Clay-induced Preferred Orientation in Polyethylene/Compatibilized Clay Nanocomposites
17
Clay-induced Preferred Orientation in Polyethylene/ Compatibilized Clay Nanocomposites A. FAMULARI, 1 P. AROSIO, 1 S. FILIPPI, 2 C. MARAZZATO, 2 P. MAGAGNINI, 2 L. MINKOVA, 3 AND S.V. MEILLE 1 1 Dipartimento di Chimica, Materiali ed Ingegneria Chimica del Politecnico di Milano, Milano, Italy 2 Dipartimento di Ingegneria Chimica, Chimica Industriale e Scienza dei Materiali dell’Universita ` degli Studi di Pisa, Pisa, Italy 3 Institute of Polymers, Bulgarian Academy of Sciences, Sofia, Bulgaria Nanocomposites of the organically modified clay Cloisite w 15A (CL15A) dispersed in HDPE-g-MA were prepared by melt-compounding. Microcomposites of the same clay with HDPE were also obtained with similar procedures. The spherulitic morphology of the polymer matrix was evidenced by optical microscopy in thin films, whereas the structure of the up to 2-mm–thick, compression-molded samples was investigated by WAXD and SAXS. Preferred orientation of both the clay and the HDPE crystallites were evidenced in the microcomposites and, to a greater extent, in nanocomposites, whereas in HDPE and HDPE-g-MA control specimens hardly any anisotropy was detected. The degree of orientation of PE crystals increases with CL15A concentration, but also with clay exfoliation, with lower cooling rates and decreasing sample thickness. The orientation of the clay platelets parallel to the compression-molded surface appears to be determined by the platelets anisotropy and by shear in the mixing and the com- pression-molding procedures. In turn, it determines the preferred uniaxial orientation of HDPE crystals, which have their crystallographic a axis orthogonal, while b and c are coplanar, to the sample surface, as already reported in the literature for melt-crystal- lized HDPE films with thickness below 0.3 mm. It is proposed that the HDPE orientation results from confined crystallization between parallel clay platelets which are on average less than 0.1 mm apart. Simple models, qualitatively accounting for the observed orien- tation of HDPE, are discussed. Organized architectures resulting from confined crystal- lization of the polymer matrix in nanocomposites with appropriate anisotropic fillers may be a general feature, important in determining key properties of these systems. Keywords nanocomposites, polyethylene, X-ray diffraction, preferred orientation, confined crystallization Introduction The combination of organically modified smectites with a number of different organic polymers has become, in recent years, a major field of interest in materials research. [1 – 8] A large variety of new microcomposites and nanocomposites has been prepared, the Received 10 July 2006; Accepted 17 October 2006. Address correspondence to S.V. Meille, Dipartimento di Chimica, Materiali ed Ingegneria Chimica del Politecnico di Milano, via Mancinelli 7, I-20131 Milano, Italy. E-mail: valdo. [email protected] Journal of Macromolecular Science w , Part B: Physics, 46:355–371, 2007 Copyright # Taylor & Francis Group, LLC ISSN 0022-2348 print/1525-609X online DOI: 10.1080/00222340601158225 355
Transcript of Clay-induced Preferred Orientation in Polyethylene/Compatibilized Clay Nanocomposites

Clay-induced Preferred Orientation in Polyethylene/Compatibilized Clay Nanocomposites
A. FAMULARI,1 P. AROSIO,1 S. FILIPPI,2 C. MARAZZATO,2
P. MAGAGNINI,2 L. MINKOVA,3 AND S.V. MEILLE1
1Dipartimento di Chimica, Materiali ed Ingegneria Chimica del Politecnico di
Milano, Milano, Italy2Dipartimento di Ingegneria Chimica, Chimica Industriale e Scienza dei
Materiali dell’Universita degli Studi di Pisa, Pisa, Italy3Institute of Polymers, Bulgarian Academy of Sciences, Sofia, Bulgaria
Nanocomposites of the organically modified clay Cloisitew 15A (CL15A) dispersed inHDPE-g-MA were prepared by melt-compounding. Microcomposites of the same claywith HDPE were also obtained with similar procedures. The spherulitic morphology ofthe polymer matrix was evidenced by optical microscopy in thin films, whereas thestructure of the up to 2-mm–thick, compression-molded samples was investigated byWAXD and SAXS. Preferred orientation of both the clay and the HDPE crystalliteswere evidenced in the microcomposites and, to a greater extent, in nanocomposites,whereas in HDPE and HDPE-g-MA control specimens hardly any anisotropy wasdetected. The degree of orientation of PE crystals increases with CL15A concentration,but also with clay exfoliation, with lower cooling rates and decreasing sample thickness.The orientation of the clay platelets parallel to the compression-molded surface appearsto be determined by the platelets anisotropy and by shear in the mixing and the com-pression-molding procedures. In turn, it determines the preferred uniaxial orientationof HDPE crystals, which have their crystallographic a axis orthogonal, while b and care coplanar, to the sample surface, as already reported in the literature for melt-crystal-lized HDPE films with thickness below 0.3 mm. It is proposed that the HDPE orientationresults from confined crystallization between parallel clay platelets which are on averageless than 0.1 mm apart. Simple models, qualitatively accounting for the observed orien-tation of HDPE, are discussed. Organized architectures resulting from confined crystal-lization of the polymer matrix in nanocomposites with appropriate anisotropic fillers maybe a general feature, important in determining key properties of these systems.
Keywords nanocomposites, polyethylene, X-ray diffraction, preferred orientation,confined crystallization
Introduction
The combination of organically modified smectites with a number of different organic
polymers has become, in recent years, a major field of interest in materials research.[1 – 8]
A large variety of new microcomposites and nanocomposites has been prepared, the
Received 10 July 2006; Accepted 17 October 2006.Address correspondence to S.V. Meille, Dipartimento di Chimica, Materiali ed Ingegneria
Chimica del Politecnico di Milano, via Mancinelli 7, I-20131 Milano, Italy. E-mail: [email protected]
Journal of Macromolecular Sciencew, Part B: Physics, 46:355–371, 2007
Copyright # Taylor & Francis Group, LLC
ISSN 0022-2348 print/1525-609X online
DOI: 10.1080/00222340601158225
355
latter class resulting when exfoliation of the layered inorganic component occurs. Small
percentages of highly anisotropic clays are able to dramatically modify key properties in
polymer nanocomposites. There is a wide consensus that these effects arise because the
inorganic particles are highly anisotropic, while, at least in one direction, dimensions
are in the nanometer range. In polymer-clay nanocomposites dramatic increments in inter-
facial area as compared to classical composites are achieved, which in turn require appro-
priate compatibility of the inorganic particles with the polymer matrix. Specific bonding
interactions may be important and recent literature shows that nanocomposites form
readily in the case of macromolecules which are polar or can hydrogen bond, like
nylons, whereas with polyolefins appropriate chemical modification is needed.[9 – 12]
In the present paper, a series of nanocomposites has been prepared by mixing in the
melt a high-density polyethylene grafted with maleic anhydride groups (HDPE-g-MA)
and the organically modified clay Cloisitew 15A (CL15A). Structural and morphological
features of these nanocomposites were investigated by optical microscopy and by x-ray dif-
fraction (WAXD and SAXS). Comparison with unmodified HDPE composites obtained
with identical percentages of CL15A, with pure HDPE and HDPE-g-MA, are drawn.
In a number of instances, as for increased barrier properties to gases, the orientation of
the anisotropic inorganic platelets in nanocomposite membranes or films is highly
relevant. When the macromolecular matrix crystallizes, orientation effects may also
result.[9 – 13] Such effects can arise because of a variety of reasons, among which the
most obvious and frequently proposed are: (i) the mechanical processing conditions
(e.g., extrusion); (ii) specific interactions with the oriented anisotropic inorganic
component, (iii) effects relating to the nucleation and growth of polymer crystals.
The focus of the present paper is the investigation of the mutual orientation features in
the mentioned, carefully prepared HDPE-g-MA nanocomposites and HDPE composites
with clay. We anticipate at this point that the preferred orientation of the clay is in line
with reasonable expectation. On the other hand, the orientation features of the HDPE
matrix are somewhat surprisingly the same as those found in PE films of thickness
below 0.3 mm[13] and they appear to occur also in the case of quiescent recrystallization
of our millimeter-thick HDPE microcomposite and HDPE-g-MA nanocomposite
samples. The results indicate that the key factor giving rise to HDPE preferred orientation
is, in the present case, the confined nature of the spherulitic crystallization process among
the oriented clay platelets rather than specific interactions or mechanical effects.
Experimental Section
The CL15A organoclay used in this work was Cloisitew 15A by Southern Clay Products,
Inc. It is a montmorillonite modified with 1.25 meq/g of dimethyldi(hydrogenated-tallow)
ammonium ions and characterized by a 3.2 nm d001-spacing.
HDPE (Eltex B5920, Solvay; MFI ¼ 0.39 dg/min; r ¼ 950 kg/m3), was used as a
reference; HDPE-g-MA (Polybond 3009, Crompton Corp. MFI ¼ 5 dg/min; 1% in
mass maleic anhydride; r ¼ 950 kg/m3) was used as the matrix of the nanocomposites.
Polymer-organoclay microcomposites-HDPE/CL15A (wt.%) and nanocomposites
HDPE-g-MA/CL15A (wt.%) were obtained at 1608C in a Brabender Plasticorder by
10 min, 60 rpm mechanical mixing; weight percent values of organoclay in the
specimens are given in parenthesis. Samples were then compression-molded at 1908C,
to obtain 20 mm disks, 2-mm-thick or else 45 or 90-mm-thick films, and subsequently
either slowly cooled (rate �0.58C min21) in the press or quenched in liquid N2.
A. Famulari et al.356

Optical microscopic observations were performed with an Ortholux Leitz polarizing
microscope equipped with a Linkam TMS 93 hot stage. Small amounts of the samples were
melted at 1908C between glass slides in order to obtain thin films about 60–70 mm thick.
The films were cooled to room temperature at a rate of 18/min. Digitized images of the
polymer spherulites were captured. The Hv diffraction patterns of low-angle light scattering
(SALS) were obtained by applying a Bertrand lens and using the microscope in diffraction
mode. Digitized images of the Hv diffraction patterns were captured, too. At least four Hv
patterns for each sample were obtained using different magnifications. The average dimensions
of the spherulites were determined from the Hv patterns using the Stein equation.[14] An image
processing system (Scion Image) was used to analyze the pattern in order to determine the angle
between the incident and the scattered beams corresponding to the maximum intensity.
Wide angle X-ray diffraction patterns (Cu-Ka) were recorded in reflection mode using a
Siemens D-500 Kristalloflex 810 diffractometer. In some cases, for samples requiring
additional thermal treatments, an Italstructures u/u diffractometer equipped with a high temp-
erature attachment was used. Patterns in transmission geometry were collected with a Bruker
P4 diffractometer equipped with a Hi-Star 2D detector. SAXS patterns (Cu-Ka) were measured
using a Bruker Nanostar (with crossed coupled Gobel mirrors and a Hi-star 2D detector).
Results and Discussion
Optical Microscopy
Films of HDPE, HDPE-g-MA, and also of composites and nanocomposites of the modified
CL15A clay with the two polymers, when crystallized upon cooling from the melt at
18C/min, show a clear spherulitic structure typical for HDPE and functionalized polyethy-
lenes (Fig. 1a–c).[15] Because the dispersed clay particles cannot be observed in the dark
polymer matrix, we are unable to establish whether the clay layers are inside or outside the
spherulites. Micrographs of the neat functionalized polyethylene and its nanocomposite
with 10 wt.% clay are presented in Fig. 1a and 1b, respectively, while Fig. 1c shows
the spherulites obtained for HDPE/CL15A (5 wt.%) composites. The corresponding Hv
small angle light scattering patterns, also included in Fig. 1, show well defined four leaf
features with central reflections, which are typical for the diffraction from non-oriented
nets of spherulites. The average dimensions of the spherulites were determined from
the Hv patterns by means of the equation[14]
Rsph ¼ c l=ðnp sin umÞ
where Rsph is the spherulite radius, c a constant (c ¼ 2.05 for spheres and 1.95 for discs),
l/n the wavelength of the light in a medium of refractive index n, um the angle between the
incident and the scattered beams corresponding to the maximum intensity. The values for
the average radius of the spherulites of representative samples are collected in Table 1. As
expected, radii are only slightly smaller for neat HDPE-g-MA than for our HDPE sample
(7.1 to be compared to 7.6 mm), while the average radius decreases to 4–5 mm in the
presence of the clay. It is well known that the spherulite size is predominantly determined
by the primary nuclei density. The smaller polymer spherulite dimensions in the presence
of the clay are, therefore, plausibly due to an increased nucleation rate implying that the
clay acts as a nucleation agent for the polymer matrix crystallization, albeit not a very
efficient one. This is confirmed by the increased temperature of the onset of polymer crys-
tallization in the presence of the clay observed during cooling at 18C/min (Table 1).
Clay-induced Orientation in Polyethylene Nanocomposites 357

HDPE Orientation
The comparison of diffraction patterns in reflection geometry (Fig. 2) of representative
compression-molded samples of HDPE, HDPE-g-MA, and of various clay composites
of the two polymers allows to establish, to a first approximation, cases in which clay
exfoliation has been achieved. As compared to similarly treated HDPE (Fig. 2a),
HDPE/CL15A (5 wt.%) composites (Fig. 2b) show low angle reflections because of the
interlayer spacing of CL15A, indicating that stacks of clay layers persist. At variance,
comparing compression-molded HDPE-g-MA patterns (Fig. 2c) with those of composites
Figure 1. Optical micrographs and Hv patterns of: (a) HDPE-g-MA, (b) HDPE-g-MA/CL15A
(10 wt.%), and (c) HDPE/CL15A (5 wt.%).
Table 1
Average spherulite radius and crystallization temperature for HDPE and
HDPE-g-MA samples with different CL15A content, crystallized from
the melt at a cooling rate of 18/min
Sample Rsph, mm Tc, 8C
HDPE 7.6 122.7
HDPE/CL15A (5 wt.%) 4.5 123.3
HDPE-g-MA 7.1 119.0
HDPE-g-MA/CL15A (5 wt.%) 4.4 123.0
HDPE-g-MA/CL15A (10 wt.%) 4.3 121.0
A. Famulari et al.358

of this modified polymer with CL15A (Fig. 2d–f) the only apparent difference at low
angle is some continuous diffraction, suggesting large degrees of clay exfoliation, i.e.,
formation of nanocomposites.
The diffraction patterns in Fig. 2 also suggest substantial preferred orientation effects
of the PE matrix in the nanocomposites under investigation. While for HDPE and HDPE-
g-MA (Fig. 2a, c) the ratio I110/I200 between the uncorrected intensities of reflections 110
and 200 (respectively at 2u ¼ 21.5 and 23.88) is ca. 3.2 and nearly conforms to the value of
about 4.0 generally found in unoriented PE specimens†, nanocomposite patterns evidence
a different situation. Specifically, for the slow-cooled HDPE-g-MA/CL15A samples with
a 5 and 10 wt.% clay content, respectively, the I110/I200 ratio in patterns decreases dra-
matically to about 1.0 and 0.2 (Fig. 2d, e) and suggests that the concentration of exfoliated
clay critically influences the orientation of the polymer matrix. Milder but similar effects
(I110/I200 ratio � 1.0) are observed for quenched nanocomposite samples (Fig. 2f) where
crystallization of HDPE is likely to have occurred at lower temperature than for the slow-
cooled samples. A value of about 2 for the I110/I200 ratio in the case of the HDPE/CL15A
(5 wt.%) microcomposite sample (Fig. 2b) suggests that some orientation of the HDPE
matrix occurs also in the composites, even if to a lesser degree than in nanocomposites.
The preferred orientation mode of the HDPE matrix that accounts for the described
perturbations of the relative intensities of the 110 and the 200 reflections observed in our
nano- and microcomposites is very similar to the one reported in the literature for melt-
crystallized thin films of PE (typically with thickness below 0.3 mm).[13] It can be
characterized straightforwardly by 2D transmission patterns: while spectra obtained with
the beam normal to the sample surface (not shown) are isotropic, those in edge-on
geometry are not, as apparent in Fig. 3 for slow-cooled HDPE-g-MA/CL15A (10 wt.%)
samples respectively 2 mm and 90 mm thick. Although the degree of orientation is
somewhat better for the thinner film, in both cases the 200 PE reflection shows a
maximum in the equatorial direction which corresponds to the normal to the surface for
both samples. This is consistent with preferred orientation of the a lattice vector of PE
Figure 2. XRD patterns (reflection geometry) of compression-molded, 2-mm–thick samples,
cooled at ca. 0.58C min21: (a) HDPE, (b) HDPE/CL15A (5 wt.%), (c) HDPE-g-MA, (d) HDPE-
g-MA/CL15A (5 wt.%), and (e) HDPE-g-MA/CL15A (10 wt.%). For comparison also the pattern
of (a) quenched HDPE-g-MA/CL15A (10 wt.%) sample is shown (f).
†Similar I110/I200 ratios of about 4.0 are obtained in powder patterns calculations in which the110 and the 200 reflections display comparable widths (FWHM ca. 0.78 2u).
Clay-induced Orientation in Polyethylene Nanocomposites 359

crystallites along the same direction, i.e., perpendicular to the compression-molded surface
of the samples. Moreover, the azimuthal orientation of the 110 reflection, although clearly
shown in Fig. 3 for the thinner 90 mm film, is similar for the two samples and the apparent
110 maxima are located at about 208 from the patterns’ meridian, which in turn is coplanar
with the film surface‡.
Azimuthal scans of the 200 reflection are shown in Fig. 4 for some nanocomposites and
microcomposites samples. The profiles pertaining to HDPE-g-MA/CL15A(10 wt.%) nano-
composites show a clearly higher degree of orientation with respect to the corresponding
HDPE/CL15A (10 wt.%) microcomposites as revealed by the width at half-maximum
measurements (FWHM is about 428 and 558 in profiles (b) and (c), respectively). It is
also clear that for similar exfoliation, the degree of orientation increases with clay concen-
tration (see profiles (b) and (d) for HDPE-g-Ma/CL15A nanocomposites with 10 and
5 wt.% clay, respectively). Moreover, thin films show somewhat smaller FWHM with
respect to thick samples (see profiles (a) and (b) in Fig. 4). It is interesting that samples
of different kind, which show similar values of the I110/I200 ratio, also have closely
similar values of azimuthal FWHM for the 200 reflection: for values of the I110/I200 in
reflection geometry patterns around 1, about 0.4 and smaller than 0.2 respectively, values
of ca. 588, 508, and 428 are found for the azimuthal FWHM of the 200 reflection. These
observations indicate that there is a good qualitative correlation between the ratio of the
200 to 110 intensities and the azimuthal FWHM of the 200 reflection.
Integration along the equator at constant 2u of the 2D patterns in Fig. 3a, b gives traces
1 and 2 of Fig. 3c which are expected to be closely comparable to the diffraction patterns
from the same film samples in reflection geometry, i.e., to trace e in Fig. 2. This is
qualitatively the case, and rationalizes the alterations of the I110/I200 ratio in the one-
dimensional patterns in Fig. 2. Somewhat surprisingly, however, it is trace 2 from the
90 mm film, rather than trace 1 from the 2-mm-thick sample of Fig. 3c, that is closer to
trace e of Fig. 2 and which pertains to the 2-mm-thick specimen. Because of the
Figure 3. Two-dimensional transmission WAXS patterns of (a) 2 mm and (b) 90-mm-thick com-
pression-molded, slow-cooled HDPE-g-MA/CL15A (10 wt.%) nanocomposite film samples. The
samples are edge on with respect to the incident X-ray beam i.e., the normal to the film surface is
horizontal and corresponds to the equatorial line in the 2D patterns. Traces 1 and 2 of (c) are the
equatorial scans of the 2D diffraction patterns (a) and (b) and are closely comparable to the diffrac-
tion patterns from the same films in reflection geometry (Fig. 2, trace e).
‡The expected value of the angle deviation from the meridian of the 110 reflection for perfectuniaxial orientation along the a axis would be 34.78. Considering the azimuthal half-width (�308) ofthe reflections it is, however, reasonable that a lower value is observed because of overlapping of thebroad symmetrical reflections on the two sides of the meridian.
A. Famulari et al.360

dominant contribution of the surface layers to the diffraction in the reflection mode, this
observation implies that the surface layer in our nanocomposite samples is more
oriented than the bulk, especially in the case of thick films, and indicates that the orien-
tation is to some degree influenced by processes occurring at the surface of the sample.
The results of an additional experiment are particularly significant: both nanocompo-
sites and microcomposite films were placed unconstrained in a sample holder and brought
in separate experiments to 140 and 1608C in a u/u diffractometer, where spectra were
recorded to confirm complete melting of the polymer matrix. Diffraction patterns
subsequently collected at room temperature, after quiescent recrystallization by cooling
at a rate of ca. 108C/min, gave diffraction patterns showing that the orientation of the
recrystallized polymer was somewhat lower than before melting (Fig. 5) but in essence
preserved, irrespective of the temperature reached by the melt. Such modest loss of orien-
tation, somewhat more significant for the composite than for the nanocomposite, appear to
Figure 4. Azimuthal scans of the 200 reflection in the 2D XRD patterns of (a) HDPE-g-Ma/CL15A
(10 wt.%) 45 mm film, (b) HDPE-g-Ma/CL15A (10 wt.%), (c) HDPE/CL15A (10 wt.%), and (d)
HDPE-g-Ma/CL15A (5 wt.%) slow-cooled samples. The full width at half-maximum (FWHM) is
about 408 in profile (a), 458 in profile (b), and 55–608 in profiles (c) and (d).
Figure 5. Reflection XRD patterns of compression-molded, 2-mm–thick nanocomposites samples:
HDPE-g-MA/CL15A (10 wt.%) (a) after quiescent melting at 140 or at 1608C and cooling at ca.
108C/min, (b) before the melting-recrystalliztion procedure. The other two pattern were similarly
obtained from HDPE/CL15A (10 wt.%) samples, (c) after quiescent melting at 140 or 1608C,
and (d) before the melting-recrystalliztion step.
Clay-induced Orientation in Polyethylene Nanocomposites 361

depend on the faster cooling rate: further experiments with cooling rates of ca. 18C/min
show negligible loss of orientation. In this respect the comparison of traces as shown in
Fig. 5a, b with those of Fig. 2e, f is quite relevant. The observed behavior indicates that
in the present case shear phenomena have only a marginal impact on the orientation of
the HDPE matrix which corresponds to the one occurring when it is melt-crystallized in
films about three orders of magnitude thinner[13,16] than we are looking at. On the other
hand, it appears relevant to note that the orientation of the clay platelets can reasonably
be expected to be invariant upon melting and recrystallization of the polymer matrix.
Clay Orientation
The experimental data discussed up to this point imply that the presence of 5–10 wt.%
clay has a key role in the orientation of the HDPE matrix, a role which is more pronounced
in nanocomposites, but qualitatively similar and quite apparent also in the case of compo-
sites. It is therefore important to discuss the organization of CL15A in our samples. The
most straightforward evidence concerns HDPE/CL15A (10 wt.%) microcomposites: in
the wide angle diffraction pattern in Fig. 6a (film sample vertical and edge-on with
respect to the x-ray beam) it is very clear that the 00I reflections of the modified clay
are oriented along the equator of the image. This corresponds to an orientation of the
clay stacks with the platelets parallel to the surface of the 2-mm–thick, compression-
molded sample. This interpretation is confirmed by the SAXS pattern (Fig. 6b) obtained
from a sample where the 001 Bragg reflection of CL15A concentrates on the equator,
but where also continuous scattering at lower angle is apparent. The orientation of
HDPE in Fig. 6a is not very apparent, but upon close examination we can see that
reflection 110 is somewhat polarized on the meridian while 200 is more intense in the
equatorial area.
Although in composites the degree of orientation of HDPE is lower, it is not surprising
that its mode is qualitatively similar to the one found in nanocomposites (Fig. 3) in which
CL15A is exfoliated. As the clay platelets are exfoliated, no Bragg maxima due to CL15A
are apparent in diffraction patterns from nanocomposites (Fig. 3a, b). The strong streak
running symmetrically from the center along the equator, i.e., the normal to the film
surface, indicates however that the clay platelets are again preferentially oriented
parallel to the compression-molded sample surface. These scattering effects are clearer
Figure 6. Two-dimensional transmission WAXS (a) and SAXS (b) patterns of 2-mm–thick,
compression-molded, HDPE/CL15A (10 wt.%) composite samples. The samples are placed edge-
on with respect to the incident X-ray beam with the normal to the compression surface coinciding
with the equator in the 2D pattern.
A. Famulari et al.362

in SAXS patterns (Fig. 7) of 90-mm-thick, slow-cooled HDPE-g-MA/CL15A (10 wt.%)
nanocomposite films, in edge- on geometry. Small angle anisotropic scattering confined
in essence on the equator and decreasing in intensity monotonously with increasing 2u
(Fig. 7a) can be related to the silicate monolayers preferentially oriented orthogonally to
the equator, i.e., in our case parallel to the compression-molded film plane.[12] For the
same nanocomposite sample mounted with the film surface perpendicular to the
incoming x-ray beam (Fig. 7b) the scattering streak at low angle is absent.
The above interpretation is consistent with the observation that nanocomposites show
scattering curves with the intensity decreasing to the background level at values of 2u of
about 9–108 independent of the clay concentration. This behavior fits a model of oriented
inorganic platelets whose scattered intensity, assuming a one-dimensional electronic
density modulation orthogonal to the film surface, can be calculated by means of the
shape factor 2/(qd) sin(qd/2), where d is the layer thickness and q ¼ 4p sinu /l.[17]
The shape factor goes to zero and there is a minimum of the scattered intensity when
qd/2 ¼ p, i.e., when d is about 1 nm (2u � 98), which roughly corresponds to the
thickness of a clay layer in clay-silicates.
To better understand the orientation process of the clay we also performed SAXS
experiments, prior to the compression molding step, on HDPE/CL15A (10 wt.%) micro-
composite samples, obtained by melt-mixing the polymer and the clay in a Brabender
rotor. Samples were obtained detaching residual material from the Brabender’s rotors
and cutting ca. 0.1 mm thick slices parallel to the surface that was in contact with the
rotor, after the preparation of the composite according to the usual procedure. Diffraction
patterns, obtained from such specimens using a 0.1 mm pinhole collimated beam all
showed, in the case of HDPE-CL15A 10% composites, significant orientation of the
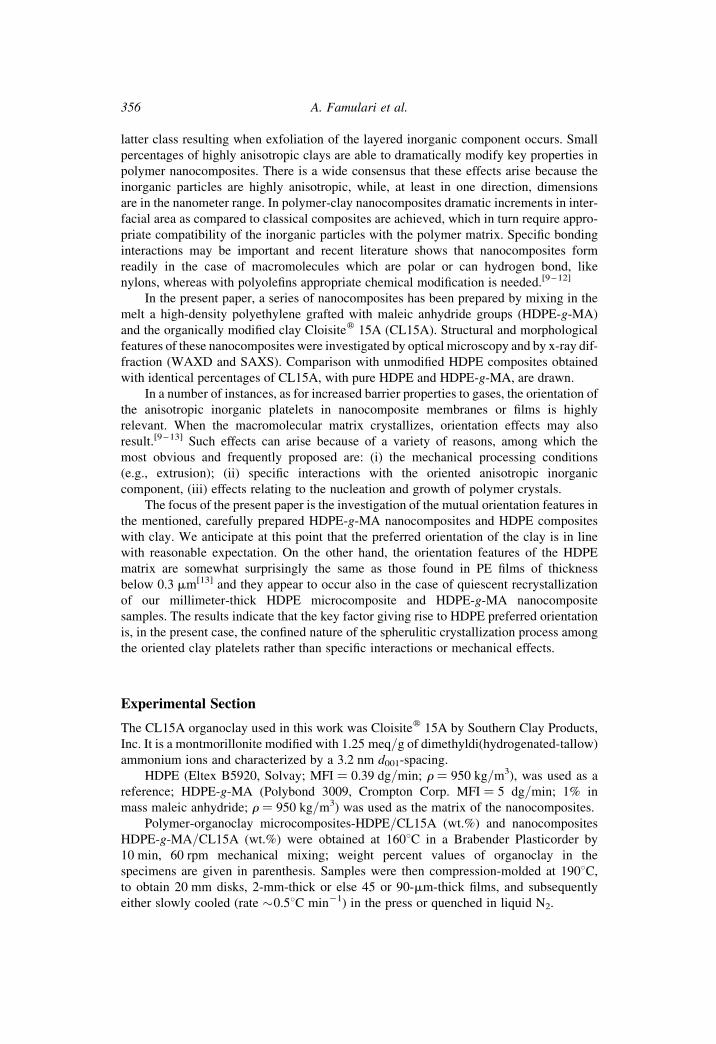
CL15A 001 reflection (see Fig. 8). So far we were unable to investigate the clay orien-
tation over smaller domains: it is, however, clear from the diffraction patterns that, even
at the melt-mixing stage, the orientation of stacks of clay platelets strongly correlate
locally over length scales of tens of mm. We consider it very plausible that in the com-
pression molding step, above a critical clay concentration, the degree of correlation
among the preexisting local orientations of the stacks of platelets further increases. As
a result even in our 2-mm-thick samples the platelets are largely iso-oriented, in
essence over the whole sample, with the platelet surfaces parallel to the compression-
molded sample surface.
Figure 7. Two-dimensional transmission SAXS patterns of compression-molded, slow-cooled, 90-
mm-thick HDPE-g-MA/CL15A (10 wt.%) nanocomposite film: (a) the film is vertical and edge-on
with respect to the incident X-ray beam, (b) the film surface is orthogonal with respect to the incident
X-ray beam.
Clay-induced Orientation in Polyethylene Nanocomposites 363
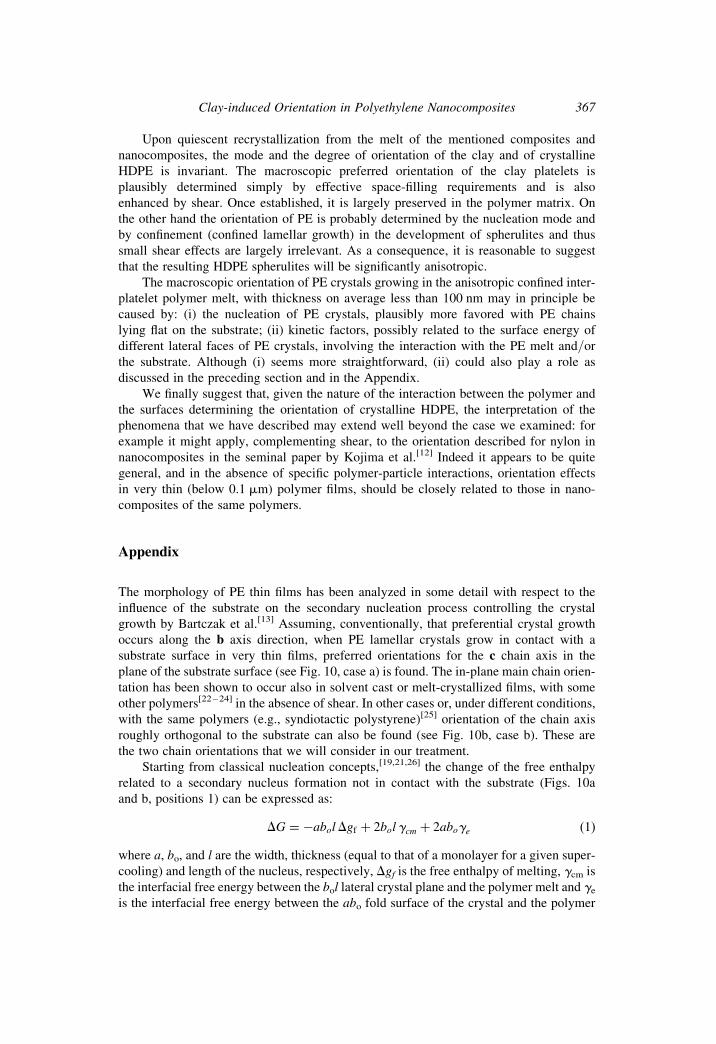
Origin of HDPE Orientation
The last issue we want to address is the origin of the high HDPE orientation in our nano-
composites. As already mentioned, the orientation features of HDPE in the compression-
molded microcomposites or nanocomposite films is characterized by the a lattice vector
orthogonal to the film surface and the b and c vectors randomly oriented, but roughly
in the film plane. This mode of orientation has been described in the literature for films
of HDPE up to a few mm thick. The occurrence of the same orientation of MA-grafted
and unmodified HDPE that we find in clay composites, upon PE crystallization on crystal-
line and amorphous substrates (calcite and rubber),[13] is inconsistent with hepitaxy and
indicates that specific bonding interactions are unlikely to play a major role. A similar
edge-on orientation of PE lamellae on the surface plane of the fillers, was reported in a
TEM study of PE composites with talc and kaolin.[18]
We already evidenced that, for a given clay content, the orientation of HDPE in com-
posites increases with the degree of clay exfoliation and it also grows with clay content for
a given degree of exfoliation. Quite remarkably the orientation in millimeter thick HDPE-
g-MA/CL15A (10 wt.%) nanocomposite samples is comparable in mode and in degree to
the one found in melt-crystallized PE films three orders of magnitude thinner. How can
this be explained?
It is well established that the clay platelets in the nanocoposites are highly anisotropic
with a preferred orientation of the silicate layers parallel to the film surface. Assuming
complete exfoliation, with a 10 wt.% clay nanocomposite and a homogenous dispersion
of the inorganic component into the polymer matrix, an average distance of about
20–100 nm can be estimated between neighboring silicate layers, taking a clay layer
thickness of about 1 nm. If some aggregation of the clay platelets is preserved, the
polymer layer thickness will increase while remaining on an average below 0.1 mm.
The quiescent crystallization of the HDPE melt in the nanocomposites can therefore
be thought to occur confined in 20–100 nm thick polymer layers, giving rise to a two-
dimensional spherulitic growth (see Fig. 9). This is a clear result, even if we assume
that the spherulites observed by optical microscopy, with a typical radius of ca. 5 mm,
i.e., nearly two orders of magnitude (100 times) larger than the polymer layer
Figure 8. Two-dimensional transmission SAXS patterns of a HDPE/CL15A (10 wt.%) composite
sample obtained by mechanical mixing the molten polymer and the clay (without the compression
molding step).
A. Famulari et al.364

thickness, are not confined by the platelets. In fact, the average distance of ca. 50 nm
between exfoliated platelets imply that the platelets should be largely intraspherulitic.
Therefore, the radial polymer lamellae are in essence confined to grow in a highly aniso-
tropic interplatelet region. Since in PE spherulites[14,19 – 21] it is well established that the
crystallographic b axis is radial, b will be largely constrained to lie parallel to the plane
of the clay platelets, i.e., parallel to the surface plane of the compression-molded
samples. This conclusion is rather straightforward, even without any constraints about
the interfacial energy between PE crystals and substrate, at variance to what was
suggested in some previous work.[13] It is simply based on a faster growth rate, on
average, of PE crystals along the b axis direction.
The in-plane orientation of the PE b axis is indeed compatible with the observed
preferred orientation of the a axis perpendicular to the sample surface. In order to fully
account for this feature it is, however, necessary to constrain not only the b axis but the
also the c axis, i.e., the chain axis of PE, to lie preferentially in the plane of the sample.
Crystalline PE lamellae therefore tend to lie edge-on, with the bc face as the contact
plane, on clay platelets (see inset to Fig. 9) or on other substrates. Although this orientation
appears to be a quite general occurrence with PE thin films, we are not aware of any
detailed discussion of the issue in the literature. We will attempt to briefly address it
with some speculative considerations in the following paragraph.
The first possibility is simply a more effective primary nucleation of PE spherulites
and crystals with chains lying parallel to the substrate surface plane. This sensible hypoth-
esis could account for our main observations. In fact it is the common assumption in
standard treatments of primary heterogeneous nucleation.[19] Interestingly is can be
found also with other polymers, as, for example, in melt-crystallized or solvent cast
Figure 9. Structural model of melt-compounded, compression-molded PE/clay microcomposites
and nanocomposites: spherulites of PE (plausibly anisotropic) and oriented clay platelets are
shown together with the lattice vectors of the orthorhombic PE unit cell. The inset shows an enlarged
view with edge-on PE lamellae growing in the confined space between clay platelets.
Clay-induced Orientation in Polyethylene Nanocomposites 365

films of isotactic polypropylene,[22] poly(3-alkylthiophenes),[23] syndiotactic poly-
styrene[24] at least under specific conditions. Since nucleated lamellae at the surface of
the heterogeneous layer are assumed to have this orientation, a bias favoring similar orien-
tation of other lamellae will be established.
There is also the possibility that it is not the primary nucleation event that determines
the orientation of the lamellae but successive growth, (i.e., secondary nucleation, see
Appendix). In other words the original nuclei may have a wide variety of different orien-
tations with respect to the clay surface. However the polymer lamellae with the “correct”
orientation with respect to the clay surface (i.e., both the b and the c axes in the plane of the
film) experience better secondary nucleation and grow faster. As a consequence preferred
orientation with a perpendicular to the clay layers arises.
Clearly both effects tend in general to dissipate as we go further away from the het-
erogeneous surface and the orientation effects will depend on the film thickness, unless
there are strong homohepitaxial effects: i.e., unless the orientation of lamellae not in
immediate contact with the substrate, is determined by the orientation of lamellae lying
on the substrate.
It seems hard with the present data to discriminate between the two “mechanisms”
and in fact both may play a role. In any case, the confined growth mode of polymer
lamellae implies that in our nanocomposites spherulites are likely to be highly anisotropic
(see Fig. 9) if not bidimensional. The relative dimensions of spherulites and CL15A
particles also appear to imply that clay platelets are at least, in part, intra-spherulitic.
More detailed investigation on these issues is in progress.
Conclusion
Clay lamellae of CL15A in organized stacks and in their exfoliated states, at concentration
values around 10 (wt.%), adopt roughly parallel organization modes in HDPE (and HDPE-
g-MA) composites obtained by melt-compounding, over domains with dimensions
estimated to be of the order of 10 mm or more (Fig. 8). Upon compression molding
these micro and nanocomposites into films, clay platelets and their stacks tend to orient
with the clay platelets parallel to the surface of the compression-molded film. For com-
pression-molded films with thickness 10–100 mm the degree of orientation of clay
lamellae is high and relatively uniform. For films of greater thickness more complex situ-
ations may result, i.e., nonnegligible skin-core effects, with somewhat higher degrees of
orientation of the clay lamellae at the surface.
In compression-molded HDPE/CL15A microcomposites or nanocomposite films the
HDPE matrix crystallizes with a uniaxial preferred orientation mode characterized by the
a lattice vector orthogonal to the film surface and the b and c vectors randomly oriented,
but roughly in the film plane. This mode of orientation, previously described in the litera-
ture for very thin films of HDPE crystallized on various crystalline and amorphous
substrates,[13] points to nonspecific interactions with the substrate. The degree of orien-
tation of HDPE increases with the degree of clay exfoliation for a given clay percentage,
and with clay content, for a given degree of exfoliation. The degree of orientation of
HDPE-g-MA in nanocomposites with 10 wt.% CL15A is comparable to the one in PE
films three orders of magnitude thinner. HDPE orientation is favored also by high crystal-
lization temperatures (or low cooling rates) suggesting that the nucleation step of PE crys-
tallization, plausibly occurring at the polymer-clay interface, plays a significant role for
the orientation of PE crystals.
A. Famulari et al.366
Upon quiescent recrystallization from the melt of the mentioned composites and
nanocomposites, the mode and the degree of orientation of the clay and of crystalline
HDPE is invariant. The macroscopic preferred orientation of the clay platelets is
plausibly determined simply by effective space-filling requirements and is also
enhanced by shear. Once established, it is largely preserved in the polymer matrix. On
the other hand the orientation of PE is probably determined by the nucleation mode and
by confinement (confined lamellar growth) in the development of spherulites and thus
small shear effects are largely irrelevant. As a consequence, it is reasonable to suggest
that the resulting HDPE spherulites will be significantly anisotropic.
The macroscopic orientation of PE crystals growing in the anisotropic confined inter-
platelet polymer melt, with thickness on average less than 100 nm may in principle be
caused by: (i) the nucleation of PE crystals, plausibly more favored with PE chains
lying flat on the substrate; (ii) kinetic factors, possibly related to the surface energy of
different lateral faces of PE crystals, involving the interaction with the PE melt and/or
the substrate. Although (i) seems more straightforward, (ii) could also play a role as
discussed in the preceding section and in the Appendix.
We finally suggest that, given the nature of the interaction between the polymer and
the surfaces determining the orientation of crystalline HDPE, the interpretation of the
phenomena that we have described may extend well beyond the case we examined: for
example it might apply, complementing shear, to the orientation described for nylon in
nanocomposites in the seminal paper by Kojima et al.[12] Indeed it appears to be quite
general, and in the absence of specific polymer-particle interactions, orientation effects
in very thin (below 0.1 mm) polymer films, should be closely related to those in nano-
composites of the same polymers.
Appendix
The morphology of PE thin films has been analyzed in some detail with respect to the
influence of the substrate on the secondary nucleation process controlling the crystal
growth by Bartczak et al.[13] Assuming, conventionally, that preferential crystal growth
occurs along the b axis direction, when PE lamellar crystals grow in contact with a
substrate surface in very thin films, preferred orientations for the c chain axis in the
plane of the substrate surface (see Fig. 10, case a) is found. The in-plane main chain orien-
tation has been shown to occur also in solvent cast or melt-crystallized films, with some
other polymers[22 – 24] in the absence of shear. In other cases or, under different conditions,
with the same polymers (e.g., syndiotactic polystyrene)[25] orientation of the chain axis
roughly orthogonal to the substrate can also be found (see Fig. 10b, case b). These are
the two chain orientations that we will consider in our treatment.
Starting from classical nucleation concepts,[19,21,26] the change of the free enthalpy
related to a secondary nucleus formation not in contact with the substrate (Figs. 10a
and b, positions 1) can be expressed as:
DG ¼ �abolDgf þ 2bolgcm þ 2aboge ð1Þ
where a, bo, and l are the width, thickness (equal to that of a monolayer for a given super-
cooling) and length of the nucleus, respectively, Dgf is the free enthalpy of melting, gcm is
the interfacial free energy between the bol lateral crystal plane and the polymer melt and ge
is the interfacial free energy between the abo fold surface of the crystal and the polymer
Clay-induced Orientation in Polyethylene Nanocomposites 367

melt. The energy barrier for critical nucleus formation can be calculated imposing the
stationary conditions:
@DG�
@a¼ 0 and
@DG�
@l¼ 0
The resulting critical values
a� ¼ 2gcm=Dgf and l� ¼ 2ge=Dgf
determine the free enthalpy maximum corresponding to the barrier for the critical nucleus
formation
DG� ¼ 4bogcmge=Dgf ð2Þ
It can be shown that the energy barrier for the formation of a critical size nucleus is lower
close to the substrate than in bulk crystallization.[13,19,21,26] In the case of the formation of
a secondary nucleus in the reentrant corner between the substrate and the growing crystal
face (Fig. 10a, position 2: polymer chain axis lying in the surface plane) the free enthalpy
change is
DG ¼ �abolDgf þ bolðgcm þ gcs � gmsÞ þ 2aboge ð3Þ
with critical values
a� ¼ ðgcm þ gcs � gmsÞ=Dgf and l� ¼ 2ge=Dgf
corresponding to a free enthalpy change maximum
DG� ¼ 2boðgcm þ gcs � gmsÞge=Dgf ð4Þ
where gcs and gms represent the interfacial free energy between the lateral plane of the
crystal and the substrate, and between the polymer melt and the substrate, respectively.
The comparison of Equations 2 and 4 shows that the energy barrier related to the
formation of a critical size nucleus in close contact with the substrate is lower than the
barrier for the formation of such a nucleus away from the substrate, provided that
gcm . gcs 2 gms.[13]
Figure 10. Two limiting models for secondary nucleation of chain-folded polymer crystal on a sub-
strate surface: (a) chain axis in the substrate plane, (b) chain axis orthogonal to the substrate plane.
Secondary nuclei growing away from the surface (position 1) and in contact with the surface plane
(position 2) are compared in the two cases.
A. Famulari et al.368

Considering the case of a secondary nucleus in close contact with the substrate
but with the polymer chain axis normal to the plane of the surface (see Fig. 10b,
position 2), the change of free enthalpy can be written as
DG ¼ �abolDgf þ 2bolgcm þ aboðge þ gcs1 � gmsÞ ð5Þ
where, in the last term, gcs1 represents the interfacial free energy between the fold surface
and the substrate. The critical a and l values are easily calculated as above
a� ¼ 2gcm=Dgf and l� ¼ ðge þ gcs1 � gmsÞ=Dgf
while the corresponding barrier for the critical secondary nucleus formation is
DG� ¼ 2bogcmðge þ gcs1 � gmsÞ=Dgf ð6Þ
Comparing expressions (4) and (6) we can see that the free energy barrier for the
formation of a critical secondary nucleus with the chain axis normal to the substrate
(Fig. 10b, position 2) is larger than that of the corresponding nucleus with the main
chain parallel to the substrate (Fig. 10a, position 2) provided that gcm . ge and that we
can assume gcs1 ffi gcs.
While both of the above hypotheses may need further support, it is quite clear that
energy barriers relative to positions 1 of cases a and b (Fig. 10a and b) coincide. With
respect to position 2 of case b, considering the plausible features of the fold surface of
the secondary nucleus, we could then adopt a different view. We may approximate the
interaction of the secondary nucleus with the substrate as a crystal-amorphous-substrate
interaction rather than a simple crystal-substrate interaction, as we have done so far. If
this description applies, the situation represented in case b at position 2 will differ from
position 1 only marginally. The conditions that make secondary nucleation described at
position 1 disfavored over position 2, case a, would therefore apply also to case b, both
for position 1 and 2, i.e., position 2, case a, is preferred.
Acknowledgment
The authors acknowledge the financial support of MIUR PRIN2004 (A.F., S.F., C.M.,
P.M., P.A., S.V.M.), NATO-grant CBP.EAP.CLG 981257 (P.M., L.M.)- and CARIPLO
Foundation (A.F., P.A., S.V.M.) S.V.M. also acknowledges stimulating discussions with
Dr. Annamaria Buono.
References
1. (a) Pinnavaia, T.J.; Bell, G.W. (eds.) Polymer-Clay Nanocomposites; John Wiley & Sons, Ltd.:
Chichester, 2000; (b) LeBaron, P.C.; Wang, Z.; Pinnavaia, T.J. Polymer-layered silicate nano-
composites: an overview. J. Appl. Clay Sci. 1999, 15, 11.
2. Alexandre, M.; Dubois, P. Polymer-layered silicate nanocomposites: preparation, properties and
uses of a new class of materials. Mater. Sci. Eng. 2000, 28, 1.
3. Ray, S.S.; Okamoto, M. Polymer/layered silicate nanocomposites: a review from preparation to
processing. Prog. Polym. Sci. 2003, 28, 1539.
4. Giannelis, E.P.; Krishnamoorti, R.; Manias, E. Polymer-silicate nanocomposites: model systems
for confined polymers and polymer brushes. Adv. Polym. Sci. 1999, 138, 107.
5. Biswas, M.; Ray, S.S. Recent progress in synthesis and evaluation of polymer-montmorillonite
nanocomposite. Adv. Polym. Sci. 2001, 155, 167.
Clay-induced Orientation in Polyethylene Nanocomposites 369

6. Manias, E.; Touny, A.; Wu, L.; Strawhecker, K.; Lu, B.; Chung, T.C. Polypropylene/montmor-
illonite nanocomposites. review of the synthetic routes and materials properties. Chem. Mater.
2001, 13, 3516.
7. Fisher, H. Polymer nanocomposites: from fundamental research to specific applications. Mat.
Sci. Eng. 2003, 23, 763.
8. Ahmadi, S.J.; Huang, Y.D.; Li, W. Synthetic routes, properties and future applications of
polymer-layered silicate nanocomposites. J. Mat. Sci. 2004, 39, 1919.
9. Gopakumar, T.G.; Lee, J.A.; Kontopoulou, M.; Parent, J.S. Influence of clay exfoliation on the
physical properties of montmorillonite/polyethylene composites. Polymer 2002, 43, 5483.
10. (a) Bafna, A.; Beaucage, G.; Mirabella, F.; Mehta, S. 3D Hierarchical orientation in polymer–
clay nanocomposite films. Polymer 2003, 44, 1103; (b) Bafna, A.; Beaucage, G.; Mirabella, F.;
Skillas, G.; Sukumaran, S. Optical properties and orientation in polyethylene blown films.
J. Polym. Sci., Part B Polym. Phys. 2001, 39, 2923; (c) Bafna, A.; Beaucage, G.;
Sukumaran, S.; Skillas, G.; Mirabella, F. Orientation in blown polyethylene films using small
angle X-ray and light scattering. Polym. Mat., Sci. Eng. 2001, 85, 275.
11. (a) Koo, C.M.; Kim, S.O.; Chung, I.J. Study on morphology evolution, orientational behavior,
and anisotropic phase formation of highly filled polymer-layered silicate nanocomposites.
Macromolecules 2003, 36, 2748; (b) Kuelpmann, A.; Osman, M.A.; Kocher, L.; Suter, U.W.
Influence of platelet aspect ratio and orientation on the storage and loss moduli of HDPE-
mica composites. Polymer 2005, 46, 523; (c) Malwitz, M.M.; Lin-Gibson, S.; Hobbie, E.K.;
Butler, P.D.; Schmidt, G. Orientation of platelets in multilayered nanocomposite polymer
films. J. Polym. Sci., Part B, Polym. Phys. 2003, 41, 3237; (d) Wang, K.; Xiao, Y.; Na, B.;
Tan, H.; Zhang, Q.; Fu, Q. Shear amplification and re-crystallization of isotactic polypropylene
from an oriented melt in presence of oriented clay platelets. Polymer 2005, 46, 9022;
(e) Loo, L.S.; Gleason, K.K. Investigation of polymer and nanoclay orientation distribution in
nylon 6/montmorillonite nanocomposite. Polymer 2004, 45, 5933.
12. Kojima, Y.; Usuki, A.; Kawasumi, M.; Okada, A.; Kurauchi, T.; Kamigaito, O.; Kaji, K. Fine
structure of nylon-6-clay hybrid. J. Polym. Sci., Part B, Polym. Phys. 1994, 32, 625.
13. (a) Bartczak, Z.; Argon, A.S.; Cohen, R.E.; Kowalewski, T. The morphology and orientation of
polyethylene in films of sub-micron thickness crystallized in contact with calcite and rubber sub-
strates. Polymer 1999, 40, 2367; (b) Bartczak, Z.; Argon, A.S.; Cohen, R.E.; Weinberg, M.
Toughness mechanism in semi-crystalline polymer blends: I. high-density polyethylene
toughened with rubbers. Polymer 1999, 40, 2331.
14. Geil, P.H. Polymer Single Crystals; Wiley-Interscience: New York, 1963.
15. Minkova, L.; Yordanov, Hr.; Filippi, S. Characterization of blends of LDPE and PA6 with
functionalized polyethylenes. Polymer 2002, 43, 6195.
16. Mellbring, O.; Kihlman Øiseth, S.; Krozer, A.; Lausmaa, J.; Hjertberg, T. Spin coating and
characterization of thin high-density polyethylene films. Macromolecules 2001, 34, 7496.
17. (a) Glatter, O.; Kratky, O. (eds.). Small Angle X-Ray Scattering; Academic Press: London, 1983;
(b) Hosemann, R.; Bagchi, S.N. Direct Analysis of Diffraction by Matter; North-Holland:
Amsterdam, 1962.
18. Rybniakar, F. Iteractions in the system polyethylene-solid filler. J. Macromol. Sc. Phys. B 1981,
19, 1.
19. Wunderlich, B. Macromolecular Physics Academic Press: New York, 1976; Vol. 2.
20. (a) Keller, A. The spherulitic structure of crystalline polymers. PART I. investigations with the
polarizing microscope. J. Polymer Sci. 1955, 17, 291; (b) Keller, A.; Sawada, S. On the interior
morphology of bulk polyethylene. Macromol. Chem. 1964, 74, 190.
21. Bassett, D.C. Principles of Polymer Morphology; Cambridge University Press: Cambridge,
1981.
22. Lovinger, A.J. Microstructure and unit-cell orientation in a-polypropylene. J. Polym. Sci.,
Polym. Phys. 1983, 21, 97.
23. (a) Asmundtveit, K.E.; Samuelsen, E.J.; Guldstein, M.; Steisland, C.; Flornes, O.; Fagermo, C.;
Seeberg, T.M.; Petterson, L.A.A.; Ignanas, O.; Feidenhans’l, R.; Ferrer, S. Structural anisotropy
A. Famulari et al.370

of poly(alkylthiophene) films. Macromolecules 2000, 33, 3120; (b) Meille, S.V.; Romita, V.;
Caronna, T.; Lovinger, A.J.; Catellani, M.; Belobrzeckaja, L. Influence of molecular weight
and regioregularity on the polymorphic behavior of poly(3-decylthiophenes). Macromolecules
1997, 30, 7898.
24. Rizzo, P.; Lamberti, M.; Albunia, A.R.; Ruiz deBallestreros, O.; Guerra, G. Macromolecules
crystalline orientation in syndiotactic polystyrene cast films 2002, 35, 5854.
25. Rizzo, P.; Costabile, A.O.; Guerra, G. Perpendicular orientation of host polymer chains in
clathrate thick films. Macromolecules 2004, 37, 3071.
26. Price, F.P. In Nucleation; Zettlemoyer, A.E., (ed.); Dekker: New York, 1969.
27. Binsbergen, F.L. Heterogeneous nucleation in the crystallization of polyolefins. III. theory and
mechanism. J. Polym. Sci. Polym. Phys. Ed. 1973, 11, 117.
Clay-induced Orientation in Polyethylene Nanocomposites 371