greenprint midtown - TransFormation Alliance
292
greenprint midtown SUSTAINABILITY ACTION PLAN 2012 MIDTOWN ALLIANCE SOUTHFACE ENERGY INSTITUTE RENAISSANCE PLANNING GROUP SUSTAINABLE ATLANTA PERKINS+WILL
-
Upload
khangminh22 -
Category
Documents
-
view
0 -
download
0
Transcript of greenprint midtown - TransFormation Alliance

greenprint midtown
SUSTAINABILITY ACTION PLAN 2012
MIDTOWN ALLIANCE
SOUTHFACE ENERGY INSTITUTE
RENAISSANCE PLANNING GROUP
SUSTAINABLE ATLANTA
PERKINS+WILL

GREENPRINT MIDTOWN
1. Introduct ion
Susta inabi l i ty P lan 20122

1 . Introduct ion3
table of contents
EXECUTIVE SUMMARY 5 INTRODUCTION 11
PLANNING APPROACH 19 IMPACT AREAS 29 ENERGY 31 OPEN SPACE 49 WATER 87 TRANSPORTATION 117
WASTE 151
IMPLEMENTATION 173 MEASUREMENT & REPORTING 179 APPENDICES 185
APPENDIX A: COMMUNITY VISIONING/ENGAGEMENT 186 KICK-OFF MEETING INTERACTIVE VISIONING SESSION COMMUNITY SURVEY BUILDING OWNERS & MANAGERS SURVEY RESTAURANT SURVEY
MULTI-FAMILY RESIDENCE SURVEY
APPENDIX B: BEST PRACTICES 242 ENERGY EFFICIENCY REVOLVING LOAN FUND HIGH-EFFICIENCY PUBLIC SPACE LIGHTING GREEN INFRASTRUCTURE PLUMBING FIXTURE RETROFITS OFFICE WASTE REDUCTION ELECTRONICS RECYCLING CONSTRUCTION & DEMOLITION WASTE DIVERSION ENVIRONMENTALLY PREFERABLE PURCHASING GREEN BUSINESS RECOGNITION TEMPORARY PARKS TACTICAL URBANISM STREET TREE INVENTORY GREEN STREETS TRANSIT STATION AREA DEVELOPMENT STREETSCAPES TRAFFIC CONTROL AND DESIGN BICYCLE INFRASTRUCTURE
APPENDIX C: POLICY & INFRASTRUCTURE BARRIERS 289


executive summary
Midtown Atlanta is perfectly positioned to be a leader in sustainabil-
ity due to its location, its infrastructure, and its people. The purpose of
Greenprint Midtown, is to spur actions that further enhance Midtown’s
development as one of the nation’s most livable, innovative, economi-
cally successful, and sustainable communities. This plan adds a “green
lens” to Midtown Alliance’s existing programs and identifies new oppor-
tunities to increase Midtown’s sustainability. The report examines five
impact areas – energy, water, open space, transportation, and waste –
focusing primarily on the 118 blocks that make up the core of Midtown.
A 6-month long planning process captured input and direction from hundreds of residents, restaura-
teurs, retailers, employers, employees, property owners and subject area experts. This report details
recommended high priority as well as longer-term actions, projects and programs that will make Mid-
town an even more appealing and sustainable place, building on the Midtown Alliance’s past success
in developing and implementing long-range community-based plans. Successful implementation will
require the participation of all members of the community; however, Midtown Alliance and its leader-
ship will play a unique and essential role to bring disparate entities and efforts together to galvanize
the community around a collective vision and facilitate implementation.
LEADING FROM A POSITION OF STRENGTH
Located in the heart of the city, Midtown is a high-density, mixed-use, walkable community. Mid-
town is home to many of Atlanta’s most prominent institutions – the Woodruff Arts Center, Emory
University Hospital – Midtown, the Center for Puppetry Arts, Georgia Institute of Technology, and
the Savannah College of Art and Design – Atlanta. Over the past 15 years, Midtown has experienced
unprecedented growth. Today, this community boasts over 24 million square feet of office space,
1 million square feet of restaurant/retail space, 12,000 multi-family residential units and 4,000 hotel
rooms.
Midtown’s accelerated growth is due in large part to its high level of regional and local accessibility.
With four MARTA rail stations, regional and local buses and shuttles, an established grid of streets
with sidewalks and bike lanes, and Interstate access, Midtown is highly connected.

Two hundred acres of adjacent green space
create a virtual forest within the city. Piedmont
Park serves as a regional destination for recre-
ation and rejuvenation, and a growing number
of smaller public and private parks and plazas
punctuate the district and create places for peo-
ple to relax and play. A distinguishing feature of
Midtown is its over 2,000 street trees. Midtown’s
sidewalk canopy allows for a comfortable and
inviting walking environment. Midtown’s Atlanta
Botanical Garden consistently ranks as one of
the best in the country and has a long-term com-
mitment to conservation.
Midtown’s property owners, businesses, and
institutions all play a strong role in shaping Mid-
town as a sustainable community. Georgia Tech
is one of the nation’s leading research institu-
tions with a deep commitment to innovation and
sustainability. Office tenants are seeking green
buildings and property owners and developers
are responding. Eight of the last ten buildings
developed in Midtown are LEED certified and
seventeen (17) office buildings in the Midtown
Core have received the Energy Star designation.
The diverse mix of residents, students, doctors,
architects, engineers, researchers, artists, law-
yers, and even puppeteers makes for an inter-
esting and vibrant community but also present a
unique opportunity for developing innovative and
creative solutions to sustainability challenges.
DOVETAILS WITH CITY AND REGIONAL EFFORTS
Greenprint Midtown aligns well with a number of
city and regional efforts to address sustainability.
The plan feeds into the City of Atlanta’s Power to
Change sustainability plan. Greenprint’s inves-
tigation of new opportunities for open space
furthers the City’s efforts to add new green
spaces as identified in Project Greenspace. The
Metro Atlanta Chamber of Commerce’s recently
released Sustainable Economic Growth Initia-
tive (SEGI) presents a strategy to link job growth
and environmental sustainability. At the regional
level, Plan 2040, the regional growth plan devel-
oped by the Atlanta Regional Commission, em-
braces sustainability as its organizing principle.
The Metro North Georgia Water Planning District
has plans and programs to address water sup-
ply and conservation, wastewater treatment, and
stormwater management.
FROM BLUEPRINT TO GREENPRINT TO ECODISTRICT
Blueprint Midtown, completed in 1997 and
updated in 2003, serves as the foundation for
Greenprint Midtown. The Blueprint was created
as a vision plan for a mixed-use, walkable, transit
friendly community that catalyzed and directed
growth and development in the core of Midtown.
The planning process incorporated the input of
thousands of community members and spurred
Midtown’s transformation.
Greenprint Midtown continued the focus on
community engagement by hosting public and
stakeholder meetings, reaching out to the com-
munity through extensive surveying efforts, and
capturing the expertise from technical and advi-
sory committee members. Greenprint reinforces
the original Blueprint vision but builds on it. This
plan takes a deliberate approach to being more
sustainable. It has a strong action bias and was
designed for near-term success.
As Greenprint Midtown moves from planning
to implementation, Midtown Alliance will brand
Midtown as an EcoDistrict. An “ecodistrict” is
defined by national sustainability leaders as a
place that has made a broad commitment to
district-scale sustainability. The Midtown Eco-
District brand will provide an opportunity to
highlight success stories, create additional
awareness around sustainability, and inspire

others to take part.
PROGRAMMATIC RECOMMENDATIONS
The following briefly summarizes the recommended opportunities and priority programs for each the
five Impact Areas. Programs were prioritized based on their expected level of impact, their value to
the community, and their likelihood of success.
I. ENERGY: Midtown’s economic growth and quality of life depends on reliable and affordable
energy - to keep buildings comfortable, to move trains and cars, to manage traffic, and to
keep Midtown streets and sidewalks safe. Midtown’s energy goals are to promote energy
conservation, energy efficiency, and renewable energy; to reduce energy use by minimizing
demand; and to reduce reliance on fossil fuels. The following programs are recommended to
meet these goals:
• Energy Efficiency and Conservation in Buildings
• High Efficiency Public Spaces Lighting
II. TRANSPORTATION: The function, convenience, comfort, and safety of our transportation
system has a significant effect on quality of life, the environment and the economic health
of regions and communities. The transportation goals for Midtown are to improve access
and mobility, decrease single occupancy vehicle trips to, from and within Midtown, and to
reduce the total amount to miles people travel. Midtown has an opportunity to build on a
relatively high number of commuters and residents using transit, walking, and/or bicycling
through additional emphasis on the following programs:
• Streetscape Program Implementation
• Bicycle Plan Implementation
• Enhanced Transportation Demand Management
• Improved Local Transit and Coordinated Shuttle Services
III. WATER: Clean and readily available water is fundamental to environmental and human health,
as well as economic prosperity. Our City and State face significant water quality and sup-
ply issues that could affect how our community grows and prospers. Through the Green-
print Midtown process, three overarching goals have been identified to meet these needs in
Midtown: minimize storm water runoff from impervious surfaces; increase water efficiency
in buildings; and reduce potable water consumption. The following programs will aid in
meeting those goals:
• Green Stormwater Infrastructure Program
• Restaurant Water Efficiency Outreach
• Multi-family Water Efficiency Outreach
• Rainwater Harvesting Outreach

IV. OPEN SPACE - The largest positive impact that we can have on our natural environment is
encouraging more options for living and working in dense urban districts where we use
less land and fewer natural resources. Programmed open spaces and tree-lined streets are
important to providing a quality of life that will attract residents and businesses and cata-
lyze new development. The open space goals outlined in Greenprint Midtown are to pro-
vide increased access to permanent and temporary open spaces; to design and program
spaces to encourage community vitality and interactions; and to preserve and enhance
Midtown’s tree canopy and landscaped areas. Programs include:
• Acquisition and Development of Civic Squares
• Temporary Park and Plaza Development
• Open Space Activation
• Landscape Enhancement
V. WASTE: Given the density of people that live, work and play in Midtown, a significant
amount of waste is generated in Midtown. This waste contributes to air, water and land
pollution. However, Midtown’s diversity and concentration of uses, particularly restaurants,
provides significant opportunities for successful waste reduction strategies that can make
measurable differences in waste reduction, are cost neutral, and support local industry. The
overall goal is to reduce the amount of solid waste generated by maximizing reuse, recy-
cling, and composting. Programs include:
• Restaurant Waste Reduction Outreach
• Multi-family Building Recycling Outreach
• Electronics Recycling Outreach
IMPLEMENTATION
Transitioning the recommended programs from Greenprint Midtown into an implementation strat-
egy is key to its success. To that end, Midtown Alliance will focus on near-term implementation
efforts that include fine-tuning programs, combining programs where appropriate, developing tools
to educate and inform the community, cultivating partnerships with key stakeholders, and establish-
ing tracking and measurement tools. While implementation will require participation by all members
of the community, Midtown Alliance’s role as implementer, catalyst, or facilitator will be critical to

ensure long-term success.
Three pivotal strategies that have the potential to positively influence all Impact Areas and can be
implemented in the short-term are described below:
Develop Partnerships – Midtown Alliance relies on partnerships to execute its work plan. There is a
near-term opportunity to further an existing partnership with Georgia Tech that would serve to tie
together innovation, economic development, and sustainability. Combining the unique research and
innovation assets of Georgia Tech with an organization that brings people and institutions together
offers great potential for Midtown to become a “sand box” for innovations that solve energy, water,
and transportation challenges.
Midtown EcoDistrict Brand – Branding Midtown as an ecodistrict will identify Midtown as a place
where sustainability is important. The brand can also be used to create awareness and educate
residents, employees, and visitors about sustainability initiatives in Midtown and the individuals and
entities that are contributing to its success.
Green Business Recognition Program – Another opportunity to raise the level of awareness of busi-
nesses that have made a commitment to sustainability is to create a “green” business certification
and recognition program. This program would empower Midtown stakeholders to support sustain-
able businesses, would provide positive reinforcement for businesses adopting sustainable practices,
and would serve to inspire other businesses to engage in sustainable actions.
In short, Midtown has the opportunity to build on the assets, existing programs, and commitments
from this community’s stakeholders to make Midtown one of the most livable, innovative, and sus-
tainable communities.

GREENPRINT MIDTOWN
1. Introduct ion
Susta inabi l i ty P lan 201210
1SECTION

1 . Introduct ion11
introduction
Greenprint Midtown is a comprehensive sustainability action plan that outlines strategies and recommends
programs to address energy, water, waste, open space, and transportation challenges in Midtown Atlanta. This
section discusses background information that provides the context for the plan, the motivation for sustainabil-
ity planning in Midtown, how Greenprint Midtown dove-tails with broader regional and city sustainability goals,
and the structure of the plan.

GREENPRINT MIDTOWN
1. Introduct ion
Susta inabi l i ty P lan 201212
BACKGROUND
In February 2012, Midtown Alliance launched
a planning initiative to identify actions that
would lead to a more sustainable Midtown
Atlanta. The results of this report provide the
framework for the creation of an “eco-district”
in Midtown. While future visioning was a
important component of this planning process,
the focus was on identifying strategies that
could be implemented in the near-term.
Midtown Alliance has a strong track record for
creating inspiring plans and most importantly,
turning them into action.
Midtown Alliance was formed in 1978
to improve the quality of life in the core
commercial district. The early years were
focused on public safety and economic
development. In 1997, inspired by the Georgia
Conservancy’s Blueprints for Successful
Communities program, Midtown Alliance
launched a groundbreaking economic
development master plan called Blueprint
Midtown. Developed using a comprehensive
community visioning process, Blueprint
Midtown reflected a strong desire for action
and progress within the core area. Blueprint
Midtown was a vision plan that stimulated
dramatic change within the District by
providing the framework and impetus for new
housing, desirable office space, transportation
improvements, public safety initiatives,
environmental maintenance, and a pedestrian-
friendly streetscape program. It also laid
the groundwork for the largest rezoning in
the history of the City of Atlanta. To fund
many of these initiatives, Midtown Alliance
worked with commercial property owners
in 2000 to form the Midtown Improvement
Established in 1978, Midtown Alliance has been the driving force behind sustained revitalization through a comprehensive approach to consensus-building, planning, and development.
District – a geographically defined area where
commercial properties pay an additional tax to
fund improvements within the District. Through
implementation of the Blueprint, Midtown has
emerged as an authentic live-work-play urban
community, home to over 20,000 residents,
over 80,000 workers and over 6 million annual
visitors.
The Blueprint was updated and further refined
in 2003 with a specific focus on retail, transit,
and parks. This spurred the creation of a
retail effort referred to as the Midtown Mile, a
renewed interest and examination of a streetcar
network, and development of the Arts District
Plaza and the Fox Triangle Plaza. Nine years
later, a new layer has been added to the
Blueprint. Greenprint Midtown was initiated to
place a “green lens” over Blueprint Midtown. It
will serve to augment the existing vision and
programs currently underway by capitalizing on
market forces to further economic growth while
specifically addressing environmental challenges
and opportunities.

1 . Introduct ion13
MOTIVATION FOR GREENPRINT MIDTOWN
Sustainability is commonly defined as meeting
the needs of the present without compromising
the ability of future generations to meet their
own needs. Most experts believe that further
developing compact, walkable communities
like Midtown offer the best opportunity to
become more sustainable. A more sustainable
Midtown means creating a place where people
and companies want to be – a place where
businesses can be successful, residents have an
opportunity to live well, and our air, water, and
land is clean. Midtown’s expanding population
and rapid increases in buildings and associated
infrastructure intensify its environmental impact.
As a region, we struggle to deal with air pollution
from vehicles and power plants, water quality
and supply issues, the heat island effect from too
many hard surfaces, and health issues. At the
same time, market forces are helping to move
the needle on identifying and implementing
innovative solutions to these issues. The
commercial real estate sector is leading the way
with building efficiency improvements that save
money and reduce energy and water impacts.
The potential to attract Generation Y is pushing
cities and communities to make investments
in transit, walking and bicycling infrastructure,
technology, and opportunities for social
interaction.
Pursuing sustainability is no longer a luxury.
It is essential for remaining competitive.
Sustainability requires taking a fresh look at
balancing economy, environment, and equity
that in the past have been viewed as competing
against one another, rather than being
complementary.
Greenprint Midtown capitalizes on growing
public understanding of sustainability issues
and the desires of governments, businesses,
and individuals to live, learn, work, and play
more sustainably within their local community.
Midtown Alliance is well positioned to
guide sustainability efforts in the District
due to its long and successful experience
with community engagement, planning,
and action bias. This experience will allow
Midtown Alliance to engage the community
in new programs and projects that focus on
broader stewardship and responsible resource
management while generating more diverse
economic development opportunities.

GREENPRINT MIDTOWN
1. Introduct ion
Susta inabi l i ty P lan 201214

1 . Introduct ion15
REGIONAL AND LOCAL SUSTAINABLITY
The need for Greenprint Midtown is also
evident within the context of regional and local
sustainability challenges. These challenges
include a sprawling growth pattern, dependence
on cars and nonrenewable sources of electricity,
loss of greenspace, increasingly limited water
resources, and a sluggish economy. Initiatives
that address these challenges are often slowed
or complicated by numerous decision-making
bodies and disparate local service delivery areas.
Limited capital for infrastructure investments
and even more limited funding for education
and outreach efforts often curb comprehensive
implementation of sustainability initiatives.
Despite these challenges, individuals and
organizations across Atlanta are working to
shift the regional sustainability paradigm. The
Atlanta region is a national leader in green
building. City and regional planners are working
to create denser, transit-oriented developments,
and bureaucratic hurdles are being removed
to encourage sustainable development in
private industry. In addition, city leaders are
collaborating with regional and state partners to
improve regional transportation infrastructure.
ATLANTA REGIONAL COMMISSION PLAN 2040
The Atlanta Regional Commission’s PLAN
2040, specifically its Regional Resource Plan,
represents a regional planning approach that
addresses sustainability challenges for Atlanta.
The plan recognizes the region’s historical
growth trends and seeks to encourage more
sustainable ways to accommodate another three
million residents by mid-century.
A paradigm shift will be needed for the region
to move forward, and sustainability actions at
the district-scale will play a significant role in
supporting the region’s economy, environment,
and residents. PLAN 2040 provides residents
of Metro Atlanta with increased opportunities
to live, learn, work, and play in an evolving
metropolitan area. The goals of the plan are to
serve the people, engage community, enhance
mobility, preserve the environment, and expand
the economy. These objectives will enhance the
sustainability of the region for decades to come.
CITY OF ATLANTA POWER TO CHANGE
Issues of growth, land and resource use,
transportation, and development must also be
addressed at the municipal scale. Often, it is
easier to enact change at a municipal level than
regionally, because of increased complexities
in governance and scope. The City of Atlanta
and Mayor Kasim Reed are addressing these
issues with the Power to Change plan. This plan
outlines objectives for the City of Atlanta to
integrate sustainability into its operations and
infrastructure with the goal of becoming one of
the “Top Ten” sustainable cities in the nation.
The Mayor’s Office of Sustainability is charged
with implementing Power to Change and
engaging all relevant stakeholder groups to
ensure that they balance economic growth with
environmental protection, while taking care
not to disenfranchise low-income communities.
Power to Change seeks to reduce greenhouse
gas emissions 25 percent by 2020, reduce
residential waste 30 percent by 2013, provide
a minimum of ten acres of green space per
1,000 residents, restore the tree canopy to 40

GREENPRINT MIDTOWN
1. Introduct ion
Susta inabi l i ty P lan 201216
percent coverage, reduce municipal energy
use 15 percent by 2020, use renewable energy
to generate 5 percent of municipal demand by
2015, and make local food available within ten
minutes of 75 percent of all residents by 2020.
The City of Atlanta, in partnership with a variety
of private and public sector stakeholders
including Midtown Alliance, has launched the
Atlanta Better Buildings Challenge, an initiative
to help commercial real estate facilities reduce
energy and water use by 20 percent by 2020.
The Better Buildings Challenge, along with
various neighborhood and community-based
sustainability initiatives, assists the City in
achieving the goals set forth in Power to Change.
VISION FOR A MIDTOWN ECODISTRICT
Atlanta’s sustainability challenges highlight the
need for a new approach to sustainable building
and design at the community and neighborhood
scale. Renewed interest in locally defined and
implemented sustainability efforts is evidenced
by growing participation, both nationally and
internationally, in programs such as the U.S.
Green Building Council’s Leadership in Energy
and Environmental Design for Neighborhood
Development (LEED ND) program and the
Portland Sustainability Institute’s (PoSI)
EcoDistrict Initiative. PoSI defines an ecodistrict
as “a neighborhood or district with a broad
commitment to accelerate neighborhood-scale
sustainability. EcoDistricts commit to achieving
ambitious sustainability performance goals,
guiding district investments and community
action, and tracking results over time.” Midtown
Alliance’s mission and planning approach
exemplify these characteristics, and as such,
Greenprint Midtown uniquely positions the
Midtown community as an ecodistrict.
Through implementation of Greenprint
Midtown, Midtown Alliance will be able to define
sustainability standards at the community
level and realize its vision of an innovative,
interconnected, resource-efficient EcoDistrict.
The Midtown EcoDistrict will organize property
owners within the area to take collective actions
that reduce consumption of energy, water, and
other resources, while simultaneously increasing
market share and profitability. By leveraging
partnerships, providing better measurements
for success, and boosting marketing efforts, the
Midtown EcoDistrict will also aid broader city
and regional sustainability initiatives.
PLAN STRUCTURE
Following this chapter, Greenprint Midtown
includes four sections and multiple
appendices. The “Planning Approach” section
summarizes the planning process, including the

1 . Introduct ion17
community engagement activities, research,
and assessments conducted to inform the
development of the plan. The “Impact Areas”
section of the plan is organized by topic and
outlines general sustainability information,
as well as strategies and specific program
recommendations associated with each.
The “Implementation” section discusses the
projected timeline and outlines opportunities
to execute the plan. The “Measurement &
Reporting” section outlines future tracking and
measurement methodologies and includes a
chart of performance measures that will gauge
the progress of Greenprint Midtown.
Greenprint Midtown is accompanied by three
appendices that are intended to document
the planning process and provide resources
to support implementation. These sections
include: community engagement strategies, best
practices, and barriers to implementation.

GREENPRINT MIDTOWN
2. P lanning Approach
Susta inabi l i ty P lan 201218
2SECTION

2. P lanning Approach19
planning approach
Greenprint Midtown was developed using a collaborative planning approach designed to capitalize on the technical
expertise of industry professionals and to engage the broader Midtown community. This section outlines the
comprehensive planning and assessment approach that was conducted between February and July 2012 which
led to the final recommendations in the plan.

GREENPRINT MIDTOWN
2. P lanning Approach
Susta inabi l i ty P lan 201220
PROJECT LEADERSHIP
Midtown Alliance engaged a consultant team led by Southface Energy Institute to develop this re-
port. Greenprint Midtown was guided by an Executive Advisory Committee and received valu-
able input from Technical Advisory Committee members dedicated to a more sustainable future
for Midtown.
CONSULTANT TEAM
Midtown Alliance managed the overall planning process and retained consulting services from local
and regional sustainability specialists to form the Consultant Team that conducted the majority of
planning activities. The Consultant Team consisted of:
SOUTHFACE ENERGY INSTITUTE – Southface is an Atlanta based non-profit that promotes energy, wa-
ter, and resource efficient workplaces, homes, and communities throughout the Southeast. South-
face served as the project manager, implemented the community engagement process, and provided
technical expertise in the areas of energy, water, and waste.
RENAISSANCE PLANNING GROUP – Renaissance is a planning, design, and policy analysis consulting
firm with expertise in transportation, urban design, land use, technology, and sustainability. RPG
served as the technical lead on transportation.
SUSTAINABLE ATLANTA – Sustainable Atlanta is a local non-profit that serves as a catalyst and facilita-
tor for sustainable progress in Atlanta. Sustainable Atlanta served as the liaison to broader city and
regional sustainability initiatives, assisted with identifying barriers to implementation and project rep-
lication opportunities.
EXECUTIVE ADVISORY COMMITTEE
An Executive Advisory Committee (EAC) was
formed to provide executive level guidance and
direction for the planning process. The ten-
member committee was comprised of Midtown
Alliance and Midtown Improvement District
board members, as well as other community
leaders interested in advancing sustainability
in Midtown. The EAC convened at key points
throughout the process.
TECHNICAL ADVISORY COMMITTEE
A Technical Advisory Committee (TAC) was
organized to engage approximately thirty-five
industry professionals with expertise in particu-
lar sustainability topics, including energy, water,
open space, transportation, and waste. TAC
members helped develop, vet, and prioritize the
strategies and programs outlined in this report.
TAC members attended a webinar orientation
in early April 2012 and met primarily via confer-
ence call on an ongoing basis throughout the
planning process.
2. P lanning Approach21
PLANNING AREA
The focus of Greenprint Midtown centers on
the Midtown Core which generally mirrors the
Midtown Improvement District (MID) bound-
ary, where Midtown Alliance has a long history
of successfully working with local property
owners, businesses, institutions, and residents.
Where necessary or appropriate, the scope of
analysis was expanded beyond the Midtown
Core to embrace greater Midtown. Midtown
Alliance sees Greenprint Midtown as providing
the framework for creating an EcoDistrict that
emanates from the core of Midtown. The Mid-
town EcoDistrict would not have a prescribed
boundary but is envisioned to embrace the
larger Midtown community.
IMPACT AREAS
Sustainability is commonly defined as meeting the needs of the present without compromising
the ability of future generations to meet their own need. For Midtown, this means creating a place
where businesses can be successful, people have opportunities and are healthy, and our air, water,
and land is clean. The specific needs of a community dictate the necessary focuses for an effective
local sustainability plan. To help define the appropriate areas of focus for Greenprint Midtown, Mid-
town Alliance and the Consultant Team evaluated the mission and capacity of the Midtown Alliance,
the unique characteristics of Midtown, other local sustainability planning efforts including the City of
Atlanta’s Power to Change, 1 the Atlanta Regional Commission’s Plan 2040 2, and the ecodistrict plan-
ning process developed by the Portland Sustainability Institute. The result of that analysis identified
five areas of focus, or Impact Areas that fit within the mission of Midtown Alliance and in most cases
builds off of an existing role. The five impact areas are as follows:
The planning area includes approximately:
• 850 acres over 118 blocks
• 24 million square feet of office space
• 1 million square feet of restaurant/retail space
• 12,000 multifamily residential units
• 4,000 hotel rooms
1 City of Atlanta. 2011. “Power to Change.” Available at :
http://atlantasustainabilityweek.org/ATLSustainPlan.pdf (Ac-
cessed June 2012)
2 Atlanta Regional Commission. 2011. “Plan 2040.” Available
at: http://documents.atlantaregional.com/plan2040/ARC-
PLAN2040report_web.pdf (Accessed June 2012)
Energy Transportation Water Waste Open Space

GREENPRINT MIDTOWN
2. P lanning Approach
Susta inabi l i ty P lan 201222
These five Impact Areas provide the best opportunity for Midtown Alliance to have a direct impact
on sustainability outcomes in the District. Transportation and open space programs are a strong fit
with Midtown Alliance’s long history of success with infrastructure development, greenspace plan-
ning and development, pedestrian-friendly streetscapes, and public safety programs. Many of the
outreach functions that Midtown Alliance currently provides to businesses in the District in the areas
of transportation demand management could be easily expanded to encompass similar concepts of
conservation and efficiency in the areas of energy, water, and waste.
COMMUNITY VISIONING AND ENGAGEMENT
Community engagement strengthens planning
processes by including all relevant stakehold-
ers in the project. It ensures that the needs of
community are being incorporated in plan de-
velopment, it helps to build a “coalition of the
willing,” and it opens up opportunities for ongo-
ing partnerships. Building on the success of the
Blueprint Midtown process, Midtown Alliance
remained committed to collaborative community
engagement during the development of Green-
print Midtown and incorporated several opportu-
nities for open dialogue and input.
The Stakeholders
Midtown employers, property owners, residents,
workers, visitors, and City and regional leaders
helped define the vision and planning priorities
for Greenprint Midtown. Community feedback
was gathered through public meetings, multiple
surveys, social media outlets, and one-on-one
discussions.
Kick-Off Meeting
Midtown Alliance hosted a kick-off meeting on
March 1, 2012 to introduce the project to the Mid-
town community and gather “out of the gate”
ideas and comments. Over 200 attendees rep-

2. P lanning Approach23
resenting diverse interests in Midtown learned
about the goals of Greenprint Midtown and
provided valuable and informative feedback on
their visions for community sustainability. Pub-
lic comments and suggestions were recorded at
the meeting to inform later steps of the planning
process; ideas and questions from participants
heavily influenced questions asked in follow-up
surveys. A summary of feedback from the kick-
off meeting is provided in Appendix A.
Community Survey
Midtown Alliance invited further input through
an online community survey that was available
for eight weeks from late March 2012 through
early May 2012. Over 600 respondents provided
feedback and information on their current level
of activity, their interests, motivations for taking
personal sustainability actions, and their ideas
for community-level programs and outcomes.
The survey indicated strong buy-in from the Mid-
town community on sustainability; recognizing
that sustainability is key to Midtown’s economic
success and its quality of life. The survey also
revealed opportunities for education and incen-
tives to further actions in homes and workplaces.
A summary of the community survey results is
provided in Appendix A.
Interactive Visioning Session
The public was invited to engage more deeply
in the planning process at the Interactive Vision-
ing Session hosted on April 17, 2012. Approxi-
mately 100 attendees participated in five rounds
of facilitated discussions and provided feedback
on specific sustainability strategies for the five
Impact Areas. Feedback from participants was
largely positive and affirmed that the proposed
strategies were appropriate and necessary for
advancing sustainability in Midtown. With a di-
Image 1: Visualization of Public Feedback on Water
53%
36%
9%
1%
1%
0%

GREENPRINT MIDTOWN
2. P lanning Approach
Susta inabi l i ty P lan 201224
verse group of people, it was an opportunity
to educate, learn, and listen. Presentation
materials from the Visioning Session and a
summary of feedback received are included in
Appendix A.
Building Owners and Managers Survey
Building owners and property managers are an
important interest group to the Greenprint Mid-
town process due to their ability to implement
building-level projects and practices. They also
offer a communications channel to the employ-
ers and employees in Midtown. Midtown Alli-
ance capitalized on their relationships with local
owners to gain important baseline information
on sustainability assets and practices already in
place in Midtown. The Consultant Team used
these responses to inform and develop recom-
mended strategies and programs for each of
the Greenprint Midtown Impact Areas.
In late March, 2012, Midtown Alliance solicited
input and information from building owners and
managers through an online survey to gather
building-specific data and better understand
the existing level of participation in sustain-
ability measures in Midtown buildings as well as
their level of interest in education and training
opportunities. The survey indicated that many
buildings are developing and/or actively imple-
menting sustainability projects or programs and
are engaging tenants in them. Aggregated sur-
vey results are included in Appendix A.
Restaurant Survey
Midtown Atlanta has a particularly high concen-
tration of restaurants which make a significant
contribution to the local economy and quality
of life. Restaurants also happen to be large
consumers of water and energy and gener-
ate a significant amount of waste. Given this, it
is important to better understand their current
sustainability practices and willingness to adopt
new practices. The survey conducted of res-
taurants in Midtown revealed that less than half
of respondents currently have a comprehensive
recycling program and a high percentage of re-
spondents were unsure about the status of water
efficient fixtures in their facility. The survey re-
sults inform priority program recommendations
and baselines for measurement and tracking.
Aggregated survey results are included in Ap-
pendix A.
Multifamily Building Survey
Multi-family buildings are the predominant resi-
dential building type in Midtown Atlanta. A sur-
vey was conducted of multi-family buildings in
Midtown Atlanta to better comprehend existing
sustainability practices and their willingness to
adopt new practices. Overall, the survey indi-
cated that most buildings offered some type of
recycling collection although many did not offer
comprehensive recycling programs. Very few
medium and small residential buildings partici-
pated in the survey so additional research needs
to be conducted in the future. Aggregated sur-
vey results are included in Appendix A.

2. P lanning Approach25
RESEARCH
In addition to the surveys, the Consultant Team conducted in-depth secondary research to
develop specific recommendations for the Greenprint Midtown plan.
BEST PRACTICES
Best practices were identified and documented to support the development and implemen-
tation of Greenprint Midtown programs. The following research was conducted to develop
best practices:
· Code and Ordinance Review
· Assets Research
· Metrics Research
· Sustainability Plan Evaluation
· Personal Consultation and Interviews
· City of Atlanta Office of Sustainability
· City of Atlanta Department of Planning and Community Development
- Office of Buildings
- Office of Planning
· City of Atlanta Department of Watershed Management
- Office of Water Efficiency
- Bureau of Watershed Protection
· Better Buildings Challenge – U.S. Department of Energy
· Atlanta Better Building Challenge – City of Atlanta
· Portland Sustainability Institute
The best management practices identified through this research are referenced throughout
the plan as appropriate; details are included in Appendix B.

GREENPRINT MIDTOWN
2. P lanning Approach
Susta inabi l i ty P lan 201226
BUILDING ASSESSMENTS
In addition to qualitative and best practices research, quantitative assessments at the build-
ing level are essential tools to determine the most effective building-level priorities for spe-
cific Impact Areas. Based on a listing of all buildings in the Midtown Core, the Consultant
Team developed a representative sample of Midtown’s building stock and performed build-
ing assessments with each to better understand energy and water use. Assessments were
conducted in the following building types:
· Class A Office Building (3)
· Class B Office Building (1)
· Multi-family Residential Condo Buildings (2)
· Multi-family Residential Apartment Building (1)
· Hotel (1)
· Restaurant (1)
Individual building assessments provided:
· An on-site inspection of the building envelope and all energy and water systems
· A detailed analysis of where energy and water dollars are currently being spent
· Recommendations for cost-effective operational and capital improvements, both
small and large-scale
· An evaluation of potential operational savings that will result from capital improve-
ments and the implementation costs.
Results of the nine building assessments and a building characterization for Midtown are
provided to Midtown Alliance as a separate deliverable.
52%
11%
19%
12%
5%
3%
2. P lanning Approach27
STRATEGY AND PROGRAM DEVELOPMENT
Community engagement, research activities, and input from technical experts were used to inform
and develop a suite of sustainability strategies and programs that form the basic framework of
Greenprint Midtown. For purposes of this plan, “strategies” are viewed as broadly defined initiatives
designed to achieve the overall sustainability goals for the District. The strategies that were devel-
oped provide the basis for program development and are broad enough that future programs could
be developed from them. Tier 1 or “priority” programs outline immediate and near-term actions Mid-
town Alliance will undertake to address local challenges within each Impact Area.
REVIEW PROCESS
The Coordinating Team applied a multi-step review process to develop general sustainability strate-
gies and identify specific programs and projects that will be the most impactful for Midtown:
STEP 1: Community engagement activities and research used to develop more than sixty sus-
tainability strategies.
STEP 2: Consultant Team and Midtown Alliance filtered list to remove strategies deemed in-
feasible or unlikely to result in successful outcomes.
STEP 3: Executive Advisory Committee and Technical Advisory Committee input used to de-
velop specific programs and projects from list of strategies.
STEP 4: Consultant Team applied evaluation criteria to the list of recommended programs to
select the final priority programs that are presented in detail in the following section
of this plan.
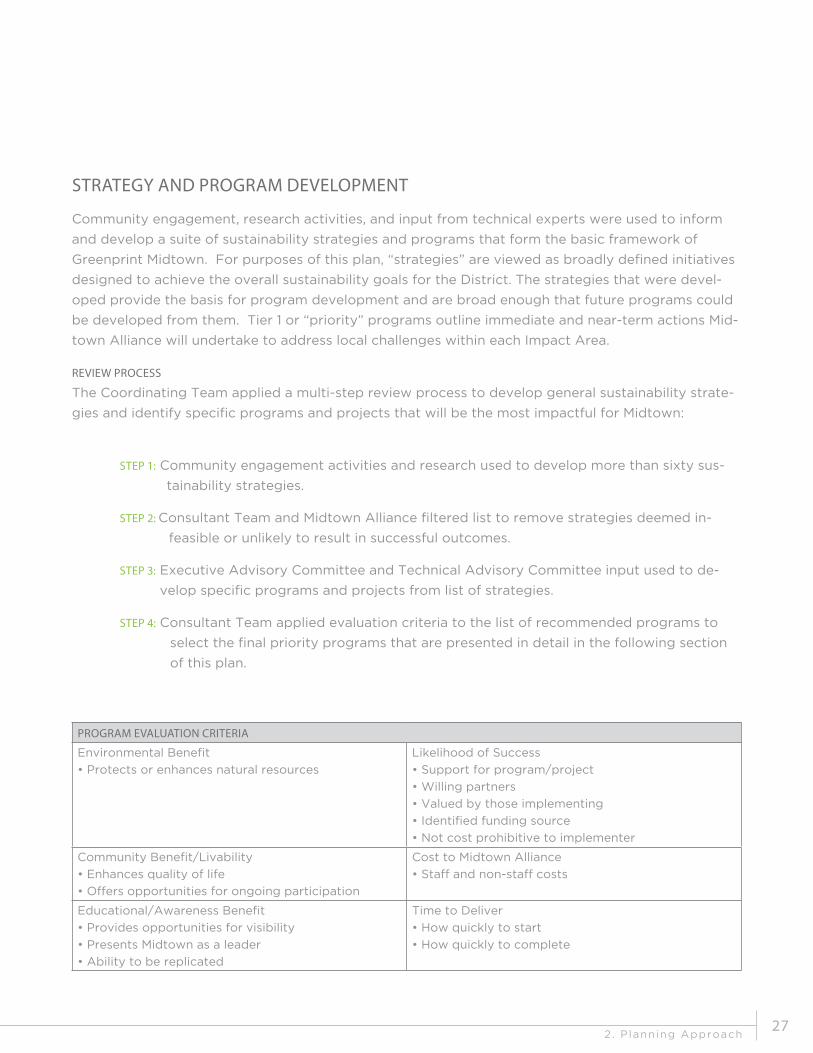
PROGRAM EVALUATION CRITERIA
Environmental Benefit
• Protects or enhances natural resources
Likelihood of Success
• Support for program/project
• Willing partners
• Valued by those implementing
• Identified funding source
• Not cost prohibitive to implementer
Community Benefit/Livability
• Enhances quality of life
• Offers opportunities for ongoing participation
Cost to Midtown Alliance
• Staff and non-staff costs
Educational/Awareness Benefit
• Provides opportunities for visibility
• Presents Midtown as a leader
• Ability to be replicated
Time to Deliver
• How quickly to start
• How quickly to complete

GREENPRINT MIDTOWN
3. Impact Areas
Susta inabi l i ty P lan 201228
3SECTION

3. Impact Areas 29
impact areas
In this section, the results of research and the develop-ment of strategies and ultimately programs are presented for each of the five Impact Areas - Energy, Transportation,
Water, Open Space, and Waste..
The following framework is outlined for each Impact Area:
Overview: The overview provides the context and reasoning behind the development of
particular strategies and programs.
Midtown Assets: Assets describes infrastructure and/or programmatic elements already
present in the District that support the goals of the Impact Area.
Strategies: Broad initiatives that serve to realize the Impact Area goals. Strategies factor
in local conditions and needs and were developed from technical expertise, best practices
research, and the public engagement process. They form the foundation for program
development.
Programs: Specific building-scale and District-scale programs that relate back to a Strategy
and ultimately help to achieve Impact Area goals. The following information is outlined
within each recommended Program:
Description: Outlines the elements of the Program and defines Midtown Alliance’s role.
Potential Implementation Partners & Resources: Local organizations already working
on similar initiatives that may provide programmatic support or serve as a resource.
Impact: Potential environmental, community, and economic effects of the Program.
Cost & Potential Funding: General estimates of costs to the Midtown Alliance and
potential sources of funding.
Challenges & Potential Solutions: Barriers to success and potential strategies to
overcome them.
Tracking and Measurement: Metrics define what is being measured, baselines
establish existing conditions, and targets provide quantifiable goals that are
time bound.
GREENPRINT MIDTOWN
3. Impact Areas
Susta inabi l i ty P lan 201230
“Put simply, the market will ultimately favor the greenest buildings in the greenest locations in the greenest cities.”
- Edward McMahon, Senior Resident Fellow, ULI/Charles E. Fraser Chair for Sustainable
Development and Environmental Policy

3. Impact Areas 31
3.1 Energy
ENERGY OVERVIEW
Midtown’s economic growth and quality
of life depends on reliable and affordable
energy - to keep buildings comfortable, to
move trains and cars, to manage traffic, and
to keep Midtown streets and sidewalks safe.
With over 24 million square feet of office
space, 12,000 residential units, 4,000 hotel
rooms, and 1 million square feet of retail and
restaurants, Midtown is a significant user
of energy. Georgia’s relatively hot, humid
climate combined with few regulatory or price
incentives result in higher than average energy
use per capita state-wide as compared to
the national per capita average. In fact,
according to the American Council for an
Energy-Efficient Economy (ACEEE), in 2011
Georgia ranked 36th among all states for
energy efficiency.
However, residents of dense, mixed-use urban
communities like Midtown use considerably
less energy per capita than those living in
suburban or rural locations. 1 Residential
towers with smaller living spaces are more
efficient to heat and cool. Easy access by foot
to nearby services and workplaces means less
energy use due to fewer car trips.
Midtown’s commercial and institutional
buildings have made significant strides
in becoming more energy efficient as
evidenced by the trend in green building
certification programs such as the U.S. Green
Building Council’s Leadership in Energy and
Environmental Design (LEED) and the U.S.
Environmental Protection Division’s Energy
Star certification. Eight (8) of the last ten (10)
buildings developed in Midtown are LEED
certified and many buildings are now seeking
LEED for Existing Buildings certification. In
2011, EPA’s list of cities with the most Energy
Star certified buildings ranked Atlanta 3rd
behind Los Angeles and Washington DC. Since
2005, 17 office buildings in the Midtown Core
have received the Energy Star designation.
Energy improvements have also recently
been made in the public realm in Midtown. In
2010, Midtown Alliance implemented a project
with funding from the Midtown Improvement
District (MID), Georgia Department of
Transportation (GDOT), and the U.S.
Department of Energy (DOE) to retrofit 542
traffic signal heads and 577 pedestrian signal
heads with high efficiency, long-lasting light
emitting diodes (LED). Over the lifespan of
the LEDs, this upgrade is expected to reduce
energy use by over 30 gigawatts and reduce
carbon emissions by 22,000 tons. This project
has improved performance and safety, and has
reduced City energy and maintenance costs.
ENERGY GOALS
• Promote energy conservation,
energy efficiency, and renewable
energy
• Reduce energy use by minimizing
demand
• Reduce reliance on fossil fuels
1 Edward L. Glaeser, “Green Cities, Brown Suburbs,” City Journal. Vol. 19,
No. 1. 2009

GREENPRINT MIDTOWN
3. Impact Areas
Susta inabi l i ty P lan 201232
It is estimated that by 2020, the United States could reduce annual energy consumption by 23
percent from a business as usual projection by deploying an array of energy efficiency measures
that overcome existing barriers.2 While there is a heightened awareness and a trend nationally
toward becoming more energy efficient and reducing energy consumption, significant opportunities
exist in Midtown to accelerate the pace of adoption and enhance an existing strength. By doing so,
Midtown building owners, businesses, and residents can lower operating costs, improve public and
environmental health, increase energy security, increase property values, and improve performance.
Midtown Alliance can help to achieve this goal by implementing programs that promote reduced
energy consumption, increasing awareness of the benefits of conservation and efficiency, linking
retrofit projects with creative financing mechanisms, and continuing investments in energy efficiency
in the public right of way.2 McKinsey & Company. 2009. “Unlocking Energy Efficiency in the U.S. Economy.” Retrieved from: http://www.mckinsey.com/client_service/electric_power_
and_natural_gas/latest_thinking/unlocking_energy_efficiency_in_the_us_economy (Accessed July 2012).

3. Impact Areas 33
CHALLENGES
Buildings consume nearly half of all energy produced in the United States and are responsible for
almost half of U.S. CO2 emissions. Here in Georgia, commercial buildings use about 14 percent more
electricity than the national average, and residential buildings use about 25 percent more than the
national average.4 This differential is primarily due to a hot and humid climate, previously weak
energy efficiency codes, lack of public awareness, and perhaps most importantly, a lack of economic
incentive due to Georgia’s relatively low energy prices.
While Georgia Power’s parent company, Southern Company, is increasing its portfolio of natural gas
fired generation and investing in small renewable energy projects, coal remains the predominant
fuel source for electricity generation in Georgia. In 2010, over 95 percent of all electricity generated
in Georgia was from imported, non-renewable energy sources.5 Georgia is one of just 17 states that
does not currently have a renewable portfolio standard (RPS) requiring a certain percentage of
electricity to be generated from a renewable energy source.
3 Energy Information Administration. 2012. “ National figures from EIA Annual
Energy Review.” Retrieved from:http://www.eia.gov/totalenergy/data/an-
nual/index.cfm#consumption (Accessed July 2012). Georgia figures from EIA
State Energy Data System for Georgia. 2012. Retrieved from: http://www.eia.
gov/state/state-energy-profiles-data.cfm?sid=GA#Consumption (Accessed
July 2012).
Source: U.S. Energy Information Administration – State Energy Data System. Energy Consumption Overview: Estimates
by Energy Source and End-Use Sector, 2010. 3
5 Energy Information Administration. 2012. “ Table 5A. Residential Average Month-
ly Bill by Census Division, and State.” http://www.eia.gov/electricity/sales_rev-
enue_price/html/table5_a.html. (Accessed July 2012). Table 5B. Commercial Av-
erage Monthly Bill by Census Division, and State.2012.Retrieved from: http://www.
eia.gov/electricity/sales_revenue_price/html/table5_b.html (Accessed July 2012).
5 U.S. Energy Information Administration. 2012. “Georgia Energy Profile 2010.
‘Table 5. Electric Power Industry Generation by Primary Energy Source, 1990
Through 2010’.” Retrieved from: http://www.eia.gov/electricity/state/georgia/
xls/sept05ga.xls (Accessed July 2012).
26%
23%

GREENPRINT MIDTOWN
3. Impact Areas
Susta inabi l i ty P lan 201234
Reliance on fossil fuels, particularly imported
non-renewable sources such as coal, results in
environmental, economic, and social impacts.
The burning of coal for fuel has well-documented
negative impacts to air, water, and land. Its
combustion contributes to atmospheric
emissions of pollutants like mercury, lead, nitric
oxides, sulfur dioxides, and carbon dioxide and
is the main contributor to Atlanta’s frequent
ground level ozone violations. 6 Furthermore,
coal and nuclear plants require massive amounts
of water to generate power. Georgia’s electricity
sector withdraws more water from our rivers
than any other sector of our economy. Since
Georgia imports almost all of its primary energy
from other states such as Kentucky and West
Virginia and from countries such as Columbia,
Egypt and Nigeria, 7 8 about half of what
consumers pay for electricity leaves the state.
Importing energy also makes the State especially
vulnerable to energy supply disruptions.
6 EPA. Environmental Protection Agency. 2012. “Coal.” Retrieved from:
http://www.epa.gov/cleanenergy/energy-and-you/affect/coal.html (Ac-
cessed July 2012).
7 EIA. Energy Information Administration.2011. “Annual Coal Distribution Re-
port 2010.” Retrieved from: http://www.eia.gov/coal/distribution/annual/pdf/
acdr_fullreport2010.pdf (Accessed July 2012).
8 EIA. Energy Information Administration.2012. “Georgia International and
Interstate Movements of Natural Gas by State.” Retrieved from: http://www.
eia.gov/dnav/ng/ng_move_ist_a2dcu_sga_a.htm (Accessed July 2012).
Historically, Atlanta has benefitted from
Georgia’s comparatively low energy prices.
However, prices for electricity have been on
the rise in recent years. Between 2005 and
2011, Georgia Power residential rates increased
54.5 percent per kilowatt hour and commercial
rates increased by 38.7 percent per kilowatt
hour.9 These rate hikes are primarily the
result of system upgrades such as nuclear
plant construction, conversion to natural gas
generation, and distribution grid improvements. 10 These are long-term projects and the
associated price increases from the capital
investments will be experienced over many
years. Fortunately, fuel costs have recently
declined but do not come close to offsetting the
capital cost increases.
While investing in energy efficiency in buildings
has proven to be a cost-effective way to lower
energy costs, access to capital continues to
be a limiting factor, particularly for smaller
commercial buildings. Building operating funds
are typically not adequate to finance meaningful
energy retrofits and many commercial lenders
are reluctant to provide funding for building
retrofits with payback beyond three years.11
10 Georgia Power. 2012. “Residential Rates and Service.” Retrieved from: http://
www.georgiapower.com/pricing/files/rates-and-schedules/2.10_R-18.pdf (Ac-
cessed July 2012).
10 Georgia Power.2012. “Residential Rate Advisor.” Retrieved from: http://www.
georgiapower.com/pricing/residential/pricing/get-the-facts.asp (Accessed July
2012).
11 Climate Change, Land Use, and Energy 2010. Urban Land Institute. Retrieved
from: http://www.uli.org/~/media/Documents/ResearchAndPublications/Re-
ports/Sustainable%20Development/2010CLUE.ashx (Accessed July 2012).

3. Impact Areas 35
OPPORTUNITIES
Commercial building energy efficiency retrofits
provide the best opportunity to reduce energy
demand and lower energy costs. Given the
challenges associated with energy generation
and distribution along with the reduction
in energy demand resulting from efficiency
measures, Midtown can consider energy
efficiency an investment in local, sustainable
energy sources. With energy costs expected to
continue to rise even further, energy efficiency
strategies will result in higher returns on
investment than in the past and continued rate
increases will make those investments even
more valuable over time. Based on an analysis
by the American Council for an Energy Efficient
Economy (ACEEE), the average utility cost
for efficiency in the U.S. is 2.5 cents per kilowatt
hour.12 This is considerably lower than the cost of
obtaining electricity from any other energy source.
Energy efficiency measures are a particularly
cost-effective option for commercial building
owners. Urban Land Institute’s 2009 Climate,
Land Use, and Energy report found that major
investors, bankers, and asset managers are
all now looking at energy efficiency as they
underwrite new acquisitions and investments.
While the market is responding as evidenced
by the significant growth in LEED and Energy
Star certified buildings, many cities are taking
more aggressive steps to accelerate efficiency
and meet sustainability goals through stronger
energy codes, legislation that mandates green
building certification, energy use disclosure,
energy audits, and retro-commissioning (an
engineering practice that ensures a building is
operating at peak performance for its current
use and equipment).
Businesses and residents, the users of
buildings, are key contributors to the amount
of energy consumed in a building. Their
behaviors – whether they leave lights on,
turn computers off, pull shades down, install
efficient lighting, purchase efficient equipment
– often dictate the energy performance of
a building. This fact reveals a significant
opportunity for Midtown Alliance to actively
engage businesses and residents in education
and awareness strategies that focus on
reducing energy consumption.
There are distinct opportunities to reduce
energy usage in public spaces such as
Midtown’s recent transition to LED bulbs in
traffic and pedestrian signals. Nationally, 22
percent of all energy generated is used for
lighting with eight (8) percent of that used
for public outdoor lighting.13 The electricity
used to power streetlights can represent a
significant portion of a city’s power bill as
well as a major source of greenhouse gas
(GHG) emissions. Replacing streetlights and
other public space lighting with more energy
efficient lamping can be an important and
cost-effective strategy for reducing energy and
maintenance costs, improving public safety
through better visibility, and reducing GHG
emissions. The technology for high efficiency
12 Friedrich K., M. Eldridge, D. York, P. Witte, and M. Kushler. 2009. “Saving Energy
Cost-Effectively: A National Review of the Cost of Energy Saved through Utility-
Sector Energy Efficiency Programs.” Retrieved from: http://www.aceee.org/
research-report/u092 (Accessed July 2012).
13 Hartley D, Jurgens C, Zatcoff E, and Bilec M, Marriott J (advisors). 2009.”Lifecy-
cle Assessments of Streetlight Technologies” University of Pittsburgh, Pittsburgh
PA. Retrieved from: www.pitt.edu/news2010/Streetlight_Report.pdf (Accessed
July 2012).
GREENPRINT MIDTOWN
3. Impact Areas
Susta inabi l i ty P lan 201236
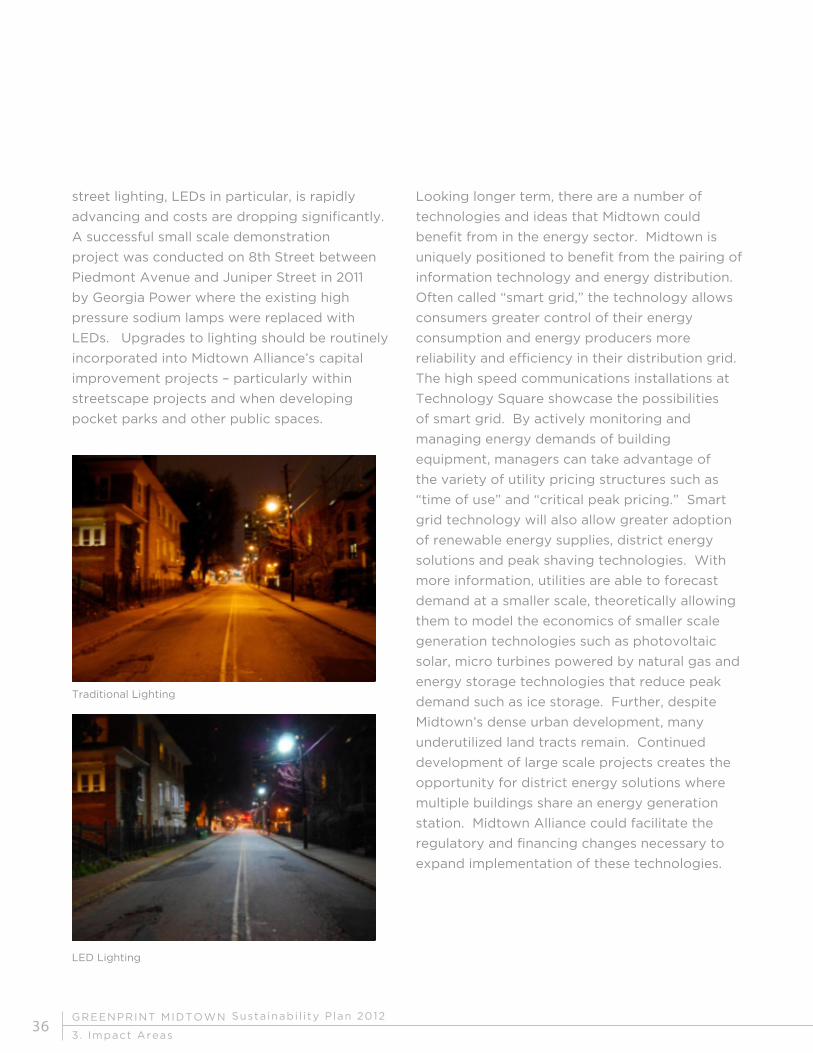
street lighting, LEDs in particular, is rapidly
advancing and costs are dropping significantly.
A successful small scale demonstration
project was conducted on 8th Street between
Piedmont Avenue and Juniper Street in 2011
by Georgia Power where the existing high
pressure sodium lamps were replaced with
LEDs. Upgrades to lighting should be routinely
incorporated into Midtown Alliance’s capital
improvement projects – particularly within
streetscape projects and when developing
pocket parks and other public spaces.
Looking longer term, there are a number of
technologies and ideas that Midtown could
benefit from in the energy sector. Midtown is
uniquely positioned to benefit from the pairing of
information technology and energy distribution.
Often called “smart grid,” the technology allows
consumers greater control of their energy
consumption and energy producers more
reliability and efficiency in their distribution grid.
The high speed communications installations at
Technology Square showcase the possibilities
of smart grid. By actively monitoring and
managing energy demands of building
equipment, managers can take advantage of
the variety of utility pricing structures such as
“time of use” and “critical peak pricing.” Smart
grid technology will also allow greater adoption
of renewable energy supplies, district energy
solutions and peak shaving technologies. With
more information, utilities are able to forecast
demand at a smaller scale, theoretically allowing
them to model the economics of smaller scale
generation technologies such as photovoltaic
solar, micro turbines powered by natural gas and
energy storage technologies that reduce peak
demand such as ice storage. Further, despite
Midtown’s dense urban development, many
underutilized land tracts remain. Continued
development of large scale projects creates the
opportunity for district energy solutions where
multiple buildings share an energy generation
station. Midtown Alliance could facilitate the
regulatory and financing changes necessary to
expand implementation of these technologies.
Traditional Lighting
LED Lighting
3. Impact Areas 37
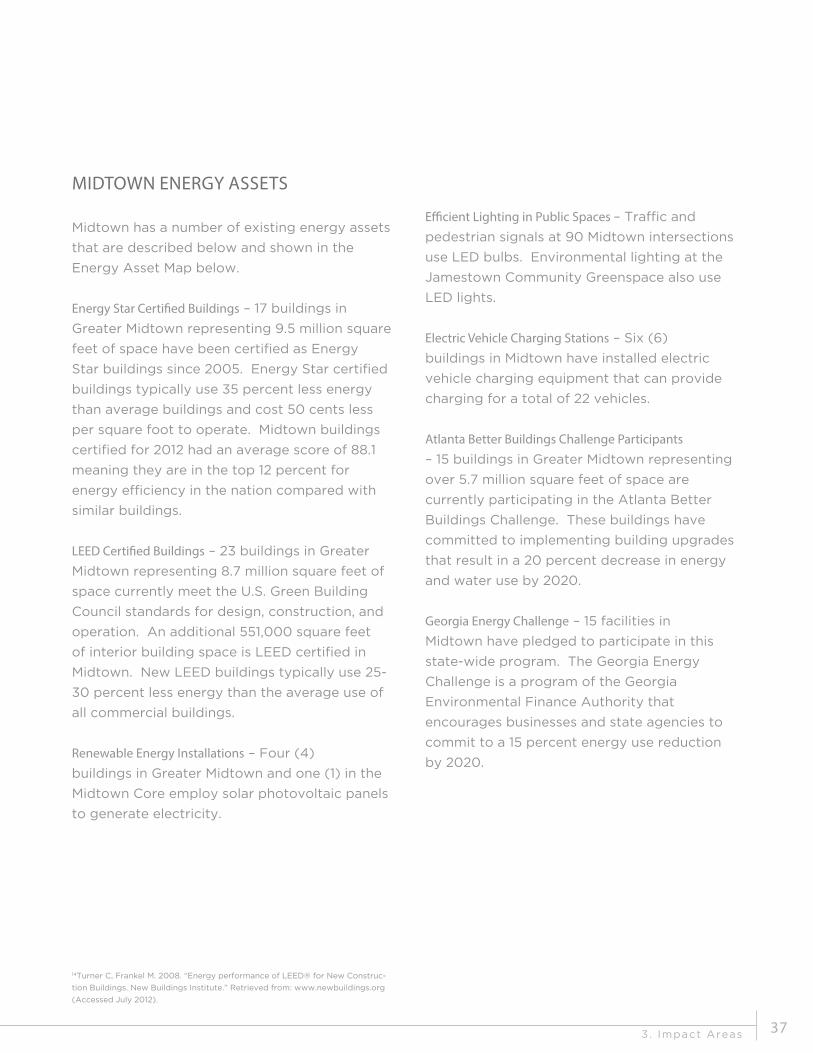
MIDTOWN ENERGY ASSETS
Midtown has a number of existing energy assets
that are described below and shown in the
Energy Asset Map below.
Energy Star Certified Buildings – 17 buildings in
Greater Midtown representing 9.5 million square
feet of space have been certified as Energy
Star buildings since 2005. Energy Star certified
buildings typically use 35 percent less energy
than average buildings and cost 50 cents less
per square foot to operate. Midtown buildings
certified for 2012 had an average score of 88.1
meaning they are in the top 12 percent for
energy efficiency in the nation compared with
similar buildings.
LEED Certified Buildings – 23 buildings in Greater
Midtown representing 8.7 million square feet of
space currently meet the U.S. Green Building
Council standards for design, construction, and
operation. An additional 551,000 square feet
of interior building space is LEED certified in
Midtown. New LEED buildings typically use 25-
30 percent less energy than the average use of
all commercial buildings.
Renewable Energy Installations – Four (4)
buildings in Greater Midtown and one (1) in the
Midtown Core employ solar photovoltaic panels
to generate electricity.
Efficient Lighting in Public Spaces – Traffic and
pedestrian signals at 90 Midtown intersections
use LED bulbs. Environmental lighting at the
Jamestown Community Greenspace also use
LED lights.
Electric Vehicle Charging Stations – Six (6)
buildings in Midtown have installed electric
vehicle charging equipment that can provide
charging for a total of 22 vehicles.
Atlanta Better Buildings Challenge Participants
– 15 buildings in Greater Midtown representing
over 5.7 million square feet of space are
currently participating in the Atlanta Better
Buildings Challenge. These buildings have
committed to implementing building upgrades
that result in a 20 percent decrease in energy
and water use by 2020.
Georgia Energy Challenge – 15 facilities in
Midtown have pledged to participate in this
state-wide program. The Georgia Energy
Challenge is a program of the Georgia
Environmental Finance Authority that
encourages businesses and state agencies to
commit to a 15 percent energy use reduction
by 2020.
14Turner C, Frankel M. 2008. “Energy performance of LEED® for New Construc-
tion Buildings. New Buildings Institute.” Retrieved from: www.newbuildings.org
(Accessed July 2012).

GREENPRINT MIDTOWN
3. Impact Areas
Susta inabi l i ty P lan 201238

3. Impact Areas 39
ENERGY STRATEGIES & PROGRAMS
Through the Greenprint Midtown planning process, the following Energy strategies were
developed and guided the selection of both Tier 1 (priority) and Tier 2 programs/projects. In the
future, additional programs and projects can be developed from these strategies.
STRATEGIES
ES1: Promote energy conservation through increased awareness
ES2: Promote energy efficiency in the public and built environment
ES3: Encourage use of alternatively fueled vehicles
ES4: Increase awareness of renewable energy options
ES5: Remove barriers to energy efficiency and conservation
TIER 1 PROGRAMS/PROJECTS
The following Tier 1 programs and projects were identified as priorities and are described in more
detail in the next section.
EP1: Energy Efficiency and Conservation in Buildings
EP2: High Efficiency Public Spaces Lighting Retrofit Program
TIER 2 PROGRAMS/PROJECTS
EP3: Renewable Energy Demonstration Project: While the cost of renewable energy is dropping
significantly, installations in buildings are best reserved for high performance buildings
wishing to approach net-zero energy use. However, Midtown should pursue installation of a
renewable energy demonstration project in a highly visible public location for the benefit of
increased public awareness.
EP4: Alternative Fuel Vehicle Infrastructure: Alternatively fueled vehicles, particularly electric
vehicles, will comprise 20% of worldwide auto sales by 2020. Installation of fueling
infrastructure in the near future will facilitate adoption of these more efficient vehicles when
they are readily available.
EP5: Multi-Building (District) Energy Feasibility: The efficiency and environmental benefits of
district energy solutions are widely recognized. However, regulatory and financing barriers
exist. Convening a committee of experts and commissioning a study will help identify
solutions appropriate for Midtown.

GREENPRINT MIDTOWN
3. Impact Areas
Susta inabi l i ty P lan 201240
TIER 1 ENERGY PROGRAMS
EP1: ENERGY EFFICIENCY AND CONSERVATION IN BUILDINGS
Description
The Greenprint Midtown planning process
identified a clear opportunity to improve energy
efficiency and reduce energy consumption in
the built environment through a comprehensive
program of awareness, education, and
promotion. The Energy Efficiency and
Conservation in Buildings Program calls for
Midtown Alliance to take an active role in the
ongoing Atlanta Better Buildings Challenge
(ABBC) and to promote additional resources
that encourage energy savings.
ABBC is a national program of the U.S.
Department of Energy (DOE) launched by
President Obama in 2011 that asks participants
to commit to implementing building retrofits
that result in a 20 percent reduction in energy
and water use by 2020. 15 The City of Atlanta
was selected as a participant and the Challenge
launched in Downtown Atlanta to capitalize
on the robust MUSH (municipal, university,
school, and hospital) market. The program has
been administered by Central Atlanta Progress
(CAP), the community improvement district for
Downtown Atlanta. Midtown Alliance signed
on as a founding partner in April 2012 and
immediately began recruiting Midtown buildings
to participate in the program. In exchange for
their commitment, building owners receive
a complimentary energy and water audit, a
detailed report that identifies opportunities for
achieving the 20 percent reduction, connections
to local vendors and financing options, training
opportunities, and recognition as a leader
in energy efficiency in the District. Results
from a similar program for Atlanta non-profit
organizations indicate savings between four and
eight percent are possible from the process of
assessment and operational changes alone.
15 Atlanta Better Buildings Challenge. 2012. Retrieved from: www.atlantabbc.com
(Accessed July 2012).

3. Impact Areas 41
The goals of this program are to create a higher level of awareness on the benefits of energy
efficiency and conservation, accelerate the existing pace of retrofits, and spur interest and
investments in deeper energy retrofits. Midtown Alliance will focus on the following initiatives and
services to achieve these goals:
• Atlanta Better Buildings Challenge (ABBC) – Midtown Alliance will aggressively promote
ABBC to Midtown building owners and managers through the following activities:
- Recruit and gain commitments of Midtown buildings – ideal candidates include office
buildings, hotels, hospitals, and retail buildings that haven’t invested in building
retrofits in at least 5 years
- Educate participants on audit results, financing options, and best practices
- Participate as a founding partner in committees and marketing activities of ABBC
- Act as the program liaison for Midtown building participants
- Track utility data through 2020
- Publicize the program and Midtown participants through Midtown Alliance’s
communication channels
• Educate businesses, residents, and building managers that are not participating in ABBC
about energy efficiency and conservation best practices such as Retro Commissioning
• Encourage the use of Energy Star Portfolio Manager to benchmark and track building
performance
• Develop an energy baseline for Midtown and track progress over time
• Educate property owners and buildings managers about the energy efficiency financing
options available to them with a specific focus on small to mid-size commercial buildings.
Financing options include but are not limited to the following:
- PACE – Property Assessed Clean Energy
- Georgia Green Loans
- Georgia Power EarthCents
- Traditional Bank Loans
- Revolving Loan Funds (RLFs)

GREENPRINT MIDTOWN
3. Impact Areas
Susta inabi l i ty P lan 201242
IMPACT
Environmental Impact: Reducing fossil fuel combustion through energy efficiency decreases the release
of harmful emissions. The ACEEE estimates that by achieving 15 percent electricity savings and
10 percent natural gas savings between 2010 and 2020, Georgia could reduce emissions of carbon
dioxide by 15.2 million tons, the equivalent of taking approximately 2.8 million cars off of Georgia’s
roads.16
Community Impact: The Energy Efficiency and Conservation Program will establish Midtown
as a leader in sustainable practices. The outreach initiatives within the Energy Efficiency and
Conservation Program will widen the pool of potential participants and create a community more
likely to implement similar measures in all aspects of their lives.
Economic Impact: Energy efficiency measures implemented at the building level will reduce
operating costs and help to attract the expanding pool of tenants interested in sustainability. This
program will also support many of the architecture and engineering firms that call Midtown home by
expanding opportunities for additional business. Generally, businesses in this sector compete locally;
therefore, money spent within the program stays local.
POTENTIAL IMPLEMENTATION PARTNERS & RESOURCES
- City of Atlanta: In addition to its policy and regulatory role, the City is the lead agency
responsible for the Atlanta Better Buildings Challenge. The City provides leadership,
communication, and access to national resources and best practices associated with the
ABBC.
- Central Atlanta Progress: Is a founding partner of the ABBC and developed the existing
program structure in partnership with the City of Atlanta.
- Southface: Provides free energy assessments as well as technical expertise via energy and
water efficiency consulting to ABBC participants.
- Georgia Power: Sponsors the ABBC by providing free energy assessments, provides
electricity usage data, and offers energy efficiency incentives through its EarthCents program.
- Atlanta Gas Light: Sponsors the ABBC by providing free energy assessments and provides
electricity usage data.
- U.S. Department of Energy: Founder and administrator of the national Better Buildings
Challenge program, provides technical expertise to the program, offers best practices from
building participants, and markets the program nationally.
16 Furrey, L. A., S. Nadel, and J. A. Laitner. 2009. “ACEEE | Laying the Foundation for Implementing A Federal Energy Efficiency Resource Standard.” Retrieved
from: http://www.aceee.org/research-report/e091 (Accessed July 2012).

3. Impact Areas 43
COSTS & POTENTIAL FUNDING
Costs to support this program are primarily related to staffing allocations but also include marketing
functions and utility tracking expenses. To effectively manage and grow Midtown’s participation the
ABBC (through 2020), promote energy efficiency resources, and track progress over time, Midtown
Alliance should allocate ~25% of an existing Midtown Alliance staff member. This allocation will likely
decrease as building participants move from the assessment phase to implementation. To track
monthly utility data for Midtown participants, Midtown Alliance should budget $1,500/yr initially with
a gradual increase in following years depending on the number of buildings participating.
While the BBC is a program of the U.S. DOE, there currently is no funding associated with
participation. ABBC is currently supported through foundation grants, in-kind services, sponsorships,
contributions from CIDs, and volunteers. As the ABBC program continues to grow in popularity,
resource needs also grow.
CHALLENGES & POTENTIAL SOLUTIONS
Challenge: Owners and managers of buildings that are already performing efficiently may be hesitant
to commit to the ABBC due to costs of making deep retrofits.
Potential Solution: The ABBC could be structured in such as way that recognizes those buildings
that are already high performing. For example, ABBC could create another layer of recognition for
those buildings that reach the highest levels of performance as measured in Energy Star. While these
buildings may not be included in the data sent to U.S. DOE, they can still be recognized as making
a commitment to energy and water efficiency. Midtown Alliance can also identify opportunities to
recognize these high performing buildings in ways separate from the ABBC.
TRACKING & MEASUREMENT
METRIC/INDICATOR BASELINE TARGET
Atlanta Better Buildings Challenge
Square Footage of Commercial
Bldg ABBC Commitment
5.4 M 10 M Sq Ft by 2015
Green Building Certification17
Square Footage of Green Certified
Bldg
15.7 M 22M Sq Ft by 2020
17 High-performance green building certification with third party or professional verification includes: LEED, EarthCraft, and ENERGY STAR

GREENPRINT MIDTOWN
3. Impact Areas
Susta inabi l i ty P lan 201244
EP2: HIGH EFFICIENCY PUBLIC SPACE LIGHTING
Description
Switching from inefficient lighting to high
efficiency lighting in public spaces like
streetscapes, parks, and plazas provides a
significant opportunity to reduce energy
use, improve public safety, and reduce
ongoing operational and maintenance costs.
Communities and entire cities have begun to
retrofit street lights with light emitting diodes
(LEDs) with great success (see Best Practice
in the Appendix). Currently, there are three
different types of street lights in Midtown –
Type A (tall pendant-style decorative fixture
for lighting roadways), Type C (shorter acorn-
style fixture for lighting sidewalks), and cobra
heads (see figure 1) – and all use high pressure
sodium (HPS) lamps. At present, retrofit options
for cobra heads are readily available and cost-
effective whereas those for Type A and C
fixtures are still limited and expensive.
This program outlines two parts – replace
existing cobra head lights with high efficiency
lights as part of a future streetscape project
and specify and install high efficiency lighting in
existing and future parks and plazas.
Midtown Alliance has developed a “green
street” concept for Juniper Street between 14th
Street and North Avenue that includes a barrier
separated bicycle facility, wide sidewalks, a
reduction in vehicular travel lanes, shade trees,
and bioswales. This project was awarded a
Livable Centers Initiative (LCI) grant through the
Atlanta Regional Commission and is currently
in the design phase. The current design
calls for adding 65 cobra head street lights.
Incorporating high efficiency lamps in the cobra
head lights as an element of this project would
add significantly to the “green street” concept
and would be the City’s first corridor with LED
lighting. If proven successful, Midtown Alliance
should explore opportunities to retrofit all cobra
heads in Midtown with LED fixtures.
Figure 1 – Midtown Street Lights – Cobra head, Type A, Type C

3. Impact Areas 45
As part of Midtown Alliance’s efforts to add more active open spaces in Midtown, high efficiency
lighting should be utilized whenever lighting is incorporated. Midtown’s newest open space, the
Jamestown Community Greenspace at 18th and West Peachtree Street, incorporates LED lighting
for the fixtures designed to highlight the trees and landscaping.
This program includes the following activities:
• Partner with appropriate departments of the City of Atlanta and with Georgia Power
to implement the high efficiency lighting project on Juniper Street and for future street
lighting projects.
• Identify the appropriate lighting fixtures by utilizing the U.S. Department of Energy’s
municipal solid-state street lighting consortium. This online resource provides best
practices, technical information, and a forum for learning from others.
• Identify funding to implement the program.
• Track energy savings as well as operation and maintenance costs savings. Track user
satisfaction through a survey that asks about light quality and perceptions on public safety.
This data should be used to inform future lighting retrofit projects.
IMPACT
Environmental Impact: The highest efficiency lighting product on the market is the LED light.
Currently, LEDs use between 50 and 90 percent less energy and last two (2) to three (3) times
longer (approximately ten (10) years) than conventional light sources. This increase in efficiency and
extended lifespan has positive environmental impacts to air, water, and waste. As shown in figure
below, switching from HPS to LED lamps on Juniper Street and throughout the Midtown core results
in significant emissions, water.
In Georgia, approximately 0.57 gallons of fresh water is consumed by thermoelectric power plants
for every kilowatt hour (kWh) of electricity that is produced.18 Replacing all existing streetlights in
Midtown would result in saving approximately 477,500 gallons of water a year. A demonstration
retrofit project at Juniper Street results in saving approximately 20,600 gallons of water a year.
LEDs do not contain hazardous waste as some lights do and are completely recyclable.
MIDTOWN ATLANTA HIGH EFFICIENCY LIGHTING RETROFITS
*Estimated Annual Savings
NOX EMISSIONSREDUCTION(LBS.)
SOXEMISSIONS REDUCTION(LBS.)
WATER USE REDUC-TION(GALLONS)
Juniper Street 70 310 20,600
Midtown Core 1,600 7,170 477,500
18 Footnote missing

GREENPRINT MIDTOWN
3. Impact Areas
Susta inabi l i ty P lan 201246
POTENTIAL IMPLEMENTATION PARTNERS & RESOURCES
- City of Atlanta, Office of Sustainability and Department of Public Works: partner for Midtown
Alliance to identify the appropriate street light fixtures and measure impacts.
- Georgia Power: may need to partner with Midtown Alliance if a future retrofit project involves
street lights that are leased from Georgia Power to the City of Atlanta.
- U.S. Department of Energy Municipal Solid-State Street Lighting Consortium: a resource to
learn more about best practices, assessing financial feasibility, and accessing technical re-
sources for street light retrofit projects.
COSTS & POTENTIAL FUNDING
Costs to support this program are primarily related to the cost of the LED fixtures and an allocation
for staff time to manage and track the project. The incremental cost to utilize an LED street light
fixture is approximately $200 per light pole. Therefore, the cost to upgrade all sixty-five (65) cobra
head lights planned for Juniper Street is approximately $13,000. The cost to manage this project and
measure results can be incorporated into existing staff/consultant allocations. If Midtown Alliance
decides to upgrade the remainder of cobra head lights in the District, the cost to purchase and install
those lights would be approximately $155,000 (assuming 387 cobra heads at $400/each).
Community Impact: LED lights can improve public safety in a community due to increased visibility.
As a directional light source, LEDs limit light pollution and ensure that light lands where it is needed.
LEDs also provide a very high quality light that is more visible at nighttime due to its bluish tint.
Economic Impact: While the upfront cost for an LED street light fixture is slightly higher than tradi-
tional lighting, high efficiency lighting will reduce both operating and maintenance costs in Midtown.
It is estimated that replacing all existing street light fixtures in Midtown would save $78,000 annual-
ly. Retrofitting only the fixtures on Juniper Street would save $3,300 annually. 19 Because LEDs last
30 to 70 percent longer than conventional light sources, labor time and material costs associated
with replacing lamps in Midtown is also reduced. 20 Using maintenance cost estimates from other
cities, the City could save around $16,000 annually if every fixture in Midtown were retrofitted and
$3,300 for just those fixtures on Juniper Street.
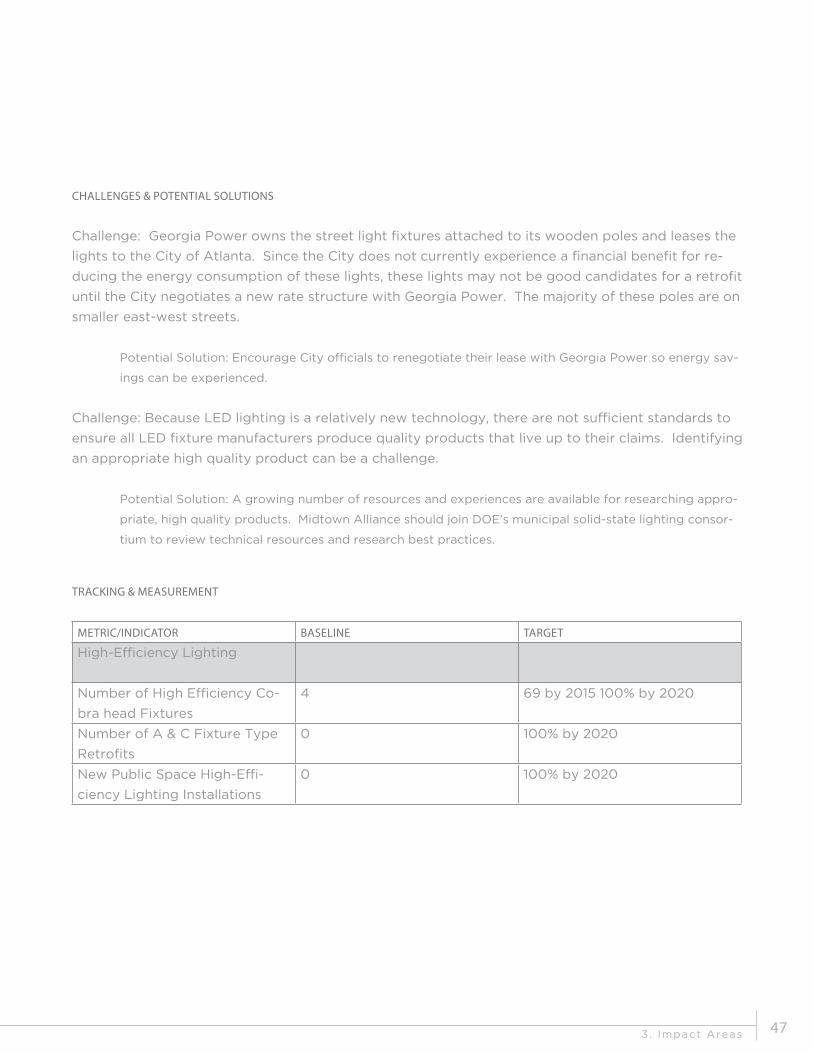
3. Impact Areas 47
TRACKING & MEASUREMENT
METRIC/INDICATOR BASELINE TARGET
High-Efficiency Lighting
Number of High Efficiency Co-
bra head Fixtures
4 69 by 2015 100% by 2020
Number of A & C Fixture Type
Retrofits
0 100% by 2020
New Public Space High-Effi-
ciency Lighting Installations
0 100% by 2020
CHALLENGES & POTENTIAL SOLUTIONS
Challenge: Georgia Power owns the street light fixtures attached to its wooden poles and leases the
lights to the City of Atlanta. Since the City does not currently experience a financial benefit for re-
ducing the energy consumption of these lights, these lights may not be good candidates for a retrofit
until the City negotiates a new rate structure with Georgia Power. The majority of these poles are on
smaller east-west streets.
Potential Solution: Encourage City officials to renegotiate their lease with Georgia Power so energy sav-
ings can be experienced.
Challenge: Because LED lighting is a relatively new technology, there are not sufficient standards to
ensure all LED fixture manufacturers produce quality products that live up to their claims. Identifying
an appropriate high quality product can be a challenge.
Potential Solution: A growing number of resources and experiences are available for researching appro-
priate, high quality products. Midtown Alliance should join DOE’s municipal solid-state lighting consor-
tium to review technical resources and research best practices.

GREENPRINT MIDTOWN
3. Impact Areas
Susta inabi l i ty P lan 201248
“City life is undergoing a renaissance. But as more people trade the green, leafy suburbs for the concrete and convenience of city life, the demand for urban green space is growing. For cities to achieve true quality of life, they need to provide residents with outdoor places to play, roam, and grow gardens”
- Trust for Public Land, ParkScore Website

3. Impact Areas 49
3.2 Open Space
OPEN SPACE OVERVIEW
People who live in urban settings consume
less energy and water and produce less air
pollution than their suburban counterparts.
Dense communities also consume less land
allowing more to be preserved. In short, the
largest positive impact that we can have on
our natural environment is encouraging more
options for living and working in dense urban
districts. Thus, if one of the ultimate goals
of Greenprint Midtown is to decrease the
ecological footprint of the district, Midtown
must be a place where people want to live and
work. In this context of sustainability, parks
and other forms of open space are critical
for attracting residents and businesses to
Midtown. Open space is often overlooked in
the development of dense urban districts but
it is a fundamental ingredient in nurturing a
livable, environmentally conscious community.
The Midtown community itself has voiced
a strong desire to add open space. In the
Greenprint Midtown Community Survey, when
asked to choose which strategies would have
the greatest impact on making Midtown more
sustainable, over 65 percent of respondents
selected “adding greenspace.”
For the purposes of this plan, the term “open
space” is used to more broadly describe
all land that is left intentionally devoid of
buildings. This large umbrella includes
parks, plazas and landscaped areas but also
the streets that, when viewed collectively,
make up the largest open space in any city.
While streets don’t fill the exact same role as
parks or plazas, they do provide some of the
OPEN SPACE GOALS
• Provide for additional open space
so that every resident of Midtown
has access to an open space
within a three minute walk and an
open space larger than an acre
within a ten minute walk.
• Design and program
interesting and appealing
open spaces that encourage
community vitality and
cohesion.
• Preserve and enhance Midtown’s
tree canopy and landscaped
areas.
same utility. In addition to their function for
transportation, streets provide a place to run or
stroll, sit and relax, play games and music and
create art. If closed to vehicular traffic, streets
can even serve as temporary plazas.
In addition to regional ecological benefits from
land preservation, open space also impacts
the ecosystem on a local scale. Vegetated
areas such as parks, landscaped areas and
trees that line streets provide an opportunity
for stormwater runoff to be redirected and
infiltrated into the soil rather than being directed
into underground stormwater infrastructure.
Trees in particular have a major impact on

GREENPRINT MIDTOWN
3. Impact Areas
Susta inabi l i ty P lan 201250
cleaning the air we breathe. According to a
recent study from the Lancaster Environment
Centre that analyzed the impact of trees
planted in “street canyons” (streets bordered
by buildings), trees reduce street level
concentrations of nitrogen dioxide by up to 40%
and particulate matter by up to 60%. 1 Trees
and other types of vegetation are also effective
at absorbing and dissipating the sun’s energy—
cooling the air temperature in the immediate
area and, collectively, across the entire city.
Parks and other landscaped areas also provide
habitat for a variety of plants, insects, birds, and
small mammals—putting urban inhabitants in
direct contact with nature.
Open space provides more than environmental
benefits and opportunities for recreation and
leisure. Parks enhance property values and, as a
result, local tax revenues. According to a study
aimed at analyzing the value of open space,
homes located immediately adjacent to a park
are worth an average of 24% more than national
averages (see Figure 2).
Figure 2: Park Proximity Sales Premium
Distance to Park (in feet) Distance to Park
(in miles, approx.)
Round-Trip Walk
(in minutes)
Sales Premium
100 1/50 1 24%
300 1/16 2.5 15%
600 1/8 5 5%
1300 1/4 10 Insignificant
Source: Miller, Andrew Ross, “Valuing Open Space: Land Economics and Neighborhood Parks.”
1 Environ Sci Technol. 2012 Jul 17;46(14):7692-9. Epub 2012 Jun 28.

3. Impact Areas 51
2 Jaffe, Eric. How Urban Parks Enhance Your Brain. The Atlantic Cities. 16 July 2012. Web. 20 July 2012. 3 City of Atlanta. Project Greenspace Draft Summary Report: City of Atlanta, 2009.
The concept of leveraging open space to create real estate value is not new and was the focus of
a recent article in July/August 2012 issue of Urban Land. Citing examples in New York, the article
focused on the direct payoff from parks. For example, real estate with views of Bryant Park has
outperformed other New York City submarkets in times of both recession and expansion. And this
bump in value is not limited to commercial space. Commenting on the city’s much lauded High Line,
Amanda Burden, New York’s planning director, remarked in a June 2011 New York Times article that
apartment prices in one building bordering the park have doubled since it opened. Similarly, the
parkside premium for apartments adjacent to Central Park is “more than double that for apartments
in surrounding neighborhoods,” according to a May 2012 article in the Wall Street Journal.
Admittedly, New York’s density creates a pent-up demand for open space that may not translate in
less crowded urban areas. Yet it is clear that parks not only add value to existing assets, but great
public spaces also create better development opportunities. This can have a meaningful impact
on retail development as well. Fundamentally, a high quality public realm can attract more people,
which translates into more shoppers and revenue. Specialty retail thrives on emotion, on the ability
of shops to convince a shopper to spend their precious time and money in their place of business.
According to Nick Egelanian, president of SiteWorks retail, an Annapolis-based retail consulting
form, Good public spaces evoke a strong emotional reaction. This is the key to retail and is why re-
tailers should consider the value of public spaces in differentiating their real estate and making it the
chosen destination over the countless other options vying for consumers’ time.
Parks and open space can also improve mental health by providing a retreat from a fast-paced, often
chaotic urban environment. According to a 2008 study published in Psychological Science “…simple and
brief interactions with nature can produce marked increases in cognitive control. To consider the
availability of nature as merely an amenity fails to recognize the vital importance of nature in effec-
tive cognitive functioning.” 2 Perhaps the most prominent impact of parks and open space is their
influence on community. Different from a coffee shop or a restaurant, open space is accessible to
all people regardless of social class. Parks are the quintessential “third places” where people go to
congregate and socialize with their neighbors.

GREENPRINT MIDTOWN
3. Impact Areas
Susta inabi l i ty P lan 201252
While there is need to add new parks and plazas, the potential to reactivate existing spaces should
not be overlooked. Underutilized spaces such as parking lots and private landscaped areas may
benefit from the insertion of new uses and programs aimed at enlivening these spaces. Vehicular
travel lanes might be closed and activated on a temporary basis with festivals and events to serve
the greater needs of the community. There are many potential tactics that may be employed in the
activation of existing spaces—each suited to the unique situation presented by the site.
Atlanta is unique from other cities by virtue of its expansive tree canopy which covers 27% of the
city. 3 This has earned Atlanta the nickname, “The City in a Forest.” The tree canopy is critical to the
quality of life in Midtown. In addition to the environmental benefits just described, trees form the
backbone of a successful open space network. Trees provide shade from the brutal summer sun
and provide a buffer from vehicular traffic, making sidewalks a place that people want to inhabit.
Through diligent maintenance of the existing tree stock and continued additions to the District’s tree
inventory, Atlanta’s image as “The City in a Forest” can be bolstered while the District’s inhabitants
reap the benefits.
Given the focus on increasing density in Midtown, the creation of non-occupiable landscaped areas
will be limited to those sites that cannot be developed for productive use. These include areas such
as highway access ramps and retaining walls. These spaces can be enhanced through landscaping to
provide aesthetic value while adding additional vegetation.

3. Impact Areas 53
OPEN SPACE ASSETS
Public Parks & Plazas - Midtown is located adja-
cent to Piedmont Park, the largest public park in
Atlanta. At 189 acres, Piedmont Park caters both
to the needs of Midtown residents and workers
as well as to visitors from across the city and
region. Other nearby significant public parks
include:
- Winn Park (10.3 acres) and Yonah Park
(1.9 acres) located northeast of Mid-
town’s urban core in the Ansley Park
neighborhood
- Renaissance Park (5.4 acres) and Central
Park (17.4 acres) to the southeast in the Old
Fourth Ward
Smaller public parks and plazas located within
the district include:
• Pershing Point Park
• Fifth Street Plaza Bridge
• World’s Athlete’s Monument
• Arts District Plaza
• Ponce Triangle Plaza
It should be noted that the Midtown Alliance,
with funding from the Midtown Improvement
District (MID), was responsible for major reno-
vations to the last three plaza spaces—deliver-
ing on a mission to improve access to open
space for Midtown residents, workers and visi-
tors.
Public Open Space - Arts District Plaza
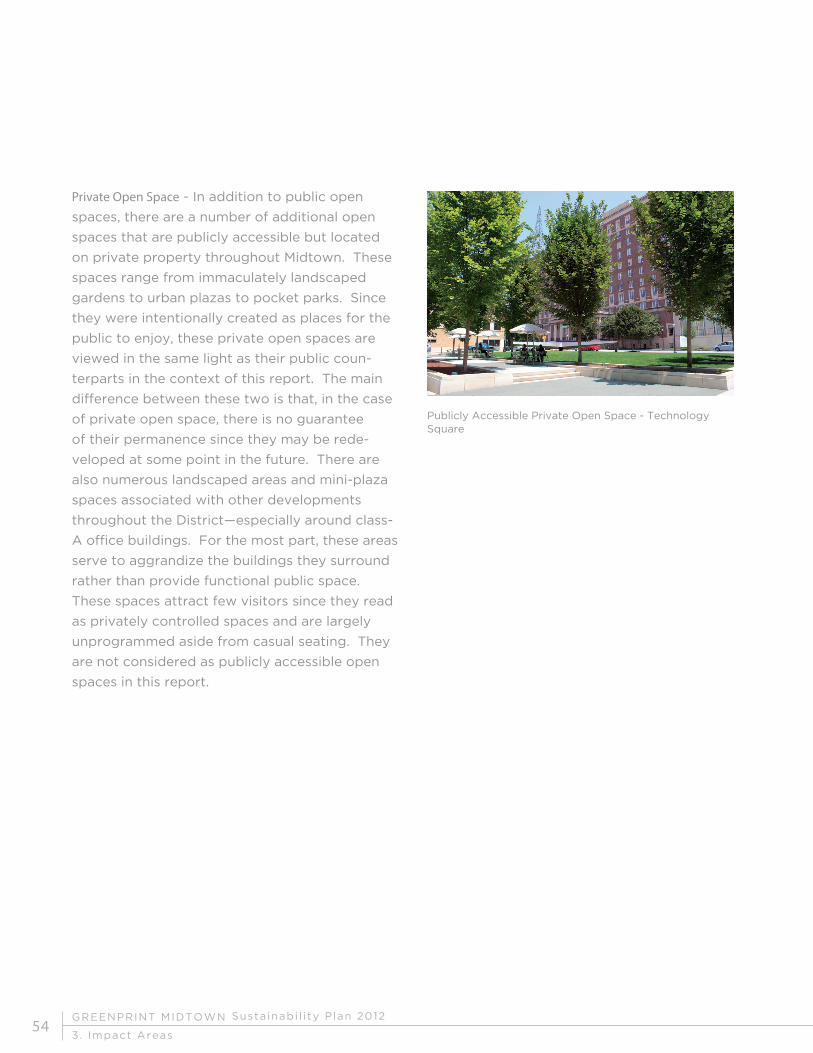
GREENPRINT MIDTOWN
3. Impact Areas
Susta inabi l i ty P lan 201254
Private Open Space - In addition to public open
spaces, there are a number of additional open
spaces that are publicly accessible but located
on private property throughout Midtown. These
spaces range from immaculately landscaped
gardens to urban plazas to pocket parks. Since
they were intentionally created as places for the
public to enjoy, these private open spaces are
viewed in the same light as their public coun-
terparts in the context of this report. The main
difference between these two is that, in the case
of private open space, there is no guarantee
of their permanence since they may be rede-
veloped at some point in the future. There are
also numerous landscaped areas and mini-plaza
spaces associated with other developments
throughout the District—especially around class-
A office buildings. For the most part, these areas
serve to aggrandize the buildings they surround
rather than provide functional public space.
These spaces attract few visitors since they read
as privately controlled spaces and are largely
unprogrammed aside from casual seating. They
are not considered as publicly accessible open
spaces in this report.
Publicly Accessible Private Open Space - Technology Square
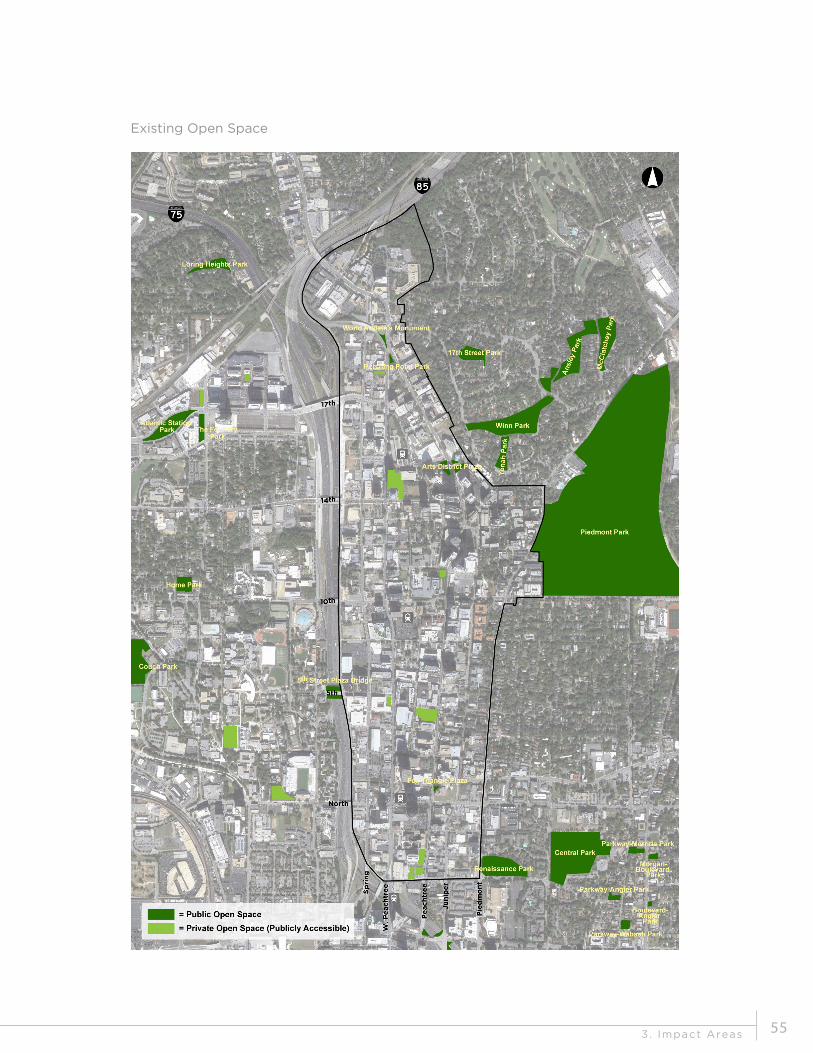
3. Impact Areas 55
Existing Open Space

GREENPRINT MIDTOWN
3. Impact Areas
Susta inabi l i ty P lan 201256
Tree Canopy - A high quality, first-class travel experience for pedestrians and cyclists is critical to
the success of open space in an urban setting. To that end, the current zoning code requires the
installation of a five-foot “street furniture and tree planting zone” between the vehicular lanes and
the sidewalk for all new development projects. This zone serves as a buffer from traffic and provides
room for pedestrian amenities such as benches, trash cans, bicycle racks and shade trees. Midtown
Alliance, with support from the MID, has been aggressively streetscaping major corridors in Midtown
since 2001—adding nearly 700 trees throughout the District. These have augmented the Midtown
Core’s robust tree canopy which includes 2,070 street trees, as identified in a recent survey. The first
street trees planted by Midtown Alliance are now reaching 15 years of age—a critical time to assess
the health of the trees and adopt measures that assure their continued longevity.

3. Impact Areas 57
CHALLENGES & OPPORTUNITIES
ACCESS TO A DIVERSITY OF OPEN SPACES
In his recent book entitled Sustainable Urbanism,
renowned architect and planner Douglas Farr,
states that all residents should have access to a
high-quality open space within a three minute
walk of their home. 4 For the purpose of the
Greenprint, this metric will be used a benchmark
for open space goals in Midtown. Thus, taking
into consideration all publicly accessible parks
and plazas within in the District, many Midtown
residents lack convenient access to open space
within a short walk from their homes.
However, walking access to open space of any
kind does not address a key issue—one could
live near multiple pocket parks or plazas and
never have access to a space large enough to
accommodate more intensive uses, such as
playgrounds, weekend markets, musical per-
formances or active recreation. Thus a second,
more stringent criteria for open space access is
needed.
According to the Trust for Public Land (TPL), ev-
ery resident should live within a ten minute walk
of a park or greenspace. 5 While TPL doesn’t ex-
plicitly detail the size or function of these spaces,
it is implied that they cater to the needs and in-
terests of residents within its general vicinity. In
order for an open space to meet the recreational
needs of a neighborhood, it should be at least
one acre in size. Applying this standard, we see
that walking access to substantial open space is
lacking for many Midtown residents. For ex-
ample, though there are a number of substantial
public open spaces located just outside the east-
ern boundary of the District (Central Park, Winn
Park, Piedmont Park), for many residents living in
the west side of the District, there are no sig-
nificant public open spaces within a convenient
walking distance.
While high land costs in Midtown preclude the
construction of a large scale park within the
urban core, it is reasonable to look for smaller
open space opportunities that would fit within
Midtown’s existing framework. The City of
Atlanta Parks 2009 Project Greenspace plan
calls for the development of “civic squares” in
Midtown. These are defined as “public gather-
ing spaces that function as a focus of community
activity and civic identity. As such, they should
be strategically located and designed to facili-
tate programmed festivals and events.” The plan
does not recommend a minimum size for civic
squares, but states that a typical city block is a
reasonable scale. In Midtown, a typical block is
approximately three acres, establishing a logical
maximum size to be pursued in the creation of
civic squares in the Midtown District. However,
three acres is a lofty goal given the difficulty of
acquiring large tracts of land in Midtown due to
high land costs.
Recently constructed national examples of suc-
cessful urban open spaces, such as Jamison
Square and Tanner Springs Park in Portland’s
Pearl District, demonstrate that civic squares
can be built on land that is even less than an
acre (0.94 and 0.92 acres respectively). The
size of these two spaces was dictated by Port-
4 Douglas Farr, Sustainable Urbanism: Urban Design With Nature (New Jersey:
John Wiley & Sons, Inc., 2008), 170.5 TPL. Cities Ask: What’s Our ParkScore? Trust For Public Land. 12 June 2012.
Web. 16 July 2012.

GREENPRINT MIDTOWN
3. Impact Areas
Susta inabi l i ty P lan 201258
Three Minute Walkshed Analysis: All Open Space

3. Impact Areas 59
Ten Minute Walkshed Analysis: Major Public Open Space

GREENPRINT MIDTOWN
3. Impact Areas
Susta inabi l i ty P lan 201260
land’s block size and they were designed to
work in tandem to provide a diversity of ameni-
ties for Pearl District residents. While Jamison
Square provides space for children to play and
hosts concerts and evening movie screenings,
Tanner Springs Park offers a natural setting for
quiet contemplation and respite from the urban
environment. 6 Midtown Alliance will pursue a
similar approach to providing open space given
the constraints imposed by Midtown’s estab-
lished urban context. In order to make Midtown
Aerial image of Tanner Springs Park (Top) and Jamison Square (bottom), Portland, Oregon
truly livable, residents must have access to open
spaces offering a variety of different functions all
located within convenient reach.
6 Easton, Valerie. Nature, Artfully Embraced. The Seattle Times. 5 November
2006. Web. 8 August 2012.
3. Impact Areas 61
REGULATORY FRAMEWORK
The City of Atlanta zoning code requires open
space to be provided onsite along with every
new development (defined as “Usable Open
Space Requirements”). Yet, despite Midtown’s
sustained residential growth, the development of
publicly accessible open space has been neglect-
ed. This has happened for several reasons.
First, the open space requirements were never
adjusted along with the creation of the SPI-16
and 17 zoning districts. Approved in 2001, the
SPI zoning ordinance allows for higher density in
return for a mix of uses and additional attention
to design. With this rise in permitted density,
the amount of open space required onsite rose
to unrealistic levels. As a result of the burden of
these requirements, it has become common for
the Midtown Development Review Committee
(DRC), which reviews development in the Dis-
trict, to recommend approved reductions in us-
able open space requirements to accommodate
the type of high quality, high density develop-
ment that is desired in the District.
Second, the open space requirements are based
on arbitrary calculations and do not include stan-
dards to ensure that the designated area func-
tions as meaningful open space that is publicly
accessible. For example, rooftop terraces and
internal courtyards count towards the usable
open space requirement even though they are
only usable by residents of the building. On
street parking and street trees also count to-
wards meeting these requirements. In the end,
developers are able to satisfy these requirements
without ever having to produce an open space
that is sizable and publicly accessible.
Finally, while it is technically permissible to
transfer a portion of the required open space
off-site to create a single consolidated park serv-
ing multiple developments rather than numer-
ous marginal open spaces spread across several
parcels, no mechanism is in place to facilitate this
transfer. In order for this mechanism to func-
tion as intended, appropriate sites for such parks
must be identified in a small area plan for Mid-
town and that plan must be adopted into the
City of Atlanta’s Comprehensive Development
Plan. A corollary issue relates to the need for a
method of determining the monetary value of
open space requirements so that a “cash-in-lieu-
of open space” provision could be implemented.
This would be useful in cases where the open
space requirement cannot be met on-site and
it makes more sense to secure funding to help
establish a park in an off-site location. Finally, a
dedicated open space fund would need to be es-
tablished to receive and hold funds if they were
set aside for a future transfer.
The goal of creating a high-density urban district
does not have to conflict with the parallel goal
of creating publicly accessible open space. It
would be short-sighted to require developers
to construct a park or plaza on every develop-
ment site since that would result in underutilized
spaces and too many gaps in the urban fab-
ric. Instead, aggregating open space into a few
strategic locations is more affordable, sustain-
able and impactful to the overall quality of life in
Midtown. In the end, UOSR requirements pro-
vide the best regulatory method for delivering
substantial open spaces, and thus revising these

GREENPRINT MIDTOWN
3. Impact Areas
Susta inabi l i ty P lan 201262
regulations to address the goal of allowing the
transfer of open space requirements should be a
priority for Midtown Alliance.
Given Midtown Alliance’s previous work with the
City of Atlanta in planning and zoning, the orga-
nization is well positioned to facilitate updates
to the zoning code to address the challenges
outlined above.
LAND COSTS
Relative to other urban areas in Atlanta, such
as Downtown and Buckhead, the price of land
in Midtown is relatively high, ranging from $80-
$100 per square foot. With the cost of an acre
somewhere between $3.5 and $4.5 million, the
outright purchase of land within Midtown’s urban
core for new parks is financially challenging. Ac-
quiring and developing a new civic square would
require a multi-million dollar investment that
would necessitate some level of public-private
partnership. The City of Atlanta’s current finan-
cial state makes it unlikely that they would be in
a position to assist in the purchase or develop-
ment land for parks in Midtown. While the Mid-
town Improvement District could be a source of
funding, this source could not be relied upon to
fund an entire project. If acquisition and devel-
opment cannot be funded mostly through devel-
opment requirements, additional funding sources
will need to be identified.

3. Impact Areas 63
Susceptibility to Change
GREENPRINT MIDTOWN
3. Impact Areas
Susta inabi l i ty P lan 201264
PERMANENT CIVIC SQUARES
Properties that are highly susceptible to change pose as potential locations for new perma-
nent civic squares. A concentration of vacant or underutilized land in Midtown is evident on
the west side of the District near the Interstate. With numerous large scale surface parking
lots, undeveloped parcels and underutilized buildings, when market demand for develop-
ment returns, this swath of Midtown will likely become host to a large number of new resi-
dents. When existing residential development is layered over the Ten Minute Walkshed
Analysis and Midtown Susceptibility to Change Map, a number of sites that might be utilized
to serve the needs of both new and existing residents can be identified.
OPPORTUNITIES IN HIGH DEMAND AREAS
Even with the fast pace of development in recent years, Midtown still has significant vacant and
underutilized land that could be transformed into a public amenity through conversion into various
types of open space. Parcels that are either vacant, used for surface parking, contain dilapidated
buildings or are not utilized to their highest and best use are generally deemed “highly susceptible
to change” and represent real opportunities for future parks, plazas or civic spaces. In the Midtown
District, approximately 19% of the land fits this description.

3. Impact Areas 65
TEMPORARY PARKS & PLAZAS
Many properties once slated for immediate rede-
velopment are now in a holding pattern due to
the slow pace of economic recovery. This under-
scores the need for creative ways to implement
“in the meantime” activities that productively uti-
lize spaces that would otherwise remain vacant
until the next development cycle. Transforming
vacant parcels into temporary pocket parks cre-
ates an interim public benefit on sites that are
often blighted by weeds, chain-link construction
fencing, trash and graffiti. A temporary pocket
park can have the added advantage of increas-
ing the property values of adjacent sites as well
as elevating the public perception of the area as
one that is vibrant and maintained.
Temporary parks allow for flexibility and experi-
mentation with various types of active uses that
may be too risky for long-term investment, such
as lawn games, community gardens and tem-
porary art installations. Yet they are also viable
venues for more typical park amenities such as
playground/fitness equipment, outdoor seating
and dog parks. Special attention must be paid
in the design of these temporary spaces to avoid
the perception that they are private spaces and
not open to the public.
Temporary parks can serve an important role in
enhancing livability by providing access to open
space for current residents. The Temporary
Open Space Opportunities map shows an over-
lay of existing residential density over the Three
Minute Walkshed and Midtown Susceptibility to
Change Map. This reveals the areas of greatest
opportunity to fill gaps and provide existing Dis-
trict residents with access to open space within a
three minute walk of their homes.
Temporary park spaces can also help fill the gaps
along some of Midtown’s major corridors and
have immediate positive impacts on surrounding
properties. In this instance, adjacency to existing
residential development is not critical. Rather it
may be enough of a benefit to create an active
use where there was none before, connecting
the dots along Peachtree Street for example.
Such places can provide lunchtime gathering
spots for local office workers and provide an
attractive setting for casual interaction or pro-
grammed events such as outdoor musicians,
fitness classes, or cultural programs sponsored
by local arts organizations.
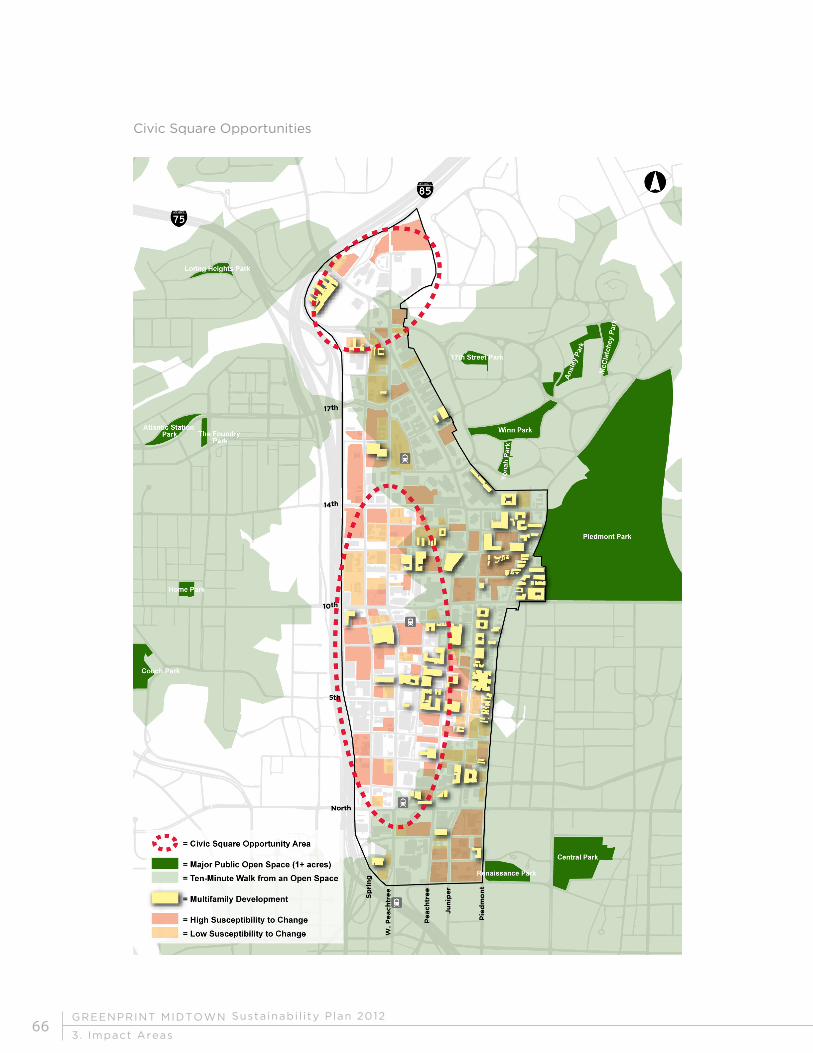
GREENPRINT MIDTOWN
3. Impact Areas
Susta inabi l i ty P lan 201266
Civic Square Opportunities
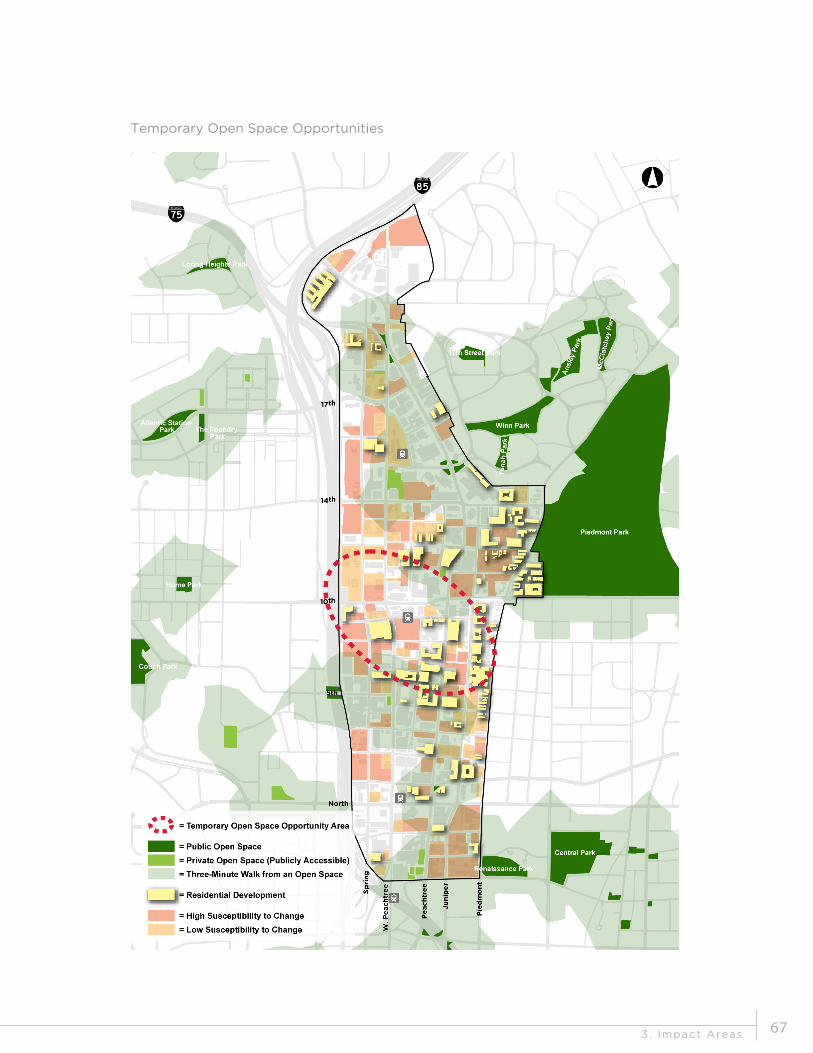
3. Impact Areas 67
Temporary Open Space Opportunities

GREENPRINT MIDTOWN
3. Impact Areas
Susta inabi l i ty P lan 201268
ENERGY STRATEGIES & PROGRAMS
Through the Greenprint Midtown planning process, the following Open Space strategies were
developed and guided the selection of both Tier 1 (priority) and Tier 2 programs/projects. In the
future, additional programs and projects can be developed from the following strategies.
STRATEGIES
OS1: Acquire, develop, and maintain land for new permanent open space.
OS2: Develop appropriate physical and programmatic interventions that serve to activate existing
open spaces.
OS3: Review and update zoning codes and other regulatory ordinances to encourage the creation
of publicly accessible open space.
OS4: Incorporate ecologically sustainable design practices into open space development.
OS5: Identify opportunities to increase Midtown’s tree canopy, particularly in public spaces, and
develop a comprehensive maintenance program for existing trees.
TIER 1 PROGRAMS/PROJECTS
The following Tier 1 programs and projects were identified as priorities and are described in more
detail in the next section.
OP1: Acquisition and Development of Civic Squares
OP2: Temporary Park and Plaza Development
OP3: Open Space Activation
OP4: Landscape Enhancement
TIER 2 PROGRAMS/PROJECTS
OP5: Community Gardens – Community gardens provide a place for local residents to gather to
grow foods that are produced in an ecologically sound manner. These gardens offer another
option for programming a pocket park space or a portion of neighborhood larger park.
Other park amenities such as seating areas can be integrated with these spaces to take
advantage of the unique aesthetic beauty of these garden spaces.
OP6: Urban Tree Nursery – These spaces can be designed to incubate trees in above ground
planter boxes so that can then be planted throughout the District at a later date. The trees
can provide shade and when combined with other amenities such as benches or public art,
can be used to create temporary park space.

3. Impact Areas 69
TIER 1 OPEN SPACE PROGRAMS
OP1 – ACQUISITION AND DEVELOPMENT OF CIVIC SQUARES
Description
Midtown Alliance will explore opportunities to
acquire and develop land to create permanent
parks, hereafter referred to as civic squares,
in strategic locations throughout the Midtown
District. This process will begin with an analysis
of the existing inventory of publicly accessible
parks and plazas in the District. Using the Ten
Minute Walkshed Analysis, gaps in open space
will be identified and evaluated in light of the
Susceptibility to Change Map. Based on this and
other research, a specific strategy for acquir-
ing various sites will be developed using a set of
mechanisms outlined below in the “Acquisition
Toolkit.” A palate of materials will be recom-
mended for use in the development of these per-
manent public spaces based on best practices in
sustainable design.
The design of civic squares in Midtown will be
consistent with the definition stated in the City
of Atlanta’s Project Greenspace: “The design
of squares should incorporate open lawn areas
and/or open paved areas to accommodate these
events. The functions of squares vary accord-
ing to the context. For example, in commercial
and mixed-use settings (where land availability
is restricted), squares can support larger events
while providing much-needed greenspace for
surrounding residents and employees. In resi-
dential neighborhoods squares provide informal
greenspace for surrounding residents while ac-
commodating smaller scale, more neighborhood-
oriented activities and events. Squares should
be programmed to include amenities that at-
tract multiple age and demographic groups and
create activity throughout the day and seasons.
They could also be located at street level above
underground parking decks.”
Land acquisition methods for civic squares will
vary depending on the specific circumstances
of current ownership. In some cases it may be
appropriate for Midtown Alliance to be the entity
that holds title to the land, while in others a land
trust may be a more appropriate short-term
vehicle. In either case, the goal for any civic
square will be to transfer ownership to the City
of Atlanta so the space is permanently preserved
in the public domain. Ultimately, all permanent
acquisitions are destined to become bonafide
City of Atlanta public parks. However, given the
limits of the City budget, the Midtown Alliance
would likely maintain the parks in perpetuity.

GREENPRINT MIDTOWN
3. Impact Areas
Susta inabi l i ty P lan 201270
The Midtown Alliance will continue to develop an open space acquisition and development plan with
the goal of delivering new permanent civic squares. Midtown Alliance will dedicate staff resources to
facilitate the following program implementation activities:
• Utilize the Ten Minute Walkshed Analysis to form the basis for the identification of areas in
need of permanent civic squares.
• Develop toolkits of mechanisms for civic square acquisition and development.
• Acquire property, design, and develop permanent civic squares.
• Develop a “Midtown Public Space Plan” for adoption into the City of Atlanta Comprehensive
Development Plan.
• Conduct surveys of potential park users to identify appropriate use and programming.
• Utilize sustainable materials and elements in the development of park spaces.
• Update development design guidelines to incorporate best practices in ecologically sustain-
able park design.
ACQUISITION TOOLKIT:
- Ten Minute Walkshed Analysis – Used to iden-
tify areas lacking access to a permanent civic
square.
- Susceptibility to Change Map – This map iden-
tifies parcels that are likely to be developed
in the short-term. It will be used to identify
parcels of land that may be acquired for the
purpose of creating civic squares. It will also be
useful for identifying areas of future redevelop-
ment that may require park access.
- Public Space Plan/Transferable Open Space
Requirements – As stated earlier, Midtown’s
SPI zoning code allows for a property owner to
relocate up to 60% of a development’s required
Usable Open Space Requirement to an offsite
parcel within the District provided the parcel is
identified in the “Midtown Public Space Plan.”
This plan must be formally adopted into the
City of Atlanta Comprehensive Development
Plan. Today no such plan exists, thus Midtown
Alliance would need to spearhead the effort to
create a plan and shepherd it through the City
Council review and approval process. The Ten
Minute Walkshed Analysis and the Susceptibil-
ity to Change Map would be used as the core
criteria in the development of this plan.
- Open Space Conservation Easements – A con-
servation easement is a legally binding agree-
ment between a property owner and a second
party (the easement holder) that restricts the
type and amount of development and use that
may take place on a property. Conservation
easements, which are voluntary in nature, can
complement government acquisition programs,
land use regulations, and structural controls to
protect significant natural resources including
open space.
By entering into a conservation easement, a
landowner ensures that his land will be pro-
tected for future generations while remaining in
private hands. There may be financial benefits
as well. If the landowner gives the easement in

3. Impact Areas 71
perpetuity for conservation purposes recognized by the IRS (i.e. outdoor recreation, preservation
of open space, etc.), he/she may be able to deduct the value of the easement from his/her personal
federal and state income taxes. High estate taxes may be similarly decreased through the use of
conservation easements satisfying the Internal Revenue Code. If a property owner restricts the use
of his property through a conservation easement prior to his/her death, the estate tax is assessed
on the restricted value of the property. When the landowner bequeaths a conservation easement
to a land trust in his/her will, the value of the easement is deducted from the estate.
Property taxes may be decreased as well since restricting various development rights may dimin-
ish the fair market value of the land. The public benefits from resource protection afforded by
the easements should substantially outweigh the costs in terms of decreased revenue to the local
government. Easements protecting open space and scenic views may result in increased property
values on adjacent land.
- Open Space Tax Credits – Georgia provides a state tax credit to individuals and corporations donat-
ing land or easements for conservation. The tax credit allows taxpayers to claim a credit against
their state income tax liability of 25% of the fair market value of the donated property interest, up
to a maximum credit of $250,000 for individuals and $500,000 for corporations. The allowed tax
credit may not exceed the amount of tax owed for the taxable year, but any unused portion of the
tax credit may be carried forward for the next five years.
- Park Impact Fees – The City of Atlanta charges a parks and recreation impact fee on all new resi-
dential and commercial development based on the square footage or number of bedrooms per unit.
Impact fees are calculated by the Office of Buildings as part of the review and approval process
for a building permit. They typically range from a low of $500 per unit to a high of $9,000 per unit
and should be periodically updated to address market rates and land values. The fees are used by
the City for land acquisition and development (grading, landscaping, utilities, and parking) of parks
and recreation facilities. The city is divided into three service areas —Northside, Southside and
Westside—and parks and recreation impact fees collected in a service area must be spent in the
same service area. Midtown is located in the Northside service area. As a point of comparison, the
park fee collections by service area for the period between 2007-2009 are summarized below:
Service Area Revenue Percent
Northside $1,865,580 66%
Southside $422,622 15%
Westside $525,528 19%
Total $2,813,730 100%
Source: Park impact fees collected from July 1, 2007 through September 30, 2009 from City of Atlanta, December 29, 2009
GREENPRINT MIDTOWN
3. Impact Areas
Susta inabi l i ty P lan 201272
Once a site has been acquired for a neighborhood-scaled park, the following strategies should be
implemented during the development phase.
• Secure Park Development and Maintenance Funding – Midtown Alliance should seek govern-
ment or philanthropic grants to assist in park development. Funds from the MID could be
used as match to leverage these funds.
• Conduct a Needs Assessment – In order to identify the appropriate design and program-
ming of a site, Midtown Alliance should seek input from the community through surveys and
other methods.
• Utilize Integrated Site Design Process – To inject innovative and sustainable solutions into
the development of the site, Midtown Alliance will use a process that encourages input from
experts representing multiple disciplines.
IMPACT
Environmental Impact: There are both direct and indirect impacts from the addition of civic square
spaces in the Midtown District. If vacant land, surface parking lots and underutilized buildings are
transformed into vegetated park areas, there are direct environmental impacts such as reduced
stormwater runoff. As mentioned previously, vegetation also reduces airborne particulates and pol-
lutants, air temperature and provide additional habitat for wildlife. Indirectly, adding open space can
enhance overall livability, which attracts people to live in an urban environment which is inherently
more sustainable.
Community Impact: Civic squares can greatly enhance community cohesion and livability. Parks
provide the opportunity for people from all walks of life to come together to share a common space
and a common experience. Parks are the quintessential “third place” where neighbors meet to form
the social bonds that are the foundation for community. Parks also form a major part of the identity
and character of a neighborhood.
Economic Impact: The economic impact of parks is evident by the associated increases in property
values. In the case of the Midtown Improvement District, increases in property values from com-
mercial properties leads to an increase in the capital raised through increment taxation, which is then
invested back into the District.
There are also less directly tangible economic impacts. Increased quality of life leads to more people
living in the District and more businesses and institutions choosing to locate there—both of which yield
economic gains in terms of job creation and additional investment from the development community.

3. Impact Areas 73
POTENTIAL IMPLEMENTATION PARTNERS/RESOURCES
• City of Atlanta Office of Park Design, in the Department of Parks, Recreation and Cultural
Affairs – Potential partner with Midtown Alliance to assist with funding, planning, design and
development of civic square projects.
• Trust for Public Land - Potentially assist with negotiations for land acquisition as a third
party. They also can hold land as a certified land trust.
• Park Pride – In addition to coordinating Friends of the Park groups and organizing volunteer
efforts, Park Pride offers grants for park development.
• Piedmont Park Conservancy – Provide insight and expertise in park development, funding
and maintenance.
COSTS & POTENTIAL FUNDING SOURCES
A limited amount of staff time will be needed to develop the Midtown Public Space Master Plan and
shepherd it through the City’s approval process. Additional effort will be needed to research poten-
tial acquisition sites, to acquire the sites and manage project design and construction. These tasks
can be completed within existing staff resources. The costs related to purchasing and developing
land are considerable and not included here since they can vary tremendously depending on the site.
Potential funding sources for land acquisition and development include the Midtown Improvement
District, Trust for Public Land, City of Atlanta Opportunity Bond, and Park Impact Fees.

GREENPRINT MIDTOWN
3. Impact Areas
Susta inabi l i ty P lan 201274
CHALLENGES & POTENTIAL SOLUTIONS
Challenge: Availability of sufficient funding to acquire and develop open space
Potential Solution: The MID is highly supportive of the open space acquisition and development pro-
gram and thus is expected to contribute to this program. Additional funding sources have been identi-
fied as described above but need to be further vetted.
Challenge: Difficulty to amend existing zoning regulations related to open space provision.
Potential Solution: Midtown Alliance has collaborated with the City of Atlanta Office of Planning in the
past on the major task of developing a new zoning ordinance for the District. Creative solutions will
need to be devised in response to challenges encountered during this process.
Challenge: Cost and resources required to maintain parks and plazas.
Potential Solution: Midtown Alliance will in all likelihood assume the burden of maintenance for all new
parks and plazas. The City of Atlanta’s Parks and Recreation budget is stretched thin. Another option,
especially suitable for a larger civic square space, would be for the Midtown Alliance to coordinate the
creation of a non-profit organization that could raise funds for park management. Midtown Alliance has
experience in this domain as they assisted in the establishment of the Piedmont Park Conservancy.
TRACKING & MEASUREMENT
METRIC/INDICATOR BASELINE TARGET
Midtown Public Spaces Master Plan N/A Plan adopted by 2013
Acquisition of land N/A Land acquired by 2017
Development of land N/A Land developed by 2018

3. Impact Areas 75
OP2 – TEMPORARY PARK AND PLAZA DEVELOPMENT
Description
The goal of this program is to foster the creation
of temporary, publicly-accessible open spaces.
These spaces are typically being held for future
redevelopment, but in the interim, they can be
utilized to create parks and plazas to benefit the
Midtown community. Temporary spaces will
generally take the form of pocket park and pla-
zas but there may also be opportunities to create
larger neighborhood-serving parks.
Using the Three Minute Walkshed Analysis,
Midtown Susceptibility to Change map, and the
existing residential density, Midtown Alliance will
identify potential locations for temporary parks
and plazas. Midtown Alliance will then work to
develop a set of incentives and structures that
can be utilized to encourage property owners to
collaborate in this effort.
The goals for the temporary open space pro-
gram are threefold:
First, it will be used to enhance access to open
space for existing Midtown residents. To this
end, Midtown Alliance staff will utilize a combi-
nation of the existing residential density, Mid-
town Susceptibility to Change map, and the
Three Minute Walkshed Analysis to strategically
identify that are vacant or underutilized and are
located within a three-minute walk of under-
served residents.
The second goal is aimed at filling gaps along
major urban corridors. This process will take on
a more pragmatic approach. Midtown Alliance
Staff will identify vacant and underutilized lots
along major corridors that detract from the exist-
ing urban framework. Staff will then develop
a tailor-made program for transforming each
space into an asset.
Thirdly, in order to create new open spaces
to serve the needs of future residents, when a
project is reviewed by the Midtown Development
Review Committee, the Three Minute Walkshed
Analysis will be used to determine whether the
Usable Open Space Requirements should be
utilized to create a publicly accessible park or
plaza on the development site. In the event that
an existing open space is already located on
or near the development site, the Usable Open
Space Requirements would be transferred to a
receiving site designated as a future civic square
as detailed in OP1.
Given the feasibility of delivering pocket parks
and plazas utilizing a temporary development
strategy, it is not anticipated that the Midtown
Alliance will pursue the acquisition and develop-
ment of permanent pocket parks and plazas.

GREENPRINT MIDTOWN
3. Impact Areas
Susta inabi l i ty P lan 201276
Midtown Alliance will dedicate staff resources to facilitate the following program implementation activities:
• Utilize the Three Minute Walkshed Analysis to form the basis for the identification of areas in
need of temporary publicly-accessible open spaces.
• Build temporary, publicly-accessible open spaces.
• Use the recommendations of the Midtown Development Review Committee to ensure that
publicly-accessible open spaces are included along with all new developments located far-
ther than a three minute walk from an open space.
• Identify appropriate tools to entice property owners to allow temporary use of their land as
temporary publicly-accessible open spaces.
• Identify appropriate tools for funding the creation of temporary publicly-accessible open
spaces.
• Measure and evaluate program for success.
INCENTIVES AND STRUCTURES:
- Short-Term Land Leases – A lease allows an entity to make improvements and grant public access
to the site for a specified period or until such time as redevelopment becomes financially feasible.
The lease states that Midtown Alliance will pay a nominal annual fee for the right to enhance the
property as a publically accessible open space. Midtown Alliance assumes all responsibility for
maintaining the space and monitoring it for public safety. This is accomplished through Midtown
Alliance’s maintenance team, Midtown Green, and public safety force, Midtown Blue. The lease can
be terminated by the property owner after one year. The Midtown Alliance has utilized this struc-
ture to develop its first temporary open space, Jamestown Community Park, at the intersection of
West Peachtree and 18th Streets.
- Property Tax Reduction – With approval from the City, a property owner can reduce their tax
burden by demolishing existing structures on their land to make way for temporary park or plaza
spaces.
- Public Safety Memorandum of Understanding – Property owners can enter into an MOU with Mid-
town Alliance that gives permission for Midtown Blue to remove trespassers and vagrants from pri-
vate property. This tool takes the burden for policing the spaces off of the private property owner.
- Contributions From Benefitting Parties – There is great potential for adjacent property owners to
contribute to the development of temporary open spaces since they realize a tangible benefit from
this amenity. In the case of Jamestown Community Park, a law school directly adjacent to the site
funded many of the improvements including landscaping and park furniture. This enabled the Mid-
town Alliance to produce a new publicly-accessible pocket park with limited investment.

3. Impact Areas 77
IMPACT
Environmental Impact: Park and plaza spaces
provide a location to plant vegetation which
removes airborne particulates and pollut-
ants, provide opportunities for stormwater
treatment, reduces air temperatures and
attract wildlife. Open space enhances liv-
ability and thus attracts people to live in an
urban environment.
Community Impact: Park and plaza spaces
provide additional opportunities for members
of the community to interact. Whether it is a
small seating area, bocce ball court or grassy
field, these spaces create an environment ripe
for development of inter-personal relationships.
Economic Impact: Park and plaza spaces,
even small ones, increase the value of nearby
properties. It is also in the interests of de-
velopers to provide open space on or near
their project sites to entice prospective buy-
ers or tenants.
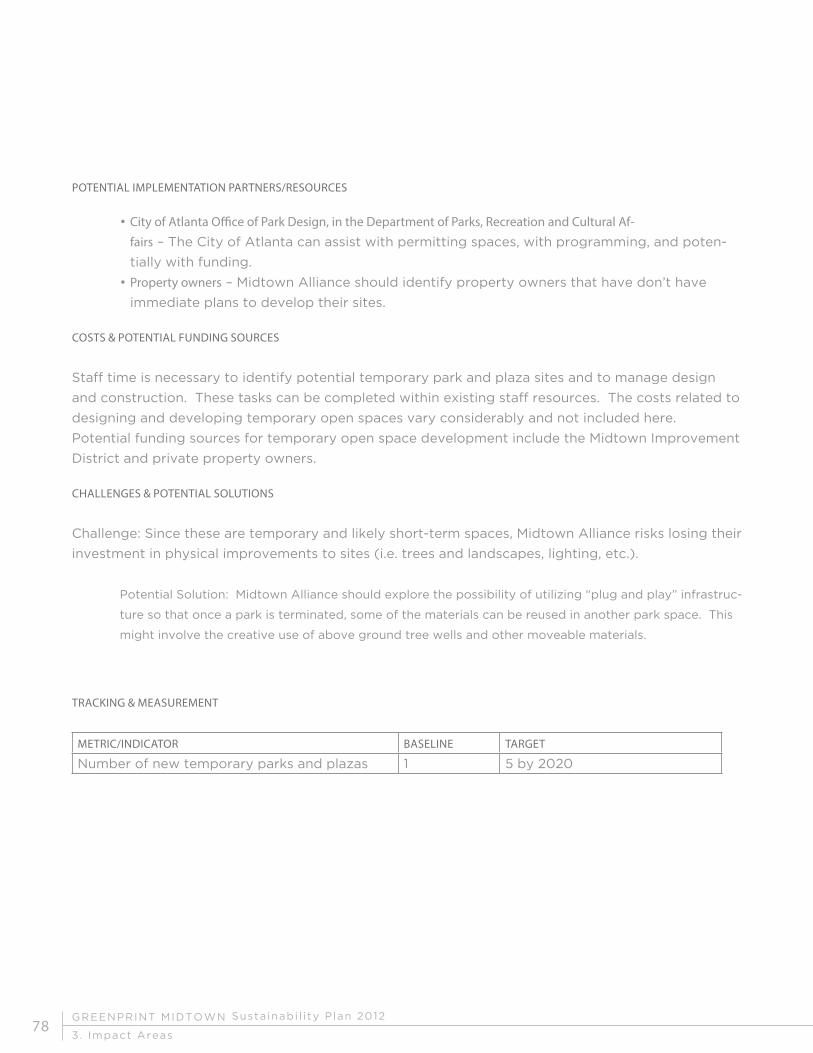
GREENPRINT MIDTOWN
3. Impact Areas
Susta inabi l i ty P lan 201278
TRACKING & MEASUREMENT
METRIC/INDICATOR BASELINE TARGET
Number of new temporary parks and plazas 1 5 by 2020
POTENTIAL IMPLEMENTATION PARTNERS/RESOURCES
• City of Atlanta Office of Park Design, in the Department of Parks, Recreation and Cultural Af-
fairs – The City of Atlanta can assist with permitting spaces, with programming, and poten-
tially with funding.
• Property owners – Midtown Alliance should identify property owners that have don’t have
immediate plans to develop their sites.
COSTS & POTENTIAL FUNDING SOURCES
Staff time is necessary to identify potential temporary park and plaza sites and to manage design
and construction. These tasks can be completed within existing staff resources. The costs related to
designing and developing temporary open spaces vary considerably and not included here.
Potential funding sources for temporary open space development include the Midtown Improvement
District and private property owners.
CHALLENGES & POTENTIAL SOLUTIONS
Challenge: Since these are temporary and likely short-term spaces, Midtown Alliance risks losing their
investment in physical improvements to sites (i.e. trees and landscapes, lighting, etc.).
Potential Solution: Midtown Alliance should explore the possibility of utilizing “plug and play” infrastruc-
ture so that once a park is terminated, some of the materials can be reused in another park space. This
might involve the creative use of above ground tree wells and other moveable materials.

3. Impact Areas 79
OP3 – OPEN SPACE ACTIVATION
Description
Activating vacant or underutilized spaces can have many positive benefits including increased com-
munity vitality, improved public safety, and enhanced visual appeal. Activation may take the form
of physical improvements or programmatic insertions—seeking to meet the needs of the community.
One example of a physical intervention is “gamification” which involves the insertion of games such
as bocce ball, shuffleboard, ping pong or even miniature golf into an existing park or plaza space.
Another is adding benches or shade structures in a landscaped area or even a parking lot. An exam-
ple of temporary activation is street closures or “open streets” initiatives. Closing a street for a lim-
ited time to host games, musical performances or neighborhood festivals transforms it into an open
space for the enjoyment of all people. Programmatic examples might include creating partnerships
with local organizations involved with the arts or the creation of temporary food truck parks. These
physical enhancements and programs can change throughout the day, week and season—activating
otherwise underutilized park and plaza spaces throughout the year.
A key goal of the tactical interventions should be to enhance the connections between these under-
utilized spaces and the public realm so they are inviting to members of the Midtown community.
Midtown Alliance will dedicate staff resources to facilitate the following program implementation
activities:
1. Identify existing underutilized open spaces and parks in need of activation. These would
include existing public open spaces, publicly accessible private open spaces, private land-
scaped areas, vacant lots, and surface parking lots.
2. Factoring in site conditions and community needs, develop and implement physical and
programmatic strategies that are low-cost but high impact.
3. Measure and evaluate program for success.

GREENPRINT MIDTOWN
3. Impact Areas
Susta inabi l i ty P lan 201280
TRACKING & MEASUREMENT
METRIC/INDICATOR BASELINE TARGET
Number of open spaces activated 1 3 by 2015
IMPACT
Environmental Impact: Successful, active open spaces encourage more people to choose to live in a
more sustainable, urban setting.
Community Impact: Vacant lots and empty parks can become havens for vagrant activity and, at the
very least, act as a visual detraction from the community. On the contrary, vibrant active parks and
plazas provide a place for the community to congregate.
Economic Impact: A park or open space that is popular can bolster property values whereas vacant
and underutilized spaces can do the exact opposite. When neutral or negative spaces are replaced
with positive ones, the District becomes more attractive to potential residents, developers, and busi-
nesses that might locate in Midtown.
POTENTIAL IMPLEMENTATION PARTNERS/RESOURCES
• Local performing arts organizations such as the Atlanta Symphony Orchestra, the Atlanta
Ballet and the Center for Puppetry Arts – these organizations could provide programming to
activate new and existing open spaces.
• High Museum, the Savannah College of Art and Design Atlanta, the Museum of Design Atlan-
ta and other local arts organizations – these organizations could create physical art installa-
tions such as sculptures or murals to help activate spaces.
• The Atlanta Street Food Coalition – representing local food trucks, this organization could
be used to activate spaces.
COSTS & POTENTIAL FUNDING SOURCES
Staff time is necessary to identify appropriate activation strategies and partnerships, and implement
programs. These tasks can be completed within existing staff resources.
CHALLENGES & POTENTIAL SOLUTIONS
Challenge: Since there are many opportunities for activating spaces, Midtown Alliance runs the risk of
not being able to maintain and program multiple spaces effectively at one time.
Potential Solution: Aim for quality of activated spaces over quantity.

3. Impact Areas 81
OP4 – LANDSCAPE ENHANCEMENT PROGRAM
Description
Enhancing Midtown’s street tree canopy and landscaped areas is critical to the comfort, beauty, ecol-
ogy, and overall livability of the area. This program focuses on trees and landscaping in the public
right-of-way, the area in which Midtown Alliance can be most impactful
Street Tree Canopy Maintenance and Expansion
Over the last ten years, Midtown made great progress in establishing itself as urban and green – bal-
ancing high intensity development with natural features. This is primarily due to the District’s im-
pressive street tree canopy. To compliment Midtown Alliance’s streetscaping efforts, a maintenance
and expansion strategy for Midtown’s tree canopy will be devised. This topic deserves special atten-
tion given the widespread impact that trees have on the quality of life in Midtown. Street trees buf-
fer pedestrians from vehicles while providing welcome shade and a pleasant environment in which to
walk. They also are a signature feature of the Midtown district and distinguish Midtown from other
urban neighborhoods in the city.
In order to maintain the existing tree canopy in the District and identify opportunities and actions to
expand, Midtown Alliance will implement the following activities:
1. Continue to expand Midtown’s street tree canopy through the implementation of Midtown
Alliance’s streetscape program.
2. Conduct an audit of all street trees to assess gaps in the tree canopy, species, health, and
the age of Midtown’s street trees.
3. Amend the streetscape maintenance manual to include best practices associated with
urban forestry, including: tree species selection, planting, trimming, mulching, and tree well
design. A review of associated streetscape design practices will also be analyzed to iden-
tify additional opportunities to bolster the health of street trees.
Landscape Area Development
In addition to the goal of creating additional accessible open spaces in the Midtown Core, Midtown
Alliance will also explore potential locations for the creation of new landscaped areas. Significant
opportunities for creating such spaces were identified in The Atlanta Connector Plan, completed in
2011. This initiative was undertaken as a collaborative planning effort between the City of Atlanta,
Georgia Department of Transportation, Midtown Alliance, and Central Atlanta Progress/Atlanta
Downtown Improvement District. The result of the study is a plan that envisions the transformation
of the I-75/85 corridor (aka, the Connector) by improving the experience of the more than 300,000
vehicles that travel the Connector daily. In simplest terms, the project seeks to enhance Atlanta’s
front door in a way that both improves its appearance and creates a positive impact for nearby busi-
nesses, institutions and destinations.

GREENPRINT MIDTOWN
3. Impact Areas
Susta inabi l i ty P lan 201282
In Midtown, the Connector runs along the entire west side of the District. The fragments of land that
run along the center and sides of the interstate are either inaccessible or too small to be occupied.
Thus, the plan proposes to transform these segments of land into intensively landscaped areas and
gateways that would serve as a visual amenity and further define the character of the Midtown Dis-
trict.
The vision manifests itself through a design approach that includes both landscape and hardscaped
elements that have been distilled into six basic concepts (Urban Forest, Vertical Greening, Lighting,
Art, Urban Furnishings and Urban Design), two of which have a direct impact on open space in Mid-
town:
1. Urban Forest – The goal of the urban forest is to create a striking “outdoor room” at each
end of the Connector to celebrate arrival into Downtown and Midtown. These gateways
combine native plants, exotic species, and light elements to highlight the built infrastruc-
ture of the freeway. Rather than replicate a true Piedmont forest, this concept seeks
to create a cultured environment that is immediately recognizable as a designed space
inspired by nature.
2. Vertical Greening – This strategy is designed to soften the stark, uninviting environment
of concrete retaining walls flanking the freeway, to highlight structural elements of inter-
est and to continue the green theme of the urban forests. A horticultural approach will be
taken with the selection of plant materials so that the effect is vigorous and visually stimu-
lating as well as environmentally sensitive and sustainable.
In order to add new landscaped areas to Midtown, Midtown Alliance will implement the following activities:
1. Identify funding sources to implement the recommendations provided in the Connector
Transformation Plan.
2. Once funding is secured, partner with the appropriate agencies to implement the projects.

3. Impact Areas 83

GREENPRINT MIDTOWN
3. Impact Areas
Susta inabi l i ty P lan 201284
IMPACT
Environmental Impact: In an urban environment,
trees provide shade for pedestrians and parked
vehicles and reduce the urban heat island effect.
Trees and vegetation also filter particulates out
of the air and reduce the quantity of stormwater
flowing into Atlanta’s combined sewer. Trees
and landscaped areas also make the District
more livable, which attracts new residents who
will lead a more sustainable lifestyle than if they
lived in a less resource-efficient location.
Community Impact: By enhancing the quality of
the street environment, people are encouraged
to walk more and come into contact with their
neighbors. Midtown’s residents, workers and
visitors will also be encouraged to venture to
parks and plazas where social interaction occurs.
Economic Impact: Indirectly, trees improve the
quality of life in Midtown making the District
more attractive for investment.
POTENTIAL IMPLEMENTATION PARTNERS/RESOURCES
- Georgia Department of Transportation – con-
trols the Downtown Connector right-of-way
along with several street corridors in Midtown.
- U.S. Department of Agriculture Forestry Ser-
vice/Southern Region – located just north of
Midtown, a resource for information and po-
tentially a source of funding.
- Central Atlanta Progress – Midtown Alliance
should continue to coordinate efforts with CAP
on the Connector Transformation Plan.
- City of Atlanta – provides policy direction and
regulatory authority.
- Trees Atlanta – a local non-profit that plants
and maintains trees throughout the City.
- Piedmont Park Conservancy – established as
the caretaker of Piedmont Park and a valuable
resource for urban forestry and landscaping.
- Atlanta Botanical Garden – can provide expert
guidance on landscape design as well as plant
selection and maintenance.

3. Impact Areas 85
COSTS & POTENTIAL FUNDING
Staff time is necessary to research and develop best practices in urban forestry and to conduct the
street tree audit. These tasks can be completed within existing staff resources.
The cost to implement The Connector Transformation Project is high given the extensive scope of
the project. The plan will likely be implemented over an extended time line of 15-20 years. Near-
term projects will include bridge enhancements, lighting, and vertical greening to emphasize the
gateway effect and provide the maximum benefit for the funds anticipated to be available in the
short term.
Potential funding sources include the Midtown Improvement District, the State Road and Tollway
Authority, Georgia Department of Transportation, and local foundations.
CHALLENGES & POTENTIAL SOLUTIONS
Challenge: The major challenge for The Connector Transformation Project relates to the difficulty
securing the funding needed to execute the project.
Potential Solution: Additional sources will need to be explored and the funding strategy will evolve
along with this project.
TRACKING & MEASUREMENT
METRIC/INDICATOR BASELINE TARGET
Tree audit N/A Completed by 2014
Bridge improvements N/A Completed by 2014
CTP – lighting enhancements N/A Completed by 2016
CTP – vertical greening N/A Completed by 2016

GREENPRINT MIDTOWN
3. Impact Areas
Susta inabi l i ty P lan 201286
“All the water that will ever be, is right now” - National Geographic, 1933

3. Impact Areas 87
3.3 Water
WATER OVERVIEW
Sustainable water management acknowledges
the interdependence among ecological
systems and the built environment. In order
to meet both basic human needs and the
needs of local watersheds, urban areas such as
Midtown must reduce potable water demand
by reusing and recycling water resources
wherever possible, using potable water only
for potable needs. 1 This section describes
challenges and opportunities for addressing
water sustainability in Midtown and outlines
strategies and programs that Midtown
Alliance can influence and integrate in order to
maximize water efficiency and reduce negative
water quality impacts.
Clean and readily available water is
fundamental to environmental and human
health, as well as economic prosperity.
However, here in Atlanta and across the
United States, demands on surface streams
and groundwater resources are increasing.
Population growth, regulatory pressures for
increased environmental protection, and
potential effects of climate change collectively
create uncertainty in water availability, costs,
and use. The complex impacts of growth
and urbanization on water resources are
experienced at many scales throughout the
country, for example:
• The 2010 Assessed Waters Database from
the U.S. Environmental Protection Agency,
reports that of the 971,156 assessed stream
miles in the United States, 43.3 percent
are considered impaired for recreational
uses, 44.5 percent are considered impaired
for aquatic wildlife, and 25.3 percent are
considered impaired for public water supply. 2
• A 2003 study by the U.S. Government
Accountability Office predicted local, regional,
or state-level water shortages in thirty-six
states, including Georgia, by 2012. 3 These
shortages were anticipated even under normal
climatological conditions. Drought periods
further exacerbate impacts of water shortages,
like the exceptional and extreme conditions
experienced in multiple regions of Georgia in
2007, 2011 and early 2012. 4
These studies and indicators reinforce the need
for local proactive action to ensure sustainability
of water resources. State, regional, and local
water plans set the foundation for water
resources management in Midtown.
WATER GOALS
• Minimize storm water runoff from
impervious surfaces
• Increase water efficiency in buildings
• Reduce potable water consumption
1 Portland Sustainability Institute. 2011. “The EcoDistricts Toolkit: Assessment.”
Retrieved from: http://www.pdxinstitute.org/images/posi_publications/Toolkits/
assessmenttoolkit_dec11.pdf (Accessed June 2012)
2 U.S. Environmental Protection Agency. 2010. “Watershed Assessment, Tracking
& Environmental Results – National Summary of State Information.” Retrieved from:
http://ofmpub.epa.gov/waters10/attains_nation_cy.control (Accessed July 2012)
3 U.S. Drought Monitor. 2012. “Drought Monitor Archive Tables.” Retrieved from:
http://droughtmonitor.unl.edu/dmtabs_archive.htm (Accessed June 2012)
4 U.S. Government Accountability Office. 2003. “States’ View of How Federal
Agencies Could Help Them Meet the Challenges of Expected Shortages” GAO-03-514.
Retrieved from: http://www.gao.gov/assets/160/157452.pdf (Accessed June 2012)

GREENPRINT MIDTOWN
3. Impact Areas
Susta inabi l i ty P lan 201288

3. Impact Areas 89
GEORGIA STATE WATER PLAN
The Georgia Comprehensive State-wide Water
Management Plan (State Water Plan)5 adopted
by the General Assembly in 2008 was the first
state-level water resources plan for Georgia.
Serving as a far-reaching vision for water re-
source management, the State Water Plan cre-
ated ten regional water planning regions to en-
sure water resources are sustainably managed
through at least 2050. The State Water Plan
provides for resource assessments, forecasting,
and regional water plans. Each regional plan out-
lines specific management practices necessary
to meet regional needs within the capabilities
of the resources. The regional plans aim to pro-
mote sustainable use, conservation and reuse of
water, guard against a shortage of water, and
promote the efficient use of the water resource.
The regional plans are also based upon detailed
scientific analysis of the water resources, the
projected future condition of the resources, cur-
rent demand, and estimated future demands.6
5 Georgia Water Council. Retrieved from: http://www.georgiawatercouncil.org/
Files_PDF/water_plan_20080109.pdf6 Georgia Department of Natural Resources, Environmental Protection Division.
Retrieved from: http://www.georgiawaterplanning.org/(Accessed June 2012)
METROPOLITAN NORTH GEORGIA
WATER PLANNING DISTRICT
The regional water plan for Metro Atlanta is
managed by the Metropolitan North Georgia
Water Planning District (Metro Water District).
The metro planning area covers approximately
4,900 square miles in fifteen counties (includ-
ing Bartow, Cherokee, Clayton, Cobb, Coweta,
DeKalb, Douglas, Fayette, Forsyth, Fulton,
Gwinnett, Hall, Henry, Paulding, and Rockdale
counties) and includes parts of six major river
basins (Chattahoochee, Coosa, Tallapoosa,
Flint, Ocmulgee, and Oconee). Staffed by the
Atlanta Regional Commission, the Metro Water

GREENPRINT MIDTOWN
3. Impact Areas
Susta inabi l i ty P lan 201290
7 Metropolitan North Georgia Water Planning District. Retrieved from: http://www.
northgeorgiawater.org/index.htm. (Accessed June 2012)
District works with local governments, water and
wastewater utilities, and stakeholders to imple-
ment three regional water resources plans, which
include specific measures for water supply and
conservation, wastewater, and watershed man-
agement.7 Fulton County and the City of Atlanta
are active participants in Metro Water District
planning activities, and can guide and influence
water sustainability for the region.
WATERSHED CHARACTERISTICS OF MIDTOWN
Midtown is located in the highly urbanized south-
ern portion of the Peachtree Creek watershed
in the Upper Chattahoochee River basin. Two
Peachtree Creek sub-basins – Clear Creek and
Tanyard Creek – flow as surface water along
the northwestern and eastern boundaries of the
Midtown core. Peachtree Street is generally the
ridgeline between the two sub-basins; areas to
the west of Peachtree Street drain to Tanyard
Creek, while areas east of Peachtree Street drain
to Clear Creek. The majority of other streams
within Midtown and Atlantic Station are chan-
neled in underground culverts. Due to its prox-
imity to Atlanta, the Chattahoochee River is the
most heavily used water resource in Georgia.8
Water management actions in Midtown and the
Peachtree Creek basin directly impact the wide
variety of uses of the Chattahoochee River, in-
cluding the quality and availability of the drink-
ing water supply for millions of Georgia citizens.
CHATTAHOOCHEE RIVER USES
Water Supply
Wastewater
Assimilation
Agriculture
Recreation
Power Generation
Navigation
8 United States Geologic Survey. 1995. “Water Resources Investigations Report
95-4278.” Retrieved from: http://pubs.usgs.gov/wri/1995/4278/report.pdf (Ac-
cessed June 2012).

3. Impact Areas 91
City of Atlanta Water System
The City of Atlanta Department of Watershed
Management (DWM) provides stormwater, drink-
ing water and wastewater services to Midtown.
Water is withdrawn from the Chattahoochee
River, treated at the Chattahoochee and Hemp-
hill water treatment facilities and then supplied
directly to businesses and residents. Wastewater
conveyance and treatment is provided at the
R.M. Clayton Water Reclamation Center located
west of Midtown. Stormwater is combined and
conveyed with sanitary sewer lines and treated
at either the water reclamation center or local
Combined Sewer Overflow (CSO) facilities.
Combined Sewer System
Areas of Atlanta operate on a combined sewer
system, which carries both wastewater and
stormwater through the system to water rec-
lamation centers for treatment and eventual
discharge into a river or stream. In dry weather,
all flow goes to a wastewater treatment plant.
During wet weather, some flow may be diverted
to CSO treatment facilities for storage and/or
treatment. In heaviest rainfall, combined sewage
flow may be discharged directly to streams. The
Clear Creek CSO Treatment Facility is located on
Monroe Drive near Piedmont Park and provides
treatment for stormwater and wastewater flows
from Midtown and Downtown Atlanta.

GREENPRINT MIDTOWN
3. Impact Areas
Susta inabi l i ty P lan 201292
WATER CHALLENGES
The urban characteristics of Midtown present
multiple challenges to sustainable water resource
management. Because land, and the water that
runs over and through it, are intimately connect-
ed, a watershed approach is vital to understand-
ing and addressing water supply and quality im-
pacts. By definition, a watershed approach is “a
coordinating framework for environmental man-
agement that focuses public and private sector
efforts to address the highest priority problems
within hydrologically-defined geographic areas,
taking into consideration both ground and sur-
face water flow.”9 A watershed approach will
consider all challenges that can be addressed in
order to help ensure water sustainability in the
Midtown.
STORMWATER POLLUTION
Atlanta receives nearly 50 inches of rain per year
on average 10 providing the Midtown Core with
over 1.1 billion gallons of rainwater annually. Due
to the increasingly high level of imperviousness
in Midtown, the majority of this rainfall leaves
the Peachtree Creek watershed as stormwater
runoff. Because environmental regulations have
become relatively effective at controlling point
source pollution from industry and wastewater
treatment plants, non-point source pollution
(stormwater runoff) is now the leading cause
of water quality problems. As land in Midtown
9 U.S. Environmental Protection Agency. 1996. “Watershed Approach Framework.”
Retrieved from: http://www.epa.gov/owow/watershed/framework/ (Accessed
July 2012).10 National Weather Service Weather Forecast Office. 2010. “Rainfall Scorecard”
Retrieved from: http://www.srh.noaa.gov/ffc/?n=rainfall_scorecard (Accessed
June 2012)

3. Impact Areas 93
11 Upper Chattahoochee Riverkeeper. Retrieved from: www.chattahoochee.org/
river-facts.php. (Accessed June 2012).
has developed, natural areas were converted to
impervious surfaces such as streets, sidewalks,
buildings and parking lots. Approximately 78%
of the Midtown Core is currently impervious. The
level of imperviousness in a dense, urban area
typical falls in the range of 75%-100%. As Mid-
town continues to grow, so will its level of imper-
viousness. Stormwater that would normally soak
into the ground becomes runoff. While some
stormwater runoff is normal, the increased vol-
ume of runoff associated with impervious surfac-
es can cause streambank erosion, flooding, and
property damage. In urban areas like Midtown,
this runoff picks up silts, oils, heavy metals, and
other pollutants from roads, sidewalks, and
other hard surfaces and deposits them directly
in streams. Addressing stormwater challenges
through strategic green infrastructure and
other sustainable practices will allow Midtown
to reduce negative impacts to resources in the
watershed.
LIMITED WATER SUPPLY
Water resources challenges in Midtown and the
Peachtree Creek basin can be exacerbated by
the overall hydrologic conditions of the Chatta-
hoochee Basin. The headwaters of the Chatta-
hoochee River, which drain into Lake Lanier north
of Atlanta, comprise the smallest drainage area
that provides a major portion of water supply for
any metropolitan area in the country. 11 The upper
portion of the Chattahoochee River supplies more
than 70 percent of drinking water for metro Atlan-
ta – an annual average of about 450 million gallons
per day – enough to fill 681 Olympic swimming
pools. The small size of the watershed limits the
amount of water that is available for human uses
because of the need to maintain in-stream flows
for assimilating wastewater and for aquatic and
wildlife habitat.
In addition to hydrologic limitations, the Chatta-
hoochee Basin faces legal and regulatory challenges
regarding rights to withdraw water for drinking pur-
poses. Georgia’s ongoing negotiations with Florida
and Alabama may limit water supplies until a perma-
nent agreement for the equitable allocation of water
among the three states can be reached.
The State Water Plan and the Metro Water Dis-
trict plans both estimate that additional water
supplies will have to be developed in the basin –
through new reservoirs or other storage – to meet
future demands. Conservation and increased wa-
ter efficiency is also a planned strategy to meet
potable water demands of the growing population.
Strategic programs to reduce potable water use
in buildings and open space projects can enable
Midtown to be a leader and positive example of
how water supply challenges can be addressed at
watershed and neighborhood scale.

GREENPRINT MIDTOWN
3. Impact Areas
Susta inabi l i ty P lan 201294
AGING INFRASTRUCTURE
Water quality and quantity challenges are further
complicated when considering the infrastructure
– and energy – required to treat stormwater and
wastewater and deliver water to consumers. The
City of Atlanta owns and operates complex and
aging systems – some in the ground for more
than 100 years – that are critical for basic sanita-
tion, public safety, economic development, and
other necessities. Basic repairs to these systems,
such as fixing leaks, replacing older pipes, and
maintaining meters, were delayed for multiple
decades. The City is now required to comply
with two federal consent decrees and a state
consent order to improve water quality, secure
drinking water facilities in accordance with na-
tional homeland security guidelines, and provide
more integrated management of water resourc-
es. The City adopted an aggressive capital im-
provement program in 1993 that will invest bil-
lions of dollars in wastewater and sewer system
improvements by the year 2027.12
These water and wastewater system improve-
ments are costly to the City and to consumers,
who shoulder the costs of infrastructure im-
provements through high water and wastewa-
ter rates. According to a 2009 national study
of water and wastewater rates, City of Atlanta
customers paid the second highest wastewater
and seventh highest water rates in the country. 13 Finding equitable ways to finance future infra-
structure improvements while encouraging con-
servation will continue to challenge the City and
ratepayers in Midtown.
12 Atlanta Department of Watershed Management. “Clean Water Atlanta”. Re-
trieved from: http://www.atlantawatershed.org/cwa/ (Accessed June 2012)
13 Black & Veatch. 2009. “50 Largest Cities Water/Wastewater Rate Survey.”

3. Impact Areas 95
14 U.S. EPA. Retrieved from: http://water.epa.gov/infrastructure/greeninfrastruc-
ture/index.cfm
15 American Rivers. 2012. “Banking On Green: A Look At How Green Infrastructure
Can Save Municipalities Money and Provide Economic Benefits Community-
Wide.” Retrieved from: http://www.americanrivers.org/assets/pdfs/reports-and-
publications/banking-on-green-report.pdf (Accessed June 2012)
WATER OPPORTUNITIES
Though Midtown contributes to stormwater pol-
lution and limited water supplies, the District
is well situated to address these challenges.
Diverse water demands from commercial and
residential buildings provide many options to in-
crease efficiency and conserve resources.
GREEN INFRASTRUCTURE
Green infrastructure is an emerging stormwater
best management practice to reduce impacts
to local streams, enhance overall environmental
quality, and provide utility services. Green infra-
structure approaches use natural or engineered
systems that mimic natural processes, to infil-
trate, evapotranspire, and/or recycle stormwa-
ter runoff. 14 By mimicking natural hydrologic
functions, these approaches prevent stormwater
from flowing into surface waters or overbur-
dened sewer systems. Green infrastructure ap-
proaches are scalable – from small projects on
individual buildings to larger elements that span
entire watersheds – and potentially cheaper than
traditional stormwater approaches. Communi-
ties across the country have used green infra-
structure as a cost-effective way to supplement
or replace traditional stormwater management
practices (see Best Practices Appendix). Ad-
ditionally, green infrastructure has been found
to enhance community aesthetic experiences
for residents, and improved quality of life and
property values in communities that have widely
adopted green infrastructure solutions. 15 Green
infrastructure approaches offer great oppor-
tunities for Midtown to more sustainably ad-
dress stormwater challenges as buildings and
streetscapes are developed and redeveloped in
the District.
Credit: Green Infrastructure Digest

GREENPRINT MIDTOWN
3. Impact Areas
Susta inabi l i ty P lan 201296
WATER EFFICIENCY AND CONSERVATION
Less water going down the drain means more water available in the lakes, rivers and streams used
for human and environmental needs. 16 Georgia’s state and regional water plans all require increased
water efficiency and conservation in order to meet future water needs of the state. Conservation
and efficiency measures may offer low-cost, low-impact opportunities to help close the water sup-
ply gap by reducing water demands of businesses and homes in Midtown, particularly in high water-
using buildings such as restaurants, hotels, and multifamily buildings.
The Pyramid of New Water Sources developed by Yudelson Associates, a leading international green
building consulting firm, graphically depicts options for developing new water sources. 17 This pyra-
mid highlights measures that could be implemented at various scales – with increasing complexity
and costs – in the District to reduce water demand. Education and behavior changes have the widest
applicability and are the lowest cost options; Midtown Alliance is well positioned to educate a wide
variety of water users and the potential for real water savings is high. As greater levels of water effi-
ciency are achieved through education, other water supply projects should be considered in order to
maximize water sustainability potential in the District.
16 U.S. EPA. “WaterSense: Why Water Efficiency” Retrieved from: http://www.epa.gov/
watersense/our_water/why_water_efficiency.html (Accessed June 2012)17 Yundelson Associates. 2011. “Pyramid of New Water Sources.” Retrieved from: http://
www.greenbuildconsult.com/pdfs/pyramid-handout.pdf (Accessed June 2012)

3. Impact Areas 97
MIDTOWN WATER ASSETS
Midtown has excellent assets for supporting a sustainable water system including a clean and safe
water supply, newly replaced infrastructure, and a regional plan for conservation. Water resources
data is often unavailable at the community scale. Ongoing coordination with the City and individual
building owners will be required to obtain a complete inventory of water assets in Midtown. Existing
water assets include:
• Rainwater Harvesting Systems
- Midtown Alliance
- Southface
- Perkins + Will
- Lure
- Ecco
- 999 Peachtree Street
- Promenade II
- 1180 Peachtree
• Buildings participating in the City of Atlanta Multifamily Toilet Rebate Program
- Arts Center Tower
• Restaurants with low-flow spray rinse valves (as identified by survey)
- Midtown Tavern
- Highland Bakery
- Jason’s Deli
- Gordon Biersch Brewery
- 5 Napkin Burger
- Campagnolo
- Apache Cafe
- Escorpion
- The Peachtree Club
- Hudson Grille Midtown
- Babs Midtown

GREENPRINT MIDTOWN
3. Impact Areas
Susta inabi l i ty P lan 201298
Midtown Water Assets

3. Impact Areas 99
Impervious Surfaces

GREENPRINT MIDTOWN
3. Impact Areas
Susta inabi l i ty P lan 2012100
WATER STRATEGIES & PROGRAMS
Through the Greenprint Midtown planning process, the following Open Space strategies were
developed and guided the selection of both Tier 1 (priority) and Tier 2 programs/projects. In the
future, additional programs and projects can be developed from the following strategies.
STRATEGIES
WS1: Encourage and implement green infrastructure features in public and private development.
WS2: Educate Midtown water users about changes in operations, behaviors, and fixtures that
reduce water use.
WS3: Promote rainwater harvesting and other on-site non-potable water supplies to meet outdoor
and process water needs.
WS4: Encourage water efficient landscapes to reduce outdoor water use.
TIER 1 PROGRAMS/PROJECTS
The following Tier 1 programs and projects were identified as priorities and are described in more
detail in the next section.
WP1: Green Stormwater Infrastructure Program
WP2: Restaurant Water Efficiency Outreach
WP3: Multifamily Water Efficiency Outreach
WP4: Rainwater Harvesting Outreach
TIER 2 PROGRAMS/PROJECTS
WP5: Water Efficiency Outreach to specific building types - The majority of buildings in Midtown
are relatively new, but continuing water efficiency outreach to prominent building types such
as commercial office buildings and hotels will be an important step to reducing overall water
use in the MID. Outreach efforts create opportunities to cultivate a culture of sustainability
among Midtown workers and visitors.
WP6: Infrastructure Retrofits for Parking Lots - The amount of impervious surface and heavy
automobile use associated with surface parking lots makes them a significant source of
stormwater runoff and pollutants. Incorporating green infrastructure strategies in privately
owned parking lots and decks are a logical extension of the sustainable community design
practices begun in street scape and open space projects as part of the Green Stormwater
Infrastructure Program.
WP7: Outdoor Water Use Policies & Practices - Watering schedules, landscaping guidelines, and
non-potable water use policies can reduce potable water use and elevate the importance of
water stewardship in Midtown.

3. Impact Areas 101
TIER 1 WATER PROGRAMS
WP1 – GREEN STORMWATER INFRASTRUCTURE PROGRAM
Description
Urban infrastructure such as roads, bike lanes,
driveways, sidewalks, and curbing are neces-
sary for community access, safety, and mobility.
However, much of this infrastructure also con-
tributes to high levels of imperviousness, which
results in surface runoff that can pollute streams
and rivers. Midtown Alliance has a significant
opportunity to lessen the impacts by incorpo-
rating green infrastructure best practices in the
design of its streetscape and open space proj-
ects. In addition, Midtown Alliance can educate
the private development community about the
benefits of incorporating green infrastructure.
Through this program, Midtown Alliance will
incorporate green infrastructure approaches,
such as bioswales, rain gardens, and permeable
pavement in future streetscape and open space
projects. This program will complement and
therefore should be coordinated with Transpor-
tation and Open Space programs.
The following program implementation activi-
ties will help further water sustainability goals in
Midtown:
• Revise the Midtown Development Design
Guidelines to incorporate green infrastructure
best practices in the Public Spaces, Site Plan-
ning and Parking sections of the guidelines.
Guidelines should focus on strategies that
minimize the quantity of stormwater entering
combined sewers through design treatments
and plant materials in order to improve wa-
ter quality and reduce flooding. The revised
guidelines should include standards for perme-
able pavement, tree planter boxes, bioswales,
rainwater harvesting and complete streets (see
Transportation Impact Area).
• Specify green infrastructure approaches in all
Requests for Proposals for streetscape and
open space projects. Include multi-year main-
tenance and training into construction contract.
• Educate the development community on the
design guideline revisions through outreach
events and trainings as appropriate, such as
during Midtown Development Review Commit-
tee meetings.
• Participate as an active stakeholder in the
review and update of related City of Atlanta or-
dinances, for example, the Standard Details and
the Post-Development Stormwater Ordinance,
to ensure symmetry on all green infrastructure
design standards.

GREENPRINT MIDTOWN
3. Impact Areas
Susta inabi l i ty P lan 2012102
POTENTIAL IMPLEMENTATION PARTNERS & RESOURCES
• City of Atlanta Department of Public Works (DPW) – DPW has permitting authority and re-
views all public and private development.
• City of Atlanta Department of Watershed Management (DWM) – DWM is responsible for pro-
tecting Atlanta’s urban waterways and for providing safe drinking water.
• The Conservation Fund – a national nonprofit that offers tools and training on green infra-
structure that could serve as a resource for the Green Stormwater Infrastructure Program. 18
IMPACT
Environmental Impact: Green infrastructure approaches use site design, natural vegetation, and
engineered materials to increase water infiltration and capture runoff. Stormwater runoff and the as-
sociated volume of combined sewer overflows can be reduced through green infrastructure, which
results in cleaner water and enhanced water supplies. Trees and vegetation incorporated in green
infrastructure projects can filter airborne pollutants and create shade that can lead to cleaner air and
reduced urban temperatures. 19 These studies have also demonstrated that green infrastructure incor-
porated on and around buildings can increase energy efficiency by shading and insulating buildings.
Community Impact: Green infrastructure projects show a visual commitment to protecting water
resources and can help raise awareness about water issues. Trees and plants improve urban aesthet-
ics and community livability by providing recreational and wildlife areas. Studies show that property
values are higher when trees and other vegetation are present.
Economic Impact: Green infrastructure can potentially have more expensive up-front costs than
traditional infrastructure due to differences in materials and labor costs. However, the investment
can save money over time by reducing capital costs of additional stormwater detention and lowering
operational expenses of pumping and treating stormwater and combined wastewater flows. Green
infrastructure can also help prevent costly repairs from damage caused by stormwater and pollution,
such as streambank restoration.
18 The Conservation Fund. “The Conservation Fund and Green Infrastructure.” Re-
trieved from: http://www.conservationfund.org/green_infrastructure (Accessed
July 2012).19 U.S. EPA. 2008. “Managing Wet Weather with Green Infrastructure Action Strat-
egy.” Retrieved from: http://water.epa.gov/infrastructure/greeninfrastructure/
upload/gi_action_strategy.pdf (Accessed June 2012).

3. Impact Areas 103
CHALLENGES & POTENTIAL SOLUTIONS
Challenge: Siting effective green infrastructure projects can impede on rights of ways, easements,
and underground utilities.
Potential Solution: Involve the City of Atlanta, utility owners, and the public as early as possible to
determine appropriate site size and whether permanent easement or land acquisition is desired or
necessary. Future plans of adjacent roads, buildings, and other infrastructure should also be consid-
ered when siting projects.
TRACKING & MEASUREMENT
METRIC/INDICATOR BASELINE TARGET
Green Infrastructure
Number of Private Projects Incorporating
Green Stormwater Infrastructure Design
11 20 20 by 2020
Number of Public Projects Incorporating Green
Stormwater Infrastructure Design 21
1 22 5 by 2020
20 Results from USGBC.org LEED Projects & Case Studies Directory21 Green Infrastructure according to the EPA includes: downspout disconnection, rainwater harvesting, rain gardens, planter boxes, bioswales, permeable pavements,
green alleys & streets, green parking, green roofs, urban tree canopy, and land conservation.22 Juniper Streetscape project

GREENPRINT MIDTOWN
3. Impact Areas
Susta inabi l i ty P lan 2012104
WP2 – RESTAURANT WATER EFFICIENCY OUT-REACH PROGRAM
Description
Water plays a crucial role in restaurants – from
cooking and cleaning to aesthetics and ambi-
ance. Home to more than 150 restaurants and
drinking establishments, Midtown is a top din-
ing destination in Metro Atlanta. On average,
restaurants use 5,800 gallons of water per day,23
nearly the average amount of water used by
an Atlanta household per month. 24 The majority
of water is used in the kitchen and for domes-
tic (cleaning) and restrooms. 25 In Atlanta, this
amount of water usage can cost well over $4,000
per month, a significant operating expense.
A July 2012 survey of Midtown restaurants
revealed significant opportunities to conserve
water and save money. Less than one-third
of the respondents utilized low-flow pre-rinse
spray valves, low-flow or waterless urinals, or
high efficiency or dual-flush toilets. 26 Increasing
water efficiency at Midtown restaurants can help
improve their bottom lines, the environment,
and the perception of the District as a place for
sustainable businesses.
23 Southwest Florida Water Management District. 1997.” ICI Conservation in the
Tri-County Area of the SWFWMD.” Retrieved from: http://www.swfwmd.state.
fl.us/conservation/waterwork/checklist-restaurant.html (Accessed July 2012)24 City of Atlanta Department of Watershed Management. “Water and Sewer Rate
Information.” Retrieved from: http://www.atlantawatershed.org/custsrv/water_
and_sewer_rates.htm (accessed July 2012)25 East Bay Municipal Utility District. 2008.WaterSmart Guidebook: A Water-Use
Efficiency Plan-Review Guide for New Businesses. Retrieved from: http://www.al-
lianceforwaterefficiency.org/WorkArea/linkit.aspx?LinkIdentifier=id&ItemID=2836
(Accessed July 2012)26 Midtown Alliance. “Midtown Restaurant Survey” July 2012.
47%
33%
5%
2%
13%

3. Impact Areas 105
Through this program, Midtown Alliance will educate and assist new and existing food service facility
owners and managers with establishing and maintaining a water conservation and efficiency pro-
gram, including information about operational changes and plumbing and equipment retrofit options
that can reduce water consumption. These outreach efforts can be a stand-alone initiative or be
incorporated as part of the Green Business Recognition Program.
Midtown Alliance will implement this program through the following activities:
• Partner with the City of Atlanta Office of Water Efficiency to develop marketing and com-
munications materials to educate restaurant managers and employees. Materials should
include information on the following water efficiency measures:
- Low-flow fixtures: aerators, low-flow pre-rinse spray valves, toilets
- Water efficient kitchen equipment: dishwashers, icemakers, coolers/freezers, dispos-
als, steamers, ice cream/yogurt machines
- Water efficient landscaping: water only when needed, mulch around plants, water
reuse for fountains
- Water saving practices and policies: train employees, turn off continuous flows used
to clean drains, thaw food in refrigerators rather than in running water.
• Distribute educational materials to all Midtown restaurants and food service facilities.
• Provide training/educational workshops to Midtown restaurants on the benefits and impor-
tance of water efficiency. Full service sit-down restaurants that serve two or more meals
per day should be target attendees.
• Create, maintain, and distribute a referral list of local distributors and manufacturers of wa-
ter efficient products and equipment.
• Monitor and track outreach and efficiency efforts.
POTENTIAL IMPLEMENTATION PARTNERS & RESOURCES
• City of Atlanta Office of Water Efficiency (OWE) – OWE can provide technical review of
outreach materials and can assist Midtown Alliance with tracking water savings from restau-
rants that retrofit fixtures.
• National Restaurant Association/Georgia Restaurant Association – national and state-level
restaurant professional associations can provide resources on the value of water efficiency
in restaurants. The national ConSERVE Sustainability Education Program is an online re-
source designed by restaurant professionals to help advance water and energy efficiency in
the industry.

GREENPRINT MIDTOWN
3. Impact Areas
Susta inabi l i ty P lan 2012106
IMPACT
Environmental Impact: Increasing water efficiency ensures water supplies will be available for all hu-
man, community, and ecological uses. Using less water in businesses contributes to healthier flows
in local streams and rivers. Adequate in-stream flows protect aquatic ecosystems, can help reduce
negative impacts of pollution and stormwater runoff, and ensure water availability for downstream
and future users.
Community Impact: Sustainability is increasingly becoming a key influencer of consumer purchas-
ing and buying decisions. According to the Greenprint Midtown Community Survey, 81 percent of
respondents are more likely to support restaurants or businesses that make a strong commitment to
sustainability. Restaurants engaging in water efficiency practices can promote their initiatives to at-
tract more customers. Increasing the number of food service facilities that use water efficiently can
also enhance the District’s image. Encouraging food service facilities to adopt water conservation
policies also has potential to promote civic pride by giving restaurants and food service facilities a
meaningful way to engage in the Midtown EcoDistrict.
Economic Impact: The City of Atlanta has some of the highest water and wastewater rates in the
country. Reducing water use can have a meaningful impact on restaurants’ profitability. On aver-
age, a restaurant in Midtown could save approximately $5,000 each year by reducing their water use
by just 10 percent. Efficient water use in food service is additionally important because many high
water volume applications (i.e. dishwashers and steamers) are generally using hot water. The energy
required to heat that water can be significant. The reduction of hot water consumption can therefore
lower water and energy bills.
COSTS & POTENTIAL FUNDING
The costs to support this program are estimated to consume about 5% of a FTE and would include
staff expenses to conduct outreach and educate restaurant and food service facilities. If this pro-
gram is included as part of a Green Business Recognition Program described later in this report, ef-
ficiencies could be experienced.
Potential funding sources include the Midtown Improvement District, the Metro North Georgia Water
Planning District, and foundations.

3. Impact Areas 107
CHALLENGES & POTENTIAL SOLUTIONS
Challenge: Restaurant managers and owners may be hesitant to invest in new technology due to the
associated upfront capital costs. Managers and employees may not feel empowered to make policy
and behavioral changes.
Potential Solution: Education materials should emphasize the role of both restaurant managers and em-
ployees in making positive environmental, economic, and community benefits through water efficiency
actions.
TRACKING & MEASUREMENT
METRIC/INDICATOR BASELINE TARGET
Outreach
Number of Restaurants Using Low-
Flow Fixtures 27
17 35 by 2017
Number of Restaurants Using Water
Efficient Equipment 28
11 20 by 2017
Number of Restaurants Adopting
Water Saving Policies
0 10 by 2017
Number of Restaurants Using Water
Efficient Outdoor Practices 29
1 30 10 by 2017
27 Waterless urinals, low-flow/high-efficiency toilets
28 Low-flow pre-rinse spray valve or other equipment
29 Rainwater harvesting for fountain or landscaping
30 Midtown Alliance. “Greenprint Midtown Restaurant Survey.” July 2012.

GREENPRINT MIDTOWN
3. Impact Areas
Susta inabi l i ty P lan 2012108
WP3 – MULTI-FAMILY WATER EFFICIENCY OUTREACH PROGRAM
Description
Condominiums and apartments are the pre-
dominant housing type in the Midtown Core;
however, the majority of multi-family residents
–59 percent of condo/townhome owners and
64 percent of renters who responded to the
Greenprint Midtown Community Survey – have
not installed low-flow plumbing fixtures. Plumb-
ing fixture replacement programs have been a
staple of the water industry’s water efficiency
efforts since the late 1980s. 31 These programs
often focus on toilet retrofits because toilets are
the main source of residential indoor water use.
The City of Atlanta currently offers a $100 rebate
for each toilet replaced with a low-flow toilet
within multi-family buildings. Beginning in July
2012, a new ordinance requires new residential
and commercial buildings install high efficiency
toilets (1.28 gpf or less). Plumbing retrofits
provide a significant opportunity to save water,
electricity and money. The U.S. EPA estimates
that a homeowner who retrofits a bathroom with
WaterSense (low-flow) fixtures can save 7,000
gallons of water, 200 kilowatt hours of electric-
ity, and $80 in utility costs. 32
31 Alliance for Water Efficiency, Toilet Fixtures Introduction. Retrieved from:
http://allianceforwaterefficiency.org/toilet_fixtures.aspx (accessed June 2012)32U.S EPA. “ Dreaming of a Better Bathroom” Retrieved from: http://www.epa.
gov/watersense/pubs/bathroom.html
Source: American Water Works Association Research Foundation, “Residential End Uses of Water,” 1999
27%
17%
16%
22%
13%
5%

3. Impact Areas 109
Through this program, Midtown Alliance will educate and assist building managers, homeowners, and
homeowners associations about plumbing retrofit options and other opportunities to reduce water
consumption. This program could be a stand-alone program or offered in conjunction with the Multi-
family Building Recycling Program (see Waste section).
Midtown Alliance will implement this program through the following activities:
• Partner with City of Atlanta to create a water conservation best practices guide and distrib-
ute to all multifamily building owners and managers. At a minimum, the guide should include
information on the following water efficiency measures:
- Leak detection (dye tablets, and water pressure testing)
- Fixture and equipment retrofits (toilets, low-flow shower heads, low-flow faucet
aerators, dishwashers, and clothes washer)
- Outdoor water use (watering rules, seasonal schedules, rain sensors)
- Billing and sub-metering
• Educate apartment managers and condominium homeowners associations about plumb-
ing retrofit options that result in reduced water consumption, with a particular emphasis on
buildings constructed prior to 1994.
• Partner with the City of Atlanta to increase participation in the City’s Multi-family Toilet Re-
bate Program. Serve as a liaison between building owners and the City to encourage partici-
pation in the toilet rebate program.
• Provide “train-the-trainer” workshops and collateral for building owners and managers so
that they can, in turn, educate their tenants on the benefits and best practices for water ef-
ficiency.
• Maintain a list of water efficiency organizations and/or suppliers that can assist with building
audits and/or bulk purchasing of fixtures and fittings.
• Monitor and track outreach efforts.

GREENPRINT MIDTOWN
3. Impact Areas
Susta inabi l i ty P lan 2012110
POTENTIAL IMPLEMENTATION PARTNERS & RESOURCES
• City of Atlanta Office of Water Efficiency (OWE) – OWE can provide technical review of out-
reach materials and can assist Midtown Alliance with tracking water savings from buildings that
retrofit fixtures. As funds are available, the City offers rebates to qualifying multifamily buildings
for toilet retrofits. 33 OWE also provides “Water Saver Kits” to its water customers. 34
• TOTO – Atlanta-based plumbing products manufacturer plans to offer discount pricing and
in kind donation of products to Atlanta Better Buildings Challenge participants. The com-
pany may be willing to offer similar product discounts and technical assistance to Midtown
multifamily buildings.
IMPACT
Environmental Impact: Replacing inefficient toilets and other plumbing fixtures with low-flow models
will conserve water. Increasing water efficiency ensures water supplies will be available for all hu-
man, community, and ecological uses. Using less water allows water flows in local streams and rivers
to stay at healthy levels. Adequate in-stream flows protect aquatic ecosystem, can help reduce
negative impacts of pollution and stormwater runoff, and ensure water availability for downstream
and future users.
Community Impact: According to the Greenprint Midtown Community Survey, 69 percent of respon-
dents indicated that incentives and rebates for water saving fixtures would most encourage them to
use less water. Increasing participation in existing rebate programs and retrofit activities can be a
meaningful way for residents to engage in the Midtown EcoDistrict.
Economic Impact: The City of Atlanta has some of the highest water and wastewater rates in the
country. Reducing water use can have a meaningful impact on bills for individual residents and
homeowners associations.
33 City of Atlanta Office of Water Efficiency. 2012. “Multi Family Toilet Rebate
Program.” Retrieved from: http://www.atlantawatershed.org/conservation/multi-
family-toilet-rebate.htm (accessed June 2012)34 City of Atlanta Office of Water Efficiency. 2012. “Water Saver Kits.” Retrieved
from: http://www.atlantawatershed.org/conservation/water-saver-kits.htm (ac-
cessed June 2012)

3. Impact Areas 111
TRACKING & MEASUREMENT
METRIC/INDICATOR BASELINE TARGET
Engagement/Recruitment
Number of Buildings Participating in
Plumbing Retrofit 35
3 36 5 by 2017
Number of Buildings Completing Water
Education Training 37
0 5 by 2017
Number Buildings Distributing Water-
Saver Kits
0 5 by 2017
Number of Buildings Adopting Water Sav-
ing Policies 38
0 5 by 2017
35 Multi-family buildings constructed prior to 1994 are eligible for toilet retrofit rebate through the City of Atlanta, plumbing retrofit program includes all fixture types36 Midtown Alliance. “Greenprint Midtown – Multi-family Residence Survey.” July 2012.37 To be developed by Midtown Alliance38 Outdoor & indoor water use policies
CHALLENGES & POTENTIAL SOLUTIONS
Challenge: Funding for the City of Atlanta Multi-family Toilet Rebate program is limited.
Potential Solution: Buildings that are eligible for the program should be prioritized for outreach. Given
the relatively small number of older multi-family buildings in the core of Midtown, it will be possible to
contact every building by the end of 2012.

GREENPRINT MIDTOWN
3. Impact Areas
Susta inabi l i ty P lan 2012112
WP4 – RAINWATER HARVESTING OUTREACH PROGRAM
Description
As water resources become more limited in
Metro Atlanta and stormwater pollution becomes
increasingly recognized as a serious problem,
rainwater and in some cases air conditioner
condensate, can play a significant role in pro-
viding water for particular needs. State code
currently allows commercial properties to use
rainwater for outdoor uses and for specific non-
potable indoor uses with appropriate plumbing
(toilet flushing and clothes washing). Rainwater
cisterns can be located above ground or below
ground depending on space constraints or aes-
thetic considerations. Harvested rainwater can
meet many non-potable water demands such as
landscape irrigation, fountains and other water
features. Atlanta’s hot and humid climate makes
air conditioner condensate recovery and reuse a
significant opportunity for water savings. Typi-
cally, condensate water is drained into the sewer.
Condensate is very pure water and can be used
for irrigation needs or for cooling tower make-up
water. Using rainwater and condensate to meet
particular water needs can involve more complex
building design and require more up-front in-
vestment than using municipally-supplied water
supplies. 39 Therefore, education on the benefits
of the practice will be necessary to increase
adoption in the District.
39 Yundelson Associates. 2011. “Pyramid of New Water Sources.” Retrieved from:
http://www.greenbuildconsult.com/pdfs/pyramid-handout.pdf (Accessed June
2012)
Courtesy of Perkins + Will

3. Impact Areas 113
Through this program, Midtown Alliance will educate property owners and managers on the benefits
of collecting rainwater and condensate and will demonstrate feasibility in various settings through a
tour of existing systems in the District, and potentially through a demonstration project. This pro-
gram will complement multiple Greenprint Midtown initiatives, including the Green Stormwater
Infrastructure Program, the Civic Square Acquisition and Development program, and the Tempo-
rary Park and Plaza Activation program. Midtown Alliance will implement this program through
the following activities:
• Educate building owners and managers about the benefits and opportunities of rainwater
and condensate capture. Buildings with appropriate end water uses should be targeted,
particularly properties with large outdoor irrigation needs, cooling towers, and/or water
features such as fountains and pools.
- Develop outreach materials to educate building owners and managers about the
benefits and uses of rainwater harvesting and condensate capture. Materials should
include information on the following:
• Uses and feasibility of various systems, including system sizing and types of
systems appropriate for different end uses
• Technical components for harvesting and treatment
• State and local building codes and guidelines related to rainwater harvesting
- Develop in-person or video tour of existing rainwater harvesting systems operating
in Midtown. Partner with building owners to document success stories and generate
publicity/acknowledgement for buildings using rainwater harvesting for non-potable
water needs.
• Install a demonstration project with a significant education and innovation component
within the District. Potential projects may include:
- Retrofit the Arts District Plaza fountain to be supplied by rainwater
- Install a rainwater harvesting system for irrigation at the new Jamestown Community
Greenspace
- Consider a rainwater harvesting system for irrigation at any proposed community
food gardens

GREENPRINT MIDTOWN
3. Impact Areas
Susta inabi l i ty P lan 2012114
POTENTIAL IMPLEMENTATION PARTNERS & RESOURCES
• Southeast Rainwater Harvesting Systems Association – Rainwater harvesting professional
association that can provide oversight of educational materials and technical assistance and
consulting for a demonstration project. 40
IMPACT
Environmental Impact: Rainwater harvesting and condensate capture lessens demand on rivers and
streams by replacing municipally supplied potable water with an on-site source. This eliminates the
energy and chemical use associated with treating and pumping water supplies. These systems have
also been shown to reduce negative impacts of stormwater flows.
Community Impact: Rainwater harvesting tanks can be a strong visible indicator of sustainability. By
increasing rainwater harvesting in Midtown, employees, residents, and visitors to Midtown will be
able to be proud that their community invests in sustainable water infrastructure.
Economic Impact: While rainwater harvesting systems can require substantial upfront costs, systems
often have a short return on investment due to resulting lower water and wastewater bills. Installing
a rainwater collection system is often less expensive than drilling private wells. 41 Community savings
can also be realized through the stormwater management functions of rainwater harvesting systems;
for example, potential costs of damage caused by runoff and flooding can be lessened or mitigated
altogether.
COSTS & POTENTIAL FUNDING
The costs to support this program are estimated to consume about 5% of a FTE and would include
staff expenses to conduct outreach and educate building owners and managers. The cost to imple-
ment a demonstration project could cost up to $10,000.
Potential funding sources include the Midtown Improvement District, the Metro North Georgia Water
Planning District, foundations, and in-kind contributions from rain harvesting companies.
40 Southeast Rainwater Harvesting Systems Association. 2011. Retrieved from:
http://www.serhsa.com/ (Assessed July 2012)41 Southeast Rainwater Harvesting Systems Association. 2011. Retrieved from:
http://www.serhsa.com/ (Assessed July 2012)
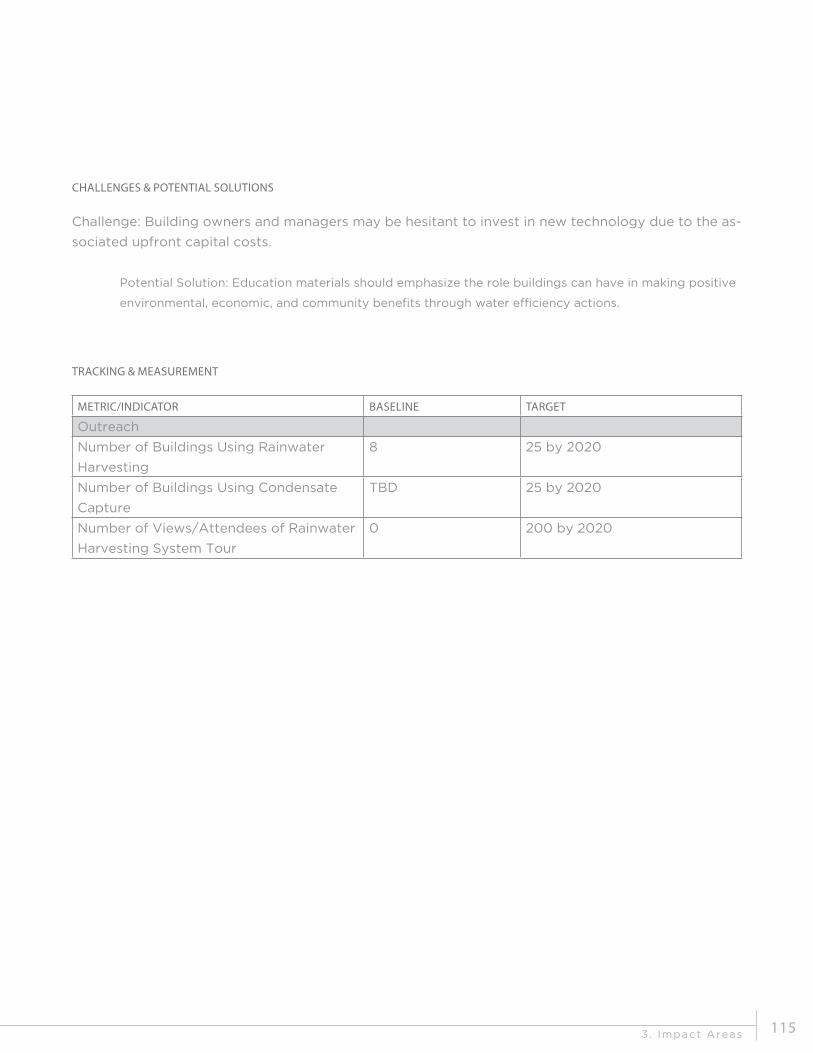
3. Impact Areas 115
CHALLENGES & POTENTIAL SOLUTIONS
Challenge: Building owners and managers may be hesitant to invest in new technology due to the as-
sociated upfront capital costs.
Potential Solution: Education materials should emphasize the role buildings can have in making positive
environmental, economic, and community benefits through water efficiency actions.
TRACKING & MEASUREMENT
METRIC/INDICATOR BASELINE TARGET
Outreach
Number of Buildings Using Rainwater
Harvesting
8 25 by 2020
Number of Buildings Using Condensate
Capture
TBD 25 by 2020
Number of Views/Attendees of Rainwater
Harvesting System Tour
0 200 by 2020
GREENPRINT MIDTOWN
3. Impact Areas
Susta inabi l i ty P lan 2012116
“Restore human legs as a means of travel. Pedestrians rely of food for fuel and need no special parking facilities.”
- Lewis Mumford

3. Impact Areas 117
3.4 Transportation
TRANSPORTATION OVERVIEW
A major focus of Greenprint Midtown is to
provide a sustainable transportation system
that maximizes environmental, economic,
and community benefits. The function,
convenience, comfort, and safety of our
transportation system has a significant effect
on quality of life, the environment and the
economic health of regions and communities.
In urbanized areas, the time dedicated to travel
and the costs of owning, maintaining and
operating cars make up a significant portion of
each household’s available resources. The use
of these resources and the cost of congestion
have an impact on disposable income and
economic productivity.
Optimizing the functionality of the
transportation system relies on efficient use
of the capacity of the transportation network,
creating the opportunity for walking, transit
use, cycling and carpooling, and building
communities with a mix of uses and densities
that are conducive to all of these types of
travel. Historically, the Atlanta region has
pursued growth with few considerations for
optimizing transportation efficiency or choice.
The incredibly rapid expansion of the regional
footprint over the past thirty years has
continued to overwhelm the regional roadway
network. On average, Metro Atlantans drive
30.2 miles per day 1 and 83% of all trips are
made by automobile. 2 At the same time, the
forces behind the region’s growth have led
to an abiding orientation toward new jobs,
investment and growth in population in the
urban centers of the region.
Midtown is experiencing the benefits of a
national demographic shift and other market
forces. After peaking in 2004, vehicle miles
traveled (VMT) per capita in the U.S. has
been steadily decreasing. This trend is led
by Generation Y. Young people are driving
less, increasing their use of transportation
alternatives, living in walkable communities, and
are driven by environmental concerns. 3
TRANSPORTATION GOALS
• Improve access and mobility to,
from, and within Midtown
• Decrease single-occupancy vehicle
(SOV) trips to, from, and within
Midtown
• Reduce vehicle miles traveled
1 2011 Transportation Fact Book. Atlanta Regional Commission. 2 Regional Travel Survey Final Report, November 2011. Atlanta Regional
Commission.
3Transportation and the New Generation: Why Young People are Driving Less and
What it Means for Transportation Policy. Frontier Group and U.S. PIRG Education
Fund. April 2012.
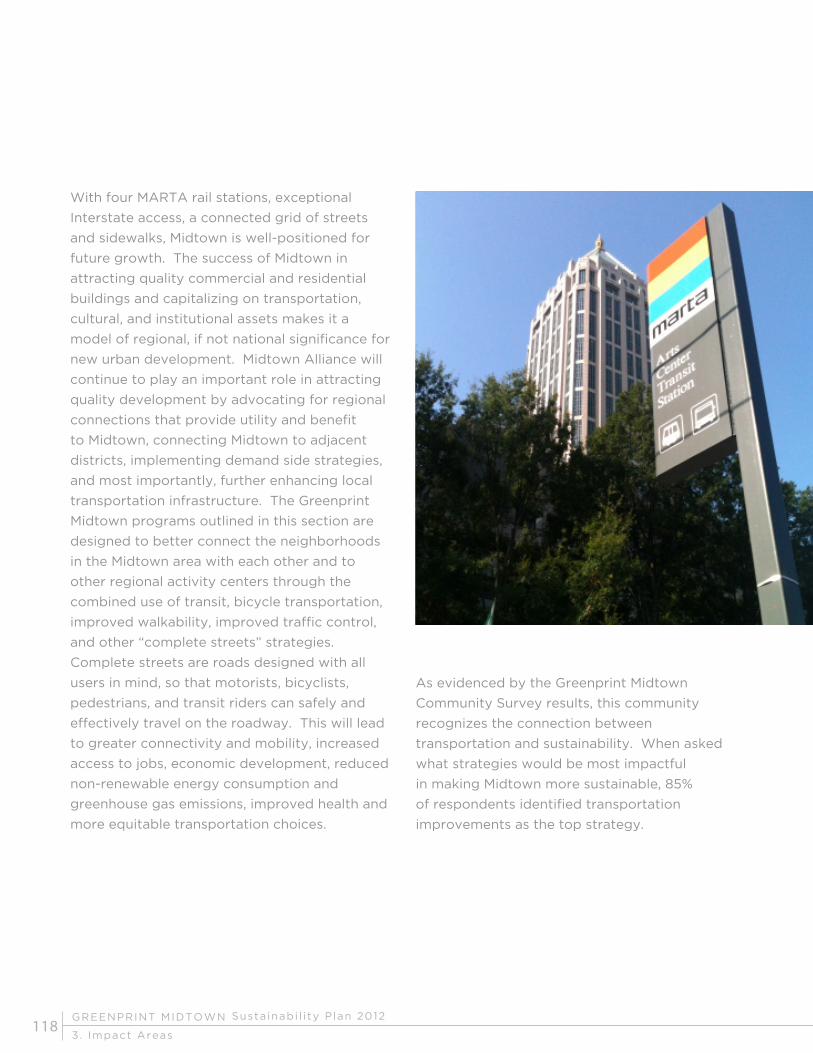
GREENPRINT MIDTOWN
3. Impact Areas
Susta inabi l i ty P lan 2012118
With four MARTA rail stations, exceptional
Interstate access, a connected grid of streets
and sidewalks, Midtown is well-positioned for
future growth. The success of Midtown in
attracting quality commercial and residential
buildings and capitalizing on transportation,
cultural, and institutional assets makes it a
model of regional, if not national significance for
new urban development. Midtown Alliance will
continue to play an important role in attracting
quality development by advocating for regional
connections that provide utility and benefit
to Midtown, connecting Midtown to adjacent
districts, implementing demand side strategies,
and most importantly, further enhancing local
transportation infrastructure. The Greenprint
Midtown programs outlined in this section are
designed to better connect the neighborhoods
in the Midtown area with each other and to
other regional activity centers through the
combined use of transit, bicycle transportation,
improved walkability, improved traffic control,
and other “complete streets” strategies.
Complete streets are roads designed with all
users in mind, so that motorists, bicyclists,
pedestrians, and transit riders can safely and
effectively travel on the roadway. This will lead
to greater connectivity and mobility, increased
access to jobs, economic development, reduced
non-renewable energy consumption and
greenhouse gas emissions, improved health and
more equitable transportation choices.
As evidenced by the Greenprint Midtown
Community Survey results, this community
recognizes the connection between
transportation and sustainability. When asked
what strategies would be most impactful
in making Midtown more sustainable, 85%
of respondents identified transportation
improvements as the top strategy.
3. Impact Areas 119
4 U.S. Department of Transportation, Bureau of Transportation Statistics; Table
4-4: U.S. Energy Consumption by the Transportation Sector. http://www.bts.gov/
publications/national_transportation_statistics/html/table_04_04.html5 National Conference of State Legislatures; Transportation Energy for the Future:
A Guide for Policymakers. http://www.ncsl.org/issues-research/energyhome/
transportation-fuels-report.aspx
6 Center for Transportation and the Environment; 14th Street Bridge Construction
Mitigation and Employee Travel Survey Technical Report, 2009.7 The Clean Air Campaign. Metro Atlanta’s State of the Commute: 2010 Metro
Atlanta Regional Commuter Survey. The Clean Air Campaign, State of the Com-
mute. http://www.cleanaircampaign.org/Your-Air-Quality-Transportation/State-
of-the-Commute
CHALLENGES AND OPPORTUNITIES
Midtown Alliance’s role in regional transportation decision-making and stewardship of the local trans-
portation network presents a few challenges and opportunities. Transportation is a topic that has
numerous economic, environmental and quality of life implications. A meaningful response to these
challenges will result in a transportation system that provides improved energy security and price
stability, environmental quality, health and well-being for community members, and economic effi-
ciency. The challenges within those topic areas are highlighted below.
TRANSPORTATION ENERGY
Transportation energy efficiency is a vitally important component of sustainability because it typi-
cally makes up more than 30% of a region’s total energy use. 4 Heavy reliance upon individually-
owned, petroleum-powered vehicles has numerous problems and side effects. Petroleum is a finite
natural resource that is not renewable. There is a significant amount of science and recent trends in
worldwide oil production that indicate we are at the all-time peak of worldwide oil production. This
is particularly troubling for the United States, which imports more than half of its oil from other coun-
tries. While there is some growth in electric and CNG powered vehicles, oil provides over 95% of our
transportation fuel and is a vital component of every other sector of the economy from agriculture to
industry. 5 The availability and price of oil will be extremely uncertain as the next decades unfold.
Strategies that emphasize reductions in VMT and adoption of transportation alternatives can help to
mitigate this challenge. Midtown presents one of the best opportunities to continue to push for sup-
plying the right type of multimodal infrastructure and transit services and raising awareness about
the importance of behavioral change. The feedback gleaned from the public during the Greenprint
Midtown planning process demonstrates their understanding and desire to move towards more en-
ergy efficient mobility options.
ENVIRONMENTAL AND HEALTH IMPACTS
Despite the relatively high level of transit, walking, and bicycling access in Midtown, approximately
two-thirds of Midtown employees commute via single occupancy vehicle. 6 As a region, the drive
alone rate is significantly higher at 82%. 7 Our travel choices contribute significantly to the region’s
air quality, public health, and other environmental concerns. The Atlanta region has one of the worst
traffic congestion and highest VMT rates in the country. Our reliance on vehicular travel results in the
release of greenhouse gas (GHG) emissions, which contribute to climate change and the formation of
harmful ground-level ozone. In Metro Atlanta, half of all smog-forming emissions come from auto-

GREENPRINT MIDTOWN
3. Impact Areas
Susta inabi l i ty P lan 2012120
mobiles. 8 In 2011, Metro Atlanta exceeded federal ozone standards on forty (40) days and standards
for particulate matter on three (3) days. 9
From a health standpoint, poor air quality can lead to, or exacerbate, asthma and other respiratory
conditions as well as serious cardiovascular issues. Populations most at risk are young children, the
elderly, and those with existing respiratory, heart, or cardiovascular conditions. Atlanta was ranked
24th worst out of 100 cities in the 2012 Asthma Capitals report published annually by the Asthma
and Allergy Foundation of America.
In addition to poor air quality, motor vehicles also contribute to polluted streams and rivers. As
vehicles are driven, they leave behind oil, antifreeze, grease, and metals on streets, which eventu-
ally can be swept into and contaminate the water supply. Vehicles also contribute to noise pollution
which not only can damage your hearing but can also contribute to increased anxiety, nausea, head-
aches, emotional instability, and elevated blood pressure. Creating a more sustainable transportation
network will reduce air, water, and noise pollution, lead to cleaner air, and a promote a better quality
of life for Midtown residents, employees and visitors.
ECONOMY AND PRODUCTIVITY
The time and money spent on transportation in the Atlanta region has negative effects on our econ-
omy and our productivity. While Midtown has one of the lowest transportation costs in the region as
a percent of average median income at 14%, as a region we spend a significant amount of our income
on transportation. 10 The 2011 Urban Mobility Report by the Texas Transportation Institute estimated
the amount of gasoline wasted while automobiles idle in traffic congestion. In the 439 urban areas
studied, 1.9 billion gallons of fuel were wasted in 2010 by cars sitting in traffic. The urban areas with
populations greater than 3 million accounted for 1.6 billion gallons of wasted fuel, almost 70% of the
total. In Atlanta this totaled over 53 million gallons of wasted fuel. 11
Traffic congestion also contributes to reduced productivity. In the same 2011 study, the Texas Trans-
portation Institute estimated that Atlanta wasted almost $2.5 billion in time and fuel due to traffic
congestions. The average annual cost per auto commuter in Atlanta was $924.
The cost of healthcare to treat illnesses and conditions due to poor air quality can also have a nega-
tive effect on our local economy.
Shifting even a small portion of motorists to transit, bicycling, or walking will result in large reduc-
tions in wasted fuel. Expanding and improving the transportation options for Midtown residents will
generate economic savings for travelers and businesses.
8 Exceedances of Federal Air Quality Standards 2011, Ambient Monitoring Pro-
gram. Georgia Department of Natural Resources, Environmental Protection Divi-
sion, Air Protection Branch. http://www.georgiaepd.org/air/amp/
10 Center for Neighborhood Technology, H+T Affordability Index, 2008. 11 Texas Transportation Institute, 2011 Annual Urban Mobility Report. http://mobil-
ity.tamu.edu/ums/

3. Impact Areas 121
MIDTOWN TRANSPORTATION ASSETS
Considering the size of the area of the core business district, Midtown has a set of transportation as-
sets that could be the envy of other large communities. The availability of transportation capacity
and choice, largely due to the Interstate system and MARTA rail service, has fueled and supported
the high-density growth in the recent past. The capacity of the system as a whole can support sig-
nificantly more growth. The following list and maps show the existing key components of Midtown’s
multimodal network:
MARTA Rail Transit - 4 transit stations including Arts Center, Midtown, North Avenue and Civic Cen-
ter Station
MARTA Bus – 10 local fixed bus routes
Regional and Express Bus Service - provided by Cobb Community Transit, Georgia Regional Trans-
portation Authority and Gwinnett County Transit
Circulator and Shuttle Service - operated by Georgia Tech, Atlantic Station, Emory University and Sa-
vannah College of Art and Design
Sidewalks - exist on almost all streets, many with extensive streetscape improvements
Bicycle Facilities - including striped lanes, shared facilities, and racks for parking
Transportation Demand Management Programs - a program of Midtown Alliance
Zipcar - 34 cars available for sharing
Electric Vehicle Charging Stations – 6 charging locations available for public or private electric ve-
hicles
Wireless Signalization and Active Management – 31 traffic signals currently being transitioned to
wireless communications. In addition, new signal timing plans will be deployed; signal and detector
equipment upgraded; and signals will be actively managed and maintained.

GREENPRINT MIDTOWN
3. Impact Areas
Susta inabi l i ty P lan 2012122
Transit

3. Impact Areas 123
Traffic Signals, Car share, EV Charging
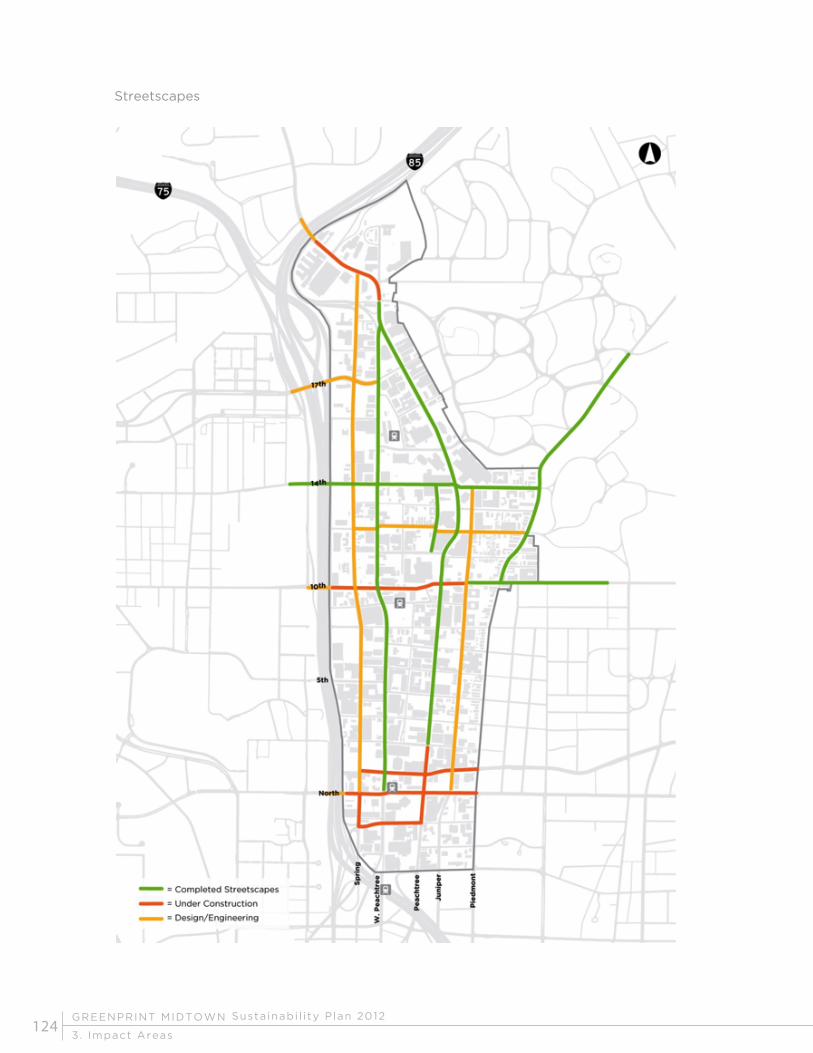
GREENPRINT MIDTOWN
3. Impact Areas
Susta inabi l i ty P lan 2012124
Streetscapes

3. Impact Areas 125
Bicycle Facilities

GREENPRINT MIDTOWN
3. Impact Areas
Susta inabi l i ty P lan 2012126
TRANSPORTATION STRATEGIES & PROGRAMS
Through the Greenprint Midtown planning process, the following Transportation strategies
were developed and served to guide the selection of both Tier 1 (priority) and Tier 2 programs/
projects. In the future, additional programs and projects can be developed from these strategies.
STRATEGIES
TS1: Promote the use of non-motorized transportation through physical improvements in the
public right-of-way.
TS2: Increase the attractiveness of existing transit service through station area enhancements,
technology tools, wayfinding, and multimodal connections.
TS3: Facilitate the use of alternatively fueled vehicles.
TS4: Maximize safety and accessibility for all travelers in Midtown.
TS5: Reduce VMT by optimizing the mix of housing and jobs.
TS6: Increase the adoption of transportation alternatives through demand-side strategies.
TS7: Improve regional access and mobility by pursuing new transit connections to adjacent
districts and activity centers.
TIER 1 PROGRAMS/PROJECTS
The following Tier 1 programs and projects were identified as priorities and are described in more
detail in the next section.
TP1: Streetscape Program Implementation
TP2: Bicycle Plan Implementation
TP3: Enhanced Transportation Demand Management
TP4: Improved Local Transit and Coordinated Shuttle Services

3. Impact Areas 127
TIER 2 PROGRAMS/PROJECTS
The following Tier 2 programs and projects were identified as potential future initiatives and are
briefly described below.
TP5: Land Use Policies - Travel behavior, especially the choice of how you get from place to place,
is significantly affected by land use, urban design, the scale of the street network, and the
pedestrian environment. While these topics are long-standing considerations in Midtown, there
is the need to reassess the land use and density policies in Midtown.
TP6: Parking Management – This program includes exploring the feasibility of implementing off-peak
on-street parking on Peachtree Street to provide an additional buffer for pedestrians and to
encourage retail. It also calls for pursuing the development of a smartphone application that
provides users with information on parking availability and cost in Midtown.
TP7: Carsharing - It is important to encourage collaborative consumption and the adoption of clean,
cost affordable transportation options by supporting the expansion of car sharing. Car sharing
programs tend to reduce overall vehicle miles of travel and can help to reduce parking demand.
This program calls for Midtown Alliance to identify opportunities with Zipcar or another
carsharing company for ways to increase the use and accessibility of this service.

GREENPRINT MIDTOWN
3. Impact Areas
Susta inabi l i ty P lan 2012128
TIER 1 TRANSPORTATION PROGRAMS
TP1: STREETSCAPE PROGRAM IMPLEMENTATION
Description
Midtown is considered by many to be the most
pedestrian friendly community in Atlanta. Creat-
ing a safe, attractive, accessible, and connected
pedestrian environment has been a high prior-
ity for Midtown Alliance over the last fifteen
years and will continue to be for the foreseeable
future. Wide, tree shaded, and well lit sidewalks
encourage residents and workers to take trips
by foot rather than by car. This provides an
environment that supports community interac-
tion, physical activity, and easy access to lo-
cal businesses. While Midtown Alliance has an
aggressive capital improvements program that
has led to more than $40 million in streetscape
improvements, additional capital projects have
been identified but still have not been complet-
ed or funded. This provides new opportunities
to make those projects more multi-modal and
more sustainable.
To fully realize the goal of creating a world-class
pedestrian environment, Midtown Alliance should
continue to implement Midtown’s comprehen-
sive Capital Improvements Program to renovate
priority corridors into “complete streets” with
improved and more sustainable infrastructure;
execute small site specific projects that improve
pedestrian safety, accessibility and connected-
ness; and incorporate “green” standards into
streetscape design, materials, and maintenance.
These initiatives are described in more detail on
the following page:
3. Impact Areas 129
CONTINUE TO EXECUTE CAPITAL CORRIDOR PROJECTS
As shown in the Streetscape Asset Map, Midtown Alliance to date has completed over fourteen miles
of streetscape projects and identified an equivalent amount that has yet to be improved. Sidewalks
are designed to meet minimum width requirements as defined in Midtown’s Special Public Interest
(SPI) zoning codes and will be buffered from vehicular traffic wherever possible with trees, landscap-
ing, and energy efficient lights. Additionally, sidewalks will provide pedestrian amenities such as
benches, transit stops, bike racks, and waste/recycling receptacles wherever possible. Intersections
will be designed to have the shortest possible street crossing distances through curb extensions or
“bump outs.” Channelized right turns will be eliminated when possible to improve pedestrian safety.
All intersections will have clear crosswalk markings, handicap accessible curbs, energy efficient traf-
fic signals, and countdown-style pedestrian signals.
A “complete streets” approach will be used to consider all users of a street. Within the roadbed,
transit service, bike lanes, and parallel parking will all be considered along with traffic mobility and
accessibility. As Midtown Alliance and the Midtown Improvement District set priorities for future
streetscape projects, the following should be considered when developing criteria:
• Access to MARTA rail stations
• Connections across the Interstate
• Core and secondary bicycle connections
• Access to parks and plazas
• Pedestrian, cyclist, and vehicular safety

GREENPRINT MIDTOWN
3. Impact Areas
Susta inabi l i ty P lan 2012130
Table 1 shows the status of potential future streetscape projects.
STREET TYPE EXTENTS
Funded (Design & Construc-
tion)
Juniper Street Streetscaping North Avenue to 14th Street
Funded (Design/Local Match
Only)
12th Street Ped/Bike Improvements Sprint Street to Piedmont Avenue
Spring Street Streetscaping 14th Street to Peachtree Street
17th Street Bridge Streetscaping Spring Street to 17th Street off-ramp
North Avenue Streetscaping Piedmont Avenue to Williams Street
10th Street Bridge Streetscaping Williams Street to 10th Street ramps
Unfunded Projects
Piedmont Avenue Ped/Bike Improvements North Avenue to 10th Street
Peachtree Street Bridge Streetscaping Buford Highway ramp to Amtrak Sta-
tion
15th Street Extension New roadway and side-
walks
Williams Street to Peachtree Street
Arts Center Station Area Ped Improvements 16th St, Arts Center Way
West Peachtree Street Streetscaping 12th Street to 14th Street
Spring Street Streetscaping North Avenue to 14th Street
8th Street Streetscaping Peachtree Street to Juniper Street
5th Street Streetscaping West Peachtree Street to Juniper
Street
Peachtree Street Streetscaping North Avenue to Pine Street
Civic Center Station Area Ped Improvements Linden Ave, Pine St, West Peachtree
St
Cypress Street Ped Improvements Peachtree Place to 3rd Street
Peachtree Walk Ped Improvements 13th Street to 11th Street
Peachtree Place Ped Improvements Williams Street to Peachtree Street
13th Street Ped Improvements West Peachtree Street to Piedmont
Avenue
11th Street Ped Improvements West Peachtree Street to Crescent
Avenue

3. Impact Areas 131
SITE SPECIFIC PROJECT IMPLEMENTATION
Midtown Alliance recognizes the need to address smaller site specific issues in the pedestrian en-
vironment in addition to large corridor improvements. To that end, Midtown Alliance has created
a budget line item for projects of this nature. Gaps in the sidewalk and bicycle network, poor qual-
ity sidewalks, inadequate crosswalk striping, and missing ADA ramps and pedestrian signals will be
identified and remedied. Priority will be placed on unsafe and egregious conditions as well as con-
necting to parks, plazas, and to MARTA rail stations.
Update Streetscape Design, Materials, and Maintenance Manual with Green Standards
A well-designed streetscape program has the potential to optimize lifecycle and performance, re-
duce carbon emissions, minimize the urban heat island effect, reduce light pollution, improve storm-
water quality, reduce waste, and improve human health. To this end, Midtown Alliance will revise its
Streetscape Design Manual to incorporate “green” standards for streetscape and pedestrian im-
provement projects. The development of updated standards will consider the following:
• Sustainable Materials – materials such as pavement and pavers, fencing, and street furniture
should be of high quality, durable, and made from recycled materials where possible.
• Tree and Landscape Best Practices – streetscape plantings should employ a variety of spe-
cies that are adaptive and resistant to drought, disease, and urban pollution
• Energy Efficient Fixtures – utilize high efficiency light fixtures (see Energy Impact Area for
details), traffic signals, pedestrian signals, and other fixtures to reduce energy use
• Stormwater – streetscape projects should minimize the quantity of stormwater entering At-
lanta’s combined sewers through design treatments and plant materials such as bio-swales
in order to improve water quality and reduce flooding (see Water Impact Area for details)
• Light Pollution – light pollution can interfere with views of the night sky and stars. It affects
wildlife, and can create unsafe conditions for motorists and pedestrians through increased
glare. Consideration should be given to light fixtures that minimize light spillage.
Midtown Alliance will continue to be the primary implementer of streetscape projects -- applying for
funding and executing capital improvements – in partnership with the Midtown Improvement District
and its government partners at the city, state and federal level. Midtown Alliance will:
1. Implement Midtown’s comprehensive Capital Improvements Program to renovate all prior-
ity corridors into “complete streets” with improved and more sustainable infrastructure and
materials.
2. Execute small site specific projects that improve pedestrian safety, accessibility, and con-
nectedness by filling gaps in the sidewalk network, fixing poor quality sidewalks, adding
crosswalk striping, and installing ADA ramps and pedestrian signals.
3. Update Streetscape Design Guidelines and educate the development community on what
has changed.
4. Track and measure progress against baselines.
GREENPRINT MIDTOWN
3. Impact Areas
Susta inabi l i ty P lan 2012132
IMPACT
Environmental Impact: When streets are more pedestrian and bike friendly, people are more likely to
leave their cars at home, which leads to less air polluting vehicular emissions. In addition to filtering
air pollutants and producing oxygen, streets that include significant trees and landscaping also help
to absorb and filter stormwater.
Community Impact: Sidewalks and bicycle facilities allow for an active lifestyle and encourage physi-
cal activity, 12 which inevitably leads to improved public health. Improved facilities provide for in-
creased opportunities for community interaction and social cohesion. Sidewalks encourage more
“eyes on the street” and can help to minimize crime.
Economic Impact: Sidewalks, a key component of walkable communities, add monetary value to a
community. Studies show that properties in walkable communities experience higher values and
income than properties locate in a poor walking environment. 13 Retail shops and services providers
in Midtown also benefit from increased foot traffic in the District.
POTENTIAL PARTNERS & RESOURCES
• City of Atlanta – the City provides input on setting priorities through its Connect Atlanta
Plan, helps to identify funding, and approves all streetscape plans
• Georgia Department of Transportation (GDOT) – GDOT controls right-of-way on a number of
street segments in Midtown and has approval authority for most federally funded projects
• Atlanta Regional Commission – develops regional growth and transportation policies, priori-
tizes projects, and awards and manages funding for transportation projects.
12 Eyler, A.A., Brownson, R.C., Bacak, S.J., & Housemann, R.A. (2003). The epidemi-
ology of walking for physical activity in the United States. Medicine & Science in
Sports & Exercise, 35(9), 1529-1536.13 Pivo, G. and Fisher, J. (2009) Effects of Walkability on Property Values and
Investment Returns. Working Paper. Responsible Property Investing Center,
Boston College and University of Arizona; Benecki Center for Real Estate Studies,
Indiana University.

3. Impact Areas 133
COSTS & POTENTIAL FUNDING
Midtown Alliance has leveraged funding from the Midtown Improvement District for a total invest-
ment of $40 million to develop fourteen miles of new sidewalks. This includes projects that have
been completed, are currently under construction, or are funded but not yet under construction. The
remainder of the streetscape program is estimated to cost an additional $40 million. Historically, the
Midtown Improvement District has allocated a local match, typically 30% of the cost of the project,
to use against a potential federal or state grant to implement the project. Given the uncertainty of
federal, state, and local funding, Midtown Alliance with the Midtown Improvement District will need
to set priorities for the Streetscape program. The program outlined above can be accomplished with
existing staff resources.
CHALLENGES & POTENTIAL SOLUTIONS
Challenge: Capital improvements are costly, complex, and typically take a long time to implement.
Given the increasingly competitive environment for limited transportation funding along with the
significant amount of funding that has already been awarded to the Midtown district, future govern-
ment funding is expected to be a significant challenge. Additionally, most of the regionally signifi-
cant corridors in Midtown have already been renovated and many of the remaining street and sidewalk
improvements are on local connector streets, which are a lower priority for government funders.
Potential Solution: If deemed a priority, the Midtown Improvement District could choose to fund the full
costs of projects. Also, the new Federal transportation bill, MAP-21, may offer new opportunities to fund
projects from funding categories that were previously not available.
TRACKING & MEASUREMENT
METRIC/INDICATOR BASELINE TARGET
Streetscape Program Implementation
Miles of streetscape renovated 14 21 by 2018
Number of pedestrians/cyclists in key cor-
ridors
To be established 10% increase by 2018
Revised Streetscape Design Guidelines N/A 2013

GREENPRINT MIDTOWN
3. Impact Areas
Susta inabi l i ty P lan 2012134
TP2: BICYCLE PLAN IMPLEMENTATION
Description
The City of Atlanta has experienced a 386 per-
cent increase in the number of people riding
their bicycles to work between 2000 and 2009.
This major increase in bicycle riding is clearly evi-
dent in Midtown and the area is well-positioned
for even greater increases. The Midtown core
is surrounded by a number of neighborhoods
and the Atlanta BeltLine, is directly adjacent to
Georgia Tech, and is at the heart of a significant
amount of activity that is within easy cycling
distance. When planning bicycle networks and
supporting infrastructure such as places to park,
it is important to take into account that not all
cyclists have the same skills and confidence to
navigate busy streets in an urban context. It is
also important to think of the different purposes
for cycling and the best ways to accommodate
them in a safe and inviting way. Many commut-
ers rely on or choose to ride bicycles to work.
Other users ride occasionally or for recreation. The long term goal is to have a complete network of
on-street bicycle lanes that provide space for north-south and east-west travel. Connections over
the Interstate are challenging but key to a well-designed system. This primary network will be on the
major streets of Midtown, those that the City of Atlanta has designated as Core Bicycle Connections.
The City of Atlanta will soon develop detailed concepts and funding strategies for two Core Bicycle
Connections in Midtown (West Peachtree Street and 10th Street) through its Cycle Atlanta 1.0 study.
Where there is not room for bicycle lanes or where lanes are not needed on minor streets, “sharrows”
and other signing and striping techniques will be utilized.

3. Impact Areas 135
Midtown Alliance will continue to take a leader-
ship role in identifying needs for new bicycling
infrastructure and implementing projects that
build out the bicycling network. Planning, fund-
ing, and contractual arrangements will include
partnerships with the City of Atlanta, the Geor-
gia Department of Transportation, and other
agencies that maintain and operate elements
of the local transportation system. Midtown
Alliance will:
1. Participate in Cycle Atlanta 1.0 and the feasibil-
ity study of an Atlanta bike share program and
consider funding a pilot program in Midtown;
2. Consider specific opportunities for and imple-
ment protected, striped, and buffered facilities
to address safety concerns;
3. Design and construct a bicycle facility network
with a focus on connecting existing bicycle fa-
cilities to new facilities within Midtown, as well
as connecting to MARTA rail stations, adjacent
districts, and the Atlanta BeltLine;
4. Apply for and organize funding to execute
capital improvements; and
5. Measure and track progress against baselines.
BICYCLE LANES AND ROUTES
Midtown Alliance will continue to lead the devel-
opment and implementation of specific projects
that incorporate facilities and roadway design
treatments that balance the needs of bicyclists
with motorists and pedestrians. The priority cor-
ridors include Juniper Street, Piedmont Avenue,
Peachtree/West Peachtree Street, 12th Street,
and 10th Street. The existing and planned bi-
cycle facilities are shown in figure X. Midtown
Alliance has put together a concept plan for a
comprehensive bicycle network as shown in fig-
ure x. The following are specific proposals that
may need additional study for feasibility, but are
the most pressing priorities within the network:
Juniper Street from 14th Street to North Avenue
Upcoming improvements to Juniper Street, a
key one-way arterial southbound, are funded by
money allocated by the Atlanta Regional Com-
mission as part of the Livable Centers Initiative.
This project calls for a reduction of travel lanes
and construction of 10’ wide sidewalks with a 5’
furniture zone, crosswalks, and a southbound
bike lane and on-street parking where possible.
In addition to adding needed transportation
facilities, the project will implement green infra-
structure strategies. Project details include:
• Protected/buffered southbound bike lane for
entire length of project, which may include
mountable concrete median or granite curbing
with intersection plantings
• Bike turning facilities (a.k.a. bike boxes) at key
intersections: 14th, 12th, 10th, 5th, and Ponce de
Leon Avenue
GREENPRINT MIDTOWN
3. Impact Areas
Susta inabi l i ty P lan 2012136
10th Street from Monroe Drive to Piedmont Avenue
This project seeks to connect the Eastside Trail
of the BeltLine to the core of Midtown with a
barrier separated two-way cycle track adja-
cent to Piedmont Park on the north side of 10th
Street. This project would provide exceptional
bicycle access to the heart of Midtown through a
safe and inviting facility. This would require the
removal of one lane of traffic.
Spring Street from Peachtree Street to
North Avenue
Midtown Alliance will investigate the potential
for adding bicycle facilities on Spring Street
in addition to enhancing or expanding the pe-
destrian realm with streetscape improvements.
The corridor presents a set of challenges due
to existing buildings being near or on the right-
of-way, relatively narrow sidewalks, lack of
landscape and lighting, narrow travel lanes, and
high volumes of traffic. Bicycle lanes on Spring
Street would provide the companion southbound
facilities to the lanes that currently exist on West
Peachtree Street. Recent traffic studies of the
corridor show that one travel lane can be re-
moved on Spring Street between 10th Street and
14th Street without degrading vehicular level of
service and that additional right-of-way exists
between 18th Street and Peachtree Street. The
section of Spring Street between 14th Street
and 18th Street has yet to be studied but pres-
ents significant challenges due to the high vol-
ume of traffic during peak periods. Connecting
Peachtree Street to 10th Street via Spring Street
would fix a critical gap in Midtown’s bicycle
network. If the Peachtree connection is not pos-
sible, 17th Street would be a logical terminus for
the facility. Bike facilities between 10th Street
and North Avenue may not be feasible due to
existing traffic, although connecting to 5th Street
and Georgia Tech is an important consideration.
Project details include:
• Add on-street bicycle lane, if feasible, to con-
nect to existing and planned east-west facilities
• Requires re-striping Spring Street with three
travel lanes and turn lanes at select locations
West Peachtree Street from North Avenue
to 17th Street
Midtown Alliance will explore three alterna-
tives for improving bicycle facilities on West
Peachtree Street. The first option is to keep
the existing facility which currently terminates
at 12th Street and extend it to 17th Street. This
would make the most sense in the long term
if a bicycle lane were determined feasible on
Spring Street. The second alternative would be
to re-stripe West Peachtree Street and install
a two-way protected cycle track, which would
require taking a travel lane. The third alternative
is to remove on-street parking on the east side
of West Peachtree Street to accommodate the
width of the protected cycle track. This option
would result in the removal of the existing bulb
outs and necessitate a reconfiguration of storm-
water drainage. The extension to 17th Street for
any of the alternatives would require a solution
for providing continuity of facility through the
14th Street intersection. Project details include:
• Extended bicycle lane from 12th Street to
17th Street
• Bicycle turning lanes at 3rd, 5th, 10th, 14th,
17th Streets

3. Impact Areas 137
• Consider a two-way cycle track from North
Avenue to 10th Street or 17th Street
• Mainline and side street approach signing and
markings for operational safety if two-way
cycle track is implemented
Piedmont Avenue from North Avenue to 14th Street
Piedmont Avenue is currently a one-way north-
bound facility with two travel lanes and on-street
parking on both sides of the street. By adding
a bicycle facility to Piedmont Avenue, you are
able to complement the southbound facility on
Juniper Street. Adding a bicycle lane would
eliminate off-peak parallel parking on the east
side of the road. This facility would connect to
the popular 5th Street bicycle facility. Project
details include:
• Protected/buffered northbound bike lane on
east side of roadway
• Potential sharrows at intersections where extra
turning capacity is needed
• Bicycle turning lanes at 10th Street and 14th
Street
Peachtree Street from North Avenue to Spring Street
Even though the roadway is spatially constrained
and traffic volumes are unlikely to support dedi-
cated bike lanes, Peachtree Street will always
remain an intuitive bicycle connection through
Midtown. As such, bike facilities should be con-
sidered in some form for Peachtree Street. Mid-
town Alliance will continue to investigate options
that may include advisory bike lanes (dashed/
striped areas within existing vehicular lanes that
heighten driver awareness towards cyclists) or
sharrow markings on Peachtree. Opportunities
also exist for connecting Peachtree Street with
existing dedicated bike lanes on Peachtree Circle
through Ansley Park. However, no viable south-
ern connection exists to Peachtree Street or 14th
Street.
12th Street from Piedmont Avenue to west of
Downtown Connector
12th Street is envisioned as an important bicycle
and pedestrian corridor connecting western Mid-
town to Piedmont Park and the Atlanta BeltLine.
Several large developments are currently under
construction in this corridor including 650 new
residential units. The long-term vision for this
corridor includes a new bike/pedestrian bridge
over the Interstate that would tie into exist-
ing greenspace adjacent to Turner Broadcast-
ing Systems, Home Park, and Georgia Tech. A
streetscape project is currently under design to
include bike facilities at the intersection of Pied-
mont Avenue and 12th Street.
• Bicycle lanes or shared lanes
• Potential overpass of Downtown Connector
Ponce De Leon Avenue from West Peachtree
Street to Piedmont Avenue
The streetscape project currently underway on
Ponce De Leon Avenue includes sharrow striping
between West Peachtree Street and Piedmont
Avenue. The City of Atlanta has funding through
the Atlanta Regional Commission’s LCI program
to extend this facility further east with dedi-
cated bike lanes between Piedmont Avenue
and the BeltLine/Ponce City Market on Ponce
De Leon Avenue.

GREENPRINT MIDTOWN
3. Impact Areas
Susta inabi l i ty P lan 2012138
SECONDARY BICYCLE FACILITIES
Midtown Alliance will assist with expertise, analy-
sis and implementation of specific policies and
programs to support cycling. These include, but
are not limited to secondary facilities and ame-
nities such as bicycle parking, shower facilities,
and better access to buildings. The bicycle and
transportation provisions in the Midtown Spe-
cial Public Interest Zoning District (SPI) should
be updated to include best practices for bicycle
access and parking. Bicycle parking is needed
in private parking facilities, public parking areas,
and on street. In addition to the SPI update,
the streetscape program will be assessed for its
success in providing bicycle parking and best
practices will be identified. Current and future
projects will include the recommended best
practices for parking.
BICYCLE SHARING PROGRAM
Bicycle sharing programs allow users to check
out a bicycle from a bike share station for a small
fee and return the bicycle to any station around
the city or community in which the program is
implemented. Bike share programs are being
implemented in hundreds of cities worldwide
because they are a cost-effective, environmen-
tally friendly way to promote multi-modal travel.
Midtown Alliance will actively participate in city-
wide efforts to institute a bicycle sharing pro-
gram. A feasibility study of bike sharing is cur-
rently underway and Midtown Alliance is actively
participating as a stakeholder in the study. The
Greenprint Midtown process revealed the need
to identify the prospective target user groups
and consider the cycling conditions that exist
for those groups prior to further developing and
implementing the program. Many participants in
the Greenprint process thought that safer bicy-
cling facilities were needed prior to instituting a
bike sharing program. The casual, tourist, or rec-
reational user may be less likely to use bike shar-
ing due to current cycling conditions. Midtown
streets are busy, often lack bicycling facilities or
signed routes, and can be intimidating for novice
cyclists. However, there are a number of groups
of potential users that would have a reason to
take advantage of the service. The most obvi-
ous are commuters and students who have local
business to attend to, but have no bicycle or
have left their bicycle at home. Another group
would be residents who do not have a bicycle,
but are familiar with the territory.

3. Impact Areas 139
BICYCLE PARKING SUPPLY AND INVENTORY
There are a number of bicycle racks available in Midtown; however, there is demand for more. Mid-
town Alliance will continue to work with developers and existing building managers to provide new
racks and to continue to incorporate racks or secure parking opportunities into streetscape projects.
While many locations of bicycle parking are known by the general public, not all are. Midtown Alli-
ance will complete, and keep up to date, a bicycle parking inventory that will be available online.
GREENPRINT MIDTOWN
3. Impact Areas
Susta inabi l i ty P lan 2012140
IMPACT
Environmental Impact: People are more inclined
to travel by bicycle when adequate bicycle infra-
structure is available. When commuters choose
to bike to work or other destinations instead of
drive, the number of cars on the road is reduced,
along with harmful air pollutants from vehicle
emissions. This also reduces the consumption of
oil, a non-renewable energy source.
Community Impact: Bicycle facilities provide
opportunities for physical activity, improved
health, and community interaction. Improving
the quantity and quality of bicycle infrastructure
increases the safety of bicyclists on the roadway
and may lead to more people choosing to bike to
their destinations instead of drive. Bicycle lanes
also provide safety benefits on the roadway
network, improving site lines and the ability for
large vehicles to navigate turning movements
at intersections. Bicycle facilities and bicycle
sharing programs also facilitate greater com-
munity interaction by getting residents out of
their cars and interacting with their environment
and neighbors.
Economic Impact: Those who travel by bicycle
save money on gas, parking, car insurance, and
other inherent costs associated with owning
and driving a vehicle. More bicyclists instead of
motorists on roadways also decrease the cost
to the community by reducing the frequency
of road resurfacing projects. A bicycle-friendly
Midtown will attract destination riders who
are taking longer recreational trips to or from
Piedmont Park, the Atlanta BeltLine, and other
locations. This has obvious benefits for local
retail establishments.
IMPLEMENTATION PARTNERS & RESOURCES
1. City of Atlanta – provides policy and planning
direction for bicycle facilities.
2. Georgia Department of Transportation - GDOT
controls right-of-way on a number of street
segments in Midtown and has approval au-
thority for most federally funded projects.
COSTS & POTENTIAL FUNDING
The cost of bicycle facilities can vary consider-
ably. The most cost effective and expedient way
to put in bicycle lanes is to install them concur-
rent with roadway resurfacing or streetscaping
projects. Two-way cycle tracks can also be done
inexpensively, but may have added costs de-
pending on whether a physical barrier is in place.
Bicycle lanes can be extremely expensive to
install if they require moving curbs and relocat-
ing stormwater and other utility infrastructure.
These types of projects often do not pencil out
as standalone projects and tend to encroach on
the existing or potential pedestrian realm. Be-
cause of these factors, it is unlikely the approach
of moving curbs back will be taken in Midtown
to accommodate bicycle lanes. Bicycle signing
and parking are relatively inexpensive and not
typically cost prohibitive elements of imple-
menting complete facilities. The program out-
lined above can be accomplished with existing
staff resources.

3. Impact Areas 141
CHALLENGES & POTENTIAL SOLUTIONS
Challenge: In general, it is difficult to match grant funding with the installation of bicycle facili-
ties. There are not many programs that support this type of investment and it is difficult to con-
struct them as standalone projects. While standalone projects qualify under some Federal funding
programs, they have a lot better chance of getting funded if implemented concurrent with other
roadway improvement projects such as resurfacing, widening, or streetscape projects. Federal
transportation grant funding is available for streetscape projects, but it can take a long time to
secure, program, and administer these types of funds. Local funds dedicated to maintenance are
constrained and difficult to dedicate for bicycle lanes as well.
Potential Solution: Midtown Alliance has been successful in developing bicycle facilities by putting
project funds together from different sources, including the Midtown Improvement District. Since
many of the planned facilities are on the state system, Midtown Alliance will work with GDOT on identi-
fying workable concepts to figure out how to put facilities in place concurrent with larger projects.
Challenge: Since bicycle lanes often require narrowing or removing vehicle lanes, there is a natural
tension between the facility and the loss of width or capacity. Design standards and traffic engi-
neering practices are often employed to maximize the benefits for vehicles, without adequate con-
sideration of the needs of non-motorized users.
Potential Solution: In order to transcend these dynamics, Midtown Alliance will conduct traffic analy-
ses to determine the effect of new bicycle facilities and extensions where there is a potential loss of
vehicle capacity or operating conditions. While not all bicycle projects will need this level of attention,
it will be required to move certain projects forward.
TRACKING & MEASUREMENT
METRIC/INDICATOR BASELINE TARGET
Streetscape Program Implementation
Miles of streetscape renovated 14 21 by 2018
Number of pedestrians/cyclists in key cor-
ridors
To be established 10% increase by 2018
Revised Streetscape Design Guidelines N/A 2013

GREENPRINT MIDTOWN
3. Impact Areas
Susta inabi l i ty P lan 2012142
TP3 – ENHANCED TRANSPORTATION DEMAND MANAGEMENT
Description
As growth in Midtown and the region continues,
traffic congestion becomes a greater concern
for the employers, employees, and residents of
Midtown. In addition to the stress caused by
traffic congestion, a greater number of vehicles
in Midtown leads to increased vehicular emis-
sions, which adversely affect public health and
the environment. The importance of Transpor-
tation Demand Management (TDM) to the At-
lanta region is well documented in the State of
Georgia’s strategic transportation plan - IT3, and
ARC’s regional blueprint for growth - Plan 2040.
Plan 2040 projects that an additional 2.7 million
people will live in the region by 2040. With lim-
ited funds for new transportation infrastructure,
demand management is an increasingly impor-
tant tool for reducing congestion and VMT.
Because Atlanta is considered a non-attainment
area under the federal guidelines of the Clean Air
Act, the Georgia Department of Transportation
(GDOT) receives Congestion Mitigation and Air
Quality (CMAQ) funds to address the issue at a
local level via targeted programming designed
to provide congestion relief and air quality
improvements. 15 The Atlanta Regional Com-
mission (ARC) administers these funds through
their TDM division. 16 Midtown Alliance partners
with ARC to implement TDM strategies on a local
level in Midtown via a program entitled Midtown
Transportation Solutions (MTS). 17 The goal of
MTS is to decrease vehicle miles traveled (VMT)
primarily from commute trips.
This program focuses on increasing commuter
participation in the MTS program and incorporat-
ing more sustainability education into the current
infrastructure of the program. MTS encourages
the usage of alternative forms of transportation
in Midtown via education, incentive programs,
and employer-based marketing. While educat-
ing and assisting commuters is an important
component of the MTS program, the employer-
targeted approach typically yields the greatest
results by concentrating efforts at a higher level
to receive more widespread response to MTS
programming. Implementing a program, such
as telework, at the employer level potentially
achieves more VMT reduction than reaching out
to individual commuters one by one.
15 United States Department of Transportation, Federal Highway Administration;
Air Quality: Congestion Mitigation and Air Quality Improvement (CMAQ) Program
http://www.fhwa.dot.gov/environment/air_quality/cmaq/.16 Atlanta Regional Commission; Commute Options http://www.atlantaregional.
com/transportation/commute-options.17 Midtown Alliance; Transportation Solutions: Overview http://www.midtown-
alliance.org/MTS_overview.html.

3. Impact Areas 143
The current programs supported by MTS are as follows:
• Employer Programs:
- Discounted transit pass sales
- Alternative Work Arrangement consulting
- TDM program development
- Idle-Reduction consulting
- Measurement and reporting tools
- Recognition program
• Commuter Programs:
- Commuter Rewards – monetary incentives
- Bike/Walk Incentive
- Commuter recognition
- Online commute trip logging tool
- Ridematching service
- Guaranteed Ride Home
- Personalized Commute Planning
- Free Transit “try-it” passes
- Smog alerts
In addition to these existing programs, Midtown Alliance will consider implementing the following
additional programs/services to reduce VMT, improve access, and increase mobility:
• Outreach to Midtown Residents - Opportunities exist to conduct outreach to Midtown resi-
dents in addition to Midtown employers/employees. VMT can be decreased in the District
by encouraging commuting residents to either work from home more often or consider
alternative transportation options whenever possible.
• Non-Commute Trips - Midtown Alliance should consider additional strategies aimed at non-
commute trips. These strategies can target employees and residents.
• Revised Communications - More sustainability-focused messaging will be developed to edu-
cate the general public on the effects of vehicular emissions.
• Regulatory Assessment - The existing SPI zoning acknowledges the importance of TDM and
contains certain requirements to support reduced VMT, however, there are provisions that
need to be assessed for effectiveness and others that could be added.

GREENPRINT MIDTOWN
3. Impact Areas
Susta inabi l i ty P lan 2012144
IMPACT
Environmental Impact: By encouraging use of al-
ternative transportation, fewer cars will be on the
road on a daily basis during peak travel times;
therefore, vehicle emissions will be reduced as
a result. Vehicular emissions include nitrogen
oxides (NOx), which lead to ground-level ozone,
and particulate matter (PM). According to the
United States Environmental Protection Agency
(EPA), the greater Atlanta area is deemed non-
attainment for current standards of particulate
matter 18 and ozone 19. Successful implementa-
tion of this program will assist the Atlanta region
in achieving attainment status.
Economic Impact: On average in Atlanta, it is
estimated that individual commuters will save 50
cents per mile for every mile not driven. Addi-
tionally, local businesses can save on operating
and facilities costs by implementing cost-effec-
tive TDM programs. Participation in TDM strate-
gies often leads to improvements in workplace
productivity.
Community Impact: An effective TDM program
will educate the general public on alternative
transportation options in the District and raise
awareness of vehicular emissions as a contribut-
ing factor when it comes to air quality. Improved
air quality leads to increased public health, spe-
cifically for those that are sensitive to air pollu-
tion.
COSTS & POTENTIAL FUNDING
The majority of funding for Midtown Alliance’s
TDM program currently comes from a Conges-
tion Mitigation and Air Quality (CMAQ) grant
through the Atlanta Regional Commission. This
is a two-year grant (2012-2013) that is currently
limited to reimbursement of staff and limited
overhead costs and only those costs related to
specific regional programs and services. His-
torically, this grant required a 20% local match,
however, the current contract does not require
such a match. Expenses outside of this must be
paid for locally and the MID has been providing
that funding since the program began in 2001.
This program can be supported within existing
staffing levels.
18 EPA Map; PM-2.5 Nonattainment Areas (1997 Standard) http://www.epa.gov/
oar/oaqps/greenbk/map/mappm25.pdf. 19 EPA Map, 8-Hour Ozone Nonattainment and Maintenance Areas (1997 Stan-
dard) http://www.epa.gov/oar/oaqps/greenbk/map8hrnm.html.

3. Impact Areas 145
CHALLENGES & POTENTIAL SOLUTIONS
Challenge: Funding for non-staff costs are not allowable through the existing funding provided by
the Atlanta Regional Commission (ARC). Locally targeted marketing materials and incentives must
be funded by Midtown Alliance.
Potential Solution: By contributing local funding, Midtown Alliance has more freedom to expand the
current programs/services as outlined by ARC/GDOT.
TRACKING & MEASUREMENT
METRIC/INDICATOR BASELINE TARGET
Enhanced Transportation Demand Man-
agement
Commuters Registered in Commuter Re-
wards Program
11,171 15,000 by 2020
Vehicle Miles Reduced 58,594,065 80 million by 2020
Tons of air pollution reduced 46,416 62,524 by 2020
Money Saved from Fuel & Maintenance $29,297,032 $40 million by 2020

GREENPRINT MIDTOWN
3. Impact Areas
Susta inabi l i ty P lan 2012146
TP4 - IMPROVED LOCAL TRANSIT AND COORDINATED SHUTTLE SERVICES
Description
While Midtown’s transit access to adjacent
districts and regional activity centers is consid-
erable, there remain significant opportunities
to further enhance existing transit service and
better connect disparate systems. Somewhat
related, there also exist opportunities to improve
the utility and perception of existing transit ser-
vices in Midtown.
Two transit projects currently in the planning
phase could have a major impact on local and
regional connections and mobility. Cobb County
is currently studying a high capacity transit route
(bus rapid transit or light rail transit) from the
Acworth/Town Center area to Midtown. The
City of Atlanta is studying an east-west streetcar
route through Midtown that would connect the
Atlanta BeltLine to Midtown and MARTA rail via
North Avenue or 10th Street. Midtown Alliance is
supportive of these projects and is engaged with
the project sponsors.
Midtown Alliance will continue to identify, as-
sist in implementing, and promote strategic
improvements and additions to transit service
and infrastructure. Select priority transportation
improvements will be identified based on current
planning initiatives. Midtown Alliance will:
1. Continue to advocate for new transit solutions
that serve to improve connections to adjacent
districts and to the region.
2. Coordinate with local and regional transit
providers and other Midtown stakeholders to
undertake a transit circulation feasibility study.
3. Catalyze the development of a mobile transit
trip planning application and improve pedes-
trian-oriented wayfinding to increase ridership.
In addition to MARTA rail and local and re-
gional bus service, there are several privately
operated circulator shuttles that are available
to the public. However, these services are not
well integrated into the system. Midtown Alli-
ance will partner with the shuttle operators to
explore opportunities to enhance or expand on
the existing routes. A district level travel analy-
sis was conducted to better understand where
opportunities exist for new circulation routes.
Twenty-four districts were included in the trav-
elshed analysis, which determined the number
of people commuting to and from Midtown on
a daily basis for work trips and other trips that
start at home, such as shopping or entertainment
trips. For each variable mapped, the person
trips for the analysis districts were normalized by
dividing the person trips by the total acreage of
each district to achieve a trip density number of
trips per acre. This analysis identified a potential
opportunity to connect the Midtown Core with
the area east of Peachtree Street between Ponce
de Leon Avenue and 10th Street. This potential
need requires a deeper level of analysis through
a feasibility study.

3. Impact Areas 147
Efforts to create a more seamless and appealing local transit system are likely to result in higher
transit ridership. This could involve the creation of a mobile transit trip planner application that
provides schedule and real-time arrival and departure information for all transit services in Midtown.
This tool would need to be created through a regional partnership but should be advocated for by
Midtown Alliance. “Low tech” solutions should also be employed. Midtown Alliance will coordinate
with MARTA and the other transit service agencies to install thermoplastic sidewalk wayfinding ar-
rows that point pedestrians to MARTA rail stations. Sidewalk stickers implemented for this purpose
prior to the 1996 Olympics have since worn off or been replaced with new sidewalks.
GREENPRINT MIDTOWN
3. Impact Areas
Susta inabi l i ty P lan 2012148
IMPACT
Environmental Impact: In addition to walking and
bicycling, using transit for commuting and every-
day travel reduces the number of vehicles on the
roadway and the harmful environmental pollut-
ants they emit. The use of non-renewable re-
sources is also decreased by substituting a more
energy-efficient method of transportation.
Economic Impact: Greater use of circulator shut-
tle services and transit options in Midtown will
reduce the number of vehicles driving through
the area and thus, the amount of harmful air pol-
lutants, which affect respiratory health. The use
of transit also promotes walking and bicycling,
further promoting physical activity and improv-
ing health.
Community Impact: Improving transit access to
and within Midtown will allow for increase access
to destinations and points of interest in Midtown.
Both of these actions may draw more students,
faculty, staff and visitors to Midtown and better
support its retail and other businesses.
IMPLEMENTATION PARTNERS & RESOURCES
• Georgia Tech, Atlantic Station, SCAD and
Emory University - operate existing circulator
services and will be engaged in district-wide
discussions.
• MARTA – operates regional rail and bus service
• Atlanta Regional Commission - coordinates the
regions transit agencies through the Regional
Transit Committee and can help facilitate dis-
cussions about service gaps and service coor-
dination.
COSTS & POTENTIAL FUNDING
Expenses for this program include staffing costs,
consulting fees, and graphic design and print-
ing costs. The cost of the feasibility study and
service coordination strategy depends on the
extent to which outside consulting services are
used. The cost of partial to full support would
range from $25,000 to over $100,000 depend-
ing on the level of ridership analysis and fore-
casting that is included. The cost for additional
transit wayfinding would depend on the level
of complexity. A low-tech project to add new
sidewalk directional arrows would likely cost less
than $3,000 while a higher tech solution such as
“next bus” arrival LED displays would be signifi-
cantly more expensive. This program can be
supported within existing staffing levels.
Potential funding sources include the Midtown
Improvement District, the Atlanta Regional Com-
mission, MARTA, and the shuttle providers.

3. Impact Areas 149
CHALLENGES & POTENTIAL SOLUTIONS
Challenge: Working with a number of institutional stakeholders will require buy in and time commit-
ment by other staff. There is also the need to define the best way to make existing service open to
the public without compromising the primary user focus of service provision.
Potential Solution: Midtown Alliance will promote creative solutions to coordinating service that could
include potential route consolidation, cost sharing, and innovative marketing.
TRACKING & MEASUREMENT
METRIC/INDICATOR BASELINE TARGET
Improved Local Transit
Completed Transit Circulation Study N/A 2014
Implemented Transit App/Wayfinding N/A 2014
GREENPRINT MIDTOWN
3. Impact Areas
Susta inabi l i ty P lan 2012150
“You can tell how high a society is by how much of its garbage is recycled”
- Dhyani Ywahoo

3. Impact Areas 151
3.5 Waste
The quantity and makeup of Midtown’s waste
reflects its density and diversity of uses. On
a daily basis, Midtown generates a significant
amount of waste from office users, residents,
restaurants, hotels, hospitals, and construction
sites. Given the number of public and private
haulers, there is no easy way to quantify the
amount of waste generated in Midtown, nor
is there an easy way to identify how much
waste is being diverted from landfills due
to recycling, reusing, or composting. The
research conducted as part of Greenprint
Midtown shows that there are significant
individual, business, and building level efforts
currently taking place to reduce the amount
of waste sent to landfills. It also showed that
significant opportunities exist to further reduce
our waste stream by moving from traditional
solid waste management to sustainable solid
waste management.
Traditional methods of solid waste
management such as landfilling and
incineration are a cost to municipalities,
and can pose risks to human health and
the environment. Sustainable solid waste
management, however, addresses the value
and impacts of materials throughout its
full life cycle. This approach begins with
environmentally responsible acquisition of
materials, and source reduction. Materials are
then reused when at all possible, and lastly
recycled when a product has reached the end
of its useful life (see figure x). Sustainable
solid waste management practices would
recognize the inherent value of Georgia’s
waste stream.
A key component of a sustainable waste
management strategy is available markets for
recycled material. Home to major carpeting,
paper, and aluminum companies, Georgia has
one of the strongest markets in the U.S. for
recycled materials. However, due to Georgia’s
abundant landfill space and the relatively low
tipping fees (the cost per ton that landfills
charge to accept waste), the economics of
recycling can be challenging. Consequently,
Georgia municipalities collectively pay
more than $100 million annually to landfill
waste, a substantial portion of which could
have generated income if recycled. 1 The
following section describes the challenges
and opportunities in sustainable solid waste
management, as well as programs and strategies
that Midtown Alliance can develop, facilitate,
and implement in order to slow the depletion of
natural resources, protect our water supply, and
drive economic growth.
Source: Strathmann Research Group, University of Illinois at Urbana-Champaign.
Life Cycle Assessment.

GREENPRINT MIDTOWN
3. Impact Areas
Susta inabi l i ty P lan 2012152
WASTE OVERVIEW
Nearly all of a community’s activities contribute
to the waste stream. Industrial and agricultural
processes that produce the goods consumed
generate hazardous and non-hazardous waste.
Households and businesses that consume these
goods in turn also produce hazardous waste and
non-hazardous, everyday garbage. Hazardous
waste is particularly dangerous as it can be toxic,
reactive, ignitable, and corrosive. The disposal of
hazardous waste is therefore strictly regulated.
Non-hazardous, municipal solid waste (MSW)
includes recyclable items such as bottles, food
scraps, newspapers, cardboard, and construction
and demolition debris that can be diverted from
landfills through reuse, recycling and compost-
ing. The District’s municipal solid waste that is
not recycled is disposed in one of fifty-five (55)
Georgia MSW landfills, a structure built into or
on top of the ground in which natural (clay) and
synthetic liners are used to protect groundwa-
ter. 2 As the landfill waste slowly decomposes,
methane (a potent greenhouse gas) is emitted
into the atmosphere. According to the Georgia
Environmental Protection Division (EPD), only
ten (10) of Georgia’s MSW landfills currently cap-
ture the methane released from their landfill for
sale as fuel. 3
In fiscal year 2011, Georgia’s per-capita disposal
rate fell significantly for a third straight year.
Excluding waste imported from out-of-state, the
amount of waste entering municipal solid waste
WASTE GOALS
• Reduce the amount of solid waste
generated by maximizing reuse,
recycling, and composting.
in FY 2011 was 5.43 pounds per person per day-
--the lowest in a decade. 4 While this reduction
is a good trend, it is still higher than the national
average of 4.4 pounds daily (in 2010). 5 Passed
in 1990, the Georgia Comprehensive Solid Waste
Management Act laid the groundwork for waste
diversion in the state by setting a statewide per
capita solid waste reduction goal of 25 percent
by July 1, 1996, with 1992 as the base year (the
state did not meet this goal by the target, but
efforts continue to meet the goal). Since the Act
was adopted, the state’s waste reduction goal
has been modified twice. Currently the law sim-
ply says “It is the intent of the General Assembly
that every effort be undertaken to reduce on a
state-wide per capita basis the amount of MSW
being received at disposal facilities.”
2 Georgia Dept. of Community Affairs. 2011.” FY2011 Solid Waste Management
Annual Report.” Retrieved from: http://www.dca.ga.gov/development/Research/
programs/swar2011.asp (Accessed July 2012) 2 Georgia Dept. of Community Affairs. 2011.” FY2011 Solid Waste Management
Annual Report.” Retrieved from: http://www.dca.ga.gov/development/Research/
programs/swar2011.asp (Accessed July 2012) 3 Georgia Environmental Protection Division. 2012. “Open Solid Waste Disposal
Facilities with Landfill Gas Energy Systems.” Retrieved from: http://www.gaepd.
org/Documents/swp_map01.html (Accessed July 2012)
4 Georgia Dept. of Community Affairs. 2011. “State of Georgia FY 2011 Solid Waste
Annual Report.” Retrieved from: http://www.dca.ga.gov/development/Research/
programs/downloads/FY%202011%20Solid%20Waste%20Annual%20Report.pdf
(Accessed July 2012) 5 United States Environmental Protection Agency. 2012. “Wastes – Resource Con-
servation – Reduce, Reuse, Recycle.” Retrieved from: http://www.epa.gov/osw/
conserve/rrr/reduce.htm (Accessed July 2012)

3. Impact Areas 153
Georgia’s 2011’s Senate Bill 157 also significantly
modified solid waste management planning in
Georgia. 6 Under the bill, solid waste manage-
ment plans are still required, but the Georgia
Department of Community Affairs (DCA) is no
longer required to review them, and local gov-
ernments do not have to meet DCA’s minimum
planning standards. 7 This easing of planning
standards and lack of oversight could result in
less effective efforts to reduce landfill waste.
According to the Georgia Statewide Charac-
terization Study of 2005, over 3 million tons of
MSW waste was disposed of in the 10-county
Atlanta Region representing roughly 47 percent
of the state’s total waste. 8 That’s enough waste
to fill a caravan of dump trucks, lined bumper-to-
bumper around the I-285 perimeter---nine times
over. In 2008, the City of Atlanta was ranked
29th out of 50 U.S. cities for solid waste diver-
sion. The City’s goal is to reduce, reuse and re-
cycle 30 percent of its residential waste by 2013,
50 percent by 2015, and 90 percent by 2020. 9
City of Atlanta Mayor Kasim Reed believes that
achieving these goals will support long-term
economic growth and improve the quality of
life for Atlanta citizens. In a recent survey of
Midtown residents, workers, and businesses,
89 percent agreed that pursuing sustainability
initiatives such as recycling and waste diversion
are instrumental in improving the overall qual-
ity of life in the District. Additionally, 47 per-
cent of Midtown survey respondents stated that
6 State of Georgia. 2011. “Senate Bill 157.” Retrieved from: http://www1.legis.
ga.gov/legis/2011_12/pdf/sb157.pdf (Accessed July 2012) 7 Georgia Dept. of Community Affairs. 2011. “2011 Solid Waste Management Annual
Report.” Retrieved from: http://www.dca.ga.gov/development/Research/pro-
grams/swar2011.asp (Accessed July 2012) 8 Georgia Dept. of Community Affairs. 2005. “Georgia Statewide Waste Char-
acterization Study.” Retrieved from: http://www.dca.ga.gov/development/
EnvironmentalManagement/publications/GeorgiaMSWCharacterizationStudy.pdf
(Accessed July 2012)
9 City of Atlanta. 2010. “Power to Change.” Retrieved from: http://atlantasus-
tainabilityweek.org/ATLSustainPlan..pdf (Accessed July 2012) 10 Midtown Alliance. “Greenprint Midtown Community Survey.” May 2012.
waste reduction through increased recycling and
composting should be a top strategy in making
the District more sustainable. 10 In response to
this need, in June 2012, Midtown Alliance pur-
chased and installed fifty (50) recycling cans
on the sidewalks throughout Midtown. The first
program of its kind in Atlanta, the City partnered
with Midtown Alliance to collect the recyclables
on a weekly basis as part of its regular residential
collection service. Observations of the program
to date indicate that the containers are being
used extensively and the amount of waste in the
sidewalk trash cans is decreasing.

GREENPRINT MIDTOWN
3. Impact Areas
Susta inabi l i ty P lan 2012154
CHALLENGES
The complex and rapidly changing recycling
industry presents a challenge to the public
education and awareness that are critical to the
success of waste diversion programs. Due to the
increasing demand for recycled materials, the
reach of the recycling industry has rapidly grown
beyond domestic markets and now supplies 40
percent of the global raw material needs. 11 As a
result of this demand, the types of materials that
can be recycled and the processes used to re-
cycle them are evolving. Although the public has
a general understanding of the process and ben-
efits of waste reduction, ongoing education will
be critical to the success of diversion programs.
During the Greenprint Midtown Interactive Vi-
sioning Session, participants frequently cited the
need for an “overarching education campaign”
and initiatives to “raise awareness” regarding
waste reduction strategies in the District. 12
Another barrier to waste reduction is that recy-
cling in Georgia provides few economic incen-
tives. Georgia has one of the nation’s lowest
landfill tipping fees, which are charged for each
ton of waste deposited in a landfill. As of 2011,
Georgia had enough permitted landfill space to
accommodate current MSW disposal rates for
another 34 years. 13 For most residential and
commercial buildings, recycling represents a
cost neutral solution to reducing waste. The
money saved by reducing their tonnage of waste
is often offset by the cost for recycling services.
Overcoming this lack of economic incentive for
waste diversion with economic development op-
portunities is part of systemic change. Still, even
without clear economic incentives, 84 percent of
respondents of the Greenprint Midtown Interac-
tive Visioning Session indicated that they recycle
because “it is the right thing to do.” 14
Finally, the City of Atlanta provides curbside re-
cycling services for single-family homes but does
not mandate the provision of recycling services
for offices, restaurants and other commercial
establishments. The City’s 2007 amended recy-
cling ordinance for multi-family dwellings does,
however, require that owners of buildings with
five or more units provide commercial containers
for the collection of recyclables. 15 There is cur-
rently no penalty for non-adherence and as evi-
denced in the Greenprint Midtown Multi-family
Building Residents Survey, some building owners
do not provide recycling services. 16 For residents
and tenants of the District’s multi-family and
commercial buildings without access to on-site
collection services, recycling is much less conve-
nient than garbage disposal. Educating building
managers about the benefits of providing recy-
cling services is critical.
11 Bureau of International Recycling. 2012. “The Industry.” Retrieved from: http://
www.bir.org/industry/ (Accessed July 2012)12 Midtown Alliance. “Greenprint Midtown Interactive Visioning Session.” April
2012.13 Georgia Dept. of Community Affairs. 2011. “2011 Solid Waste Management An-
nual Report.” Retrieved from: http://www.dca.ga.gov/development/Research/
programs/swar2011.asp (Accessed July 2012)
14 Midtown Alliance. “Greenprint Midtown Interactive Visioning Session.” April 201215 City of Atlanta. 2007. “Ordinance #07-O01335 Recycling for Multi-family Dwell-
ing.” Retrieved from: http://www.atlantarecycles.com/documents/multi-famreso-
lution.pdf (Accessed July 2012) 16 Midtown Alliance. “Greenprint Midtown Building Owner Survey.” May 2012
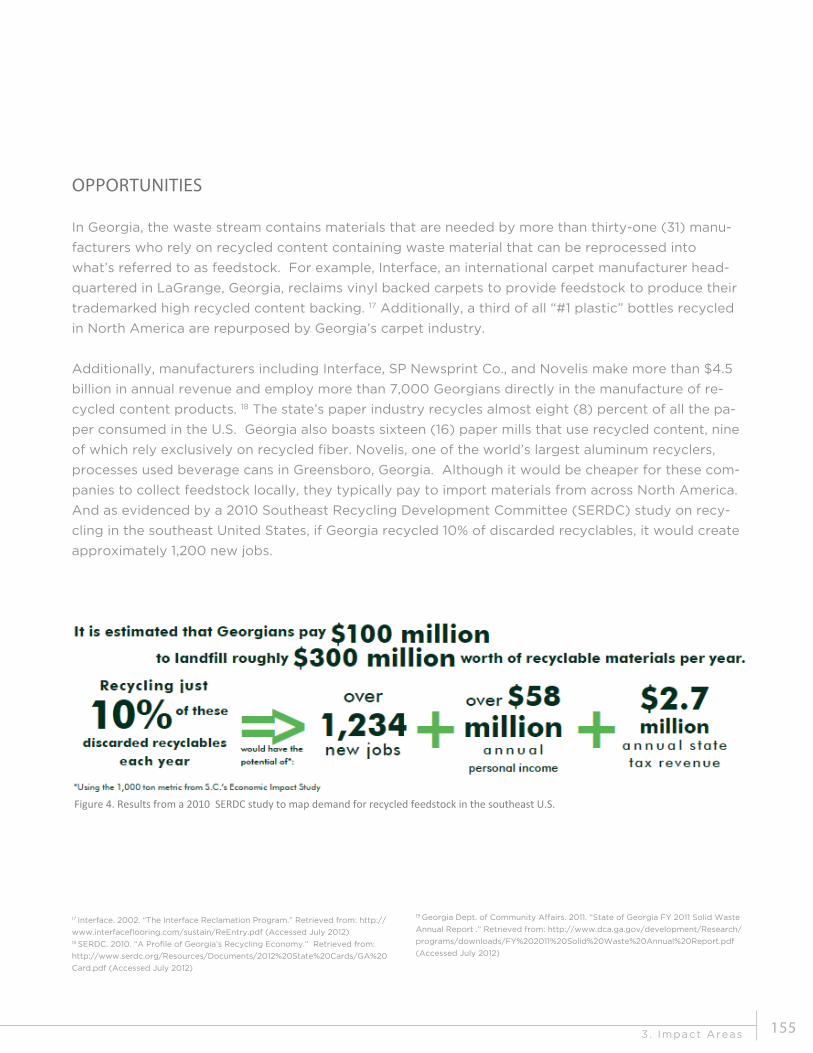
3. Impact Areas 155
OPPORTUNITIES
In Georgia, the waste stream contains materials that are needed by more than thirty-one (31) manu-
facturers who rely on recycled content containing waste material that can be reprocessed into
what’s referred to as feedstock. For example, Interface, an international carpet manufacturer head-
quartered in LaGrange, Georgia, reclaims vinyl backed carpets to provide feedstock to produce their
trademarked high recycled content backing. 17 Additionally, a third of all “#1 plastic” bottles recycled
in North America are repurposed by Georgia’s carpet industry.
Additionally, manufacturers including Interface, SP Newsprint Co., and Novelis make more than $4.5
billion in annual revenue and employ more than 7,000 Georgians directly in the manufacture of re-
cycled content products. 18 The state’s paper industry recycles almost eight (8) percent of all the pa-
per consumed in the U.S. Georgia also boasts sixteen (16) paper mills that use recycled content, nine
of which rely exclusively on recycled fiber. Novelis, one of the world’s largest aluminum recyclers,
processes used beverage cans in Greensboro, Georgia. Although it would be cheaper for these com-
panies to collect feedstock locally, they typically pay to import materials from across North America.
And as evidenced by a 2010 Southeast Recycling Development Committee (SERDC) study on recy-
cling in the southeast United States, if Georgia recycled 10% of discarded recyclables, it would create
approximately 1,200 new jobs.
Figure 4. Results from a 2010 SERDC study to map demand for recycled feedstock in the southeast U.S.
17 Interface. 2002. “The Interface Reclamation Program.” Retrieved from: http://
www.interfaceflooring.com/sustain/ReEntry.pdf (Accessed July 2012) 18 SERDC. 2010. “A Profile of Georgia’s Recycling Economy.” Retrieved from:
http://www.serdc.org/Resources/Documents/2012%20State%20Cards/GA%20
Card.pdf (Accessed July 2012)
19 Georgia Dept. of Community Affairs. 2011. “State of Georgia FY 2011 Solid Waste
Annual Report .” Retrieved from: http://www.dca.ga.gov/development/Research/
programs/downloads/FY%202011%20Solid%20Waste%20Annual%20Report.pdf
(Accessed July 2012)

GREENPRINT MIDTOWN
3. Impact Areas
Susta inabi l i ty P lan 2012156
There is also opportunity to divert electronics,
cell phones, and batteries from entering landfills.
According to the United States Environmental
Protection Agency (EPA), approximately 438
million electronic products were sold in 2009
in the United States, double the amount sold
in 1997. Although these items only represent
approximately two (2) percent of the municipal
solid waste stream, it accounts for 70 percent
of toxic waste found in landfills. 20 Diversion of
these materials will reduce the possibility of air,
water, and soil contamination from heavy metals
like lead and mercury. Because consumers often
do not know that electronics can be recycled, or
they don’t know where to recycle their electron-
ics, there is also a considerable amount of obso-
lete electronics in storage that could be reused
or repurposed. In 2009, the EPA estimates that
roughly 5 million tons of products were in stor-
age, and another 2.37 million tons were ready for
replacement/disposal, representing an increase
of more than 120 percent since 1999. 21 Given
Midtown’s large office sector and the commu-
nity’s penchant for technology, there is great po-
tetial for diversion programs that target e-waste.
As with electronic waste, there is significant
opportunity for the diversion of organic waste
within the District. According to the Georgia
Statewide Characterization Study of 2005, food
waste is the largest single (in tons) component
of the region’s waste stream. 22 Restaurants are
contributors to this waste stream, each produc-
ing on average 100,000 pounds of garbage a
year. In a national survey conducted by the Na-
tional Restaurant Association (NRA), 60 percent
of consumers reported that they prefer to pa-
tronize restaurants that recycle, and 51 percent
of consumers indicated that they are willing to
pay more at restaurants that recycle. 23 Addition-
ally, in the Greenprint Midtown Community Sur-
vey, 81 percent of participants said they are more
likely to support restaurants that make a strong
commitment to sustainability. 24 The diversion
of food waste can make a large and immediate
20 United States Protection Agency. 2012. Retrieved from: http://www.epa.gov/
osp/regions/emerpoll/swift.ppt (Accessed July 2012)21 United Stated Environmental Protection Agency. 2008. “Electronics Waste
Management in the United States.” Retrieved from: http://www.epa.gov/wastes/
conserve/materials/ecycling/docs/app-1.pdf (Accessed July 2012)22 Georgia Dept. of Community Affairs. 2005. “Georgia Statewide Waste Char-
acterization Study.” Retrieved from: http://www.dca.ga.gov/development/
EnvironmentalManagement/publications/GeorgiaMSWCharacterizationStudy.pdf
(Accessed July 2012)
23 National Restaurant Survey. 2011. “Recycling For All the Right Returns.”
Retrieved from: http://www.restaurant.org/sustainability/restaurantsrecycle/
(Accessed July 2012)24 Midtown Alliance. “Greenprint Midtown Community Survey” May 2012

3. Impact Areas 157
environmental impact. When food scraps are
disposed in a landfill it quickly decomposes and
becomes a major source of methane, a green-
house gas with great global warming potential. 25 The District, which is home to more than 150
restaurants, can benefit significantly from waste
reduction programs targeting food waste.
Georgia’s waste stream also has potential to
drive job creation. On a per-ton basis, sorting
and processing recyclables yields ten (10) times
more jobs than landfilling or incineration. 26 Addi-
tionally, recycling is a knowledge-based industry
that holds accurate sorting, pricing, and inven-
tory management in high regard. As a result,
wages at recycling facilities are often higher than
the national average. 27
MIDTOWN WASTE ASSETS
Midtown offers the following recycling assets:
• 6 Zero Waste Zone Participants
• 48 buildings with ex-isting recycling pro-grams (based on sur-vey responses)
• 50 public recycling bins
• 7 e-waste collection locations
• 50 public recycling bins in Piedmont Park
25 United States Environmental Protection Agency. 2012. “Basic Information about
Food Waste.” Retrieved from: http://www.epa.gov/osw/conserve/materials/
organics/food/fd-basic.htm (Accessed July 2012)26 Grassroots Recycling Network. 2000. “Wasting and Recycling in the United
States.” Retrieved from: http://www.grrn.org/assets/pdfs/wasting/WRUS.pdf
(Accessed July 2012)27 King County Solid Waste Division. 2009. “Recycling and Economic Develop-
ment.” Retrieved from: http://your.kingcounty.gov/solidwaste/linkup/docu-
ments/recycling-economic-development-review.pdf (Accessed July 2012)

GREENPRINT MIDTOWN
3. Impact Areas
Susta inabi l i ty P lan 2012158
Waste Assets

3. Impact Areas 159
WASTE REDUCTION STRATEGIES & PROGRAMS
Through the Greenprint Midtown planning process, the following waste strategies were developed
and serve to guide the selection of both Tier 1 (priority) and Tier 2 programs and projects. In the
future, additional programs and projects can be developed from the following strategies:
STRATEGIES
WsS1: Create sector-specific programs to reduce waste
WsS2: Encourage increased electronics recycling
WsS3: Explore community collection of compostable material
WsS4: Encourage purchasing policies that will promote products that are readily accepted at District
recycling and composting facilities
WsS5: Promote construction and demolition waste programs among District building owners, man-
agers, and contractors
TIER 1 PROGRAMS & PROJECTS
The following Tier 1 programs were identified as priorities and are described in more detail in the
next section.
WsP1: Restaurant Waste Reduction Outreach Program
WsP2: Multi-family Building Recycling Outreach Program
WsP3: Electronics Recycling Outreach Program
TIER 2 PROGRAMS & PROJECTS
WsP4: Construction & Demolition Waste Reduction: Encourage building and demolition contractors
to reuse and recycle construction and demolition waste rather than disposing of it in landfills.
The recession of 2007 lead to a continuous decline in construction activity and ultimately a
reduction in the amount of construction and demolition waste heading to landfills. Upon re-
covery from the recession, waste reduction strategies could allow this trend to continue.
WsP5: Office Waste Reduction Campaign: Encourage businesses to target materials that are abun-
dant in their waste stream and can easily be diverted from landfills. This program should be
implemented in tandem with the Green Business Recognition Program.
WsP6: Sustainable Procurement Officer Network: Facilitate the creation of a peer network that pro-
vides resources, best practices, and opportunities to exchange information in order to support
responsible procurement. This should be implemented in tandem with the Green Business
Recognition Program.

GREENPRINT MIDTOWN
3. Impact Areas
Susta inabi l i ty P lan 2012160
TIER 1 WASTE REDUCTION PROGRAMS
WSP1 – RESTAURANT WASTE REDUCTION OUT-REACH PROGRAM
Description
Every day, restaurants and food service facilities
are faced with the challenge of managing the
volumes of waste their establishments gener-
ate. Annually, the average restaurant produces
100,000 pounds of garbage, and while roughly
95 percent of this waste could be recycled or
composted, nearly 98 percent ends up in land-
fills. 28 Food waste in landfills quickly breaks
down and becomes a major source of methane,
a powerful greenhouse gas that contributes to
climate change. 29
Waste reduction and diversion programs could
have a significant impact in the District, which
is home to more than 150 restaurants, of which
only 6 are enrolled in a formal waste reduction
program. 30 The Restaurant Waste Reduction
Outreach Program will encourage food service
facilities to adopt waste reduction and diversion
policies through a food service sustainability
awareness and education campaign that outlines
the benefits and best management practices of
environmentally preferred purchasing, recycling
grease, cardboard, paper, glass, plastic and met-
als, and composting and donation of food residu-
als. 31 These outreach efforts can complement
the Green Business Recognition Program and the
Restaurant Water Efficiency Program.
Midtown Alliance will facilitate the following pro-
gram implementation activities:
• Partner with sustainable food service industry
professionals to develop a series of educational
collateral and workshops that will outline the
benefits of waste reduction and diversion and
introduce best management practices.
• Engage all known District restaurants and food
service facilities, and recruit their owners, man-
agers, and staff to attend the workshops.
• Partner with sustainable food service industry
professionals to introduce District food service
facilities to sustainable food service certification
programs, and encourage participation. 32
•Measure program success and report results.
28 Dine Green. 2012. “Six Reasons to Become A Certified Green Restaurant.” Re-
trieved from: http://dinegreen.weebly.com/waste.html (Accessed July 2012)29 United States Environmental Protection Agency. 2012. “Basic Information about
Food Waste.” Retrieved from: http://www.epa.gov/osw/conserve/materials/or-
ganics/food/fd-basic.htm (Accessed July 2012)30 Midtown Alliance. “Greenprint Midtown Restaurant Survey.” July 201231 Elemental Impact. 2011. “Zero Waste Zone Brochure.” Retrieved from: http://
www.zerowastezones.org/Resources (Accessed July 2012)
32Elemental Impact. 2001. “Zero Waste Zone Brochure.” Retrieved from: http://
www.zerowastezones.org/Resources (Accessed July 2012)

3. Impact Areas 161
POTENTIAL IMPLEMENTATION PARTNERS & RESOURCES
• Elemental Impact (EI): a national nonprofit organization and founder of the Zero Waste Zone
program, whose mission is to bring sustainable operating practices to the foodservice industry. EI
could support the development of best practices, workshop curriculum and collateral, and market-
ing and communications materials.
• National Restaurant Association (NRA): represents nearly 400,000 restaurants, suppliers, educa-
tors and non-profits. NRA has partnered with EI on the Zero Waste Zone program and also created
ConSERVE, an initiative that promotes sustainable food service operations. NRA could recommend
industry best practices.
• Current Zero Waste Zone participants: The Zero Waste Zone program’s goal is to divert the maxi-
mum amount of recyclable items and organic matter from landfills and back into the production
cycle. Participating restaurants and food service facilities can provide programmatic experience
and guidance to potential program participants.
GREENPRINT MIDTOWN
3. Impact Areas
Susta inabi l i ty P lan 2012162
IMPACT
Environmental Impact: Waste reduction and
diversion policies that include recycling and
composting can slow the depletion of natural re-
sources, protect our water supply, and conserve
energy. Additionally, waste reduction and diver-
sion reduces methane and other greenhouse gas
emissions produced by waste disposed in land-
fills. Restaurant waste reduction and diversion
policies that encourage composting also have
the added benefit of creating nutrient-rich soil
that could potentially be returned for use within
the District. Furthermore, spent grease can also
be recycled for reuse as bio-fuel, an alternative
energy source that burns cleaner than petro-
leum-based diesel and emits less air pollutants. 33
Community Impact: Sustainability is increasingly
becoming a key influencer of consumer pur-
chasing and buying decisions. According to the
Greenprint Midtown Community Survey, 81 per-
cent of respondents are more likely to support
restaurants or businesses that make a strong
commitment to sustainability.34 Restaurants with
waste reduction and diversion policies can pro-
mote this through their communication channels.
Increasing the number of food service facilities
that employ waste reduction and diversion
policies can also enhance the District’s image.
Encouraging food service facilities to employ
waste reduction and diversion policies also has
the potential to promote civic pride by giving
restaurants and food service facilities a meaning-
ful way to engage in the Midtown EcoDistrict.
Economic Impact - While most buildings and
businesses do not see significant cost savings by
recycling, there are opportunities to avoid costs
by reducing the frequency of collection trips,
reducing the volume, and reducing the amount
of waste sent to landfills. These savings can
offset the cost of providing recycling and com-
posting services. Waste reduction and diversion
policies could also allow food service facilities to
write off donations to food banks and charities
in their tax filings. Response to consumer de-
mand for more sustainable food service options
could potentially lead to increased patronage at
District restaurants. Additionally, recycling and
composting supports Georgia’s thriving end-use
markets for recyclable material, which directly
employs more than 7,000 Georgians. 35
33 United States Environmental Protection Agency. 2012. “Learn About Biodiesel.”
Retrieved from: http://www.epa.gov/region9/waste/biodiesel/questions.html
(Accessed July 2012)34 Midtown Alliance. “Greenprint Midtown Community Survey.” May 2012

3. Impact Areas 163
COST & POTENTIAL FUNDING
The costs to support this program are estimated to consume about 5% of a FTE and would include
staff expenses to conduct outreach and educate restaurant and food service facilities. If this pro-
gram is included as part of a Green Business Recognition Program described later in this report, ef-
ficiencies could be experienced.
Potential funding sources include the Midtown Improvement District and foundations.
CHALLENGES & POTENTIAL SOLUTIONS
Challenge: Greenco, Georgia’s only commercial composting facility is not currently operating due to
permitting issues.
Potential Solution: Until there is increased access to commercial composting facilities in Georgia, the
program will encourage the use of smaller services such as Waste Wagon, as well as self-composting.
TRACKING & MEASUREMENT
METRIC/INDICATOR BASELINE TARGET
Engagement/Recruitment
Number of Restaurants Composting 2 8 by 2017
Number of Restaurants with comprehen-
sive recycling program*
5 20 by 2017
Number of Restaurants Enrolled in Waste
Reduction Program**
6 24 by 2017
* Recycling of glass, plastic, and aluminum in addition to cardboard, paper, and cooking oil
** Zero Waste Zone or similar program

GREENPRINT MIDTOWN
3. Impact Areas
Susta inabi l i ty P lan 2012164
WSP2 – MULTI-FAMILY BUILDING RECYCLING OUTREACH PROGRAM
Description
Multi-family dwellings are the predominant hous-
ing type in the District and will continue to be
for the foreseeable future. Although the City of
Atlanta does not currently offer recycling ser-
vices to multi-family dwellings, the City’s 2007
ordinance addresses this need by requiring
multi-family building owners to provide commer-
cial containers for the collection of recyclables. 36 While some private waste haulers provide
recycling services for multi-family buildings they
service for garbage collection, there are some
multi-family buildings without access to recy-
cling services. In the Greenprint Midtown Multi-
family Residence Survey, 91 % of respondents
(multi-family building owners and managers)
report that they provide recycling service to
their tenants. 37 While this indicates a high level
of access, the community engagement forums
revealed that some District residents were un-
aware that recycling services were provided in
their buildings or that the types of materials col-
lected was limited.
The Multi-family Building Recycling Program
will engage District building owners, building
managers and residents and educate them on
the benefits of recycling. The program will also
help building owners and managers, particularly
those of buildings with space restraints, to over-
come barriers to complying with the ordinance.
The program will also explore the potential for
developing a multi-building cooperative hauling
agreement for waste management services. This
program could be a stand-alone program or of-
fered in conjunction with the Multi-family Plumb-
ing Retrofit Outreach Program.
36 City of Atlanta. 2007. “Ordinance #07-O01335 Recycling for Multi-family Dwell-
ing.” Retrieved from: http://www.atlantarecycles.com/documents/multi-famresolu-
tion.pdf (Accessed July 2012)37 Midtown Alliance. “Greenprint Midtown Multi-family Residents Survey.” July 2012.

3. Impact Areas 165
Midtown Alliance will facilitate the following program implementation activities:
• Engage District multi-family building managers and owners and inform them of the
City of Atlanta’s ordinance requiring the provision of commercial containers for the
collection of recyclables in multi-family dwellings. Specifically target the smaller
buildings that are less likely to provide recycling services.
• Address barriers to compliance with the City’s ordinance, and assist building owners
and managers in overcoming these obstacles by using resources and tools provided in
Building Multi-family Building Recycling Programs in Georgia, a toolkit developed by
Atlanta Recycles in 2010 to guide property owners, managers, residents and local re-
cycling program managers in setting up effective and sustainable recycling programs
for multi-family residential and mixed use properties in Georgia. 38
• Communicate the benefits of recycling to District building owners and managers.
• Provide “train-the-trainer” workshop and collateral for building owners and managers
so that they can, in turn, educate their tenants on the benefits and best practices for
recycling.
• Investigate the feasibility of creating a District-wide cooperative hauling agreement by
employing the services of a waste management broker.
• Measure program success and report results.
38 Georgia Dept. of Community Affairs. 2010. “Building Multi-Family Recycling
Programs In Georgia.” Retrieved from http://www.dca.ga.gov/development/
EnvironmentalManagement/programs/downloads/MultiFamRecycle2010.pdf
(Accessed July 2012)

GREENPRINT MIDTOWN
3. Impact Areas
Susta inabi l i ty P lan 2012166
39 SERDC. 2010. “A Profile of Georgia’s Recycling Economy.” Retrieved from
http://www.serdc.org/Resources/Documents/2012%20State%20Cards/GA%20
Card.pdf (Accessed July 2012)
IMPACT
Environmental Impact: Multi-family dwellings are
the predominant housing type in the District. As
recycling services become more accessible to
residents of District multi-family dwellings, the
potential for significant waste diversion will also
increase. Increased waste diversion will slow
the depletion of natural resources, protect our
water supply, and conserve energy. Additionally,
waste diversion decreases methane and other
greenhouse gas emissions. Should a coopera-
tive buying agreement be incorporated into the
program, the use of a single hauler could reduce
the number of collection trips, vehicle miles trav-
eled (VMT), and the associated greenhouse gas
emissions.
Community Impact: Providing convenient recy-
cling services also has potential to promote civic
pride by giving residents a meaningful way to
engage in the Midtown EcoDistrict. Additionally,
the establishment of a District-wide coopera-
tive hauling agreement for multi-family build-
ings will be a first for Atlanta, and the program
could serve as a best practices model for other
similarly situated communities. The program
can provide the development of building man-
agement partnerships that can be leveraged for
future sustainability initiatives.
Economic Impact: There are opportunities to
avoid costs by reducing the frequency of collec-
tion trips, reducing the volume, and reducing the
amount of waste sent to landfills. These sav-
ings can offset the cost of providing recycling
and composting services. Should the program
be expanded to include a cooperative hauling
agreement, building owners and managers could
benefit from economies of scale. Additionally,
increased recycling supports Georgia’s thriving
end-use markets for recyclable material, which
directly employs more than 7,000 Georgians. 39
Potential Implementation Partners & Resources
• Atlanta Recycles: Atlanta Recycles is a coalition
of governmental, corporate, and environmen-
tal entities with a shared mission to promote
recycling and improve the collection infrastruc-
ture for recyclable materials. The organization
can assist with developing and implementing a
recycling education and awareness campaign
geared towards multi-family building owners,
building managers, and residents.
• City of Atlanta Office of Sustainability: The Of-
fice of Sustainability works with all city depart-
ments to balance Atlanta’s economic growth
with environmental protection while being
mindful of social justice. The office can identify
potential program participants through its busi-
ness license office, and expand awareness of
the program to new District businesses apply-
ing for licenses.
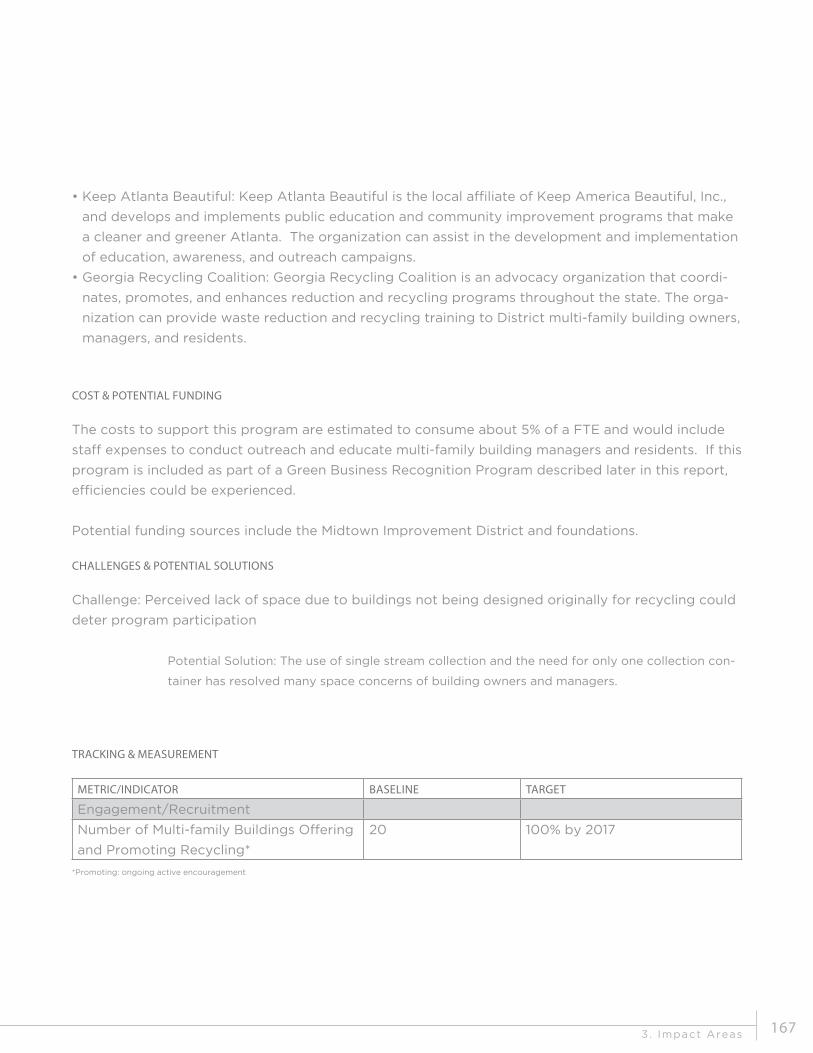
3. Impact Areas 167
COST & POTENTIAL FUNDING
The costs to support this program are estimated to consume about 5% of a FTE and would include
staff expenses to conduct outreach and educate multi-family building managers and residents. If this
program is included as part of a Green Business Recognition Program described later in this report,
efficiencies could be experienced.
Potential funding sources include the Midtown Improvement District and foundations.
CHALLENGES & POTENTIAL SOLUTIONS
Challenge: Perceived lack of space due to buildings not being designed originally for recycling could
deter program participation
Potential Solution: The use of single stream collection and the need for only one collection con-
tainer has resolved many space concerns of building owners and managers.
TRACKING & MEASUREMENT
METRIC/INDICATOR BASELINE TARGET
Engagement/Recruitment
Number of Multi-family Buildings Offering
and Promoting Recycling*
20 100% by 2017
*Promoting: ongoing active encouragement
• Keep Atlanta Beautiful: Keep Atlanta Beautiful is the local affiliate of Keep America Beautiful, Inc.,
and develops and implements public education and community improvement programs that make
a cleaner and greener Atlanta. The organization can assist in the development and implementation
of education, awareness, and outreach campaigns.
• Georgia Recycling Coalition: Georgia Recycling Coalition is an advocacy organization that coordi-
nates, promotes, and enhances reduction and recycling programs throughout the state. The orga-
nization can provide waste reduction and recycling training to District multi-family building owners,
managers, and residents.

GREENPRINT MIDTOWN
3. Impact Areas
Susta inabi l i ty P lan 2012168
WSP3 – ELECTRONICS RECYCLING OUTREACH PROGRAM
Description
Electronic waste, or “e-waste,” is a term gener-
ally applied to consumer and business electronic
equipment that is either near or at the end of
its useful life, or is unwanted by the original
consumer but is in good working order and can
be repurposed or reused by others. Accord-
ing to the Consumer Electronics Association,
the average American household owns roughly
twenty-four (24) electronic products. 41 In 2009,
more than 2 million tons of these electronics
were ready for end-of-life management, yet only
25 percent were collected for recycling. 42 Ac-
cording to Global Futures Foundation, e-waste
accounts for 70 percent of toxic waste found
in landfills. 42 Although e-waste, when appro-
priately managed, presents a lower immediate
risk to human health and the environment than
hazardous waste, it contains toxic heavy metals
like lead and mercury that can contaminate air,
water, and soil when incinerated or disposed in
landfills. 44
Because consumers often do not know that
electronics can be recycled, or they don’t know
where to recycle their electronics, they end up
either throwing them away or storing them. The
Electronics Recycling Outreach Program will
educate District residents and businesses on
the benefits of electronics recycling and reuse,
encourage building managers to offer e-waste
collection, and sponsor District-wide e-waste
collection events.
Midtown Alliance will facilitate the following pro-
gram implementation activities:
• Develop a comprehensive list of e-waste re-
cycling locations and promote through typical
communications channels.
• Encourage building managers to offer onsite
e-waste collection opportunities.Design an
e-waste community education and outreach
campaign and develop marketing and promo-
tional collateral to support the effort.
• Partner with others to offer a District-wide e-
waste collection event.
• Track, monitor and analyze outreach campaign
metrics, and collection metrics.
40 Midtown Alliance. “Greenprint Midtown Multi-family Residents Survey.” July 2012.41 Consumer Electronics Association. 2008. “Market Research Report: Trends in CE
Reuse, Recycle and Removal.” Retrieved from: http://www.epa.gov/epawaste/con-
serve/materials/ecycling/index.htm#_ftnref1 (Accessed July 2012)42 United States Environmental Protection Agency. 2012. Statistics on the Manage-
ment of Used and End-of-Life Electronics. Retrieved from: http://www.epa.gov/
epawaste/conserve/materials/ecycling/manage.htm (Accessed July 2012)43 United States Environmental Protection Agency. 2012. Retrieved from http://
www.epa.gov/osp/regions/emerpoll/swift.ppt (Accessed July 2012)44 United States Environmental Protection Agency. 2008. “Electronics Waste
Management in the United States.” Retrieved from: http://www.epa.gov/wastes/
conserve/materials/ecycling/docs/app-1.pdf (Accessed July 2012)

3. Impact Areas 169
IMPACT
Environmental Impact: Diverting e-waste from land-
fills for recycling and/reuse will reduce air, water,
and soil contamination from leaching elements
within e-waste like lead, mercury and cadmium.
Recycling e-waste also saves energy and con-
serves natural resources by reducing the need to
extract additional raw materials from the earth.
Community Impact: Increasing awareness of elec-
tronics recycling services has potential to pro-
mote civic pride by giving residents a meaning-
ful way to engage in the Midtown EcoDistrict.
E-waste recycling also addresses a stated com-
munity need - roughly 85 percent of Greenprint
Midtown Community Survey respondents said
they would participate in waste diversion pro-
grams such as electronic waste recycling if the
service was available in the District. 45
Economic Impact: The diversion of electronic waste
can result in lower waste handling and disposal
fees by decreasing the volume of waste going
to landfills. This may produce savings to offset
the cost of providing recycling services. When
properly managed, e-waste can be source of
valuable precious metals such as copper, gold,
and zinc. Recycling e-waste domestically cre-
ates jobs for professional recyclers and refur-
bishers.
45 Midtown Alliance. “Greenprint Midtown Community Survey.” May 2012.

GREENPRINT MIDTOWN
3. Impact Areas
Susta inabi l i ty P lan 2012170
POTENTIAL IMPLEMENTATION PARTNERS & RESOURCES
• City of Atlanta Office of Sustainability: The Of-
fice of Sustainability develops and initiates pro-
grams to balance Atlanta’s economic growth
with environmental protection. Midtown Alli-
ance could seek to establish a partnership for
e-waste education and collection efforts.
• Keep Atlanta Beautiful: Keep Atlanta Beauti-
ful, an affiliate of Keep America Beautiful, Inc.,
develops and implements public education and
community improvement programs that make
a cleaner and greener Atlanta. Midtown Alli-
ance may seek to partner with KAB to develop
an e-waste collection event.
• Georgia Recycling Coalition: GRC is an organi-
zation that coordinates, promotes and enhanc-
es reduction and recycling programs through-
out the state.
• Atlanta Recycles: Atlanta Recycles provides
educational and awareness around waste and
recycling opportunities.
• Keep Atlanta Beautiful: Keep Atlanta Beautiful
is the local affiliate of Keep America Beautiful,
Inc., and develops and implements public edu-
cation and community improvement programs
that make a cleaner and greener Atlanta. The
organization can assist in the development and
implementation of education, awareness, and
outreach campaigns.
• Georgia Recycling Coalition: Georgia Recy-
cling Coalition is an advocacy organization that
coordinates, promotes, and enhances reduction
and recycling programs throughout the state.
The organization can provide waste reduction
and recycling training to District multi-family
building owners, managers, and residents.
COSTS & POTENTIAL FUNDING
The costs to support this program are estimated
to consume about 5% of a FTE and would in-
clude staff expenses to conduct outreach and
educate District residents, employees, and
employers. Expenses related to developing and
promoting collection events are expected to be
less than $3,000/year.
Potential funding sources include the Midtown
Improvement District, event sponsors,
and foundations.

3. Impact Areas 171
TRACKING & MEASUREMENT
METRIC/INDICATOR BASELINE TARGET
E-waste Outreach
Number of buildings offering e-waste
recycling
TBD 20 by 2020
Number of Electronics Recycling Events in
Midtown
0 1-2 Events/Year by 2013
CHALLENGES & POTENTIAL SOLUTIONS
Challenge: There is a diverse audience within the District for electronics recycling communication
and outreach. Residents, businesses, and the daytime working population are all critical stakeholders
to reach, but each may require customized messaging and resources.
Potential Solution: Midtown Alliance will partner with existing electronics recycling programs and pro-
viders to leverage resources for marketing and outreach.
Challenge: E-waste is regularly exported from the U.S. and other developed countries to developing
ones. However, not every electronic collector/recycler follows environmentally sustainable recycling
practices and international law. E-waste generated in Georgia is often exported to countries that
employ dismantling practices that are harmful to people and the environment.
Potential Solution: Responsible e-waste recyclers and refurbishers can now become certified through inde-
pendent third party criteria and verification. Programs events should always use certified and local recyclers.

GREENPRINT MIDTOWN
4. Implementat ion
Susta inabi l i ty P lan 2012172
4SECTION

4. Implementat ion 173
implementation
Greenprint Midtown was designed with an emphasis on action. The recommended programs outlined in Green-print Midtown will be further developed by Midtown Al-liance staff and prioritized by Midtown Alliance and the
Midtown Improvement District for implementation. There are clear opportunities to combine certian programs ei-ther by sector (i.e. restaurants) or by function (i.e. water
efficiency). This section includes a projected implementa-tion timeline for Tier 1 Programs, offers several near-term
implementation opportunities, and outlines potential barri-ers to implementation.
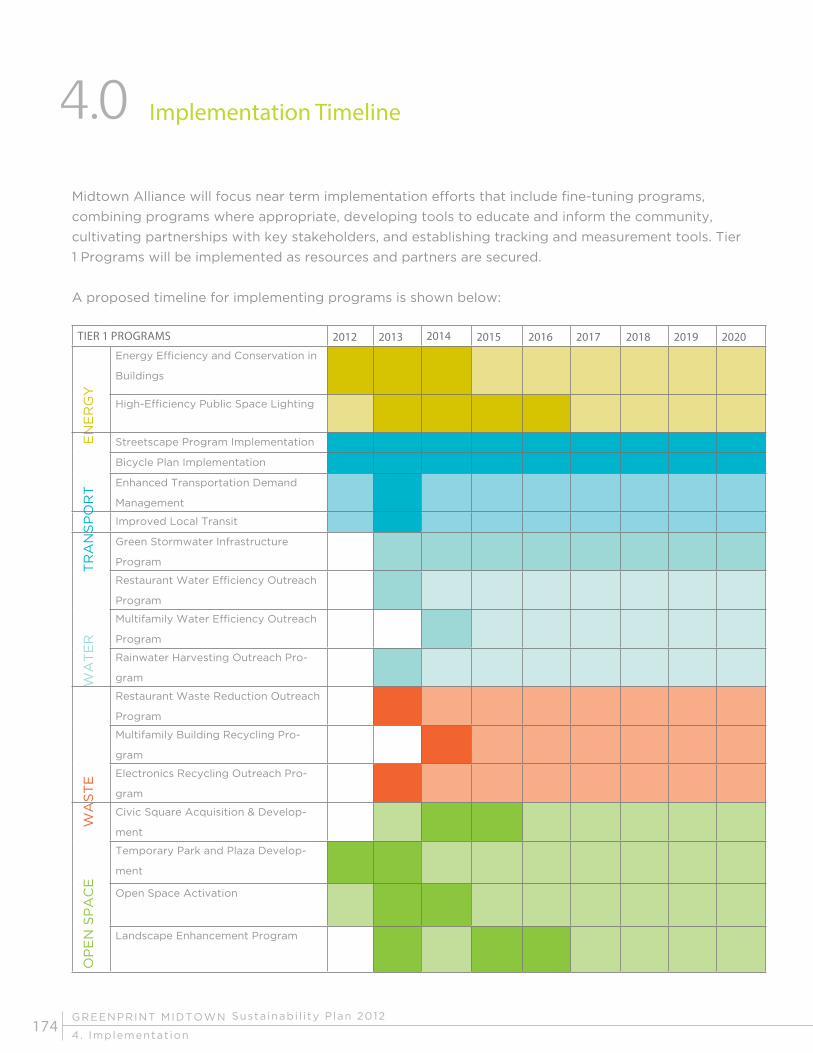
GREENPRINT MIDTOWN
4. Implementat ion
Susta inabi l i ty P lan 2012174
4.0
Midtown Alliance will focus near term implementation efforts that include fine-tuning programs,
combining programs where appropriate, developing tools to educate and inform the community,
cultivating partnerships with key stakeholders, and establishing tracking and measurement tools. Tier
1 Programs will be implemented as resources and partners are secured.
A proposed timeline for implementing programs is shown below:
EN
ER
GY
TR
AN
SP
OR
TW
AT
ER
WA
ST
EO
PE
N S
PA
CE
Implementation Timeline
TIER 1 PROGRAMS 2012 2013 2014 2015 2016 2017 2018 2019 2020
Energy Efficiency and Conservation in
Buildings
High-Efficiency Public Space Lighting
Streetscape Program Implementation
Bicycle Plan Implementation
Enhanced Transportation Demand
Management
Improved Local Transit
Green Stormwater Infrastructure
Program
Restaurant Water Efficiency Outreach
Program
Multifamily Water Efficiency Outreach
Program
Rainwater Harvesting Outreach Pro-
gram
Restaurant Waste Reduction Outreach
Program
Multifamily Building Recycling Pro-
gram
Electronics Recycling Outreach Pro-
gram
Civic Square Acquisition & Develop-
ment
Temporary Park and Plaza Develop-
ment
Open Space Activation
Landscape Enhancement Program

4. Implementat ion 175
Near-term opportunities to transition
Greenprint Midtown from a planning process
into implementation can come through the
development of partnerships, continued
community engagement, and initiatives that
recognize existing sustainability success stories.
It is critical that the momentum created during
the development of Greenprint Midtown carries
on into implementation. Midtown Alliance
has already begun to implement some new
smaller scale projects that benefit the District
including the provision of public recycling bins,
the installation of a rainwater cistern, and the
development of a new temporary public park.
Specific approaches that will help move
Greenprint Midtown into the implementation
phase include collaborative efforts with key
stakeholders, the development of the Midtown
EcoDistrict brand, and the launch of the Green
Business Recognition Program.
PARTNERSHIPS
There are a number of opportunities for
Midtown Alliance to partner with others to
advance sustainability programs in Midtown. An
opportunity to expand on an existing partnership
is with Georgia Tech. Through the Greenprint
Midtown planning process and a parallel
planning effort to create a Midtown Innovation
Zone, a new partnership with Georgia Tech is
being developed. The innovation zone concept
is a place-based economic development strategy
led by Midtown Alliance to enhance Midtown’s
technology assets and promote the significant
assets and innovators that already exist in
Midtown. There are clear opportunities to link
4.1 Near-term Opportunities
innovation and sustainability with Midtown
becoming the “sand box” for technology
innovations that solve energy, water, and
transportation challenges.
MIDTOWN ECODISTRICT
The term “ecodistrict” is used by a growing
number of communities in the U.S. and
internationally to describe their commitment
to responsible growth through a brand. The
Portland Sustainability Institute (PoSI), the
creator of the EcoDistrict Framework that
Greenprint Midtown roughly mirrors, describes
an ecodistrict as a neighborhood or district
with a broad commitment to accelerate
neighborhood-scale sustainability by committing
to performance goals, guiding and investing
in solutions, and tracking results over time.
Midtown Alliance has adopted the ecodistrict
term based on its commitment to pursuing
sustainability at the district level and intends
to develop a Midtown EcoDistrict brand. This
brand could be used by Midtown Alliance
and other stakeholders to show that they
have invested and are contributing to the
sustainability of Midtown. The brand can also be
used to create awareness and educate residents,
employees, and visitors about sustainability
projects, programs, or initiatives in Midtown.

GREENPRINT MIDTOWN
4. Implementat ion
Susta inabi l i ty P lan 2012176
GREEN BUSINESS RECOGNITION PROGRAM
Another opportunity to develop an awareness
of the existing businesses that have already
made a commitment to sustainability is to create
a certification and recognition program. This
would serve several purposes. First, it would
respond to the survey results that showed a high
level of interest in supporting businesses that
were more sustainable. Second, it would provide
positive reinforcement to the many businesses
in Midtown that are already taking action and
would serve to inspire other businesses to
engage in sustainable actions. Third, it would
support the buildings that are participating in the
Atlanta Better Buildings Challenge. And finally,
it would present Midtown as a place that has a
high concentration of sustainable business.
One conceptual model for this program is the
San Francisco Green Business Program. The SF
Green Business Program is part of a statewide
program and operated at the local level by the
City of San Francisco. The program is offered
to a number of sectors including offices, hotels,
restaurants, and retailers among others where
participants must engage in a certain number
of sustainability actions from a checklist and
those actions are subject to verification by
program administrators. The program provides
participants with best practices, consulting, and
opportunities for recognition. A similar program
in Atlanta might start out in Midtown as a pilot
and then be expanded to the rest of the City or
even the region if successful.
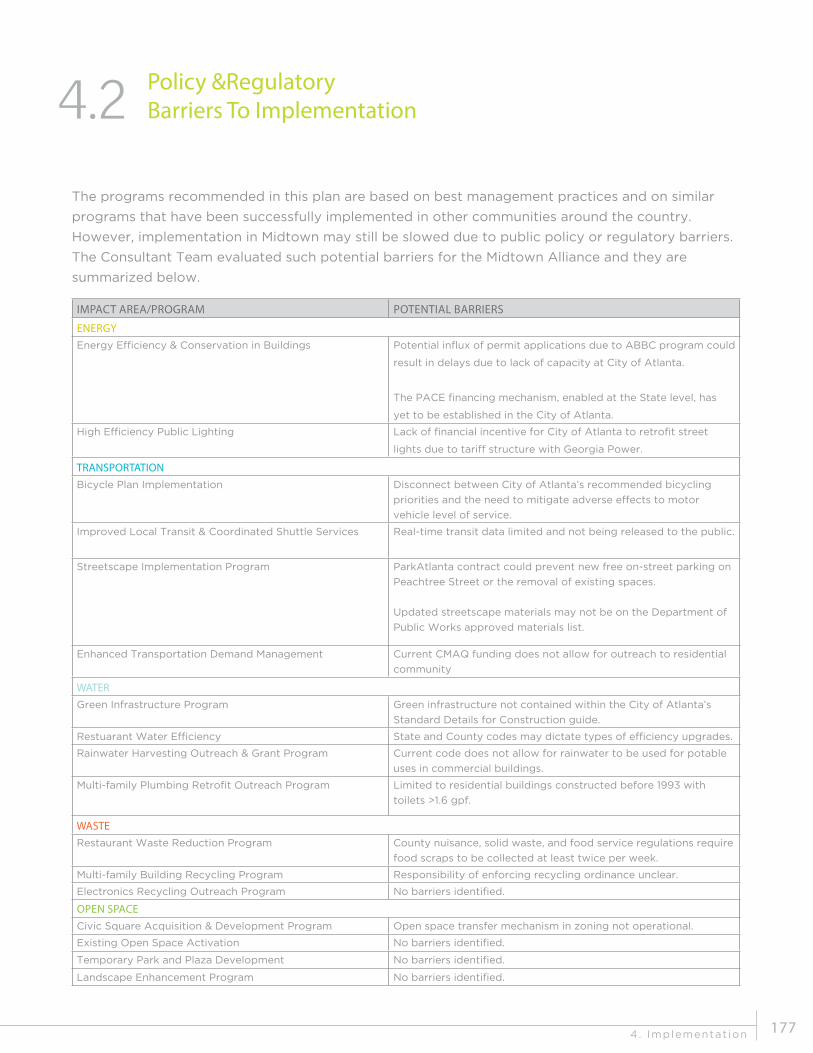
4. Implementat ion 177
IMPACT AREA/PROGRAM POTENTIAL BARRIERS
ENERGYEnergy Efficiency & Conservation in Buildings Potential influx of permit applications due to ABBC program could
result in delays due to lack of capacity at City of Atlanta.
The PACE financing mechanism, enabled at the State level, has
yet to be established in the City of Atlanta.
High Efficiency Public Lighting Lack of financial incentive for City of Atlanta to retrofit street
lights due to tariff structure with Georgia Power.
TRANSPORTATIONBicycle Plan Implementation Disconnect between City of Atlanta’s recommended bicycling
priorities and the need to mitigate adverse effects to motor
vehicle level of service.
Improved Local Transit & Coordinated Shuttle Services Real-time transit data limited and not being released to the public.
Streetscape Implementation Program ParkAtlanta contract could prevent new free on-street parking on
Peachtree Street or the removal of existing spaces.
Updated streetscape materials may not be on the Department of
Public Works approved materials list.
Enhanced Transportation Demand Management Current CMAQ funding does not allow for outreach to residential
community
WATER Green Infrastructure Program Green infrastructure not contained within the City of Atlanta’s
Standard Details for Construction guide.
Restuarant Water Efficiency State and County codes may dictate types of efficiency upgrades.
Rainwater Harvesting Outreach & Grant Program Current code does not allow for rainwater to be used for potable
uses in commercial buildings.
Multi-family Plumbing Retrofit Outreach Program Limited to residential buildings constructed before 1993 with
toilets >1.6 gpf.
WASTERestaurant Waste Reduction Program County nuisance, solid waste, and food service regulations require
food scraps to be collected at least twice per week.
Multi-family Building Recycling Program Responsibility of enforcing recycling ordinance unclear.
Electronics Recycling Outreach Program No barriers identified.
OPEN SPACECivic Square Acquisition & Development Program Open space transfer mechanism in zoning not operational.
Existing Open Space Activation No barriers identified.
Temporary Park and Plaza Development No barriers identified.
Landscape Enhancement Program No barriers identified.
4.2 Policy &Regulatory Barriers To Implementation
The programs recommended in this plan are based on best management practices and on similar
programs that have been successfully implemented in other communities around the country.
However, implementation in Midtown may still be slowed due to public policy or regulatory barriers.
The Consultant Team evaluated such potential barriers for the Midtown Alliance and they are
summarized below.

GREENPRINT MIDTOWN
5. Tracking & Measurement
Susta inabi l i ty P lan 2012178
5SECTION
5. Tracking & Measurement 179
measurement + reporting
Measuring performance is essential to the long-term success of Greenprint Midtown. As programs and projects
are developed and implemented, ongoing monitoring will be essential to understand whether the programs
being implemented are achieving successful outcomes. This section outlines tracking and measurement
methodologies and includes a chart of metrics, baselines, and targets that will gauge the progress of the plan.

GREENPRINT MIDTOWN
5. Tracking & Measurement
Susta inabi l i ty P lan 2012180
5.0 Methodology
Given the limited performance level data
currently available at the District scale,
Midtown Alliance cannot currently employ
precise measures to determine performance.
Until data on greenhouse gas emissions,
water usage, and other measures are available
at the District scale, Midtown Alliance will
focus on measuring programmatic success.
Aligning Midtown’s metrics where possible
with the City of Atlanta’s Power to Change
sustainability plan is useful and important.
Longer term, Midtown Alliance should seek
opportunities and partnerships to collect
more precise performance metrics. The
TIER 1 PROGRAMS METRIC/INDICATOR BASELINE TARGET
ENERGY Energy Efficiency
and Conservation in
Buildings
Square Footage of
Commercial Bldgs
Signing Commitment
5.4 10 Million Square Feet
by 2015
Building Square Footage
Certified Green (LEED or
Energy Star)1
15.7 22 Million by 2020
High-Efficiency Public
Space Lighting
Number of High
Efficiency Cobra head
Fixtures
4 69 by 2015
100% by 2020
Number of A & C Fixture
Type Retrofits
0 100% by 2020
New Public Space High-
Efficiency Lighting
Installations
0 100% by 2020
5.1 Performance Measures
Portland Sustainability Institute has outlined
an extensive list of performance measures for
gauging the success of eco-districts.
Data should be collected and reported
regularly to show the overall value of
particular programs. A “dashboard” that
presents key performance indicators should
be developed and published online to report
this information externally. This will not
only provide transparency to Midtown’s
stakeholders, it will serve to educate and
motivate the community to take action.
1 High-performance green building certification with third party or professional verification includes: LEED, EarthCraft, and ENERGY STAR

5. Tracking & Measurement 181
TRANSPORTATION Streetscape Program
Implementation
Miles of Streetscape
Renovated
14 21 by 2018
Number of pedestrians in
key corridors
To be established 10% increase by 2018
Revised Streetscape
Design Guidelines
N/A 2013
Bicycle Plan
Implementation
Miles of On-street Bicycle
Lanes
2.5 7.5 by 2020
Number of cyclists in key
corridors
To be established 20% increase by 2018
Enhanced
Transportation
Demand Management
Commuters Registered
in Commuter Rewards
Program
11,171 15,000 by 2020
Vehicle Miles Reduced 58,594,065 80 million by 2020
Tons of Air Pollution
Reduced
46,416 62,524 by 2020
Money Saved from Fuel
and Maintenance
$29,297,032 $40 million by 2020
Improved Local Transit Completed Transit
Circulation Study
N/A 2014
Implemented Transit
App/Wayfinding
N/A 2014
WATER Green Stormwater
Infrastructure
Number of Private
Projects Incorporating
Green Stormwater
Infrastructure Design 3
11 20 by 2020
Number of Public
Projects Incorporating
Green Stormwater
Infrastructure Design
1 5 by 2020

GREENPRINT MIDTOWN
5. Tracking & Measurement
Susta inabi l i ty P lan 2012182
Restaurant Water
Efficiency Outreach
Program
Number of Restaurants
Using Low-Flow Fixtures
4
17 35 by 2017
Number of Restaurants
Using Water Efficient
Equipment 5
11 20 by 2017
Number of Restaurants
Adopting Water Saving
Policies
0 10 by 2017
Number of Restaurants
Using Water Efficient
Outdoor Practices6
17 10 by 2017
Multifamily Water
Efficiency Outreach
Program
Number of Buildings
Participating in Plumbing
Retrofit8
3 9 5 by 2017
Number of Buildings
Completing Water
Education Training10
0 5 by 2017
Number Buildings
Distributing WaterSaver
Kits
0 5 by 2017
Number of Buildings
Adopting Water Saving
Policies 11
0 5 by 2017
Rainwater Harvesting
Outreach Program
Number of Buildings
Using Rainwater
Harvesting
8 25 by 2020
Number of Buildings
Using Condensate
Capture
TBD 25 by 2020
Number of Views/
Attendees of Rainwater
Harvesting System Tour
0 200 by 2020
WASTE Restaurant Waste
Reduction Outreach
Program
Total Number of
Restaurants Composting
2 8 by 2017
Total Number of
Restaurants Recycling 12
5 13 20 by 2017
Total Number of
Restaurants Enrolled
in Waste Reduction
Program 14
6 24 by 2017
3 Waterless urinals, low-flow/high-efficiency toilets4 Low-flow pre-rinse spray valve or other equipment 5 Rainwater harvesting for fountain or landscaping7 Results from Greenprint Midtown – Restaurant Survey8 Multi-family buildings constructed prior to 1994 are eligible for toilet retrofit rebate through the City of Atlanta, plumbing retrofit program includes all fixture types9 Results from Greenprint Midtown – Multi-family Residence Survey, respondents using low-flow toilets10 To be developed by Midtown Alliance11 Outdoor & indoor water use policies

5. Tracking & Measurement 183
Multifamily Building
Recycling Program
Total Number of
Buildings Offering and
Promoting Recycling 15
20 16 100% by 2017
Electronics Recycling
Outreach Program
Number of Electronics
Recycling Events
0 1-2 Events/Year by
2013
OPEN SPACE Civic Square
Acquisition &
Development Program
Midtown Public Spaces
Master Plan
N/A Plan adopted by 2013
Acquisition of Land N/A Land acquired by 2017
Development of Land N/A Land developed by
2018
Temporary Park and
Plaza Development
Number of New
Temporary Parks and
Plazas
1 5 by 2020
Existing Open Space
Activation
Number of Open Spaces
Activated
N/A 3 by 2015
Landscaping
Enhancement Program
Tree Audit N/A Completed by 2014
Bridge Improvements N/A Comleted by 2016
CTP - lighting
enhancements
N/A Completed by 2016
CTP - vertical greening N/A Completed by 2016
12 Recycling of glass, plastic, and aluminum in addition to cardboard, paper, and cooking oil13 Composting and Recycling results from Greenprint Midtown – Restaurant Survey14 157 food service facilities in Midtown, 6 participate in Zero Waste Zone program15 Promoting: on-going active encouragement
Results from Greenprint Midtown – Multi-family Residence Survey

GREENPRINT MIDTOWN
6. Appendix
Susta inabi l i ty P lan 2012184
6SECTION

6. Appendix 185
appendices
APPENDIX A:
Community Visioning + Engagement Summary
APPENDIX B:
Best Practices
APPENDIX C:
Policy + Infrastructure Barriers To Implementation

GREENPRINT MIDTOWN
6. Appendix
Susta inabi l i ty P lan 2012186
Community engagement strengthens planning processes by including
all relevant stakeholders in the plan. This engagement fosters a sense of
ownership, increasing the level of investment in a plan’s success. It also
anticipates roadblocks, allowing for proactive, constructive solutions.
Building on the success of its Blueprint Midtown process, Midtown Alliance
remained committed to collaborative community engagement during the
development of Greenprint Midtown. The following methods were used to
gather community feedback in order to help shape the vision and planning
priorities for Greenprint Midtown.
GREENPRINT MIDTOWN INTERACTIVE
Visioning Session: The community was invited to
engage more deeply in the planning process by
participating in five rounds of facilitated discus-
sions. Attendees provided feedback on specific
sustainability strategies for the plan’s five impact
areas.
GREENPRINT MIDTOWN BUILDING MANAGERS SURVEY
Building owners and property managers are an
important interest group to the Greenprint Mid-
town process due to their potential impact on
many of the plan’s strategies. Accordingly, Mid-
town Alliance solicited this group’s input through
an online survey that sought to better under-
stand the sustainability measures already prac-
ticed in Midtown buildings. The survey indicated
that the majority of respondents are actively en-
gaging tenants in developing and/or implement-
ing sustainability projects or programs.
GREENPRINT MIDTOWN KICK-OFF MEETING
As the first step in community engagement Mid-
town Alliance introduced Greenprint Midtown to
the community, and its associated goals. Attend-
ees provided valuable and informative feedback
on their vision for sustainability in the District that
would inform later steps of the planning process,
particularly the community survey. The results of
the input are presented as word clouds with the
most frequently used words or phrases appearing
larger.
GREENPRINT MIDTOWN COMMUNITY SURVEY
Midtown Alliance invited further comment
through an online community survey in which
the public was asked about their personal sus-
tainability actions. The survey indicated that the
majority of respondents either live or work in
Midtown and strongly agree that pursuing sus-
tainability is a key factor in improving Midtown’s
overall quality of life. The survey also solicited
ideas for community-level programs and out-
comes.
A.1 Community Visioning + Engagement Summary

6. Appendix 187
GREENPRINT MIDTOWN RESTAURANT SURVEY
The significant impact restaurants have on the
environment from their energy consumption,
water use, and waste generation provides a
need for a characterization study. Midtown
Atlanta has a particularly high concentration
of restaurants and it is important to better
understand current sustainability practices
and aspirations. A survey was conducted of
restaurants in Midtown which revealed that less
than half of respondents have a comprehensive
recycling program or have implemented water
efficiency measures. The survey results inform
priority program recommendations and baselines
for measurement and tracking.
GREENPRINT MIDTOWN MULTI-FAMILY BUILDINGS RESIDENTS SURVEY
Multi-family buildings are the predominant
residential building type in Midtown Atlanta.
The high concentration of multi-family residenc-
es and the lack of publicly available data create
the need for a characterization study. A survey
was conducted on multi-family residences in
Midtown Atlanta to better comprehend sustain-
ability practices. The survey indicated that multi-
family condominiums are providing recycling and
smaller multi-family apartments either did not
respond or do not offer recycling. The survey re-
sults inform priority program recommendations
and baselines for measurement and tracking.
The following are notes and summaries of the
community engagement process.

GREENPRINT MIDTOWN
6. Appendix
Susta inabi l i ty P lan 2012188
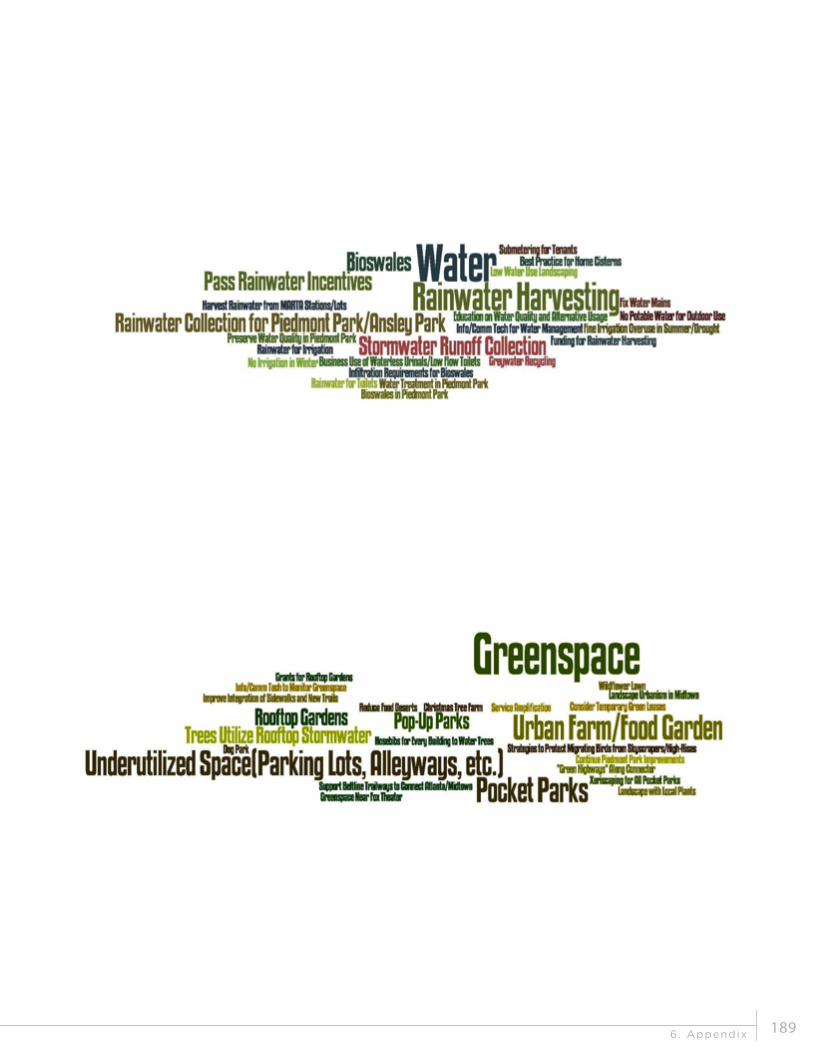
6. Appendix 189

GREENPRINT MIDTOWN
6. Appendix
Susta inabi l i ty P lan 2012190
A.2 Greenprint Midtown Interative Visioning Session Summary
BACKGROUND
Midtown Alliance hosted the Greenprint Midtown Interactive Visioning Session on Tuesday, April 17,
2012 at the AT&T Conference Center in Atlanta, Georgia. Over 100 attendees participated in five rounds
of facilitated discussions and provided feedback on sustainability strategies in the five Impact Areas:
energy, open space, transportation, waste and water. Professionals familiar with Midtown and with
subject area expertise volunteered as facilitators for the event. This document summarizes feedback
from each Impact Area and specific notes on draft strategies.
UNIVERSAL THEMES FOR ALL IMPACT AREAS
• Education and communication to the public
and to Midtown stakeholders is critical.
• Viable funding and creative financing
options are needed for all strategies and
programs.
• Programs should be offered to both
commercial and residential buildings.
• Competition and positive recognition
can spur interest and participation.
• Metrics must be identified to track progress
towards sustainability goals.
ENERGY
Facilitators: Brandon Jones, Diana Burk, Scott
Briskey, Mandy Mahoney and John Bracey
HIGHLIGHTS
• Retrofits seem logical; funding and
communication to tenants are key to
success.
• Energy data is important to understand
opportunities but must be aggregated and/
or anonymized to protect privacy.
• Alternative fueling stations are a good
education opportunity, but not currently a
high priority.
• Incentives, not mandates, are strongly
preferred for green building certification.
• Demonstration renewable energy project
is valuable but it must be highly visible and
have an education component.

6. Appendix 191
NOTES
Strategy 1:
Energy Efficient Retrofit Programs
• Funding, PAL, Georgia Power Rebates
• Incentives are important – split between
tenants/multi-family
• Engage a diversity of buildings - Fortunate
500 business to Mom & Pop
• Targets Midtown’s main source of energy use
• Communicate why this is important
• Establish competition between tenants (via
submetering) and between buildings
• Focus on cost effectiveness
• Multi-family buildings offer low hanging fruit
• Potential to have a huge impact that is
measurable
• Big selling point for buildings
• Monitoring/immediate feedback assists with
behavior change
• Residential should be included in energy
efficiency program
• Prioritize oldest buildings
Strategy 2:
Conservation Through Systematic Monitoring of Energy Use
• Providing accountability to see impact,
building labeling
• Recognition for high performers
• Provide data post building audit
• Hard to do publically – comparisons need to
be anonymous
• Monitoring useful to management
• Benchmarking – how do you compare?
• Reward/recognize /pat you on back
• Competition - show how buildings are
meeting goals
• Aggregate data or firms are not going to
disclose
• Numbers are gold
• Residential buildings
• Concerns about public/private data
• Volunteer program, not punitive,
participatory, voluntary reporting
Strategy 3:
Alternative Fueling Stations
• Electric vehicles still too expensive
• Place stations in greenspaces
• Clean Natural Gas, biofuels, EV is best
for non-fleet
• Public awareness needs to happen to
build demand
• Need data to show adoption rate
• Plug-ins are recently standardized – fast
charge are not
• Cost to charge inexpensive - $1/day
• Important moving forward
• Biofuel and CNG hard to produce

GREENPRINT MIDTOWN
6. Appendix
Susta inabi l i ty P lan 2012192
• Gas stations have left b/c of land value – left
up to property owners
• Preferred parking requirement in SPI zoning
not enforced
• Flex fuel gas station – use existing partners
• Operating cost impacts for buildings with
charging stations
• Consider distance between stations
• Lower priority, but planting seed is important
Strategy 4:
Certified Energy Efficient New Buildings
• Market driven – do not need to require
• Corporate/social responsibility helps to
create market for green bulidings
• Make permitting easier
• Medium priority – how many new buildings
are planned?
• Focus on LEED OB&M and existing projects
• Incentives not mandates due to difficulty of
achieving
• Establish a Green District with own
requirements
• Worried about continually changing criteria
• Tie to monitoring
Strategy 5:
Renewable Energy Demonstration Project
• Demonstration project - wind turbine
• Education display to answer “Where
does energy come from?”
• Needs to be super visible to raise awareness
• Solar powered street lights
• Already have this at Southface and
other buildings
• Publish a renewable energy project map
• Good idea - who will pay for demonstration?
• Portable project for education in schools/
businesses
OTHER
• Business innovation is heart of the would-be
marketplace
• Offer pre-paid energy cards for users
• Energy efficiency in public domain - is it
being used efficiently?
• Improve smart grid technology in District
• Consider strategies to address heat island
effect
• Parking structures and solar
• Awareness – waste energy map

6. Appendix 193
OPEN SPACE
Facilitators: Eric Bosman, Aaron Fortner, Eric
Kronberg, Greg Ramsey and Eric Bishop
• Greenspaces need to be more welcoming
and accessible to overcome perception that
spaces on private property are off-limits to
the public.
• High interest in connecting/linking existing
greenspaces.
• Significant overlap of “features that make
a good park” and “programs to activate
greenspace.”
NOTES
Favorite Open Space in Midtown
• Piedmont Park
• Winn Park
• Arts District Plaza (Peachtree & 15th Street)
• Federal Reserve
• Pocket Parks
• AT&T dog park
• Ansley Park
• Central Park
• Winn Park
• Tech Square Plaza
• 5th Street bridge
• Old Fourth Ward Park
• One Atlantic Center
Key Features that Make a Good Park and Programs to Activate Greenspace
• People
• Places to sit – benches, moveable tables and
chairs
• Shade during the day
• Good lighting at night
• Lawns for sitting or laying out
• Places for private, quiet reflection
• Clean environment
• Playground equipment (if I see mothers and
children in a park then I know it’s safe)
• Public art
• Outdoor music
• Social activities like classes (fitness, yoga,
painting, etc.)
• Community gardens
• Skateboarding ramps
• Vendors that would bring local businesses
into public open spaces
• Public drinking fountain
• Food and drink
• Active uses
GREENPRINT MIDTOWN
6. Appendix
Susta inabi l i ty P lan 2012194
• Dog park
• Festivals/events
• Games - Life size chess board, Bocce ball,
Disc Golf
• Reading room
• Live music
• People need to want to be there
• Clean
• Olmstead design
• Need to clearly be for the public
• Food trucks
• Movable seats
• Safety
• Water feature
• Inviting
• Pleasant
• Cool
• Walkable – within it and to it
• Visible, close to transport
• Safe/secured with cameras
• Exercise equipment
• Access for bikes
• Solar plug in for laptops
• Entertainment – music/stages
• Pet friendly
• Wi-Fi
• Farmers Market
• Artistic bike racks
• Connected green places to walk
• More green connection – green roof @ North
Ave MARTA station
• Place to walk not in the city
• Link historic sites – walking trail
• Eyes on the street
• Laptop connection to linger
• Fitness events
• Greenway linkage
• Limit auto traffic
• Maintain privacy gradients – public/intimate
spaces
• Lots of trees
• Small concerts
• More intimate spaces
• Tie schools to playgrounds, safe for families
• Connect private business spaces to city
spaces
• Boundaries are important to create intimacy
• Outdoor Movies
• Parks that don’t work – lack of access,
no focus

6. Appendix 195
Top 3 preferences for type of open space in Midtown
• Small pocket parks ( a few suggested
locations – near the Fox Theatre since it is
such a high-traffic area for pedestrians, near
the food truck venue at Peachtree and 13th
Street, along the I-75/85 corridor, near 10th
and Juniper)
• Playgrounds and community gardens were
mentioned more often that dog parks which
were rarely discussed
• The ability to have BOTH quiet,
contemplative areas AND active areas
within the same space was a priority
• Using food trucks to activate open spaces
was mentioned multiple times. There seems
to be a need for a more enhanced open
space in the vicinity of the food trucks at 13th
Street since there is very little opportunity
for people to sit and hang out in the
parking lot.
• Gaming would be a good way to program
open space near Tech Square. For instance
if the parking lot at the NE corner of Spring
and 5th Street could be activated with
foosball, ping pong, min golf, those would
stand a good chance of success given the
captive audience of students and the high
pedestrian traffic at lunchtime.
• Pocket Parks/connections in the proposed
locations:
•Piedmont/Junipersouthof10th
•75/85corridorparkandtrail
•14th/Peachtree
•SpringStreet
•12th/Peachtree
•InfrontofNoodle
•FoxTheatre/MARTA–NorthAve
•BikelaneonWilliams/Fowler
•10th/Juniper/Piedmont
•ParkopportunityonPeachtree
•Near5th/TechSquare
•12th/WestPeachtree
•14thStreet/proposedsymphonyhallsite
•Promenadeon10thfromMARTA
to Piedmont Park
•DewberryparkingacrossfromFed
• Private/safe open space – rooftops, etc
• Linear Connections between parks
• Green roofs for MARTA stations
• Family friendly settings by schools
• Green near retail and restaurants
• More active spaces near Tech
• Plaza across the connector
• Linking greenspaces very important
• Living walls – large buildings/parking
• Lots of plazas over MARTA are uninviting
• Need places to walk, need circuits of
greenspace
• Convert tops of parking decks to greenspace
• Daylight streams where possible
• Convert parking lots to decks and parks

GREENPRINT MIDTOWN
6. Appendix
Susta inabi l i ty P lan 2012196
OTHER
• Sponsor an avenue to make it green
• Greenspaces around schools
• Identify users (bus/res/school) and how
underserved – focus groups
TRANSPORTATION
Facilitators: John Maximuk, Amy Goodwin, Kevin
Bacon, Robert Reed and Alan Steinbeck
HIGHLIGHTS
• Pedestrian safety is key – put pedestrians
first
• More education needed on the concept of
“complete streets” and how it can address
the wide variety of interests in transportation
infrastructure.
• Need a more complete and safer bicycle net
work before bike sharing is launched.
• More information wanted on available transit
services and options for the “last mile” after
leaving transit.
• Concept of “managed parking” was not well
understood, but interest was high in
addressing parking challenges.
• Safety concerns must be addressed to gain
support for bike infrastructure.
NOTES
Strategy 1:
Complete Streets Enhancement Projects
• Focus on connecting/improving sidewalks
outside of the MID
• Stormwater problems/strategies
• Rebuilt-state of good repair – include
bike paths
• Peachtree as pedestrian mall between
5th-10th Streets
• Redesign Piedmont/Juniper for people
• Pockets of sidewalk: good and bad
• Grade issues
• Close Peachtree on weekend to encourage
more walking/biking
• Provide bike access on 10th Street
• Wider sidewalks throughout the district
• Consider water quality and quantity
• Slim down vehicular lanes to make room for
bikes
• Maintain crosswalks, bike lanes, bike boxes
• Monroe Road Diet
• See Santa Monica, CA as example
• Example project of complete street
• Need better N-S access for bikes
• Protected lanes are key for cyclists

6. Appendix 197
• More two-way streets – better retail, speeds
too fast
• Juniper/Piedmont two-way conversion is
needed
• Enhance transit in conjunction with
streetscapes
• What is a complete street – need general
education
• 3 lanes to 2 lanes ok if traffic times, light
synchronized
• Road diet top priority – especially on W.
Peachtree
• Speeds unacceptable on Spring and W.
Peachtree
Strategy 2:
Bike and Car Sharing Programs
• Consider terrain and bikes
• Need protected bike infrastructure
• Need network first
• People need to feel safe on bike
• Not so much for older residents
• Invest in tandem with bike infrastructure
• Bike share program for Beltline makes sense
• Zipcar is fine should be in the mix but not
top priority
• Zipcar is essential – add more cars
• Bike share more touristy – not priority
Strategy 3:
Promotion & Expansion of Public & Institutional Transit Services
• Currently not user friendly
• Need Peachtree Street trolley
• Midtown station bus – last mile problems
• Cost benefit of transit vs. cars
• Fine grain routing application
• Support for transit app
• Expanding rail – wide support
• Last mile connectivity
• Safety issues
• Better bus coordination
• GA Tech Trolley expansion
• Shuttles to park haven’t worked –
challenging
• Access to local food by transit
• Streetcars, expand transit
• More east-west transit
• Circulators – feel welcome on Tech Trolley
but not on Emory shuttle
• Advertise routes and that they have public
access
• Expand stops for Emory, expand promotion
• Info on train schedules in stations
• Circulators have good level of service, not
top priority to expand

GREENPRINT MIDTOWN
6. Appendix
Susta inabi l i ty P lan 2012198
Strategy 4:
Managed Parking Solutions
• Need proper signage
• Close streets for weekends
• Local neighborhood resistance
• Dedicated parking for apt buildings for car
share
• Develop parking smartphone app
• Don’t let cars in at all – reduce parking
• Shared parking w/ private decks for
Zipcars
• Strong support for parking app – people
don’t know where all the parking is
• Signage/standardization
• More on-street parking
• Don’t want to encourage driving with
more parking
• Parking too cheap
• Satellite lots for events
• Limit number of spaces per building/
office
• Promote/expand guaranteed ride home
• Need more bike parking
• Would support on street parking if it
helps to reduce speeds, support retail
Strategy 5:
Expanded Bicycle Network
• Need better N-S access
• More police on bikes
• Safety is top priority
• Afraid to ride – traffic too fast and distracted
• Prefer dedicated bike lanes
• 3 foot lanes and sharrows are inadequate
• Color lanes to make more visible
OTHER
• Beltline connectivity
• TIA alignment
WASTE
Facilitators: Holly Elmore, Synkai Harrison,
Suzanne Burns
HIGHLIGHTS
• Public and multi-family recycling are very
desirable programs, but public education is
critical for success.
• Need continuous waste services – not just
once per month.
• Restaurant waste strategies should be a high
priority, but may be difficult due to lack of
infrastructure.

6. Appendix 199
NOTES
Strategy 1:
Public Recycling
• Great ideas as long as you can keep it clean
• Metric-How many buildings currently have
recycling programs?
• Need an education campaign
• Uniformity in messaging, branding, signage
and receptacles is important and should be
consistent throughout Midtown
• Metrics-What is being captured already?
What is your baseline?
• Easier to implement because part of
common practice
• Expected by visitors to the City
• Need intuitive separation/signage
• Barriers: logistics, who separates, source
separation
• Not enough – need education and signage
• People don’t pay attention to source
separation
• Top priority
Strategy 2:
Electronics Recycling Program for Midtown
• Consider quarterly recycling events
• What are the incentives for participation?
• Livable Buckhead has a successful
electronics recycling program. Consider
reaching out to them to see “how they are
doing it”
• Regular collection would be helpful,
awareness campaign
• Roll offs a few times a year
• Partner with grocery stores for drop-off
• Need to be transparent about ultimate
disposal of components
• Not frequent enough, volume based
• Battery recycling party
Strategy 3:
Food Service Waste Reduction
• Metric: What is the current capacity of
facilities accepting food waste?
• Composting is a great idea, facility is key
-most difficult strategy
• Grease recycling – add as unique initiative
• Second priority
• Like idea of methane harvesting from
compost
• First priority
Strategy 4:
Recycling in Multifamily & Office Buildings
• This would have the greatest impact. Should
be moved to number 1.

GREENPRINT MIDTOWN
6. Appendix
Susta inabi l i ty P lan 2012200
• This should be ranked equally with public
recycling. What is being captured in public
recycling verses multi-family/office will
determine which to focus on.
• What works and what doesn’t – public
education campaign is key
• Paper shredding day at condos –
perceived as easy to do
Strategy 5:
Construction Waste Reduction
• There is a significant amount being done
already
• Could have a lot of impact in Midtown,
specifically due to building retrofits
OTHER
• What are the specific overall goals for waste?
Tonnage or public awareness? If the goal is
diversion (tonnage), then construction waste
may have the greatest overall impact. If the
goal is to raise public awareness, then
strategies that are visible should have a
greater impact. (public, multifamily and
office building recycling)
• What are the metrics? How will you track
progress to set goals?
• Additional Strategy: Consider competition
between buildings for waste diversion.
• Implementing recycling programs in older
buildings may be challenging.( issues with
existing spaces and infrastructure)
• New construction-should be easier to
implement programs. What is the incentive
to participate?
• Ease of implementation with no additional
cost
• Identify which programs have been
successful in Midtown.
• Metrics-Identify gaps in recycling efforts.
Determine how to fill those gaps.
• Metrics-What type of waste is being
generated? (Context: This should influence
the types of strategies that are selected)
• What impact does pet waste have?
• What are the economic incentives for each of
the strategies? How do each compare
considering ease of implementation
• Midtown Alliance could serve as a clearing
house providing recommendations, list
of preferred contractors, etc.
• The strategy must be easy to implement
and participate in.
• Midtown Alliance should reach out to condo
associations to inform them about what is
required.(referring to city ordinances
requiring recycling)
• Emory has been successful in bring vendors
to the area (vendors who are looking to take
recycled materials). Midtown Alliance should
look to Emory as a resource.
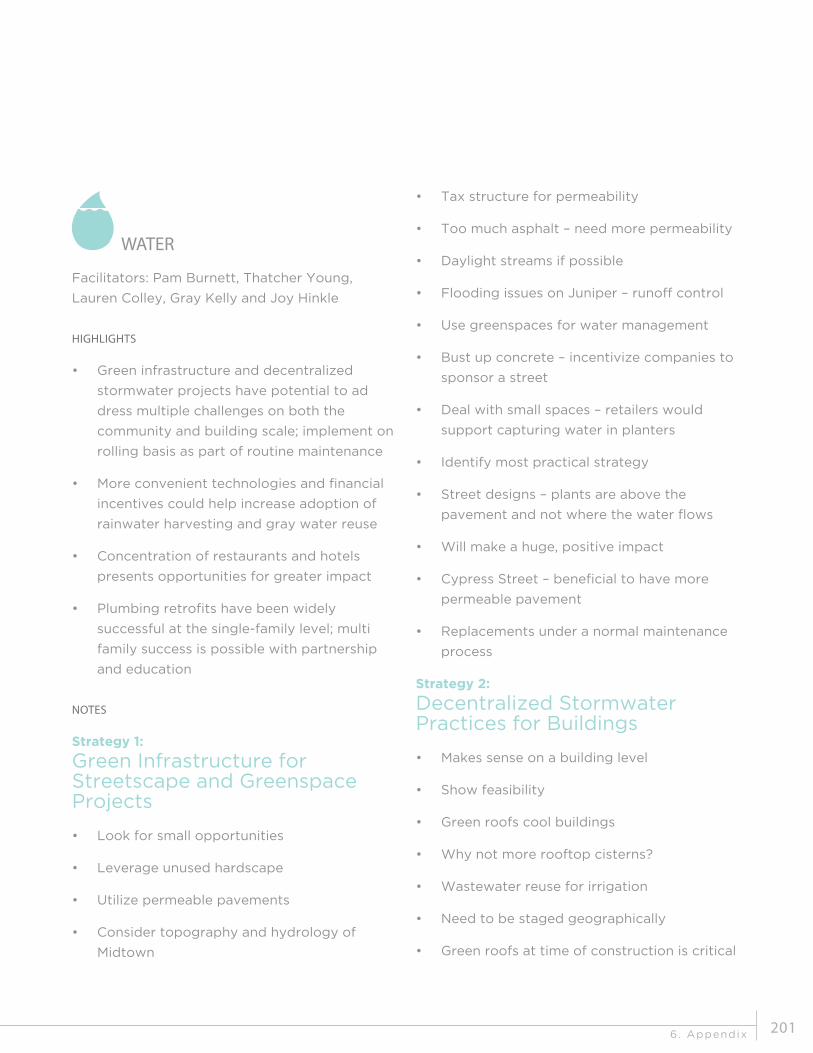
6. Appendix 201
WATER
Facilitators: Pam Burnett, Thatcher Young,
Lauren Colley, Gray Kelly and Joy Hinkle
HIGHLIGHTS
• Green infrastructure and decentralized
stormwater projects have potential to ad
dress multiple challenges on both the
community and building scale; implement on
rolling basis as part of routine maintenance
• More convenient technologies and financial
incentives could help increase adoption of
rainwater harvesting and gray water reuse
• Concentration of restaurants and hotels
presents opportunities for greater impact
• Plumbing retrofits have been widely
successful at the single-family level; multi
family success is possible with partnership
and education
NOTES
Strategy 1:
Green Infrastructure for Streetscape and Greenspace Projects
• Look for small opportunities
• Leverage unused hardscape
• Utilize permeable pavements
• Consider topography and hydrology of
Midtown
• Tax structure for permeability
• Too much asphalt – need more permeability
• Daylight streams if possible
• Flooding issues on Juniper – runoff control
• Use greenspaces for water management
• Bust up concrete – incentivize companies to
sponsor a street
• Deal with small spaces – retailers would
support capturing water in planters
• Identify most practical strategy
• Street designs – plants are above the
pavement and not where the water flows
• Will make a huge, positive impact
• Cypress Street – beneficial to have more
permeable pavement
• Replacements under a normal maintenance
process
Strategy 2:
Decentralized Stormwater Practices for Buildings
• Makes sense on a building level
• Show feasibility
• Green roofs cool buildings
• Why not more rooftop cisterns?
• Wastewater reuse for irrigation
• Need to be staged geographically
• Green roofs at time of construction is critical

GREENPRINT MIDTOWN
6. Appendix
Susta inabi l i ty P lan 2012202
• Incentives needed – ROI – cost vs.
maintenance
• Owners are short term so no long term
interest in products
• Visible cisterns may encourage other to
add their own
• Stormwater credits for on-site controls
• Daily use of the water provide quick payback
– irrigation longer
• Capture condensate from AC/cooling towers
• Incentivize private property opportunities
• Food to reduce water to combined
stormwater system
Strategy 3:
Rainwater and Gray Water Harvesting for Irrigation
• Need real usage measurement, not
assimilated
• Scaling to more local distribution
• How to retrofit commercial buildings/code
for new constructions for gray water?
• Require at least for irrigation
• Need more storage facilities
• Store water on top of buildings
• Combine with Strategy 2
• Concerns about gray water due to use of
chlorine, consumptive use
• Helps with stormwater management
• Will reduce HOA fees by using stormwater in
other building uses
• Rebate/incentives needed
• Improved convenience for gray water use
• Systems are still expensive, can be
inconvenient
Strategy 4:
Efficiency Assessments and Recommendations for Large Commercial Users
• Data needs to be in your bill
• Show comparison on bills to educate
• Education has to be dollars and cents –
show the real numbers
• Commercial is more important – greater
potential savings
• Do we know this is a weakness?
• Leak detection for hotels and large buildings
• Visible monitoring of use – peer reviews
• Separation of water and sewer meters
• Take credit for the good water initiatives
• Focus on residential/single family – haven’t
large commercial buildings already done this
to save money?
• Tougher to implement but effective
• Older buildings should be reviewed for
efficiency

6. Appendix 203
• Fastest return for enhancing/improving the
supply problem
• Generate water with cooling towers
• Concentration of restaurants and hotels
present opportunities
• Collect/treat water onsite
Strategy 5:
Plumbing Retrofits for Multi-family Residences
• Education needed to improve use of current
programs
• Good program – simple ideas
• Front loading washer rebates
• Rebates are working well –publicize more
• Plumbing rebates – recycle toilets into
foundation materials
• Be more specific about how to implement
• Get volunteer teams to install the dual flush
adapters – technical school internships
• Because of triple lease, you don’t see savings
• Owners must be engaged

GREENPRINT MIDTOWN
6. Appendix
Susta inabi l i ty P lan 2012204
Survey: Greenprint Midtown Community Survey
Value Count Percent %
I live in Midtown 375 62%
I work in Midtown 313 51.7%
I am generally interested in Midtown and the Greenprint process 193 31.9%
Statistics
Total Responses 605
Value Count Percent %
Condominium/Townhome Owner 292 48.9%
Single-family Homeowner 163 27.3%
Apartment Renter 113 18.9%
Single-family Renter 29 4.9%
Statistics
Total Responses 597
Summary Report - Jul 31, 2012
1. Which of the following best describes you?
4. What type of housing best describes your current living situation?
Which of the following best describes you?
62%
51.7%
31.9%
I live in Midtown I work in Midtown I am generally interested in Midtown and the
Greenprint process
0
100
25
50
75
What type of housing best describes your current living situation?
48.9%
27.3%
18.9%
4.9%
Condominium/Townhome Owner Single-family Homeowner Apartment Renter Single-family Renter0
100
25
50
75

6. Appendix 205
5. If you participate in any of the following sustainability actions at home, what inspires you to do
so?
Saves
MoneyConvenience
Improved
performance/quality
It's the right
thing to do
Do not participate
in this actionResponses
Recycle paper, plastic, glass, aluminum5.9%
35
11.1%
66
4.9%
29
84.2%
501
11.8%
70595
Compost food scraps2.4%
14
2.1%
12
6.3%
37
16.1%
94
79.7%
466585
Use energy efficient light bulbs48.0%
285
5.2%
31
19.0%
113
61.1%
363
13.3%
79594
Lower thermostat in winter; raise thermostat
in summer
70.9%
421
2.0%
12
12.6%
75
49.2%
292
9.1%
54594
Turn off lights when not in the room72.1%
434
4.0%
24
8.5%
51
64.6%
389
1.0%
6602
Install WaterSense/low-flow plumbing
fixtures
28.8%
169
1.0%
6
6.1%
36
31.1%
182
54.3%
318586
Purchase ENERGY STAR labeled
electronics
45.5%
268
3.4%
20
17.0%
100
47.7%
281
24.8%
146589
Shop locally and purchase local food and
products when available
15.2%
90
24.1%
143
35.9%
213
58.6%
348
13.1%
78594
Use Zipcars3.4%
20
10.5%
61
2.1%
12
4.3%
25
87.0%
507583
6. If you take any of the following sustainability actions at your workplace, what inspires you to do
so?
Company
Policy
Personal
Habit
Saves
MoneyConvenience
It's the right
thing to do
Do not participate
in this actionResponses
Recycle paper, plastic, glass and aluminum26.3%
151
39.4%
226
5.6%
32
10.6%
61
63.8%
366
12.2%
70574
Turn off lights when not in the room14.6%
84
45.1%
260
21.5%
124
4.3%
25
53.6%
309
14.2%
82576
Shut down computer before leaving at end
of day
17.6%
101
38.7%
222
15.7%
90
3.5%
20
41.8%
240
27.7%
159574
Lower thermostat in winter; raise
thermostat in summer
16.4%
93
11.1%
63
13.4%
76
1.6%
9
20.2%
115
58.5%
332568
Print less or two-sided18.2%
105
32.3%
186
29.3%
169
9.0%
52
53.8%
310
17.0%
98576
Use refillable water bottles or reusable
mugs
11.8%
68
45.1%
259
22.8%
131
16.4%
94
53.0%
304
15.3%
88574
Participate on a "green team"7.4%
42
6.7%
38
2.1%
12
0.9%
5
17.0%
96
76.5%
433566
Shop locally and purchase local food and
products when available
5.8%
33
18.1%
103
4.6%
26
11.6%
66
31.5%
179
50.3%
286569
Use Zipcars1.1%
6
2.7%
15
1.4%
8
4.3%
24
4.0%
22
91.0%
506556

GREENPRINT MIDTOWN
6. Appendix
Susta inabi l i ty P lan 2012206
Value Count Percent %
Water conservation and reuse 260 43.1%
Energy efficiency and renewable energy options (i.e. solar power,
biofuels)293 48.6%
Waste reduction through increased recycling and composting 284 47.1%
Adding greenspace, community gardens and local foods markets 396 65.7%
Improving traffic congestion, transit options and walking/bicycling
conditions511 84.7%
Statistics
Total Responses 603
Value Count Percent %
Strongly Agree 321 53.1%
Agree 217 35.9%
Neutral 52 8.6%
Disagree 7 1.2%
Strongly Disagree 5 0.8%
Uncertain 2 0.3%
Statistics
Total Responses 604
7. Select the top three strategies you believe would be most impactful in making Midtown more
sustainable:
8. Pursuing sustainability is a key factor in improving Midtown's overall quality of life.
Select the top three strategies you believe would be most impactful in makingMidtown more sustainable:
43.1%48.6% 47.1%
65.7%
84.7%
Water conservation and
reuse
Energy efficiency and
renewable energy options
(i.e. solar power, biofuels)
Waste reduction through
increased recycling and
composting
Adding greenspace,
community gardens and local
foods markets
Improving traffic congestion,
transit options and
walking/bicycling conditions
0
100
25
50
75
Pursuing sustainability is a key factor in improving Midtown's overall qualityof life.
Strongly Agree 53.1%
Agree 35.9%
Neutral 8.6%
Disagree 1.2%
Strongly Disagree 0.8%
Uncertain 0.3%

6. Appendix 207
Value Count Percent %
Strongly Agree 272 45.4%
Agree 243 40.6%
Neutral 65 10.9%
Disagree 10 1.7%
Strongly Disagree 6 1%
Uncertain 3 0.5%
Statistics
Total Responses 599
Value Count Percent %
Yes 489 81.2%
No 39 6.5%
Unsure 74 12.3%
Statistics
Total Responses 602
9. Pursuing sustainability is important for Midtown's economic success.
10. Would you be more likely to support restaurants or businesses that make a strong commitment
to sustainability?
Pursuing sustainability is important for Midtown's economic success.
Strongly Agree 45.4%
Agree 40.6%
Neutral 10.9%
Disagree 1.7%
Strongly Disagree 1.0%
Uncertain 0.5%
Would you be more likely to support restaurants or businesses that make astrong commitment to sustainability?
81.2%
6.5%12.3%
Yes No Unsure0
100
25
50
75
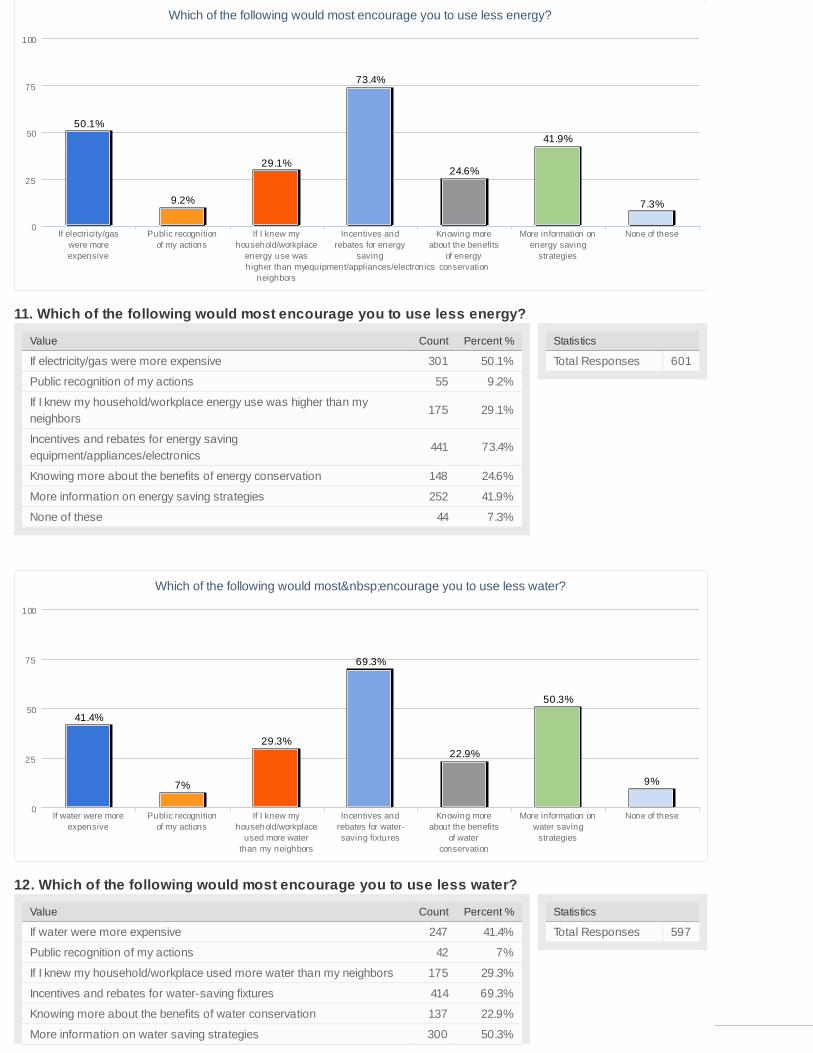
GREENPRINT MIDTOWN
6. Appendix
Susta inabi l i ty P lan 2012208
Value Count Percent %
If electricity/gas were more expensive 301 50.1%
Public recognition of my actions 55 9.2%
If I knew my household/workplace energy use was higher than my
neighbors175 29.1%
Incentives and rebates for energy saving
equipment/appliances/electronics441 73.4%
Knowing more about the benefits of energy conservation 148 24.6%
More information on energy saving strategies 252 41.9%
None of these 44 7.3%
Statistics
Total Responses 601
Value Count Percent %
If water were more expensive 247 41.4%
Public recognition of my actions 42 7%
If I knew my household/workplace used more water than my neighbors 175 29.3%
Incentives and rebates for water-saving fixtures 414 69.3%
Knowing more about the benefits of water conservation 137 22.9%
More information on water saving strategies 300 50.3%
Statistics
Total Responses 597
11. Which of the following would most encourage you to use less energy?
12. Which of the following would most encourage you to use less water?
Which of the following would most encourage you to use less energy?
50.1%
9.2%
29.1%
73.4%
24.6%
41.9%
7.3%
If electricity/gas
were more
expensive
Public recognition
of my actions
If I knew my
household/workplace
energy use was
higher than my
neighbors
Incentives and
rebates for energy
saving
equipment/appliances/electronics
Knowing more
about the benefits
of energy
conservation
More information on
energy saving
strategies
None of these0
100
25
50
75
Which of the following would most encourage you to use less water?
41.4%
7%
29.3%
69.3%
22.9%
50.3%
9%
If water were more
expensive
Public recognition
of my actions
If I knew my
household/workplace
used more water
than my neighbors
Incentives and
rebates for water-
saving fixtures
Knowing more
about the benefits
of water
conservation
More information on
water saving
strategies
None of these0
100
25
50
75

6. Appendix 209
None of these 54 9%
Value Count Percent %
Drive Alone 280 46.3%
Take transit 98 16.2%
Walk 412 68.1%
Bike 73 12.1%
Taxicab 22 3.6%
Other 36 6%
Statistics
Total Responses 605
Value Count Percent %
Standard gasoline automobile 507 84.1%
Diesel automobile 7 1.2%
Hybrid automobile 32 5.3%
Plug-in electric automobile 3 0.5%
Natural gas automobile 0 0%
Statistics
Total Responses 603
13. How do you typically travel within Midtown?
14. What type of vehicle(s) do you currently drive/operate within Midtown?
How do you typically travel within Midtown?
46.3%
16.2%
68.1%
12.1%
3.6%6%
Drive Alone Take transit Walk Bike Taxicab Other0
100
25
50
75
What type of vehicle(s) do you currently drive/operate within Midtown?
84.1%
1.2%5.3%
0.5%3.3%
16.6%
6.5%2.7%
Standard
gasoline
automobile
Diesel
automobile
Hybrid
automobile
Plug-in electric
automobile
Motorcycle/Scooter Bicycle I do not operate
any vehicle in
Midtown
Other vehicle0
100
25
50
75

GREENPRINT MIDTOWN
6. Appendix
Susta inabi l i ty P lan 2012210
Motorcycle/Scooter 20 3.3%
Bicycle 100 16.6%
I do not operate any vehicle in Midtown 39 6.5%
Other vehicle 16 2.7%
Value Count Percent %
Drive Alone 345 59.2%
Take transit 105 18%
Carpool 38 6.5%
Walk 130 22.3%
Bike 43 7.4%
Vanpool 0 0%
Telework 38 6.5%
Statistics
Total Responses 583
Value Count Percent %
Extending rail/bus routes to more places 362 60.9%
Statistics
Total Responses 594
16. How do you typically commute to and from work?
17. Which of the following would encourage you to take transit or use transit more often in Midtown?
How do you typically commute to and from work?
59.2%
18%
6.5%
22.3%
7.4% 6.5%
Drive Alone Take transit Carpool Walk Bike Telework0
100
25
50
75
Which of the following would encourage you to take transit or use transit moreoften in Midtown?
60.9%
49%
17.8%
43.9%
58.1%
13.6%
Extending rail/bus
routes to more places
More frequent transit
service
More information about
available transit
service
Real-time train/bus
arrival information
More local
shuttles/trolleys within
Midtown
None of the above0
100
25
50
75

6. Appendix 211
More frequent transit service 291 49%
More information about available transit service 106 17.8%
Real-time train/bus arrival information 261 43.9%
More local shuttles/trolleys within Midtown 345 58.1%
None of the above 81 13.6%
Value Count Percent %
More bicycle lanes 375 62.8%
More secure bicycle parking 210 35.2%
Having showers available at my workplace 106 17.8%
Slower traffic 157 26.3%
Training classes for safer bicycling 47 7.9%
Bicycle sharing program 135 22.6%
None of the above 192 32.2%
Statistics
Total Responses 597
18. Which of the following would encourage you to ride a bicycle or ride a bicycle more often in
Midtown?
19. Additional greenspace is important for Midtown.
Which of the following would encourage you to ride a bicycle or ride a bicyclemore often in Midtown?
62.8%
35.2%
17.8%
26.3%
7.9%
22.6%
32.2%
More bicycle lanes More secure bicycle
parking
Having showers
available at my
workplace
Slower traffic Training classes for
safer bicycling
Bicycle sharing
program
None of the above0
100
25
50
75
Additional greenspace is important for Midtown.
Strongly Agree 58.1%Agree 28.5%
Neutral 10.9%
Disagree 1.7%
Strongly Disagree 0.7%
Uncertain 0.2%

GREENPRINT MIDTOWN
6. Appendix
Susta inabi l i ty P lan 2012212
Value Count Percent %
Strongly Agree 346 58.1%
Agree 170 28.5%
Neutral 65 10.9%
Disagree 10 1.7%
Strongly Disagree 4 0.7%
Uncertain 1 0.2%
Statistics
Total Responses 596
Value Count Percent %
Dog run 146 24.4%
Playground 95 15.9%
Tables and chairs 291 48.6%
Public art (i.e. sculpture, fountain) 330 55.1%
Active recreation (i.e. shuffleboard) 236 39.4%
Community food garden 260 43.4%
Natural space 340 56.8%
Statistics
Total Responses 599
20. Select the top three features you would most want to see in a new public greenspace in
Midtown:
Select the top three features you would most want to see in a new publicgreenspace in Midtown:
24.4%
15.9%
48.6%
55.1%
39.4%43.4%
56.8%
Dog run Playground Tables and chairs Public art (i.e.
sculpture, fountain)
Active recreation
(i.e. shuffleboard)
Community food
garden
Natural space0
100
25
50
75
If available in Midtown, would you participate in any of the following programsto reduce our waste stream?
73.6%
85%
50.7%
67.3%
Public space recycling Electronics recycling Community composting Household hazardous waste collection0
100
25
50
75

6. Appendix 213
Value Count Percent %
Public space recycling 421 73.6%
Electronics recycling 486 85%
Community composting 290 50.7%
Household hazardous waste collection 385 67.3%
Statistics
Total Responses 572
21. If available in Midtown, would you participate in any of the following programs to reduce our
waste stream?
2. What is your home zip code?
Count Response
1 20009
1 30004
1 30009
1 30016
2 30022
13 30030
2 30032
6 30033
2 30039
1 30043
1 30044
1 30046
4 30047
1 30064
2 30066
5 30067
1 30068
3 30075
1 30076
4 30078
5 30080
3 30082
3 30084
1 30088
1 3009
2 30101
1 30102
1 30106
4 30127
2 30135
1 30152
1 30157
1 30188
1 30189
2 30214
1 30248
1 30263
1 30268

GREENPRINT MIDTOWN
6. Appendix
Susta inabi l i ty P lan 2012214
1 30269
1 30274
1 30281
1 303019
2 30303
9 30305
22 30306
17 30307
131 30308
221 30309
3 30310
1 30311
16 30312
3 30313
14 30316
5 30317
9 30318
7 30319
14 30324
2 30326
5 30328
2 30329
2 30331
4 30332
1 30337
4 30338
2 30339
1 30340
3 30341
2 30342
3 30344
3 30345
2 30363
1 30513
1 30518
1 30548
1 30601
1 330097
1 90068
3. What is your work zip code?
Count Response
3 0
1 11230
1 17603
1 20009
1 30004
1 30005

6. Appendix 215
1 30009
1 30014
1 30022
4 30030
1 30032
2 30035
1 30044
1 30046
1 30060
1 30062
1 30075
1 30076
2 30084
1 30091
1 30094
1 30096
1 30097
1 30114
1 30117
1 30122
2 30144
1 30189
1 30260
1 30268
1 30297
3 30301
3 30302
52 30303
6 30305
6 30306
3 30307
107 30308
238 30309
1 3030930005
1 3030930303
2 30310
2 30312
5 30313
2 30317
10 30318
7 30319
3 30320
7 30322
5 30324
5 30326
2 30327
8 30328
5 30329
26 30332
1 30333
1 30334

GREENPRINT MIDTOWN
6. Appendix
Susta inabi l i ty P lan 2012216
2 30336
1 30337
2 30338
18 30339
1 30340
4 30341
1 30342
1 30345
3 30346
1 30354
2 30360
2 30361
4 30363
2 30366
4 30375
1 30513
1 30601
1 30605
1 30909
1 31901
1 33016
1 33180
15. How long is your commute to work in miles one-way?
Count Response
77 0
87 1
24 10
1 100
1 109
11 11
16 12
11 13
8 14
16 15
3 16
2 17
6 18
1 19
73 2
10 20
1 200
2 21
2 22
3 23
2 24
12 25
3 26

6. Appendix 217
3 27
3 28
58 3
9 30
1 31
2 32
2 33
3 35
3 38
26 4
4 40
1 42
2 45
36 5
2 50
1 560
24 6
19 7
13 8
3 9

GREENPRINT MIDTOWN
6. Appendix
Susta inabi l i ty P lan 2012218
Survey: Greenprint Midtown Building Owners & Managers Survey
Value Count Percent %
Office - Class A 10 55.6%
Office - Class B 1 5.6%
Hotel 1 5.6%
Retail 1 5.6%
Residential - Condo 5 27.8%
Residential - Apartment 0 0%
Statistics
Total Responses 18
Value Count Percent %
Very Satisfied 7 38.9%
Satisfied 9 50%
Neutral 2 11.1%
Statistics
Total Responses 18
Sum 77.0
Average 4.3
Summary Report - Jul 31, 2012
3. PRIMARY Building Type
17. Perceived Overall Occupant Comfort at Building Level
PRIMARY Building Type
55.6%
5.6% 5.6% 5.6%
27.8%
Office - Class A Office - Class B Hotel Retail Residential - Condo0
100
25
50
75
Perceived Overall Occupant Comfort at Building Level
Very Satisfied 38.9%
Satisfied 50.0%
Neutral 11.1%

6. Appendix 219
Dissatisfied 0 0%
Very Dissatisfied 0 0%
StdDev 0.65
Max 5.0
Value Count Percent %
Electric 11 64.7%
Gas 6 35.3%
Other 0 0%
Statistics
Total Responses 17
Value Count Percent %
Yes 6 33.3%
No 10 55.6%
Control Type 6 33.3%
Statistics
Total Responses 18
18. PRIMARY Water Heating System
20. Does the building have central lighting controls?
PRIMARY Water Heating System
64.7%
35.3%
Electric Gas0
100
25
50
75
Does the building have central lighting controls?
33.3%
55.6%
33.3%
Yes No Control Type0
100
25
50
75

GREENPRINT MIDTOWN
6. Appendix
Susta inabi l i ty P lan 2012220
Value Count Percent %
Photocell 11 64.7%
Time Clock 14 82.4%
Centralized 3 17.6%
Combination 4 23.5%
Other 1 5.9%
Statistics
Total Responses 17
Value Count Percent %
Detention 1 8.3%
Retention 3 25%
Integrated 4 33.3%
Other 4 33.3%
Statistics
Total Responses 12
22. What types of exterior lighting controls are used?
23. PRIMARY on-site stormwater management strategy
What types of exterior lighting controls are used?
64.7%
82.4%
17.6%
23.5%
5.9%
Photocell Time Clock Centralized Combination Other0
100
25
50
75
PRIMARY on-site stormwater management strategy
8.3%
25%
33.3% 33.3%
Detention Retention Integrated Other0
100
25
50
75

6. Appendix 221
Value Count Percent %
Toilet 18 100%
Faucet 18 100%
Shower 16 88.9%
Pool 3 16.7%
Fountain 7 38.9%
Irrigation System 16 88.9%
Pre-Rinse Spray Valve 2 11.1%
Dishwasher 17 94.4%
Icemaker 15 83.3%
Laundry Facility 7 38.9%
Process Water 1 5.6%
Cooling System (Cooling Tower, Evaporative Cooler, etc) 13 72.2%
Heating System (Boiler, Humidifier, etc) 7 38.9%
Other 1 5.6%
Statistics
Total Responses 18
24. Which of the following water-using fixtures are installed at the building?
25. Are any of the following alternative water sources used at the building?
Rainwater Harvesting System Grey Water Recycling System Private Well Other Responses
Indoor Use0.0%
0
0.0%
0
0.0%
0
100.0%
11
Outdoor Use50.0%
3
0.0%
0
33.3%
2
16.7%
16
Combination0.0%
0
0.0%
0
0.0%
0
0.0%
00
Which of the following water-using fixtures are installed at the building?100% 100%
88.9%
16.7%
38.9%
88.9%
11.1%
Toilet Faucet Shower Pool Fountain Irrigation
System
Pre-Rinse Spray
Valve
All others0
100
25
50
75

GREENPRINT MIDTOWN
6. Appendix
Susta inabi l i ty P lan 2012222
Value Count Percent %
Master Meter 17 94.4%
Sub-Meter by Tenant 10 55.6%
Irrigation Meter 13 72.2%
Statistics
Total Responses 18
Value Count Percent %
Paper 18 100%
Cardboard 18 100%
Plastic 17 94.4%
Glass 16 88.9%
Aluminum 16 88.9%
Other 5 27.8%
Statistics
Total Responses 18
26. What types of water meters are used within the building?
29. If recycling is offered within the building, what items are accepted by your provider?
What types of water meters are used within the building?
94.4%
55.6%
72.2%
Master Meter Sub-Meter by Tenant Irrigation Meter0
100
25
50
75
If recycling is offered within the building, what items are accepted by yourprovider?
100% 100%94.4%
88.9% 88.9%
27.8%
Paper Cardboard Plastic Glass Aluminum Other0
100
25
50
75

6. Appendix 223
Value Count Percent %
Free tenant parking associated with lease 6 37.5%
Preferential (up front) parking for carpools or vanpools 4 25%
Reduced rate parking for carpools or vanpools 1 6.3%
Electric vehicle charging stations 2 12.5%
Secure bicycle parking 11 68.8%
Showers/changing facilities for bicyclists 7 43.8%
Reduced cost transit passes 5 31.3%
No idle policy while in parking facility 7 43.8%
Kiosk/onsite information for transportation alternatives 4 25%
Statistics
Total Responses 16
Value Count Percent %
Do Not Use ENERGY STAR Portfolio Manager 7 38.9%
Less than 2 Years 1 5.6%
2-5 Years 8 44.4%
Over 5 Years 2 11.1%
Statistics
Total Responses 18
Sum 16.0
Average 2.0
Max 2.0
30. Are any of the following transportation amenities offered by building management?
31. How long have you used ENERGY STAR Portfolio Manager?
Are any of the following transportation amenities offered by buildingmanagement?
37.5%
25%
6.3%12.5%
68.8%
43.8%
31.3%
43.8%
25%
Free tenant
parking
associated
with lease
Preferential
(up front)
parking for
carpools or
vanpools
Reduced rate
parking for
carpools or
vanpools
Electric
vehicle
charging
stations
Secure
bicycle
parking
Showers/changing
facilities for
bicyclists
Reduced cost
transit passes
No idle policy
while in
parking
facility
Kiosk/onsite
information for
transportation
alternatives
0
100
25
50
75
How long have you used ENERGY STAR Portfolio Manager?
38.9%
5.6%
44.4%
11.1%
Do Not Use ENERGY STAR Portfolio
Manager
Less than 2 Years 2-5 Years Over 5 Years0
100
25
50
75
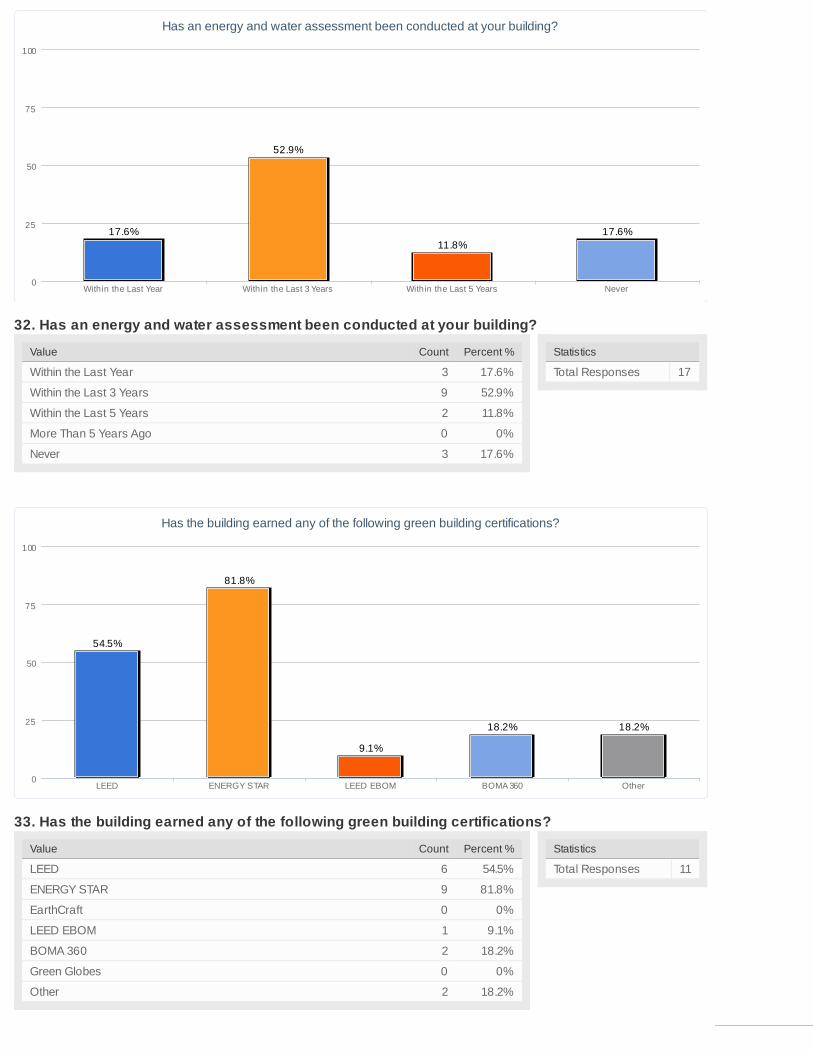
GREENPRINT MIDTOWN
6. Appendix
Susta inabi l i ty P lan 2012224
Value Count Percent %
Within the Last Year 3 17.6%
Within the Last 3 Years 9 52.9%
Within the Last 5 Years 2 11.8%
More Than 5 Years Ago 0 0%
Never 3 17.6%
Statistics
Total Responses 17
Value Count Percent %
LEED 6 54.5%
ENERGY STAR 9 81.8%
EarthCraft 0 0%
LEED EBOM 1 9.1%
BOMA 360 2 18.2%
Green Globes 0 0%
Other 2 18.2%
Statistics
Total Responses 11
32. Has an energy and water assessment been conducted at your building?
33. Has the building earned any of the following green building certifications?
Has an energy and water assessment been conducted at your building?
17.6%
52.9%
11.8%
17.6%
Within the Last Year Within the Last 3 Years Within the Last 5 Years Never0
100
25
50
75
Has the building earned any of the following green building certifications?
54.5%
81.8%
9.1%
18.2% 18.2%
LEED ENERGY STAR LEED EBOM BOMA 360 Other0
100
25
50
75
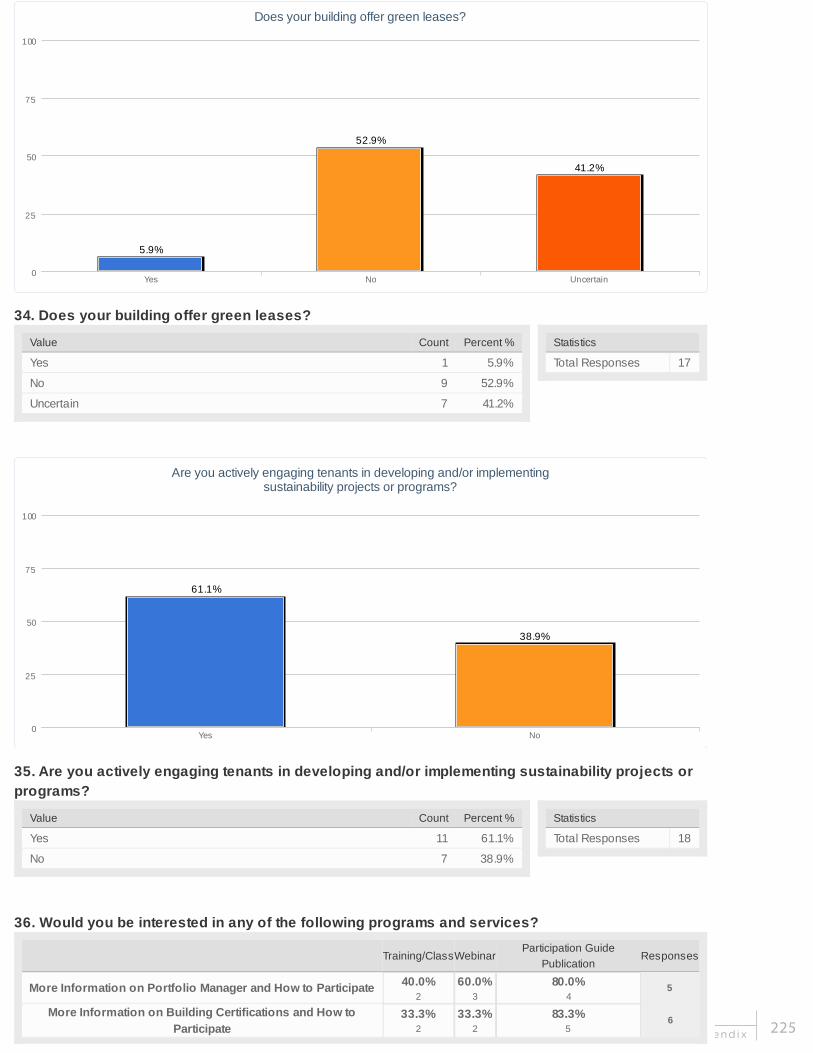
6. Appendix 225
Value Count Percent %
Yes 1 5.9%
No 9 52.9%
Uncertain 7 41.2%
Statistics
Total Responses 17
Value Count Percent %
Yes 11 61.1%
No 7 38.9%
Statistics
Total Responses 18
34. Does your building offer green leases?
35. Are you actively engaging tenants in developing and/or implementing sustainability projects or
programs?
36. Would you be interested in any of the following programs and services?
Training/ClassWebinarParticipation Guide
PublicationResponses
More Information on Portfolio Manager and How to Participate40.0%
2
60.0%
3
80.0%
45
More Information on Building Certifications and How to
Participate
33.3%
2
33.3%
2
83.3%
56
Does your building offer green leases?
5.9%
52.9%
41.2%
Yes No Uncertain0
100
25
50
75
Are you actively engaging tenants in developing and/or implementingsustainability projects or programs?
61.1%
38.9%
Yes No0
100
25
50
75

GREENPRINT MIDTOWN
6. Appendix
Susta inabi l i ty P lan 2012226
Value Count Percent %
Yes 13 72.2%
No 5 27.8%
Statistics
Total Responses 18
37. Would your building be interested in participating in the Greenprint Midtown assessment study
and receiving a free energy and water assessment?
1. Building Name
Count Response
1 1100 Spring
1 1180 Peachtree
1 999 Peachtree
1 Atlantic Center Plaza
1 Biltmore House
1 Colony House Condo Association
1 Colony Square
1 Federal Home Loan Bank of Atalnta
1 Federal Reserve Bank of Atlanta
1 Memorial Arts Building
1 Metropolis
1 One Atlantic Center
1 One Midtown Plaza
1 Peachtree Lofts Condominiums
1 Pershing Point Plaza
1 Piedmont Crest
1 Promenade
1 Renaissance Midtown Hotel
4. Primary Building Type
Count Response
Would your building be interested in participating in the Greenprint Midtownassessment study and receiving a free energy and water assessment?
72.2%
27.8%
Yes No0
100
25
50
75

6. Appendix 227
5. Year Built
Count Response
1 1924
1 1952
1 1960
1 1968
2 1970
1 1972
1 1984
1 1986
2 1987
1 1990
2 2001
1 2002
2 2006
1 2008
6. Year of Last Major Renovation
Count Response
1 0
1 1997
1 1999
2 2000
1 2001
2 2006
2 2008
1 2010
2 2011
1 2012
7. Total Square Footage
Count Response
1 1100312
1 160000
1 223977
1 226293
1 235514
1 271572
1 295000
1 305730
1 410357
1 500380
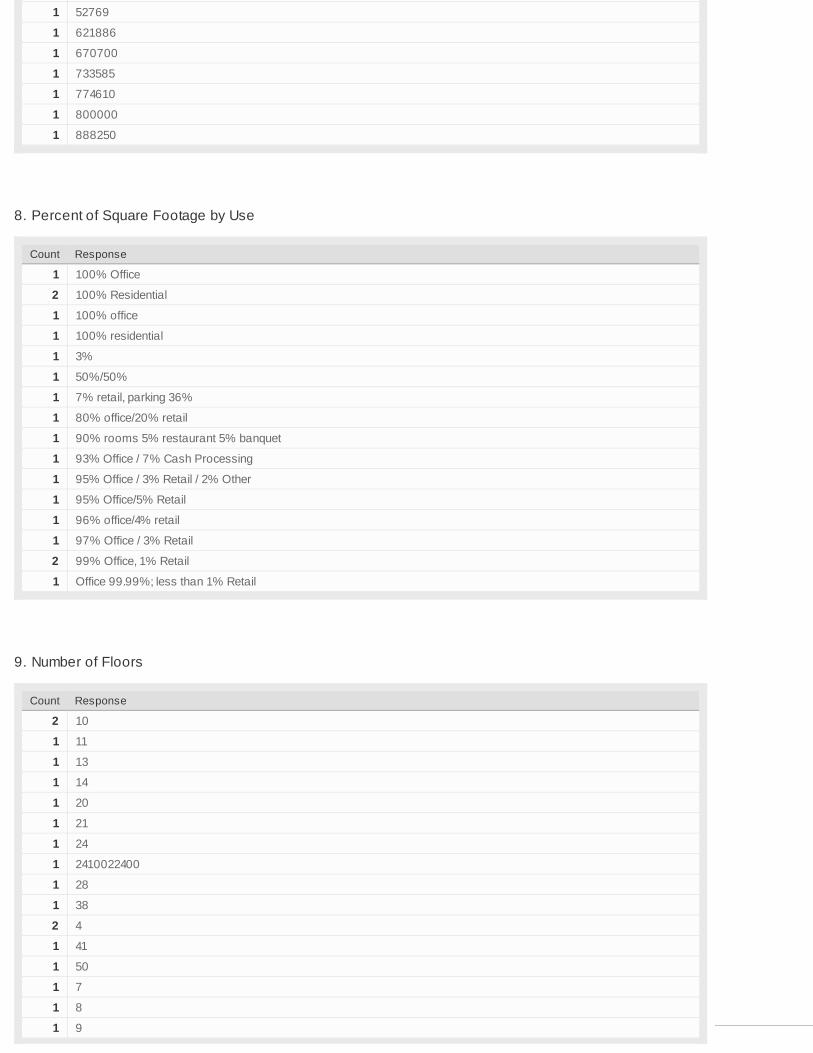
GREENPRINT MIDTOWN
6. Appendix
Susta inabi l i ty P lan 2012228
1 52769
1 621886
1 670700
1 733585
1 774610
1 800000
1 888250
8. Percent of Square Footage by Use
Count Response
1 100% Office
2 100% Residential
1 100% office
1 100% residential
1 3%
1 50%/50%
1 7% retail, parking 36%
1 80% office/20% retail
1 90% rooms 5% restaurant 5% banquet
1 93% Office / 7% Cash Processing
1 95% Office / 3% Retail / 2% Other
1 95% Office/5% Retail
1 96% office/4% retail
1 97% Office / 3% Retail
2 99% Office, 1% Retail
1 Office 99.99%; less than 1% Retail
9. Number of Floors
Count Response
2 10
1 11
1 13
1 14
1 20
1 21
1 24
1 2410022400
1 28
1 38
2 4
1 41
1 50
1 7
1 8
1 9

6. Appendix 229
10. Floor Height in Feet
Count Response
1 10
1 11
2 12
2 13
3 14
1 15
1 20
1 691
4 9
11. Number of Elevators
Count Response
1 12
1 15
2 2
1 20
2 22
1 24
2 3
1 4
3 5
1 7
2 8
1 9
12. Estimated Number of Occupants
Count Response
1 1000
1 1170
1 1186
2 1200
1 1630
1 1800
1 212
1 300
1 350
1 375
1 457
1 500
1 650

GREENPRINT MIDTOWN
6. Appendix
Susta inabi l i ty P lan 2012230
1 70
1 75
1 800
13. Estimated Percent of Occupants with Computers
Count Response
6 100
1 1800
1 40
1 400
1 70
4 90
1 98
2 99
14. Primary Mechanical System Type
Count Response
1 Central Plant - W Hotel
1 Centrifugal Chiller
1 Centrifugal Chillers
1 Chilled Water
1 Chilled water/ electric reheat
1 Chiller plant with 1 AHU/floor
1 Constant Air - Steam/Chilled water purchased from central plant
1 HVAC
1 HVAC, Generators, UPS, PDU's
1 Mechancial Cooling - Boiler heat
1 SWUD
1 Water Source Heat Pumps/Chilled Water loop
1 central variable speed centrifugal chillers, variable speed AHUs, rooftop cooling towers
1 chiller
1 unknown
1 Central chilled water plant with chilled water distribution to single central HVAC distribution per floor with multi-zone
PIU/VAV air distribution
15. Year Mechanical System was Last Upgraded or Installed
Count Response
1 1980
1 1984
1 1996
1 2000
1 2001

6. Appendix 231
1 2002
1 2006
3 2008
2 2010
3 2011
1 2012
16. Are any mechanical system upgrades planned?
Count Response
2 No
1 Not currently.
5 Yes
1 Yes, condenser water loop for supplemental cooling units
1 maybe
4 no
1 not at this time
1 yes
19. Total Water Heating Capacity
Count Response
3 0
1 100
1 18
1 2000000
1 30
1 4000000
1 4920000
21. Estimated Percentage of Building with Local Controls
Count Response
1 0
3 10
1 100
1 2
2 20
1 3
1 30
1 42
2 5
1 60
1 80

GREENPRINT MIDTOWN
6. Appendix
Susta inabi l i ty P lan 2012232
27. Are any water system upgrades planned?
Count Response
1 Low flow restroom fixtures, feasibility study for alternate source of cooling tower makeup water
5 No
1 Yes
1 Yes, low flow toilet installation
1 Yes-new irrigation pump
5 no
1 not at this time
2 yes
28. List the provider for the following waste management services within the building:Solid Waste
Count Response
1 Advanced Disposal
1 American Recycling
1 City of Atl
1 City of Atlanta
1 Republic Services
10 Waste Management
1 Waste Pro
1 WastePro
1 waste management
28. List the provider for the following waste management services within the building:Recycling
Count Response
1 Advanced Disposal
1 Air Cycle, Batteries Plus, Southeast Recycling
2 American Recycling
1 B Green Services
3 Conex
1 Conex and American Recycling
1 Republic Services
1 RockTenn, Conex, and Sonoco (depending on material recycled)
1 Through Biltmore Office Bldg
4 Waste Management
1 WastePro
1 waste management
28. List the provider for the following waste management services within the building:Compost
Count Response

6. Appendix 233
1 GreenCo
1 Greenco
2 N/A
1 None
1 Waste Management
1 greenco
1 unknown
38. Is your building engaged in any other sustainability strategies?
Count Response
1 Lighting retrofit
1 Not at the moment
1 Yes
1 Yes - Continuos commissioning and energy efficiency modifications / improvements
1 no
1 We currently recycle and we are currently updating our parking deck lights to more efficient bulbs.
1 Yes. The Bank has developed a comprehensive environmental plan that covers all of our environmental impacts.
Additional areas that are covered in the plan include: purchasing, transportation, and employee education, among other
topics.

GREENPRINT MIDTOWN
6. Appendix
Susta inabi l i ty P lan 2012234
1 of 4
Greenprint Midtown - Restaurant Survey
1. What is the name of the restaurant or food service establishment that you represent? (Please note that individual business names will be kept confidential and only aggregate data will be published.)
Response
Count
35
answered question 35
skipped question 0
2. Do you recycle any of the following? (select all that apply)
Response
PercentResponse
Count
Paper 43.5% 10
Plastic 43.5% 10
Glass 47.8% 11
Cardboard 82.6% 19
Aluminum 26.1% 6
Other (please specify)
6
answered question 23
skipped question 12

6. Appendix 235
2 of 4
3. Do you collect food scraps for compost?
Response
PercentResponse
Count
Yes 8.6% 3
No 91.4% 32
Don't know 0.0% 0
answered question 35
skipped question 0
4. Do you recycle your used cooking oil?
Response
PercentResponse
Count
Yes 48.6% 17
No 25.7% 9
Do not use cooking oil 22.9% 8
Don't know 2.9% 1
answered question 35
skipped question 0

GREENPRINT MIDTOWN
6. Appendix
Susta inabi l i ty P lan 2012236
3 of 4
5. Does your facility employ any of the following water-saving features?
Yes No Don't knowResponse
Count
Low-flow pre-rinse spray valves to rinse dishes
31.4% (11) 37.1% (13) 31.4% (11) 35
Low-flow or waterless urinals 18.8% (6) 71.9% (23) 9.4% (3) 32
High efficiency or dual flush toilets 32.4% (11) 50.0% (17) 17.6% (6) 34
Rainwater or condensate collection and reuse
3.0% (1) 93.9% (31) 3.0% (1) 33
Other (please specify)
1
answered question 35
skipped question 0
6. Is your restaurant certified "green" through any of the following programs? (check all that apply)
Response
PercentResponse
Count
Zero Waste Zone 0.0% 0
Certified Green Restaurant through the Green Restaurant Association
0.0% 0
None of the above 100.0% 35
Other (please specify)
1
answered question 35
skipped question 0

6. Appendix 237
1 of 4
Greenprint Midtown - Multi-family Residence Survey
1. What is the name of the residence that you represent?
Response
Count
33
answered question 33
skipped question 0
2. Does your building offer recycling for any of the following?
Response
PercentResponse
Count
Paper 90.9% 30
Plastic 84.8% 28
Glass 72.7% 24
Cardboard 75.8% 25
Aluminum 66.7% 22
Other or none of the above (please specify)
12.1% 4
answered question 33
skipped question 0
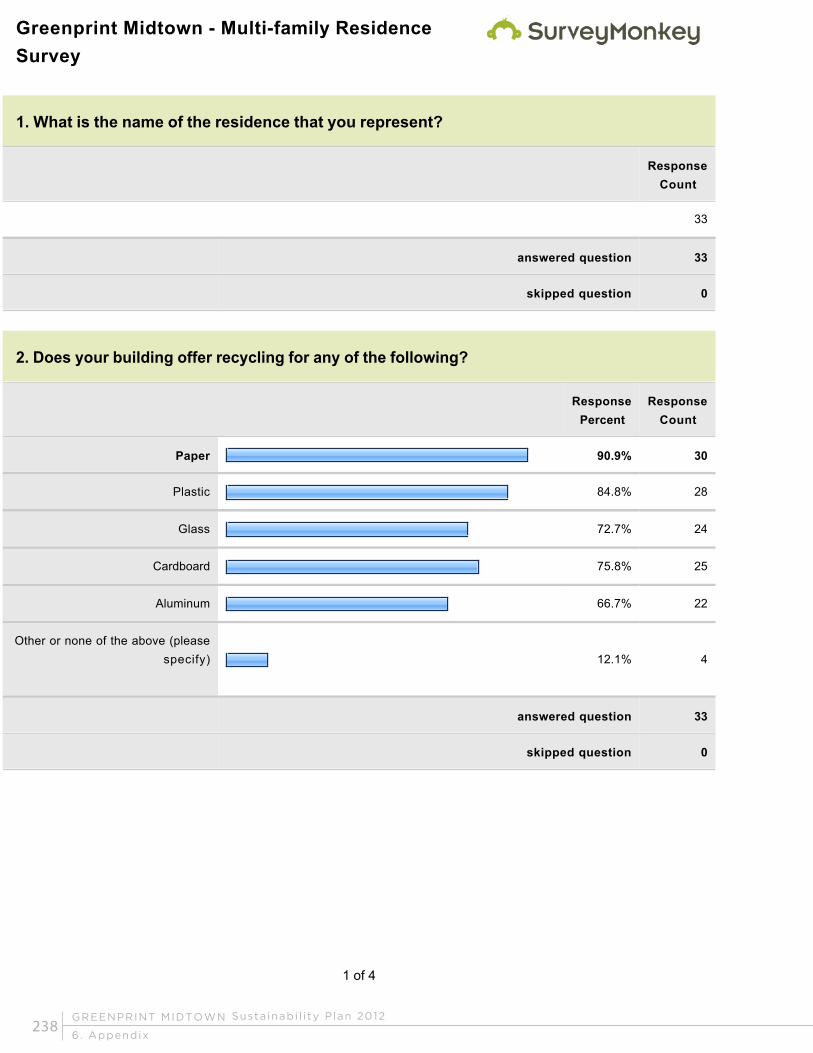
GREENPRINT MIDTOWN
6. Appendix
Susta inabi l i ty P lan 2012238
1 of 4
Greenprint Midtown - Multi-family Residence Survey
1. What is the name of the residence that you represent?
Response
Count
33
answered question 33
skipped question 0
2. Does your building offer recycling for any of the following?
Response
PercentResponse
Count
Paper 90.9% 30
Plastic 84.8% 28
Glass 72.7% 24
Cardboard 75.8% 25
Aluminum 66.7% 22
Other or none of the above (please specify)
12.1% 4
answered question 33
skipped question 0
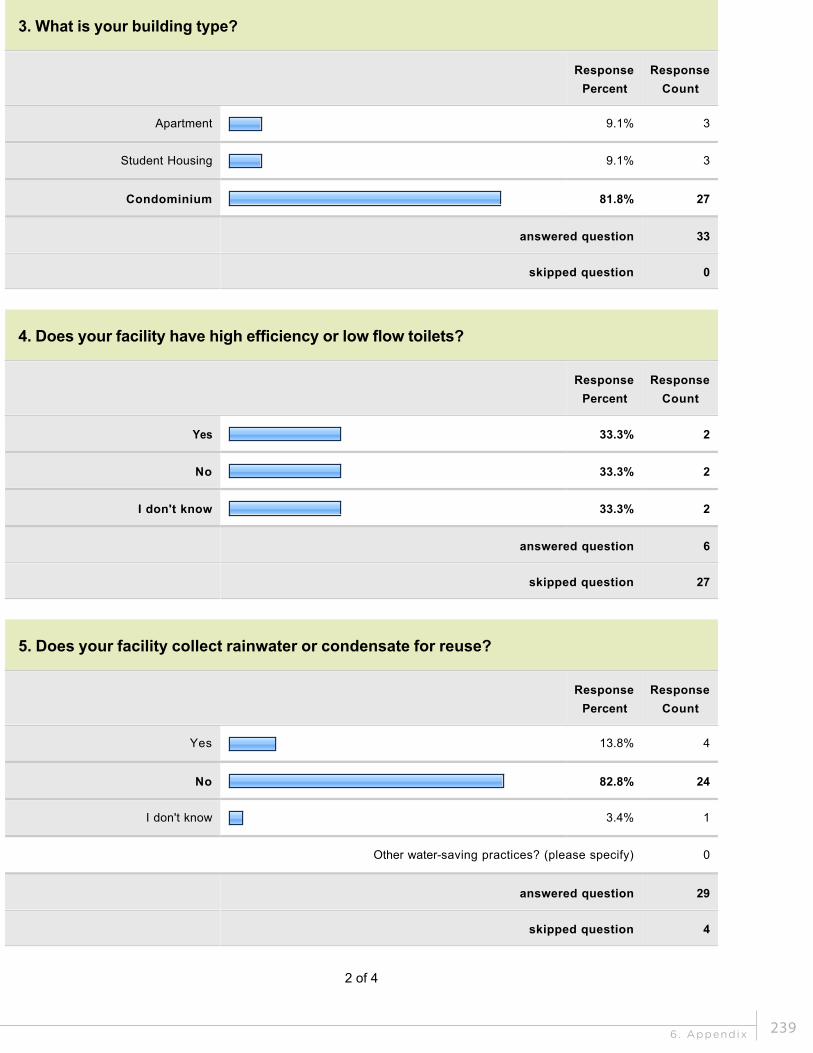
6. Appendix 239
2 of 4
3. What is your building type?
Response
PercentResponse
Count
Apartment 9.1% 3
Student Housing 9.1% 3
Condominium 81.8% 27
answered question 33
skipped question 0
4. Does your facility have high efficiency or low flow toilets?
Response
PercentResponse
Count
Yes 33.3% 2
No 33.3% 2
I don't know 33.3% 2
answered question 6
skipped question 27
5. Does your facility collect rainwater or condensate for reuse?
Response
PercentResponse
Count
Yes 13.8% 4
No 82.8% 24
I don't know 3.4% 1
Other water-saving practices? (please specify) 0
answered question 29
skipped question 4

GREENPRINT MIDTOWN
6. Appendix
Susta inabi l i ty P lan 2012240
3 of 4
6. Do you have a building-wide green team?
Response
PercentResponse
Count
yes 10.7% 3
no 78.6% 22
don't know 0.0% 0
Other (please specify)
10.7% 3
answered question 28
skipped question 5
7. If a Green Residence certification and/or recognition program were available locally, would you be interested in learning more about it?
Response
PercentResponse
Count
Yes 82.8% 24
No 6.9% 2
Maybe 10.3% 3
answered question 29
skipped question 4

6. Appendix 241
4 of 4
8. Would you be interested in hearing how other residences have "greened up" their operations?
Response
PercentResponse
Count
Yes 93.1% 27
No 6.9% 2
answered question 29
skipped question 4
9. Are there any other sustainable initiatives your building has taken that you'd like to tell us about?
Response
Count
9
answered question 9
skipped question 24

GREENPRINT MIDTOWN
6. Appendix
Susta inabi l i ty P lan 2012242
B.1 Energy Efficiency Revolving Loan FundEP1: ENERGY EFFICIENCY AND CONSERVATION IN BUILDINGS
OVERVIEW & CHARACTERISTICS
An Energy Efficiency Revolving Loan Fund
provides financing for projects that reduce
energy and resource demand. The payback
for the loan is based upon the lender’s re-
turn on investment (ROI). In other words, a
portion of the savings realized goes towards
repaying the initial loan for the improve-
ments. The money in the fund is then rein-
vested to finance other projects. Potential
for consistent annual returns ranges from 29
percent to more than 47 percent.1
KEY FINDINGS
An Energy Efficiency Revolving Loan Fund:
• removes lack of funding as a barrier for
implementing energy efficiency projects,
• reduces operating costs by decreasing
energy and water consumption, and
• reduces carbon footprint and green
house gas emissions.
SUCCESS STORIES
Western Michigan State University
Western Michigan University’s Quasi Green
Loan Fund was established in 1980, and is
the oldest of its kind. The university credits
the success of the fund to its focus on over-
all operational cost reduction, as opposed to
funding projects on a simple one-time basis.
The fund is unique in that it reinvests money
from cost-savings, but it also draws capital
from campus utilities, maintenance, and oth-
er budgets as necessary.
• Fund size: $365,000*
• Number of projects: 101
• Return on investment: 47%2
*Because of the specific accounting pro-
cesses involved in WMU’s Quasi GRF, the
amount spent on return-based sustainability
projects varies per year.
1Sustainable Endowments Institute. 2011. “Greening the Bottom Line: The Trend
Towards Green Revolving Funds on Campus”. Retrieved from: http://greenbillion.
org/wp-content/uploads/2011/10/GreeningTheBottomLine.pdf (Accessed July
2012).
2Sustainable Endowments Institute. 2011. “Western Michigan State University
Quasi-Revolving Loan Fund”. Retrieved from: http://greenbillion.org/wp-content/
uploads/2011/11/Western_Michigan_Case_Study_2-1.pdf (Accessed July 2012).
Number of Green Revolving Loan Funds by YearSource: Sustainable Endowments Institute, 2011

6. Appendix 243
Iowa State University
Iowa State University’s Live Green Revolving
Loan Fund was established in 2008 and of-
fers a combination of an administration-driv-
en initiative with a decentralized implemen-
tation structure. To incentivize participation,
the university modified its billing process
so that campus departments and buildings
are individually accountable for their energy
consumption. In turn, the cost savings from
funded projects directly benefit the respec-
tive departments and buildings.
• Fund size: $3,000,000
• Number of projects: 11
• Return on investment: 29%3
Harvard University
Harvard University’s Green Campus Loan
Fund was established in 2001. Originally
funded at $1.5 million, the fund is now one of
the largest in the nation, and finances high
performance campus design, operations,
and maintenance projects. The university’s
Office of Sustainability addresses fund chal-
lenges and opportunities by providing guid-
ance consultation to departments interested
in pursuing funds.
• Fund size: $12,000,000
• Number of projects: 185
• Return on investment: 30%4
3Sustainable Endowments Institute. 2011. “Iowa State University Live Green
Revolving Loan Fund.” Retrieved from: http://greenbillion.org/wp-content/up-
loads/2012/01/Iowa-Case-Study_v5.pdf (Accessed July 2012).
4Sustainable Endowments Institute. 2011. “Harvard University Green Campus Loan
Fund.” Retrieved from: http://greenbillion.org/wp-content/uploads/2011/10/Har-
vard.pdf (Accessed July 2012).

GREENPRINT MIDTOWN
6. Appendix
Susta inabi l i ty P lan 2012244
RESOURCES
“Greening the Bottom Line: The Trend To-
wards Green Revolving Funds on Campus,”
Sustainable Endowments Institute, 2011,
http://greenbillion.org/wp-content/up-
loads/2011/10/GreeningTheBottomLine.pdf
“Western Michigan State University Quasi-
Revolving Loan Fund,” Sustainable Endow-
ments Institute, 2011, http://greenbillion.org/
wp-content/uploads/2011/11/Western_Michi-
gan_Case_Study_2-1.pdf
“Iowa State University Live Green Revolv-
ing Loan Fund,” Sustainable Endowments
Institute, 2011, http://greenbillion.org/wp-
content/uploads/2012/01/Iowa-Case-Study_
v5.pdf
“Harvard University Green Campus Loan
Fund,” Sustainable Endowments Institute,
2011, http://greenbillion.org/wp-content/up-
loads/2011/10/Harvard.pdf
“Investment Primer for Green Revolving
Loan Funds,” Sustainable Endowments In-
stitute, 2011, http://greenbillion.org/wpcon-
tent/uploads/2012/05/Investment_Primer.
“Creating a Campus Sustainability Revolving
Loan Fund: A Guide for Students,”
AASHE, 2007, http://www.aashe.org/
highlights/pressreleases/creating-campus-
sustainabilityrevolving-loan-fund-guide-stu-
dents

6. Appendix 245
B.2 High-Efficiency Public Space LightingEP2: HIGH EFFICIENCY PUBLIC SPACES LIGHTING
OVERVIEW & CHARACTERISTICS
High-Efficiency Public Space Lighting en-
ables public works departments and munici-
palities to save on energy costs, enhance
public safety, improve transportation, direct
light to where it is needed, distribute illu-
mination evenly, and enhance the aesthetic
value of public spaces via either new instal-
lations or retrofits. High-efficiency public
space lighting aligns well with city’s energy
efficiency initiatives, hazardous materials
reduction, and other environmental impacts.
Outdoor lighting ordinances and codes are
now adopting the concept of e-zones which
account for energy efficient lighting applica-
tions in public spaces to reduce the environ-
mental impact of lighting. Ordinances and
local standards will vary by location and lo-
cal zoning departments should be engaged
prior to implementing a public space light-
ing project.1
KEY FINDINGS
• Establish collaborative partnerships
with national or local organizations
knowledgeable about public space
lighting technology, financing, and public
private implementation models.
• Fund projects through a combination of
energy rebates and a street lighting as
sessment fund which could be repaid in
less than ten (10) years from savings in
energy and maintenance costs.
• Track metrics associated with reductions
in energy use, maintenance and energy
cost savings, and greenhouse gas
emissions.2
SUCCESS STORIES
Los Angeles, California
In 2009, the City of Los Angeles in partnership
with the Clinton Climate Initiative announced
they would develop the most expansive light
emitting diode (LED) green street light pro-
gram ever initiated by a city. The program was
started in response to the high energy and
operations costs for the 140,000 streetlights
in the city. Street lighting receives $42 million
annually from the Street Lighting Maintenance
Assessment Fund. The fund was intended to
cover costs associated with operation and
maintenance, energy, material, labor, and fleet
expenses. Local policies prohibit the city from
adjusting the fund to correspond with inflation
and meet operational costs which led to a pro-
jected future deficit of $10 million annually. The
Bureau of Street Lighting requested a $48.5
million loan for the five (5) year project with the
loan being repaid in the eighth year. Retrofit-
ting the street lighting system has resulted in
the following reductions:3
1EPA, and ENERGY STAR.2012 “Lighting.” Retrieved from: http://www.energystar.
gov/ia/business/EPA_BUM_CH6_Lighting.pdf (Accessed July 2012).
2NYC Global Partners, and City of Los Angeles.2011. “Best Practice: Los Angeles
LED Street Lighting System.” Retrieved from: http://www.nyc.gov/html/unccp/
gprb/downloads/pdf/LA_LEDstreetlights.pdf (Accessed July 2012).
3NYC Global Partners, and City of Los Angeles. 2011. “Best Practice: Los Angeles
LED Street Lighting System.” Retrieved from: http://www.nyc.gov/html/unccp/
gprb/downloads/pdf/LA_LEDstreetlights.pdf (Accessed July 2012).

GREENPRINT MIDTOWN
6. Appendix
Susta inabi l i ty P lan 2012246
• Energy: 57.6% or 68,648,000 kWh
• CO2: 8,674 metric tons
• Costs: $1,297,173 saved4
San Diego, California
In 2009, the San Diego Regional Peer-to-
Peer Street Lighting Working Group (SLWG)
was established with funding from Califor-
nia’s Energy Efficiency Public Goods Charge
Program and sponsored by San Diego Gas
& Electric (SDG&E). The SLWG meets every
2-3 weeks to collaborate and share best
practices in sustainability to retrofit 145,000
street lights in the SDG&E service area.
The collaboration process provided some
valuable lessons for the successful
implementation of a street lighting
retrofit, which include:
• Staying technology neutral
• Selecting an independent, non-biased
group leader
• Appointing a lead stakeholder to
develop technology specifications
• Testing the technologies with public
input and
• Developing specifications before
approaching manufacturers5
The first phase of the street lighting retrofit
included four cities in SDG&E’s service area
and accounted for:
• 13,000 retrofits
• $5,000,000 in economic stimulus
• $1,000,000 in taxpayer savings
• 50 new jobs
• 30% reduction in street lighting
energy use
• 6,000,000 kWh reduction
• 2,600 tons of CO2 emissions reduced6
4NYC Global Partners, and City of Los Angeles. 2011. “Best Practice: Los Angeles
LED Street Lighting System.” Retrieved from: http://www.nyc.gov/html/unccp/
gprb/downloads/pdf/LA_LEDstreetlights.pdf (Accessed July 2012); Savings cal-
culated from installing 36,500 LED’s as of February 2011
5LGC, CleanTECH San Diego, and California Public Utilities Commission.2010. “San
Diego Regional Peer-to-Peer Street Lighting Working Group.” Retrieved from:
http://www.lgc.org/freepub/docs/energy/case_studies/SD_SLWG.pdf (Accessed
July 2012).
6LGC, CleanTECH San Diego, and California Public Utilities Commission.2010. “San
Diego Regional Peer-to-Peer Street Lighting Working Group.” Retrieved from:
http://www.lgc.org/freepub/docs/energy/case_studies/SD_SLWG.pdf (Accessed
July 2012).; Annual figures from LGC, CleanTECH San Diego, and California Public
Utilities Commission

6. Appendix 247
B.3 Green InfrastructureWP1: GREEN STORMWATER INFRASTRUCTURE PROGRAM
OVERVIEW & CHARACTERISTICS
Green infrastructure presents an opportunity
for communities to more naturally handle
and manage stormwater, with a goal of
healthier urban environments and reduced
stress on man-made water management
systems. Traditional urban settings are made
of large areas of impermeable hardscape
like roads, sidewalks, and roofs, which are
unable to manage excessive water flow dur-
ing storm events. In some cases, stormwater
overflow can cause costly combined-sewer
overflows (CSO). Through the integrated
use of bioswales, porous pavements, green
roofs, rainwater harvesting, land conserva-
tion, and a host of other methods, a city can
capture the benefits of a green infrastruc-
ture system.1
The EPA estimates the need for over $105 billion for CSO controls and stormwater management over the next 20 years.Source: Environmental Protection Agency
KEY FINDINGS
• Integrate stormwater management into
capital program
• Incorporate education into green
infrastructure projects
• Reach out to the community before
designing
• Measure performance
SUCCESS STORIES
Philadelphia, Pennsylvania
The Philadelphia Water Department (PWD) has
developed an extensive green infrastructure
plan for its stormwater management. The plan
includes renovation and construction of exist-
ing infrastructure, like streets, parks, schools,
homes, and more. City streets account for a
large source of impervious surface in Philadel-
phia, which has the PWD designing and con-
structing a variety of green street plans that
include tree trenches, pervious pavement, and
stormwater bumpouts. At the same time, Phila-
delphia’s Green Parks program upgrades parks
with green infrastructure while addressing the
concerns.3
1US Environmental Protection Agency. 2012. “Why Green Infrastructure?.” Re-
trieved from: http://water.epa.gov/infrastructure/greeninfrastructure/gi_why.cfm
(Accessed July 2012).
2Philadelphia Water Department. 2012. “Green Stormwater Infrastructure Pro-
grams.” Retrieved from: http://www.phillywatersheds.org/what_were_doing/
green_infrastructure/programs (Accessed July 2012).
3Philadelphia Water Department. 2012. “Green Stormwater Infrastructure Project
Map.” Retrieved from: http://www.phillywatersheds.org/BigGreenMap (Accessed
July 2012).

GREENPRINT MIDTOWN
6. Appendix
Susta inabi l i ty P lan 2012248
Portland, Oregon
Portland’s Grey to Green infrastructure pro-
gram was developed to better manage the
city’s stormwater while also improving air
quality and increasing native vegetation and
wildlife habitat. Grey to Green includes the
use of land acquisition, re-vegetation ef-
forts, ecoroof construction, and green street
development in order to reach their specific
targets.4 The program includes goals of add-
ing forty-three (43) new acres of ecoroof,
constructing 920 new green street facilities,
and the planting of over 80,000 new trees.5
As of a 2011 report, the Grey to Green pro-
gram has:
• Green Street Construction: 546 facilities
• Trees Planted: 26,400
• Ecoroof: 6.5 acres, with 90 more projects
approved
• Land Conservation: 261 acres6
Portland estimates that Grey to Green projects could reduce air particulate levels by more than 17 tons annually, and save 927,000 kWh annually.Source: Portland Bureau of Environmental
Services
4City of Portland Bureau of Environmental Services. 2012. “Grey to Green
Elements.” Retrieved from: http://www.portlandonline.com/bes/index.
cfm?c=47203&a=193188 (Accessed July 2012).
5City of Portland Bureau of Environmental Services. 2012. “What is Grey
to Green” Retrieved from: http://www.portlandonline.com/bes/index.
cfm?c=47203&a=321331 (Accessed July 2012).
6City of Portland Bureau of Environmental Services. 2012. “What is Grey
to Green.” Retrieved from: http://www.portlandonline.com/bes/index.
cfm?c=47203&a=321331 (Accessed July 2012).

6. Appendix 249
Washington, D.C.
Washington D.C.’s District Department of
the Environment (DDOE) has instituted
various programs and regulations on green
infrastructure. The RiverSmart Homes pro-
gram provides incentives to homeowners
looking to implement green infrastructure
projects on their property. Those that qual-
ify can receive up to $1,200 for the installa-
tion of shade tree planting, rain barrels, per-
vious pavers, rain gardens, or bayscaping.7
Additionally, the Environmental Protection
Agency (EPA) approved new performance
standards for stormwater runoff controls in
Washington D.C. These standards for the
District include:8
• Green Roofs: 350,000 sq. ft.
• Water Retention: 1.2 inches from a
24-hour storm for development projects
of 5,000 sq. ft. or greater
• Trees Planted: 4,150
RESOURCES
US Environmental Protection Agency.
(2012). Green Infrastructure. http://water.
epa.gov/infrastructure/greeninfrastructure/
index.cfm
City of Portland Bureau of Environmental
Services. (2010). Portland’s Green Infrastruc-
ture: Quantifying the Health, Energy, and
Community Livability Benefits. Available at:
http://www.portlandonline.com/bes/index.
cfm?c=52055&a=298042
Philadelphia Water Department. (2012).
Green Stormwater Infrastructure. http://
www.phillywatersheds.org/what_were_do-
ing/green_infrastructure
7District Department of the Environment. 2012. “RiverSmart Homes-Overview.”
Retrieved from: http://green.dc.gov/service/riversmart-homes-overview (Ac-
cessed July 2012).
8US Environmental Protection Agency. 2011. “EPA Approves New Performance
Standards for D.C. Stormwater.” Retrieved from: http://yosemite.epa.gov/opa/
admpress.nsf/d0cf6618525a9efb85257359003fb69d/ac714e4db1dd491c8525792
000617a95!OpenDocument (Accessed July 2012).

GREENPRINT MIDTOWN
6. Appendix
Susta inabi l i ty P lan 2012250
B.4 Plumbing Fixture RetrofitsWP3: MULTI-FAMILY WATER EFFICIENCY OUTREACH
OVERVIEW & CHARACTERISTICS
Plumbing retrofits improve efficiency stan-
dards for water fixtures and outdoor irriga-
tion in residential and commercial settings.
This includes toilets and urinals, faucets,
showerheads, and pre-rinse spray valves.
Updating plumbing fixtures can significantly
reduce the amount of water used in residen-
tial and commercial buildings. If done na-
tionally, Plumbing retrofits could provide all
eight Southeastern states with their entire
public water supply which equals approxi-
mately 20 percent of the total U.S. public
water supply.1
KEY FINDINGS
Retrofits should include the following strate-
gies:
• Replace conventional toilets with low-
flow or high-efficiency toilets
• Install efficient faucets and/or faucet
aerators
• Replace showerheads that have a flow
rate greater than 2.5 gallons per minute2
SUCCESS STORIES
Asheville Civic Center
A 2009 study by Veritec Consulting, found
that the installation of motion-sensor fau-
cets, toilets, and urinals significantly in-
creased water consumption.3 This is largely
attributed to unnecessary flushes caused by
motion detection in restrooms. Additionally,
faucets often flow for longer periods and at
higher pressure when automated in com-
parison to manual operation.4 The Asheville
Civic Center was equipped with urinals that
automatically flush when doors opened. A
water audit showed that this system was
functioning inefficiently. A two minute delay
was set to prevent urinals from flushing after
each use during high volume events.
• Fixture Efficiency: Water usage reduced
by nearly 90% for urinals
• Water Savings: 600,000 gallons annually
from timer installation5
1 Hoffner, Jenny. 2008. “Hidden Reservoir: Why Water Efficiency Is the Best Solu-
tion for the Southeast. American Rivers.” Retrieved from: http://www.alliancefor-
waterefficiency.org/uploadedFiles/News/NewsArticles/NewsArticleResources/
American_Rivers_Hidden_Reservoir_Oct_2008.pdf. (Accessed July 2012).
2 Alliance for Water Efficiency. 2010. “Water Saving Tips: For Residential Water
Use, Indoors and Out.” Retrieved from: http://allianceforwaterefficiency.org/
residential-tips.aspx (Accessed July 2012).
3 Gauley, Bill, and John Koeller. 2010. “Sensor-Operated Plumbing Fixtures: Do
They Save Water?” Retrieved from: http://www.map-testing.com/assets/files/
Sensor-Operated%20Fixtures%20Final%20Report%20March%202010.pdf (Ac-
cessed July 2012).
4 Gauley, Bill, and John Koeller. 2010. “Sensor-Operated Plumbing Fixtures: Do
They Save Water?” Retrieved from: http://www.map-testing.com/assets/files/
Sensor-Operated%20Fixtures%20Final%20Report%20March%202010.pdf (Ac-
cessed July 2012).
5N.C. Department of Environment and Natural Resources. 2009. “Water Efficiency
Manual for Commercial, Industrial, and Institutional Facilities.” Retrieved from:
http://infohouse.p2ric.org/ref/01/00692.pdf (Accessed July 2012).

6. Appendix 251
WP3: MULTI-FAMILY WATER EFFICIENCY OUTREACH
Houston, Texas
The Houston Department of Public Works
and Engineering has implemented water
conservation programs due to their large
commercial and residential service base and
groundwater resources which have been
degraded from land subsidence, saltwater
intrusion, and flooding. Conservation pro-
grams will lower costs and necessity for
infrastructure investment. The Texas Natu-
ral Resource Conservation Commission re-
quired the City to implement a conservation
plan to meet state requirements. The con-
servation program has these elements:
• Education program
• In-house program
• Contract customers program, and
• Conservation planning program
The education program entails outreach and
efficiency retrofits for older buildings. The
in-house program involves irrigation audits,
leak detection and repair of pools and foun-
tains, and analysis of water use. The contract
customers program requires billing based
on actual water use and penalties for un-
necessary water use during peak-demand.
The 1994 conservation planning program
study was conceived with a Texas Water
Development Board grant. The conserva-
tion plan was adopted in 1998 and enhanced
programs to include residential audits, ap-
pliance labeling, commercial indoor audits,
cooling tower audits, public indoor and out-
door audits, pool and fountain audits and
standards, increased public education, and
a “water-wise and energy-efficiency pro-
gram.”6
Tampa, Florida
Beginning in 1989, the Tampa Water Depart-
ment implemented procedures to reduce
water usage via water-conserving codes,
an increasing block rate structure, public
education, in-school education, and other
conservation projects. These water conser-
vation programs are in response to Tampa’s
rapid economic and population growth over
the past decades as well as periodic drought
conditions. Tampa receives the majority
of their water from the Hillsborough River,
which is seriously impacted by drought con-
ditions. The City advocates for water effi-
ciency through:6 EPA. Environmental Protection Agency. 2002. “Cases in Water Conservation:
How Efficiency Programs Help Water Utilities Save Water and Avoid Costs.” Re-
trieved from: http://www.allianceforwaterefficiency.org/uploadedFiles/Resource_
Center/Library/Programs/EPA_Case%20Studies.pdf (Accessed July 2012).

GREENPRINT MIDTOWN
6. Appendix
Susta inabi l i ty P lan 2012252
• Water use restrictions
• Fines for water violations and
• Plumbing and landscaping codes
Outdoor irrigation is limited to one (1) day
per week and new systems are required
to install rain sensors. The landscape code
restricts the amount of turf grass to 50
percent in new developments. The city
amended the plumbing code to require
water-efficient plumbing fixtures in all new
construction and renovation. The city also
began distributing water conservation kits
to homeowners in 1989. In 1994, the water
department started a toilet rebate program
to retrofit existing toilets with high-efficien-
cy toilets (HET), single family, multi-family,
and commercial customers are eligible to
participate in the program.7
RESOURCES
Gauley, Bill, and John Koeller. “Sensor-
Operated Plumbing Fixtures: Do They Save
Water?” Veritec Consulting Inc., Mar. 2010.
Web. 17 July 2012. http://www.map-testing.
com/assets/files/Sensor-Operated%20
Fixtures%20Final%20Report%20March%20
2010.pdf.
Hoffner, Jenny. Hidden Reservoir: Why Wa-
ter Efficiency Is the Best Solution for the
Southeast. American Rivers, 22 Oct. 2008.
Web. 16 July 2012. http://www.alliancefor-
waterefficiency.org/uploadedFiles/News/
NewsArticles/NewsArticleResources/Ameri-
can_Rivers_Hidden_Reservoir_Oct_2008.
pdf.
“Water Efficiency Manual for Commercial,
Industrial, and Institutional Facilities.” N.C.
Department of Environment and Natural
Resources, May 2009. Web. 17 July 2012.
http://infohouse.p2ric.org/ref/01/00692.
pdf.
“Water Saving Tips: For Residential Water
Use, Indoors and Out.” Alliance for Water
Efficiency. 2010. Web. 17 July 2012. http://al-
lianceforwaterefficiency.org/residential-tips.
aspx.
EPA. “Cases in Water Conservation: How Ef-
ficiency Programs Help Water Utilities Save
Water and Avoid Costs.” Allianceforwa-
terefficiency.org. Environmental Protection
Agency, July 2002. Web. 2012. http://www.
allianceforwaterefficiency.org/uploaded-
Files/Resource_Center/Library/Programs/
EPA_Case%20Studies.pdf
7 EPA, Environmental Protection Agency. 2002. “Cases in Water Conservation:
How Efficiency Programs Help Water Utilities Save Water and Avoid Costs.” Re-
trieved from: http://www.allianceforwaterefficiency.org/uploadedFiles/Resource_
Center/Library/Programs/EPA_Case%20Studies.pdf (Accessed July 2012).
6. Appendix 253
B.5 Office Waste ReductionGREEN BUSINESS RECOGNITION PROGRAM
OVERVIEW & CHARACTERISTICS
Office Waste Reduction programs are a
way for businesses to target those materials
that are abundant in their waste stream and
easily diverted from landfills. Frequently,
this can be accomplished in a cost effective
manner through the facilitation of proac-
tive source separation and saves money by
conserving resources and reducing disposal
costs. In addition to recycling, source reduc-
tion is a simple strategy to decrease office
waste or institutional and commercial waste
(ICW) by limiting the amount of materials
which require a waste management policy.
Office waste is made up of many materials
that are readily divertible, of which the three
most common categories,1 representing al-
most 90 percent of total generated waste
by weight, are as follows:2
• Paper products (54%)
• Plastics (12%)
• Organics (23%)
SUCCESS STORIES
Federal Reserve Bank of Atlanta
The Federal Reserve Bank of Atlanta, locat-
ed in Midtown, adopted a five-year environ
High ICW reduction may be easier to achieve than residential waste reduction as ICW tends to be more homogenous and rich in recyclables.Source: Environmental Protection Agency, 1999
mental plan which addresses the environmental
impacts of nine (9) areas, of which recycling
and waste reduction are two (2) that are includ-
ed in the plan. The plan contains specific goals
for recycling and waste reduction including a
decrease in paper use and a comprehensive re-
cycling program. The bank received recognition
from the State of Georgia for measures taken to
green their operations.
• Plan Established: 2010
• Waste Reduction: 20% paper use
• Recognition: 2010 Partnership for a Sustain-
able Georgia’s Silver Award
1 Glass & Metals are not considered common material categories (~3%)
2 SCI, Sustainable Cities Institute. 2009. “Office Waste Reduction Programs.” Re-
trieved from: http://www.sustainablecitiesinstitute.org/view/page.basic/class/
feature.class/Lesson_Office_Waste_Reduction_Program (Accessed July 2012).
3 Federal Reserve Bank of Atlanta.2010. “The Long Recovery in the Southeast:
Federal Reserve Bank of Atlanta 2010 Annual Report.” Retrieved from: http://
www.frbatlanta.org/documents/pubs/annualreport/10ar.pdf (Accessed July
2012).

GREENPRINT MIDTOWN
6. Appendix
Susta inabi l i ty P lan 2012254
San Jose, CA
The City of San Jose, CA has a waste collec-
tion and processing system that will enable
all businesses in the area to meet the state’s
mandatory commercial recycling require-
ments.4 The city has contracted a single
hauler to collect garbage, recycling, and
organics from businesses. The waste hauler
uses an innovative “wet/dry” system to
enhance the waste services system. The bi-
nary system views waste as a resource and
minimizes the amount of waste sent to the
landfill.
• Established: July 2012
• Program Development: 500 businesses
participated
• Recycling Rate: Increased from 25% to
80% 5
Austin, TX
The City of Austin has committed to achiev-
ing reductions in per capita solid waste
disposal to landfills and incinerators, and
a more long-term goal of Zero Waste to
landfills and incinerators. The Commercial
Recycling Ordinance requires businesses
and office buildings with 100 employees or
more to provide on-site recycling for at least
two recyclable materials. The ordinance has
been updated and renamed The Universal
Recycling Ordinance requires all commercial
properties to recycle the following at a mini-
mum: office paper, plastic #1 & 2, cardboard,
aluminum, and glass.6 Businesses and com-
mercial properties are encouraged to go
beyond the minimum by participating in the
Zero Waste plan. The success of existing
policies indicates that the city can continue
to enhance its overall sustainability and en-
courage a green economy.7
• Commercial Recycling Ordinance Adopt-
ed: 1999
• Universal Recycling Ordinance Adopted:
2012
• Zero Waste Strategic Plan Adopted:
2009
• Zero Waste Diversion Rate Goals: 20%
by 2012, 75% by 2020, and 90% by 2040
• Zero Waste Businesses Diversion Rate:
90%
• Commercial Properties: 2,6038
4 City of San Jose-Environmental Services.2012.”New Recycling & Garbage Collec-
tion Services.” Retrieved from: http://www.sjrecycles.org/business/commercial-
redesign.asp (Accessed July 2012) ; State law AB341 requires businesses who
generate more than 4 cubic yards of waste to recycle.
5 City of San Jose-Environmental Services. 2012.”New Recycling & Garbage Collec-
tion Services.” Retrieved from: http://www.sjrecycles.org/business/commercial-
redesign.asp (Accessed July 2012.
6 City of Austin, TX.2011. “Summary of Universal Recycling Ordinance.” Retrieved
from: http://www.austintexas.gov/sites/default/files/files/Trash_and_Recycling/
Summary_of_URO.pdf (Accessed July 2012).
7 Gary Liss & Associates, and Richard Anthony Associates.2008. “Austin, TX Zero
Waste Strategic Plan.” Retrieved from: http://www.ilsr.org/wp-content/up-
loads/2012/02/Austin-TX-Zero-Waste-Plan.pdf (Accessed July 2012).
8 Gary Liss & Associates, and Richard Anthony Associates.2008. “Austin, TX Zero
Waste Strategic Plan.” Retrieved from: http://www.ilsr.org/wp-content/up-
loads/2012/02/Austin-TX-Zero-Waste-Plan.pdf (Accessed July 2012).

6. Appendix 255
RESOURCES
SCI. “Office Waste Reduction Programs.”
Sustainable Cities Institute. Sustainable Cit-
ies Institute, 2009. Web. 2012. http://www.
sustainablecitiesinstitute.org/view/page.
basic/class/feature.class/Lesson_Office_
Waste_Reduction_Program
EPA. “Cutting the Waste Stream in Half:
Community Record-Setters Show How.”
EPA.gov. Environmental Protection Agency,
Oct. 1999. Web. 2012. http://www.epa.gov/
osw/conserve/downloads/f99017.pdf
ILSR. “ILSR’s U.S. EPA-Sponsored Waste
Reduction Project.” ILSR.org. Environmental
Protection Agency, 1999. Web. 2012. http://
www.ilsr.org/13049/
City of San Jose. “New Recycling & Gar-
bage Collection Services.” New Recycling
& Garbage Collection Services. City of San
Jose-Environmental Services, July 2012.
Web. 2012. http://www.sjrecycles.org/busi-
ness/commercial-redesign.asp.content/up-
loads/2012/02/Austin-TX-Zero-Waste-Plan.
pdf.
Federal Reserve Bank of Atlanta. “The Long
Recovery in the Southeast: Federal Reserve
Bank of Atlanta 2010 Annual Report.” Frbat-
lanta.org. Federal Reserve Bank of Atlanta,
2010. Web. 2012. http://www.frbatlanta.org/
documents/pubs/annualreport/10ar.pdf.
Gary Liss & Associates, and Richard Anthony
Associates. “Austin, TX Zero Waste Strate-
gic Plan.” ILSR.org. City of Austin, TX, Dec.
2008. Web. 2012. http://www.ilsr.org/wp-
content/uploads/2012/02/Austin-TX-Zero-
Waste-Plan.pdf.
City of Austin, TX. “Summary of Universal
Recycling Ordinance.” Austintexas.gov. City
of Austin, TX, 2011. Web. 2012. http://www.
austintexas.gov/sites/default/files/files/
Trash_and_Recycling/Summary_of_URO.
pdf.

GREENPRINT MIDTOWN
6. Appendix
Susta inabi l i ty P lan 2012256
B.6 Electronics RecyclingWSP3: ELECTRONICS RECYCLING OUTREACH
OVERVIEW & CHARACTERISTICS
Electronic waste (e-waste) includes broken
or obsolete televisions, computer monitors,
central processing units, phones, videocas-
sette recorders, copiers and printers, stereos
and speakers, microwaves, and other end-
of-life electronic equipment.1 These materi-
als must be handled differently from typical
waste because they contain both hazardous
materials and valuable resources. In 2009,
75 percent (17.8 million tons) of the e-waste
ready for end-of-life management was not
properly handled. It is absolutely critical for
this growing problem to be addressed in re-
cycling programs and legislation.
E-waste is both the fastest growing and the largest source of heavy metals and organic pollutants in solid waste produce in the U.S.Source: Sustainable Cities Institute, 2011;
EPA, 2004
KEY FINDINGS
To facilitate effective e-waste management
plans, organizations should:
• Utilize public outreach campaigns to in-
form the community of the importance of
managing e-waste
• Provide recycling and re-use options,
and
• Manage the recycling process in a way
that protects both global public health and
the environment.2
SUCCESS STORIES
State of Washington
As of January 1, 2009, electronics manufac-
turing companies in the State of Washington
became responsible for the cost associated
with recycling waste materials from their
facilities in accordance with the Electronics
Waste Recycling Law. The revenue saved
will fund both existing municipal waste col-
lection systems and provide necessary fund-
ing for new non-municipal collection sites.
Placing the legal responsibility of recycling
on electronics companies that are generat-
ing the waste alleviates a great budgetary
burden from local governments.3
1Sustainable Cities Institute. 2012. “Electronic Waste Best Management Practices.”
Retrieved from: http://www.sustainablecitiesinstitute.org (Accessed July 2012).
2EPA. Environmental Protection Agency.2012. “Statistics on the Management of
Used and End-of-Life Electronics.” Retrieved from: http://www.epa.gov/osw/con-
serve/materials/ecycling/manage.htm (Accessed July 2012).
3Electronics Take Back Coalition. 2006. “Washington State’s E-Waste Law Will
Save Millions for Local Governments.” Retrieved from: http://c133251.r51.cf0.
rackcdn.com/Case%20Study%20-Washington%20State%20E-Waste%20Law%20
SF.pdf (Accessed July 2012).

6. Appendix 257
WSP3: ELECTRONICS RECYCLING OUTREACH
• Annual Savings: $550,000 for Snohom-
ish County, Washington
• Waste Hauling: $380,000 saved annually
• E-Waste Collection: 92% of residents
have access4
ViaTek Solutions
ViaTek is an electronics waste recycling or-
ganization headquartered in Tampa, FL with
a facility in Lawrenceville, GA. The company
is committed to the proper handling of elec-
tronics waste and implementing environ-
mentally responsible business operations.
• Public Relations: Top 20 electronic recy-
clers by Secure Destruction Business
• Certification: E-Steward
• Processing Output: 13 million pounds an-
nually
University of San Diego E-waste Collection Center
In reaction to the terrible environmental and
health consequences of electronics waste
dumping in Ghana, University of San Diego
faculty and students started a program
which educates the public on the impor-
tance of electronics waste management and
utilizing environmentally and ethically re-
sponsible recycling practices.
The university provides a drop-off location
for the collection of electronics which oper-
ates in conjunction with a local San Diego
recycling company who deals specifically
with the management of e-waste.
• Established: 2011
• E-Waste Collection: 155,000 pounds
RESOURCES
“Electronic Waste Best Management Prac-
tices.” Sustainable Cities Institute: Web. 12
July 2012. http://www.sustainablecitiesinsti-
tute.org.
“Statistics on the Management of Used and
End-of-Life Electronics.” EPA. Environmental
Protection Agency, n.d. Web. 13 July 2012.
http://www.epa.gov/osw/conserve/materi-
als/ecycling/manage.htm.
“Washington State’s E-Waste Law Will Save
Millions for Local Governments.” Electron-
ics Take Back Coalition, 2006. Web. http://
c133251.r51.cf0.rackcdn.com/Case%20
Study%20-Washington%20State%20E-
Waste%20Law%20SF.pdf.
“Electronics Recycling in Washington: A
Prodcut Stewardship Solution” Product
Stewardship. Product Stewardship Council,
Feb. 2010. Web. http://www.productstew-
ardship.net/PDFs/productsElectronicsEcy-
cleGeneralFactSheet.pdf.4Product Stewardship Council. 2010. “Electronics Recycling in Washington: A
Product Stewardship Solution” Retrieved from: http://www.productstewardship.
net/PDFs/productsElectronicsEcycleGeneralFactSheet.pdf (Accessed July 2012).

GREENPRINT MIDTOWN
6. Appendix
Susta inabi l i ty P lan 2012258
“ViaTek Solutions Celebrates 40th Anniver-
sary of Earth Day with Launch of Its New At-
lanta Processing Facility” ViaTek Solutions,
31 Mar. 2009. Web. http://www.viateksolu-
tions.com/pdfs/ViaTekPR-Atlanta_eDay09.
pdf.
“E-Stewards Certification Introduction.” Cer-
tification. Web. 12 July 2012. http://e-stew-
ards.org/certification-overview/.
“E-Waste Collection Center.” University of
San Diego E-Waste Collection. Web. http://
www.sandiego.edu/EWASTE/.

6. Appendix 259
B.7 Construction and Demolition Waste Diversion
OVERVIEW & CHARACTERISTICS
Construction and Demolition (C&D) Waste
Diversion ensures that the large amount of
material waste produced on a construction
site is not landfilled. Non-hazardous C&D de-
bris includes brick, aluminum, wood, drywall,
and a host of other materials. As it stands,
C&D waste constitutes a large amount of
solid waste disposal in the country. The US
Environmental Protection Agency (EPA)
performed an extensive study to estimate
the C&D waste from residential and nonresi-
dential projects in 2003 with the following
results:
• Residential: 67,000,000 tons
• Nonresidential: 103,000,000 tons
• Total: 170,000,000 tons1
In an attempt to reduce this flow of C&D
debris to landfills, communities across the
country have taken measurements to in-
crease C&D waste diversion rates.
From Oct 2008-Sept 2009, C&D debris accounted for just over 21% of Georgia’s solid waste.Source: GA Department of Natural Resources
KEY FINDINGS
• Use economic incentives such as permit fee
rebates to encourage C&D recycling
• Require reporting as part of permit applica-
tion
• Educate stakeholders on benefits
SUCCESS STORIES
Alameda County, CA
Alameda County passed an ordinance requiring
C&D projects in unincorporated areas to pro-
vide a Debris Management Plan. Understand-
ing the difficulties of source sorting C&D debris,
the County encourages the use of waste facili-
ties that are capable of sorting the debris after
delivery. The Alameda County facilities which
accept the mixed C&D waste have shown high
diversion rates.
• Debris Management Plan Ordinance: 2009
• Diversion Rate Standards: 75% of inert solids
& 50% of other C&D Waste
1United States Environmental Protection Agency. 2009. “Estimating 2003 Build-
ing-Related Construction and Demolition Materials Amounts.” Retrieved from:
http://www.epa.gov/wastes/conserve/imr/cdm/pubs/cd-meas.pdf (Accessed
July 2012).
2Alameda County Public Works Agency. 2012. “Construction & Demolition Debris
Management Program.” Retrieved from: http://www.acgov.org/pwa/about/con-
struction/building/debris.htm (Accessed July 2012).

GREENPRINT MIDTOWN
6. Appendix
Susta inabi l i ty P lan 2012260
Charleston County, SC
Charleston County has made a commitment
to reduce its waste stream and incineration
rates. Part of this plan includes diverting
C&D waste from landfills and finding alter-
native applications for the C&D debris. The
County began this process by discontinu-
ing its C&D services for private companies
at the Bees Ferry Landfill.3 Private landfills
are charging higher tipping fees for C&D de-
bris than Charleston County, who is in effect
incentivizing private companies to recycle,
donate, or repurpose their C&D debris.
Charleston County has received recommen-
dations from the public to require C&D de-
bris plans and minimum diversion rates for
permitted projects.
• County Waste Plan Established: 2008
• Landfill Composition: 39% C&D4
• Technical Assistance: Charleston Green
Committee
3City of Charleston. “Construction and Demolition: Waste Diversion Guide.” Re-
trieved from: http://www.charleston-sc.gov/shared/docs/0/cd%20waste%20
diversion%20brochure.pdf
4Charleston County and Kessler Consulting. 2009. “Solid Waste Management
Study Presentation: Waste Disposal Alternatives.” Microsoft PowerPoint Presenta-
tion. Retrieved from http://www.charlestoncounty.org/pdfs/CouncilPresentation-
031209Final.pdf (Accessed July 2012).
5Georgia Institute of Technology Office of Environmental Stewardship. 2007.
“Georgia Tech Recycles.” Retrieved from: http://www.stewardship.gatech.edu/
recycling.php (Accessed July 2012).
6Sustainable Endowments Institute. 2010. “The College Sustainability Report Card:
Georgia Institute of Technology.” Retrieved from: http://www.greenreportcard.
org/report-card-2011/schools/georgia-institute-of-technology/surveys/campus-
survey#building (Accessed July 2012).
7Association for the Advancement of Sustainability in Higher Education. 2012.
“Georgia Institute of Technology.” Retrieved from: https://stars.aashe.org/institu-
tions/georgia-institute-of-technology-ga/report/2012-05-15/11/51/365/ (Accessed
July 2012).
Georgia Institute of Technology
Georgia Tech, located in Midtown Atlanta,
has established a variety of institutional
practices and policies for waste manage-
ment, including C&D debris. Typical C&D
projects at Georgia Tech recycle over 95
percent of their waste, which adds to the
community’s strong waste reduction efforts.
When combined with other solid waste re-
duction projects on campus, the C&D debris
diversion efforts pushed Georgia Tech’s
total solid waste diversion rates just past 51
percent.5
• Diversion Rate 2009-2010: 98% of C&D6
• C&D Waste Diverted 2012: 3,238 tons
• C&D Landfilled 2012: 100 tons7
RESOURCES
Alameda County Ordinance. Addition of
Section 470 to Chapter 15.08 Building Code:
“Construction and Demolition Debris Man-
agement.” 2009. http://www.acgov.org/
pwa/documents/CD_Allen_06_16_2009.pdf
“Zero Waste.” Charleston Green Commit-
tee. http://www.charlestongreencommittee.
com/charlestongreenplan_zerowaste.pdf

6. Appendix 261
“Technical Assistance: Construction and De-
molition Debris Management.” South Caroli-
na Department of Health and Environmental
Control. 2010. http://www.scdhec.gov/envi-
ronment/lwm/recycle/pubs/c&d_debris.pdf
“Building Savings: Strategies for Waste
Reduction of Construction and Demolition
Debris from Buildings.” US Environmental
Protection Agency. 2000. http://www.epa.
gov/epawaste/nonhaz/municipal/pubs/
combined.pdf

GREENPRINT MIDTOWN
6. Appendix
Susta inabi l i ty P lan 2012262
B.8 Environmentally Preferable PurchasingGREEN BUSINESS RECOGNITION PROGRAM
OVERVIEW & CHARACTERISTICS
Environmentally Preferable Purchasing
(EPP) aims to integrate environmental con-
siderations into all stages of the purchasing
process with the goal of reducing the im-
pact on human health and the environment.
An EPP can address every transaction that
is made by a business or organization for
goods and services but typical programs in-
clude protocols for:
• Office supplies
• Cleaning materials and cleaning service
contracts
• Furniture, fixtures, and equipment
• Employee and supplier vehicles and oth-
er transportation
• Meeting materials and food
• Real estate and its construction or lease
Factors considered when determining if
products or services are environmentally
preferable may include:
• How raw materials are acquired
• The production and manufacturing
methods and location
• Product packaging
• Material content and composition
• The means of distribution
• The ability for reuse when the product is
obsolete or damaged
• The energy and water efficiency perfor-
mance of the product
• Operation and maintenance require-
ments
• A final disposal option when the item is
no longer serviceable
SUCCESS STORIES
City of Santa Monica, CA
The City of Santa Monica, California has set
a national standard and example for devel-
oping an environmental purchasing program
within the structure of existing purchasing
procedures and policies.
1Environmental Protection Agency. 2010. “Basic Information: Environmentally
Preferable Purchasing.” Retrieved from: http://www.epa.gov/oppt/epp/pubs/
about/about.htm (Accessed July 2012).
2Environmental Protection Agency. 2010. “Basic Information: Environmentally
Preferable Purchasing.” Retrieved From: http://www.epa.gov/oppt/epp/pubs/
about/about.htm (Accessed July 2012).
3Georgia Department of Natural Resources. “Module 2: Environmentally Preferable
Purchasing (EPP).” Retrieved from: http://www1.gadnr.org/sustain/toolkit/mod-
ules_2_1.html (Accessed July 2012).

6. Appendix 263
GREEN BUSINESS RECOGNITION PROGRAM
It is integrated into all purchasing aspects
of a $30 million annual budget. It is a sys-
tem embraced by multiple operational levels
within the local government because it in-
cludes the end-user in the decision making
process and provides follow-up support on
alternative products for evaluation of their
effectiveness and additional user-training if
required. The city attributes its success to:
• Having support from the top
• Including the end-users in the decision-
making process
• Conducting up-front research
• Adopting a customized approach to pur-
chasing
• Creating partnerships between environ-
mental and purchasing staff
• Implementing pilot programs
• Providing hands-on training by experts
• Holding face-to-face meetings with ven-
dors
• Maintaining flexibility
• Evaluating the program and planning
next steps
4Environmental Protection Agency. 1998.”The City of Santa Monica’s Environmen-
tal Purchasing: A Case Study.” Retrieved from: http://www.epa.gov/epp/pubs/
case/santa.pdf (Accessed July 2012).
5Kaiser Permanente. 2006. “Environmental Stewardship: Case Studies Power-
Point.” Retrieved from: http://info.kaiserpermanente.org/communitybenefit/html/
our_work/global/our_work_6_casestudies.html (Accessed July 2012).
RESOURCES
EPA. “Basic Information: Environmentally
Preferable Purchasing.” EPA.gov. Envi-
ronmental Protection Agency, 2010. Web.
2012. http://www.epa.gov/oppt/epp/pubs/
about/about.htm
Georgia Department of Natural Resources.
“Module 2: Environmentally Preferable Pur-
chasing (EPP).” P²AD. Georgia Department
of Natural Resources, n.d. Web. 2012. http://
www1.gadnr.org/sustain/toolkit/mod-
ules_2_1.html
EPA. “The City of Santa Monica’s Environ-
mental Purchasing: A Case Study.” EPA.gov.
Environmental Protection Agency, Mar. 1998.
Web. 2012. http://www.epa.gov/epp/pubs/
case/santa.pdf
Kaiser Permanente. “Environmental Stew-
ardship: Case Studies PowerPoint.” Kaiser-
permanente.org. Kaiser Permanente, 2006.
Web. 2012. http://info.kaiserpermanente.
org/communitybenefit/html/our_work/
global/our_work_6_casestudies.html

GREENPRINT MIDTOWN
6. Appendix
Susta inabi l i ty P lan 2012264
B.9 Green Business Recognition
OVERVIEW & CHARACTERISTICS
A Green Business Recognition Program
helps businesses in varying sectors imple-
ment sustainability measures to their daily
operations. Businesses commit to program
standards and select measures in areas re-
lated to energy, water, waste, pollution, and
education to make improvements applicable
to their respective business sector and in-
ternal capacities. Businesses must commit
to program standards and applicable envi-
ronmental regulations to be eligible for rec-
ognition. The program provides a valuable
opportunity to:
• implement sustainable business practic-
es,
• receive technical assistance,
• achieve cost savings from resource con-
servation, efficiency upgrades, and utilities,
and
• receive recognition as a green business
in the region.
According to a recent survey of San Francisco Green Businesses, 42% reported an increase in business since receiving their recognition.Source: San Francisco Green Business, 2009
SUCCESS STORIES
San Francisco Green Business
San Francisco’s Green Business Program
was established in 2004 and is a member
of the Bay Area Green Business Program,
a founding member of the California Green
Business Network. The California Green
Business Network which began in 2005 is
comprised of nineteen (19) programs. The
success of the San Francisco Program can
be attributed to the partnerships that exist
among the state, county, city, utilities, and
organizations. Government agencies add
credibility to the program and provide ac-
cess to funding which allows businesses to
participate without a fee.
1Evans, Pamela, Jo Fleming, and Sushma Bhatia. 2010. “California’s Green Business
Programs.” Retrieved from: http://www.calcupa.org/conference/2010/grand-g/
California-Green-Business-Programs.ppt (Accessed July 2012).

6. Appendix 265
The program received a grant from the Cali-
fronia Department of Toxic Substances Con-
trol to develop a tool which will be main-
tained by the San Francisco Department of
the Environment to manage environmental
data, track business progress, and measure
results to demonstrate the positive effects
of the California Green Business Network
programs, and calculate environmental and
fiscal benefits to participants. The metrics
tracking tool is available to businesses in the
California Green Business Network, results
are communicated to the public through
program websites, e-newsletters, and local
media.
• 2010 Certified Businesses*: 170 in San
Francisco, over 2,000 in California2
• Partners: SF Environment, SF Dept. of
Public Health, SF Public Utilities Commis-
sion, City and County of San Francisco
• Funding: $74,500 for metrics tracking3
• Savings: $707,5004
2Evans, Pamela, Jo Fleming, and Sushma Bhatia. 2010. “California’s Green Business
Programs.” Retrieved from: http://www.calcupa.org/conference/2010/grand-g/
California-Green-Business-Programs.ppt (Accessed July 2012).
3City of San Francisco City Operations and Neighborhood Services Commit-
tee.2010. “City of San Francisco-City Operations and Neighborhood Services
Committee-Grant Information and Budget.” Retrieved from: http://www.sfbos.
org/ftp/uploadedfiles/bdsupvrs/resolutions10/r0224-10.pdf (Accessed July
2012).
4City of Charleston. 2012.”City of Charleston, SC » Planning & Neighborhoods.”
Retrieved from: http://www.charleston-sc.gov/dept/content.aspx?nid=2062
(Accessed July 2012).
5Energy, Water, Waste conservation savings from Santa Cruz County Program
(199 participants).
Charleston Green Business Challenge
Charleston’s Green Business Challenge be-
gan in 2011 and was established on an annual
basis by the City of Charleston in partner-
ship with local and national organizations.5
The Green Business Challenge developed a
scorecard for participants to baseline their
operations with regard to eight (8) envi-
ronmental and social categories and set a
target score using the scorecard template.6
The target score can be achieving a tier on
the scorecard through the accumulation of
points or a percent reduction on utility bills.
The scorecard is modeled after the City of
Chicago and ICLEI’s Green Office Challenge
which is a competition to reduce energy
consumption and greenhouse gas emissions
from commercial buildings.7 The Green Busi-
ness Challenge has a broad scope which
enables varying business sectors to use the
same scorecard. The scorecard helps the
city with metrics tracking and carbon reduc-
tion.
6ICLEI. 2012. “Chicago Green Office Challenge Winners Recognized by Mayor and
ICLEI.” Retrieved from: http://www.icleiusa.org/news/press-room/press-releases/
chicago-green-office-challenge-winners-recognized-by-mayor-and-iclei (Ac-
cessed July 2012).
7City of Charleston. 2012. “City of Charleston, SC » Planning & Neighborhoods.”
Retrieved from: http://www.charleston-sc.gov/dept/content.aspx?nid=2062 (Ac-
cessed July 2012).

GREENPRINT MIDTOWN
6. Appendix
Susta inabi l i ty P lan 2012266
The nature of the challenge is to set the bar
high and integrate sustainable practices with
business operations.
• Challenge Participants: 76 in 2011-20128
• Partners: Charleston Metro Chamber of
Commerce, Charleston County, Charleston
Green Fair and Best in Green & Local Expo,
Lowcountry Local First, The Sustainabil-
ity Institute, and The Medical University of
South Carolina9
• Savings: $44,000 by 10 participants10
RESOURCES
San Francisco Green Business. “SF Green
Business - Home.” SF Green Business -
Home. City and County of San Francisco,
2009. Web. June 2012. http://www.sfgreen-
business.org/.
Evans, Pamela, Jo Fleming, and Sushma
Bhatia. California’s Green Business Pro-
grams. 2010. Web, San Francisco. http://
www.calcupa.org/conference/2010/grand-
g/California-Green-Business-Programs.ppt
9City of Charleston. 2012. “City of Charleston, SC » Planning & Neighborhoods.”
Retrieved from: http://www.charleston-sc.gov/dept/content.aspx?nid=2062 (Ac-
cessed July 2012).
10City of Charleston.2012.”Green Business Challenge Information Brochure.”
Retrieved From: http://www.charleston-sc.gov/shared/docs/0/gbc%20bro-
chure%20for%202011-2012.11-22.pdf (Accessed July 2012).
City of San Francisco City Operations and
Neighborhood Services Committee. City of
San Francisco-City Operations and Neigh-
borhood Services Committee-Grant Infor-
mation and Budget. San Francisco: City of
San Francisco, 18 May 2010. http://www.
sfbos.org/ftp/uploadedfiles/bdsupvrs/reso-
lutions10/r0224-10.pdf
Bay Area Green Business Program. “Working
Together.” ABAG Green Business Program.
State of California, n.d. Web. June 2012.
http://www.greenbiz.ca.gov/index.html.
City of Charleston. “City of Charleston, SC
» Planning & Neighborhoods.” City of
Charleston, SC » Planning & Neighbor-
hoods. City of Charleston, 2012. Web. June
2012. http://www.charleston-sc.gov/dept/
content.aspx?nid=2062.
City of Charleston. “Green Business Chal-
lenge Information Brochure.” City of
Charleston-Green Business Challenge. City
of Charleston, 2012. Web. June 2012. http://
www.charleston-sc.gov/shared/docs/0/
gbc%20brochure%20for%202011-2012.11-22.
pdf.
ICLEI. “Chicago Green Office Challenge Win-
ners Recognized by Mayor and ICLEI.” ICLEI
Local Governments for Sustainability USA.
ICLEI, 30 May 2012. Web. June 2012. http://
www.icleiusa.org/news/press-room/press-
releases/chicago-green-office-challenge-
winners-recognized-by-mayor-and-iclei.

6. Appendix 267
B.10 Temporary ParksOP2: TEMPORARY PARKS AND PLAZA DEVELOPMENT
OVERVIEW & CHARACTERISTICS
As redevelopment projects stall around the
country due to a sluggish economy, many
urban areas are looking for creative ways
to implement “in the meantime” activities
that productively utilize spaces that would
otherwise remain vacant until the next de-
velopment cycle. Transforming vacant par-
cels into temporary pocket parks creates an
interim public benefit on sites that are often
blighted by chain-link construction fencing,
trash and graffiti. A temporary pocket park
can have the added advantage of increasing
the property values of adjacent sites as well
as providing tangible public health benefits.
A temporary lease offers property owners a
low-risk mechanism to convert a site into an
attractive public amenity than can enrich the
quality of urban life. Lease instruments can
be structured for a 3-5 year period based on
a nominal fee and typically are terminable at
the discretion of the owner, with the provi-
sion of a payback for leases cancelled within
the first year. Potential site improvements
range from simple enhancements such a
new landscaping, lighting and outdoor seat-
ing, to more programmed schemes which
might incorporate fitness/playground equip-
ment, public art installations, dog park, com-
munity garden or even lawn games such as
bocce, shuffleboard or table tennis.
A community improvement district (CID),
such as Midtown Alliance, is uniquely quali-
fied to enhance, maintain, and provide se-
curity for temporary parks since they often
already provide environmental maintenance
and public safety for the area they serve.
Further, a CID has the local political influ-
ence, strategic relationships with property
owners and financial wherewithal to facili-
tate the conversion of vacant parcels into
more productive uses, even if only on a
short-term basis.
KEY FINDINGS
• Temporary parks convert underutilized
parcels into productive spaces that add im-
mediate beauty and value to a community.
• Due to the fact that they are short-
term investments, temporary parks provide
unique opportunities to test tactical strat-
egies for activation and they make good
demonstration projects.
• Partnerships are an important compo-
nent in delivering park spaces that meet the
specific needs of the community and can
help provide user groups that will activate
the space.
• Public safety and ongoing maintenance
must be priorities and should be addressed
within the terms of the lease agreement.
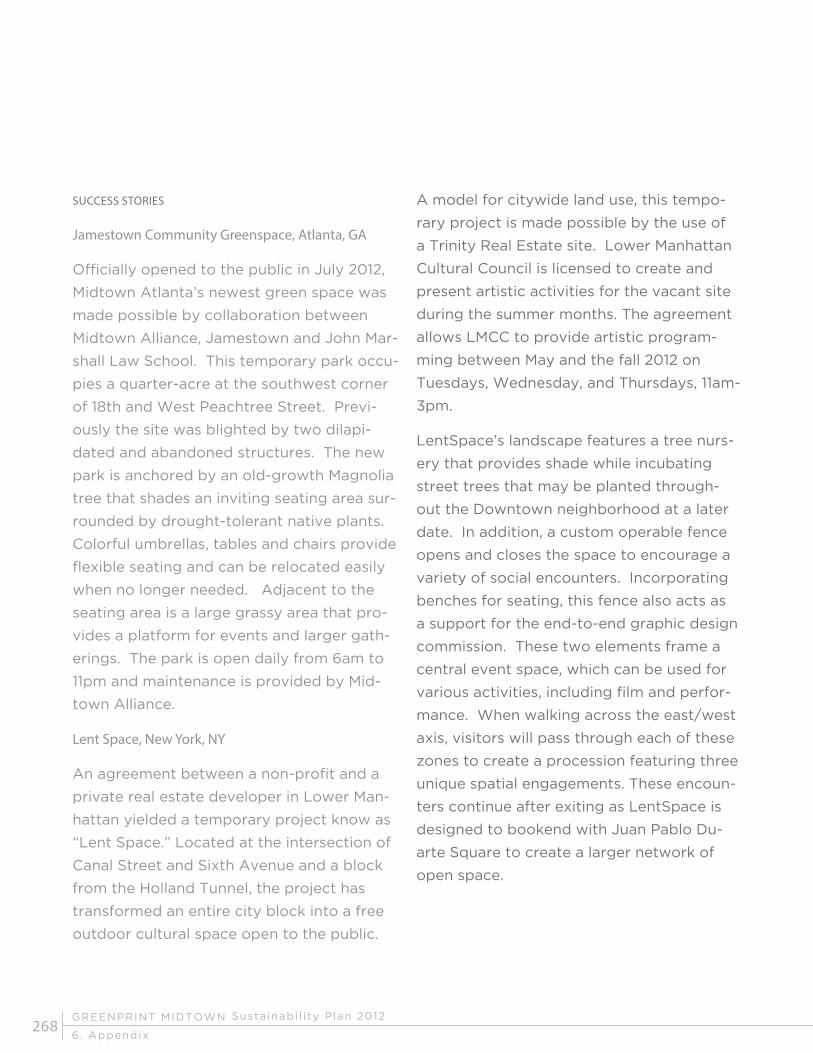
GREENPRINT MIDTOWN
6. Appendix
Susta inabi l i ty P lan 2012268
SUCCESS STORIES
Jamestown Community Greenspace, Atlanta, GA
Officially opened to the public in July 2012,
Midtown Atlanta’s newest green space was
made possible by collaboration between
Midtown Alliance, Jamestown and John Mar-
shall Law School. This temporary park occu-
pies a quarter-acre at the southwest corner
of 18th and West Peachtree Street. Previ-
ously the site was blighted by two dilapi-
dated and abandoned structures. The new
park is anchored by an old-growth Magnolia
tree that shades an inviting seating area sur-
rounded by drought-tolerant native plants.
Colorful umbrellas, tables and chairs provide
flexible seating and can be relocated easily
when no longer needed. Adjacent to the
seating area is a large grassy area that pro-
vides a platform for events and larger gath-
erings. The park is open daily from 6am to
11pm and maintenance is provided by Mid-
town Alliance.
Lent Space, New York, NY
An agreement between a non-profit and a
private real estate developer in Lower Man-
hattan yielded a temporary project know as
“Lent Space.” Located at the intersection of
Canal Street and Sixth Avenue and a block
from the Holland Tunnel, the project has
transformed an entire city block into a free
outdoor cultural space open to the public.
A model for citywide land use, this tempo-
rary project is made possible by the use of
a Trinity Real Estate site. Lower Manhattan
Cultural Council is licensed to create and
present artistic activities for the vacant site
during the summer months. The agreement
allows LMCC to provide artistic program-
ming between May and the fall 2012 on
Tuesdays, Wednesday, and Thursdays, 11am-
3pm.
LentSpace’s landscape features a tree nurs-
ery that provides shade while incubating
street trees that may be planted through-
out the Downtown neighborhood at a later
date. In addition, a custom operable fence
opens and closes the space to encourage a
variety of social encounters. Incorporating
benches for seating, this fence also acts as
a support for the end-to-end graphic design
commission. These two elements frame a
central event space, which can be used for
various activities, including film and perfor-
mance. When walking across the east/west
axis, visitors will pass through each of these
zones to create a procession featuring three
unique spatial engagements. These encoun-
ters continue after exiting as LentSpace is
designed to bookend with Juan Pablo Du-
arte Square to create a larger network of
open space.
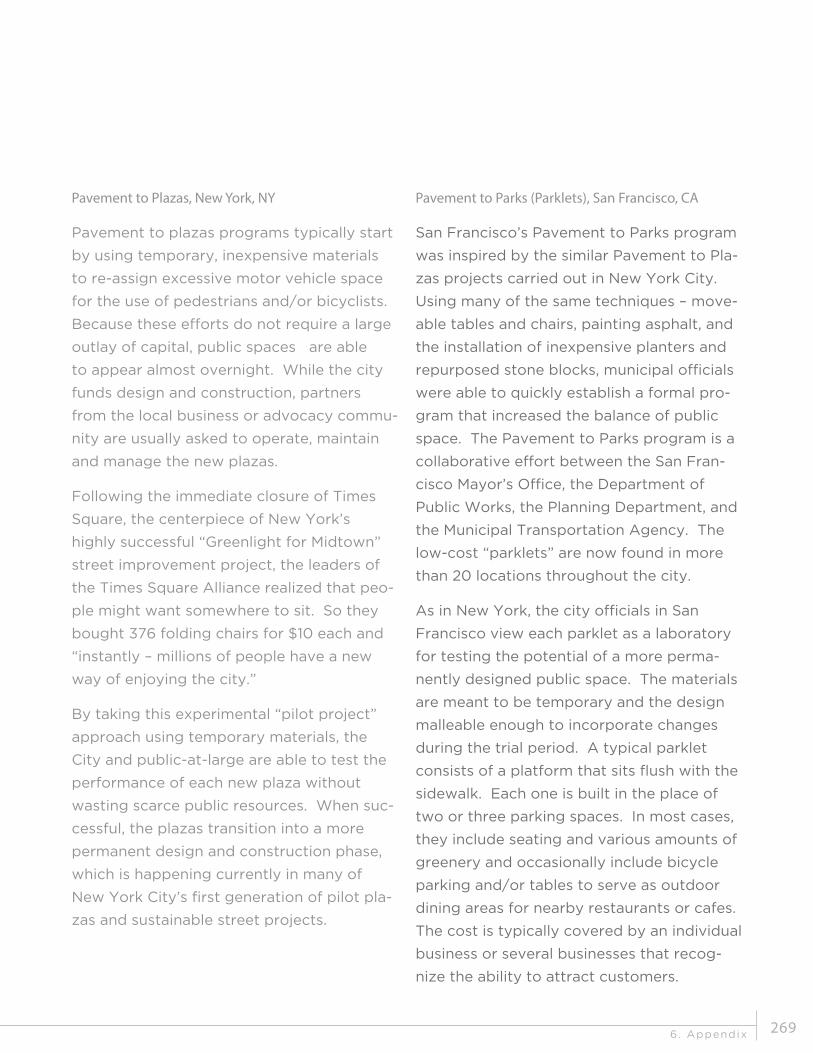
6. Appendix 269
Pavement to Plazas, New York, NY
Pavement to plazas programs typically start
by using temporary, inexpensive materials
to re-assign excessive motor vehicle space
for the use of pedestrians and/or bicyclists.
Because these efforts do not require a large
outlay of capital, public spaces are able
to appear almost overnight. While the city
funds design and construction, partners
from the local business or advocacy commu-
nity are usually asked to operate, maintain
and manage the new plazas.
Following the immediate closure of Times
Square, the centerpiece of New York’s
highly successful “Greenlight for Midtown”
street improvement project, the leaders of
the Times Square Alliance realized that peo-
ple might want somewhere to sit. So they
bought 376 folding chairs for $10 each and
“instantly – millions of people have a new
way of enjoying the city.”
By taking this experimental “pilot project”
approach using temporary materials, the
City and public-at-large are able to test the
performance of each new plaza without
wasting scarce public resources. When suc-
cessful, the plazas transition into a more
permanent design and construction phase,
which is happening currently in many of
New York City’s first generation of pilot pla-
zas and sustainable street projects.
Pavement to Parks (Parklets), San Francisco, CA
San Francisco’s Pavement to Parks program
was inspired by the similar Pavement to Pla-
zas projects carried out in New York City.
Using many of the same techniques – move-
able tables and chairs, painting asphalt, and
the installation of inexpensive planters and
repurposed stone blocks, municipal officials
were able to quickly establish a formal pro-
gram that increased the balance of public
space. The Pavement to Parks program is a
collaborative effort between the San Fran-
cisco Mayor’s Office, the Department of
Public Works, the Planning Department, and
the Municipal Transportation Agency. The
low-cost “parklets” are now found in more
than 20 locations throughout the city.
As in New York, the city officials in San
Francisco view each parklet as a laboratory
for testing the potential of a more perma-
nently designed public space. The materials
are meant to be temporary and the design
malleable enough to incorporate changes
during the trial period. A typical parklet
consists of a platform that sits flush with the
sidewalk. Each one is built in the place of
two or three parking spaces. In most cases,
they include seating and various amounts of
greenery and occasionally include bicycle
parking and/or tables to serve as outdoor
dining areas for nearby restaurants or cafes.
The cost is typically covered by an individual
business or several businesses that recog-
nize the ability to attract customers.

GREENPRINT MIDTOWN
6. Appendix
Susta inabi l i ty P lan 2012270
B.11 Tactical UrbanismOP3: OPEN SPACE ACTIVISM
OVERVIEW & CHARACTERISTICS
Improving the livability of our towns and
cities commonly starts at the street, block
or building scale. While larger scale efforts
have their place, incremental, small-scale im-
provements are increasingly seen as a way
to stage more substantial investments. This
approach allows a host of local actors to
test new concepts before making substantial
political and financial commitments. Some-
times sanctioned, sometimes not, these ac-
tions are commonly referred to as “guerilla
urbanism,” “pop-up urbanism,” “city repair,”
or “D.I.Y. urbanism.” Eventually, the term
“tactical urbanism” was inspired by a 2010
blog post that discussed the “Greenlight for
Broadway” project implemented by the New
York Department of Transportation. It has
come to describe a groundswell of other
low-cost high-impact interventions to acti-
vate spaces in urban areas.
KEY FINDINGS
While exhibiting several overlapping charac-
teristics, “tactical urbanism,” is a deliberate
approach to city-making that features the
following five characteristics:
• A deliberate, phased approach to insti-
gating change;
• An offering of local ideas for local plan-
ning challenges;
• Short-term commitment and realistic ex-
pectations;
• Low risks, with a possibility of high re-
ward; and
• The development of social capital be-
tween citizens, and the building of orga-
nizational capital between public/private
institutions, non-profit/NGSs, and their con-
stituents.
SUCCESS STORIES
Open Streets, Atlanta’s Streets Alive!
Open streets initiatives are increasingly
common in cities seeking innovative ways to
meet environmental, social, economic, and
public health goals. The idea originated in
Bogotá, Columbia, where neighborhood ac-
tivists opened the streets for people to bike,
skate, or use any human powered means
of transportation, while temporarily closing
them to motor vehicles. In Bogotá today,
70 miles of streets are opened to the public
from 7 a.m. to 2 p.m. every Sunday. Amaz-
ingly, over 800,000 people – young and old,
on foot, bike, and every imaginable kind of
wheeled device – take part each week.
The organizing sponsors of the Atlanta
event include Atlanta Bicycle Coalition,
Kwanza Hall and a steering committee filled
with civic leaders, business leaders and com-
munity leaders. The vision of Atlanta Streets
Alive is to encourage Atlanta to develop liv-
ing streets — streets that appeal to pedestri-
ans, bikers, businesses and neighbors.

6. Appendix 271
OP3: OPEN SPACE ACTIVISM
Participants in open streets initiatives de-
velop a wider understanding of their city,
each other, and the potential for making
streets friendlier for people. In this way,
open streets are a tool for building social
and political capital, while having very real
economic impacts for businesses, vendors
and organizations along the chosen route.
Chair Bombing, Brooklyn, NY
Whether to rest, socialize or simply watch
the world go by, increasing the supply of
public seating almost always makes a street
and, by extension, a neighborhood, more
livable. “Chair bombing” is the act of re-
moving salvageable material from the local
waste stream and using it to build public
seating. The process requires attention to
the design and construction of the seat-
ing as well as thoughtful consideration of
where the chairs are needed most in order
to support existing social activity or serve as
a catalyst for community gathering. Chair
bombing calls attention to the general lack
of public seating in the urban environment.
It also can be a good indicator of where fur-
ther physical improvements may be made
by a municipality, property owner, retail ten-
ant, and/or other change agents.
DoTank, a Brooklyn-based interdisciplinary
collective, has placed chairs in six locations
throughout northern Brooklyn.
While the bombings are often done in con-
junction with outdoor events, the first effort
has resulted in permanent seating at Blue
Bottle Coffee in Brooklyn’s Williamsburg
neighborhood.
Reclaimed Setbacks, Little Free Library
Setback reclamations intentionally activate
the underutilized, semi-public space found
between the public right-of-way (typi-
cally the sidewalk) and a property owner’s
principal structure. Setback reclamations
range from illegal structure extensions to
temporary programming to community gar-
dening. Such tactics help diminish the real
and perceived distances found between the
structure and the sidewalk. If done well,
reclamations can effectively create a more
engaging and social neighborhood street
environment.
An example of how to activate reclaimed
setbacks is demonstrated by a grassroots
movement known as the “Little Free Li-
brary.” This is an idea that has taken root on
lawns and in small parks across the coun-
try. “Take a book, leave a book” is the basic
concept of these miniature libraries and the
movement is gaining momentum. Construct-
ed out of salvaged materials, the libraries
often look like miniature homes or barns,
or simply just a box on a post. Little Free
Libraries can be found in at least 24 states
and eight countries.

GREENPRINT MIDTOWN
6. Appendix
Susta inabi l i ty P lan 2012272
B.12 Street Tree InventoryOP4: LANDSCAPE ENHANCEMENT PROGRAM
OVERVIEW & CHARACTERISTICS
In order to better understand the benefits
of our existing street tree canopy, identify
where gaps in coverage exist, and maintain
our trees, an inventory of Midtown’s trees
is essential. A street tree inventory should
capture the tree species, age, condition, and
exact location. Many cities and communities
are conducting tree inventories so that they
can better manage these assets. One expert
quantified the benefits of a single street tree
to be over $90,000 over the lifetime of a
tree. The best practices listed below have
taken the inventory a step further to include
a quantification of the benefits to energy,
water, and air quality.
KEY FINDINGS
• Crowd sourcing is a cost efficient way
to assist with the inventory and serves to
involve the community and educate them
about the benefits of trees.
• Use open-source code to create the
map. While easier and more cost-effective
than starting from scratch, it still requires
technical expertise.
. • While the majority of data submitted by
crowd-sourced users has been found to be
accurate, quality control and/or training is
still needed.
• If tree maintenance is the primary rea-
son for conducting an inventory, utilizing a
trained or certified arborist to conduct the
inventory will result in more accurate results
SUCCESS STORIES
San Diego County Tree Map
The San Diego County Tree Map was cre-
ated in order to map every tree in San Di-
ego County. It is sponsored by the Califor-
nia Center for Sustainable Energy (CCSE)
and structured as collaboration between
non-profits, government agencies, busi-
nesses, and the community. CCSE utilized a
web-based open-source map called Open-
TreeMap that allows for anyone to add a
tree to the inventory. The San Diego County
Tree Map website provides an online tree
species identification resource as well as
videos that show how to properly measure
the diameter of a tree. Information on the
species and tree size is used to estimate the
ecosystem services the urban forest pro-
vides, including how much energy the trees
are helping conserve, how many pounds of
air pollutants and greenhouse gases they are
absorbing from the atmosphere, and how
many gallons of stormwater they’re helping
to filter.

6. Appendix 273
OP4: LANDSCAPE ENHANCEMENT PROGRAM
San Diegans can explore the trees around
them, searching by species, location, tree
size, and a number of characteristics, such
as whether the trees bear edible fruit or
nuts, have distinct fall color or especially
beautiful flowers, or are native to Califor-
nia. Since the project’s public launch in
March 2012, over 330,000 trees have been
mapped. The project was funded through a
natural resources protection grant through
the California Department of Forestry and
Fire Protection.
Philly Tree Map
The Philly Tree Map was created to better
maintain its urban forest and to promote
sustainability within the metro area. This
map uses the same open source platform
that the San Diego County Tree Map uses. It
provides a web-based map and database of
trees located in the 13-county Philadelphia
region with similar functionality as the San
Diego Tree Map. Similar to San Diego, the
Philly Tree Map is a collaboration between
local non-profits, government agencies, and
businesses. Philadelphia uses a “reputation”
based system to encourage accuracy in how
the public submits data. Any individual can
register for a free PhillyTreeMap account
and add trees to the database or edit exist-
ing tree information.
Public users gain reputation points by con-
tributing to the PhillyTreeMap database.
After reaching 1,000 reputation points, us-
ers may edit additional data fields related to
the height and status of the tree. Users with
this higher reputation level may also review
public edits and provide positive (thumbs-
up), neutral, or negative (thumbs-down) re-
sponses to the edit. Such actions affect the
public user’s reputation (i.e. if a more experi-
enced user likes your edit, you get additional
reputation points). Reputation points are
gained and lost according based on a point
system. Since the project’s launch, over
51,000 trees have been mapped.
Downtown Atlanta Tree Inventory
In 2011, the City of Atlanta hired Davey Re-
source Group to conduct a comprehensive
inventory of Downtown street trees. This
project was initiated by the Department of
Planning and Community Development and
the Office of Parks, Recreation, and Cultural
Affairs. The inventory cost $55,000 and was
funded by $20,000 grant from the Urban
and Community Forestry Grant Program of
the U.S. Forest Service with the remainder
coming from the City’s Tree Trust Fund. The
tree inventory provided the City with infor-
mation about the species, size, quality, and
condition of approximately 9,000 public
trees in Downtown Atlanta.

GREENPRINT MIDTOWN
6. Appendix
Susta inabi l i ty P lan 2012274
With more funding, the City’s goal is to in-
ventory every public tree in the City.
Information from the inventory will help es-
tablish management priorities by:
• identifying trees that need to be pruned
or removed,
• revealing any systemic problems with
pests or disease,
• identifying the distribution of tree spe-
cies with size, height, and other characteris-
tics, and
• providing an up-to-date report on the
overall condition of the trees.
The inventory also identified locations with
sufficient space for planting trees, aiding in
future planting efforts. The Downtown area
that was inventoried was approximately four
square miles bounded by North Avenue to
the north, Boulevard to the east, Interstate
20 to the south, and Northside Drive to the
west. To date, the inventory has not been
posted online.

6. Appendix 275
B.13 Green StreetsTP1: STREETSCAPE PROGRAM IMPLEMENTATION
OVERVIEW & CHARACTERISTICS
Green Streets transform impervious street
surfaces into landscaped green spaces
that capture storm water runoff and let
water soak into the ground as plants
and soil filter pollutants. Green Streets
convert storm water from a waste that can
overload stormwater systems, to a resource
that nourishes plants and replenishes
groundwater supplies. They also create
attractive streetscapes and urban green
spaces, provide natural habitat, and help
connect neighborhoods, schools, parks,
and business districts. Green Streets also
provide shade, help reduce the urban
heat-island effect, and improve air quality.
Implementing well-defined green street
strategies in Midtown is of particular
importance because of combined sewer
overflow issues in the city.
KEY FINDINGS
• Curb extensions/Street planters
– Traditionally used for traffic calming,
curb extensions can also be used to slow,
capture, and clean street runoff. Similar
to curb extensions, street planters use
vegetation and soil to slow, capture,
and clean street runoff and stormwater.
Funding for curb extensions and street
planters can be derived from a portion of
the construction budget for projects that
involve developing in the public right-of-
way.
• City support is crucial in the success
of green streets. Cities dedicated to
creating green streets are more willing to
dedicate municipality funds to support such
programs.
• Rain gardens – Rain gardens use
captured stormwater and street runoff
to grow lush vegetated areas. These can
potentially be funded by government grants
and private business donations.
• Pervious pavement/materials –
Porous pavement and materials allow
stormwater to percolate into the ground
rather than overload sewer systems or flow
into bodies of water. This allows stormwater
to be filtered and cleaned before recharging
groundwater.
• A public/private partnership between
a city and its residents can be a beneficial
way for a city to increase the number
of trees planted along its streets. The
city provides the initial costs of planting
while the resident provides the necessary
watering in the first couple of years of the
tree’s life.

GREENPRINT MIDTOWN
6. Appendix
Susta inabi l i ty P lan 2012276
SUCCESS STORIES
Portland, OR
The City of Portland is a leader in imple-
menting Green Street strategies. In April
2007, the Portland City Council approved a
Green Street resolution, report, and policy to
implement Green Streets in public and pri-
vate development. Since then, Portland has
created seven Green Streets, with others in
the works, and won several awards. The city
collects 1 percent of the construction budget
of project in the public right-of-way, which is
put into Portland’s 1 percent for Green fund
that helps fund Green Streets projects.
New York City
New York City implements its Greenstreets
program through the Central Forestry
and Horticulture department, which was
first launched in 1996. Mayor Bloomberg’s
PlaNYC 2030 includes a budget of $8.5 mil-
lion for the construction of Greenstreets
from 2007 to 2017. As of 2010, there were
2,468 Greenstreets citywide comprising a
total of 204 acres, with 2,760 Greenstreets
planned by 2017.
Puyallup, Washington
The City of Puyallup’s Rain Garden Program
has educated hundreds of citizens on storm-
water pollution prevention, green infrastruc-
ture techniques, and has disconnected over
1 million gallons of stormwater. Since the
program began in 2009, sixty-two (62) rain
gardens have been created in seven clus-
ters throughout the City with grant funding
from the Department of Ecology and busi-
ness donations. The program offers a Rain
Garden Handbook which provides guidance
on design, installation, and upkeep of rain
gardens.
University of Rhode Island Permeable Parking Lots
The University of Rhode Island installed
two parking lots during 2002 and 2003 us-
ing permeable asphalt. Both parking lots
have porous pavement due to the fact that
they are located within the Pawcatuck sole
source aquifer, within the town of South
Kingstown’s groundwater protection overlay
district, and within the wellhead protection
area for the University’s wells.

6. Appendix 277
The porous asphalt is installed over a 1” layer
of chocker course rock and bed of uniformly
graded, clean washed crushed rock that is
usually 18-36” deep. A layer of geotextile
fabric separates the crushed rock from the
underlying soil to prevent any fine soil par-
ticles from moving up into the storage bed.
The bottom of the recharge bed is excavat-
ed to a level surface and is not compacted
to allow the water to distribute and infiltrate
evenly over the entire bottom bed area. The
permeable asphalt helps to control runoff
of pollutants to surface waters and protects
groundwater supplies. Due to concerns of
potential groundwater contamination and
compaction of the porous bituminous as-
phalt, commercial and industrial vehicles are
not permitted to park in these lots.
Berkeley Street Tree Plantings
The City of Berkeley has gained over 4,470
street and park trees since 2000. The Parks
Recreation and Waterfront Department
plants more than 800 new and replacement
trees in the parkway strip, area between the
sidewalk and curb, each year.
There is no added cost to the adjacent
property owners who want the tree planting,
but the City does require the property
owner to water the tree once a week for the
first two (2) years after planting. The City
covers any associated costs for necessary
concrete removal. The species of tree to
be planted on a specific street, along with
the planting location is determined by the
City. If a species has not been designated
for a specific street, staff will work with the
neighborhood in selecting an appropriate
species.

GREENPRINT MIDTOWN
6. Appendix
Susta inabi l i ty P lan 2012278
B.14 Transit Station Area DevelopmentTP5: LAND USE POLICIES
OVERVIEW & CHARACTERISTICS
Encouraging development around transit
stations can lead to improved sustainabil-
ity and promotes economic development.
There are many innovative policies that help
to optimize the mix and density of residen-
tial, retail, and employment surrounding
transit stations.
Some of these policies include:
• Transit Revitalization Investment Dis-
tricts (TRID)
• Transit-oriented development (TOD)
bond programs
• TOD grant or loan programs
While Midtown already has its own Special
Public Interest District, which encourages
appropriate development and aesthetic
treatments around MARTA stations, addi-
tional policies can supplement the existing
zoning district.
KEY FINDINGS
• A district-based tax increment financing
mechanism allows for the encouragement
of transit-oriented development without the
requirement of “blight” in the area.
• Government funding to encourage de-
velopment around transit stations can result
in more housing, retail, and employment
which create a more mixed-use environ-
ment.
• Development in designated transit im-
provement areas can create the passenger
ridership numbers needed to justify rail in a
municipality.
• Housing incentive zones can help spur
higher-density residential development near
transit stations. However, the budget for
these housing zones is critical to the success
of the program.
• Education/outreach is a crucial step in
getting the public to understand the impor-
tance of infill and redevelopment in down-
town areas near transit stations.
• Grant/loan incentives for TODs should
be directed towards the improvement of
residential development, enhancing pedes-
trian and bicycle pathways to stations, and
acquiring land around stations that are es-
sential to redevelopment.
SUCCESS STORIES
Pennsylvania
In 2004, Pennsylvania passed the Transit
Revitalization Investment District (TRID)
Act, which is designed to encourage transit-
oriented development by enabling the use
of a district-based tax increment financing
mechanism.

6. Appendix 279
TP5: LAND USE POLICIES
It captures increases in property values
near transit stations and keeps the money
for use within the district. It is unlike tax-
increment financing because it does not
require “blight” in the district. Many cities
have taken advantage of the passage of
the Act for planning purposes; Philadelphia
completed a TRID master plan in 2008 that
led to improvements in a number of neigh-
borhoods before the TRIDs have even been
implemented.
Massachusetts
The Massachusetts Executive Office of
Transportation and Public Works and the
Department of Housing and Community
Development created the Transit Oriented
Development Infrastructure and Housing
Support Program (TOD Bond Program)
to provide financial support to the design
and construction of TOD projects. The TOD
Bond Program provides grants ranging
from $50,000 for design to $500,000 for
bike and pedestrian improvements to $2
million for housing and parking projects
around transit stations. One outcome of the
TOD Bond Program is Concord Common
development, surrounding the historic
Concord Center commuter rail station
(pictured), which comprises three mixed
use buildings with retail space, office space,
a 180 seat restaurant, 20 rental apartments,
spaces for shared parking amongst the
different uses, and dedicated spaces for
commuter parking. Residents living in the
apartments have a landscaped pathway
from Sudbury Road to the platform, creating
a pleasant pedestrian access way.
Twin Cities (Minneapolis and St. Paul)
The City of Minneapolis, Hennepin County,
the Metropolitan Council, and the state
of Minnesota have a variety of TOD and
affordable housing programs available
throughout the region. TOD grants include
the Livable Communities Act (LCA) Transit
Oriented Development (TOD) program,
the Tax Base Revitalization Account
(TBRA), and the Liveable Communities
Demonstrations Account (LCDA) programs.
These programs provide funding for
development in a Transit Improvement Area
(TIA) or TIA-eligible station areas located
along light rail, commuter rail or bus rapid
transitways, are within one-quarter mile of
any spot along high frequency local bus
lines, or within a one-half mile radius of
bus stops or stations on high-frequency
express routes where significant passenger
infrastructure is in place.

GREENPRINT MIDTOWN
6. Appendix
Susta inabi l i ty P lan 2012280
Also, projects and developments that exhibit
compact and efficient use of available space,
contain a diversity and mix of uses with
daily conveniences and support pedestrian-
friendly physical design including access for
people with physical disabilities. TIA fund-
ing helped build Minnesota’s first light-rail
line, Hiawatha (pictured), in June 2004. In
the first five years of operation, custom-
ers boarded the Hiawatha line 42.9 million
times. In 2010, ridership totaled 10.5 million.
Connecticut
The Connecticut Office of Policy and Man-
agement created a Housing for Economic
Growth Program in April 2008 that provided
technical assistance and financial incentives
for municipalities to create housing incen-
tive zones, which had to be near transit
stations or in existing developed locations.
The zones had to allow for higher-density
development than surrounding areas and set
aside 20 percent of new residential units for
those making up to 80 percent of the Area
Median Income (AMI). The state paid mu-
nicipalities $2,000 per multi-family unit and
$5,000 per single-family unit for each build-
ing permit issued in the zone. Thrity-five
(35) applications were received initally.
Each municipality received up to $50,000.
An additional fifteen (15) grant applica-
tions were approved before the temporary
suspension of the program. Each of those
approved municipalities received up to
$20,000. As of February 2012, there are 112
acres of development devoted to incentized
housing zones with many municipalities still
in the process of adopting their incentive
housing zones.
Oregon
Oregon’s Metro Transit-Oriented Develop-
ment (TOD) Program is designed to provide
incentives, primarily in the form of mod-
est funding grants, to private developers
to build higher-density, mixed-use projects
located near transit. The TOD Program’s
activities include direct investment in de-
velopment projects, limited acquisition and
banking of property near transit, supporting
the addition of neighborhood amenities such
as fixed tenant improvements that promote
commercial activities and providing educa-
tion and outreach to local jurisdictions, de-
velopers, and citizens throughout the region
about TODs. One educational/promotional
activity is the “Get Centered” program
which is a series of quarterly half-day work-
shops educating key members of the public
on urban centers and the importance of pro-
moting infill and redevelopment.

6. Appendix 281
California
California’s Department of Housing and
Community Development Transit-Oriented
Development (TOD) Housing Program offers
grants and loans to cities, counties, transit
agencies, and developers to encourage
higher density uses in close proximity to
transit stations. Funds may be used for costs
of the housing development; infrastructure
necessary to the housing development;
capital improvements that enhance
public pedestrian or bike access from the
housing development(s) to the nearest
transit station; and/or land acquisition
by a redevelopment agency during the
predevelopment period. The first round of
Transit-Oriented Development (TOD) grants
($145 million) went to sixteen (16) projects
in the State.

GREENPRINT MIDTOWN
6. Appendix
Susta inabi l i ty P lan 2012282
B.15 StreetscapesTP1: STREETSCAPE PROGRAM IMPLEMENTATION
OVERVIEW & CHARACTERISTICS
An inviting and safe streetscape environ-
ment can encourage more people to walk
instead of drive and improve the character
of a neighborhood. Midtown already has a
robust streetscape program, called Midtown
Cityscapes, with more than $21 million in-
vested to generate $430 million in public
and private funds for streetscape improve-
ments. Over the past few years, Midtown Al-
liance has enhanced over fourteen (14) miles
of streetscape sidewalks, installed 730 new
streetlights, planted 700+ shade trees, and
installed three (3) new public plazas. The
overarching goals of Midtown Cityscapes is
to create a walkable pedestrian realm by im-
proving sidewalks, adding lights, trees and
benches, creating urban parks and green
space, and promoting pedestrian use.
KEY FINDINGS
• Pavement to Parks program helps cre-
ate environments that are more pedestrian-
oriented instead of auto-oriented in areas
of a city that are being underutilized for pe-
destrian activity. The program implements
streetscaping elements to create public
spaces that attract people.
• Parklets provide opportunities to cre-
ate a more pedestrian friendly environ-
ment in areas where urban parks and side-
walk widths may be minimal by replacing
under-utilized street parking spaces with
streetscaping elements such as tables,
chairs, and planters. Parklets can be perma-
nent fixtures in a community or temporary/
seasonal.
• The Green Alley program offers an op-
portunity for cities to make areas that are
typically paved and not suitable for people
more environmentally sustainable and pe-
destrian friendly through the use of pave-
ment treatments and streetscape elements
such as lighting fixtures.
• Public art & design helps a city create
a unique identity and sense of place. It can
improve the quality and design of buildings
and private developments, streetscapes and
public places while showcasing the talent of
local artists within a community.
SUCCESS STORIES
New York City Pavement to Parks
New York City’s Pavement to Parks program
converts excess roadway into plazas, seat-
ing areas, and parks.
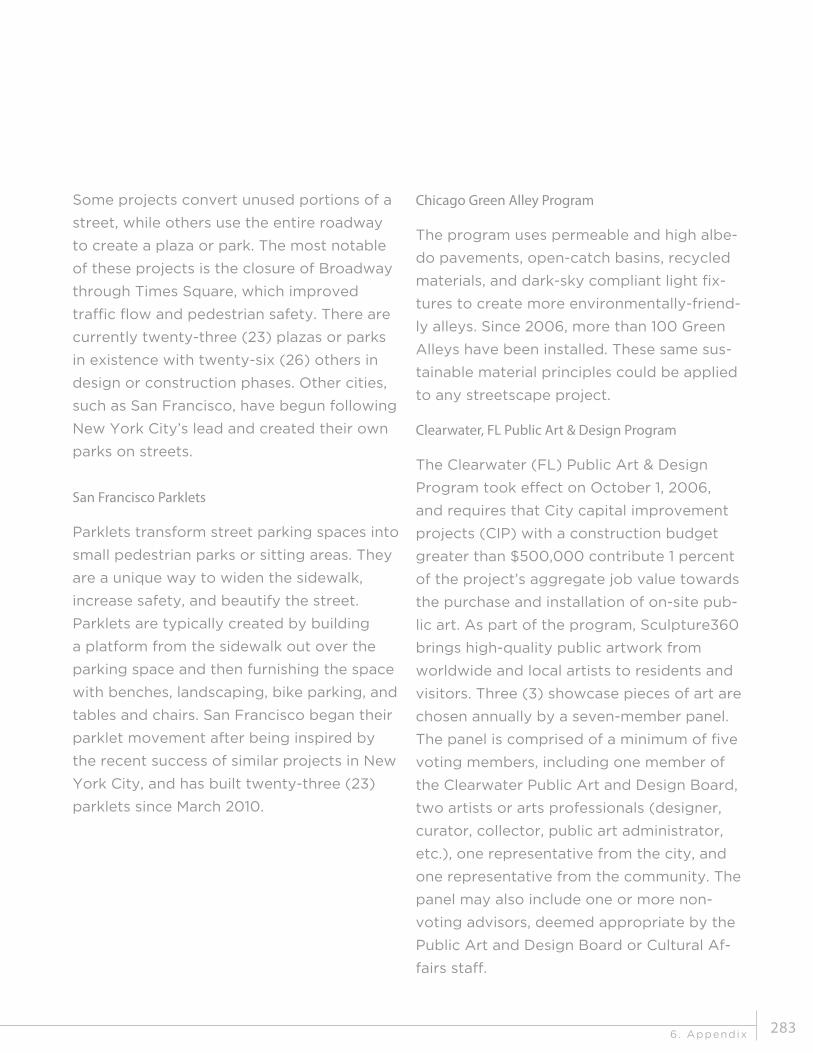
6. Appendix 283
TP1: STREETSCAPE PROGRAM IMPLEMENTATION
Some projects convert unused portions of a
street, while others use the entire roadway
to create a plaza or park. The most notable
of these projects is the closure of Broadway
through Times Square, which improved
traffic flow and pedestrian safety. There are
currently twenty-three (23) plazas or parks
in existence with twenty-six (26) others in
design or construction phases. Other cities,
such as San Francisco, have begun following
New York City’s lead and created their own
parks on streets.
San Francisco Parklets
Parklets transform street parking spaces into
small pedestrian parks or sitting areas. They
are a unique way to widen the sidewalk,
increase safety, and beautify the street.
Parklets are typically created by building
a platform from the sidewalk out over the
parking space and then furnishing the space
with benches, landscaping, bike parking, and
tables and chairs. San Francisco began their
parklet movement after being inspired by
the recent success of similar projects in New
York City, and has built twenty-three (23)
parklets since March 2010.
Chicago Green Alley Program
The program uses permeable and high albe-
do pavements, open-catch basins, recycled
materials, and dark-sky compliant light fix-
tures to create more environmentally-friend-
ly alleys. Since 2006, more than 100 Green
Alleys have been installed. These same sus-
tainable material principles could be applied
to any streetscape project.
Clearwater, FL Public Art & Design Program
The Clearwater (FL) Public Art & Design
Program took effect on October 1, 2006,
and requires that City capital improvement
projects (CIP) with a construction budget
greater than $500,000 contribute 1 percent
of the project’s aggregate job value towards
the purchase and installation of on-site pub-
lic art. As part of the program, Sculpture360
brings high-quality public artwork from
worldwide and local artists to residents and
visitors. Three (3) showcase pieces of art are
chosen annually by a seven-member panel.
The panel is comprised of a minimum of five
voting members, including one member of
the Clearwater Public Art and Design Board,
two artists or arts professionals (designer,
curator, collector, public art administrator,
etc.), one representative from the city, and
one representative from the community. The
panel may also include one or more non-
voting advisors, deemed appropriate by the
Public Art and Design Board or Cultural Af-
fairs staff.
GREENPRINT MIDTOWN
6. Appendix
Susta inabi l i ty P lan 2012284
B.16 Traffic Control & DesignTP1: STREETSCAPE PROGRAM IMPLEMENTATION
TP3: IMPROVED LOCAL TRANSIT AND COORDINATED SHUTTLE SERVICES
OVERVIEW & CHARACTERISTICS
Midtown is working to improve traffic signal
design, traffic control and lane configura-
tions to maximize intersection and local
network operations and safety for vehicles,
pedestrians, buses and cyclists. Thanks to
a grant from the Department of Energy
(DOE), Midtown is currently installing wire-
less traffic communication devices at Mid-
town’s highest-traffic intersections, which
will increase signal efficiency and traffic
management. The Georgia Department of
Transportation, City of Atlanta, and Midtown
Alliance were recently awarded a $1 million
grant to actively manage and synchronize
approximately 100 traffic signals in Mid-
town. This project includes on-call response
to traffic operations issues, repair and re-
placement of communications equipment,
and implementation of timing strategies for
different times of day and planned and un-
planned events.
KEY FINDINGS
• Traffic management benefits from man-
agement and appropriate design and con-
sideration of all aspects of the roadway.
Vehicle speeds, pedestrian crossings, transit
accommodations, medians, and street park-
ing are just a few other street characteristics
that affect the flow of traffic and safety of all
types of commuters. The Institute of
Transportation Engineers Designing Walk-
able Urban Thoroughfares: A Context Sen-
sitive Approach is an excellent source for
detailed descriptions of how to design the
entire thoroughfare for a walkable commu-
nity.
• Diagonal crossings for pedestrians can
improve vehicle capacity flow and reduce
the number of vehicle-pedestrian conflicts
when incorporated with exclusive pedestrian
phasing at signalized intersections.
• Traffic calming tools such as changing
street paths from straight to serpentine (chi-
canes) create traffic patterns that reduce
vehicle speeds while also offering opportuni-
ties for stormwater runoff landscaping treat-
ments.
• Patterned/textured intersection cross-
walks make pedestrians more visible to
motorists and reduce vehicle speeds if used
over long segment lengths.
• Mid-block two-stage pedestrian cross-
ings provide pedestrians with a center ref-
uge area which is especially beneficial to
elderly individuals and children on streets
where the number of lanes present has cre-
ated conditions that are quite wide.

6. Appendix 285
TP1: STREETSCAPE PROGRAM IMPLEMENTATION
TP3: IMPROVED LOCAL TRANSIT AND COORDINATED SHUTTLE SERVICES
• Bus bulbs are beneficial to buses
because they allow the bus to stay in its
traffic lane while dropping-off and picking-
up passengers, instead of having to pull
over to the curb. They also provide more
standing room for passengers loading/
unloading the bus on sidewalks with high
pedestrian traffic.
SUCCESS STORIES
Beverly Hills, CA Exclusive Pedestrian Phasing
The Beverly Hills Business District has a high
volume of pedestrian activity, which was
leading to a number of accidents between
pedestrians and automobiles. In 1987, the
city implemented an exclusive pedestrian
crossing phase at eight intersections where
automobiles at all approaches would allow
pedestrians to cross the intersection either
diagonally or conventionally. This allowed
pedestrians to safely cross the street and
also improved vehicle flow due to easier
movement by no longer conflicting with pe-
destrians. The average cost per intersection
was $500 to $700 and led to a 66 percent
reduction in accidents between pedestrians
and automobiles.
Austin, TX Chicanes
The City of Austin, Texas has neighborhood
chicanes which change street paths from
straight to serpentine. They are intended
to be used as traffic calming devices that
reduce vehicle speeds while having less of
an impact on emergency vehicles than tradi-
tional speed bumps. Chicanes can simply be
restriped lines painted on a street or can in-
clude curb extensions with or without land-
scaping treatments.
Gainesville, FL Textured/Patterned Crosswalks
Gainesville, Florida patterned/textured inter-
section crosswalks use stamped pavement
or alternating paving materials to create an
uneven surface for vehicles to traverse. They
are used in areas where there is substantial
pedestrian activity to make vehicles more
aware of pedestrians. Patterned/textured
streets can also reduce vehicle speeds if
used over an extended length.
Bellevue, WA Two-stage Pedestrian Crossing
Two-stage mid-block pedestrian crossings in
Bellevue, Washington allow less disruption
of traffic while giving ample time for pedes-
trians to cross the road. First, pedestrians
stop traffic in one direction while crossing
to the center refuge island median. Then the
first direction of traffic resumes while the
opposite direction is stopped for the pedes-
trians to finish crossing the road.

GREENPRINT MIDTOWN
6. Appendix
Susta inabi l i ty P lan 2012286
New York City Bus Bulbs
New York City’s bus bulbs, also known as
nubs, are essentially sidewalk extensions
through a parking lane that becomes direct-
ly adjacent to the travel lane. Bulbs are com-
mon at city sidewalks crowded with high
patron volumes and where parking along
the curb is permitted. Bulbs have particular
application along streets with lower traffic
speeds and/or low traffic volumes where it
would be acceptable to stop buses in the
travel lane. Collector streets in neighbor-
hoods and designated pedestrian districts
are good candidates for this type of bus
stop.

6. Appendix 287
B.17 Bicycle InfrastructureTP2: BICYCLE PLAN IMPLEMENTATION
OVERVIEW & CHARACTERISTICS
People are more inclined to travel by bicycle
when adequate bicycle infrastructure is
available. Midtown has a great opportunity
to enhance cycling infrastructure due to
its close proximity to Downtown, Georgia
Tech, and other in town neighborhoods.
Beyond adding bike lanes, sharrows, and
bike parking, there are additional methods
for incorporating bicycle infrastructure as an
integral component of the street network.
Several cities are implementing innovative
ways that further protect bicyclists and
incorporate bicycle facilities in the roadway.
KEY FINDINGS
• Cycle Tracks
These are buffered bike lanes located at the
very edge of the roadway and are separated
from traffic, either by a raised curb, planted
median, or parking. This increases the safety
of bicyclists from “dooring,” when drivers
open the doors of their parked cars into the
bicycle lane. These lanes can either have a
one-way flow lane with traffic, or two-lanes
going in different directions. Segregating
bicyclists from motor vehicles makes riding
in the city safer and encourages more folks
to pedal around town, decreasing motor
vehicle congestion and increasing a city’s
overall health and livability.
• Bike Boxes
Bike boxes aid in bicycle turning movements
by creating an exclusive bicycle waiting
area located ahead of vehicle stop bars at
signalized intersections. This infrastructure
improvement allows bicyclists to get
out ahead of traffic and move to the left
during a red light. The bike boxes improve
awareness and visibility of cyclists and help
prevent collisions between motorists and
cyclists.
• Contraflow Bicycle Lanes
Contraflow bicycle lanes are similar to cycle
tracks in that they separate bicycle traffic
from vehicular traffic and protect from
dooring. These facilities are different from
cycle tracks in that they function against the
flow of traffic and are more appropriate on
neighborhood-level streets and also on one-
way streets.
• Bicycle Repair Stations
While it is unsure if bicycle repair stations
increase the number of bicycle riders,
they do alleviate one barrier for potential
bicyclists which is the fear of getting a flat
or having their bicycle in need repair when
far away from work or home.
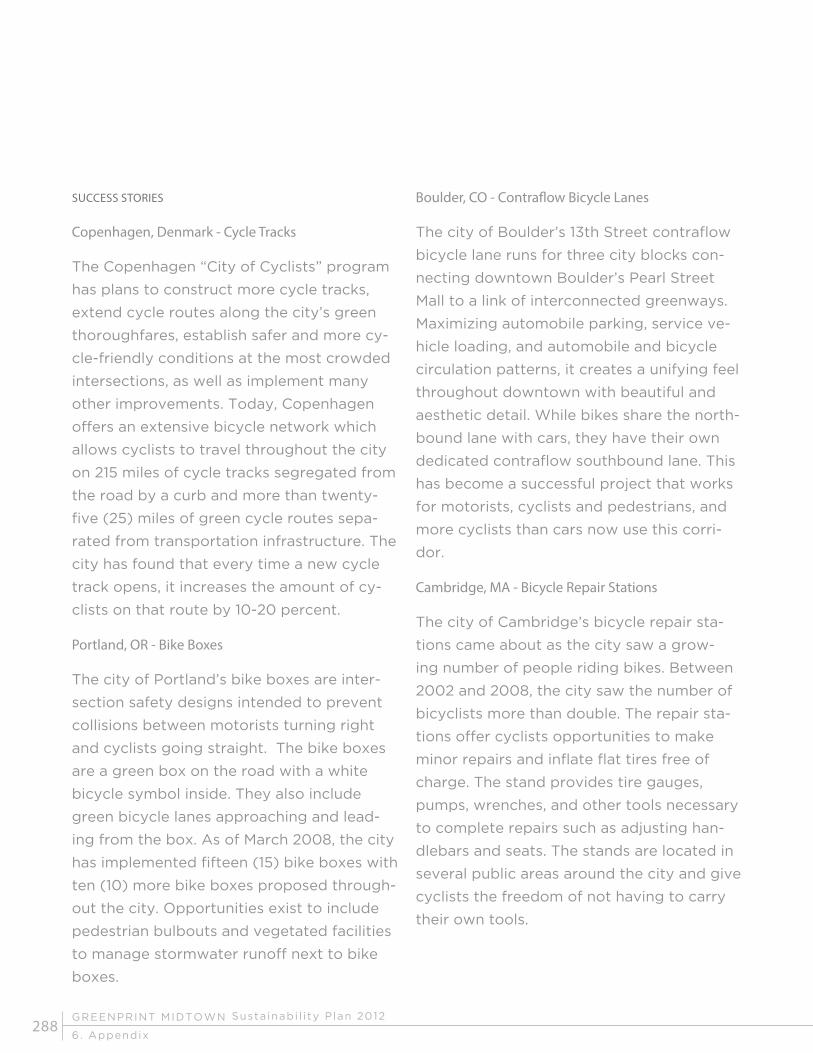
GREENPRINT MIDTOWN
6. Appendix
Susta inabi l i ty P lan 2012288
SUCCESS STORIES
Copenhagen, Denmark - Cycle Tracks
The Copenhagen “City of Cyclists” program
has plans to construct more cycle tracks,
extend cycle routes along the city’s green
thoroughfares, establish safer and more cy-
cle-friendly conditions at the most crowded
intersections, as well as implement many
other improvements. Today, Copenhagen
offers an extensive bicycle network which
allows cyclists to travel throughout the city
on 215 miles of cycle tracks segregated from
the road by a curb and more than twenty-
five (25) miles of green cycle routes sepa-
rated from transportation infrastructure. The
city has found that every time a new cycle
track opens, it increases the amount of cy-
clists on that route by 10-20 percent.
Portland, OR - Bike Boxes
The city of Portland’s bike boxes are inter-
section safety designs intended to prevent
collisions between motorists turning right
and cyclists going straight. The bike boxes
are a green box on the road with a white
bicycle symbol inside. They also include
green bicycle lanes approaching and lead-
ing from the box. As of March 2008, the city
has implemented fifteen (15) bike boxes with
ten (10) more bike boxes proposed through-
out the city. Opportunities exist to include
pedestrian bulbouts and vegetated facilities
to manage stormwater runoff next to bike
boxes.
Boulder, CO - Contraflow Bicycle Lanes
The city of Boulder’s 13th Street contraflow
bicycle lane runs for three city blocks con-
necting downtown Boulder’s Pearl Street
Mall to a link of interconnected greenways.
Maximizing automobile parking, service ve-
hicle loading, and automobile and bicycle
circulation patterns, it creates a unifying feel
throughout downtown with beautiful and
aesthetic detail. While bikes share the north-
bound lane with cars, they have their own
dedicated contraflow southbound lane. This
has become a successful project that works
for motorists, cyclists and pedestrians, and
more cyclists than cars now use this corri-
dor.
Cambridge, MA - Bicycle Repair Stations
The city of Cambridge’s bicycle repair sta-
tions came about as the city saw a grow-
ing number of people riding bikes. Between
2002 and 2008, the city saw the number of
bicyclists more than double. The repair sta-
tions offer cyclists opportunities to make
minor repairs and inflate flat tires free of
charge. The stand provides tire gauges,
pumps, wrenches, and other tools necessary
to complete repairs such as adjusting han-
dlebars and seats. The stands are located in
several public areas around the city and give
cyclists the freedom of not having to carry
their own tools.

6. Appendix 289
The purpose of this section is to identify potential policy and
infrastructure barriers to implementing the programs selected
for Greenprint Midtown. The primary focus is on regulatory and
administrative barriers that need to be addressed when working with
City of Atlanta government.
gram in the City but it is not yet in place. While
not the only financing tool, PACE helps property
owners overcome key barriers.
Midtown Alliance should encourage the City to
adopt the PACE program and voice support for
it if and when it is put before City Council.
High Efficiency Public Spaces Lighting
• Midtown’s decorative Type A and Type C
street lights do not currently have cost effective
and thoroughly tested retrofits available. It is ex-
pected that as the technology for LEDs contin-
ues to improve, costs will go down and effective-
ness will improve.
TRANSPORTATION
Streetscape Program Implementation
• There are several potential challenges in
implementing a streetscape program in Midtown.
One potential opportunity up for consideration
is to convert the curb lane of Peachtree Street
on-street parking on weekends. The City of At-
lanta’s contract with Park Atlanta could present
a barrier to adding free parking. Midtown Alli-
ance should explore this further with the City of
Atlanta Office of Transportation to determine if
this is an issue.
ENERGY
Energy Efficiency and Conservation in Buildings
• The City of Atlanta has committed to the
Department of Energy’s (DOE) Better Buildings
Challenge (BBC) and received considerable par-
ticipation to date. Fifty-six (56) buildings repre-
senting 38 million square feet of space has com-
mitted to the program to date. Assuming that
many of these buildings follow through on their
commitment to implement energy and water
retrofits, the City could experience a significant
uptick in building permit applications. This could
create a backlog and result in delays in approv-
als.
Midtown Alliance and its partners in the Atlanta
Better Buildings Challenge should make sure that
the City is aware of this potential problem so
that they can rectify it.
• Property Assessed Clean Energy or “PACE”
financing is not currently established within the
City of Atlanta. This financing tool provides a
new opportunity for property owners to finance
energy and water improvements through as-
sessments on real estate taxes. The assessment
stays with the property, rather than the property
owner. Work is underway to establish this pro-
C.1 Policy + Infrastructure Barriers to Implementation

GREENPRINT MIDTOWN
6. Appendix
Susta inabi l i ty P lan 2012290
increasing mobility.
Improved Local Transit and Coordinated Shuttle Ser-
vices
• Lack of publicly accessible real-time tran-
sit data is an existing barrier to creating useful
mobile transit applications that could serve to
increase ridership. The Atlanta Regional Com-
mission is currently working with the region’s
transit agencies to develop a trip planning ap-
plication using scheduled data. This would assist
riders when coordinating trips that use multiple
systems and better connect disparate systems.
Midtown Alliance should continue to stress the
importance of creating a real-time transit appli-
cation to MARTA and others.
WATER
Green Infrastructure Program
• The City of Atlanta is in the process of
updating its post development stormwater ordi-
nance. In its current form, the ordinance requires
that developers detain storm water on their
property. The Department of Watershed Man-
agement is seeking to encourage and require the
use of green infrastructure practices. The de-
partment has already identified existing barriers
in the zoning, subdivision, and tree ordinances
and is working to address those barriers. One
significant challenge for the City is that no green
infrastructure construction details are contained
within the City of Atlanta’s Standard Details for
Construction. These details serve as a reference
for City staff and without standard details for
green infrastructure solutions, projects could be
denied or delayed.
• As Midtown Alliance identifies new
streetscape materials that might be more envi-
ronmentally beneficial such as pavers or perme-
able pavement, they should coordinate with the
City of Atlanta Department of Public Works to
add these materials to their approved materials
list. The Department of Public Works has specif-
ic materials they will maintain and if new materi-
als are not on the approved list, it could result in
project delays.
Bicycle Plan Implementation
• Competition for limited roadway space can
create challenges for bicycle facility implementa-
tion. The recommendations in the City’s trans-
portation plan (Connect Atlanta) for core and
secondary bicycle connections are occasionally
at odds with the need to preserve motor vehicle
level of service. Midtown Alliance should be pre-
pared to conduct transportation studies for cor-
ridors that it intends to create bicycle facilities
on. It should also continue to encourage the City
to prioritize non-motorized transportation in ap-
propriate corridors.
Enhanced Transportation Demand Management
• Currently, funding through the Atlanta Re-
gional Commission can only be used for outreach
activities with employers. This restricts Midtown
Alliance’s ability to outreach to the many resi-
dents of Midtown. A regional transportation
demand management planning process is under-
way currently to assess existing TDM strategies
in the region. Through this process, Midtown
Alliance should pursue increased flexibility in or-
der to have greater impact in reducing VMT and

6. Appendix 291
shed Management would welcome the opportu-
nity to work with Midtown Alliance in exploring
the possibility of expanding the program. The
City of Atlanta has enough funding to support
the existing program for the next two years. It
should be noted that the rebate program ap-
plies to buildings constructed before 1993 and
that toilets using more than 1.6 gallons per flush
qualify for the rebate.
WASTE
Restaurant Waste Reduction
• Restaurants in Midtown must comply with
Fulton County Department of Health and Well-
ness nuisance and solid waste regulations over
which both the City of Atlanta and Fulton Coun-
ty have jurisdiction. County code requires that
solid waste containing food scraps be picked
up at a minimum of twice a week. According
to Fulton County, as long as restaurants com-
ply with the county’s nuisance, solid waste and
food services codes, there should be no barriers
to implementing a restaurant waste reduction
program in Midtown Atlanta. This could be an
onerous requirement for restaurants that seek to
have organics collected.
Multi-family Building Recycling
• The City of Atlanta’s Multifamily Recy-
cling Ordinance went into effect in July 2008.
New construction projects must allot space for
recycling receptacles. This is currently being en-
forced by the Office of Buildings.
Restaurant Water Efficiency
• Restaurants in Midtown must comply with
Fulton County Department of Health and Well-
ness sanitary water facilities and controls regula-
tions. The City of Atlanta, Fulton County, and
the State of Georgia have jurisdiction over these
regulations. County code requires that water
sources and systems must be of sufficient ca-
pacity to meet peak water demands and hot
water generation and distribution systems must
be sufficient to meet peak hot water demands
throughout the food service establishment. This
does not preclude any restrict restaurants from
making efficiency changes. However, Midtown
Alliance should be aware of these codes as they
may affect the types of efficiency strategies that
a restaurant engages in.
Rainwater Harvesting
• The City of Atlanta follows the plumbing
code for the State of Georgia which allows for
the use of rainwater for toilet flushing and out-
door irrigation. According to the Department of
Watershed Management, no barriers exist that
would prevent the expansion of rainwater har-
vesting for non-potable use. However, the City
of Atlanta does not have an ordinance which
allows for implementing rainwater harvesting
for potable use in multi-family and commercial
buildings, only non-potable use.
Multi-family Water Efficiency
• The City of Atlanta’s toilet rebate program
includes both single family and multifamily resi-
dential buildings. While not currently offered to
commercial buildings, the Department of Water-

GREENPRINT MIDTOWN
6. Appendix
Susta inabi l i ty P lan 2012292
mechanism to function as intended, appropriate
sites for such parks must be identified in a small
area plan for Midtown and that plan must be ad-
opted into the City of Atlanta’s Comprehensive
Development Plan. A corollary issue relates to
the need for a method of determining the mon-
etary value of open space requirements so that
a “cash-in-lieu-of open space” provision could
be implemented. This would be useful in cases
where the open space requirement cannot be
met on-site and it makes more sense to secure
funding to help establish a park in an off-site
location. Finally, a dedicated open space fund
would need to be established to receive and hold
funds if they were set aside for a future transfer.
Midtown Alliance intends to with the City to
update the zoning code so that the open space
transfer mechanism works.
Existing multifamily buildings of six or more units
are required to provide space and containers for
their tenants. Since the collection of recycled
materials in multi-family buildings is handled by
private companies and not the City of Atlanta,
there appears to be some confusion at the De-
partment of Public Works and Office of Solid
Waste Services as to whose responsibility it is to
enforce the ordinance within existing buildings.
While lack of enforcement can be an issue, most
buildings are already complying and Midtown
Alliance can work with those that aren’t to get
them started.
Electronics Recycling
• According to the Fulton County Department
of Health and Wellness as long as the e-waste re-
cycling program complies with the county’s nui-
sance and solid wastes codes, county ordinances
should not present any barriers. To minimize the
potential for non-compliance, e-waste transport-
ed to a recycling facility in a timely manner and
should not be stored outside for any extensive
period of time.
OPEN SPACE
Acquisition and Development of Civic Squares
• Midtown’s SPI zoning allows developers
to transfer a portion of their required open space
off-site to create a single consolidated park serv-
ing multiple developments rather than numerous
marginal open spaces spread across several par-
cels. However, the mechanism to facilitate this
transfer is not currently in place. In order for this