Asynchronous parallel successive overrelaxation for the symmetric linear complementarity problem
Upload
independentCategory
view
2download
0
Source processes of the 1978 and 2005 Miyagi-oki, Japan,
earthquakes: Repeated rupture of asperities over
successive large earthquakes
Changjiang Wu,1,2 Kazuki Koketsu,1 and Hiroe Miyake1
Received 29 May 2007; revised 24 February 2008; accepted 14 March 2008; published 23 August 2008.
[1] Highly similar seismograms commonly observed along transform or convergent plateboundaries indicate that repeated small to moderate earthquakes occur within a singlearea. The results of source-process inversions for seismic events within the northeasternJapan subduction zone suggest that large earthquakes and their component asperitiesalso exhibit this repeating nature under certain conditions. However, sets of similarseismograms that might provide direct evidence of the repeated rupture oflarge-earthquake asperities have not been observed. This paper analyzes two offshoreearthquakes near Miyagi Prefecture, Japan, the most recent occurring in 2005 with a JMAmagnitude (M) of 7.2 in the source region of the 1978 earthquake (M7.4). Wedemonstrate the similarity in waveforms from the seismograms recorded during the 1978and 2005 earthquakes. The early portions of the 2005 seismograms resemble the 1978seismograms, suggesting that the asperities located close to the 1978 hypocenterruptured again during the 2005 event. The seismogram similarities provide the first directevidence for the repeated rupture of asperities during successive large earthquakes.The results of our waveform inversions further indicate that the two asperities of the 2005event largely coincide with the southern two asperities of the 1978 event. Theserepeating asperities are recorded in the early portions of the 2005 seismograms with 60%of the amplitude recorded in the 1978 seismograms. The characteristic behavior of theasperities supports the slip-predictable recurrence model of earthquake rupture ratherthan the time-predictable recurrence model.
Citation: Wu, C., K. Koketsu, and H. Miyake (2008), Source processes of the 1978 and 2005 Miyagi-oki, Japan, earthquakes:
Repeated rupture of asperities over successive large earthquakes, J. Geophys. Res., 113, B08316, doi:10.1029/2007JB005189.
1. Introduction
[2] It is a classical and important issue as to whetherearthquakes recur characteristically or noncharacteristically[Schwartz, 1999]. The ability to identify large earthquakes ascharacteristic events within individual areas would enablelong-term forecasting of the occurrence of earthquakes andstrong ground motions. Characteristic earthquake regularityfor small to moderate earthquakes along transform or con-vergent plate boundaries has been determined by observingthe degree of waveform similarity in seismograms. Forexample, highly similar seismograms have been observedthat record the periodic recurrence of microearthquakes onthe San Andreas and Hayward faults in California [Nadeauet al., 1995; Burgmann et al., 2000], and clusters of smallearthquakes on the upper surface of a subducting plate innortheastern Japan have been observed with highly similarwaveforms [Igarashi et al., 2003]. Medium-sized earth-
quakes that occurred near Parkfield, California, in 1934and 1966 produced remarkably similar seismograms [Bakunand McEvilly, 1979]. In addition, eight similar earthquakesof magnitude 4.8 were observed from 1957 to 1995 along asubducting plate boundary off Sanriku, northeastern Japan[Matsuzawa et al., 2002].[3] While the above studies document examples of sim-
ilar seismograms from small and medium earthquakes, wehave yet to observe such repeated seismograms as directevidence of the characteristic behavior of large earthquakes.Seismograms of subduction-zone earthquakes, which aregenerally large-scale and frequent, are critical for seismicdisaster mitigation and hazard assessment and provide largeamounts of observational data. Northeastern Japan, wherethe Pacific Plate subducts beneath the Eurasian Plate (seethe inset map of Figure 1), provides a strong example of thecharacteristic behavior of seismic events because of the highrecurrence rate of large earthquakes (see Table 1) and thedetailed monitoring of the area by a dense array of strongmotion seismographs in the K-NET [Kinoshita, 1998] andKiK-net [Aoi et al., 2000] networks. Waveform inversionmethods are useful tools for capturing earthquake sourceprocesses, and the results of waveform inversions forrepeated large earthquakes within a single region in north-
JOURNAL OF GEOPHYSICAL RESEARCH, VOL. 113, B08316, doi:10.1029/2007JB005189, 2008
1Earthquake Research Institute, University of Tokyo, Tokyo, Japan.2Now at National Research Institute for Earth Science and Disaster
Prevention, Tsukuba, Japan.
Copyright 2008 by the American Geophysical Union.0148-0227/08/2007JB005189$09.00
B08316 1 of 15

eastern Japan have allowed a comparison of their character-istics. The waveform inversion methods have been appliedto recent high-quality digital records derived from denseseismograph arrays as well as to historical seismograms.[4] Historical records reveal that Miyagi Prefecture in
northeastern Japan has been affected by large offshore earth-quakes at an average interval of 37.1 years [EarthquakeResearch Committee, 2005; 6 historical events from1793 to 1978 listed in Table 1]. The most recent events inthe Miyagi-oki region (translated to English as ‘‘region offthe coast of Miyagi’’) occurred in 1936 and 1978, both withJapan Meteorological Agency (JMA) -reported magnitudesof 7.4. A Japanese Government report concluded that there
was a 99% probability of an M7.5 Miyagi-oki earthquakeoccurring in the following 30-year interval based on1 January 2005 [Earthquake Research Committee,23 March 2005]. A seismic event actually occurred in thisarea on 16 August 2005, although its magnitude (M) of7.2 was somewhat smaller than those of the 1936 and 1978events. The 2005 event was recorded by modern K-NETand KiK-net seismographs, whereas the previous event in1978 was observed by strong motion seismographs. In thepresent study, we investigated the two waveform data setsfrom the 1978 and 2005 events, and then identified thesource processes of the two earthquakes using waveforminversion methods.
2. Waveform Data
2.1. Data Sets
[5] For the 1978 earthquake, we used displacementrecords observed at eight stations (black squares in Figure 1)equipped with JMA-5X low-gain displacement seismo-graphs [Hamamatsu, 1966] and accelerograms observed atsix stations (black triangles in Figure 1) equipped withSMAC strong motion seismographs [Iai et al., 1978]. Atime domain recursive filter was applied to both sets ofrecords with a passband of 0.025 to 0.8 Hz. We thenconverted the SMAC accelerograms into JMA-5X velocityseismograms using digital integration and instrumentalresponse filters. The seismograms were trimmed to show50 s durations, except those with clipped displacementrecords. The timing of the seismograms was adjusted bycomparing the S-wave arrival times and the calculatedtraveltimes.[6] The KiK-net network consists of three-component
accelerometers deployed throughout Japan in 1997 withsensors set at the surface and in boreholes with a minimum100 m depth. KiK-net borehole instruments record higher-quality waveforms than K-NET instruments because oflower background noise and a broader dynamic range.Consequently, we used accelerograms observed in bore-holes at 12 KiK-net stations (red circles in Figure 1) andteleseismic P wave records observed at 33 stations of theIncorporated Research Institutions of Seismology (IRIS)Global Seismographic Network (Figure 2) for the 2005earthquake. The accelerograms with 50 s durations wereintegrated into velocity waveforms after applying a band-pass filter of 0.02 to 0.8 Hz. All of the processed seismo-grams for both earthquakes were resampled at a frequencyof 2 Hz.
2.2. Waveform Similarity
[7] Figure 3 compares the displacement seismograms forthe 1978 event recorded at the eight JMA stations and the2005 event at the nearest K-NET stations. The seismogram
Figure 1. Tectonic setting and observation network for theMiyagi-oki earthquakes. (a) Red circles, black squares, andblack triangles denote KiK-net, JMA, and SMAC stations,respectively. The main map shows the land surface andseafloor topography in the area indicated by the blackrectangle in the inset map. (b) Cross-sectional distribution ofsmall earthquakes recorded from 31 October 2002 to25 March 2003 (circles). The red stars represent the(a) epicenter and (b) hypocenter of the 2005 earthquake.
Table 1. A Series of the Miyagi-Oki Earthquakes
Date Interval Magnitude
17 Feb 1793 �8.220 July 1835 42.4 years �7.321 Oct 1861 26.3 years �7.420 Feb 1897 35.3 years 7.43 Nov 1936 39.7 years 7.412 Jun 1978 41.6 years 7.416 Aug 2005 27.2 years 7.2
B08316 WU ET AL.: SOURCE PROCESSES OF THE MIYAGI-OKI EARTHQUAKES
2 of 15
B08316

order, from the upper to the lower, corresponds to the southto north station order. The seismograms for the 2005 eventwere obtained by twice integrating broadband accelerationrecords observed at nearby K-NET stations with a timedomain digital filter, which exactly followed the frequencyresponse of the JMA-5X seismograph. The 1978 seismo-grams were reduced to 60% of their original values becauseof the larger moment release of this event than the 2005event. Although the later portions of the 1978 seismogramsrecorded at the central and northern stations are clipped, wediscovered that the 1978 and 2005 seismograms are highlysimilar, with the exception of the seismograms recorded atcertain northern stations, such as ‘‘ofujma’’, ‘‘miyjma’’, and‘‘mrkjma.’’ In particular, the 2005 seismograms resemblethe early portions of the 1978 seismograms. At the southernstations, correlations between the 1978 seismograms and the2005 seismograms are all above 0.7 and reach 0.9 at the‘‘fksjma’’ stations (see Table 2). Figure 3 clearly showssmaller ratios of the recorded maximum amplitudes of the1978 seismograms to the 2005 ones at the southern stationsthan those at the northern stations: the 15 upper components(i.e., at the five southern stations) show ratios of 1.97 ± 0.96,while the 9 lower 9 components (i.e., at the three northernstations) show ratios of 4.72 ± 1.62.
3. Waveform Inversion Analysis
3.1. Velocity Models and Green’s Functions
[8] To confirm the repeated rupture of the large-earth-quake asperities, we undertook source-process inversions ofthe waveform data described in the previous section. Wefirst constructed horizontally layered velocity models for theobservation stations. The common base model summarized
in Table 3 was built based on previous studies of the areacrustal structure such as Iwasaki et al. [2001] and Nakajimaet al. [2002]. Two sedimentary layers for the JMA andSMAC stations located within the Sendai basin (Figure 1)were introduced in the model, for which velocity profilesare shown in Table 4, whereas the shallow parts of themodels for the KiK-net stations were individually con-structed based on the velocity profiles within the boreholes(Table 5) to provide calibrated 1-D Green’s functions [e.g.,Graves and Wald, 2001].[9] The Green’s functions were calculated using a one-
dimensional, horizontally layered velocity model and thereflection/transmission matrix method [Kennett and Kerry,1979]. Green’s functions for the KiK-net stations werecalculated for the buried receivers. The teleseismic Green’sfunctions were calculated according to the method de-scribed in Kikuchi and Kanamori [1982]. We applied thesame bandpass filters as those used for the observed seismo-grams. In particular, the frequency response of the JMA-5Xseismograph was applied to the Green’s functions for theJMA stations.
3.2. Source Models and Inversion Procedures
[10] The depths of offshore earthquakes cannot be deter-mined precisely because seismic networks are mostly com-posed of land stations. Accordingly, for the source models,we used only the horizontal coordinates of the 1978 and2005 hypocenters determined by the JMA and the Earth-quake Research Institute, University of Tokyo. The faultplanes are located along the plate boundary, which is welldefined by recent earthquake observation efforts undertakenusing ocean bottom seismometers (OBSs) in the Miyagi-okiarea [Yamamoto et al., 2004]. OBSs can greatly improvedepth determination and hence reveal a more accuratedepiction of plate boundary geometry. The hypocenters onthe fault planes were located at a depth of 30 km. Note thatthis depth is 10 km shallower than that determined by JMA,but consistent with the hypocenter depth of 27 km deter-mined by Seno et al. [1980]. We then determined theorientation of the fault planes from our CMT solutions forthe 1978 and 2005 earthquakes. Table 6 lists the parametersof the source models, which incorporated dimensions esti-mated on the basis of aftershock distributions. Since theorientation of the fault planes for both events are almostidentical, we assumed that the 1978 and 2005 earthquakesoccurred on a single fault plane.[11] We divided the fault plane into small subfaults,
allowing their slip vectors to be rotated vertically to 90�.The source time function on each subfault is expressed bynine half-overlapped isosceles triangles with a width of 1 s,resulting in a synthetic waveform that is formulated to be asum of Green’s function convolutions with these timefunctions. We added spatial and temporal smoothing con-straints to the model parameters, and the relative weights ofthe waveforms to the sum of squared differences betweenobserved and synthetic waveforms were basically deter-mined using the Akaike Bayesian Information Criterion(ABIC). We then determined the slips of the subfaults byminimizing the sum of squared differences with the non-negative least squares method by Wu and Takeo [2004]. Ajoint inversion of strong motion and teleseismic waveformswas completed for the 2005 earthquake. The teleseismic
Figure 2. Map of the teleseismic stations (solid blackcircles) used in the waveform inversion for the 2005Miyagi-oki earthquake. The epicenter is marked by a blackstar.
B08316 WU ET AL.: SOURCE PROCESSES OF THE MIYAGI-OKI EARTHQUAKES
3 of 15
B08316

waveforms were weighted such that the sum of theirsquared amplitudes (normalized for each component) wasequal to that of the strong motion data.
4. Results
[12] A linear inversion method usually assumes a maxi-mum global rupture velocity Vr to control the start time ofthe first time window on each subfault. However, the local
Figure 3. Comparison of seismograms for the 1978 and 2005 events. The displacement seismogramsobserved by JMA-5X seismographs during the 1978 Miyagi-oki earthquake are reduced to 60% oftheir original values (black traces). The acceleration seismograms observed during the 2005 earthquake atK-NET stations located closet to the JMA stations were converted to displacement seismograms (redtraces) using the JMA-5X response filter.
Table 2. Waveform Correlation of the 1978 and 2005 Earthquakes
Station EW NS UD
isnjma/myg010 0.82 (11sa) 0.73(11s) 0.71(11s)onajma/fks011 0.88(21s) 0.91(21s) 0.82(22s)fksjma/fks003 0.93(16s) 0.73(16s) 0.90(16s)yamjma/ymt011 0.80(17s) 0.90(19s) 0.77(19s)senjma/myg013 0.71(10s) 0.73(10s) 0.75(10s)
aInside the parenthesis is duration of the time window for correlationcalculation.
B08316 WU ET AL.: SOURCE PROCESSES OF THE MIYAGI-OKI EARTHQUAKES
4 of 15
B08316

rupture velocity may vary from the assumed value Vr whenmultitime windows are used. Furthermore, the maximumvelocity assumption affects the final results since theduration of multitime windows and the width of each timewindow are limited. In the current study, we searched forthe best value by comparing the waveform fitting errors fordifferent maximum rupture velocities. For example, in thecase of the 1978 Miyagi-oki earthquake, the ratio of thereduced variance to the initial variance between the syn-thetic and observed waveforms increased gradually from46 to 52% as the maximum velocity Vr increased from 2.4 to3.2 km/s, and then decreased to 51% when Vr reached3.4 km/s. Vr of 3.2 km/s was thus determined for the 1978earthquake. Similarly, Vr of 3.4 km/s was selected for the2005 earthquake.[13] Figure 4 shows the slip distributions on the fault
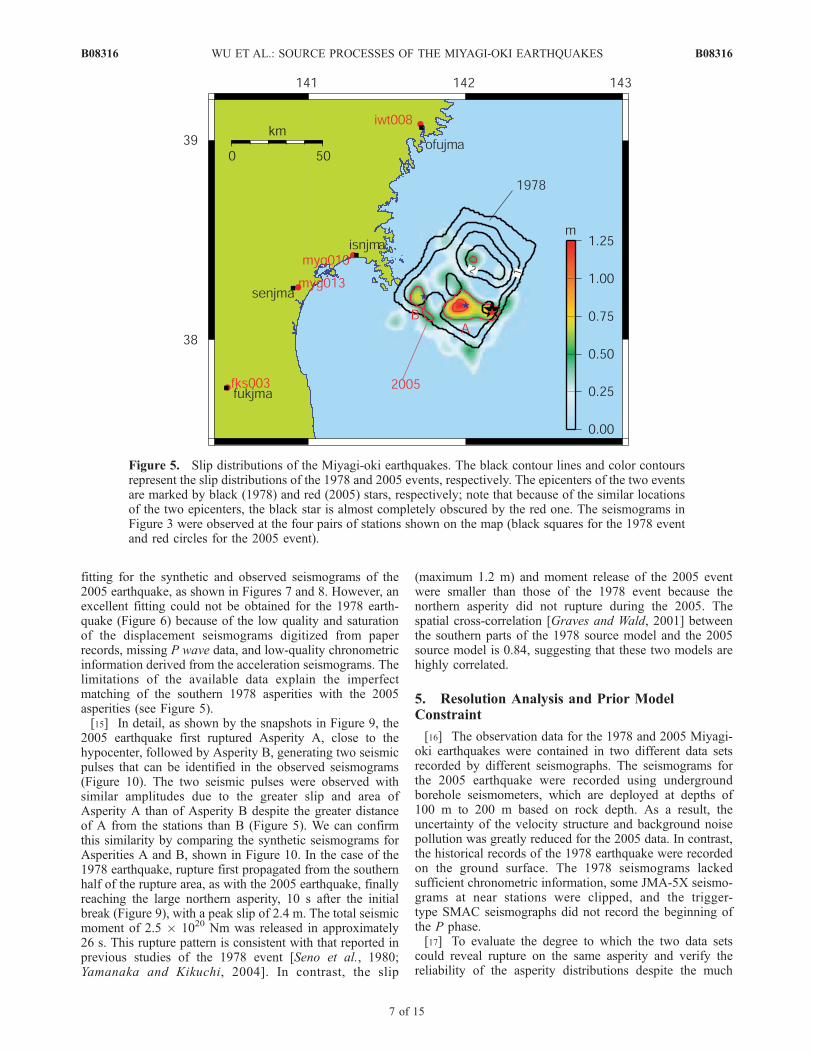
plane derived from the above waveform inversions for the1978 and 2005 Miyagi-oki earthquakes. Figure 5 comparesthe slip distributions for the both events projected onto thesurface. Our inversion results indicate that the source of1978 earthquake was a large asperity in the northern half ofthe rupture area and two smaller asperities in the southernhalf. For the 2005 event, we recovered two asperities(marked as A and B in Figure 5, and referred to below asAsperities A and B) that largely coincide with the southernasperities of the 1978 event. The hypocenter of the 2005event also largely coincides with that of the 1978 event (redand black stars in Figure 5), supporting the conclusion thatthese repeating asperities share a common rupture mode andthat they generated the similar seismograms in Figure 3.However, the moment release for the 2005 event is differentfrom that for the southern half of the 1978 event. The 2005event seismic moment release was 0.64 � 1020 Nm, whichis just 60% of the moment release from the southernasperities of the 1978 event; consequently, the 2005 seismo-grams record amplitudes that are 60% of those seen in the1978 seismograms, as shown in Figure 3.[14] Figures 6 to 8 favorably compare the observed and
synthetic seismograms. In particular, the high quality of theKiK-net and IRIS GSN seismograms as well as the appro-priate velocity models enabled an excellent waveform
Table 3. Velocity Model in the Crust and Upper Mantle
Vp, km/s Vs, km/s Density, g/cm3 Depth, km Qp Qs
6.08 3.50 2.64 5.0 340.0 170.06.23 3.60 2.65 13.0 360.0 180.06.35 3.64 2.70 21.0 400.0 250.06.55 3.68 2.75 27.0 450.0 350.06.95 3.96 2.90 32.0 600.0 350.07.60 4.29 3.10 40.0 700.0 400.07.69 4.31 3.15 65.0 1000.0 500.07.73 4.34 3.20 90.0 1000.0 500.08.27 4.56 3.30 120.0 1000.0 500.08.37 4.61 3.35 150.0 1000.0 500.0
Table 4. Surface Layers in the Velocity Model for the 1978
Miyagi-Oki Earthquake
Vp, km/s Vs, km/s Density, g/cm3 Depth, km Qp Qs
1.93 0.69 2.05 0.4 100.0 70.02.75 1.59 2.23 0.7 200.0 100.0
Table 5. Surface Layers in the Velocity Model for the 2005
Miyagi-Oki Earthquake
Vp, km/s Vs, km/s Density, g/cm3 Depth, km Qp Qs
fksh192.14 0.97 1.74 0.04 85.60 42.804.68 3.06 2.41 0.70 187.20 93.605.63 3.26 2.65 2.00 225.20 112.60
iwth042.20 0.83 1.75 0.05 88.00 44.004.00 2.30 2.23 0.25 160.00 80.004.83 2.45 2.45 0.70 193.20 96.605.63 3.26 2.65 2.00 225.20 112.60
iwth053.80 1.50 2.18 0.05 152.00 76.005.20 2.60 2.55 0.70 208.00 104.005.63 3.26 2.65 2.00 225.20 112.60
iwth185.28 2.27 2.57 0.06 211.20 105.605.86 2.63 2.73 2.00 234.40 117.20
iwth235.70 2.40 2.69 0.09 228.00 114.005.70 2.20 2.69 2.00 228.00 114.00
iwth275.25 2.59 2.57 0.08 210.00 105.005.25 2.79 2.57 0.70 210.00 105.005.63 3.26 2.65 2.00 225.20 112.60
mygh011.75 0.56 1.63 0.11 70.00 35.003.52 1.75 2.11 0.25 140.80 70.404.83 2.45 2.45 0.70 193.20 96.605.63 3.26 2.67 2.00 225.20 112.60
mygh032.85 1.65 1.93 0.03 114.00 57.004.98 2.63 2.49 0.70 199.20 99.605.63 3.26 2.65 2.00 225.20 112.60
mygh044.75 1.84 2.43 0.00 190.00 95.004.75 2.83 2.43 0.04 190.00 95.005.63 3.26 2.65 0.70 225.20 112.60
mygh114.80 2.59 2.45 0.12 192.00 96.005.30 2.78 2.58 0.70 212.00 106.005.63 3.26 2.65 2.00 225.20 112.60
mygh124.02 1.69 2.24 0.03 160.80 80.405.51 2.67 2.64 2.00 220.40 110.20
mygh081.72 0.59 1.63 0.00 68.80 34.402.26 0.97 1.77 0.09 90.40 45.203.52 1.75 2.11 0.20 140.80 70.404.83 2.45 2.45 0.35 193.20 96.605.63 3.26 2.65 0.98 225.20 112.60
Table 6. Parameters of the Source Models
Earthquake
Hypocenter Location
Strike,
deg.
Dip,
deg.
Rake,
deg.
Dimension,
Length by
WidthLatitude Longitude Depth
1978 38.150 142.167 30 km 211 22 90 ± 45 78 km � 72 km
2005 38.137 142.167 30 km 211 23 90 ± 45 70 km � 70 km
B08316 WU ET AL.: SOURCE PROCESSES OF THE MIYAGI-OKI EARTHQUAKES
5 of 15
B08316

Figure 4. Slip distributions of the 1978 earthquake (upper) and the 2005 earthquake (lower). The slipvectors are shown with black arrows, and the hypocenters are marked by red stars.
B08316 WU ET AL.: SOURCE PROCESSES OF THE MIYAGI-OKI EARTHQUAKES
6 of 15
B08316
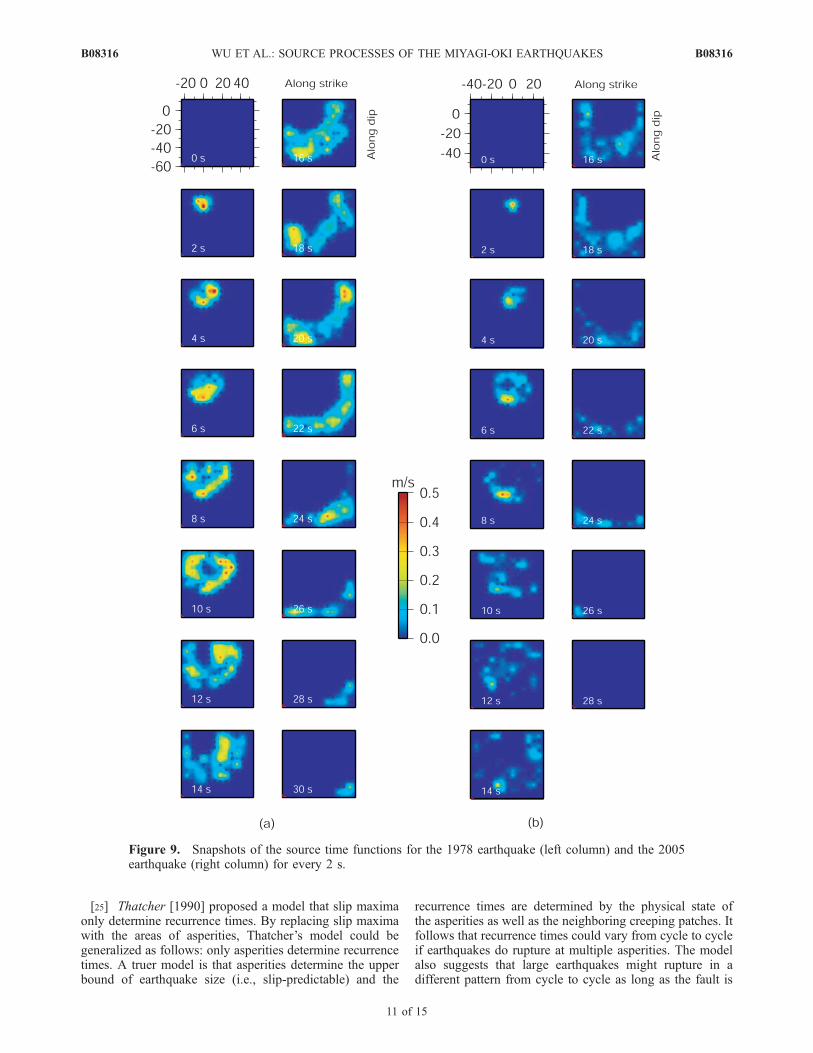
fitting for the synthetic and observed seismograms of the2005 earthquake, as shown in Figures 7 and 8. However, anexcellent fitting could not be obtained for the 1978 earth-quake (Figure 6) because of the low quality and saturationof the displacement seismograms digitized from paperrecords, missing P wave data, and low-quality chronometricinformation derived from the acceleration seismograms. Thelimitations of the available data explain the imperfectmatching of the southern 1978 asperities with the 2005asperities (see Figure 5).[15] In detail, as shown by the snapshots in Figure 9, the
2005 earthquake first ruptured Asperity A, close to thehypocenter, followed by Asperity B, generating two seismicpulses that can be identified in the observed seismograms(Figure 10). The two seismic pulses were observed withsimilar amplitudes due to the greater slip and area ofAsperity A than of Asperity B despite the greater distanceof A from the stations than B (Figure 5). We can confirmthis similarity by comparing the synthetic seismograms forAsperities A and B, shown in Figure 10. In the case of the1978 earthquake, rupture first propagated from the southernhalf of the rupture area, as with the 2005 earthquake, finallyreaching the large northern asperity, 10 s after the initialbreak (Figure 9), with a peak slip of 2.4 m. The total seismicmoment of 2.5 � 1020 Nm was released in approximately26 s. This rupture pattern is consistent with that reported inprevious studies of the 1978 event [Seno et al., 1980;Yamanaka and Kikuchi, 2004]. In contrast, the slip
(maximum 1.2 m) and moment release of the 2005 eventwere smaller than those of the 1978 event because thenorthern asperity did not rupture during the 2005. Thespatial cross-correlation [Graves and Wald, 2001] betweenthe southern parts of the 1978 source model and the 2005source model is 0.84, suggesting that these two models arehighly correlated.
5. Resolution Analysis and Prior ModelConstraint
[16] The observation data for the 1978 and 2005 Miyagi-oki earthquakes were contained in two different data setsrecorded by different seismographs. The seismograms forthe 2005 earthquake were recorded using undergroundborehole seismometers, which are deployed at depths of100 m to 200 m based on rock depth. As a result, theuncertainty of the velocity structure and background noisepollution was greatly reduced for the 2005 data. In contrast,the historical records of the 1978 earthquake were recordedon the ground surface. The 1978 seismograms lackedsufficient chronometric information, some JMA-5X seismo-grams at near stations were clipped, and the trigger-type SMAC seismographs did not record the beginning ofthe P phase.[17] To evaluate the degree to which the two data sets
could reveal rupture on the same asperity and verify thereliability of the asperity distributions despite the much
Figure 5. Slip distributions of the Miyagi-oki earthquakes. The black contour lines and color contoursrepresent the slip distributions of the 1978 and 2005 events, respectively. The epicenters of the two eventsare marked by black (1978) and red (2005) stars, respectively; note that because of the similar locationsof the two epicenters, the black star is almost completely obscured by the red one. The seismograms inFigure 3 were observed at the four pairs of stations shown on the map (black squares for the 1978 eventand red circles for the 2005 event).
B08316 WU ET AL.: SOURCE PROCESSES OF THE MIYAGI-OKI EARTHQUAKES
7 of 15
B08316

higher resolution of 2005 than 1978 earthquake data, wedevised several numerical tests. Referring to the slip distri-bution of the 2005 earthquake, we constructed an inputsource model for the two asperities, with uniform slips of 2and 1 m, respectively for Asperities A and B (see Figure 11).First, to calculate target seismograms from the syntheticwaveforms, we used the same structure models as thoseused for the 2005 earthquake (i.e., structures with differentsurface layers for each station) and the same station distri-bution. To see the effects of structure uncertainty, we usedthe same inversion method discussed in section 3 and fittedthe target seismograms using the same structure model usedfor the 1978 earthquake (see Tables 3 and 4). Spatialsmoothing constraint judged by the ABIC resulted in agood recovery by the input source model: the spatialcorrelation between the target model and the inverted modelwas 0.91. In the case of the 1978 earthquakes, we arbitrarilyaligned different surface layers with the structure listed inTable 4 for different stations and calculated the target 1978seismograms using the same input source model mentionedabove. The inverted model, which used the velocity modellisted in Tables 3 and 4, also had high spatial cross-correlation (0.88) with the input model when phase-pick-up errors were not included. Finally, we added some errors
to the S-phase pick-up and fitted the target seismogramsagain. Though the cross-correlation between the invertedand the input source model decreased to 0.75, we still cansay that the target source model showed reasonablyrecovery.[18] Note that although the ABIC can be used as an
objective criterion for the smoothing weights, the spatialsmoothing weight is slightly larger than the one favored bythe minimum ABIC value and was a stronger constraint interms of the spatial cross-correlation (see Figure 11). In fact,a larger weight is usually preferred to that favored by ABICto account for the waveform misfit. For example, Yamanakaand Kikuchi [2004] fixed their smoothing weight to 0.25and slip distributions were equally smoothed without anyadjustment. Similarly, we favored a weight slightly largerthan the value determined by ABIC.[19] The source models for the 1978 and 2005 Miyagi-oki
earthquakes were inverted from two different sets of seis-mograms. A constrained inversion using one of the sourcemodels as a prior model tested whether the two models wereconsistent. We introduced a prior moment constraint (seeFigure 12) for the 1978 source model because of thedisparity in resolution between the two events. The 1978model was constrained so that the seismic moment release
Figure 6. Comparison of all of the observed (black) and synthetic (red) seismograms for the 1978Miyagi-oki earthquake. The maximum amplitude in cm for the JMA-5X records or cm/s for the SMACrecords is shown on the upper right corner for each component.
B08316 WU ET AL.: SOURCE PROCESSES OF THE MIYAGI-OKI EARTHQUAKES
8 of 15
B08316

on the same asperities is 1.6 times the correspondingseismic moment of the 2005 earthquake. Notably, thewaveform fittings were slightly improved (0.02%) afterthe introduction of such a prior constraint. The waveformerror reduction was balanced by the slight increase insmoothing errors. The waveform fitting was hardly affectedby the prior constraint because only the moment in thesouthern area was constrained, while the waveform fittingwas mostly sensitive to the larger slip, which occurred onthe northern asperity. The new source model showed ahigher spatial cross-correlation (0.86) with the 2005 sourcemodel.[20] If the seismograms could be explained by an upward
shift of the 1978 source model shown in Figure 4 by severalkilometers and a downward shift of the 2005 source modelshown in Figure 4 by several kilometers, the complemen-tary relationship between the two earthquakes would beevident instead. However, such simply transposed modelswould not match the seismograms. We further investigatedthe effects of the uncertainty of the hypocenter depth byshifting the hypocenters upwards or downward by 5 or 6 kmin the dip direction. When the hypocenter of the 1978earthquake was moved upwards by 6 km in the dipdirection, the fitting error reduction dramatically decreasedto 44%. In addition, unlike the model described in the lastsection, the error reduction increased with the maximumrupture velocity Vr and did not reach a maximum value evenfor Vr greater than the shear wave velocity. These results
imply that a shallower hypocenter is not physically reason-able. Meanwhile, when we moved the hypocenter of the2005 earthquake downward by 5 km in the dip direction, nosignificant changes could be identified from the new model,which suggests that the depth resolution of our asperity mapis reliable.
6. Discussion
[21] The rupture area of a large earthquake consists ofseveral asperities (zones of large amounts of slip) and thesurrounding area [e.g., Lay and Kanamori, 1981]. Theresemblance among the ‘‘southern’’ seismograms shown inFigure 3 indicates that asperities located close to the 1978hypocenter ruptured again during the 2005 event. The con-trasting seismogram, for example recorded at the ‘‘ofujma’’stations, suggests that other asperities in the northern part ofthe 1978 source region did not rupture during the 2005earthquake. Accordingly, the similar seismograms shown inFigure 3 provide direct evidence of the repeated rupture ofthe same southern asperities during the 1978 and 2005Miyagi-oki earthquakes. The northern stations also showedcontrasting ratios of waveform amplitudes between the twoearthquakes, which suggested that a large slip such as theone that occurred in the northern part of the source area in1978, did not occur in that area in 2005.[22] We identified two asperities in the 2005 earthquake
that are close to the two southern asperities of the 1978
Figure 7. Comparison of all of the observed (black) and synthetic (red) strong motion seismograms(velocity) for the 2005 Miyagi-oki earthquake. The maximum amplitude in cm/s for each component isshown on the upper right corner.
B08316 WU ET AL.: SOURCE PROCESSES OF THE MIYAGI-OKI EARTHQUAKES
9 of 15
B08316

earthquake, although Okada et al. [2005] and Yaginuma etal. [2007] recovered a single asperity around the hypocenterbased on their waveform inversions of the 2005 earth-quakes. The existence of two asperities is supported directlyby the observed strong motion waveforms, which clearlyindicate two seismic pulses (A and B in Figure 10). Wedetected the arrival times of the pulses and determined thepositions of their sources, which were located near theasperities of the 2005 earthquake. Consequently, pulses Aand B in the observed waveforms correspond well withAsperities A and B.[23] The two pulses cannot be observed in the teleseismic
P wave trains (Figure 8), indicating that the teleseismicwaveform inversion performed by Okada et al. [2005]recovered only a single large asperity. If only strong motiondata are used, even the empirical Green’s function methodcan recover the two asperities for the 2005 earthquake[Kamae, 2006; Suzuki and Iwata, 2007]. Therefore the highresolution of the strong motion data analyses supports theconclusion that the rupture of the two asperities in thesouthern part of the Miyagi-oki region was repeated.[24] An accurate study of earthquake recurrence is of
great importance for long-term earthquake hazard assess-ment. By surveying the recurrence characteristics of greatcircum-Pacific earthquakes and the spatial distribution pat-tern of seismic moment release, Thatcher [1990] character-ized earthquake recurrence as a temporally ordered cyclicalseismic strain release mechanism with spatially irregular
rupture. The complex asperity distribution on a single fault(or plate boundary) segment explains the spatially irregularrupture pattern in each cycle, while the temporal ordercomes from relatively stable plate movements. Recentstudies of historical earthquakes in the Japan Trench [e.g.,Yamanaka and Kikuchi, 2004] showed a repeated asperitypattern. The repeated rupture model is also favored bystudies of plate movements based on the Global PositioningSystem (GPS) observation data [e.g., Nishimura et al.,2004]. Moreover, geomorphic features showed repeatedprehistoric rupture of the Superstition Hills, California,earthquake with the same slip distribution [Lindvall et al.,1989]. In contrast, Park and Mori [2007] studied thedistribution of asperities for five large earthquakes alongthe New Britain trench, Papua New Guinea, and showedthat the locations of the asperities for the individual earth-quakes did not significantly overlap. Complicated plategeometry and rapid subduction at the New Britain trenchmight account for the varying asperity pattern. However, therecurrence time of an M8-class earthquake along the NewBritain Trench is approximately 100 years [Park and Mori,2007], which is a much longer time window than thatstudied by Park and Mori [2007], and the spatial irregular-ity of the asperities observed by Park and Mori [2007] canbe explained as resulting from an in-cycle complementaryseismic moment release. This implies that a longer timewindow is necessary to test whether or not asperities for M8earthquakes along the New Britain trench repeated rupture.
Figure 8. Comparison of the observed (black) and synthetic (red) teleseismic waveforms for the 2005Miyagi-oki earthquake. The maximum amplitude in mm is shown on the upper right corner for eachcomponent.
B08316 WU ET AL.: SOURCE PROCESSES OF THE MIYAGI-OKI EARTHQUAKES
10 of 15
B08316
[25] Thatcher [1990] proposed a model that slip maximaonly determine recurrence times. By replacing slip maximawith the areas of asperities, Thatcher’s model could begeneralized as follows: only asperities determine recurrencetimes. A truer model is that asperities determine the upperbound of earthquake size (i.e., slip-predictable) and the
recurrence times are determined by the physical state ofthe asperities as well as the neighboring creeping patches. Itfollows that recurrence times could vary from cycle to cycleif earthquakes do rupture at multiple asperities. The modelalso suggests that large earthquakes might rupture in adifferent pattern from cycle to cycle as long as the fault is
Figure 9. Snapshots of the source time functions for the 1978 earthquake (left column) and the 2005earthquake (right column) for every 2 s.
B08316 WU ET AL.: SOURCE PROCESSES OF THE MIYAGI-OKI EARTHQUAKES
11 of 15
B08316

composed of two or more comparable asperities. Althoughnonasperities (creeping patches) alone do not determine therecurrence times according to this model, they may affectthe rupture pattern by changing the stress distribution [e.g.,Schaff et al., 1998], encouraging or discouraging the prop-agation of dynamic rupture from one asperity to another. Inother words, some asperities may rupture during a largeearthquake while others may remain locked. The largestearthquakes are triggered when slip occurs on all theasperities. This could explain the different rupture patternobserved for each of the Miyagi-oki earthquakes from cycle
to cycle. Different cycle-to-cycle rupture patterns have alsobeen observed for moderate-sized earthquakes. Custodioand Archuleta [2007] showed that slip during the 1966and 2004 Parkfield earthquakes occurred in differentregions of the fault.[26] Including the 2005 event, the recurrence interval for
the Miyagi-oki earthquakes (see Table 1) is 35.4 ± 7.2 years.This recurrence interval is relatively short for M7 earth-quakes, as compared with the average interval of 22 yearsbetween the M6 Parkfield earthquakes, and could provide astrong subject for the time-predictable model. The Miyagi-oki earthquakes listed in Table 1 have similar magnitudes.Without waveform comparison, however, it is difficult toestimate the size of those historical events and the magni-tude regularity should not be overstated. Variation in thetime interval is 20% of the average interval, and theseismicity map varied from cycle to cycle. Figure 13 plotsthe epicenter distribution since 1938 on the basis of theJMA catalogue. During the 1938–1978 cycle more earth-quakes with magnitudes greater than 5 occurred than duringthe 1978–2005 cycle. Figure 13 shows three seismicity gapareas (marked as A, B, and C, respectively), and gaps A andC could be explained as highly interplate-coupled andbalanced by large seismic moment release, whereas thegap B was associated with aseismic slip (poorly inter-plate-coupled or locked but with a slow slip period), assmall earthquakes had not been located in this area. We didnot compare our asperity maps with the earthquake distri-bution because the JMA hypocenters were different fromour asperitymaps.Note that so-called seismicity gapsAandCare meaningful only above a certain magnitude becausesmaller earthquakes did occur in A and C.[27] Nishimura et al. [2004] analyzed the interplate
coupling in northeastern Japan from 1995 to 2002 usingGPS data and showed that interplate coupling on the PacificPlate was strong in Miyagi-oki. Their model showed thatthere might be a perfect lock (100% interplate coupling) inthis area. We would point out that the coupling factor shouldnot be calculated based on the maximum slip and theaccumulated plate movements since our source models weresmoothed. However, the moment release in the southernarea during the 1978 earthquake was approximately 1.6 timesof that of the 2005 earthquake, a value comparable with thetime interval ratio, suggesting that the strain loading rate inthis area was stable. Given stable plate movements andstable interplate coupling, the time-predictable model couldpredict a regular recurrence interval unless considerablestress perturbation was found in the southern area in2005. Consequently, our results favored the slip-predictablemodel because the moment release was proportional to therecurrence interval. The time-predictable model’s failurewas also reported by other studies. For example, Murrayand Segall [2002] showed that the time-predictable modelfailed for the Parkfield earthquakes.
7. Conclusions
[28] Direct evidence of characteristic earthquakes providedby similar seismograms was previously limited to severalmedium-sized earthquakes and many small events [e.g.,Bakun and McEvilly, 1979; Nadeau et al., 1995; Burgmannet al., 2000; Matsuzawa et al., 2002; Igarashi et al., 2003].
Figure 10. Comparison of the observed and syntheticvelocity seismograms for the 2005 Miyagi-oki earthquake.The maximum observation value (cm/s) for each componentis plotted in the lower right corner. The three sets of syntheticseismograms were computed for the entire earthquake source(red traces), Asperity A (pink traces), and Asperity B(blue traces) in comparison with the observations (blacktraces).
B08316 WU ET AL.: SOURCE PROCESSES OF THE MIYAGI-OKI EARTHQUAKES
12 of 15
B08316

In the current study, we demonstrate such seismic evidenceof large earthquake asperities on the subducting Pacificplate. The repeating nature of these asperities is alsoconfirmed by a comparison of the slip distributions of the1978 and 2005 Miyagi-oki earthquakes. Figures 3 to 5indicate that the asperities of the 2005 event are similar tothose of the 1978 event based on faulting mechanism,
relative moment release, hypocenter location, and rupturedirection. The repeating trend observed in the Miyagi-okiearthquakes is consistent with the second class of charac-teristic behavior defined by Bakun et al. [2005]. The 1934and 1966 events in Parkfield, California, also fall in thesecond class of characteristic earthquakes. In contrast, the2004 Parkfield event belongs only to the first class because
Figure 11. Input slip model (a) and inverted slip models (b, c, and d) using different smoothing weights.‘‘sm’’ means the smoothing weight, ‘‘Corr.’’ means the spatial cross correlation between the input andinverted models.
B08316 WU ET AL.: SOURCE PROCESSES OF THE MIYAGI-OKI EARTHQUAKES
13 of 15
B08316

its magnitude, location, and faulting mechanism are similarto those of the previous events, while its hypocenterlocation and rupture direction differ. Other asperities ofnortheastern Japan earthquakes that fall under the first classdesignation include the asperity of the 1994 Sanriku-har-uka-oki earthquake and the southern asperity of the 1968Tokachi-oki earthquake, which fall into the first class ofcharacteristic behavior because of differing hypocenters[Nagai et al., 2001; Yamanaka and Kikuchi, 2004]. Similarseismograms are expected only for characteristic asperitiesin the second class. Interaction among characteristic asper-ities in different classes and with different repetition modesleads to the observed diversity of earthquakes in northeast-ern Japan [Lay and Kanamori, 1981].[29] The repeating asperities of the Miyagi-oki earth-
quakes do not fully satisfy the conditions of the first classof characteristic behavior because the moment releases are
Figure 12. Asperities area (hatched area) used for momentconstraint (upper) and the inverted slip distribution (lower).Symbols in the lower figure are the same as Figure 4.
Figure 13. Seismicity map since 1938 in the Miyagi-okiarea. Top: 1938� 1978,Middle: 1979� 15August 2005, andBottom: since 16August 2005� 2007. The epicenter symbolsare color-coded to indicate hypocenter depth. The circle sizedenotes the magnitude on the scale shown by the four solid redcircles to the right side of the middle map (the number plottedabove the circles, i.e., 4 to 7 means the magnitude).
B08316 WU ET AL.: SOURCE PROCESSES OF THE MIYAGI-OKI EARTHQUAKES
14 of 15
B08316

different for the 1978 and 2005 events. The 1978 eventreleased 1.1 � 1020 Nm from the southern asperities,42 years after the 1936 event, whereas the 2005 eventreleased 0.64 � 1020 Nm, 27 years after the 1978 event.The ratios of these moment releases are approximately equalto the ratios of the intervals, and the southern half of the 1978rupture area largely coincides with the rupture area of the2005 event, consequently, the slip amount for a given asperityrupture appears to be proportional to the recurrence interval.This proportionality, in turn, indicates that the slip-predictable model is more appropriate for repeating large-earthquake asperities than the time-predictable model[Shimazaki and Nakata, 1980]. Similar slip-predictablerecurrence patterns were also observed for the asperity ofthe 1994 Sanriku-haruka-oki earthquake and the southernasperity of the 1968 Tokachi-oki earthquake [Nagai et al.,2001; Yamanaka and Kikuchi, 2004].[30] The northern Miyagi-oki asperity ruptured during the
1978 earthquake, but not during the 2005 event. In addition,the northern asperity is larger than the sum of the southernasperities, supporting the conclusion that prediction effortsshould be focused on the high probability of a futureearthquake with a greater magnitude than that of the 2005event occurring close to the northern asperity.
[31] Acknowledgments. The JMA and SMAC seismograms of the1978 earthquake were provided by Yoshiko Yamanaka, Shojiro Kataoka,the National Institute for Land and Infrastructure Management, and the Portand Airport Research Institute. The K-NET, KiK-net, and teleseismicseismograms of the 2005 earthquake were distributed by the NationalInstitute for Earth Science and Disaster Prevention and the IRIS DataManagement Center. We are very grateful to Greg Beroza, an anonymousreviewer, and an anonymous Associate Editor for reviewing the manuscriptand providing valuable comments. This study was supported by the SpecialProject for Earthquake Disaster Mitigation in Urban Areas and a Grant-in-Aid for Special Purposes (17800002) from MEXT, Japan.
ReferencesAoi, S., K. Obara, S. Hori, K. Kasahara, and Y. Okada (2000), New strong-motion observation network: KiK-net, Eos Trans. AGU, 81, Fall Meet.Suppl., Abstract S71A-05.
Bakun, W. H., and T. V. McEvilly (1979), Earthquakes near Parkfield,California –Comparing the 1934 and 1966 sequences, Science, 205,1375–1377.
Bakun, W. H., et al. (2005), Implications for prediction and hazard assess-ment from the 2004 Parkfield earthquake, Nature, 437, 969–975.
Burgmann, R., D. Schmidt, R. M. Nadeau, M. d’Alessio, E. Fielding,D. Manaker, T. V. McEvilly, and M. H. Murray (2000), Earthquakepotential along the Northern Hayward Fault, California, Science, 289,1178–1182.
Custodio, S., and R. J. Archuleta (2007), Parkfield earthquakes: Character-istic or complementary?, J. Geophys. Res., 112, B05310, doi:10.1029/2006JB004617.
Earthquake Research Committee (2005), Report: National Seismic HazardMaps for Japan, (Available at http://www.jishin.go.jp/main/chousa/06mar_yosoku-e/NationalSeismicHazardMaps.pdf), 158 pp., Headquar-ters for Earthquake Res. Promotion, Tokyo, Japan.
Graves, R. W., and D. J. Wald (2001), 3D seismic resolution analysis offinite fault source inversion using 1D and 3D Green’s functions: 1. Strongmotions, J. Geophys. Res., 106(B5), 8745–8766.
Hamamatsu, O. (1966), Historical table of seismographs for routine obser-vations in J. M. A. network, Zisin, 19, 286–305 (in Japanese with Eng-lish abstract).
Iai, S., E. Kurata, and H. Tsuchida (1978), Digitization and correction ofstrong-motion accelerograms, Tech. Note Port Harbour Res. Inst. 286,56 pp., Port Harbour Res. Inst., Yokosuka, Japan.
Igarashi, T., T. Matsuzawa, and A. Hasegawa (2003), Repeating earth-quakes and interplate aseismic slip in the northeastern Japan subductionzone, J. Geophys. Res., 108(B5), 2249, doi:10.1029/2002JB001920.
Iwasaki, T., et al. (2001), Extensional structure in northern Honshu Arc asinferred from seismic refraction/wide-angle reflection profiling, Geophys.Res. Lett., 28(12), 2329–2332.
Kamae, K. (2006), Source modeling of the 2005 off-shore Miyagi prefec-ture, Japan, earthquake (MJMA = 7.2) using the empirical Green’s func-tion method, Earth Planet. Space, 58, 1561–1566.
Kennett, L. N., and N. J. Kerry (1979), Seismic waves in a stratified halfspace, Geophys. J. R. Astron. Soc., 57, 557–583.
Kikuchi, M., and H. Kanamori (1982), Inversion of complex body waves,Bull. Seismol. Soc. Am., 72, 491–506.
Kinoshita, S. (1998), Kyoshin Net (K-NET), Seismol. Res. Lett., 69, 309–332.
Lay, T., and H. Kanamori (1981), An asperity model of large earthquakesequences, in Earthquake Prediction, Maurice Ewing Ser. IV, edited byD. W. Simpson and P. G. Richards, pp. 579–592, AGU, Washington,D. C.
Lindvall, S. C., T. K. Rockwell, and K. W. Hudnut (1989), Evidencefor prehistoric earthquakes on the Superstition Hills fault from offsetgeomorphic features, Bull. Seismol. Soc. Am., 79, 342–361.
Matsuzawa, T., T. Igarashi, and A. Hasegawa (2002), Characteristic small-earthquake sequence off Sanriku, northeastern Honshu, Japan, Geophys.Res. Lett., 29(11), 1543, doi:10.1029/2001GL014632.
Murray, J., and P. Segall (2002), Testing time-predictable earthquake recur-rence by direct measurement of strain accumulation and release, Nature,419, 287–291.
Nadeau, R. M., W. Foxall, and T. V. McEvilly (1995), Clustering andperiodic recurrence of microearthquakes on the San Andreas fault atParkfield, California, Science, 267, 503–507.
Nagai, R., M. Kikuchi, and Y. Yamanaka (2001), Comparative study on thesource processes of recurrent large earthquakes in Sanriku-oki region:The 1968 Tokachi-oki earthquake and the 1994 Sanriku-oki earthquake,Zisin, 54, 267–280 (in Japanese with English abstract).
Nakajima, J., T. Matsuzawa, and A. Hasegawa (2002), Moho depth varia-tion in the central part of northeastern Japan estimated from reflected andconverted waves, Phys. Earth. Planet. Inter., 130, 31–47.
Nishimura, T., T. Hiraswaw, S. Miyazaki, T. Sagiya, T. Tada, S. Miura, andK. Tanaka (2004), Temporal change of interpolate coupling in northeasternJapan during 1995–2002 estimated from continuous GPS observations,Geophys. J. Int., 157, doi:10.1111/j.1365-246X.2004.02159.x.
Okada, T., T. Yaginuma, N. Umino, T. Kono, T. Matsuzawa, S. Kita, andA. Hasegawa (2005), The 2005 M7.2 MIYAGI-OKI earthquake, NEJapan: Possible rerupturing of one of asperities that caused the previousM7.4 earthquake, Geophys. Res. Lett., 32, L24302, doi:10.1029/2005GL024613.
Park, S., and J. Mori (2007), Are asperity patterns persistent? Implicationfrom large earthquakes in Papua New Guinea, J. Geophys. Res., 112,B03303, doi:10.1029/2006JB004481.
Schaff, D. P., G. C. Beroza, and B. E. Shaw (1998), Postseismic responseof repeating aftershocks, Geophys. Res. Lett., 25(24), 4549–4552.
Schwartz, S. Y. (1999), Noncharacteristic behavior and complex recurrenceof large subduction zone earthquakes, J. Geophys. Res., 104(B10),23,111–23,125.
Seno, T., K. Shimazaki, P. Somerville, K. Sudo, and T. Eguchi (1980),Rupture process of the Miyagi-Oki, Japan, Earthquake of June 12,1978, Phys. Earth Planet. Inter., 23, 39–61.
Shimazaki, K., and T. Nakata (1980), Time-predictable recurrence modelfor large earthquakes, Geophys. Res. Lett., 7(4), 279–282.
Suzuki, W., and T. Iwata (2007), Source model of the 2005 Miyagi-Oki,Japan, earthquake estimated from broadband strong motions, Earth Pla-net. Space, 59, 1155–1171.
Thatcher, W. (1990), Order and diversity in the modes of circum-pacificearthquake recurrence, J. Geophys. Res., 95(B3), 2609–2623.
Wu, C., and M. Takeo (2004), An intermediate deep earthquake rupturing ona dip-bending fault: Waveform analysis of the 2003Miyagi-ken Oki earth-quake, Geophys. Res. Lett., 31, L24619, doi:10.1029/2004GL021228.
Yaginuma, T., T. Okada, A. Hasegawa, K. Kato, M. Takemura, and Y. Yagi(2007), Coseismic slip distribution of the 2006 Miyagi-Oki (M7.2) earth-quake estimated by inversion of strong-motion and teleseismic wave-forms– Its relation with the 1978 Miyagi-Oki earthquake (M7.4), Zisin,60, 43–53 (in Japanese with English abstract).
Yamamoto, Y., et al. (2004), Microseismicity around the focal area of the1978 Miyagi-oki earthquake by OBS observation, Eos Trans. AGU,85(47), Fall Meet. Suppl., Abstract S53A-0172.
Yamanaka, Y., and M. Kikuchi (2004), Asperity map along the subductionzone in northeastern Japan inferred from regional seismic data, J. Geo-phys. Res., 109, B07307, doi:10.1029/2003JB002683.
�����������������������K. Koketsu and H. Miyake, Earthquake Research Institute, University of
Tokyo, 1-1-1 Yayoi, Bunkyo-ku, Tokyo 113-0032, Japan.C. Wu, National Research Institute for Earth Science and Disaster
Prevention, 3-1 Tennodai, Tsukuba, Ibaraki 305-0006, Japan. ([email protected])
B08316 WU ET AL.: SOURCE PROCESSES OF THE MIYAGI-OKI EARTHQUAKES
15 of 15
B08316
Copyright © 2022 FDOKUMEN