1 Revisiting the 1897 Shillong and 1905 Kangra earthquakes ...
17
1 Revisiting the 1897 Shillong and 1905 Kangra earthquakes in northern India: Site Response, Moho reflections and a Triggered Earthquake Susan E. Hough(1), Roger Bilham(2), Nicolas Ambraseys(3), and Nicole Feldl(2) (1)U.S Geological Survey, Pasadena, California USA (2)University of Colorado, Boulder, Colorado USA (3)Imperial College, London, UK Abstract Re-valuated instrumental magnitudes and intensity distributions for the Mw8.0 Shillong Plateau earthquake of 1897 and the Mw7.8 Kangra earthquake of 1905, combined with newly available geodetic constraints on rupture geometries, allow us to compare observed distributions of intensity with those predicted from theoretical models for shaking produced by each earthquake. The difference between predicted and observed shaking is interpreted in terms of the site response of the Ganges and Brahmaputra basins. As expected, these comparisons identify regions of enhanced shaking near the main rivers. We infer amplifications of 1-2 intensity units, corresponding to an amplification factor of 2-4 in peak ground acceleration. We also find two unexpected results in our comparison of observed and predicted shaking from the Kangra earthquake: 1) The epicentral region is surrounded by a halo of enhanced intensity at 150-200 km radius and 2) The Dehra Dun region was the locus of a broad region of anomalously high intensities. We interpret the former result as the signal from post-critical Moho reflections and the latter observation as a probable second large earthquake (M>7) at 30-50 km depth triggered within minutes of the 1905 mainshock. These results have important consequences from future earthquakes in the Himalaya. Introduction Several recent studies have provided new estimates of magnitude, rupture parameters, and shaking intensity for the 1897 Assam and the 1905 Kangra earthquakes in northern India. The dense spatial coverage of these data provides substantial information about the distribution of shaking in the alluvial plains of northern India that can be used to evaluate past and future great Himalayan earthquakes as well as to address unresolved general issues related to both events. The magnitudes of the 1897 and 1905 earthquakes listed in early catalogues vary by 0.5 magnitude units. The re-evaluated instrumental data indicate the 1897 earthquake was Ms=8.0±0.1 (Ambraseys, 1999), and the 1905 earthquake was Ms=7.8±0.05 (Ambraseys and Bilham, 2000).
-
Upload
khangminh22 -
Category
Documents
-
view
0 -
download
0
Transcript of 1 Revisiting the 1897 Shillong and 1905 Kangra earthquakes ...

1
Revisiting the 1897 Shillong and 1905 Kangra earthquakes in northern India: SiteResponse, Moho reflections and a Triggered Earthquake
Susan E. Hough(1), Roger Bilham(2), Nicolas Ambraseys(3), and Nicole Feldl(2)
(1)U.S Geological Survey, Pasadena, California USA(2)University of Colorado, Boulder, Colorado USA(3)Imperial College, London, UK
Abstract
Re-valuated instrumental magnitudes and intensity distributions for the Mw8.0 ShillongPlateau earthquake of 1897 and the Mw7.8 Kangra earthquake of 1905, combined withnewly available geodetic constraints on rupture geometries, allow us to compare observeddistributions of intensity with those predicted from theoretical models for shakingproduced by each earthquake. The difference between predicted and observed shaking isinterpreted in terms of the site response of the Ganges and Brahmaputra basins. Asexpected, these comparisons identify regions of enhanced shaking near the main rivers.We infer amplifications of 1-2 intensity units, corresponding to an amplification factor of2-4 in peak ground acceleration. We also find two unexpected results in our comparisonof observed and predicted shaking from the Kangra earthquake: 1) The epicentral regionis surrounded by a halo of enhanced intensity at 150-200 km radius and 2) The DehraDun region was the locus of a broad region of anomalously high intensities. We interpretthe former result as the signal from post-critical Moho reflections and the latterobservation as a probable second large earthquake (M>7) at 30-50 km depth triggeredwithin minutes of the 1905 mainshock. These results have important consequences fromfuture earthquakes in the Himalaya.
Introduction
Several recent studies have provided new estimates of magnitude, rupture parameters,and shaking intensity for the 1897 Assam and the 1905 Kangra earthquakes in northernIndia. The dense spatial coverage of these data provides substantial information about thedistribution of shaking in the alluvial plains of northern India that can be used to evaluatepast and future great Himalayan earthquakes as well as to address unresolved generalissues related to both events.
The magnitudes of the 1897 and 1905 earthquakes listed in early catalogues vary by 0.5magnitude units. The re-evaluated instrumental data indicate the 1897 earthquake wasMs=8.0±0.1 (Ambraseys, 1999), and the 1905 earthquake was Ms=7.8±0.05 (Ambraseysand Bilham, 2000).

2
The observed shaking intensity distribution for the 1897 earthquake was originallyevaluated by Oldham (1899), and for the 1905 earthquake by Middlemiss (1905, 1910).These observations have now been supplemented by numerous additional accounts foundin newspapers, government reports and materials unavailable to these authors, and thesehave been re-evaluated using the MSK scale of intensities. In all 282 unequivocal MSKintensities were assigned for the 1897 earthquake (Figure 1a, Ambraseys and Bilham,2003), and 523 for the 1905 earthquake (Figure 1b, Ambraseys and Douglas, 2003). Thenew evaluations take into account building styles and ignore accounts for which reliableintensities cannot be assessed. In particular, locations where damage was associated withliquefaction were not included in assessments of intensity. It is now recognized thatliquefaction tends to occur over a large range of moderate to high intensities in regionswhere saturated sediments are present, resulting in building damage caused by foundationfailure, rather than by the accelerations that caused the liquefaction. It is typicallyimpossible to assign a precise intensity to these observations.
The re-evaluated intensity data, and the revised instrumental magnitudes for these twoearthquakes, provide a key to interpreting intensity data from numerous earlier historicalearthquakes for which only intensity data are available.
Rupture geometry for the 1897 and 1905 earthquakes
Geodetic data combined with geological observations of secondary faulting in theepicenter of the 1897 Shillong Plateau earthquake provide strong constraints on rupturegeometry, indicating 16±5 m of reverse slip on a 110±10-km ESE fault, corresponding toMw=8.1±0.1 (Bilham and England, 2001). The down-dip width of the causal rupture isthe least well-constrained parameter in the solution but it appears to have slipped on a50±5° SSW dipping fault from 35 km to 9 km depth, extending through much of thecrust. This subsurface slip stressed the shallower regions of the Shillong plateau resultingin 10 m of normal faulting on the Chedrang fault observed by Oldham (1899).
In contrast, geodetic data for the Kangra earthquake sample only the SW edge of theinferred 1905 rupture and provide weak constraints for an inferred shallow-dipping thrustfault with less than 5 m of slip (Wallace et al., 2003). Several authors have used levelingdata from the Dehra Dun region to support the notion that rupture extended 250 km SE ofthe epicenter, consistent with a region of high intensity shaking recorded in the region ofDehra Dun (e.g. most recently Yeats, 1992). A re-evaluation of the raw leveling datashows, however, that the data used in these studies are significantly contaminated bysystematic errors (Bilham, 2001) and that there was probably little or no uplift in theDehra Dun region. The absence of significant uplift or horizontal deformation (Turner,1907) at Dehra Dun constrains the rupture length to be less than 180 km. This isconsistent with the revised magnitude of Mw=7.8, which suggests the rupture length wasno more than 110 km, given a probable 50-70 km rupture width (Wallace et al. 2002).The rupture presumably terminated to the southwest near the mapped location of theJawalmucki thrust fault (Powers et al., 1998). The inferred rupture parameters for 1897

3
and 1905 are used below as input in computer simulations that generate synthetic shakingintensity maps for each earthquake.
Previous attempts to assess the location, extent and strike of the 1905 rupture area basedon intensity data published by Middlemiss (1910) show a zone of intense destruction nearthe town of Kangra (RF VIII-X), and an isolated zone of lower intensity (RF VIII)centered 250 km to the SW near the town of Dehra Dun. For many years the inflatedmagnitude assigned by Richter to this earthquake (Ms=8.0) supported the widely heldbelief that the rupture zone corresponded approximately to the area of RF intensity VIIshaking that enveloped these two high intensity regions.
The reality of the intervening region of lower intensity shaking between these tworegions of damage has been investigated in several studies (Seeber and Armbruster, 1972;Molnar, 1987). These studies conclude that although Middlemiss’s coverage of theintervening region was limited to two traverses, it would have revealed high intensityshaking had any been present. The revised and expanded MSK data confirm that the lowintensity region is not an artifact caused by poor spatial sampling (Figure 1b).
For the purposes of comparing Middlemiss’ contours with the re-evaluated MSKintensities we contoured their distribution using a purely mathematical algorithm.Contouring is done using the GMT routine “surface” (see Wessel and Smith, 1991); thisroutine produces contours of randomly spaced spatial data, z(x,y), by solving
(1-T)*L(L(z)) + T*L(z) =0
where T is a tension factor and L is the Laplacian operator. We use T=1, which providesa harmonic solution with no maxima or minima away from control points. Our contoursresemble the older Rossi-Forel isoseismals, although our larger number of intensityreports provides additional detail. The similarities between Middlemiss’ contours and thecontours in Figure 1b confirm the essential features of the 1905 earthquake: a lowintensity region separates the epicentral rupture zone from a zone of high intensity 250km to the SW.
We found a tendency for Middlemiss’ higher isoseismals to include unjustifiably largeareas, a conclusion derived also for Oldham’s isoseismals contoured for the 1897earthquake (Ambraseys and Bilham, 2003). This bias is caused by extensive buildingdamage at relatively modest levels of shaking with no graded intensification of damagetowards higher levels of shaking. A comparison of Middlemiss’ areas of Rossi-Forelshaking with those of inferred MSK shaking shows them to be approximately oneintensity unit too high above Intensity VIII and a half intensity too high above intensityVII. For lower intensities we find the areas comparable.
Predicted Intensity Distributions

4
As was demonstrated by Hough et al. (2002) for the 2001 Bhuj earthquake, one can useground motion modeling methods to predict the distribution of ground motions from agiven fault model and, using established relationships between ground motions andintensities (Wald et al., 1999), convert this into a predicted damage map. Following theHough et al. (2002) approach, we calculate predicted hard-rock damage patterns fromboth the 1897 and the 1905 earthquakes using rupture models constrained from geodeticdata and other available information. We use the method of Beresnev and Atkinson(1997), a well-calibrated, semi-stochastic approach that includes finite-fault effects to theextent that the source is distributed (finite-fault phase effects are not modeled with thisapproach). We also use the attenuation results of Singh et al. (1999) for regional Q(f).
One key unknown in the Beresnev and Atkinson (1997) approach is the “strength factor,”which is related to slip velocity. For both earthquakes we initially choose the same valuethat Hough et al. (2002) obtained for the Bhuj earthquake: 1.6. Although this valuecannot be determined precisely without quantified ground motion estimates, it can beadjusted based on the overall intensity pattern. For the 1897 earthquake, we find that thevalue of 1.6 provides a very good fit to the extent of the region over which light damageoccurred. For the 1905 earthquake, a better fit is obtained with a lower value: 1.2. Forthe 1905 earthquake, a better fit is obtained with a lower value: 1.2. To include the effectof the Chedrang fault rupture in our predicted shaking map for the Kangra earthquake, wemodel a second event with the appropriate rupture parameters. The combined intensitymap is then determined by choosing, at each point, the higher of the values predictedfrom the Chedrang and Oldham fault ruptures. This approach presumably provides alower bound for the combined shaking level, as two distinct ruptures are expected toprolong the duration of strong ground motion at many sites, and thus to potentiallygenerate more severe damage than two distinct earthquakes.
Figures 2a and 2b show the observed and predicted intensity distributions for the 1897and 1905 earthquake. Figures 3a and 3b show the residuals: calculated simply as theobserved minus predicted intensity values.
For the Shillong earthquake, we obtain a broad region of amplified intensitiescorresponding to the Ganges Basin (Figure 3a), consistent with the expectation ofamplification at soft-sediment sites. We do not observe amplification along theBrahmputra River, but this is because Ambraseys and Bilham (2003) do not assignintensity values for the many sites along this river for which there was documentedliquefaction, but insufficient information to assign intensity. On Figure 3a we indicatethe sites at which liquefaction was observed. Many of these are along the BhramaputraRiver; it thus appears that shaking was amplified in these locations as well, although theobservations are not sufficient to quantify it. Throughout the Ganges Basin, however, wefind consistent amplification of 1-2 intensity units. As discussed by Hough et al. (2002)this implies a peak ground acceleration amplification of 2-4.
The intensity residuals from the 1905 earthquake reveal a more complex pattern thanthose from the 1897 event (Figure 3b). Our preferred choice of strength factor results in

5
a good overall match to the shaking distribution. However, several features of theresidual map are found to be insensitive to changes in modeling parameters such as thestrength factor and detailed rupture geometry.
From Figure 3b we make the following observations: 1) Shaking in the main rupturezone is overpredicted, 2) amplified shaking is observed near the banks of rivers in theGanges, and in the Kashmir Valley, 3) a faint region of increased intensity is evidentsurround the epicenter at a distance of roughly 180 km, and 4) a broad region of highresiduals is found near Dehra Dun; this is displaced 20 km to the east from a highintensity zone contoured by Middlemiss. These observations are discussed in turn below.
In contrast to the results for the 1897 event, our modeling predicts stronger near-fieldshaking than that observed. It is possible that this reflects a bias in the intensityassignments: if the only structures damaged in an earthquake are of construction typesthat are highly vulnerable to damage, it is impossible to ascertain if very high shakingoccurred. However, the 1905 mainshock is inferred to have been a low-angle thrustrupture of the main Himalayan decollement fault, and several recent studies suggest thatother shallow thrust events, most notably the 1999 Chi-Chi, Taiwan earthquake,generated relatively low near-field peak accelerations (e.g., Boore, 2001). Our results areconsistent with this hypothesis.
Our second observation, of amplified shaking along rivers and in valleys, is againconsistent with expectations for significant amplifications at soft-sediment sites. Thedegree of amplification is consistent with that inferred for the 1897 earthquake.
SmS reflected wave from the Moho?
The faint high-intensity “halo” surrounding the mainshock extends both to the west of themainshock, on sediment sites, and to the east, on hard-rock sites. We interpret thispattern as evidence that post-critical Moho reflections are large enough to contribute in asignificant way to damage patterns. The geometry that leads to these reflections isillustrated in Figure 4. Previous studies have argued for such an effect in otherearthquakes beginning with the 1989 Loma Prieta, California earthquake (Somerville andYoshimura, 1990). Somerville and Yoshimura showed that SmS arrivals were larger thanthe direct S arrivals at distances of 50-100 km; later studies (e.g., Mori and Helmberger,1996) have found similar results. Although a detailed crustal model would be requiredfor precise ray-tracing, tomographic studies indicate that the Moho is located atapproximately 40 km along the Himalayan front (Sheehan et al, 2003); high amplitudeSmS waves at distances of 100-200 km are thus consistent with this interpretation.
While a number of studies have found evidence that post-critical Moho reflectionscontribute to damage patterns, past studies have relied on far fewer data points than areprovided by our dense sampling. For perhaps the first time, dense macroseismic datafrom the Kangra earthquake have illuminated the full spatial distribution of SmS arrivals.These results suggest a deeper Moho to the northeast of the mainshock than to the

6
southwest, a hypothesis that will be testable when crustal structure is known in moredetail.
A faint halo is suggested in the intensity residuals calculated for the 1897 earthquake,especially to the south and west of the epicenter. The signal is less prominent, however,than that of the 1905 earthquake, presumably due to the latter event’s substantially deeperepicenter and different mechanism. The Kangra earthquake presumably occurred on ashallow dipping thrust at 6-12 km depth largely on, and parallel to, the upper surface ofthe Indian plate, whereas the Shillong earthquake ruptured through the plate from at least35 km depth on a steep reverse fault that terminated far below the surface.
Perhaps the most conspicuous feature in the residual 1905 intensity plot is the roughlycircular region of high intensities near Dehra Dun, centered slightly to the west ofMiddelmiss’ intensity VIII outlier. The circular nature of the aftershock pattern issuggestive of a triggered earthquake rather than sedimentary basin amplification since atleast half of the high intensity observations are found north of the Ganga Plain within theHimalayan foothills. The (inferred) triggered earthquake location is close to the SmS“halo” discussed earlier, suggesting that these arrivals might have contributed to thetriggering of the subsequent event.
A second earthquake in the Dehra Dun region has been suggested by previous authorswho have explored possible causes for the region of isolated high intensities in the Rossi-Forel contours (e.g., Chander, 1988). Had a separate shock occurred it would have tohave been close to the time of the mainshock for people to not have reported two separateshocks. The epicenter of this triggered earthquake is apparently 29.0°N, 78.7°E with anuncertainty of ±0.5°.
Although the intensity residual generated by the (inferred) triggered earthquake isdramatic, the intensity distribution reveals a broad region of relatively modest shaking inthe Dehra Dun region. Using our modeling approach to match this pattern, we concludethat the earthquake must be large (Mw upwards of 7.0) and deep (depth upwards of 30km). There is, however, a trade-off in the modeling between magnitude and depth; wecannot distinguish between, say, a Mw7 event at 30 km depth and a Mw7.5 event at 50km depth.
If a remotely triggered earthquake of Mw~7 did occur at 30 km depth, the relativelyrecent 1988 Bihar-Nepal earthquake might represent an analog for this event. The PDEmagnitude of this earthquake is Mw6.7 and it occurred on a NE-trending strike-slip faultnear the base of the India plate (Dikshit and Koirala, 1983; GSI, 1993; Chen and Kao,1996).
No horizontal deformation was detected near Dehra Dun in 1905 (Burrard, 1906; Turner,1907) and although 15 cm of apparent uplift has been described in numerous articles thatinterpret this as coseismic defomation, the raw leveling data are contaminated bysystematic errors (Bilham, 2000), and it is doubtful that any vertical deformation

7
occurred. Hence the geodetic data, once considered an important constraint on mainshockrupture, are unable to substantiate the possible occurrence of a triggered earthquake nearDehra Dun. The leveling data are especially unhelpful to resolve the parameters of adeep earthquake, for which the surface deformation will be muted, and will be expressedby a long surface wavelength.
To address further the question of a possible triggered earthquake we have searched forearly instrumental recordings of the 1905 earthquake. Although instrumental recordingsfrom this date are sparse, we were able to locate several records from which arrivals canbe identified with some confidence. Two P-wave arrivals are evident at ColabaObservatory (Bombay) in the first minute of the earthquake, and two distinct S-wavearrivals separated by about 6-7 minutes are suggested in the Wiechert recording fromGottingham. The best evidence, however, comes from the station at Leipzig: a dampedWiechert instrument (Figure 5). This record reveals clear evidence of a second, high-frequency S-wave group, about 7 minutes after the first S arrivals. The record moreoversuggests that the sS-S time of the second event is larger than the sS-S time of the firstevent, consistent with our inference that the triggered earthquake was considerablydeeper than the first.
An additional source of epicentral shaking data is found in the horizontal-forcemagnetogram recorded at Dehra Dun recorded on a chart advancing at approximately 15mm/hour (Thomas, 1907). The record saturates for 8 minutes following the arrival ofsurface waves from the mainshock, but distinct shocks occur at 11.3 m, 19.7 m, 25.6 mand 43.5 m after this first arrival. The times in the following abstract from Thomas(1907) are cited in Madras local time (GMT-5:21) indicating the arrival of Raleigh wavesat Dehra Dun at 00:51±1m GMT. Middlemiss infers an origin time of 06:09 or 00:48.
"At Dehra the effect begins sharply with a maximum (the oscillation being so rapid as to fail to registerphotographically) at 6h 11.6m; the maximum continues till 6h 19.8m, a period of 8.2 minutes; this isfollowed by a period of slower oscillation for 3.1 minutes, when a second sharp shock was recorded at 6h22.9 m : the magnet continued oscillating until 6h 37.3m, a period of 25.7 minutes, during which there werein addition to the principal shock 3 others recorded, namely, at 6h 22.9, 6h 31.3, and 6h 36.2m. A furtherdisturbance occurs at 6h 55.1 m (duration about 1.4 minutes) which is the only aftershock noted atBarackpore" (near Calcutta).
Because of the initial saturation of the instrument the data do not provide any informationabout separate shocks that might have occurred within 8 minutes of the mainshock.However, the noted times of the later events can be used to constrain the times of earlylarge aftershocks, which we use in the following section as a guide to the interpretation ofanecdotal accounts.
Felt and recorded aftershocks in 1905
Numerous felt reports of aftershocks are listed by Middlemiss (1910) who considerstheir reported times to be unreliable. However, if we assume that observers noted onlythe strongest aftershocks, it is possible to synchronize these reports using the aftershocks

8
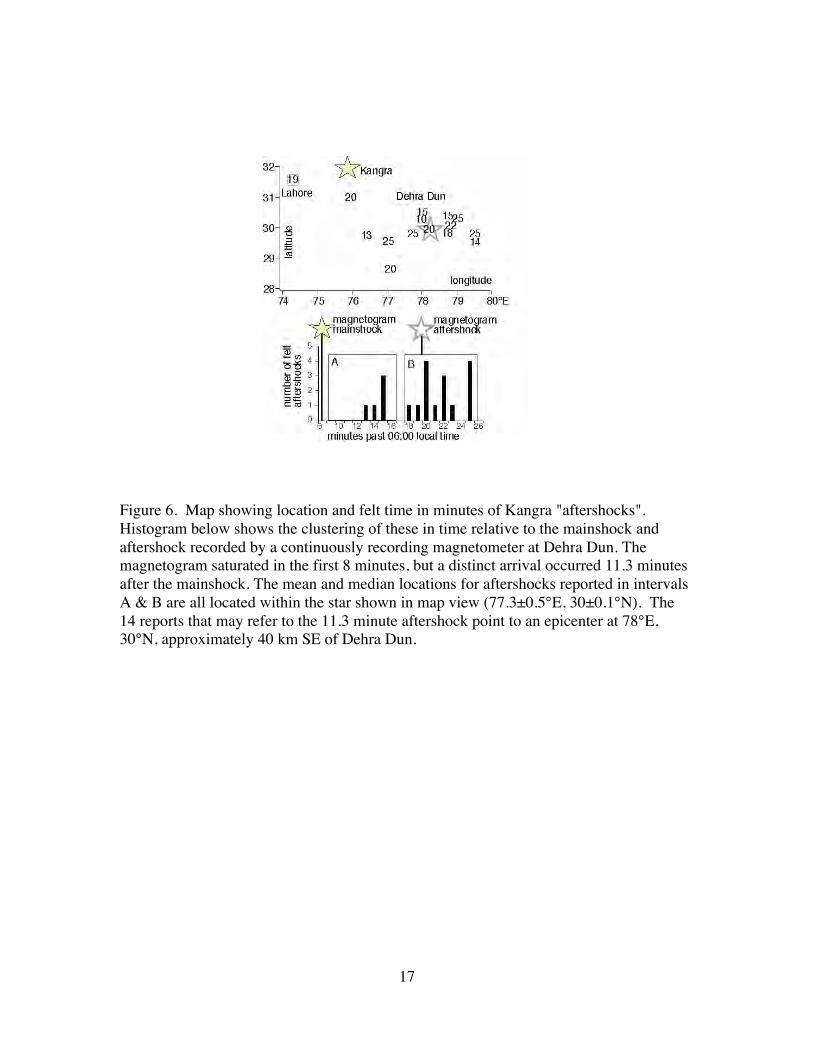
recorded by the magnetogram. In Figure 6 we show the locations of reported aftershocksreported during the 15 minutes following the mainshock; these are plotted spatially andlabeled according to the minute they were felt. The mean location of reports(independent of intensity) for two consecutive 8 minute windows are calculated to lie 20-100 km SE of Dehra Dun, near the inferred location of the secondary shock (Table 1).
Because the Kangra epicentral region was severely damaged, few people were able todocument the timing of aftershocks. The locations listed in Table 1 may thus be biasedaway from the mainshock epicenter. Together with the scant distribution of quantitativeobservations and their concentration in a few urban centers, this leads to a probable biastoward Dehra Dun. Notwithstanding these limitations, the results suggest that the DehraDun region experienced either an anomalously large number of felt aftershocks shortlyafter the mainshock, or a large number of poorly timed observations of a single largeaftershock, within fifteen minutes of the mainshock arrival.
Conclusions
Macroseismic observations from two key historic earthquakes in the Himalayan regionreveal unexpected details of the nature of the ground motions generated by these events.Using available geodetic and other information to constrain rupture models, we are ableto predict the distributions of shaking from the events and to compare these results to theobserved intensities. We obtain several interesting results, including maps of sediment-induced amplification in the Ganges Basin and elsewhere, as well as compelling evidencethat the 1905 Kangra mainshock was followed by a subsequent, remotely triggeredearthquake in the Dehra Dun region. The depth of this triggered earthquake (30-50 km)requires it to have occurred below the plate boundary, and probably at the base of theIndian plate.
Our results underscore seceral important conclusions about triggered earthquakes. First,while small remotely triggered earthquakes occur commonly in geothermal and volcanicregions (e.g., Hill et al., 1993), large triggered earthquakes are possible. As this studydemonstrates, large, early triggered events can be very difficult to identify withoutmodern instrumental data. We note, however, that there is evidence for triggeredearthquakes following both the 1934 Mw8.0 Bihar-Nepal earthquake and the 2001Mw7.6 Bhuj earthquake. The former event was followed the next day by a M5.6earthquake approximately 170 km to the north of the mainshock; the Bhuj earthquakewas followed three days later by a M4.3 earthquake 12.4N 77.3W, over 1400 km south ofthe epicenter. The distance between the 1934 mainshock and inferred triggered event iscomparable to that between the Kangra mainshock and Dehra Dun event, againsuggesting that triggered earthquakes may occur preferentially at distances where SmSwaves generate high-amplitude arrivals.

9
The triggered earthquake identified in this study, like the 1988 Udaypur, Nepal,earthquake, underscores the important conclusion that an important source of seismichazards in the Himalaya lies not only on slip on the plate boundary, but from earthquakesthat respond at depth to the bending or unbending of the descending plate (e.g., Bilham etal., 2003).
Acknowledgements
Support for two of the authors (RB and NF) was provided by NSF EAR0003449 andEAR0229690.
Bibliography
Ambraseys, N. and R. Bilham, A note on the Kangra Ms=7.8 earthquake of 4 April 1905,Current Science, 79, 101-106, 2000.
Ambraseys, N. and R. Bilham, Re-evaluated intensities for the great Assam earthquake of12 June 1897, Shillong, India, Bull. Seism. Soc. Am., 93, 2003.
Ambraseys, N. N. and J. Douglas, 2003. Magnitude calibration of north Indianearthquakes, Geophys. J. Int in the press.
Beresnev, I.A. and G.M. Atkinson, Generic finite-fault model for ground-motionprediction in eastern North America, Bull. Seism. Soc. Am., 89, 608-625, 1997.
Bilham, R., Slow tilt reversal of the Lesser Himalaya between 1862 and 1992 at 78°E,and bounds to the southeast rupture of the 1905 Kangra earthquake, Geophys. J. Int(2001) 144, 1-23.
Bilham, R. and P. England, Plateau pop-up during the great 1897 Assam earthquake,Nature 410, 806-809, 2001.
Bilham, R., K. Wallace, F. Blume, and N. Feldl, Flexure and fragmentation of the Indianplate: mid-plate earthquakes, in, Indo-US Workshop on Seismicity and Geodynamics,National Geophysical Research Institute, Hyderabad, India, 27, 2003.
Boore, D.M., Comparisons of ground motions from the 1999 Chi-Chi earthquake withempirical predictions largely based on data from California, Bull. Seism. Soc. Am., 91,1212-1217.
Burrard, S. G. (1906). Geodesy, 42-52, in Annual Report of the Board of ScientificAdvice for India for the Year 1904-05, Government Central Press, Calcutta, 1906. pp.138.
10
Chander, R. (1988). Interpretation of observed ground level changes due to the Kangraearthquake, northwest Himalaya, Tectonophysics, 149, 289-298.
Chen, W.-P. and H. Kao, (1996). Seismotectonics of Asia: some recent progress, in theTectonic Evolution of Asia, ed. A. Yin and T.M. Harrison, Cambridge University Press,37-54.
Dikshit, A.M. and A. Koirala, (1989). Report on the intensity mapping of Udaypurearthquake of 20 August 1988. HMG Ministry of Industry, Nepal, Dept. of Mines andGeol., Lainchaur, Kathmandu.
Geologic Survey of India, Bihar-Nepal earthquake, August 20, 1988, GSI SpecialPublication 31, Eds. D.R. Nandy, A.K. Cloudhury, C. Chakraborty, and P.L. Narula,1993.
Hough, S.E., S. Martin, R. Bilham, and G. Atkinson, The 26 January, 2001 Bhuj, Indiaearthquake: observed and predicted ground motions, Bull. Seism. Soc. Am. 92, 2061-2079, 2002.
Middlemiss, C.S., Preliminary account of the Kangra earthquake of 4th April 1905, Mem.Geol. Soc. India, 32, Pt. 4, 258-294, Geol. Surv. India, Calcutta.
Middlemiss, C.S., The Kangra earthquake of 4 April 2005, Mem. Geol. Surv.India 38, 405, 1910.
Molnar, P., The distribution of intensity associated with the 1905 Kangra earthquake andbounds on the extent of rupture, J. Geol. Soc. India, 29, 221, 1987.
Mori, J. and D. Helmberger, Large-amplitude Moho reflections (SmS) from Landersaftershocks, southern California, Bull. Seism. Soc. Am. 86, 1845-1852, 1996.
Powers, P. M., Lillie, R. J., and Yeats, R. S., 1998, Structure and shortening of theKangra and Dehra Dun reentrants, Sub-Himalaya, India: Geol. Soc. Am. Bull., 110, 1010-1027.
Seeber, L. and J.G. Armbruster, Great detachment earthquakes along the Himalayan Arcand long-term forecasting, in Earthquake Predictionan International Review, eds. D.W.Simpson and P.G. Richards, Maurice Ewing Series, Am. Geophys. U., 4, 259-277, 1981.
Singh, S.K., M. Ordaz, R.S. Dattatrayam, and H.K. Gupta, A spectral analysis of the 21May 1997, Jabalpur, India earthquake (Mw5.8) and estimation of ground motion fromfuture earthquakes in the Indian shield region, Bull Seism. Soc. Am., 89, 1620-1630,1999.
Thomas, R. H. (1907) The Magnetic Survey of India 1904-05 p.1-74. in Longe, F. B.Extracts from Narrative Reports of Officers of the Survey of India for the season 1904-

11
05. Survey of India, Government Printing Office, Calcutta.
Turner, H. H., (1907) Triangulation in Baluchistan, No.24 Survey Party (Triangulation)for season 1904-05, IV, p.115 in Longe, F. B. Extracts from Narrative Reports ofOfficers of the Survey of India for the season 1904-1905. Government Printing Office,Calcutta, 1907.
Wald, D.J., V. Quitoriano, T.H. Heaton, and H. Kanamori, Relationships between peakground acceleration, peak ground velocity, and modified Mercalli intensity in California,Earthquake Spectra, 15, 557-564, 1999.
Wallace, K., Rebecca Bendick, Roger Bilham, Frederick Blume, Vineet Gahalaut & Vinod Gaur (2002). Geodetic constraint of the Kangra 1905 Ms=7.8 rupture. EOS,Trans. Am. Geophys. U., abs.
Wesnousky, S. G., Kumar, S., Mohindra, R., and Thakur, V. C. (1999). Holocene sliprate of the Himalayan Frontal Thrust of India, Observations near Dehra Dun: Tectonics,18, 967-976.
Wessel, P. and W.H.F Smith, Free software helps map and display data, EOS, Trans. Am.Geophys. U., 72, 441, 445, 1991.
Yeats, R.S., T. Nakata, A. Faraj, M. Fort, M.A. Mirza, M.R. Pandey, and R.S. Stein, TheHimalayan frontal fault system, Ann. Tect. 6, 85-98, 1992

12
Figure 1. Observed intensity distribution for the 1897 Assam earthquake (1a, left) and1905 Kangra earthquake (1b, right) as determined by Ambraseys and Bilham (2003) andAmbraseys and Douglass (2004), respectively. Scale bar indicates ground motionvalues, pga and pgv, that are found to correspond to each intensity level usinginstrumentally recorded earthquakes in California (Wald et al. 1999).

13
Figure 2. Predicted shaking intensity from the 1897 Assam earthquake (2a, left) and the1905 Kangra earthquake (2b, right) determined using methodology and rupture modelsdiscussed in text. These maps are drawn from predicted pga values, which areconverted to intensity according to the values given in the scale bar.

14
Figure 3. Residual intensity (observed minus predicted) from the 1897 Assamearthquake (3a, left) and the 1905 Kangra earthquake (3b, right) determined usingmethodology and rupture models discussed in text. Red circles in Figure 3b indicatesites at which liquefaction was documented. Small circles in both panels indicatelocations at which intensity values were determined. The same scale bar (far left) isused to generate both figures.

15
Figure 4. Recording of the 1905 Kangra mainshock made by an early Wiechertseismometer in Leipzig, Germany. The record reveals a clear initial S/sS arrival,followed by S-wave multiples with longer periods. About 7 minutes after the first S/sSarrivals, a second apparent S/sS group arrives ahead of the surface waves. The highfrequency character of the second S-wave group is consistent with primary body wavearrivals from a second event but not with S-wave multiples from the first event. Thesecond S/sS group reveals a greater S-sS time than the initial S-wave group, suggestingthe second event was deeper than the first. (Note: we hope to obtain a cleaner version ofthis record!)

16
Figure 5. Cartoon illustrating the generation of post-critical SmS arrivals.If, as expected, the Moho thickens to the east of the mainshock, SmS arrivalsare expected to be generated at greater distances in the Himalaya than in thedirection of India.
17
Figure 6. Map showing location and felt time in minutes of Kangra "aftershocks".Histogram below shows the clustering of these in time relative to the mainshock andaftershock recorded by a continuously recording magnetometer at Dehra Dun. Themagnetogram saturated in the first 8 minutes, but a distinct arrival occurred 11.3 minutesafter the mainshock. The mean and median locations for aftershocks reported in intervalsA & B are all located within the star shown in map view (77.3±0.5°E, 30±0.1°N). The14 reports that may refer to the 11.3 minute aftershock point to an epicenter at 78°E,30°N, approximately 40 km SE of Dehra Dun.