
Artificial intelligence and augmented intelligence collaboration ...
Upload
khangminh22Category
view
7download
0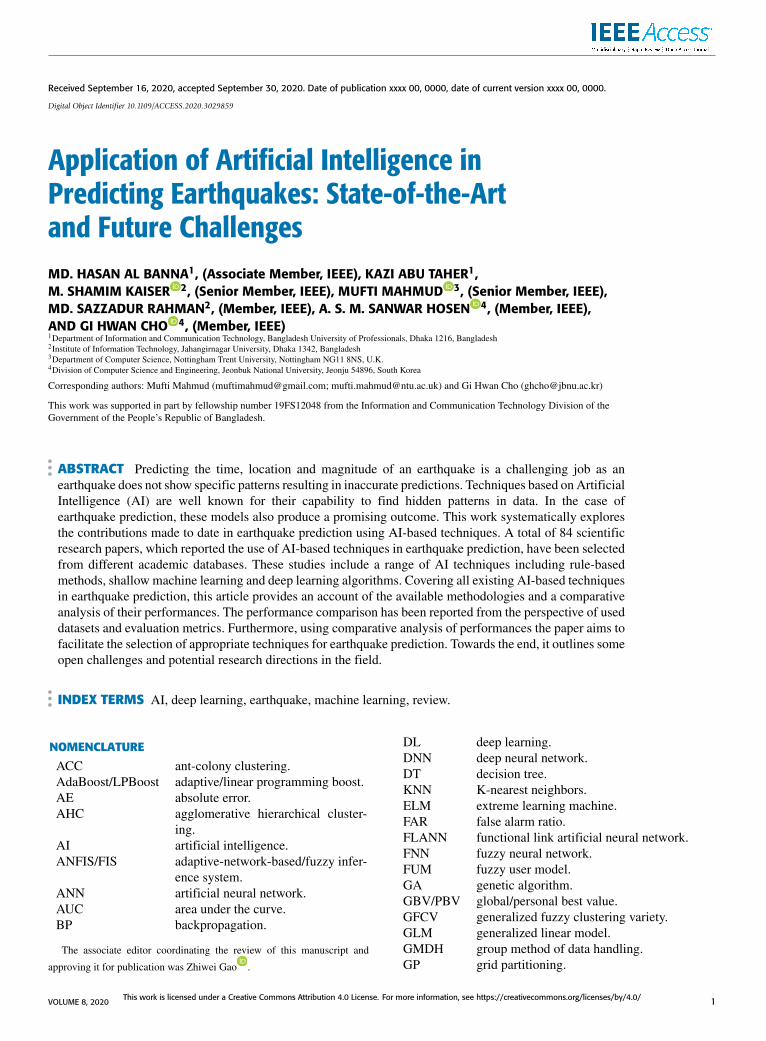
Received September 16, 2020, accepted September 30, 2020. Date of publication xxxx 00, 0000, date of current version xxxx 00, 0000.
Digital Object Identifier 10.1109/ACCESS.2020.3029859
Application of Artificial Intelligence inPredicting Earthquakes: State-of-the-Artand Future ChallengesMD. HASAN AL BANNA1, (Associate Member, IEEE), KAZI ABU TAHER1,M. SHAMIM KAISER 2, (Senior Member, IEEE), MUFTI MAHMUD 3, (Senior Member, IEEE),MD. SAZZADUR RAHMAN2, (Member, IEEE), A. S. M. SANWAR HOSEN 4, (Member, IEEE),AND GI HWAN CHO 4, (Member, IEEE)1Department of Information and Communication Technology, Bangladesh University of Professionals, Dhaka 1216, Bangladesh2Institute of Information Technology, Jahangirnagar University, Dhaka 1342, Bangladesh3Department of Computer Science, Nottingham Trent University, Nottingham NG11 8NS, U.K.4Division of Computer Science and Engineering, Jeonbuk National University, Jeonju 54896, South Korea
Corresponding authors: Mufti Mahmud ([email protected]; [email protected]) and Gi Hwan Cho ([email protected])
This work was supported in part by fellowship number 19FS12048 from the Information and Communication Technology Division of theGovernment of the People’s Republic of Bangladesh.
ABSTRACT Predicting the time, location and magnitude of an earthquake is a challenging job as anearthquake does not show specific patterns resulting in inaccurate predictions. Techniques based on ArtificialIntelligence (AI) are well known for their capability to find hidden patterns in data. In the case ofearthquake prediction, these models also produce a promising outcome. This work systematically exploresthe contributions made to date in earthquake prediction using AI-based techniques. A total of 84 scientificresearch papers, which reported the use of AI-based techniques in earthquake prediction, have been selectedfrom different academic databases. These studies include a range of AI techniques including rule-basedmethods, shallow machine learning and deep learning algorithms. Covering all existing AI-based techniquesin earthquake prediction, this article provides an account of the available methodologies and a comparativeanalysis of their performances. The performance comparison has been reported from the perspective of useddatasets and evaluation metrics. Furthermore, using comparative analysis of performances the paper aims tofacilitate the selection of appropriate techniques for earthquake prediction. Towards the end, it outlines someopen challenges and potential research directions in the field.
INDEX TERMS AI, deep learning, earthquake, machine learning, review.
NOMENCLATUREACC ant-colony clustering.AdaBoost/LPBoost adaptive/linear programming boost.AE absolute error.AHC agglomerative hierarchical cluster-
ing.AI artificial intelligence.ANFIS/FIS adaptive-network-based/fuzzy infer-
ence system.ANN artificial neural network.AUC area under the curve.BP backpropagation.
The associate editor coordinating the review of this manuscript and
approving it for publication was Zhiwei Gao .
DL deep learning.DNN deep neural network.DT decision tree.KNN K-nearest neighbors.ELM extreme learning machine.FAR false alarm ratio.FLANN functional link artificial neural network.FNN fuzzy neural network.FUM fuzzy user model.GA genetic algorithm.GBV/PBV global/personal best value.GFCV generalized fuzzy clustering variety.GLM generalized linear model.GMDH group method of data handling.GP grid partitioning.
VOLUME 8, 2020 This work is licensed under a Creative Commons Attribution 4.0 License. For more information, see https://creativecommons.org/licenses/by/4.0/ 1

M. H. A. Banna et al.: Application of AI in Predicting Earthquakes: State-of-the-Art and Future Challenges
HWT Haar wavelet transformation.IABC improved artificial bee colony.IASPEI international association of seismology and
physics of the earth’s interior.LM Levenberg-Marquardt.LR logistic regression.LSTM long short-term memory.MAE mean absolute error.MFO moth flame optimization.ML machine learning.MLP multi-layer perceptron.MSE mean squared error.NARX nonlinear auto-regressive networks with exoge-
nous input.NB Naive Bayes.NDAP neural dynamic optimization of Adeli and Park.NDC neural dynamic classification.NFS neuro-fuzzy system.PCA principal component analysis.PDF probability density function.PHMM poisson hidden Markov model.PNN probabilistic neural network.PR polynomial regression.PRNN pattern recognition neural network.PSO particle swarm optimization.RBFNN radial basis function neural network.RE relative error.RF random forest.RMSE root mean square error.ROC receiver operating characteristics.SC subtractive clustering.SES seismic electric signal.P0 negative predictive value.P1 positive predictive value.Sn sensitivity.Sp specificity.SVD singular value decomposition.SVM/R support vector machine/regressor.TEC total electron content.WIA Willmott’s index of agreement.
I. INTRODUCTIONEarthquake is a natural disaster caused by the movement oftectonic plates of earth due to the release of its substantialinternal energy. A major earthquake with a magnitude greaterthan five can inflict massive death tolls and huge infrastruc-tural damages costing billions of dollars. However, if theoccurrences of an earthquake can be predicted, the magnitudeof destruction can be minimized. A complete earthquakeprediction procedure should have three types of information:the magnitude, location, and time of occurrence. Since 2005,there have been 28,400 occurrences of earthquakes with amagnitude of more than five around the world [1]. Fig. 1presents the location of the occurrences from January toDecember 2019 [1]. Observing closely, it is possible to see
some patterns in locations of earthquakes (denoted by red dotsin Fig. 1). This kind of patterns may provide researchers withpossibilities to accurately predict earthquakes.
Earthquake prediction can be classified into the short-termand long-term process. Short-term prediction is very compli-cated as it predicts earthquakes within days or weeks of theiroccurrences. Therefore, it should be precise and accurate,and fewer false alarms are appreciated. Generally, short-termpredictions are used for evacuation of an area before anearthquake. On the other hand, long-term earthquakes are pre-dicted based on earthquakes periodical arrival, which carriesa few pieces of information. Still, they can help to set stan-dards for building code and designing disaster response plans.In 2009, L’Aquila city of Italy was struck by a 5.9 magnitudeearthquake, taking away the life of 308 citizens. However,the earthquake forecast commission of Italy predicted thatthere would be no damage, and they did not evacuate thecity. Such faulty prediction can lead to a massive massacretaking away lives and damaging lots of infrastructures. Thescientists involved in that incident were punished with sixyears of imprisonment [2].
The earthquake predictionmodels performwell with earth-quakes having medium magnitudes, but while the shockshave high magnitude, the outcomes achieved are poor. Majorearthquakes cause most damages and bring the most con-cern. The reason behind this scenario is that there is asmaller number of earthquakes with high magnitude, andwithout data, the prediction becomes very difficult. Theresearches on the prediction use historical data involving anearthquake’s energy, depth, location, and magnitude fromthe earthquake catalogs. Based on the magnitude of com-pleteness value, the area-specific earthquake parameters likeb-value parameters are calculated. Machine learning (ML)based algorithms mainly calculate the seismic indicators likeGutenberg Richter b-values, time lag, earthquakes energy,mean magnitude, etc. [3]. Instead deep learning (DL) basedmodels can calculate thousands of sophisticated features bythemselves [4], [5]. Since ML and DL based models aredata-driven and major earthquakes happen in a few cases, it ischallenging to predict them based on historical data. Somemethods predict the major earthquakes by separately trainingthem or adding weights to them, but these models need manyimprovements [6].
Another way for successful prediction is to find someprecursors of a major earthquake. Precursors are the changesin elements in nature before the occurrence of an earth-quake. Earthquake scientists suggest that concentration ofRadon gas, strange cloud formation, earth’s electromagneticfield variations, humidity, temperature of the soil, crustalchange, etc. can be the possible candidate precursors [7].Such generalization may be misleading because there weremany cases found where these precursors were present with-out the occurrence of an earthquake, and earthquakes tookplace even though there was an absence of these precursors.According to the International Association of Seismologyand Physics of the Earth’s Interior (IASPEI), precursor-based
2 VOLUME 8, 2020

M. H. A. Banna et al.: Application of AI in Predicting Earthquakes: State-of-the-Art and Future Challenges
FIGURE 1. Earthquakes occurred around the world from January 2019 to December 2019 with magnitude greater or equal to five. In twelve months,1637 earthquakes happened around the world. The data were collected from the United States Geological Surveys and plotted using ArcGIS software.The red square represents the epicenter of occurrence of the earthquake.
earthquake research should have some qualities like- it shouldbe observed from more than one site and instruments andshould be related to stress and strains of the earth [8]. No pre-cursor with definite proof of predicting earthquake is foundyet. Fig. 2 depicts the necessary process of prediction ofearthquakes with AI based methods. Some AI classifiersare used for this prediction process, along with the inputparameters and preprocessing.
Evaluation of an earthquake prediction method can becarried out using different metrics such as positive and neg-ative predictive values (P1, P0), specificity (Sp), sensitivity(Sn), accuracy, false alarm rate (FAR), R-score, root meansquare error (RMSE), mean squared error (MSE), relativeerror (RE), mean absolute error (MAE), area under the curve(AUC), chi-square testing, and so on. Earthquake models aredependent on the area from where the data are collected. Thatis why there is a need for a standard dataset of an earthquakeon which the researchers can calculate the evaluation metricsfor comparing their models with previous studies.
There are some review articles available that evaluatedearthquake prediction studies. In some of the reviews, the pre-cursory based researches are criticized based on their sci-entific values [10]. How these precursors can be used inearthquake prediction is also elaborated [11]. The use ofRadon concentration for the prediction of an earthquake is
also investigated [17]. Data mining techniques are discussedin the study [15]. Classical ML techniques are reviewed, andtheir evaluation techniques are discussed in the study [20].How the rule-based techniques can work in this field areinvestigated in [21]. Mignan and Broccardo [22] discussedthe DL techniques in this field. There is a missing studywhere all these techniques are accumulated together, whichcan be an excellent resource for AI researchers in the field ofearthquake prediction.
For this review, earthquake prediction studies that includeAI-basedmethods are searched in databases like IEEEXploredigital library, Science Direct, and Google Scholar. Ini-tially, 292 papers were found. After removing duplicatesand reviewing the abstract of these papers, 148 papers wereselected for full-text review. This study includes both journaland conference articles because the conference proceedingsalso present substantial content vital in the prediction pro-cess. After reviewing full-text of these papers, 64 paperswere excluded as they were not specialized researches ofearthquake prediction. Finally, the 84 papers are studied inthis research. Fig. 3 illustrates the selection procedure ofthe articles for this study using a Prisma diagram. Fig. 4(a)depicts the buzz-words of earthquake researches. Fig. 4(b)represents the pie diagram showing the distribution of AIalgorithms, and it clearly shows that the Artificial Neural
VOLUME 8, 2020 3

M. H. A. Banna et al.: Application of AI in Predicting Earthquakes: State-of-the-Art and Future Challenges
FIGURE 2. A general earthquake prediction model. Earthquakes are predicted based on some features. These features can be the seismicity indicators,which are calculated from the earthquake catalog. Some earthquake precursors can be found which happened a few days before the earthquake. Butthese precursors never confirm an earthquake. Radon gas concentration, soil temperature variation, and strange cloud formation are some of theearthquake precursors. From the seismograph P-wave and S-wave can be detected by which earthquake can be predicted. Some countries use dedicatedsatellite to monitor earthquake-related parameters which helps in finding earthquake precursors. These data are used as an input signal to theprediction model. Then the data are processed to remove missing values and converted to a form that suits the classification and regression algorithms.In this study, we have considered the AI-based algorithms only. These algorithms try to find hidden patterns in the data to classify them. In the end,these algorithms predict the time, location, and magnitude of an earthquake.
Network (ANN) is used in most studies. Fig. 4(c) shows theyearly distribution of the reviewed articles. Studies of thelast 15 years were incorporated into this research. Most ofthe researches were from the year 2016 to the year 2019.In these four years, 36 pieces of research were done basedon AI techniques. The other 48 studies were selected fromthe year 2005 to the year 2015. In the year 2009 and the year2014, 8 studies were selected each year, which is the highestin the first 11 years considered for review.
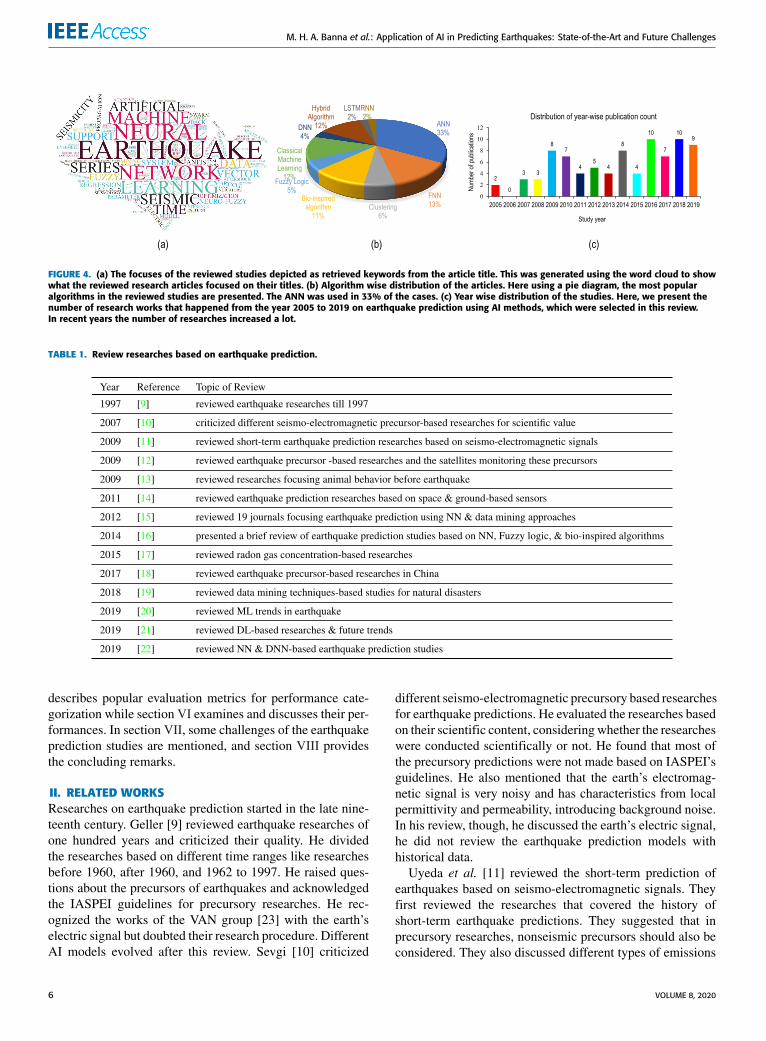
This study focuses on reviewing the earthquake researchesthat are based on different AI techniques. It reflects the state-of-the-art historically. All the possible AI-based methodsused in this regard are included with their proposed methodsand findings. To the author’s knowledge, the other reviewworks in this field considered a few aspects of the earthquakeand did not cover all theAImethods.We have incorporated allthe studies that focus on earthquake prediction and its charac-teristics with their performance. This will widen the scope offurther research by pointing out the most effective parametersof earthquakes and techniques with higher accuracy. Table 1presents existing review articles published in this field. Themain contributions of this article are discussed below, whichshows the uniqueness of this study:
1) This study considers the articles that include rule-basedmethods such as Fuzzy logic, adaptive-network-basedfuzzy inference system (ANFIS); Shallow machinelearning algorithms such as support vector machine(SVM), support vector regression (SVR), random For-est (RF), decision tree (DT), radial basis functionneural network (RBFNN), K-nearest neighbor (KNN),probabilistic neural network (PNN), ANN, clustering;and Deep machine learning methods such as a recur-rent neural network (RNN), long short-term mem-ory (LSTM), deep neural nets (DNN) for predictingan earthquake. Not only that, the bio-inspired mod-els are also evaluated. To the best of our knowl-edge, no study has been done considering all thesetechniques.
2) 84 papers from renowned publishers are extensivelyreviewed based on the AI techniques.
3) This study presents an in-depth description of themethodologies of these researches.
4) Relative comparison between different techniquesbased on their performances are presented.
5) The databases used in the studies are also included,which can help earthquake research enthusiasts in
4 VOLUME 8, 2020

M. H. A. Banna et al.: Application of AI in Predicting Earthquakes: State-of-the-Art and Future Challenges
FIGURE 3. Prisma diagram of the selection process of the research articles of this review. Thesearch string used in this study is- (‘‘Neural Network’’ or ‘‘Machine Learning’’ or ‘‘SVM’’ or‘‘RNN’’ or ‘‘HMM’’ or ‘‘Hidden Markov’’ or ‘‘Fuzzy’’ or ‘‘Deep Learning’’ or ‘‘Data Mining’’ or‘‘SVR’’ or ‘‘PNN’’ or ‘‘LSTM’’ or ‘‘Clustering’’ or ‘‘Radial Basis’’ or ‘‘RBF’’ or ‘‘Support Vector’’) and(‘‘Earthquake’’) and (‘‘Prediction’’). Based on this search string, we have initially found292 research articles from Science Direct, Google Scholar, and IEEE Xplore digital library. Afterscreening and eligibility testing, we have selected 84 research papers for this review.
their studies. Performance comparison based on thesedatasets are also provided in this article.
It is expected that this study will attract newAI researchers to this highly demanding field of earthquakeprediction.
The rest of the paper is organized as follows. In section II,the works related to this study are discussed. Section IIIdiscusses the working principle of the most common AIalgorithms. Section IV briefly discusses the methodologiesused by the researchers of earthquake prediction. Section V
VOLUME 8, 2020 5
M. H. A. Banna et al.: Application of AI in Predicting Earthquakes: State-of-the-Art and Future Challenges
FIGURE 4. (a) The focuses of the reviewed studies depicted as retrieved keywords from the article title. This was generated using the word cloud to showwhat the reviewed research articles focused on their titles. (b) Algorithm wise distribution of the articles. Here using a pie diagram, the most popularalgorithms in the reviewed studies are presented. The ANN was used in 33% of the cases. (c) Year wise distribution of the studies. Here, we present thenumber of research works that happened from the year 2005 to 2019 on earthquake prediction using AI methods, which were selected in this review.In recent years the number of researches increased a lot.
TABLE 1. Review researches based on earthquake prediction.
describes popular evaluation metrics for performance cate-gorization while section VI examines and discusses their per-formances. In section VII, some challenges of the earthquakeprediction studies are mentioned, and section VIII providesthe concluding remarks.
II. RELATED WORKSResearches on earthquake prediction started in the late nine-teenth century. Geller [9] reviewed earthquake researches ofone hundred years and criticized their quality. He dividedthe researches based on different time ranges like researchesbefore 1960, after 1960, and 1962 to 1997. He raised ques-tions about the precursors of earthquakes and acknowledgedthe IASPEI guidelines for precursory researches. He rec-ognized the works of the VAN group [23] with the earth’selectric signal but doubted their research procedure. DifferentAI models evolved after this review. Sevgi [10] criticized
different seismo-electromagnetic precursory based researchesfor earthquake predictions. He evaluated the researches basedon their scientific content, considering whether the researcheswere conducted scientifically or not. He found that most ofthe precursory predictions were not made based on IASPEI’sguidelines. He also mentioned that the earth’s electromag-netic signal is very noisy and has characteristics from localpermittivity and permeability, introducing background noise.In his review, though, he discussed the earth’s electric signal,he did not review the earthquake prediction models withhistorical data.
Uyeda et al. [11] reviewed the short-term prediction ofearthquakes based on seismo-electromagnetic signals. Theyfirst reviewed the researches that covered the history ofshort-term earthquake predictions. They suggested that inprecursory researches, nonseismic precursors should also beconsidered. They also discussed different types of emissions
6 VOLUME 8, 2020
M. H. A. Banna et al.: Application of AI in Predicting Earthquakes: State-of-the-Art and Future Challenges
of the earth before earthquakes like telluric current andhigh-frequency electromagnetic waves. They pointed out thatthis electric signal should not be considered as earthquakeprecursors. Alvan and Azad [14] reviewed earthquake pre-diction researches based on space-based and ground-basedsensors covering most of the earthquake precursors. Theydivided the studies based on the different precursors likeearth’s crust, temperature, strange cloud formation, humid-ity, and Radon gas concentration. The satellite imagery andground parameters were also discussed in this research.Woith [17] reviewed earthquake prediction techniques thatused Radon gas concentration as a parameter. He pointed tothe fact that though there are anomalies present in Radon con-centration, in many cases, no earthquake occurs. He reviewed105 publications and enlisted their databases and methods.He also discussed how models should differentiate betweenseismic disturbance of Radon concentration and human-madeones.
Huang et al. [18] reviewed earthquake precursoryresearches from 1965 to 2015 in China. In this research,the studies were clustered in different time ranges.Seismic parameters, geo-electromagnetic parameters, geode-tic and gravity parameters, and ground fluids were con-sidered as earthquake precursors. Then they discussedthe ongoing projects in China for earthquake prediction.Mubarak et al. [12] discussed earthquake precursors likegravity variations, temperature and humidity fluctuation,Radon concentration changes, and electric field changes.Then they briefly discussed seven countries which use satel-lite for their precursory predictions. From the literature theyreviewed, a decrease in air humidity, and an increase in Radonconcentration and electric field can be taken as earthquakeprecursors. Bhargava et al. [13] reviewed the articles whichused animals’ weird behavior before an earthquake as theindicator of an earthquake and mentioned that China, Japan,and the USA have facilities for this kind of research. They didnot include historical data-based researches for earthquakeprediction.
Otari and Kulkarni [15] reviewed 16 journals from 1989 to2011 and grouped them based on NN and data miningapproaches. In 2018, Goswami et al. [19] reviewed data min-ing techniques to predict, detect, and develop managementstrategies for natural disasters like earthquakes, Tsunami,or cyclones. They proposed a twitter-based disaster man-agement model for India. Galkina and Grafeeva [20] ana-lyzed the ML trend in earthquake prediction research. Theyobserved datasets, features, the magnitude of completeness,and performancemeasurement criteria for these studies. Theynoticed that these studies face difficulties in predicting rarebut more important major earthquakes. Azam et al. [16]reviewed earthquake prediction works based on NN, Fuzzylogic, and bio-inspired optimization algorithms. However,there is a lack of detailed research in this area. Jiao andAlavi [21] reviewed the DL-based researches and predictedfuture trends in this area. DNN is used for this purpose asit can take unorganized data and calculate many features
by itself. They presented a generalized picture of the work-ing procedure of these systems. Mignan and Broccardo [22]analyzed 77 articles on NN from 1994 to 2019. They dividedthe studies into two categories- ANN and DNN. DNN is thefuture of the earthquake prediction model though the modelis more complex and uninterpretable. As a result, overfittingbecomes a problem.
All the review articles discussed either short-term earth-quakes with earthquake precursors or addressed some por-tion of AI methods to the best of the author’s knowl-edge. No review covers short-term earthquakes, long-termearthquakes, earth’s electromagnetics, ANN-based meth-ods, Fuzzy based studies, clustering techniques, DNN,bio-inspired algorithms, and ML techniques for prediction ofearthquakes. Through this study, all these sectors were incor-porated for a comprehensive review of earthquake prediction.
III. ARTIFICIAL INTELLIGENCE (AI) ALGORITHMSA. RULE BASED APPROACHES1) FUZZY LOGICThe decision-making process of humans is different thanhow a machine works. Between ‘‘yes’’ and ‘‘no’’, humanconsiders some other options. Fuzzy-logic systems representthis way of decision making. A fuzzy logic system has somemodules with whom it takes a decision. The fuzzificationmodule uses a membership function to generate a member-ship degree from crisp inputs. Membership degree can be-large positive, medium positive, small, mid negative, andlarge negative. Then the knowledge base comes, where thereare some IF-THEN rules, which are adopted from humanbehavior. The inference engine compares the input with therules and provides reasoning for the input. The defuzzifica-tion module converts this reasoning to crisp output. Fuzzylogic is popular because of its ease of use, and flexibility.Fig. 5(a) shows the basic structure of Fuzzy logic systems.
2) FUZZY NEURAL NETWORK (FNN)When Fuzzy networks are represented as ANN so that theycan be optimized using backpropagation or genetic algo-rithm (GA), we call the system a neuro-fuzzy system (NFS).One approach to implementing this system is the Mamdaniapproach by Ebhasim Mamdani [24]. For this approach, boththe input and output of the system must be a fuzzy quantity.It uses a simple min-max operations structure, which makesit a great model for human inference systems. This model isunderstandable for humans, but the complexity increases withthe increase in input rules. This model uses five layers forprediction, which are enlisted as:
1) Fuzzification layer: The input vector consisting of fea-tures enters into the fuzzification layer, where its mem-bership value is calculated. Generally, the Gaussianfunction is selected for calculating the membershipvalue [24].
2) Fuzzy inference layer: In the inference layer, fuzzyrules fire based on the input vector by multiplying themembership values.
VOLUME 8, 2020 7

M. H. A. Banna et al.: Application of AI in Predicting Earthquakes: State-of-the-Art and Future Challenges
FIGURE 5. (a) Fuzzy Logic architecture. In Fuzzy logic, the crisp input is fuzzified and compared with the rules to create a crisp output. (b) MamdaniFNN architecture. It has five layers that work together to predict a value. A1, A2, B1, B2 are the input nodes which take X, Y as input. The next layerdenoted by 5 multiplies the values of the previous layer to generate weight W1 and W2. These weights are used for implication, and the result ofthem is summed together. This output goes to the defuzzification layer to produce an output. (c) Takagi-Sugeno ANFIS architecture. This is afive-layer architecture where A1, A2, B1, B2 are the input nodes which take X, Y as input. The next layer denoted by 5 multiplies the values of theprevious layer to generate weight W1 and W2. The layer denoted by N normalizes the value of the previous layer and outputs W1 and W2. The rulesare a combination of X, Y and the input nodes. These rules are multiplied and summed together to produce an output. The square layers areadaptive as they can be changed to produce a better output.
3) Implication layer: In the implication layer, consequentmembership functions are calculated based on theirstrength.
4) Aggregation layer: In the aggregation layer, the multi-plication of firing strength and consequent parametersare summed together.
5) Defuzzification layer: The final crisp output is achievedby defuzzification, which follows the center of the areamethod.
Fig. 5(b) depicts the layer structure of the Mamdani FNN.The other approach is Takagi Sugeno neuro-fuzzy system,
which is also known as ANFIS. The NN and fuzzy inferencesystem (FIS) are combined for this model [25]. Usually, FISdoes not have learning ability, and its membership function isfixed. Five layered ANFIS approach solves these problemsand generates IF-THEN rules from the knowledge of anexpert avoiding extensive initialization stage and making thesystem efficient in computation.
The first layer generates grade membership functions likeGaussian functions, triangular functions, and trapezoid func-tions, which are used to generate firing strength. The secondlayer uses the membership function’s grade to calculate thefiring strength. The output of each model is compared, andthe product or minimum of them is selected. In the thirdlayer, normalization is done by dividing the firing strengthof a rule by the combined firing strength. Defuzzificationis the next layer where the output is calculated using theweighted parameters. The sum of all the defuzzified nodesis summed together in the last stage to generate the overallANFIS output. Fig. 5(c) depicts the architecture of an ANFISmodel. The square layers are adaptive, that means, with someoptimization algorithms like BP or GA, we can adjust theselayers.
B. SHALLOW MACHINE LEARNING1) SUPPORT VECTOR MACHINE (SVM)SVM is a ML-based classification algorithm used success-fully in applications like classification, pattern recognition,and prediction. It organizes the classes by constructing ahyperplane in an N-dimensional plane in a way so that the
hyperplane ensures maximum margin distance between datapoints of the classes [26]. The data points close to the hyper-plane are called support vectors, which determine the orienta-tion and position of the hyperplane.When a linear hyperplanecannot separate the classes, a higher dimensional nonlinearhyperplane is needed. Polynomial, sigmoid, and radial basisfunction (RBF) kernels are some accessible kernel functionsthat are used for these cases. SVM is a quite computationallyexpensive classifier and usually takes longer time for train-ing. It possesses regularization capability and is capable ofworking with linear or nonlinear data. Fig. 6(a) shows howSVM constructs hyperplane between two groups of data forclassification purposes.
2) SUPPORT VECTOR REGRESSION (SVR)SVR algorithm works in an entirely different manner thanmost of the regression algorithms [27]. Where the otherregression algorithms try to minimize the sum of squarederror, SVR is concerned with the error when the error isin a particular range. This regression method works simi-larly to SVM, but instead of providing a class as output,it produces a real number. SVR gives flexibility in case oferror to minimize coefficients (E-value) and optimizes themto improve performance. It is trained with symmetrical lossfunction to penalize low, and high miss estimates equally.The computation complexity of SVR is not dependent onthe input shape’s dimension. For nonlinear operations, it useskernel functions like polynomial kernel, which is representedby Eq. (1), where xi, xj are two different observations inthe dataset, r is the coefficient of the polynomial, and d isthe degree of the polynomial andGaussian RBF kernel, whichis represented by Eq. (2), where xi, xj are two different obser-vations in the dataset, and γ is the spread of the kernel.
f (xi, xj) = (xi × xj + r)d (1)
f (xi, xj) = e−γ ||xi−xj||2
(2)
It possesses excellent generalization capability and capable ofachieving high prediction accuracy. This process is depictedin Fig. 6(b).
8 VOLUME 8, 2020
M. H. A. Banna et al.: Application of AI in Predicting Earthquakes: State-of-the-Art and Future Challenges
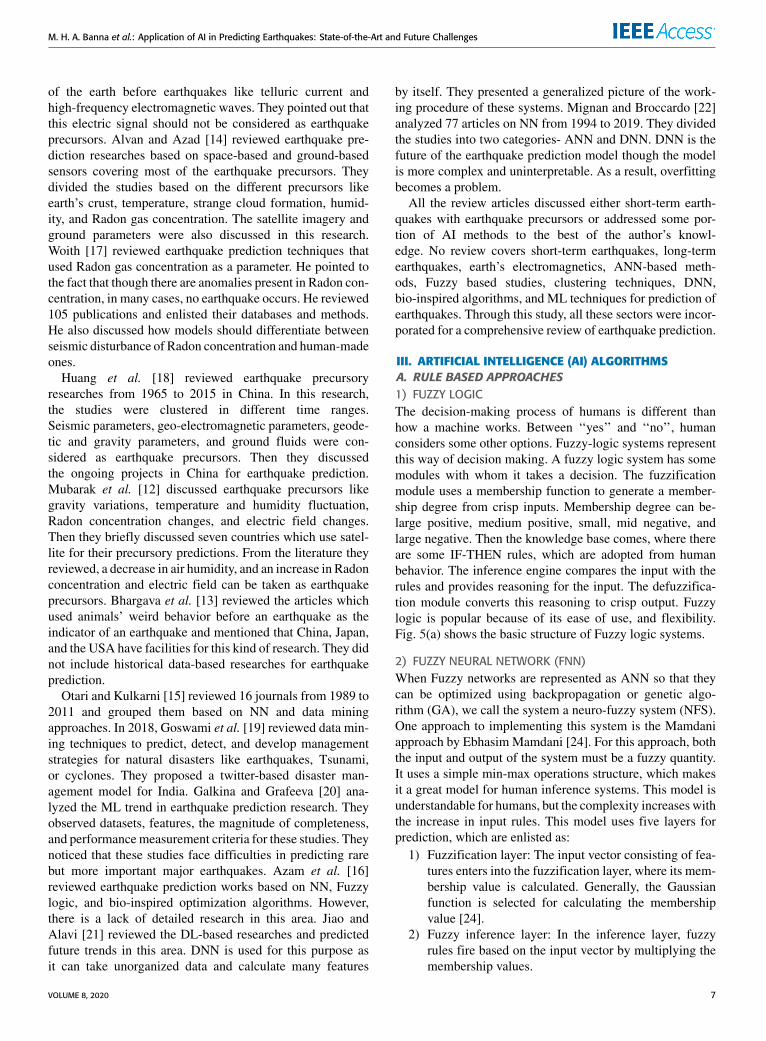
FIGURE 6. (a) Classification process of the SVM algorithm. This algorithm tries to create a hyperplane to maximize the margin between to close datapoints of two different classes. (b) Working procedure of the SVR algorithm. It inherits properties from the SVM algorithm but does regressionoperation. A regression line is drawn to cover the whole dataset. The maximum deviation is denoted by e. The data which are not in the deviation of±e are the outliers. (c) Decision-making process of the KNN algorithm. Based on the value of k, classification can be changed. (d) The workingprinciple of the K-means clustering algorithm. Based on Euclidean distance, the clusters are formed. The output of the clustering is represented usingdifferent colors. (e) Classification process of the RF algorithm. From the data, different sub-trees are generated, which produces different classes. Theclass with most occurrences are selected as the output class. (f) Dendrogram of hierarchical clustering. When data in the Dendrogram are accessed ina top-down approach, it is called divisive clustering, and when it is accessed in a bottom-up fashion, it is called agglomerative clustering.(g) Decision-making process of the DT (C4.5) algorithm. Here, based on different conditions, the algorithm reaches to different decisions.
3) K-NEAREST NEIGHBOR (KNN) ALGORITHMIt is a supervisedML algorithmwhere data in close proximityare thought to have the same output class [28]. The valueof k is determined at first, which should not be very smallor massive. Then the input data’s Euclidean distance is cal-culated considering each feature. The Euclidean distance oftwo-point a and b is represented by Eq. (3).
||a− b|| =√(x1 − x2)2 + (y1 − y2)2 (3)
where coordinates of a is (x1, y1), and coordinates of point bis (x2, y2). Based on those distances, the data are sorted insmallest to largest order. Then the labels of the first k entitiesare considered, and the label with the highest occurrences isselected as the class of that data. Although it is a straightfor-ward algorithm, it is not suitable for large datasets. Fig. 6(c)shows how the change in the value of k can change theprediction process.
4) RANDOM FOREST (RF) ALGORITHMThis classifier is a collection of randomly selected decisiontrees that works in a voting method [29]. It takes votes fromdifferent decision trees to determine the final class. Thismethod combines the output of different random decisiontrees to provide a classification result. Each tree of RF isconstructed using different bootstrap samples. It changes theprocedure of construction in the case of a regression tree.RF is quite similar to bagging, but it contains another extralayer to introduce randomness. It has the ability to acquirehigh accuracy and can handle massive datasets efficiently.The decision-making process of an RF classifier is shown
in Fig. 6(e). This method does not need hyperparameter opti-mization, therefore, it is a simple but effective ML method.
5) DECISION TREE C4.5 ALGORITHMThis is a statistical classifier that works by generating deci-sion trees based on information gain, where the highest nor-malized gain is selected as the criterion of splitting [30]. It isan improved version of the Iterative Dichotomiser 3 algo-rithm, which can deal with continuous variables, discretevariables and missing values. It builds a classifier by analyz-ing the training set to classify the test set. C4.5 builds decisiontrees that respect Occam’s Razor. In C4.5, missing values aredealt with by estimations from the dataset. This algorithmsupports tree pruning to deal with overfitting. Here a subtreecan be replaced by a leaf node. Meanwhile, small changesin a dataset can lead to a change in the decision tree. Thisalgorithm is easy to implement and works well, even with anoisy dataset. Fig. 6(g) shows how DT algorithms come to aconclusion based on conditions in the data.
6) K-MEANS CLUSTERINGClustering is an unsupervised learning technique that seg-ments data into different sub-divisions. K-means clusteringis a prevalent iterative clustering technique that finds localmaxima in each iteration [31]. For this algorithm, initially,the value of k is fixed. The optimum value can be foundby using the elbow method. The algorithm first assigns ran-dom means on each cluster and classifies the data based ondistance from the mean. Usually, Euclidean or Manhattandistances are used for calculating distance. Based on theassigned clusters, the mean is again calculated for each clus-ter, and then the data are reclassified. This process continues
VOLUME 8, 2020 9

M. H. A. Banna et al.: Application of AI in Predicting Earthquakes: State-of-the-Art and Future Challenges
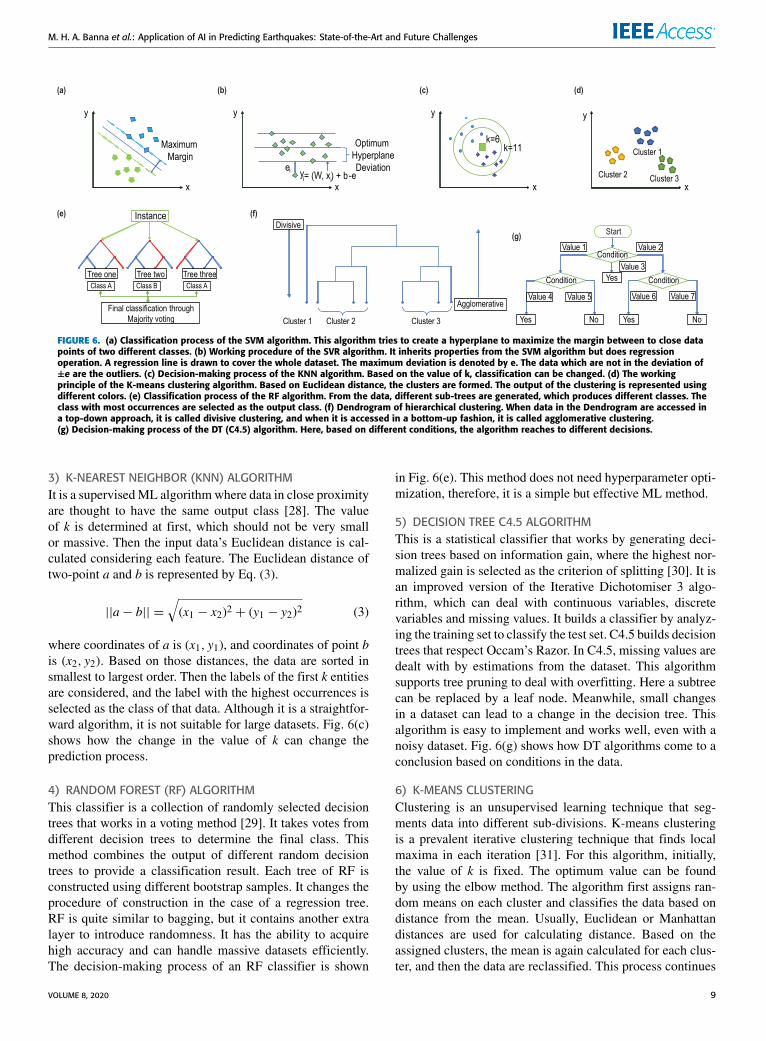
FIGURE 7. (a) An ANN architecture consisting of two hidden layers. In the input layer, there are three nodes, and there are two nodes for eachhidden layer. In each node, an activation function takes the input from the previous layer. (b) An RBFNN architecture. The nodes denoted by 8implements radial functions. (c) A PNN architecture. The pattern layer is denoted by �, and the summation layer is denoted by
∑. This
algorithm uses a probability distribution function. (d) DNN architecture. This network consists of four hidden layers which are fully connected.(e) RNN architecture. There are two recurrent layers which has some feedback connection. These connections help finding historical patternsin data. (f) LSTM cell structure. It uses some parameters which are, ht (output value of a cell), xt (input value of a cell), ft (forget gate value), it(input gate value), Ot (output gate value), Ct (cell state), Ct (candidate value). σ , and tanh are the activation functions. The output ht iscalculated as ht = tanh(ct )×Ot , where Ct = ft Ct−1 + it Ct .
until there is no change in means between successive itera-tions. The mean is calculated again to obtain the classifieddata. Fig. 6(d) shows the workflow of this algorithm.
7) HIERARCHICAL CLUSTERINGHierarchical clustering is a hierarchical decomposition ofdata. For this, a dendrogram is built. Fig. 6(f) shows anexample of a dendrogram. Initially, this algorithm considerseach data points as an individual cluster [31]. Then twoclusters with the lowest Euclidean distance are combined intoone cluster. This distance is assigned as the height of thedendrogram. Afterwards this cluster is compared with otherclusters to find two clusters with the lowest distance. Thisprocess continues until k number of clusters are obtained,or only one cluster is left. The value of k can be found fromthe dendrogram by a horizontal line that is not crossed by theverticle lines. Although it is a high-speed algorithm, it cannotbe used for a large dataset.
8) ARTIFICIAL NEURAL NETWORK (ANN)The ANN is a synthetic mimic of the human brain in responseto some event. It is composed of some neurons, which arelinked together with some weights and biases. By training anANN, the biases and weights are tuned in such a way thatit produces output closer to the actual result [32]. Typically,an ANN has an input layer that takes data, one or morehidden layers for feature generation, and an output layer for
classification. Fig. 7(a) shows a common ANN architecture.Each layer consists of neurons that have activation functionsinside. These activation functions take the inputs and biasesof the previous layers, calculate the weighted sum, and scaleit within some range. This way, the data move forward, andthe output layer produces predicted output. After this forwardpass, the error is calculated by the sum square function whichis the residue of actual output and predicted output. This errorfunction needs to be minimized. The BP algorithm is adoptedto minimize the error and adjust the biases and weightsaccordingly. The first derivative of the error is calculated withrespect to the weights. Then learning rate is multiplied withthese values and is deducted from the weights to adjust them.
This method can be slow to converge to the optimal value.To resolve this, the Levenberg-Marquardt method can beused for faster convergence [33]. This method can approachsecond-order training speed as the Hessian matrix is notcomputed [33]. Since the error function is in sum squaredform, the Hessian function can be estimated as H = JT J ,and its gradient is g = JT e, where J is the Jacobian matrix,e is a vector of the network error, and T means transpose.The Jacobean matrix is calculated using BP. The LM approx-imates the Hessian matrix as Eq. (4).
XK+1 = XK − [JT J + µI ]−1JT e (4)
where I is an identity matrix and µ is a control parameter.When µ is equal to zero, it works like Newton’s method,
10 VOLUME 8, 2020

M. H. A. Banna et al.: Application of AI in Predicting Earthquakes: State-of-the-Art and Future Challenges
and when it is big, it works like a gradient descent with asmall step size. Newton’s method is faster for reaching theminimization of the error. When a successful step is taken,the value of µ is decreased, and vice versa.GA is a nonlinear optimization technique with impressive
global searching ability [34]. This algorithm is often usedto set the initial weights and biases of the NN so that itconverges to its optimal form fast and gets out of the localminima. In GA, a set of individuals are taken, which arecalled population. Each individual in the population is calledchromosomes, and chromones are composed of genes. Thereare five steps in this algorithm as follows:
1) initialization2) computation of fitness function3) selection of parent chromosomes4) crossover between them5) mutation
First, the initial population is selected, and the fitness scoreis computed based on the ability of each chromosome tocompete with others. Interconnecting weights and biases ofNN can be encoded as a chromosome. Based on the fitnessscore, a rank is provided, and chromosomeswith better fitnessscores have more chances of crossover. During the crossoverstage, a random point is selected from the parent gene. Fromhere, the genes of each parent chromosomes are exchangedto produce an offspring. In the mutation stage, some bits ofthe offspring are flipped, which helps them better the fitnessscores. Next, the fitness score of the offspring is calculatedto test if they are the next generation chromosomes [35].This process is repeated for some generations and stops ifsome specific number of generations are completed, or somecondition is reached.
In the particle swarm optimization (PSO) algorithm, par-ticles are used to find the best solution. If the best set ofstructural parameters for ANN needs to be calculated, thismethod can be used to optimize it. In PSO, the particlesare initialized with some random value [36]. Then distanceis measured from the goal state to the current state of eachparticle. There are two values which are the personal bestvalue (PBV) and the global best value (GBV). If the PBVis higher than the particle’s previous best values, it updatesits PBV. The GBV is the best PBV achieved among all theparticles in that iteration. Based on the GBV, velocity iscalculated for each particle, and their data are changed. Thisprocess will be terminated when all the particles reach thegoal state, or some predefined conditions are met.
Any boosting classifier uses weak classifiers to build arobust classifier. In Adaptive boosting (AdaBoost), some verysimple classifiers are selected, which uses specific featuresto classify data [37]. These classifiers can run very fast.In AdaBoost first, a classifier classifies the data and looksfor the misclassified data points. Based on its performance,a weight is given to this classifier. Then the misclassified datapoints are given more importance, and the classifier’s goalis to classify most weighted data points with more accuracy.
This process continues, and eventually, a collection of weakclassifiers with optimizedweights is obtained. This collectionof weighted weak classifiers can classify data with highaccuracy.
9) RADIAL BASIS FUNCTION NEURAL NETWORK (RBFNN)This is an NN that works with some variation in the activationfunction. This RBFNN has three layers that are an input layerwhich is not weighted and is connected to the input parame-ters; a hidden layer where the radial basis functions are usedas activation function; and an output layer which is fullyconnected to the hidden layer outputs. The layer structure isrepresented in Fig. 7(b). In this network, some radial func-tions, which can be a circle, describe different classes. Fromthe center of the circles, as we go away, the function dropsoff. This drop-off is commonly represented by exponentiallydecaying functions like e−bd
2, where b controls the drop-
off [38]. If b is significant, then drop-off is sharp. When someinput is fed into the network, Euclidean distance is calculatedbetween that point and the center of the radial function.The output of different hidden neurons is multiplied withweights and forwards to the output neuron. In output neurons,the linear activation function is used, and a weighted sum ofthe output of the previous layer is calculated to generate anoutput.
10) PROBABILISTIC NEURAL NETWORK (PNN)The PNN algorithm works based on the Parzen windowclassifier. The parent probability density function of all theclasses is approximated using a Perzon window function [3].The Bayes rule is applied to the allocated highest posteriorprobabilities for each class. The network architecture hasan input layer, a pattern layer, a summation layer, and anoutput layer. The input vector is fed into the input layer.The number of training vectors determines the number ofneurons in the pattern layer. The Gaussian function is appliedto the Euclidean distance of the input vector and each trainingvector. This process is similar to RBFNN. In the summa-tion layer, each neuron represents a specific class and com-putes a weighted sum of all the pattern layer values it isrelated to. This way, the class, which has maximum patternoutput, determines the maximum PDF. In the output layer,the class that has the highest joint PDF is assigned as one,and the rest are assigned zero. The PNN does not use generalANN concepts like learning rules. Fig. 7(c) shows the basicPNN architecture.
C. DEEP MACHINE LEARNING1) DEEP NEURAL NETWORK (DNN)This is a subclass of the ANN, which does not need hand-crafted features to be fed into the network as it has thecapability of calculating complex features from the data. Forunstructured data, DNN works best. A DNN model has adense architecture of many hidden layers [39]. Each layer iscomposed of neurons, and the neurons are connected with
VOLUME 8, 2020 11
M. H. A. Banna et al.: Application of AI in Predicting Earthquakes: State-of-the-Art and Future Challenges
weighted links and biases. The goal of the network is tooptimize them so that they can produce good classificationaccuracy. A loss or error function like the MSE is defined forthis purpose. There are lots of DL-based models such as deepbelief network, convolutional neural network (CNN), RNN,and so on. If there are 2N data points, usually an N number ofhidden layers are used. For the CNN, hidden layers computeconvolution operations with some fixed filter size and stride.Each neuron has an activation function that is fired when theinput to that neuron is over some specified value. Because ofcomplex patterns, DNNs can face difficulties such as overfit-ting. Regularization techniques like dropout of some neuronscan be used for solving this problem. Learning rates andbatched processing are used for computational convergencewith some optimization algorithms. Batch normalization isused in some cases. Fig. 7(d) shows a DNN architecture.
2) RECURRENT NEURAL NETWORK (RNN)Usually, NN does not have any feedback connection from theoutput layer, for which these algorithms are not suitable foroperations where time-series data are involved. RNN worksbest for activities that include time-series data [40]. Normally,in an RNN, there is more than one recurrent layer. Therecurrent layers have feedback connections from the modeloutput. An RNN architecture is shown in Fig. 7(e). On everyiteration, the output of the model of the previous iterationis passed through to recurrent layers and to the hidden layeroutputs. These outputs aremodified by the activation functionof the output layer and produce a new output. This wholeprocedure can be illustrated by Eq. (5).
Oi =n∑j=1
f [Si.Wj + Oi−1.Wr ] (5)
where Oi is the output of the model after ith iteration, Si isthe input parameters, Wi is the weight of the input layer, andWr is the weights of the recurrent layer. RNN uses BP tooptimize the network [41].
3) LONG SHORT-TERM MEMORY (LSTM)RNN can be prone to vanishing or exploding gradient prob-lem where the gradient of the error becomes very small orvery large. Consequently, the network does not learn any-thing. It also cannot handle long term dependencies. Forsolving these problems, the LSTMwas introduced. It also hasa chain-like structure and has memory cells which consists ofthree gates that are the input gate, the forget gate, and theoutput gate [42].
Fig. 7(f) shows how an LSTM cell works. The forget gatedecides howmuch cell state would be stored. The informationthat needs to be stored in the cell state happens in two seg-ments. The input gate layer determines the values that need tobe updated. A vector of new candidate values is created usinga tanh function. These two are summed together and used toupdate the state. The output gate uses a filtered version ofthe output. A sigmoid layer determines which portion of the
previous cell state will be shown. This portion ismultiplied bythe tanh function of the cell state to produce the final result.It overcomes vanishing or exploding gradient effect and canlearn long term dependencies [43].
Bi-directional LSTM is an LSTM network extension thatuses forward and backward pass to retain past and futureknowledge. Generally, this network works better than generalLSTM because bi-directional LSTM can better grasp func-tion meaning. For this network layout, replication of the sameLSTM layer is used, but the input direction is reverse for onelayer. Bi-directional LSTM networks tend to do better thanone-way classification problems.
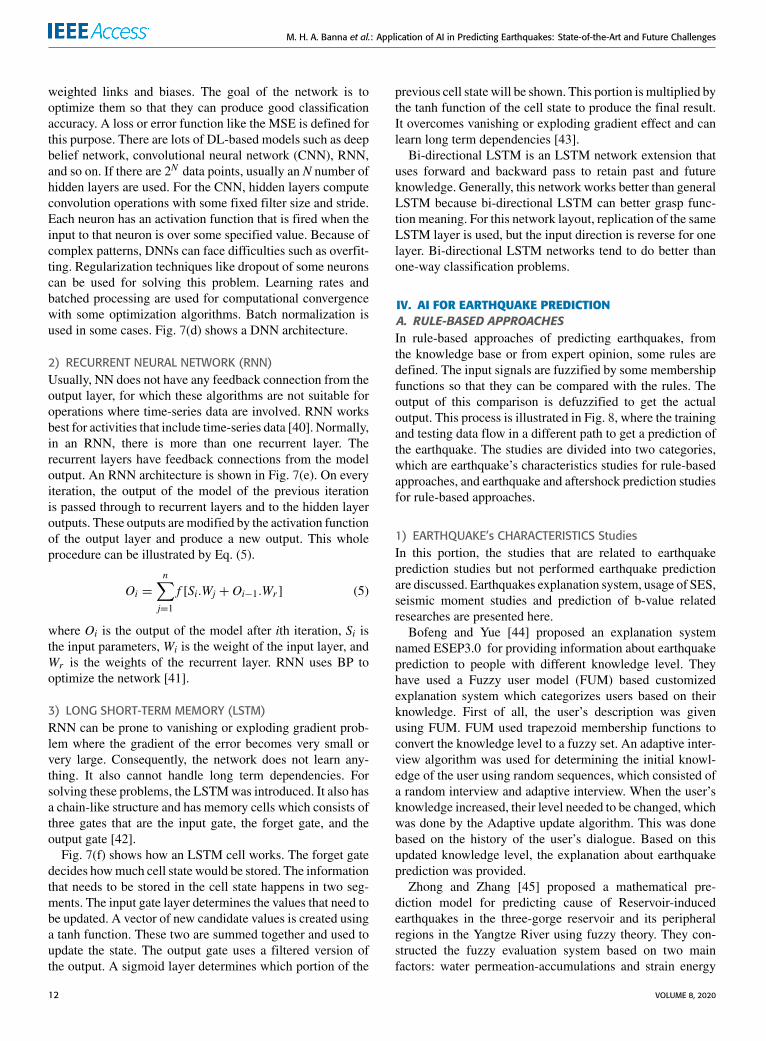
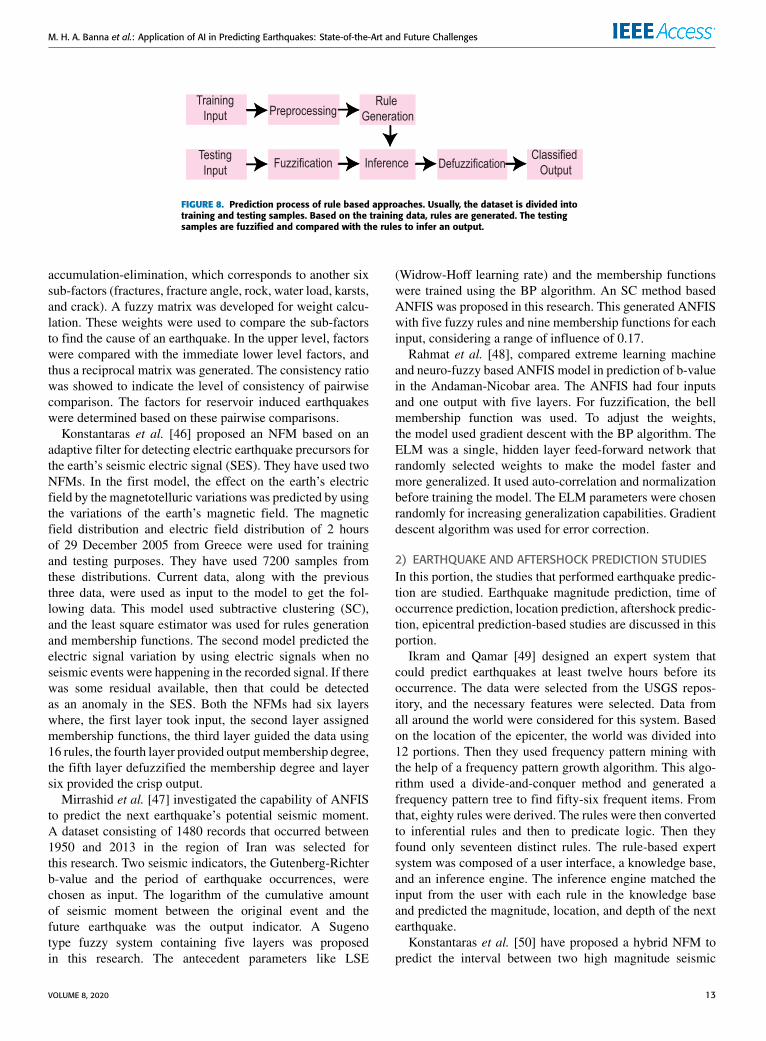
IV. AI FOR EARTHQUAKE PREDICTIONA. RULE-BASED APPROACHESIn rule-based approaches of predicting earthquakes, fromthe knowledge base or from expert opinion, some rules aredefined. The input signals are fuzzified by some membershipfunctions so that they can be compared with the rules. Theoutput of this comparison is defuzzified to get the actualoutput. This process is illustrated in Fig. 8, where the trainingand testing data flow in a different path to get a prediction ofthe earthquake. The studies are divided into two categories,which are earthquake’s characteristics studies for rule-basedapproaches, and earthquake and aftershock prediction studiesfor rule-based approaches.
1) EARTHQUAKE’s CHARACTERISTICS StudiesIn this portion, the studies that are related to earthquakeprediction studies but not performed earthquake predictionare discussed. Earthquakes explanation system, usage of SES,seismic moment studies and prediction of b-value relatedresearches are presented here.
Bofeng and Yue [44] proposed an explanation systemnamed ESEP3.0 for providing information about earthquakeprediction to people with different knowledge level. Theyhave used a Fuzzy user model (FUM) based customizedexplanation system which categorizes users based on theirknowledge. First of all, the user’s description was givenusing FUM. FUM used trapezoid membership functions toconvert the knowledge level to a fuzzy set. An adaptive inter-view algorithm was used for determining the initial knowl-edge of the user using random sequences, which consisted ofa random interview and adaptive interview. When the user’sknowledge increased, their level needed to be changed, whichwas done by the Adaptive update algorithm. This was donebased on the history of the user’s dialogue. Based on thisupdated knowledge level, the explanation about earthquakeprediction was provided.
Zhong and Zhang [45] proposed a mathematical pre-diction model for predicting cause of Reservoir-inducedearthquakes in the three-gorge reservoir and its peripheralregions in the Yangtze River using fuzzy theory. They con-structed the fuzzy evaluation system based on two mainfactors: water permeation-accumulations and strain energy
12 VOLUME 8, 2020
M. H. A. Banna et al.: Application of AI in Predicting Earthquakes: State-of-the-Art and Future Challenges
FIGURE 8. Prediction process of rule based approaches. Usually, the dataset is divided intotraining and testing samples. Based on the training data, rules are generated. The testingsamples are fuzzified and compared with the rules to infer an output.
accumulation-elimination, which corresponds to another sixsub-factors (fractures, fracture angle, rock, water load, karsts,and crack). A fuzzy matrix was developed for weight calcu-lation. These weights were used to compare the sub-factorsto find the cause of an earthquake. In the upper level, factorswere compared with the immediate lower level factors, andthus a reciprocal matrix was generated. The consistency ratiowas showed to indicate the level of consistency of pairwisecomparison. The factors for reservoir induced earthquakeswere determined based on these pairwise comparisons.
Konstantaras et al. [46] proposed an NFM based on anadaptive filter for detecting electric earthquake precursors forthe earth’s seismic electric signal (SES). They have used twoNFMs. In the first model, the effect on the earth’s electricfield by the magnetotelluric variations was predicted by usingthe variations of the earth’s magnetic field. The magneticfield distribution and electric field distribution of 2 hoursof 29 December 2005 from Greece were used for trainingand testing purposes. They have used 7200 samples fromthese distributions. Current data, along with the previousthree data, were used as input to the model to get the fol-lowing data. This model used subtractive clustering (SC),and the least square estimator was used for rules generationand membership functions. The second model predicted theelectric signal variation by using electric signals when noseismic events were happening in the recorded signal. If therewas some residual available, then that could be detectedas an anomaly in the SES. Both the NFMs had six layerswhere, the first layer took input, the second layer assignedmembership functions, the third layer guided the data using16 rules, the fourth layer provided output membership degree,the fifth layer defuzzified the membership degree and layersix provided the crisp output.
Mirrashid et al. [47] investigated the capability of ANFISto predict the next earthquake’s potential seismic moment.A dataset consisting of 1480 records that occurred between1950 and 2013 in the region of Iran was selected forthis research. Two seismic indicators, the Gutenberg-Richterb-value and the period of earthquake occurrences, werechosen as input. The logarithm of the cumulative amountof seismic moment between the original event and thefuture earthquake was the output indicator. A Sugenotype fuzzy system containing five layers was proposedin this research. The antecedent parameters like LSE
(Widrow-Hoff learning rate) and the membership functionswere trained using the BP algorithm. An SC method basedANFIS was proposed in this research. This generated ANFISwith five fuzzy rules and nine membership functions for eachinput, considering a range of influence of 0.17.
Rahmat et al. [48], compared extreme learning machineand neuro-fuzzy based ANFIS model in prediction of b-valuein the Andaman-Nicobar area. The ANFIS had four inputsand one output with five layers. For fuzzification, the bellmembership function was used. To adjust the weights,the model used gradient descent with the BP algorithm. TheELM was a single, hidden layer feed-forward network thatrandomly selected weights to make the model faster andmore generalized. It used auto-correlation and normalizationbefore training the model. The ELM parameters were chosenrandomly for increasing generalization capabilities. Gradientdescent algorithm was used for error correction.
2) EARTHQUAKE AND AFTERSHOCK PREDICTION STUDIESIn this portion, the studies that performed earthquake predic-tion are studied. Earthquake magnitude prediction, time ofoccurrence prediction, location prediction, aftershock predic-tion, epicentral prediction-based studies are discussed in thisportion.
Ikram and Qamar [49] designed an expert system thatcould predict earthquakes at least twelve hours before itsoccurrence. The data were selected from the USGS repos-itory, and the necessary features were selected. Data fromall around the world were considered for this system. Basedon the location of the epicenter, the world was divided into12 portions. Then they used frequency pattern mining withthe help of a frequency pattern growth algorithm. This algo-rithm used a divide-and-conquer method and generated afrequency pattern tree to find fifty-six frequent items. Fromthat, eighty rules were derived. The rules were then convertedto inferential rules and then to predicate logic. Then theyfound only seventeen distinct rules. The rule-based expertsystem was composed of a user interface, a knowledge base,and an inference engine. The inference engine matched theinput from the user with each rule in the knowledge baseand predicted the magnitude, location, and depth of the nextearthquake.
Konstantaras et al. [50] have proposed a hybrid NFM topredict the interval between two high magnitude seismic
VOLUME 8, 2020 13
M. H. A. Banna et al.: Application of AI in Predicting Earthquakes: State-of-the-Art and Future Challenges
events in the southern Hellenic arc. They tried to draw arelation between the seismic frequency and the occurrence ofhigh magnitude seismic events. The smaller seismic eventsaccumulate energy in the earth’s crust, and a series of theseevents leads to a high magnitude seismic event. There werefour inputs to the fuzzy system, which were related to themean seismic rates and duration between two seismic eventshaving a magnitude greater than 5.9. In a fuzzy network,the number of neurons depends on the input and number ofmembership functions. The proposed fuzzy network workedin a similar way of the feed-forward network where weightwas updated based on the difference of actual output andexpected output. They trained the NFM for 20 epochs, wherethe error was ideally zero. There was only one output neuronthat provided the date of the next big seismic event.
Dehbozorgi and Farokhi [51] proposed a neuro-fuzzy clas-sifier for predicting short-term earthquakes using seismogramdata five minutes before the earthquake. The equal num-ber of seismogram signals were selected, which have anddo not have an earthquake after five minutes. The selecteddata were from Iranian region and to give them as an inputto the model, they were sliced. The baseline drift of thesignals was removed by the fourth-order Butterworth highpass filter, which normalized the data. Fifty-four featureswere calculated by statistical analysis, wavelet transforma-tion by Daubechies-two methods, fast Fourier transform,entropy calculation, and power spectral density calculation.There were sixty rules for the NFM, which was comparedwith a multi-layer perceptron (MLP) with two hidden layershaving thirty neurons. After training, the feature selectionwas performed using the UTA algorithm which replaces afeature with the mean value of that feature and measures theperformance. If the performance decreases, then the featureis considered as an important one. This feature selectionprocedure improved the base model.
ANFIS is a very popular model among the earthquakeprediction researchers as many models were developed basedon them [52]–[57]. Zeng et al. [52] proposed an adaptivefuzzy inference model to predict epicentral intensity. Theyused the magnitude and depth of hypocenter as input to themodel, and the model provided the intensity of hypocenter asoutput. The data from the Sichuan province of China from theyear 2004 to the year 2015 were used for this study. They alsocalculated the mean of the magnitudes and variance of thesubstantial magnitudes. The membership function was ridgeshaped, and the membership degree was one as the mean wasin the center, and the variance was the same as the width. Thesamples were classified according to the magnitude Ai andthe depth of hypocenter Bj. Then they calculated the mean ofmagnitude, depth, and epicentral intensity. When there wereless than three samples, the mean of epicentral intensity wasadjusted by using the growth rate.
Andalib et al. [53] came up with the idea of using a Fuzzyexpert system for solving the problem of predicting timebetween two earthquakes and their distance of occurrence.Sugeno type ANFIS was used for this purpose. The data
were collected from the Zagros earthquake catalog and usedfour parameters as input to the inference system. The inputparameters were the magnitude of two earthquakes, timedistance, and geographical distance. The knowledge of thehuman experts were used to generate the rules for the ANFISas this model tries to replicate the performance of the humanexperts. Expert opinion was used to fuzzify the crisp inputsas well. Based on the rules of the FIS the crisp outputswere generated which was the prediction of an earthquakebefore 6 months. This model considered the most powerfulearthquake in the area and compared it with a magnitudethresholdM and distance Nmiles. The value of N andMwereoptimized for the prediction.
Shodiq et al. [54] came up with the idea of using acombination of automatic clustering and ANFIS for earth-quake prediction. The proposed model involves pre-processing, automatic clustering, and ANFIS. Automaticclustering used hill climbing and valley tracing for finding theoptimum number of clusters, and for the clustering betweenzones, the K-means algorithm was used. The data wereclustered in seven zones. They selected the magnitude ofcompleteness as 5.1 Mw. In the ANFIS portion, seismicindicators were calculated and normalized within a rangeof 0.1 to 0.9. The ANFIS model used a Sugeno model havingfive layers consisting of adaptive nodes and fixed nodes.They have used data of Indonesia from the year 2010 to theyear 2017. The ANFIS used 2 Gaussian membership functionto get the membership degree. The model was trained with100 epochs to predict the occurrence and non-occurrence ofan earthquake.
Kamath and Kamat [55] tried to predict the magnitudeof the next earthquake using ANFIS. Here the ANFIS hadfive layers, and the Takagi Sugeno type FIS was used. Datafrom Andaman and Nicobar Island was used for training andtesting purposes. While clustering, they checked SC and gridpartitioning (GP) for building the initial FIS. They chose Tri-angular and Gaussian shapes for input membership function.The parameters of the membership functions were optimizedusing BP and hybrid algorithms. The SC performed best with8 fuzzy rules and 70 neurons, which varied the influence andsquash factor. The model was trained for 50 epochs, and thesquash factor was selected as 1.25 for the training process.Pandit and Biswal [56] proposed ANFIS with GP and SC forpredicting the magnitude of an earthquake. Ground motionsof 45 earthquakes from the USA, Canada, Japan,Mexico, andYugoslavia were selected as a dataset. In GP, a uniformly por-tioned grid with defined membership functions and param-eters were generated to produce an initial FIS. In SC, eachdata point was selected as a cluster center according to thesurrounding data point’s density and found out the formand an optimum number of fuzzy rules. Triangular member-ship function was used to generate the membership degree.Hybrid optimization and BP were used for training usingMATLAB GUI.
Mirrashid [57] proposed ANFIS for the prediction of theearthquake over the magnitude of 5.4. Earthquake catalog
14 VOLUME 8, 2020

M. H. A. Banna et al.: Application of AI in Predicting Earthquakes: State-of-the-Art and Future Challenges
TABLE 2. A summary of used algorithms and features by rule-based earthquake prediction approaches.
from the year 1950 to 2013 in the Iranian region was used asa dataset. The dataset had different magnitude scales whichwere converted to the moment magnitude scale. They usedseismicity indicators as input to the model and normalizedthem between 0.1 and 0.9. Generally, the seismicity indica-tors are elapsed time (te), mean magnitude (Ae), earthquakeenergy (Ee), slope of magnitude (dB) ( dAedt (dB)), mean squaredeviation (1e), meantime (te), magnitude deficit (δAe), andcoefficient of variation (ρ). The ANFIS that they proposedwas the Sugeno type five-layer model, which is composedof BP and least square estimates. GP, SC, and fuzzy c-meanalgorithms were used along with ANFIS. The GP model useda predefined number of membership functions to divide thedata spaces into rectangular sub-spaces. The SC algorithmcalculated the potential of each data point for being the clustercenter. The unsupervised FCM learning algorithm consideredeach data to be part of all classes.
Bahrami and Shafiee [58] proposed a fuzzy descriptormodel with a generalized fuzzy clustering variety (GFCV)algorithm to forecast earthquakes in Iran. Linear descriptorsystems and fuzzy validity functions were used to divide theinput space of a fuzzy descriptor into linear sub-spaces. Thenormalized Gaussian type functions were used as validityfunctions. This model is an extension of the Takagi-Sugenofuzzy model. The linear system descriptors and validity func-tions were adjusted using the GFCV algorithm, which calcu-latedMSE and stopped the system’s trainingwhen it started toincrease. They have used 560 seconds of seismograms signalof an earthquake sampled at 50 Hz.The model used 7 neuronsand was trained for 7 epochs only to produce a better resultthan other fuzzy descriptor algorithms.
Table 2 summarizes the used algorithms and thefeatures of the studies that used rule-based predictionapproaches.
B. SHALLOW MACHINE LEARNINGIn shallow ML, there are classical ML approaches, clus-tering approaches, and NN-based approaches. The classicalML algorithms such as SVM, SVR, KNN, RF, DT, etc.,use handcrafted features for prediction of an earthquake.As they cannot generate feature themselves, feature selectionis an essential aspect of this prediction process. Fig. 9 showsa basic diagram of these algorithms classifying earthquakeevents. This section will be divided into two categories tokeep similar studies under the same hood. The categoriesare- earthquake and aftershock prediction studies for shal-low machine learning-based techniques, and earthquake’scharacteristics studies for shallow machine learning-basedstudies.
1) EARTHQUAKE AND AFTERSHOCK PREDICTION STUDIESIn this portion, the studies that performed earthquake andaftershock prediction are studied. Earthquake magnitudeprediction, time of occurrence prediction, location predic-tion, earthquake detection, aftershock prediction, and energyprediction-based studies are discussed in this portion.
Jiang et al. [59] tried to predict the most significant annualmagnitude of the earthquake in China synthetically. Differ-ent seismic precursors such as stress, water level, hydro-chemistry, gravity were collected for the north region ofChina, and Beijing. Their choice of the algorithm was SVM,and they have selected twelve seismic precursors as features.The SVM algorithm maps the sample space into a highdimensional Eigenspace with the use of nonlinear functions.Since seismic events are very nonlinear, SVM helps in pre-dicting them accurately. The SVM model used the polyno-mial kernel function and tried to optimize the value C, whichis the punishment of samples for which the error is morethan ε. The suitable value for ε was found to be 0.6707.
VOLUME 8, 2020 15

M. H. A. Banna et al.: Application of AI in Predicting Earthquakes: State-of-the-Art and Future Challenges
FIGURE 9. Earthquake prediction process of classical ML approaches. First, the earthquakeparameters are preprocessed to remove missing values. Then features are calculated fromthem. Selected features are fed to the ML algorithms to provide an output. Based on theperformance, the hyperparameters of the algorithms are changed.
Astuti et al. [60] proposed a method to predict earthquakelocation, magnitude, and time using singular value decompo-sition (SVD) and SVM. They have used the earth’s electricfield signal as input to the model. They have used data fromGreece for the year 2003 to the year 2010. In the preprocess-ing stage, the E-W and N-S pole field values were squaredand summed, and then their root was calculated. The Gfdiffwas calculated from the input signal, whichwas the differencebetween the nth sample and (n-1)th sample electric field. Thepeak from the Gfdiff was calculated, and the slope to the nextday’s peak was captured. For feature extraction, first SVDwas applied for orthogonal transformation, and segments ofGfdiffs of 180 samples were separated. The LPC coefficientswere found using the Levinson-Durbin algorithm. Then thefeatures were used as input to the SVM classifier, where ahyperplane was determined to separate the data into differ-ent classes. The optimization was done using the Lagrangemultiplier, and for nonlinearity, kernel functions were used.
Hajikhodaverdikhan et al. [61], proposed an SVR modeloptimized by particle filter to predict mean magnitude andnumber of earthquakes in the next month in Iran. They haveevaluated 30 precursors for this study. In SVR, the modelsearches for a hyperplane that can separate the dataset intodifferent portions based on classes. Particle filters estimatethe state of a linear system and convert it to have some ran-domness in the presence of noise. SVR has some parameterslike C, ε, and kernel scale. When C value increases, the gen-eralization of that model decreases, but error performanceincreases. ε represents loss function whose lower value isdesired, but if it is zero, than there may be some overfittingpresent. In this model, Gaussian RBF was used as a kernelfilter. These three parameters were selected using the particlefilter by calculating probability density function with particleweights. The kernel width, C, and ε are the parameters thatwere optimized by the PSO to improve performance of SVR.
Huang et al. [62] proposed a hybrid algorithm of SVR andNNs to predict earthquake over magnitude five in Hindukush,Chile, and South California. The cutoff magnitude for Hin-dukush, Chile, and South California are 2.6M, 3.4M, and4.0M, respectively, which are calculated from the GR-curve.They have calculated 60 parametric and non-parametric fea-tures. The maximum-relevance-and-minimum-redundancyfeature selection technique was used for each region, and
separate features were selected for a different region. Basedon the features, the input vector was given to the SVRmodel. The output was used as the input of the LM-NN.The weights were passed to the Quasi newton network andfrom that to the Bayesian regularization NN. With each NNto escape local minima, an enhanced PSO was used. MCCwas chosen as optimization criteria for PSO. It optimized thehyper-parameters of SVR to increase its efficiency.
Li and Kang [63] proposed a hybrid algorithm of KNNand Polynomial regression (PR) to predict the aftershock ofan earthquake. The time intervals of aftershocks were theconditional attribute, which was converted to seconds, andaftershock magnitude was the decision attribute. They havecollected the time intervals of the earthquake aftershocksof the Wenchuan region of China. The shortest distance ofa sample to other samples was calculated using Euclideandistance, and these values were sorted to find K neighbors.The decision attributes were modeled by PR, calculating theleast square estimation of the coefficient vector. Then themodel was compared with the regular KNN and distanceweighted KNN based on absolute error (AE) and RE.
Prasad et al. [64] proposed a seismic wave-based earth-quake detection method that used Haar Wavelet transforma-tion (HWT) for denoising purposes. They collected seismicsignal of 140 earthquakes from different sources. These datawere de-noised using HWT. The next step was to apply afast Fourier transformation spectrum analysis to calculate theenergy and frequency of the concerned signal. Using thisenergy E of the signal, the magnitude M was calculated withthe formula Eq. (6) [65].
M = |(logE − 11.8)/1.5| (6)
If the magnitude was greater than three, then it was calledan earthquake. These data were then selected as a datasetfor different ML algorithms, such as- RF, Naïve Bayes (NB),j48, REP tree, and BP.
Sikder and Munakata [66] tried two algorithms that arerough set and DT for identifying their performance in pre-dicting an earthquake. They have used fifteen attributesrelated to Radon concentration and climatic factors. For theRough set, the decision table was generated with these fifteenattributes. They used 155 records of weekly geo-climaticconditions regarding earthquake. Then approximation of each
16 VOLUME 8, 2020

M. H. A. Banna et al.: Application of AI in Predicting Earthquakes: State-of-the-Art and Future Challenges
FIGURE 10. Earthquake prediction process using clustering approaches. The processed seismic dataare given as input to the clustering layer, which divides them into different clusters. For example,here, Cluster 1, Cluster 2, and Cluster 3 are three clusters calculated from the seismic data. Eachcluster is classified using different versions of the classification algorithm based on theircharacteristics, which produce the desired output.
decision class was constructed considering all the conditionalattributes. They have used the discernibility matrix algorithmto find the smallest subset of attributes that represents thedata. 440 reducts were found with whom fifteen decisionrules were made using the learning from example, module 2algorithm. For the DT algorithm, tree-building was doneusing the C4.5 learning scheme. For both cases, the modelwas validated using leave one out cross-validation method.
Marisa et al. [67] tried to predict the probability of thenumber of earthquakes in 15 days period in Sumatra. First,the earthquakes with a magnitude greater than 4.9 anddepth less than 70 km were selected. They collected earth-quake catalog of Sumatra island from the year 2008 to theyear 2018. Then the variance value and average value werecalculated. The variance value was 3.463, which was higherthan the average value of 1.676. This indicated that therewas oversampling. Hence, they should have used a Pois-son mixture model, but the earthquake data showed auto-correlation. So, they selected Poisson Hidden Markov Model(PHMM). The model parameters were selected using theExpectation-Maximization (EM) model and parameters withtwo, three, and four hidden models were selected. With themodel, they predicted the earthquakes for 2017 and 2018,compared them with the actual prediction, and used thechi-square test for validation.
In clustering-based studies, first, the study area is dividedinto different clusters. The data which are of the same qual-ity and characteristics are clustered in a group. Based onindividual clusters, the decision making process changes.Fig. 10 shows this process of clustering, leading to earthquakeprediction.
Florido et al. [68] proposed a clustering-based model forthe prediction of an earthquake in Chile. First of all, in the
preprocessing stage, they removed all the foreshock and after-shocks from the dataset. This is done to get only the main-shocks. They collected data for Talca, Pichilemu, Santiago,and Valparaiso region for this study. Then they calculated theb-value, magnitude, and time of occurrence to get the datasetprepared. For calculating the b-value, 50 earthquakes with amagnitude of more than three were used. Then they used theclustering algorithm to make clusters that need the optimumvalue of the number of clusters. Silhouette index was used toget the value. Then using Euclidean distance for the K-means,the clusters were defined. For earthquakes with a magnitudeof more than 4.4, patterns were searched, which can be usedfor predicting future earthquakes.
Florido et al. [69] have used a tree-based algorithm thatused exhaustive search for predicting an earthquake in sevendifferent datasets. They used an earthquake catalog to gen-erate a propositional dataset which has Gutenberg-Richterparameters to predict the earthquake with the highest magni-tude. They have collected earthquake catalog of Chile, IberianPeninsula, and Japan for this study. From this dataset, fortraining purposes, clustering and groupingwere done. For thisgrouping, the number of clusters (K) and the length of thepattern (A) were used. With exhaustive searching, the bestcombination of A and K was obtained. Then a tree of theprecursors was extracted, and patterns were captured usingthe best precursors from each sub-tree. Based on these proce-dures, an earthquake of the next day was predicted.
Hierarchical K-means algorithm was used by Shodiq et al.for researches [70]–[71]. Shodiq et al. [70] proposed a spatialanalysis and automatic clustering-based technique to predictearthquake’s time period. They collected earthquake datafrom the year 2004 to the year 2014 for the Indonesian region.At first, they collected data, normalized, and vectorized it.
VOLUME 8, 2020 17

M. H. A. Banna et al.: Application of AI in Predicting Earthquakes: State-of-the-Art and Future Challenges
Then they used the valley tracing technique. They calculatedthe accuracy of clustering and found that six clusters can opti-mally separate the data. Then hierarchical K-means cluster-ing is done where centroid K-means outperformed the otherK-means. Then the probability is calculated using Eq. (7).
P(M ,T ) = (1− e−N (M )T ) (7)
where P is the probability of an earthquake with magnitudeMand time period T, and N(M) is index seismicity. Then theydivided the dataset into learning samples and testing samples.
Shodiq et al. [72] also proposed an automatic clusteringand ANN-based method to predict an earthquake of magni-tude higher than 5.5 within 5 days of the occurrence of anearthquake. They have collected information about 82,580earthquakes in the Indonesian region from the year 1910 tothe year 2017. At first, they preprocessed the dataset andprepared the dataset for clustering. The optimum number ofclusters was obtained using valley tracing and hill-climbingalgorithms and then clustered the data using the K-meansclustering algorithm. Then they sub-clustered the seismicparameters and calculated the input parameters. There wereseven input parameters, and five of them were obtainedusing the Gutenberg-Richter law. Then a NN consisting ofseven input neurons, two hidden layers where each layer hadthirty-two neurons, and one output was used to predict theearthquake. They performed 100,000 training iterations witha learning rate of 0.01 to the BP algorithm.
Shodiq et al. [71] proposed a hierarchical K-means clus-tering algorithm for predicting aftershocks of earthquakeswithin five days. The earthquakes of magnitude greater orequal to 5.1 were selected for calculating seismicity param-eters. This research used earthquake catalog of 1910 to2017 for Indonesia by the BMKG andUSGS repositories. Forclustering the data based on epicenter parameters, the firstvalley tracing and the hill-climbing algorithm were usedto find the optimal number of clusters which analyzed themoving variance of the clusters and used it to find local andglobal minima. The optimal cluster number was six. Thenhierarchical clustering was used for clustering the data intosix clusters. An NN was used to predict aftershocks. Thenumber of hidden layers and neurons was found by trialand error. The best combination had two hidden layers, withthirty-two neurons in each, having a learning rate of 0.1.This model performed better for earthquakes with a highermagnitude than 6.
Mejia et al. [73] used the Dobrovolsky clustering andKannan-Mathematical model for predicting earthquakes witha magnitude of more than 3.9 in the Philippines. The data forearthquakes in the year 2011 to the year 2013 were collectedfor this research. Since there are many fault lines in this area,the earth’s electric field was used to cluster the area. To findthe radial area, Dobrovolsky-Megathrust equation was used.The epicenter of the megathrust was found using the latitudi-nal cluster’s geometrical center. Then Kannan-Mathematicalmodel was applied, which is based on the spatial connectiontheory. According to this theory, the earthquakes in the same
fault line are connected historically. So, they calculated thePoisson range identifier (PRI) in this work. Poisson distri-bution was used to calculate distance factors. The distancefactor and recursive Poisson distribution were used to predictan earthquake.
Tan and Cai [74] proposed an agglomerative hierarchicalclustering (AHC) based earthquake prediction algorithm thatcan reduce the effect of an imbalanced dataset. They ana-lyzed the earthquake events in the Yunnan Region between1970 and 1998, and they only took the events whose magni-tude was greater than 3.5. They found that positive classesare in very fewer numbers compared to negative classes,which make the dataset imbalanced. They imposed the AHCmethod, which was proposed by Cohen to oversample posi-tive class and then applied Biased SVM for classification pur-poses. AHC constructed the dendrogram using single linkage,group average or multiple linkage algorithm and calculatedcentroids from all the clusters. The centroids were joined withthe minority samples and dealt with the data imbalance.
Lu et al. [75] proposed a GA-based clustering algorithmto predict the location and timing of earthquake aftershocks.They have used seismographs of Southern California andJapan, which was used to create a directed graph. The correla-tion between each nodewas calculated, which represents rela-tion tremors and time-stamps of two points. The connectionweights were converted to one or zero based on whether therewas a connection between the two points or not. After doingclustering on this directed graph using a GA, a central pointwas found, which was the epicenter of the main earthquake.From here, some sub-clusters can be found, which reoccurredin different places of the graph. A regression algorithm wasused to predict future re-occurrence of the aftershocks.
Shao et al. [76] proposed an ant-colony clustering (ACC)-based method for earthquake prediction. At first, theyselected the duration of 14 different anomalies and classi-fied them into seismological and precursory anomalies. Thenumber of anomalies was also considered as input. Theyclassified the magnitudes into three groups and the ACC wasdone. In the ACC, an ant calculates its similarity among itsneighborhood and decides whether to make a cluster withit or not. The agent can change the similarity and exertits influence in clustering. The parameters they used wereα = 0.8, k + = 0.8, and k− = 0.2 for the optimized model.Zhang et al. [77] proposed a PSO based clustering tech-
nique to predict earthquake and compared the proposedmodel with a model using the K-means clustering tech-nique. PSO has fewer parameters and can solve multi-domainand nonlinear problems. In the research work, 14 differentabnormal indices were considered for earthquake predic-tion. This research tried to find a connection between theearthquake magnitude and precursors such as short levelling,belt, and seismic gap. At first, they normalized the data toremove the dimensional effect. Then parameters were ini-tialized automatically, and the PSO algorithm was appliedto it. Then an evaluation function was designed. They setthe number of particle swarms to 500, α = 0.8, k+ = 0.8,
18 VOLUME 8, 2020

M. H. A. Banna et al.: Application of AI in Predicting Earthquakes: State-of-the-Art and Future Challenges
TABLE 3. A summary of used methodologies and features by the earthquake prediction researches that included classical ML and clustering techniques.
k− = 0.2 for finding optimized output. Table 3 showsthe research methods and used parameters by the classicalML-based and clustering-based researches.
The NN-based methods for prediction of earthquakes usean architecture that consists of weights, biases, connections,and neurons. In each neuron, there is an activation functionthat is connected to links from the previous layer. This acti-vation function fires when the value of the input is higher thanthe threshold of the activation function. An error is calculatedusing the predicted output and actual output. Some optimiza-tion function try to minimize the error value by updatingthe weights and biases of the network to achieve the finaloutput. Fig. 11 depicts this process of output generation bya NN-based model.
ANN-based researches are used in many cases for predic-tion of earthquake [78], [79]. Alarifi et al. [78] tried to findout the best feed-forward NN for prediction of an earthquake.After collecting data from the earthquake catalog of the north-ern Red Sea area, first, they filtered the noise from the dataand then reformatted the location parameter with 16 × 16tallies. This reduced the possibility of different locationsby 99.84%. They calculated different statistical features onthe different features. They calculated earthquake sequencenumber, tile location, earthquake magnitude, and the depthof source to use them as features. Then they tried differentdelays, the number of hidden layer neurons, and activationfunctions and calculated MSE and MAE to find the bestcombination. The best combination was found with a delayof three. The number of hidden layers was two. The firsthidden layer had three neurons, the second had two, and theactivation function is Tansig.
Reyes et al. [80] proposed a NN-based model that couldpredict earthquakes more than a specific threshold five daysbefore the earthquake in Chile. Since Chile is a country with a
large area and the seismicity of different areas does notmatch,they divided the country into six different regions basedon Kohonen-self organized map. Among them, four cities(Talca, Pichilemu, Santiago, and Valparaiso) were selectedfor analysis using four different ANNs. All four ANNs hadthe same structure, but the weights were different. The inputlayer of the ANN had seven inputs, and the hidden layerhad fifteen neurons. The learning was done using BP witha sigmoid activation function. The model was then comparedwith SVM, KNN, and K-means algorithm based on zero levelhit, one level hit, Sp, and Sn.
Morales-Esteban et al. [81] proposed an ANN for pre-diction of earthquake magnitude greater than a threshold orbetween some range in the area of the Alboran Sea andAzores-Gibraltar Fault. For training the model of the Alb-oran Sea, data from December 2004 to May 2005 wereused whereas for Azores-Gibraltar earthquakes. data fromJuly 2003 to June 2005 were considered. For this model,as the dataset behaves like episodes of events, no preprocess-ing was done. They used a three-layer feed-forward networkwith a BP learning algorithm. The hidden layer has seveninputs and fifteen neurons. Hence, the number of neuron con-nections was 122. The model was trained with 300 epochs,and the activation function was sigmoid shaped.
Moustra et al. [82] used time-series magnitude and SES forprediction of the most significant seismic event in the nextday. They used data of Greece for the year 1980 to the year2001. First, they used a three-layer perceptron model witha learning rate of 0.4, a momentum of 0.8, and the optimalwidth of time moving window before the concerned day was30 days. The outliers of the data were the seismic events,which had a magnitude greater than 5.2. Next, they used onlythe outliers for training all the data. Afterwards, they usedseismic signals calculated by the VAN team, which had only
VOLUME 8, 2020 19
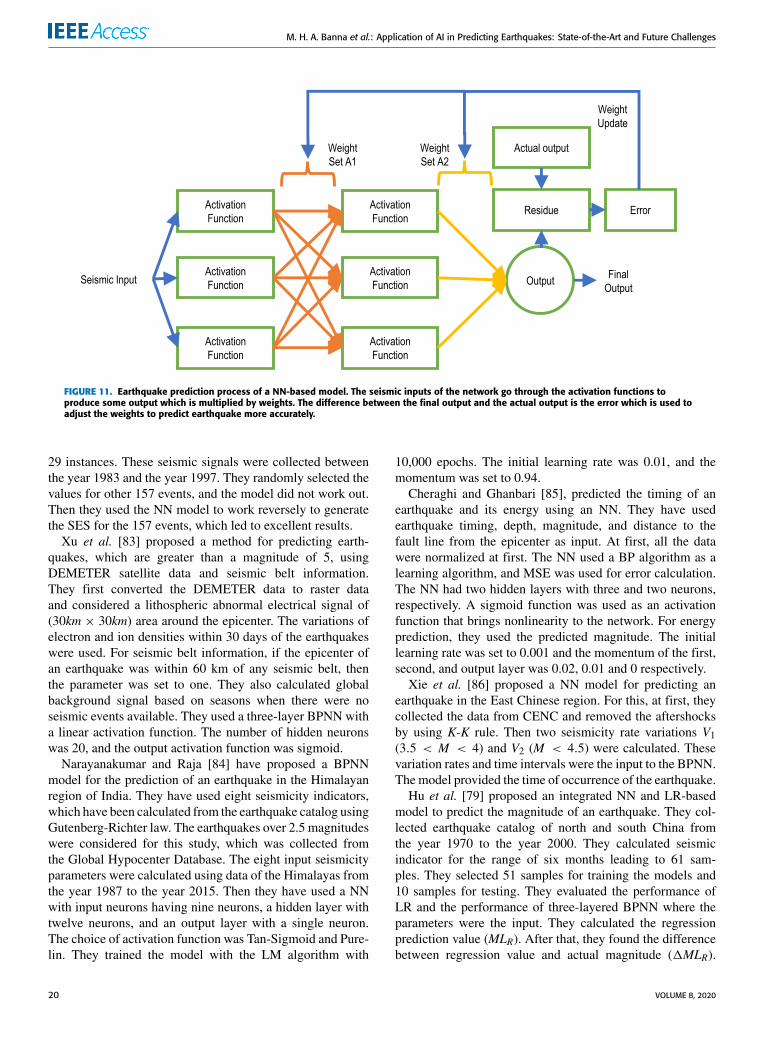
M. H. A. Banna et al.: Application of AI in Predicting Earthquakes: State-of-the-Art and Future Challenges
FIGURE 11. Earthquake prediction process of a NN-based model. The seismic inputs of the network go through the activation functions toproduce some output which is multiplied by weights. The difference between the final output and the actual output is the error which is used toadjust the weights to predict earthquake more accurately.
29 instances. These seismic signals were collected betweenthe year 1983 and the year 1997. They randomly selected thevalues for other 157 events, and the model did not work out.Then they used the NN model to work reversely to generatethe SES for the 157 events, which led to excellent results.
Xu et al. [83] proposed a method for predicting earth-quakes, which are greater than a magnitude of 5, usingDEMETER satellite data and seismic belt information.They first converted the DEMETER data to raster dataand considered a lithospheric abnormal electrical signal of(30km × 30km) area around the epicenter. The variations ofelectron and ion densities within 30 days of the earthquakeswere used. For seismic belt information, if the epicenter ofan earthquake was within 60 km of any seismic belt, thenthe parameter was set to one. They also calculated globalbackground signal based on seasons when there were noseismic events available. They used a three-layer BPNN witha linear activation function. The number of hidden neuronswas 20, and the output activation function was sigmoid.
Narayanakumar and Raja [84] have proposed a BPNNmodel for the prediction of an earthquake in the Himalayanregion of India. They have used eight seismicity indicators,which have been calculated from the earthquake catalog usingGutenberg-Richter law. The earthquakes over 2.5 magnitudeswere considered for this study, which was collected fromthe Global Hypocenter Database. The eight input seismicityparameters were calculated using data of the Himalayas fromthe year 1987 to the year 2015. Then they have used a NNwith input neurons having nine neurons, a hidden layer withtwelve neurons, and an output layer with a single neuron.The choice of activation function was Tan-Sigmoid and Pure-lin. They trained the model with the LM algorithm with
10,000 epochs. The initial learning rate was 0.01, and themomentum was set to 0.94.
Cheraghi and Ghanbari [85], predicted the timing of anearthquake and its energy using an NN. They have usedearthquake timing, depth, magnitude, and distance to thefault line from the epicenter as input. At first, all the datawere normalized at first. The NN used a BP algorithm as alearning algorithm, and MSE was used for error calculation.The NN had two hidden layers with three and two neurons,respectively. A sigmoid function was used as an activationfunction that brings nonlinearity to the network. For energyprediction, they used the predicted magnitude. The initiallearning rate was set to 0.001 and the momentum of the first,second, and output layer was 0.02, 0.01 and 0 respectively.
Xie et al. [86] proposed a NN model for predicting anearthquake in the East Chinese region. For this, at first, theycollected the data from CENC and removed the aftershocksby using K-K rule. Then two seismicity rate variations V1(3.5 < M < 4) and V2 (M < 4.5) were calculated. Thesevariation rates and time intervals were the input to the BPNN.The model provided the time of occurrence of the earthquake.
Hu et al. [79] proposed an integrated NN and LR-basedmodel to predict the magnitude of an earthquake. They col-lected earthquake catalog of north and south China fromthe year 1970 to the year 2000. They calculated seismicindicator for the range of six months leading to 61 sam-ples. They selected 51 samples for training the models and10 samples for testing. They evaluated the performance ofLR and the performance of three-layered BPNN where theparameters were the input. They calculated the regressionprediction value (MLR). After that, they found the differencebetween regression value and actual magnitude (1MLR).
20 VOLUME 8, 2020

M. H. A. Banna et al.: Application of AI in Predicting Earthquakes: State-of-the-Art and Future Challenges
Next, the BPNN took 13 parameters as input: six seismicparameters, six cosmological parameters, and the differencebetween actual magnitude and regression magnitude. Theyset the number of neurons in hidden layers to 25, and theoutput layer provided the predicted deviation (1MLN ). Thefinal estimated output was calculated using Eq. (8).
MLRN = MLR +1MLN (8)
Some of the earthquake researches are based on LM algo-rithm [32], [87], [88]. For instance, Zhou and Zhu [87] pro-posed an LM-BP based model to predict the magnitude of anearthquake. Usually, BP models face problems such as slowlearning and can not find the global minima. LM algorithmcan solve this problem. This model converges to the goalat a faster speed and significantly reduces the problem ofnot reaching global minima. They proposed this model tohave one input layer with seven inputs, one hidden layer withsixteen neurons, and one output layer. They tried differentcombinations of hidden layer neurons for achieving the goal.The S-tangent transfer function was used as an activationfunction for the hidden layer, and S-logarithmic was used foroutput layer.
Kulahci et al. [32] proposed a three-layer feed-forwardNN algorithm for earthquake prediction using the monitoringof Radon gas concentration. Data have been collected fromthe Turkish-Arabian fault boundary, where Radon started toconcentrate from 2004. They have used eight parametersthat are related to Radon concentration and soil tempera-ture. By using statistical analysis, they saw that two-third ofthe attributes are essential, and they must be used in everycase. The model uses gradient-descent for weight update andLM algorithm for BP procedure as it converges fast. Thetransfer function used for the input layer to the hidden layerwas tangent sigmoid function, and the hidden layer to theoutput layer is the Purelin function. To avoid overfitting,automated training-testing was used while training where thetraining process halts at some random time to check error.
Ma et al. [88] proposed a BP-basedmodel using the param-eters from the DEMETER satellite for prediction earthquakebefore thirty days. The DEMETER satellite provides dataof seismic electromagnetic radiations like ion and electrondensities, and temperatures. When there is no earthquakedistribution of wave intensity, they called it background,which gets affected by environmental parameters. To predictan earthquake, they removed the background from the signal.Then they used it as input to the three-layer perceptronmodel.The LM algorithm was used for learning as it works fast.The MAE was used for error calculation, and the activationfunction was sigmoid to add nonlinearity. The validationof the model was performed based on the seismic eventshappened in the year 2008.
Hu et al. [89] have used a hybrid algorithm of linear regres-sion (LR) and BP to predict earthquakes in three months ofrange. The study area for this research was Beijing and theycollected earthquake catalog of the year 1990 to the year2003. They converted the different earthquake magnitude
scales to the Richter scale value. They have used five seismicparameters and two-time varying parameters for training themodel. First, LR was used to calculate MR (regression pre-diction value) based on the seismic parameters. Then 1MRwas calculated as 1MR = MA − MR, where MA is theactual magnitude of the earthquake. After that, BP was usedto predict the magnitude of the earthquake, which is 1MN .Then they integrated both the models, and the final output ofthe integrated model (MI ) was calculated using Eq. (9).
MI = MR +1MR (9)
Zhou et al. [95] proposed a NN and an SVM model topredict the magnitude of seismic events. They also showedthat the combination of these two algorithms performed bet-ter than they performed independently. They collected dataaround the world from the year 1999 to the year 2016 andselected latitude, longitude, and focal depth as training factorsand magnitude as testing factor in achieving data reduction.They trained the SVM model with a linear kernel, and thecost function of the violation was set to 10. They also trainedan error inverse propagation-based NN with 5000 iterations.They combined the result using Eq. (10).
γ = αy1 + (1− α)y2 (10)
where y1 and y2 is the prediction result of SVM and NN,γ was the final result, and α was set to 0.5.Suratgar et al. [96] proposed a NN-based solution for
prediction of earthquake magnitude. They used data of Iranfrom the year 1970 to the year 1976 for simulation purposes.They considered the absolute value of declination and hor-izontal geomagnetic field in this prediction. 5 parametersof 9 days were used as input to the two-layered nonlin-ear auto-regressive networks with exogenous input (NARX)algorithm. NARX is a recurrent dynamic network. For errorcorrection of the weights, the LM algorithm was used, whichwas modified by the Gauss-Newton method.
Rafiei and Adeli [97] predicted earthquake magnitudeusing neural dynamic classification algorithm and the loca-tion of it using an optimization algorithm named neuraldynamic optimization of Adeli and Park (NDAP). Based ona time resolution of one week, the time lag number wascalculated with a magnitude threshold of 4.5, 5.0, 5.5, 6.0,and 6.5. 8 seismicity indicators of an earthquake were calcu-lated using the earthquake catalog. They collected earthquakecatalog of 1932 to 2016 for the southern Californian regionand calculated features for a range of half months. Therefore,the number of feature vectors for each year was 24. TheNDC network had five layers that are an input layer, featurevector representation layer, pattern layer, summation layer,and output layer. The input feature vector was transformedinto a 3-dimensional feature vector twice in the second layerof the network. The transformation parameters are optimizedusing the NDAP algorithm. In this network, if the predictionof magnitude is larger than the threshold value, only then thelocation is predicted using the NDAP algorithm.
VOLUME 8, 2020 21
M. H. A. Banna et al.: Application of AI in Predicting Earthquakes: State-of-the-Art and Future Challenges
Majhi et al. [99] proposed a functional linkANNoptimizedby the moth flame optimization (MFO) algorithm to predictthe magnitude of an earthquake. The FLANN has no hiddenlayers where some nonlinear function obtains nonlinearity.They have used regular BP, least-square optimization, Gra-dient descent, and LM-BP and MFO algorithm as a learningalgorithm to see which one works better. These algorithmswere used to find the optimal weights of the model. First,earthquake data with a magnitude greater or equal to 5.5 wasselected. After that the time and date attributes were com-bined as one attribute. All the attributes were normalized andthen expanded. Five seismicity indicators were calculated andthen expanded using 7 different nonlinear functions. Finally,the model was trained with them.
Zhang and Wang [34] proposed a combination of a GAand BPNN model for earthquake prediction. They imposeda GA to obtain better convergence and to avoid local minima.They considered 17 groups of input-output data for this study,where 14 groups were used for training the model. Theyused 7 features that were calculated from the dataset. Thesefeatures were the input to the BPNN. The architecture of theBPNN had a hidden layer with 15 neurons and an output layerwith 1 neuron. There were around 136 connections; amongthem, 105 connections were between input and hidden, and15 connections were between the hidden and output layer.The weights were updated using the GA. A colony composedof two hundred individuals and twenty sub-colonies was usedto update the weights. The generation gap was 0.8, the inter-crossing rate was 1, the mutating rate was 0.01, the maxgeneration was 500, the rate of migration was 0.2, and theinsertion rate was 0.9. After a set of selection, mutation, andintercrossing, GA erased the lower adapted chromosomes andset the optimal weight for the BPNN connection.
Tao [100] tried to predict long-term earthquakes with highmagnitudes with the use of BP and BP with GA. He con-sidered data from the Himalayan region and Nepal for thisstudy. The data was calculated for 2150 B.C. to 2014 A.D.A three-layer feed-forward network was used where the hid-den layer had 6 neurons, and the activation function wasS-tangent function. The output layer used the S-algorithmactivation function. The steepest descent algorithm trainedthe model. The weights and thresholds of the BP networkwere then obtained using the GA where the maximum gen-eration was 2000, and the size of the population was 10.The mutation rates and cross probability were 0.1 and 0.5,respectively.
Li and Liu [36] proposed a hybrid algorithm of PSO and aBPNN for predicting the magnitude of an earthquake. Theycalculated six features from the earthquake catalog of longi-tude 117 degrees to 120 degrees east and latitude 22 degreesto 26 degrees east. These data were divided into 29 groupsof which first 20 groups were taken for training and restwere used for testing purposes. They have used an improvedPSO algorithm as it is strong in global search at first andbecomes good at local search eventually because of inertiaweight (ω). To improve the PSO, the nonlinear algorithm
function was used as inertia weight, which made it capable ofbeing strong in local search in initial stages as well. This PSOalgorithm was used in optimizing the weights and thresholdsof a three-layer BPNN to make it faster and more effective.The NN had 6 input neurons and 15 hidden layer neurons,which used the Tan sigmoid activation function.
Shah and Ghazali [101] proposed the improved artificialbee colony (IABC) algorithm for training MLP in time seriesearthquake data. They selected the earthquake data of Cali-fornia of the year 2011 for this study. This dataset contained6000 instances, and 70% of the data were used for trainingthe model and rest were used for testing. IABC algorithmreduced the weight areas and used 3 control parameters.In this algorithm, agents divided the food area, and the beessearched for the best weights. Every bee suggested a solutionarea where the best among them were selected using a greedyalgorithm. In this work, the learning rate was 0.6, and themomentumwas 0.5. TheMLPmodel had 2 hidden layers andan output layer. The weights of the model were initializedrandomly, and the IABC algorithm was used to find theoptimized configuration.
Maya and Yu [102] proposed the use of transfer learningand meta-learning in a NN for improving the learning processto predict an earthquake. Transfer learning and meta-learningare capable of increasing the speed of convergence in the NN.They at first trained a simple MLP consisting of a hiddenlayer with 10 neurons and one output layer where the learningrate was 0.155. This method was proved to be inconvenient.Then they made the same prediction by using the fusion ofMLP and SVM with only 100 iterations. This time, the per-formance was improved than the previous MLP, but the delayelements were more significant than expected. They intro-duced transfer learning by choosing the last weights as initialweights of the newmodel, and the combination ofMLP,meta-learning, and transfer learning improved the performance ofMLP with a less amount of time.
Liu et al. [103], proposed an ensemble procedure ofRBFNN called CERNN for earthquake prediction. Here,the number of neurons in hidden layers and the number oftraining epochs were determined automatically. They haveused 14 earthquake precursors as input to the network andgenerated training subsets using a Bootstrap algorithm. Themodel was built by training the RBFNNwith 23 earthquakes.A group of 11 earthquakeswere used for validation, and a sep-arate group of 11 earthquakes were used for testing themodel.The RBFNNwas designed using nearest neighbor clustering.They have trained the RBFNN for a certain amount of timethen they checked if it produces error less than a definitevalue. When the error was minimum than the threshold, it isadded in the CERNN.
RBFNN was successfully used in earthquake predictionresearches [38], [104]–[106]. For example, Wang et al. [38]proposed an RBFNN to predict the earthquake magnitude.They experimented with data of south-west Yunnan province.They selected 7 different factors such as accumulationof energy, b-value, number of earthquakes, activity cycle,
22 VOLUME 8, 2020

M. H. A. Banna et al.: Application of AI in Predicting Earthquakes: State-of-the-Art and Future Challenges
magnitude, and so on, as input and value of magnitude werenormalized to prevent over-saturation of neurons. They pro-posed a model containing an input layer, a hidden layer, andan output layer. The network output was counter normalizedto achieve actual prediction. For training purposes, 10 sam-ples were used, whereas 7 samples of the earthquake wereused for testing purposes. The result of the RBFNN wascompared with the performance of BPNN.
Amar et al. [106] proposed a BPNN and an RBFNN inpredicting an earthquake. The RBFNN had 3 layers whereoutput is generated based on the linear combination of thehidden layer outputs. Each hidden layer used the RBF func-tion as the activation function. RBFNN showed impressivegeneralization ability, and lengthy calculation was avoided.Parzen windows classification was used to divide the datasetinto different magnitude groups. It divided the dataset intofour classes. Then they trained the model with data fromaround the world of the year 2000 to the year 2011. The dataof the year 2011 was used for testing purposes of the twomodels. The RBFmodel performed better than the vanilla BPmodel.
PNN was used for earthquake prediction in somestudies [3], [107]. For example, Adeli et al. [3] predictedearthquake with a PNN, which can predict class ranges butnot specific values. Therefore, this model can be used formagnitude range prediction but not for time or place of occur-rence of an earthquake. The historical data of 1950 to 1990 ofthe southern California region was used for this study. Theseismicity indicators were calculated for every 15 days of theconcerned data range. They have used 8 seismicity indicatorsas an input vector, which are normalized with RMS values.Themodel consisted of one input layer, a pattern hidden layer,a summation layer, and one output layer. The pattern layercomputed the Gaussian function of the Euclidean distancebetween the input vector and the training vector. It did notuse the learning rate or predefined convergence criteria. TheParzen window classifier was used for PDF calculation andclassification. Huang [107] proposed a PNN model for pre-dicting the magnitude of earthquakes. At first, he calculated8 different seismic indicators, which was given as input tothe PNN model. The PNN model consisted of an input layerhaving 8 neurons, 2 hidden layers named pattern layer andsummation layer, and an output layer. There were 7 differentinput classes which were based on the magnitude of earth-quakes and 7 output classes according to different range ofmagnitude. They have used data from Northern China, and997 feature vectors were used for training this model. Theperformance of each class range was evaluated separately tohave a profound realization of the performance of this model.
Li et al. [109] used an ML approach for distinguishing theearthquakes from seismic data and predicting the arrival timeof primary (P) wave and secondary (S) wave. They collecteddata from 16 seismological stations. The data were in SACformat. At first, they performed some data preprocessingtasks and extracted 6 features from the file header. As eachdata file was around 100 MB in size, data clipping was done
using a trigger picker algorithm, such as recursive short timeaverage or long time average, to capture the seismic event.The signals were also processed using a band-pass filter anddetrend algorithm to remove noise. They used the autoregres-sive (AR) Picker algorithm for estimating the arrival time ofP and S waves. Then different ML algorithms such as SVM,DT, RF, and LRwere used to detect earthquakes and predictedthe arrival time of P and S wave. They also calculated theepicenter using a triangulation technique.
Asim et al. [110] proposed a seismicity analysis for extract-ing features and ML algorithms for prediction of earthquakesin Cyprus where thresholding magnitudes were 3, 3.5, 4,and 4.5. They collected the data from Euro-MediterraneanSeismological Center, which was comprised of around10000 events from the year 1924 to 2018. The aftershockswere removed from the data using de-clustering method-ologies. All the earthquake events below the correspondingthreshold were removed as well. Sixty different seismic fea-tures such as energy release, seismic rate, change of seismicrate, and so on were calculated from the dataset. Then ANN,RF, and SVM were used for prediction purposes. The pro-posed ANN was three-layered, and there were 20 neurons inthe hidden layer where the weights were updated using BP.Radial kernel-based SVM and an RF comprised of 20 deci-sion trees were also used for prediction purposes. This modelcould predict an earthquake for different magnitudes andperiod thresholds.
Asim et al. [111], used seismic indicators and tree-basedML algorithms for predicting an earthquake in Hindukush.The proposed model was capable of predicting earthquakewhose magnitude was greater than 5.0 and which would pos-sibly occur within 15 days. They considered the classificationtask as a binary classification task. At first, they calculated51 different seismic features from seismic data of the pre-vious 50 events. They mainly calculated Gutenberg-Richterslaw, energy release, and seismic rate change using differentprocedures that extracted themaximumpossible features. DT,J48, RF with 20 decision trees and depth of 10, Rotationforest with 8 subsets, RotBoost with 10 iterations were com-pared for binary classification from extracted features. Theyemployed 10-fold cross-validation scheme for evaluating theperformance of the models.
Karimzadeh et al. [112] used ML classifiers along withCoulomb stress change, stress distribution, and fault map topredict the aftershock of the Kermanshah earthquake. Theytreated this problem as a binary classification problem andpredicted the location of aftershock with magnitude greaterthan 2.5. The slip distribution was calculated from a nonlinearand linear inversion process. The Coulomb stress change,which defines the faults and the surrounding faults causedby the earthquake, was calculated using the slip distribution,friction coefficient, and Skemton’s coefficient. A binary gridmap was generated from the geographical coordinates ofthe aftershocks and NB, KNN, SVM, and RBF classifierspredicted whether any aftershock occurred on a specific gridor not. These models simply predicted zero or one for a point
VOLUME 8, 2020 23
M. H. A. Banna et al.: Application of AI in Predicting Earthquakes: State-of-the-Art and Future Challenges
for which Coulomb stress change, slip distribution, and slipdistribution was represented.
Celik et al. [113] proposed an earthquake magnitude pre-diction method based on analyzing the time series and imple-menting ML algorithms. The date, time, depth, location,and local magnitude of 3000 earthquake events in Turkeywere used for this study. The magnitude range of the earth-quakes was between 1 and 5. Auto-correlation, and partialcorrelation of the delay were also considered along withearthquake catalog parameters. LR, DT, Additive Regression,Rap Tree, and MLP were used for comparison of predictionperformance. For forecasting, Weka application was used.The longitude, latitude, depth, and magnitude were predictedby turns. Table 4 shows the summary of the publicationyears, used methods, and parameters for studies that involveNN-based researches.
2) EARTHQUAKE’s CHARACTERISTICS STUDIESIn this portion, the studies that are related to earthquake pre-diction studies but not performed earthquake prediction arediscussed. Earthquakes best set of features, precursors, modelbehavior, explosions, forecasting error reduction, anomalydetection, and earthquake modelling related researches arepresented here.
Martínez-Álvarez et al. [90] tried to use feature selection inpredicting earthquakes. They selected the region of Chile andthe Iberian Peninsula for seismic data. The basis for featureselection was information gain. First of all, they converted theproblem to a prediction problem to a classification problem.Then information gain for each set of features was calcu-lated. They have calculated 16 seismicity indicators based onGR-Law and OU’s Law. Based on that, a rank was given tothe samples. Then seven best features were selected and usedas input to an ANN model. The model’s statistical perfor-mance was calculated next using non-parametric analysis ofvariance, which is also called the Friedman test. This featureselection technique improved the performance of the ANNmodel a lot.
Okada and Kaneda [91] proposed a NN model for find-ing indicators of an earthquake. They collected data fromthe dense oceanfloor network system for earthquakes andtsunamis, which is a multi-channel observatory. Fifteen chan-nels of ocean bottom pressure gauge were taken as input data.The data were normalized between -1 and 1. The NN hasthree layers with a hidden layer having three neurons andone bias. They have used gradient descent for optimizationand BP for learning. For nonlinearity, the hyperbolic tangenttanh activation function was used. From the training data,an output curve was generated, and its trajectory was found.They assumed that this trajectory could be used as a precursorfor an earthquake as it moves back to the normal position afteran earthquake.
Lin et al. [92] tried to find out the optimal numberof neurons in hidden layers of a BPNN to predict earth-quakes. They used the data from Philippines to construct themodel. At first, they created the initial magnitude prediction
BPNN model using two hidden layers with data from theyear 2000 to 2010. The best prediction was achieved using10 neurons for hidden layers and a learning rate of 0.83. Thenthey used an embedded BPNN model with initial weightssame as the previous model and also used the slip rate of theplate so that it can predict data in the future. It was trainedwith data from the year 1990 to 1999 and year 2011 to 2014.Then the initial BPNN was trained with data from the year1990 to 2014 and learning rate 0.33, and had a similar result asthe previous model. They calculated correlation coefficient,standard deviation and MSE for the predicted and the actualmagnitudes on a yearly basis to evaluate the methods.
Lakshmi and Tiwari [93] proposed a nonlinear forecastingtechnique and ANN-based model for earthquake prediction.They used data from the year 1960 to the year 2003 ofthe North-East Indian region. Data with magnitude greateror equal to 4.0 were selected for this study. Initially, theyreconstructed the data into a two-dimensional phase plane touse in nonlinear forecasting. They considered each event asm-dimensional points, and a time delay was also calculatedcomparing with previous events. A neighborhood was chosenfrom the m-dimensional points for which the prediction gotthe smallest simplex. The optimum simplex had theminimumphase volume and vector displacement. They also proposedan ANN approach with one hidden layer and an input layerwith 2 to 10 neurons. They used the LM algorithm for thisanalysis. The output of ANN was the frequency value of thenext month. They set the number of neurons in the hiddenlayer to 10, learning rate to 0.01, and momentum to 0.9 afterthe trial and error process. They also used LR to evaluate themodel where they used the output of the model and the targetoutput.
Niksarlioglu and Kulahci [94] tried to estimate earthquakemagnitude using the change of concentration of Radon gas,the relation of this gas with seismic events, and other envi-ronmental changes. An ANN and clustering were used forachieving this goal. The input to the ANN model was datarelated to Radon gas volume and temperature by which themagnitude of the earthquake is estimated. Next, clusteringwas applied using non-hierarchical clustering, which usesEuclidean distance. The seismic data from the East Anatolianfault was collected for the year 2005 to the year 2010. Theyrecorded 69 earthquakes with magnitude greater than 3. TheANN used LM algorithm for BP operation. For the 3 clusters,this ANN model predicted the magnitude of earthquakes.
Zhao et al. [37] came up with an ensemble algorithmof BP and AdaBoost to differentiate between natural andexplosion-based earthquakes. They used data from the Chinaearthquake science data center, which had 656 samples.Among the samples, 138 of them were earthquakes, and therest were explosion data. This method utilizes some weakBP classifiers to make a strong one. They have used seismicwave signals as input and calculated 27 features from them.The features were then normalized. The weak classifierswere made of only one hidden layer with three neurons,which helps in having excellent generalization capabilities.
24 VOLUME 8, 2020

M. H. A. Banna et al.: Application of AI in Predicting Earthquakes: State-of-the-Art and Future Challenges
TABLE 4. A summary of used methodologies and features used in NN based researches for earthquake prediction.
10 weak classifiers were used to create the proposed clas-sifier, and a comprehensive decision-maker predicted theoutput class based on them. The classifier was then com-pared with principal component analysis (PCA)-SVM andBPNN models.
Fong et al. [98] proposed an extension of the existing groupmethod of data handling (GMDH) algorithm to reduce errorsin forecasting rare events. The proposed method consisted ofthree stages. At first, they converted the time series data tomultivariate format from univariate format. Then a feature
VOLUME 8, 2020 25

M. H. A. Banna et al.: Application of AI in Predicting Earthquakes: State-of-the-Art and Future Challenges
selection was made to find out the relevant variables. Theselected variables were the input of GMDH modeling, whichwas done using the models, inference and algorithms or com-binational (COMBI) algorithm. Lagged time series data andresiduals were also the input of the first layer of GMDH. Thecoefficients of each neuron were calculated using the leastsquare regression method. The fittest nodes were the input tothe next layer of the NN. This process continues until findingout the best neurons for a layer. For testing their theory, theycollected earthquake data from 1973 to 2012 around theworldand evaluated the performance. There were 663,852 eventson which the model was built. Their proposed model workedwell on the rare earthquake events.
Akhoondzadeh [35] proposed using GA to detect anomalyof total electron content (TEC), which can help in the pre-diction of an earthquake. TEC is the integrated number ofelectrons between two satellites or between a satellite anda receiver. The TEC related to the 8.0 magnitude Solomonearthquake was considered for this study. The bio-inspiredGA algorithm was used, which has three major states such ascrossover, mutation, and reproduction. In the crossover stageof the GA, two chromosomes were taken to create a new one.In the mutation stage, some of the gene values were changed,and in the reproduction part, the new chromosome’s fitnessfunction was calculated to verify if it is a new generationchromosome. The higher bound of TEC can be calculatedusing Eq. (11).
µ+ 1.5σ (11)
where µ is the mean and σ is the SD of the differencesbetween the actual and predicted TEC value. Different othermodels were compared with this model to detect anomalies.
Chen et al. [104] proposed a seismic time series predictionalgorithm using chaos theory and RBFNN. They used theseismic event that occurred in Guanxi as their dataset. Theearthquakes with magnitude less than 0 and greater than9 were trimmed from the dataset. At first, they calculated theparameter from a time series dataset and reconstructed phasespace using them. Then they established the RBFNN. Themomentum term was calculated by adding an adaptive factorinto gradient descent, and a Gaussian function was used asa transfer function. The number of the neurons of the hid-den layers was selected using mutual authentication, whichreduced the RMSE. A linear activation function was used forthe output layer. Iteration of one step was used to carry amulti-step prediction. The time series analysis of earthquakesrevealed chaotic behavior which could be formulated as adeterministic process.
D’Amico et al. [105], compared the RBFNN and SVR asa heuristic method to overcome the contemporary anomalyproblem of the delta-sigma method to forecast the number ofaftershocks. They used the aftershocks which occurred in theAustralian-Pacific plate boundary with main shocks havinga magnitude greater or equal to 7. The ratio of differencesbetween the observed temporal trend and the theoretical trendwas used for finding anomalies in the delta-sigma method.
Using this approach, if 1σ> 2.5, then an anomaly was
detected. First, the RBFNNwas created using two hidden lay-ers, the first layer having RBF transfer function and the sec-ond one having linear transfer function. The weighted inputfunction was calculated by |dist| function, and element byelement product for the first and second layers, respectively.The SVR method used Vapnik ε-insensitive loss functionwith linear kernel and the libsvm optimizer. The perfor-mance of the two methods combined with the delta-sigmaalgorithm was tested using RMSE and Willmott’s index ofagreement (WIA).
Asencio-Cortés et al. [108] tried to determine the parame-ters which work best predicting an earthquake. A set of earth-quake parameters were calculated from an earthquake catalogof Chile. These parameters could have different parameter-izations. Based on the parameters, 5 different studies weredone using a different subset of the parameters and differentparameterization values. Their Sn was observed, and opti-mized values for them were selected. Then some popularsupervisedML classifiers such as KNN, NB, SVM, C4.5, andANNwere used to see the classification accuracies. Differentstudies provided different feature sets, which means that thebest set of features may vary based on the data used forbuilding the model. But this process can help to find the bestset of features.
C. DEEP LEARNING (DL)DL is the hot topic of AI-based researches. This ML processdoes not need handcrafted features and can generate thou-sands of very sophisticated features, which is very difficultfor a human to find by hand. These DL-based models usemultiple hidden layers, that can be time-consuming. Becauseof sophisticated features, thesemodels can face the overfittingproblem. Therefore, dropout and regularization concepts areused. The process of earthquake prediction with DL-basedapproaches is presented in Fig. 12. Here, the multiple hiddenlayers are used to find the features which are used in classi-fication using a fully connected layer. We will categories thestudies into two groups such as earthquake’s characteristicsstudies for deep learning-based approaches, and earthquakeand aftershock prediction studies for deep learning-basedapproaches.
1) EARTHQUAKE’s CHARACTERISTICS STUDIESIn this portion, the studies that are related to earthquakeprediction studies but not performed earthquake predictionare discussed. Earthquake’s SES anomaly prediction studiesand earthquake trend prediction related researches are pre-sented here. DNN is getting popular in earthquake predictionresearches [39], [114]. Kanarachos et al. [114] proposed ahybrid algorithm comprising of the wavelet transform, DNN,and Hilbert transformation for detecting anomalies in timeseries data. They used this model to predict the anomalyin SES during an earthquake. They collected SES of the18th and 19th of December 1995 after the Kozani-Grevenaearthquake. These SES were used for anomaly prediction.
26 VOLUME 8, 2020

M. H. A. Banna et al.: Application of AI in Predicting Earthquakes: State-of-the-Art and Future Challenges
FIGURE 12. Prediction process of an earthquake using DL-based approaches. The DNN usesmultiple pooling, batch processing, dropout layers to produce features. It can generatesophisticated features which are very difficult to calculate by hand. Based on these features,an earthquake is predicted.
Their transferable algorithm was used for wavelet decom-position for de-noising purposes and used the Daubechiesbasis function. The output from the wavelet decompositionwas used as input to the DNN, which first learned hiddenpatterns in the data and then generalized them. The hiddenlayer was comprised of an ensemble of different stackedNN, where for activation, logistic sigmoid functions wereused. The next layer was used to learn the temporal structureof the signal. The output of this model was then comparedwith the wavelet decomposition output for error calculation.The Hilbert transformation was used for the detection ofanomalies in the signal. For seismic application, they usedSES’s long dipoles L’s - I, L’, L.
Bhandarkar et al. [115] compared the feed-forward NNand LSTM to predict the trend of an earthquake. From theAfghanistan and Tajikistan area, 5000 samples were takenfor this study. The data from Thailand, North-East India,and Lakshadweep were also collected. The feed-forward NNhad 2 hidden layers with 20 and 40 neurons, each having asigmoid activation function. The learning rule they have usedwas RMSprop. The LSTM model finds the dynamics of thesequence using cycles in the structure. LSTM removed theproblem of vanishing effect from an RNN. The LSTMmodelthey have used has 2 hidden layers with 40 hidden units ineach LSTM cell, and BP was limited to 15 steps. A drop outlayer was placed between the 2 hidden layers. They reducedthe RMS loss using the Adagrad algorithm.
2) EARTHQUAKE AND AFTERSHOCK PREDICTION STUDIESThe earthquake magnitude prediction-based studies are dis-cussed in this portion.
Wang et al. [39] proposed a DL-based magnitude predic-tion model for earthquakes using the P-wave to give fore-casting information. They have used 30,756 accelerogramsfrom the year 1997 to the year 2019 for this study. Thedata were collected with the Kiban Kyoshin network formagnitude range of 4 to 9. This model did not need to adjustthe hyperparameters as they were adjusted adaptively. Themodel took the first 2.56 seconds (28 samples) of the p-waveof an earthquake as input to the model and predicted thelogarithm of the maximum displacement in the horizontalcomponents. They have used MSE as a loss function. Foreach filter, the kernel size was 2, and the stride was 1.
The choice activation function was a rectified linear unit,in short ReLU. For the pooling layer, max-pooling was cho-sen where the dropout rate was 0.5 to remove overfitting.The Adam optimizer was used along with a learning rateof 0.0001.
LSTM is good method for finding pattern in data. There-fore, researchers are using it for earthquake prediction [42],[115]. Wang et al. [42] proposed to use LSTM for earthquakeprediction, which used spatio-temporal correlation. LSTMuses memory-cells, which helps in predicting long-termevents. They have used data of China and divided the regioninto equal-sized sub-divisions. Earthquakes of magnitudehigher than 4.5 were collected for this study from the year1966 to the year 2016. They have used a 2-dimensionalmatrixto represent earthquake data having the same timestamp butof different locations to achieve spatial and temporal corre-lation. They used this matrix as input to the LSTM layer.The output of this layer went to the drop out layer to over-come the overfitting problem. Then it was passed to a fullyconnected layer whose output was passed through a softmaxactivation function. The error function they have used wascross-entropy, and to optimize it, RMSprop optimizer wasused.
Asim et al. [116] tried to evaluate the performances ofpattern recognition NN (PRNN), RF, RNN, and Ensemble oflinear programming boost (LPBoost) algorithm in predictingearthquake greater than 5.4 before 1 month. They used earth-quake data of Hindukush region from the year 1976 to theyear 2013. A total of 11,137 events were used for this study.The PRNN used LM-BP for training as it works faster thanthe normal BP. It was made with 2 hidden layers, each having12 neurons, and the transfer function was tan Sigmoid. TheRNN algorithm could save the internal state as there weredirected cycles present between the units. It was composedof 2 hidden layers with 6 and 7 neurons, respectively. TheRF algorithm was an ensemble of many decision trees thatwere merged through Bootstrap aggregating or bagging with50 trees. The ensemble of LPBoost maximized a marginbetween training data of different classes and linearly addedmany tree-based classifiers.
Panakkat and Adeli [40] proposed 2 different approachesfor calculating the seismic indicator and showed theeffectiveness of RNN in earthquake location and time
VOLUME 8, 2020 27

M. H. A. Banna et al.: Application of AI in Predicting Earthquakes: State-of-the-Art and Future Challenges
TABLE 5. A summary of DL-based articles used in this review which include used methodologies and features.
prediction. The earthquake catalog of the southern Californiawas used for this research from which the 2 different setsof seismicity features were calculated. In the first approach,they divided the whole region into some sub-regions andrecorded the earthquakes, which were also divided into someequal time intervals. From each sub-region and each interval,seismicity indicators were calculated. In the second approach,the recordswere not divided into equal periods. Instead, it wasdivided according to the period between each large earth-quakes and seismicity indicators. Here, 8 seismic indicatorswere given as input to RNN, which has 1 recurrent layer and1 output layer. The output layer contained 2 nodes in caseof location prediction and 1 node in case of time prediction.LM training algorithm was used for minimizing the MSEbetween the desired output and network output. The numberof iterations was set to 1000, and the goal MSE was setto 0.001 as convergence criteria. The proposed methodologypredicted time and location with an error of 56 days and15.7 miles when the threshold of the earthquake was 6.5.
Panakkat and Adeli [65] have introduced 8 seismicityindicators and compared RNN, LM-BPNN, and RBFNN inpredicting an earthquake. The best structures for each of themodel were determined. They used Southern California andSan-Francisco Bay region’s earthquake catalog for this study.They provided an in-depth description of the calculation ofseismicity indicators in this research. The best BP networkhad 2 hidden layers, each having 8 nodes. The RNN had2 hidden layers. One of the hidden layers was a general denselayer having 8 nodes, and another hidden layer was a recur-rent layer with 4 nodes, which used tan Sigmoid activationfunction. For the south Californian region, the RBFNN used1 hidden RBF layer with 8 nodes. An architecture of 2 hiddenlayers with 8 nodes each were used for the San FranciscoBay region. The performance of these algorithms was thencompared based on the evaluation metrics.
Asencio-Cortés et al. [117] proposed a cloud-based bigdata analysis of earthquake magnitude prediction within7 days of occurrence, using 5 regression algorithms. Theyhave considered DL, generalized linear models (GLM), RF,gradient boosting machines, and stacking ensemble of thesealgorithms for this purpose. They collected about 1 GigaByte
of earthquake catalog of California and divided the data intodifferent cells of size 0.5 longitude × 0.5 latitude. Fromthere, they selected 27 cells where the number of eventsgreater than magnitude 5 was more than 500. Then theycalculated 16 features from them. Amazon web services wasused as a cloud-based platform for big data analysis. Thecells were stored in tables using Amazon redshift. For theimplementation of the 5 regressors, the H2O library was used.The summary of the methods and features used in DL-basedresearches are shown in Table 5.
V. EVALUATION METRICS AND PERFORMANCECATEGORIZATIONA. POPULAR EVALUATION METRICSWhen a model is built, the next important thing is to check itsperformance, as a low performing model is of no use and canlead to some unfavorable conditions. Here, we will brieflydescribe some of the most used evaluation techniques in thereviewed articles. Initially, we will see the basic concept oftrue positive, true negative, false positive, and false negativevalues. Afterwards, we will explore some of the complexevaluation metrics.
a: TRUE POSITIVE VALUES (TP)In the prediction of an earthquake, the number of cases inwhich the model predicted earthquake matches the actualrecorded earthquakes are called TP.
b: TRUE NEGATIVE VALUES (TN)In the number of cases, when the model predicts no earth-quake, and no earthquake happened indeed is called the TN.
c: FALSE POSITIVE VALUES (FP)This value states how many times the model predicted earth-quake but did not happen in real-life.
d: FALSE NEGATIVE VALUES (FN)The number of times the model did not predict an earth-quake, but in the real case, there was an earthquake, which iscalled FN .
28 VOLUME 8, 2020
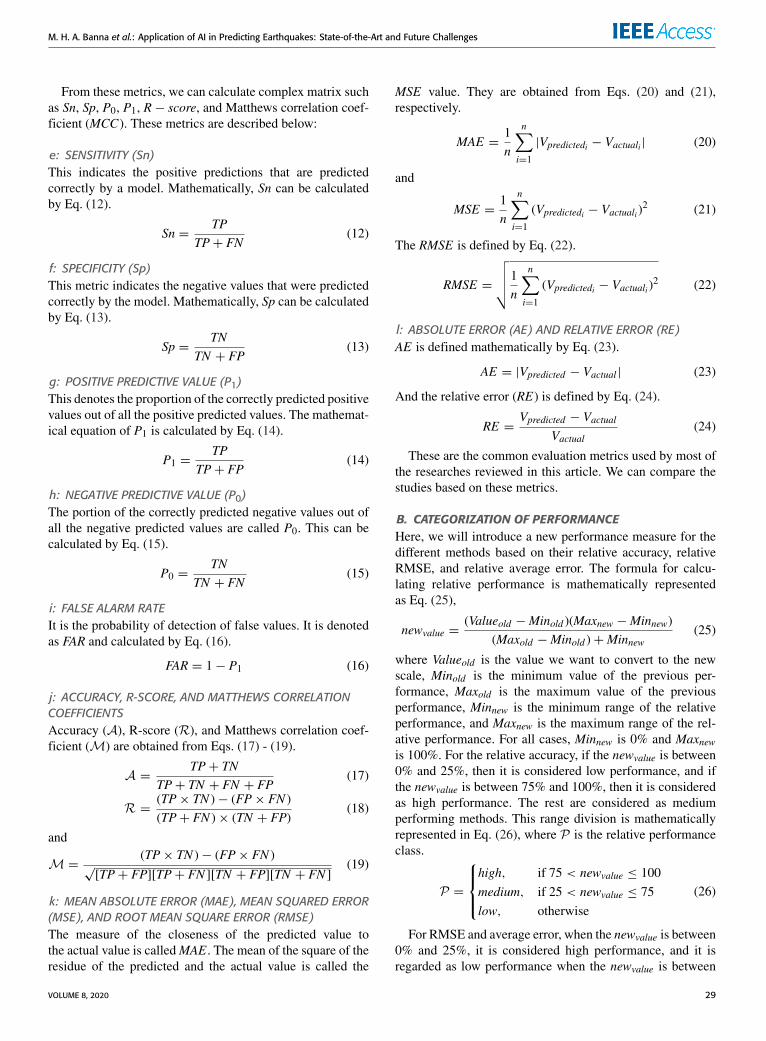
M. H. A. Banna et al.: Application of AI in Predicting Earthquakes: State-of-the-Art and Future Challenges
From these metrics, we can calculate complex matrix suchas Sn, Sp, P0, P1, R− score, and Matthews correlation coef-ficient (MCC). These metrics are described below:
e: SENSITIVITY (Sn)This indicates the positive predictions that are predictedcorrectly by a model. Mathematically, Sn can be calculatedby Eq. (12).
Sn =TP
TP+ FN(12)
f: SPECIFICITY (Sp)This metric indicates the negative values that were predictedcorrectly by the model. Mathematically, Sp can be calculatedby Eq. (13).
Sp =TN
TN + FP(13)
g: POSITIVE PREDICTIVE VALUE (P1)This denotes the proportion of the correctly predicted positivevalues out of all the positive predicted values. The mathemat-ical equation of P1 is calculated by Eq. (14).
P1 =TP
TP+ FP(14)
h: NEGATIVE PREDICTIVE VALUE (P0)The portion of the correctly predicted negative values out ofall the negative predicted values are called P0. This can becalculated by Eq. (15).
P0 =TN
TN + FN(15)
i: FALSE ALARM RATEIt is the probability of detection of false values. It is denotedas FAR and calculated by Eq. (16).
FAR = 1− P1 (16)
j: ACCURACY, R-SCORE, AND MATTHEWS CORRELATIONCOEFFICIENTSAccuracy (A), R-score (R), and Matthews correlation coef-ficient (M) are obtained from Eqs. (17) - (19).
A =TP+ TN
TP+ TN + FN + FP(17)
R =(TP× TN )− (FP× FN )(TP+ FN )× (TN + FP)
(18)
and
M =(TP× TN )− (FP× FN )
√[TP+ FP][TP+ FN ][TN + FP][TN + FN ]
(19)
k: MEAN ABSOLUTE ERROR (MAE), MEAN SQUARED ERROR(MSE), AND ROOT MEAN SQUARE ERROR (RMSE)The measure of the closeness of the predicted value tothe actual value is calledMAE . The mean of the square of theresidue of the predicted and the actual value is called the
MSE value. They are obtained from Eqs. (20) and (21),respectively.
MAE =1n
n∑i=1
|Vpredictedi − Vactuali | (20)
and
MSE =1n
n∑i=1
(Vpredictedi − Vactuali )2 (21)
The RMSE is defined by Eq. (22).
RMSE =
√√√√1n
n∑i=1
(Vpredictedi − Vactuali )2 (22)
l: ABSOLUTE ERROR (AE) AND RELATIVE ERROR (RE)AE is defined mathematically by Eq. (23).
AE = |Vpredicted − Vactual | (23)
And the relative error (RE) is defined by Eq. (24).
RE =Vpredicted − Vactual
Vactual(24)
These are the common evaluation metrics used by most ofthe researches reviewed in this article. We can compare thestudies based on these metrics.
B. CATEGORIZATION OF PERFORMANCEHere, we will introduce a new performance measure for thedifferent methods based on their relative accuracy, relativeRMSE, and relative average error. The formula for calcu-lating relative performance is mathematically representedas Eq. (25),
newvalue =(Valueold −Minold )(Maxnew −Minnew)
(Maxold −Minold )+Minnew(25)
where Valueold is the value we want to convert to the newscale, Minold is the minimum value of the previous per-formance, Maxold is the maximum value of the previousperformance, Minnew is the minimum range of the relativeperformance, and Maxnew is the maximum range of the rel-ative performance. For all cases, Minnew is 0% and Maxnewis 100%. For the relative accuracy, if the newvalue is between0% and 25%, then it is considered low performance, and ifthe newvalue is between 75% and 100%, then it is consideredas high performance. The rest are considered as mediumperforming methods. This range division is mathematicallyrepresented in Eq. (26), where P is the relative performanceclass.
P =
high, if 75 < newvalue ≤ 100medium, if 25 < newvalue ≤ 75low, otherwise
(26)
For RMSE and average error, when the newvalue is between0% and 25%, it is considered high performance, and it isregarded as low performance when the newvalue is between
VOLUME 8, 2020 29
M. H. A. Banna et al.: Application of AI in Predicting Earthquakes: State-of-the-Art and Future Challenges
75% and 100%. The rest are considered as medium perfor-mance. The range classification is presented mathematicallyin Eq. (27), where P is the relative performance class.
P =
high, if 0 < newvalue ≤ 25medium, if 25 < newvalue ≤ 75low, otherwise
(27)
VI. PERFORMANCE ANALYSIS AND DISCUSSIONA. RULE-BASED APPROACHESBofeng and Yue [44] used the FUMCE model to increase theunderstandability of an earthquake prediction expert systemby giving different levels of explanations to a user who hasa different knowledge level. They categorized the users asa novice, common user, advanced user, domain expert, andknowledge engineer so that an expert system can give anexplanation of the earthquake prediction based on their abilityto understand.
Zhong and Zhang [45] tried to predict earthquakes whichare formed because of reservoirs using fuzzy logic. Theyconsidered the ‘‘Three George’’ reservoir and divided it into1300 units. They divided the magnitude scale of earthquakesinto 4 classes as v1, v2, v3, and v4 that represents micro,sensible, devastating and strong earthquakes respectively.They found that their study area produced the biggest sizeof membership function for the class v3, which was 3.155.Therefore, they expected a devastating earthquake in thatarea.
Konstantaras et al. [46] used NFS to detect anomalies inelectrotelluric potentials, which can be used as a precursorof an earthquake. They found that the ratio of their recordedmagnetic field and residue of predicted and recorded mag-netic field varied from 57.14 dB to 75.28 dB. For the electricfield, this value varied from 41.86 to 52.23 dB.
Mirrashid et al. [47], in his ANFIS model, tried to predictthe seismic moment of the next earthquake. They found thatthere is a correlation between the origin of an earthquake andthe cumulative seismic moment. The R2 value was 98%, andthey achieved an MAE of 0.15%.
Rahmat et al. [48] tried to predict b-value using ANFISand ELM algorithm. For training, the ANFIS achieved RMSEof 0.003, and ELM achieved RMSE of 6.33 × 10⁻⁷. Dur-ing testing, the ELM algorithm performed similarly, but theANFIS produce RMSE of 1.507, which led to an inferior suc-cess rate of 21.84%. Table 6 shows the algorithms, outcomes,used dataset, and the evaluation metrics by the researchesinvolving rule-based methods.
Iqram andQamar [49] used predicate logic to predict earth-quakes before 1/2 hour, 1 hour, 2 hours, 6 hours, and 12 hours.They found that their system can predict all the earthquakeswithin 12 hours margin.
TheNFS of Shodiq et al. [50] revealed the relation betweentime intervals and large earthquakes (≥ 5.9). They tested11 earthquake instances and successfully predicted 8 of them.The other 3 events happened 12 days after, 5 months before,and 44 days after the original prediction.
Dehbozorgi and Farokhi [51], in his NFM, tried to predictearthquake 5 minutes before its occurrence and used featureselection to see if the accuracy increases. They comparedthe model with an MLP model. Without feature selection,the NFM achieved 82.85% accuracy, where the MLP modelwas 71.42% accurate. After the feature selection, the accu-racy reduced by nearly 2%, but the network complexityreduced a lot.
Zeng et al. [52] used an ANFIS inference model andcompared it with a fitting model for prediction of epicentralintensity. Their model performed better than the fitting modelwith a mean of error of 0.36, a standard deviation of 0.47, anda correlation coefficient of 0.9362.
Andalib et al. [53] had the goal of reproducing the per-formance of human experts for earthquake prediction. Theirmodel produced 36 false alarms for the 147 tested cases,which had a magnitude of 5.5 and above. For earthquakesgreater than magnitude 6, this model false alarm was 40%as there was a lack of data for higher magnitudes.
Shodiq et al. [54] used ANFIS for spatial analysis ofmagnitude distribution of aftershocks and found that thenon-occurrence was able to be predicted by the model with70% accuracy. But the prediction of the occurrence of theearthquake was 60% accurate.
Kamath and Kamat [55] achieved RMSE of 0.059 fortraining and 0.408 for testing in predicting the magnitude ofan earthquake using the ANFIS model.
Pandit and Biswal [56] used ANFIS with SC to achievecorrelation factor (R2) of 0.8699 for forecasting earthquakes.
Mirrashid [57] used ANFIS with fuzzy means clusteringto achieve RMSE of 0.172 for earthquakes with magnitudegreater or equals to 5.5. With 12 clusters and 12 rules,he achieved an R2 value of 0.95 and an MAE of 0.150.Bahrami and Shafiee [58] forecasted an earthquake with anMSE of 0.0395 using their ANFIS model, which had sevenneurons.
For the rule-based approaches, accuracy is converted torelative performance with Minold equals to 70% and Maxoldequals to 100%. For RMSE conversion,Minold is 6.25×10⁻⁷
and Maxold is 0.601. The relative performance classes areevaluated using Eqs. (26) and (27).
m: THE WORKS REPORTING THE HIGH PERFORMANCE FORRULE-BASED APPROACHESThe rule-based expert system method achieved relative accu-racy of 100% [49]. The ANFIS based methods [55] and [47]provided relative RMSE of 17.96% and 24.95%. The ANFISwith ELM method [58] achieved relative RMSE of 19.8%and GFCV method [48] achieved relative RMSE of 0%.These methods are considered as high performing methodsaccording to the criteria described previously.
n: THE WORKS REPORTING THE MEDIUM PERFORMANCEFOR RULE-BASED APPROACHESThe NFC-based method [51] got relative accuracy of 42.86%and the ANFIS-based method [57] provided relative RMSE
30 VOLUME 8, 2020
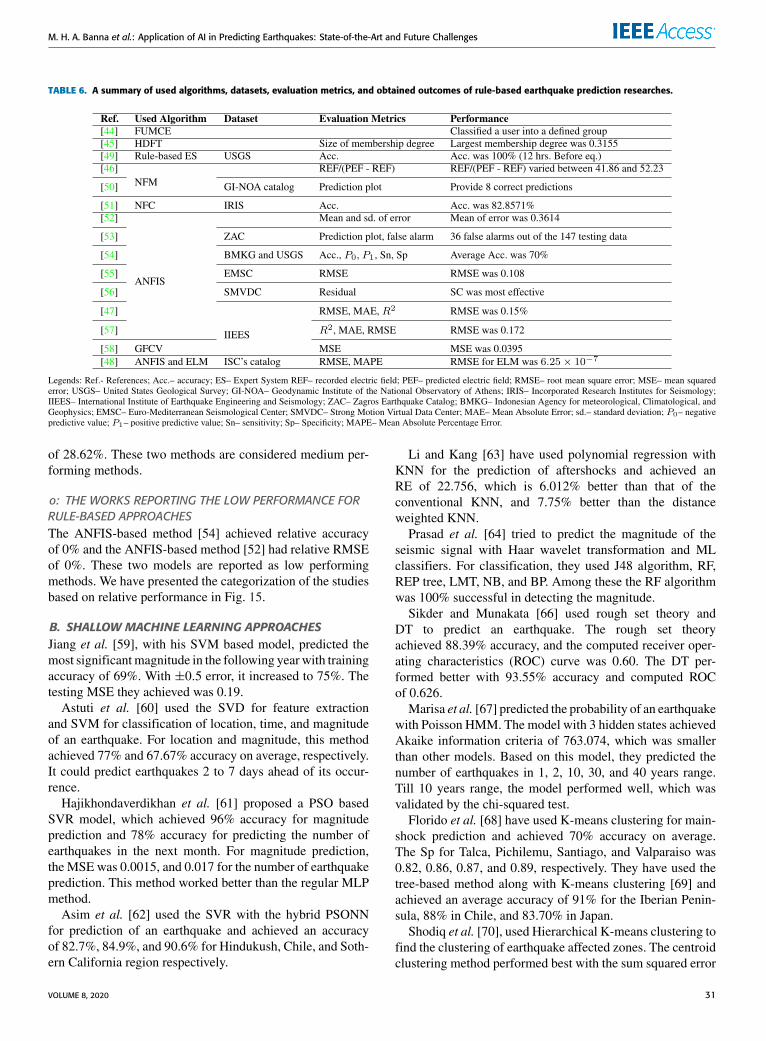
M. H. A. Banna et al.: Application of AI in Predicting Earthquakes: State-of-the-Art and Future Challenges
TABLE 6. A summary of used algorithms, datasets, evaluation metrics, and obtained outcomes of rule-based earthquake prediction researches.
of 28.62%. These two methods are considered medium per-forming methods.
o: THE WORKS REPORTING THE LOW PERFORMANCE FORRULE-BASED APPROACHESThe ANFIS-based method [54] achieved relative accuracyof 0% and the ANFIS-based method [52] had relative RMSEof 0%. These two models are reported as low performingmethods. We have presented the categorization of the studiesbased on relative performance in Fig. 15.
B. SHALLOW MACHINE LEARNING APPROACHESJiang et al. [59], with his SVM based model, predicted themost significantmagnitude in the following year with trainingaccuracy of 69%. With ±0.5 error, it increased to 75%. Thetesting MSE they achieved was 0.19.
Astuti et al. [60] used the SVD for feature extractionand SVM for classification of location, time, and magnitudeof an earthquake. For location and magnitude, this methodachieved 77% and 67.67% accuracy on average, respectively.It could predict earthquakes 2 to 7 days ahead of its occur-rence.
Hajikhondaverdikhan et al. [61] proposed a PSO basedSVR model, which achieved 96% accuracy for magnitudeprediction and 78% accuracy for predicting the number ofearthquakes in the next month. For magnitude prediction,the MSE was 0.0015, and 0.017 for the number of earthquakeprediction. This method worked better than the regular MLPmethod.
Asim et al. [62] used the SVR with the hybrid PSONNfor prediction of an earthquake and achieved an accuracyof 82.7%, 84.9%, and 90.6% for Hindukush, Chile, and Soth-ern California region respectively.
Li and Kang [63] have used polynomial regression withKNN for the prediction of aftershocks and achieved anRE of 22.756, which is 6.012% better than that of theconventional KNN, and 7.75% better than the distanceweighted KNN.
Prasad et al. [64] tried to predict the magnitude of theseismic signal with Haar wavelet transformation and MLclassifiers. For classification, they used J48 algorithm, RF,REP tree, LMT, NB, and BP. Among these the RF algorithmwas 100% successful in detecting the magnitude.
Sikder and Munakata [66] used rough set theory andDT to predict an earthquake. The rough set theoryachieved 88.39% accuracy, and the computed receiver oper-ating characteristics (ROC) curve was 0.60. The DT per-formed better with 93.55% accuracy and computed ROCof 0.626.
Marisa et al. [67] predicted the probability of an earthquakewith Poisson HMM. The model with 3 hidden states achievedAkaike information criteria of 763.074, which was smallerthan other models. Based on this model, they predicted thenumber of earthquakes in 1, 2, 10, 30, and 40 years range.Till 10 years range, the model performed well, which wasvalidated by the chi-squared test.
Florido et al. [68] have used K-means clustering for main-shock prediction and achieved 70% accuracy on average.The Sp for Talca, Pichilemu, Santiago, and Valparaiso was0.82, 0.86, 0.87, and 0.89, respectively. They have used thetree-based method along with K-means clustering [69] andachieved an average accuracy of 91% for the Iberian Penin-sula, 88% in Chile, and 83.70% in Japan.
Shodiq et al. [70], used Hierarchical K-means clustering tofind the clustering of earthquake affected zones. The centroidclustering method performed best with the sum squared error
VOLUME 8, 2020 31

M. H. A. Banna et al.: Application of AI in Predicting Earthquakes: State-of-the-Art and Future Challenges
TABLE 7. A summary of used algorithms, datasets, evaluation metrics, and obtained outcomes of classical ML and clustering-based earthquakesprediction studies.
of 0.98347 and took only 6.11 seconds. They predicted thatthere would be no earthquake till 2020 greater than magni-tude 7. They performed a spatial analysis of the magnitudedistribution and achieved Sp of 100% for earthquakes of mag-nitude 5.5 to 6 [72]. For earthquakes more significant than 6,the Sp reduced to 84%. They used ANN with HierarchicalK-means clustering to predict an earthquake in the next 5 daysand achieved an Sp of 92.73% for a magnitude range of 5.5 to6 [71]. For earthquakes with a magnitude greater than 6,the Sp was 99.16%.
Mejia et al. [73] used Debrovolsky based clustering tocreate a probability distribution plot of an earthquake. With adistance of 10 kilometers, an angle of 10 degrees, and a timelag of 10 days, they were able to give correct predictions fortesting samples.
Tan and Cai [74] proposed a method based on AHC andSVM and achieved an accuracy of 75% for positive sam-ples and 68% for negative samples. The achieved G-valuewas 0.67.
Lu et al. [75] have used GA based clustering for pre-dicting the time and location of aftershocks. They created aweighted graph where the correlated aftershocks were clus-tered together.
Shao et al. [76] used ACC and compared it with theK-means clustering. The average distance the K-meansclustering moved was 44.267, and for the ACC model, itwas 41.488.
Zhang et al. [77] used PSO based clustering, and itachieved 83.3% accuracy. The distance it covered was thesame as the ACC method proposed by Shao et al. In Table 7,the summary of the algorithms, outcomes, used dataset,
and the evaluation metrics used by the classical ML-basedresearches are shown.
For the classical shallow ML methods, Minold is equalto 69% and Maxold is equal to 100% for relative accuracycalculation. Based on this range, the relative performanceconversion is done using Eq. (25). The relative performanceclasses are evaluated using Eq. (26).
p: THE WORKS REPORTING THE HIGH PERFORMANCE FORCLASSICAL MACHINE LEARNING-BASED APPROACHESThe SVR-based method [61] was a high performingmethod with a relative accuracy of 87.9%. The HWT-basedmethod [64] for the feature transformation was found to besuccessful as the relative accuracy was 100%. The DT-basedmethod [66] and the KMC-TBS method [69] were alsohigh performing as their relative accuracy were 79.03% and79.32% respectively.
q: THE WORKS REPORTING THE MEDIUM PERFORMANCEFOR CLASSICAL MACHINE LEARNING-BASED APPROACHESThe bio-inspired PSO-based clustering method [77] achievedrelative accuracy of 46.77%, which makes it a medium per-forming method. The SVM-SVD method [60] produced rel-ative accuracy of 29.32%. Therefore, it is a medium perform-ing model.
r: THE WORKS REPORTING THE LOW PERFORMANCE FORCLASSICAL MACHINE LEARNING-BASED APPROACHESThe SVM based method [59] low performing as the relativeaccuracy of these models is 0%. The KMC method [68] andthe HKMC with ANN-based methods [71], [72] were also
32 VOLUME 8, 2020

M. H. A. Banna et al.: Application of AI in Predicting Earthquakes: State-of-the-Art and Future Challenges
low performings with a relative accuracy of 3.23%, 9.68%and 19.35% respectively. These categorizations are depictedin Fig. 15.
Alarifi et al. [78] proposed an ANN-based magnitude pre-diction model of the earthquake which used tan-sigmoid as anactivation function. The model achieved MSE of 0.1153 andMAE of 0.26371. It works at least 32% better than otherconfigurations of this model. Rayes et al. [80] used ANN inthe Chile region and found the Sp of 88.5%, 77.8%, 97.9%,and 93.9% for Talca, Pichilemu, Santiago, and Valparaisorespectively. The average Sn is a bit small, which was 40.9%.Morales-Esteban et al. [81] tried to predict earthquakeswithin 7 days that are greater than some threshold. For theAlboran sea region, the training and testing specificities were77.1% and 25%. For Azores-Gilbraltar fault, the training Spwas 80.3%, and the testing Sp was 92.8%. Moustra et al. [82]used ANN to find the magnitude of the next day using SES.Using time-series data, they achieved an accuracy of 80.55%.When they used the NN recursively to generate missingSES, that model achieved 84.01% accuracy for magnitudeprediction and 92.96% accuracy for time lag prediction.Xu et al. [83] used DEMETER satellite data and predicted95 positive earthquake instances of the 117 instances cor-rectly. It could predict only 57.5% non-seismic events withtheir ANN-based method. Narayanakumar and Raja [84]provided an earthquake magnitude prediction model usingBPNN,which predicted small earthquakeswith 66.66% accu-racy. The moderate earthquakes were predicted with 75%accuracy. Since there was a minimal amount of trainingsamples for earthquakes with a magnitude greater than 5.8,the model could not predict major earthquakes. Cheraghi andGhanbari [85] have used ANN to predict the time and magni-tude of an earthquake. For magnitude prediction, the averageerror was 0.5%, and the maximum error was 3.5%. Theycould predict the timing of an earthquake with 10 days of theerror. Xie et al. [86] predicted the actual time of the earth-quake within 2 months range using BPNN. At 221 epochs,they managed to reduce MSE at the level of 10−3.Hu et al. [79] predicted the future magnitude of 6 monthsusing the LR-BPNN method. The LR alone can achieveRMSE of ±0.78 ML, and the integrated LR-BPNN modelcan achieve RMSE of ±0.41 ML.
Zhou and Zhu [87] compared the traditional BPmodel withthe BP-LM model and found that the BP-LM model worksbetter than BP. This model achieved an error level of 0.0006,and the traditional BPmodel reached the error level of 0.4159.This model showed a 5.6% error for testing samples.Kulachi et al. [32] used the LM-BPNN model for predictionof the magnitude of an earthquake. The AE they achieved was2.3%, and the REwas between 0% and 12%. They used factoranalysis and showed that 80.18% of the data were coveredby four factors only. Ma et al. [88] have used an LM-BPNNmodel on the DEMETER satellite data. This model cor-rectly predicted 78 out of 93 seismic samples achieving83.9% accuracy. For non-seismic events, the accuracy fallsto 46.6%.
Hu et al. [89] compared an LR and LR-BPNN modelfor magnitude prediction. The training RMSE for the LRmodel was±0.66, and testing was±0.62.With the combinedLR-BPNN model, they achieved training RMSE of ±0.22,and for testing, it was ±0.28.
Zhou et al. [95] used an ANN-SVM model for earthquakemagnitude prediction. They found that if the error does notexceed ±0.5, then the SVM model can predict 9 out of 15,and ANN could predict 10 out of 15 testing samples. Thecombination of these two could predict 11 out of 15 sampleswith 73.33% accuracy.
Suratgar et al. [96] presented a simulation-based studyof earthquake magnitude prediction. The norm of error theyachieved was 0.047 to 0.067.
Rafiei and Adeli [97] proposed an earthquake magnitudeprediction model using the NDAP-NDC model. This modelachieved an accuracy of 99.4% and an R-score of 0.94. Theyalso compared it with the EPNN model, which achieved anaccuracy of 99.3%.
Majhi et al. [99] used their MFOFLANN model for earth-quake magnitude prediction. This model achieved an RMSEof 0.0565. They have compared it with the IPSO-BPNNmodel, which achieved similar RMSE, which is 0.0590.
Zhang and Wang [34] predicted the probability of earth-quakes using the BP-GA method. The maximum averagedRE was 0.1585, and its minimum value was 0.0632. Fornormal BP, it varied between 0.2495 and 0.5330.
Tao [100] proposed a hybrid algorithm of BPNN and GAfor predicting earthquakes with a magnitude greater than 6.5.For the Himalayan region, the error was -0.06 to +0.05. Usingonly BPNN, it was -0.0062 to -0.0028.
Li and Lu [36] have used the IPSO-BPNN method for themagnitude prediction of an earthquake. This model achievedAE between 0.021 and 0.375. Shah and Ghazali [101] pro-posed an IABC-MLP model for magnitude prediction, whichachieved an accuracy of 99.89%. The MSE varied between0.001702 and 0.001910.
Maya and Yu [102] proposed a model for short-term earth-quake prediction with meta-learning and transfer learning.With MLP-meta-learning, it achieved MSE of 0 to 0.09. Withthe MLP-meta learning-transfer learning model, the MSEwas between 0 and 0.07.
Lui et al. [103] predicted the magnitude of an earthquakeusing an ensemble of RBFNN. When the magnitude differ-ence is not more than 0.5, this model achieved an accuracyof 91%.Wang et al. [38] also used RBFNN for the magnitudeprediction of an earthquake. The maximum prediction errorwas 0.8152, and the average prediction error was 0.2722.Amar et al. [106] predicted the magnitude of an earthquakebefore 1 day of its occurrence using RBFNN. They achievedan average R-score of 0.75. For the prediction of 7 days, thismodel achieved an average R-score of 0.88.
Adeli and Panakkat [3] introduced PNN for earthquakemagnitude prediction. For magnitude 4.5 to 6, the aver-age R-score was 0.68, and the average POD score was0.84. Huang [107] also used PNN for earthquake magnitude
VOLUME 8, 2020 33

M. H. A. Banna et al.: Application of AI in Predicting Earthquakes: State-of-the-Art and Future Challenges
prediction. For an earthquake magnitude of 3.5 to 6 in theChinese region, the average R-score was 0.59, and the aver-age POD score was 0.69.
Li et al. [109] compared RF, SVM, and DT algorithmsfor prediction of earthquake and arrival time of P-wave andS-wave. The accuracy of RF, SVM, and DT models were85%, 83%, and 88%, respectively. Asim et al. [110] compareddifferent ML algorithms for the magnitude of earthquakeprediction within 15 days. For a magnitude range of 3 to 4,RF performed best and achieved an MCC of 0.81. For 4 to4.5 magnitude range, SVM achieved MCC of 0.86, and forthe earthquake over 4.5 magnitude range, RF performed bestwith MCC of 0.724. They also compared the ML algo-rithms for short-term earthquake prediction [111]. The rota-tion forest algorithmworked best with an F-measure of 0.928.Karimzadeh et al. [112] tried to predict the location ofearthquakes with different ML algorithms. Without the faultinformation and with information of fault 1, NB algorithmperformed best with 78% accuracy. With the information offault 2, the RF algorithm achieved the best accuracy of 75%.Celik et al. [113] compared LR additive regression, REP tree,MLP, and DT for predicting different aspects of earthquakes.For longitude and latitude prediction, LR performed best withMSE of 0.84 and 0.96. For depth and magnitude predictionMLP performed best with MSE of 1.88, and 0.34. Table 8shows the algorithms, outcomes, used dataset, and the evalu-ation metrics by the NN-based researches.
Martinez-Alvarez et al. [90] used feature selection withANN to find out if there would be an earthquake greater thana threshold magnitude. This model achieved Sp of 81.08%,97.22%, 96.77%, 94.62%, 85%, and 91.30% for Talca,Santiago, Valparaiso, Pichilemu, Alboran sea, and westernAzores-Gilbraltar fault region respectively.
Okada and Kaneda [91], using ANN, learned a waveformwhich replicates waveform of ocean bottom pressure gage.It exhibits a cyclic trajectory which returns to its initial posi-tion after an earthquake. They said that this could be used inpredicting aftershocks.
Lin et al. [92] first figured out the best number of neu-rons in the hidden layer for an ANN model and used theirEEMPBPNN model for magnitude prediction. The averagestandard deviation was 0.21, and theMSE varied from 0.01 to0.09.
Lakshmi and Tiwari [93] tried to evaluate the dynamics ofan earthquake in the northeast Indian region. They have usednonlinear forecasting and ANN. The highest R-value theyhave found is 0.4014 for nonlinear forecasting and 0.520 forANN. Because of this low value, they evaluated NEI as achaotic plane.
Niksarlioglu and Kulachi [94] used ANN and clusteringfor the magnitude prediction of earthquakes and achievedRE between 0% to 6.25%. They divided the data into threeclusters.
Zhao et al. [37] used different hybrid algorithms to dif-ferentiate earthquakes and explosions. The BPNN modelachieved 98.21% accuracy, and PCA-SVM achieved 99.23%
accuracy. The best model was the BP-AdaBoost model,which was 99.49% accurate.
Fong et al. [98] forecasted earthquake magnitude usingthe GMDH method. The worst residual error they observedwas 0.2367, and the best was 0.1733. The standard deviationwas between 0.11 and 0.19, which indicates that it is a stablemodel.
Akhoondzadeh [35] used GA for detecting anomalies inTEC before and after an earthquake. His model found that8 days and 7 days before the earthquake, the TECwas 54.66%and 21.75% higher than the threshold, respectively. 10 hoursafter the earthquake, it was 29.8% higher than the higherbound.
For earthquake prediction, Chen et al. [104] proposed achaos theory based RBFNN. This model achieved trainingRMSE of 0.0107 to 0.0109. The prediction RMSE variedbetween 0.042 and 0.049. D’Amico et al. [105] comparedRBFNN with SVR for aftershock prediction with globalRMSE values 0.80 and 0.88 for RBFNN and SVR. TheRBFNN achieved a global WIA of 0.94, which was 0.02 bet-ter than that of the SVR model.
Asencio-Cortes et al. [108] tried to find out the best setof parameters for earthquake prediction. They tried KNN,SVM, NB, DT, and ANN algorithm in combination with theparameters to find the best possible set. They found that thestart and end of the training and testing catalog, calculated b-value, lower and upper bound of magnitude threshold are theessential criteria for earthquake prediction.
For the NN-based methods, Minold is equal to 71.5% andMaxold is equal to 99.89% for relative accuracy calcula-tion. The relative RMSE is calculated with a lower boundof 0.0041 and upper bound of 1.19 to convert it to the rangeof 0 to 100. For average error, the Minold and the Maxold are0.0625 and 5.6 respectively. Based on these ranges, the rel-ative performance conversion is done using Eq. (25). Therelative performance classes are evaluated using Eqs. (26)and (27).
s: THE WORKS REPORTING THE HIGH PERFORMANCE FORNEURAL NETWORK-BASED APPROACHESThe BP-AdaBoost [37] and the NDC-NDAP method [97]provided relative accuracy of 98.59% and 98.27%. Thebio-inspired IABC-MLPmethod achieved a relative accuracyof 100%. The RBFNN model [106] also performed wellwith a relative accuracy of 86.30%. These models are highperforming methods based on relative accuracy.
The embedded BPNN [92] and the LR-BP [89] methodsachieved relative RMSE of 24.95% and 23.27% respectively.The GMDHNN method [98], Meta-learning with transferlearning method [102], and RBFNN-based method [104]performed well with relative RMSE of 16.98%, 21.97%, and3.4% respectively. The MFOFLANNmethod [99] performedbest based on the relative RMSE. These methods are highperforming methods based on relative RMSE.
The LM-BP method [32] and the HC-ANN method [94]provided relative average error of 1.04% and 0%.
34 VOLUME 8, 2020

M. H. A. Banna et al.: Application of AI in Predicting Earthquakes: State-of-the-Art and Future Challenges
TABLE 8. A summary of used algorithms, used datasets, evaluation metrics, and obtained outcomes of NN-based earthquake researches.
The bio-inspired ANN-GA method [34] and the BP-PSOmodel [36] provided relative average error of 7.36% and
2.45% respectively. These models, along with the RBFNNmethod [38] are considered as high performing methods.
VOLUME 8, 2020 35
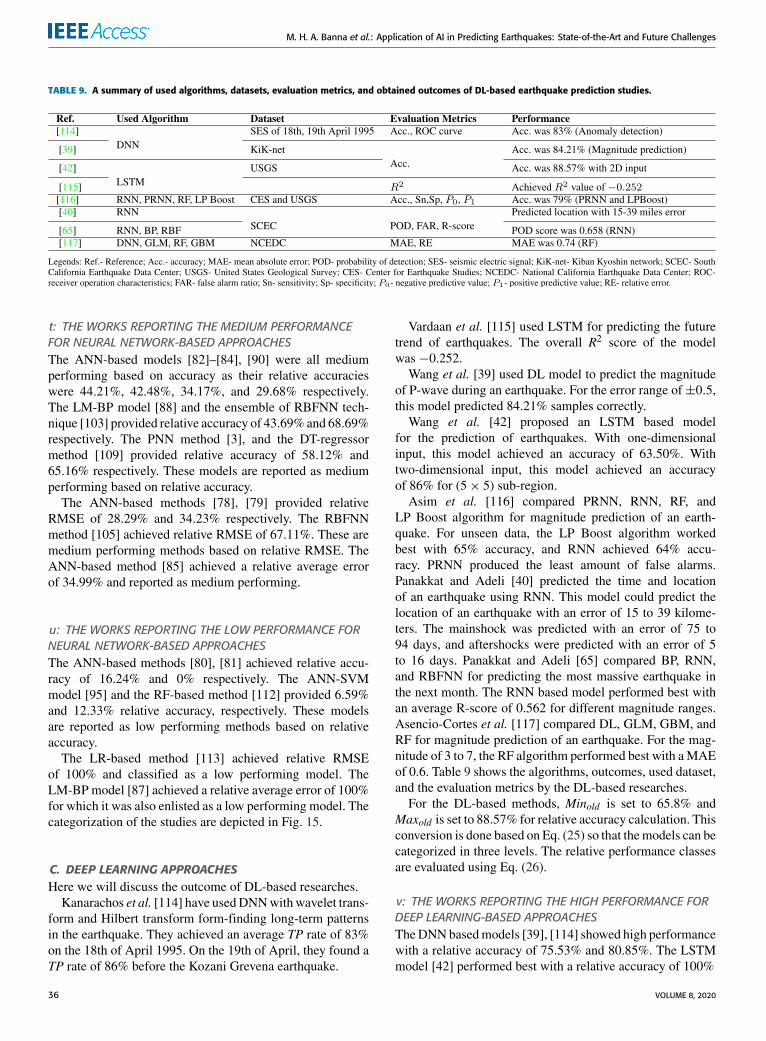
M. H. A. Banna et al.: Application of AI in Predicting Earthquakes: State-of-the-Art and Future Challenges
TABLE 9. A summary of used algorithms, datasets, evaluation metrics, and obtained outcomes of DL-based earthquake prediction studies.
t: THE WORKS REPORTING THE MEDIUM PERFORMANCEFOR NEURAL NETWORK-BASED APPROACHESThe ANN-based models [82]–[84], [90] were all mediumperforming based on accuracy as their relative accuracieswere 44.21%, 42.48%, 34.17%, and 29.68% respectively.The LM-BP model [88] and the ensemble of RBFNN tech-nique [103] provided relative accuracy of 43.69% and 68.69%respectively. The PNN method [3], and the DT-regressormethod [109] provided relative accuracy of 58.12% and65.16% respectively. These models are reported as mediumperforming based on relative accuracy.
The ANN-based methods [78], [79] provided relativeRMSE of 28.29% and 34.23% respectively. The RBFNNmethod [105] achieved relative RMSE of 67.11%. These aremedium performing methods based on relative RMSE. TheANN-based method [85] achieved a relative average errorof 34.99% and reported as medium performing.
u: THE WORKS REPORTING THE LOW PERFORMANCE FORNEURAL NETWORK-BASED APPROACHESThe ANN-based methods [80], [81] achieved relative accu-racy of 16.24% and 0% respectively. The ANN-SVMmodel [95] and the RF-based method [112] provided 6.59%and 12.33% relative accuracy, respectively. These modelsare reported as low performing methods based on relativeaccuracy.
The LR-based method [113] achieved relative RMSEof 100% and classified as a low performing model. TheLM-BP model [87] achieved a relative average error of 100%for which it was also enlisted as a low performing model. Thecategorization of the studies are depicted in Fig. 15.
C. DEEP LEARNING APPROACHESHere we will discuss the outcome of DL-based researches.
Kanarachos et al. [114] have usedDNNwithwavelet trans-form and Hilbert transform form-finding long-term patternsin the earthquake. They achieved an average TP rate of 83%on the 18th of April 1995. On the 19th of April, they found aTP rate of 86% before the Kozani Grevena earthquake.
Vardaan et al. [115] used LSTM for predicting the futuretrend of earthquakes. The overall R2 score of the modelwas −0.252.Wang et al. [39] used DL model to predict the magnitude
of P-wave during an earthquake. For the error range of±0.5,this model predicted 84.21% samples correctly.
Wang et al. [42] proposed an LSTM based modelfor the prediction of earthquakes. With one-dimensionalinput, this model achieved an accuracy of 63.50%. Withtwo-dimensional input, this model achieved an accuracyof 86% for (5× 5) sub-region.
Asim et al. [116] compared PRNN, RNN, RF, andLP Boost algorithm for magnitude prediction of an earth-quake. For unseen data, the LP Boost algorithm workedbest with 65% accuracy, and RNN achieved 64% accu-racy. PRNN produced the least amount of false alarms.Panakkat and Adeli [40] predicted the time and locationof an earthquake using RNN. This model could predict thelocation of an earthquake with an error of 15 to 39 kilome-ters. The mainshock was predicted with an error of 75 to94 days, and aftershocks were predicted with an error of 5to 16 days. Panakkat and Adeli [65] compared BP, RNN,and RBFNN for predicting the most massive earthquake inthe next month. The RNN based model performed best withan average R-score of 0.562 for different magnitude ranges.Asencio-Cortes et al. [117] compared DL, GLM, GBM, andRF for magnitude prediction of an earthquake. For the mag-nitude of 3 to 7, the RF algorithm performed best with aMAEof 0.6. Table 9 shows the algorithms, outcomes, used dataset,and the evaluation metrics by the DL-based researches.
For the DL-based methods, Minold is set to 65.8% andMaxold is set to 88.57% for relative accuracy calculation. Thisconversion is done based on Eq. (25) so that themodels can becategorized in three levels. The relative performance classesare evaluated using Eq. (26).
v: THE WORKS REPORTING THE HIGH PERFORMANCE FORDEEP LEARNING-BASED APPROACHESTheDNNbasedmodels [39], [114] showed high performancewith a relative accuracy of 75.53% and 80.85%. The LSTMmodel [42] performed best with a relative accuracy of 100%
36 VOLUME 8, 2020
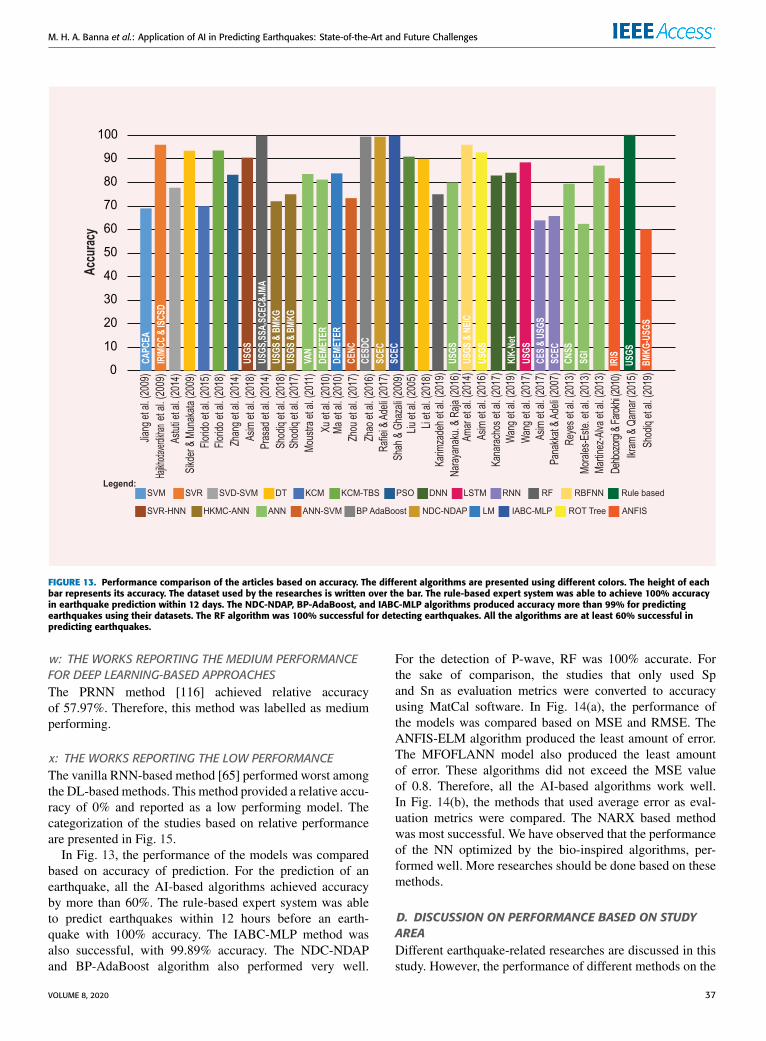
M. H. A. Banna et al.: Application of AI in Predicting Earthquakes: State-of-the-Art and Future Challenges
FIGURE 13. Performance comparison of the articles based on accuracy. The different algorithms are presented using different colors. The height of eachbar represents its accuracy. The dataset used by the researches is written over the bar. The rule-based expert system was able to achieve 100% accuracyin earthquake prediction within 12 days. The NDC-NDAP, BP-AdaBoost, and IABC-MLP algorithms produced accuracy more than 99% for predictingearthquakes using their datasets. The RF algorithm was 100% successful for detecting earthquakes. All the algorithms are at least 60% successful inpredicting earthquakes.
w: THE WORKS REPORTING THE MEDIUM PERFORMANCEFOR DEEP LEARNING-BASED APPROACHESThe PRNN method [116] achieved relative accuracyof 57.97%. Therefore, this method was labelled as mediumperforming.
x: THE WORKS REPORTING THE LOW PERFORMANCEThe vanilla RNN-based method [65] performed worst amongthe DL-based methods. This method provided a relative accu-racy of 0% and reported as a low performing model. Thecategorization of the studies based on relative performanceare presented in Fig. 15.
In Fig. 13, the performance of the models was comparedbased on accuracy of prediction. For the prediction of anearthquake, all the AI-based algorithms achieved accuracyby more than 60%. The rule-based expert system was ableto predict earthquakes within 12 hours before an earth-quake with 100% accuracy. The IABC-MLP method wasalso successful, with 99.89% accuracy. The NDC-NDAPand BP-AdaBoost algorithm also performed very well.
For the detection of P-wave, RF was 100% accurate. Forthe sake of comparison, the studies that only used Spand Sn as evaluation metrics were converted to accuracyusing MatCal software. In Fig. 14(a), the performance ofthe models was compared based on MSE and RMSE. TheANFIS-ELM algorithm produced the least amount of error.The MFOFLANN model also produced the least amountof error. These algorithms did not exceed the MSE valueof 0.8. Therefore, all the AI-based algorithms work well.In Fig. 14(b), the methods that used average error as eval-uation metrics were compared. The NARX based methodwas most successful. We have observed that the performanceof the NN optimized by the bio-inspired algorithms, per-formed well. More researches should be done based on thesemethods.
D. DISCUSSION ON PERFORMANCE BASED ON STUDYAREADifferent earthquake-related researches are discussed in thisstudy. However, the performance of different methods on the
VOLUME 8, 2020 37

M. H. A. Banna et al.: Application of AI in Predicting Earthquakes: State-of-the-Art and Future Challenges
FIGURE 14. (a) Performance comparison of earthquake prediction methods based on MSE and RMSE. The model with the lowest MSE or RMSE values ismostly appreciated. The different techniques are represented with different colored bars, and their height represents their value. The respective datasetsare mentioned over the bar. The GMDHNN algorithm produced the highest amount of error. The ANFIS-ELM method performed best, and the bio-inspiredalgorithm MFOFLANN also produced excellent results. (b) Performance comparison of earthquake prediction methods based on average error. The LM-BPmethod produced the worst performance, with an average error of 5.5%. The NARX algorithm produced the least average error.
same database needs to be addressed. Here, we will discussthe performance of different models on the different datasetsbased on relative performance discussed earlier. The methodsare discussed based on high, medium and low performance.Some studies were done considering data from the wholeworld. The rule-based expert system [49] predicted earth-quake with high relative accuracy. For reducing errors in fore-casting GMDHNN [98] showed high performance on worlddata. For magnitude prediction based on the data around theworld, RBFNN [106] and MFOFLANN based model [99]showed high performance. The ANN-SVM model [95] pro-vided low performance.
For the study area of Iran, ANFIS [47] showed highperformance for seismic moment prediction. For forecast-ing earthquake ANFIS-ELM model [58] and the SVR-basedmodel, [61] achieved high performance for Iranian region.For short-term earthquake prediction, NFC model [51]showed medium performance. For magnitude prediction,ANFIS-based model [57] provided medium performance, but
the RF-based model [112] showed low performance on dataof the Iranian region.
Some researches took China as their study area. Forearthquake occurrence, LR-BP [89] and LSTM [42] modelachieved high performance. For earthquake magnitude pre-diction, RBFNN [38] achieved high relative accuracy, ANN[79] and ensemble of RBFNN [103] produced medium rel-ative performance and SVM-based model [59] showed lowperformance. Intensity near the epicenter in China was pre-dicted by ANFIS [52] with low relative performance. After-shock in China was predicted by PRKNN [63] with lowperformance.
For the study area of Indonesia, the magnitude of theearthquakewas predicted byHKMC-ANN-basedmodel [71],[72] with low performance and with ANFIS [55] it was pre-dicted with high relative performance. ANFIS [54] predictedthe occurrence and non-occurrence with low relative perfor-mance. GFCV-based method [48] showed high performancefor b-value prediction for the Indonesian region.
38 VOLUME 8, 2020

M. H. A. Banna et al.: Application of AI in Predicting Earthquakes: State-of-the-Art and Future Challenges
FIGURE 15. Categorization of performances for various rule-based, shallow/deep machine learning approaches. The studies arecompared on their relative performance calculated by Eq. (25). Based on the relative performance, the studies are categorized in high,medium, and low classes.
In southern California, researches were done for earth-quake magnitude prediction. The NDC-NDAP method [97]and the IABC-MLP method showed high performance forthis area. The PNN [3] and the SVR-HNN [62] achievedmedium performance. The RNN-based model [65] providedlow performance for the south Californian region.
The KMC-TBS model [69] provided high accuracy formagnitude prediction, but ANN-based [80] model achievedlow performance for data of Chile. The best set of parameterswere calculated by ANN [90] model with a relative mediumperformance for this area. The occurrence of the earthquakewas predicted by KMC [68] with a low performance for thedata of Chile.
For magnitude prediction in Greece, both the ANN-basedmodel [82] and the SVM-SVD model achieved medium
performance. The DNN-based model [114] showed highperformance for SES anomaly prediction in the Greekarea.
For the Turkish region, LR-based model [113] providedlow accuracy for earthquake magnitude prediction, butHC-ANN model [94] achieved high relative performance forthe occurrence of earthquake prediction.
In the Iberian Peninsula area, ANNmodel [81] achieve lowperformance for earthquake magnitude prediction. For theHimalayan region, ANN [84] provided medium performancefor magnitude prediction. The optimized neural number waspredicted with high performance by the embedded BPNNmodel [92] for the Philippines region. In the Hindukushregion, PRNN [116] provided high relative performance formagnitude prediction.
VOLUME 8, 2020 39
M. H. A. Banna et al.: Application of AI in Predicting Earthquakes: State-of-the-Art and Future Challenges
VII. CHALLENGES AND FUTURE RESEARCHEarthquake researches face great difficulties due to the rar-ity of data, quality of data collection, lack of pattern, andvariability of performance of the same model in differentgeological locations. Most of these problems significantlyaffect the performance of the model. Here we will discuss thedifficulties faced in earthquake researches, and somemethodsof overcoming these situations are also presented, which canbe adopted in future studies.
A. PREDICTION ACCURACY LIMITED TO MAGNITUDEAll the earthquake prediction models reviewed in this arti-cle performed very well in predicting magnitudes between3 and 5. Naturally, an earthquake with a magnitude greaterthan magnitude 6 is rare events. When an earthquake witha magnitude higher than 6 happens, the AI-based modelsshow poor performance because of data scarcity. Training themodel separately with earthquake events greater than mag-nitude 6 can help in these scenarios. Generation of artificialdata using models like generative adversarial networks can beused as well.
B. TIME PREDICTION ERRORSince the occurrence of the earthquake does not follow somespecific patterns, the earthquake time prediction usually facessignificant errors. For long-term earthquake time prediction,20 days to 5 months of error are observed in most cases.Prediction of earthquakes can be treated as a time-seriesanalysis problem. Therefore, the best performing models intime-series analysis can be used for it. The earthquake pre-diction researchers should explore Attention-based architec-tures.
C. RESOLUTIONThe epicenter is the point on the earth’s surface verticallyabove the earthquake’s position of generation. The quake’sintensity is highest on the epicenter, which leads to thehighest amount of damage. But epicentral location is usu-ally predicted with 70 miles of error. Therefore, the perfectoccurrence of an earthquake is very tough to predict. Clus-tering the earthquake events based on their location keepsthe location-based patterns intact. Thus, clustering the earth-quake events can help a lot for more accurate prediction.
D. NO BENCHMARK DATASETSThe earthquake prediction datasets typically contain earth-quake catalog, SES, seismic waves, precursory parameters,or animal behavior. The probability of earthquake occur-rence is small. Consequently, for a specific area, data is notsufficient. SES for the historical earthquake catalog is notavailable. VAN team managed to record SES for 29 eventsin quest of creating an SES dataset. Though this effort is notenough for machine learning or deep learning researches. Theduration of the P-wave is minimal, which makes earthquakeprediction very difficult. There is no benchmark dataset based
on which model can be evaluated. The DL-based approachcannot be used due to the scarcity of large benchmark dataset.An earthquake dataset should be created on which everyearthquake model can be tested for easing the comparisonprocess of the different models.
E. EFFECT OF ENVIRONMENTAL FACTORSThe physics behind the occurrence of an earthquake is noteasy to understand. Precursors such as radon concentration,soil temperature, strange waves are very troublesome tomonitor. Monitoring animal behavior is not easy as well.So, the prediction studies of an earthquake are not builton strong in-depth knowledge of earthquake science. Thisleads to under-performing models. In-depth research on thelocation-dependent behavior of an earthquake is necessary forbetter understanding of this phenomenon.
F. INSUFFICIENT EFFECTIVE PARAMETERSFor earthquake prediction studies, the best set of earthquakeparameters are not defined. Different studies use differentparameter sets. The magnitude of completeness is differentfor different datasets as well. Based on these, b-value param-eters are calculated. In a single dataset, different earthquake’smagnitude techniques (Local-scale, Richter scale) are evalu-ated by different techniques. These kinds of variance makeearthquake prediction studies more difficult. In most cases,the same method performs very differently, just because thedataset is different. The best set of earthquake features need tobe defined for different geological locations. While recordingthe earthquake data, a specific magnitude scale should beadopted all over the world.
VIII. CONCLUSIONOf all the natural disasters, earthquake is one of the mostdevastating one as it occurs suddenly, damages a significantnumber of infrastructures, and takes away lives. Many of theexisting prediction techniques provide high false alarm, there-fore, lack of accurate prediction process is a contributor to thiscatastrophic consequence of earthquake. AI-based methodshave created a new scope for improving this prediction pro-cess due to their high accuracy when compared to other tech-niques. Such methods can significantly reduce damages asthe concerned area can be evacuated based on the forecasting.To facilitate the prediction process, this article reviewed theexisting techniques that involve AI-based earthquake predic-tion. From the academic research databases 84 papers wereselected between 2005 and 2019. The reported methods weresummarized in tables and extensively discussed. Then thesetechniques were compared based on their performances. Thereported results of the methods, used datasets, and appliedevaluation metrics were also summarized in tables. This workaims to highlight the impact of AI-based techniques in earth-quake prediction which will help the researchers to developmore accurate methods.
40 VOLUME 8, 2020

M. H. A. Banna et al.: Application of AI in Predicting Earthquakes: State-of-the-Art and Future Challenges
ACKNOWLEDGMENTThe authors would like to thank Bangladesh University ofProfessionals for supporting this research.
COMPLIANCE WITH ETHICAL STANDARDSConflicts of Interest: All authors declare that they have noconflict of interest.
Ethical Approval: No ethical approval required for thisstudy.
InformedConsent: This study used secondary data, there-fore, the informed consent does not apply.
Authors and Contributors: This work was carried out inclose collaboration between all co-authors.
REFERENCES[1] (2020). Search Earthquake Catalog. Accessed: May 11, 2020. [Online].
Available: https://earthquake.usgs.gov/earthquakes/search/[2] D. E. Alexander, ‘‘The L’Aquila earthquake of 6 April 2009 and Italian
government policy on disaster response,’’ J. Natural Resour. Policy Res.,vol. 2, no. 4, pp. 325–342, Oct. 2010.
[3] H. Adeli and A. Panakkat, ‘‘A probabilistic neural network for earthquakemagnitude prediction,’’ Neural Netw., vol. 22, no. 7, pp. 24–1018, 2009.
[4] J. Patterson and A. Gibson, Deep Learning: A Practitioner’s Approach.Newton, MA, USA: O’Reilly Media, 2017.
[5] Y. Ma, H. Peng, T. Khan, E. Cambria, and A. Hussain, ‘‘Sentic LSTM:A hybrid network for targeted aspect-based sentiment analysis,’’ Cognit.Comput., vol. 10, no. 4, pp. 639–650, Aug. 2018.
[6] X. Yang, K. Huang, R. Zhang, and J. Y. Goulermas, ‘‘A novel deepdensitymodel for unsupervised learning,’’Cognit. Comput., vol. 11, no. 6,pp. 778–788, Dec. 2019.
[7] R. D. Cicerone, J. E. Ebel, and J. Britton, ‘‘A systematic compilation ofearthquake precursors,’’ Tectonophysics, vol. 476, pp. 96–371, Oct. 2009.
[8] M. Wyss and D. C. Booth, ‘‘The IASPEI procedure for the evaluation ofearthquake precursors,’’ Geophys. J. Int., vol. 131, no. 3, pp. 423–424,Dec. 1997.
[9] R. J. Geller, ‘‘Earthquake prediction: A critical review,’’ Geophys. J. Int.,vol. 131, no. 3, pp. 425–450, Dec. 1997.
[10] L. Sevgi, ‘‘A critical review on electromagnetic precursors and earthquakeprediction,’’ Turk. J. Electr. Eng. Comput. Sci., vol. 15, no. 1, pp. 1–15,2007.
[11] S. Uyeda, T. Nagao, and M. Kamogawa, ‘‘Short-term earthquake pre-diction: Current status of seismo-electromagnetics,’’ Tectonophysics,vol. 470, nos. 3–4, pp. 205–213, May 2009.
[12] M. A. Mubarak, M. S. Riaz, M. Awais, Z. Jilani, N. Ahmad, M. Irfan,F. Javed, A. Alam, and M. Sultan, ‘‘Earthquake prediction: A globalreview and local research,’’ Proc. Pakistan Acad. Sci, vol. 46, no. 4,pp. 233–246, 2009.
[13] N. Bhargava, V. Katiyar, M. Sharma, and P. Pradhan, ‘‘Earthquake pre-diction through animal behavior: A review,’’ Indian J. Biomech., vol. 78,pp. 159–165, Mar. 2009.
[14] H. V. Alvan and F. H. Azad, ‘‘Satellite remote sensing in earthquakeprediction. A review,’’ in Proc. Nat. Postgraduate Conf., Sep. 2011,pp. 1–5.
[15] G. Otari and R. Kulkarni, ‘‘A review of application of data mining inearthquake prediction,’’ Int. J. Comput. Sci. Inf. Technol., vol. 3, no. 2,pp. 3570–3574, 2012.
[16] F. Azam, M. Sharif, M. Yasmin, and S. Mohsin, ‘‘Artificial intelligencebased techniques for earthquake prediction: A review,’’ Sci. Int., vol. 26,no. 4, pp. 1495–1502, 2014.
[17] H. Woith, ‘‘Radon earthquake precursor: A short review,’’ Eur. Phys. J.Special Topics, vol. 224, no. 4, pp. 611–627, May 2015.
[18] F. Huang, M. Li, Y. Ma, Y. Han, L. Tian, W. Yan, and X. Li, ‘‘Studies onearthquake precursors in China: A review for recent 50 years,’’ GeodesyGeodynamics, vol. 8, no. 1, pp. 1–12, Jan. 2017.
[19] S. Goswami, S. Chakraborty, S. Ghosh, A. Chakrabarti, andB. Chakraborty, ‘‘A review on application of data mining techniques tocombat natural disasters,’’ Ain Shams Eng. J., vol. 9, no. 3, pp. 365–378,Sep. 2018.
[20] A. Galkina and N. Grafeeva, ‘‘Machine learning methods for earthquakeprediction: A survey,’’ in Proc. SEIM, 2019, p. 25.
[21] P. Jiao and A. H. Alavi, ‘‘Artificial intelligence in seismology: Advent,performance and future trends,’’ Geosci. Frontiers, vol. 11, no. 3,pp. 739–744, May 2020.
[22] A. Mignan and M. Broccardo, ‘‘Neural network applicationsin earthquake prediction (1994-2019): Meta-analytic insight ontheir limitations,’’ 2019, arXiv:1910.01178. [Online]. Available:http://arxiv.org/abs/1910.01178
[23] S. Uyeda, ‘‘The van method of short-term earthquake prediction,’’INCEDE Newslett., vol. 5, no. 4, pp. 2–4, 1997.
[24] S. López, A. A. Márquez, F. A. Márquez, and A. Peregrín, ‘‘Evolutionarydesign of linguistic fuzzy regression systems with adaptive defuzzi-fication in big data environments,’’ Cognit. Comput., vol. 11, no. 3,pp. 388–399, Jun. 2019.
[25] M. S. Kaiser, Z. I. Chowdhury, S. A. Mamun, A. Hussain, andM. Mahmud, ‘‘A neuro-fuzzy control system based on feature extractionof surface electromyogram signal for solar-powered wheelchair,’’ Cognit.Comput., vol. 8, no. 5, pp. 946–954, Oct. 2016.
[26] G. Sun, X. Rong, A. Zhang, H. Huang, J. Rong, and X. Zhang, ‘‘Multi-scale mahalanobis kernel-based support vector machine for classificationof high-resolution remote sensing images,’’ Cognit. Comput., to be pub-lished, doi: 10.1007/s12559-019-09631-5.
[27] I. Aljarah, A. M. Al-Zoubi, H. Faris, M. A. Hassonah, S. Mirjalili, andH. Saadeh, ‘‘Simultaneous feature selection and support vector machineoptimization using the grasshopper optimization algorithm,’’ Cognit.Comput., vol. 10, no. 3, pp. 478–495, Jun. 2018.
[28] S. B. Imandoust and M. Bolandraftar, ‘‘Application of k-nearest neighbor(knn) approach for predicting economic events: Theoretical background,’’Int. J. Eng. Res. Appl., vol. 3, pp. 605–610, Sep. 2013.
[29] A. Lulli, L. Oneto, and D. Anguita, ‘‘Mining big data with randomforests,’’ Cognit. Comput., vol. 11, no. 2, pp. 294–316, Apr. 2019.
[30] J. R. Quinlan, C4.5: Programs for Machine Learning. San Mateo, CA,USA: Morgan Kaufmann, 1992.
[31] M. Kaushik and B. Mathur, ‘‘Comparative study of K-means and hierar-chical clustering techniques,’’ Int. J. Softw. Hardw. Res. Eng., vol. 2, no. 6,pp. 93–98, 2014.
[32] F. Külahci, M. Inceöz, M. Dogru, E. Aksoy, and O. Baykara, ‘‘Artificialneural network model for earthquake prediction with radon monitoring,’’Appl. Radiat. Isot., vol. 67, no. 1, pp. 212–219, Jan. 2009.
[33] D. W. Marquardt, ‘‘An algorithm for least-squares estimation of nonlin-ear parameters,’’ J. Soc. Ind. Appl. Math., vol. 11, no. 2, pp. 431–441,Jun. 1963.
[34] Q. Zhang and C. Wang, ‘‘Using genetic algorithm to optimize artificialneural network: A case study on earthquake prediction,’’ in Proc. 2nd Int.Conf. Genetic Evol. Comput., Sep. 2008, pp. 128–131.
[35] M. Akhoondzadeh, ‘‘Genetic algorithm for TEC seismo-ionosphericanomalies detection around the time of the solomon (Mw=8.0) earthquakeof 06 February 2013,’’ Adv. Space Res., vol. 52, no. 4, pp. 581–590,Aug. 2013.
[36] C. Li and X. Liu, ‘‘An improved PSO-BP neural network and its appli-cation to earthquake prediction,’’ in Proc. Chin. Control Decis. Conf.(CCDC), May 2016, pp. 3434–3438.
[37] G. Zhao, H. Huang, and X. Lu, ‘‘Discriminating earthquakes and explo-sion events by seismic signals basing on BP-AdaBoost classifier,’’in Proc. 2nd IEEE Int. Conf. Comput. Commun. (ICCC), Oct. 2016,pp. 1965–1969.
[38] Y.Wang, Y. Chen, and J. Zhang, ‘‘The application of RBF neural networkin earthquake prediction,’’ in Proc. 3rd Int. Conf. Genetic Evol. Comput.,Oct. 2009, pp. 465–468.
[39] Y.Wang, Z. Wang, Z. Cao, and J. Lan, ‘‘Deep learning for magnitude pre-diction in earthquake early warning,’’ 2019, arXiv:1912.05531. [Online].Available: http://arxiv.org/abs/1912.05531
[40] A. Panakkat and H. Adeli, ‘‘Recurrent neural network for approximateearthquake time and location prediction using multiple seismicity indica-tors,’’ Comput.-Aided Civil Infrastruct. Eng., vol. 24, no. 4, pp. 280–292,May 2009.
[41] H. Cai, T. T. Nguyen, Y. Li, V. W. Zheng, B. Chen, G. Cong, and X. Li,‘‘Modeling marked temporal point process using multi-relation structureRNN,’’ Cogn. Comput., vol. 12, no. 3, pp. 499–512, May 2020.
[42] Q. Wang, Y. Guo, L. Yu, and P. Li, ‘‘Earthquake prediction based onspatio-temporal data mining: An LSTM network approach,’’ IEEE Trans.Emerg. Topics Comput., vol. 8, no. 1, pp. 148–158, Jan. 2020.
VOLUME 8, 2020 41

M. H. A. Banna et al.: Application of AI in Predicting Earthquakes: State-of-the-Art and Future Challenges
[43] J. Zheng, F. Cai, W. Chen, C. Feng, and H. Chen, ‘‘Hierarchical neuralrepresentation for document classification,’’ Cognit. Comput., vol. 11,no. 2, pp. 317–327, Apr. 2019.
[44] Z. Bofeng and L. Yue, ‘‘Customized explanation in expert system forearthquake prediction,’’ in Proc. 17th IEEE Int. Conf. Tools Artif. Intell.(ICTAI), 2005, p. 5.
[45] M. Zhong and Q. Zhang, ‘‘Prediction of reservoir-induced earthquakebased on fuzzy theory,’’ in Proc. ISNNS, 2010, pp. 101–104.
[46] A. Konstantaras, M. R. Varley, F. Vallianatos, J. P. Makris, G. Collins, andP. Holifield, ‘‘Detection of weak seismo-electric signals upon the record-ings of the electrotelluric field by means of neuro-fuzzy technology,’’IEEE Geosci. Remote Sens. Lett., vol. 4, no. 1, pp. 161–165, Jan. 2007.
[47] M. Mirrashid, M. Givehchi, M. Miri, and R. Madandoust, ‘‘Performanceinvestigation of neuro-fuzzy system for earthquake prediction,’’ Asian J.Civ. Eng., vol. 17, pp. 213–223, Jan. 2016.
[48] B. Rahmat, F. Afiadi, and E. Joelianto, ‘‘Earthquake prediction systemusing neuro-fuzzy and extreme learning machine,’’ in Proc. Int. Conf. Sci.Technol. (ICST ), 2018, pp. 452–458.
[49] A. Ikram and U. Qamar, ‘‘Developing an expert system based on associ-ation rules and predicate logic for earthquake prediction,’’ Knowl.-BasedSyst., vol. 75, pp. 87–103, Feb. 2015.
[50] A. Konstantaras, F. Vallianatos, M. R. Varley, and J. P. Makris, ‘‘Soft-computing modelling of seismicity in the southern hellenic arc,’’ IEEEGeosci. Remote Sens. Lett., vol. 5, no. 3, pp. 323–327, Jul. 2008.
[51] L. Dehbozorgi and F. Farokhi, ‘‘Notice of retraction: Effective featureselection for short-term earthquake prediction using neuro-fuzzy classi-fier,’’ inProc. 2nd IITA Int. Conf. Geosci. Remote Sens., vol. 2, Aug. 2010,pp. 165–169.
[52] W. Zeng, Y. Zhao, and Q. Yin, ‘‘Sugeno fuzzy inference algorithm andits application in epicentral intensity prediction,’’ Appl. Math. Model.,vol. 40, nos. 13–14, pp. 6501–6508, Jul. 2016.
[53] A. Andalib, M. Zare, and F. Atry, ‘‘A fuzzy expert system for earthquakeprediction, case study: The Zagros range,’’ 2016, arXiv:1610.04028.[Online]. Available: http://arxiv.org/abs/1610.04028
[54] M. N. Shodiq, D. H. Kusuma, M. G. Rifqi, A. R. Barakbah, and T. Har-sono, ‘‘Adaptive neural fuzzy inference system and automatic clusteringfor earthquake prediction in indonesia,’’ JOIV, Int. J. Informat. Vis., vol. 3,no. 1, pp. 47–53, Jan. 2019.
[55] R. Kamath and R. Kamat, ‘‘Earthquake magnitude prediction forandaman-nicobar islands: Adaptive neuro fuzzy modeling with fuzzysubtractive clustering approach,’’ J. Chem. Pharm. Sci., vol. 10, no. 3,pp. 1228–1233, 2017.
[56] A. Pandit and K. C. Biswal, ‘‘Prediction of earthquake magnitude usingadaptive neuro fuzzy inference system,’’ Earth Sci. Informat., vol. 12,no. 4, pp. 513–524, Dec. 2019.
[57] M. Mirrashid, ‘‘Earthquake magnitude prediction by adaptive neuro-fuzzy inference system (ANFIS) based on fuzzy C-means algorithm,’’Natural Hazards, vol. 74, no. 3, pp. 1577–1593, Dec. 2014.
[58] B. Bahrami and M. Shafiee, ‘‘Fuzzy descriptor models for earthquaketime prediction using seismic time series,’’ Int. J. Uncertainty, FuzzinessKnowl.-Based Syst., vol. 23, no. 4, pp. 505–519, Aug. 2015.
[59] C. Jiang, X. Wei, X. Cui, and D. You, ‘‘Application of support vectormachine to synthetic earthquake prediction,’’ Earthq. Sci., vol. 22, no. 3,pp. 315–320, Jun. 2009.
[60] W. Astuti, R. Akmeliawati, W. Sediono, and M. J. E. Salami, ‘‘Hybridtechnique using singular value decomposition (SVD) and support vec-tor machine (SVM) approach for earthquake prediction,’’ IEEE J. Sel.Topics Appl. Earth Observ. Remote Sens., vol. 7, no. 5, pp. 1719–1728,May 2014.
[61] P. Hajikhodaverdikhan, M. Nazari, M. Mohsenizadeh, S. Shamshirband,and K.-W. Chau, ‘‘Earthquake prediction with meteorological data byparticle filter-based support vector regression,’’ Eng. Appl. Comput. FluidMech., vol. 12, no. 1, pp. 679–688, Jan. 2018.
[62] Z. Huang, C. Yang, X. Zhou, and S. Yang, ‘‘Energy consumption fore-casting for the nonferrousmetallurgy industry using hybrid support vectorregression with an adaptive state transition algorithm,’’ Cogn. Comput.,vol. 12, no. 2, pp. 357–368, Mar. 2020.
[63] A. Li and L. Kang, ‘‘KNN-based modeling and its application in after-shock prediction,’’ in Proc. Int. Asia Symp. Intell. Interact. Affect. Com-put., Dec. 2009, pp. 83–86.
[64] N. Prasad, K. K. Reddy, and R. T. Nirjogi, ‘‘A novel approach for seismicsignal magnitude detection using Haar wavelet,’’ in Proc. 5th Int. Conf.Intell. Syst., Model. Simulation (ISMS), Jan. 2014, pp. 324–329.
[65] A. Panakkat and H. Adeli, ‘‘Neural network models for earthquakemagnitude prediction using multiple seismicity indicators,’’ Int. J. NeuralSyst., vol. 17, no. 1, pp. 13–33, Feb. 2007.
[66] I. U. Sikder and T. Munakata, ‘‘Application of rough set and decisiontree for characterization of premonitory factors of low seismic activity,’’Expert Syst. Appl., vol. 36, no. 1, pp. 102–110, Jan. 2009.
[67] Marisa, U. A. Sembiring, and H. Margaretha, ‘‘Earthquake prob-ability prediction in sumatra island using Poisson hidden Markovmodel (HMM),’’ in Proc. AIP Conf. Proc., 2019, vol. 2192, no. 1,Art. no. 090006.
[68] E. Florido, F. Martínez-Álvarez, A. Morales-Esteban, J. Reyes, andJ. L. Aznarte-Mellado, ‘‘Detecting precursory patterns to enhance earth-quake prediction in chile,’’ Comput. Geosci., vol. 76, pp. 112–120,Mar. 2015.
[69] E. Florido, G. Asencio–Cortés, J. L. Aznarte, C. Rubio-Escudero, andF. Martínez–Álvarez, ‘‘A novel tree-based algorithm to discover seismicpatterns in earthquake catalogs,’’ Comput. Geosci., vol. 115, pp. 96–104,Jun. 2018.
[70] M. N. Shodiq, A. R. Barakbah, and T. Harsono, ‘‘Spatial analysis of earth-quake distribution with automatic clustering for prediction of earthquakeseismicity in Indonesia,’’ in Proc. KCIC, 2015, pp. 24–26.
[71] M. N. Shodiq, D. H. Kusuma, M. G. Rifqi, A. R. Barakbah, andT. Harsono, ‘‘Neural network for earthquake prediction based on auto-matic clustering in indonesia,’’ JOIV, Int. J. Informat. Vis., vol. 2, no. 1,p. 37, Feb. 2018.
[72] M. N. Shodiq, D. H. Kusuma, M. G. Rifqi, A. R. Barakbah, andT. Harsono, ‘‘Spatial analisys of magnitude distribution for earthquakeprediction using neural network based on automatic clustering in Indone-sia,’’ in Proc. IES-KCIC, 2017, pp. 246–251.
[73] J. Mejia, K. Rojas, N. Valeza, and A. R. Villagracia, ‘‘Earthquake pre-diction through Kannan-mathematical-model analysis and dobrovolsky-based clustering technique,’’ in Proc. DLSU Res. Congr., Mar. 2015,pp. 1–6.
[74] K. Tan and X. Cai, ‘‘Prediction of earthquake in Yunnan region based onthe AHC over sampling,’’ in Proc. Chin. Control Decis. Conf., May 2010,pp. 2449–2452.
[75] Y. Lu, E. Sawada, and G. Chakraborty, ‘‘Earthquake aftershock predictionbased solely on seismograph data,’’ in Proc. IEEE Int. Conf. Big DataSmart Comput. (BigComp), Feb. 2019, pp. 1–6.
[76] X. Shao, X. Li, L. Li, and X. Hu, ‘‘The application of ant-colony clus-tering algorithm to earthquake prediction,’’ in Proc. Adv. Electron. Eng.Commun. Manag., 2012, pp. 145–150.
[77] X. Y. Zhang, X. Li, and X. Lin, ‘‘The data mining technology of particleswarm optimization algorithm in earthquake prediction,’’ in Proc. Adv.Mater. Res., vol. 989, 2014, pp. 1570–1573.
[78] A. S. N. Alarifi, N. S. N. Alarifi, and S. Al-Humidan, ‘‘Earthquakesmagnitude predication using artificial neural network in northern red seaarea,’’ J. King Saud Univ. Sci., vol. 24, no. 4, pp. 301–313, Oct. 2012.
[79] W. S. Hu, H. Wang, and H. L. Nie, ‘‘Regional short-term earthquakeprediction model based on BP neural network,’’ Appl. Mech. Mater.,vols. 166–169, pp. 2309–2314, May 2012.
[80] J. Reyes, A. Morales-Esteban, and F. Martínez-Álvarez, ‘‘Neural net-works to predict earthquakes in chile,’’ Appl. Soft Comput., vol. 13, no. 2,pp. 1314–1328, Feb. 2013.
[81] A. Morales-Esteban, F. Martínez-Álvarez, and J. Reyes, ‘‘Earthquakeprediction in seismogenic areas of the iberian peninsula based on compu-tational intelligence,’’ Tectonophysics, vol. 593, pp. 121–134, May 2013.
[82] M. Moustra, M. Avraamides, and C. Christodoulou, ‘‘Artificial neu-ral networks for earthquake prediction using time series magnitudedata or seismic electric signals,’’ Expert Syst. Appl., vol. 38, no. 12,pp. 15032–15039, Nov. 2011.
[83] F. Xu, X. Song, X. Wang, and J. Su, ‘‘Neural network model for earth-quake prediction using DMETER data and seismic belt information,’’ inProc. 2ndWRI Global Congr. Intell. Syst., vol. 3, Dec. 2010, pp. 180–183.
[84] S. Narayanakumar and K. Raja, ‘‘A BP artificial neural network modelfor earthquake magnitude prediction in himalayas, india,’’ Circuits Syst.,vol. 07, no. 11, pp. 3456–3468, 2016.
[85] A. Cheraghi and A. Ghanbari, ‘‘Study of risk analysis and earthquakemagnitude and timing prediction via tectonic and geotechnical propertiesof the faults and identifying risky areas in terms of seismicity in larestancity using ann,’’ Rev. QUID, vol. 2017, no. 1, pp. 1137–1142, 2017.
[86] J. Xie, J. F. Qiu, W. Li, and J. W. Wang, ‘‘The application of neuralnetwork model in earthquake prediction in East China,’’ in Proc. Adv.Comput. Sci. Intell. Syst. Environ., 2011, pp. 79–84.
42 VOLUME 8, 2020

M. H. A. Banna et al.: Application of AI in Predicting Earthquakes: State-of-the-Art and Future Challenges
[87] F. Zhou and X. Zhu, ‘‘Earthquake prediction based on lm-bp neuralnetwork,’’ in Proc. 9th LDIA, 2014, pp. 13–20.
[88] L. Ma, F. Xu, X. Wang, and L. Tang, ‘‘Earthquake prediction basedon levenberg-marquardt algorithm constrained back-propagation neuralnetwork using DEMETER data,’’ in Proc. KSEM, 2010, pp. 591–596.
[89] W. S. Hu, H. L. Nie, and H. Wang, ‘‘Applied research of BP neuralnetwork in earthquake prediction,’’ in Proc. Appl. Mech. Mater., vol. 204,2012, pp. 2449–2454.
[90] F. Martínez-Álvarez, J. Reyes, A. Morales-Esteban, andC. Rubio-Escudero, ‘‘Determining the best set of seismicity indicators topredict earthquakes. Two case studies: Chile and the iberian peninsula,’’Knowl.-Based Syst., vol. 50, pp. 198–210, Sep. 2013.
[91] A. Okada and Y. Kaneda, ‘‘Neural network learning: Crustal state esti-mation method from time-series data,’’ in Proc. Int. Conf. Control, Artif.Intell., Robot. Optim. (ICCAIRO), May 2018, pp. 141–146.
[92] J.-W. Lin, C.-T. Chao, and J.-S. Chiou, ‘‘Determining neuronal number ineach hidden layer using earthquake catalogues as training data in trainingan embedded back propagation neural network for predicting earthquakemagnitude,’’ IEEE Access, vol. 6, pp. 52582–52597, 2018.
[93] S. Sri Lakshmi and R. K. Tiwari, ‘‘Model dissection from earthquake timeseries: A comparative analysis using modern non-linear forecasting andartificial neural network approaches,’’ Comput. Geosci., vol. 35, no. 2,pp. 191–204, Feb. 2009.
[94] S. Niksarlioglu and F. Kulahci, ‘‘An artificial neural network model forearthquake prediction and relations between environmental parametersand earthquakes,’’ in Proc. WASET, no. 74, 2013, p. 616.
[95] W.-Z. Zhou, J.-S. Kan, and S. Sun, ‘‘Study on seismic magnitude pre-diction based on combination algorithm,’’ in Proc. 9th Int. Conf. Model.,Identificat. Control (ICMIC), Jul. 2017, pp. 539–544.
[96] A. A. Suratgar, F. Setoudeh, A. H. Salemi, and A. Negarestani, ‘‘Mag-nitude of earthquake prediction using neural network,’’ in Proc. 4th Int.Conf. Natural Comput., 2008, pp. 448–452.
[97] M. H. Rafiei and H. Adeli, ‘‘NEEWS: A novel earthquake early warningmodel using neural dynamic classification and neural dynamic optimiza-tion,’’ Soil Dyn. Earthq. Eng., vol. 100, pp. 417–427, Sep. 2017.
[98] S. Fong, Z. Nannan, R. K. Wong, and X.-S. Yang, ‘‘Rare events forecast-ing using a residual-feedback GMDH neural network,’’ in Proc. IEEE12th Int. Conf. Data Mining Workshops, Dec. 2012, pp. 464–473.
[99] S. K. Majhi, S. S. Hossain, and T. Padhi, ‘‘MFOFLANN: Moth flameoptimized functional link artificial neural network for prediction of earth-quake magnitude,’’ Evolving Syst., vol. 11, no. 1, pp. 45–63, Mar. 2020.
[100] Z. Tao, ‘‘Artificial neural network attempts for long-term evaluation ofgreat earthquakes,’’ in Proc. 11th Int. Conf. Natural Comput. (ICNC),Aug. 2015, pp. 1128–1132.
[101] H. Shah and R. Ghazali, ‘‘Prediction of earthquake magnitude by animproved ABC-MLP,’’ in Proc. Develop. E-Syst. Eng., Dec. 2011,pp. 312–317.
[102] M. Maya and W. Yu, ‘‘Short-term prediction of the earthquake throughneural networks and meta-learning,’’ in Proc. 16th Int. Conf. Electr. Eng.,Comput. Sci. Autom. Control (CCE), Sep. 2019, pp. 1–6.
[103] Y. Liu, Y. Li, G. Li, B. Zhang, and G. Wu, ‘‘Constructive ensemble ofRBF neural networks and its application to earthquake prediction,’’ inProc. ISNN, 2005, pp. 532–537.
[104] Y. Chen, J. Zhang, and J. He, ‘‘Research on application of earthquakeprediction based on chaos theory,’’ in Proc. Int. Conf. Intell. Comput.Integr. Syst., Oct. 2010, pp. 753–756.
[105] S. D’Amico, M. Cacciola, F. Parrillo, F. Carlo Morabito, M. Versaci,and V. Barrile, ‘‘Heuristic advances in identifying aftershocks in seismicsequences,’’ Comput. Geosci., vol. 35, no. 2, pp. 245–254, Feb. 2009.
[106] E. Amar, T. Khattab, and F. Zad, ‘‘Intelligent earthquake predictionsystem based on neural network,’’ Int. J. Environ. Chem. Ecol. Geol.Geophys. Eng., vol. 8, no. 12, p. 874, 2014.
[107] S.-Z. Huang, ‘‘The prediction of the earthquake based on neutral net-works,’’ in Proc. ICCDA, vol. 2, 2010, pp. V2–517.
[108] G. Asencio-Cortés, F. Martínez-Álvarez, A. Morales-Esteban, andJ. Reyes, ‘‘A sensitivity study of seismicity indicators in supervised learn-ing to improve earthquake prediction,’’ Knowl.-Based Syst., vol. 101,pp. 15–30, Jun. 2016.
[109] W. Li, N. Narvekar, N. Nakshatra, N. Raut, B. Sirkeci, and J. Gao,‘‘Seismic data classification using machine learning,’’ in Proc. IEEE 4thInt. Conf. Big Data Comput. Service Appl. (BigDataService), Mar. 2018,pp. 56–63.
[110] K. M. Asim, S. S. R. Moustafa, I. A. Niaz, E. A. Elawadi, T. Iqbal, andF. Martínez-Álvarez, ‘‘Seismicity analysis and machine learning modelsfor short-term lowmagnitude seismic activity predictions in Cyprus,’’ SoilDyn. Earthq. Eng., vol. 130, Mar. 2020, Art. no. 105932.
[111] K. M. Asim, A. Idris, F. Martinez-Alvarez, and T. Iqbal, ‘‘Short termearthquake prediction in hindukush region using tree based ensemblelearning,’’ in Proc. Int. Conf. Frontiers Inf. Technol. (FIT), Dec. 2016,pp. 365–370.
[112] S. Karimzadeh, M. Matsuoka, J. Kuang, and L. Ge, ‘‘Spatial prediction ofaftershocks triggered by a major earthquake: A binary machine learningperspective,’’ ISPRS Int. J. Geo-Inf., vol. 8, no. 10, p. 462, Oct. 2019.
[113] E. Celik, M. Atalay, and A. Kondiloglu, ‘‘The earthquake magnitudeprediction used seismic time series and machine learning methods,’’ inProc. ENTECH, Dec. 2016, pp. 50–56.
[114] S. Kanarachos, S.-R.-G. Christopoulos, A. Chroneos, andM. E. Fitzpatrick, ‘‘Detecting anomalies in time series data via adeep learning algorithm combining wavelets, neural networks andHilbert transform,’’ Expert Syst. Appl., vol. 85, pp. 292–304, Nov. 2017.
[115] T. Bhandarkar, V. K, N. Satish, S. Sridhar, R. Sivakumar, and S. Ghosh,‘‘Earthquake trend prediction using long short-term memory RNN,’’ Int.J. Electr. Comput. Eng. (IJECE), vol. 9, no. 2, p. 1304, Apr. 2019.
[116] K. M. Asim, F. Martínez-Álvarez, A. Basit, and T. Iqbal, ‘‘Earthquakemagnitude prediction in hindukush region using machine learning tech-niques,’’ Natural Hazards, vol. 85, no. 1, pp. 471–486, Jan. 2017.
[117] G. Asencio–Cortés, A. Morales–Esteban, X. Shang, andF. Martínez–Álvarez, ‘‘Earthquake prediction in California usingregression algorithms and cloud-based big data infrastructure,’’ Comput.Geosci., vol. 115, pp. 198–210, Jun. 2018.
MD. HASAN AL BANNA (Associate Member,IEEE) was born in Dhaka, Bangladesh, in 1997.He received the B.Sc. degree in informationand communication technology (ICT) from theBangladesh University of Professionals, Dhaka,in 2019, where he is currently pursuing the mas-ter’s degree. He is currently working as a TeachingAssistant with the Bangladesh University of Pro-fessionals. He has published a conference paper oncameramodel identification and currently working
on earthquake prediction, Bangla handwritten characters, and AI for mentalhealth. His research interest includes the application of AI and ML. He wasawarded the Fellowship from the Bangladesh ICT Division for his master’sthesis.
KAZI ABU TAHER received the Ph.D. degreefrom the Bangladesh University of Engineeringand Technology, Dhaka, Bangladesh. He is cur-rently a Research Fellow with the City, Universityof London, U.K., and a Visiting Scholar with theNational University of Singapore. He has beenserving as a Professor with the Bangladesh Univer-sity of Professionals. His research interests includephotonics, networking, communication security,block chain security, and ICT in pedagogy.
VOLUME 8, 2020 43

M. H. A. Banna et al.: Application of AI in Predicting Earthquakes: State-of-the-Art and Future Challenges
M. SHAMIM KAISER (Senior Member, IEEE)received the bachelor’s and master’s degreesin applied physics, electronics, and commu-nication engineering from the University ofDhaka, Bangladesh, in 2002 and 2004, respec-tively, and the Ph.D. degree in telecommunica-tion engineering from the Asian Institute of Tech-nology (AIT) Pathumthani, Thailand, in 2010.In 2005, he joined the Department of ETE,Daffodil International University, as a Lecturer.
In 2010, he has worked as an Assistant Professor with the Department ofEEE, Eastern University, Bangladesh, and the Department of MNS, BRACUniversity, Dhaka. Since 2011, he has been an Assistant Professor with theInstitute of Information Technology, Jahangirnagar University, Dhaka, wherehe became an Associate Professor, in 2015, and a Full Professor, in 2019.He has authoredmore than 100 papers in different peer-reviewed journals andconferences. His current research interests include data analytics, machinelearning, wireless networks and signal processing, cognitive radio networks,big data and cyber security, and renewable energy. He is a LifeMember of theBangladesh Electronic Society and the Bangladesh Physical Society. He isalso a Senior Member of USA and IEICE, Japan, and a Volunteer of theIEEE Bangladesh Section. He is the founding Chapter Chair of the IEEEBangladesh Section Computer Society Chapter.
MUFTI MAHMUD (Senior Member, IEEE)received the Ph.D. degree in information engineer-ing from the University of Padova, Italy, in 2011.He is currently a Senior Lecturer of computingwith Nottingham Trent University, U.K. He hasbeen serving at various positions in the industryand academia in India, Bangladesh, Italy, Belgium,and U.K., since 2003. He is an expert in computa-tional intelligence, applied data analysis, and bigdata technologies with a keen focus on healthcare
applications. He has published over 100 peer-reviewed articles and papersin leading journals and conferences. He is also Senior Member of ACM,a Professional Member of the British Computer Society, and a Fellow of theHigher Education Academy, U.K. During the year 2020–2021, he has beenserving as the Vice Chair of the Intelligent System Application TechnicalCommittee of IEEE Computational Intelligence Society (CIS), a member ofthe IEEE CIS Task Force on Intelligence Systems for Health and the IEEER8 Humanitarian Activities Subcommittee, the Publications Chair of theIEEE UK and Ireland Industry Applications Chapter, and a Project LiaisonOfficer of the IEEE UK and Ireland SIGHT Committee. He was a recipientof the Marie-Curie Postdoctoral Fellowship. He has also been serving asthe coordinating Chair of the local organizing committee of the IEEE-WCCI2020; theGeneral Chair of BI2020 andBI2021; and the ProgramChairof IEEE-CICARE2020 and IEEE-CICARE2021. He serves as an AssociateEditor for Cognitive Computation, IEEE ACCESS, and Big Data Analyticsjournals, and a Regional Editor (Europe) for Brain Informatics journal.
MD. SAZZADUR RAHMAN (Member, IEEE)received the B.Sc. and M.S. degrees in appliedphysics, electronics, and communication engineer-ing from the University of Dhaka, Bangladesh,in 2005 and 2006, respectively, and the Ph.D.degree in material science from Kyushu Univer-sity, Japan, in 2015. He has worked as a FacultyMember with the Faculty of Computer Science andEngineering, Hajee Mohammad Danesh Scienceand Technology University, from May 2009 to
November 2018. Since November 2018, he has been serving with theInstitute of Information Technology, Jahangirnagar University, Dhaka,Bangladesh, where he currently works as an Assistant Professor. His researchinterests include material science for computer application, surface science,ubiquitous computing, WSNs, blockchain, machine learning, and the IoT.
A. S. M. SANWAR HOSEN (Member, IEEE)received the M.S. and Ph.D. degrees in com-puter science and engineering (CSE) from JeonbukNational University (JBNU), Jeonju, South Korea,in 2013 and 2017, respectively. He has workedas a Postdoctoral Researcher with the Schoolof Computer, Information, and CommunicationEngineering, KunsanNational University, Gunsan,South Korea, and the Division of CSE, JBNU,where he is currently an Assistant Professor
(Research). He has published several papers in journals and interna-tional conferences. His research interests include wireless sensor networks,the Internet of Things, network security, data distribution services, fog-cloudcomputing, artificial intelligence, blockchain, and green IT. He serves as areviewer of several reputed journals.
GI HWAN CHO (Member, IEEE) received theB.S. degree in computer science from Chon-nam University, Gwangju, South Korea, in 1985,the M.S. degree in computer science from SeoulNational University, Seoul, Korea, in 1987, and thePh.D. degree in computing science from the Uni-versity of Newcastle, Newcastle Upon Tyne, U.K.,in 1996. He has worked with the Electronics andTelecommunications Research Institute (ETRI),Daejeon, South Korea, as a Senior Member of
Technical Staff, from September 1987 to August 1997; and the Departmentof Computer Science, Mokpo National University, Mokpo, South Korea,as a full-time Lecturer, from September 1997 to February 1999. FromMarch 1999, he joined the Division of Computer Science and Engineering,Jeonbuk National University, Jeonju, South Korea, where he is currentlyserving as a Professor. His current research interests include mobile com-puting, computer communication, security on wireless networks, wirelesssensor networks, and distributed computing systems.
44 VOLUME 8, 2020
Copyright © 2022 FDOKUMEN