Numerical modelling of lumpy clay landfill
34
Numerical modelling of lumpy clay landfill J. Najser, D. Mašín * and J. Boháč Faculty of Science, Charles University in Prague, Czech Republic ABSTRACT Two trial motorway embankments built on a landfill consisting of clayey lumps were monitored over the period of 3 and 5 years respectively. The subsoil of the embankment was instrumented by hydrostatic levelling profiles, pore pressure transducers and depth reference points installed in boreholes. An advanced constitutive model for clays (hypoplastic model for clays with meta-stable structure) was used for numerical modelling of both case histories. Basic hypoplastic model for clays was calibrated using isotropic compression tests and triaxial compression tests on reconstituted clay. Three additional model parameters describing the effects of lumpy structure were calibrated using oedometer tests on specimens prepared from scaled down lumpy material (material with smaller size of clay lumps). The performance of the model was evaluated by comparison with the results of the centrifuge model of self weight consolidated landfill. Finally, the hypoplastic model was used for simulation of both trial embankments and the results were compared with in situ measurements. The degradation of the lumpy structure of the upper layer of the in situ landfill due to weathering was back analyzed using monitoring data. KEY WORDS: clay; hypoplasticity; double porosity; soil structure; high compressibility; embankment * Correspondence to: David Mašín, Faculty of Science, Charles University in Prague, Albertov 6, 128 43 Prague 2, Czech Republic. E-mail: [email protected] 1
Transcript of Numerical modelling of lumpy clay landfill

Numerical modelling of lumpy clay landfill
J. Najser, D. Mašín* and J. Boháč
Faculty of Science, Charles University in Prague, Czech Republic
ABSTRACT
Two trial motorway embankments built on a landfill consisting of clayey lumps were monitored
over the period of 3 and 5 years respectively. The subsoil of the embankment was instrumented by
hydrostatic levelling profiles, pore pressure transducers and depth reference points installed in
boreholes. An advanced constitutive model for clays (hypoplastic model for clays with meta-stable
structure) was used for numerical modelling of both case histories. Basic hypoplastic model for
clays was calibrated using isotropic compression tests and triaxial compression tests on
reconstituted clay. Three additional model parameters describing the effects of lumpy structure were
calibrated using oedometer tests on specimens prepared from scaled down lumpy material (material
with smaller size of clay lumps). The performance of the model was evaluated by comparison with
the results of the centrifuge model of self weight consolidated landfill. Finally, the hypoplastic
model was used for simulation of both trial embankments and the results were compared with in
situ measurements. The degradation of the lumpy structure of the upper layer of the in situ landfill
due to weathering was back analyzed using monitoring data.
KEY WORDS: clay; hypoplasticity; double porosity; soil structure; high compressibility; embankment
* Correspondence to: David Mašín, Faculty of Science, Charles University in Prague, Albertov 6, 128 43 Prague 2, Czech Republic. E-mail: [email protected]
1

1. INTRODUCTION
In North-Western Bohemia (Czech Republic), large areas are influenced by open cast mining of
brown coal (Fig. 1). The coal seam is up to 30 m thick and it is situated at depths of up to 150 m.
The overburden is composed of stiff clays and claystones, which are excavated during the mining
process and placed into large spoil heaps as irregularly shaped lumps ranging from dust size up to
blocks of 0.5 m in diameter. Initially, external landfills are created, whose thickness reaches up
to100 m. In the later phases of the exploitation, when the mine pits are large enough, they are
backfilled with the excavated soil. The thickness of these internal landfills is up to 200 m. The total
area of landfills exceeds 100 km2. Due to the large area affected by mining, landfill areas have a
potential for engineering development and they need to be considered as a construction subsoil,
which implies a need for a detailed study of their mechanical behaviour.
The lumpy clay landfill material represents an example of a double porosity soil with two distinct
pore systems. In addition to the voids within intact clay lump the double porosity soil has also voids
between the clay lumps. Voids within clay lumps are measured by the intragranular porosity (ni),
which is defined as the ratio of the voids within the lumps and the total volume of the lumps. The
size of the voids between clay lumps is measured by the intergranular porosity (ne), defined as the
ratio of the voids between the lumps and the total volume of the soil. The total porosity of the fill nt
can then be calculated from
(1)
2
n t = ni 1 − ne ne
Fig. 1: Tertiary basins with brown coal seam in NW Bohemia: 1 – Cheb Basin, 2 – Sokolov Basin, 3 – Most Basin, 4 – Zittau Basin.

and it may reach up to 70% in the case of the lumpy clay landfills [1]. An alternative definition of
the intragranular porosity (volume of intra-aggregate pores divided by total volume of soil) was put
forward by Koliji et al. [2].
Within the scientific literature, the term “double porosity” material is used for any material with two
distinct pore systems. Most of the research on double-porosity materials is related to the behaviour
of unsaturated fine-grained soils. In particular, the soil compacted on the dry side of optimum water
content is often found to have a distinct double-porosity structure, with the size of micro-pores
(intragranular pores) of the order of 0.1-1 μm and the size of macro-pores of the order of 10-100
μm. The aggregates of fine particles are in this case formed naturally by the physico-chemical
phenomena at the clay particle level. For the related literature, see for example [3-9].
The double-porosity material studied in this paper is different in nature from the material described
in the previous paragraph. The size of the lumps, and thus also the size of the macro-pores, is of the
order of magnitude of 0.1-1 m, and thus 4 orders of magnitude larger then in the case of typical
compacted fine-grained soil. The lumps are created by the artificial mechanical disintegration of the
more-or-less homogeneous deposit of fine-grained soil of different consistency. The literature
describing the mechanical behaviour of such double-porosity media is more scarce. Most of the
research was associated with the behaviour of the lumpy clay landfills originating as a by-product
of open cast mining, or with the investigation of the mechanical properties of the clay lumps
dredged out from the seabed. Experimental investigation of the behaviour of a dredged lumpy clay
used in Singapore for land reclamation was described by Robinson et al. [10] and Karthikeyan et al.
[11]. Similar material was used for land reclamation in Halmstad Harbor, Sweden [12]. Further
experimental studies on the behaviour of dredged lumpy material are in [13,14].
A summary of the field monitoring of the behaviour of mining landfills from various sites can be
found in [15-17]. The following common features were described from different sites: large and
nonuniform compressibility associated with the degradation of the lumpy structure, creep of the
landfill and collapsible behaviour of the fill after the first saturation. Soon after filling, the soil can
be described as a granular material (Fig. 2a). Over time and with increasing load, the structure of
the fill changes, the macrovoids are reduced in size and filled with clay (Fig. 2b) and the overall
mechanical behaviour then resembles single porosity fine grained soil [18]. The behaviour of the
landfill at each site is influenced by the specific conditions – mechanical properties of the lump
material, shape of the lumps, lump size distribution, compaction during filling, groundwater
3

conditions and stress history.
The fundamental principles governing the behaviour of double-porous media were studied by a
number of authors. The general consolidation theory of double-porous medium was proposed by
Aifantis [19] and Wilson and Aifantis [20], and it was later on refined by Khalili and Valliapan [21]
and Yang et al. [22,23]. These works, however, focus on the hydro-mechanical coupling and
consolidation of double-porous media, rather then on an accurate quantitative description of the
mechanical behaviour of lumpy material. The behaviour of these soils is fairly complex, due to the
combination of the non-linear mechanical behaviour of the lumps and degradation of the double-
porosity structure, which is itself controlled by various phenomena (mechanical loading, weathering
processes, etc.). Considering all these effects within models that take into account micro-mechanics
of such a material may be a tedius task. Among few examples, Doležalová and Kořán [24]
presented DEM modelling of lumpy material. Callari and Federico [25] compared consolidation
reponse of double porous medium predicted by the micro-mechanical model based on FEM and
predictions by a model of a homogeneous equivalent double porosity medium.
Due to the difficulties in accurate description of the micro-mechanical behaviour of lumpy material,
it is often preferable to use phenomenological models based on the experimental observation of the
overall mechanical behaviour of these soils. A constitutive framework for the mechanical behaviour
of soils with the double porosity structure was developed by Koliji et al. [2] based on experimental
data summarised by Koliji et al [26]. Oedometer tests on aggregated soil revealed that the yield
limit of the double porosity soil is a function not only of stress state and stress history, but also of
the particular soil structure. Based on the experimental results, a new state parameter was proposed
to quantify the double porosity soil structure. Similar approach was used by Mašín et al. [27]. More
details on constitutive modelling of double porosity soils are given in Sec. 3.
4

In this paper, we focus on the mechanical behaviour of double-porous material with large inter-
aggregate pores (lumpy material). The behaviour of this material is described using a
phenomenological constitutive model based on the overall mechanical response of this complex soil
(namely, a hypoplastic model enhanced by the effects of structure). The paper is organised as
follows. After the introductory sections, the calibration of the hypoplastic model for structured clays
is described based on laboratory experiments on the reconstituted and undisturbed clayfill material
and lumpy clayfill material with scaled-down granulometry. The model is then evaluated by means
of finite element simulations of the centrifuge model of an embankment on a lumpy clay landfill
with scaled-down granulometry, to demonstrate its predictive capabilities. Subsequently, two real-
size motorway embankments on the landfill are simulated using the adopted models. Finally, the
inter-granular porosity degradation of the landfill during 15 years between heaping and construction
of the embankments is quantified by means of inverse analysis of the monitored data.
2. TRIAL EMBANKMENTS
A new motorway between Prague (Czech Republic) and Dresden (Germany) crosses 20 to 30 years
old landfill of the Most basin (Fig. 1). The total length of the sections crossing the old lumpy clay
landfills is approximately 6 km. Before the construction of the motorway, two trial embankments
had been built on its route. The thickness of the landfill at the site was approximately 30 m. The
first embankment (Embankment 1) was located at a site where 3.5 m thick permeable layer of fly
ash had been deposited on the top of the landfill after the landfill heaping. No fly ash was present at
the site of the second embankment (Embankment 2). The embankments were monitored for 3 and 5
years respectively.
5
Fig. 2: Landfill during construction (a) and after 15 years of self-weight consolidation and weathering (b).
The landfill material at the site of interest possesses an average total porosity of 40%, liquid limit
of 72% and plasticity index of 45%. The mineralogical composition determined by X-Ray
diffraction analysis is 36% kaolinite, 25% smectite, 11% illite and 21% quartz. The process of the
landfill construction is as follows: After the excavation, the clay lumps are transported by conveyor
belts and filled with stowing machines with rotating boom. In the process, the lumpy material forms
conical heaps, and some size segregation of the lumps takes place. Therefore, the resulting landfills
are not homogeneous and differential settlements should be expected. Generally, there has been lack
of information on the method of filling and on the initial conditions (for example existence of
effective drainage) and therefore the prediction of the mechanical behaviour of the old landfills is
difficult.
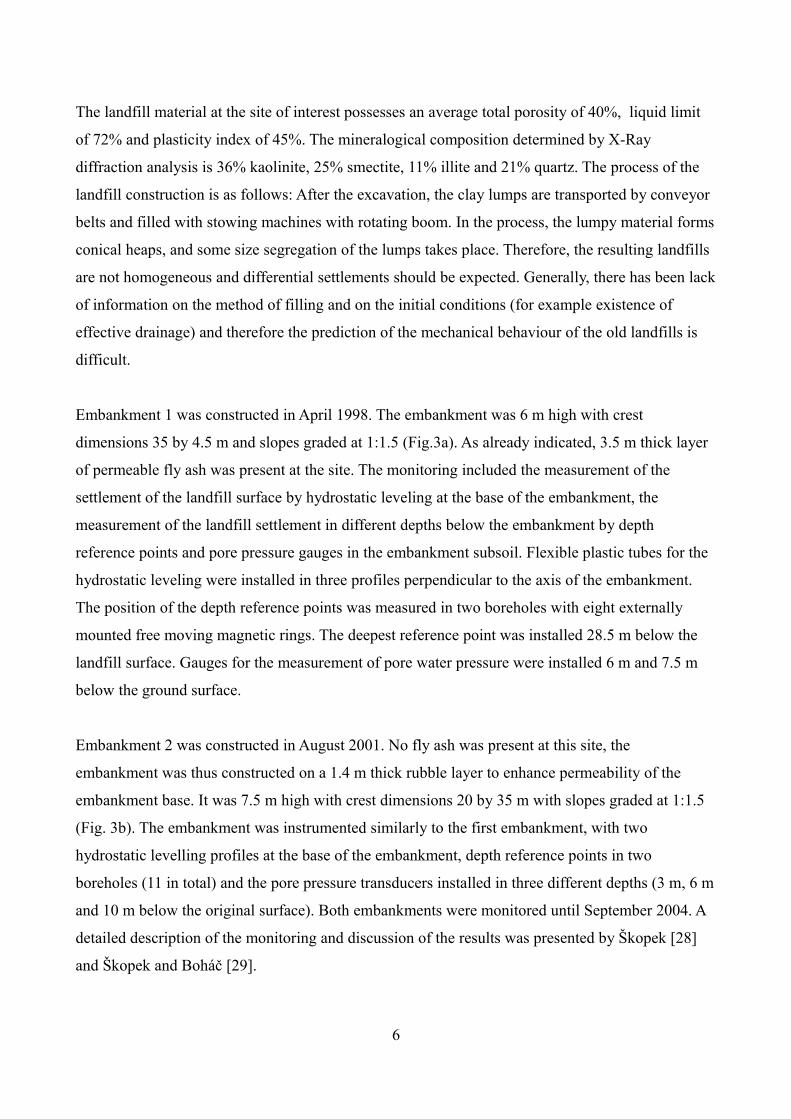
Embankment 1 was constructed in April 1998. The embankment was 6 m high with crest
dimensions 35 by 4.5 m and slopes graded at 1:1.5 (Fig.3a). As already indicated, 3.5 m thick layer
of permeable fly ash was present at the site. The monitoring included the measurement of the
settlement of the landfill surface by hydrostatic leveling at the base of the embankment, the
measurement of the landfill settlement in different depths below the embankment by depth
reference points and pore pressure gauges in the embankment subsoil. Flexible plastic tubes for the
hydrostatic leveling were installed in three profiles perpendicular to the axis of the embankment.
The position of the depth reference points was measured in two boreholes with eight externally
mounted free moving magnetic rings. The deepest reference point was installed 28.5 m below the
landfill surface. Gauges for the measurement of pore water pressure were installed 6 m and 7.5 m
below the ground surface.
Embankment 2 was constructed in August 2001. No fly ash was present at this site, the
embankment was thus constructed on a 1.4 m thick rubble layer to enhance permeability of the
embankment base. It was 7.5 m high with crest dimensions 20 by 35 m with slopes graded at 1:1.5
(Fig. 3b). The embankment was instrumented similarly to the first embankment, with two
hydrostatic levelling profiles at the base of the embankment, depth reference points in two
boreholes (11 in total) and the pore pressure transducers installed in three different depths (3 m, 6 m
and 10 m below the original surface). Both embankments were monitored until September 2004. A
detailed description of the monitoring and discussion of the results was presented by Škopek [28]
and Škopek and Boháč [29].
6
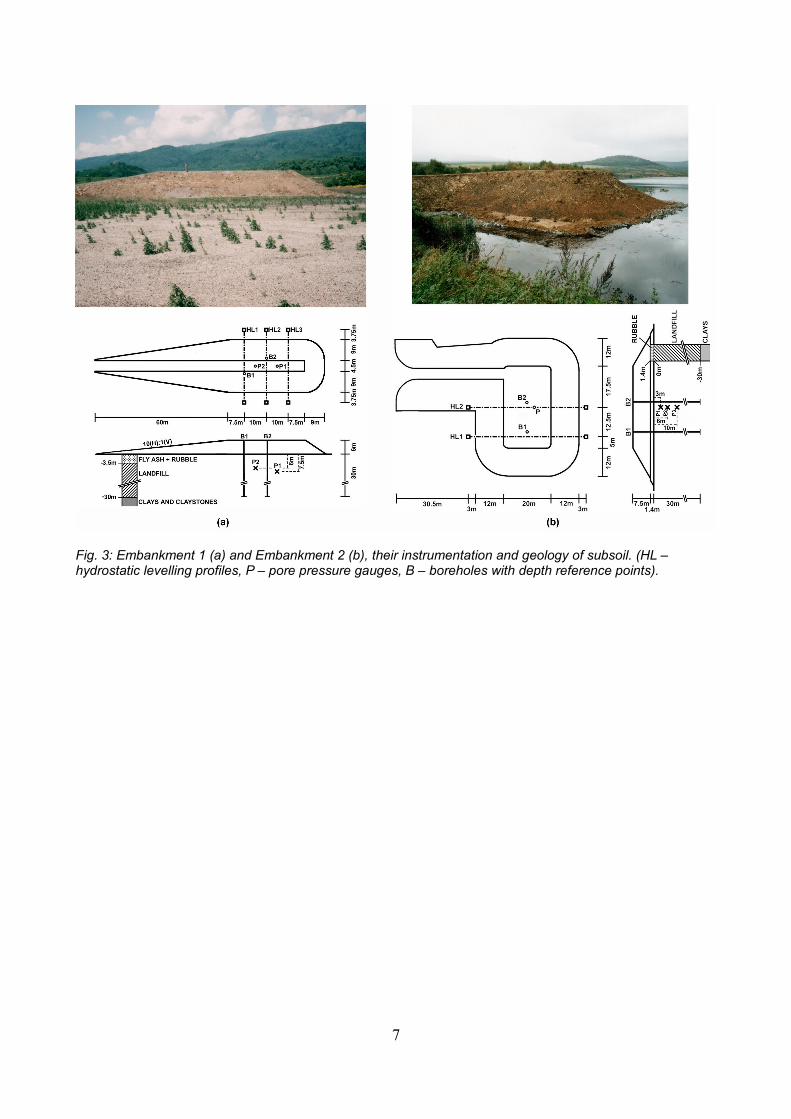
Fig. 3: Embankment 1 (a) and Embankment 2 (b), their instrumentation and geology of subsoil. (HL – hydrostatic levelling profiles, P – pore pressure gauges, B – boreholes with depth reference points).
7

Fig. 4: Ground water level variations during the monitoring of embankments.
Due to the pumping of water from nearby fly ash lagoon, the ground water level varied during the
period of the monitoring of both embankments, as shown in Fig. 4. The pumping was interrupted in
the period 1999 to 2003, which resulted in a rise of water level above soil surface. After resuming
the pumping in 2003, water level decreased approximately 5 m below the surface.
The settlement in the central axis of both embankments is presented in Fig. 5a. The fast initial
settlement immediately after the construction is followed by the slower deformation in the
following years. The final settlements of 0.23 and 0.58 m were measured under Embankments 1 and
2, respectively. The data from the depth reference points are presented in Figs. 5b and 5c. In the
case of Embankment 1 (Fig. 5b) the measurement from June 2000 is presented, because the data
from the later measurements are incomplete and influenced by the heave associated with the rising
water level. The intervals of measurement are shown in Fig. 4 (these intervals were also subject of
the numerical modelling). The settlement of depth reference points under Embankment 2 (Fig. 5c)
corresponds to the last measurement, which was carried out in September 2004. The data from the
depth reference points indicate, that the affected zone below the embankments is limited to the
upper 20-25 m.
8
Jan-
97
Jan-
98
Jan-
99
Jan-
00
Jan-
01
Jan-
02
Jan-
03
Jan-
04
Jan-
05
-8
-6
-4
-2
0
2
Posi
tion
of w
ater
leve
l (m
)
water level
LANDFILL SURFACE
TRIAL EMBANKMENT 2
PUMPING OF WATER PUMPING RESTORED
TRIAL EMBANKMENT 1
PUMPING INTERRUPTED
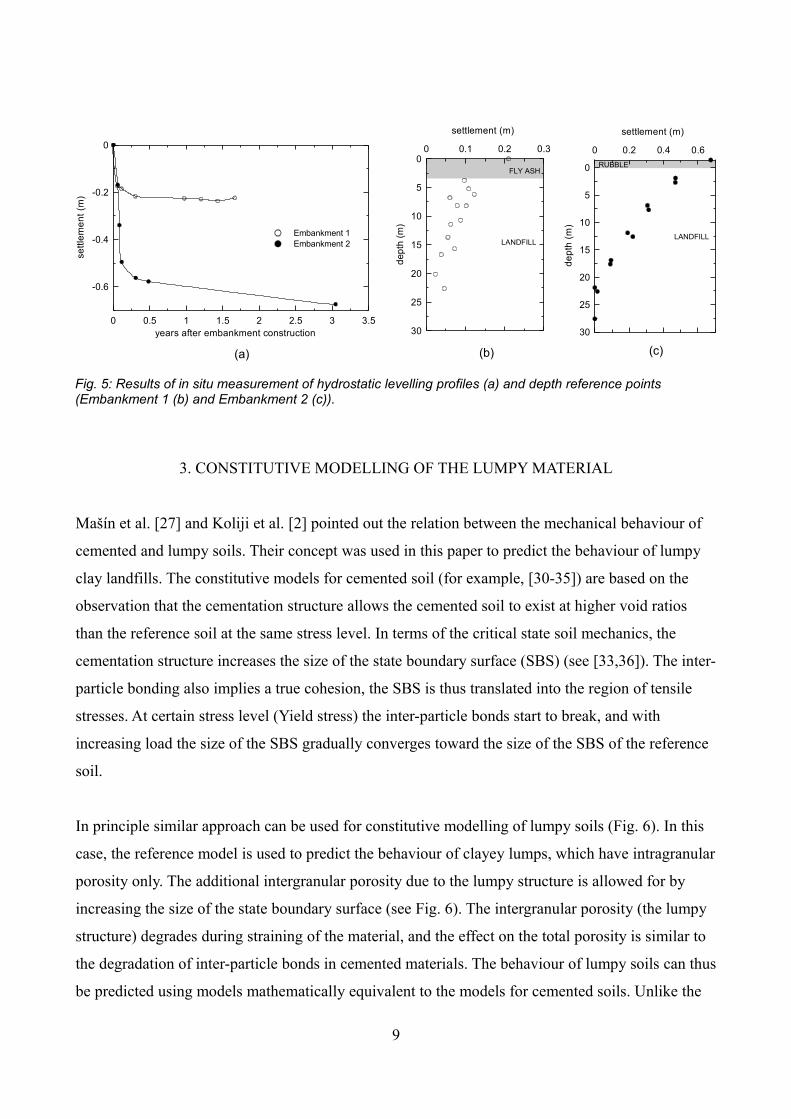
3. CONSTITUTIVE MODELLING OF THE LUMPY MATERIAL
Mašín et al. [27] and Koliji et al. [2] pointed out the relation between the mechanical behaviour of
cemented and lumpy soils. Their concept was used in this paper to predict the behaviour of lumpy
clay landfills. The constitutive models for cemented soil (for example, [30-35]) are based on the
observation that the cementation structure allows the cemented soil to exist at higher void ratios
than the reference soil at the same stress level. In terms of the critical state soil mechanics, the
cementation structure increases the size of the state boundary surface (SBS) (see [33,36]). The inter-
particle bonding also implies a true cohesion, the SBS is thus translated into the region of tensile
stresses. At certain stress level (Yield stress) the inter-particle bonds start to break, and with
increasing load the size of the SBS gradually converges toward the size of the SBS of the reference
soil.
In principle similar approach can be used for constitutive modelling of lumpy soils (Fig. 6). In this
case, the reference model is used to predict the behaviour of clayey lumps, which have intragranular
porosity only. The additional intergranular porosity due to the lumpy structure is allowed for by
increasing the size of the state boundary surface (see Fig. 6). The intergranular porosity (the lumpy
structure) degrades during straining of the material, and the effect on the total porosity is similar to
the degradation of inter-particle bonds in cemented materials. The behaviour of lumpy soils can thus
be predicted using models mathematically equivalent to the models for cemented soils. Unlike the
9
Fig. 5: Results of in situ measurement of hydrostatic levelling profiles (a) and depth reference points (Embankment 1 (b) and Embankment 2 (c)).
0 0.5 1 1.5 2 2.5 3 3.5years after embankment construction
-0.6
-0.4
-0.2
0
settl
emen
t (m
)
Embankment 1Embankment 2
(a)
0 0.1 0.2 0.3
settlement (m)
30
25
20
15
10
5
0
dept
h (m
)
LANDFILL
FLY ASH
(b)
0 0.2 0.4 0.6
settlement (m)
30
25
20
15
10
5
0
dept
h (m
)
LANDFILL
RUBBLE
(c)
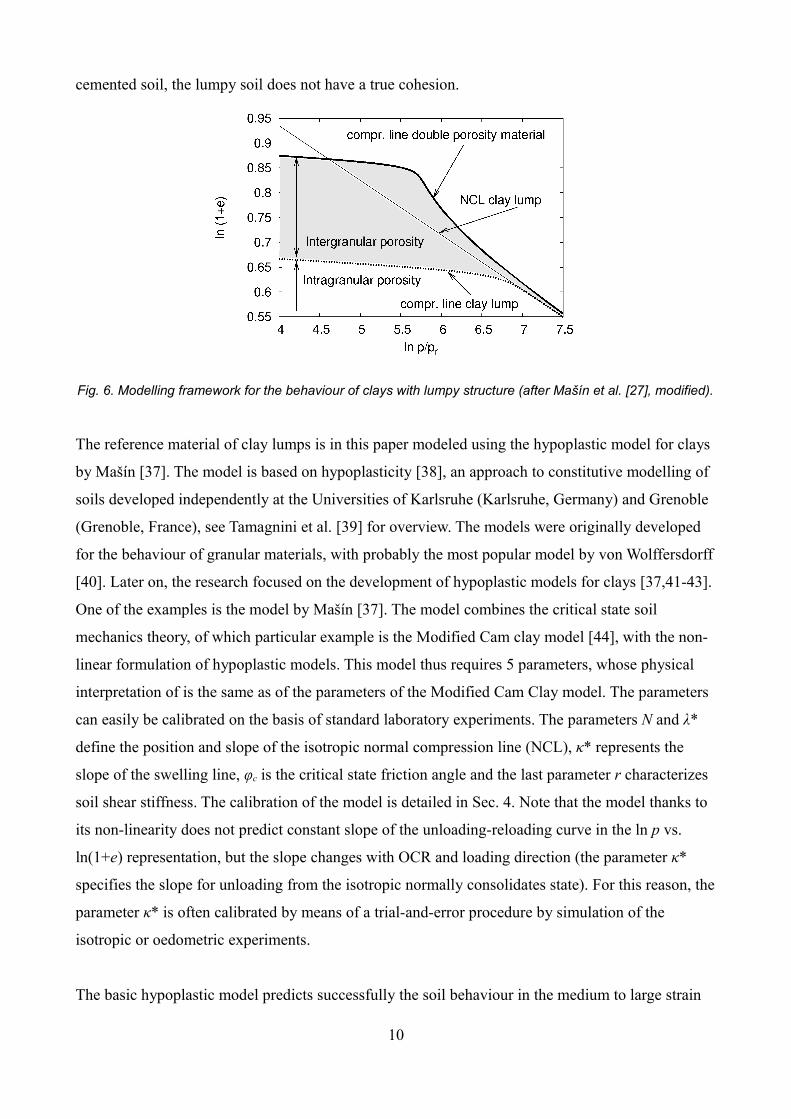
cemented soil, the lumpy soil does not have a true cohesion.
The reference material of clay lumps is in this paper modeled using the hypoplastic model for clays
by Mašín [37]. The model is based on hypoplasticity [38], an approach to constitutive modelling of
soils developed independently at the Universities of Karlsruhe (Karlsruhe, Germany) and Grenoble
(Grenoble, France), see Tamagnini et al. [39] for overview. The models were originally developed
for the behaviour of granular materials, with probably the most popular model by von Wolffersdorff
[40]. Later on, the research focused on the development of hypoplastic models for clays [37,41-43].
One of the examples is the model by Mašín [37]. The model combines the critical state soil
mechanics theory, of which particular example is the Modified Cam clay model [44], with the non-
linear formulation of hypoplastic models. This model thus requires 5 parameters, whose physical
interpretation of is the same as of the parameters of the Modified Cam Clay model. The parameters
can easily be calibrated on the basis of standard laboratory experiments. The parameters N and λ*
define the position and slope of the isotropic normal compression line (NCL), κ* represents the
slope of the swelling line, φc is the critical state friction angle and the last parameter r characterizes
soil shear stiffness. The calibration of the model is detailed in Sec. 4. Note that the model thanks to
its non-linearity does not predict constant slope of the unloading-reloading curve in the ln p vs.
ln(1+e) representation, but the slope changes with OCR and loading direction (the parameter κ*
specifies the slope for unloading from the isotropic normally consolidates state). For this reason, the
parameter κ* is often calibrated by means of a trial-and-error procedure by simulation of the
isotropic or oedometric experiments.
The basic hypoplastic model predicts successfully the soil behaviour in the medium to large strain
10
Fig. 6. Modelling framework for the behaviour of clays with lumpy structure (after Mašín et al. [27], modified).

range. However, in the small strain range and upon cyclic loading they fail in predicting the high
quasi-elastic soil sti ness. To overcome this drawback, Niemunis and Herle [45] proposed anff
extension of the hypoplastic equation by considering additional state variable ”intergranular strain”
to determine the direction of the previous loading. This extension is, however, not adopted in the
present paper, as it concerns monotonous loading processes in the large-strain range.
The basic model for clays has been later on enhanced to predict the behaviour of clays with meta-
stable structure by Mašín [30]. This model assumes one additional state variable – sensitivity s,
defined as a ratio of the sizes of state boundary surfaces of natural and reference materials. This
state variable has been proposed and used in earlier constitutive models for structured clays by other
authors, see [33,45]. The model requires three additional parameters, describing the rate of structure
degradation (k), final sensitivity (sf) and a parameter controlling the influence of a shear strain rate
on structure degradation (A). This model was used to predict the behaviour of the lumpy soil.
4. CALIBRATION OF THE HYPOPLASTIC MODEL
4.1. Calibration of the basic model
As indicated in Sec. 3, the reference material for simulation of the lumpy clay is the material of clay
lumps. Therefore, in principle, the parameters of the reference hypoplastic model should be
calibrated using laboratory experiments on the material of clay lumps. As the available experimental
results on this material include triaxial shear tests only, which are not sufficient to calibrate all the
model parameters, different approach was chosen. The model was calibrated using tests on
reconstituted soil. The obtained parameter set was subsequently used in predictions of shear tests on
the material of clay lumps, to indicate the two materials can be described using the same
parameters.
Isotropic compression tests on reconstituted clay samples from the neighbouring “5. květen“ landfill
were used for the calibration of the model parameters N and λ* (Fig. 7). The laboratory experiments
were described in detail by Hájek et al. [46]. A set of triaxial tests on the reconstituted specimens
from the subsoil of Embankment 2 was carried out to determine the parameters φc and r. The
specimens were consolidated isotropically to the required mean effective stresses (p' = 100, 200 and
300 kPa respectively) and undrained triaxial shear tests were carried out. The experimental data and
predictions by the model are shown in Fig. 8.
11

The last parameter, κ*, influences significantly the compression curve in the low stress range and its
value used in subsequent numerical simulations was determined directly from the tests on lumpy
clay oedometer specimens (section 4.2). This is because the experimental data indicate that the
parameter κ* depends on the value of the lumpy structure. As the dependency of κ* on structure is
not incorporated in the formulation of the constitutive model, κ* was calibrated directly using tests
on lumpy specimens. The obtained dependency of κ* was considered in the numerical simulations.
For the calibration of other parameters using the results of tests on the reconstituted soil κ* = 0.014
was adopted.
12
Fig. 7. Calibration of the parameters N and λ* on isotropically compressed reconstituted specimens.
2 3 4 5 6 7ln (p')
0.5
0.6
0.7
0.8
ln (1
+e)
10 100 1000p'
isotropic compression testsisotropic NCL - model calibration
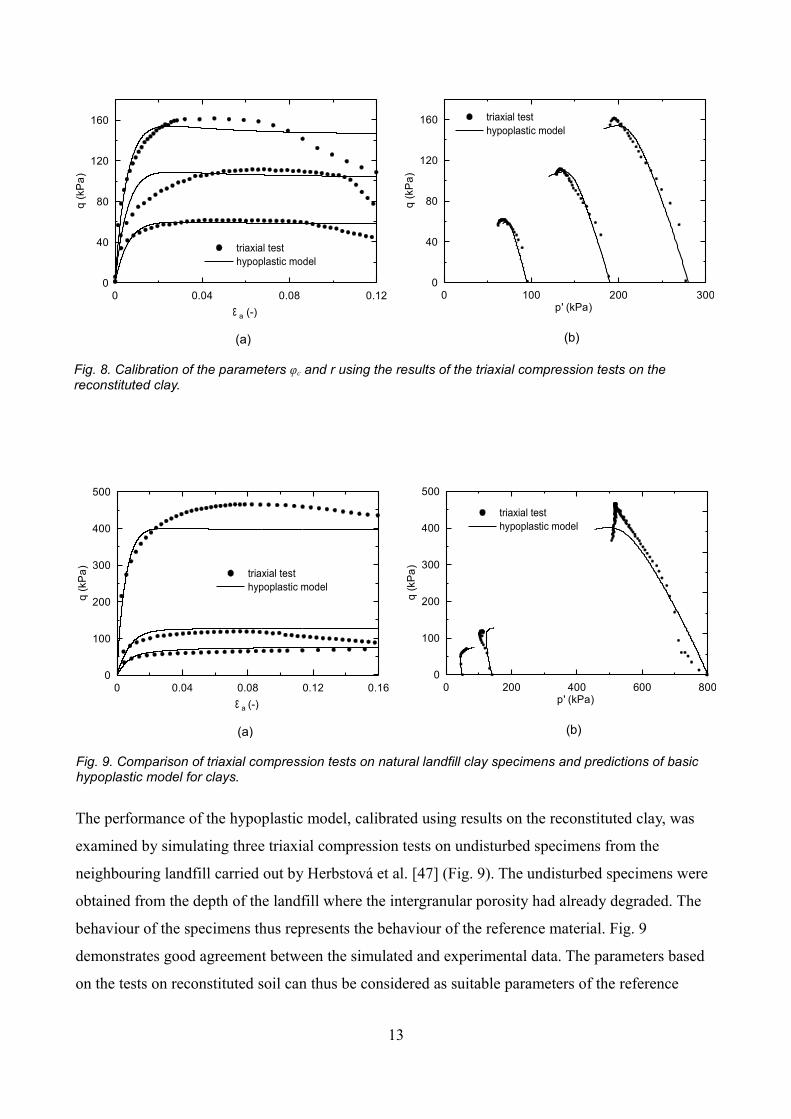
The performance of the hypoplastic model, calibrated using results on the reconstituted clay, was
examined by simulating three triaxial compression tests on undisturbed specimens from the
neighbouring landfill carried out by Herbstová et al. [47] (Fig. 9). The undisturbed specimens were
obtained from the depth of the landfill where the intergranular porosity had already degraded. The
behaviour of the specimens thus represents the behaviour of the reference material. Fig. 9
demonstrates good agreement between the simulated and experimental data. The parameters based
on the tests on reconstituted soil can thus be considered as suitable parameters of the reference
13
Fig. 9. Comparison of triaxial compression tests on natural landfill clay specimens and predictions of basic hypoplastic model for clays.
0 0.04 0.08 0.12 0.16ε a (-)
0
100
200
300
400
500
q (k
Pa) triaxial test
hypoplastic model
0 200 400 600 800p' (kPa)
0
100
200
300
400
500
q (k
Pa)
triaxial test hypoplastic model
(a) (b)
Fig. 8. Calibration of the parameters φc and r using the results of the triaxial compression tests on the reconstituted clay.
0 0.04 0.08 0.12ε a (-)
0
40
80
120
160
q (k
Pa)
triaxial test hypoplastic model
0 100 200 300p' (kPa)
0
40
80
120
160
q (k
Pa)
triaxial test hypoplastic model
(a) (b)
hypoplastic model.
4.2. Calibration of the parameters describing the lumpy structure
The parameters and variables controlling the effects of the lumpy structure were found using
oedometer tests on the lumpy clay specimens with scaled down lump size distribution,
preconsolidated in a mini-centrifuge. The clay from the landfill area was air dried at 50°C and
crushed between two metal platens. The lumps produced were sieved and remixed to give an
appropriate in situ grain size distribution with grain (lump) size scaled down by a factor of 180
(maximum lump size was 2.5 mm). This technique of the preparation of scaled-down clay lumps
allows to keep the similar shape of the lumps as in situ and the original fabric of the lumps is also
preserved. Therefore the strength and hydraulic conductivity of the lumps (influencing the rate of
the structure degradation of the soil), is expected to represent correctly the field conditions. The
lumps were poured into four cylindric containers with the diameter of 80 mm and depth of 140 mm
and flooded. The flooding of the landfill model after filling reflects the field conditions at a site of
the trial embankments. After the saturation, the containers were placed into the mini-centrifuge and
the soil was consolidated at 180 g. The structure of the fully consolidated landfill model varied
significantly with depth. The lumpy structure could still be observed in the top part of the model. In
the deeper part of the model, the interlump voids mostly closed due to plastic straining at the
contacts of the lumps. After the consolidation and unloading, seven oedometer specimens were
prepared from different heights of the models. The specimens were installed in 71.5 mm diameter
oedometers and compressed subsequently under one-dimensional conditions (detailed description of
the mini-centrifuge and the test procedure can be found in Najser et al. [48]).
In simulating the oedometric tests on the lumpy soil, the value of p' was calculated using K0 = 0.62
obtained from Jaky's formula K0 = 1 - sinφc. When all intergranular voids close, the compression
line of the lumpy clay specimens according to the framework set up in Sec. 3 joins the NCL of the
reference soil. The required vertical stress for the complete degradation of the lumpy structure was
not reached before the end of the oedometric tests (Fig. 10). However, the results indicate that at
higher stresses the compression line of the lumpy specimens converges towards the NCL of the
reference soil (it was experimentally confirmed by Henriquez [49]), and the value of sf = 1 was
therefore used. The oedometer test on intact clay (material of the clay lump) carried out by
Henriquez [49] is also presented in Fig. 10, to indicate that the reconstituted soil and clay lump
material follow the same NCL (supporting conclusions from Sec. 4.1).
14

As no shear tests on the lumpy clay material were performed, a reasonable value of the parameter A
was assumed based on the behaviour of natural structured clays (A = 0.25) [30]. The parameter k,
the initial value of structure s0 and the basic model parameter κ*, which influence the slope of the
compression curve before reaching NCL, were calibrated separately for each oedometer lumpy
specimen (Fig. 10). Table 1 summarizes the corresponding values of k, κ* and s0 together with
maximum σv' reached during preconsolidation of the soil in mini-centrifuge before the oedometer
tests. When plotted against σv' reached in the mini-centrifuge (Fig. 11), it is evident that the
parameter κ* and the value of s0 depend on the pre-consolidation vertical stress and consequently on
the initial void ratio of the oedometer specimens. No trend in stress dependency was found for the
parameter k, so value of k = 0.28 was considered as an average value from all tests.
15
Fig. 10. Calibration of the soil structure from the oedometer tests on lumpy clay. Experimental data on clay lump from Henriquez [49].
0 1 2 3 4 5 6 7 8ln (p')
0.3
0.4
0.5
0.6
0.7
0.8
0.9
1
ln (1
+e)
1 10 100 1000p'
oedometer tests ofdouble-porosity claymodel calibrationNCL of reconstituted clayoedometer test of clay lump
T1
T2
T3
T4T5
T6T7

Oedometer test σv' in centrifuge (kPa) κ* k s0 e0
T1 20 0.023 0.35 7.2 1.73
T2 55 0.016 0.35 4.2 1.48
T3 94 0.0135 0.35 2.8 1.35
T4 18 0.019 0.27 5.8 1.64
T5 33 0.014 0.21 5.3 1.57
T6 69 0.009 0.28 3.7 1.38
T7 80 0.009 0.18 3.8 1.39
Tab. 1. Data from calibration of the soil structure parameters on oedometer specimens.
16
Fig. 11: The dependency of κ*, k and s0 (a, b, c) on preconsolidation stress applied to oedometer specimens in the mini-centrifuge . The dependency of s0 on e0 (d).
1.3 1.4 1.5 1.6 1.7 1.8e0
0
2
4
6
8
10
s 0
(d)
0 20 40 60 80 100σ v' during pre-consolidation in centrifuge (kPa)
2
3
4
5
6
7
8
s 0
T1
T2
T3
T4T5
T6 T7
(c)
0 20 40 60 80 100σ v' during pre-consolidation in centrifuge (kPa)
0.005
0.01
0.015
0.02
0.025κ*
T1
T2
T3
T4
T5
T6 T7
(a)
0 20 40 60 80 100σ v' during pre-consolidation in centrifuge (kPa)
0
0.1
0.2
0.3
0.4
0.5
k
T1 T2 T3
T4
T5
T6
T7
(b)

For the stress dependent parameter κ* it was taken into account that the initial conditions for the
centrifuge modelling should represent the loosest state of the landfill before the self-weight
consolidation takes place. Therefore κ* = 0.0187 used in the predictions of the self-weight
consolidation stage and for embankment loading stage was chosen as the mean value of three
loosest oedometer specimens.
The dependency on vertical stress was found also for the initial sensitivity s0. This finding is
obvious, as increasing the vertical stress during preconsolidation in mini-centrifuge causes
according to the framework from Sec. 3 a degradation of the soil structure. Even small change in s0
significantly influences the predictions of the landfill settlement, because it influences the apparent
preconsolidation stress. At higher stresses, the structure degrades and the soil has large
compressibility, whereas at lower stresses the structure is stable and the soil response is relatively
stiff, controlled by the parameter κ*. The dependency of s0 on e0 was therefore considered in the
analyses. A linear relationship represents appropriately the experimental data (Fig. 11d):
(2)
Summary of the parameters of the hypoplastic model for structured clays is given in Tab. 2.
φc λ* κ* N r k A sf
22.4 0.0835 0.0187 1.045 0.3 0.28 0.25 1
Tab. 2. Parameters of the hypoplastic model for clays with meta-stable structure.
5. MODELLING OF CENTRIFUGE TESTS
5.1. Centrifuge tests
The centrifuge modelling of the case history of Embankment 2 was carried out in the geotechnical
drum centrifuge at ETH Zürich in Switzerland. A detailed description of the centrifuge can be found
in Springman et al. [50]. The centrifuge models were prepared in square containers (400 x 400 mm
in plan, 200 mm height) using NW Bohemian landfill clay. Clay lumps were air dried, crushed and
sieved to obtain the scaled-down lump size distribution equivalent to the field (dimensions of the
lumps were reduced according to the centrifuge scaling laws [51]). As explained in Sec. 4.2, it is
17
s0 = 10.35⋅e0 − 10.87
believed that the model material represents appropriately the behaviour of the lumpy soil of the
landfill. The centrifuge modelling was carried out at the nominal g level of 150 measured at an
effective radius of 0.91 m. The centrifuge models were fully saturated before the test and the water
level was kept constant close to the model surface during the test. After the end of the self-weight
consolidation, the centrifuge was stopped, a geotextile was placed on the landfill surface and a 2D
embankment was constructed from sand (rubble stone layer was neglected in the centrifuge
modelling). The embankment was 7.5 m high (in the prototype scale) with the length of the
embankment crest corresponding to 13.5 m and length of the ramp 20.5 m. After reacceleration to
150g, the model was monitored until the consolidaton below the embankment was completed. The
same monitoring as in situ was carried out including measurement of surface settlement and the
settlement of the depth reference points by laser. Details about the centrifuge test, model preparation
and instrumentation are beyond the scope of this paper and can be found, e.g., in Najser et al. [52].
5.2. Numerical modelling
The model parameters from Tab. 2 were used in the numerical simulation of the centrifuge test. The
modelling was performed using finite element method in 2D using the software package Tochnog
Professional [53]. The constitutive model was implemented using a user-defined subroutine, which
is freely available on the internet (Gudehus et al. [54]). An explicit adaptive integration scheme with
local substepping based on the Runge–Kutta–Fehlberg method of the 3-rd order of accuracy
(RKF23) was used for the time integration of the constitutive model. A fully coupled consolidation
analysis was carried out. However, as indicated in the Introduction, the main aim of the research
was to predict the mechanical response of the lumpy clay material, rather then the consolidation
characteristics of a double-porosity medium. For this reason, consolidation of the landfill was
treated in a simple way. The hydraulic conductivity linearly dependent on the stress level was
chosen for the numerical modelling based on the back analysis of the rate of consolidation in the
centrifuge models (5*10-8 m/s at σv' = 5 kPa and 1*10-10 m/s at σv' = 150 kPa).
The initial void ratio e0 = 1.78 was used based on the centrifuge test and the initial sensitivity
s0 = 7.54 was calculated from Eq. (2). The unit weight of the landfill γ = 16.1 kN/m3 was
determined from the average density of the lumpy clay before the centrifuge test. The embankment
body was modelled using the Mohr-Coulomb model (Tab. 3). The results of modelling of the self-
weight consolidation presented in Fig. 12 show good correlation with the experimental data from
the centrifuge test.
18

Case history E (MPa) υ (-) φ' (°) c' (kPa) ψ (°) γ (kN/m3)
Embankment centrifuge test 25 0.25 40 1 20 30.12.1899
Embankment Emb.1, Emb. 2 15 0.4 27 1 13.5 17.6
Fly ash Emb. 1 3.5 0.35 35 1 17.5 15.9
Rubble stone Emb. 2 25 0.25 40 1 17 19
Tab. 3. Mohr-Coulomb parameters and unit weights of materials considered in simulations.
The surface settlements of the centrifuge and numerical models after the embankment surcharge are
compared in Fig. 13a. The geotextile below the embankment was modelled as truss elements
without interface elements (thickness of 0.1 m, E = 25 GPa). The comparison shows 20% smaller
settlement of the centrifuge model (the final settlement in prototype scale 1.6 m) as compared to
numerical model (the final settlement 2 m).
The settlement of the landfill in the vertical profile is presented in Fig. 13b. Due to the incomplete
data of the depth reference points in the centrifuge, the final values could not be plotted and the
time of the measurement in Fig. 13b corresponds to 656 days (in prototype scale) after the
embankment construction. It shows that the difference between the centrifuge and numerical model
gradually increases over the whole vertical profile. In general, however, it may be concluded that
the predictions of the centrifuge tests are in a reasonable agreement with the centrifuge test results.
19
Fig. 12. Comparison of self-weight consolidation of centrifuge and numerical model of the landfill.
-7
-6
-5
-4
-3
-2
-1
0
∆h (m
)
0 4 8 12 16time (years)
centrifuge testnumerical model

6. MODELLING OF TRIAL EMBANKMENTS
The two field trial embankments were simulated using finite element method under plane strain
conditions. As in the case of the modelling of centrifuge test, fully coupled consolidation analyses
were used.
6.1. Embankment 1
The pluviation of the 3.5 m fly ash layer mixed with a rubble stone on the top of the landfill was
simulated by gradual increase of its unit weight between 15 to 20 years after the landfill
construction. The unit weight of the landfill of γ = 16.1 kN/m3 was used for the modelling of both
case histories. Unit weights of other materials are indicated in Tab. 3. The construction of the
embankment started 25 years after the landfill construction and took 45 days. The geometry of the
model and the finite element mesh are presented in Fig. 14.
The embankment body and fly ash layer were modelled using the Mohr-Coulomb model (the
parameters are summarized in Tab. 3.). The initial values of void ratio e0 = 1.78 and s0 = 7.54
obtained from the centrifuge model were used to represent the initial conditions for the landfill as
there were no available data about the initial porosity from the field.
20
Fig. 13. Comparison of the centrifuge and numerical modelling of the settlement under Embankment 2.
-2.5
-2
-1.5
-1
-0.5
0
∆h (m
)
0 4 8 12 16time (years)
centrifuge testnumerical model
0 0.4 0.8 1.2 1.6 2
settlement (m)
25
20
15
10
5
0
dept
h (m
)
centrifuge testnumerical model
(a) (b)

During filling in situ, no water was present in the mine pit as a result of pumping of water during
mining. The landfill was flooded later by a gradual increase of ground water level between 3 to 10
years after landfill construction. Finally, the groundwater level reached the landfill surface. In the
numerical model, a gradual rise of water level after filling was simulated by a decrease of the
effective unit weight of the landfill.
6.2. Embankment 2
The geometry of the model and the finite element mesh of Embankment 2 are presented in Fig. 15.
No fly ash was pluviated in the location of Embankment 2. After the rise of the ground water level,
the consolidation continued for another 15 years until the total time of self-weight consolidation of
25 years was reached. Then the layer of the rubble stone was placed on the top of the landfill
(thickness 1.4 m) and the embankment was constructed in 45 days. The decrease of the water level
in the interval 1.6 – 2.2 years after the embankment construction (Fig. 4) was simulated by the
increase of the effective unit weight of the landfill in the top 5 metres. The parameters for the
modelling of the embankment and rubble stone are presented in Table 3. The parameters for the
hypoplastic model of the landfill were identical to those used in modelling Embankment 1.
21
Fig. 14. Geometry and finite element mesh of numerical model of Embankment 1.

Fig. 15. Geometry and finite element mesh of numerical model of Embankment 2.
6.3. Self-weight consolidation
The settlement of the landfill surface at the site of Embankment 1 determined from the numerical
modelling is presented in Fig. 16. The end of filling is marked by “A“ with the settlement of 8.6 m.
The final settlement due to the self-weight consolidation was reached after approximately 2 years.
The gradual increase of ground water level between 3 to 10 years after starting the filling (marked
by “B“ and “C“) resulted in the heave of 0.33 m due to the decrease of σv'. The surcharge due to the
pluviation of the fly ash (15 - 20 years, marked by “D“ and “E“) resulted in 0.12 m additional
settlement (fly ash layer generated a surcharge of σv' = 18 kPa). No field measurements are available
for comparison with the numerical simulations of the self-weight consolidation.
22
Fig. 16. Self-weight consolidation of the landfill in location of Embankment 1.
-14
-12
-10
-8
-6
-4
-2
0
∆h (m
)
0 5 10 15 20 25time (years)
modelling of self-weight consolidation
A∆ h = 8.60 m
B∆ h = 13.52 m
C∆ h = 13.19 m
D∆ h = 13.18 m
E∆ h = 13.30 m

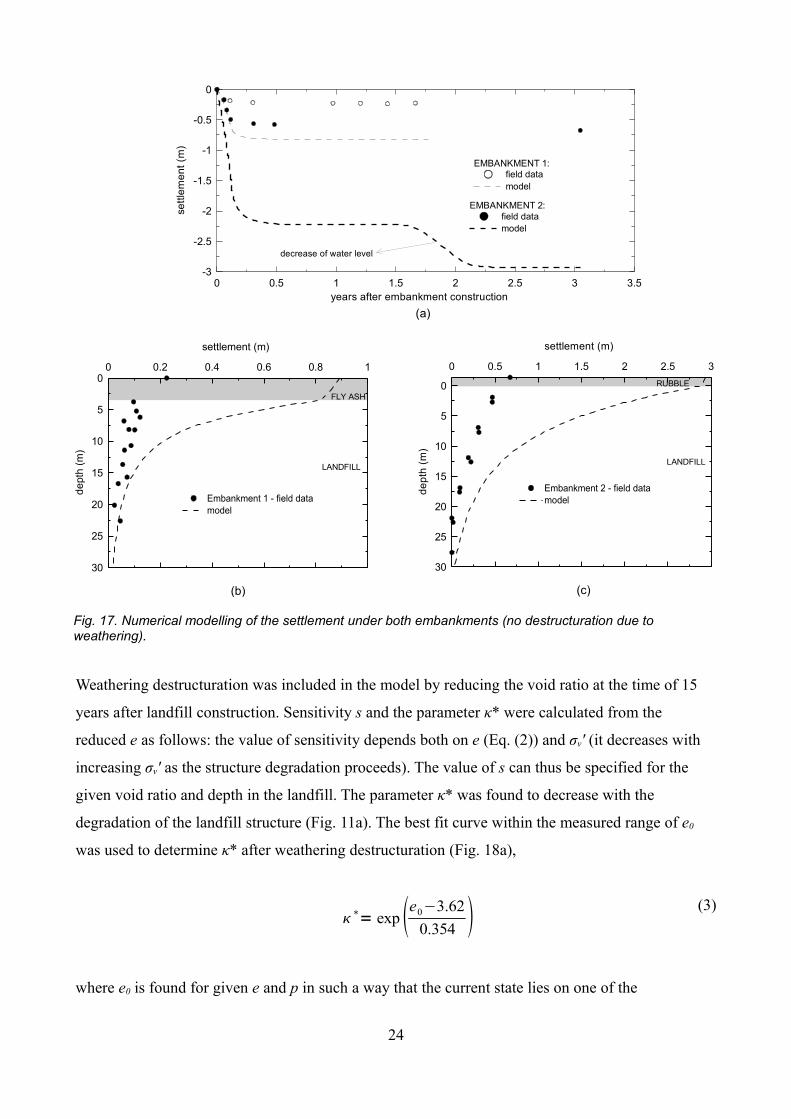
6.4. Settlement after embankment surcharge
The numerical modelling showed a significantly higher settlement after the construction of both the
embankments when compared to the field data (Fig 17). The calculated settlements were 3.7 and 4.4
times higher for Embankments 1 and 2, respectively. In the case of Embankment 2, the decrease of
the water level during the monitoring (Fig. 4) was simulated by the increase of the effective unit
weight of the landfill in the top 5 metres in the interval 1.6 – 2.2 years after the embankment
construction.
One of the possible reasons of the discrepancy in the final settlements is the destructuration of the
landfill in shallow depth caused by weathering. In situ, the top layer is exposed to rainfall and
wetting-drying cycles. The lumps are decomposed and macrovoids are partially filled with clay,
which results in a lower compressibility. This hypothesis was also supported by the significantly
higher settlement measured in the centrifuge model when compared to the case history (Figs. 5 and
13). In the centrifuge no weathering took place and the compressibility of the landfill model after
the self-weight consolidation remained higher.
The structure degradation in shallow depth due to weathering (termed as “weathering
destructuration” in the following text) was simulated by an inverse analysis of the settlement data
(hydrostatic levelling profiles, depth reference points) from in situ monitoring. The calibration of
the model based on the oedometer specimens with different degree of structure degradation (Fig.
10) revealed that the degree of destructuration can be described by a continuous change in the void
ratio, sensitivity (Fig. 11d, Eq. (2)) and model parameter κ*, which is influencing the initial slope of
the compression curves (Fig. 11a).
23
Weathering destructuration was included in the model by reducing the void ratio at the time of 15
years after landfill construction. Sensitivity s and the parameter κ* were calculated from the
reduced e as follows: the value of sensitivity depends both on e (Eq. (2)) and σv' (it decreases with
increasing σv' as the structure degradation proceeds). The value of s can thus be specified for the
given void ratio and depth in the landfill. The parameter κ* was found to decrease with the
degradation of the landfill structure (Fig. 11a). The best fit curve within the measured range of e0
was used to determine κ* after weathering destructuration (Fig. 18a),
(3)
where e0 is found for given e and p in such a way that the current state lies on one of the
24
Fig. 17. Numerical modelling of the settlement under both embankments (no destructuration due to weathering).
∗= exp e0−3.620.354
0 0.2 0.4 0.6 0.8 1
settlement (m)
30
25
20
15
10
5
0
dept
h (m
)
Embankment 1 - field datamodel
FLY ASH
LANDFILL
(b)
0 0.5 1 1.5 2 2.5 3
settlement (m)
30
25
20
15
10
5
0
dept
h (m
)
Embankment 2 - field datamodel
LANDFILL
RUBBLE
(c)
0 0.5 1 1.5 2 2.5 3 3.5years after embankment construction
-3
-2.5
-2
-1.5
-1
-0.5
0
settl
emen
t (m
)
EMBANKMENT 2:field datamodel
EMBANKMENT 1:field datamodel
(a)
decrease of water level

corresponding compression curves from Fig. 18b. Eq. (3) is used to calculate κ* in the range of
e0 = 1.73 - 1.35, while the values of κ* = 0.008 (determined for the material of the clay lump by
Henriquez [49] – Fig. 10) and 0.023 (maximum κ* determined for the lumpy specimens) were used
outside this range. Fig. 18b shows the K0 compression curves representing the landfill with different
degrees of destructuration in the whole vertical profile of the landfill with modified values of e, s
and κ*. The destructuration of 0% corresponds to the landfill with no effect of weathering, 100%
destructuration represents the overconsolidated material of the lump with no intergranular porosity.
K0 compression test carried out by Henriquez [49] was used to define the position of its
compression line, see Fig. 10. The percentage of the destructuration Ds can be defined as
(4)
where es100 refers to the void ratio of fully structured model and es0 refers to the void ratio of the
model without the lumpy structure at the corresponding depth.
The inverse analyses were performed by means of a trial-and-error procedure. The e, s and κ* were
varied until the numerical models of both embankments predicted the same settlement profile with
depth as measured in situ. The results are presented by full lines in Fig. 19. The settlement profile is
well predicted by the modified model. Figures 19b and 19c show that most of the difference
between the models with an without weathering destructuration took place in the top 10 metres of
the landfill. This can be expected due to the bigger influence of the weathering near the surface, and
25
D s =es100 − e
e s100 − es0
Fig. 18. Change of κ* with different e0 based on oedometer test results (a); K0 compression curves of lumpy clay with different degree of destructuration (b).
1.3 1.4 1.5 1.6 1.7 1.8e0 (-)
0.008
0.012
0.016
0.02
0.024
κ*
(a)
-2 0 2 4 6 8 10ln p' (kPa)
0.2
0.4
0.6
0.8
1
1.2
ln v
(-)
0.1 1 10 100 1000depth in landfill (m)
0%10%20%30%40%50%60%70%80%90%
100%
destructuration
NCL of reconstituted clay (N=1.045, λ =0.0835)
(b)

also because the intergranular porosity had already degraded in larger depths due to the higher
stresses.
The dependency of void ratio on mean stress after destructuration can be seen in Fig. 20a. It
presents the landfill state before weathering destructuration and the states of both numerical models
after weathering destructuration. The compression curves from Fig. 18b representing 0% and 100%
destructuration are added to visualize the magnitude of the destructuration used in both case
histories.
The change of destructuration with depth calculated according to Eq. (4) is presented in Fig. 20b.
Different values of weathering destructuration were found under the embankments (Fig. 20). It can
be assumed that the effect of weathering was similar at both sites and the difference can be
attributed to different lump size distributions, or other local inhomogeneities.
26

27
Fig. 19. Influence of weathering destructuration on the settlement.
0 0.2 0.4 0.6 0.8 1
settlement (m)
30
25
20
15
10
5
0
dept
h (m
)
Embankment 1 - field datamodel incl. weathering destructurationmodel (no weathering destructuration)
FLY ASH
LANDFILL
(b)
0 0.5 1 1.5 2 2.5 3
settlement (m)
30
25
20
15
10
5
0
dept
h (m
)
Embankment 2 - field datamodel incl. weathering destructurationmodel (no weathering destructuration)
LANDFILL
RUBBLE
(c)
0 0.5 1 1.5 2 2.5 3 3.5years after embankment construction
-3
-2.5
-2
-1.5
-1
-0.5
0
settl
emen
t (m
)
EMBANKMENT 2:field datamodel (no weathering destructuration)model incl. weathering destructuration
EMBANKMENT 1:field datamodel (no weathering destructuration)model incl. weathering destructuration
(a)

Fig. 20. Weathering destructuration under both embankments.
7. CONCLUSIONS
A hypoplastic constitutive model for clays with meta-stable structure was used for modelling of
settlements due to embankments on lumpy clay landfills. A scaled down model from the
geotechnical centrifuge showed a good agreement with the experimental results and demonstrated a
good performance of the chosen constitutive model. The numerical model of the full-scale field trial
embankments yielded bigger settlements due to embankment surcharge than the field
measurements. Degradation of the lumpy structure in situ due to weathering in the top part of the
landfill was considered as the main reason for this discrepancy. The weathering effects were
modelled by reduction of the void ratio, sensitivity and parameter κ* in the vertical profile of
landfill. Inverse analysis of the weathering destructuration showed that the lumpy structure is
degraded in top 10 m and the effect of the weathering destructuration decreases with depth. The
enhanced model represents well the observed settlements.
ACKNOWLEDGEMENTS
The authors greatly appreciate finantial support of the research grants GACR 205/08/0732, GACR
103/07/0678 and MSM0021620855. The part of the experimental work was carried out at ETH
Zürich. The authors wish to thank Prof. S. Springman Dr. J. Laue and E. Pooley for their support.
28
-2 0 2 4 6 8 10ln p' (kPa)
0.2
0.4
0.6
0.8
1
1.2
ln v
(-)
0.1 1 10 100 1000depth in landfill (m)
full structureweathering destructuration under Embankment 1weathering destructuration under Embankment 20%
100%
destructuration
0 20 40 60 80 100
weathering destructuration Ds (%)
25
20
15
10
5
0
dept
h (m
)
Emb. 1Emb. 2
(a) (b)

REFERENCES
1. Feda J (1998). Fragmentary clay – a difficult waste material. Engineering Geology 51:77–
88.
2. Koliji A, Vulliet L, Laloui L. (2008) New basis for the constitutive modelling of aggregated
soils. Acta Geotechnica; 3(1), 61–69.
3. Lloret, A., Villar, M. V., Sanchez, M., Gens, A., Pintado, X. and Alonso, E. E. (2003).
Mechanical behaviour of heavily compacted bentonite under high suction changes.
Géotechnique 53, No. 1, 27-40.
4. Alonso, E. E., Lloret, A., Gens, A. and Yang, D. Q. (1995). Experimental behaviour of
highly expansive double-structure clay. In Proc. of the 1st International Conference of
Unsaturated Soils, Paris, Alonso and Delage (eds.), vol. 1, 11-16.
5. Bagherieh, A. R., Khalili, N., Habibagahi, G. and Ghahramani, A. (2009). Drying response
and effective stress in a double porosity aggregated soil. Engineering Geology 105, No. 1-2,
44-50.
6. Alonso, E. E., Vaunat, J. and Gens, A. (1999). Modelling the mechanical behaviour of
expansive clays. Engineering Geology 54, 173-183.
7. Romero, E., Gens, A. and Lloret, A. (1999). Water permeability, water retention and
microstructure of unsaturated compacted Boom clay. Engineering Geology 54, 117-127.
8. Thom, R., Sivakumar, R., Sivakumar, V., Murray, E. J. and Mackinnon, P. (2007). Pore size
distribution of unsaturated kaolin: the initial states and final states following saturation.
Géotechnique 57, No. 5. 469-474.
9. Khalili, N., Witt, R., Laloui, L., Vulliet, L. And Koliji, A. (2005). Effective srtress in double
porous media with two immiscible fluids. Geophysical Research Letters 32, No. 15,
doi:10.1029/2005GL023766
29

10. Robinson RG, Tan TS, Dasari GR, Leung CF, Vijayakumar A. (2005) Experimental study of
the behavior of a lumpy fill of soft clay. International Journal of Geomechanics ASCE;
5(2):125–137.
11. Karthikeyan M, Dasari GR, Tan TS. (2004) In situ characterization of a land reclaimed using
big clay lumps. Canadian Geotechnical Journal; 41:242–256.
12. Hartlen J, Ingers C. (1981) Land reclamation using fine-grained dredged material. Proc. 10th
Int. Conf. on Soil Mech. and Found. Engrg., Stockholm; 145–148.
13. Manivannan R, Wong JC, Leung CF, Tan SA. (1998) Consolidation characteristics of lumpy
fill, Proc. Centrifuge 98; 889–894.
14. Leung CF, Wong JC, Manivanann R, Tan SA. (2001) Experimental evaluation of
consolidation behaviour of stiff clay lumps in reclamation fill. Geotechnical Testing
Journal; 24(2):145–156.
15. Charles JA, Watts KS. (2001) Building on fill: geotechnical aspects. 2nd edition;
Construction Research Communications, London.
16. Charles JA. (2008) The engineering behaviour of fill materials: the use, misuse and disuse of
case histories. Géotechnique 58(7):541–570.
17. Vaníček I, Vaníček M. (2008) Earth structures in transport, water and environmental
engineering; Springer.
18. Herbstová V and Herle I. (2009) Structure transitions of clay fills in North-Western
Bohemia. Engineering Geology 104:157–166.
19. Aifantis, E. C. (1977). Introducing a multi-porous medium. Dev. Mech. 8, 209-211.
20. Wilson, R.K. and Aifantis, E.C. (1982). On the theory of consolidation with double porosity.
International Journal of Engineering Science 20(9):1009-1035.
30

21. Khalili, N. and Valliapan, S. (1996). Unified theory of flow and deformation in double
porous media. European Journal of Mechanics, A/Solids 15, No. 2, 321-336.
22. Yang, L.-A., Tan, T.-S., Tan, S.-A., Leung, C.-F. (2002). One-dimensional self-weight
consolidation of a lumpy clay fill. Géotechnique 52, No. 10, 713-725.
23. Yang LA, Tan TS. (2009) One-dimensional consolidation of lumpy clay with non-linear
properties. Géotechnique 55(3):227–235.
24. Doležalová, M. And Kořán, P. (2002). Micromechanical modelling of a dump material. The
International Journal of Geomechanics 2, No. 1, 47-74.
25. Callari, C. And Federico, F. (2000). FEM validation of a double-porosity elastic model for
consolidation of structurally complex clayey soils. International Journal for Numerical and
Analytical Methods in Geomechanics 24, 367-402.
26. Koliji, A., Laloui, L. And Vulliet, L. (2009). Behaviour of unsaturated aggregated soil in
oedometric conditions. Soils and Foundations 49, No. 3, 369-380.
27. Mašín D, Herbstová V, Boháč J. (2005) Properties of double porosity clayfills and suitable
constitutive models. Proc. 16th Int. Conf. ICSMGE, Osaka, Japan; 827–830.
28. Škopek J. (2001) Evaluation of fill compressibility by means of a trial embankment. Proc.
of Int. Conf. Insitu Measurement of Soil Properties, Bali.
29. Škopek J, Boháč J. (2004 ) Site investigation by trial embankments. Proc. of ISC-2 on
Geotechnical and Geophysical Site Characterization, Porto; 1571–1574.
30. Mašín D. (2007) A hypoplastic constitutive model for clays with meta-stable structure.
Canadian Geotechnical Journal 44(3):363–375.
31. Lagioia, R. and Nova, R. (1995). An experimental and theoretical study of the behaviour of
a calcarenite in triaxial compression. Géotechnique, 45(4): 633–648.
31

32. Liu, M. D. and Carter, J. P. (2002). A structured Cam Clay model. Canadian Geotechnical
Journal, 39: 1313–1332.
33. Baudet, B. A. and Stallebrass, S. E. (2004). A constitutive model for structured clays.
Géotechnique, 54(4): 269–278.
34. Rouainia, M. and Muir Wood, D. (2000). A kinematic hardening constitutive model for
natural clays with loss of structure. Géotechnique, 50(2): 153–164.
35. Kavvadas, M. and Amorosi, A. (2000). A constitutive models for structured soils.
Géotechnique, 50(3): 263–273.
36. Burland, J. B. (1990). On the compressibility and shear strength of natural clays.
Géotechnique, 40(3): 329–378.
37. Mašín D. (2005) A hypoplastic constitutive model for clays. International Journal for
Numerical and Analytical Methods in Geomechanics 28(4):311–336.
38. Kolymbas, D. (1991). An outline of hypoplasticity. Archive of Applied Mechanics; 61:143–
151.
39. Tamagnini, C., Viggiani, G., and Chambon, R. (2000). A review of two di erent approachesff
to hypoplasticity. In D. Kolymbas (Ed.), Constitutive modelling of granular materials, pp.
107–144. Springer.
40. von Wolffesrdorff, P. A. (1996). A hypoplastic relation for granular materials with
predefined limit state surface. Mechanics of Cohesive-Frictional Materials 1, 251-271.
41. Niemunis A. (1996). A visco-hypoplastic model for clay and its FE implementation.
Resultats recents en mechanique des sols et des roches XI Colloque Franco-Polonais,
Gdansk.
42. Huang W-X, Wu W, Sun D-A, Sloan S (2006) A simple hypoplastic model for normally
32

compressed clay. Acta Geotechnica 1(1):15–27.
43. Niemunis, A., Grandas-Tavera, C. E. and Prada-Sarmiento, L. F. (2009). Anisotropic visco-
hypoplasticity. Acta Geotechnica 4(4): 293-314.
44. Roscoe KH, Burland JB (1968) On the generalised stress–strain behaviour of wet clay. In:
Heyman J, Leckie FA (eds) Engineering plasticity. Cambridge University Press, Cambridge,
pp 535–6.
45. Niemunis A, Herle I. (1997). Hypoplastic model for cohesionless soils with elastic strain
range. Mechanics of Cohesive-Frictional Materials; 2:279–299.
46. Hájek V, Mašín D, Boháč J. (2009). Capability of constitutive models to simulate soils with
different OCR using a single set of parameters. Computers and Geotechnics 36(4):655–664.
47. Herbstová V, Mašín D, Boháč J. (2005) Parameters for non-engineered colliery clayfills.
Proc. Int. Conf. on Problematic Soils (GEOPROB), Famagusta, Cyprus; 335–342.
48. Najser J, Pooley E, Springman SM. (2009) Modelling of double porosity clays in a mini-
centrifuge. International Journal of Physical Modelling in Geotechnics 9(1):15–22.
49. Henriquez H. (2006 ) Sensitivity model for clayey spoil heaps – laboratory evaluation. MSc
thesis, Univ Técnica de Lisboa – PřF UK Praha.
50. Springman SM, Laue J, Boyle R, White J, Zweidler A. (2001). The ETH Zurich
Geotechnical Drum Centrifuge. International Journal of Physical Modelling in Geotechnics,
1(1), 59–70.
51. Schofield AN. (1980) Cambridge Geotechnical Centrifuge Operations. Géotechnique
30(2):227–268.
52. Najser J, Pooley E, Springman SM, Laue J, Boháč J. (2009) Mechanisms controlling the
behaviour of double porosity clayfills – in situ and centrifuge study. Quarterly Journal of
Engineering Geology and Hydrogeology; in print.
33

53. Rodemann, D. (2008) Tochnog professional user's manual, http://www.feat.nl.
54. Gudehus, G., Amorosi, A., Gens, A., Herle, I., Kolymbas, D., Mašín, D., Muir Wood, D.,
Nova, R., Niemunis, A., Pastor, M., Tamagnini, C., Viggiani, G. (2008). The soilmodels.info
project. International Journal for Numerical and Analytical Methods in Geomechanics 32,
1571-1572.
34