Physiochemical Assessment of Landfill Generated Leachates in Lagos, Nigeria

Dow
nloa
ded
from
asc
elib
rary
.org
by
UN
IVE
RSI
DA
DE
FE
DE
RA
L D
E V
ICO
SA o
n 10
/23/
14. C
opyr
ight
ASC
E. F
or p
erso
nal u
se o
nly;
all
righ
ts r
eser
ved.
Strategic Decision Analysis for Selection of Landfill SitesAndré L. O. Melo1; Maria Lúcia Calijuri2; Izabel C. D. Duarte3; Roberto F. Azevedo4; and
Juliana F. Lorentz5
Abstract: This paper presents a methodology used to assess and select areas for landfills implantation in the city of Cachoeiro deItapemirim–ES �Espírito Santo State�, Brazil, using multicriteria analysis and geographical information systems �GIS�. Fifteen areasbetween 20 and 200 ha were found that presented suitability greater than 220 �score limit�. The present landfill is in an area with nullsuitability �the worst possible� and distant from the areas with suitability over 220. The results showed that GIS was a useful and agile toolin integrating spatial information for decision making in the assessment and selection process of areas suitable for landfill implantation.
DOI: 10.1061/�ASCE�0733-9453�2006�132:2�83�
CE Database subject headings: Landfills; Geographic information systems; Brazil; Site selection.
Introduction
Urbanization has reduced areas for landfill installation that aresuitable environmentally and economically and a much more pre-cise technical approach is required to select landfill sites.
Consideration of the technical, environmental, social, andeconomic aspects and geoprocessing techniques permits some al-ternatives to be obtained to locate these landfills. The carefulassessment of the areas is important to ensure the minimization ofenvironmental impacts from this type of undertaking. This paperpresents the methodology used in the assessment and selection ofareas for a landfill in the city of Cachoeiro de Itapemirim–ES,using multicriteria analysis and geographical informationsystems.
Methodology
The methodology used fuzzy logic and multicriteria analysis andincluded the surveying and analysis of operational, legal, environ-mental, social, and economic conditioners, followed by the acqui-sition, storage, description, and analysis, at the spatial level, ofthese georeferential data.
Generally the decision process intends to satisfy one or mul-tiple objectives, and is developed based on the assessment of oneor several criteria �Eastman 1997�. The location of a landfill is amulticriteria decision process where various attributes are consid-ered and imply the assessment and selection of suitable areas,among several possible alternatives, based on certain criteria.
1Federal Univ. of Viçosa, Viçosa, Minas Gerais, Brazil.2Professor, Federal Univ. of Viçosa, Viçosa, Minas Gerais, Brazil.3Professor, Federal Univ. of Viçosa, Viçosa, Minas Gerais, Brazil.4Professor, Federal Univ. of Viçosa, Viçosa, Minas Gerais, Brazil.5Student, Federal Univ. of Viçosa, Viçosa, Minas Gerais, Brazil.Note. Discussion open until October 1, 2006. Separate discussions
must be submitted for individual papers. To extend the closing date byone month, a written request must be filed with the ASCE ManagingEditor. The manuscript for this paper was submitted for review and pos-sible publication on October 31, 2002; approved on March 9, 2005. Thispaper is part of the Journal of Surveying Engineering, Vol. 132, No. 2,
May 1, 2006. ©ASCE, ISSN 0733-9453/2006/2-83–92/$25.00.J. Surv. Eng. 2006
The question of risk associated with decision is another aspectthat has caused concern in multicriteria analysis. In a problem ofthis nature the assessment of different aspects that contribute to adecision is implicit. The way of combining criteria, the consider-ation of all or only part of them, the way in which some cancompensate others are aspects that assume great importance indecisions, especially in scarce resource contexts. Within thesemore extreme risk attitudes in the assessment—conservatives andriskers, there may be a place for scenarios that are more compat-ible with the conditions that contextualized the decision.
Decision is defined as the choice between alternatives. Thealternatives may represent different locations, plans, classifica-tions, or hypotheses of a phenomenon. The decision is supportedby the consideration of criteria that serve as norms to find the bestalternatives and represent conditions that can be quantified orassessed contributing to the decision making. Environmental, op-erational, social, and economic criteria were defined for thisstudy. The criteria can be of two types: constraints and factors.
Constraints are based on Boolean criteria �true or false� thatsurround or limit the analysis of specific geographic regions. Theconstraints differentiate suitable areas from unsuitable areas. Fac-tors are criteria that define some degree of suitability for all thegeographic regions. Normally this suitability is measured on acontinuous scale to reach all the solution space initially foreseen�Ramos and Mendes 2001�.
In this study, the constraints differentiated areas or alternativesthat could be considered suitable as final destinations for solidresidue from those that are not suitable under any condition at all.In turn, the factors define areas or alternatives in terms of a con-tinuous suitability measurement, enhancing or decreasing the im-portance of an alternative, under consideration, in those placesoutside the absolute constraints. The decision rule is the proce-dure by which the chosen criteria, factors or constraints, arecombined.
The way that the data available influence in the definition ofthe suitability of an area for the implantation of a landfill in thecity studied was defined considering the different criteria nor-mally adopted in the selection of localities for this purpose. As aresult, some data were classified by their suitability for the re-quired use, becoming factors, and others as absolute barriers, pre-venting the use of the area and becoming constraints.
Normally, the values of different criteria are not compatible
JOURNAL OF SURVEYING ENGINEERING © ASCE / MAY 2006 / 83
.132:83-92.

Dow
nloa
ded
from
asc
elib
rary
.org
by
UN
IVE
RSI
DA
DE
FE
DE
RA
L D
E V
ICO
SA o
n 10
/23/
14. C
opyr
ight
ASC
E. F
or p
erso
nal u
se o
nly;
all
righ
ts r
eser
ved.
which makes their aggregation unfeasible. To solve these prob-lems each one of the factors must be standardized or normalizedto a same scale. Standardization is essentially a process of con-verting the values of the original data to levels of suitability.
The normalization process is, in its essence, identical to theprocess introduced by fuzzy logic, according to which a set ofvalues expressed on a given scale is converted to another compa-rable set, expressed on a normalized scale. According to Zadeh�1965� “the theory of the fuzzy set is in short, the step followingapproximation between the precision of classical mathematics andthe imprecision of the real world.”
The fuzzy set is a generalization of an ordinary set. It is definedfrom a continuous dominion, with degrees of pertinence varyingfrom 0 to 1 or from 0 to 255 after normalization. In the generaltheory, the pertinence or affirmative of a given phenomenon isrelative. With the advent of this theory, a concept structure wasobtained appropriate for decision making, as fuzzy logic helps todecrease the subjectivity of the choice and increase the reasoningin the decision process. Fuzzy logic has been applied to severalpurposes in the field of environmental geotechnics, including thechoice of areas for landfills. In these studies, the results haveshown that Boolean operations �method based on binary logic—mathematical base of the conventional geographic informationsystem �GIS�� present a 35% failure in the selection of potentialareas for this purpose when compared to analyses using fuzzylogic �Charnpratheep and Ganer 1996�.
Several functions can be used to normalize the criteria, andwithin the fuzzy set membership functions are sigmoidal,J-shaped, linear, and user defined �Zadeh 1965; Eastman 1997;Ramos and Mendes 2001�. In some GISs this logic is alreadyimplemented in computer routines called fuzzy models.
The attribution of weights to the criteria, or valorization, is thequantification of the relative importance of each one in the deci-sion process. Although there is no consensual method for weightattribution, there are several proposals in the literature �Voogd1983; Von Winterfeldt and Edwards 1986; Malczewski 1999�.Some of these methods are presented in Ramos �2000�, includingmethods based on order of criteria, methods based on pointscales, methods based on point distribution, and methods basedon pairwise criteria comparison. The method based on pairwisecriteria comparison was adopted in this study present in the algo-rithm of the program used in the analyses. The module calculateda set of weights and a consistence ratio and allowed repeatedadjustments to the comparison. The ratio indicates any inconsis-tency that may have occurred during the comparison process.
Two procedures were used in the criteria aggregation in thisstudy, the multicriteria analysis–weighted linear combination�MCE-WLC� and the multicriteria analysis–order weight average�MCE-OWA�. The WLC aggregation technique permits totalcompensation among the factors through the application of factorweights. The assumed risk in the analysis is measured exactlybetween the AND �minimum� and the OR �maximum� of theBoolean analysis. The factors are combined in WLC by applyinga weight to each one and then adding the results to produce a finalsuitability map.
The OWA technique introduced by Yager �1988� permits com-pensation among the factors by applying factor weights, and alsocontrols the risk level assumed in the analysis and the degree ofcompensation among them by the application of a second set ofweights, called ordered weights. The risk level depends on theposition of the ordered weights in the ranking and on the magni-tude of their values. Greater values in the first positions represent
less risk. Greater values in the last positions represent greater risk.84 / JOURNAL OF SURVEYING ENGINEERING © ASCE / MAY 2006
J. Surv. Eng. 2006
By varying the ordered weights, any combination is possible aslong as its sum is equal to one; the OWA procedure allows imple-mentation of a range �in truth infinite� of aggregation options. Thedislocation of ordered weights to the minimum or maximum con-trols the risk level �“ANDness”�, in turn, the homogeneity ofordered weights distribution by their positions controls the com-pensation �“tradeoff”�.
The result is a strategic decision spectrum, approximately tri-angular, defined on one side by risk and on the other by tradeoff�Eastman et al. 1998a,b� as shown in Fig. 1. The risk level ismeasured by the risk variable, given by the equation �Eastmanet al. 1998a,b�:
ANDness =1
n − 1�i
��n − i�Oi� �1�
and the tradeoff is given by
tradeoff = 1 −�n�
i�Oi −
1
n�2
n − 1�2�
where n=total number of factors; i=order of the factor; andOi=weight �order weight� for the order factor i.
Selection of Techniques Associated to the MulticriteriaAssessment
Technique selection depends both on the particular situationunder analysis and the data and resources available. Regardingweight assessment, whenever weights to be expressed are priori-ties of a group of decision makers, pairwise comparison should beused. Although this is more complex and time consuming, theresults and the procedure itself become perfectly adequate to theproblems of landfill location. The method sometimes imposes in-teraction to guarantee a degree of acceptable consistency. It al-lows an assessment of the relative importance of the locationcriteria.
Regarding the normalization of criteria, the most suitable pro-cedure for continuous variables �distances, for example�, is theapplication of a fuzzy function that should be carefully chosenand calibrated. In turn, when dealing with cases in the presence ofcriteria involving nominal scales �soil use, for example� the val-ues should be attributed arbitrarily, according to an adopted
Fig. 1. Strategic decision space
normalized scale.
.132:83-92.
Dow
nloa
ded
from
asc
elib
rary
.org
by
UN
IVE
RSI
DA
DE
FE
DE
RA
L D
E V
ICO
SA o
n 10
/23/
14. C
opyr
ight
ASC
E. F
or p
erso
nal u
se o
nly;
all
righ
ts r
eser
ved.
Fig. 2. Hillshading map
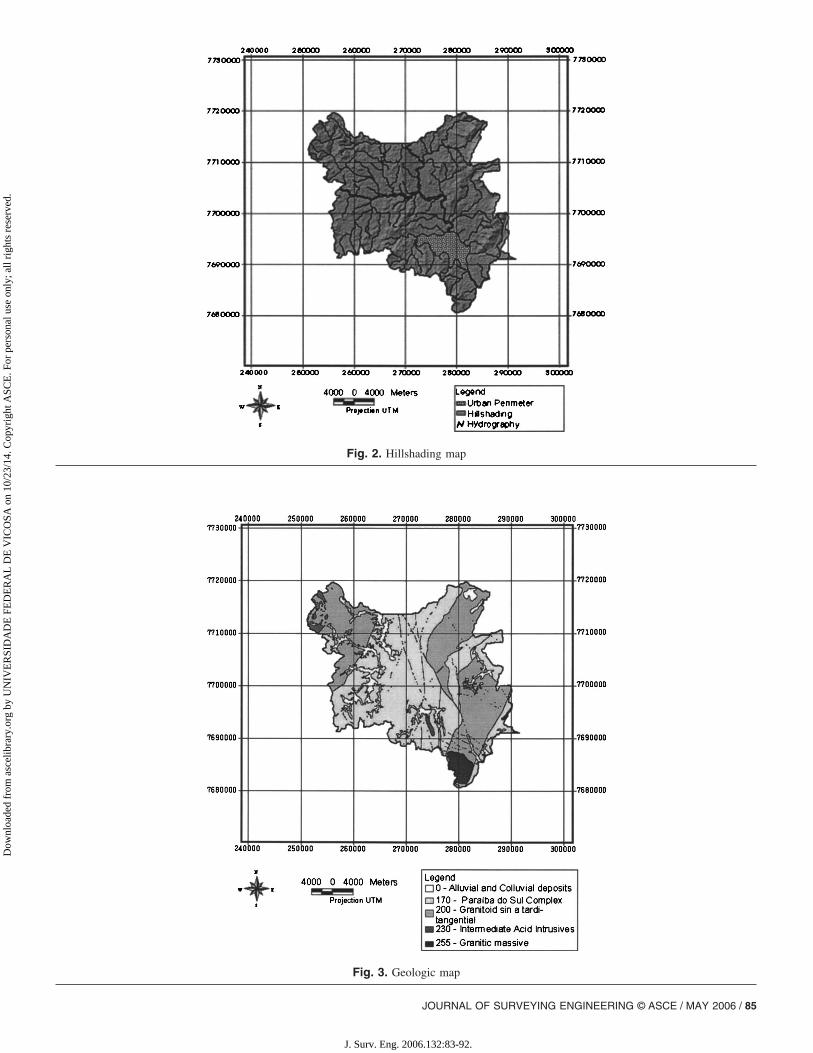
Fig. 3. Geologic map
JOURNAL OF SURVEYING ENGINEERING © ASCE / MAY 2006 / 85
J. Surv. Eng. 2006.132:83-92.

Dow
nloa
ded
from
asc
elib
rary
.org
by
UN
IVE
RSI
DA
DE
FE
DE
RA
L D
E V
ICO
SA o
n 10
/23/
14. C
opyr
ight
ASC
E. F
or p
erso
nal u
se o
nly;
all
righ
ts r
eser
ved.
Case Study
Characterization of the Study Area
The city of Cachoeiro de Itapemirim is located in the south ofEspirito Santo State, Brazil, forming part of the physiographicalSerrana do Sul zone and presents the following geographical co-ordinates: 20°51�12� latitude south and 41°06�22� longitudewest from Greenwich.
Figs. 2–5, respectively, present the analytical shading modeland the hydrography, geologic, geomorphologic, and pedologicmaps. And Figs. 6 and 7, respectively, present road system, urbanzone, districts, and farms, and Landsat Image of Cachoeiro deItapemirim city. The following information was used to developthe analyses: planialtimetric map, topographic bases �1:50,000,1978�, geologic �1:100,000, 1992�, geomorphologic �1:250,000,1983�, pedologic �1:250,000, 1983�, and hydrographic �1:50,000,1983� maps, and Landsat Satellite 5 Image �orbit 216, point 074of August 29, 1999 on Bands 3, 4, and 5�.
Strategic Decision Analysis—Establishing Criteria
Strategic decision analysis of decision was subdivided into threecriteria, environmental, operational, and social and economic, andaimed to discern the aspects that individualize each criterion�relative importance� for a better pairwise comparison and to re-
Fig. 4. Geo
late the factors of the same nature.
86 / JOURNAL OF SURVEYING ENGINEERING © ASCE / MAY 2006
J. Surv. Eng. 2006
1. Restrictive criteria �constraint�: Data in Table 1 show theconstraints associated to the environmental, operational, so-cial, and economic in this study.
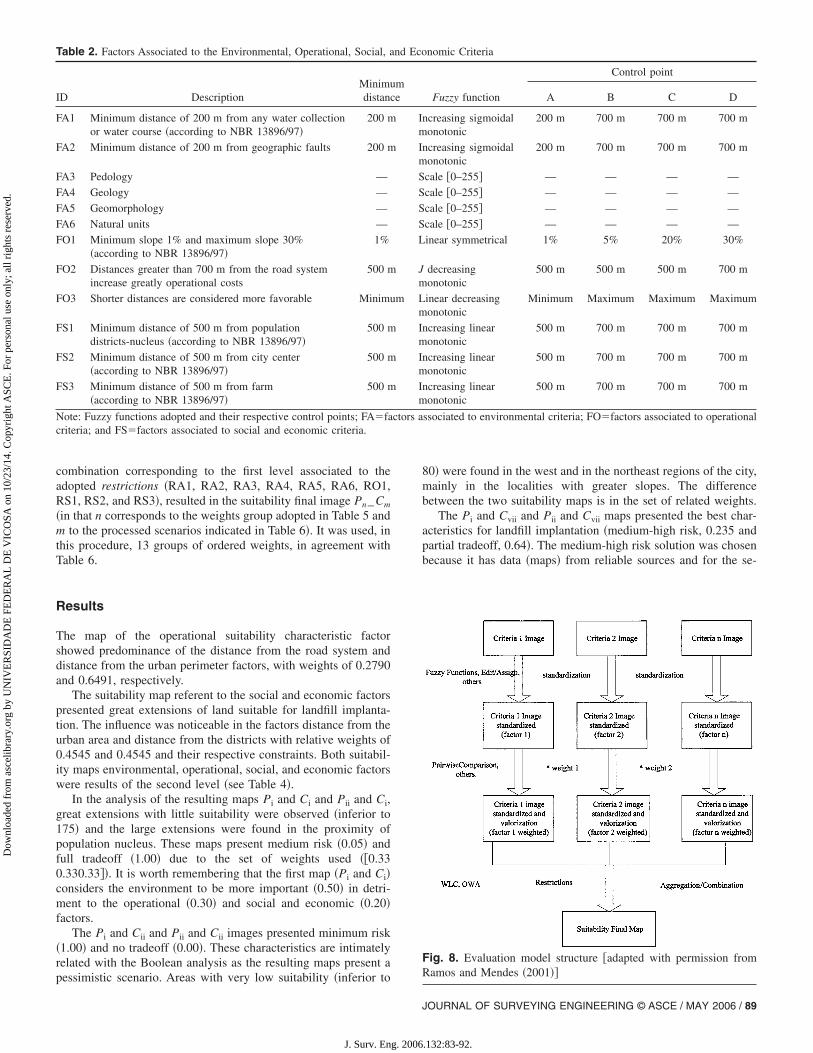
2. Scale criteria �factors�: Data in Table 2 show the factors as-sociated to the environmental, operational, social, and eco-nomic criteria considered. Table 2 also shows the functionsused to normalize the data and their respective control points.
Evaluation Model Structure
The evaluation model structure used is shown in Fig. 8.
Variable Weighting—Pairwise Comparison
Considering that the variables that interfere in the choice of areasfor landfill implantation contribute with differentiated weights inthe final decision process, a weighting was established accordingto the importance of each one for the suitability of the area. Thealgorithm used helped establish the final weights by pairwisecomparison of the relative importance of the variables, reducingthe subjectivity in the decision.
The final weight of each variable was estimated by the ana-lytical hierarchy process �AHP� method applied to the pairwisecomparison matrix. The factor weights obtained are presented in
ologic map
morphTable 3.
.132:83-92.

Dow
nloa
ded
from
asc
elib
rary
.org
by
UN
IVE
RSI
DA
DE
FE
DE
RA
L D
E V
ICO
SA o
n 10
/23/
14. C
opyr
ight
ASC
E. F
or p
erso
nal u
se o
nly;
all
righ
ts r
eser
ved.
Fig. 5. Pedologic map
Fig. 6. Road system, urban perimeter, districts, and farms
JOURNAL OF SURVEYING ENGINEERING © ASCE / MAY 2006 / 87
J. Surv. Eng. 2006.132:83-92.

Dow
nloa
ded
from
asc
elib
rary
.org
by
UN
IVE
RSI
DA
DE
FE
DE
RA
L D
E V
ICO
SA o
n 10
/23/
14. C
opyr
ight
ASC
E. F
or p
erso
nal u
se o
nly;
all
righ
ts r
eser
ved.
Analysis Flowchart
The selection and application model of the case study wasperformed with the resources of the GIS IDRISI32, I32.21�Eastman 2001�.
In the flowchart in Fig. 9, the operators and the maps �rasterformat� are identified by their name as is done by the programwhich is followed by the hierarchical structure analysis presentedin Table 4.
Evaluation Scenarios
The amount of possible options in the definition of evaluationscenarios is theoretically infinite, considering different combina-tions of weights and different combinations of techniques�MCE-WLC and MCE-OWA� in the different levels of ap-proaches. In this work, it was opted for a group of scenariosmainly based on its practical interest, in the context of the mu-nicipal reality of Cachoeiro de Itapemirim. The scenarios wereobtained joining the approaches in accordance to the levels estab-lished in Table 4:• Second level: Combination of the MCE-WLC resulting images
for each one of the three groups of score approaches and• First level: Combination of the aggregation results of the sec-
ond level, with use of MCE-OWA, using three groups of factorweights and 13 groups of ordered weights, corresponding to39 total sceneries.
Each factor group �FA, FO, and FS� was processed by the WLC
Fig. 7. L
operator, using the factor weights shown in Table 3. The images
88 / JOURNAL OF SURVEYING ENGINEERING © ASCE / MAY 2006
J. Surv. Eng. 2006
Table 1. Constraint Associates to the Environmental, Operational, andSocial Economic Criteria
ID Description
RA1 Minimum distance of 200 m �buffer� of any watercollection or water course
RA2 Minimum distance of 200 m �buffer� from roadsystem
RA3 Minimum distance of 200 m �buffer� from geographicfaults
RO1 Minimum 1% slope and maximum 30% slope
RO2 Cachoeiro de Itapemirim city limit
RS Constraints associated with social and economiccriteria
RS1 Minimum distance of 500 m �buffer� from districts–population nucleus
RS2 Minimum distance of 500 m �buffer� from city–urbanized area
RS3 Minimum distance of 500 m �buffer� from farmcenters
Note: RA�constraints associated with environmental criteria; and RS
andsat image
�constraints associated with social and economic criteria.
.132:83-92.
Dow
nloa
ded
from
asc
elib
rary
.org
by
UN
IVE
RSI
DA
DE
FE
DE
RA
L D
E V
ICO
SA o
n 10
/23/
14. C
opyr
ight
ASC
E. F
or p
erso
nal u
se o
nly;
all
righ
ts r
eser
ved.
combination corresponding to the first level associated to theadopted restrictions �RA1, RA2, RA3, RA4, RA5, RA6, RO1,RS1, RS2, and RS3�, resulted in the suitability final image Pn_Cm
�in that n corresponds to the weights group adopted in Table 5 andm to the processed scenarios indicated in Table 6�. It was used, inthis procedure, 13 groups of ordered weights, in agreement withTable 6.
Results
The map of the operational suitability characteristic factorshowed predominance of the distance from the road system anddistance from the urban perimeter factors, with weights of 0.2790and 0.6491, respectively.
The suitability map referent to the social and economic factorspresented great extensions of land suitable for landfill implanta-tion. The influence was noticeable in the factors distance from theurban area and distance from the districts with relative weights of0.4545 and 0.4545 and their respective constraints. Both suitabil-ity maps environmental, operational, social, and economic factorswere results of the second level �see Table 4�.
In the analysis of the resulting maps Pi and Ci and Pii and Ci,great extensions with little suitability were observed �inferior to175� and the large extensions were found in the proximity ofpopulation nucleus. These maps present medium risk �0.05� andfull tradeoff �1.00� due to the set of weights used ��0.330.330.33��. It is worth remembering that the first map �Pi and Ci�considers the environment to be more important �0.50� in detri-ment to the operational �0.30� and social and economic �0.20�factors.
The Pi and Cii and Pii and Cii images presented minimum risk�1.00� and no tradeoff �0.00�. These characteristics are intimatelyrelated with the Boolean analysis as the resulting maps present a
Table 2. Factors Associated to the Environmental, Operational, Social, a
ID DescriptionMinimudistanc
FA1 Minimum distance of 200 m from any water collectionor water course �according to NBR 13896/97�
200 m
FA2 Minimum distance of 200 m from geographic faults 200 m
FA3 Pedology —
FA4 Geology —
FA5 Geomorphology —
FA6 Natural units —
FO1 Minimum slope 1% and maximum slope 30%�according to NBR 13896/97�
1%
FO2 Distances greater than 700 m from the road systemincrease greatly operational costs
500 m
FO3 Shorter distances are considered more favorable Minimu
FS1 Minimum distance of 500 m from populationdistricts-nucleus �according to NBR 13896/97�
500 m
FS2 Minimum distance of 500 m from city center�according to NBR 13896/97�
500 m
FS3 Minimum distance of 500 m from farm�according to NBR 13896/97�
500 m
Note: Fuzzy functions adopted and their respective control points; FA�facriteria; and FS�factors associated to social and economic criteria.
pessimistic scenario. Areas with very low suitability �inferior to
J. Surv. Eng. 2006
80� were found in the west and in the northeast regions of the city,mainly in the localities with greater slopes. The differencebetween the two suitability maps is in the set of related weights.
The Pi and Cvii and Pii and Cvii maps presented the best char-acteristics for landfill implantation �medium-high risk, 0.235 andpartial tradeoff, 0.64�. The medium-high risk solution was chosenbecause it has data �maps� from reliable sources and for the se-
nomic Criteria
Fuzzy function
Control point
A B C D
ncreasing sigmoidalonotonic
200 m 700 m 700 m 700 m
ncreasing sigmoidalonotonic
200 m 700 m 700 m 700 m
cale �0–255� — — — —
cale �0–255� — — — —
cale �0–255� — — — —
cale �0–255� — — — —
inear symmetrical 1% 5% 20% 30%
decreasingonotonic
500 m 500 m 500 m 700 m
inear decreasingonotonic
Minimum Maximum Maximum Maximum
ncreasing linearonotonic
500 m 700 m 700 m 700 m
ncreasing linearonotonic
500 m 700 m 700 m 700 m
ncreasing linearonotonic
500 m 700 m 700 m 700 m
ssociated to environmental criteria; FO�factors associated to operational
Fig. 8. Evaluation model structure �adapted with permission fromRamos and Mendes �2001��
nd Eco
me
Im
Im
S
S
S
S
L
Jm
m Lm
Im
Im
Im
ctors a
JOURNAL OF SURVEYING ENGINEERING © ASCE / MAY 2006 / 89
.132:83-92.

criteria.
90 / JOURNAL OF SURVEYING ENGINEERING © ASCE / MAY 2006
J. Surv. Eng. 2006
Dow
nloa
ded
from
asc
elib
rary
.org
by
UN
IVE
RSI
DA
DE
FE
DE
RA
L D
E V
ICO
SA o
n 10
/23/
14. C
opyr
ight
ASC
E. F
or p
erso
nal u
se o
nly;
all
righ
ts r
eser
ved.
curity in being able to assume a greater degree of risk in thisundertaking.
For a more detailed decision, the greatest weight was appliedto the operational factor in detriment to the other factors. Thisdecision was based on two criteria, one, the fact that the restric-tions adopted had already dealt intensively with environmentalaspects and the second related to the rise in operational costs thatcould make the undertaking unviable. Of all the scenarios pro-cessed it was considered that the Pii and Cvii map was the one thatpresented the best characteristics for landfill installation.
The Pn and Cm maps were results of the first level �seeTable 4�.
Table 5. Group of Factor Weights Referring to the Relative Importanceof the Score Approaches �Environmental, Operational and SocialEconomic� in the 1° Level Evaluation
Weights set Factor Weight
Pi FA 0.50
FO 0.30
FS 0.20
Sum 1.00Pii FA 0.30
FO 0.50
FS 0.20
Sum 1.00Piii FA 0.40
FO 0.40
FS 0.20
Sum 1.00
Table 6. Groups of Ordered Weights in the 1° Level Evaluation
Scenario Ordered weights Risk Tradeoff Characteristic
Ci �0.33 0.33 0.33� 0.50 1.00 Medium riskfull tradeoff
Cii �1.00 0.00 0.00� 1.00 0.00 Minimum riskno tradeoff
Ciii �0.00 0.00 1.00� 0.00 0.00 Maximum riskno tradeoff
Civ �0.00 1.00 0.00� 0.50 0.00 Medium riskno tradeoff
Cv �0.50 0.40 0.10� 0.70 0.64 Minimum riskpartial tradeoff
Cvi �0.10 0.40 0.50� 0.30 0.64 High riskpartial tradeoff
Cvii �0.10 0.50 0.40� 0.35 0.64 Medium-high riskpartial tradeoff
Cviii �0.40 0.50 0.10� 0.65 0.64 Medium-low riskpartial tradeoff
Cix �0.70 0.20 0.10� 0.80 0.44 Low riskpartial tradeoff
Cx �0.10 0.20 0.70� 0.20 0.44 High riskpartial tradeoff
Cxi �0.10 0.70 0.20� 0.45 0.44 Medium-high riskpartial tradeoff
Cxii �0.20 0.70 0.10� 0.55 0.44 Medium-low riskpartial tradeoff
Cxiii �0.20 0.60 0.20� 0.50 0.60 Medium riskpartial tradeoff
Table 3. Factor Weights Obtained from Comparison Matrix
FactorsFactor
weights
FA1—Factor: Distance from water courses 0.4417
FA2—Factor: Distance from geographic faults 0.3013
FA3—Factor: Pedology 0.0934
FA4—Factor: Geology 0.0934
FA5—Factor: Geomorphologic 0.0452
FA6—Factor: Natural units 0.0251
FO1—Factor: Slope 0.0909
FO2–Factor: Distance from road system 0.4545
FO3—Factor: Distance from urban perimeter 0.4545
FS1—Factor: Distance of districts 0.2790
FS2—Factor: Distance from city center 0.6491
FS3—Factor: Distance from farms 0.0719
FA�factors associated to environmental criteria; FO�factors associatedto operational criteria; and FS�factors associated to social and economic
Table 4. Scaled Factors by Levels
Level�degree�
Environmentalfactor
Operationalfactor
Social and economicfactors
1 FA FO FS
2 FA1; FA2; FA3;FA4; FA5; FA6
FO1; FO2; FO3 FS1; FS2; FS3
Fig. 9. Flowchart of factor and constraints aggregation process�adapted with permission from Ramos and Mendes �2001��
.132:83-92.
Dow
nloa
ded
from
asc
elib
rary
.org
by
UN
IVE
RSI
DA
DE
FE
DE
RA
L D
E V
ICO
SA o
n 10
/23/
14. C
opyr
ight
ASC
E. F
or p
erso
nal u
se o
nly;
all
righ
ts r
eser
ved.
Minimum Area Calculation
There was a population of 175,000 inhabitants in the city in 2001.When a per capita residue production of 0.50 kg/ inhabitant/day,mean residue density of 0.790 tf/m2 and a useful life of 10 years�minimum required by NBR 13896/97� were adopted, the produc-tion calculated in the period was about 518,381,430 m3 with anaccumulated volume �residue+soil cover� of 622,057,70 m2. Theminimum area value was 13.5 ha by the trench method. A mini-mum area of 20 ha was chosen to accommodate other operationalactivities of the landfill and a possible enlargement.
Selection of Areas with Greater Suitability
The areas most suitable for installation of the landfill were chosenusing the final suitability image �Pii and Cvii—medium-high riskand partial tradeoff� and the minimum necessary area defined�20 ha�. It was defined that suitability over 200 would be theestablished criteria and over 220 would be ideal. The great differ-ence in the number of areas found is due to the bands of unsuit-ability in the first �220–255� and the second �200–255�. The lo-cation in an area that is not the best, associated to the potentialimpacts inherent to the landfill, indicates that the final destinationof the solid residues should be removed to more appropriate lo-calities using the suitability map as a guide. There are many al-ternatives, including areas not very far from the present location
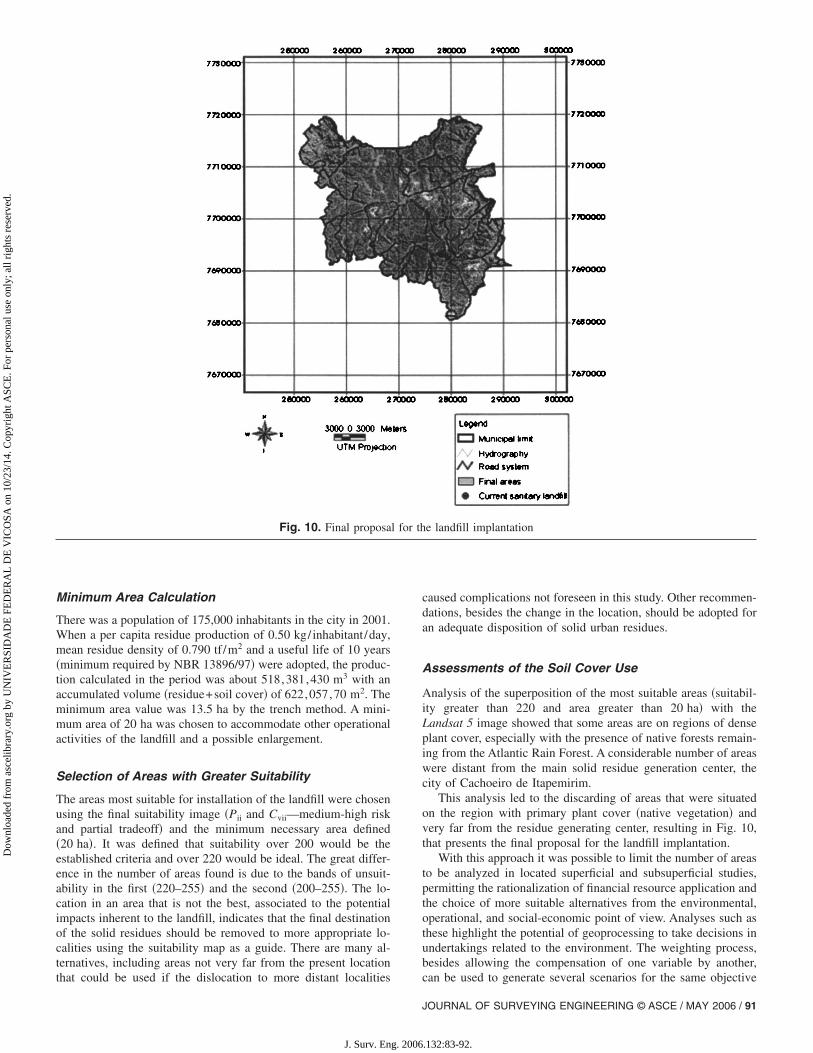
Fig. 10. Final proposa
that could be used if the dislocation to more distant localities
J. Surv. Eng. 2006
caused complications not foreseen in this study. Other recommen-dations, besides the change in the location, should be adopted foran adequate disposition of solid urban residues.
Assessments of the Soil Cover Use
Analysis of the superposition of the most suitable areas �suitabil-ity greater than 220 and area greater than 20 ha� with theLandsat 5 image showed that some areas are on regions of denseplant cover, especially with the presence of native forests remain-ing from the Atlantic Rain Forest. A considerable number of areaswere distant from the main solid residue generation center, thecity of Cachoeiro de Itapemirim.
This analysis led to the discarding of areas that were situatedon the region with primary plant cover �native vegetation� andvery far from the residue generating center, resulting in Fig. 10,that presents the final proposal for the landfill implantation.
With this approach it was possible to limit the number of areasto be analyzed in located superficial and subsuperficial studies,permitting the rationalization of financial resource application andthe choice of more suitable alternatives from the environmental,operational, and social-economic point of view. Analyses such asthese highlight the potential of geoprocessing to take decisions inundertakings related to the environment. The weighting process,besides allowing the compensation of one variable by another,
e landfill implantation
l for thcan be used to generate several scenarios for the same objective
JOURNAL OF SURVEYING ENGINEERING © ASCE / MAY 2006 / 91
.132:83-92.

Dow
nloa
ded
from
asc
elib
rary
.org
by
UN
IVE
RSI
DA
DE
FE
DE
RA
L D
E V
ICO
SA o
n 10
/23/
14. C
opyr
ight
ASC
E. F
or p
erso
nal u
se o
nly;
all
righ
ts r
eser
ved.
by the simple alteration of the weight or the inclusion or exclu-sion of variables. Allied to other innovative tools, such as geosta-tistics, resources such as classification continue to represent ananalytical capacity for desktop systems until recently unimagin-able that are accessible to any user today.
Conclusions
This study presents the methodology used in the assessment andselection of areas for landfill implantation in the city of Cachoeirode Itapemirim, with the use of MCE and GIS. Fifteen areas werefound between 20 and 200 ha that presented suitability greaterthan 220 �score limit�. The present landfill is on an area with nullsuitability �the worst possible�, distant from the areas with suit-ability greater than 220 and it should be relocated. Using thesuitability map as a guide, there are many alternatives that couldbe used, including areas not very far from the present site.
The results revealed the GIS as a useful and agile tool inintegrating spatial information to make decisions. The methodused showed the potentialities of the advanced analyses availablein some GIS software, including IDRIS32, Version I322.21 thatexecutes multicriteria analyses with high mathematical rigor.
References
Charnpratheep, K., and Ganer, B. Z. Q. �1996�. “Preliminary landfill sitescreening using fuzzy geographical information systems.” Waste Man-
92 / JOURNAL OF SURVEYING ENGINEERING © ASCE / MAY 2006
J. Surv. Eng. 2006
age. Res., 15, 197–215.Eastman, J. R. �1997�. IDRISI for Windows—User’s guide, version 2.0,
Clark Labs, Clark Univ., Worcester, Mass., EUA.Eastman, J. R. �2001�. IDRISI 32 release 2—Guide To GIS and Image
Processing, manual version 32.20, Clark Labs, Clark Univ., Worces-ter, Mass., EUA, Vols. I and II.
Eastman, J. R., Jiang, H., and Toledano, J. �1998a�. “Multi-criteria andmulti-objective decision making for land allocation using GIS.” Civ.Eng. Mag., 10, 527–534 �in Portuguese�.
Eastman, J. R., Jiang, H., and Toledano, J. �1998b�. Multi-criteria andmulti-objective decision making for land allocation using GIS.” Mul-ticriteria analysis for land-use management, E. Beint and P. Nijkamp,eds., Kluwer Academic, Dordrecht, The Netherlands, 227–251.
Malczewski, J. �1999�. GIS and multicriteria decision analysis, Wiley,New York.
Ramos, R. A. R. �2000�. “Industrial location: A model for the northwestof Portugal.” Doctorate thesis, Univ. of Minho, Minho, Portugal.
Ramos, R. A. R., and Mendes, J. F. G. �2001�. “Evaluation of the soilsuitability for industrial location: The Valença case.” Civ. Eng. Mag.,10, 7–29 �in Portuguese�.
Von Winterfeldt, D., and Edwards, W. �1986�. Decision analysis andbehavioural research, Cambridge University Press, Cambridge, U.K.
Voodg, H. �1983�. Multi-criteria evaluation for urban and regional plan-ning, Pion Ltd., London.
Yager, R. R. �1988�. “On ordered weighted averaging aggregation opera-tors in multi-criteria decision making.” IEEE Trans. Syst. Man Cy-bern., 8�1�, 183–190.
Zadeh, L. A. �1965�. “Fuzzy sets. Information and control.” Informationand Computation, Vol. 8, Elsevier, Amsterdam, The Netherlands,338–353.
.132:83-92.
Copyright © 2022 FDOKUMEN