2020 Glenmore Landfill Annual Report Operational Certificate ...
212
Operational Certificate 12218 Annual Report 2020 March 29, 2021 2020 Glenmore Landfill Annual Report Operational Certificate MR 12218 EMS reference # E104956
-
Upload
khangminh22 -
Category
Documents
-
view
0 -
download
0
Transcript of 2020 Glenmore Landfill Annual Report Operational Certificate ...

Operational Certificate 12218 Annual Report 2020 March 29, 2021
2020 Glenmore Landfill Annual Report Operational Certificate MR 12218
EMS reference # E104956

Operational Certificate 12218 Annual Report 2020 March 29, 2021 2
Table of Contents 1. EXECUTIVE SUMMARY............................................................................................................ 3
2. STATISTICS ................................................................................................................................... 5
3. OPERATIONAL PLAN FOR THE NEXT 12 MONTHS (SECTION 8 – CSDP) .............. 6
4. DATA AND INFORMATION ...................................................................................................... 8
5. LIST OF APPENDICES .............................................................................................................. 13

Operational Certificate 12218 Annual Report 2020 March 29, 2021 3
1. EXECUTIVE SUMMARY This 2020 annual report is to provide information relevant to Operational Certificate MR 12218 for the Glenmore Landfill. Under the provisions of the Waste Management Act and in accordance with the approved Regional District of Central Okanagan Solid Waste Management Plan (SWMP), the City of Kelowna is authorized to manage recyclable materials and to discharge waste to the ground at the Glenmore Landfill, located at 2720 John Hindle Drive, in the City of Kelowna. In 2020, the Glenmore Landfill operated in compliance with the current SWMP.
GHD Canada updated the Design, Operations and Closure Plan (DOCP) to replace the 2008 Comprehensive Site Development Plan. This DOCP update started in late 2017, was completed in Q4 2018, and was submitted to the Province in March of 2019. Approval of the DOCP was received from the Province in January 2020. An Upgrading Plan to reflect the additional work to meet the updates in the BC Guidelines was submitted in June 2020. Additional comments on the Upgrading Plan describing progress to date can be found in Appendix 1 – Upgrading Plan Update, City of Kelowna, February 23, 2020. This includes additional nuisance monitoring evaluation that can be found in Appendix 2 – Odour Monitoring Results Summary, GHD Canada, dated September 10, 2020. A minor amendment to the Operational Certificate was issued by the Province on May 27, 2020. A copy of this amendment can be found in Appendix 3 – OC12218 Amendment, Province of British Columbia, May 27, 2020. An additional amendment is in progress to address the following items:
• Increase the annual volume of garbage that may be disposed by 10%; • Allow for contaminated soils other than hydrocarbon contaminated soils to be
received and used as daily cover; • Correct some typographical errors; • Include a reference to the DOCP Approved by the Province in 2020; and • Update some of the clauses at the request of the Province.
The estimated population contributing to the municipal solid waste handled at the Glenmore Landfill in 2020 was 222,748 based on the BC Government Statistics website (https://www2.gov.bc.ca/gov/content/data/statistics/people-population-community/population/population-estimates accessed on March 3, 2021. This population produced a total of 145,704 tonnes of waste (including hydrocarbon contaminated soil) that was deposited at the Glenmore Landfill in 2020. In addition to this volume of waste disposed, an additional 48,482 tonnes of organics and 21,284 tonnes of recyclable such as concrete, shingles, metal, etc. was recycled for a diversion rate of 32.69% at the Glenmore Landfill in 2020. Based on the projected waste volumes and filling plan, the landfill is expected to be operational until the year 2107.

Operational Certificate 12218 Annual Report 2020 March 29, 2021 4
Waste volume decreases in 2020 are primarily related to a decrease in construction/demolition debris due to regional development, less contaminated soil received, and the COVID-19 Pandemic. It is expected that a small amount of waste is likely being imported from out of region due to the higher tipping fees in neighbouring regions. Tipping fees were reviewed as part of the overall site development and 10-year Capital Plan and garbage rates increased slightly in 2020. There were minor changes to the City Solid Waste Management Bylaw No 10106 in 2020, mostly to align with Regional initiatives, minor pricing for items such as tires and mattresses, and to add scrap metal as a mandatory recyclable. The Glenmore Landfill will also become a drop off location for the Major Appliance Recycling Roundtable (MARR) as of April 1, 2021. This does not affect the wastes managed, but allows for the inclusion of the Glenmore Landfill’s appliance receiving in the MARR reporting.

Operational Certificate 12218 Annual Report 2020 March 29, 2021 5
2. STATISTICS The City of Kelowna Glenmore Landfill and Administration Building are located as 2720 John Hindle Drive, Kelowna, BC V1V 2C5. The Scale House has a civic address of 2710 John Hindle Drive. a. Table 1 - Discharge Quantity (tonnes):
Year Amount Discharged 2016 154,510 2017 151,456 2018 166,916 2019 156,566 2020 145,704
b. Table 2 - Service Population (all annual numbers updated March 3, 2021)
Year Population 2016 203,998 2017 208,476 2018 213,831 2019 218,454 2020 222,748
Service population data is obtained annually from the BC Statistics Population Estimates of the Central Okanagan Regional District. c. Table 3 - Waste Discharge Rate (tonnes/capita updated March 3, 2021):
Year Waste Discharge Rate (tonnes/capita) 2016 0.76 2017 0.73 2018 0.78 2019 0.72 2020 0.65
d. Authorized design volume: An updated Fill Plan was prepared for the City of Kelowna by CH2M Hill (now Jacobs Engineering Group) in 2014. This design volume was approximately 40,000,000m3 as of 2014. This design meets Criteria in the 2016 BC Landfill Criteria for Municipal Solid Waste and is the basis for the updated DOCP. e. Remaining Site Life and Capacity: Based on the current waste generation volumes and filling plan options, the landfill is expected to be operational until approximately 2107 as updated in Section 8 of the 2018 DOCP. f. Complaints The landfill received 17 service requests related to landfill operations in 2020. Five complaints were related to customer service issues (i.e. waiting time at the scale house or fees charged) and no complaints were received for nuisance items. The remaining requests were information requests related to waste pick up, or questions regarding recycling and composting. Any additional complaints were received by phone or in person were not tabulated. Typically, issues in the Service Request System were addressed with 2 business days.

Operational Certificate 12218 Annual Report 2020 March 29, 2021 6
3. OPERATIONAL PLAN FOR THE NEXT 12 MONTHS (SECTION 8 – CSDP)
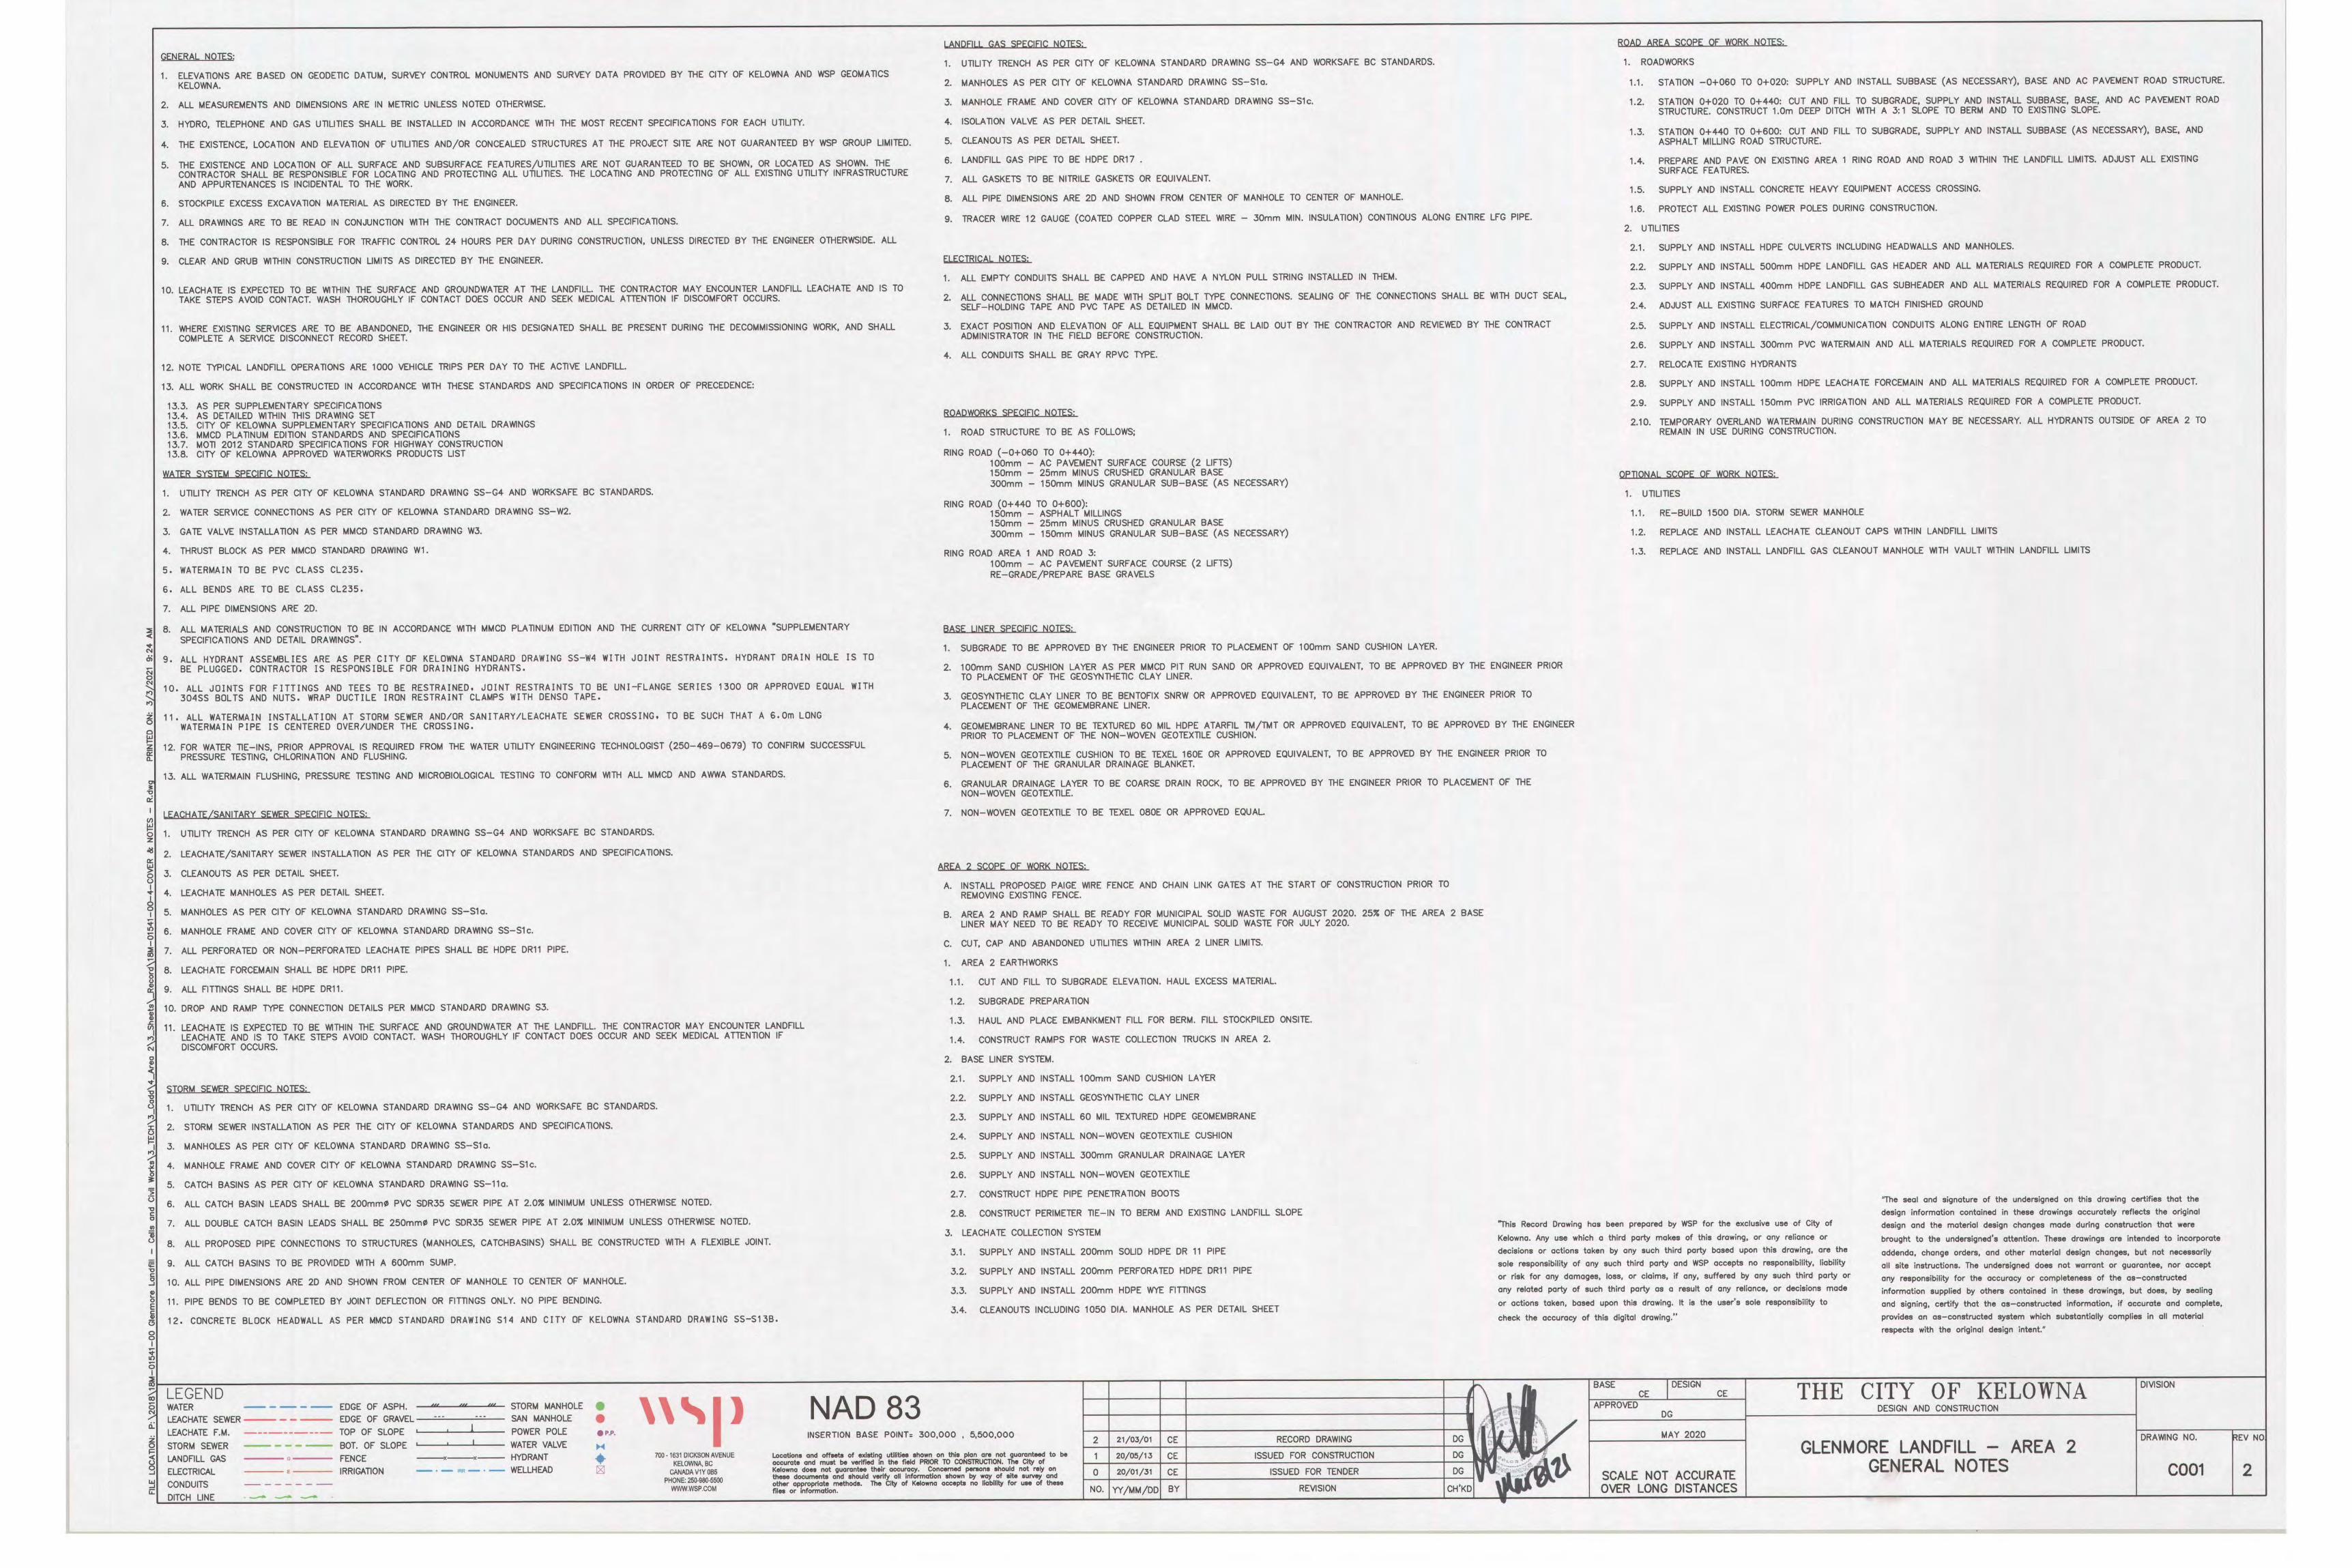
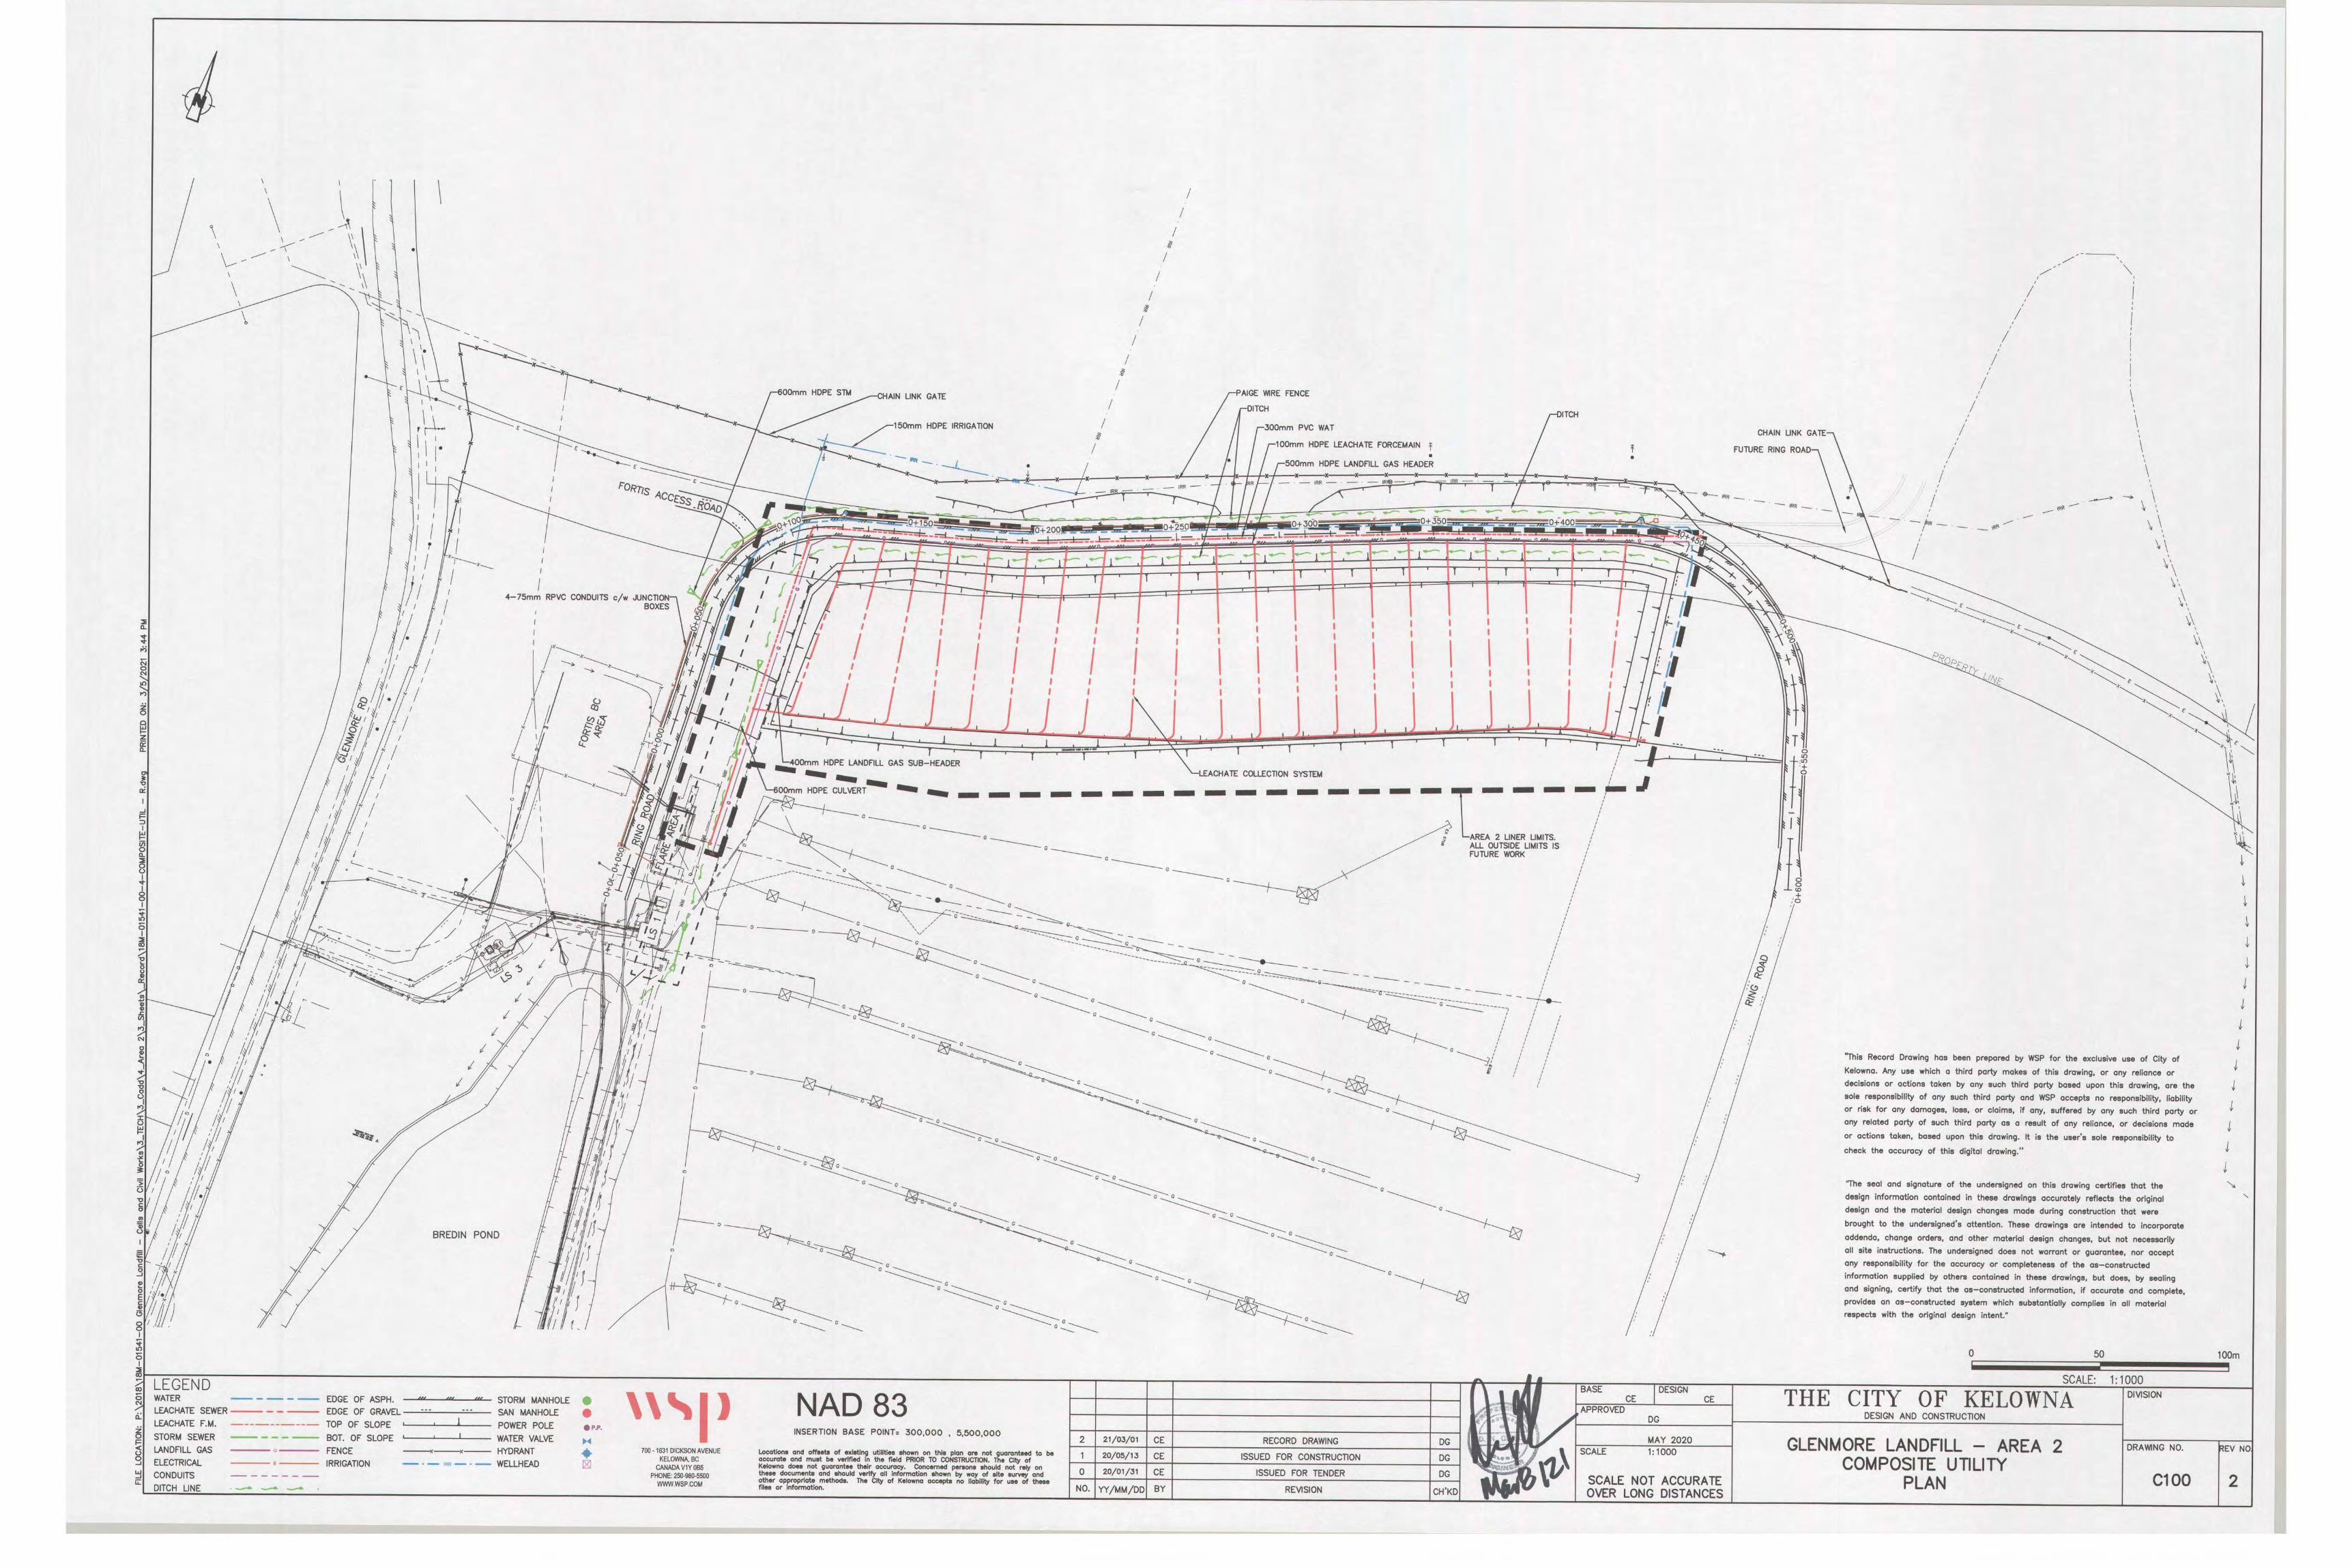
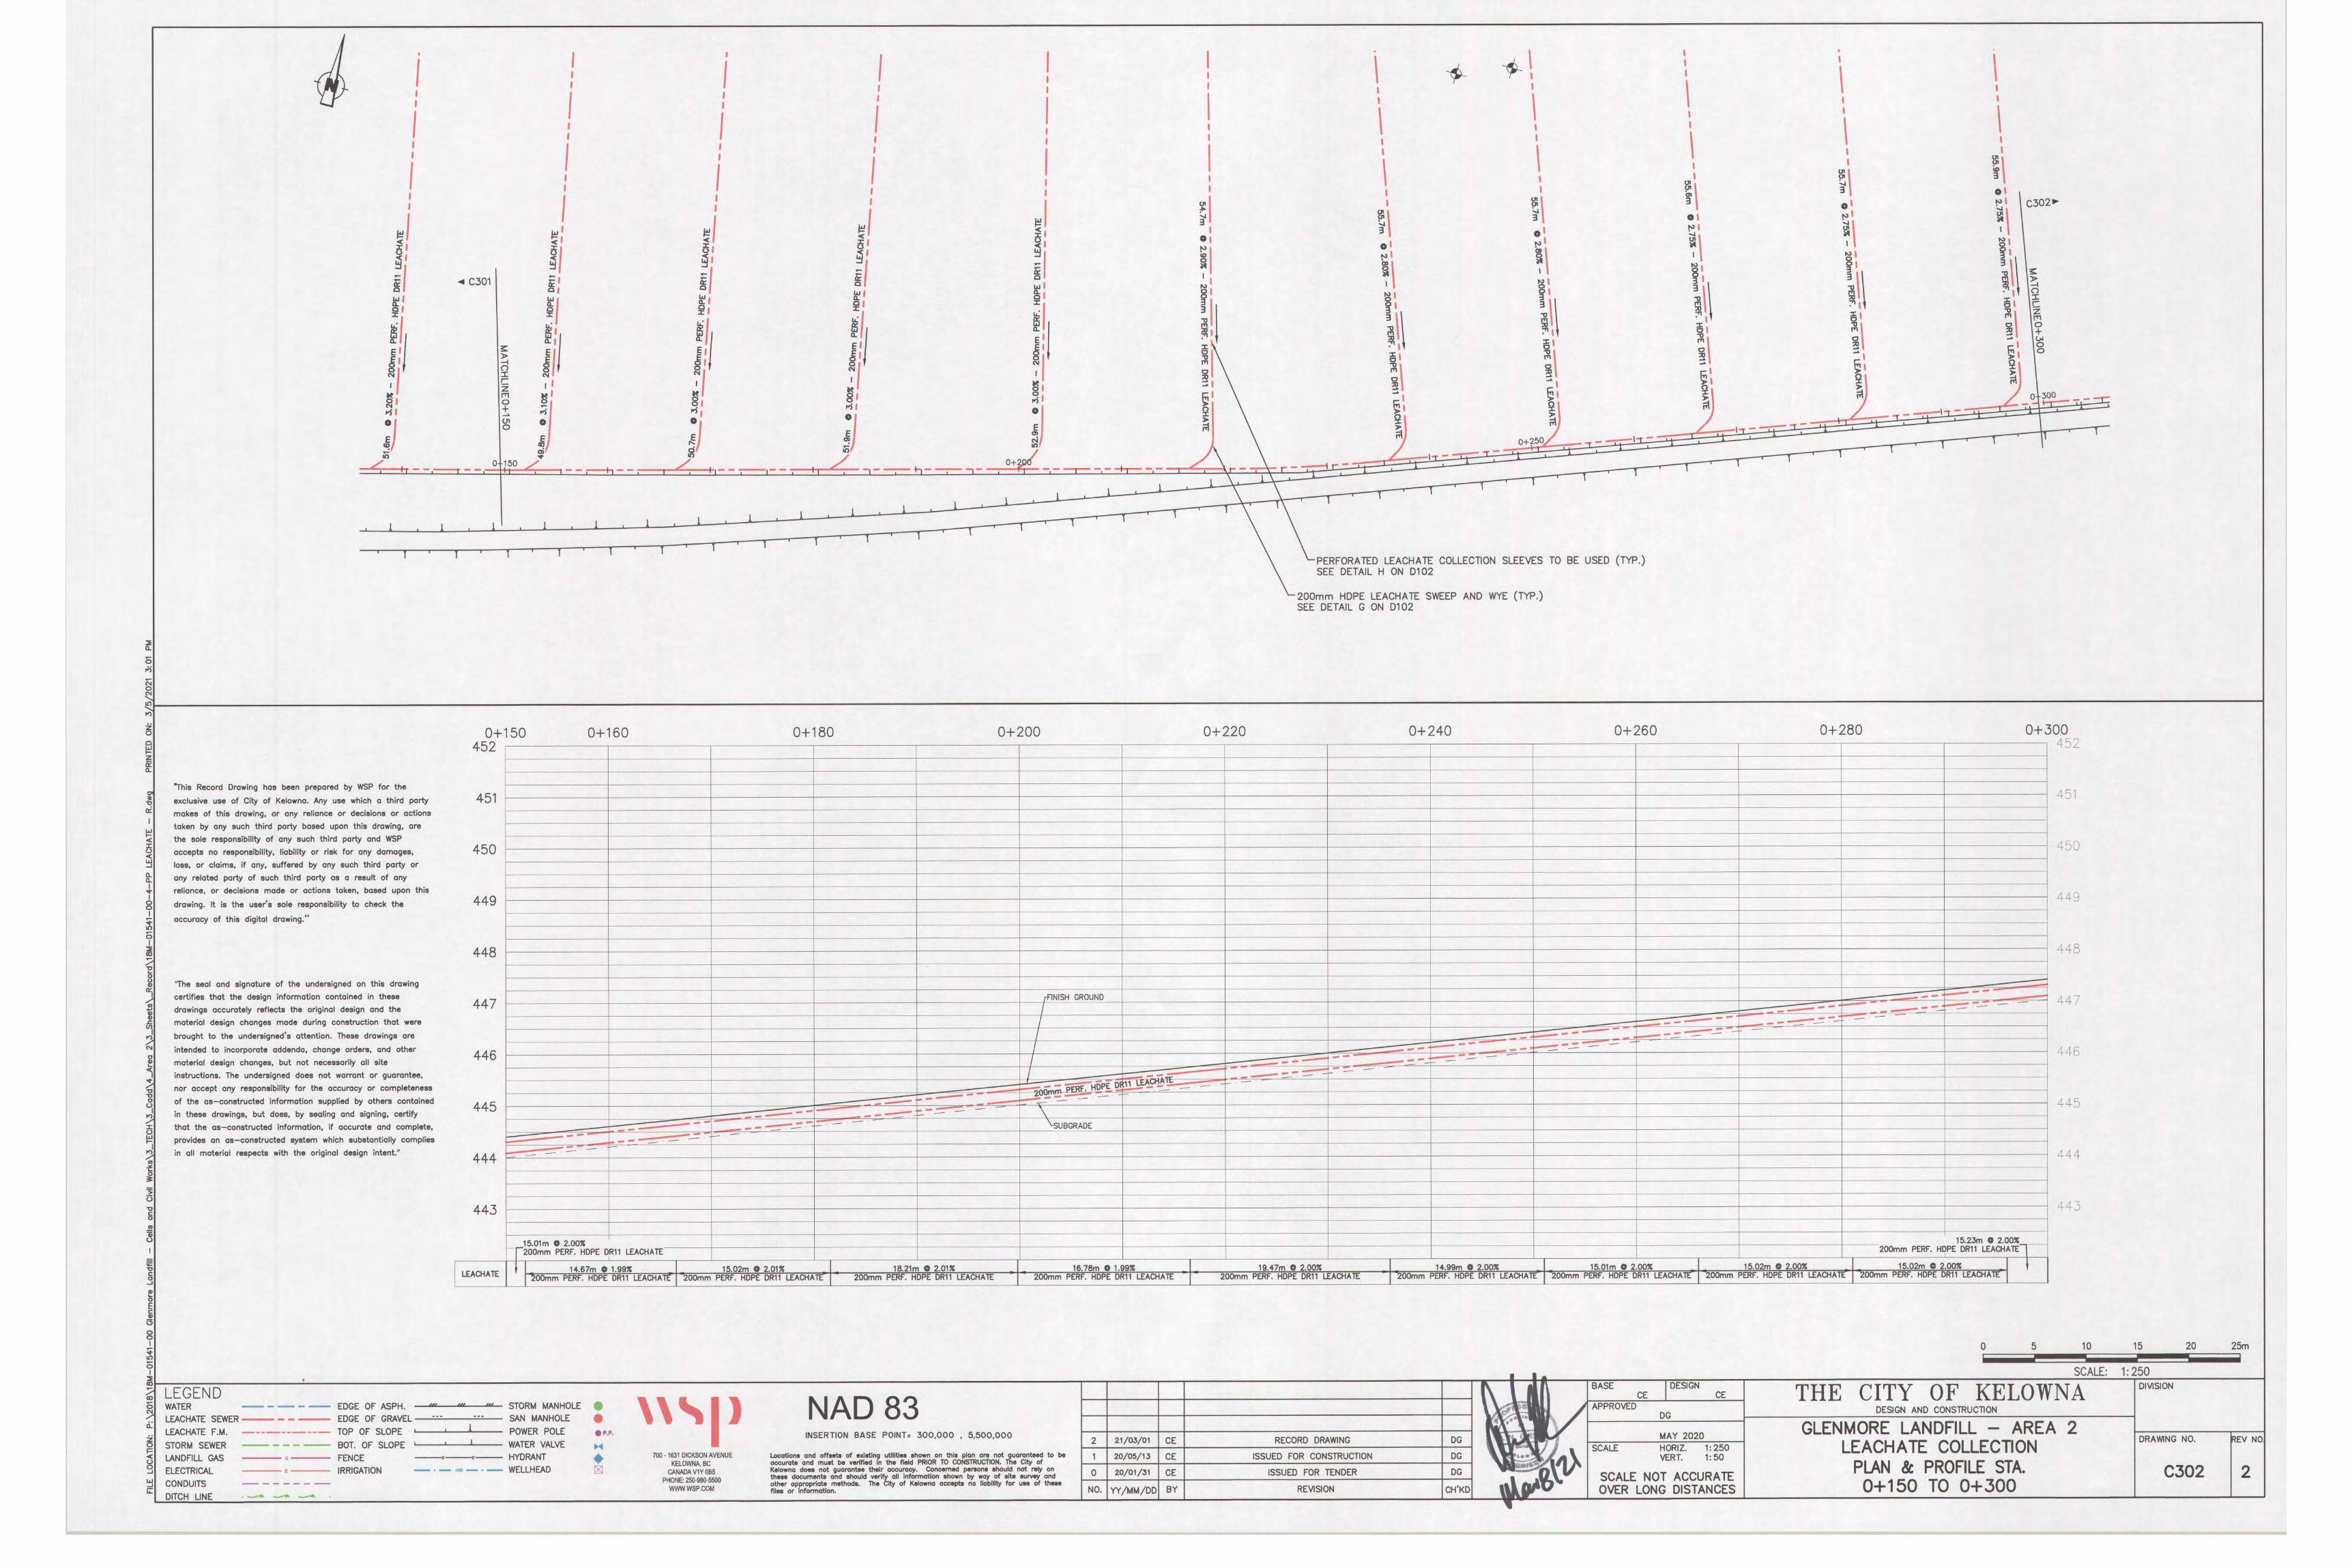
a. Operational and Filling Plan Filling operations continued in AREA 1 in 2020, followed by the completion of the “J” lift in Phases 1 and 2. While filling progressed in these locations, AREA 2 was constructed in the northern end of the property. Construction included earthworks for grading, liner and leachate infrastructure, landfill gas tie ins, berm construction and road improvements. Filling of AREA 2 started in late 2020 and when the first lift is completed in approximately April 2021, filling will then alternate between AREAS 1 and 2 for the next few years. The construction details for AREA 2 can be found in Appendix 4 – AREA 2 Record Drawings, WSP Inc., March 8, 2021. An estimated 71,514 tonnes of clean fill was received in 2020 and used as cover or placed into the soil stockpile. In addition, the landfill produced approximately 45,000 m3 of clean fill during on site earthworks for various projects. Acceptance of clean fill will be limited in 2021 as the soil stockpile is nearing capacity. Construction of a new Operations building incorporating a landfill workshop, heated area to park the equipment to apply daily cover and fire suppression, and a covered mechanics bay to service equipment was completed. Other ancillary infrastructure will be relocated to other buildings and lay-down areas. b. Landfilling Method The area method will be used to place and compact waste in cells of approximately 20,000 m3. A 0.3 meter intermediate soil cover will be applied on the lift and alternate daily cover will be applied on the working face. Wastes will be spread in thin layers (0.6 meters or less) and compacted. Compaction will be achieved using a Tana E525 landfill compactor, with a CAT 836H Compactor used when the TANA is being serviced. c. Glengrow The production of Glengrow compost is located at the 10-hectare site constructed to the south of the Phase 3 area of the landfill. Stockpiling and grinding of yard waste feed stock is still accomplished in the receiving area east of Phase 2. Plans are in the works for relocating the organics and recyclable receiving area adjacent the composting facility to the south of the Phase 3 slough. Additional works are planned for the Glengrow composting operations. An Aerated Static Pile (ASP) system is being designed to improve composting efficiency and accommodate future composting volumes growth. d. Controls
• Litter is controlled by compaction of the waste and minimizing the working face. Fencing for litter control is placed around the fill area as required.
• Dust control will continue by applying water and seeding of exposed areas. • Vector control will continue by using a combination of distress calls, harassment
and daily cover. A falconer continues to assist in reducing the impact of nuisance birds, and a pilot project for Starling control was initiated with the BC Fruit growers Association.
• Mud control for internal roads will be accomplished through the construction and maintenance of all-weather access roads to the working face. Crushed shale and

Operational Certificate 12218 Annual Report 2020 March 29, 2021 7
ground up wood chips will be used as a pad at the tipping area. A wheel wash system is in place to minimize mud tracking coming off-site.
• Weeds have been mitigated primarily by gas powered weed eaters, mowing and by the use of an excavator to clear any overgrown areas.
• Visual aesthetics have been addressed by the planting of additional trees and shrubs in the new berm along John Hindle Drive and on the hillside to the east of the residential drop off transfer station. Further landscaping along the western side of the landfill along Glenmore Road will be incorporated into other site projects in future years.
e. Heavy Equipment Utilized for Landfill Operations
• TANA E525 Landfill Compactor • Caterpillar 836H Landfill Compactor • Volvo D7E Electric Hybrid Dozer • Case 921 FXR Front End Loader • Volvo L110H Front End Loader • Komatsu PC220 Excavator • Two International 7500 Roll-off bin trucks • Two Komatsu WA 380 Front End Loader • Additional Rental equipment as required
f. Landfill Personnel
• 8 Equipment Operators • 9 Landfill Attendants/Spotter • 4 Landfill Technicians • 1 full time and 6-part time Scale Operators • 2 Supervisors • 1 Manager • 1 Operations Clerk
Additional staff were brought onsite from other departments to support the landfill after the start of the COVID-19 pandemic due to heavier than normal traffic volumes. g. Scale House Operations A new scale program was installed in 2020, as the current scale program is no longer supported by the manufacturer.

Operational Certificate 12218 Annual Report 2020 March 29, 2021 8
4. DATA AND INFORMATION
a. Waste Reduction Accomplishments Table 4 - Material Diverted from Landfill Disposal On-site (tonnes)
Year Material Diverted 2016 66,506 2017 67,983 2018 73,542 2019 79,880 2020 70,767
Most of the material diverted (49,482 tonnes) was organics such as yard waste, prunings and clean wood waste (pallets and other dimensional lumber). These organic wastes are composted on-site and sold as soil amendment marketed under the name of GlenGrow. Clean dimensional lumber was ground and supplied to Tolko Industries in exchange for hog fuel that was utilized in the production of OgoGrow, a biosolids based compost produced at another City of Kelowna facility. Select painted lumber is chipped and beneficially re-used on-site as padding material for mud and dust control, but in not included in the volume recovered. A total of 6237.11 tonnes of drywall was received at the Glenmore Landfill in 2020, with 3673.12 tonnes shipped off-site for recycling. More restrictive receiving conditions by recyclers are creating a challenging process for acceptance of this material at the landfill, and the City is working to find additional recycling capacity. b. Leachate Management The leachate collection system at the Glenmore Landfill consists of gravity drains that feed two leachate lift stations. Leachate is combined with sewage from the City’s residential sewer system at one of these lift stations prior to discharge off-site. The sewage/leachate mixture is treated with BIOXIDE® Calcium Nitrate Solution and is aerated to reduce hydrogen sulfide levels. The air from the aeration process is treated for odours with a Biorem Multi-Stage Biofilter. The treated sewage/leachate is discharged into the municipal sanitary sewer system on Glenmore Road and is ultimately processed at the City’s Wastewater Treatment Facility. Leachate discharge volumes increased in 2020 due to continual pump operation and the target to lower water levels onsite. Discharge volumes are summarized in the table below. Note that leachate discharged from the site does not equal leachate generated as pumping rates are dependent of surface water levels. Table 5 – Leachate Discharge to Wastewater Treatment Facility (WWTF) in m3
Year Quantity Discharged 2016 40,998 2017 82,367 2018 152,984 2019 126,300 2020 160,310
Operational Certificate 12218 Annual Report 2020 March 29, 2021 9
c. Leachate Recirculation The purpose of leachate recirculation is to collect the water from beneath the landfill which is pumped back into covered waste cells through landfill gas collection trenches in Phase 1. The concept is that the recirculated leachate will increase the in-situ moisture content of the waste. This would further encourage anaerobic decomposition in the buried waste cells, generating increased amounts of methane (and other landfill gases) which would result in increased throughput of landfill gas to the FORTIS BC Biogas Plant. A potential added benefit of the accelerated decomposition of in-situ waste is that the decomposing material will take up less volume in the landfill. The resulting subsidence would ultimately provide increased air space for continued landfilling activities. Due to staff shortages, fewer leachate recirculation events occurred in 2020. Between May and October of 2020, approximately 836.8m3 of leachate was introduced into the landfill. A new pump was purchased for this project and will be installed in future years as budget allows. The data being collected will be reviewed over the next year to assist planning for later implementation of the re-circulation on a full scale. d. Landfill Gas Review The 2020 highlights related to the landfill gas management system included the installation of 11 new horizontal collector runs consisting of 988 m of new pipe. These collectors will be attached to the header system in 2021 or 2022.
Table 6 – 2020 Landfill Gas Volume Summary Flare Flow volume 523,127 m3 FORTIS BC Biogas Plant Flow volume 2,737,570 m3 Total LFG Destroyed by Flare/Biogas 3,260,697 m3 Methane captured based on 50% methane by volume
1,630,348 m3
Calculated methane produced (tonnes) 1,087 Collection Efficiency (%) 66%
The FORTIS BC Plant was the primary method of managing recovered landfill gas resulting in 84% of the total landfill gas in 2020 being beneficially reused. The Landfill Gas Management System had 8 callouts and a total downtime of 28.8 hours for both scheduled and non-scheduled downtime. This downtime is approximately 0.97% of total operations time compared to 85 hours (0.97%) downtime in 2019. A summary of downtime hours collected for the SCADA system and field notes is included in Tables 7a and 7b below. Scheduled Flare maintenance is performed while the FORTIS Biogas Plant was is operational to eliminate possible downtime. The site had two system shut downs due to incidents involving heavy equipment damaging pipes.
After hour callouts were typically less than one hour. Scheduled maintenance included exercising all valves, filling P-Traps, new gas run connections to the system and flare maintenance which were completed when FORTIS BC wasnot operational.

Operational Certificate 12218 Annual Report 2020 March 29, 2021 10
Table 7a – 2020 Landfill gas system unscheduled outage summary
Table 7b -2020 Landfill Gas Management System Downtime Total Annual hours (2020 was a leap year) 8784 Total run time hours – FORTIS or Flare 8728.8 Hours downtime 28.8 % Time operational 99.7%
The details of the flare efficiency and overall collection efficiency for the LFG system can be found in the Landfill Gas Collection Efficiency Study completed by Jacobs of Calgary, AB. This Study is based on the model and requirements of the BC Landfill Gas Facilities Design Guidelines, 2010, and is attached to this report as Appendix 5 - 2020 Landfill Gas Collection Efficiency Study – Glenmore Landfill Site, JACOBS, March 12, 2021. Landfill Gas Collection Efficiency was calculated to be 66% for 2020. We are making strides to bring this up to the performance objective of 75% with the help of further scada system refinements and enhancements to our monitoring program.
Date Outage Time Total Downtime
Reason
Jan 13 13:20-13:55 35 mins Extreme cold temperatures prevented automated start up
Jan 14 12:11-13:15 64 mins Fortis plant fault lost permissive signal to flare causing shutdown
Jan 19 07:15-08:00 45 mins Fortis plant fault lost permissive signal to flare causing shutdown
Jan 21 08:15-08:45 30 mins Flare blower fault required manual reset of vfd’s
Feb 03 00:14-00:40 26 mins Fortis plant fault lost permissive signal to flare causing shutdown
Feb 19 02:00-02:32 32 mins Fortis plant fault lost permissive signal to flare causing shutdown
May 25 09:22-10:02 40 mins Piping system damaged by heavy equipment causing air intrusion and system shutdown.
May 27 08:04-08:28 24 mins Piping system damaged by heavy equipment causing air intrusion and system shutdown
TOTAL 296 mins (4.9hrs)

Operational Certificate 12218 Annual Report 2020 March 29, 2021 11
Landfill gas was monitored monthly in perimeter vapour probes and at a minimum monthly at gas wellheads in compliance with the requirements of the Landfill Gas Management Regulation. Gas quality at the flare and upstream of the FORTIS Biogas Plant was monitored on a continual basis with alarming and emergency system shutdowns in place.
e. Groundwater Groundwater sampling events took place in late May/early June and October/early November as per the recommendations of the 2019 Glenmore Landfill Annual Water Quality Report. A smaller third event occurred in August to sample a small number of wells that were missed during the May event. Groundwater wells in addition to surface water and leachate locations were sampled for the parameters of concern by Landfill Environmental Technologists. Samples were submitted to Caro Analytical Services of Kelowna, BC for analysis and the data reporting and corresponding interpretation was completed by SNC-Lavalin Inc. (SNC) of Kelowna, BC. The SNC findings for the water monitoring program including groundwater, surface water and leachate are attached to this report. See Appendix 6 - 2020 Glenmore Landfill Annual Water Quality Report, SNC Lavalin Inc, March 25, 2020. As noted in the SNC report, no significant changes to water levels or water quality were noted in the results from the 2019 water monitoring program, with the exception of an increase in concentration of a small number of leachate indicator parameters at three wells in locations adjacent to or south of the Phase 3 Slough and an increase in one indicator parameter at a well located north of the slough.
Three groundwater monitoring wells were decommissioned in April 2020 as they were located in the Area 2 expansion area. Decommissioning was overseen by WSP Inc. and was carried out as per the Groundwater Protection Regulation by a drilling contractor. In addition to the groundwater sampling mentioned above, the wells were sampled prior to decommissioning.
f. Surface Water
As part of the surface water management process, Tutt Pond was used as an irrigation source during the agricultural season. Sprinkling occurred intermittently in July and August. This irrigation process has been used at the site for decades to manage surface water. Based upon recommendations from Golder Associates in previous years, water levels were not pumped below a specified elevation in Tutt Pond to eliminate the risk of leachate from being drawn into the pond. To support the use of surface water for irrigation, a Human Health and Environmental Risk Assessment – Evaluating Water Use From Tutt Pond and Bredin Pond, Glenmore Landfill, Sept 24, 2018, SNC-Lavalin (HHERA) was completed and historically submitted to the Province. The HHERA concluded that there were no unacceptable risks to human health. Potential low to medium ecological risk was identified related to increasing pH and sodium concentrations over time for irrigating. Quarterly water sampling for pH and sodium and annual soil pH and sodium adsorption ratio testing were recommended. This testing was completed as part of the 2020 environmental monitoring program and will continue in 2021. Surface water samples were collected from the four on-site surface water bodies in April, June, September and October. Samples were also collected from Bubna Slough and Slough #2, located north of the landfill, as well as Little Robert Lake and Robert Lake, located south of the landfill, in the same months to aid with assessing background water quality in

Operational Certificate 12218 Annual Report 2020 March 29, 2021 12
the region (exception: no sample was collected from Little Robert Lake in April 2020). As noted in the SNC 2020 water report, no significant changes to water levels or water quality were noted in 2020, except for lower ammonia in Bredin Pond. The off-site samples collected suggested that the parameters exceeding the applicable regulatory criteria are representative of background surface water quality conditions. g. Leachate Sampling
Per the recommendation in the SNC 2019 water report, a new leachate sampling point was established in September 2020 to replace the Phase 1 sampling location which was buried in 2019 during the Area 1 liner preparation. The new sampling point is mainly representative of leachate collected over top of the Area 1 liner with a small contribution from leachate collected from below the liner.
Leachate samples were collected at two locations on the Landfill site in March and June, and the third new location was added for September and November 2020. Samples were representative of Area 1, Phase 1, Phase 2 and combined leachate prior to Bioxide treatment and aeration.
h. Hydrogeological Review The landfill typically conducts a fully comprehensive hydrogeological report every five years. The next occurrence for this is anticipated to begin after the 2021 sampling events are completed. i. Vegetation Analysis Observations of vegetation at the landfill perimeter were conducted monthly. There were no visible indications of adverse effects on plants due to leachate or landfill gas migrating to the root zones outside the landfill limit of waste. The landscaped berms along Glenmore Road lost many trees due to a failure in the irrigation system. This section of landscaping will be replaced when internal road alignment work and surface water management infrastructure is addressed in the next two to four years. j. Financial Security The updated Financial Security Plan was completed in the updated DOCP to meet the requirements of the Second Edition of Landfill Criteria For Municipal Solid Waste (June 2016). The Financial Security Plan was calculated based on estimated closure costs plus post-closure Operations and Monitoring of 80 years as determined by the Contaminating Lifespan Analysis. The Financial Closure Fund will be updated with the assistance of the City Financial department based on the PS 3270 Accounting Principles. This fund is currently calculated to be just over $81M. Tipping fee rates have been scheduled for adjustment in 2019 and 2020 to ensure funding for projects based on the 2018 DOCP and the City’s 10-year Capital Plan. As in previous years, excess revenues were deposited into a reserve fund that will be used to develop the site for infrastructure and capital costs for items such as leachate, landfill gas, and water management systems, and to cover the cost of landfill closure and post closure.

Operational Certificate 12218 Annual Report 2020 March 29, 2021 13
5. LIST OF APPENDICES Appendix 1 – Upgrading Plan Update, City of Kelowna, February 23, 2020 Appendix 2 – Odour Monitoring Results Summary, GHD Canada, dated September 10, 2020 Appendix 3 – OC12218 Amendment, Province of British Columbia, May 27, 2020 Appendix 4 – AREA 2 Record Drawings, WSP Inc., March 8, 2021 Appendix 5 - 2020 Landfill Gas Collection Efficiency Study – Glenmore Landfill Site, JACOBS, March 12, 2021 Appendix 6 - 2020 Glenmore Landfill Annual Water Quality Report, SNC Lavalin Inc, March 25, 2020

Appendix 1 Upgrading Plan Update, City of
Kelowna, February 23, 2020

Item # DOCP Section Task Description June 11 2020 Status 2021 Q1 Status
Site Operations
1 4.6
Update Nuisance Impact Assessment with more Site specific data (dust, odour, etc.)
Nuisance modelling using CALPUFF completed by GHD and reported under separate cover. Results of nuisance modelling to be briefly summarized in Upgrading Plan updates or Annual Reports
Nuisance modelling using CALPUFF completed by GHD and reported under separate cover. Results of nuisance modelling to be briefly summarized in Upgrading Plan updates or Annual Reports
2 12.8Fire break 15 metres around landfill footprint. City to undertake this task. The completion of this task will be
documented in the Upgrading Plan updates or Annual ReportsSome initial work was completed in 2020. Additional ongoing budget approved for annual work to be completed by a contractor starting in 2021.
3 15.3 Landfill Gas (LFG) Generation Assessment required in 2021 (5 year review)
City to retain a consultant to complete this work in 2021 This work should be completed by Q3 of 2021 and will be submitted as a stand alone report when available.
4 15.5 LFG management ‐ confirm Safe Work Procedures (SWP), training, best management practices (BMPs) for protection and signage
City to undertake this task. The completion of this task will be documented in the Upgrading Plan updates or Annual Reports
Assigned to the Landfill Environmental Techs and to be completed in 2021.
5 Fill PlanConceptual design for Area 2 including access roads, leachate management infrastructure, etc.
City has retained WSP to undertake this work. Completed, area 2 was substantially constructed in 2020 with paving to be completed in 2021. As builts provided by WSP to be included in the 2020 Annual report.
6 6.8
Maintain leachate levels below 437 metres above mean sea level (m AMSL) in the Slough. Consider installing a SCADA system to alarm the City if leachate levels are approaching the 437 m AMSL threshold
City to undertake this task. The completion of this task will be documented in the Upgrading Plan updates or Annual Reports
The City uses Proficy Portal to manually monitor the leachate levels in Leachate 1 and 2 and will confirm these are representative of leachate levels with manual measurements. Levels might vary across the site depending on the elevation from North to South.
Organics Facility
7 ‐Conceptual design for new location of the organics facility on Site. Ensurenew location for organics facility meets requirements of the Organic Matter Recycling Regulation
City to retain a consultant to complete this work In progress, WSP retained to perform this work. Design/Build RFP pending for 2021.
Site Administration
8 12.3.3
OC Amendment to expand contaminated soil acceptance criteria City has retained GHD to support this application. In progress. Application submitted, and awaiting draft of revised Operational Certificate from BC MoECC in early 2021. Required expiration of the Provincial Order in Council that occurred in January 2021.
9 Appendix C Financial Security Plan City has undertaken and completed this task. This will be documented in the Upgrading Plan updates and Annual Reports.
Completed in 2020.
Site Geotechnical Investigations
10 10.2 ‐ 10.3Additional geotechnical/liquefaction assessment City to retain a consultant to complete this work. Results of geotechnical
assessment will be documented under separate cover and briefly summarized in the Upgrading Plan
Scheduled as future work (2023 ‐ 2025) to include the Groundwater Impact Assessment
Environmental Monitoring
11 11.1
Groundwater impact assessment ‐ additional sets of nested wells to be installed in the southern portion of the Site.
Additional monitoring wells installed. The wells will be included in the Site's monitoring program to provide groundwater data for the Groundwater Impact Assessment. Results of Impact Assessment to be provided under separate cover
Four additional nested wells installed in late 2019 (three sets to the South and one set to the North) and baseline monitoring is underway.
12 11.1Implement recommended changes to the Site's environmental monitoring program including: background groundwater/surface water locations, surface water locations, hydraulic levels, new monitoring wells
City to collect additional water quality data over the next 1 to 2 years to characterize the new sampling locations. Results to be incorporated into Impact Assessment Report and Annual Reports
Changes to the environmental monitoring program implemented and data being collected to establish baseline. Data needed to complete the Impact Assessment in future years.
13 18 Update existing environmental monitoring program sampling events to include additional recommended sampling locations
See DOCP Sec 11.1 status Completed
14 18.2.1Establish a leachate sampling location from lined and unlined areas (or equivalent sampling location).
See DOCP Sec 11.1 status. New sample location added for Area 1 (P1 Leachate MH‐2) to be sampled twice in 2020. Area 2 also has sample location that should be added to 2021 program.
15 18.4.2
Complete a landfill gas (LFG) migration assessment and install LFG monitors inside Site buildings
City has installed gas monitors in the on site buildings. City to retain a consultant to complete a LFG migration assessment to determine the bestlocations for LFG probes around the Site. Gas monitoring results to be summarized in Annual Reports
Landfill Gas Migration Assessment to be completed in 2021 by GHD and will be included in the 2021 Annual Report. Additional wells will be scheduled over a number of years starting in 2021. A report evaluating monitoring needs for building was completed by SLR and was submitted as part of the 2018 annual report
16ENV Inspection
letter (Jul 23, 2019)
Complete a background water quality/Robert Lake water quality study to assist in determining background water quality conditions for the Site
See DOCP Sec 11.1 status In progress, data being acquired by ongoing sampling events as per DOCP Item 11.1 above

Surface Water Management
17 5
Complete surface water modelling onsite as part of the Northern Pond and diversion pipe design
City has retained WSP to proceed with the design. Design and construction details to be reported under separate cover
Conceptual stormwater design completed by WSP in 2020. In 2021, preliminary design to be split between on‐site and off‐site work. More detailed modelling required on‐site. Off‐site exercise based on pipeline flow, alignment and discharge to Brandt's Creek. Application for water license for off‐site storage ponds and discharge to Brandt's Creek (2021‐2026).
18 12.7.6
Finish berm on John Hindle and re‐vegetate the berm along Glenmore The berm construction/re‐vegetation along John Hindle was completed in 2019 by the City. Re‐vegetation of the berm along Glenmore will be scheduled after the construction of the surface water diversion pipe is completed.
Berm re‐configuration to be included as part of the Storm Water Management Plan and will be re‐vegetated when completed (estimated 2026)
19 13.3Downstream surface water assessment as part of the Northern Pond construction and stormwater diversion piping to Brandt's Creek permitting (FLNRORD, ENV, ALC, etc.) and design
See DOCP Sec 5 status. City has retained WSP to proceed with the design and assist with required permitting
Flow monitoring stations to be installed in 2021 in selected locations, measuring water flows and water quantity to develop historical data records (surface water run‐on vs Leachate) as part of Groundwater Impact

Appendix 2 Odour Monitoring Results
Summary, GHD Canada, dated September 10, 2020
GHD | 138 East 7th Avenue Suite 100 Vancouver British Columbia V5T 1M6 Canada | 084612 | Report No 7 | September 10 2020
Odour Monitoring Results Summary Glenmore Landfill Kelowna, BC
City of Kelowna
GHD | Odour Monitoring Results Summary | 084612 (7) | Page i
Table of Contents
1. Introduction ................................................................................................................................... 1
2. Methodology ................................................................................................................................. 1
3. Results and Observations ............................................................................................................ 1
4. References ................................................................................................................................... 2
Figure Index Figure 1 Odour Monitoring Locations
Table Index Table 1 Odour Monitoring Data
Appendix Index Appendix A Photo Log

GHD | Odour Monitoring Results Summary | 084612 (7) | Page 1
1. Introduction
GHD was contracted by the City of Kelowna (City) to conduct an assessment for odours emanating from the composting facility at the Glenmore Landfill (Site). The purpose of the odour monitoring event was to quantify the odour concentrations during grinding operations. This data may be used refine the inputs to GHD’s nuisance modelling assessment (i.e., CALPUFF model) at a later date.
GHD also conducted odour monitoring in a nearby residential neighbourhood.
The odour monitoring event was conducted on July 9, 2020, to determine the extent of odour impacts originating from compost material grinding and routine landfilling activities at the Site.
2. Methodology
GHD conducted odour monitoring at fifteen locations throughout the Site. On-site locations were selected to target areas with the potential for the strongest odours, including the compost grinding area, compost area, leachate manholes, and the active face of the landfill. Odour monitoring measurements were collected during compost grinding operations in Area 4 of the Site and at static compost piles in the composting area. Odours were also assessed at two off-site locations along Quail Run Road and Allegro Mews, a residential area located approximately 500 metres (m) east of the Site boundary. The residential odour monitoring was completed to identify potential odour impacts originating from the Site to the residential neighborhood.
Odour monitoring was conducted using a Scentroid SM100i Intelligent Personal Olfactometer and a tablet with ODMAP automated sampling software.
Odour was measured in odour units (OU). One OU represents the strength of odour at which 50 percent of the population can detect its presence.
3. Results and Observations
A detailed list of the Site conditions and odour monitoring results are provided in Table 1. The following details associated with each monitoring location are provided in Table 1: time of measurement, location coordinates, wind speed, wind direction, hedonic tone, and odour concentrations. Figure 1 illustrates the locations of the odour monitoring measurements. A photolog of some of the selected monitoring locations is provided in Appendix A.
On the afternoon of July 9, 2020, the winds were generally from the south with speeds between 4 to 11 kilometres per hour (km/hr) (Environment Canada). The average ambient temperature during the monitoring event was 18.97 degrees Celsius. It was overcast, with light rain occurring before the odour monitoring event, and no precipitation occurring over the duration of the event.
Odour concentration measurements were the highest during compost material grinding (Locations 1 through 6) and ranged from 625 OU to 4,479 OU. The odours in the compost area, Locations 12 and 13, were comparable at 4,479 OU.
GHD | Odour Monitoring Results Summary | 084612 (7) | Page 2
Intermittent leachate odours at Locations 7 and 8, upwind and downwind of the leachate wet well, were detected, but could not be quantified due to the intermittent nature of the odour. Odour concentration measurements of 0 OU were measured at Locations 9 and 10 near the leachate manholes along the western boundary of Area 1. Odours at Location 11 at the active landfill face was measured at 2,926 OU. At the residential monitoring locations in the Quail Ridge neighbourhood, odour concentration measurements of 0 OU were detected at both Location 14 and Location 15.
4. References
Environment Canada Historical Climate Data, accessed July 14, 2020. Climate ID 1123939
All of Which is Respectfully Submitted,
GHD
Michaela Dyck, P. Geo.
Deacon Liddy, P. Eng.
.

!( !(
!(!(!(
!(
!(
!(
!(
!(
!(
!(
!(
!(
!(
1
2
34
5
6
78
9
10
11
1213
14
15
0 70 140 210
Meters
FIGURE 1
084612 Aug 26, 2020
GIS File: Q:\GIS\PROJECTS\84000s\84612\Layouts\007\084612(007)GIS-OT001.mxd
ODOUR MONITORING LOCATIONS
Source: Google Earth Imagery, Date 05/20/2017
Coordinate System:NAD 1983 UTM Zone 11N
CITY OF KELOWNAGLENMORE LANDFILL, KELOWNA, BCODOUR MONITORING RESULTS SUMMARY
Legend!( Odour Monitoring Location
Location Odour Concentration (OU/m3) Hedonic Tone1 2926 unpleasant2 982 unpleasant2 - unpleasant3 10357 unpleasant4 625 unpleasant4 - unpleasant5 4479 very unpleasant6 4479 very unpleasant7 0 unpleasant8 - unpleasant9 0 neutral
10 0 neutral11 - unpleasant11 2926 unpleasant12 4479 unpleasant13 - unpleasant14 0 neutral15 0 neutral

Table 1
Odour Results
Odour Monitoring Results Summary - July 9, 2020
Glenmore Landfill
City of Kelowna
Page 1 of 1
Date Time Location Longitude Latitude
Wind Speed
(km/hr) Wind Direction Hedonic Tone
Odour
Concentration
(OU/m3) Comments
7/9/2020 12:16 PM 1 -119.4153504 49.95949245 8 SE unpleasant 2926 Upwind of compost grinding7/9/2020 12:23 PM 2 -119.4153504 49.95949245 8 SE unpleasant 982 Upwind of compost grinding7/9/2020 12:27 PM 2 -119.4153504 49.95949245 8 SE unpleasant - Upwind of compost grinding7/9/2020 12:28 PM 3 -119.4153504 49.95949245 8 SE unpleasant 10357(2) Downwind of compost grinding7/9/2020 12:31 PM 4 -119.4153504 49.95949245 8 SE unpleasant 625 Adjacent to freshly turned compost material pile7/9/2020 12:33 PM 4 -119.4153504 49.95949245 8 SE unpleasant - Adjacent to freshly turned compost material pile7/9/2020 12:34 PM 5 -119.4153504 49.95949245 8 SE very unpleasant 4479 Downwind of compost grinding7/9/2020 12:36 PM 6 -119.4153504 49.95949245 8 SE very unpleasant 4479 Downwind of compost grinding7/9/2020 12:55 PM 7 -119.4155347 49.95925268 8 SE unpleasant 0 Upwind of leachate wet well7/9/2020 1:01 PM 8 -119.4155347 49.95925268 11 SW unpleasant - Downwind of leachate wet well7/9/2020 1:16 PM 9 -119.4227326 49.95892286 11 SW neutral 0 Adjacent to leachate manhole7/9/2020 1:21 PM 10 -119.4227326 49.95892286 11 SW neutral 0 Adjacent to leachate manhole7/9/2020 1:35 PM 11 -119.4227326 49.95892286 11 SW unpleasant - Downwind of landfill active face7/9/2020 1:36 PM 11 -119.4227326 49.95892286 11 SW unpleasant 2926 Downwind of landfill active face7/9/2020 1:52 PM 12 -119.4181181 49.95990355 11 SW unpleasant 4479 Downwind of unloading of ground compost material7/9/2020 1:55 PM 13 -119.4181181 49.95990355 11 SW unpleasant - Downwind of unloading of ground compost material7/9/2020 2:29 PM 14 -119.4052226 49.96048684 4 SW(1) neutral 0 Residential neighbourhood7/9/2020 2:38 PM 15 -119.4057618 49.9626588 4 SW(1) neutral 0 Residential neighbourhood
Notes:
Wind Speed and Direction Data were obtained from the Environment Canada. Kelowna Station (Climate ID:1123939)Weather data measured during the beginning of the hourly interval is considered representative of the whole hour.(1) Wind direction data missing from Environment Canada weather data, wind direction estimated by GHD field staff.(2)Likely inaccurate reading.- Unsuccessful reading due to intermittent nature of the odour.
GHD 084612-RPT-7-T1

GHD | Odour Monitoring Results Summary | 084612 (7)
Appendix A Photo Log

Site Photographs
GHD | Odour Monitoring Results Summary | 084612 (7) | Page 1
Photo 1 - Looking northwest at Location 1.
Photo 2 - Looking southeast at Location 5.
Site Photographs
GHD | Odour Monitoring Results Summary | 084612 (7) | Page 2
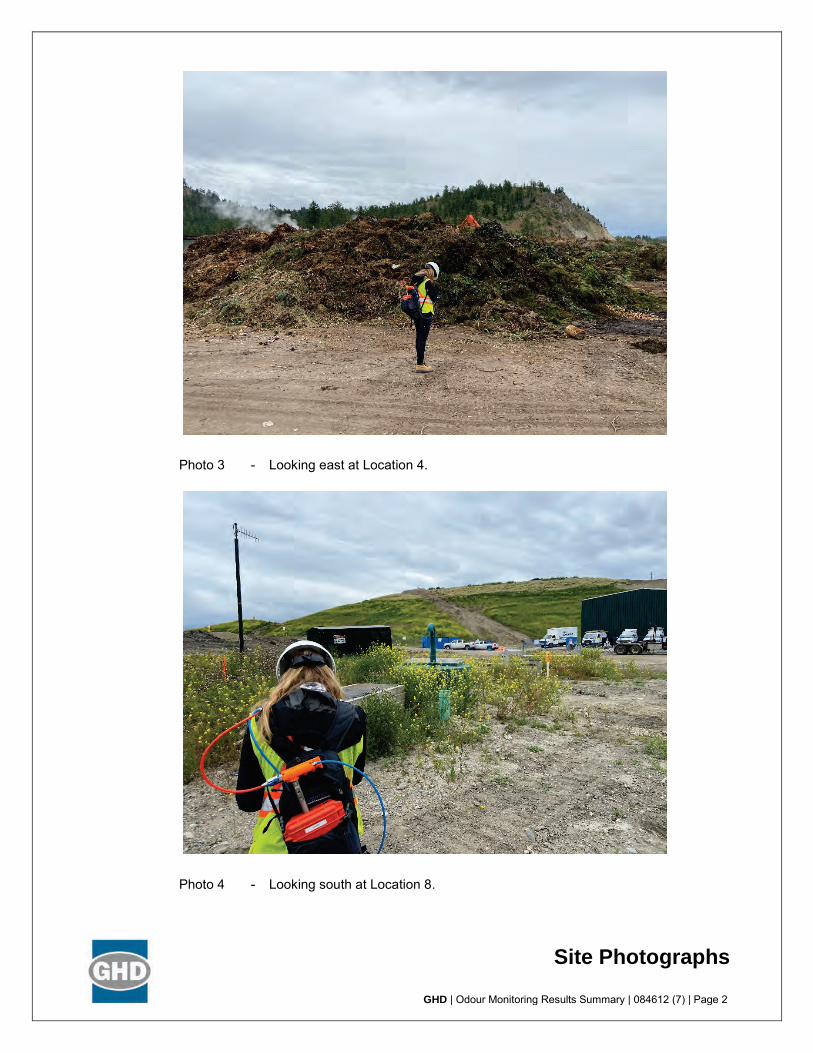
Photo 3 - Looking east at Location 4.
Photo 4 - Looking south at Location 8.

Site Photographs
GHD | Odour Monitoring Results Summary | 084612 (7) | Page 3
Photo 5 - Looking north at Location 10.
Photo 6 - Looking south at Location 11.

Site Photographs
GHD | Odour Monitoring Results Summary | 084612 (7) | Page 4
Photo 7 - Looking south at Location 13.
Photo 8 - Looking southwest at Location 14.

Site Photographs
GHD | Odour Monitoring Results Summary | 084612 (7) | Page 5
Photo 9 - Looking southwest at Location 15.

Appendix 3 OC12218 Amendment,
Province of British Columbia, May 27, 2020
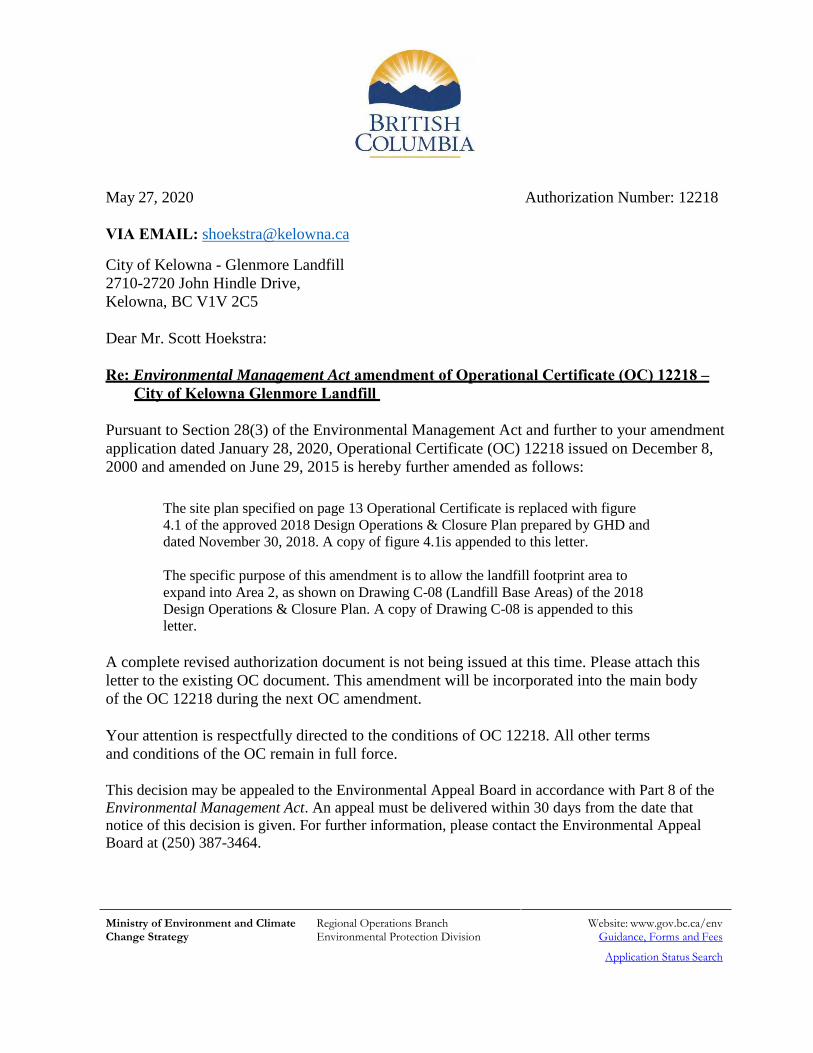
May 27, 2020 Authorization Number: 12218
VIA EMAIL: [email protected]
City of Kelowna - Glenmore Landfill
2710-2720 John Hindle Drive,
Kelowna, BC V1V 2C5
Dear Mr. Scott Hoekstra:
Re: Environmental Management Act amendment of Operational Certificate (OC) 12218 – City of Kelowna Glenmore Landfill
Pursuant to Section 28(3) of the Environmental Management Act and further to your amendment
application dated January 28, 2020, Operational Certificate (OC) 12218 issued on December 8,
2000 and amended on June 29, 2015 is hereby further amended as follows:
The site plan specified on page 13 Operational Certificate is replaced with figure
4.1 of the approved 2018 Design Operations & Closure Plan prepared by GHD and
dated November 30, 2018. A copy of figure 4.1is appended to this letter.
The specific purpose of this amendment is to allow the landfill footprint area to
expand into Area 2, as shown on Drawing C-08 (Landfill Base Areas) of the 2018
Design Operations & Closure Plan. A copy of Drawing C-08 is appended to this
letter.
A complete revised authorization document is not being issued at this time. Please attach this
letter to the existing OC document. This amendment will be incorporated into the main body
of the OC 12218 during the next OC amendment.
Your attention is respectfully directed to the conditions of OC 12218. All other terms
and conditions of the OC remain in full force.
This decision may be appealed to the Environmental Appeal Board in accordance with Part 8 of the
Environmental Management Act. An appeal must be delivered within 30 days from the date that
notice of this decision is given. For further information, please contact the Environmental Appeal
Board at (250) 387-3464.
Ministry of Environment and Climate Change Strategy
Regional Operations Branch Environmental Protection Division
Website: www.gov.bc.ca/env Guidance, Forms and Fees
Application Status Search

City of Kelowna Authorization Number: 12218
May 27, 2020 Page 2 of 2
Please advise if you have questions regarding the above conditions.
Yours truly,
Luc Lachance, P.Eng.
For Director,
Environmental Management Act
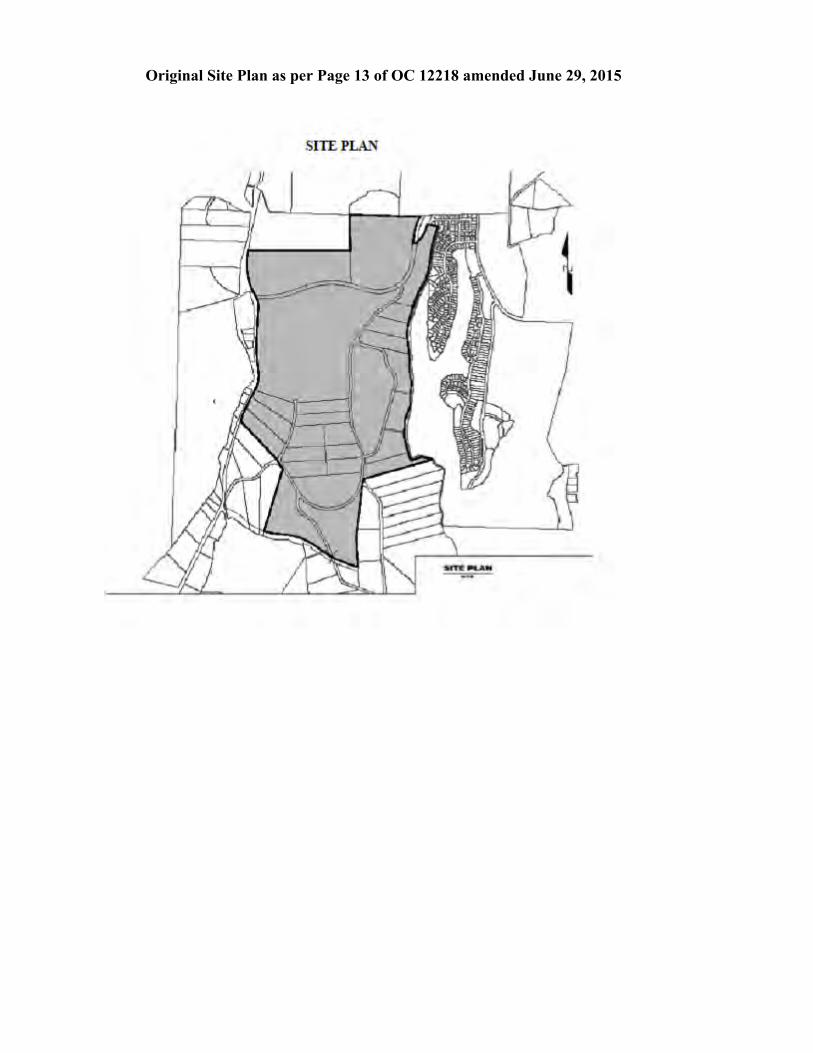
Original Site Plan as per Page 13 of OC 12218 amended June 29, 2015
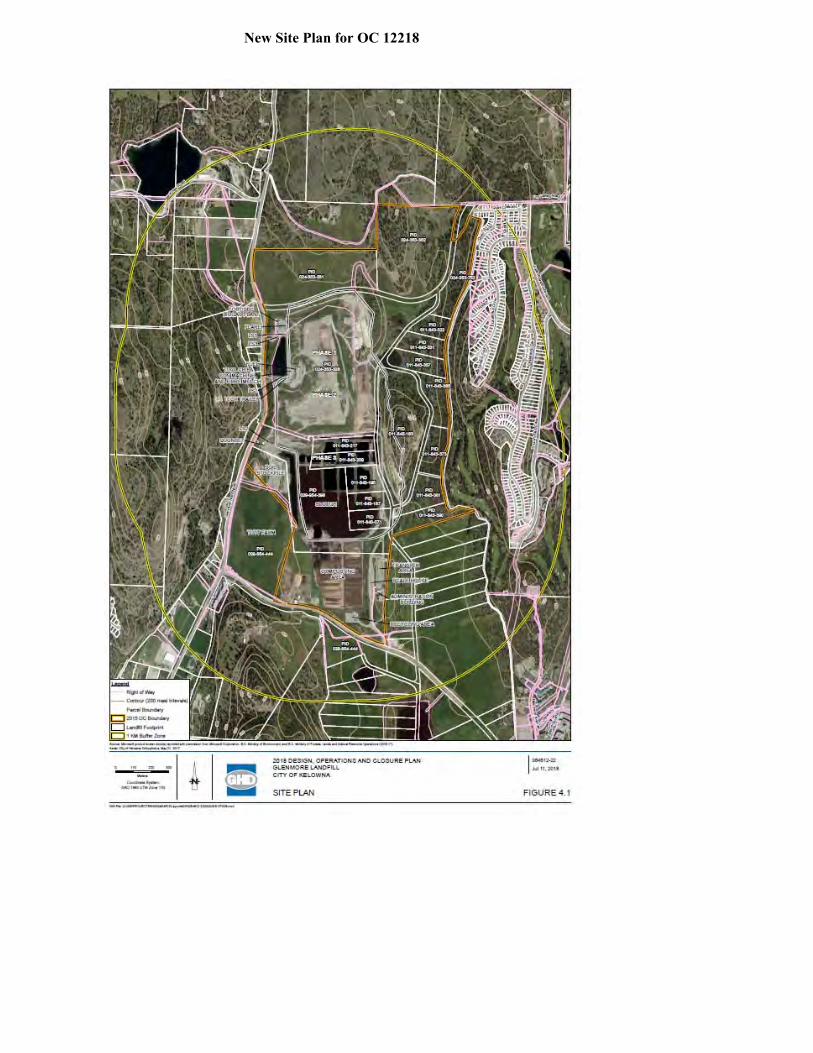
New Site Plan for OC 12218

New Site Plan for OC 12218 showing future landfill stages and limit of waste

Appendix 4 Area 2 Record Drawings, WSP
Inc., March 8, 2021


Appendix 5 2020 Landfill Gas Collection Efficiency Study – Glenmore Landfill Site, JACOBS, March
12, 2021

MemorandumUnit 330205 Quarry Park Boulevard SECalgary, Alberta T2C 3E7Canadawww.Jacobs.com
FES0213201444CGY 1
Subject Final 2020 Landfill Gas Collection Efficiency Study – Glenmore Landfill Site
Attention City of Kelowna (City)
From Raymond Li, Ph.D., P.Eng., Jacobs Engineering Group Inc. (Jacobs)
Date March 12, 2021
1. Introduction
This technical memorandum (TM) was prepared by CH2M HILL Canada Limited (CH2M), now a JacobsCompany, to provide the City of Kelowna with the estimated landfill gas (LFG) collection system efficiencyfor 2020, using up-to-date waste composition and waste filling data (CH2M, 2010; City, 2011, 2012, 2013,2014, 2015, 2016, 2017, 2018, 2019; 2020 and Enevoldson, 2021a, pers. comm.). The LFG recovery wasassessed, along with the factors influencing actual LFG generation and recovery at the Glenmore Landfill(Site). The collection system’s efficiency was also calculated using the formulas contained within theBritish Columbia Ministry of Environment and Climate Change Strategy’s (BC MOECCS’s) LFGManagement Facilities Design Guidelines (CRA, 2010).
2. Background
The Site is located on Glenmore Road approximately 1.5 kilometres (km) east of Okanagan Lake and9 km northeast of the Kelowna city centre. The Site is owned and operated by the City; has an estimatedavailable airspace of 40,000,000 cubic metres (m3); and is expected to reach capacity by 2107 (GHD,2018). The Site has been in operation since 1966 (City, 2018).
Landfilling occurred in the Phase 1 and Phase 2 areas during 2020. In 2020, the total buried waste wasestimated as 142,535 tonnes (Enevoldson, 2021a, pers. comm.).
3. Regulatory Framework
On December 8, 2008, a regulation for the management of LFG at British Columbia (BC) regulated landfillsites was ordered and approved by BC MOECCS. In accordance with the Landfill Gas ManagementRegulation (Regulation), a regulated landfill site has 100,000 tonnes or more of municipal solid waste(MSW), or has received 10,000 or more tonnes of MSW annually for disposal into the landfill site in anycalendar year after 2008 (BC MOECCS, 2008). With over 100,000 tonnes annually, Glenmore Landfill isclassified as a regulated landfill.
After the landfill falls under the regulation, a qualified professional is required to conduct an initial LFGgeneration assessment (Assessment) using their knowledge with respect to solid waste and LFGmanagement to select models for LFG estimation, assess results, and provide requiredrecommendations. The Assessment must be conducted in accordance with the most recent edition ofLFG guidance documents, as approved by the BC MOECCS Director. The guidance documents includethe Landfill Gas Generation Assessment Procedure Guidelines (BC MOECCS LFG Guideline) that wasprepared by Conestoga-Rovers & Associates (CRA), dated March 2009, and the Landfill Gas GenerationEstimation Tool – for Annual Reporting (Tool) provided by British Columbia Environmental Protection and

Final 2020 Landfill Gas Collection Efficiency Study – Glenmore Landfill Site
2 FES0213201444CGY
Sustainability (BC EPS, 2021). Both are available on the BC EPS website and must be used in thepreparation of Assessments (CRA, 2009). The City submitted its first LFG generation assessment reportin 2010 (CH2M, 2010).
4. Landfill Gas Generation Assessment Methodology
This section summarizes the information required in the Regulation, in accordance with the BC MOECCSLFG Guideline, Section 4, Information Collection and Synthesis.
4.1 Annual Waste Buried
Table 1 presents the estimated annual amount of MSW disposed of at the Site between 1990 and 2020,as well as the projected volume of waste to be disposed at the Site for 4 years after the annualAssessment, which corresponds to the year 2024. Although wastes have been disposed at the Site since1966, Table 1 shows tonnages from 1990, used to estimate LFG generation using the BC EPS simulationtool.
Tonnes of refuse disposed at the Site between 2010 and 2019 are based on a previous Landfill GasCollection Efficiency Study (CH2M, 2020). The 2020 tonnage of waste landfilled at the Site as well asassumed projected annual tonnage for years 2021 through 2024 are based on personal communicationwith Darren Enevoldson, Environmental Technician and LFG Specialist at the City, on February 2, 2021(Enevoldson 2021a, pers. comm.).
Table 1. Annual Quantity of Waste Disposed at the Site
Years
Waste Disposed(tonnes)
Cumulative Waste Disposed(tonnes)
1990 87,434 87,434
1991 87,434 174,868
1992 93,852 268,720
1993 89,753 358,473
1994 84,272 442,745
1995 80,458 523,203
1996 80,794 603,997
1997 95,904 699,901
1998 83,756 783,657
1999 85,258 868,915
2000 89,547 958,462
2001 95,815 1,054,277
2002 102,522 1,156,799
2003 96,772 1,253,571
2004 106,483 1,360,054
2005 108,597 1,468,651
2006 116,218 1,584,869
2007 102,688 1,687,557
2008 100,611 1,788,168
2009 114,590 1,902,758
2010 119,861 2,022,619
2011 106,387 2,129,006

Final 2020 Landfill Gas Collection Efficiency Study – Glenmore Landfill Site
FES0213201444CGY 3
Table 1. Annual Quantity of Waste Disposed at the Site
Years
Waste Disposed(tonnes)
Cumulative Waste Disposed(tonnes)
2012 108,110 2,237,116
2013 108,917 2,346,033
2014 123,178 2,469,211
2015 136,115 2,605,326
2016 154,510 2,759,836
2017 151,456 2,911,292
2018 166,916 3,078,208
2019 156,566 3,234,774
2020 142,535 3,377,309
2021 155,000 3,532,309
2022 155,000 3,687,309
2023 155,000 3,842,309
2024 155,000 3,997,309
4.1.1 Waste Characterization Categories
Characterization according to waste type is required to follow the BC MOECCS LFG Guideline. Wastemust be characterized into three categories: relatively inert, moderately decomposable, anddecomposable. The most recent available waste composition study, 2013 Waste Composition Study ofRegional District of Central Okanagan (RDCO) (Morrison Hershfield Ltd., 2016), was used to determinethe proportions of relatively inert, moderately decomposable, and decomposable waste materials.
The various waste streams, including tonnage and percentages of total waste buried at the Site in 2020,where provided by the City and are summarized in Table 2 (Enevoldson 2021a, pers. comm.).
Table 2. 2020 Waste Stream Tonnage and Percentage of Total
Waste Stream TonnesPercentage
(%)
Residential (Cart) Garbage 41,092 25.83
Commercial (ICI) Garbage 37,714 26.46
C&D Debris 54,398 33.16
Contaminated Soil 4,129 2.90
Asbestos 724 0.51
Gypsum 2,564 1.80
Others 1,914 1.34
Total 142,535 100.00
Notes:% = percentC&D = construction and demolitionICI = industrial, commercial, and institutional
Final 2020 Landfill Gas Collection Efficiency Study – Glenmore Landfill Site
4 FES0213201444CGY
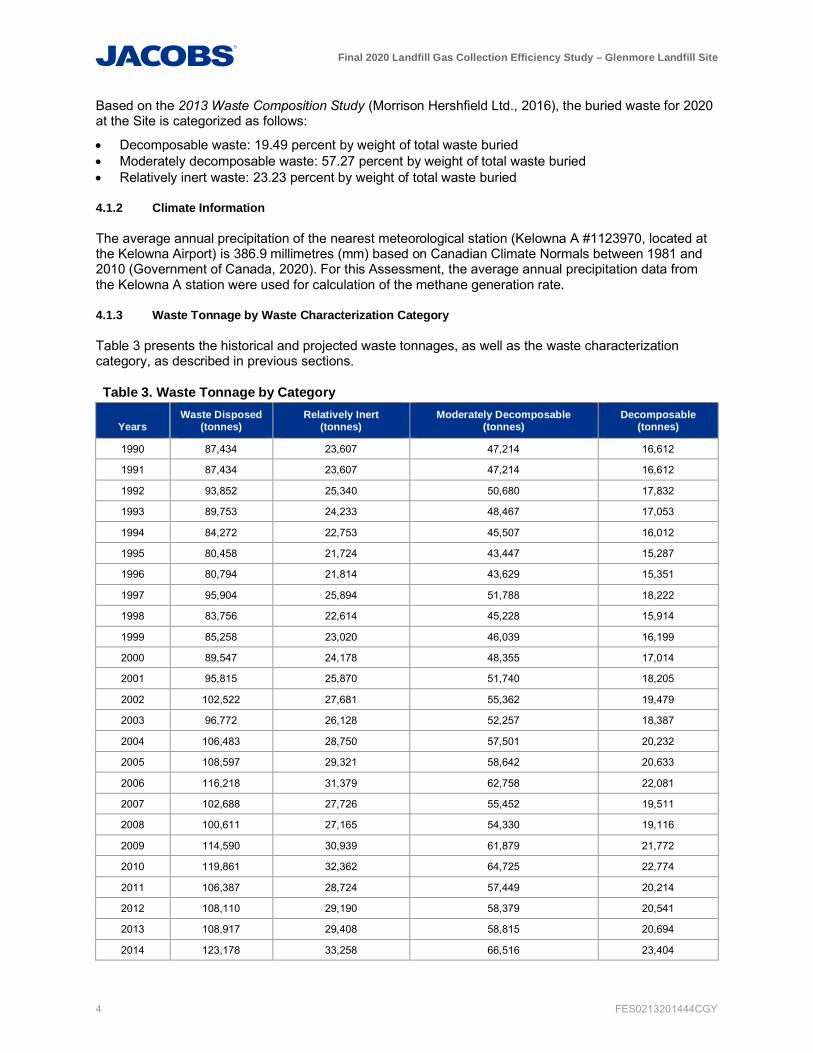
Based on the 2013 Waste Composition Study (Morrison Hershfield Ltd., 2016), the buried waste for 2020at the Site is categorized as follows:
· Decomposable waste: 19.49 percent by weight of total waste buried· Moderately decomposable waste: 57.27 percent by weight of total waste buried· Relatively inert waste: 23.23 percent by weight of total waste buried
4.1.2 Climate Information
The average annual precipitation of the nearest meteorological station (Kelowna A #1123970, located atthe Kelowna Airport) is 386.9 millimetres (mm) based on Canadian Climate Normals between 1981 and2010 (Government of Canada, 2020). For this Assessment, the average annual precipitation data fromthe Kelowna A station were used for calculation of the methane generation rate.
4.1.3 Waste Tonnage by Waste Characterization Category
Table 3 presents the historical and projected waste tonnages, as well as the waste characterizationcategory, as described in previous sections.
Table 3. Waste Tonnage by Category
YearsWaste Disposed
(tonnes)Relatively Inert
(tonnes)Moderately Decomposable
(tonnes)Decomposable
(tonnes)
1990 87,434 23,607 47,214 16,612
1991 87,434 23,607 47,214 16,612
1992 93,852 25,340 50,680 17,832
1993 89,753 24,233 48,467 17,053
1994 84,272 22,753 45,507 16,012
1995 80,458 21,724 43,447 15,287
1996 80,794 21,814 43,629 15,351
1997 95,904 25,894 51,788 18,222
1998 83,756 22,614 45,228 15,914
1999 85,258 23,020 46,039 16,199
2000 89,547 24,178 48,355 17,014
2001 95,815 25,870 51,740 18,205
2002 102,522 27,681 55,362 19,479
2003 96,772 26,128 52,257 18,387
2004 106,483 28,750 57,501 20,232
2005 108,597 29,321 58,642 20,633
2006 116,218 31,379 62,758 22,081
2007 102,688 27,726 55,452 19,511
2008 100,611 27,165 54,330 19,116
2009 114,590 30,939 61,879 21,772
2010 119,861 32,362 64,725 22,774
2011 106,387 28,724 57,449 20,214
2012 108,110 29,190 58,379 20,541
2013 108,917 29,408 58,815 20,694
2014 123,178 33,258 66,516 23,404

Final 2020 Landfill Gas Collection Efficiency Study – Glenmore Landfill Site
FES0213201444CGY 5
Table 3. Waste Tonnage by Category
Years
Waste Disposed(tonnes)
Relatively Inert(tonnes)
Moderately Decomposable(tonnes)
Decomposable(tonnes)
2015 136,115 36,751 73,502 25,862
2016 154,510 41,718 83,435 29,357
2017 151,456 40,893 81,786 28,777
2018 166,916 45,067 90,135 31,714
2019 156,566 40,707 84,546 31,313
2020 142,535 33,114 81,637 27,785
2021 155,000 36,010 88,776 30,214
2022 155,000 36,010 88,776 30,214
2023 155,000 36,010 88,776 30,214
2024 155,000 36,010 88,776 30,214
Note:Waste Disposed data are from Table 1; other data are based on calculations. Tonnage of each category prior to 2020 is basedon the 2019 Landfill Gas Collection Efficiency Study – Glenmore Landfill Site (CH2M, 2020).
5. Landfill Gas Generation Model
Methane production at the Site was estimated using the Tool specified by the British ColumbiaEnvironmental Protection and Sustainability (BC EPS) for annual reporting. The model is based on a first-order kinetic decomposition rate equation for quantifying emissions from the decomposition of wastes inMSW landfills. Table 4 presents the parameters required to run the model.
Table 4. Input Parameters used in the Tool
Input Parameters or Constants
LFG Generation Model
BC EPS LFG Guideline and Calculation Tool
First year of historical data used 1990
Year of Assessment 2020
Annual waste tonnage Annual waste acceptance from 1990 to 2020Annual waste tonnages for relatively inert, moderately decomposable, and decomposablewastes
k Methane generation rate
Methane generation rates For relatively inert, moderately decomposable, and decomposable wastes
Lo Methane generation potential
Waste types Relatively inert, moderately decomposable, and decomposable wastes
The following assumptions were used in the Tool:
· Lag time before start of gas production: 1 year· Methane by volume: 50 percent· Carbon dioxide by volume: 50 percent· Methane density at 1 atmosphere (atm), 25 degrees Celsius (°C): 0.6557 kilogram per cubic metre
(kg/m3)· Carbon dioxide density, 25°C: 1.7988 kg/m3
Final 2020 Landfill Gas Collection Efficiency Study – Glenmore Landfill Site
6 FES0213201444CGY
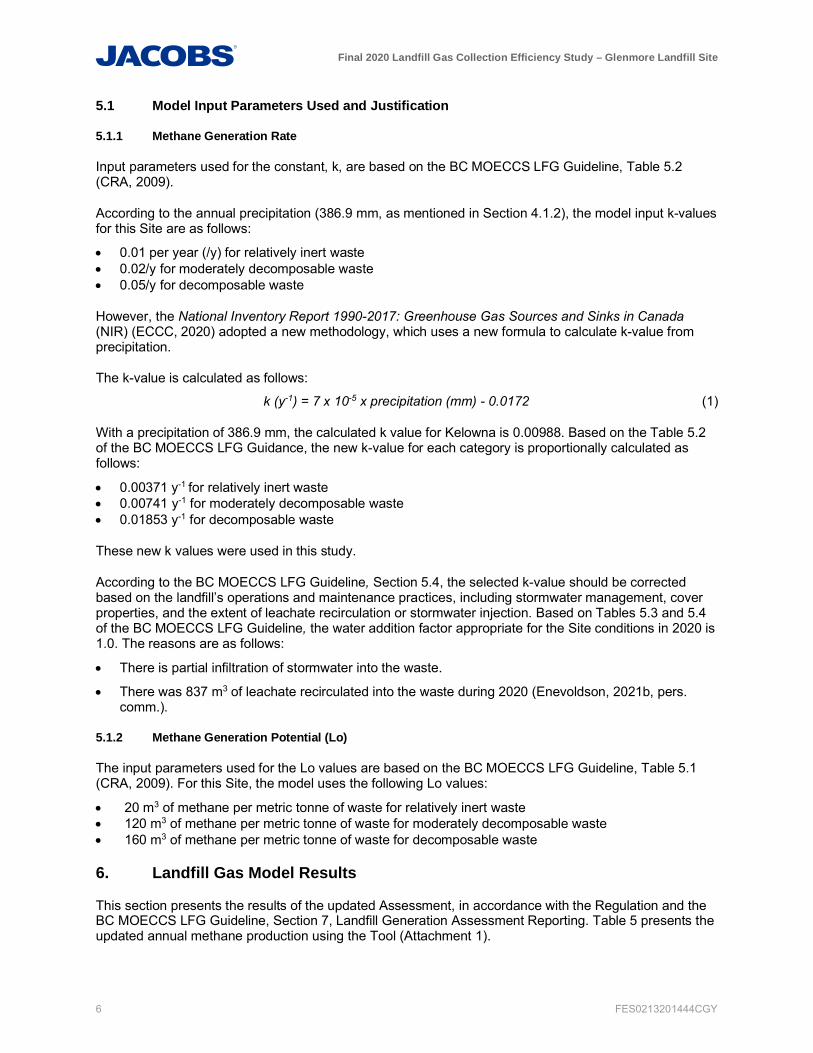
5.1 Model Input Parameters Used and Justification
5.1.1 Methane Generation Rate
Input parameters used for the constant, k, are based on the BC MOECCS LFG Guideline, Table 5.2(CRA, 2009).
According to the annual precipitation (386.9 mm, as mentioned in Section 4.1.2), the model input k-valuesfor this Site are as follows:
· 0.01 per year (/y) for relatively inert waste· 0.02/y for moderately decomposable waste· 0.05/y for decomposable waste
However, the National Inventory Report 1990-2017: Greenhouse Gas Sources and Sinks in Canada(NIR) (ECCC, 2020) adopted a new methodology, which uses a new formula to calculate k-value fromprecipitation.
The k-value is calculated as follows:
k (y-1) = 7 x 10⁻⁵ x precipitation (mm) - 0.0172 (1)
With a precipitation of 386.9 mm, the calculated k value for Kelowna is 0.00988. Based on the Table 5.2of the BC MOECCS LFG Guidance, the new k-value for each category is proportionally calculated asfollows:
· 0.00371 y-1 for relatively inert waste· 0.00741 y-1 for moderately decomposable waste· 0.01853 y-1 for decomposable waste
These new k values were used in this study.
According to the BC MOECCS LFG Guideline, Section 5.4, the selected k-value should be correctedbased on the landfill’s operations and maintenance practices, including stormwater management, coverproperties, and the extent of leachate recirculation or stormwater injection. Based on Tables 5.3 and 5.4of the BC MOECCS LFG Guideline, the water addition factor appropriate for the Site conditions in 2020 is1.0. The reasons are as follows:
· There is partial infiltration of stormwater into the waste.
· There was 837 m3 of leachate recirculated into the waste during 2020 (Enevoldson, 2021b, pers.comm.).
5.1.2 Methane Generation Potential (Lo)
The input parameters used for the Lo values are based on the BC MOECCS LFG Guideline, Table 5.1(CRA, 2009). For this Site, the model uses the following Lo values:
· 20 m3 of methane per metric tonne of waste for relatively inert waste· 120 m3 of methane per metric tonne of waste for moderately decomposable waste· 160 m3 of methane per metric tonne of waste for decomposable waste
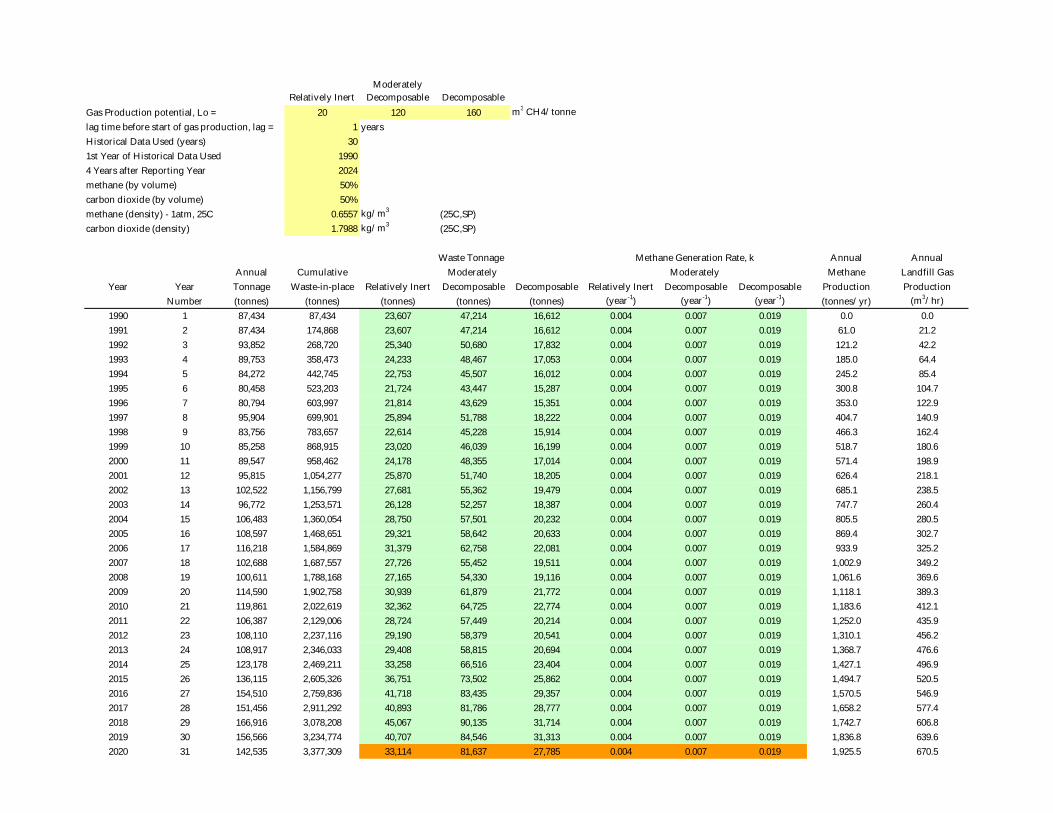
6. Landfill Gas Model Results
This section presents the results of the updated Assessment, in accordance with the Regulation and theBC MOECCS LFG Guideline, Section 7, Landfill Generation Assessment Reporting. Table 5 presents theupdated annual methane production using the Tool (Attachment 1).

Final 2020 Landfill Gas Collection Efficiency Study – Glenmore Landfill Site
FES0213201444CGY 7
Table 5. Annual Methane Production Using the BC MOECCS Calculation Tool for the GlenmoreLandfill
Estimated Quantity of Methane Produced Year Tonnes Per Year
In the year preceding the Assessment 2019 1,837
In the year of the Assessment 2020 1,926
1 year after the Assessment 2021 2,004
2 years after the Assessment 2022 2,091
3 years after the Assessment 2023 2,177
4 years after the Assessment 2024 2,261
According to Tool results, 1,926 tonnes of methane were generated in 2020, which corresponds toapproximately a 334 cubic metres per hour (m3/h) or 197 standard cubic feet per minute (scfm) methanegeneration rate (at 25°C, 101.3 kilopascals [kPa]). Using a typical LFG composition of 50 percentmethane and 50 percent carbon dioxide by volume, the LFG generation rate in 2020 is about 670.5 m3/h(394.6 scfm).
7. Landfill Gas System Efficiency
7.1 2020 Landfill Gas Collection Data
In 2020, there were 523,127 m3 of LFG destroyed through flaring and 2,737,570 m3 of LFG wasprocessed through the Fortis Biogas Plant for beneficial use by FortisBC (Enevoldson, 2021a, pers.comm.). This equates to a total of 3,260,697 m3 of LFG collected from the landfill.
7.2 2020 Landfill Gas Collection Efficiency
In accordance with the BC MOECCS LFG Design Guidelines, collection efficiency (CE) is calculatedbased on the following equation:
CE = (Qc/Qp)*100% (2)
Where:
CE = Collection efficiency expressed as a percentage (%)
Qc = Normalized average collected flow rate of LFG in the given calendar year (m3/h)
Qp = Estimated generated LFG flow rate in given calendar year (m3/h), which is calculated by the Tool
The normalized average collected flow rate of LFG (Qc) is calculated according to:
Qc = Qa* Cm/50% (3)
Where:
Qa = Average measured LFG flow rate (m3/h)
Cm = Annual average methane concentration measured during LFG management system uptime at acentral collection point near the blower or combustion and utilization device of the LFGmanagement system expressed as a percentage (%)

Final 2020 Landfill Gas Collection Efficiency Study – Glenmore Landfill Site
8 FES0213201444CGY
The average measured LFG flow rate (Qa) is measured according to the following:
Qa = VLFG / (24*number of days in that year) (4)
Where:
VLFG = Total volume of LFG collected in the calendar year 2020 (cubic metres per year [m3/y]); 2020 has366 days
Based on this formula:
Qa = VLFG / (24*366) (5)
Qa = 3,260,697 m3/ (24*366 hr) (6)
= 371.2 m3/h
Qp = 670.5 m3/h (from Tool)
Based on record data:
Cm = 59.3% (Enevoldson, 2021c, pers. comm.) (7)
Qc = Qa* Cm/50% (8)
= 371.2*59.3%/50%
= 440.2 m3/h
CE = (Qc/Qp)*100% (9)
= (440.2/670.5)*100%
= 65.7%
The final collection efficiency of the LFG collection system is estimated to be 66 percent.
8. Limitations
The findings and conclusions of this TM are based on information provided by the City, which is assumedto be correct, and certain assumptions as outlined in this TM. Except as provided for in this TM, Jacobshas made no independent investigation as to the accuracy or completeness of the information obtainedfrom the City or from other secondary sources during completion of this work. In some cases, however,information data gaps exist. The interpretation and findings of this TM were limited in these situations.
This TM was prepared using analyses and procedures consistent with generally accepted professionalengineering consulting principles and practices. No other warranty, expressed or implied, is made. ThisTM is solely for the use and information of the City of Kelowna (our client) unless otherwise noted. Anyreliance on this TM by a third party is at such party's sole risk.
Criteria contained herein apply to conditions existing when services were performed and are intendedonly for the purposes, locations, and project parameters indicated. Jacobs is not responsible for theimpacts of any changes in environmental standards, practices, or regulations subsequent to performanceof services.

Final 2020 Landfill Gas Collection Efficiency Study – Glenmore Landfill Site
FES0213201444CGY 9
9. References
British Columbia Ministry of Environment and Climate Change Strategy (BC MOECCS). 2008. LandfillGas Management Regulation. Province of BC ordered and approved December 8, 2008.
British Columbia Environmental Protection and Sustainability (BC EPS). 2021. Landfill Gas GenerationEstimation Tool – for Annual Report. https://www2.gov.bc.ca/gov/content/environment/waste-management/garbage/landfills Accessed February 19, 2021.
CH2M HILL Canada Limited (CH2M). 2010. Landfill Gas Generation Assessment Report – GlenmoreLandfill Site.
CH2M HILL Canada Limited (CH2M). 2019. 2018 Landfill Gas Collection Efficiency Study – GlenmoreLandfill Site.
CH2M HILL Canada Limited (CH2M). 2020. Final 2019 Landfill Gas Collection Efficiency Study –Glenmore Landfill Site.
City of Kelowna (City). 2011. 2010 Glenmore Landfill Annual Report.
City of Kelowna (City). 2012. 2011 Glenmore Landfill Annual Report.
City of Kelowna (City). 2013. 2012 Glenmore Landfill Annual Report.
City of Kelowna (City). 2014. 2013 Glenmore Landfill Annual Report.
City of Kelowna (City). 2015. 2014 Glenmore Landfill Annual Report.
City of Kelowna (City). 2016. 2015 Glenmore Landfill Annual Report.
City of Kelowna (City). 2017. 2016 Glenmore Landfill Annual Report.
City of Kelowna (City). 2018. 2017 Glenmore Landfill Annual Report.
City of Kelowna (City). 2019. 2018 Glenmore Landfill Annual Report.
City of Kelowna (City). 2020. 2019 Glenmore Landfill Annual Report.
Conestoga-Rovers & Associates (CRA). 2009. Landfill Gas Generation Assessment ProcedureGuidelines. Prepared for BC MOECCS. March.
Conestoga-Rovers & Associates (CRA). 2010. Landfill Gas Management Facilities Design Guidelines.Prepared for BC MOECCS. March.
Enevoldson, D., Environmental Technician and LFG Specialist, City of Kelowna. 2021a. Personalcommunication (email) with Chuck Smith, Jacobs. February 2.
Enevoldson, D., Environmental Technician and LFG Specialist, City of Kelowna. 2021b. Personalcommunication (email) with Raymond Li, Jacobs. February 23.
Enevoldson, D., Environmental Technician and LFG Specialist, City of Kelowna. 2021c. Personalcommunication (email) with Chuck Smith, Jacobs. February 25.
Environment and Climate Change Canada (ECCC). 2021. National Inventory Report 1990-2017:Greenhouse Gas Sources and Sinks in Canada. https://unfccc.int/documents/194925. AccessedFebruary 19, 2021.
GHD. 2018 Design, Operations, and Closure Plan
Government of Canada. 2020. 1981-2010 Climate Normals & Averages.https://climate.weather.gc.ca/climate_normals/station_select_1981_2010_e.html?searchType=stnName&txtStationName=kelowna&searchMethod=contains. Accessed February 19, 2021.

Final 2020 Landfill Gas Collection Efficiency Study – Glenmore Landfill Site
10 FES0213201444CGY
Morrison Hershfield Ltd. 2016. 2013 Waste Composition Study of Regional District of Central Okanagan.Prepared for the City of Kelowna.
Attachment 1British Columbia Ministry of Environment
and Protection and Sustainability’sMethane Generation Estimation Tool - for
Annual Reporting Results for theGlenmore Landfill Site

Year of Report 2020Annual Tonnage in Preceding Year 156,566 (tonnes/year)Total waste in Place in the Preceding Yr 3,234,774 (tonnes/year)Methane generation in the Preceding Yr 1,837 (tonnes CH4/year)
Waste Tonnage Methane Generation(tonnes) (tonnes CH4/year)
2020 142,535 1,9262021 155,000 2,0042022 155,000 2,0912023 155,000 2,1772024 155,000 2,261
Next Five Years
Relatively InertModerately
Decomposable DecomposableGas Production potential, Lo = 20 120 160 m3 CH4/tonnelag time before start of gas production, lag = 1 yearsHistorical Data Used (years) 301st Year of Historical Data Used 19904 Years after Reporting Year 2024methane (by volume) 50%carbon dioxide (by volume) 50%methane (density) - 1atm, 25C 0.6557 kg/m3 (25C,SP)carbon dioxide (density) 1.7988 kg/m3 (25C,SP)
Annual AnnualAnnual Cumulative Moderately Moderately Methane Landfill Gas
Year Year Tonnage Waste-in-place Relatively Inert Decomposable Decomposable Relatively Inert Decomposable Decomposable Production ProductionNumber (tonnes) (tonnes) (tonnes) (tonnes) (tonnes) (year-1) (year-1) (year-1) (tonnes/yr) (m3/hr)
1990 1 87,434 87,434 23,607 47,214 16,612 0.004 0.007 0.019 0.0 0.01991 2 87,434 174,868 23,607 47,214 16,612 0.004 0.007 0.019 61.0 21.21992 3 93,852 268,720 25,340 50,680 17,832 0.004 0.007 0.019 121.2 42.21993 4 89,753 358,473 24,233 48,467 17,053 0.004 0.007 0.019 185.0 64.41994 5 84,272 442,745 22,753 45,507 16,012 0.004 0.007 0.019 245.2 85.41995 6 80,458 523,203 21,724 43,447 15,287 0.004 0.007 0.019 300.8 104.71996 7 80,794 603,997 21,814 43,629 15,351 0.004 0.007 0.019 353.0 122.91997 8 95,904 699,901 25,894 51,788 18,222 0.004 0.007 0.019 404.7 140.91998 9 83,756 783,657 22,614 45,228 15,914 0.004 0.007 0.019 466.3 162.41999 10 85,258 868,915 23,020 46,039 16,199 0.004 0.007 0.019 518.7 180.62000 11 89,547 958,462 24,178 48,355 17,014 0.004 0.007 0.019 571.4 198.92001 12 95,815 1,054,277 25,870 51,740 18,205 0.004 0.007 0.019 626.4 218.12002 13 102,522 1,156,799 27,681 55,362 19,479 0.004 0.007 0.019 685.1 238.52003 14 96,772 1,253,571 26,128 52,257 18,387 0.004 0.007 0.019 747.7 260.42004 15 106,483 1,360,054 28,750 57,501 20,232 0.004 0.007 0.019 805.5 280.52005 16 108,597 1,468,651 29,321 58,642 20,633 0.004 0.007 0.019 869.4 302.72006 17 116,218 1,584,869 31,379 62,758 22,081 0.004 0.007 0.019 933.9 325.22007 18 102,688 1,687,557 27,726 55,452 19,511 0.004 0.007 0.019 1,002.9 349.22008 19 100,611 1,788,168 27,165 54,330 19,116 0.004 0.007 0.019 1,061.6 369.62009 20 114,590 1,902,758 30,939 61,879 21,772 0.004 0.007 0.019 1,118.1 389.32010 21 119,861 2,022,619 32,362 64,725 22,774 0.004 0.007 0.019 1,183.6 412.12011 22 106,387 2,129,006 28,724 57,449 20,214 0.004 0.007 0.019 1,252.0 435.92012 23 108,110 2,237,116 29,190 58,379 20,541 0.004 0.007 0.019 1,310.1 456.22013 24 108,917 2,346,033 29,408 58,815 20,694 0.004 0.007 0.019 1,368.7 476.62014 25 123,178 2,469,211 33,258 66,516 23,404 0.004 0.007 0.019 1,427.1 496.92015 26 136,115 2,605,326 36,751 73,502 25,862 0.004 0.007 0.019 1,494.7 520.52016 27 154,510 2,759,836 41,718 83,435 29,357 0.004 0.007 0.019 1,570.5 546.92017 28 151,456 2,911,292 40,893 81,786 28,777 0.004 0.007 0.019 1,658.2 577.42018 29 166,916 3,078,208 45,067 90,135 31,714 0.004 0.007 0.019 1,742.7 606.82019 30 156,566 3,234,774 40,707 84,546 31,313 0.004 0.007 0.019 1,836.8 639.62020 31 142,535 3,377,309 33,114 81,637 27,785 0.004 0.007 0.019 1,925.5 670.5
Waste Tonnage Methane Generation Rate, k
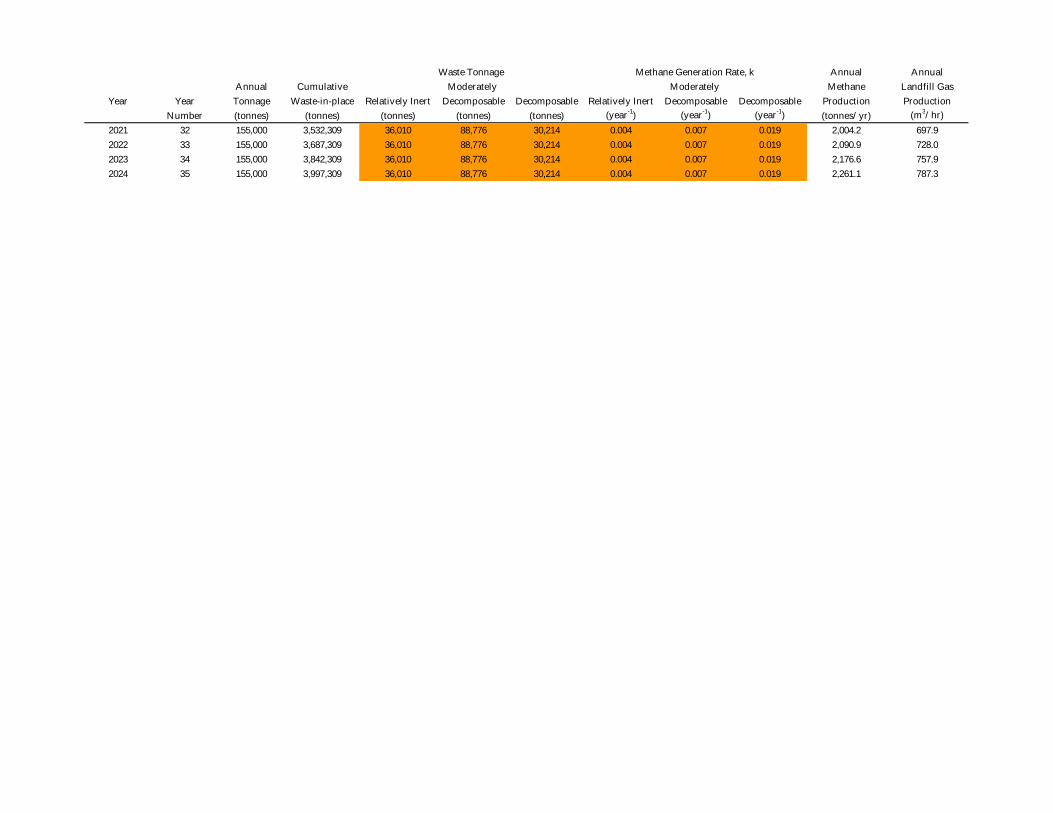
Annual AnnualAnnual Cumulative Moderately Moderately Methane Landfill Gas
Year Year Tonnage Waste-in-place Relatively Inert Decomposable Decomposable Relatively Inert Decomposable Decomposable Production ProductionNumber (tonnes) (tonnes) (tonnes) (tonnes) (tonnes) (year-1) (year-1) (year-1) (tonnes/yr) (m3/hr)
Waste Tonnage Methane Generation Rate, k
2021 32 155,000 3,532,309 36,010 88,776 30,214 0.004 0.007 0.019 2,004.2 697.92022 33 155,000 3,687,309 36,010 88,776 30,214 0.004 0.007 0.019 2,090.9 728.02023 34 155,000 3,842,309 36,010 88,776 30,214 0.004 0.007 0.019 2,176.6 757.92024 35 155,000 3,997,309 36,010 88,776 30,214 0.004 0.007 0.019 2,261.1 787.3

Appendix 6 2020 Glenmore Landfill Annual
Water Quality Report, SNC Lavalin Inc, March 25, 2020

2020 Glenmore Landfill Annual Water Quality Report Operations Certificate MR 12218 EMS Reference # E104956 Prepared for:
City of Kelowna
March 25, 2021
Internal Ref: 662036 › Final › V1
2020 Glenmore Landfill Annual Water Quality Report City of Kelowna
Internal Ref: 662036 › Draft › V2 March 25, 2021 | i © 2021 SNC-Lavalin Inc. All Rights Reserved. Confidential.
Table of Contents Signature Page
1 Introduction 1
2 Site Description 2
3 2020 Annual Water Quality Program 3
3.1 2020 Additional Site Works ............................................................................................................ 5
4 Groundwater and Surface Water Assessment Criteria 6
5 2020 Annual Water Quality Program Results 7
5.1 Fieldwork Methodology ................................................................................................................... 7 5.2 Field Observation ........................................................................................................................... 7 5.3 Groundwater and Surface Water Levels ........................................................................................ 7 5.4 Groundwater Chemistry .................................................................................................................. 8
5.4.1 Moderate to High Leachate Monitoring Wells ..................................................................... 8 5.4.2 Low to Minimal Leachate-Impacted Monitoring Wells ...................................................... 12 5.4.3 Comparison to Baseline Groundwater Quality .................................................................. 12
5.5 Surface Water Chemistry ............................................................................................................. 13 5.6 Leachate Chemistry ...................................................................................................................... 13 5.7 Quality Assurance/Quality Control (QA/QC) Program ................................................................. 14
6 Conclusions and Recommendations 16
7 Proposed 2021 Annual Water Quality Program 17
7.1 Groundwater Elevations ............................................................................................................... 17 7.2 Groundwater Quality ..................................................................................................................... 17 7.3 Surface Water Quality .................................................................................................................. 17 7.4 Leachate Quality ........................................................................................................................... 17 7.5 Data Analysis and Reporting ........................................................................................................ 18
8 Notice to Reader 19
9 References 20

2020 Glenmore Landfill Annual Water Quality Report City of Kelowna
Internal Ref: 662036 › Draft › V2 March 25, 2021 | ii © 2021 SNC-Lavalin Inc. All Rights Reserved. Confidential.
Table of Contents (Cont’d) In-Text Tables Table A: Summary of 2020 Groundwater Sampling Program – Semi-Annual Sampling ............................ 4 Table B: Summary of 2020 Surface Water Sampling Program – Quarterly Sampling ............................... 5 Table C: Summary of 2020 Leachate Sampling Program – Quarterly Sampling ........................................ 5 Table D: Summary of 2018 to 2020 Analytical Results for Leachate Parameter Indicators ..................... 10 Table E: Baseline Monitoring Wells .......................................................................................................... 13
Figures A. Water Elevations South End B. Water Elevations Centre South C. Water Elevations Centre A D. Water Elevations Centre B E. Water Elevations North F. Water Elevations Northeast G. 2018 to 2020 Concentrations of Ammonia, Total (as N), Chloride, Fluoride, and Sulfate for Select
Groundwater and Leachate Sample Locations H. 2018 to 2020 Concentrations of Chemical Oxygen Demand, Boron, Chromium, and Dissolved Iron for
Select Groundwater and Leachate Sample Locations
Tables 1: Detailed Monitoring Well Construction and Current Status 2a: Groundwater Elevations 2b: Surface Water Elevations 3a: Summary of Analytical Results for Groundwater – Inorganics 3b: Summary of Analytical Results for Groundwater – Dissolved Metals 3c: Summary of Analytical Results for Groundwater – Drinking Water Comparison - Inorganics 3d: Summary of Analytical Results for Groundwater – Drinking Water Comparison - Dissolved Metals 4a: Summary of Analytical Results for Surface Water – Inorganics 4b: Summary of Analytical Results for Surface Water – Total Metals 5: Summary of Analytical Results for Leachate
Drawings › 662036-001: Key Plan › 662036-002: Site Plan › 662036-003A: Potentiometric Elevations and Inferred Contours (March 2020) › 662036-003B: Potentiometric Elevations and Inferred Contours (September 2020)

2020 Glenmore Landfill Annual Water Quality Report City of Kelowna
Internal Ref: 662036 › Draft › V2 March 25, 2021 | iii © 2021 SNC-Lavalin Inc. All Rights Reserved. Confidential.
Table of Contents (Cont’d) Appendices I: ENV Operation Certificate 12218 II: May 25, 2011 Letter from BC Ministry of Environment and Climate Change Strategy re Glenmore
Landfill III: Fieldwork Methodology IV: Glenmore Landfill – Well Decommission Letter, prepared by WSP, April 9, 2020 V: Historical Analytical Data
P:\CP\CITY OF KEL\662036 GLNMRE LNDFL WTR MNTNG\50_DEL\53_FINAL_RPT_20210325_662036_RPT_GLNMRELNDFL_ANNWTRMNTNG_FINAL.DOCX

2020 Glenmore Landfill Annual Water Quality Report City of Kelowna
Internal Ref: 662036 › Draft › V2 March 25, 2021 | 1 © 2021 SNC-Lavalin Inc. All Rights Reserved. Confidential.
1 Introduction As requested by the City of Kelowna (CoK), SNC-Lavalin Inc. (SNC-Lavalin) has prepared this report summarizing the results of the 2020 annual environmental water quality monitoring program conducted by the CoK at the Glenmore Landfill, located in Kelowna, BC (Drawing 662036-001). The purpose of the data review is to assess the 2020 water level trends and review the groundwater, surface water and leachate concentrations associated with the Glenmore Landfill. The intent of this report is to satisfy the water monitoring requirements of the current Glenmore Landfill Operational Certificate (OC) 12218 (Appendix I) and to satisfy the recommendations made by the BC Ministry of Environment and Climate Change Strategy (ENV) in their letter to the CoK dated May 25, 2011 (Appendix II).

2020 Glenmore Landfill Annual Water Quality Report City of Kelowna
Internal Ref: 662036 › Draft › V2 March 25, 2021 | 2 © 2021 SNC-Lavalin Inc. All Rights Reserved. Confidential.
2 Site Description Glenmore Landfill (the ‘Site’) is in the north end of the City of Kelowna as seen in Drawing 662036-001. The exact Site Plan for the Glenmore Landfill is provided in OC 12218 (Appendix I). The Site boundaries and other main areas and key features of the Site including operational areas (i.e., Phase 1, Phase 2, Phase 3 Slough and Compost Facility), leachate collection system, surface water bodies within the Site (i.e., Northeast Pond, Bredin Pond and Tutt Pond and Slough) and surface water bodies located outside the boundaries of the Site (i.e., Bubna Slough and Slough #2 located upgradient and Little Robert Lake and Robert Lake located downgradient) as well as on and off-Site monitoring wells and surface water and leachate sample locations are show on Drawings 662036-002 and 662036-003. There are several monitoring well locations that are outside the boundaries of the Site including the GL41 series (three wells) located to the north of the landfill, GL15 well series (two wells) located to the southwest, the GL28 well series (three wells) located to the south, 06BH-02 and 09BH series (seven wells) located east, south and southeast of the site. Wells 06BH and 09BH are owned by the University of British Columbia (UBC). The CoK has been given permission by UBC to monitor and sample groundwater at these wells. Detailed well construction and status for each monitoring well installed on and off the Site can be found in Table 1, attached.

2020 Glenmore Landfill Annual Water Quality Report City of Kelowna
Internal Ref: 662036 › Draft › V2 March 25, 2021 | 3 © 2021 SNC-Lavalin Inc. All Rights Reserved. Confidential.
3 2020 Annual Water Quality Program As recommended in the 2019 Glenmore Landfill Annual Water Quality Report, dated March 10, 2020, the 2020 annual water quality program consisted of manual monitoring of 73 monitoring wells for water levels, monitoring surface water elevations with dataloggers and where possible monthly reporting of manual surface water elevations. Note the dataloggers were not found to be a reliable method of monitoring surface elevations (possibly due to soft bottoms of ponds). Select monitoring well locations were sampled semi-annually (i.e., spring – June 2020 and fall - September 2020) for water quality analysis. Surface water samples were collected quarterly from the four onsite surface water bodies (i.e., Northeast Pond, Slough, Tutt Pond and Bredin Pond) and from background surface water bodies (i.e., Little Robert Lake, Robert Lake, Bubna Slough and Slough #2. Leachate samples were collected quarterly from the on-Site leachate collection manholes (i.e., N Pumphouse Manhole (MH), P1 Leachate MH-2 [replaces P1 Leachate MH-1], and S Leachate Wet Well). Generally, quarterly surface water and leachate sampling was completed at the same time as water sampling.
Minor changes were made to the monitoring and sampling program for 2020 compared to the prior year including:
› P1 Leachate MH-2 was sampled in September and November 2020 only. This is a different location than previous years as the previous location (P1 Leachate MH-1) was buried during liner preparation in 2019.
› Multi-level monitoring wells installed in November 2019 in the vicinity of the southern Site boundary (i.e., GL39-1, GL39-2 and GL39-3, GL40-1, GL40-2 and GL40-3 and GL42-1, GL42-2 and GL42-3) and at one upgradient location (i.e., GL41-1, GL41-2 and GL41-3) were included in the 2020 monitoring program and, based on findings, were sampled accordingly.
› Monitoring wells GL2-1, GL2-2, GL4-1, GL4-2, and GL20-1 were sampled in July, August and/or October 2020 as recommended in 2019 Glenmore Landfill Annual Water Quality Report, dated March 10, 2020.
› Samples were collected from Slough #2 location to further characterize baseline surface water quality for the Site.
Volatile Organic Acids (e.g., Resin and Fatty Acids) were added to leachate parameters in 2019 as recommended in Leachate Recirculation Operational Procedure Manual, prepared by CH2M Hill Canada, dated October 2017. These compounds are required to determine leachate system efficiency (i.e., buffering capacity); however, are not regulated by applicable water quality standards/guidelines. A summary of the 2020 sampling program is provided in the tables, below. Sampling locations are identified in Drawing 662036-002. Field sampling methodologies can be found in Appendix III.
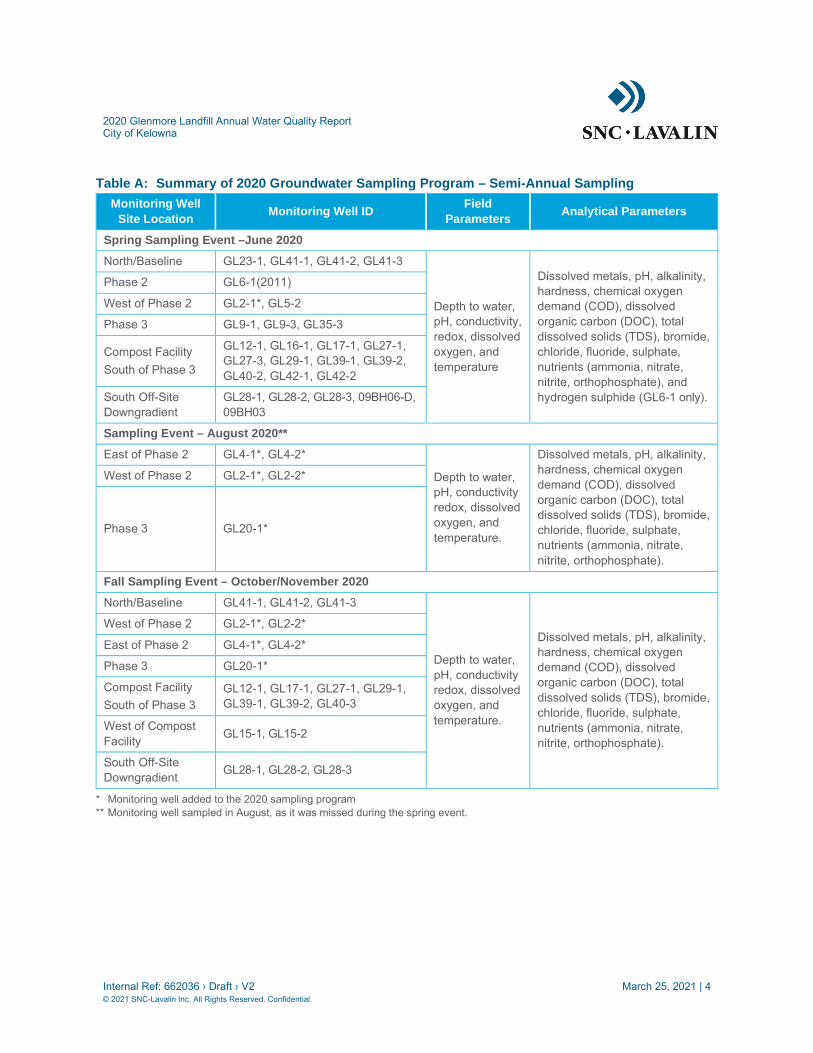
2020 Glenmore Landfill Annual Water Quality Report City of Kelowna
Internal Ref: 662036 › Draft › V2 March 25, 2021 | 4 © 2021 SNC-Lavalin Inc. All Rights Reserved. Confidential.
Table A: Summary of 2020 Groundwater Sampling Program – Semi-Annual Sampling
Monitoring Well
Site Location Monitoring Well ID Field
Parameters Analytical Parameters
Spring Sampling Event –June 2020
North/Baseline GL23-1, GL41-1, GL41-2, GL41-3
Depth to water, pH, conductivity, redox, dissolved oxygen, and temperature
Dissolved metals, pH, alkalinity, hardness, chemical oxygen demand (COD), dissolved organic carbon (DOC), total dissolved solids (TDS), bromide, chloride, fluoride, sulphate, nutrients (ammonia, nitrate, nitrite, orthophosphate), and hydrogen sulphide (GL6-1 only).
Phase 2 GL6-1(2011)
West of Phase 2 GL2-1*, GL5-2
Phase 3 GL9-1, GL9-3, GL35-3
Compost Facility South of Phase 3
GL12-1, GL16-1, GL17-1, GL27-1, GL27-3, GL29-1, GL39-1, GL39-2, GL40-2, GL42-1, GL42-2
South Off-Site Downgradient
GL28-1, GL28-2, GL28-3, 09BH06-D, 09BH03
Sampling Event – August 2020**
East of Phase 2 GL4-1*, GL4-2*
Depth to water, pH, conductivity redox, dissolved oxygen, and temperature.
Dissolved metals, pH, alkalinity, hardness, chemical oxygen demand (COD), dissolved organic carbon (DOC), total dissolved solids (TDS), bromide, chloride, fluoride, sulphate, nutrients (ammonia, nitrate, nitrite, orthophosphate).
West of Phase 2 GL2-1*, GL2-2*
Phase 3 GL20-1*
Fall Sampling Event – October/November 2020
North/Baseline GL41-1, GL41-2, GL41-3
Depth to water, pH, conductivity redox, dissolved oxygen, and temperature.
Dissolved metals, pH, alkalinity, hardness, chemical oxygen demand (COD), dissolved organic carbon (DOC), total dissolved solids (TDS), bromide, chloride, fluoride, sulphate, nutrients (ammonia, nitrate, nitrite, orthophosphate).
West of Phase 2 GL2-1*, GL2-2*
East of Phase 2 GL4-1*, GL4-2*
Phase 3 GL20-1*
Compost Facility South of Phase 3
GL12-1, GL17-1, GL27-1, GL29-1, GL39-1, GL39-2, GL40-3
West of Compost Facility GL15-1, GL15-2
South Off-Site Downgradient GL28-1, GL28-2, GL28-3
* Monitoring well added to the 2020 sampling program ** Monitoring well sampled in August, as it was missed during the spring event.

2020 Glenmore Landfill Annual Water Quality Report City of Kelowna
Internal Ref: 662036 › Draft › V2 March 25, 2021 | 5 © 2021 SNC-Lavalin Inc. All Rights Reserved. Confidential.
Table B: Summary of 2020 Surface Water Sampling Program – Quarterly Sampling
Surface Water
(Pond) Location Sample ID Analytical Parameters
April, June, September, and October 2020
East of Phases 1 & 2 Northeast Pond
Total metals, pH, conductivity, alkalinity, hardness, COD, TOC, TDS, TSS, bromide, chloride, fluoride, sulphate, sulfide, nutrients (ammonia, nitrate nitrite, orthophosphate, TKN, total phosphorous), fecal and total coliforms.
Centre of Site Tutt Pond and Slough
West of Phases 1 & 2 Bredin Pond
April, June, September and October 2020
Background
Bubna Slough
Slough #2
Little Robert Lake*
Robert Lake
* Not sampled in April
Table C: Summary of 2020 Leachate Sampling Program – Quarterly Sampling
Leachate Sample
Location Sample ID Analytical Parameters
March, June, September, and November 2020
West side of Phase 1 N Pumphouse MH Dissolved metals, pH, alkalinity, hardness, BOD,
COD, DOC, TDS, bromide, chloride, fluoride, sulphate, hydrogen sulfide, nutrients (ammonia, nitrate nitrite, orthophosphate, phosphorous), light extractable petroleum hydrocarbon (LEPH)/heavy extractable petroleum hydrocarbon (HEPH), polycyclic aromatic hydrocarbons (PAH), volatile organic compounds (VOC), volatile petroleum hydrocarbons (VPH), Volatile Organic Acids
P1 Leachate MH-2*
Southwest corner of Phase 2 S Leachate Wet Well
* Location established in September and subsequently sampled in September and November.
3.1 2020 Additional Site Works The City of Kelowna completed the following additional site work in 2020:
› Monitoring wells GL0-1, GL0-2, and GL0-3 were decommissioned in April 2020 as they were located within the Area 2 expansion area. The decommissioned monitoring wells are shown on the attached drawings, and are documented in letter report prepared by WSP, dated April 9, 2020, that can be found in Appendix IV; and
› New P1 Leachate sample location (P1 Leachate MH-2) established on leachate cleanout near Area 1.

2020 Glenmore Landfill Annual Water Quality Report City of Kelowna
Internal Ref: 662036 › Draft › V2 March 25, 2021 | 6 © 2021 SNC-Lavalin Inc. All Rights Reserved. Confidential.
4 Groundwater and Surface Water Assessment Criteria
Water quality data collected in 2020 was reviewed by SNC-Lavalin and compared to the following applicable standards and guidelines:
› Contaminated Sites Regulation1 (CSR) aquatic life (AW) standards were used in the comparison of all groundwater quality results.
› British Columbia Approved Water Quality Guidelines2 (BCWQG) for irrigation (IW) and the CSR IW standards were used in comparison to all groundwater quality results and surface water quality results collected. Site surface water run-off is managed in three constructed ponds, Northeast pond, Bredin pond, and Tutt pond. Surface water from the Northeast pond flows to Bredin pond, which flows into Tutt pond. An overflow pipe links Tutt pond to the Slough. The water level in Tutt pond is managed such that flow is directed towards the Slough. Surface water from Tutt pond is also periodically used to irrigate the agricultural lands southwest of the Site. For comparison, surface water samples collected from Little Robert Lake, Robert Lake and Bubna Slough (discharge) were also included.
› Guidelines for Canadian Drinking Water Quality 3 (GCDWQ), CSR drinking water (DW) standards, and BCWQG for AW and DW guidelines were used in the comparison of groundwater quality results collected from baseline/potential background monitoring wells GL0-1, GL0-2, GL0-3, GL2-1, GL9-1, GL15-1, GL15-2, GL41-1, GL41-2, and GL39, GL40, and GL42 well series located along the southern boundary, and off-Site monitoring wells GL28 well series, 09BH03, and 09BH06-D located south of the Site (i.e., being the most downgradient wells from the Site).
Leachate at the Site is treated with Bioxide® at the north sewer lift station to address potentially elevated hydrogen sulfide levels. The sewage/leachate mixture is also aerated, and odours are treated by a Biorem Multi-Stage Biofilter. The treated sewage/leachate is discharged into the municipal sanitary sewer system on Glenmore Road and is ultimately treated at the City’s Wastewater Treatment Facility. Therefore, analytical results for treated leachate samples were not compared to the applicable groundwater standards, and/or surface water guidelines.
1 Contaminated Sites Regulation (CSR), B.C. Reg. 375/96, includes amendments up to B.C. Reg. 131/2020, February 1, 2021. 2 British Columbia Approved Water Quality Guidelines, includes Working Water Quality Guidelines for BC (BCWQG).
British Columbia Ministry of Environment & Climate Change Strategy, updated July 2020. 3 Guidelines for Canadian Drinking Water Quality (GCDWQ), Health Canada, September 2020.

2020 Glenmore Landfill Annual Water Quality Report City of Kelowna
Internal Ref: 662036 › Draft › V2 March 25, 2021 | 7 © 2021 SNC-Lavalin Inc. All Rights Reserved. Confidential.
5 2020 Annual Water Quality Program Results
The following sections present the findings and analytical results of the monitoring and sampling program carried out by CoK at the Site in 2020.
5.1 Fieldwork Methodology All monitoring and sampling activities were completed in accordance with ENV regulatory requirements and technical guidance/protocols, industry standard practices and are summarized in Appendix III. In addition, quality assurance/quality control (QA/QC) measures were implemented to ensure that the data quality objectives (DQO) were achieved and summarized in Section 5.7.
5.2 Field Observation During the 2020 sampling events, hydrogen sulphide gas-like odours were noted at GL29-1 and GL40-3 in November. An organic musty odour was notes at several wells located within the Site (i.e., GL6-1 (2011), GL12-1, GL16-1, GL27-1, GL27-3, GL29-1, GL35-3, GL40-2, GL40-3, and GL41-3). Several wells were found dry (GL40-1, GL42-3), with low volume and poor recovery (GL39-3), or damaged (09BH07), and therefore were not sampled.
Groundwater samples collected from well GL40-2 are not considered representative based on the following:
› Well GL40-2 (screened in bedrock) had same initial depth to water as GL40-3 (screened in overlying till) with similar drawdown after purging GL40-2 only.
› Had good recharge in well GL40-3 versus slow to no recovery in well GL40-2, suggesting water bearing zone is within the till with limited to no water in the bedrock.
As such, water in well GL40-2 is expected to come primarily by drainage (like a sump) from the till due to a compromised bentonite seal.
Hydrogen sulphide gas-like odour was noted during each 2020 sampling event at the leachate sample locations, and is consistent with the previous observations (2017 to 2019):
› N Pumphouse Manhole on March 5, June 3, September 30, November 16.
› S Leachate Wet Well on March 5, June 3, September 29, November 16.
› P1 Leachate Manhole 2 on September 29, November 16.
5.3 Groundwater and Surface Water Levels The results of groundwater and surface water elevation monitoring, along with historical data, are summarized in Tables 2a and 2b, respectively.
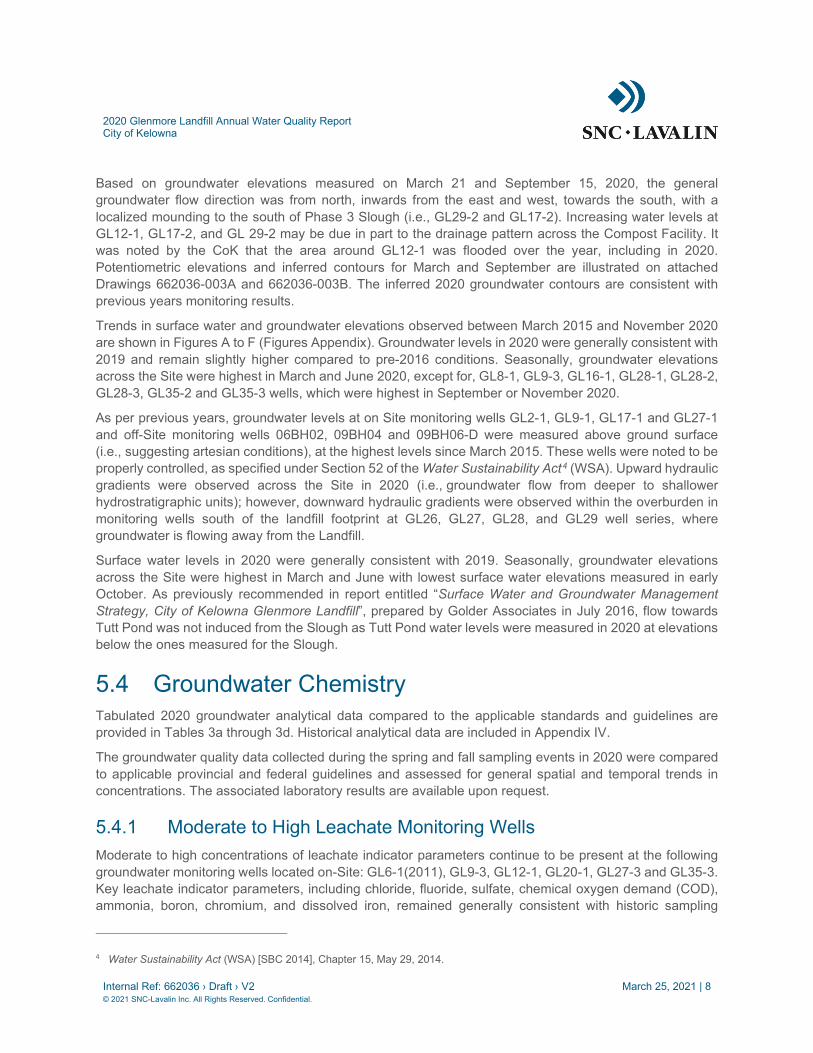
2020 Glenmore Landfill Annual Water Quality Report City of Kelowna
Internal Ref: 662036 › Draft › V2 March 25, 2021 | 8 © 2021 SNC-Lavalin Inc. All Rights Reserved. Confidential.
Based on groundwater elevations measured on March 21 and September 15, 2020, the general groundwater flow direction was from north, inwards from the east and west, towards the south, with a localized mounding to the south of Phase 3 Slough (i.e., GL29-2 and GL17-2). Increasing water levels at GL12-1, GL17-2, and GL 29-2 may be due in part to the drainage pattern across the Compost Facility. It was noted by the CoK that the area around GL12-1 was flooded over the year, including in 2020. Potentiometric elevations and inferred contours for March and September are illustrated on attached Drawings 662036-003A and 662036-003B. The inferred 2020 groundwater contours are consistent with previous years monitoring results.
Trends in surface water and groundwater elevations observed between March 2015 and November 2020 are shown in Figures A to F (Figures Appendix). Groundwater levels in 2020 were generally consistent with 2019 and remain slightly higher compared to pre-2016 conditions. Seasonally, groundwater elevations across the Site were highest in March and June 2020, except for, GL8-1, GL9-3, GL16-1, GL28-1, GL28-2, GL28-3, GL35-2 and GL35-3 wells, which were highest in September or November 2020.
As per previous years, groundwater levels at on Site monitoring wells GL2-1, GL9-1, GL17-1 and GL27-1 and off-Site monitoring wells 06BH02, 09BH04 and 09BH06-D were measured above ground surface (i.e., suggesting artesian conditions), at the highest levels since March 2015. These wells were noted to be properly controlled, as specified under Section 52 of the Water Sustainability Act4 (WSA). Upward hydraulic gradients were observed across the Site in 2020 (i.e., groundwater flow from deeper to shallower hydrostratigraphic units); however, downward hydraulic gradients were observed within the overburden in monitoring wells south of the landfill footprint at GL26, GL27, GL28, and GL29 well series, where groundwater is flowing away from the Landfill.
Surface water levels in 2020 were generally consistent with 2019. Seasonally, groundwater elevations across the Site were highest in March and June with lowest surface water elevations measured in early October. As previously recommended in report entitled “Surface Water and Groundwater Management Strategy, City of Kelowna Glenmore Landfill”, prepared by Golder Associates in July 2016, flow towards Tutt Pond was not induced from the Slough as Tutt Pond water levels were measured in 2020 at elevations below the ones measured for the Slough.
5.4 Groundwater Chemistry Tabulated 2020 groundwater analytical data compared to the applicable standards and guidelines are provided in Tables 3a through 3d. Historical analytical data are included in Appendix IV.
The groundwater quality data collected during the spring and fall sampling events in 2020 were compared to applicable provincial and federal guidelines and assessed for general spatial and temporal trends in concentrations. The associated laboratory results are available upon request.
5.4.1 Moderate to High Leachate Monitoring Wells Moderate to high concentrations of leachate indicator parameters continue to be present at the following groundwater monitoring wells located on-Site: GL6-1(2011), GL9-3, GL12-1, GL20-1, GL27-3 and GL35-3. Key leachate indicator parameters, including chloride, fluoride, sulfate, chemical oxygen demand (COD), ammonia, boron, chromium, and dissolved iron, remained generally consistent with historic sampling
4 Water Sustainability Act (WSA) [SBC 2014], Chapter 15, May 29, 2014.

2020 Glenmore Landfill Annual Water Quality Report City of Kelowna
Internal Ref: 662036 › Draft › V2 March 25, 2021 | 9 © 2021 SNC-Lavalin Inc. All Rights Reserved. Confidential.
results. Hydrogen sulfide concentrations at GL6-1(2011), most impacted well on-Site, had increased over 10 times from 2018 and 2019 concentrations. Elevated concentrations of chloride and sulfate in groundwater at GL15-2 (located west of Phase 2) may be due to agricultural practices and irrigation of the surrounding agricultural fields, as this well is located upgradient from the Site based on the 2020 inferred contours (Drawings 662036-003A and 662036-003B).
Water quality results, specifically concentrations of chloride and sulfate, at GL9-3, GL27-3 and GL12-1 (located along the southern perimeter and/or south of the Phase 3 Slough) were within the range of historical concentrations; however, ammonia (GL12-1) and dissolved iron (GL12-1 and GL27-3) concentrations have increased in 2020, which suggest a potential leachate migration to the south.
Key leachate parameter indicators for 2018, 2019, and 2020 analytical results of groundwater and leachate sampling locations within the Site along the downgradient side of Phase 3 Slough are presented in Table D below, and are shown in Figures G and H (Figures Appendix).

2020 Glenmore Landfill Annual Water Quality Report City of Kelowna
Internal Ref: 662036 › Draft › V2 March 25, 2021 | 10 © 2021 SNC-Lavalin Inc. All Rights Reserved. Confidential.
Table D: Summary of 2018 to 2020 Analytical Results for Leachate Parameter Indicators
Site
Location Sample Date
(yyyy mm dd)
Ammonia,
Total (as N)
µg/L
Chloride
mg/L
Fluoride
µg/L
Sulfate
mg/L
COD
mg/L
Boron
µg/L
Chromium
µg/L
Dissolved
Iron
µg/L
S Leachate Wet Well
2018-03-15 71,600 815 < 2,500 2,080 784 2,790 37 89
2018-05-24 54,500 523 < 1,000 1,440 711 1,610 21 59
2018-08-16 56,200 871 < 1,000 2,240 826 2,090 40 69
2018-11-08 48,800 980 < 1,000 2,990 988 1,860 44 56
2019-03-15 17,800 698 < 1,000 1,950 646 1,390 18 46
2019-06-03 28,600 587 < 1,000 1,570 617 1,470 18 64
2019-09-03 25,900 949 < 10,000 2,500 935 2,140 54 70
2019-10-31 59,500 908 < 1,000 2,370 865 1,740 53 87
2020 03 05 25,000 487 490 1,200 512 1,160 13.2 32.4
2020 06 03 28,600 540 < 1,000 1,350 585 < 2.0 14.3 38.2
2020 09 29 103,000 673 < 1,000 1,260 890 2,070 33.9 40.9
2020 11 16 66,400 834 < 1,000 1,900 859 2,340 41.7 < 200
GL6-1 (2011)
2018 06 04 334,000 1,570 < 50,000 12,000 881 2,660 15 3,150
2019 06 03 227,000 527 < 10,000 2,380 705 2,660 17 507
2019 06 03 236,000 559 < 10,000 2,350 705 2,710 17 467
2020 06 11 194,000 652 < 1,000 282 621 2,180 18.1 191
GL35-3
2018 08 15 1,720 341 1,720 3,320 < 20 87 1 24,800
2019 05 30 1,220 351 1,730 3,510 26 77 1 23,200
2020 06 08 1,490 325 1,410 3,410 < 20 55.4 1.73 16,700
GL20-1 2020 08 26 140,000 506 < 1,000 86.3 422 24.3 5.18 897
2020 10 20 116,000 493 < 1,000 32.6 429 1,760 25.0 8,910

2020 Glenmore Landfill Annual Water Quality Report City of Kelowna
Internal Ref: 662036 › Draft › V2 March 25, 2021 | 11 © 2021 SNC-Lavalin Inc. All Rights Reserved. Confidential.
Table D (Cont’d): Summary of 2018 to 2020 Analytical Results for Leachate Parameter Indicators
Site
Location Sample Date
(yyyy mm dd)
Ammonia,
Total (as N)
µg/L
Chloride
mg/L
Fluoride
µg/L
Sulfate
mg/L
COD
mg/L
Boron
µg/L
Chromium
µg/L
Dissolved
Iron
µg/L
GL9-3
2018 05 28 69 238 4,350 199 86 9 < 0.50 12
2019 05 27 73 1,540 < 10,000 31,700 83 9 1 16
2020 06 08 < 50 1,400 < 50,000a 34,500 79 11.2 1.31 19.3
GL27-3
2018 08 15 589 516 970 10,200 < 20 43 < 0.50 2,260
2019 05 27 57 475 < 10,000 9,330 < 20 35 1 < 10
2020 06 08 806 442 < 50,000a 10,400 21 33.7 0.58 4,610
GL12-1
2018 06 04 1,430 1,050 1,220 9,180 542 201 3 8,590
2018 09 19 1,840 495 1,840 3,660 513 167 3 19,600
2019 05 27 1,750 480 1,560 3,800 485 137 3 12,500
2019 09 19 1,270 496 1,190 3,620 458 117 3 20,500
2020 06 10 4,260 610 1,200 3,880 544 214 < 10.0a 19,700
2020 11 02 7,300 603 1,400 3,820 566 94.2 1.99 24,400
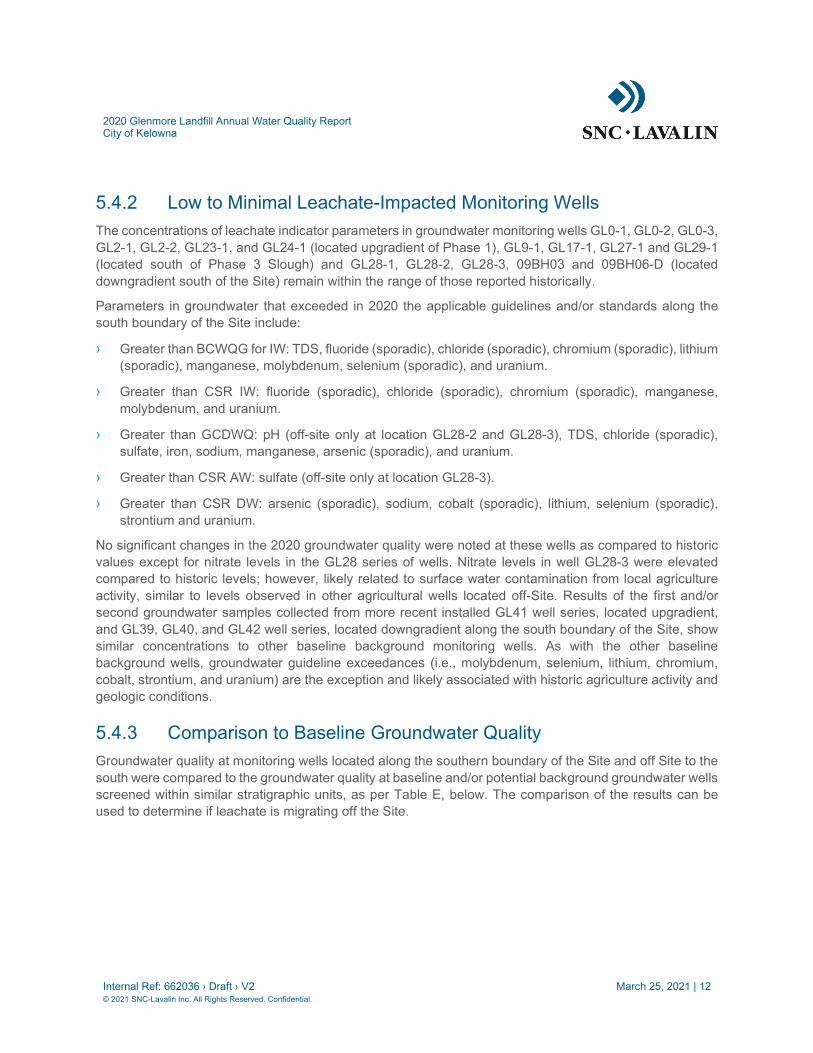
2020 Glenmore Landfill Annual Water Quality Report City of Kelowna
Internal Ref: 662036 › Draft › V2 March 25, 2021 | 12 © 2021 SNC-Lavalin Inc. All Rights Reserved. Confidential.
5.4.2 Low to Minimal Leachate-Impacted Monitoring Wells The concentrations of leachate indicator parameters in groundwater monitoring wells GL0-1, GL0-2, GL0-3, GL2-1, GL2-2, GL23-1, and GL24-1 (located upgradient of Phase 1), GL9-1, GL17-1, GL27-1 and GL29-1 (located south of Phase 3 Slough) and GL28-1, GL28-2, GL28-3, 09BH03 and 09BH06-D (located downgradient south of the Site) remain within the range of those reported historically.
Parameters in groundwater that exceeded in 2020 the applicable guidelines and/or standards along the south boundary of the Site include:
› Greater than BCWQG for IW: TDS, fluoride (sporadic), chloride (sporadic), chromium (sporadic), lithium (sporadic), manganese, molybdenum, selenium (sporadic), and uranium.
› Greater than CSR IW: fluoride (sporadic), chloride (sporadic), chromium (sporadic), manganese, molybdenum, and uranium.
› Greater than GCDWQ: pH (off-site only at location GL28-2 and GL28-3), TDS, chloride (sporadic), sulfate, iron, sodium, manganese, arsenic (sporadic), and uranium.
› Greater than CSR AW: sulfate (off-site only at location GL28-3).
› Greater than CSR DW: arsenic (sporadic), sodium, cobalt (sporadic), lithium, selenium (sporadic), strontium and uranium.
No significant changes in the 2020 groundwater quality were noted at these wells as compared to historic values except for nitrate levels in the GL28 series of wells. Nitrate levels in well GL28-3 were elevated compared to historic levels; however, likely related to surface water contamination from local agriculture activity, similar to levels observed in other agricultural wells located off-Site. Results of the first and/or second groundwater samples collected from more recent installed GL41 well series, located upgradient, and GL39, GL40, and GL42 well series, located downgradient along the south boundary of the Site, show similar concentrations to other baseline background monitoring wells. As with the other baseline background wells, groundwater guideline exceedances (i.e., molybdenum, selenium, lithium, chromium, cobalt, strontium, and uranium) are the exception and likely associated with historic agriculture activity and geologic conditions.
5.4.3 Comparison to Baseline Groundwater Quality Groundwater quality at monitoring wells located along the southern boundary of the Site and off Site to the south were compared to the groundwater quality at baseline and/or potential background groundwater wells screened within similar stratigraphic units, as per Table E, below. The comparison of the results can be used to determine if leachate is migrating off the Site.

2020 Glenmore Landfill Annual Water Quality Report City of Kelowna
Internal Ref: 662036 › Draft › V2 March 25, 2021 | 13 © 2021 SNC-Lavalin Inc. All Rights Reserved. Confidential.
Table E: Baseline Monitoring Wells
Baseline Well Stratigraphic Unit Downgradient Monitoring Well
Upgradient: GL0-3, GL2-1 (artesian), & GL41-3; and far downgradient: 09BH06-D (artesian), and 09BH03
Sand and Gravel On-Site along the southern boundary: GL39-1, GL39-2, GL40-1*, and GL42-3*; and Off-Site to the south: GL28-3
Upgradient: GL0-2, GL0-1, GL15-2, and GL41-2 Till
On-Site along the southern boundary: GL40-3, GL42-1, GL42-2; and Off-Site to the south: GL28-1 and GL28-2
Upgradient: GL15-1, and GL 41-1 Volcanic Bedrock On-Site along the southern boundary: GL40-2**
(*) Denotes 2019 installed well, not sampled yet as were either dry, had insufficient saturated thickness, poor recharge and development. (**) Well installation is compromised (samples not considered representative)
As per Section 5.4.1, monitoring wells with moderate to high concentrations of leachate indicator parameters identified within the Site exhibit significantly higher concentrations of leachate indicator parameters, consistent to historical results.
5.5 Surface Water Chemistry Tabulated 2020 surface water analytical data compared to the applicable standards and guidelines are provided in Tables 4a and 4b. Historical analytical data are included in Appendix IV.
In general, the surface water parameter concentrations collected at Bredin Pond, Tutt Pond, Northeast Pond and the Slough were consistent with those previously reported except for lower ammonia concentrations at Bredin Pond. The consistently high parameter concentrations in the Slough are inferred to be due to contact with historical waste/leachate in the Slough and to evaporation processes; with slightly lower parameter earlier in the year, due to flooding (i.e., dilution of parameter concentrations).
Parameters that exceeded the applicable BCWQG for AW and/or IW within the on-Site ponds in 2020 include conductivity, pH (except Tutt Pond and Bredin Pond), total suspended solids, total ammonia as N (except Bredin Pond), chloride, fluoride (Northeast Pond only), sulphate (except Tutt Pond), arsenic (Northeast Pond and Slough), beryllium (Northeast Pond only), chromium (Slough and Bredin Pond), iron (Slough only), manganese (Northeast Pond and Tutt Pond), molybdenum and uranium.
Surface water data collected from Bubna Slough and Slough #2 (upstream), and Little Robert Lake and Robert Lake (downstream), representing local baseline conditions, was used to compare to on-site surface water quality. The results of the comparison shown in Tables 4a and 4b suggest that, except for elevated concentrations at the Slough (i.e., historical alkaline lake known as Alki Lake), most of the exceedances of BCWQG for AW and/or IW are associated with local background surface water quality conditions.
5.6 Leachate Chemistry Leachate quality in samples collected from three different locations of the leachate collection system including the N Pumphouse MH, S Leachate Wet Well, and the P1 Leachate MH-2 (September and November sampling events only) are presented in Table 5. Historical analytical data are included in Appendix IV.

2020 Glenmore Landfill Annual Water Quality Report City of Kelowna
Internal Ref: 662036 › Draft › V2 March 25, 2021 | 14 © 2021 SNC-Lavalin Inc. All Rights Reserved. Confidential.
The 2020 leachate quality results are consistent with historic results. P1 Leachate MH-2 is a different location than last year, with leachate quality results higher than previous determined at P1 Leachate MH; however, the new P1 Leachate MH-2 location is mostly representative of water above the liner with a small portion from below the liner, which is influencing the results, whereas, the previous P1 Leachate MH location was representative of water in the historical MSW beneath the liner. Leachate indicator parameters are variable between sample locations and seasonal sampling events. As presented in Table D, Section 5.4.1, and shown in Figures G and H (Figures Appendix), ammonia concentrations were significantly higher in leachate, except for samples collected in June from GL6-1(2011). Chloride, chemical oxygen demand, boron, and chromium concentrations were generally higher than the moderate to high leachate-impacted wells in the areas of Phase 2 / Phase 3.
All leachate samples (i.e., except new P1 Leachate MH-2 location), had hydrocarbon and VOC parameter concentrations consistent with historic results.
Volatile Organic Acids (e.g., Resin and Fatty Acids) were added to leachate parameters in 2019 to determine leachate system efficiency (i.e., buffering capacity); however, are not regulated by applicable water quality standards/guidelines.
5.7 Quality Assurance/Quality Control (QA/QC) Program CoK implements strict QA/QC measures for all sampling and analysis to ensure that all data is representative. The QA/QC program included the following.
› Use of in-house trained personnel;
› Implementation of accordance with ENV regulatory requirements and technical guidance/protocols, industry standard practices;
› Written field instructions; and
› Documentation of all field activities.
Samples were collected in a manner appropriate for the prevention of cross-contamination and other field sampling errors. Samples were collected using an appropriate contaminant-free sampling equipment and dedicated tubing and placed in contaminant-free containers specifically designed for such use and appropriate to the subsequent analyses.
› Chain-of-Custody documentation for sample submission:
− Use of an appropriate coding system for submitting samples to the analytical laboratory to ensure that information concerning location or expected concentration is unavailable to the analyst(s). A chain-of-custody form will be established to trace the movement and handling of samples from the field to their final destination.
− Use of a Canadian Association for Laboratory Accreditation Inc. (CALA) accredited laboratory (i.e., Caro Analytical Services.
− Adherence to laboratory sampling and analysis protocols (e.g., hold times, sample containers, preservatives, detection limits, approved methodology).
− Procedures to confirmation accurate transcription of laboratory data into tables.
− Review of laboratory QC performance (standards, spike recoveries etc.) to confirm results are within acceptable limits.

2020 Glenmore Landfill Annual Water Quality Report City of Kelowna
Internal Ref: 662036 › Draft › V2 March 25, 2021 | 15 © 2021 SNC-Lavalin Inc. All Rights Reserved. Confidential.
Results of the laboratory’s internal checks are included in the analytical reports. Implementation of corrective action plans when acceptable limits are exceeded.
QA/QC procedures included analyzing blind field duplicate samples. Analytical results for the original samples and corresponding blind duplicate samples were compared using the calculated variability of the results, as expressed by the Relative Percent Difference (RPDDUP), which is defined as the absolute value of the difference between the results for the original and duplicate samples, divided by the average of the results. Because of the poor precision near the laboratory detection limit, RPDDUP values are only calculated for sample sets in which the analytical results of the original or the duplicate sample is greater than five times the Practical Quantitation Limit (PQL).
The RPDDUP trigger criteria for all parameters in groundwater and surface water duplicates is 50% as specified in the BC Field Sampling Manual.
Groundwater QA/QC Results
A total of 39 wells were sampled between March and November 2020 with eight field duplicate samples for a total of 13.1% field duplicate analysis. Field duplicate sample analyses are presented in Tables 3a to 3d.
All the RPDDUP values calculated between the groundwater duplicate pairs collected in 2020 met the Data Quality Objectives (DQO), except for boron concentrations from samples collected in June 10 from GL28-1. As both samples had very low concentrations and met the applicable standards/guidelines, the analytical results for all samples, including GL28-1 were considered reliable.
Surface Water QA/QC Results
A total of 27 surface water samples were collected and analyzed between April and October 2020 with three field duplicate samples for a total of 11.1% field duplicate analysis. Field duplicate sample analyses are presented in Table 4a and 4b.
All the RPDDUP values calculated between the surface water duplicate pairs collected in 2020 met the Data Quality Objectives (DQO), except for boron and lithium concentrations from samples collected in June 5 from Bredin Pond. As both samples had very low concentrations and met the applicable standards/guidelines, the analytical results for all samples, including Bredin Pond were considered reliable.
Leachate QA/QC Results
A total of 10 leachate samples were collected and analyzed between March and November 2020 with two field duplicate samples for a total of 20% field duplicate analysis. Field duplicate sample analyses are presented in Table 5.
QA/QC Laboratory Results
Based on review of the laboratory analytical reports, standard internal QA/QC procedures indicated acceptable reproducibility of laboratory results.
QA/QC Summary
The QA/QC results support the overall interpretation presented in this report. The analytical results of the groundwater collected during the 2020 annual water program are acceptable, based on the QA/QC measures taken, and the acceptable results of the blind duplicate analysis as described in the above sections.
Based on the above considerations, the analytical results for groundwater samples analyzed are considered reliable and representative of subsurface conditions.
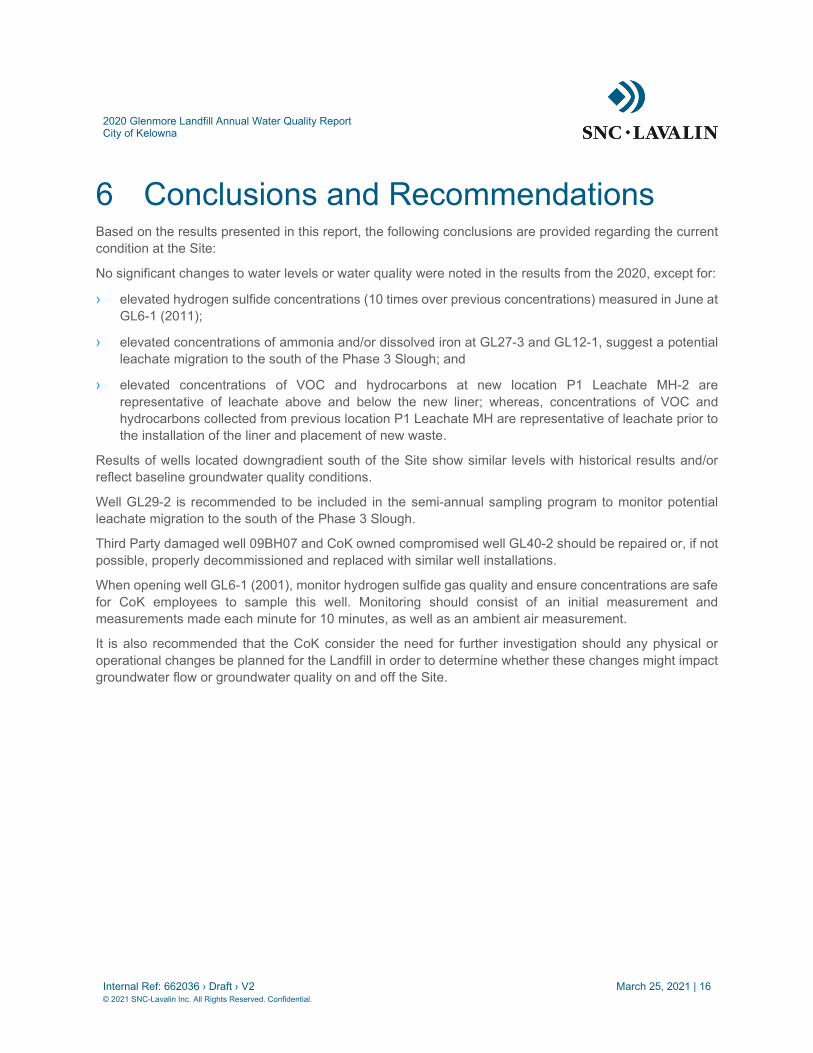
2020 Glenmore Landfill Annual Water Quality Report City of Kelowna
Internal Ref: 662036 › Draft › V2 March 25, 2021 | 16 © 2021 SNC-Lavalin Inc. All Rights Reserved. Confidential.
6 Conclusions and Recommendations Based on the results presented in this report, the following conclusions are provided regarding the current condition at the Site:
No significant changes to water levels or water quality were noted in the results from the 2020, except for:
› elevated hydrogen sulfide concentrations (10 times over previous concentrations) measured in June at GL6-1 (2011);
› elevated concentrations of ammonia and/or dissolved iron at GL27-3 and GL12-1, suggest a potential leachate migration to the south of the Phase 3 Slough; and
› elevated concentrations of VOC and hydrocarbons at new location P1 Leachate MH-2 are representative of leachate above and below the new liner; whereas, concentrations of VOC and hydrocarbons collected from previous location P1 Leachate MH are representative of leachate prior to the installation of the liner and placement of new waste.
Results of wells located downgradient south of the Site show similar levels with historical results and/or reflect baseline groundwater quality conditions.
Well GL29-2 is recommended to be included in the semi-annual sampling program to monitor potential leachate migration to the south of the Phase 3 Slough.
Third Party damaged well 09BH07 and CoK owned compromised well GL40-2 should be repaired or, if not possible, properly decommissioned and replaced with similar well installations.
When opening well GL6-1 (2001), monitor hydrogen sulfide gas quality and ensure concentrations are safe for CoK employees to sample this well. Monitoring should consist of an initial measurement and measurements made each minute for 10 minutes, as well as an ambient air measurement.
It is also recommended that the CoK consider the need for further investigation should any physical or operational changes be planned for the Landfill in order to determine whether these changes might impact groundwater flow or groundwater quality on and off the Site.

2020 Glenmore Landfill Annual Water Quality Report City of Kelowna
Internal Ref: 662036 › Draft › V2 March 25, 2021 | 17 © 2021 SNC-Lavalin Inc. All Rights Reserved. Confidential.
7 Proposed 2021 Annual Water Quality Program
The following recommendations are provided for the 2021 annual water quality program.
7.1 Groundwater Elevations Groundwater levels form all accessible wells on and off the Site should continue to be recorded on a quarterly basis to observe seasonal trends.
7.2 Groundwater Quality Groundwater samples should continue to be collected semi-annually from the wells listed in Table A and the additional monitoring well GL29-2 recommended on Section 6. Sampling should continue to be conducted each spring, when groundwater levels are highest, and in the fall when groundwater levels are lowest.
All groundwater samples should continue to be measured for the following field parameters: pH, conductivity and temperature. In addition, all groundwater samples should be analyzed for the following parameters: dissolved metals, pH, alkalinity, hardness, chemical oxygen demand, dissolved organic carbon, total dissolved solids, bromide, chloride, fluoride, sulphate and nutrients; ammonia, nitrate, nitrite, orthophosphate.
Groundwater samples from GL6-1 (2011) should continue to be analyzed for hydrogen sulphide.
7.3 Surface Water Quality Surface water sampling should continue to be collected on a quarterly basis at Bredin Pond, Tutt Pond, Northeast Pond and the Slough to confirm the surface water quality at these locations and its potential impact on groundwater quality in areas where this surface water is used for irrigation purposes. To further characterize baseline surface water quality for the Site, sampling should continue to be collected on a semi-annual basis at off-site surface water locations (i.e., Little Robert Lake, Robert Lake and Bubna Slough and Slough #2). All samples should continue to be measured and/or analyzed for the parameters listed in Table D.
7.4 Leachate Quality Leachate sampling and analysis should be conducted quarterly from each leachate collection sumps, as per Table C, and add leachate collection point from Area 2 (i.e., to be named in 2021). Leachate samples and groundwater samples should be taken at the same time to compare groundwater quality.

2020 Glenmore Landfill Annual Water Quality Report City of Kelowna
Internal Ref: 662036 › Draft › V2 March 25, 2021 | 18 © 2021 SNC-Lavalin Inc. All Rights Reserved. Confidential.
7.5 Data Analysis and Reporting All water sampling and monitoring should continue to be evaluated and compared to the applicable provincial standards and federal guidelines.

2020 Glenmore Landfill Annual Water Quality Report City of Kelowna
Internal Ref: 662036 › Draft › V2 March 25, 2021 | 19 © 2021 SNC-Lavalin Inc. All Rights Reserved. Confidential.
8 Notice to Reader This report has been prepared and the work referred to in this report have been undertaken by SNC-Lavalin Inc. (SNC-Lavalin) for the exclusive use of City of Kelowna, who has been party to the development of the scope of work and understands its limitations. The methodology, findings, conclusions and recommendations in this report are based solely upon the scope of work and subject to the time and budgetary considerations described in the proposal and/or contract pursuant to which this report was issued. Any use, reliance on, or decision made by a third party based on this report is the sole responsibility of such third party. SNC-Lavalin accepts no liability or responsibility for any damages that may be suffered or incurred by any third party as a result of the use of, reliance on, or any decision made based on this report. Should this report be submitted to the BC Ministry of Environment & Climate Change Strategy (ENV) by City of Kelowna, ENV is authorized to rely on the results in the report, subject to the limitations set out herein, for the sole purpose of determining whether City of Kelowna has fulfilled its obligations with respect to meeting the regulatory requirements of ENV.
The findings, conclusions and recommendations in this report (i) have been developed in a manner consistent with the level of skill normally exercised by professionals currently practicing under similar conditions in the area, and (ii) reflect SNC-Lavalin’s best judgment based on information available at the time of preparation of this report. No other warranties, either expressed or implied, are made as to the professional services provided under the terms of our original contract and included in this report. The findings and conclusions contained in this report are valid only as of the date of this report and may be based, in part, upon information provided by others. If any of the information is inaccurate, new information is discovered, site conditions change or standards are amended, modifications to this report may be necessary. The results of this assessment should in no way be construed as a warranty that the subject site is free from any and all environmental impact.
Any soil and rock descriptions in this report and associated logs have been made with the intent of providing general information on the subsurface conditions of the site. This information should not be used as geotechnical data for any purpose unless specifically addressed in the text of this report. Groundwater conditions described in this report refer only to those observed at the location and time of observation noted in the report.
This report must be read as a whole, as sections taken out of context may be misleading. If discrepancies occur between the preliminary (draft) and final version of this report, it is the final version that takes precedence. Nothing in this report is intended to constitute or provide a legal opinion.
The contents of this report are confidential and proprietary. Other than by City of Kelowna, copying or distribution of this report or use of or reliance on the information contained herein, in whole or in part, is not permitted without the express written permission of City of Kelowna and SNC-Lavalin.

2020 Glenmore Landfill Annual Water Quality Report City of Kelowna
Internal Ref: 662036 › Draft › V2 March 25, 2021 | 20 © 2021 SNC-Lavalin Inc. All Rights Reserved. Confidential.
9 References 2019 Glenmore Landfill Annual Water Quality Report, dated March 13, 2019, Prepared for the City of
Kelowna by SNC-Lavalin (SNC-Lavalin, 2018).

Figures A. Water Elevations South End B. Water Elevations Centre South C. Water Elevations Centre A D. Water Elevations Centre B E. Water Elevations North F. Water Elevations Northeast G. 2018 to 2020 Concentrations of Ammonia, Total (as N), Chloride, Fluoride, and Sulfate for Select
Groundwater and Leachate Sample Locations H. 2018 to 2020 Concentrations of Chemical Oxygen Demand, Boron, Chromium, and Dissolved Iron for
Select Groundwater and Leachate Sample Locations
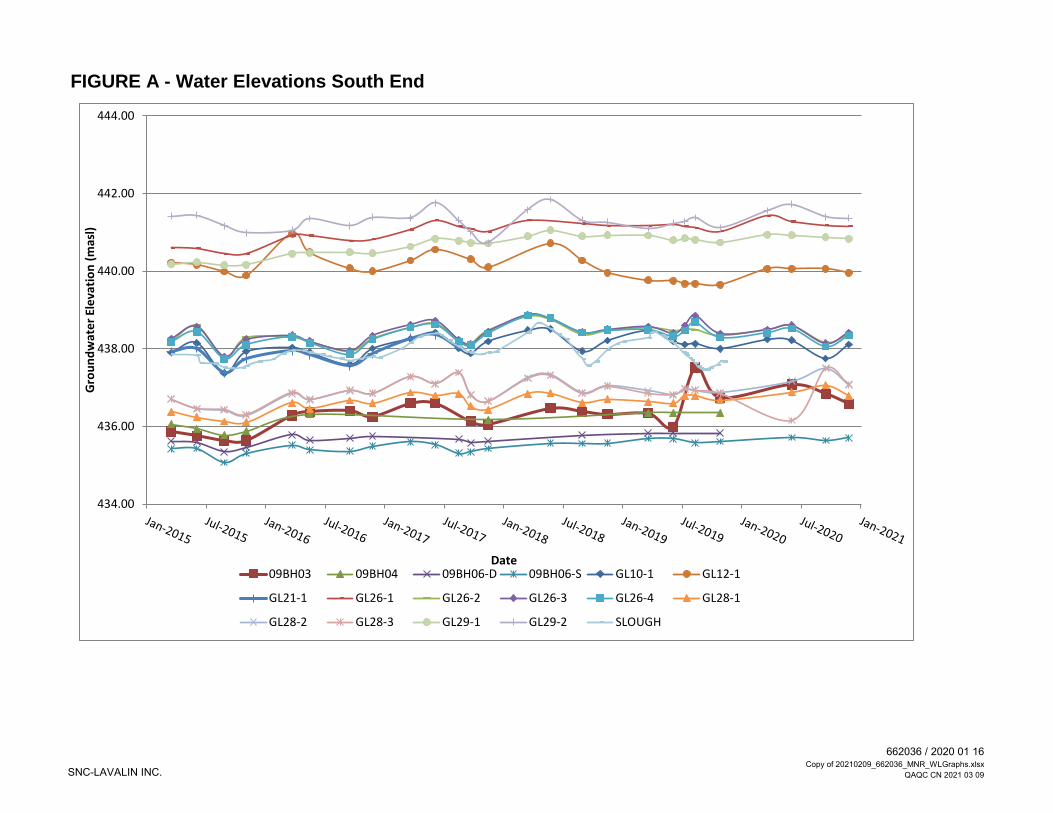
FIGURE A - Water Elevations South End
434.00
436.00
438.00
440.00
442.00
444.00
Gro
undw
ater
Ele
vatio
n (m
asl)
Date09BH03 09BH04 09BH06-D 09BH06-S GL10-1 GL12-1
GL21-1 GL26-1 GL26-2 GL26-3 GL26-4 GL28-1
GL28-2 GL28-3 GL29-1 GL29-2 SLOUGH
SNC-LAVALIN INC.
662036 / 2020 01 16Copy of 20210209_662036_MNR_WLGraphs.xlsx
QAQC CN 2021 03 09

FIGURE B - Water Elevations Centre South
436.00
438.00
440.00
442.00
444.00
446.00
448.00
450.00
452.00
Gro
undw
ater
Ele
vatio
n (m
asl)
Date
GL8-1 GL8-2 GL9-1 GL9-3 GL27-4 GL27-1 GL9-2 GL27-2
GL17-1 GL17-2 GL16-1 GL15-1 GL15-2 GL13-1 SLOUGH
SNC-LAVALIN INC.
662036 / 2020 01 16Copy of 20210209_662036_MNR_WLGraphs.xlsx
QAQC CN 2021 03 09

FIGURE C - Water Elevations Centre A
436.00
436.50
437.00
437.50
438.00
438.50
439.00
439.50
Gro
undw
ater
Ele
vatio
n (m
asl)
Date
GL30-1 GL30-2 GL30-3 GL34-1 GL34-2 GL34-3 GL36-1
GL36-2 GL36-3 GL6-1 (2011) GL7-1 SLOUGH TUTT POND
SNC-LAVALIN INC.
662036 / 2020 01 16Copy of 20210209_662036_MNR_WLGraphs.xlsx
QAQC CN 2021 03 09

FIGURE D - Water Elevations Centre B
436.00
436.50
437.00
437.50
438.00
438.50
439.00
439.50
Gro
undw
ater
Ele
vatio
n (m
asl)
Date
GL31-1 GL31-2 GL31-3 GL32-1 GL32-2 GL32-3 GL33-1
GL33-2 GL33-3 GL35-1 GL35-2 GL35-3 SLOUGH TUTT POND
SNC-LAVALIN INC.
662036 / 2020 01 16Copy of 20210209_662036_MNR_WLGraphs.xlsx
QAQC CN 2021 03 09
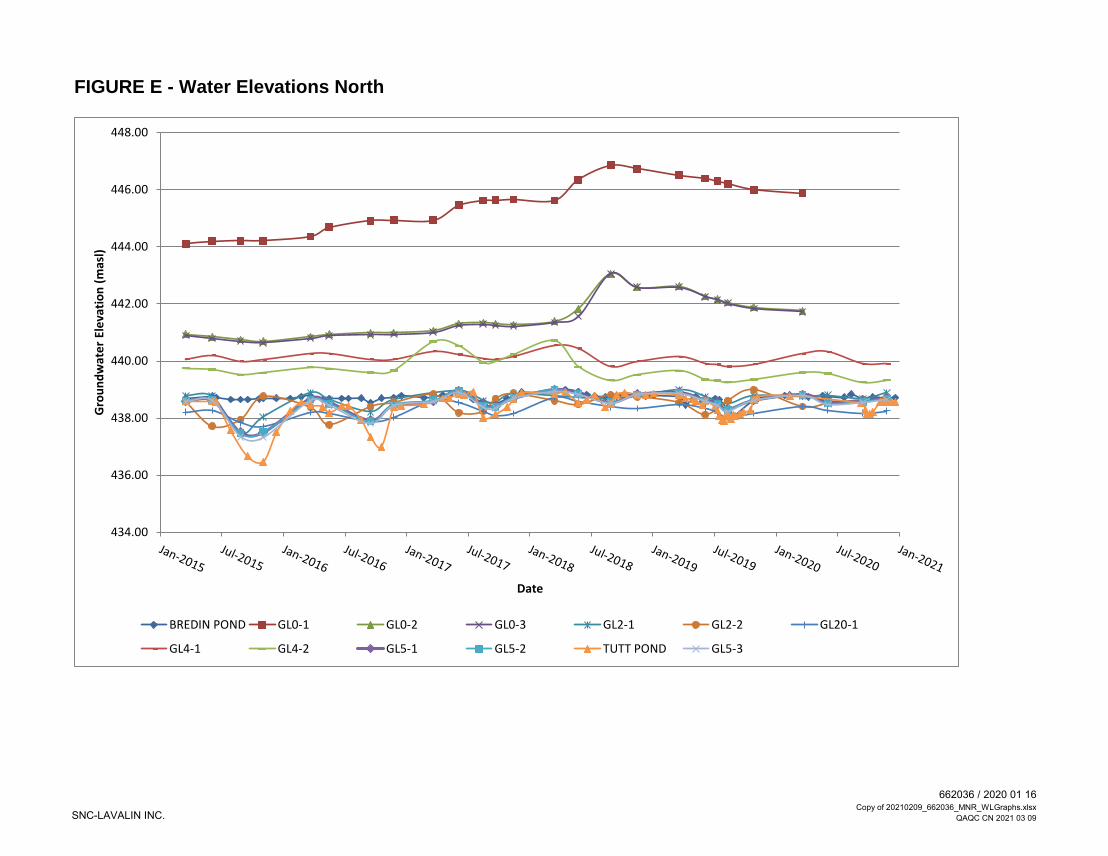
FIGURE E - Water Elevations North
434.00
436.00
438.00
440.00
442.00
444.00
446.00
448.00
Gro
undw
ater
Ele
vatio
n (m
asl)
Date
BREDIN POND GL0-1 GL0-2 GL0-3 GL2-1 GL2-2 GL20-1
GL4-1 GL4-2 GL5-1 GL5-2 TUTT POND GL5-3
SNC-LAVALIN INC.
662036 / 2020 01 16Copy of 20210209_662036_MNR_WLGraphs.xlsx
QAQC CN 2021 03 09
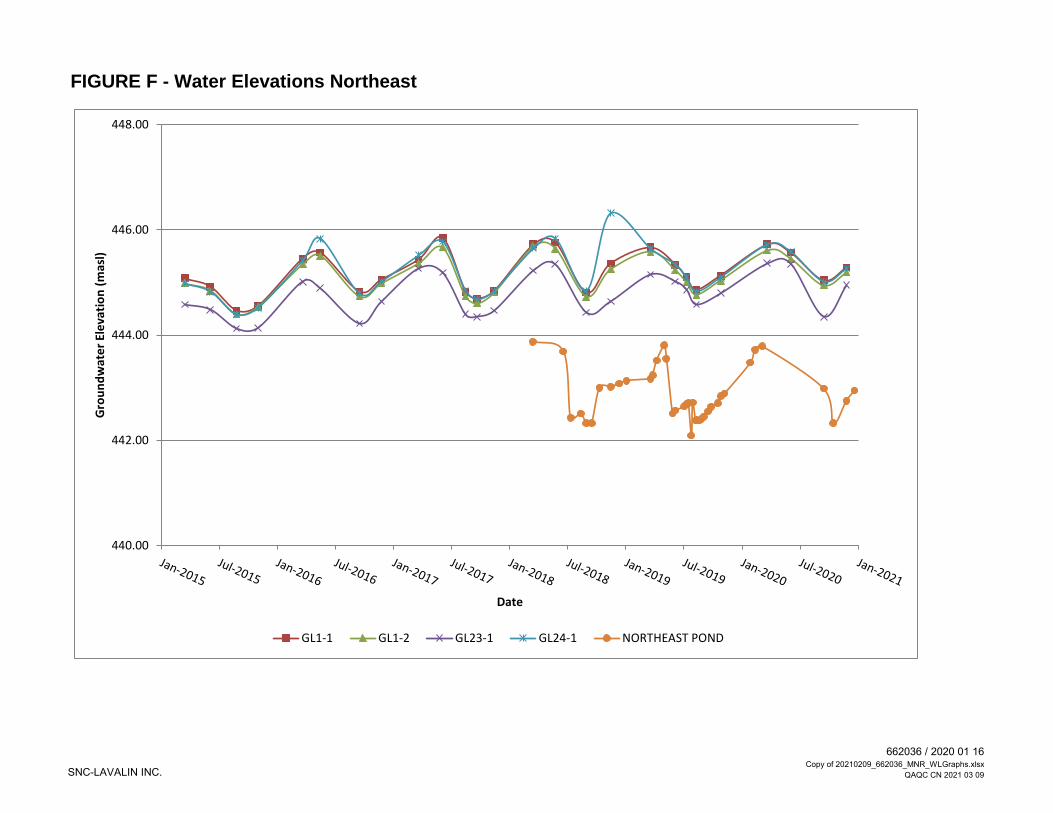
FIGURE F - Water Elevations Northeast
440.00
442.00
444.00
446.00
448.00
Gro
undw
ater
Ele
vatio
n (m
asl)
Date
GL1-1 GL1-2 GL23-1 GL24-1 NORTHEAST POND
SNC-LAVALIN INC.
662036 / 2020 01 16Copy of 20210209_662036_MNR_WLGraphs.xlsx
QAQC CN 2021 03 09
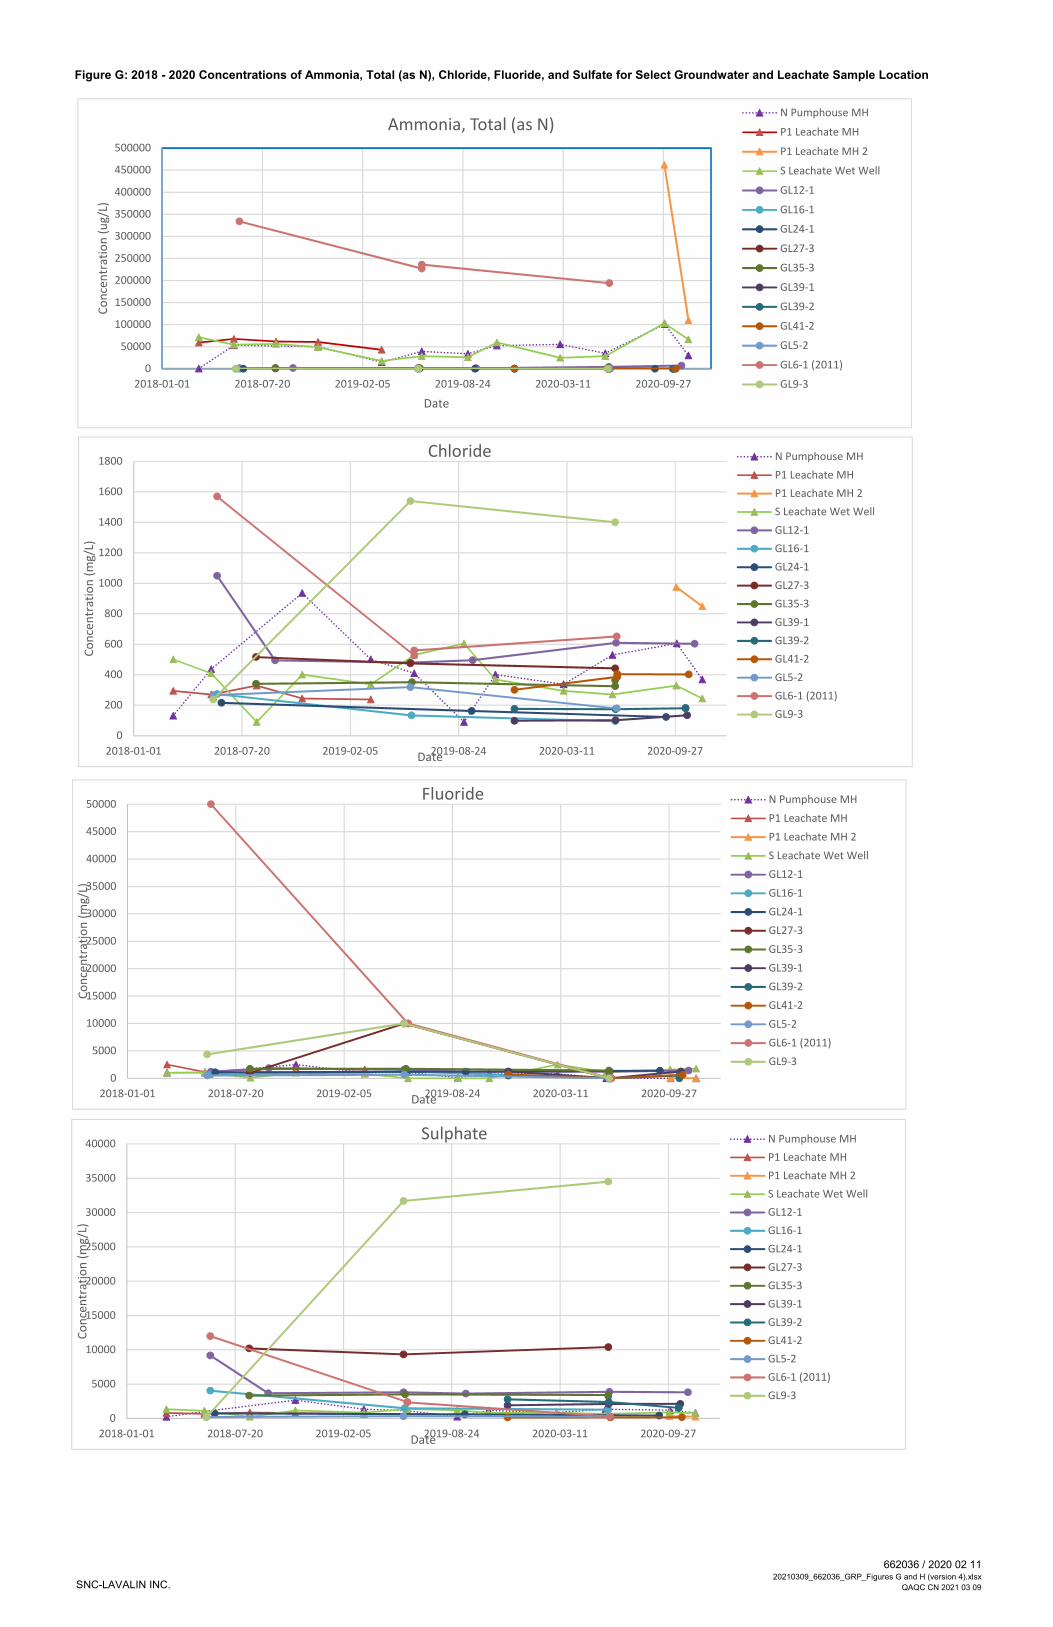
Figure G: 2018 - 2020 Concentrations of Ammonia, Total (as N), Chloride, Fluoride, and Sulfate for Select Groundwater and Leachate Sample Locations
0
50000
100000
150000
200000
250000
300000
350000
400000
450000
500000
2018-01-01 2018-07-20 2019-02-05 2019-08-24 2020-03-11 2020-09-27
Co
nce
ntr
atio
n (
ug/
L)
Date
Ammonia, Total (as N) N Pumphouse MH
P1 Leachate MH
P1 Leachate MH 2
S Leachate Wet Well
GL12-1
GL16-1
GL24-1
GL27-3
GL35-3
GL39-1
GL39-2
GL41-2
GL5-2
GL6-1 (2011)
GL9-3
0
200
400
600
800
1000
1200
1400
1600
1800
2018-01-01 2018-07-20 2019-02-05 2019-08-24 2020-03-11 2020-09-27
Co
nce
ntr
atio
n (
mg /
L)
Date
Chloride N Pumphouse MH
P1 Leachate MH
P1 Leachate MH 2
S Leachate Wet Well
GL12-1
GL16-1
GL24-1
GL27-3
GL35-3
GL39-1
GL39-2
GL41-2
GL5-2
GL6-1 (2011)
GL9-3
0
5000
10000
15000
20000
25000
30000
35000
40000
45000
50000
2018-01-01 2018-07-20 2019-02-05 2019-08-24 2020-03-11 2020-09-27
Co
nce
ntr
atio
n (
mg/
L)
Date
Fluoride N Pumphouse MH
P1 Leachate MH
P1 Leachate MH 2
S Leachate Wet Well
GL12-1
GL16-1
GL24-1
GL27-3
GL35-3
GL39-1
GL39-2
GL41-2
GL5-2
GL6-1 (2011)
GL9-3
0
5000
10000
15000
20000
25000
30000
35000
40000
2018-01-01 2018-07-20 2019-02-05 2019-08-24 2020-03-11 2020-09-27
Co
nce
ntr
atio
n (
mg/
L)
Date
Sulphate N Pumphouse MH
P1 Leachate MH
P1 Leachate MH 2
S Leachate Wet Well
GL12-1
GL16-1
GL24-1
GL27-3
GL35-3
GL39-1
GL39-2
GL41-2
GL5-2
GL6-1 (2011)
GL9-3
SNC-LAVALIN INC.
662036 / 2020 02 1120210309_662036_GRP_Figures G and H (version 4).xlsx
QAQC CN 2021 03 09

Figure H: 2018 -2020 Concentrations of Chemical Oxygen Demand, Boron, Chromium, and Dissolved Iron for Select Groundwater and Leachate Sample Locations
0
2000
4000
6000
8000
10000
12000
14000
2018-01-01 2018-07-20 2019-02-05 2019-08-24 2020-03-11 2020-09-27
Co
nce
ntr
atio
n (
mg/
L)
Date
Chemical Oxygen Demand N Pumphouse MH
P1 Leachate MH
P1 Leachate MH 2
S Leachate Wet Well
GL12-1
GL16-1
GL24-1
GL27-3
GL35-3
GL39-1
GL39-2
GL41-2
GL5-2
GL6-1 (2011)
GL9-3
0
500
1000
1500
2000
2500
3000
3500
4000
4500
5000
2018-01-01 2018-07-20 2019-02-05 2019-08-24 2020-03-11 2020-09-27
Co
nce
ntr
atio
n (
mg/
L)
Date
Boron N Pumphouse MH
P1 Leachate MH
P1 Leachate MH 2
S Leachate Wet Well
GL12-1
GL16-1
GL24-1
GL27-3
GL35-3
GL39-1
GL39-2
GL41-2
GL5-2
GL6-1 (2011)
GL9-3
0
20
40
60
80
100
120
2018-01-01 2018-07-20 2019-02-05 2019-08-24 2020-03-11 2020-09-27
Co
nce
ntr
atio
n (
mg/
L)
Date
Chromium N Pumphouse MH
P1 Leachate MH
P1 Leachate MH 2
S Leachate Wet Well
GL12-1
GL16-1
GL24-1
GL27-3
GL35-3
GL39-1
GL39-2
GL41-2
GL5-2
GL6-1 (2011)
GL9-3
0
5000
10000
15000
20000
25000
30000
2018-01-01 2018-07-20 2019-02-05 2019-08-24 2020-03-11 2020-09-27
Co
nce
ntr
atio
n (
mg/
L)
Date
Iron N Pumphouse MH
P1 Leachate MH
P1 Leachate MH 2
S Leachate Wet Well
GL12-1
GL16-1
GL24-1
GL27-3
GL35-3
GL39-1
GL39-2
GL41-2
GL5-2
GL6-1 (2011)
GL9-3
SNC-LAVALIN INC.
662036 / 2020 02 1120210309_662036_GRP_Figures G and H (version 4).xlsx
QAQC CN 2021 03 09

Tables 1: Detailed Monitoring Well Construction and Current Status 2a: Groundwater Elevations 2b: Surface Water Elevations 3a: Summary of Analytical Results for Groundwater – Inorganics 3b: Summary of Analytical Results for Groundwater – Dissolved Metals 3c: Summary of Analytical Results for Groundwater – Drinking Water Comparison - Inorganics 3d: Summary of Analytical Results for Groundwater – Drinking Water Comparison - Dissolved Metals 4a: Summary of Analytical Results for Surface Water – Inorganics 4b: Summary of Analytical Results for Surface Water – Total Metals 5: Summary of Analytical Results for Leachate

Grade Piezo
Top of
screen
Bottom of
Screen
Top of
Screen
Bottom
of
Screen
Screen
Length
Well IDa Well IDaNorthing Easting (m msl) (m msl) (m msl) (m msl) (m bgs) (m bgs) (m bgs)
GL41-1 GL41-1 5537673.4 326191.3 449.7 450.6 440.6 439.0 9.1 10.7 1.6 volcanic bedrock, brown, hard Sonic Core VanMars SNC Lavalin 2019 Active
GL41-2 GL41-2 5537673.3 326191.5 449.7 450.6 443.3 442.4 6.4 7.3 0.9 gravel and silt, trace clay (till) Sonic Core VanMars SNC Lavalin 2019 Active
GL41-3 GL41-3 5537675.7 326192.7 449.7 450.6 447.0 445.5 2.7 4.2 1.5 silt, some clay followed by sand, trace silt HSA On the Mark SNC Lavalin 2019 Active
GL0-1 12-1A 5537338.6 326498.8 449.2 450.0429.1 426.0
20.1 23.23.1 sandy clay (till) followed by bedrock Sonic Core MudBay SLR 2012
Decomm in
September 2020
GL0-2 12-1B 5537338.6 326498.8 449.0 450.0 435.0 431.9 14.0 17.1 3.1sandy silt, some gravel (suspect till) followed by sand and silt,
some clay, trace gravelSonic Core MudBay SLR 2012
Decomm in
September 2020
GL0-3 12-1C 5537338.6 326498.8449.42 450.49
439.9 436.9 9.5 12.5 3.0 sand and gravel followed by sand, trace silt and gravel Sonic Core MudBay SLR 2012Decomm in
September 2020
GL23-1 GL23-1 5537307.3 326976.6 446.0 446.6 437.8 436.3 8.2 9.7 1.5 sand, compact HSA Beck Golder 2007 Active
GL24-1 GL24-1 5537291.1 327107.7 446.8 447.6 443.6 441.6 3.2 5.2 2.0 sand, compact followed by silty sand (till) HSA Beck Golder 2007 Active
GL1-1 GL1-1 5537230.4 327134.1 446.3 446.9 435.8 434.3 10.5 12.0 1.5 silt, some gravel (till) HSA - Gartner Lee 1990 Active
GL1-2 GL1-2 5537230.4 327134.1 446.3 447.0 443.8 440.3 2.5 6.0 3.5 silty sand followed by sand HSA - Gartner Lee 1990 Active
GL22-1 GL22-1 5537429.7 326934.5 449.4450.3 438.2 436.6
11.2 12.81.6 sand, trace silt HSA Beck Golder 2007
Decomm in Sept/Oct
2016
GL3-5 12-14 5537050.6 326414.3 457.1 457.4 435.5 433.9 21.6 23.2 1.6 sand and gravel followed by silty clay with sand Sonic Core MudBay SLR 2012 Decomm in 2017
GL3-1 GL3-1 5537029.2 326492.0 - - - - ? 46.9 -volcanic bedrock Air Rotary - Gartner Lee 1990 Decomm in May 2011
GL3-2 GL3-2 5537029.2 326492.0 - - - - 16.8 18.51.7 silty sand some gravel (till) HSA - Gartner Lee 1990 Decomm in May 2011
GL3-3 GL3-3 5537029.2 326492.0 - - - - 0.5 3.53.0 fill followed by silty clay HSA - Gartner Lee 1990 Decomm in May 2011
GL6-1 (2011) GL6-1 (2011) 5536528.3 326582.8 439.7 440.5 437.9 434.8 1.8 4.9 3.1 Interbedded clay and garbage (municipal solid waste) Sonic Core Beck SLR 2011 Active
GL18-1 GL18-1 5536537.1 326574.7 - - - - >24 - -bedrock Sonic Core Beck SLR 2011 Decomm in May 2011
GL18-2 GL18-2 5536537.1 326574.7 442.6442.9 426.4 423.4
16.2 19.23.0 silty sand Mud Rotary Foundex Golder 2005
Decomm in January
2019
GL18-3 GL18-3 5536537.1 326574.7 442.9442.8 437.5 434.6
5.4 8.32.9 landfill refusal Mud Rotary Foundex Golder 2005
Decomm in January
2020
GL2-1 GL2-1 5536880.9 326219.1 438.6 439.0 430.6 429.1 8.0 9.5 1.5 silty clay followed by silty sand HSA - Gartner Lee 1990 Active
GL2-2 GL2-2 5536880.9 326219.1 438.9 439.0 436.4 432.9 2.5 6.0 3.5 silty clay HSA - Gartner Lee 1990 Active
GL5-1 GL5-1 5536592.3 326175.4 439.0 440.0 421.0 420.0 18.0 19.0 1.0 crystalline bedrock Air Rotary - Gartner Lee 1990 Active
GL5-2 GL5-2 5536592.3 326175.4 439.2 440.1 431.7 429.2 7.5 10.0 2.5 sand followed by gravelly silt (till) HSA - Gartner Lee 1990 Active
GL5-3 GL5-3 5536592.3 326175.4 439.2 440.2 437.2 434.2 2.0 5.0 3.0 silty clay HSA - Gartner Lee 1990 Active
GL4-1 GL4-1 5536929.9 326887.8 441.1 441.4 433.4 432.4 7.7 8.7 1.0 silty gravel and sand HSA - Gartner Lee 1990 Active
GL4-2 GL4-2 5536929.9 326887.8 441.1 441.4 439.4 435.9 1.7 5.2 3.5 silty clay HSA - Gartner Lee 1990 Active
GL34-1 11-26A 5536303.3 326445.5 439.2 440.0 433.2 431.7 6.0 7.5 1.5 fat clay (reworked soil, fill) with 7 cm sand lenses Sonic Core Beck SLR 2011 Active
GL34-2 11-26B 5536303.3 326445.5 439.2 439.7 428.5 427.6 10.7 11.6 0.9 silty sand, clay layers Sonic Core Beck SLR 2011 Active
GL34-3 11-26C 5536303.3 326445.5 439.3 440.1 425.7 424.8 13.6 14.5 0.9 lean clay, trace sand followed by fat clay, trace sand Sonic Core Beck SLR 2011 Active
GL30-1 11-13A1 5536286.0 326746.8 439.2 440.0 432.6 431.1 6.6 8.1 1.5 fat clay (reworked soil, fill) with 10 cm sand lens Sonic Core Beck SLR 2011 Decomm in Oct 2019
GL30-2 11-13B 5536286.0 326746.8 439.4 440.7 427.5 426.6 11.9 12.8 0.9 silty sand followed by fat clay Sonic Core Beck SLR 2011 Decomm in Oct 2019
GL30-3 11-13C 5536286.0 326746.8 439.4 440.6 424.3 423.4 15.1 16.0 0.9 fat clay Sonic Core Beck SLR 2011 Decomm in Oct 2019
GL31-1 11-18A15536191.5 326639.6
439.4440.3 432.5 431.0
6.9 8.41.5 fat clay (reworked soil, fill) followed by lean clay (native) Sonic Core Beck SLR 2011 Damaged 2020
GL31-2 11-18B1 5536191.5 326639.6 439.2 440.0 428.6 427.7 10.6 11.5 0.9 lean clay followed by silt with sand Sonic Core Beck SLR 2011 Active
GL31-3 11-18C 5536191.5 326639.6 439.5 440.4 425.2 424.2 14.3 15.3 1.0 silt some sand Sonic Core Beck SLR 2011 Damaged 2020
GL32-1 11-21A1 5536093.5 326735.0 438.2 439.0 433.6 432.1 4.6 6.1 1.5 fat clay (native) with 1 cm sand lenses Sonic Core Beck SLR 2011 Active
GL32-2 11-21B 5536093.5 326735.0 437.8 438.7 429.7 428.8 8.1 9.0 0.9 lean clay with sand lenses followed by silty sand Sonic Core Beck SLR 2011 Active
GL32-3 11-21C1 5536093.5 326735.0 437.8 438.6 427.9 426.9 9.9 10.9 1.0 silty sand, trace clay Sonic Core Beck SLR 2011 Damaged 2020
GL33-1 11-22A 5536202.4 326837.1 439.4 440.0 433.8 430.7 5.6 8.7 3.1fat clay (reworked soil, fill) followed by silty sand with gravel
(suspect till)Sonic Core Beck SLR 2011 Decomm in Oct 2019
GL33-2 11-22B 5536202.4 326837.1 439.5 440.1 430.5 429.0 9.0 10.5 1.5 silty sand with gravel (suspect till) Sonic Core Beck SLR 2011 Decomm in Oct 2019
GL33-3 11-22C 5536202.4 326837.1 439.5 440.2 427.7 426.2 11.8 13.3 1.5silty sand with gravel (suspect till) followed by volcanic
bedrock (weak)Sonic Core Beck SLR 2011 Decomm in Oct 2019
GL35-1 11-31A15536105.2 326411.2
438.1439.0 432.0 430.5
6.1 7.61.5 fat clay (reworked soil, fill) follwed by silty sand and lean clay Sonic Core Beck SLR 2011 Active
GL35-2 11-31B 5536105.2 326411.2 438.1 439.0 427.5 425.9 10.6 12.2 1.6 lean clay Sonic Core Beck SLR 2011 Active
GL35-3 11-31C 5536105.2 326411.2 438.4 439.3 425.1 423.6 13.3 14.8 1.5 silty sand with gravel (till) Sonic Core Beck SLR 2011 Active
GL36-1 11-3A 5536496.4 326764.1 439.2 439.8 433.7 430.7 5.5 8.5 3.0fat clay (reworked soil, fill) followed by fat clay (native) with cm
sand layersSonic Core Beck SLR 2011 Decomm in Oct 2019
GL36-2 11-3B 5536496.4 326764.1 439.3 440.0 429.1 427.6 10.2 11.7 1.5 fat clay (native), trace sand followed by sandy silt Sonic Core Beck SLR 2011 Decomm in Oct 2019
GL3712-11 5536489.1 326646.4 439.3 440.1 437.5 431.4 1.8 7.9 6.1
interbedded silt clay and garbage followed by clay, silty layers
with wood chunksSonic Core MudBay SLR 2012 Decomm in 2017
GL38 12-10 5536488.9 326634.4 439.3 440.1 437.5 431.5 1.8 7.8 6.0interbedded silt clay and garbage followed by fat clay
(reworked soil, fill). No recovery below 5 m.Sonic Core MudBay SLR 2012 Decomm in 2017
GL8-1 GL8-1 5535944.5 326391.9 438.8 439.7 431.3 429.8 7.5 9.0 1.5 sand, some gravel HSA - Gartner Lee 1990 Active
GL8-2 GL8-2 5535944.5 326391.9 438.8 439.6 438.3 434.8 0.5 4.0 3.5 clay HSA - Gartner Lee 1990 Active
GL14-1 GL14-1 5536265.0 326258.7 453.3 453.8 >8 bedrock Mud Rotary Foundex Golder 2005 Decomm in 2016
GL7-1 GL7-1 5536434.3 326891.0 439.0 439.7 436.0 435.5 3.0 3.5 0.5 weathered bedrock Air Rotary - Gartner Lee 1990 Active
GL26-1 09-2-1 5535984.6 326863.3 440.9 441.4 435.8 434.3 5.1 6.6 1.5 clayey silt followed by bedrock, some fractures Odex - Golder 2009 Active
GL26-2 09-2-2 5535984.6 326863.3 440.7 441.6 437.0 435.5 3.7 5.2 1.5 clayey silt, trace sand and gravel HSA - Golder 2009 Active
GL26-3 09-2-3 5535984.6 326863.3 440.7 441.5 438.6 437.3 2.1 3.4 1.3 silty gravelly sand followed by layered clayey silt SSA - Golder 2009 Active
GL26-4 09-2-4 5535984.6 326863.3 440.7 441.5 417.8 414.8 22.9 25.9 3.0 bedrock Odex - Golder 2009 Active
GL10-1 GL10-1 5535933.0 326821.6 438.4 439.4 435.5 430.0 2.9 8.4 5.5 silty clay, some sand and gravel HSA - Gartner Lee 1990 Active
12-16 12-16 5536514.5 326448.7 - - - - 6.1 10.7 4.6 fat clay (reworked soil, fill) HSA On the Mark SLR 2012 Decomm in 2012
GL25-1 09-1-1 5536149.0 327105.1 458.3 459.0 443.7 440.7 14.6 17.6 3.0 sand and gravel with silty clay (till) Odex - Golder 2009 Decomm in 2016
GL25-2 09-1-2 5536149.0 327105.1 458.3 459.108 456.5 455.0 1.8 3.3 1.5 interbedded clay and silty clay SSA - Golder 2009 Decomm in 2016
GL27-1 09-3-1 5535841.1 326462.8 438.7 441.6 415.1 413.6 23.6 25.1 1.5 bedrock , some fractures Odex - Golder 2009 Active
GL27-2 09-3-2 5535841.1 326462.8 438.7 440.8 428.2 426.7 10.5 12.0 1.5 silty clay, some sand and gravel (till) SSA - Golder 2009 Active
GL27-3 09-3-3 5535841.1 326462.8 438.6 440.8 430.2 428.7 8.4 9.9 1.5 layered clay followed by silty clay, some sand and gravel (till) HSA - Golder 2009 Active
GL27-4 09-3-4 5535841.1 326462.8 438.7 440.6 437.9 436.9 0.8 1.8 1.0 sandy gravelly silt (fill) SSA - Golder 2009 Active
GL17-1 GL17-1 5535791.4 326494.6 439.2 440.3 - - >18 - - bedrock Mud Rotary Foundex Golder 2005 Active
GL17-2 GL17-2 5535791.4 326494.6 439.2 439.8 434.4 431.4 4.8 7.8 3.0 silty gravelly sand (till) Mud Rotary Foundex Golder 2005 Active
GL13-1 GL13-1 5535791.4 326494.6 - 439.8 - - 4.6 7.6 3.0 silty sand with gravel (till) HSA - Gartner Lee 1998 Active
GL12-1 GL12-1 5535729.1 326538.3 441.3 442.3 435.2 432.2 6.1 9.1 3.0 silty sand (till) HSA - Gartner Lee 1998 Active
GL29-1 12-4A 5535749.3 326652.7 443.9 445.1 402.4 399.4 41.5 44.5 3.0 sand and silt followed by bedrock Sonic Core MudBay SLR 2012 Active
GL29-2 12-4B 5535749.3 326652.7 443.9 444.8 436.0 432.9 7.9 11.0 3.1 sand and silt (till) Sonic Core MudBay SLR 2012 Active
GL15-1 GL15-1 5535905.1 326176.5 452.0 452.3 - - >12 - - bedrock Mud Rotary Foundex Golder 2005 Active
GL15-2 GL15-2 5535905.1 326176.5 451.7 452.0 448.6 445.6 3.1 6.1 3.0 sandy silt and gravel (till) Mud Rotary Foundex Golder 2005 Active
06BH02 06BH02 5535672.4 327122.8 445.6 445.4 437.6 434.6 8.0 11.0 3.0 clay followed by sand and gravel HSA Kamloops EBA 2006 Active
GL39-1 GL39-1 5535296.8 326790.4 439.5 440.4 430.7 429.5 8.8 10.0 1.2 silt, some sand, clay and gravel (till) HSA On the Mark SNC Lavalin 2019 Active
GL39-2 GL39-2 5535297.6 326789.1 439.6 440.5 435.3 433.5 4.3 6.1 1.8 silty sand , trace gravel and clay HSA On the Mark SNC Lavalin 2019 Active
GL39-3 GL39-3 5535298.3 326787.8 439.6 440.6 438.1 436.6 1.5 3.0 1.5 silty clay, some sand HSA On the Mark SNC Lavalin 2019 Active
GL40-1 GL40-1 5535525.2 326465.2 449.7 450.5 446.7 445.1 3.0 4.6 1.6 sand and gravel, trace clay and silt (till) HSA On the Mark SNC Lavalin 2019 Active
GL40-2 GL40-2 5535523.8 326466.4 449.6 450.4 435.0 433.4 14.6 16.2 1.6 volcanic bedrock, brown, hard Sonic Core VanMars SNC Lavalin 2019 Active
GL40-3 GL40-3 5535523.7 326466.2 449.6 450.4 439.8 438.0 9.8 11.6 1.8 clay and silt, some sand, trace gravel (till) Sonic Core VanMars SNC Lavalin 2019 Active
GL42-1 GL42-1 5535422.7 326636.2 447.6 448.4 429.3 427.7 18.3 19.9 1.6 sand and gravel, trace silt (till) Sonic Core VanMars SNC Lavalin 2019 Active
GL42-2 GL42-2 5535422.6 326636.2 447.6 448.4 437.5 436.0 10.1 11.6 1.5 clayey silt Sonic Core VanMars SNC Lavalin 2019 Active
GL42-3 GL42-3 5535423.9 326637.6 447.7 448.5 441.0 439.2 6.7 8.5 1.8 sand, gravel and cobbles (till) Sonic Core VanMars SNC Lavalin 2019 Active
09BH01 09BH01 5535385.2 326712.8 - - - - - - - - SSA Beck SLR 2011 Decomm in Aug 2011
09BH05-S 09BH05-S 5535090.7 326805.6 - - - - 11.2 14.2 1.8 silty sand HSA Kel EBA 2009 Inaccessible
09BH05-D 09BH05-D 5535090.7 326805.6 - - - - 22.0 23.0 1.8 sand, some gravel, trace silt HSA Kel EBA 2009 Inaccessible
09BH06-S 09BH06-S 5534457.6 326917.6 435.9 435.9 431.9 430.4 4.0 5.5 1.8 silty clay HSA Kel EBA 2009 Active
09BH06-D 09BH06-D 5534457.6 326917.6 435.6 435.8 428.6 425.6 7.0 10.0 1.8 silty sand HSA Kel EBA 2009 Active
09BH07 09BH07 5535293.6 327214.6 440.9 441.0 434.4 431.4 6.5 9.5 1.8 sand, trace silt HSA Kel EBA 2009 Damaged 2020
09BH03 09BH03 5535064.2 327413.6 440.8 441.0 434.7 431.7 6.1 9.1 1.8 sand, trace silt HSA Kel EBA 2009 Active
09BH04 09BH04 5535008.4 327178.2 436.2 436.4 425.0 422.0 11.2 14.2 1.8 sand and gravel, trace clay HSA Kel EBA 2009 Active
GL28-1 09-4-1 5535273.8 326721.5 442.1 442.1 424.6 423.1 17.5 19.0 1.5 sand, some silt followed by gravel, some sand, trace silt Odex - Golder 2009 Active
GL28-2 09-4-2 5535273.8 326721.5 441.4 441.8 435.9 434.4 5.5 7.0 1.5 silty sand HSA - Golder 2009 Active
GL28-3 09-4-3 5535273.8 326721.5 441.4 441.7 438.9 437.4 2.5 4.0 1.5 layered silty clay, some sand SSA - Golder 2009 Activea Reference elevation is a mark on the rim of the monitoring well standpipe surveyed with respect to geodetic datum.
HSA - Hollow Stem Auger
SSA - Solid Stem Auger
Table 1: Detailed Monitoring Well Construction and Current Status
South and South East of Site
South Perimeter of Site
East of Compost Facility
West of Compost Facility
Screen Details
Lithology
Monitoring Well Geodetic Elevations
Phase 1
Phase 2
West of Phase 2
East of Phase 2
Phase 3 Slough
West of Phase 3 Slough
East of Phase 3 Slough
Compost Facility - South of Phase 3 Slough
UTM Coordinates
North and North East of Phase 1
Consultant
Initial
Monitoring
Current StatusCity's
Current
Monitoring
Drilling
Method Company Consultant Year
SNC-LAVALIN INC. Page 1 of 1
662036 / 2021 02 17
20210309_662036_Table 1. allMWs.xlsx
QAQC CN 2021 03 09

Table 2a: Groundwater Elevations
Well ID GL0-1 GL0-2 GL0-3 GL1-1 GL1-2 GL2-1 GL2-2 GL3-5 GL4-1 GL4-2 GL5-1 GL5-2 GL5-3 GL6-1 (2011) GL7-1 GL8-1 GL8-2 GL9-1 GL9-2 GL9-3 GL10-1 GL12-1 GL13-1
Measurement date
2015 Well Elevation 450.052 450.008 450.541 446.97 446.982 438.991 438.988 457.82 441.404 441.407 439.973 440.079 440.088 440.511 439.744 439.729 GL8-2 439.592 439.477 439.505 439.392 441.834 439.757
2015-03-17 444.112 440.943 440.898 445.077 444.994 438.791 438.59 439.181 440.059 439.746 438.593 438.591 438.57 437.889 438.051 438.86 438.143 439.502 437.932 437.885 437.901 440.224 439.142
2015-06-04 444.202 440.846 440.793 444.922 444.844 438.756 438.581 439.102 440.214 439.698 438.616 438.63 438.61 437.871 438.109 438.779 438.141 439.502 437.939 437.9 438.15 440.159 439.102
2015-08-27 444.213 440.748 440.691 444.461 444.386 437.46 437.716 439.007 439.993 439.516 437.513 437.472 437.343 437.556 437.814 437.53 437.291 439.414 437.509 437.46 437.372 439.985 438.957
2015-11-02 444.211 440.697 440.636 444.565 444.544 438.053 437.953 439.025 440.038 439.585 437.488 437.513 437.334 437.562 437.843 437.259 437.088 439.393 437.682 437.635 437.943 439.891 438.903
2016 Well Elevation 449.999 449.957 450.487 446.955 446.965 438.998 438.994 457.44 441.363 441.371 439.998 440.114 440.119 440.481 439.718 439.642 439.572 439.443 439.435 439.414 442.248
2016-03-22 444.361 440.856 440.797 445.451 445.35 438.888 438.764 439.02 440.254 439.78 438.669 438.651 438.605 437.931 438.137 438.829 438.188 438.031 437.945 438.033 440.96 439.274
2016-05-16 444.694 440.942 440.882 445.57 445.506 438.638 438.376 439.201 440.253 439.722 438.529 438.495 438.434 437.891 438.126 438.777 438.019 437.944 437.896 437.914 440.486 439.305
2016-09-16 444.907 440.992 440.923 444.82 444.743 438.216 437.759 439.145 440.072 439.6 437.927 437.892 437.808 437.696 437.953 438.047 437.684 437.671 437.607 437.604 440.076 439.238
2016-11-24 444.928 440.995 440.925 445.065 444.99 438.649 438.414 439.105 440.072 439.661 438.43 438.475 438.435 437.822 438.02 438.75 438.043 437.834 437.785 438.006 439.998 439.318
2017 Well Elevation
2017-03-21 444.93 441.069 441.012 445.443 445.367 438.563 439.341 440.343 440.676 438.589 438.626 438.579 438.163 438.298 439.03 438.48 438.241 438.18 438.26 440.28 439.405
2017-06-05 445.449 441.309 441.242 445.847 445.67 438.967 438.842 decommisioned 440.234 440.532 438.955 438.949 438.894 438.4 438.492 438.974 438.485 438.438 438.367 438.422 440.56 439.507
2017-08-16 445.621 441.351 441.288 444.824 444.742 438.613 438.193 440.081 439.953 438.493 438.441 438.381 438.067 438.232 438.561 437.934 438.108 438.03 438.009 439.505
2017-09-22 445.63 441.308 441.242 444.69 444.61 438.547 438.243 440.067 439.992 438.413 438.389 438.35 437.895 438.113 438.536 437.892 437.978 437.893 437.88 440.31 439.466
2017-11-14 445.66 441.281 441.222 444.841 444.805 438.848 438.685 440.162 440.243 438.693 438.71 438.696 437.9 438.118 438.754 438.164 438.041 437.96 438.191 440.095 439.318
2018 Well Elevation
2018-03-16 445.621 441.402 441.348 445.732 445.693 438.998 438.865 440.554 440.72 438.987 438.986 438.939 438.426 438.993 438.73 438.519 438.434 438.479 439.608
2018-05-25 446.338 441.829 441.575 445.756 445.645 438.884 438.612 440.438 439.8 438.87 438.835 438.805 438.516 438.919 438.472 438.565 438.485 438.515 440.723 439.668
2018-08-30 446.861 443.054 443.056 444.814 444.725 438.687 438.481 439.819 439.331 438.564 438.563 438.525 437.544 438.843 438.115 438.083 438.003 437.945 440.284 439.401
2018-11-16 446.734 442.592 442.576 445.355 445.246 438.998 438.814 439.994 439.506 438.843 438.815 438.81 437.972 438.206 438.942 438.342 Artesian 438.208 438.135 438.206 439.958 439.248
2019 Well Elevation 449.997 449.947 450.49 446.944 446.951 438.999 438.992 441.353 441.357 440.023 440.137 440.15 440.449 439.721 439.65 439.574 439.565 439.449 439.444 439.418 442.251 439.759
2019-03-21 446.512 442.622 442.591 445.674 445.579 438.999 438.752 440.153 439.647 438.913 438.868 438.859 438.359 438.456 438.861 438.719 439.565 438.457 438.461 438.48 439.766 439.328
2019-06-06 446.395 442.265 442.245 445.341 445.229 438.739 438.551 439.898 439.348 438.619 438.606 438.582 438.139 438.31 438.631 438.26 439.565 438.287 438.205 438.186 439.75 439.158
2019-07-12 446.297 442.16 442.137 445.1 445 439.881 439.322 438.545 438.493 438.445 437.839 438.7 438.147 439.565 438.156 438.091 438.105 439.676 439.114
2019-08-12 446.215 442.05 442.022 444.874 444.773 438.503 438.116 439.806 439.258 438.293 438.287 438.223 437.015 438.054 438.587 437.899 438.032 437.973 438.132 439.684 439.074
2019-08-13
2019-10-28 446.003 441.875 441.841 445.129 445.033 438.779 438.613 439.891 439.348 438.624 438.622 438.617 437.54 437.821 438.669 438.116 439.565 437.934 437.873 437.999 439.652 439.06
2020 Well Elevation
2020-03-21 445.87 441.76 441.72 445.73 445.61 438.77 438.99 440.25 439.60 438.82 438.80 438.78 438.20 438.32 438.88 439.39 439.54 438.31 438.26 438.25 440.06 439.33
2020-06-04 445.57 445.45 438.81 438.40 440.32 439.57 438.57 438.52 438.48 438.16 438.30 438.69 438.27 439.52 438.28 438.21 438.22 440.06 439.35
2020-09-15 445.04 444.95 438.69 438.52 439.90 439.26 438.59 438.57 438.55 437.86 438.00 438.86 438.05 439.52 437.95 437.89 437.75 440.06 439.30
2020-11-26 445.29 445.20 438.90 438.64 439.90 439.33 438.71 438.68 438.66 437.51 438.02 439.03 438.21 439.54 438.08 439.04 438.11 439.95 439.26
decommisioned
SNC-LAVALIIN INC.
662036 / 2021 02 1220210309_662036_MNR_GW.xlsx
QAQC CN 2021 03 09
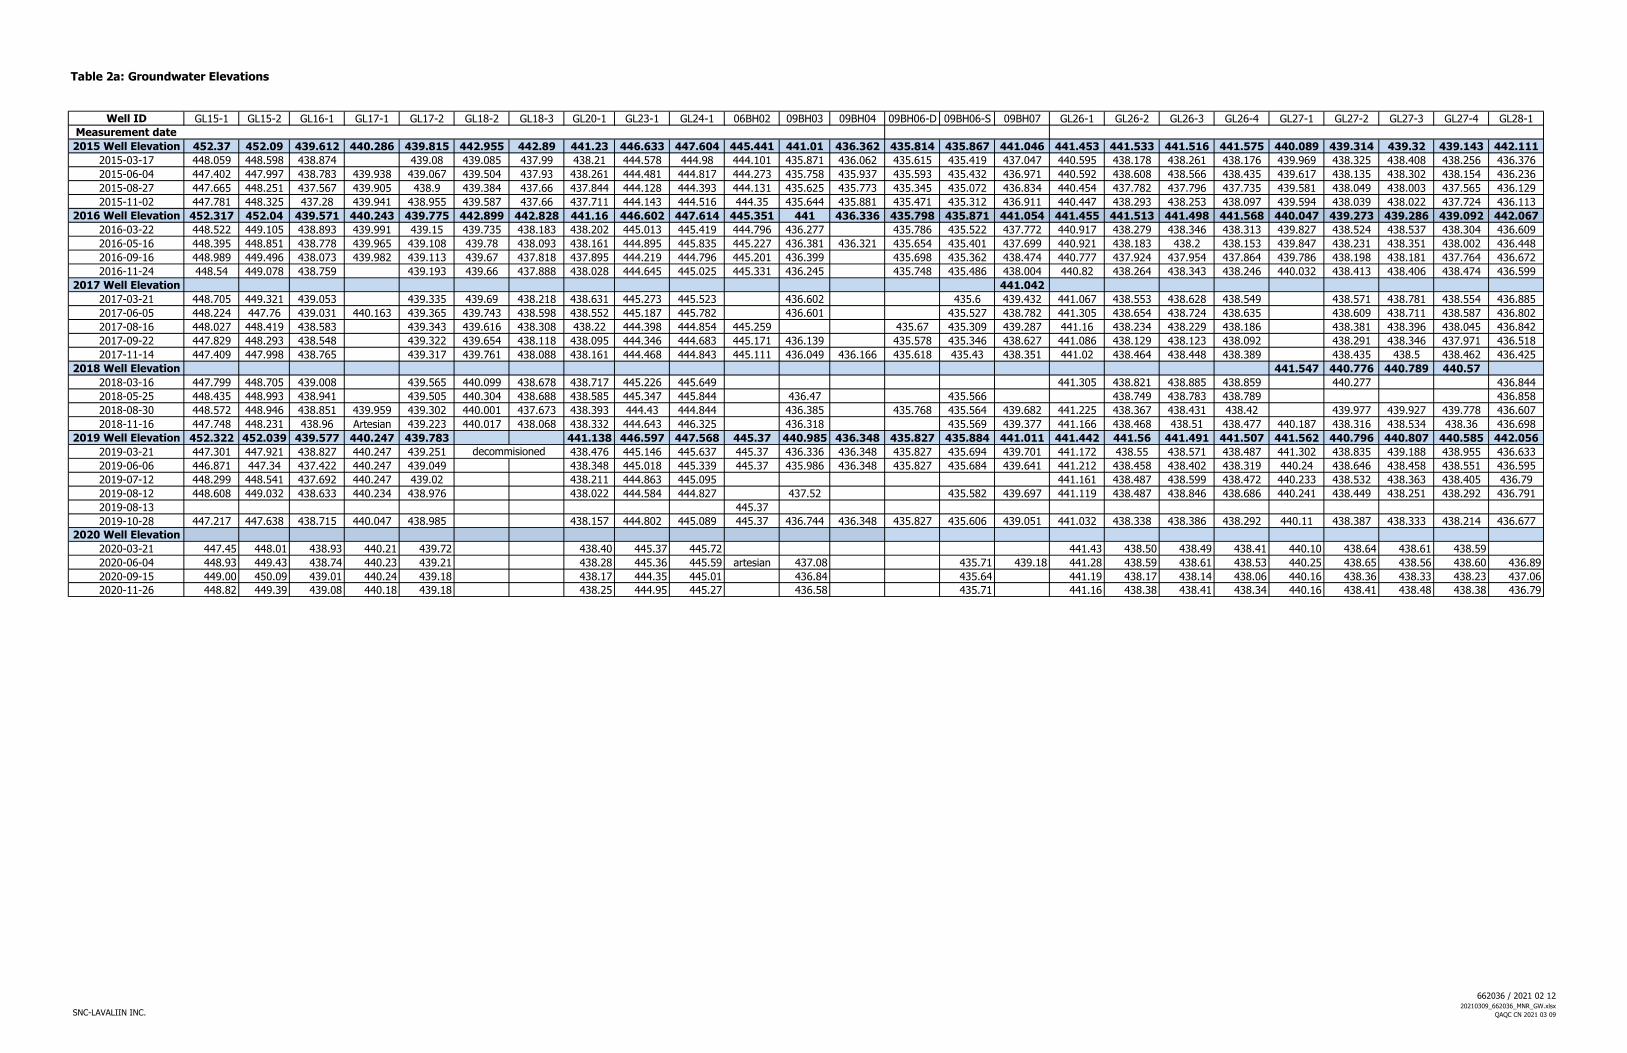
Table 2a: Groundwater Elevations
Well ID GL15-1 GL15-2 GL16-1 GL17-1 GL17-2 GL18-2 GL18-3 GL20-1 GL23-1 GL24-1 06BH02 09BH03 09BH04 09BH06-D 09BH06-S 09BH07 GL26-1 GL26-2 GL26-3 GL26-4 GL27-1 GL27-2 GL27-3 GL27-4 GL28-1
Measurement date
2015 Well Elevation 452.37 452.09 439.612 440.286 439.815 442.955 442.89 441.23 446.633 447.604 445.441 441.01 436.362 435.814 435.867 441.046 441.453 441.533 441.516 441.575 440.089 439.314 439.32 439.143 442.111
2015-03-17 448.059 448.598 438.874 439.08 439.085 437.99 438.21 444.578 444.98 444.101 435.871 436.062 435.615 435.419 437.047 440.595 438.178 438.261 438.176 439.969 438.325 438.408 438.256 436.376
2015-06-04 447.402 447.997 438.783 439.938 439.067 439.504 437.93 438.261 444.481 444.817 444.273 435.758 435.937 435.593 435.432 436.971 440.592 438.608 438.566 438.435 439.617 438.135 438.302 438.154 436.236
2015-08-27 447.665 448.251 437.567 439.905 438.9 439.384 437.66 437.844 444.128 444.393 444.131 435.625 435.773 435.345 435.072 436.834 440.454 437.782 437.796 437.735 439.581 438.049 438.003 437.565 436.129
2015-11-02 447.781 448.325 437.28 439.941 438.955 439.587 437.66 437.711 444.143 444.516 444.35 435.644 435.881 435.471 435.312 436.911 440.447 438.293 438.253 438.097 439.594 438.039 438.022 437.724 436.113
2016 Well Elevation 452.317 452.04 439.571 440.243 439.775 442.899 442.828 441.16 446.602 447.614 445.351 441 436.336 435.798 435.871 441.054 441.455 441.513 441.498 441.568 440.047 439.273 439.286 439.092 442.067
2016-03-22 448.522 449.105 438.893 439.991 439.15 439.735 438.183 438.202 445.013 445.419 444.796 436.277 435.786 435.522 437.772 440.917 438.279 438.346 438.313 439.827 438.524 438.537 438.304 436.609
2016-05-16 448.395 448.851 438.778 439.965 439.108 439.78 438.093 438.161 444.895 445.835 445.227 436.381 436.321 435.654 435.401 437.699 440.921 438.183 438.2 438.153 439.847 438.231 438.351 438.002 436.448
2016-09-16 448.989 449.496 438.073 439.982 439.113 439.67 437.818 437.895 444.219 444.796 445.201 436.399 435.698 435.362 438.474 440.777 437.924 437.954 437.864 439.786 438.198 438.181 437.764 436.672
2016-11-24 448.54 449.078 438.759 439.193 439.66 437.888 438.028 444.645 445.025 445.331 436.245 435.748 435.486 438.004 440.82 438.264 438.343 438.246 440.032 438.413 438.406 438.474 436.599
2017 Well Elevation 441.042
2017-03-21 448.705 449.321 439.053 439.335 439.69 438.218 438.631 445.273 445.523 436.602 435.6 439.432 441.067 438.553 438.628 438.549 438.571 438.781 438.554 436.885
2017-06-05 448.224 447.76 439.031 440.163 439.365 439.743 438.598 438.552 445.187 445.782 436.601 435.527 438.782 441.305 438.654 438.724 438.635 438.609 438.711 438.587 436.802
2017-08-16 448.027 448.419 438.583 439.343 439.616 438.308 438.22 444.398 444.854 445.259 435.67 435.309 439.287 441.16 438.234 438.229 438.186 438.381 438.396 438.045 436.842
2017-09-22 447.829 448.293 438.548 439.322 439.654 438.118 438.095 444.346 444.683 445.171 436.139 435.578 435.346 438.627 441.086 438.129 438.123 438.092 438.291 438.346 437.971 436.518
2017-11-14 447.409 447.998 438.765 439.317 439.761 438.088 438.161 444.468 444.843 445.111 436.049 436.166 435.618 435.43 438.351 441.02 438.464 438.448 438.389 438.435 438.5 438.462 436.425
2018 Well Elevation 441.547 440.776 440.789 440.57
2018-03-16 447.799 448.705 439.008 439.565 440.099 438.678 438.717 445.226 445.649 441.305 438.821 438.885 438.859 440.277 436.844
2018-05-25 448.435 448.993 438.941 439.505 440.304 438.688 438.585 445.347 445.844 436.47 435.566 438.749 438.783 438.789 436.858
2018-08-30 448.572 448.946 438.851 439.959 439.302 440.001 437.673 438.393 444.43 444.844 436.385 435.768 435.564 439.682 441.225 438.367 438.431 438.42 439.977 439.927 439.778 436.607
2018-11-16 447.748 448.231 438.96 Artesian 439.223 440.017 438.068 438.332 444.643 446.325 436.318 435.569 439.377 441.166 438.468 438.51 438.477 440.187 438.316 438.534 438.36 436.698
2019 Well Elevation 452.322 452.039 439.577 440.247 439.783 441.138 446.597 447.568 445.37 440.985 436.348 435.827 435.884 441.011 441.442 441.56 441.491 441.507 441.562 440.796 440.807 440.585 442.056
2019-03-21 447.301 447.921 438.827 440.247 439.251 438.476 445.146 445.637 445.37 436.336 436.348 435.827 435.694 439.701 441.172 438.55 438.571 438.487 441.302 438.835 439.188 438.955 436.633
2019-06-06 446.871 447.34 437.422 440.247 439.049 438.348 445.018 445.339 445.37 435.986 436.348 435.827 435.684 439.641 441.212 438.458 438.402 438.319 440.24 438.646 438.458 438.551 436.595
2019-07-12 448.299 448.541 437.692 440.247 439.02 438.211 444.863 445.095 441.161 438.487 438.599 438.472 440.233 438.532 438.363 438.405 436.79
2019-08-12 448.608 449.032 438.633 440.234 438.976 438.022 444.584 444.827 437.52 435.582 439.697 441.119 438.487 438.846 438.686 440.241 438.449 438.251 438.292 436.791
2019-08-13 445.37
2019-10-28 447.217 447.638 438.715 440.047 438.985 438.157 444.802 445.089 445.37 436.744 436.348 435.827 435.606 439.051 441.032 438.338 438.386 438.292 440.11 438.387 438.333 438.214 436.677
2020 Well Elevation
2020-03-21 447.45 448.01 438.93 440.21 439.72 438.40 445.37 445.72 441.43 438.50 438.49 438.41 440.10 438.64 438.61 438.59
2020-06-04 448.93 449.43 438.74 440.23 439.21 438.28 445.36 445.59 artesian 437.08 435.71 439.18 441.28 438.59 438.61 438.53 440.25 438.65 438.56 438.60 436.89
2020-09-15 449.00 450.09 439.01 440.24 439.18 438.17 444.35 445.01 436.84 435.64 441.19 438.17 438.14 438.06 440.16 438.36 438.33 438.23 437.06
2020-11-26 448.82 449.39 439.08 440.18 439.18 438.25 444.95 445.27 436.58 435.71 441.16 438.38 438.41 438.34 440.16 438.41 438.48 438.38 436.79
decommisioned
SNC-LAVALIIN INC.
662036 / 2021 02 1220210309_662036_MNR_GW.xlsx
QAQC CN 2021 03 09
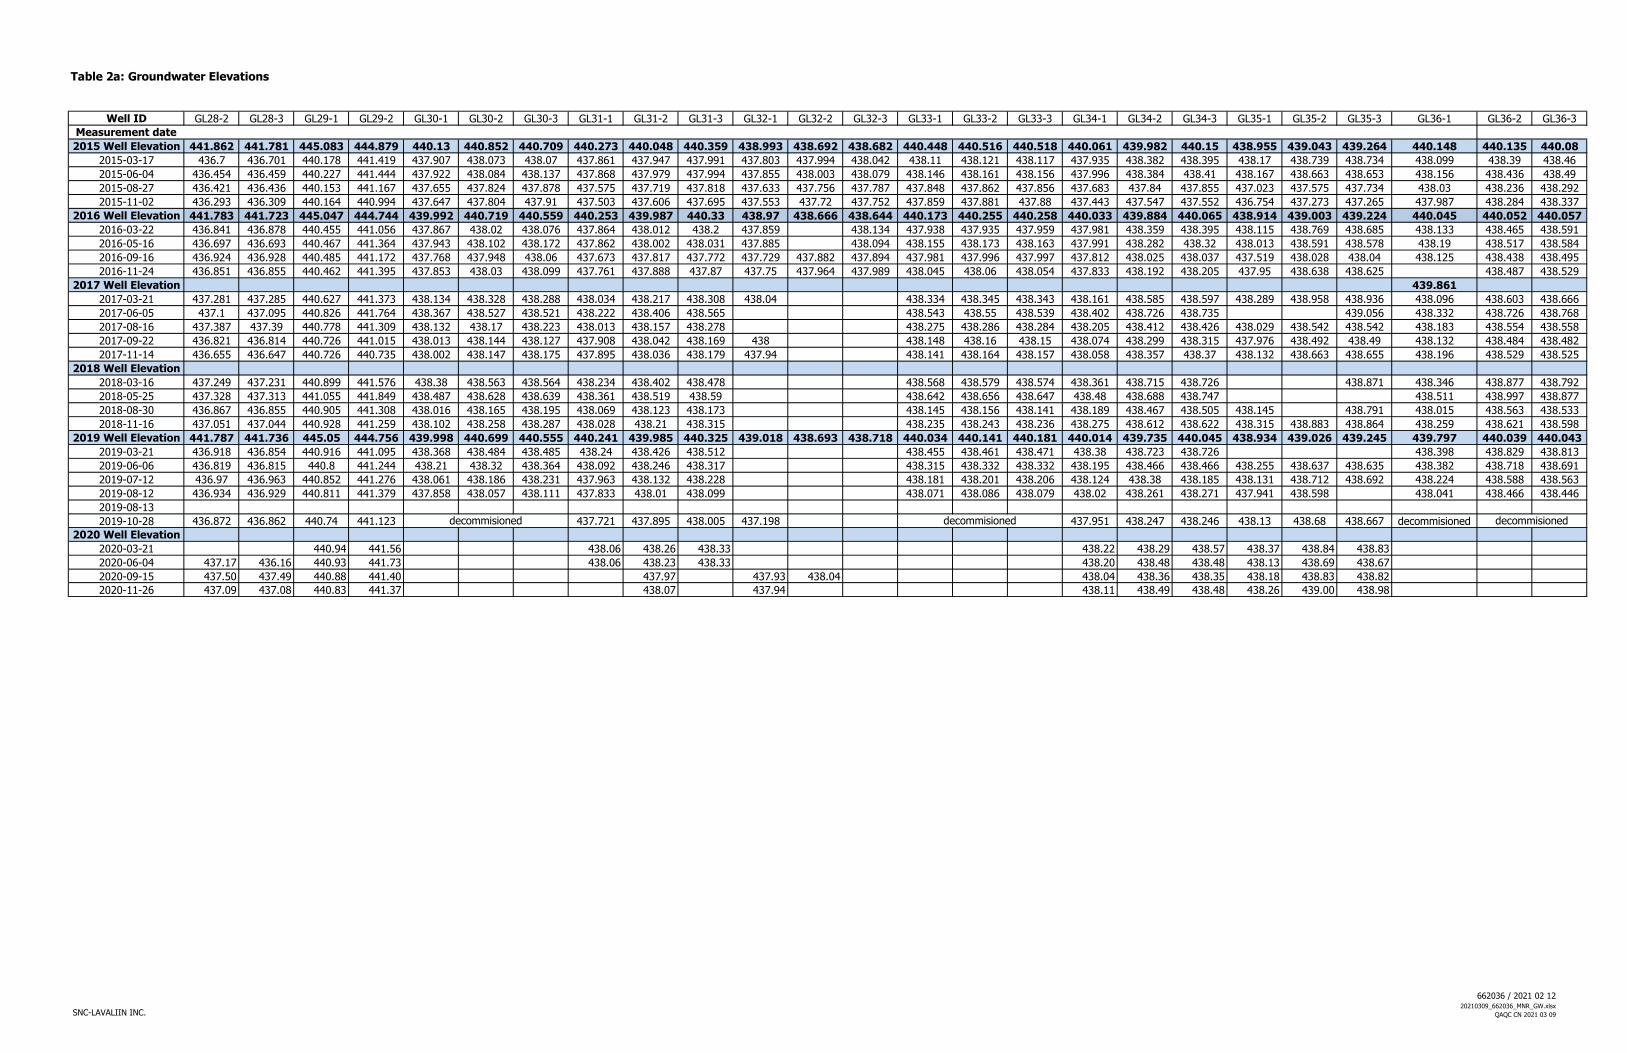
Table 2a: Groundwater Elevations
Well ID GL28-2 GL28-3 GL29-1 GL29-2 GL30-1 GL30-2 GL30-3 GL31-1 GL31-2 GL31-3 GL32-1 GL32-2 GL32-3 GL33-1 GL33-2 GL33-3 GL34-1 GL34-2 GL34-3 GL35-1 GL35-2 GL35-3 GL36-1 GL36-2 GL36-3
Measurement date
2015 Well Elevation 441.862 441.781 445.083 444.879 440.13 440.852 440.709 440.273 440.048 440.359 438.993 438.692 438.682 440.448 440.516 440.518 440.061 439.982 440.15 438.955 439.043 439.264 440.148 440.135 440.08
2015-03-17 436.7 436.701 440.178 441.419 437.907 438.073 438.07 437.861 437.947 437.991 437.803 437.994 438.042 438.11 438.121 438.117 437.935 438.382 438.395 438.17 438.739 438.734 438.099 438.39 438.46
2015-06-04 436.454 436.459 440.227 441.444 437.922 438.084 438.137 437.868 437.979 437.994 437.855 438.003 438.079 438.146 438.161 438.156 437.996 438.384 438.41 438.167 438.663 438.653 438.156 438.436 438.49
2015-08-27 436.421 436.436 440.153 441.167 437.655 437.824 437.878 437.575 437.719 437.818 437.633 437.756 437.787 437.848 437.862 437.856 437.683 437.84 437.855 437.023 437.575 437.734 438.03 438.236 438.292
2015-11-02 436.293 436.309 440.164 440.994 437.647 437.804 437.91 437.503 437.606 437.695 437.553 437.72 437.752 437.859 437.881 437.88 437.443 437.547 437.552 436.754 437.273 437.265 437.987 438.284 438.337
2016 Well Elevation 441.783 441.723 445.047 444.744 439.992 440.719 440.559 440.253 439.987 440.33 438.97 438.666 438.644 440.173 440.255 440.258 440.033 439.884 440.065 438.914 439.003 439.224 440.045 440.052 440.057
2016-03-22 436.841 436.878 440.455 441.056 437.867 438.02 438.076 437.864 438.012 438.2 437.859 438.134 437.938 437.935 437.959 437.981 438.359 438.395 438.115 438.769 438.685 438.133 438.465 438.591
2016-05-16 436.697 436.693 440.467 441.364 437.943 438.102 438.172 437.862 438.002 438.031 437.885 438.094 438.155 438.173 438.163 437.991 438.282 438.32 438.013 438.591 438.578 438.19 438.517 438.584
2016-09-16 436.924 436.928 440.485 441.172 437.768 437.948 438.06 437.673 437.817 437.772 437.729 437.882 437.894 437.981 437.996 437.997 437.812 438.025 438.037 437.519 438.028 438.04 438.125 438.438 438.495
2016-11-24 436.851 436.855 440.462 441.395 437.853 438.03 438.099 437.761 437.888 437.87 437.75 437.964 437.989 438.045 438.06 438.054 437.833 438.192 438.205 437.95 438.638 438.625 438.487 438.529
2017 Well Elevation 439.861
2017-03-21 437.281 437.285 440.627 441.373 438.134 438.328 438.288 438.034 438.217 438.308 438.04 438.334 438.345 438.343 438.161 438.585 438.597 438.289 438.958 438.936 438.096 438.603 438.666
2017-06-05 437.1 437.095 440.826 441.764 438.367 438.527 438.521 438.222 438.406 438.565 438.543 438.55 438.539 438.402 438.726 438.735 439.056 438.332 438.726 438.768
2017-08-16 437.387 437.39 440.778 441.309 438.132 438.17 438.223 438.013 438.157 438.278 438.275 438.286 438.284 438.205 438.412 438.426 438.029 438.542 438.542 438.183 438.554 438.558
2017-09-22 436.821 436.814 440.726 441.015 438.013 438.144 438.127 437.908 438.042 438.169 438 438.148 438.16 438.15 438.074 438.299 438.315 437.976 438.492 438.49 438.132 438.484 438.482
2017-11-14 436.655 436.647 440.726 440.735 438.002 438.147 438.175 437.895 438.036 438.179 437.94 438.141 438.164 438.157 438.058 438.357 438.37 438.132 438.663 438.655 438.196 438.529 438.525
2018 Well Elevation
2018-03-16 437.249 437.231 440.899 441.576 438.38 438.563 438.564 438.234 438.402 438.478 438.568 438.579 438.574 438.361 438.715 438.726 438.871 438.346 438.877 438.792
2018-05-25 437.328 437.313 441.055 441.849 438.487 438.628 438.639 438.361 438.519 438.59 438.642 438.656 438.647 438.48 438.688 438.747 438.511 438.997 438.877
2018-08-30 436.867 436.855 440.905 441.308 438.016 438.165 438.195 438.069 438.123 438.173 438.145 438.156 438.141 438.189 438.467 438.505 438.145 438.791 438.015 438.563 438.533
2018-11-16 437.051 437.044 440.928 441.259 438.102 438.258 438.287 438.028 438.21 438.315 438.235 438.243 438.236 438.275 438.612 438.622 438.315 438.883 438.864 438.259 438.621 438.598
2019 Well Elevation 441.787 441.736 445.05 444.756 439.998 440.699 440.555 440.241 439.985 440.325 439.018 438.693 438.718 440.034 440.141 440.181 440.014 439.735 440.045 438.934 439.026 439.245 439.797 440.039 440.043
2019-03-21 436.918 436.854 440.916 441.095 438.368 438.484 438.485 438.24 438.426 438.512 438.455 438.461 438.471 438.38 438.723 438.726 438.398 438.829 438.813
2019-06-06 436.819 436.815 440.8 441.244 438.21 438.32 438.364 438.092 438.246 438.317 438.315 438.332 438.332 438.195 438.466 438.466 438.255 438.637 438.635 438.382 438.718 438.691
2019-07-12 436.97 436.963 440.852 441.276 438.061 438.186 438.231 437.963 438.132 438.228 438.181 438.201 438.206 438.124 438.38 438.185 438.131 438.712 438.692 438.224 438.588 438.563
2019-08-12 436.934 436.929 440.811 441.379 437.858 438.057 438.111 437.833 438.01 438.099 438.071 438.086 438.079 438.02 438.261 438.271 437.941 438.598 438.041 438.466 438.446
2019-08-13
2019-10-28 436.872 436.862 440.74 441.123 437.721 437.895 438.005 437.198 437.951 438.247 438.246 438.13 438.68 438.667 decommisioned
2020 Well Elevation
2020-03-21 440.94 441.56 438.06 438.26 438.33 438.22 438.29 438.57 438.37 438.84 438.83
2020-06-04 437.17 436.16 440.93 441.73 438.06 438.23 438.33 438.20 438.48 438.48 438.13 438.69 438.67
2020-09-15 437.50 437.49 440.88 441.40 437.97 437.93 438.04 438.04 438.36 438.35 438.18 438.83 438.82
2020-11-26 437.09 437.08 440.83 441.37 438.07 437.94 438.11 438.49 438.48 438.26 439.00 438.98
decommisioned decommisioned decommisioned
SNC-LAVALIIN INC.
662036 / 2021 02 1220210309_662036_MNR_GW.xlsx
QAQC CN 2021 03 09

Table 2a: Groundwater Elevations
Well ID GL37 GL38 GL39-1 GL39-2 GL39-3 GL40-1 GL40-2 GL40-3 GL41-1 GL41-2 GL41-3 GL42-1 GL42-2 GL42-3
Measurement date
2015 Well Elevation 440.248 440.228
2015-03-17 437.888 437.88
2015-06-04 437.864 437.858
2015-08-27 437.527 437.521
2015-11-02 437.568 437.568
2016 Well Elevation 440.144 440.075
2016-03-22 437.859 437.804
2016-05-16 437.882 437.876
2016-09-16 437.7 437.693
2016-11-24 437.745 437.8
2017 Well Elevation
2017-03-21 438.152 438.143
2017-06-05 438.37 438.371
2017-08-16 438.054 438.043
2017-09-22 decommisioned decommisioned
2017-11-14
2018 Well Elevation
2018-03-16
2018-05-25
2018-08-30
2018-11-16
2019 Well Elevation 440.41 440.46 440.56 448.43 448.42 448.47 450.49 450.45 450.44 450.57 450.55 450.57
2019-03-21
2019-06-06
2019-07-12
2019-08-12
2019-08-13
2019-10-28
2020 Well Elevation
2020-03-21 437.09 437.13 437.19 443.50 443.55 448.39 448.33 448.36 440.04 439.79
2020-06-04 437.14 437.23 437.21 443.27 443.29 448.13 448.15 448.16 440.05 439.79
2020-09-15 437.43 437.51 437.63 443.08 443.12 447.76 447.65 447.66 449.37 440.16
2020-11-26 437.13 437.20 437.28 441.58 441.61 447.41 447.36 447.38 440.04 439.82
SNC-LAVALIIN INC.
662036 / 2021 02 1220210309_662036_MNR_GW.xlsx
QAQC CN 2021 03 09

Table 2b: Surface Water Elevations
Well ID BREDIN POND NORTHEAST POND SLOUGH TUTT POND
Measurement date
2015 Elevation 439.211 444.22 439.249 440.72
2015-03-17 438.701 443.53 437.859 438.58
2015-06-04 438.761 443.58 437.839 438.59
2015-06-16 438.721 NM 437.639 438.569
2015-07-29 438.651 NM 437.624 437.58
2015-08-27 438.651 443.15 437.519 NM
2015-09-18 438.651 NM 437.504 436.67
2015-10-21 438.681 NM 437.514 NM
2015-11-02 438.691 443.18 437.559 436.47
2015-12-11 438.701 NM 437.671 437.515
2016 Elevation NM NM NM 440.677
2016-01-21 438.691 NM 437.729 438.237
2016-02-23 438.751 NM 437.869 438.547
2016-03-22 438.781 443.83 437.959 438.447
2016-04-26 438.651 NM 437.959 438.397
2016-05-16 438.691 NM 437.899 438.177
2016-05-20 NM 443.85 NM NM
2016-06-22 438.691 NM 437.859 438.417
2016-07-12 438.691 NM 437.809 438.427
2016-08-19 438.701 NM 437.749 437.927
2016-09-16 438.551 443.28 437.689 437.337
2016-10-18 438.701 NM 437.739 436.987
2016-11-24 438.721 443.18 437.809 438.367
2016-12-16 438.781 NM 437.779 438.427
2017 Elevation NM NM NM 440.689
2017-02-21 438.711 443.66 437.999 438.479
2017-03-21 438.721 446.53 438.149 NM
2017-04-18 438.811 443.48 438.309 438.689
2017-05-08 438.811 443.48 438.359 438.709
2017-06-05 438.901 443.28 438.399 438.839
2017-06-21 438.851 443.16 438.359 438.799
2017-07-17 438.651 443.1 438.219 438.909
2017-08-16 438.581 443.07 438.059 438.009
2017-09-22 438.501 446.03 437.899 438.129
2017-10-26 438.691 446.12 437.859 438.399
2017-11-14 438.711 443.17 437.899 438.659
2017-12-08 438.911 443.31 437.919 438.889
2018 Elevation 439.171 444.216 439.238 440.719
2018-03-16 438.871 443.866 438.419 438.847
2018-04-17 438.991 NM 438.669 438.914
2018-05-25 438.931 NM 438.519 438.529
2018-06-19 438.821 443.686 438.379 438.639
2018-07-13 438.761 442.426 438.248 438.787
2018-08-13 438.741 442.511 437.908 438.369
2018-08-30 438.721 442.326 437.739 438.499
2018-09-17 438.761 442.326 437.568 438.819
2018-10-11 438.821 442.996 437.668 438.879
2018-11-16 438.781 443.016 437.968 438.819
2018-12-12 438.771 443.076 438.118 438.799Notes:
NM - Not Monitored
SNC-LAVALIN INC.
662036 / 2020 01 2020210309_662036_MNR_POND.xlsx
QAQC CN 2021 03 09

Table 2b: Surface Water Elevations
Well ID BREDIN POND NORTHEAST POND SLOUGH TUTT POND
2019 Elevation 439.171 444.216 439.238 440.739
2019-01-04 438.791 443.126 438.193 438.859
2019-03-21 438.761 443.174 438.278 438.819
2019-03-28 438.741 443.236 438.403 438.799
2019-04-08 NM 444.165 439.222 NM
2019-04-09 438.461 443.516 438.436 438.689
2019-05-02 438.671 443.806 438.348 438.649
2019-05-09 438.751 443.546 438.288 438.599
2019-05-29 438.601 442.506 438.198 438.474
2019-06-06 438.661 442.566 438.148 438.599
2019-07-05 438.681 442.646 437.918 438.409
2019-07-12 NM 442.694 437.883 438.266
2019-07-17 438.651 442.709 437.835 438.084
2019-07-26 NM 442.089 437.774 437.932
2019-08-01 NM 442.716 437.718 437.909
2019-08-09 438.321 442.381 437.641 438.19
2019-08-12 438.281 442.394 437.631 438.06
2019-08-21 438.081 442.384 437.549 437.981
2019-08-28 438.071 442.406 437.498 438.124
2019-09-04 NM 442.446 437.468 438.079
2019-09-17 NM 442.546 437.468 438.149
2019-09-27 NM 442.645 437.523 438.209
2019-10-19 NM 442.714 437.593 438.288
2019-10-28 NM 442.836 437.683 438.677
2019-11-08 438.681 442.894 437.666 438.739
2020 Elevations 438.152
2020-01-28 438.791 443.477 438.039 438.781
2020-02-12 438.801 NM 438.108 438.78
2020-03-21 NM 443.786 438.149 NM
2020-04-07 438.751 NM 438.183 NM
2020-05-20 438.791 NM NM NM
2020-06-04 438.741 NM 438.129 NM
2020-07-22 438.731 NM 437.899 NM
2020-08-12 438.841 NM 437.784 NM
2020-09-11 NM NM NM 438.512
2020-09-15 438.691 442.986 437.676 NM
2020-09-23 NM NM NM 438.282
2020-09-28 NM NM NM 438.152
2020-10-07 NM NM NM 438.152
2020-10-15 438.741 442.326 437.659 438.212
2020-11-06 NM NM NM 438.572
2020-11-12 NM NM NM 438.572
2020-11-19 NM NM NM 438.572
2020-11-26 438.701 442.745 437.717 438.572
2020-12-09 NM NM NM 438.572
2020-12-21 438.711 442.946 437.789 438.572Notes:
NM - Not Monitored
SNC-LAVALIN INC.
662036 / 2020 01 2020210309_662036_MNR_POND.xlsx
QAQC CN 2021 03 09

TABLE 3a: Summary of Analytical Results for Groundwater - Inorganics
Physical Parameters Dissolved Inorganics
Sample Sample Sample Date pH To
tal
Ha
rdn
es
s
pH
(fi
eld
)
Co
nd
uc
tiv
ity
Fie
ld C
on
du
cti
vit
y
To
tal
Dis
so
lve
d S
oli
ds
Dis
so
lve
d O
rga
nic
Ca
rbo
n
Am
mo
nia
, T
ota
l (a
s N
)
Nit
rate
(a
s N
)
Nit
rite
(a
s N
)
Ch
lori
de
Flu
ori
de
Su
lfa
te
To
tal
Alk
ali
nit
y
Alk
ali
nit
y,
Bic
arb
on
ate
(a
s C
aC
O3
)
Alk
ali
nit
y,
Ca
rbo
na
te (
as
Ca
CO
3)
Alk
ali
nit
y,
Hy
dro
xid
e (
as
Ca
CO
3)
Alk
ali
nit
y,
Ph
en
olp
hth
ale
in (
as
Ca
CO
3)
Bro
mid
e
Hy
dro
ge
n S
ulf
ide
Su
lfid
e
Ch
em
ica
l O
xy
ge
n D
em
an
d
Ort
ho
-Ph
os
ph
ate
Location ID (yyyy mm dd) pH mg/L pH µS/cm µS/cm mg/L mg/L µg/L µg/L µg/L mg/L µg/L mg/L mg/L mg/L mg/L mg/L mg/L mg/L mg/L mg/L mg/L mg/L
BC Standard
CSR Aquatic Life (AW)b n/a n/a n/a n/a n/a n/a n/a 3,700-18,500e 400,000 800-2,000f 1,500 3,000h 3,090-4,290h n/a n/a n/a n/a n/a n/a 0.02 n/a n/a n/a
CSR Irrigation Watering (IW) n/a n/a n/a n/a n/a n/a n/a n/a n/a n/a 100 1,000 n/a n/a n/a n/a n/a n/a n/a n/a n/a n/a n/a
BCWQG Irrigation Water Long-Term Average (IW)c 5.0 - 9.5 n/a 5.0 - 9.5 700g n/a 500g n/a n/a n/a n/a n/a 1,000 n/a n/a n/a n/a n/a n/a n/a n/a n/a n/a n/a
BCWQG Irrigation Water Short-term Maximum (IW)d 5.0 - 9.5 n/a 5.0 - 9.5 n/a n/a n/a n/a n/a n/a n/a 100 2,000 n/a n/a n/a n/a n/a n/a n/a n/a n/a n/a n/a
Monitoring Wells (screened in sand and gravel) - Upgradient and/or BaselineGL0-3 GL0-3-200310 2020 03 10 7.82 1,000 - - - 1,970 6.19 56 55,800 < 10 139 930 505 491 491 < 1.0 < 1.0 < 1.0 < 1.00 - - 31 < 0.0050
GL1-2 GL1-2-200910 2020 09 10 8.14 814 - - - 1,300 4.98 < 50 < 10 < 10 117 1,430 283 676 676 < 1.0 < 1.0 < 1.0 < 0.10 - - - < 0.0050
GL2-1 GL2-1-200609 2020 06 09 7.90 556 7.36 - 1,202 970 1.54 90 < 1,000 < 1,000 54.0 < 10,000a 410 254 254 < 1.0 < 1.0 < 1.0 < 10.0 - - < 20 < 0.500
GL2-1-200820 2020 08 20 8.10 473 7.46 - 1,435 1,000 1.72 73 - - 63.4 - - 237 237 < 1.0 < 1.0 < 1.0 0.44 - - < 20 < 0.0050
DUPA-200820 Duplicate 8.10 476 7.46 - 1,435 992 2.18 69 - - 63.2 - - 240 240 < 1.0 < 1.0 < 1.0 0.44 - - < 20 < 0.0050
QA/QC RPD% 0 1 * - * 1 * * - - 0 - - 1 1 * * * * - - * *
GL2-1-201019 2020 10 19 8.10 513 7.6 - 1,508 1,030 2.10 131 < 10 < 10 66.4 580 443 216 216 < 1.0 < 1.0 < 1.0 0.50 - - < 20 < 0.0050
GL23-1 GL23-1-200617 2020 06 17 7.97 1,000 6.95 - 2,150 1,530 14.6 < 50 134 < 100 32.3 < 1,000 405 964 964 < 1.0 < 1.0 < 1.0 < 1.00 - - 33 < 0.0500
GL23-1-200910 2020 09 10 7.98 1,130 - - - 1,660 14.8 < 50 28 < 10 33.1 780 402 1,110 1,110 < 1.0 < 1.0 < 1.0 0.32 - - - < 0.0050
GL41-3 GL41-3-200612 2020 06 12 7.40 755 7.26 - 2,133 1,580 6.68 141 1,180 < 100 423 < 1,000 159 575 - - - - < 1.00 - - < 200 < 0.0500
GL41-3-201022 2020 10 22 7.86 696 7.31 - 2,621 1,400 6.93 < 50 1,380 < 10 423 650 160 570 570 < 1.0 < 1.0 < 1.0 < 1.00 - - < 20 < 0.0050
09BH06-D 09BH06-D-200609 2020 06 09 7.95 422 7.3 - 1,038 849 2.26 96 < 10 < 10 8.22 790 327 373 373 < 1.0 < 1.0 < 1.0 < 0.10 - - < 20 < 0.0050
Monitoring Wells (screened in sand and gravel) - Within the Footprint of the Landfill06BH02 09BH03-200609 2020 06 09 7.80 1,270 7.04 - 3,178 3,020 7.88 < 50 1,750 < 10 25.3 950 1,540 776 776 < 1.0 < 1.0 < 1.0 < 0.10 - - 22 < 0.0050
GL2-2 GL2-2-200826 2020 08 26 8.06 405 7.36 - 1,142 751 1.29 < 50 < 100 < 100 37.4 < 1,000 273 305 305 < 1.0 < 1.0 < 1.0 < 1.00 - - < 20 < 0.0500
GL2-2-201020 2020 10 20 7.91 464 7.55 - 1,234 810 1.25 < 50 < 10 < 10 46.7 660 309 283 283 < 1.0 < 1.0 < 1.0 0.29 - - < 20 < 0.0050
GL4-1 GL4-1-200814 2020 08 14 8.18 642 7.95 - 1,846 1,280 2.82 126 < 100 < 100 16.7 1,540 498 563 563 < 1.0 < 1.0 < 1.0 < 1.00 - - < 20 < 0.0500
GL4-1-201016 2020 10 16 8.11 616 7.69 - 1,582 1,260 3.18 116 < 10 < 10 17.7 1,900 501 536 536 < 1.0 < 1.0 < 1.0 < 0.10 - - < 20 < 0.0050
GL6-1 (2011) GL6-1-200611 2020 06 11 7.82 962 7.1 8,440 6,871 5,220 241 194,000 < 100 < 100 652 < 1,000 282 3,980 3,980 < 1.0 < 1.0 < 1.0 4.43 10.7 25.5 621 0.576
GL9-3 GL9-3-200608 2020 06 08 7.80 10,200 7.32 - 36,600 52,600 23.6 < 50 < 5,000 < 5,000a 1,400 < 50,000a 34,500 921 921 < 1.0 < 1.0 < 1.0 < 50.0 - - 79 < 2.50
GL16-1 GL16-1-200608 2020 06 08 7.98 699 7.08 - 3,720 3,020 1.59 256 < 1,000 < 1,000 95.1 < 10,000a 1,270 973 973 < 1.0 < 1.0 < 1.0 < 10.0 - - < 20 < 0.500
GL20-1 GL20-1-200826 2020 08 26 7.73 118 6.99 - 7,514 5,240 122 140,000 < 100 < 100 506 < 1,000 86.3 4,460 4,460 < 1.0 < 1.0 < 1.0 < 1.00 - - 422 2.39
GL20-1-201020 2020 10 20 7.50 565 7 - 8,684 5,230 < 0.50 116,000 < 100 < 100 493 < 1,000 32.6 4,240 4,240 < 1.0 < 1.0 < 1.0 < 1.00 - - 429 2.48
Monitoring Wells (screened in sand and gravel) - DowngradientGL39-2 GL39-2-200609 2020 06 09 7.85 1,910 7.29 - 4,140 4,110 6.23 < 50 1,820 < 1,000 174 < 10,000a 2,400 401 401 < 1.0 < 1.0 < 1.0 < 10.0 - - 26 < 0.500
GL39-2-201016 2020 10 16 7.88 1,240 7.35 - 3,324 2,990 6.14 < 50 1,400 < 10 180 500 1,540 374 374 < 1.0 < 1.0 < 1.0 < 1.00 - - 21 < 0.0050
DUP1-201016 Duplicate 7.90 1,260 7.69 - 1,582 3,090 5.89 < 50 1,440 < 10 181 < 2,500a 1,570 397 397 < 1.0 < 1.0 < 1.0 < 1.00 - - 23 < 0.0050
QA/QC RPD% 0 2 * - * 3 4 * 3 * 1 * 2 6 6 * * * * - - * *
GL28-3 GL28-3-200610 2020 06 10 7.67 2,890 6.92 - 630.3 7,680 9.25 < 50 5,160 < 100 56.6 < 1,000 4,550 864 864 < 1.0 < 1.0 < 1.0 < 1.00 - - 26 < 0.0500
GL28-3-201105 2020 11 05 7.75 2,870 6.96 - 277.6 7,810 9.33 < 50 5,150 18 49.4 280 4,500 839 839 < 1.0 < 1.0 < 1.0 < 10.0 - - < 20 < 0.0050
Monitoring Wells (screened in till) - Upgradient and/or BaselineGL0-1 GL0-1-200310 2020 03 10 7.94 405 - - - 705 1.01 284 49 < 10 6.82 860 316 189 189 < 1.0 < 1.0 < 1.0 < 0.10 - - < 20 0.0175
GL0-2 GL0-2-200310 2020 03 10 7.95 456 - - - 721 1.18 317 < 10 < 10 7.88 1,150 303 255 255 < 1.0 < 1.0 < 1.0 < 0.10 - - < 20 0.0134
GL1-1 GL1-1-200910 2020 09 10 8.12 746 - - - 1,200 3.45 52 < 10 < 10 131 1,570 284 646 646 < 1.0 < 1.0 < 1.0 < 0.10 - - - < 0.0050
GL24-1 GL24-1-200910 2020 09 10 8.04 856 - - - 1,750 6.56 < 50 1,690 < 10 123 1,390 418 930 930 < 1.0 < 1.0 < 1.0 0.30 - - - < 0.0050
GL15-2 GL15-2-201104 2020 11 04 7.69 6,230 6.94 - 10,680 11,900 19.0 < 50 1,690 < 10 360 1,020 7,190 794 794 < 1.0 < 1.0 < 1.0 < 10.0 - - 33 < 0.0050
DUP2-201104 Duplicate 7.67 6,360 - - - 11,200 19.5 < 50 1,790 < 10 367 970 7,160 797 797 < 1.0 < 1.0 < 1.0 < 10.0 - - 32 < 0.0050
QA/QC RPD% 0 2 - - - 6 3 * 6 * 2 5 0 0 0 * * * * - - * *
GL41-2 GL41-2-200612 2020 06 12 7.44 726 7.24 - 2,073 1,390 6.13 < 50 1,500 < 100 387 < 1,000 166 563 - - - - < 1.00 - - < 20 < 0.0500
DUPD-200612 Duplicate 7.50 743 7.24 - 2,073 1,370 6.38 < 50 1,460 < 100 404 < 1,000 164 559 - - - - < 1.00 - - < 20 < 0.0500
QA/QC RPD% 1 2 * - * 1 4 * 3 * 4 * 1 1 - - - - * - - * *
GL41-2-201022 2020 10 22 7.83 684 7.31 - 2,562 1,410 6.58 < 50 1,960 < 10 402 640 175 559 559 < 1.0 < 1.0 < 1.0 < 1.00 - - < 20 < 0.0050
Monitoring Wells (screened in till) - Within the Footprint of the LandfillGL4-2 GL4-2-200814 2020 08 14 8.04 846 7.71 - 2,259 1,610 5.89 < 50 < 100 < 100 61.7 2,040 480 845 845 < 1.0 < 1.0 < 1.0 < 1.00 - - < 20 < 0.0500
GL4-2-201030 2020 10 30 8.01 765 7.46 - 2,207 1,460 4.41 < 50 < 10 < 10 49.4 2,520 473 812 812 < 1.0 < 1.0 < 1.0 0.27 - - < 20 < 0.0050
GL5-2 GL5-2-200611 2020 06 11 7.83 501 7.21 - 1,529 1,120 2.31 < 50 310 < 100 179 < 1,000 243 522 522 < 1.0 < 1.0 < 1.0 < 1.00 - - 48 < 0.0500
GL12-1 GL12-1-200610 2020 06 10 7.39 4,490 6.78 - 6,947 8,040 203 4,260 < 100 < 100 610 1,200 3,880 997 997 < 1.0 < 1.0 < 1.0 < 1.00 - - 544 < 0.0500
GL12-1-201102 2020 11 02 7.51 4,720 6.64 - 8,081 8,040 179 7,300 < 1,000 < 10 603 1,400 3,820 948 948 < 1.0 < 1.0 < 1.0 0.84 - - 566 < 0.0050
GL27-3 GL27-3-200608 2020 06 08 7.88 5,540 7.3 - 15,172 18,200 6.30 806 6,600 < 5,000a 442 < 50,000a 10,400 586 586 < 1.0 < 1.0 < 1.0 < 50.0 - - 21 < 2.50
GL29-1 GL29-1-200612 2020 06 12 7.04 421 7.01 - 1,380 1,110 6.25 199 < 100 < 100 21.8 < 1,000 185 758 - - - - < 1.00 - - 31 < 0.0500
GL29-1-201120 2020 11 20 7.84 442 7.07 - 1,723 1,050 3.16 230 < 10 < 10 22.9 1,290 172 814 814 < 1.0 < 1.0 < 1.0 < 0.10 - - < 20 < 0.0050
GL35-3 GL35-3-200608 2020 06 08 7.73 2,180 6.73 - 7,916 7,520 3.66 1,490 < 1,000 < 1,000 325 1,410 3,410 1,920 1,920 < 1.0 < 1.0 < 1.0 < 10.0 - - < 20 < 0.500
DUPA-200608 Duplicate 7.73 2,080 6.73 - 7,916 7,520 4.14 1,470 < 100 < 100 365 1,130 3,280 1,910 1,910 < 1.0 < 1.0 < 1.0 1.78 - - < 20 < 0.0500
QA/QC RPD% 0 5 * - * 0 12 1 * * 12 22 4 1 1 * * * * - - * *
Monitoring Wells (screened in till) - DowngradientGL39-1 GL39-1-200609 2020 06 09 7.81 2,120 7.02 - 3,724 3,710 6.40 56 4,470 < 1,000 102 < 10,000a 2,110 598 598 < 1.0 < 1.0 < 1.0 < 10.0 - - 22 < 0.500
GL39-1-201019 2020 10 19 7.85 1,970 7.03 - 4,547 4,140 8.10 < 50 5,840 < 10 134 1,230 2,120 574 574 < 1.0 < 1.0 < 1.0 < 0.10 - - 29 < 0.0050
GL40-3 GL40-3-201117 2020 11 17 8.09 311 7.31 - 4,621 3,000 66.4 11,400 < 100 < 100 201 < 1,000 375 2,190 2,190 < 1.0 < 1.0 < 1.0 < 1.00 - - 2,430 < 0.0500
GL42-1 GL42-1-200612 2020 06 12 7.12 184 7.28 - 2,332 2,360 2.39 703 < 100 < 100 36.7 < 1,000 20.8 2,050 - - - - < 1.00 - - 330 0.0580
GL42-1-201106 2020 11 06 7.80 171 7.27 - 5,266 3,620 2.95 743 < 10 < 10 47.6 560 1.3 3,030 3,030 < 1.0 < 1.0 < 1.0 0.34 - - 35 < 0.0050
GL42-2 GL42-2-200616 2020 06 16 8.08 855 7.45 - 4,649 3,910 6.51 461 1,760 232 64.3 < 1,000 2,050 928 928 < 1.0 < 1.0 < 1.0 < 1.00 - - 519 < 0.0500
GL42-2-201109 2020 11 09 7.76 1,270 7.34 - 5,360 4,220 7.70 83 883 153 63.6 590 2,250 918 918 < 1.0 < 1.0 < 1.0 < 10.0 - - 89 < 0.0050
GL28-1 GL28-1-200610 2020 06 10 7.71 1,770 7.15 - 3,321 3,300 4.43 120 < 100 < 100 37.8 < 1,000 2,080 554 554 < 1.0 < 1.0 < 1.0 < 1.00 - - < 20 < 0.0500
DUPB-200610 Duplicate 7.75 1,630 7.15 - 3,321 3,680 3.83 124 < 100 < 100 38.1 < 1,000 2,140 544 544 < 1.0 < 1.0 < 1.0 < 1.00 - - < 20 < 0.0500
QA/QC RPD% 1 8 * - * 11 15 * * * 1 * 3 2 2 * * * * - - * *
GL28-1-201104 2020 11 04 7.82 1,850 7.14 - 4,082 3,840 6.24 128 < 1,000 < 10 46.9 1,020 2,240 516 516 < 1.0 < 1.0 < 1.0 < 10.0 - - < 20 < 0.0050
DUP3-201104 Duplicate 7.80 1,850 - - - 3,450 6.09 127 < 1,000 < 10 46.3 1,000 2,190 515 515 < 1.0 < 1.0 < 1.0 < 10.0 - - < 20 < 0.0050
QA/QC RPD% 0 0 - - - 11 2 * * * 1 2 2 0 0 * * * * - - * *
GL28-2 GL28-2-200610 2020 06 10 7.66 1,730 6.95 - 3,882 4,250 4.99 < 50 9,190 < 100 32.0 < 1,000 2,490 587 587 < 1.0 < 1.0 < 1.0 < 1.00 - - < 20 < 0.0500
GL28-2-201104 2020 11 04 7.70 2,200 6.9 - 5,499 4,790 6.26 < 50 9,400 < 10 42.9 130 3,020 677 677 < 1.0 < 1.0 < 1.0 < 0.10 - - < 20 < 0.0050
Monitoring Wells (screened in bedrock) - Upgradient and/or BaselineGL15-1 GL15-1-201104 2020 11 04 7.80 1,530 7.18 - 3,904 3,210 10.8 51 2,440 < 10 241 860 1,200 644 644 < 1.0 < 1.0 < 1.0 < 1.00 - - 32 < 0.0050
GL41-1 GL41-1-200616 2020 06 16 8.03 661 7.43 - 2,257 1,400 6.70 54 1,060 < 100 399 < 1,000 185 497 497 < 1.0 < 1.0 < 1.0 < 1.00 - - 28 < 0.0500
GL41-1-201102 2020 11 02 8.03 735 7.56 - 248 1,530 5.81 < 50 1,570 < 10 371 720 138 592 592 < 1.0 < 1.0 < 1.0 < 0.10 - - 23 0.0142
Monitoring Wells (screened in bedrock) - Within the Footprint of the Landfill
GL9-1 GL9-1-200611 2020 06 11 7.90 584 7.06 - 2,032 1,470 1.77 255 < 100 < 100 109 < 1,000 267 1,060 1,060 < 1.0 < 1.0 < 1.0 < 1.00 - - < 20 < 0.0500
DUPC-200611 Duplicate 7.86 570 - - - 1,450 1.26 255 < 100 < 100 113 < 1,000 276 1,050 1,050 < 1.0 < 1.0 < 1.0 < 1.00 - - < 20 < 0.0500
QA/QC RPD% 1 2 - - - 1 * 0 * * 4 * 3 1 1 * * * * - - * *
GL17-1 GL17-1-200608 2020 06 08 8.20 121 7.35 - 2,138 1,590 2.32 349 < 10 < 10 62.6 1,820 3.9 1,400 1,400 < 1.0 < 1.0 < 1.0 < 1.00 - - < 20 0.0500
GL17-1-201020 2020 10 20 8.01 132 7.43 - 2,457 1,530 2.22 402 < 10 < 10 69.6 1,990 4.4 1,300 1,300 < 1.0 < 1.0 < 1.0 0.33 - - < 20 0.0103
GL27-1 GL27-1-200608 2020 06 08 8.31 93.2 7.5 - 2,216 1,530 2.12 230 < 10 < 10 35.5 3,060 17.0 1,500 1,480 22.6 < 1.0 11.3 < 0.10 - - < 20 < 0.0050
GL27-1-201022 2020 10 22 8.10 85.2 7.63 - 2,525 1,600 2.79 243 < 10 < 10 37.7 3,330 7.8 1,420 1,420 < 1.0 < 1.0 < 1.0 < 0.10 - - < 20 0.0567
Associated Caro file(s): 0030839, 0060827, 0060994, 0061179, 0061343, 0061444, 0061688, 0061843, 0081411, 0082156, 0082778, 0091179, 20J1574, 20J1805, 20J1862, 20J2273, 20J3219, 20K0127, 20K0624, 20K0764, 20K0824, 20K0932, 20K1802, 20K2368.
All terms defined within the body of SNC-Lavalin's report.
< Denotes concentration less than indicated detection limit or RPD less than indicated value.a Laboratory detection limit exceeds regulatory standard/guideline.
- Denotes analysis not conducted.b Standard to protect freshwater aquatic life.
n/a Denotes no applicable standard/guideline.c Guideline to protect irrigation watering, long-term average (i.e. "chronic") (guidelines apply to total metals concentrations).
QA/QC RPD Denotes quality assurance/quality control relative percent differenced Guideline to protect irrigation watering, short-term maximum (i.e. "acute") (guidelines apply to total metals concentrations).
* RPDs are not calculated where one or more concentrations are less than five times RDL.e Standard varies with pH.
RDL Denotes reported detection limit.f Standard varies with Chloride.g Guideline is crop dependent.
BOLD Concentration greater than CSR Aquatic Life (AW) standardh Standard varies with hardness.
SHADED Concentration greater than CSR Irrigation Watering (IW) standard
RED Concentration greater than BCWQG Irrigation Water Long-Term Average (IW) guideline
RED Concentration greater than BCWQG Irrigation Water Short-term Maximum (IW) guideline
SNC-LAVALIN INC. Page 1 of 1
662036 / 2021 02 0820210309_662036_TAB.xlsx
QAQC CN 2021 03 09

TABLE 3b: Summary of Analytical Results for Groundwater - Dissolved Metals
Physical Parameters Dissolved Metals
Sample Sample Sample Date pH To
tal H
ard
ness
pH
(fi
eld
)
Dis
so
lved
Alu
min
um
Dis
so
lved
Calc
ium
Dis
so
lved
Iro
n
Dis
so
lved
Mag
nesiu
m
Dis
so
lved
Man
gan
ese
Dis
so
lved
Po
tassiu
m
Dis
so
lved
So
diu
m
An
tim
on
y
Ars
en
ic
Bari
um
Bery
lliu
m
Bo
ron
Cad
miu
m
Ch
rom
ium
Co
balt
Co
pp
er
Lead
Lit
hiu
m
Merc
ury
Mo
lyb
den
um
Nic
kel
Sele
niu
m
Sil
ver
Th
alliu
m
Tin
Tit
an
ium
Ura
niu
m
Van
ad
ium
Zin
c
Location ID (yyyy mm dd) pH mg/L pH µg/L mg/L µg/L mg/L µg/L mg/L mg/L µg/L µg/L µg/L µg/L µg/L µg/L µg/L µg/L µg/L µg/L µg/L µg/L µg/L µg/L µg/L µg/L µg/L µg/L µg/L µg/L µg/L µg/LBC Guideline
CSR Aquatic Life (AW)b n/a n/a n/a n/a n/a n/a n/a n/a n/a n/a 90 50 10,000 1.5 12,000 1.5 - 4e
10f 40 40 - 90
e50 - 150
e n/a 0.25 10,000 650 - 1,500e 20 0.5 - 15
e 3 n/a 1,000 85 n/a 75 - 2,400e
CSR Irrigation Watering (IW) n/a n/a n/a 5,000 n/a 5,000g n/a 200g n/a n/a n/a 100 n/a 100 500 5 5f 50 200 200 2,500 1 10 200 20 n/a n/a n/a n/a 10 100 1,000 - 5,000j
BCWQG Irrigation Water Long-Term Average (IW)c 5.0 - 9.5 n/a 5.0 - 9.5 n/a n/a n/a n/a 200 n/a n/a n/a n/a n/a 100 500h n/a 4.9f 50 n/a n/a 750h n/a 10i 200 n/a n/a n/a n/a n/a 10 100 1,000 - 5,000j
BCWQG Irrigation Water Short-term Maximum (IW) 5.0 - 9.5 n/a 5.0 - 9.5 5,000 n/a n/a n/a n/a n/a n/a n/a 100 n/a n/a n/a 5.1 n/a n/a 200 200i n/a 2 50
i n/a 10 n/a n/a n/a n/a n/a n/a n/a
Monitoring Wells (screened in sand and gravel) - Upgradient and/or Baseline
GL0-3 GL0-3-200310 2020 03 10 7.82 1,000 - < 5.0 154 64 150 1.85 11.9 230 < 0.20 < 0.50 28.3 0.17 37.7 0.046 1.12 0.49 2.43 < 0.20 50.1 < 0.010 14.4 2.60 6.33 < 0.050 < 0.020 < 0.20 < 5.0 178 < 1.0 9.3
GL1-2 GL1-2-200910 2020 09 10 8.14 814 - 2.2 68.1 < 2.0 156 3.48 10.8 157 0.087 0.752 49.8 < 0.010 39.2 0.0328 0.13 0.143 1.24 < 0.050 40.0 - 23.5 1.24 0.26 < 0.010 < 0.0040 < 0.050 0.26 59.8 2.34 < 1.0
GL2-1 GL2-1-200609 2020 06 09 7.90 556 7.36 < 1.0 124 1,220 60 157 4.45 122 < 0.050 2.46 92.7 < 0.010 12.3 0.0075 < 0.10 0.0524 0.23 < 0.050 14.1 < 0.010 14.3 0.127 < 0.10 < 0.010 < 0.0040 < 0.050 < 0.20 5.07 < 0.20 < 1.0
GL2-1-200820 2020 08 20 8.10 473 7.46 1.6 106 1,210 50.8 129 3.92 98.7 < 0.050 2.82 88.1 < 0.010 11.7 0.0068 0.15 0.0583 < 0.10 < 0.050 12.8 < 0.010 13.8 0.077 < 0.10 < 0.010 < 0.0040 < 0.050 < 0.20 4.13 < 0.20 < 1.0
DUPA-200820 Duplicate 8.10 476 7.46 3.0 107 1,200 51 130 3.98 99.4 < 0.050 2.81 87.3 < 0.010 11.4 0.0057 0.12 0.0449 < 0.10 < 0.050 12.9 < 0.010 13.7 0.079 < 0.10 < 0.010 < 0.0040 0.113 < 0.20 4.13 < 0.20 < 1.0
QA/QC RPD% 0 1 * * 1 1 0 1 2 1 * 0 1 * 3 * * 26 * * 1 * 1 * * * * * * 0 * *
GL2-1-201019 2020 10 19 8.10 513 7.6 < 1.0 125 1,490 48.8 129 4.18 101 < 0.050 3.25 76.5 < 0.010 6.3 < 0.0020 < 0.10 0.0526 < 0.10 < 0.050 11.2 < 0.010 14.9 0.087 < 0.10 < 0.010 < 0.0040 < 0.050 < 0.20 4.03 < 0.20 < 1.0
GL23-1 GL23-1-200617 2020 06 17 7.97 1,000 6.95 < 1.0 85.7 < 2.0 192 316 13.7 178 < 0.050 0.581 64.8 < 0.010 30.4 0.0823 0.11 0.746 1.97 < 0.050 36.7 < 0.010 15.0 10.4 0.34 < 0.010 0.0073 < 0.050 < 0.20 68.9 0.97 1.2
GL23-1-200910 2020 09 10 7.98 1,130 - 1.2 101 < 2.0 213 870 14.9 189 < 0.050 0.561 69.6 < 0.010 29.5 0.321 0.15 0.690 3.02 < 0.050 41.7 - 17.0 13.3 0.26 < 0.010 0.0139 < 0.050 < 0.20 74.7 0.79 2.2
GL41-3 GL41-3-200612 2020 06 12 7.40 755 7.26 < 1.0 69.3 2.2 141 7.31 17.2 290 0.080 1.07 104 < 0.010 24.2 0.0240 2.09 0.0981 1.37 < 0.050 47.5 < 0.010 8.33 0.925 0.53 < 0.010 0.0242 < 0.050 < 0.20 27.7 1.82 < 1.0
GL41-3-201022 2020 10 22 7.86 696 7.31 2.1 70.9 4.7 126 5.82 17.1 273 0.075 1.14 91.5 < 0.010 27.7 0.0231 2.02 0.0589 2.26 < 0.050 41.3 < 0.010 8.25 0.910 0.35 < 0.010 0.0135 < 0.050 < 0.20 26.9 2.14 4.9
09BH06-D 09BH06-D-200609 2020 06 09 7.95 422 7.3 < 1.0 70.1 459 60 199 4.73 156 < 0.050 2.85 48.2 < 0.010 15.0 0.0048 < 0.10 0.190 < 0.10 < 0.050 59.9 < 0.010 18.0 0.377 < 0.10 < 0.010 0.0045 < 0.050 < 0.20 10.2 < 0.20 < 1.0
Monitoring Wells (screened in sand and gravel) - Within the Footprint of the Landfill
06BH02 09BH03-200609 2020 06 09 7.80 1,270 7.04 1.2 184 < 2.0 197 0.089 7.9 92.3 0.064 0.500 24.1 < 0.010 13.3 0.0278 34.1 0.145 1.96 < 0.050 31.0 < 0.010 26.3 1.26 52.4 < 0.010 < 0.0040 < 0.050 < 0.20 207 1.91 1.1
GL2-2 GL2-2-200826 2020 08 26 8.06 405 7.36 16.9 81.7 42.9 48.8 128 3.59 74.7 < 0.050 1.17 90.3 < 0.010 9.4 0.0666 0.18 0.0636 0.38 < 0.050 9.73 < 0.010 9.21 0.396 < 0.10 < 0.010 < 0.0040 0.062 1.15 4.38 0.61 < 1.0
GL2-2-201020 2020 10 20 7.91 464 7.55 < 1.0 108 23.7 47.2 98.6 3.96 74.5 < 0.050 1.21 109 < 0.010 6.6 0.0744 0.27 0.232 0.27 < 0.050 10.2 < 0.010 10.4 0.268 < 0.10 < 0.010 < 0.0040 < 0.050 < 0.20 4.14 < 0.20 1.8
GL4-1 GL4-1-200814 2020 08 14 8.18 642 7.95 < 1.0 54.1 786 123 85.7 7.03 207 < 0.050 2.90 16.5 < 0.010 17.7 0.0079 0.66 0.0329 < 0.10 < 0.050 40.2 < 0.010 35.6 0.387 < 0.10 < 0.010 < 0.0040 < 0.050 < 0.20 45.9 < 0.20 < 1.0
GL4-1-201016 2020 10 16 8.11 616 7.69 1.9 51.8 732 118 81.0 6.73 198 < 0.050 2.58 16.0 < 0.010 15.8 0.0244 < 0.10 0.0360 0.11 < 0.050 37.8 < 0.010 33.6 0.356 < 0.10 < 0.010 < 0.0040 0.116 < 0.20 44.0 < 0.20 1.2
GL6-1 (2011) GL6-1-200611 2020 06 11 7.82 962 7.1 79.8 151 191 142 295 382 1,200 1.70 6.48 367 0.025 2,180 0.0081 18.1 22.2 0.88 0.151 28.1 < 0.010 1.31 23.7 0.86 < 0.010 < 0.0040 4.82 15.7 1.95 3.61 1.8
GL9-3 GL9-3-200608 2020 06 08 7.80 10,200 7.32 159 430 19.3 2,230 217 238 12,900 0.150 1.19 15.8 0.021 11.2 0.145 1.31 1.07 3.44 < 0.050 135 < 0.010 110 6.26 1.94 0.016 0.409 < 0.050 0.83 1,780 1.05 1.5
GL16-1 GL16-1-200608 2020 06 08 7.98 699 7.08 3.6 95.1 424 112 335 19.9 832 0.062 18.4 13.6 0.011 65.3 0.0570 0.60 0.567 0.93 0.200 249 < 0.010 16.7 1.05 < 0.10 < 0.010 0.0192 < 0.050 < 0.20 6.69 < 0.20 1.7
GL20-1 GL20-1-200826 2020 08 26 7.73 118 6.99 19.6 5.1 897 25.6 54.1 40.5 404 0.198 3.46 58.9 0.099 24.3 0.0021 5.18 3.82 < 0.10 0.359 0.614 < 0.010 1.01 8.64 < 0.10 < 0.010 0.170 0.865 12.5 0.0021 2.43 < 1.0
GL20-1-201020 2020 10 20 7.50 565 7 66.5 88.1 8,910 83.7 247 173 1,540 0.678 12.2 280 0.023 1,760 0.0205 25.0 18.7 0.36 0.051 65.4 < 0.010 3.93 32.7 0.27 < 0.010 < 0.0040 3.94 88.8 2.55 22.3 1.2
Monitoring Wells (screened in sand and gravel) - Downgradient
GL39-2 GL39-2-200609 2020 06 09 7.85 1,910 7.29 4.5 188 8.8 349 6.72 9.71 1.27 0.059 0.419 12.3 < 0.010 9.7 0.0480 7.30 0.137 1.74 < 0.050 23.6 < 0.010 23.2 1.33 4.73 < 0.010 0.0111 < 0.050 0.31 120 0.79 < 1.0
GL39-2-201016 2020 10 16 7.88 1,240 7.35 1.6 117 < 2.0 230 4.88 7.93 531 0.082 0.422 12.9 < 0.010 10.9 0.0236 3.31 0.109 1.63 < 0.050 22.2 < 0.010 26.8 1.02 5.17 < 0.010 0.0089 0.132 < 0.20 89.8 0.61 < 1.0
DUP1-201016 Duplicate 7.90 1,260 7.69 1.6 121 < 2.0 233 4.86 7.9 545 0.085 0.421 12.8 < 0.010 10.3 0.0213 3.29 0.105 1.48 < 0.050 22.0 < 0.010 26.9 1.02 5.22 < 0.010 0.0084 0.217 < 0.20 91.1 0.60 < 1.0
QA/QC RPD% 0 2 * * 3 * 1 0 0 3 * 0 1 * 6 10 1 4 10 * 1 * 0 0 1 * * * * 1 * *GL28-3 GL28-3-200610 2020 06 10 7.67 2,890 6.92 < 1.0 395 < 2.0 462 130 12.7 1,190 0.110 0.893 19.9 0.012 6.0 0.180 0.35 0.356 1.45 < 0.050 40.5 < 0.010 13.1 8.14 0.23 < 0.010 0.0300 < 0.050 0.22 273 1.68 1.8
GL28-3-201105 2020 11 05 7.75 2,870 6.96 < 1.0 408 4.2 448 281 12.3 1,170 0.142 0.815 19.2 < 0.010 5.0 0.227 0.28 0.484 1.69 < 0.050 46.5 < 0.010 16.5 11.6 0.17 < 0.010 0.0416 0.087 0.34 269 2.02 3.0
Monitoring Wells (screened in till) - Upgradient and/or Baseline
GL0-2 GL0-2-200310 2020 03 10 7.95 456 - < 5.0 73.1 113 66.4 179 10.4 58.3 < 0.20 3.78 51.5 < 0.10 56.8 0.021 < 0.50 0.24 < 0.10 < 0.20 32.0 < 0.010 25.8 1.03 < 0.50 < 0.050 < 0.020 < 0.20 < 5.0 3.01 < 1.0 < 4.0
GL0-1 GL0-1-200310 2020 03 10 7.94 405 - < 5.0 58.4 13 62.9 25.7 9.93 65.6 < 0.20 3.44 39.9 < 0.10 58.4 0.019 < 0.50 < 0.10 0.12 < 0.20 15.6 < 0.010 29.9 0.41 < 0.50 < 0.050 < 0.020 < 0.20 < 5.0 4.80 < 1.0 < 4.0
GL1-1 GL1-1-200910 2020 09 10 8.12 746 - 2.4 63.4 3.4 143 29.4 9.46 153 0.095 0.624 43.0 < 0.010 45.8 0.123 0.19 0.156 1.28 0.078 39.7 - 29.6 1.85 0.41 < 0.010 0.0073 < 0.050 0.20 54.6 0.21 2.9
GL24-1 GL24-1-200910 2020 09 10 8.04 856 - < 1.0 64.6 < 2.0 169 24.7 9.03 226 0.148 1.18 35.2 < 0.010 77.2 0.105 0.35 0.555 1.85 < 0.050 31.6 - 23.6 4.64 2.35 < 0.010 0.0154 0.053 0.88 101 0.84 1.1
GL15-2 GL15-2-201104 2020 11 04 7.69 6,230 6.94 1.1 538 < 2.0 1,190 0.088 20.3 1,630 0.103 0.950 20.8 < 0.010 9.8 0.0432 22.4 0.297 4.75 < 0.050 64.9 < 0.010 21.3 2.80 82.1 < 0.010 0.0104 < 0.050 < 0.20 549 2.84 < 1.0
DUP2-201104 Duplicate 7.67 6,360 - 1.0 542 < 2.0 1,220 0.091 20.6 1,660 0.107 0.948 21.4 < 0.010 9.5 0.0446 22.6 0.296 4.78 < 0.050 64.5 < 0.010 21.0 2.80 79.3 < 0.010 0.0101 < 0.050 < 0.20 545 2.80 < 1.0
QA/QC RPD% 0 2 - * 1 * 2 * 1 2 * 0 3 * * 3 1 0 1 * 1 * 1 0 3 * * * * 1 1 *GL41-2 GL41-2-200612 2020 06 12 7.44 726 7.24 < 1.0 71.1 < 2.0 133 0.111 16 279 0.073 1.05 87.9 < 0.010 25.2 0.0102 2.26 0.0429 1.13 < 0.050 45.2 < 0.010 7.49 0.479 0.49 0.010 0.0064 < 0.050 < 0.20 26.3 2.29 < 1.0
DUPD-200612 Duplicate 7.50 743 7.24 < 1.0 71.4 < 2.0 137 0.085 16.3 284 0.074 1.06 87.8 < 0.010 25.2 0.0119 2.26 0.0404 1.13 < 0.050 45.3 < 0.010 7.45 0.454 0.51 < 0.010 0.0065 < 0.050 < 0.20 26.1 2.32 < 1.0
QA/QC RPD% 1 2 * * 0 * 3 * 2 2 * 1 0 * 0 15 0 6 0 * 0 * 1 5 * * * * * 1 1 *
GL41-2-201022 2020 10 22 7.83 684 7.31 < 1.0 72.6 < 2.0 122 0.070 15.1 256 0.072 1.05 85.2 0.011 29.7 0.0149 2.44 0.0438 1.24 < 0.050 41.7 < 0.010 7.10 0.516 0.49 0.011 < 0.0040 < 0.050 < 0.20 25.8 2.54 < 1.0
Associated CARO file(s): 0030839, 0060827, 0060994, 0061179, 0061343, 0061444, 0061688, 0061843, 0081411, 0082156, 0082778, 0091179, 20J1574, 20J1805, 20J1862, 20J2273, 20J3219, 20K0127, 20K0624, 20K0764, 20K0824, 20K0932, 20K1802, 20K2368.
All terms defined within the body of SNC-Lavalin's report.
< Denotes concentration less than indicated detection limit or RPD less than indicated value.a Laboratory detection limit exceeds regulatory standard/guideline.
- Denotes analysis not conducted.b Standard to protect freshwater aquatic life.
n/a Denotes no applicable standard/guideline.c Guideline to protect irrigation watering, long-term average (i.e. "chronic") (guidelines apply to total metals concentrations).
QA/QC RPD Denotes quality assurance/quality control relative percent differenced Guideline to protect irrigation watering, short-term maximum (i.e. "acute") (guidelines apply to total metals concentrations).
* RPDs are not calculated where one or more concentrations are less than five times RDL.e Standard varies with hardness.
RDL Denotes reported detection limit.f Individual standards exist for Cr +3 and Cr +6. Reported value represents more stringent standard.g Only applies for specific Schedule 2 Site Activities; verify for your site.
BOLD Concentration greater than CSR Aquatic Life (AW) standardh Guideline is crop dependent.
SHADED Concentration greater than CSR Irrigation Watering (IW) standardi Guideline is soil dependent.
RED Concentration greater than BCWQG Irrigation Water Long-Term Average (IW) guidelinej Guideline is pH dependent.
RED Concentration greater than BCWQG Irrigation Water Short-term Maximum (IW) guideline
SNC-LAVALIN INC. Page 1 of 2
662036 / 2021 02 0820210309_662036_TAB.xlsx
QAQC CN 2021 03 09

TABLE 3b: Summary of Analytical Results for Groundwater - Dissolved Metals
Physical Parameters Dissolved Metals
Sample Sample Sample Date pH To
tal H
ard
ness
pH
(fi
eld
)
Dis
so
lved
Alu
min
um
Dis
so
lved
Calc
ium
Dis
so
lved
Iro
n
Dis
so
lved
Mag
nesiu
m
Dis
so
lved
Man
gan
ese
Dis
so
lved
Po
tassiu
m
Dis
so
lved
So
diu
m
An
tim
on
y
Ars
en
ic
Bari
um
Bery
lliu
m
Bo
ron
Cad
miu
m
Ch
rom
ium
Co
balt
Co
pp
er
Lead
Lit
hiu
m
Merc
ury
Mo
lyb
den
um
Nic
kel
Sele
niu
m
Sil
ver
Th
alliu
m
Tin
Tit
an
ium
Ura
niu
m
Van
ad
ium
Zin
c
Location ID (yyyy mm dd) pH mg/L pH µg/L mg/L µg/L mg/L µg/L mg/L mg/L µg/L µg/L µg/L µg/L µg/L µg/L µg/L µg/L µg/L µg/L µg/L µg/L µg/L µg/L µg/L µg/L µg/L µg/L µg/L µg/L µg/L µg/LBC Guideline
CSR Aquatic Life (AW)b n/a n/a n/a n/a n/a n/a n/a n/a n/a n/a 90 50 10,000 1.5 12,000 1.5 - 4e
10f 40 40 - 90
e50 - 150
e n/a 0.25 10,000 650 - 1,500e 20 0.5 - 15
e 3 n/a 1,000 85 n/a 75 - 2,400e
CSR Irrigation Watering (IW) n/a n/a n/a 5,000 n/a 5,000g n/a 200g n/a n/a n/a 100 n/a 100 500 5 5f 50 200 200 2,500 1 10 200 20 n/a n/a n/a n/a 10 100 1,000 - 5,000j
BCWQG Irrigation Water Long-Term Average (IW)c 5.0 - 9.5 n/a 5.0 - 9.5 n/a n/a n/a n/a 200 n/a n/a n/a n/a n/a 100 500h n/a 4.9f 50 n/a n/a 750h n/a 10i 200 n/a n/a n/a n/a n/a 10 100 1,000 - 5,000j
BCWQG Irrigation Water Short-term Maximum (IW) 5.0 - 9.5 n/a 5.0 - 9.5 5,000 n/a n/a n/a n/a n/a n/a n/a 100 n/a n/a n/a 5.1 n/a n/a 200 200i n/a 2 50
i n/a 10 n/a n/a n/a n/a n/a n/a n/a
Monitoring Wells (screened in till) - Within the Footprint of the Landfill
GL4-2 GL4-2-200814 2020 08 14 8.04 846 7.71 11.6 51.9 168 174 197 9.14 258 < 0.050 0.729 44.9 < 0.010 29.3 0.143 0.57 0.842 2.95 0.214 32.8 < 0.010 72.2 3.68 0.22 < 0.010 0.0071 < 0.050 0.79 78.0 1.30 4.1
GL4-2-201030 2020 10 30 8.01 765 7.46 < 1.0 47.5 11.0 157 47.9 8.63 231 0.129 0.833 38.3 < 0.010 23.1 0.0457 < 0.10 0.211 0.90 < 0.050 29.6 < 0.010 98.3 2.10 0.86 < 0.010 < 0.0040 < 0.050 0.25 86.2 1.40 1.5
GL5-2 GL5-2-200611 2020 06 11 7.83 501 7.21 4.2 65.3 < 2.0 82.1 0.187 6.98 195 < 0.050 0.339 48.2 < 0.010 24.9 0.0230 0.37 0.0245 0.47 < 0.050 36.8 < 0.010 12.5 0.325 0.36 < 0.010 < 0.0040 < 0.050 < 0.20 28.8 3.95 < 1.0
GL12-1 GL12-1-200610 2020 06 10 7.39 4,490 6.78 < 100 583 19,700 736 22,000 85.1 780 < 5.00 21.0 48.7 < 1.00 214 < 0.200 < 10.0a 4.54 < 10.0 < 5.00 144 < 0.010 21.2 27.1 < 10.0 < 1.00 < 0.400 < 5.00 < 20.0 288 < 20.0 < 100
GL12-1-201102 2020 11 02 7.51 4,720 6.64 15.9 642 24,400 757 21,300 82.4 895 0.114 22.0 43.9 0.073 94.2 0.0075 1.99 5.17 0.50 < 0.050 133 < 0.010 21.4 24.7 0.51 < 0.010 0.0204 < 0.050 2.44 260 1.84 1.3
GL27-3 GL27-3-200608 2020 06 08 7.88 5,540 7.3 1.4 439 4,610 1,080 555 42 3,830 < 0.050 9.61 9.77 0.014 33.7 0.0349 0.58 2.10 5.33 < 0.050 90.2 < 0.010 69.3 3.26 0.42 < 0.010 0.0162 < 0.050 0.41 73.6 0.23 1.1
GL29-1 GL29-1-200612 2020 06 12 7.04 421 7.01 1.9 74.4 1,030 57 674 9.32 263 0.478 4.78 68.4 0.089 59.8 0.0043 0.19 33.0 < 0.10 < 0.050 99.1 < 0.010 8.96 2.52 0.11 < 0.010 < 0.0040 0.051 0.29 25.2 0.30 < 1.0
GL29-1-201120 2020 11 20 7.84 442 7.07 1.1 84.5 898 56.1 532 10.3 276 < 0.050 3.99 56.0 0.122 43.4 < 0.0020 0.15 47.6 < 0.10 < 0.050 95.0 < 0.010 8.94 1.39 < 0.10 < 0.010 < 0.0040 < 0.050 < 0.20 21.1 < 0.20 < 1.0
GL35-3 GL35-3-200608 2020 06 08 7.73 2,180 6.73 3.0 228 16,700 392 377 37.1 2,040 < 0.050 0.842 15.9 0.066 55.4 0.0077 1.73 0.0296 0.90 < 0.050 350 < 0.010 2.34 0.361 0.10 < 0.010 < 0.0040 < 0.050 1.16 21.9 1.25 < 1.0
DUPA-200608 Duplicate 7.73 2,080 6.73 2.9 213 15,900 376 363 36.2 2,090 < 0.050 0.820 15.8 0.059 50.2 0.0067 1.62 0.0297 0.97 < 0.050 316 < 0.010 2.29 0.350 0.11 < 0.010 < 0.0040 < 0.050 1.19 21.0 1.23 < 1.0
QA/QC RPD% 0 5 * * 7 5 4 4 2 2 * 3 1 11 10 * 7 0 7 * 10 * 2 3 * * * * 3 4 2 *
Monitoring Wells (screened in till) - Downgradient
GL39-1 GL39-1-200609 2020 06 09 7.81 2,120 7.02 1.1 229 < 2.0 376 31.8 14.2 476 < 0.050 0.333 13.5 < 0.010 15.9 0.0609 0.50 0.286 1.19 < 0.050 67.4 < 0.010 22.4 1.07 10.6 < 0.010 0.0157 < 0.050 < 0.20 219 0.42 1.4
GL39-1-201019 2020 10 19 7.85 1,970 7.03 1.7 253 3.9 324 10.2 13.5 380 < 0.050 0.472 12.4 < 0.010 8.4 0.0459 0.35 0.207 1.16 < 0.050 59.5 < 0.010 22.4 1.02 5.58 < 0.010 0.0144 < 0.050 0.24 219 0.23 1.4
GL40-3 GL40-3-201117 2020 11 17 8.09 311 7.31 2.1 75.4 66.6 29.7 466 10.6 1,230 1.45 15.4 585 < 0.010 76.9 0.0058 0.24 0.119 < 0.10 < 0.050 283 < 0.010 1.52 1.13 < 0.10 < 0.010 < 0.0040 0.176 1.29 8.49 1.22 < 1.0
GL42-1 GL42-1-200612 2020 06 12 7.12 184 7.28 < 1.0 35 2,940 23.4 343 9.87 1,530 0.225 2.67 551 0.025 82.3 0.0270 0.30 0.154 < 0.10 0.110 1,270 < 0.010 4.00 0.610 0.12 < 0.010 < 0.0040 0.115 1.00 1.73 1.36 1.7
GL42-1-201106 2020 11 06 7.80 171 7.27 1.7 33.4 3,500 21.3 467 9.63 1,440 0.655 5.24 640 0.014 55.3 0.0334 0.48 0.292 0.19 0.065 1,270 < 0.010 3.08 0.932 < 0.10 < 0.010 < 0.0040 0.269 1.78 0.956 1.50 1.9
GL42-2 GL42-2-200616 2020 06 16 8.08 855 7.45 55.4 89.2 122 153 1,320 7.78 973 0.353 2.53 102 0.013 48.3 0.195 0.18 1.88 0.63 0.167 105 < 0.010 18.4 6.50 0.21 < 0.010 0.0497 0.346 1.62 85.4 0.77 2.8
GL42-2-201109 2020 11 09 7.76 1,270 7.34 30.2 117 51.3 238 606 8.76 1,350 0.868 1.74 47.2 < 0.010 43.1 0.719 3.51 1.88 2.36 0.068 200 < 0.010 21.7 9.37 0.73 < 0.010 0.0787 0.429 2.24 100 1.56 4.2
GL28-1 GL28-1-200610 2020 06 10 7.71 1,770 7.15 < 1.0 214 1,720 300 287 10.7 461 < 0.050 3.37 10.1 0.014 18.6 0.0107 0.14 0.536 0.21 < 0.050 83.0 < 0.010 12.6 0.871 < 0.10 < 0.010 0.0044 < 0.050 < 0.20 112 0.30 1.3
DUPB-200610 Duplicate 7.75 1,630 7.15 < 1.0 208 1,760 269 276 10.3 415 < 0.050 3.67 10.9 0.019 11.1 0.0120 0.17 0.541 0.22 < 0.050 62.6 < 0.010 13.1 0.906 < 0.10 < 0.010 0.0050 < 0.050 < 0.20 112 0.24 1.4
QA/QC RPD% 1 8 * * 3 2 11 4 4 11 * 9 8 * 51 11 * 1 * * 28 * 4 4 * * * * * 0 * *
GL28-1-201104 2020 11 04 7.82 1,850 7.14 < 1.0 237 1,770 306 320 11.5 454 < 0.050 2.90 9.69 0.022 16.4 0.0046 < 0.10 0.589 0.40 < 0.050 82.5 < 0.010 13.3 1.79 < 0.10 < 0.010 0.0045 < 0.050 < 0.20 118 < 0.20 1.4
DUP3-201104 Duplicate 7.80 1,850 - < 1.0 236 1,760 307 316 11.5 451 < 0.050 2.86 9.59 0.072 16.4 0.0059 < 0.10 0.577 2.83 < 0.050 84.1 < 0.010 13.1 1.76 < 0.10 < 0.010 0.0043 < 0.050 < 0.20 119 < 0.20 < 1.0
QA/QC RPD% 0 0 - * 0 1 0 1 0 1 * 1 1 * 0 * * 2 * * 2 * 2 2 * * * * * 1 * *GL28-2 GL28-2-200610 2020 06 10 7.66 1,730 6.95 < 1.0 301 < 2.0 237 8.74 12 657 < 0.050 0.466 12.5 < 0.010 18.6 0.0520 0.30 0.189 0.58 < 0.050 43.8 < 0.010 5.31 1.33 0.60 < 0.010 0.0053 < 0.050 < 0.20 151 1.15 1.1
GL28-2-201104 2020 11 04 7.70 2,200 6.9 < 1.0 397 171 293 19.2 14.2 955 < 0.050 0.414 13.4 < 0.010 16.9 0.0582 28.2 0.310 1.13 < 0.050 53.9 < 0.010 5.86 3.06 1.05 < 0.010 0.0089 < 0.050 < 0.20 196 1.15 < 1.0
Monitoring Wells (screened in bedrock) - Upgradient and/or BaselineGL15-1 GL15-1-201104 2020 11 04 7.80 1,530 7.18 < 1.0 220 5.9 238 52.1 5.5 437 0.261 0.633 136 < 0.010 16.1 0.528 0.37 0.526 4.01 < 0.050 32.5 < 0.010 10.2 4.73 19.9 < 0.010 0.0152 < 0.050 < 0.20 95.8 5.75 2.2
GL41-1 GL41-1-200616 2020 06 16 8.03 661 7.43 3.4 69.4 4.0 118 669 17.4 249 0.122 1.30 192 < 0.010 45.7 0.393 0.58 1.01 1.17 < 0.050 38.3 < 0.010 12.0 4.80 0.79 < 0.010 0.0521 0.200 < 0.20 29.2 1.85 5.6
GL41-1-201102 2020 11 02 8.03 735 7.56 2.1 61.4 < 2.0 141 215 18.6 312 0.156 1.20 118 < 0.010 50.6 0.311 1.68 0.229 1.69 < 0.050 44.2 < 0.010 11.0 2.40 0.54 < 0.010 0.0260 < 0.050 0.26 27.7 2.73 4.7
Monitoring Wells (screened in bedrock) - Within the Footprint of the Landfill
GL9-1 GL9-1-200611 2020 06 11 7.90 584 7.06 < 1.0 100 19,300 80.9 411 14.8 320 < 0.050 0.238 28.6 0.070 36.3 0.0022 0.11 0.116 < 0.10 < 0.050 126 < 0.010 0.743 0.166 < 0.10 < 0.010 < 0.0040 < 0.050 < 0.20 1.96 0.23 < 1.0
DUPC-200611 Duplicate 7.86 570 - < 1.0 98.1 18,800 78.8 400 14.4 313 < 0.050 0.187 27.9 0.068 34.8 0.0131 0.12 0.120 < 0.10 < 0.050 128 < 0.010 0.726 0.152 < 0.10 < 0.010 < 0.0040 < 0.050 < 0.20 1.97 0.21 1.2
QA/QC RPD% 1 2 - * 2 3 3 3 3 2 * * 2 3 4 * * 3 * * 2 * 2 * * * * * * 1 * *GL17-1 GL17-1-200608 2020 06 08 8.20 121 7.35 1.2 22.6 1,750 15.7 46.9 15.4 629 < 0.050 3.27 218 0.015 69.1 0.0051 0.74 0.202 0.49 < 0.050 197 < 0.010 0.388 0.695 < 0.10 < 0.010 < 0.0040 < 0.050 < 0.20 0.0970 < 0.20 < 1.0
GL17-1-201020 2020 10 20 8.01 132 7.43 1.4 23.9 1,790 17.4 51.3 17.4 531 < 0.050 2.61 277 0.011 52.6 < 0.0020 0.23 0.192 < 0.10 < 0.050 199 < 0.010 0.477 0.264 < 0.10 < 0.010 < 0.0040 < 0.050 0.23 0.129 < 0.20 1.1GL27-1 GL27-1-200608 2020 06 08 8.31 93.2 7.5 2.8 16.7 636 12.5 90.8 13.5 712 < 0.050 17.7 474 0.025 60.4 0.0051 0.80 0.0068 0.46 < 0.050 194 < 0.010 16.7 0.067 < 0.10 < 0.010 < 0.0040 < 0.050 0.24 0.666 0.31 1.0
GL27-1-201022 2020 10 22 8.10 85.2 7.63 < 1.0 14.2 551 12.1 82.8 11 566 < 0.050 8.73 424 0.028 64.7 0.0099 < 0.10 0.0068 < 0.10 < 0.050 200 < 0.010 13.4 < 0.040 < 0.10 < 0.010 < 0.0040 < 0.050 < 0.20 0.585 0.27 < 1.0
Associated CARO file(s): 0030839, 0060827, 0060994, 0061179, 0061343, 0061444, 0061688, 0061843, 0081411, 0082156, 0082778, 0091179, 20J1574, 20J1805, 20J1862, 20J2273, 20J3219, 20K0127, 20K0624, 20K0764, 20K0824, 20K0932, 20K1802, 20K2368.
All terms defined within the body of SNC-Lavalin's report.
< Denotes concentration less than indicated detection limit or RPD less than indicated value.a Laboratory detection limit exceeds regulatory standard/guideline.
- Denotes analysis not conducted.b Standard to protect freshwater aquatic life.
n/a Denotes no applicable standard/guideline.c Guideline to protect irrigation watering, long-term average (i.e. "chronic") (guidelines apply to total metals concentrations).
QA/QC RPD Denotes quality assurance/quality control relative percent differenced Guideline to protect irrigation watering, short-term maximum (i.e. "acute") (guidelines apply to total metals concentrations).
* RPDs are not calculated where one or more concentrations are less than five times RDL.e Standard varies with hardness.
RDL Denotes reported detection limit.f Individual standards exist for Cr +3 and Cr +6. Reported value represents more stringent standard.g Only applies for specific Schedule 2 Site Activities; verify for your site.
BOLD Concentration greater than CSR Aquatic Life (AW) standardh Guideline is crop dependent.
SHADED Concentration greater than CSR Irrigation Watering (IW) standardi Guideline is soil dependent.
RED Concentration greater than BCWQG Irrigation Water Long-Term Average (IW) guidelinej Guideline is pH dependent.
RED Concentration greater than BCWQG Irrigation Water Short-term Maximum (IW) guideline
SNC-LAVALIN INC. Page 2 of 2
662036 / 2021 02 0820210309_662036_TAB.xlsx
QAQC CN 2021 03 09

TABLE 3c: Summary of Analytical Results for Groundwater - Drinking Water Comparison - Inorganics
Physical Parameters Dissolved Inorganics
Sample Sample Sample Date pH To
tal
Hard
nes
s
pH
(fi
eld
)
Co
nd
ucti
vit
y
Fie
ld C
on
du
cti
vit
y
To
tal
Dis
so
lve
d
So
lid
s
Dis
so
lved
Org
an
ic
Carb
on
Am
mo
nia
, T
ota
l (a
s
N)
Nit
rate
(as
N)
Nit
rite
(as
N)
Ch
lori
de
Flu
ori
de
Su
lfa
te
To
tal
Alk
ali
nit
y
Alk
alin
ity,
Bic
arb
on
ate
(as
CaC
O3
)
Alk
alin
ity,
Carb
on
ate
(as
CaC
O3
)
Alk
alin
ity,
Hyd
rox
ide
(as
CaC
O3
)
Alk
alin
ity,
Ph
en
olp
hth
ale
in (
as
CaC
O3
)
Bro
mid
e
Hyd
rog
en
Su
lfid
e
Su
lfid
e
Ch
em
ical
Ox
yg
en
Dem
an
d
Ort
ho
-Ph
osp
hate
Location ID (yyyy mm dd) pH mg/L pH µS/cm µS/cm mg/L mg/L µg/L µg/L µg/L mg/L µg/L mg/L mg/L mg/L mg/L mg/L mg/L mg/L mg/L mg/L mg/L mg/L
BC Guideline
Canadian Drinking Water Quality Guidelines (CDWQG)b 7.0-10.5 n/a 7.0-10.5 n/a n/a 500 n/a n/a 10,000 1,000 250 1,500 500 n/a n/a n/a n/a n/a n/a 0.05 n/a n/a n/a
BCWQG Drinking Water (DW)b n/a n/a n/a n/a n/a n/a n/a n/a 10,000 1,000 250 1,500 500 n/a n/a n/a n/a n/a n/a n/a n/a n/a n/a
CSR Drinking Water (DW)e n/a n/a n/a n/a n/a n/a n/a n/a 10,000 1,000 250 1,500 500 n/a n/a n/a n/a n/a n/a 0.05 n/a n/a n/a
BCWQG Aquatic Life Long-Term Average (AW)f 6.5 - 9.0 n/a 6.5 - 9.0 n/a n/a n/a n/a 365-1,780
e 3,000 80-100c 150 n/a 309-429
d n/a n/a n/a n/a n/a n/a n/a n/a n/a n/a
BCWQG Aquatic Life Short-term Maximum (AW)g 6.5 - 9.0 n/a 6.5 - 9.0 n/a n/a n/a n/a 1,900-12,300e 32,800 240-600c 600 1,269-1,870d n/a n/a n/a n/a n/a n/a n/a n/a n/a n/a n/a
Monitoring Wells - Baseline and/or Upgradient
09BH03 09BH03-200609 2020 06 09 7.80 1,270 7.04 - 3,178 3,020 7.88 < 50 1,750 < 10 25.3 950 1,540 776 776 < 1.0 < 1.0 < 1.0 < 0.10 - - 22 < 0.0050
09BH06-D 09BH06-D-200609 2020 06 09 7.95 422 7.3 - 1,038 849 2.26 96 < 10 < 10 8.22 790 327 373 373 < 1.0 < 1.0 < 1.0 < 0.10 - - < 20 < 0.0050
GL0-1 GL0-1-200310 2020 03 10 7.94 405 - - - 705 1.01 284 49 < 10 6.82 860 316 189 189 < 1.0 < 1.0 < 1.0 < 0.10 - - < 20 0.0175
GL0-2 GL0-2-200310 2020 03 10 7.95 456 - - - 721 1.18 317 < 10 < 10 7.88 1,150 303 255 255 < 1.0 < 1.0 < 1.0 < 0.10 - - < 20 0.0134
GL0-3 GL0-3-200310 2020 03 10 7.82 1,000 - - - 1,970 6.19 56 55,800 < 10 139 930 505 491 491 < 1.0 < 1.0 < 1.0 < 1.00 - - 31 < 0.0050
GL1-1 GL1-1-200910 2020 09 10 8.12 746 - - - 1,200 3.45 52 < 10 < 10 131 1,570 284 646 646 < 1.0 < 1.0 < 1.0 < 0.10 - - - < 0.0050
GL1-2 GL1-2-200910 2020 09 10 8.14 814 - - - 1,300 4.98 < 50 < 10 < 10 117 1,430 283 676 676 < 1.0 < 1.0 < 1.0 < 0.10 - - - < 0.0050
GL2-1 GL2-1-200609 2020 06 09 7.90 556 7.36 - 1,202 970 1.54 90 < 1,000 < 1,000a 54.0 < 10,000a 410 254 254 < 1.0 < 1.0 < 1.0 < 10.0 - - < 20 < 0.500
GL2-1-200820 2020 08 20 8.10 473 7.46 - 1,435 1,000 1.72 73 - - 63.4 - - 237 237 < 1.0 < 1.0 < 1.0 0.44 - - < 20 < 0.0050
DUPA-200820 Duplicate 8.10 476 7.46 - 1,435 992 2.18 69 - - 63.2 - - 240 240 < 1.0 < 1.0 < 1.0 0.44 - - < 20 < 0.0050
QA/QC RPD% 0 1 * - * 1 * * - - 0 - - 1 1 * * * * - - * *
GL2-1-201019 2020 10 19 8.10 513 7.6 - 1,508 1,030 2.10 131 < 10 < 10 66.4 580 443 216 216 < 1.0 < 1.0 < 1.0 0.50 - - < 20 < 0.0050
GL9-1 GL9-1-200611 2020 06 11 7.90 584 7.06 - 2,032 1,470 1.77 255 < 100 < 100 109 < 1,000 267 1,060 1,060 < 1.0 < 1.0 < 1.0 < 1.00 - - < 20 < 0.0500
DUPC-200611 Duplicate 7.86 570 - - - 1,450 1.26 255 < 100 < 100 113 < 1,000 276 1,050 1,050 < 1.0 < 1.0 < 1.0 < 1.00 - - < 20 < 0.0500
QA/QC RPD% 1 2 - - - 1 * 0 * * 4 * 3 1 1 * * * * - - * *
GL15-1 GL15-1-201104 2020 11 04 7.80 1,530 7.18 - 3,904 3,210 10.8 51 2,440 < 10 241 860 1,200 644 644 < 1.0 < 1.0 < 1.0 < 1.00 - - 32 < 0.0050
GL15-2 GL15-2-201104 2020 11 04 7.69 6,230 6.94 - 10,680 11,900 19.0 < 50 1,690 < 10 360 1,020 7,190 794 794 < 1.0 < 1.0 < 1.0 < 10.0 - - 33 < 0.0050
DUP2-201104 Duplicate 7.67 6,360 - - - 11,200 19.5 < 50 1,790 < 10 367 970 7,160 797 797 < 1.0 < 1.0 < 1.0 < 10.0 - - 32 < 0.0050
QA/QC RPD% 0 2 - - - 6 3 * 6 * 2 5 0 0 0 * * * * - - * *
GL23-1 GL23-1-200617 2020 06 17 7.97 1,000 6.95 - 2,150 1,530 14.6 < 50 134 < 100 32.3 < 1,000 405 964 964 < 1.0 < 1.0 < 1.0 < 1.00 - - 33 < 0.0500
GL23-1-200910 2020 09 10 7.98 1,130 - - - 1,660 14.8 < 50 28 < 10 33.1 780 402 1,110 1,110 < 1.0 < 1.0 < 1.0 0.32 - - - < 0.0050
GL41-1 GL41-1-200616 2020 06 16 8.03 661 7.43 - 2,257 1,400 6.70 54 1,060 < 100 399 < 1,000 185 497 497 < 1.0 < 1.0 < 1.0 < 1.00 - - 28 < 0.0500
GL41-1-201102 2020 11 02 8.03 735 7.56 - 248 1,530 5.81 < 50 1,570 < 10 371 720 138 592 592 < 1.0 < 1.0 < 1.0 < 0.10 - - 23 0.0142
GL41-2 GL41-2-200612 2020 06 12 7.44 726 7.24 - 2,073 1,390 6.13 < 50 1,500 < 100 387 < 1,000 166 563 - - - - < 1.00 - - < 20 < 0.0500
DUPD-200612 Duplicate 7.50 743 7.24 - 2,073 1,370 6.38 < 50 1,460 < 100 404 < 1,000 164 559 - - - - < 1.00 - - < 20 < 0.0500
QA/QC RPD% 1 2 * - * 1 4 * 3 * 4 * 1 1 - - - - * - - * *
Monitoring Wells - Downgradient
GL39-1 GL39-1-200609 2020 06 09 7.81 2,120 7.02 - 3,724 3,710 6.40 56 4,470 < 1,000a 102 < 10,000
a 2,110 598 598 < 1.0 < 1.0 < 1.0 < 10.0 - - 22 < 0.500
GL39-1-201019 2020 10 19 7.85 1,970 7.03 - 4,547 4,140 8.10 < 50 5,840 < 10 134 1,230 2,120 574 574 < 1.0 < 1.0 < 1.0 < 0.10 - - 29 < 0.0050
GL39-2 GL39-2-200609 2020 06 09 7.85 1,910 7.29 - 4,140 4,110 6.23 < 50 1,820 < 1,000a 174 < 10,000a 2,400 401 401 < 1.0 < 1.0 < 1.0 < 10.0 - - 26 < 0.500
GL39-2-201016 2020 10 16 7.88 1,240 7.35 - 3,324 2,990 6.14 < 50 1,400 < 10 180 500 1,540 374 374 < 1.0 < 1.0 < 1.0 < 1.00 - - 21 < 0.0050
DUP1-201016 Duplicate 7.90 1,260 7.69 - 1,582 3,090 5.89 < 50 1,440 < 10 181 < 2,500a 1,570 397 397 < 1.0 < 1.0 < 1.0 < 1.00 - - 23 < 0.0050
QA/QC RPD% 0 2 * - * 3 4 * 3 * 1 * 2 6 6 * * * * - - * *
Associated CARO file(s): 0030839, 0060827, 0060994, 0061179, 0061343, 0061444, 0061688, 0061843, 0081411, 0082156, 0082778, 0091179, 20J1574, 20J1805, 20J1862, 20J2273, 20J3219, 20K0127, 20K0624, 20K0764, 20K0824, 20K0932, 20K1802, 20K2368.
All terms defined within the body of SNC-Lavalin's report.
< Denotes concentration less than indicated detection limit or RPD less than indicated value.a Laboratory detection limit exceeds regulatory standard/guideline.
- Denotes analysis not conducted.b Pathways Included: Aesthethic Objectives, Maximum Acceptable Concentrations.
n/a Denotes no applicable standard/guideline.c Guideline is chloride dependent.
QA/QC RPD Denotes quality assurance/quality control relative percent differenced Guideline is hardness dependent.
* RPDs are not calculated where one or more concentrations are less than five times RDL.e Guideline is pH and temperature dependent. 15C Temperature assumed.
RDL Denotes reported detection limit.f Guideline to protect freshwater aquatic life, long-term average (i.e. "chronic").g Guideline to protect freshwater aquatic life, short-term maximum (i.e. "acute").
BOLD Concentration greater than Canadian Drinking Water Quality Guidelines (CDWQG) Guideline
SHADED Concentration greater than BCWQG Drinking Water (DW) - AO guideline
SHADED Concentration greater than BCWQG Drinking Water (DW) - MAC guideline
RED Concentration greater than CSR Drinking Water (DW) standard
BLUE SHADED Concentration greater than BCWQG Aquatic Life Long-Term Average (AW) guideline
BLUE SHADED Concentration greater than BCWQG Aquatic Life Short-term Maximum (AW) guideline
SNC-LAVALIN INC. Page 1 of 2
662036 / 2021 02 0820210309_662036_TAB.xlsx
QAQC CN 2021 03 09

TABLE 3c: Summary of Analytical Results for Groundwater - Drinking Water Comparison - Inorganics
Physical Parameters Dissolved Inorganics
Sample Sample Sample Date pH To
tal
Hard
nes
s
pH
(fi
eld
)
Co
nd
ucti
vit
y
Fie
ld C
on
du
cti
vit
y
To
tal
Dis
so
lve
d
So
lid
s
Dis
so
lved
Org
an
ic
Carb
on
Am
mo
nia
, T
ota
l (a
s
N)
Nit
rate
(as
N)
Nit
rite
(as
N)
Ch
lori
de
Flu
ori
de
Su
lfa
te
To
tal
Alk
ali
nit
y
Alk
alin
ity,
Bic
arb
on
ate
(as
CaC
O3
)
Alk
alin
ity,
Carb
on
ate
(as
CaC
O3
)
Alk
alin
ity,
Hyd
rox
ide
(as
CaC
O3
)
Alk
alin
ity,
Ph
en
olp
hth
ale
in (
as
CaC
O3
)
Bro
mid
e
Hyd
rog
en
Su
lfid
e
Su
lfid
e
Ch
em
ical
Ox
yg
en
Dem
an
d
Ort
ho
-Ph
osp
hate
Location ID (yyyy mm dd) pH mg/L pH µS/cm µS/cm mg/L mg/L µg/L µg/L µg/L mg/L µg/L mg/L mg/L mg/L mg/L mg/L mg/L mg/L mg/L mg/L mg/L mg/L
BC Guideline
Canadian Drinking Water Quality Guidelines (CDWQG)b 7.0-10.5 n/a 7.0-10.5 n/a n/a 500 n/a n/a 10,000 1,000 250 1,500 500 n/a n/a n/a n/a n/a n/a 0.05 n/a n/a n/a
BCWQG Drinking Water (DW)b n/a n/a n/a n/a n/a n/a n/a n/a 10,000 1,000 250 1,500 500 n/a n/a n/a n/a n/a n/a n/a n/a n/a n/a
CSR Drinking Water (DW)e n/a n/a n/a n/a n/a n/a n/a n/a 10,000 1,000 250 1,500 500 n/a n/a n/a n/a n/a n/a 0.05 n/a n/a n/a
BCWQG Aquatic Life Long-Term Average (AW)f 6.5 - 9.0 n/a 6.5 - 9.0 n/a n/a n/a n/a 365-1,780
e 3,000 80-100c 150 n/a 309-429
d n/a n/a n/a n/a n/a n/a n/a n/a n/a n/a
BCWQG Aquatic Life Short-term Maximum (AW)g 6.5 - 9.0 n/a 6.5 - 9.0 n/a n/a n/a n/a 1,900-12,300e 32,800 240-600c 600 1,269-1,870d n/a n/a n/a n/a n/a n/a n/a n/a n/a n/a n/a
Monitoring Wells - Downgradient
GL40-3 GL40-3-201117 2020 11 17 8.09 311 7.31 - 4,621 3,000 66.4 11,400 < 100 < 100 201 < 1,000 375 2,190 2,190 < 1.0 < 1.0 < 1.0 < 1.00 - - 2,430 < 0.0500
GL42-1 GL42-1-200612 2020 06 12 7.12 184 7.28 - 2,332 2,360 2.39 703 < 100 < 100 36.7 < 1,000 20.8 2,050 - - - - < 1.00 - - 330 0.0580
GL42-1-201106 2020 11 06 7.80 171 7.27 - 5,266 3,620 2.95 743 < 10 < 10 47.6 560 1.3 3,030 3,030 < 1.0 < 1.0 < 1.0 0.34 - - 35 < 0.0050
GL42-2 GL42-2-200616 2020 06 16 8.08 855 7.45 - 4,649 3,910 6.51 461 1,760 232 64.3 < 1,000 2,050 928 928 < 1.0 < 1.0 < 1.0 < 1.00 - - 519 < 0.0500
GL42-2-201109 2020 11 09 7.76 1,270 7.34 - 5,360 4,220 7.70 83 883 153 63.6 590 2,250 918 918 < 1.0 < 1.0 < 1.0 < 10.0 - - 89 < 0.0050
GL28-1 GL28-1-200610 2020 06 10 7.71 1,770 7.15 - 3,321 3,300 4.43 120 < 100 < 100 37.8 < 1,000 2,080 554 554 < 1.0 < 1.0 < 1.0 < 1.00 - - < 20 < 0.0500
DUPB-200610 Duplicate 7.75 1,630 7.15 - 3,321 3,680 3.83 124 < 100 < 100 38.1 < 1,000 2,140 544 544 < 1.0 < 1.0 < 1.0 < 1.00 - - < 20 < 0.0500
QA/QC RPD% 1 8 * - * 11 15 * * * 1 * 3 2 2 * * * * - - * *
GL28-1-201104 2020 11 04 7.82 1,850 7.14 - 4,082 3,840 6.24 128 < 1,000 < 10 46.9 1,020 2,240 516 516 < 1.0 < 1.0 < 1.0 < 10.0 - - < 20 < 0.0050
DUP3-201104 Duplicate 7.80 1,850 - - - 3,450 6.09 127 < 1,000 < 10 46.3 1,000 2,190 515 515 < 1.0 < 1.0 < 1.0 < 10.0 - - < 20 < 0.0050
QA/QC RPD% 0 0 - - - 11 2 * * * 1 2 2 0 0 * * * * - - * *
GL28-2 GL28-2-200610 2020 06 10 7.66 1,730 6.95 - 3,882 4,250 4.99 < 50 9,190 < 100 32.0 < 1,000 2,490 587 587 < 1.0 < 1.0 < 1.0 < 1.00 - - < 20 < 0.0500
GL28-2-201104 2020 11 04 7.70 2,200 6.9 - 5,499 4,790 6.26 < 50 9,400 < 10 42.9 130 3,020 677 677 < 1.0 < 1.0 < 1.0 < 0.10 - - < 20 < 0.0050
GL28-3 GL28-3-200610 2020 06 10 7.67 2,890 6.92 - 630.3 7,680 9.25 < 50 5,160 < 100 56.6 < 1,000 4,550 864 864 < 1.0 < 1.0 < 1.0 < 1.00 - - 26 < 0.0500
GL28-3-201105 2020 11 05 7.75 2,870 6.96 - 277.6 7,810 9.33 < 50 5,150 18 49.4 280 4,500 839 839 < 1.0 < 1.0 < 1.0 < 10.0 - - < 20 < 0.0050
Associated CARO file(s): 0030839, 0060827, 0060994, 0061179, 0061343, 0061444, 0061688, 0061843, 0081411, 0082156, 0082778, 0091179, 20J1574, 20J1805, 20J1862, 20J2273, 20J3219, 20K0127, 20K0624, 20K0764, 20K0824, 20K0932, 20K1802, 20K2368.
All terms defined within the body of SNC-Lavalin's report.
< Denotes concentration less than indicated detection limit or RPD less than indicated value.a Laboratory detection limit exceeds regulatory standard/guideline.
- Denotes analysis not conducted.b Pathways Included: Aesthethic Objectives, Maximum Acceptable Concentrations.
n/a Denotes no applicable standard/guideline.c Guideline is chloride dependent.
QA/QC RPD Denotes quality assurance/quality control relative percent differenced Guideline is hardness dependent.
* RPDs are not calculated where one or more concentrations are less than five times RDL.e Guideline is pH and temperature dependent. 15C Temperature assumed.
RDL Denotes reported detection limit.f Guideline to protect freshwater aquatic life, long-term average (i.e. "chronic").g Guideline to protect freshwater aquatic life, short-term maximum (i.e. "acute").
BOLD Concentration greater than Canadian Drinking Water Quality Guidelines (CDWQG) Guideline
SHADED Concentration greater than BCWQG Drinking Water (DW) - AO guideline
SHADED Concentration greater than BCWQG Drinking Water (DW) - MAC guideline
RED Concentration greater than CSR Drinking Water (DW) standard
BLUE SHADED Concentration greater than BCWQG Aquatic Life Long-Term Average (AW) guideline
BLUE SHADED Concentration greater than BCWQG Aquatic Life Short-term Maximum (AW) guideline
SNC-LAVALIN INC. Page 2 of 2
662036 / 2021 02 0820210309_662036_TAB.xlsx
QAQC CN 2021 03 09

TABLE 3d: Summary of Analytical Results for Groundwater - Drinking Water Comparison - Dissolved Metals
Physical Parameters Dissolved Metals
Sample Sample Sample Date pH To
tal
Ha
rdn
es
s
pH
(fi
eld
)
Dis
so
lve
d O
rga
nic
Ca
rbo
n
Dis
so
lve
d A
lum
inu
m
Dis
so
lve
d C
alc
ium
Dis
so
lve
d I
ron
Dis
so
lve
d M
ag
ne
siu
m
Dis
so
lve
d M
an
ga
ne
se
Dis
so
lve
d P
ota
ss
ium
Dis
so
lve
d S
od
ium
An
tim
on
y
Ars
en
ic
Ba
riu
m
Be
ryll
ium
Bo
ron
Ca
dm
ium
Ch
rom
ium
Co
ba
lt
Co
pp
er
Le
ad
Lit
hiu
m
Me
rcu
ry
Mo
lyb
de
nu
m
Nic
ke
l
Se
len
ium
Sil
ve
r
Str
on
tiu
m
Th
all
ium
Tin
Tit
an
ium
Tu
ng
ste
n
Ura
niu
m
Va
na
diu
m
Zin
c
Location ID (yyyy mm dd) pH mg/L pH mg/L µg/L mg/L µg/L mg/L µg/L mg/L mg/L µg/L µg/L µg/L µg/L µg/L µg/L µg/L µg/L µg/L µg/L µg/L µg/L µg/L µg/L µg/L µg/L µg/L µg/L µg/L µg/L µg/L µg/L µg/L µg/L
BC Guideline
Canadian Drinking Water Quality Guidelines (CDWQG)b 7.0-10.5 n/a 7.0-10.5 n/a 100 n/a 300 n/a 20 n/a 200 6 10 2,000 n/a 5,000 7 50 n/a 1,000 5 n/a 1 n/a n/a 50 n/a n/a n/a n/a n/a n/a 20 n/a 5,000
BCWQG Drinking Water (DW)b n/a n/a n/a n/a 9,500 n/a 300 n/a 20 n/a n/a 6 n/a n/a n/a 5,000 5 50 1 1,000 5 n/a 1 n/a 80 10 n/a 7,000 n/a n/a n/a n/a 20 n/a 3,000
CSR Drinking Water (DW) n/a n/a n/a n/a 9,500 n/a 6,500h n/a 1,500h n/a 200 6 10 1,000 8 5,000 5 50i 20j 1,500 10 8 1 250 80 10 20 2,500 n/a 2,500 n/a 3 20 20 3,000
BCWQG Aquatic Life Long-Term Average (AW)f 6.5 - 9.0 n/a 6.5 - 9.0 n/a 50 (pH>=6.5)c n/a n/a n/a n/a n/a n/a n/a n/a n/a n/a n/a 0.188 - 0.457d n/a n/a 0.2 - 14.2e n/a n/a n/a n/a n/a n/a n/a n/a n/a n/a n/a n/a n/a n/a n/a
BCWQG Aquatic Life Short-term Maximum (AW)g 6.5 - 9.0 n/a 6.5 - 9.0 n/a 100 (pH>=6.5)c n/a 350 n/a n/a n/a n/a n/a n/a n/a n/a n/a 0.499 - 2.8d n/a n/a 0.2 - 73.8e n/a n/a n/a n/a n/a n/a n/a n/a n/a n/a n/a n/a n/a n/a n/a
Monitoring Wells - Baseline and/or Upgradient
09BH03 09BH03-200609 2020 06 09 7.80 1,270 7.04 7.88 1.2 184 < 2.0 197 0.089 7.9 92.3 0.064 0.500 24.1 < 0.010 13.3 0.0278 34.1 0.145 1.96 < 0.050 31.0 < 0.010 26.3 1.26 52.4 < 0.010 1,390 < 0.0040 < 0.050 < 0.20 < 0.20 207 1.91 1.1
09BH06-D 09BH06-D-200609 2020 06 09 7.95 422 7.3 2.26 < 1.0 70.1 459 60 199 4.73 156 < 0.050 2.85 48.2 < 0.010 15.0 0.0048 < 0.10 0.190 < 0.10 < 0.050 59.9 < 0.010 18.0 0.377 < 0.10 < 0.010 1,650 0.0045 < 0.050 < 0.20 < 0.20 10.2 < 0.20 < 1.0
GL0-1 GL0-1-200310 2020 03 10 7.94 405 - 1.01 < 5.0 58.4 13 62.9 25.7 9.93 65.6 < 0.20 3.44 39.9 < 0.10 58.4 0.019 < 0.50 < 0.10 0.12 < 0.20 15.6 < 0.010 29.9 0.41 < 0.50 < 0.050 1,500 < 0.020 < 0.20 < 5.0 < 1.0 4.80 < 1.0 < 4.0
GL0-2 GL0-2-200310 2020 03 10 7.95 456 - 1.18 < 5.0 73.1 113 66.4 179 10.4 58.3 < 0.20 3.78 51.5 < 0.10 56.8 0.021 < 0.50 0.24 < 0.10 < 0.20 32.0 < 0.010 25.8 1.03 < 0.50 < 0.050 1,500 < 0.020 < 0.20 < 5.0 < 1.0 3.01 < 1.0 < 4.0
GL0-3 GL0-3-200310 2020 03 10 7.82 1,000 - 6.19 < 5.0 154 64 150 1.85 11.9 230 < 0.20 < 0.50 28.3 0.17 37.7 0.046 1.12 0.49 2.43 < 0.20 50.1 < 0.010 14.4 2.60 6.33 < 0.050 2,800 < 0.020 < 0.20 < 5.0 < 1.0 178 < 1.0 9.3
GL1-1 GL1-1-200910 2020 09 10 8.12 746 - 3.45 2.4 63.4 3.4 143 29.4 9.46 153 0.095 0.624 43.0 < 0.010 45.8 0.123 0.19 0.156 1.28 0.078 39.7 - 29.6 1.85 0.41 < 0.010 3,120 0.0073 < 0.050 0.20 0.42 54.6 0.21 2.9
GL1-2 GL1-2-200910 2020 09 10 8.14 814 - 4.98 2.2 68.1 < 2.0 156 3.48 10.8 157 0.087 0.752 49.8 < 0.010 39.2 0.0328 0.13 0.143 1.24 < 0.050 40.0 - 23.5 1.24 0.26 < 0.010 3,510 < 0.0040 < 0.050 0.26 < 0.20 59.8 2.34 < 1.0
GL2-1 GL2-1-200609 2020 06 09 7.90 556 7.36 1.54 < 1.0 124 1,220 60 157 4.45 122 < 0.050 2.46 92.7 < 0.010 12.3 0.0075 < 0.10 0.0524 0.23 < 0.050 14.1 < 0.010 14.3 0.127 < 0.10 < 0.010 29.0 < 0.0040 < 0.050 < 0.20 < 0.20 5.07 < 0.20 < 1.0
GL2-1-200820 2020 08 20 8.10 473 7.46 1.72 1.6 106 1,210 50.8 129 3.92 98.7 < 0.050 2.82 88.1 < 0.010 11.7 0.0068 0.15 0.0583 < 0.10 < 0.050 12.8 < 0.010 13.8 0.077 < 0.10 < 0.010 39.0 < 0.0040 < 0.050 < 0.20 < 0.20 4.13 < 0.20 < 1.0
DUPA-200820 Duplicate 8.10 476 7.46 2.18 3.0 107 1,200 51 130 3.98 99.4 < 0.050 2.81 87.3 < 0.010 11.4 0.0057 0.12 0.0449 < 0.10 < 0.050 12.9 < 0.010 13.7 0.079 < 0.10 < 0.010 39.5 < 0.0040 0.113 < 0.20 < 0.20 4.13 < 0.20 < 1.0
QA/QC RPD% 0 1 * * * 1 1 0 1 2 1 * 0 1 * 3 * * 26 * * 1 * 1 * * * * * * * * 0 * *
GL2-1-201019 2020 10 19 8.10 513 7.6 2.10 < 1.0 125 1,490 48.8 129 4.18 101 < 0.050 3.25 76.5 < 0.010 6.3 < 0.0020 < 0.10 0.0526 < 0.10 < 0.050 11.2 < 0.010 14.9 0.087 < 0.10 < 0.010 3,840 < 0.0040 < 0.050 < 0.20 < 0.20 4.03 < 0.20 < 1.0
GL9-1 GL9-1-200611 2020 06 11 7.90 584 7.06 1.77 < 1.0 100 19,300 80.9 411 14.8 320 < 0.050 0.238 28.6 0.070 36.3 0.0022 0.11 0.116 < 0.10 < 0.050 126 < 0.010 0.743 0.166 < 0.10 < 0.010 5,030 < 0.0040 < 0.050 < 0.20 < 0.20 1.96 0.23 < 1.0
DUPC-200611 Duplicate 7.86 570 - 1.26 < 1.0 98.1 18,800 78.8 400 14.4 313 < 0.050 0.187 27.9 0.068 34.8 0.0131 0.12 0.120 < 0.10 < 0.050 128 < 0.010 0.726 0.152 < 0.10 < 0.010 5,110 < 0.0040 < 0.050 < 0.20 < 0.20 1.97 0.21 1.2
QA/QC RPD% 1 2 - * * 2 3 3 3 3 2 * * 2 3 4 * * 3 * * 2 * 2 * * * 2 * * * * 1 * *
GL15-1 GL15-1-201104 2020 11 04 7.80 1,530 7.18 10.8 < 1.0 220 5.9 238 52.1 5.5 437 0.261 0.633 136 < 0.010 16.1 0.528 0.37 0.526 4.01 < 0.050 32.5 < 0.010 10.2 4.73 19.9 < 0.010 12,900 0.0152 < 0.050 < 0.20 < 0.20 95.8 5.75 2.2
GL15-2 GL15-2-201104 2020 11 04 7.69 6,230 6.94 19.0 1.1 538 < 2.0 1,190 0.088 20.3 1,630 0.103 0.950 20.8 < 0.010 9.8 0.0432 22.4 0.297 4.75 < 0.050 64.9 < 0.010 21.3 2.80 82.1 < 0.010 14,900 0.0104 < 0.050 < 0.20 0.32 549 2.84 < 1.0
DUP2-201104 Duplicate 7.67 6,360 - 19.5 1.0 542 < 2.0 1,220 0.091 20.6 1,660 0.107 0.948 21.4 < 0.010 9.5 0.0446 22.6 0.296 4.78 < 0.050 64.5 < 0.010 21.0 2.80 79.3 < 0.010 14,100 0.0101 < 0.050 < 0.20 0.32 545 2.80 < 1.0
QA/QC RPD% 0 2 - 3 * 1 * 2 * 1 2 * 0 3 * * 3 1 0 1 * 1 * 1 0 3 * 6 * * * * 1 1 *
GL23-1 GL23-1-200617 2020 06 17 7.97 1,000 6.95 14.6 < 1.0 85.7 < 2.0 192 316 13.7 178 < 0.050 0.581 64.8 < 0.010 30.4 0.0823 0.11 0.746 1.97 < 0.050 36.7 < 0.010 15.0 10.4 0.34 < 0.010 4,430 0.0073 < 0.050 < 0.20 < 0.20 68.9 0.97 1.2
GL23-1-200910 2020 09 10 7.98 1,130 - 14.8 1.2 101 < 2.0 213 870 14.9 189 < 0.050 0.561 69.6 < 0.010 29.5 0.321 0.15 0.690 3.02 < 0.050 41.7 - 17.0 13.3 0.26 < 0.010 4,640 0.0139 < 0.050 < 0.20 < 0.20 74.7 0.79 2.2
GL41-1 GL41-1-200616 2020 06 16 8.03 661 7.43 6.70 3.4 69.4 4.0 118 669 17.4 249 0.122 1.30 192 < 0.010 45.7 0.393 0.58 1.01 1.17 < 0.050 38.3 < 0.010 12.0 4.80 0.79 < 0.010 2,540 0.0521 0.200 < 0.20 < 0.20 29.2 1.85 5.6
GL41-1-201102 2020 11 02 8.03 735 7.56 5.81 2.1 61.4 < 2.0 141 215 18.6 312 0.156 1.20 118 < 0.010 50.6 0.311 1.68 0.229 1.69 < 0.050 44.2 < 0.010 11.0 2.40 0.54 < 0.010 2,830 0.0260 < 0.050 0.26 < 0.20 27.7 2.73 4.7
GL41-2 GL41-2-200612 2020 06 12 7.44 726 7.24 6.13 < 1.0 71.1 < 2.0 133 0.111 16 279 0.073 1.05 87.9 < 0.010 25.2 0.0102 2.26 0.0429 1.13 < 0.050 45.2 < 0.010 7.49 0.479 0.49 0.010 3,120 0.0064 < 0.050 < 0.20 < 0.20 26.3 2.29 < 1.0
DUPD-200612 Duplicate 7.50 743 7.24 6.38 < 1.0 71.4 < 2.0 137 0.085 16.3 284 0.074 1.06 87.8 < 0.010 25.2 0.0119 2.26 0.0404 1.13 < 0.050 45.3 < 0.010 7.45 0.454 0.51 < 0.010 3,080 0.0065 < 0.050 < 0.20 < 0.20 26.1 2.32 < 1.0
QA/QC RPD% 1 2 * 4 * 0 * 3 * 2 2 * 1 0 * 0 15 0 6 0 * 0 * 1 5 * * 1 * * * * 1 1 *
GL41-2-201022 2020 10 22 7.83 684 7.31 6.58 < 1.0 72.6 < 2.0 122 0.070 15.1 256 0.072 1.05 85.2 0.011 29.7 0.0149 2.44 0.0438 1.24 < 0.050 41.7 < 0.010 7.10 0.516 0.49 0.011 2,840 < 0.0040 < 0.050 < 0.20 < 0.20 25.8 2.54 < 1.0
Monitoring Wells - Downgradient
GL39-1 GL39-1-200609 2020 06 09 7.81 2,120 7.02 6.40 1.1 229 < 2.0 376 31.8 14.2 476 < 0.050 0.333 13.5 < 0.010 15.9 0.0609 0.50 0.286 1.19 < 0.050 67.4 < 0.010 22.4 1.07 10.6 < 0.010 45.5 0.0157 < 0.050 < 0.20 < 0.20 219 0.42 1.4
GL39-1-201019 2020 10 19 7.85 1,970 7.03 8.10 1.7 253 3.9 324 10.2 13.5 380 < 0.050 0.472 12.4 < 0.010 8.4 0.0459 0.35 0.207 1.16 < 0.050 59.5 < 0.010 22.4 1.02 5.58 < 0.010 6,840 0.0144 < 0.050 0.24 < 0.20 219 0.23 1.4
GL39-2 GL39-2-200609 2020 06 09 7.85 1,910 7.29 6.23 4.5 188 8.8 349 6.72 9.71 1.27 0.059 0.419 12.3 < 0.010 9.7 0.0480 7.30 0.137 1.74 < 0.050 23.6 < 0.010 23.2 1.33 4.73 < 0.010 27.6 0.0111 < 0.050 0.31 < 0.20 120 0.79 < 1.0
GL39-2-201016 2020 10 16 7.88 1,240 7.35 6.14 1.6 117 < 2.0 230 4.88 7.93 531 0.082 0.422 12.9 < 0.010 10.9 0.0236 3.31 0.109 1.63 < 0.050 22.2 < 0.010 26.8 1.02 5.17 < 0.010 2,870 0.0089 0.132 < 0.20 < 0.20 89.8 0.61 < 1.0
DUP1-201016 Duplicate 7.90 1,260 7.69 5.89 1.6 121 < 2.0 233 4.86 7.9 545 0.085 0.421 12.8 < 0.010 10.3 0.0213 3.29 0.105 1.48 < 0.050 22.0 < 0.010 26.9 1.02 5.22 < 0.010 2,840 0.0084 0.217 < 0.20 < 0.20 91.1 0.60 < 1.0
QA/QC RPD% 0 2 * 4 * 3 * 1 0 0 3 * 0 1 * 6 10 1 4 10 * 1 * 0 0 1 * 1 * * * * 1 * *
GL40-3 GL40-3-201117 2020 11 17 8.09 311 7.31 66.4 2.1 75.4 66.6 29.7 466 10.6 1,230 1.45 15.4 585 < 0.010 76.9 0.0058 0.24 0.119 < 0.10 < 0.050 283 < 0.010 1.52 1.13 < 0.10 < 0.010 8,370 < 0.0040 0.176 1.29 0.66 8.49 1.22 < 1.0
GL42-1 GL42-1-200612 2020 06 12 7.12 184 7.28 2.39 < 1.0 35 2,940 23.4 343 9.87 1,530 0.225 2.67 551 0.025 82.3 0.0270 0.30 0.154 < 0.10 0.110 1,270 < 0.010 4.00 0.610 0.12 < 0.010 3,460 < 0.0040 0.115 1.00 0.24 1.73 1.36 1.7
GL42-1-201106 2020 11 06 7.80 171 7.27 2.95 1.7 33.4 3,500 21.3 467 9.63 1,440 0.655 5.24 640 0.014 55.3 0.0334 0.48 0.292 0.19 0.065 1,270 < 0.010 3.08 0.932 < 0.10 < 0.010 3,360 < 0.0040 0.269 1.78 0.22 0.956 1.50 1.9
GL42-2 GL42-2-200616 2020 06 16 8.08 855 7.45 6.51 55.4 89.2 122 153 1,320 7.78 973 0.353 2.53 102 0.013 48.3 0.195 0.18 1.88 0.63 0.167 105 < 0.010 18.4 6.50 0.21 < 0.010 4,000 0.0497 0.346 1.62 < 0.20 85.4 0.77 2.8
GL42-2-201109 2020 11 09 7.76 1,270 7.34 7.70 30.2 117 51.3 238 606 8.76 1,350 0.868 1.74 47.2 < 0.010 43.1 0.719 3.51 1.88 2.36 0.068 200 < 0.010 21.7 9.37 0.73 < 0.010 5,560 0.0787 0.429 2.24 < 0.20 100 1.56 4.2
GL28-1 GL28-1-200610 2020 06 10 7.71 1,770 7.15 4.43 < 1.0 214 1,720 300 287 10.7 461 < 0.050 3.37 10.1 0.014 18.6 0.0107 0.14 0.536 0.21 < 0.050 83.0 < 0.010 12.6 0.871 < 0.10 < 0.010 6,210 0.0044 < 0.050 < 0.20 < 0.20 112 0.30 1.3
DUPB-200610 Duplicate 7.75 1,630 7.15 3.83 < 1.0 208 1,760 269 276 10.3 415 < 0.050 3.67 10.9 0.019 11.1 0.0120 0.17 0.541 0.22 < 0.050 62.6 < 0.010 13.1 0.906 < 0.10 < 0.010 6,270 0.0050 < 0.050 < 0.20 < 0.20 112 0.24 1.4
QA/QC RPD% 1 8 * 15 * 3 2 11 4 4 11 * 9 8 * 51 11 * 1 * * 28 * 4 4 * * 1 * * * * 0 * *
GL28-1-201104 2020 11 04 7.82 1,850 7.14 6.24 < 1.0 237 1,770 306 320 11.5 454 < 0.050 2.90 9.69 0.022 16.4 0.0046 < 0.10 0.589 0.40 < 0.050 82.5 < 0.010 13.3 1.79 < 0.10 < 0.010 7,000 0.0045 < 0.050 < 0.20 < 0.20 118 < 0.20 1.4
DUP3-201104 Duplicate 7.80 1,850 - 6.09 < 1.0 236 1,760 307 316 11.5 451 < 0.050 2.86 9.59 0.072 16.4 0.0059 < 0.10 0.577 2.83 < 0.050 84.1 < 0.010 13.1 1.76 < 0.10 < 0.010 7,000 0.0043 < 0.050 < 0.20 < 0.20 119 < 0.20 < 1.0
QA/QC RPD% 0 0 - 2 * 0 1 0 1 0 1 * 1 1 * 0 * * 2 * * 2 * 2 2 * * 0 * * * * 1 * *
GL28-2 GL28-2-200610 2020 06 10 7.66 1,730 6.95 4.99 < 1.0 301 < 2.0 237 8.74 12 657 < 0.050 0.466 12.5 < 0.010 18.6 0.0520 0.30 0.189 0.58 < 0.050 43.8 < 0.010 5.31 1.33 0.60 < 0.010 6,550 0.0053 < 0.050 < 0.20 < 0.20 151 1.15 1.1
GL28-2-201104 2020 11 04 7.70 2,200 6.9 6.26 < 1.0 397 171 293 19.2 14.2 955 < 0.050 0.414 13.4 < 0.010 16.9 0.0582 28.2 0.310 1.13 < 0.050 53.9 < 0.010 5.86 3.06 1.05 < 0.010 8,600 0.0089 < 0.050 < 0.20 < 0.20 196 1.15 < 1.0
GL28-3 GL28-3-200610 2020 06 10 7.67 2,890 6.92 9.25 < 1.0 395 < 2.0 462 130 12.7 1,190 0.110 0.893 19.9 0.012 6.0 0.180 0.35 0.356 1.45 < 0.050 40.5 < 0.010 13.1 8.14 0.23 < 0.010 9,460 0.0300 < 0.050 0.22 < 0.20 273 1.68 1.8
GL28-3-201105 2020 11 05 7.75 2,870 6.96 9.33 < 1.0 408 4.2 448 281 12.3 1,170 0.142 0.815 19.2 < 0.010 5.0 0.227 0.28 0.484 1.69 < 0.050 46.5 < 0.010 16.5 11.6 0.17 < 0.010 8,710 0.0416 0.087 0.34 < 0.20 269 2.02 3.0
Associated CARO file(s): 0030839, 0060827, 0060994, 0061179, 0061343, 0061444, 0061688, 0061843, 0081411, 0082156, 0082778, 0091179, 20J1574, 20J1805, 20J1862, 20J2273, 20J3219, 20K0127, 20K0624, 20K0764, 20K0824, 20K0932, 20K1802, 20K2368.
All terms defined within the body of SNC-Lavalin's report.
< Denotes concentration less than indicated detection limit or RPD less than indicated value.a Laboratory detection limit exceeds regulatory standard/guideline.
- Denotes analysis not conducted.b Pathways Included: Aesthethic Objectives, Maximum Acceptable Concentrations.
n/a Denotes no applicable standard/guideline.c Guideline is pH dependent.
QA/QC RPD Denotes quality assurance/quality control relative percent differenced Guideline is hardness dependent.
* RPDs are not calculated where one or more concentrations are less than five times RDL.e Guideline is temperature, pH, DOC and hardness dependent. Calculate using BLM software!
RDL Denotes reported detection limit.f Guideline to protect freshwater aquatic life, long-term average (i.e. "chronic").g Guideline to protect freshwater aquatic life, short-term maximum (i.e. "acute").
BOLD Concentration greater than Canadian Drinking Water Quality Guidelines (CDWQG) Guidelineh Only applies for specific Schedule 2 Site Activities; verify for your site.
SHADED Concentration greater than BCWQG Drinking Water (DW) - AO guidelinei Individual standards exist for Cr +3 and Cr +6. Reported value represents more stringent standard.
SHADED Concentration greater than BCWQG Drinking Water (DW) - MAC guidelinej Interim BC MoE Regional Background Estimate (Protocol 9 Determining Background Groundwater Quality).
RED Concentration greater than CSR Drinking Water (DW) standard
BLUE SHADED Concentration greater than BCWQG Aquatic Life Long-Term Average (AW) guideline
BLUE SHADED Concentration greater than BCWQG Aquatic Life Short-term Maximum (AW) guideline
SNC-LAVALIN INC. Page 1 of 1
662036 / 2021 02 0920210309_662036_TAB.xlsx
QAQC CN 2021 03 09
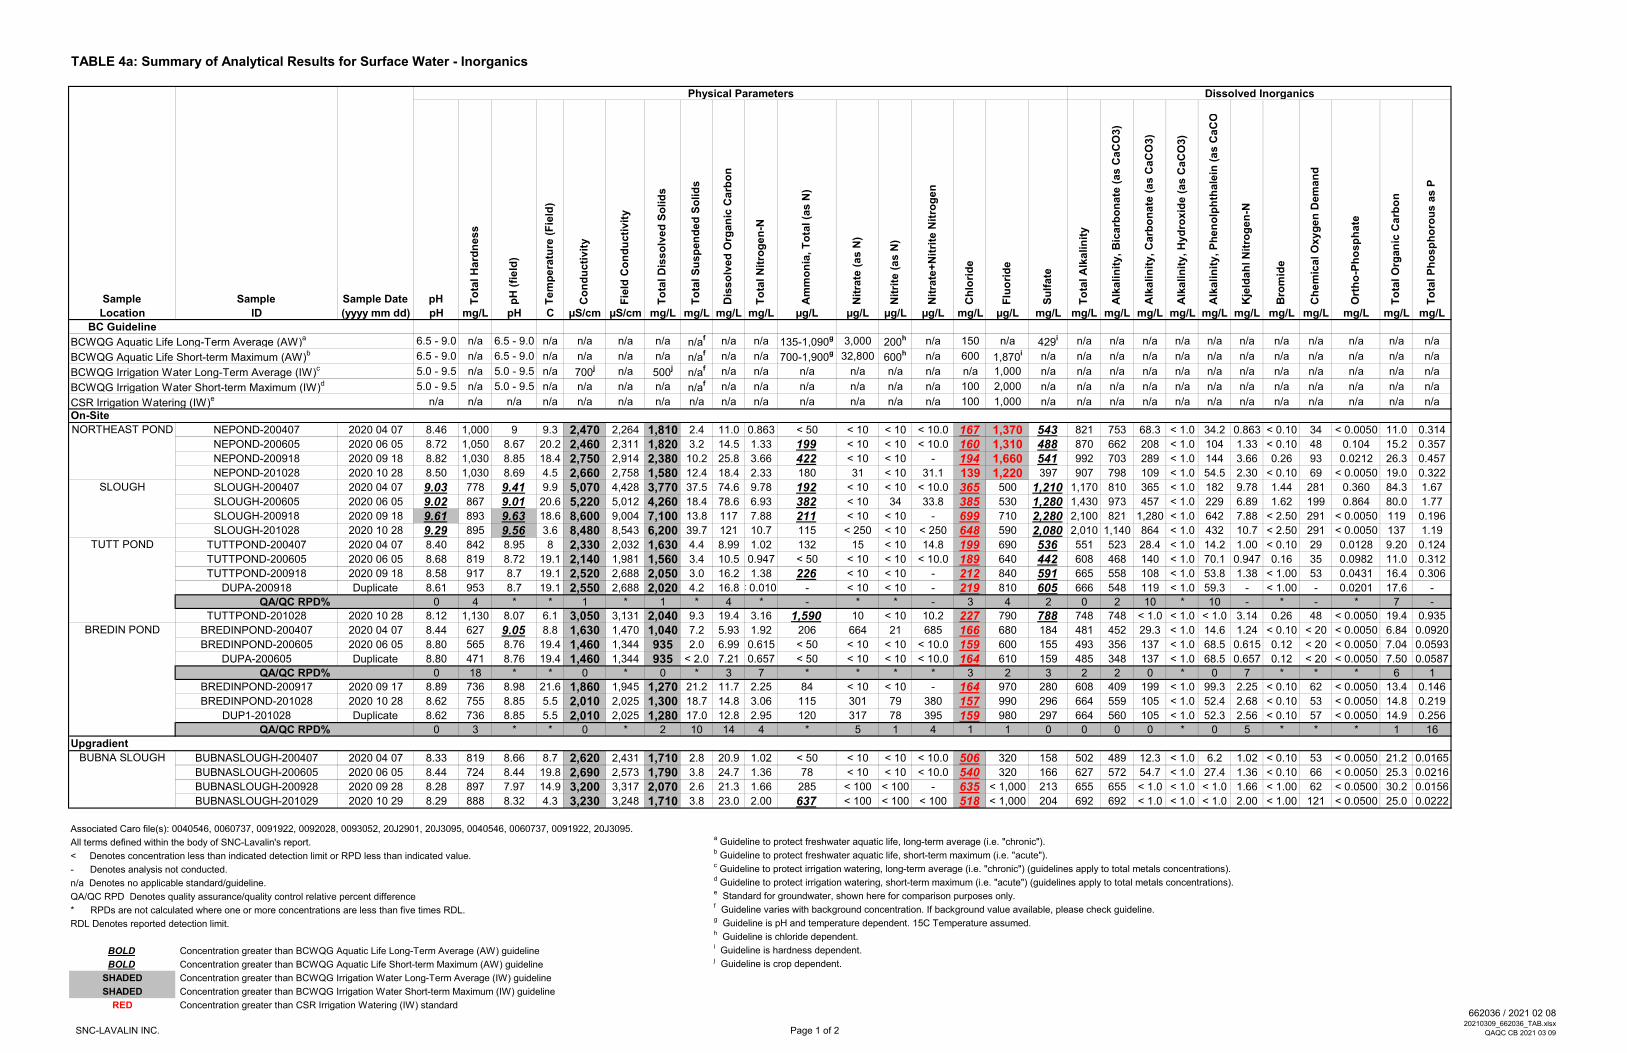
TABLE 4a: Summary of Analytical Results for Surface Water - Inorganics
Physical Parameters Dissolved Inorganics
Sample Sample Sample Date pH To
tal
Ha
rdn
es
s
pH
(fi
eld
)
Te
mp
era
ture
(F
ield
)
Co
nd
uc
tiv
ity
Fie
ld C
on
du
cti
vit
y
To
tal
Dis
so
lve
d S
oli
ds
To
tal
Su
sp
en
de
d S
oli
ds
Dis
so
lve
d O
rga
nic
Ca
rbo
n
To
tal
Nit
rog
en
-N
Am
mo
nia
, T
ota
l (a
s N
)
Nit
rate
(a
s N
)
Nit
rite
(a
s N
)
Nit
rate
+N
itri
te N
itro
ge
n
Ch
lori
de
Flu
ori
de
Su
lfa
te
To
tal
Alk
ali
nit
y
Alk
ali
nit
y,
Bic
arb
on
ate
(a
s C
aC
O3
)
Alk
ali
nit
y,
Ca
rbo
na
te (
as
Ca
CO
3)
Alk
ali
nit
y,
Hy
dro
xid
e (
as
Ca
CO
3)
Alk
ali
nit
y,
Ph
en
olp
hth
ale
in (
as
Ca
CO
3)
Kje
lda
hl
Nit
rog
en
-N
Bro
mid
e
Ch
em
ica
l O
xy
ge
n D
em
an
d
Ort
ho
-Ph
os
ph
ate
To
tal
Org
an
ic C
arb
on
To
tal
Ph
os
ph
oro
us
as
P
Location ID (yyyy mm dd) pH mg/L pH C µS/cm µS/cm mg/L mg/L mg/L mg/L µg/L µg/L µg/L µg/L mg/L µg/L mg/L mg/L mg/L mg/L mg/L mg/L mg/L mg/L mg/L mg/L mg/L mg/L
BC Guideline
BCWQG Aquatic Life Long-Term Average (AW)a 6.5 - 9.0 n/a 6.5 - 9.0 n/a n/a n/a n/a n/a
f n/a n/a 135-1,090g 3,000 200
h n/a 150 n/a 429i n/a n/a n/a n/a n/a n/a n/a n/a n/a n/a n/a
BCWQG Aquatic Life Short-term Maximum (AW)b 6.5 - 9.0 n/a 6.5 - 9.0 n/a n/a n/a n/a n/a
f n/a n/a 700-1,900g 32,800 600
h n/a 600 1,870i n/a n/a n/a n/a n/a n/a n/a n/a n/a n/a n/a n/a
BCWQG Irrigation Water Long-Term Average (IW)c 5.0 - 9.5 n/a 5.0 - 9.5 n/a 700
j n/a 500j
n/af n/a n/a n/a n/a n/a n/a n/a 1,000 n/a n/a n/a n/a n/a n/a n/a n/a n/a n/a n/a n/a
BCWQG Irrigation Water Short-term Maximum (IW)d 5.0 - 9.5 n/a 5.0 - 9.5 n/a n/a n/a n/a n/a
f n/a n/a n/a n/a n/a n/a 100 2,000 n/a n/a n/a n/a n/a n/a n/a n/a n/a n/a n/a n/a
CSR Irrigation Watering (IW)e n/a n/a n/a n/a n/a n/a n/a n/a n/a n/a n/a n/a n/a n/a 100 1,000 n/a n/a n/a n/a n/a n/a n/a n/a n/a n/a n/a n/a
NORTHEAST POND NEPOND-200407 2020 04 07 8.46 1,000 9 9.3 2,470 2,264 1,810 2.4 11.0 0.863 < 50 < 10 < 10 < 10.0 167 1,370 543 821 753 68.3 < 1.0 34.2 0.863 < 0.10 34 < 0.0050 11.0 0.314
NEPOND-200605 2020 06 05 8.72 1,050 8.67 20.2 2,460 2,311 1,820 3.2 14.5 1.33 199 < 10 < 10 < 10.0 160 1,310 488 870 662 208 < 1.0 104 1.33 < 0.10 48 0.104 15.2 0.357
NEPOND-200918 2020 09 18 8.82 1,030 8.85 18.4 2,750 2,914 2,380 10.2 25.8 3.66 422 < 10 < 10 - 194 1,660 541 992 703 289 < 1.0 144 3.66 0.26 93 0.0212 26.3 0.457
NEPOND-201028 2020 10 28 8.50 1,030 8.69 4.5 2,660 2,758 1,580 12.4 18.4 2.33 180 31 < 10 31.1 139 1,220 397 907 798 109 < 1.0 54.5 2.30 < 0.10 69 < 0.0050 19.0 0.322
SLOUGH SLOUGH-200407 2020 04 07 9.03 778 9.41 9.9 5,070 4,428 3,770 37.5 74.6 9.78 192 < 10 < 10 < 10.0 365 500 1,210 1,170 810 365 < 1.0 182 9.78 1.44 281 0.360 84.3 1.67
SLOUGH-200605 2020 06 05 9.02 867 9.01 20.6 5,220 5,012 4,260 18.4 78.6 6.93 382 < 10 34 33.8 385 530 1,280 1,430 973 457 < 1.0 229 6.89 1.62 199 0.864 80.0 1.77
SLOUGH-200918 2020 09 18 9.61 893 9.63 18.6 8,600 9,004 7,100 13.8 117 7.88 211 < 10 < 10 - 699 710 2,280 2,100 821 1,280 < 1.0 642 7.88 < 2.50 291 < 0.0050 119 0.196
SLOUGH-201028 2020 10 28 9.29 895 9.56 3.6 8,480 8,543 6,200 39.7 121 10.7 115 < 250 < 10 < 250 648 590 2,080 2,010 1,140 864 < 1.0 432 10.7 < 2.50 291 < 0.0050 137 1.19
TUTT POND TUTTPOND-200407 2020 04 07 8.40 842 8.95 8 2,330 2,032 1,630 4.4 8.99 1.02 132 15 < 10 14.8 199 690 536 551 523 28.4 < 1.0 14.2 1.00 < 0.10 29 0.0128 9.20 0.124
TUTTPOND-200605 2020 06 05 8.68 819 8.72 19.1 2,140 1,981 1,560 3.4 10.5 0.947 < 50 < 10 < 10 < 10.0 189 640 442 608 468 140 < 1.0 70.1 0.947 0.16 35 0.0982 11.0 0.312
TUTTPOND-200918 2020 09 18 8.58 917 8.7 19.1 2,520 2,688 2,050 3.0 16.2 1.38 226 < 10 < 10 - 212 840 591 665 558 108 < 1.0 53.8 1.38 < 1.00 53 0.0431 16.4 0.306
DUPA-200918 Duplicate 8.61 953 8.7 19.1 2,550 2,688 2,020 4.2 16.8< 0.0100 - < 10 < 10 - 219 810 605 666 548 119 < 1.0 59.3 - < 1.00 - 0.0201 17.6 -
QA/QC RPD% 0 4 * * 1 * 1 * 4 * - * * - 3 4 2 0 2 10 * 10 - * - * 7 -
TUTTPOND-201028 2020 10 28 8.12 1,130 8.07 6.1 3,050 3,131 2,040 9.3 19.4 3.16 1,590 10 < 10 10.2 227 790 788 748 748 < 1.0 < 1.0 < 1.0 3.14 0.26 48 < 0.0050 19.4 0.935
BREDIN POND BREDINPOND-200407 2020 04 07 8.44 627 9.05 8.8 1,630 1,470 1,040 7.2 5.93 1.92 206 664 21 685 166 680 184 481 452 29.3 < 1.0 14.6 1.24 < 0.10 < 20 < 0.0050 6.84 0.0920
BREDINPOND-200605 2020 06 05 8.80 565 8.76 19.4 1,460 1,344 935 2.0 6.99 0.615 < 50 < 10 < 10 < 10.0 159 600 155 493 356 137 < 1.0 68.5 0.615 0.12 < 20 < 0.0050 7.04 0.0593
DUPA-200605 Duplicate 8.80 471 8.76 19.4 1,460 1,344 935 < 2.0 7.21 0.657 < 50 < 10 < 10 < 10.0 164 610 159 485 348 137 < 1.0 68.5 0.657 0.12 < 20 < 0.0050 7.50 0.0587
QA/QC RPD% 0 18 * * 0 * 0 * 3 7 * * * * 3 2 3 2 2 0 * 0 7 * * * 6 1
BREDINPOND-200917 2020 09 17 8.89 736 8.98 21.6 1,860 1,945 1,270 21.2 11.7 2.25 84 < 10 < 10 - 164 970 280 608 409 199 < 1.0 99.3 2.25 < 0.10 62 < 0.0050 13.4 0.146
BREDINPOND-201028 2020 10 28 8.62 755 8.85 5.5 2,010 2,025 1,300 18.7 14.8 3.06 115 301 79 380 157 990 296 664 559 105 < 1.0 52.4 2.68 < 0.10 53 < 0.0050 14.8 0.219
DUP1-201028 Duplicate 8.62 736 8.85 5.5 2,010 2,025 1,280 17.0 12.8 2.95 120 317 78 395 159 980 297 664 560 105 < 1.0 52.3 2.56 < 0.10 57 < 0.0050 14.9 0.256
QA/QC RPD% 0 3 * * 0 * 2 10 14 4 * 5 1 4 1 1 0 0 0 0 * 0 5 * * * 1 16
BUBNA SLOUGH BUBNASLOUGH-200407 2020 04 07 8.33 819 8.66 8.7 2,620 2,431 1,710 2.8 20.9 1.02 < 50 < 10 < 10 < 10.0 506 320 158 502 489 12.3 < 1.0 6.2 1.02 < 0.10 53 < 0.0050 21.2 0.0165
BUBNASLOUGH-200605 2020 06 05 8.44 724 8.44 19.8 2,690 2,573 1,790 3.8 24.7 1.36 78 < 10 < 10 < 10.0 540 320 166 627 572 54.7 < 1.0 27.4 1.36 < 0.10 66 < 0.0050 25.3 0.0216
BUBNASLOUGH-200928 2020 09 28 8.28 897 7.97 14.9 3,200 3,317 2,070 2.6 21.3 1.66 285 < 100 < 100 - 635 < 1,000 213 655 655 < 1.0 < 1.0 < 1.0 1.66 < 1.00 62 < 0.0500 30.2 0.0156
BUBNASLOUGH-201029 2020 10 29 8.29 888 8.32 4.3 3,230 3,248 1,710 3.8 23.0 2.00 637 < 100 < 100 < 100 518 < 1,000 204 692 692 < 1.0 < 1.0 < 1.0 2.00 < 1.00 121 < 0.0500 25.0 0.0222
Associated Caro file(s): 0040546, 0060737, 0091922, 0092028, 0093052, 20J2901, 20J3095, 0040546, 0060737, 0091922, 20J3095.
All terms defined within the body of SNC-Lavalin's report.a Guideline to protect freshwater aquatic life, long-term average (i.e. "chronic").
< Denotes concentration less than indicated detection limit or RPD less than indicated value.b Guideline to protect freshwater aquatic life, short-term maximum (i.e. "acute").
- Denotes analysis not conducted.c Guideline to protect irrigation watering, long-term average (i.e. "chronic") (guidelines apply to total metals concentrations).
n/a Denotes no applicable standard/guideline.d Guideline to protect irrigation watering, short-term maximum (i.e. "acute") (guidelines apply to total metals concentrations).
QA/QC RPD Denotes quality assurance/quality control relative percent differencee Standard for groundwater, shown here for comparison purposes only.
* RPDs are not calculated where one or more concentrations are less than five times RDL.f Guideline varies with background concentration. If background value available, please check guideline.
RDL Denotes reported detection limit.g Guideline is pH and temperature dependent. 15C Temperature assumed.
h Guideline is chloride dependent.
BOLD Concentration greater than BCWQG Aquatic Life Long-Term Average (AW) guidelinei Guideline is hardness dependent.
BOLD Concentration greater than BCWQG Aquatic Life Short-term Maximum (AW) guidelinej Guideline is crop dependent.
SHADED Concentration greater than BCWQG Irrigation Water Long-Term Average (IW) guideline
SHADED Concentration greater than BCWQG Irrigation Water Short-term Maximum (IW) guideline
RED Concentration greater than CSR Irrigation Watering (IW) standard
On-Site
Upgradient
SNC-LAVALIN INC. Page 1 of 2
662036 / 2021 02 0820210309_662036_TAB.xlsx
QAQC CB 2021 03 09

TABLE 4a: Summary of Analytical Results for Surface Water - Inorganics
Physical Parameters Dissolved Inorganics
Sample Sample Sample Date pH To
tal
Ha
rdn
es
s
pH
(fi
eld
)
Te
mp
era
ture
(F
ield
)
Co
nd
uc
tiv
ity
Fie
ld C
on
du
cti
vit
y
To
tal
Dis
so
lve
d S
oli
ds
To
tal
Su
sp
en
de
d S
oli
ds
Dis
so
lve
d O
rga
nic
Ca
rbo
n
To
tal
Nit
rog
en
-N
Am
mo
nia
, T
ota
l (a
s N
)
Nit
rate
(a
s N
)
Nit
rite
(a
s N
)
Nit
rate
+N
itri
te N
itro
ge
n
Ch
lori
de
Flu
ori
de
Su
lfa
te
To
tal
Alk
ali
nit
y
Alk
ali
nit
y,
Bic
arb
on
ate
(a
s C
aC
O3
)
Alk
ali
nit
y,
Ca
rbo
na
te (
as
Ca
CO
3)
Alk
ali
nit
y,
Hy
dro
xid
e (
as
Ca
CO
3)
Alk
ali
nit
y,
Ph
en
olp
hth
ale
in (
as
Ca
CO
3)
Kje
lda
hl
Nit
rog
en
-N
Bro
mid
e
Ch
em
ica
l O
xy
ge
n D
em
an
d
Ort
ho
-Ph
os
ph
ate
To
tal
Org
an
ic C
arb
on
To
tal
Ph
os
ph
oro
us
as
P
Location ID (yyyy mm dd) pH mg/L pH C µS/cm µS/cm mg/L mg/L mg/L mg/L µg/L µg/L µg/L µg/L mg/L µg/L mg/L mg/L mg/L mg/L mg/L mg/L mg/L mg/L mg/L mg/L mg/L mg/L
BC Guideline
BCWQG Aquatic Life Long-Term Average (AW)a 6.5 - 9.0 n/a 6.5 - 9.0 n/a n/a n/a n/a n/a
f n/a n/a 135-1,090g 3,000 200
h n/a 150 n/a 429i n/a n/a n/a n/a n/a n/a n/a n/a n/a n/a n/a
BCWQG Aquatic Life Short-term Maximum (AW)b 6.5 - 9.0 n/a 6.5 - 9.0 n/a n/a n/a n/a n/a
f n/a n/a 700-1,900g 32,800 600
h n/a 600 1,870i n/a n/a n/a n/a n/a n/a n/a n/a n/a n/a n/a n/a
BCWQG Irrigation Water Long-Term Average (IW)c 5.0 - 9.5 n/a 5.0 - 9.5 n/a 700
j n/a 500j
n/af n/a n/a n/a n/a n/a n/a n/a 1,000 n/a n/a n/a n/a n/a n/a n/a n/a n/a n/a n/a n/a
BCWQG Irrigation Water Short-term Maximum (IW)d 5.0 - 9.5 n/a 5.0 - 9.5 n/a n/a n/a n/a n/a
f n/a n/a n/a n/a n/a n/a 100 2,000 n/a n/a n/a n/a n/a n/a n/a n/a n/a n/a n/a n/a
CSR Irrigation Watering (IW)e n/a n/a n/a n/a n/a n/a n/a n/a n/a n/a n/a n/a n/a n/a 100 1,000 n/a n/a n/a n/a n/a n/a n/a n/a n/a n/a n/a n/a
SLOUGH #2 SLOUGH #2-200407 2020 04 07 8.58 590 - - 4,260 - 2,950 4.8 36.8 2.53 339 12 < 10 11.9 492 630 897 671 586 85.4 < 1.0 42.7 2.52 0.95 96 < 0.0050 37.3 0.0690
SLOUGH #2-200605 2020 06 05 9.00 506 - - 4,230 - 3,070 6.4 49.5 2.85 < 50 < 10 < 10 < 10.0 512 660 933 766 487 278 < 1.0 139 2.85 < 10.0 142 < 0.0050 52.0 0.0660
SLOUGH #2-200917 2020 09 17 8.70 811 - - 5,320 - 3,880 4.0 46.4 3.21 550 < 10 < 10 - 623 830 1,180 841 677 164 < 1.0 82.2 3.21 < 0.10 133 < 0.0050 48.3 0.0714
SLOUGH #2-201029 2020 10 29 8.51 657 - - 5,420 - 3,580 2.4 46.4 3.61 1,160 < 100 < 100 < 100 617 < 1,000 1,190 862 782 79.7 < 1.0 39.8 3.61 1.68 110 < 0.0500 48.4 0.0398
LITTLE ROBERT LK LITTLEROBERTLAKE-200928 2020 09 28 8.72 1,330 8.76 14.2 4,350 4,285 3,490 153 24.0 2.85 211 < 100 < 100 - 115 < 1,000 1,720 675 520 155 < 1.0 77.7 2.85 < 1.00 93 0.564 27.2 1.50
LITTLEROBERTLAKE-201029 2020 10 29 8.50 1,300 8.71 5 4,150 4,187 3,210 6.4 19.5 2.65 440 309 < 100 309 103 < 1,000 1,540 697 621 75.8 < 1.0 37.9 2.34 < 1.00 52 0.618 23.3 1.58
LTTILEROBERTLAKE-200605 2020 06 05 8.86 1,240 8.97 20.5 3,520 3,393 3,040 8.8 23.5 1.78 < 50 < 10 < 10 < 10.0 116 430 1,630 648 414 234 < 1.0 117 1.78 < 1.00 50 0.604 25.7 0.592
ROBERT LK ROBERTLAKE-200407 2020 04 07 8.87 1,190 9.4 14 7,620 6,679 6,240 21.7 38.2 3.64 68 < 10 < 10 < 10.0 203 590 3,350 1,170 873 294 < 1.0 147 3.64 < 0.10 117 1.26 39.3 2.95
ROBERTLAKE-200605 2020 06 05 8.81 1,220 8.86 21.1 7,520 735.8 7,100 147 53.3 7.34 438 < 1,000 < 10 < 1,000 193 630 3,560 1,440 1,090 349 < 1.0 175 7.34 < 10.0 245 2.70 57.5 4.96
ROBERTLAKE-200928 2020 09 28 8.97 1,450 8.92 15.4 10,400 10,282 8,580 32.0 60.3 6.66 1,160 < 100 107 - 262 < 1,000 4,160 1,560 1,050 516 < 1.0 258 6.56 < 1.00 179 1.88 64.1 3.47
ROBERTLAKE-201028 2020 10 28 8.94 1,380 9.18 4 9,880 9,840 7,960 44.7 58.4 6.80 129 < 250 79 < 250 245 630 4,160 1,580 1,100 477 < 1.0 239 6.72 0.98 153 0.869 68.3 3.47
Associated Caro file(s): 0040546, 0060737, 0091922, 0092028, 0093052, 20J2901, 20J3095, 0040546, 0060737, 0091922, 20J3095.
All terms defined within the body of SNC-Lavalin's report.a Guideline to protect freshwater aquatic life, long-term average (i.e. "chronic").
< Denotes concentration less than indicated detection limit or RPD less than indicated value.b Guideline to protect freshwater aquatic life, short-term maximum (i.e. "acute").c
- Denotes analysis not conducted.c Guideline to protect irrigation watering, long-term average (i.e. "chronic") (guidelines apply to total metals concentrations).
n/a Denotes no applicable standard/guideline.d Guideline to protect irrigation watering, short-term maximum (i.e. "acute") (guidelines apply to total metals concentrations).
QA/QC RPD Denotes quality assurance/quality control relative percent differencee Standard for groundwater, shown here for comparison purposes only.
* RPDs are not calculated where one or more concentrations are less than five times RDL.f Guideline varies with background concentration. If background value available, please check guideline.
RDL Denotes reported detection limit.g Guideline is pH and temperature dependent. 15C Temperature assumed.
h Guideline is chloride dependent.
BOLD Concentration greater than BCWQG Aquatic Life Long-Term Average (AW) guidelinei Guideline is hardness dependent.
BOLD Concentration greater than BCWQG Aquatic Life Short-term Maximum (AW) guidelinej Guideline is crop dependent.
SHADED Concentration greater than BCWQG Irrigation Water Long-Term Average (IW) guideline
SHADED Concentration greater than BCWQG Irrigation Water Short-term Maximum (IW) guideline
RED Concentration greater than CSR Irrigation Watering (IW) standard
Downgradient
SNC-LAVALIN INC. Page 2 of 2
662036 / 2021 02 0820210309_662036_TAB.xlsx
QAQC CB 2021 03 09

TABLE 4b: Summary of Analytical Results for Surface Water - Total Metals
Physical ParametersDissolved
MetalsTotal Metals
Sample Sample Sample Date pH To
tal H
ard
ness
pH
(fi
eld
)
Dis
so
lved
Org
an
ic C
arb
on
Co
pp
er
Alu
min
um
An
tim
on
y
Ars
en
ic
Bari
um
Bery
lliu
m
Bis
mu
th
Bo
ron
Cad
miu
m
Calc
ium
Ch
rom
ium
Co
balt
Co
pp
er
Iro
n
Lead
Lit
hiu
m
Mag
nesiu
m
Man
gan
ese
Merc
ury
Mo
lyb
den
um
Nic
kel
Po
tassiu
m
Sele
niu
m
Sil
ver
So
diu
m
Th
alliu
m
Tin
Tit
an
ium
Ura
niu
m
Van
ad
ium
Zin
c
Location ID (yyyy mm dd) pH mg/L pH mg/L µg/L µg/L µg/L µg/L µg/L µg/L µg/L µg/L µg/L µg/L µg/L µg/L µg/L µg/L µg/L µg/L µg/L µg/L µg/L µg/L µg/L µg/L µg/L µg/L µg/L µg/L µg/L µg/L µg/L µg/L µg/L
BC Guideline
BCWQG Aquatic Life Long-Term Average (AW)a 6.5 - 9.0 n/a 6.5 - 9.0 n/a 5.8-34.5
m n/a 9 n/a 1,000 0.13 n/a 1,200 n/a n/a 1 4 n/a n/a 19.6g n/a n/a 2,600
g0.02
h 1,000 150g n/a 2 1.5
g n/a 0.8 n/a n/a 8.5 n/a 187.5g
BCWQG Aquatic Life Short-term Maximum (AW)b 6.5 - 9.0 n/a 6.5 - 9.0 n/a 43.3-244
m n/a n/a 5 n/a n/a n/a n/a n/a n/a n/a 110 n/a 1,000 417g n/a n/a 3,390
g n/a 2,000 n/a n/a n/a 3g n/a n/a n/a n/a n/a n/a 340.5
g
BCWQG Irrigation Water Long-Term Average (IW)c 5.0 - 9.5 n/a 5.0 - 9.5 n/a n/a n/a n/a n/a n/a 100 n/a 500i n/a n/a 4.9 (Cr(+3)) 50 n/a n/a n/a 750i n/a 200 n/a 10j 200 n/a n/a n/a n/a n/a n/a n/a 10 100 5,000k
BCWQG Irrigation Water Short-term Maximum (IW)d 5.0 - 9.5 n/a 5.0 - 9.5 n/a 200 5,000 n/a 100 n/a n/a n/a n/a 5.1 n/a n/a n/a 200 n/a 200
j n/a n/a n/a 2 50j n/a n/a 10 n/a n/a n/a n/a n/a n/a n/a n/a
CSR Irrigation Watering (IW)e n/a n/a n/a n/a n/a 5,000 n/a 100 n/a 100 n/a 500 5 n/a 5 50 200 5,000
l 200 2,500 n/a 200l 1 10 200 n/a 20 n/a n/a n/a n/a n/a 10 100 n/a
NORTHEAST POND NEPOND-200407 2020 04 07 8.46 1,000 9 11.0 0.59 27.2 0.178 3.37 39.2 < 0.010 < 0.010 61.0 0.0056 53,000 0.58 0.324 0.67 55.4 0.060 44.1 211,000 176 < 0.010 22.2 2.94 15,900 0.38 < 0.010 298,000 < 0.0040 < 0.050 2.04 40.9 2.12 < 1.0
NEPOND-200605 2020 06 05 8.72 1,050 8.67 14.5 0.31 17.6 0.219 3.95 15.4 < 0.010 < 0.010 87.1 0.0069 52,600 0.14 0.245 0.32 36.8 < 0.050 40.2 223,000 132 < 0.010 18.6 2.45 17,600 0.28 < 0.010 328,000 < 0.0040 < 0.050 1.32 33.6 2.50 < 1.0
NEPOND-200918 2020 09 18 8.82 1,030 8.85 25.8 0.38 73.4 0.345 6.45 115 < 0.010 < 0.010 78.0 0.0061 39,400 0.36 0.545 0.66 149 0.117 34.8 226,000 318 < 0.010 18.6 3.01 22,100 0.33 < 0.010 322,000 < 0.0040 < 0.050 5.71 26.6 4.09 3.0
NEPOND-201028 2020 10 28 8.50 1,030 8.69 18.4 0.87 77.9 0.220 3.76 105 0.196 < 0.010 89.7 0.0084 40,500 0.27 0.621 10.6 151 0.157 48.2 225,000 261 < 0.010 22.0 3.28 17,600 0.22 < 0.010 323,000 < 0.0040 < 0.050 6.83 32.6 3.41 2.4
SLOUGH SLOUGH-200407 2020 04 07 9.03 778 9.41 74.6 4.33 679 2.12 19.1 51.1 0.028 0.023 319 0.0265 47,900 2.80 1.61 6.35 988 0.683 49.1 160,000 60.2 < 0.010 25.9 9.18 138,000 0.69 0.016 1,030,000 0.0060 0.451 39.4 46.1 13.3 7.3
SLOUGH-200605 2020 06 05 9.02 867 9.01 78.6 3.47 648 2.04 20.9 50.9 0.026 0.016 449 0.0152 45,400 1.98 1.26 4.45 915 0.498 56.3 183,000 25.1 < 0.010 24.7 9.00 151,000 0.51 0.012 1,060,000 0.0065 0.448 35.5 41.8 11.7 3.9
SLOUGH-200918 2020 09 18 9.61 893 9.63 117 2.58 131 4.15 37.5 22.8 < 0.010 0.013 366 0.0191 8,200 0.96 0.589 3.64 209 0.297 54.0 212,000 7.14 < 0.010 33.2 8.75 250,000 0.43 < 0.010 1,660,000 < 0.0040 0.340 9.83 46.5 7.07 4.6
SLOUGH-201028 2020 10 28 9.29 895 9.56 121 1.96 930 3.48 32.2 31.5 0.044 0.025 486 0.0298 16,600 2.74 1.35 4.18 1,190 0.772 71.0 207,000 48.4 < 0.010 31.7 11.4 229,000 0.67 0.022 2,010,000 0.0108 0.667 55.7 53.0 10.8 8.1
TUTT POND TUTTPOND-200407 2020 04 07 8.40 842 8.95 8.99 0.66 41.9 0.149 2.33 60.9 < 0.010 < 0.010 57.6 0.0053 84,100 0.95 0.446 0.85 65.6 0.050 33.1 154,000 92.1 < 0.010 10.1 2.01 11,800 0.88 < 0.010 245,000 < 0.0040 < 0.050 2.72 37.0 3.82 1.8
TUTTPOND-200605 2020 06 05 8.68 819 8.72 10.5 1.06 31.2 0.207 2.66 63.4 < 0.010 < 0.010 34.6 0.0062 81,800 0.21 0.418 1.19 59.8 0.054 28.7 149,000 39.0 < 0.010 10.1 1.98 12,300 0.70 < 0.010 237,000 < 0.0040 < 0.050 1.78 33.6 4.67 < 1.0
TUTTPOND-200918 2020 09 18 8.58 917 8.7 16.2 1.02 47.8 0.276 4.25 73.2 < 0.010 < 0.010 30.2 0.0090 77,200 0.30 0.624 1.23 87.2 0.083 23.6 176,000 131 < 0.010 13.7 2.61 16,700 0.78 < 0.010 286,000 < 0.0040 < 0.050 3.75 36.0 5.49 1.3
DUPA-200918 Duplicate 8.61 953 8.7 16.8 - 49.7 0.295 4.45 75.4 < 0.010 < 0.010 34.7 0.0081 78,800 0.32 0.655 1.37 92.1 0.085 23.8 184,000 135 < 0.010 13.8 2.68 17,600 0.75 < 0.010 300,000 < 0.0040 < 0.050 3.58 36.2 5.83 1.5
QA/QC RPD% 0 4 * 4 - 4 7 5 3 * * 14 * 2 * 5 11 5 * 1 4 3 * 1 3 5 4 * 5 * * 5 1 6 *
TUTTPOND-201028 2020 10 28 8.12 1,130 8.07 19.4 0.63 178 0.318 4.84 94.7 0.013 < 0.010 44.0 0.0133 114,000 0.71 0.811 1.48 273 0.178 33.5 205,000 470 < 0.010 11.0 3.85 16,400 1.69 < 0.010 364,000 < 0.0040 < 0.050 11.3 49.1 4.95 2.5
BREDIN POND BREDINPOND-200407 2020 04 07 8.44 627 9.05 5.93 0.69 87.1 0.101 0.875 72.4 < 0.010 < 0.010 25.9 0.0073 54,900 1.06 0.183 1.10 120 0.140 31.7 119,000 36.4 < 0.010 10.2 1.09 10,700 1.19 0.014 151,000 < 0.0040 0.050 4.55 24.7 2.94 3.7
BREDINPOND-200605 2020 06 05 8.80 565 8.76 6.99 0.89 28.7 0.128 0.963 76.8 < 0.010 < 0.010 27.8 0.0056 44,300 0.32 0.149 1.00 35.8 0.056 27.4 110,000 13.0 < 0.010 8.84 0.941 9,510 0.90 < 0.010 140,000 < 0.0040 < 0.050 1.31 20.2 2.95 1.3
DUPA-200605 Duplicate 8.80 471 8.76 7.21 0.86 24.5 0.155 0.971 78.7 < 0.010 < 0.010 13.9 0.0053 34,600 0.40 0.144 1.05 32.7 0.050 15.0 93,300 11.9 < 0.010 8.81 0.908 8,990 0.77 < 0.010 116,000 < 0.0040 < 0.050 1.73 19.2 2.45 1.2
QA/QC RPD% 0 18 * 3 3 16 * 1 2 * * 67 * 25 * 3 5 9 * 58 16 9 * 0 4 6 16 * 19 * * 28 5 19 *
BREDINPOND-200917 2020 09 17 8.89 736 8.98 11.7 0.35 56.3 0.181 2.48 65.6 < 0.010 < 0.010 41.9 0.0046 36,300 0.29 0.182 0.62 73.3 0.058 33.2 157,000 39.1 < 0.010 10.4 1.39 14,800 0.67 < 0.010 213,000 < 0.0040 < 0.050 2.67 20.1 2.63 3.0
BREDINPOND-201028 2020 10 28 8.62 755 8.85 14.8 2.30 70.9 0.173 2.46 95.2 < 0.010 < 0.010 51.5 0.0053 40,900 0.38 0.244 0.88 88.1 0.094 36.5 159,000 44.5 < 0.010 10.8 1.59 15,700 0.70 0.011 225,000 < 0.0040 < 0.050 3.39 20.9 2.24 3.6
DUP1-201028 Duplicate 8.62 736 8.85 12.8 0.47 72.9 0.184 2.31 96.7 < 0.010 < 0.010 54.2 0.0055 40,700 0.39 0.254 0.94 85.7 0.085 38.8 154,000 45.3 < 0.010 10.8 1.55 15,100 0.66 0.019 216,000 < 0.0040 < 0.050 3.88 20.4 2.31 3.1
QA/QC RPD% 0 3 * 14 * 3 * 6 2 * * 5 * 0 * 4 7 3 * 6 3 2 * 0 3 4 6 * 4 * * 13 2 3 *
BUBNA SLOUGH BUBNASLOUGH-200407 2020 04 07 8.33 819 8.66 20.9 0.19 6.7 0.171 1.60 21.3 < 0.010 < 0.010 30.2 0.0093 53,900 0.14 0.0420 0.26 11.7 < 0.050 73.1 166,000 7.23 < 0.010 0.936 0.494 25,400 0.12 < 0.010 325,000 < 0.0040 < 0.050 0.46 4.01 2.13 3.0BUBNASLOUGH-200605 2020 06 05 8.44 724 8.44 24.7 0.19 3.1 0.218 1.68 11.1 < 0.010 < 0.010 17.2 < 0.0020 38,200 0.11 0.0370 0.44 7.5 < 0.050 44.7 153,000 6.79 < 0.010 0.815 0.437 25,000 < 0.10 < 0.010 289,000 < 0.0040 < 0.050 0.32 3.26 1.00 < 1.0BUBNASLOUGH-200928 2020 09 28 8.28 897 7.97 21.3 0.49 3.5 0.192 1.66 21.0 < 0.010 < 0.010 39.8 < 0.0020 42,600 0.13 0.0353 0.83 7.1 < 0.050 86.7 192,000 20.6 < 0.010 0.561 0.444 30,600 < 0.10 < 0.010 375,000 < 0.0040 < 0.050 0.25 2.25 0.81 1.6BUBNASLOUGH-201029 2020 10 29 8.29 888 8.32 23.0 0.22 3.3 0.147 1.45 20.2 < 0.010 < 0.010 32.0 < 0.0020 41,500 < 0.10 0.0365 0.33 5.3 < 0.050 98.6 190,000 3.80 < 0.010 0.940 0.456 31,500 < 0.10 < 0.010 378,000 < 0.0040 < 0.050 0.30 3.70 0.80 1.1
SLOUGH #2 SLOUGH #2-200407 2020 04 07 8.58 590 - 36.8 0.53 16.8 0.354 4.08 15.0 < 0.010 < 0.010 29.6 0.0047 52,000 0.32 0.290 1.09 51.4 0.072 109 112,000 129 < 0.010 3.46 1.19 71,700 0.20 < 0.010 782,000 < 0.0040 < 0.050 1.77 15.9 1.38 2.4
SLOUGH #2-200605 2020 06 05 9.00 506 - 49.5 0.67 23.3 0.466 5.23 7.94 < 0.010 < 0.010 12.3 0.0061 35,800 0.59 0.322 0.70 64.3 0.101 67.8 101,000 41.0 < 0.010 3.77 1.49 71,400 0.16 < 0.010 823,000 < 0.0040 < 0.050 2.02 16.1 1.50 < 1.0
SLOUGH #2-200917 2020 09 17 8.70 811 - 46.4 0.43 12.5 0.616 7.92 29.1 < 0.010 < 0.010 19.8 0.0081 38,500 0.30 0.265 0.55 37.5 0.062 122 174,000 37.1 < 0.010 6.94 1.76 118,000 0.20 0.015 997,000 < 0.0040 < 0.050 1.29 22.2 2.27 1.7
SLOUGH #2-201029 2020 10 29 8.51 657 - 46.4 0.19 8.3 0.474 5.19 18.4 < 0.010 < 0.010 19.3 < 0.0020 37,100 0.13 0.181 < 0.20 33.2 0.070 156 137,000 39.2 < 0.010 5.18 1.18 96,100 0.20 < 0.010 1,100,000 < 0.0040 < 0.050 1.50 22.6 0.71 < 1.0
LITTLE ROBERT LK LITTLEROBERTLAKE-200928 2020 09 28 8.72 1,330 8.76 24.0 1.52 7,380 0.542 7.05 126 0.276 0.096 40.3 0.0648 167,000 15.5 5.09 12.5 8,430 3.93 50.3 221,000 376 < 0.010 7.20 13.7 25,900 0.48 0.037 632,000 0.0819 0.275 424 35.8 19.9 23.2
LITTLEROBERTLAKE-201029 2020 10 29 8.50 1,300 8.71 19.5 0.38 224 0.521 6.26 46.4 < 0.010 < 0.010 35.9 0.0049 142,000 0.60 0.426 0.69 249 0.148 45.1 229,000 131 < 0.010 6.79 1.67 26,100 0.38 < 0.010 658,000 < 0.0040 < 0.050 13.5 34.3 2.82 1.6
LTTILEROBERTLAKE-200605 2020 06 05 8.86 1,240 8.97 23.5 0.52 189 0.404 4.94 52.1 0.013 < 0.010 26.9 0.0088 144,000 0.54 0.639 1.11 274 0.182 20.1 213,000 63.5 < 0.010 9.98 2.17 19,700 0.25 < 0.010 561,000 < 0.0040 < 0.050 12.0 42.1 3.78 1.3
ROBERT LK ROBERTLAKE-200407 2020 04 07 8.87 1,190 9.4 38.2 2.07 420 0.436 8.04 42.6 0.016 < 0.010 51.1 0.0189 63,900 0.98 1.02 2.84 515 0.399 19.4 250,000 192 < 0.010 53.2 4.56 48,700 0.56 < 0.010 1,740,000 < 0.0040 < 0.050 26.5 91.5 10.2 3.2
ROBERTLAKE-200605 2020 06 05 8.81 1,220 8.86 53.3 1.17 850 0.558 8.90 56.7 0.038 0.014 43.1 0.0434 96,800 2.19 1.64 2.84 1,150 0.660 15.1 239,000 373 < 0.010 56.6 5.80 51,100 0.49 < 0.010 1,800,000 0.0080 0.075 71.6 94.6 10.0 5.3
ROBERTLAKE-200928 2020 09 28 8.97 1,450 8.92 60.3 2.18 1,430 0.611 11.9 58.8 0.046 0.019 63.4 0.0379 93,200 2.70 1.23 3.38 1,330 0.864 24.0 296,000 168 < 0.010 52.9 6.02 63,200 0.79 < 0.010 2,410,000 0.0113 0.066 77.4 90.7 7.73 7.7
ROBERTLAKE-201028 2020 10 28 8.94 1,380 9.18 58.4 2.02 1,790 0.621 12.1 61.6 0.077 0.021 65.9 0.0484 66,400 3.08 1.48 3.97 1,770 1.24 27.4 295,000 145 < 0.010 56.6 6.68 62,600 1.08 0.018 2,280,000 0.0165 0.071 104 90.0 11.3 9.2
Associated CARO file(s): 0040546, 0060737, 0091922, 0092028, 0093052, 20J2901, 20J3095.
All terms defined within the body of SNC-Lavalin's report.a Guideline to protect freshwater aquatic life, long-term average (i.e. "chronic").
< Denotes concentration less than indicated detection limit or RPD less than indicated value.b Guideline to protect freshwater aquatic life, short-term maximum (i.e. "acute").
- Denotes analysis not conducted.c Guideline to protect irrigation watering, long-term average (i.e. "chronic") (guidelines apply to total metals concentrations).
n/a Denotes no applicable standard/guideline.d Guideline to protect irrigation watering, short-term maximum (i.e. "acute") (guidelines apply to total metals concentrations).
QA/QC RPD Denotes quality assurance/quality control relative percent differencee Standard for groundwater, shown here for comparison purposes only.
* RPDs are not calculated where one or more concentrations are less than five times RDL.f Guideline varies with background concentration. If background value available, please check guideline.
RDL Denotes reported detection limit.g Guideline is hardness dependent.h Total Mercury guideline is based on the % of MethylMercury present. WQG = 0.0001 / (MeHg/total Hg), where MeHg is mass (or concentration) of methyl mercury and THg. Guideline shown assumes MeHg<0.5% of Total Hg.
BOLD Concentration greater than BCWQG Aquatic Life Long-Term Average (AW) guidelinei Guideline is crop dependent.
BOLD Concentration greater than BCWQG Aquatic Life Short-term Maximum (AW) guidelinej Guideline is soil dependent.
SHADED Concentration greater than BCWQG Irrigation Water Long-Term Average (IW) guidelinek Guideline is pH dependent.
SHADED Concentration greater than BCWQG Irrigation Water Short-term Maximum (IW) guidelinel Only applies for specific Schedule 2 Site Activities; verify for your site.
RED Concentration greater than CSR Irrigation Watering (IW) standardm Guideline is temperature, pH, DOC and hardness dependent. Calculate using BLM software!
Downgradient
Upgradient
SNC-LAVALIN INC. Page 1 of 1
662036 / 2021 02 0820210309_662036_TAB.xlsx
QAQC CN 2021 03 09
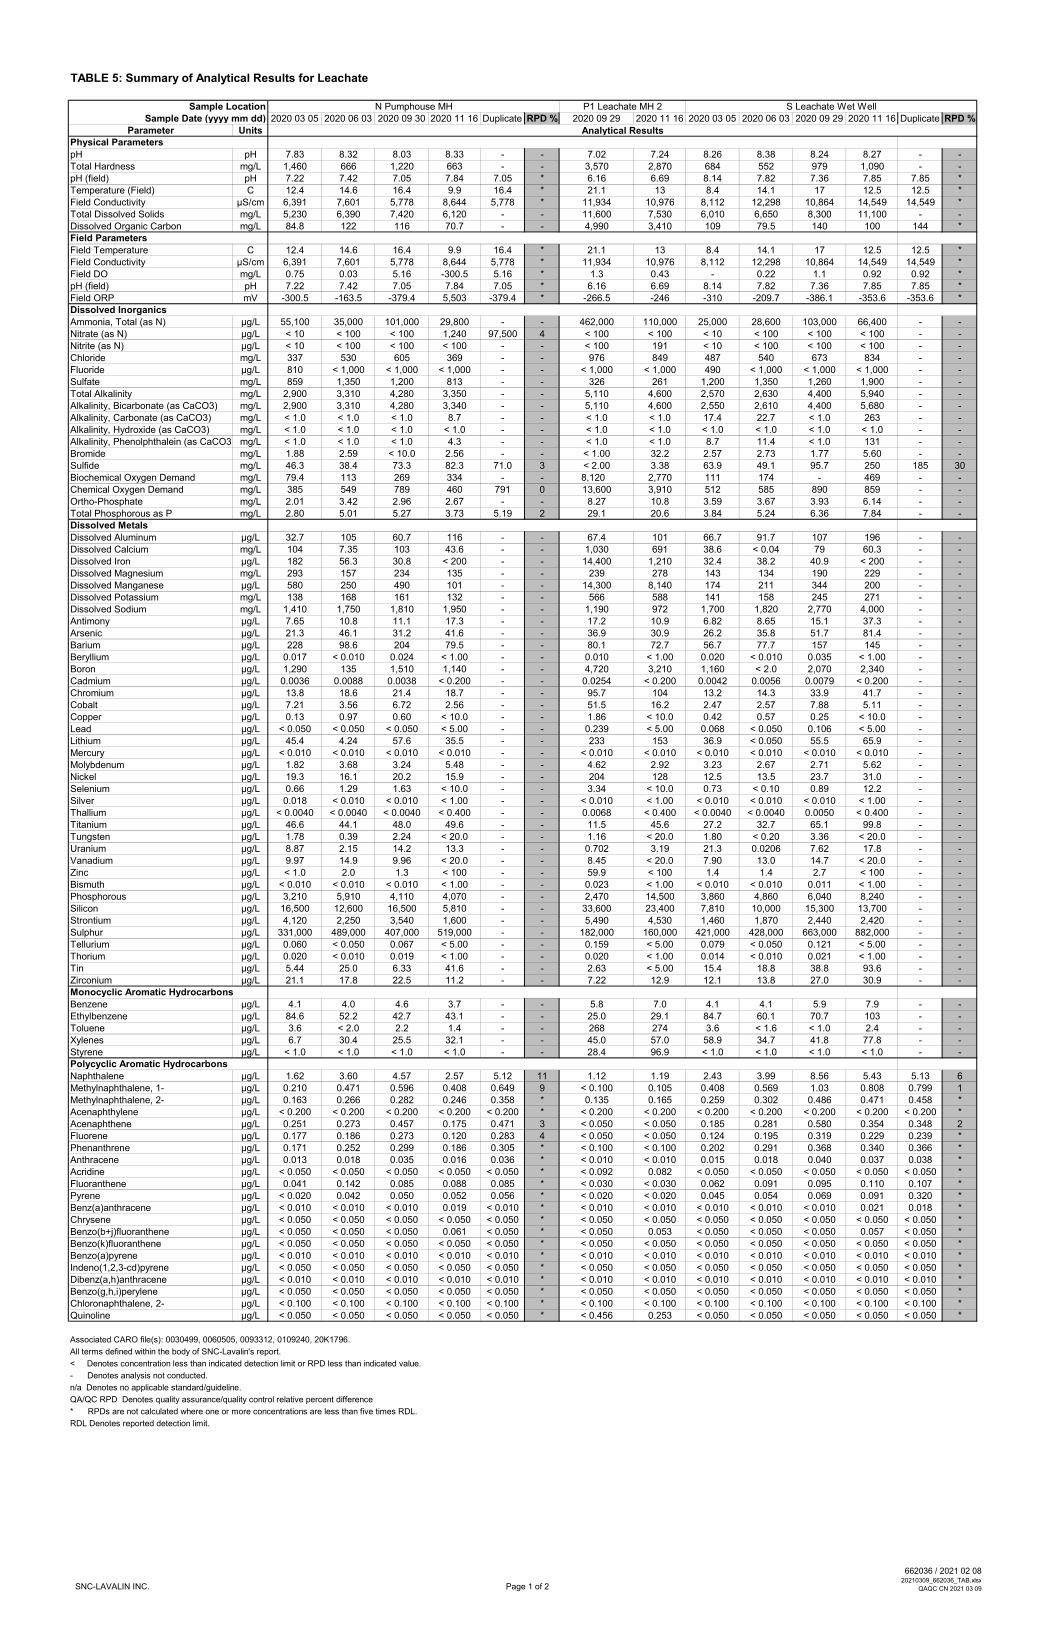
TABLE 5: Summary of Analytical Results for Leachate
Sample Location N Pumphouse MH P1 Leachate MH 2 S Leachate Wet WellSample Date (yyyy mm dd) 2020 03 05 2020 06 03 2020 09 30 2020 11 16 Duplicate RPD % 2020 09 29 2020 11 16 2020 03 05 2020 06 03 2020 09 29 2020 11 16 Duplicate RPD %
Parameter Units Analytical ResultsPhysical Parameters
pH pH 7.83 8.32 8.03 8.33 - - 7.02 7.24 8.26 8.38 8.24 8.27 - -Total Hardness mg/L 1,460 666 1,220 663 - - 3,570 2,870 684 552 979 1,090 - -pH (field) pH 7.22 7.42 7.05 7.84 7.05 * 6.16 6.69 8.14 7.82 7.36 7.85 7.85 *Temperature (Field) C 12.4 14.6 16.4 9.9 16.4 * 21.1 13 8.4 14.1 17 12.5 12.5 *Field Conductivity µS/cm 6,391 7,601 5,778 8,644 5,778 * 11,934 10,976 8,112 12,298 10,864 14,549 14,549 *Total Dissolved Solids mg/L 5,230 6,390 7,420 6,120 - - 11,600 7,530 6,010 6,650 8,300 11,100 - -Dissolved Organic Carbon mg/L 84.8 122 116 70.7 - - 4,990 3,410 109 79.5 140 100 144 *Field Parameters
Field Temperature C 12.4 14.6 16.4 9.9 16.4 * 21.1 13 8.4 14.1 17 12.5 12.5 *Field Conductivity µS/cm 6,391 7,601 5,778 8,644 5,778 * 11,934 10,976 8,112 12,298 10,864 14,549 14,549 *Field DO mg/L 0.75 0.03 5.16 -300.5 5.16 * 1.3 0.43 - 0.22 1.1 0.92 0.92 *pH (field) pH 7.22 7.42 7.05 7.84 7.05 * 6.16 6.69 8.14 7.82 7.36 7.85 7.85 *Field ORP mV -300.5 -163.5 -379.4 5,503 -379.4 * -266.5 -246 -310 -209.7 -386.1 -353.6 -353.6 *Dissolved Inorganics
Ammonia, Total (as N) µg/L 55,100 35,000 101,000 29,800 - - 462,000 110,000 25,000 28,600 103,000 66,400 - -Nitrate (as N) µg/L < 10 < 100 < 100 1,240 97,500 4 < 100 < 100 < 10 < 100 < 100 < 100 - -Nitrite (as N) µg/L < 10 < 100 < 100 < 100 - - < 100 191 < 10 < 100 < 100 < 100 - -Chloride mg/L 337 530 605 369 - - 976 849 487 540 673 834 - -Fluoride µg/L 810 < 1,000 < 1,000 < 1,000 - - < 1,000 < 1,000 490 < 1,000 < 1,000 < 1,000 - -Sulfate mg/L 859 1,350 1,200 813 - - 326 261 1,200 1,350 1,260 1,900 - -Total Alkalinity mg/L 2,900 3,310 4,280 3,350 - - 5,110 4,600 2,570 2,630 4,400 5,940 - -Alkalinity, Bicarbonate (as CaCO3) mg/L 2,900 3,310 4,280 3,340 - - 5,110 4,600 2,550 2,610 4,400 5,680 - -Alkalinity, Carbonate (as CaCO3) mg/L < 1.0 < 1.0 < 1.0 8.7 - - < 1.0 < 1.0 17.4 22.7 < 1.0 263 - -Alkalinity, Hydroxide (as CaCO3) mg/L < 1.0 < 1.0 < 1.0 < 1.0 - - < 1.0 < 1.0 < 1.0 < 1.0 < 1.0 < 1.0 - -Alkalinity, Phenolphthalein (as CaCO3) mg/L < 1.0 < 1.0 < 1.0 4.3 - - < 1.0 < 1.0 8.7 11.4 < 1.0 131 - -Bromide mg/L 1.88 2.59 < 10.0 2.56 - - < 1.00 32.2 2.57 2.73 1.77 5.60 - -Sulfide mg/L 46.3 38.4 73.3 82.3 71.0 3 < 2.00 3.38 63.9 49.1 95.7 250 185 30Biochemical Oxygen Demand mg/L 79.4 113 269 334 - - 8,120 2,770 111 174 - 469 - -Chemical Oxygen Demand mg/L 385 549 789 460 791 0 13,600 3,910 512 585 890 859 - -Ortho-Phosphate mg/L 2.01 3.42 2.96 2.67 - - 8.27 10.8 3.59 3.67 3.93 6.14 - -Total Phosphorous as P mg/L 2.80 5.01 5.27 3.73 5.19 2 29.1 20.6 3.84 5.24 6.36 7.84 - -Dissolved Metals
Dissolved Aluminum µg/L 32.7 105 60.7 116 - - 67.4 101 66.7 91.7 107 196 - -Dissolved Calcium mg/L 104 7.35 103 43.6 - - 1,030 691 38.6 < 0.04 79 60.3 - -Dissolved Iron µg/L 182 56.3 30.8 < 200 - - 14,400 1,210 32.4 38.2 40.9 < 200 - -Dissolved Magnesium mg/L 293 157 234 135 - - 239 278 143 134 190 229 - -Dissolved Manganese µg/L 580 250 490 101 - - 14,300 8,140 174 211 344 200 - -Dissolved Potassium mg/L 138 168 161 132 - - 566 588 141 158 245 271 - -Dissolved Sodium mg/L 1,410 1,750 1,810 1,950 - - 1,190 972 1,700 1,820 2,770 4,000 - -Antimony µg/L 7.65 10.8 11.1 17.3 - - 17.2 10.9 6.82 8.65 15.1 37.3 - -Arsenic µg/L 21.3 46.1 31.2 41.6 - - 36.9 30.9 26.2 35.8 51.7 81.4 - -Barium µg/L 228 98.6 204 79.5 - - 80.1 72.7 56.7 77.7 157 145 - -Beryllium µg/L 0.017 < 0.010 0.024 < 1.00 - - 0.010 < 1.00 0.020 < 0.010 0.035 < 1.00 - -Boron µg/L 1,290 135 1,510 1,140 - - 4,720 3,210 1,160 < 2.0 2,070 2,340 - -Cadmium µg/L 0.0036 0.0088 0.0038 < 0.200 - - 0.0254 < 0.200 0.0042 0.0056 0.0079 < 0.200 - -Chromium µg/L 13.8 18.6 21.4 18.7 - - 95.7 104 13.2 14.3 33.9 41.7 - -Cobalt µg/L 7.21 3.56 6.72 2.56 - - 51.5 16.2 2.47 2.57 7.88 5.11 - -Copper µg/L 0.13 0.97 0.60 < 10.0 - - 1.86 < 10.0 0.42 0.57 0.25 < 10.0 - -Lead µg/L < 0.050 < 0.050 < 0.050 < 5.00 - - 0.239 < 5.00 0.068 < 0.050 0.106 < 5.00 - -Lithium µg/L 45.4 4.24 57.6 35.5 - - 233 153 36.9 < 0.050 55.5 65.9 - -Mercury µg/L < 0.010 < 0.010 < 0.010 < 0.010 - - < 0.010 < 0.010 < 0.010 < 0.010 < 0.010 < 0.010 - -Molybdenum µg/L 1.82 3.68 3.24 5.48 - - 4.62 2.92 3.23 2.67 2.71 5.62 - -Nickel µg/L 19.3 16.1 20.2 15.9 - - 204 128 12.5 13.5 23.7 31.0 - -Selenium µg/L 0.66 1.29 1.63 < 10.0 - - 3.34 < 10.0 0.73 < 0.10 0.89 12.2 - -Silver µg/L 0.018 < 0.010 < 0.010 < 1.00 - - < 0.010 < 1.00 < 0.010 < 0.010 < 0.010 < 1.00 - -Thallium µg/L < 0.0040 < 0.0040 < 0.0040 < 0.400 - - 0.0068 < 0.400 < 0.0040 < 0.0040 0.0050 < 0.400 - -Titanium µg/L 46.6 44.1 48.0 49.6 - - 11.5 45.6 27.2 32.7 65.1 99.8 - -Tungsten µg/L 1.78 0.39 2.24 < 20.0 - - 1.16 < 20.0 1.80 < 0.20 3.36 < 20.0 - -Uranium µg/L 8.87 2.15 14.2 13.3 - - 0.702 3.19 21.3 0.0206 7.62 17.8 - -Vanadium µg/L 9.97 14.9 9.96 < 20.0 - - 8.45 < 20.0 7.90 13.0 14.7 < 20.0 - -Zinc µg/L < 1.0 2.0 1.3 < 100 - - 59.9 < 100 1.4 1.4 2.7 < 100 - -Bismuth µg/L < 0.010 < 0.010 < 0.010 < 1.00 - - 0.023 < 1.00 < 0.010 < 0.010 0.011 < 1.00 - -Phosphorous µg/L 3,210 5,910 4,110 4,070 - - 2,470 14,500 3,860 4,860 6,040 8,240 - -Silicon µg/L 16,500 12,600 16,500 5,810 - - 33,600 23,400 7,810 10,000 15,300 13,700 - -Strontium µg/L 4,120 2,250 3,540 1,600 - - 5,490 4,530 1,460 1,870 2,440 2,420 - -Sulphur µg/L 331,000 489,000 407,000 519,000 - - 182,000 160,000 421,000 428,000 663,000 882,000 - -Tellurium µg/L 0.060 < 0.050 0.067 < 5.00 - - 0.159 < 5.00 0.079 < 0.050 0.121 < 5.00 - -Thorium µg/L 0.020 < 0.010 0.019 < 1.00 - - 0.020 < 1.00 0.014 < 0.010 0.021 < 1.00 - -Tin µg/L 5.44 25.0 6.33 41.6 - - 2.63 < 5.00 15.4 18.8 38.8 93.6 - -Zirconium µg/L 21.1 17.8 22.5 11.2 - - 7.22 12.9 12.1 13.8 27.0 30.9 - -Monocyclic Aromatic Hydrocarbons
Benzene µg/L 4.1 4.0 4.6 3.7 - - 5.8 7.0 4.1 4.1 5.9 7.9 - -Ethylbenzene µg/L 84.6 52.2 42.7 43.1 - - 25.0 29.1 84.7 60.1 70.7 103 - -Toluene µg/L 3.6 < 2.0 2.2 1.4 - - 268 274 3.6 < 1.6 < 1.0 2.4 - -Xylenes µg/L 6.7 30.4 25.5 32.1 - - 45.0 57.0 58.9 34.7 41.8 77.8 - -Styrene µg/L < 1.0 < 1.0 < 1.0 < 1.0 - - 28.4 96.9 < 1.0 < 1.0 < 1.0 < 1.0 - -Polycyclic Aromatic Hydrocarbons
Naphthalene µg/L 1.62 3.60 4.57 2.57 5.12 11 1.12 1.19 2.43 3.99 8.56 5.43 5.13 6Methylnaphthalene, 1- µg/L 0.210 0.471 0.596 0.408 0.649 9 < 0.100 0.105 0.408 0.569 1.03 0.808 0.799 1Methylnaphthalene, 2- µg/L 0.163 0.266 0.282 0.246 0.358 * 0.135 0.165 0.259 0.302 0.486 0.471 0.458 *Acenaphthylene µg/L < 0.200 < 0.200 < 0.200 < 0.200 < 0.200 * < 0.200 < 0.200 < 0.200 < 0.200 < 0.200 < 0.200 < 0.200 *Acenaphthene µg/L 0.251 0.273 0.457 0.175 0.471 3 < 0.050 < 0.050 0.185 0.281 0.580 0.354 0.348 2Fluorene µg/L 0.177 0.186 0.273 0.120 0.283 4 < 0.050 < 0.050 0.124 0.195 0.319 0.229 0.239 *Phenanthrene µg/L 0.171 0.252 0.299 0.186 0.305 * < 0.100 < 0.100 0.202 0.291 0.368 0.340 0.366 *Anthracene µg/L 0.013 0.018 0.035 0.016 0.036 * < 0.010 < 0.010 0.015 0.018 0.040 0.037 0.038 *Acridine µg/L < 0.050 < 0.050 < 0.050 < 0.050 < 0.050 * < 0.092 0.082 < 0.050 < 0.050 < 0.050 < 0.050 < 0.050 *Fluoranthene µg/L 0.041 0.142 0.085 0.088 0.085 * < 0.030 < 0.030 0.062 0.091 0.095 0.110 0.107 *Pyrene µg/L < 0.020 0.042 0.050 0.052 0.056 * < 0.020 < 0.020 0.045 0.054 0.069 0.091 0.320 *Benz(a)anthracene µg/L < 0.010 < 0.010 < 0.010 0.019 < 0.010 * < 0.010 < 0.010 < 0.010 < 0.010 < 0.010 0.021 0.018 *Chrysene µg/L < 0.050 < 0.050 < 0.050 < 0.050 < 0.050 * < 0.050 < 0.050 < 0.050 < 0.050 < 0.050 < 0.050 < 0.050 *Benzo(b+j)fluoranthene µg/L < 0.050 < 0.050 < 0.050 0.061 < 0.050 * < 0.050 0.053 < 0.050 < 0.050 < 0.050 0.057 < 0.050 *Benzo(k)fluoranthene µg/L < 0.050 < 0.050 < 0.050 < 0.050 < 0.050 * < 0.050 < 0.050 < 0.050 < 0.050 < 0.050 < 0.050 < 0.050 *Benzo(a)pyrene µg/L < 0.010 < 0.010 < 0.010 < 0.010 < 0.010 * < 0.010 < 0.010 < 0.010 < 0.010 < 0.010 < 0.010 < 0.010 *Indeno(1,2,3-cd)pyrene µg/L < 0.050 < 0.050 < 0.050 < 0.050 < 0.050 * < 0.050 < 0.050 < 0.050 < 0.050 < 0.050 < 0.050 < 0.050 *Dibenz(a,h)anthracene µg/L < 0.010 < 0.010 < 0.010 < 0.010 < 0.010 * < 0.010 < 0.010 < 0.010 < 0.010 < 0.010 < 0.010 < 0.010 *Benzo(g,h,i)perylene µg/L < 0.050 < 0.050 < 0.050 < 0.050 < 0.050 * < 0.050 < 0.050 < 0.050 < 0.050 < 0.050 < 0.050 < 0.050 *Chloronaphthalene, 2- µg/L < 0.100 < 0.100 < 0.100 < 0.100 < 0.100 * < 0.100 < 0.100 < 0.100 < 0.100 < 0.100 < 0.100 < 0.100 *Quinoline µg/L < 0.050 < 0.050 < 0.050 < 0.050 < 0.050 * < 0.456 0.253 < 0.050 < 0.050 < 0.050 < 0.050 < 0.050 *
Associated CARO file(s): 0030499, 0060505, 0093312, 0109240, 20K1796.
All terms defined within the body of SNC-Lavalin's report.
< Denotes concentration less than indicated detection limit or RPD less than indicated value.
- Denotes analysis not conducted.
n/a Denotes no applicable standard/guideline.
QA/QC RPD Denotes quality assurance/quality control relative percent difference
* RPDs are not calculated where one or more concentrations are less than five times RDL.
RDL Denotes reported detection limit.
SNC-LAVALIN INC. Page 1 of 2
662036 / 2021 02 0820210309_662036_TAB.xlsx
QAQC CN 2021 03 09
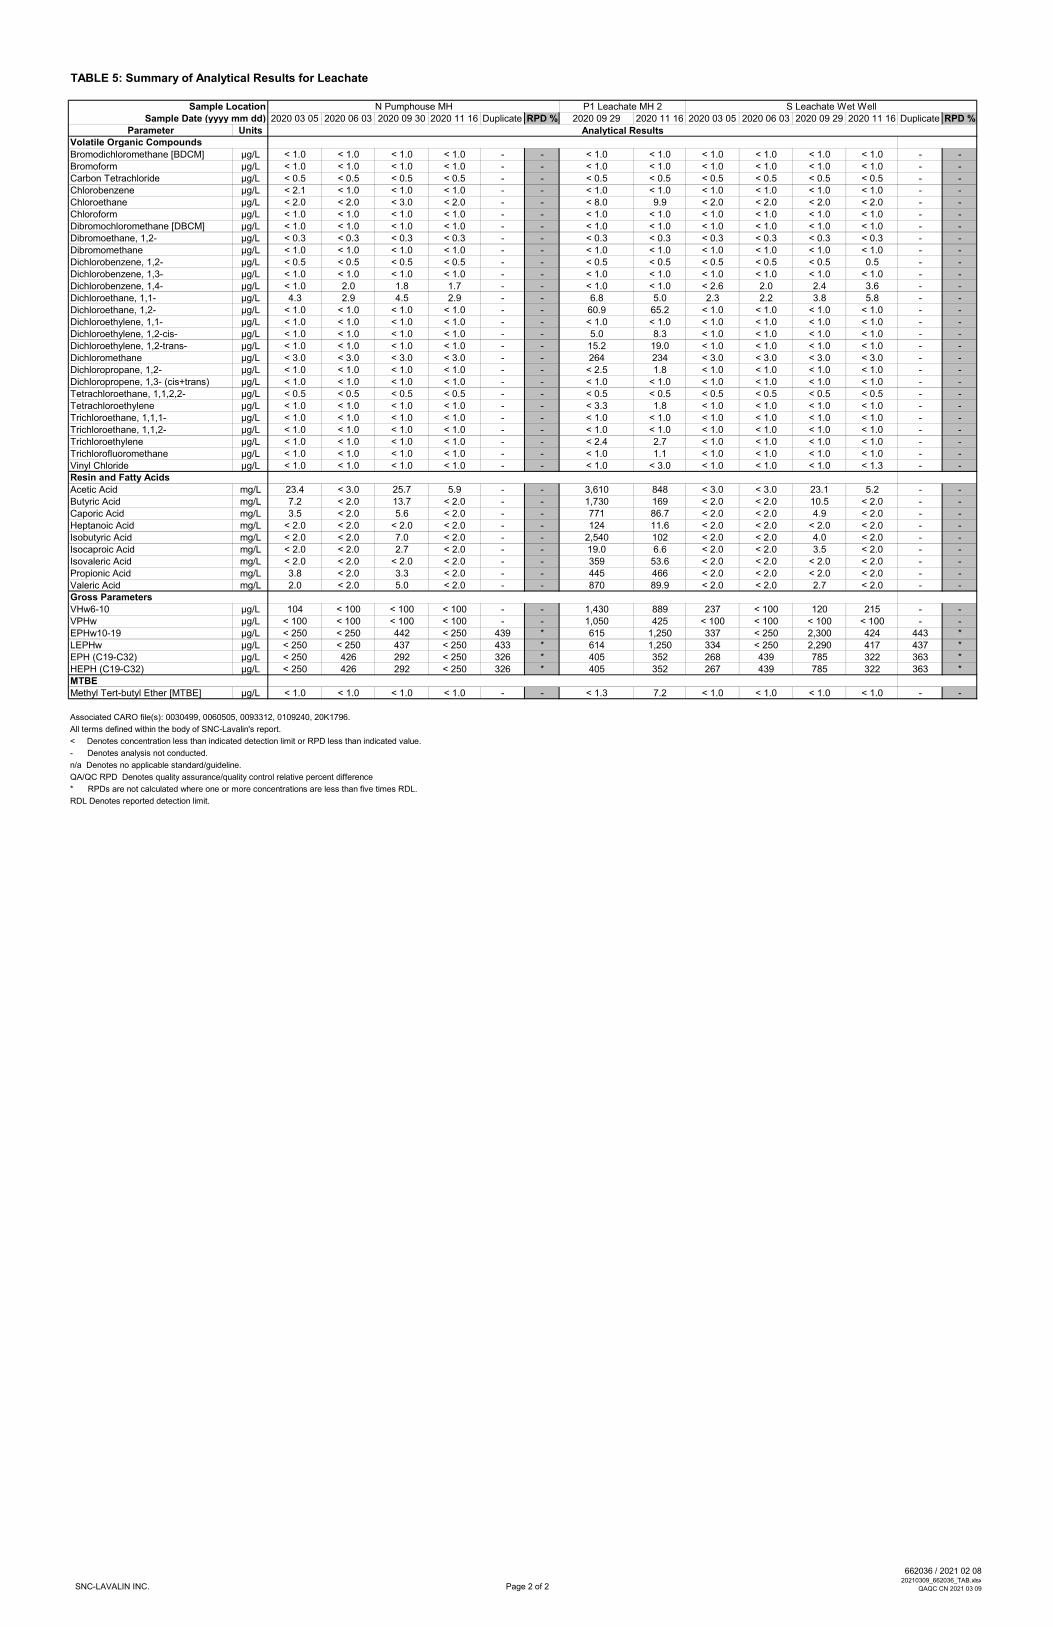
TABLE 5: Summary of Analytical Results for Leachate
Sample Location N Pumphouse MH P1 Leachate MH 2 S Leachate Wet WellSample Date (yyyy mm dd) 2020 03 05 2020 06 03 2020 09 30 2020 11 16 Duplicate RPD % 2020 09 29 2020 11 16 2020 03 05 2020 06 03 2020 09 29 2020 11 16 Duplicate RPD %
Parameter Units Analytical ResultsVolatile Organic Compounds
Bromodichloromethane [BDCM] µg/L < 1.0 < 1.0 < 1.0 < 1.0 - - < 1.0 < 1.0 < 1.0 < 1.0 < 1.0 < 1.0 - -Bromoform µg/L < 1.0 < 1.0 < 1.0 < 1.0 - - < 1.0 < 1.0 < 1.0 < 1.0 < 1.0 < 1.0 - -Carbon Tetrachloride µg/L < 0.5 < 0.5 < 0.5 < 0.5 - - < 0.5 < 0.5 < 0.5 < 0.5 < 0.5 < 0.5 - -Chlorobenzene µg/L < 2.1 < 1.0 < 1.0 < 1.0 - - < 1.0 < 1.0 < 1.0 < 1.0 < 1.0 < 1.0 - -Chloroethane µg/L < 2.0 < 2.0 < 3.0 < 2.0 - - < 8.0 9.9 < 2.0 < 2.0 < 2.0 < 2.0 - -Chloroform µg/L < 1.0 < 1.0 < 1.0 < 1.0 - - < 1.0 < 1.0 < 1.0 < 1.0 < 1.0 < 1.0 - -Dibromochloromethane [DBCM] µg/L < 1.0 < 1.0 < 1.0 < 1.0 - - < 1.0 < 1.0 < 1.0 < 1.0 < 1.0 < 1.0 - -Dibromoethane, 1,2- µg/L < 0.3 < 0.3 < 0.3 < 0.3 - - < 0.3 < 0.3 < 0.3 < 0.3 < 0.3 < 0.3 - -Dibromomethane µg/L < 1.0 < 1.0 < 1.0 < 1.0 - - < 1.0 < 1.0 < 1.0 < 1.0 < 1.0 < 1.0 - -Dichlorobenzene, 1,2- µg/L < 0.5 < 0.5 < 0.5 < 0.5 - - < 0.5 < 0.5 < 0.5 < 0.5 < 0.5 0.5 - -Dichlorobenzene, 1,3- µg/L < 1.0 < 1.0 < 1.0 < 1.0 - - < 1.0 < 1.0 < 1.0 < 1.0 < 1.0 < 1.0 - -Dichlorobenzene, 1,4- µg/L < 1.0 2.0 1.8 1.7 - - < 1.0 < 1.0 < 2.6 2.0 2.4 3.6 - -Dichloroethane, 1,1- µg/L 4.3 2.9 4.5 2.9 - - 6.8 5.0 2.3 2.2 3.8 5.8 - -Dichloroethane, 1,2- µg/L < 1.0 < 1.0 < 1.0 < 1.0 - - 60.9 65.2 < 1.0 < 1.0 < 1.0 < 1.0 - -Dichloroethylene, 1,1- µg/L < 1.0 < 1.0 < 1.0 < 1.0 - - < 1.0 < 1.0 < 1.0 < 1.0 < 1.0 < 1.0 - -Dichloroethylene, 1,2-cis- µg/L < 1.0 < 1.0 < 1.0 < 1.0 - - 5.0 8.3 < 1.0 < 1.0 < 1.0 < 1.0 - -Dichloroethylene, 1,2-trans- µg/L < 1.0 < 1.0 < 1.0 < 1.0 - - 15.2 19.0 < 1.0 < 1.0 < 1.0 < 1.0 - -Dichloromethane µg/L < 3.0 < 3.0 < 3.0 < 3.0 - - 264 234 < 3.0 < 3.0 < 3.0 < 3.0 - -Dichloropropane, 1,2- µg/L < 1.0 < 1.0 < 1.0 < 1.0 - - < 2.5 1.8 < 1.0 < 1.0 < 1.0 < 1.0 - -Dichloropropene, 1,3- (cis+trans) µg/L < 1.0 < 1.0 < 1.0 < 1.0 - - < 1.0 < 1.0 < 1.0 < 1.0 < 1.0 < 1.0 - -Tetrachloroethane, 1,1,2,2- µg/L < 0.5 < 0.5 < 0.5 < 0.5 - - < 0.5 < 0.5 < 0.5 < 0.5 < 0.5 < 0.5 - -Tetrachloroethylene µg/L < 1.0 < 1.0 < 1.0 < 1.0 - - < 3.3 1.8 < 1.0 < 1.0 < 1.0 < 1.0 - -Trichloroethane, 1,1,1- µg/L < 1.0 < 1.0 < 1.0 < 1.0 - - < 1.0 < 1.0 < 1.0 < 1.0 < 1.0 < 1.0 - -Trichloroethane, 1,1,2- µg/L < 1.0 < 1.0 < 1.0 < 1.0 - - < 1.0 < 1.0 < 1.0 < 1.0 < 1.0 < 1.0 - -Trichloroethylene µg/L < 1.0 < 1.0 < 1.0 < 1.0 - - < 2.4 2.7 < 1.0 < 1.0 < 1.0 < 1.0 - -Trichlorofluoromethane µg/L < 1.0 < 1.0 < 1.0 < 1.0 - - < 1.0 1.1 < 1.0 < 1.0 < 1.0 < 1.0 - -Vinyl Chloride µg/L < 1.0 < 1.0 < 1.0 < 1.0 - - < 1.0 < 3.0 < 1.0 < 1.0 < 1.0 < 1.3 - -Resin and Fatty Acids
Acetic Acid mg/L 23.4 < 3.0 25.7 5.9 - - 3,610 848 < 3.0 < 3.0 23.1 5.2 - -Butyric Acid mg/L 7.2 < 2.0 13.7 < 2.0 - - 1,730 169 < 2.0 < 2.0 10.5 < 2.0 - -Caporic Acid mg/L 3.5 < 2.0 5.6 < 2.0 - - 771 86.7 < 2.0 < 2.0 4.9 < 2.0 - -Heptanoic Acid mg/L < 2.0 < 2.0 < 2.0 < 2.0 - - 124 11.6 < 2.0 < 2.0 < 2.0 < 2.0 - -Isobutyric Acid mg/L < 2.0 < 2.0 7.0 < 2.0 - - 2,540 102 < 2.0 < 2.0 4.0 < 2.0 - -Isocaproic Acid mg/L < 2.0 < 2.0 2.7 < 2.0 - - 19.0 6.6 < 2.0 < 2.0 3.5 < 2.0 - -Isovaleric Acid mg/L < 2.0 < 2.0 < 2.0 < 2.0 - - 359 53.6 < 2.0 < 2.0 < 2.0 < 2.0 - -Propionic Acid mg/L 3.8 < 2.0 3.3 < 2.0 - - 445 466 < 2.0 < 2.0 < 2.0 < 2.0 - -Valeric Acid mg/L 2.0 < 2.0 5.0 < 2.0 - - 870 89.9 < 2.0 < 2.0 2.7 < 2.0 - -Gross Parameters
VHw6-10 µg/L 104 < 100 < 100 < 100 - - 1,430 889 237 < 100 120 215 - -VPHw µg/L < 100 < 100 < 100 < 100 - - 1,050 425 < 100 < 100 < 100 < 100 - -EPHw10-19 µg/L < 250 < 250 442 < 250 439 * 615 1,250 337 < 250 2,300 424 443 *LEPHw µg/L < 250 < 250 437 < 250 433 * 614 1,250 334 < 250 2,290 417 437 *EPH (C19-C32) µg/L < 250 426 292 < 250 326 * 405 352 268 439 785 322 363 *HEPH (C19-C32) µg/L < 250 426 292 < 250 326 * 405 352 267 439 785 322 363 *MTBE
Methyl Tert-butyl Ether [MTBE] µg/L < 1.0 < 1.0 < 1.0 < 1.0 - - < 1.3 7.2 < 1.0 < 1.0 < 1.0 < 1.0 - -
Associated CARO file(s): 0030499, 0060505, 0093312, 0109240, 20K1796.
All terms defined within the body of SNC-Lavalin's report.
< Denotes concentration less than indicated detection limit or RPD less than indicated value.
- Denotes analysis not conducted.
n/a Denotes no applicable standard/guideline.
QA/QC RPD Denotes quality assurance/quality control relative percent difference
* RPDs are not calculated where one or more concentrations are less than five times RDL.
RDL Denotes reported detection limit.
SNC-LAVALIN INC. Page 2 of 2
662036 / 2021 02 0820210309_662036_TAB.xlsx
QAQC CN 2021 03 09
Drawings › 662036-001: Key Plan › 662036-002: Site Plan › 662036-003A: Potentiometric Elevations and Inferred Contours (March 2020) › 662036-003B: Potentiometric Elevations and Inferred Contours (September 2020)

LEGEND
662036-0010
REVISIONS
REFERENCE DRAWINGS
KEYPLAN
AutoCAD SHX Text
CHK'D:
AutoCAD SHX Text
TITLE:
AutoCAD SHX Text
REV.:
AutoCAD SHX Text
DWG No:
AutoCAD SHX Text
CLIENT NAME:
AutoCAD SHX Text
SCALE:
AutoCAD SHX Text
DATE:
AutoCAD SHX Text
PROJECT LOCATION:
AutoCAD SHX Text
DWN BY:
AutoCAD SHX Text
CITY OF KELOWNA
AutoCAD SHX Text
-
AutoCAD SHX Text
CLENMORE LANDFILL
AutoCAD SHX Text
KELOWNA, BC
AutoCAD SHX Text
2019-02-20
AutoCAD SHX Text
AS SHOWN
AutoCAD SHX Text
AJK
AutoCAD SHX Text
PR
AutoCAD SHX Text
0
AutoCAD SHX Text
2019-02-20
AutoCAD SHX Text
ISSUED TO CLIENT
AutoCAD SHX Text
AJK
AutoCAD SHX Text
PR
AutoCAD SHX Text
-
AutoCAD SHX Text
-
AutoCAD SHX Text
-
AutoCAD SHX Text
DWG. NO.
AutoCAD SHX Text
DATE
AutoCAD SHX Text
DESCRIPTION
AutoCAD SHX Text
CHK
AutoCAD SHX Text
BY
AutoCAD SHX Text
DESCRIPTION
AutoCAD SHX Text
REV.
AutoCAD SHX Text
DATE
AutoCAD SHX Text
PLOT:
AutoCAD SHX Text
CADFILE:
AutoCAD SHX Text
PATH: \\SLI2606\PROJECTS\CURRENT PROJECTS\CITY OF KELOWNA\662036 GLENMORE LANDFILL WATER MONITORING\40_EXECUTION\45_GIS_DWGS\CAD\662036-R1.DWG\\SLI2606\PROJECTS\CURRENT PROJECTS\CITY OF KELOWNA\662036 GLENMORE LANDFILL WATER MONITORING\40_EXECUTION\45_GIS_DWGS\CAD\662036-R1.DWG

JOHN HINDLE DRIVE
ROBERTLAKE
LITTLEROBERTLAKE
COMPOSTFACILITY
GLE
NM
ORE
RO
AD
PHASE 3SLOUGH
PHASE 2
PHASE 1
TUTTMOUNTAIN
QUAILRIDGE
BREDINPOND
NORTHEASTPOND
BREDINHILL
09BH06-S09BH06-D
09BH03
09BH04
09BH07
09BH05-S09BH05-D
06BH02
GL28-2GL28-1GL28-3
GL12-1
GL 29-1GL 29-2
GL21-1
GL10-1
GL26-1GL26-2GL26-3GL26-4
GL25-1GL25-2
GL9-1GL9-2GL9-3
GL17-1GL17-2GL13-1
GL33-1GL33-2GL33-3GL32-1
GL32-2GL32-3
GL31-1GL31-2GL31-3
GL34-1GL34-2GL34-3
GL20-1
GL38 GL37
GL6-1 (2011) GL36-1GL36-2GL36-3
GL7-1
GL2-1GL2-2
GL4-1GL4-2
GL1-1GL1-2
GL24-1
GL3-5GL3-1GL3-2GL3-3
GL18-1GL18-2GL18-3
BH12-16
09BH01
GL15-1GL15-2
GL16-1
GL35-1GL35-2GL35-3
GL5-1GL5-2GL5-3
GL23-1
GL22-1
GL14-1
N PUMPHOUSEMANHOLE
P1-LEACHATEMANHOLE
S LEACHATEWET WELL
GL27-1GL27-2GL27-3GL27-4
GL8-1GL8-2
GL41-3
GL41-1GL41-2
GL40-1GL40-2GL40-3
GL42-3GL42-1GL42-2
GL39-3GL39-2GL39-1
GL30-1GL30-2GL30-3
TUTT POND
BUBNA SLOUGH
GL0-3GL0-1GL0-2
P1-LEACHATE MH-2
LEGEND NOTES REFERENCE DRAWINGS
REVISIONS
662036-0023
SITE PLANGL2-1
AutoCAD SHX Text
DATE
AutoCAD SHX Text
REV.
AutoCAD SHX Text
DESCRIPTION
AutoCAD SHX Text
BY
AutoCAD SHX Text
CHK
AutoCAD SHX Text
DESCRIPTION
AutoCAD SHX Text
DATE
AutoCAD SHX Text
DWG. NO.
AutoCAD SHX Text
CITY OF KELOWNA
AutoCAD SHX Text
GLENMORE LANDFILL
AutoCAD SHX Text
KELOWNA, BC
AutoCAD SHX Text
2019-02-20
AutoCAD SHX Text
1:10,000
AutoCAD SHX Text
AJK
AutoCAD SHX Text
PR
AutoCAD SHX Text
0
AutoCAD SHX Text
2019-03-13
AutoCAD SHX Text
ISSUED TO CLIENT
AutoCAD SHX Text
AJK
AutoCAD SHX Text
PR
AutoCAD SHX Text
1
AutoCAD SHX Text
2020-01-31
AutoCAD SHX Text
ISSUED TO CLIENT
AutoCAD SHX Text
PES
AutoCAD SHX Text
ICN
AutoCAD SHX Text
2
AutoCAD SHX Text
2020-03-10
AutoCAD SHX Text
ISSUED TO CLIENT
AutoCAD SHX Text
PES
AutoCAD SHX Text
ICN
AutoCAD SHX Text
3
AutoCAD SHX Text
2021-03-09
AutoCAD SHX Text
ISSUED TO CLIENT
AutoCAD SHX Text
AJK
AutoCAD SHX Text
RRW
AutoCAD SHX Text
-
AutoCAD SHX Text
-
AutoCAD SHX Text
ESRI AERIAL IMAGERY
AutoCAD SHX Text
FIG 3
AutoCAD SHX Text
2018-02-16
AutoCAD SHX Text
GOLDER
AutoCAD SHX Text
DWN BY:
AutoCAD SHX Text
PROJECT LOCATION:
AutoCAD SHX Text
DATE:
AutoCAD SHX Text
SCALE:
AutoCAD SHX Text
CLIENT NAME:
AutoCAD SHX Text
DWG No:
AutoCAD SHX Text
REV.:
AutoCAD SHX Text
TITLE:
AutoCAD SHX Text
CHK'D:
AutoCAD SHX Text
2.
AutoCAD SHX Text
ORIGINAL DRAWING IN COLOUR.
AutoCAD SHX Text
1.
AutoCAD SHX Text
LOCATION OF EXISTING UTILITIES SHOWN ARE APPROXIMATE ONLY AND SHOULD BE CONFIRMED ON SITE. NOT ALL UTILITIES MAY BE SHOWN.
AutoCAD SHX Text
PLOT:
AutoCAD SHX Text
CADFILE:
AutoCAD SHX Text
W
AutoCAD SHX Text
S
AutoCAD SHX Text
NORTH
AutoCAD SHX Text
E
AutoCAD SHX Text
PATH: \\SLI2606\PROJECTS\CURRENT PROJECTS\CITY OF KELOWNA\662036 GLENMORE LANDFILL WATER MONITORING\40_EXECUTION\45_GIS_DWGS\CAD\662036-R6.DWG\\SLI2606\PROJECTS\CURRENT PROJECTS\CITY OF KELOWNA\662036 GLENMORE LANDFILL WATER MONITORING\40_EXECUTION\45_GIS_DWGS\CAD\662036-R6.DWG
AutoCAD SHX Text
INDICATES WELL WITH ARTESIAN CONDITIONS (2019)
AutoCAD SHX Text
SITE EXTENTS (REPORTING ONLY)
AutoCAD SHX Text
LECHATE COLLECTION SYSTEM
AutoCAD SHX Text
APPROXIMATE EXTENTS OF LANDFILL (BASED ON ACTIVE AND/OR HISTORICAL LAND FILLING ACTIVITIES)
AutoCAD SHX Text
MONITORING WELL LOCATION (GOLDER & OTHERS, 1990-2012)
AutoCAD SHX Text
MONITORING WELL (DECOMMISSIONED)
AutoCAD SHX Text
APPROXIMATE MANHOLE LOCATION
AutoCAD SHX Text
APPROXIMATE LEACHATE SAMPLING LOCATION
AutoCAD SHX Text
APPROXIMATE SURFACE WATER SAMPLING LOCATION
AutoCAD SHX Text
SITE PLAN BASED ON INFORMATION FROM GOLDER 2017 ANNUAL MONITORING REPORT.
AutoCAD SHX Text
0
AutoCAD SHX Text
METRES
AutoCAD SHX Text
100
AutoCAD SHX Text
500
AutoCAD SHX Text
3.
AutoCAD SHX Text
LIMITS OF FOOTPRINT
AutoCAD SHX Text
N2/SLOUGH#2 (UTM11 5540794N,326212E) IS LOCATED 2028m NORTH AND 81.2m WEST OF BUBNA SLOUGH

JOHN HINDLE DRIVE
ROBERTLAKE
LITTLEROBERTLAKE
COMPOSTFACILITY
GLE
NM
ORE
RO
AD
PHASE 3SLOUGH
PHASE 2
PHASE 1
TUTTMOUNTAIN
QUAILRIDGE
BREDINPOND
NORTHEASTPOND
BREDINHILL
09BH06-S09BH06-D
09BH03
09BH04
09BH07
09BH05-S09BH05-D
06BH02
GL28-2GL28-1GL28-3
GL12-1
GL 29-1GL 29-2
GL21-1
GL10-1
GL26-1GL26-2GL26-3GL26-4
GL25-1GL25-2
GL9-1GL9-2GL9-3
GL17-1GL17-2GL13-1
GL33-1GL33-2GL33-3GL32-1
GL32-2GL32-3
GL31-1GL31-2GL31-3
GL34-1GL34-2GL34-3
GL20-1
GL38 GL37
GL6-1 (2011) GL36-1GL36-2GL36-3
GL7-1
GL2-1GL2-2
GL4-1GL4-2
GL1-1GL1-2
GL24-1
GL3-5GL3-1GL3-2GL3-3
GL18-1GL18-2GL18-3
BH12-16
09BH01
GL15-1GL15-2
GL16-1
GL35-1GL35-2GL35-3
GL5-1GL5-2GL5-3
GL23-1
GL22-1
GL14-1
N PUMPHOUSEMANHOLE
P1-LEACHATEMANHOLE
S LEACHATEWET WELL
GL27-1GL27-2GL27-3GL27-4
GL8-1GL8-2
GL41-3
GL41-1GL41-2
GL40-1GL40-2GL40-3
GL42-3GL42-1GL42-2
GL39-3GL39-2GL39-1
GL30-1GL30-2GL30-3
TUTT POND
GL0-3GL0-1GL0-2
P1-LEACHATE MH-2
LEGEND REFERENCE DRAWINGS
REVISIONS
662036-003A0
436.2
POTENTIOMETRIC ELEVATIONS ANDINFERRED CONTOURS (MARCH 21, 2020)
438.3
438.3
445.4
439.4
448.0
445.7
438.2
441.7
445.6
439.0
439.6
438.8
438.2
(439.1)438.4
(438.9) 438.3438.5
(439.7)
(440.1)(441.6)
438.4
448
439
441
443
445
447448.4
437.2
GL2-1
443
(440.1)
438.6
AutoCAD SHX Text
W
AutoCAD SHX Text
S
AutoCAD SHX Text
NORTH
AutoCAD SHX Text
E
AutoCAD SHX Text
DATE
AutoCAD SHX Text
REV.
AutoCAD SHX Text
DESCRIPTION
AutoCAD SHX Text
BY
AutoCAD SHX Text
CHK
AutoCAD SHX Text
DESCRIPTION
AutoCAD SHX Text
DATE
AutoCAD SHX Text
DWG. NO.
AutoCAD SHX Text
CITY OF KELOWNA
AutoCAD SHX Text
CLENMORE LANDFILL
AutoCAD SHX Text
KELOWNA, BC
AutoCAD SHX Text
2019-02-20
AutoCAD SHX Text
1:10,000
AutoCAD SHX Text
AJK
AutoCAD SHX Text
PR
AutoCAD SHX Text
0
AutoCAD SHX Text
2021-03-09
AutoCAD SHX Text
ISSUED TO CLIENT
AutoCAD SHX Text
AJK
AutoCAD SHX Text
RRW
AutoCAD SHX Text
-
AutoCAD SHX Text
-
AutoCAD SHX Text
DWN BY:
AutoCAD SHX Text
PROJECT LOCATION:
AutoCAD SHX Text
DATE:
AutoCAD SHX Text
SCALE:
AutoCAD SHX Text
CLIENT NAME:
AutoCAD SHX Text
DWG No:
AutoCAD SHX Text
REV.:
AutoCAD SHX Text
TITLE:
AutoCAD SHX Text
CHK'D:
AutoCAD SHX Text
MONITORING WELL LOCATION (GOLDER & OTHERS, 1990-2019)
AutoCAD SHX Text
PLOT:
AutoCAD SHX Text
CADFILE:
AutoCAD SHX Text
PATH: \\SLI2606\PROJECTS\CURRENT PROJECTS\CITY OF KELOWNA\662036 GLENMORE LANDFILL WATER MONITORING\40_EXECUTION\45_GIS_DWGS\CAD\662036-R6.DWG\\SLI2606\PROJECTS\CURRENT PROJECTS\CITY OF KELOWNA\662036 GLENMORE LANDFILL WATER MONITORING\40_EXECUTION\45_GIS_DWGS\CAD\662036-R6.DWG
AutoCAD SHX Text
MONITORING WELL (DECOMMISSIONED)
AutoCAD SHX Text
APPROXIMATE MANHOLE LOCATION
AutoCAD SHX Text
APPROXIMATE LEACHATE SAMPLING LOCATION
AutoCAD SHX Text
APPROXIMATE SURFACE WATER SAMPLING LOCATION
AutoCAD SHX Text
SITE PLAN BASED ON INFORMATION FROM GOLDER 2017 ANNUAL MONITORING REPORT.
AutoCAD SHX Text
0
AutoCAD SHX Text
METRES
AutoCAD SHX Text
100
AutoCAD SHX Text
500
AutoCAD SHX Text
SITE EXTENTS (REPORTING ONLY)
AutoCAD SHX Text
LECHATE COLLECTION SYSTEM
AutoCAD SHX Text
INFERRED DIRECTION OF GROUNDWATER FLOW
AutoCAD SHX Text
APPROXIMATE EXTENTS OF LANDFILL (BASED ON ACTIVE AND/OR HISTORICAL LAND FILLING ACTIVITIES)
AutoCAD SHX Text
GROUNDWATER ELEVATION (m) (2020-03-21)
AutoCAD SHX Text
INDICATES WELL WITH ARTESIAN CONDITIONS (2019)
AutoCAD SHX Text
GROUNDWATER ELEVATION NOT USED IN CONTOURING
AutoCAD SHX Text
INFERRED POTENTIOMETRIC CONTOUR (2m INTERVAL)
AutoCAD SHX Text
INFERRED POTENTIOMETRIC CONTOUR (5m INTERVAL)
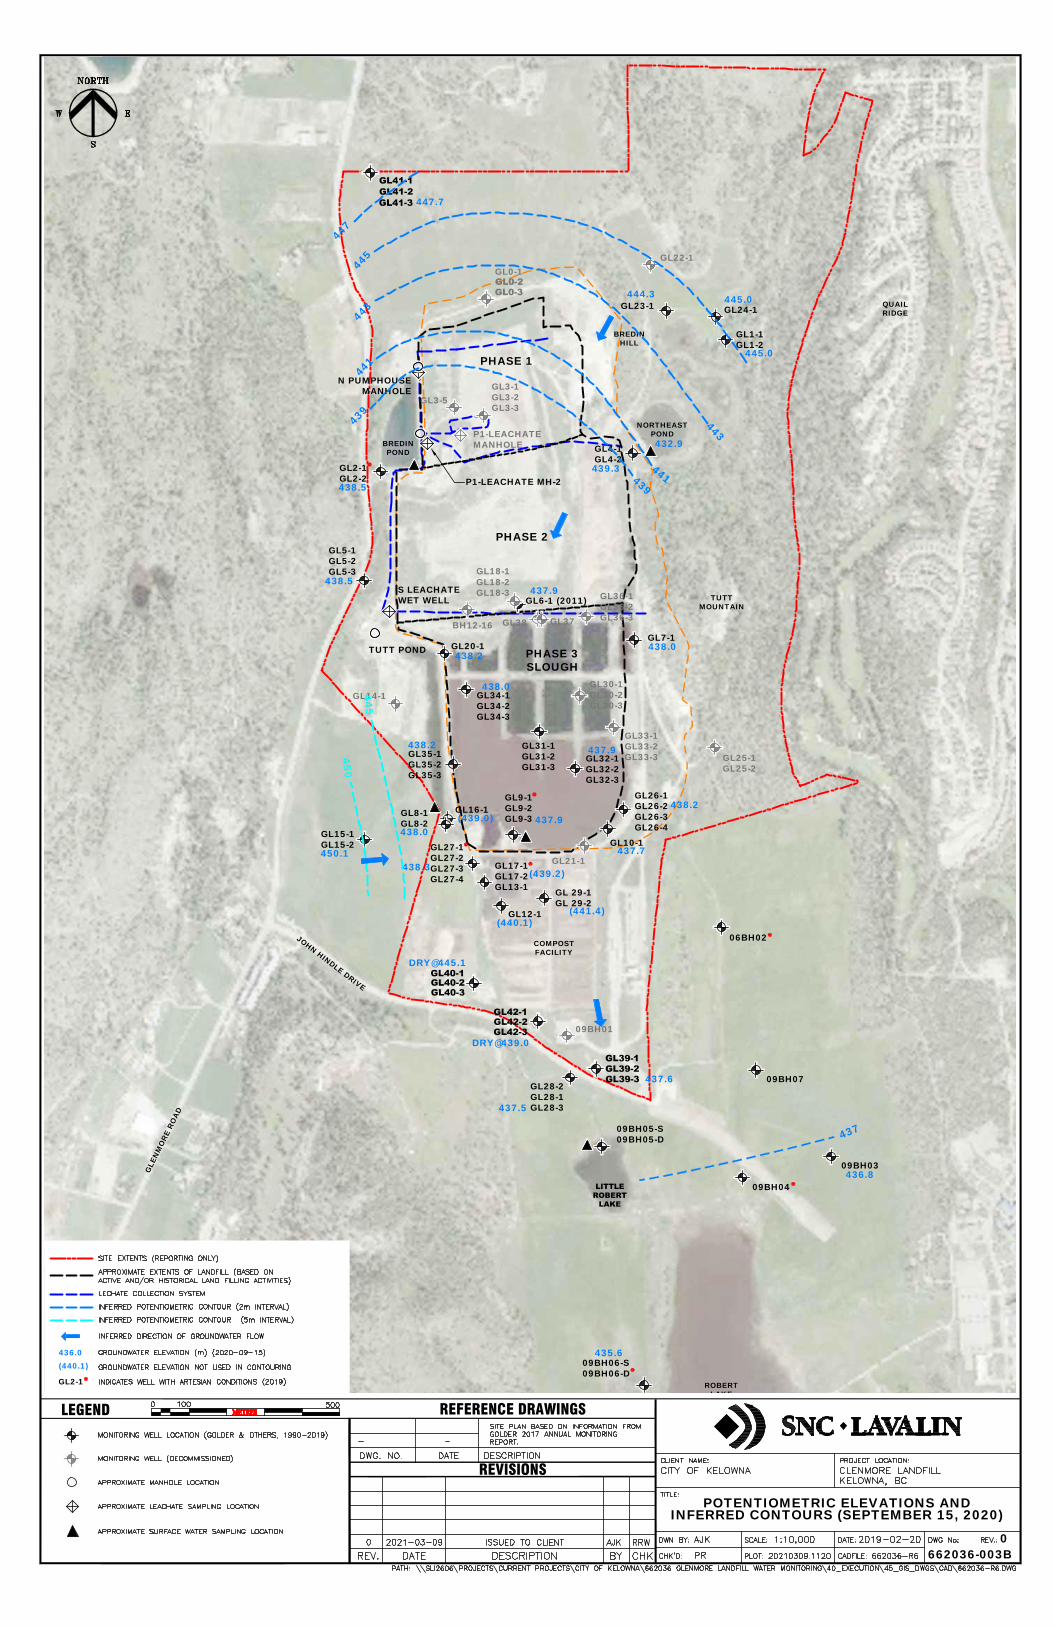
JOHN HINDLE DRIVE
ROBERTLAKE
LITTLEROBERTLAKE
COMPOSTFACILITY
GLE
NM
ORE
RO
AD
PHASE 3SLOUGH
PHASE 2
PHASE 1
TUTTMOUNTAIN
QUAILRIDGE
BREDINPOND
NORTHEASTPOND
BREDINHILL
09BH06-S09BH06-D
09BH03
09BH04
09BH07
09BH05-S09BH05-D
06BH02
GL28-2GL28-1GL28-3
GL12-1
GL 29-1GL 29-2
GL21-1
GL10-1
GL26-1GL26-2GL26-3GL26-4
GL25-1GL25-2
GL9-1GL9-2GL9-3
GL17-1GL17-2GL13-1
GL33-1GL33-2GL33-3GL32-1
GL32-2GL32-3
GL31-1GL31-2GL31-3
GL34-1GL34-2GL34-3
GL20-1
GL38 GL37
GL6-1 (2011) GL36-1GL36-2GL36-3
GL7-1
GL2-1GL2-2
GL4-1GL4-2
GL1-1GL1-2
GL24-1
GL3-5GL3-1GL3-2GL3-3
GL18-1GL18-2GL18-3
BH12-16
09BH01
GL15-1GL15-2
GL16-1
GL35-1GL35-2GL35-3
GL5-1GL5-2GL5-3
GL23-1
GL22-1
GL14-1
N PUMPHOUSEMANHOLE
P1-LEACHATEMANHOLE
S LEACHATEWET WELL
GL27-1GL27-2GL27-3GL27-4
GL8-1GL8-2
GL41-3
GL41-1GL41-2
GL40-1GL40-2GL40-3
GL42-3GL42-1GL42-2
GL39-3GL39-2GL39-1
GL30-1GL30-2GL30-3
TUTT POND
GL0-3GL0-1GL0-2
P1-LEACHATE MH-2
LEGEND REFERENCE DRAWINGS
REVISIONS
662036-003B0
436.0
POTENTIOMETRIC ELEVATIONS ANDINFERRED CONTOURS (SEPTEMBER 15, 2020)
437.7
435.6
444.3
450.1
438.0
438.0
445.0
437.9
436.8
445.0
438.5
439.3
438.5
438.0
438.2
(439.0) 437.9438.2
437.9
438.3(439.2)
(440.1)(441.4)
437.6
437.5
438.2
450
439
441
44344
7
437
GL2-1
(440.1)
447.7
445
443
441
439
432.9
445
AutoCAD SHX Text
W
AutoCAD SHX Text
S
AutoCAD SHX Text
NORTH
AutoCAD SHX Text
E
AutoCAD SHX Text
DATE
AutoCAD SHX Text
REV.
AutoCAD SHX Text
DESCRIPTION
AutoCAD SHX Text
BY
AutoCAD SHX Text
CHK
AutoCAD SHX Text
DESCRIPTION
AutoCAD SHX Text
DATE
AutoCAD SHX Text
DWG. NO.
AutoCAD SHX Text
CITY OF KELOWNA
AutoCAD SHX Text
CLENMORE LANDFILL
AutoCAD SHX Text
KELOWNA, BC
AutoCAD SHX Text
2019-02-20
AutoCAD SHX Text
1:10,000
AutoCAD SHX Text
AJK
AutoCAD SHX Text
PR
AutoCAD SHX Text
0
AutoCAD SHX Text
2021-03-09
AutoCAD SHX Text
ISSUED TO CLIENT
AutoCAD SHX Text
AJK
AutoCAD SHX Text
RRW
AutoCAD SHX Text
-
AutoCAD SHX Text
-
AutoCAD SHX Text
DWN BY:
AutoCAD SHX Text
PROJECT LOCATION:
AutoCAD SHX Text
DATE:
AutoCAD SHX Text
SCALE:
AutoCAD SHX Text
CLIENT NAME:
AutoCAD SHX Text
DWG No:
AutoCAD SHX Text
REV.:
AutoCAD SHX Text
TITLE:
AutoCAD SHX Text
CHK'D:
AutoCAD SHX Text
MONITORING WELL LOCATION (GOLDER & OTHERS, 1990-2019)
AutoCAD SHX Text
PLOT:
AutoCAD SHX Text
CADFILE:
AutoCAD SHX Text
PATH: \\SLI2606\PROJECTS\CURRENT PROJECTS\CITY OF KELOWNA\662036 GLENMORE LANDFILL WATER MONITORING\40_EXECUTION\45_GIS_DWGS\CAD\662036-R6.DWG\\SLI2606\PROJECTS\CURRENT PROJECTS\CITY OF KELOWNA\662036 GLENMORE LANDFILL WATER MONITORING\40_EXECUTION\45_GIS_DWGS\CAD\662036-R6.DWG
AutoCAD SHX Text
MONITORING WELL (DECOMMISSIONED)
AutoCAD SHX Text
APPROXIMATE MANHOLE LOCATION
AutoCAD SHX Text
APPROXIMATE LEACHATE SAMPLING LOCATION
AutoCAD SHX Text
APPROXIMATE SURFACE WATER SAMPLING LOCATION
AutoCAD SHX Text
SITE PLAN BASED ON INFORMATION FROM GOLDER 2017 ANNUAL MONITORING REPORT.
AutoCAD SHX Text
0
AutoCAD SHX Text
METRES
AutoCAD SHX Text
100
AutoCAD SHX Text
500
AutoCAD SHX Text
SITE EXTENTS (REPORTING ONLY)
AutoCAD SHX Text
LECHATE COLLECTION SYSTEM
AutoCAD SHX Text
INFERRED DIRECTION OF GROUNDWATER FLOW
AutoCAD SHX Text
APPROXIMATE EXTENTS OF LANDFILL (BASED ON ACTIVE AND/OR HISTORICAL LAND FILLING ACTIVITIES)
AutoCAD SHX Text
GROUNDWATER ELEVATION (m) (2020-09-15)
AutoCAD SHX Text
INFERRED POTENTIOMETRIC CONTOUR (2m INTERVAL)
AutoCAD SHX Text
INDICATES WELL WITH ARTESIAN CONDITIONS (2019)
AutoCAD SHX Text
GROUNDWATER ELEVATION NOT USED IN CONTOURING
AutoCAD SHX Text
INFERRED POTENTIOMETRIC CONTOUR (5m INTERVAL)

Appendix I ENV Operation Certificate 12218


Appendix II May 25, 2011 Letter from BC Ministry of Environment and
Climate Change Strategy re Glenmore Landfill

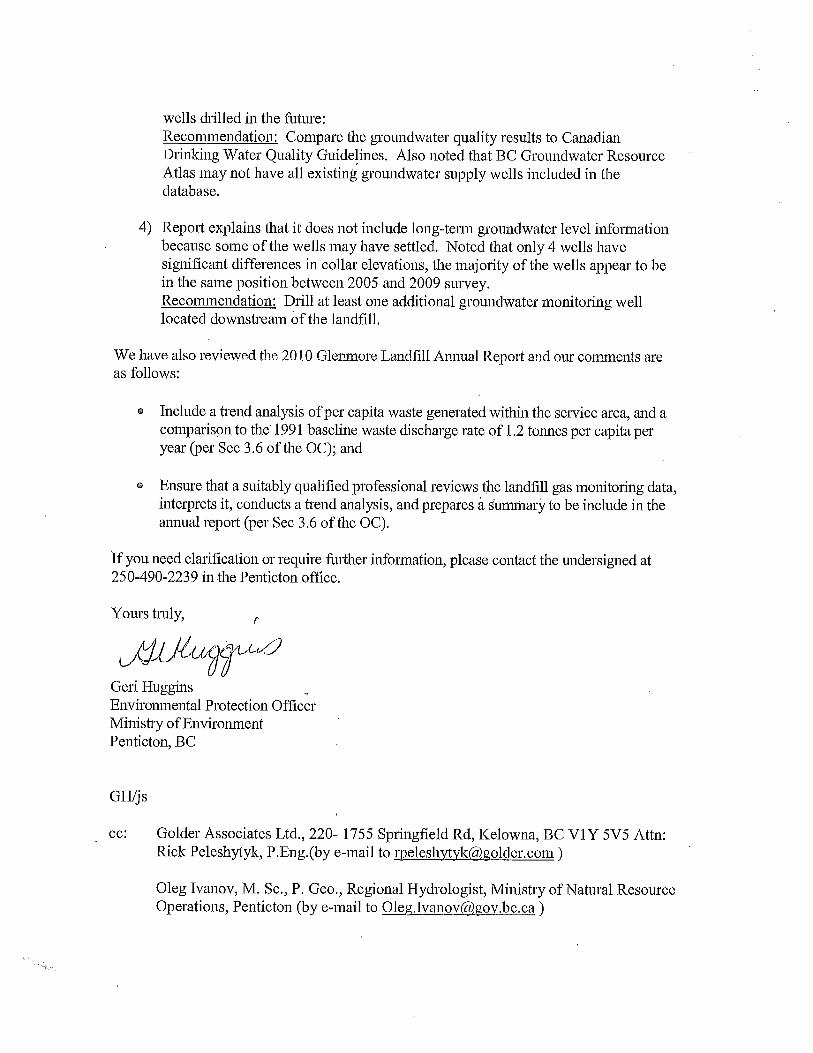

Appendix III Fieldwork Methodology

2020 Glenmore Landfill Annual Water Quality Report City of Kelowna
Internal Ref: 662036 › Draft › V2 March 25, 2021 | 1 © 2021 SNC-Lavalin Inc. All Rights Reserved. Confidential.
Fieldwork Methodology All monitoring and sampling activities were completed in accordance with ENV regulatory requirements and technical guidance/protocols, industry standard practices. In addition, quality assurance/quality control (QA/QC) measures were implemented for sampling and analyses to ensure that all data is representative, as summarized in Section 5.7. The following sections summarize the field methods utilized by the City of Kelowna (CoK) field staff for the 2020 annual water quality program.
Groundwater Monitoring Groundwater levels were measured at all on and off-site monitoring wells on March 21, June 4, September 15, and November 26, 2020. Water Levels were measured off a permanent marking on the top of the PVC pipe in each well. Groundwater elevations were measured relative to the geodetic data obtained during site surveys. Groundwater flow direction was inferred from trends collected during the 2020 monitoring program, provided in Tables 2a and 2b and shown on Drawings 662036-003A and 662036-003B.
Groundwater Sampling Groundwater samples were collected by CoK field staff from selected monitoring wells on and off the Site during three sampling events completed in June (spring event), August (summer event) and October and November (fall event). Sampling procedures were in accordance with the previous annual water quality program. Sample bottles, preservatives, filters and coolers used for groundwater sampling were obtained by CoK.
In general, a peristaltic pump was used for groundwater sampling except for GL42-1 and GL42-2 which used a disposable bailer. Field measurements (pH, DO, ORP, temperature, and conductivity) were obtained during well purging prior to sampling. Samples were taken once the field parameters stabilized (i.e., low flow sampling) or three well volumes were removed (i.e., sampling using inertial lift pump and tubing).
Samples were collected into appropriate laboratory-prepared containers, samples were filtered (when applicable) and were stored in an ice chilled cooler and driven within recommended holding times and with the appropriate chain-of-custody documentation to Caro Analytical Services (Caro), locate in Kelowna, BC, for analysis of specified parameters shown in Tables 3a to 3d. Duplicates groundwater samples were collected during each sampling event. These results can be found in Table 3a to 3d with the results summarized in Section 5.7.
Surface Water Monitoring and Sampling Surface water levels were measured manually in 2020 by CoK field staff on a monthly basis at the Tutt Pond, Bredin Pond, Northeast Pond, and Slough. Data loggers were used in Bredin Pond, Tutt Pond, Northeast Pond, and Slough.
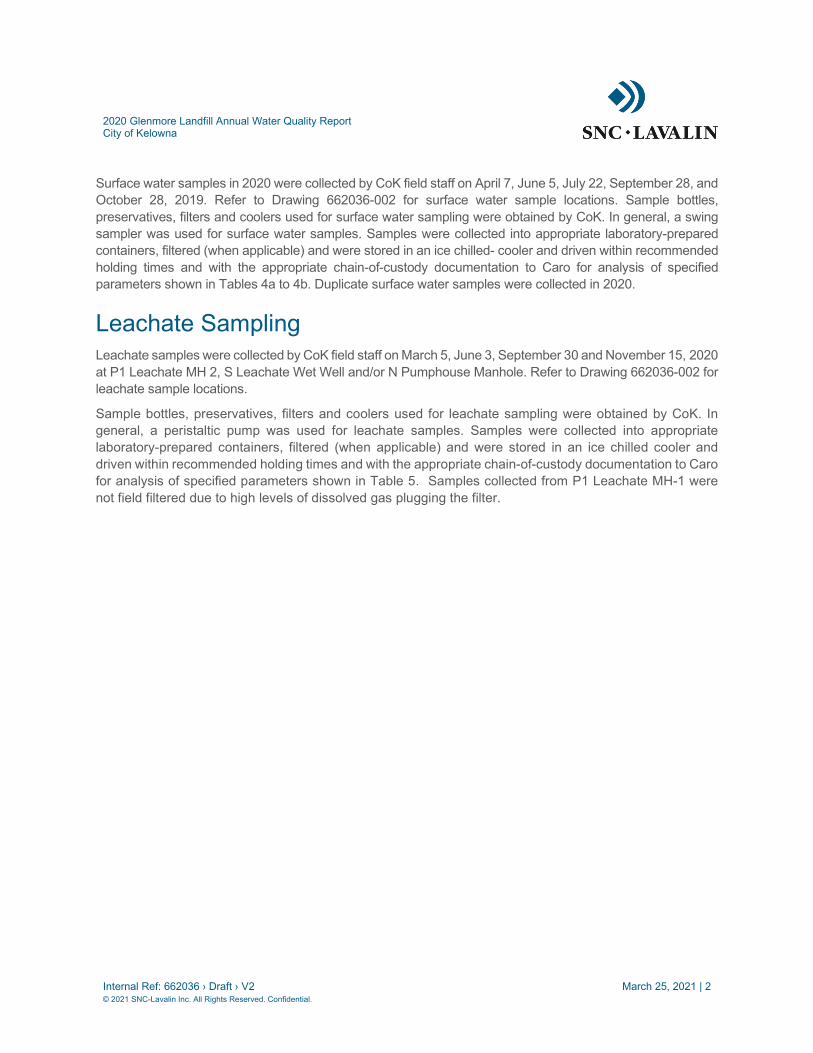
2020 Glenmore Landfill Annual Water Quality Report City of Kelowna
Internal Ref: 662036 › Draft › V2 March 25, 2021 | 2 © 2021 SNC-Lavalin Inc. All Rights Reserved. Confidential.
Surface water samples in 2020 were collected by CoK field staff on April 7, June 5, July 22, September 28, and October 28, 2019. Refer to Drawing 662036-002 for surface water sample locations. Sample bottles, preservatives, filters and coolers used for surface water sampling were obtained by CoK. In general, a swing sampler was used for surface water samples. Samples were collected into appropriate laboratory-prepared containers, filtered (when applicable) and were stored in an ice chilled- cooler and driven within recommended holding times and with the appropriate chain-of-custody documentation to Caro for analysis of specified parameters shown in Tables 4a to 4b. Duplicate surface water samples were collected in 2020.
Leachate Sampling Leachate samples were collected by CoK field staff on March 5, June 3, September 30 and November 15, 2020 at P1 Leachate MH 2, S Leachate Wet Well and/or N Pumphouse Manhole. Refer to Drawing 662036-002 for leachate sample locations.
Sample bottles, preservatives, filters and coolers used for leachate sampling were obtained by CoK. In general, a peristaltic pump was used for leachate samples. Samples were collected into appropriate laboratory-prepared containers, filtered (when applicable) and were stored in an ice chilled cooler and driven within recommended holding times and with the appropriate chain-of-custody documentation to Caro for analysis of specified parameters shown in Table 5. Samples collected from P1 Leachate MH-1 were not field filtered due to high levels of dissolved gas plugging the filter.

Appendix IV Glenmore Landfill – Well Decommission Letter, prepared
by WSP, April 9, 2020


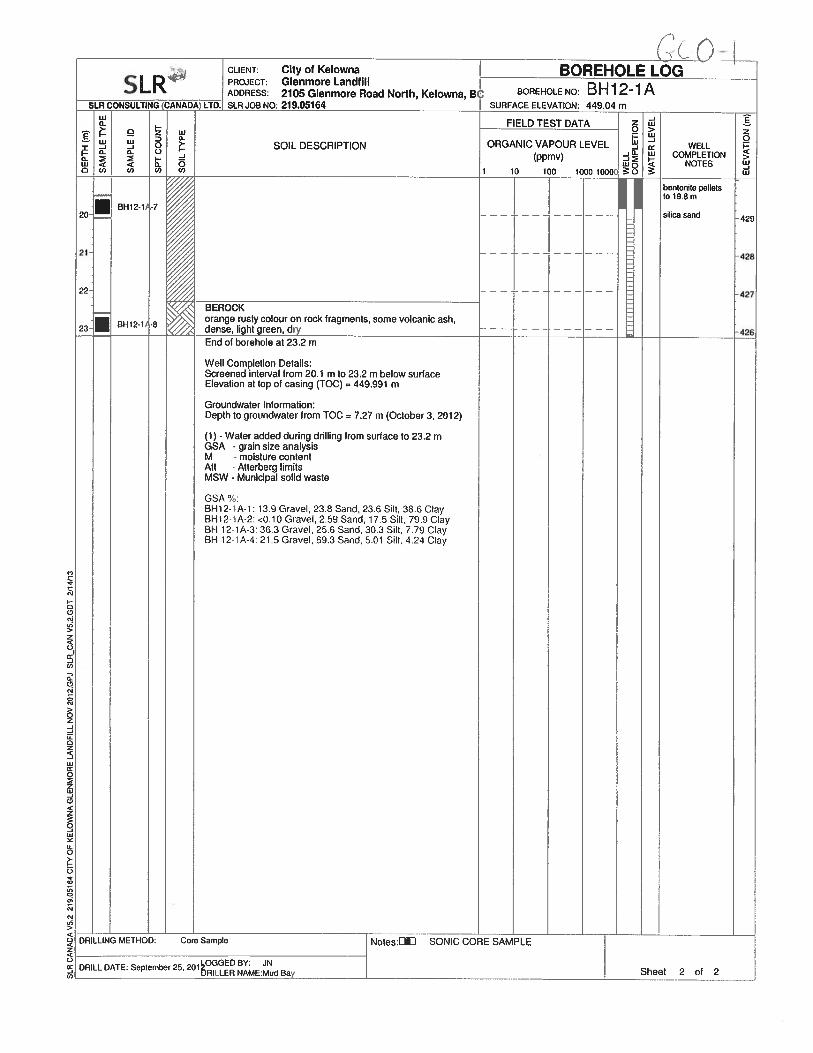
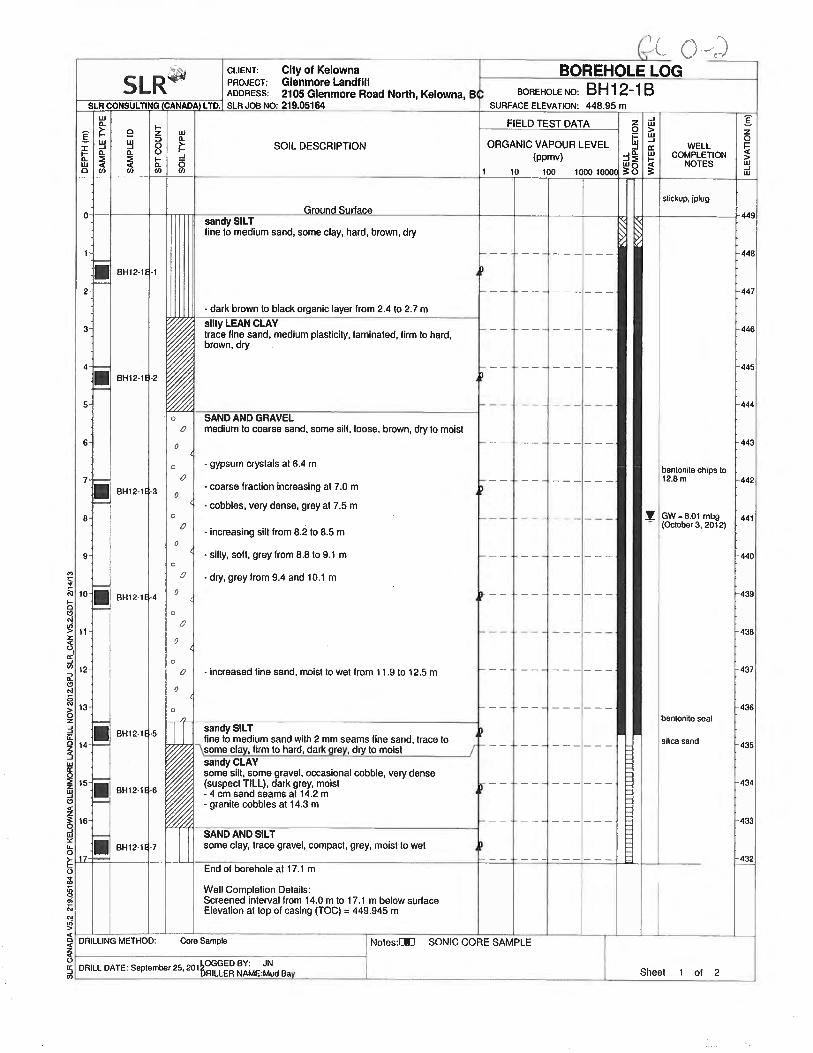


Appendix V Historical Analytical Data
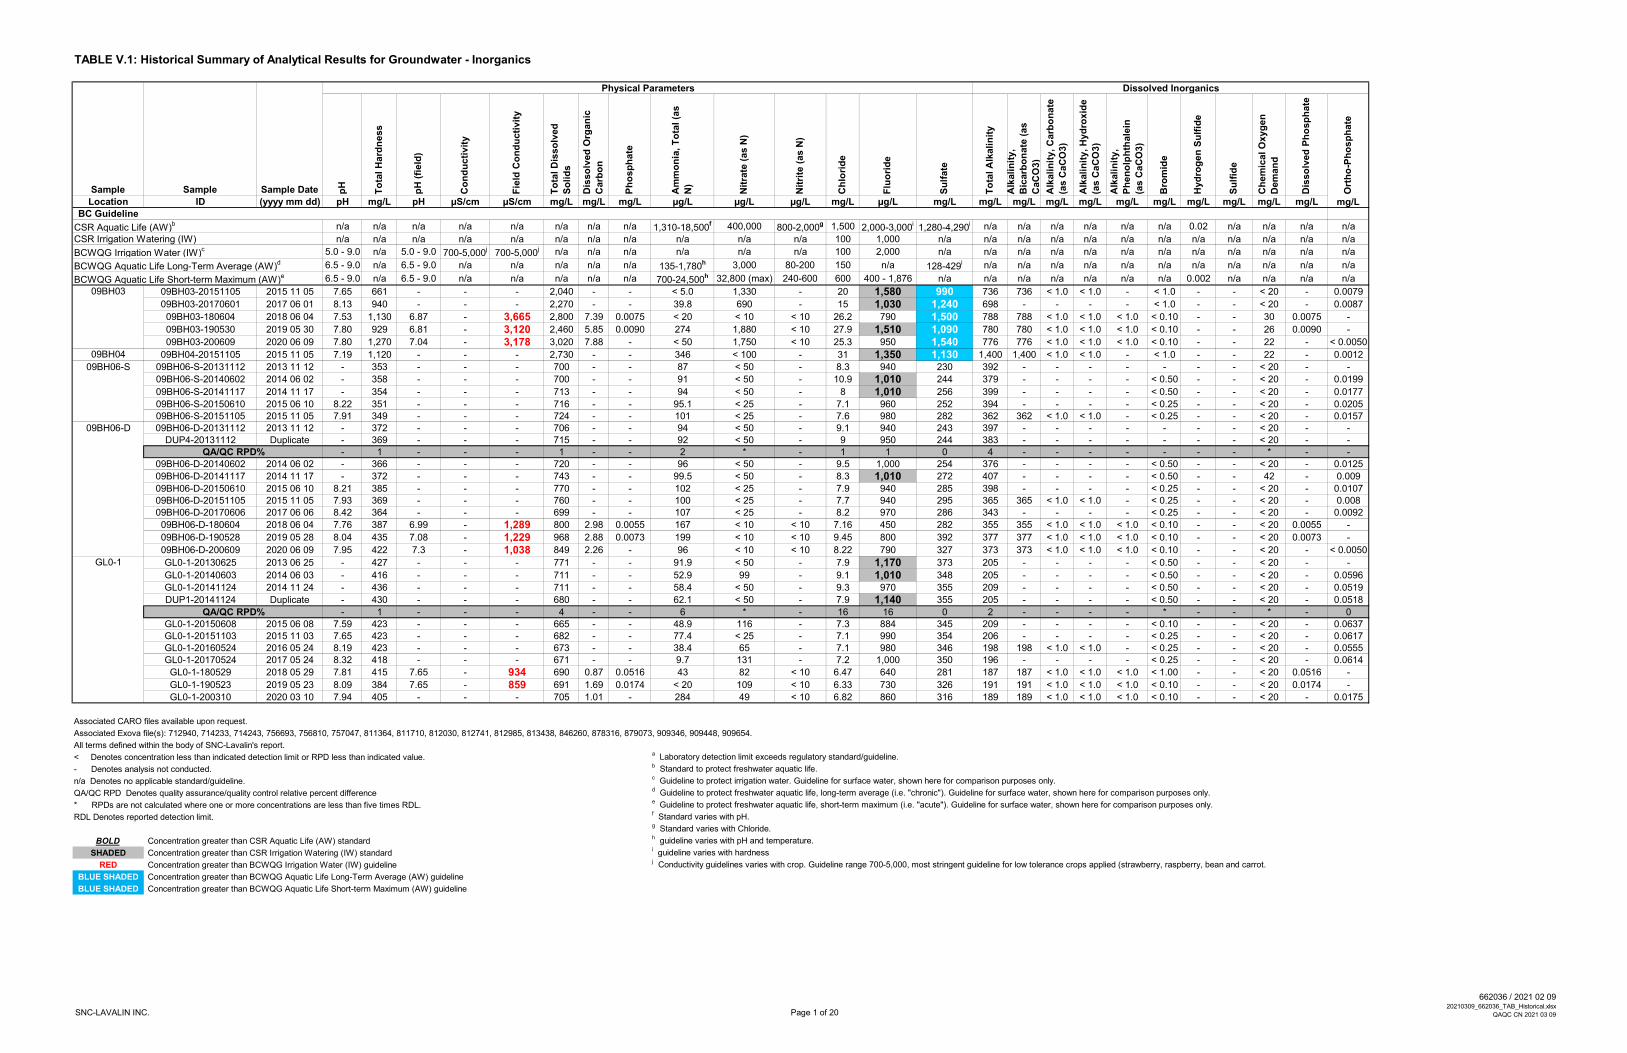
TABLE V.1: Historical Summary of Analytical Results for Groundwater - Inorganics
Physical Parameters Dissolved Inorganics
Sample Sample Sample Date pH
To
tal H
ard
ness
pH
(fi
eld
)
Co
nd
ucti
vit
y
Fie
ld C
on
du
cti
vit
y
To
tal D
isso
lved
So
lid
s
Dis
so
lved
Org
an
ic
Carb
on
Ph
osp
hate
Am
mo
nia
, T
ota
l (a
s
N)
Nit
rate
(as N
)
Nit
rite
(as N
)
Ch
lori
de
Flu
ori
de
Su
lfate
To
tal A
lkali
nit
y
Alk
ali
nit
y,
Bic
arb
on
ate
(as
CaC
O3)
Alk
ali
nit
y, C
arb
on
ate
(as C
aC
O3)
Alk
ali
nit
y, H
yd
roxid
e
(as C
aC
O3)
Alk
ali
nit
y,
Ph
en
olp
hth
ale
in
(as C
aC
O3)
Bro
mid
e
Hyd
rog
en
Su
lfid
e
Su
lfid
e
Ch
em
ical O
xyg
en
Dem
an
d
Dis
so
lved
Ph
osp
hate
Ort
ho
-Ph
osp
hate
Location ID (yyyy mm dd) pH mg/L pH µS/cm µS/cm mg/L mg/L mg/L µg/L µg/L µg/L mg/L µg/L mg/L mg/L mg/L mg/L mg/L mg/L mg/L mg/L mg/L mg/L mg/L mg/LBC Guideline
CSR Aquatic Life (AW)b n/a n/a n/a n/a n/a n/a n/a n/a 1,310-18,500
f 400,000 800-2,000g 1,500 2,000-3,000
i1,280-4,290
i n/a n/a n/a n/a n/a n/a 0.02 n/a n/a n/a n/a
CSR Irrigation Watering (IW) n/a n/a n/a n/a n/a n/a n/a n/a n/a n/a n/a 100 1,000 n/a n/a n/a n/a n/a n/a n/a n/a n/a n/a n/a n/a
BCWQG Irrigation Water (IW)c 5.0 - 9.0 n/a 5.0 - 9.0 700-5,000
j700-5,000
j n/a n/a n/a n/a n/a n/a 100 2,000 n/a n/a n/a n/a n/a n/a n/a n/a n/a n/a n/a n/a
BCWQG Aquatic Life Long-Term Average (AW)d 6.5 - 9.0 n/a 6.5 - 9.0 n/a n/a n/a n/a n/a 135-1,780
h 3,000 80-200 150 n/a 128-429i n/a n/a n/a n/a n/a n/a n/a n/a n/a n/a n/a
BCWQG Aquatic Life Short-term Maximum (AW)e 6.5 - 9.0 n/a 6.5 - 9.0 n/a n/a n/a n/a n/a 700-24,500
h 32,800 (max) 240-600 600 400 - 1,876 n/a n/a n/a n/a n/a n/a n/a 0.002 n/a n/a n/a n/a
09BH03 09BH03-20151105 2015 11 05 7.65 661 - - - 2,040 - - < 5.0 1,330 - 20 1,580 990 736 736 < 1.0 < 1.0 - < 1.0 - - < 20 - 0.0079
09BH03-20170601 2017 06 01 8.13 940 - - - 2,270 - - 39.8 690 - 15 1,030 1,240 698 - - - - < 1.0 - - < 20 - 0.0087
09BH03-180604 2018 06 04 7.53 1,130 6.87 - 3,665 2,800 7.39 0.0075 < 20 < 10 < 10 26.2 790 1,500 788 788 < 1.0 < 1.0 < 1.0 < 0.10 - - 30 0.0075 -
09BH03-190530 2019 05 30 7.80 929 6.81 - 3,120 2,460 5.85 0.0090 274 1,880 < 10 27.9 1,510 1,090 780 780 < 1.0 < 1.0 < 1.0 < 0.10 - - 26 0.0090 -
09BH03-200609 2020 06 09 7.80 1,270 7.04 - 3,178 3,020 7.88 - < 50 1,750 < 10 25.3 950 1,540 776 776 < 1.0 < 1.0 < 1.0 < 0.10 - - 22 - < 0.0050
09BH04 09BH04-20151105 2015 11 05 7.19 1,120 - - - 2,730 - - 346 < 100 - 31 1,350 1,130 1,400 1,400 < 1.0 < 1.0 - < 1.0 - - 22 - 0.0012
09BH06-S 09BH06-S-20131112 2013 11 12 - 353 - - - 700 - - 87 < 50 - 8.3 940 230 392 - - - - - - - < 20 - -
09BH06-S-20140602 2014 06 02 - 358 - - - 700 - - 91 < 50 - 10.9 1,010 244 379 - - - - < 0.50 - - < 20 - 0.0199
09BH06-S-20141117 2014 11 17 - 354 - - - 713 - - 94 < 50 - 8 1,010 256 399 - - - - < 0.50 - - < 20 - 0.0177
09BH06-S-20150610 2015 06 10 8.22 351 - - - 716 - - 95.1 < 25 - 7.1 960 252 394 - - - - < 0.25 - - < 20 - 0.020509BH06-S-20151105 2015 11 05 7.91 349 - - - 724 - - 101 < 25 - 7.6 980 282 362 362 < 1.0 < 1.0 - < 0.25 - - < 20 - 0.0157
09BH06-D 09BH06-D-20131112 2013 11 12 - 372 - - - 706 - - 94 < 50 - 9.1 940 243 397 - - - - - - - < 20 - -DUP4-20131112 Duplicate - 369 - - - 715 - - 92 < 50 - 9 950 244 383 - - - - - - - < 20 - -
QA/QC RPD% - 1 - - - 1 - - 2 * - 1 1 0 4 - - - - - - - * - -09BH06-D-20140602 2014 06 02 - 366 - - - 720 - - 96 < 50 - 9.5 1,000 254 376 - - - - < 0.50 - - < 20 - 0.0125
09BH06-D-20141117 2014 11 17 - 372 - - - 743 - - 99.5 < 50 - 8.3 1,010 272 407 - - - - < 0.50 - - 42 - 0.009
09BH06-D-20150610 2015 06 10 8.21 385 - - - 770 - - 102 < 25 - 7.9 940 285 398 - - - - < 0.25 - - < 20 - 0.010709BH06-D-20151105 2015 11 05 7.93 369 - - - 760 - - 100 < 25 - 7.7 940 295 365 365 < 1.0 < 1.0 - < 0.25 - - < 20 - 0.00809BH06-D-20170606 2017 06 06 8.42 364 - - - 699 - - 107 < 25 - 8.2 970 286 343 - - - - < 0.25 - - < 20 - 0.0092
09BH06-D-180604 2018 06 04 7.76 387 6.99 - 1,289 800 2.98 0.0055 167 < 10 < 10 7.16 450 282 355 355 < 1.0 < 1.0 < 1.0 < 0.10 - - < 20 0.0055 -
09BH06-D-190528 2019 05 28 8.04 435 7.08 - 1,229 968 2.88 0.0073 199 < 10 < 10 9.45 800 392 377 377 < 1.0 < 1.0 < 1.0 < 0.10 - - < 20 0.0073 -
09BH06-D-200609 2020 06 09 7.95 422 7.3 - 1,038 849 2.26 - 96 < 10 < 10 8.22 790 327 373 373 < 1.0 < 1.0 < 1.0 < 0.10 - - < 20 - < 0.0050
GL0-1 GL0-1-20130625 2013 06 25 - 427 - - - 771 - - 91.9 < 50 - 7.9 1,170 373 205 - - - - < 0.50 - - < 20 - -
GL0-1-20140603 2014 06 03 - 416 - - - 711 - - 52.9 99 - 9.1 1,010 348 205 - - - - < 0.50 - - < 20 - 0.0596
GL0-1-20141124 2014 11 24 - 436 - - - 711 - - 58.4 < 50 - 9.3 970 355 209 - - - - < 0.50 - - < 20 - 0.0519
DUP1-20141124 Duplicate - 430 - - - 680 - - 62.1 < 50 - 7.9 1,140 355 205 - - - - < 0.50 - - < 20 - 0.0518
QA/QC RPD% - 1 - - - 4 - - 6 * - 16 16 0 2 - - - - * - - * - 0GL0-1-20150608 2015 06 08 7.59 423 - - - 665 - - 48.9 116 - 7.3 884 345 209 - - - - < 0.10 - - < 20 - 0.0637GL0-1-20151103 2015 11 03 7.65 423 - - - 682 - - 77.4 < 25 - 7.1 990 354 206 - - - - < 0.25 - - < 20 - 0.0617GL0-1-20160524 2016 05 24 8.19 423 - - - 673 - - 38.4 65 - 7.1 980 346 198 198 < 1.0 < 1.0 - < 0.25 - - < 20 - 0.0555GL0-1-20170524 2017 05 24 8.32 418 - - - 671 - - 9.7 131 - 7.2 1,000 350 196 - - - - < 0.25 - - < 20 - 0.0614
GL0-1-180529 2018 05 29 7.81 415 7.65 - 934 690 0.87 0.0516 43 82 < 10 6.47 640 281 187 187 < 1.0 < 1.0 < 1.0 < 1.00 - - < 20 0.0516 -
GL0-1-190523 2019 05 23 8.09 384 7.65 - 859 691 1.69 0.0174 < 20 109 < 10 6.33 730 326 191 191 < 1.0 < 1.0 < 1.0 < 0.10 - - < 20 0.0174 -
GL0-1-200310 2020 03 10 7.94 405 - - - 705 1.01 - 284 49 < 10 6.82 860 316 189 189 < 1.0 < 1.0 < 1.0 < 0.10 - - < 20 - 0.0175
Associated CARO files available upon request.
Associated Exova file(s): 712940, 714233, 714243, 756693, 756810, 757047, 811364, 811710, 812030, 812741, 812985, 813438, 846260, 878316, 879073, 909346, 909448, 909654.
All terms defined within the body of SNC-Lavalin's report.
< Denotes concentration less than indicated detection limit or RPD less than indicated value.a Laboratory detection limit exceeds regulatory standard/guideline.
- Denotes analysis not conducted.b Standard to protect freshwater aquatic life.
n/a Denotes no applicable standard/guideline.c Guideline to protect irrigation water. Guideline for surface water, shown here for comparison purposes only.
QA/QC RPD Denotes quality assurance/quality control relative percent differenced Guideline to protect freshwater aquatic life, long-term average (i.e. "chronic"). Guideline for surface water, shown here for comparison purposes only.
* RPDs are not calculated where one or more concentrations are less than five times RDL.e Guideline to protect freshwater aquatic life, short-term maximum (i.e. "acute"). Guideline for surface water, shown here for comparison purposes only.
RDL Denotes reported detection limit.f Standard varies with pH.g Standard varies with Chloride.
BOLD Concentration greater than CSR Aquatic Life (AW) standardh guideline varies with pH and temperature.
SHADED Concentration greater than CSR Irrigation Watering (IW) standardi guideline varies with hardness
RED Concentration greater than BCWQG Irrigation Water (IW) guidelinej Conductivity guidelines varies with crop. Guideline range 700-5,000, most stringent guideline for low tolerance crops applied (strawberry, raspberry, bean and carrot.
BLUE SHADED Concentration greater than BCWQG Aquatic Life Long-Term Average (AW) guideline
BLUE SHADED Concentration greater than BCWQG Aquatic Life Short-term Maximum (AW) guideline
SNC-LAVALIN INC. Page 1 of 20
662036 / 2021 02 0920210309_662036_TAB_Historical.xlsx
QAQC CN 2021 03 09

TABLE V.1: Historical Summary of Analytical Results for Groundwater - Inorganics
Physical Parameters Dissolved Inorganics
Sample Sample Sample Date pH
To
tal H
ard
ness
pH
(fi
eld
)
Co
nd
ucti
vit
y
Fie
ld C
on
du
cti
vit
y
To
tal D
isso
lved
So
lid
s
Dis
so
lved
Org
an
ic
Carb
on
Ph
osp
hate
Am
mo
nia
, T
ota
l (a
s
N)
Nit
rate
(as N
)
Nit
rite
(as N
)
Ch
lori
de
Flu
ori
de
Su
lfate
To
tal A
lkali
nit
y
Alk
ali
nit
y,
Bic
arb
on
ate
(as
CaC
O3)
Alk
ali
nit
y, C
arb
on
ate
(as C
aC
O3)
Alk
ali
nit
y, H
yd
roxid
e
(as C
aC
O3)
Alk
ali
nit
y,
Ph
en
olp
hth
ale
in
(as C
aC
O3)
Bro
mid
e
Hyd
rog
en
Su
lfid
e
Su
lfid
e
Ch
em
ical O
xyg
en
Dem
an
d
Dis
so
lved
Ph
osp
hate
Ort
ho
-Ph
osp
hate
Location ID (yyyy mm dd) pH mg/L pH µS/cm µS/cm mg/L mg/L mg/L µg/L µg/L µg/L mg/L µg/L mg/L mg/L mg/L mg/L mg/L mg/L mg/L mg/L mg/L mg/L mg/L mg/LBC Guideline
CSR Aquatic Life (AW)b n/a n/a n/a n/a n/a n/a n/a n/a 1,310-18,500
f 400,000 800-2,000g 1,500 2,000-3,000
i1,280-4,290
i n/a n/a n/a n/a n/a n/a 0.02 n/a n/a n/a n/a
CSR Irrigation Watering (IW) n/a n/a n/a n/a n/a n/a n/a n/a n/a n/a n/a 100 1,000 n/a n/a n/a n/a n/a n/a n/a n/a n/a n/a n/a n/a
BCWQG Irrigation Water (IW)c 5.0 - 9.0 n/a 5.0 - 9.0 700-5,000
j700-5,000
j n/a n/a n/a n/a n/a n/a 100 2,000 n/a n/a n/a n/a n/a n/a n/a n/a n/a n/a n/a n/a
BCWQG Aquatic Life Long-Term Average (AW)d 6.5 - 9.0 n/a 6.5 - 9.0 n/a n/a n/a n/a n/a 135-1,780
h 3,000 80-200 150 n/a 128-429i n/a n/a n/a n/a n/a n/a n/a n/a n/a n/a n/a
BCWQG Aquatic Life Short-term Maximum (AW)e 6.5 - 9.0 n/a 6.5 - 9.0 n/a n/a n/a n/a n/a 700-24,500
h 32,800 (max) 240-600 600 400 - 1,876 n/a n/a n/a n/a n/a n/a n/a 0.002 n/a n/a n/a n/a
GL0-2 GL0-2-20130627 2013 06 27 - 506 - - - 956 - - 183 6,410 - 49.4 1,410 395 294 - - - - < 0.50 - - < 20 - -
GL0-2-20140603 2014 06 03 - 465 - - - 744 - - 101 181 - 20.9 1,240 326 255 - - - - < 0.50 - - < 20 - 0.0591
GL0-2-20141124 2014 11 24 - 496 - - - 814 - - 92.6 1,820 - 26.3 1,220 341 268 - - - - < 0.50 - - < 20 - 0.0553
GL0-2-20150608 2015 06 08 7.8 479 - - - 675 - - 213 < 10 - 9.6 1,090 317 273 - - - - < 0.10 - - < 20 - 0.0399
GL0-2-20151103 2015 11 03 7.94 500 - - - 726 - - 171 < 25 - 12.1 1,190 317 268 - - - - < 0.25 - - < 20 - 0.0446
DUP1-20151103 Duplicate 7.94 510 - - - 774 - - 167 49 - 13.1 1,220 326 255 - - - - < 0.25 - - < 20 - 0.0446
QA/QC RPD% 0 2 - - - 6 - - 2 * - 8 2 3 5 - - - - * - - * - 0
GL0-2-20160524 2016 05 24 8.22 468 - - - 700 - - 208 < 25 - 6.8 1,240 310 266 266 < 1.0 < 1.0 - < 0.25 - - < 20 - 0.0423
GL0-2-20170524 2017 05 24 8.4 482 - - - 696 - - 173 < 25 - 7.1 1,320 325 258 - - - - < 0.25 - - < 20 - 0.0463
GL0-2-180529 2018 05 29 7.82 473 7.43 - 931 726 1.12 0.0173 211 < 10 < 10 9.63 1,050 296 258 258 < 1.0 < 1.0 < 1.0 < 1.00 - - < 20 0.0173 -
DUP2-180529 Duplicate 7.85 469 7.43 - 931 698 1.17 0.0093 214 < 10 < 10 9.45 1,100 294 260 260 < 1.0 < 1.0 < 1.0 < 1.00 - - < 20 0.0093 -
QA/QC RPD% 0 1 * - 4 * * 1 * * 2 5 1 1 1 * * * * - - * * -
GL0-2-190529 2019 05 29 8.01 546 7.5 - 1,406 1,050 3.70 < 0.0050 173 16,800 47 71.6 1,050 349 340 340 < 1.0 < 1.0 < 1.0 < 1.00 - - < 20 < 0.0050 -
GL0-2-200310 2020 03 10 7.95 456 - - - 721 1.18 - 317 < 10 < 10 7.88 1,150 303 255 255 < 1.0 < 1.0 < 1.0 < 0.10 - - < 20 - 0.0134
GL0-3 GL0-3-20130627 2013 06 27 - 762 - - - 1,500 - - < 5.0 49,500 - 123 1,580 400 436 - - - - < 1.0 - - 27 - -
GL0-3-20140603 2014 06 03 - 747 - - - 1,440 - - < 5.0 48,600 - 124 1,190 385 445 - - - - < 1.0 - - 20 - 0.0096
GL0-3-20141124 2014 11 24 - 797 - - - 1,440 - - 11.8 49,300 - 127 1,160 390 457 - - - - < 1.0 - - < 20 - 0.0059
GL0-3-20150608 2015 06 08 7.65 772 - - - 1,390 - - 13 47,700 - 121 1,120 391 456 - - - - < 0.50 - - 48 - 0.0069
GL0-3-20151103 2015 11 03 7.53 751 - - - 1,460 - - 7.5 47,600 - 121 1,130 382 422 - - - - < 0.50 - - < 20 - 0.0068
GL0-3-20160524 2016 05 24 8.1 754 - - - 1,450 - - 9.6 49,100 - 127 1,220 401 442 442 < 1.0 < 1.0 - < 1.0 - - < 20 - 0.0054
GL0-3-20170524 2017 05 24 8.05 769 - - - 1,420 - - 13.3 48,700 - 131 1,110 368 396 - - - - < 1.0 - - < 20 - 0.0063
GL0-3-180529 2018 05 29 7.81 799 7.28 - 1,826 1,480 5.47 0.0084 38 44,700 < 10 121 990 293 481 481 < 1.0 < 1.0 < 1.0 < 1.00 - - 22 0.0084 -
GL0-3-190529 2019 05 29 7.77 1,110 7.12 - 2,776 2,060 6.89 < 0.0050 82 67,000 12 154 920 613 525 525 < 1.0 < 1.0 < 1.0 < 1.00 - - < 20 < 0.0050 -
GL0-3-200310 2020 03 10 7.82 1,000 - - - 1,970 6.19 - 56 55,800 < 10 139 930 505 491 491 < 1.0 < 1.0 < 1.0 < 1.00 - - 31 - < 0.0050
GL1-1 GL 1-1-20091109 2009 11 09 - 866 - - - - - - - - - - - - - - - - - - - - - - -
GL1-1-20100810 2010 08 10 - 790 - - - 1,250 - - 30 - - 169 - 222 656 - - - - - - - 40 - 0.007
GL30-1-20100810 Duplicate - 780 - - - 1,300 - - 40 - - 168 - 219 660 - - - - - - - 10 - 0.008
QA/QC RPD% - 1 - - - 4 - - 29 - - 1 - 1 1 - - - - - - - * - 13
GL1-1-20160531 2016 05 31 7.43 - - - - 1,290 - - < 20 633 - 237 1,520 244 664 - - - - - - - - - < 0.01
GL1-1-20180927 2018 09 27 - 730 - - - - - - 45 12 - 157 1,420 253 - - - - - < 0.10 - - - - < 0.0050
GL1-1-180612 2018 06 12 7.75 743 - - - 1,160 - 0.0115 62 58 < 10 173 1,250 242 627 627 < 1.0 < 1.0 < 1.0 < 0.10 - - - 0.0115 -
GL1-1-190917 2019 09 17 7.94 763 - - - 1,200 4.15 - 76 < 10 < 10 153 1,520 269 628 628 < 1.0 < 1.0 < 1.0 < 0.10 - - - - < 0.0050
GL1-1-200910 2020 09 10 8.12 746 - - - 1,200 3.45 - 52 < 10 < 10 131 1,570 284 646 646 < 1.0 < 1.0 < 1.0 < 0.10 - - - - < 0.0050
Associated CARO files available upon request.
Associated Exova file(s): 712940, 714233, 714243, 756693, 756810, 757047, 811364, 811710, 812030, 812741, 812985, 813438, 846260, 878316, 879073, 909346, 909448, 909654.
All terms defined within the body of SNC-Lavalin's report.
< Denotes concentration less than indicated detection limit or RPD less than indicated value.a Laboratory detection limit exceeds regulatory standard/guideline.
- Denotes analysis not conducted.b Standard to protect freshwater aquatic life.
n/a Denotes no applicable standard/guideline.c Guideline to protect irrigation water. Guideline for surface water, shown here for comparison purposes only.
QA/QC RPD Denotes quality assurance/quality control relative percent differenced Guideline to protect freshwater aquatic life, long-term average (i.e. "chronic"). Guideline for surface water, shown here for comparison purposes only.
* RPDs are not calculated where one or more concentrations are less than five times RDL.e Guideline to protect freshwater aquatic life, short-term maximum (i.e. "acute"). Guideline for surface water, shown here for comparison purposes only.
RDL Denotes reported detection limit.f Standard varies with pH.g Standard varies with Chloride.
BOLD Concentration greater than CSR Aquatic Life (AW) standardh guideline varies with pH and temperature.
SHADED Concentration greater than CSR Irrigation Watering (IW) standardi guideline varies with hardness
RED Concentration greater than BCWQG Irrigation Water (IW) guidelinej Conductivity guidelines varies with crop. Guideline range 700-5,000, most stringent guideline for low tolerance crops applied (strawberry, raspberry, bean and carrot.
BLUE SHADED Concentration greater than BCWQG Aquatic Life Long-Term Average (AW) guideline
BLUE SHADED Concentration greater than BCWQG Aquatic Life Short-term Maximum (AW) guideline
SNC-LAVALIN INC. Page 2 of 20
662036 / 2021 02 0920210309_662036_TAB_Historical.xlsx
QAQC CN 2021 03 09

TABLE V.1: Historical Summary of Analytical Results for Groundwater - Inorganics
Physical Parameters Dissolved Inorganics
Sample Sample Sample Date pH
To
tal H
ard
ness
pH
(fi
eld
)
Co
nd
ucti
vit
y
Fie
ld C
on
du
cti
vit
y
To
tal D
isso
lved
So
lid
s
Dis
so
lved
Org
an
ic
Carb
on
Ph
osp
hate
Am
mo
nia
, T
ota
l (a
s
N)
Nit
rate
(as N
)
Nit
rite
(as N
)
Ch
lori
de
Flu
ori
de
Su
lfate
To
tal A
lkali
nit
y
Alk
ali
nit
y,
Bic
arb
on
ate
(as
CaC
O3)
Alk
ali
nit
y, C
arb
on
ate
(as C
aC
O3)
Alk
ali
nit
y, H
yd
roxid
e
(as C
aC
O3)
Alk
ali
nit
y,
Ph
en
olp
hth
ale
in
(as C
aC
O3)
Bro
mid
e
Hyd
rog
en
Su
lfid
e
Su
lfid
e
Ch
em
ical O
xyg
en
Dem
an
d
Dis
so
lved
Ph
osp
hate
Ort
ho
-Ph
osp
hate
Location ID (yyyy mm dd) pH mg/L pH µS/cm µS/cm mg/L mg/L mg/L µg/L µg/L µg/L mg/L µg/L mg/L mg/L mg/L mg/L mg/L mg/L mg/L mg/L mg/L mg/L mg/L mg/LBC Guideline
CSR Aquatic Life (AW)b n/a n/a n/a n/a n/a n/a n/a n/a 1,310-18,500
f 400,000 800-2,000g 1,500 2,000-3,000
i1,280-4,290
i n/a n/a n/a n/a n/a n/a 0.02 n/a n/a n/a n/a
CSR Irrigation Watering (IW) n/a n/a n/a n/a n/a n/a n/a n/a n/a n/a n/a 100 1,000 n/a n/a n/a n/a n/a n/a n/a n/a n/a n/a n/a n/a
BCWQG Irrigation Water (IW)c 5.0 - 9.0 n/a 5.0 - 9.0 700-5,000
j700-5,000
j n/a n/a n/a n/a n/a n/a 100 2,000 n/a n/a n/a n/a n/a n/a n/a n/a n/a n/a n/a n/a
BCWQG Aquatic Life Long-Term Average (AW)d 6.5 - 9.0 n/a 6.5 - 9.0 n/a n/a n/a n/a n/a 135-1,780
h 3,000 80-200 150 n/a 128-429i n/a n/a n/a n/a n/a n/a n/a n/a n/a n/a n/a
BCWQG Aquatic Life Short-term Maximum (AW)e 6.5 - 9.0 n/a 6.5 - 9.0 n/a n/a n/a n/a n/a 700-24,500
h 32,800 (max) 240-600 600 400 - 1,876 n/a n/a n/a n/a n/a n/a n/a 0.002 n/a n/a n/a n/a
GL1-2 GL 1-2-20091109 2009 11 09 - 909 - - - - - - - - - - - - - - - - - - - - - - -
GL1-2-20100810 2010 08 10 - 840 - - - 1,140 - - < 10 - - 191 - 201 675 - - - - - - - 60 - 0.006
GL1-2-20160531 2016 05 31 7.66 - - - - 1,190 - - < 20 29 - 232 1,420 209 660 - - - - - - - - - < 0.01
GL1-2-180612 2018 06 12 7.84 790 - - - 1,230 - 0.0102 71 < 10 < 10 216 1,270 238 640 640 < 1.0 < 1.0 < 1.0 < 0.10 - - - 0.0102 -
GL1-2-20180927 2018 09 27 - 759 - - - - - - < 20 44 - 181 1,100 228 - - - - - < 0.10 - - - - < 0.0050
GL1-2-190917 2019 09 17 7.98 762 - - - 1,240 4.46 - 32 < 10 < 10 166 1,330 256 662 662 < 1.0 < 1.0 < 1.0 < 0.10 - - - - < 0.0050
GL1-2-200910 2020 09 10 8.14 814 - - - 1,300 4.98 - < 50 < 10 < 10 117 1,430 283 676 676 < 1.0 < 1.0 < 1.0 < 0.10 - - - - < 0.0050
GL2-1 GL 2-1-20091109 2009 11 09 - 348 - - - - - - - - - - - - - - - - - - - - - - -GL 2-1-20120627 2012 06 27 - 380 - - - 670 - - 50 - - 22.5 - 212 306 - - - - - - - 10 - 0.004GL2-1-20100810 2010 08 10 - 360 - - - 604 - - 40 - - 16.8 - 170 317 - - - - - - - < 10 - 0.004GL30-2-20100810 Duplicate - 350 - - - 650 - - 30 - - 15.9 - 173 320 - - - - - - - < 10 - 0.006
QA/QC RPD% - 3 - - - 7 - - 29 - - 6 - 2 1 - - - - - - - * - *GL2-1-20110629 2011 06 29 - 359 - - - 638 - - 50 - - 21.3 - 203 302 - - - - - - - < 10 - 0.09GL2-1-20111217 2011 12 17 - 372 - - - 640 - - 20 < 10 - 18.1 - 207 332 - - - - - - - < 10 - < 0.01GL2-1-20121204 2012 12 04 - 348 - - - 642 - - 90 < 100 - 18 - 192 326 - - - - - - - 14 - < 0.002GL2-1-20130626 2013 06 26 - 418 - - - 660 - - 34.3 < 50 - 23.2 830 225 291 - - - - < 0.50 - - < 20 - -GL2-1-20140603 2014 06 03 - 418 - - - 707 - - 17 54 - 32 770 266 292 - - - - < 0.50 - - < 20 - 0.0034DUP3-20140603 Duplicate - 412 - - - 710 - - 17.2 82 - 33 750 260 293 - - - - < 0.50 - - < 20 - 0.0031
QA/QC RPD% - 1 - - - 0 - - * 41 - 3 3 2 0 - - - - * - - * - *GL2-1-20141124 2014 11 24 - 429 - - - 688 - - 39.8 372 - 27.8 790 233 275 - - - - < 0.50 - - < 20 - 0.0044GL2-1-20150608 2015 06 08 7.89 444 - - - 713 - - 14.6 36 - 34.5 730 281 306 - - - - 0.31 - - < 20 - 0.0027GL2-1-20151103 2015 11 03 8.05 424 - - - 688 - - 37.1 < 25 - 28.2 760 246 358 - - - - 0.27 - - < 20 - 0.0028GL2-1-20160524 2016 05 24 8.21 445 - - - 730 - - < 5.0 97 - 34.9 720 275 289 289 < 1.0 < 1.0 - 0.31 - - < 20 - 0.0033DUP2-20160524 Duplicate 8.2 439 - - - 718 - - < 5.0 68 - 35.9 740 283 289 289 < 1.0 < 1.0 - 0.35 - - < 20 - 0.0027
QA/QC RPD% 0 1 - - - 2 - - * 35 - 3 3 3 0 0 * * - * - - * - *GL2-1-20170524 2017 05 24 8.25 466 - - - 815 - - 53.7 < 25 - 45.3 670 323 259 - - - - 0.39 - - < 20 - 0.0016
GL2-1-180528 2018 05 28 7.90 457 - - - 845 1.46 < 0.0050 92 < 250 < 250a 35.6 510 319 257 257 < 1.0 < 1.0 < 1.0 < 2.50 - - < 20 < 0.0050 -
GL2-1-190523 2019 05 23 8.11 505 7.57 - 1,119 903 1.77 < 0.0050 63 16 < 10 46.4 510 370 260 260 < 1.0 < 1.0 < 1.0 0.32 - - < 20 < 0.0050 -
GL2-1-200609 2020 06 09 7.90 556 7.36 - 1,202 970 1.54 - 90 < 1,000 < 1,000a 54.0 < 10,000a 410 254 254 < 1.0 < 1.0 < 1.0 < 10.0 - - < 20 - < 0.500
GL2-1-200820 2020 08 20 8.10 473 7.46 - 1,435 1,000 1.72 - 73 - - 63.4 - - 237 237 < 1.0 < 1.0 < 1.0 0.44 - - < 20 - < 0.0050
DUPA-200820 Duplicate 8.10 476 7.46 - 1,435 992 2.18 - 69 - - 63.2 - - 240 240 < 1.0 < 1.0 < 1.0 0.44 - - < 20 - < 0.0050
QA/QC RPD% 0 1 * - * 1 * - * - - 0 - - 1 1 * * * * - - * - *
GL2-1-201019 2020 10 19 8.10 513 7.6 - 1,508 1,030 2.10 - 131 < 10 < 10 66.4 580 443 216 216 < 1.0 < 1.0 < 1.0 0.50 - - < 20 - < 0.0050
GL2-2 GL 2-2-20091109 2009 11 09 - 359 - - - - - - - - - - - - - - - - - - - - - - -GL2-2-20100810 2010 08 10 - 350 - - - 598 - - < 10 - - 16.1 - 129 352 - - - - - - - 20 - 0.016
GL2-2-200826 2020 08 26 8.06 405 7.36 - 1,142 751 1.29 - < 50 < 100 < 100 37.4 < 1,000 273 305 305 < 1.0 < 1.0 < 1.0 < 1.00 - - < 20 - < 0.0500
GL2-2-201020 2020 10 20 7.91 464 7.55 - 1,234 810 1.25 - < 50 < 10 < 10 46.7 660 309 283 283 < 1.0 < 1.0 < 1.0 0.29 - - < 20 - < 0.0050
GL3-2 GL3-2-20091116 2009 11 16 - 337 - - - - - - - - - - - - - - - - - - - - - - -
GL3-2-20100810 2010 08 10 - 320 - - - 750 - - 140 - - 9.52 - 278 379 - - - - - - - 10 - 0.024
Associated CARO files available upon request.
Associated Exova file(s): 712940, 714233, 714243, 756693, 756810, 757047, 811364, 811710, 812030, 812741, 812985, 813438, 846260, 878316, 879073, 909346, 909448, 909654.
All terms defined within the body of SNC-Lavalin's report.
< Denotes concentration less than indicated detection limit or RPD less than indicated value.a Laboratory detection limit exceeds regulatory standard/guideline.
- Denotes analysis not conducted.b Standard to protect freshwater aquatic life.
n/a Denotes no applicable standard/guideline.c Guideline to protect irrigation water. Guideline for surface water, shown here for comparison purposes only.
QA/QC RPD Denotes quality assurance/quality control relative percent differenced Guideline to protect freshwater aquatic life, long-term average (i.e. "chronic"). Guideline for surface water, shown here for comparison purposes only.
* RPDs are not calculated where one or more concentrations are less than five times RDL.e Guideline to protect freshwater aquatic life, short-term maximum (i.e. "acute"). Guideline for surface water, shown here for comparison purposes only.
RDL Denotes reported detection limit.f Standard varies with pH.g Standard varies with Chloride.
BOLD Concentration greater than CSR Aquatic Life (AW) standardh guideline varies with pH and temperature.
SHADED Concentration greater than CSR Irrigation Watering (IW) standardi guideline varies with hardness
RED Concentration greater than BCWQG Irrigation Water (IW) guidelinej Conductivity guidelines varies with crop. Guideline range 700-5,000, most stringent guideline for low tolerance crops applied (strawberry, raspberry, bean and carrot.
BLUE SHADED Concentration greater than BCWQG Aquatic Life Long-Term Average (AW) guideline
BLUE SHADED Concentration greater than BCWQG Aquatic Life Short-term Maximum (AW) guideline
SNC-LAVALIN INC. Page 3 of 20
662036 / 2021 02 0920210309_662036_TAB_Historical.xlsx
QAQC CN 2021 03 09
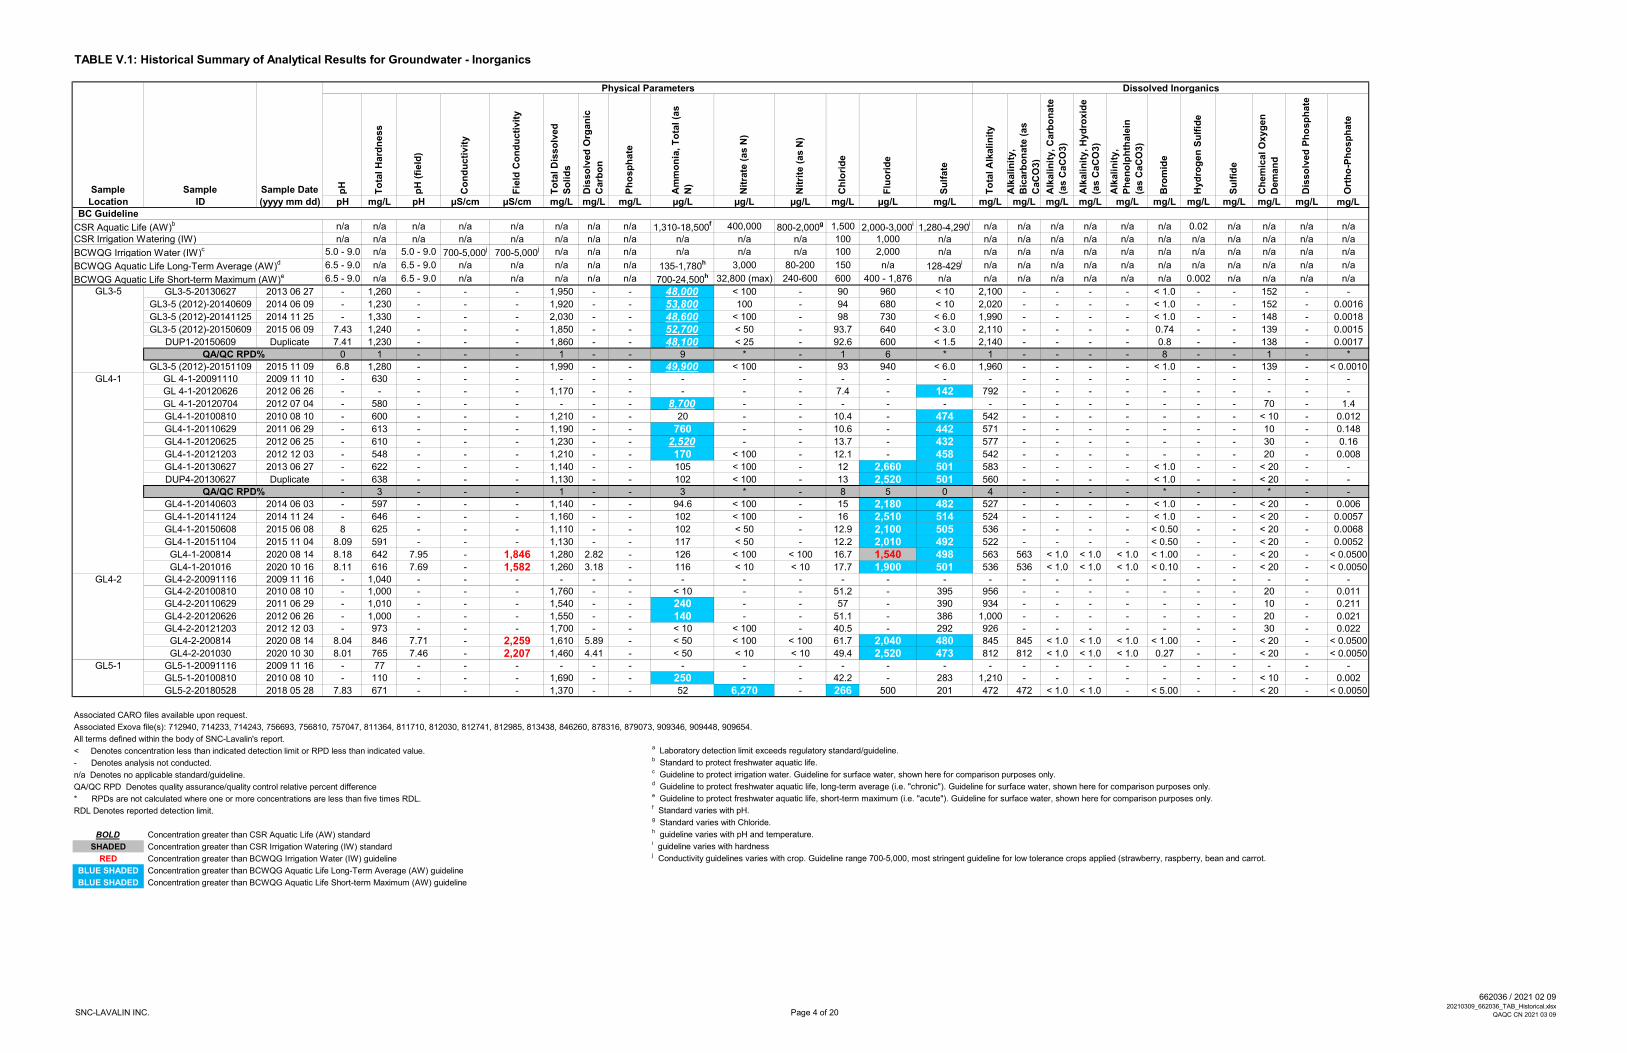
TABLE V.1: Historical Summary of Analytical Results for Groundwater - Inorganics
Physical Parameters Dissolved Inorganics
Sample Sample Sample Date pH
To
tal H
ard
ness
pH
(fi
eld
)
Co
nd
ucti
vit
y
Fie
ld C
on
du
cti
vit
y
To
tal D
isso
lved
So
lid
s
Dis
so
lved
Org
an
ic
Carb
on
Ph
osp
hate
Am
mo
nia
, T
ota
l (a
s
N)
Nit
rate
(as N
)
Nit
rite
(as N
)
Ch
lori
de
Flu
ori
de
Su
lfate
To
tal A
lkali
nit
y
Alk
ali
nit
y,
Bic
arb
on
ate
(as
CaC
O3)
Alk
ali
nit
y, C
arb
on
ate
(as C
aC
O3)
Alk
ali
nit
y, H
yd
roxid
e
(as C
aC
O3)
Alk
ali
nit
y,
Ph
en
olp
hth
ale
in
(as C
aC
O3)
Bro
mid
e
Hyd
rog
en
Su
lfid
e
Su
lfid
e
Ch
em
ical O
xyg
en
Dem
an
d
Dis
so
lved
Ph
osp
hate
Ort
ho
-Ph
osp
hate
Location ID (yyyy mm dd) pH mg/L pH µS/cm µS/cm mg/L mg/L mg/L µg/L µg/L µg/L mg/L µg/L mg/L mg/L mg/L mg/L mg/L mg/L mg/L mg/L mg/L mg/L mg/L mg/LBC Guideline
CSR Aquatic Life (AW)b n/a n/a n/a n/a n/a n/a n/a n/a 1,310-18,500
f 400,000 800-2,000g 1,500 2,000-3,000
i1,280-4,290
i n/a n/a n/a n/a n/a n/a 0.02 n/a n/a n/a n/a
CSR Irrigation Watering (IW) n/a n/a n/a n/a n/a n/a n/a n/a n/a n/a n/a 100 1,000 n/a n/a n/a n/a n/a n/a n/a n/a n/a n/a n/a n/a
BCWQG Irrigation Water (IW)c 5.0 - 9.0 n/a 5.0 - 9.0 700-5,000
j700-5,000
j n/a n/a n/a n/a n/a n/a 100 2,000 n/a n/a n/a n/a n/a n/a n/a n/a n/a n/a n/a n/a
BCWQG Aquatic Life Long-Term Average (AW)d 6.5 - 9.0 n/a 6.5 - 9.0 n/a n/a n/a n/a n/a 135-1,780
h 3,000 80-200 150 n/a 128-429i n/a n/a n/a n/a n/a n/a n/a n/a n/a n/a n/a
BCWQG Aquatic Life Short-term Maximum (AW)e 6.5 - 9.0 n/a 6.5 - 9.0 n/a n/a n/a n/a n/a 700-24,500
h 32,800 (max) 240-600 600 400 - 1,876 n/a n/a n/a n/a n/a n/a n/a 0.002 n/a n/a n/a n/a
GL3-5 GL3-5-20130627 2013 06 27 - 1,260 - - - 1,950 - - 48,000 < 100 - 90 960 < 10 2,100 - - - - < 1.0 - - 152 - -
GL3-5 (2012)-20140609 2014 06 09 - 1,230 - - - 1,920 - - 53,800 100 - 94 680 < 10 2,020 - - - - < 1.0 - - 152 - 0.0016
GL3-5 (2012)-20141125 2014 11 25 - 1,330 - - - 2,030 - - 48,600 < 100 - 98 730 < 6.0 1,990 - - - - < 1.0 - - 148 - 0.0018
GL3-5 (2012)-20150609 2015 06 09 7.43 1,240 - - - 1,850 - - 52,700 < 50 - 93.7 640 < 3.0 2,110 - - - - 0.74 - - 139 - 0.0015
DUP1-20150609 Duplicate 7.41 1,230 - - - 1,860 - - 48,100 < 25 - 92.6 600 < 1.5 2,140 - - - - 0.8 - - 138 - 0.0017
QA/QC RPD% 0 1 - - - 1 - - 9 * - 1 6 * 1 - - - - 8 - - 1 - *
GL3-5 (2012)-20151109 2015 11 09 6.8 1,280 - - - 1,990 - - 49,900 < 100 - 93 940 < 6.0 1,960 - - - - < 1.0 - - 139 - < 0.0010
GL4-1 GL 4-1-20091110 2009 11 10 - 630 - - - - - - - - - - - - - - - - - - - - - - -
GL 4-1-20120626 2012 06 26 - - - - - 1,170 - - - - - 7.4 - 142 792 - - - - - - - - - -
GL 4-1-20120704 2012 07 04 - 580 - - - - - - 8,700 - - - - - - - - - - - - - 70 - 1.4
GL4-1-20100810 2010 08 10 - 600 - - - 1,210 - - 20 - - 10.4 - 474 542 - - - - - - - < 10 - 0.012
GL4-1-20110629 2011 06 29 - 613 - - - 1,190 - - 760 - - 10.6 - 442 571 - - - - - - - 10 - 0.148
GL4-1-20120625 2012 06 25 - 610 - - - 1,230 - - 2,520 - - 13.7 - 432 577 - - - - - - - 30 - 0.16
GL4-1-20121203 2012 12 03 - 548 - - - 1,210 - - 170 < 100 - 12.1 - 458 542 - - - - - - - 20 - 0.008
GL4-1-20130627 2013 06 27 - 622 - - - 1,140 - - 105 < 100 - 12 2,660 501 583 - - - - < 1.0 - - < 20 - -
DUP4-20130627 Duplicate - 638 - - - 1,130 - - 102 < 100 - 13 2,520 501 560 - - - - < 1.0 - - < 20 - -
QA/QC RPD% - 3 - - - 1 - - 3 * - 8 5 0 4 - - - - * - - * - -
GL4-1-20140603 2014 06 03 - 597 - - - 1,140 - - 94.6 < 100 - 15 2,180 482 527 - - - - < 1.0 - - < 20 - 0.006
GL4-1-20141124 2014 11 24 - 646 - - - 1,160 - - 102 < 100 - 16 2,510 514 524 - - - - < 1.0 - - < 20 - 0.0057
GL4-1-20150608 2015 06 08 8 625 - - - 1,110 - - 102 < 50 - 12.9 2,100 505 536 - - - - < 0.50 - - < 20 - 0.0068
GL4-1-20151104 2015 11 04 8.09 591 - - - 1,130 - - 117 < 50 - 12.2 2,010 492 522 - - - - < 0.50 - - < 20 - 0.0052
GL4-1-200814 2020 08 14 8.18 642 7.95 - 1,846 1,280 2.82 - 126 < 100 < 100 16.7 1,540 498 563 563 < 1.0 < 1.0 < 1.0 < 1.00 - - < 20 - < 0.0500
GL4-1-201016 2020 10 16 8.11 616 7.69 - 1,582 1,260 3.18 - 116 < 10 < 10 17.7 1,900 501 536 536 < 1.0 < 1.0 < 1.0 < 0.10 - - < 20 - < 0.0050
GL4-2 GL4-2-20091116 2009 11 16 - 1,040 - - - - - - - - - - - - - - - - - - - - - - -GL4-2-20100810 2010 08 10 - 1,000 - - - 1,760 - - < 10 - - 51.2 - 395 956 - - - - - - - 20 - 0.011
GL4-2-20110629 2011 06 29 - 1,010 - - - 1,540 - - 240 - - 57 - 390 934 - - - - - - - 10 - 0.211
GL4-2-20120626 2012 06 26 - 1,000 - - - 1,550 - - 140 - - 51.1 - 386 1,000 - - - - - - - 20 - 0.021
GL4-2-20121203 2012 12 03 - 973 - - - 1,700 - - < 10 < 100 - 40.5 - 292 926 - - - - - - - 30 - 0.022
GL4-2-200814 2020 08 14 8.04 846 7.71 - 2,259 1,610 5.89 - < 50 < 100 < 100 61.7 2,040 480 845 845 < 1.0 < 1.0 < 1.0 < 1.00 - - < 20 - < 0.0500
GL4-2-201030 2020 10 30 8.01 765 7.46 - 2,207 1,460 4.41 - < 50 < 10 < 10 49.4 2,520 473 812 812 < 1.0 < 1.0 < 1.0 0.27 - - < 20 - < 0.0050
GL5-1 GL5-1-20091116 2009 11 16 - 77 - - - - - - - - - - - - - - - - - - - - - - -
GL5-1-20100810 2010 08 10 - 110 - - - 1,690 - - 250 - - 42.2 - 283 1,210 - - - - - - - < 10 - 0.002
GL5-2-20180528 2018 05 28 7.83 671 - - - 1,370 - - 52 6,270 - 266 500 201 472 472 < 1.0 < 1.0 - < 5.00 - - < 20 - < 0.0050
Associated CARO files available upon request.
Associated Exova file(s): 712940, 714233, 714243, 756693, 756810, 757047, 811364, 811710, 812030, 812741, 812985, 813438, 846260, 878316, 879073, 909346, 909448, 909654.
All terms defined within the body of SNC-Lavalin's report.
< Denotes concentration less than indicated detection limit or RPD less than indicated value.a Laboratory detection limit exceeds regulatory standard/guideline.
- Denotes analysis not conducted.b Standard to protect freshwater aquatic life.
n/a Denotes no applicable standard/guideline.c Guideline to protect irrigation water. Guideline for surface water, shown here for comparison purposes only.
QA/QC RPD Denotes quality assurance/quality control relative percent differenced Guideline to protect freshwater aquatic life, long-term average (i.e. "chronic"). Guideline for surface water, shown here for comparison purposes only.
* RPDs are not calculated where one or more concentrations are less than five times RDL.e Guideline to protect freshwater aquatic life, short-term maximum (i.e. "acute"). Guideline for surface water, shown here for comparison purposes only.
RDL Denotes reported detection limit.f Standard varies with pH.g Standard varies with Chloride.
BOLD Concentration greater than CSR Aquatic Life (AW) standardh guideline varies with pH and temperature.
SHADED Concentration greater than CSR Irrigation Watering (IW) standardi guideline varies with hardness
RED Concentration greater than BCWQG Irrigation Water (IW) guidelinej Conductivity guidelines varies with crop. Guideline range 700-5,000, most stringent guideline for low tolerance crops applied (strawberry, raspberry, bean and carrot.
BLUE SHADED Concentration greater than BCWQG Aquatic Life Long-Term Average (AW) guideline
BLUE SHADED Concentration greater than BCWQG Aquatic Life Short-term Maximum (AW) guideline
SNC-LAVALIN INC. Page 4 of 20
662036 / 2021 02 0920210309_662036_TAB_Historical.xlsx
QAQC CN 2021 03 09

TABLE V.1: Historical Summary of Analytical Results for Groundwater - Inorganics
Physical Parameters Dissolved Inorganics
Sample Sample Sample Date pH
To
tal H
ard
ness
pH
(fi
eld
)
Co
nd
ucti
vit
y
Fie
ld C
on
du
cti
vit
y
To
tal D
isso
lved
So
lid
s
Dis
so
lved
Org
an
ic
Carb
on
Ph
osp
hate
Am
mo
nia
, T
ota
l (a
s
N)
Nit
rate
(as N
)
Nit
rite
(as N
)
Ch
lori
de
Flu
ori
de
Su
lfate
To
tal A
lkali
nit
y
Alk
ali
nit
y,
Bic
arb
on
ate
(as
CaC
O3)
Alk
ali
nit
y, C
arb
on
ate
(as C
aC
O3)
Alk
ali
nit
y, H
yd
roxid
e
(as C
aC
O3)
Alk
ali
nit
y,
Ph
en
olp
hth
ale
in
(as C
aC
O3)
Bro
mid
e
Hyd
rog
en
Su
lfid
e
Su
lfid
e
Ch
em
ical O
xyg
en
Dem
an
d
Dis
so
lved
Ph
osp
hate
Ort
ho
-Ph
osp
hate
Location ID (yyyy mm dd) pH mg/L pH µS/cm µS/cm mg/L mg/L mg/L µg/L µg/L µg/L mg/L µg/L mg/L mg/L mg/L mg/L mg/L mg/L mg/L mg/L mg/L mg/L mg/L mg/LBC Guideline
CSR Aquatic Life (AW)b n/a n/a n/a n/a n/a n/a n/a n/a 1,310-18,500
f 400,000 800-2,000g 1,500 2,000-3,000
i1,280-4,290
i n/a n/a n/a n/a n/a n/a 0.02 n/a n/a n/a n/a
CSR Irrigation Watering (IW) n/a n/a n/a n/a n/a n/a n/a n/a n/a n/a n/a 100 1,000 n/a n/a n/a n/a n/a n/a n/a n/a n/a n/a n/a n/a
BCWQG Irrigation Water (IW)c 5.0 - 9.0 n/a 5.0 - 9.0 700-5,000
j700-5,000
j n/a n/a n/a n/a n/a n/a 100 2,000 n/a n/a n/a n/a n/a n/a n/a n/a n/a n/a n/a n/a
BCWQG Aquatic Life Long-Term Average (AW)d 6.5 - 9.0 n/a 6.5 - 9.0 n/a n/a n/a n/a n/a 135-1,780
h 3,000 80-200 150 n/a 128-429i n/a n/a n/a n/a n/a n/a n/a n/a n/a n/a n/a
BCWQG Aquatic Life Short-term Maximum (AW)e 6.5 - 9.0 n/a 6.5 - 9.0 n/a n/a n/a n/a n/a 700-24,500
h 32,800 (max) 240-600 600 400 - 1,876 n/a n/a n/a n/a n/a n/a n/a 0.002 n/a n/a n/a n/a
GL5-2 GL5-2-20091116 2009 11 16 - 602 - - - - - - - - - - - - - - - - - - - - - - -GL30-1-20091116 Duplicate - 597 - - - - - - - - - - - - - - - - - - - - - - -
QA/QC RPD% - 1 - - - - - - - - - - - - - - - - - - - - - - -
GL5-2-20100810 2010 08 10 - 640 - - - 1,050 - - < 10 - - 183 - 168 527 - - - - - - - 10 - 0.006
GL30-3-20100810 Duplicate - 640 - - - 1,120 - - < 10 - - 181 - 167 526 - - - - - - - 10 - 0.007
QA/QC RPD% - 0 - - - 6 - - * - - 1 - 1 0 - - - - - - - * - 15
GL5-2-20110704 2011 07 04 - 778 - - - 1,080 - - 40 - - 228 - 153 560 - - - - - - - 20 - 0.005
GL 5-2-20120627 2012 06 27 - 710 - - - 1,160 - - < 10 - - 243 - 171 522 - - - - - - - 10 - 0.005
DUP C-20120627 Duplicate - 730 - - - 1,130 - - 30 - - 246 - 171 520 - - - - - - - 40 - 0.005
QA/QC RPD% - 3 - - - 3 - - * - - 1 - 0 0 - - - - - - - * - 0
GL5-2-20121205 2012 12 05 - 659 - - - 1,060 - - < 10 < 1,000 - 193 - 191 551 - - - - - - - 21 - 0.005
GL5-2-20130626 2013 06 26 - 726 - - - 1,150 - - < 5.0 < 100 - 256 1,160 181 580 - - - - < 1.0 - - 37 - -
GL5-2-20131114 2013 11 14 - 687 - - - 1,110 - - < 5.0 < 100 - 226 980 207 803 - - - - < 1.0 - - < 20 - -
GL5-2-20140603 2014 06 03 - 655 - - - 1,130 - - < 5.0 < 100 - 248 980 191 600 - - - - < 1.0 - - 21 - 0.0046
GL5-2-20141118 2014 11 18 - 636 - - - 1,000 - - 5.9 < 100 - 176 940 210 691 - - - - < 1.0 - - < 20 - 0.0046
DUP2-20141118 Duplicate - 635 - - - 1,070 - - < 5.0 < 100 - 177 950 211 683 - - - - < 1.0 - - 24 - 0.0047
QA/QC RPD% - 0 - - - 7 - - * * - 1 1 0 1 - - - - * - - * - *
GL5-2-20150608 2015 06 08 7.65 956 - - - 1,890 - - < 5.0 2,060 - 739 790 176 630 - - - - < 1.0 - - 31 - 0.0036
GL5-2-20151103 2015 11 03 7.94 623 - - - 1,060 - - 5 < 50 - 165 940 219 539 - - - - < 0.50 - - < 20 - 0.0049
GL5-2-20160526 2016 05 26 7.97 879 - - - 1,960 - - < 5.0 5,370 - 719 900 215 475 - - - - < 1.0 - - < 20 - 0.0031
GL5-2-20170525 2017 05 25 8.22 782 - - - 1,690 - - < 5.0 5,720 - 550 840 209 510 - - - - < 1.0 - - < 20 - 0.0037
DUP1-20170525 Duplicate 8.28 787 - - - 1,670 - - < 5.0 5,670 - 543 850 207 437 - - - - < 1.0 - - < 20 - 0.0038
QA/QC RPD% 1 1 - - - 1 - - * 1 - 1 1 1 15 - - - - * - - * - *
GL5-2-180528 2018 05 28 7.83 671 7.08 - 2,100 1,370 4.60 < 0.0050 52 6,270 < 10 266 500 201 472 472 < 1.0 < 1.0 < 1.0 < 5.00 - - < 20 < 0.0050 -
GL5-2-190527 2019 05 27 7.96 638 7.43 - 2,396 1,300 4.40 0.0051 38 9,010 < 10 319 650 332 488 488 < 1.0 < 1.0 < 1.0 0.24 - - < 20 0.0051 -
GL5-2-200611 2020 06 11 7.83 501 7.21 - 1,529 1,120 2.31 - < 50 310 < 100 179 < 1,000 243 522 522 < 1.0 < 1.0 < 1.0 < 1.00 - - 48 - < 0.0500
GL5-3 GL5-3-20091116 2009 11 16 - 596 - - - - - - - - - - - - - - - - - - - - - - -
GL5-3-20100810 2010 08 10 - 600 - - - 974 - - < 10 - - 180 - 155 474 - - - - - - - 20 - 0.022
GL6-1 (2011) GL 6-1-20091110 2009 11 10 - 3,530 - - - - - - - - - - - - - - - - - - - - - - -
GL6-1-20110704 2011 07 04 - 1,220 - - - 9,120 - - 230,000 - - 840 - 930 6,900 - - - - - - - 1,120 - 5.6
GL 6-1 (2011)-20120626 2012 06 26 - 1,510 - - - 10,100 - - 275,000 - - 809 - 1,800 6,150 - - - - - - - 1,300 - -
GL 6-1 (2011)-20120704 2012 07 04 - - - - - - - - - - - - - - - - - - - - - - - - 2.6
GL6-1 (2011)-20130627 2013 06 27 - 1,200 - - - 9,310 - - 251,000 < 250 - 951 1,100 779 6,020 - - - - 10.4 - - 1,220 - -
GL6-1-20131114 2013 11 14 - 1,650 - - - 12,400 - - 235,000 < 500 - 965 438 3,740 7,020 - - - - 10 - - 1,120 - -
GL6-1 (2011)-20140609 2014 06 09 - 1,300 - - - 9,450 - - 252,000 550 - 872 < 1,000 2,030 5,810 - - - - 8.7 - - 987 - 4.94
GL6-1 (2011)-20141127 2014 11 27 - 1,580 - - - 13,800 - - 234,000 840 - 943 449 3,480 7,150 7,150 < 100 < 100 - 9.4 - - 1,030 - 6.39
GL6-1 (2011)-20150615 2015 06 15 7.83 1,030 - - - 9,280 - - 254,000 < 500 - 936 < 2,000a 1,710 5,920 - - - - 9.4 - - 1,110 - 4.24
Associated CARO files available upon request.
Associated Exova file(s): 712940, 714233, 714243, 756693, 756810, 757047, 811364, 811710, 812030, 812741, 812985, 813438, 846260, 878316, 879073, 909346, 909448, 909654.
All terms defined within the body of SNC-Lavalin's report.
< Denotes concentration less than indicated detection limit or RPD less than indicated value.a Laboratory detection limit exceeds regulatory standard/guideline.
- Denotes analysis not conducted.b Standard to protect freshwater aquatic life.
n/a Denotes no applicable standard/guideline.c Guideline to protect irrigation water. Guideline for surface water, shown here for comparison purposes only.
QA/QC RPD Denotes quality assurance/quality control relative percent differenced Guideline to protect freshwater aquatic life, long-term average (i.e. "chronic"). Guideline for surface water, shown here for comparison purposes only.
* RPDs are not calculated where one or more concentrations are less than five times RDL.e Guideline to protect freshwater aquatic life, short-term maximum (i.e. "acute"). Guideline for surface water, shown here for comparison purposes only.
RDL Denotes reported detection limit.f Standard varies with pH.g Standard varies with Chloride.
BOLD Concentration greater than CSR Aquatic Life (AW) standardh guideline varies with pH and temperature.
SHADED Concentration greater than CSR Irrigation Watering (IW) standardi guideline varies with hardness
RED Concentration greater than BCWQG Irrigation Water (IW) guidelinej Conductivity guidelines varies with crop. Guideline range 700-5,000, most stringent guideline for low tolerance crops applied (strawberry, raspberry, bean and carrot.
BLUE SHADED Concentration greater than BCWQG Aquatic Life Long-Term Average (AW) guideline
BLUE SHADED Concentration greater than BCWQG Aquatic Life Short-term Maximum (AW) guideline
SNC-LAVALIN INC. Page 5 of 20
662036 / 2021 02 0920210309_662036_TAB_Historical.xlsx
QAQC CN 2021 03 09

TABLE V.1: Historical Summary of Analytical Results for Groundwater - Inorganics
Physical Parameters Dissolved Inorganics
Sample Sample Sample Date pH
To
tal H
ard
ness
pH
(fi
eld
)
Co
nd
ucti
vit
y
Fie
ld C
on
du
cti
vit
y
To
tal D
isso
lved
So
lid
s
Dis
so
lved
Org
an
ic
Carb
on
Ph
osp
hate
Am
mo
nia
, T
ota
l (a
s
N)
Nit
rate
(as N
)
Nit
rite
(as N
)
Ch
lori
de
Flu
ori
de
Su
lfate
To
tal A
lkali
nit
y
Alk
ali
nit
y,
Bic
arb
on
ate
(as
CaC
O3)
Alk
ali
nit
y, C
arb
on
ate
(as C
aC
O3)
Alk
ali
nit
y, H
yd
roxid
e
(as C
aC
O3)
Alk
ali
nit
y,
Ph
en
olp
hth
ale
in
(as C
aC
O3)
Bro
mid
e
Hyd
rog
en
Su
lfid
e
Su
lfid
e
Ch
em
ical O
xyg
en
Dem
an
d
Dis
so
lved
Ph
osp
hate
Ort
ho
-Ph
osp
hate
Location ID (yyyy mm dd) pH mg/L pH µS/cm µS/cm mg/L mg/L mg/L µg/L µg/L µg/L mg/L µg/L mg/L mg/L mg/L mg/L mg/L mg/L mg/L mg/L mg/L mg/L mg/L mg/LBC Guideline
CSR Aquatic Life (AW)b n/a n/a n/a n/a n/a n/a n/a n/a 1,310-18,500
f 400,000 800-2,000g 1,500 2,000-3,000
i1,280-4,290
i n/a n/a n/a n/a n/a n/a 0.02 n/a n/a n/a n/a
CSR Irrigation Watering (IW) n/a n/a n/a n/a n/a n/a n/a n/a n/a n/a n/a 100 1,000 n/a n/a n/a n/a n/a n/a n/a n/a n/a n/a n/a n/a
BCWQG Irrigation Water (IW)c 5.0 - 9.0 n/a 5.0 - 9.0 700-5,000
j700-5,000
j n/a n/a n/a n/a n/a n/a 100 2,000 n/a n/a n/a n/a n/a n/a n/a n/a n/a n/a n/a n/a
BCWQG Aquatic Life Long-Term Average (AW)d 6.5 - 9.0 n/a 6.5 - 9.0 n/a n/a n/a n/a n/a 135-1,780
h 3,000 80-200 150 n/a 128-429i n/a n/a n/a n/a n/a n/a n/a n/a n/a n/a n/a
BCWQG Aquatic Life Short-term Maximum (AW)e 6.5 - 9.0 n/a 6.5 - 9.0 n/a n/a n/a n/a n/a 700-24,500
h 32,800 (max) 240-600 600 400 - 1,876 n/a n/a n/a n/a n/a n/a n/a 0.002 n/a n/a n/a n/a
GL6-1 (2011) GL6-1 (2011)-20170530 2017 05 30 7.4 1,260 - - - 7,540 - - 119 < 250 - 941 < 1,000 1,210 4,370 - - - - 8.4 - - < 20 - 2.69
(cont'd) GL6-1(2011)-20121205 2012 12 05 - 1,980 - - - 9,940 - - 245,000 < 10,000a - 828 - 2,080 614 - - - - - - - 1,280 - 4
GL6-1-180604 2018 06 04 7.45 1,900 6.987.0 15,700 14,230 10,800 339 0.224 334,000 < 5,000a 276 1,570 < 50,000a 12,000 3,960 3,960 < 1.0 < 1.0 < 1.0 < 50.0 0.49 1.08 881 0.224 -
GL6-1 (2011)-190603 2019 06 03 7.80 1,270 7.42 11,200 11,903 6,100 175 1.15 227,000 < 1,000 < 1,000a 527 < 10,000a 2,380 3,600 3,600 < 1.0 < 1.0 < 1.0 < 10.0 0.82 8.44 705 1.15 -
DUP3-190603 Duplicate 7.72 1,240 7.42 - 11,903 8,100 180 0.560 236,000 < 1,000 < 1,000a 559 < 10,000a 2,350 3,510 3,510 < 1.0 < 1.0 < 1.0 < 10.0 - - 705 0.560 -
QA/QC RPD% 1 2 * - * 28 3 69 4 * * 6 * 1 3 3 * * * * - - 0 69 -
GL6-1-200611 2020 06 11 7.82 962 7.1 8,440 6,871 5,220 241 - 194,000 < 100 < 100 652 < 1,000 282 3,980 3,980 < 1.0 < 1.0 < 1.0 4.43 10.7 25.5 621 - 0.576
GL7-1 GL7-1-20110704 2011 07 04 - 1,190 - - - 2,560 - - 400 - - 69.3 - 735 1,410 - - - - - - - 30 - 0.006
GL7-1-20120625 2012 06 25 - 1,150 - - - 2,590 - - 360 - - 69.2 - 709 1,540 - - - - - - - 30 - < 0.002
GL7-1-20121205 2012 12 05 - 1,120 - - - 2,500 - - 450 < 1,000 - 72 - 758 1,520 - - - - - - - 32 - 0.002
GL7-1-20130626 2013 06 26 - 1,110 - - - 2,500 - - 442 < 100 - 69 2,490 771 1,440 - - - - < 1.0 - - 34 - -
GL7-1-20131114 2013 11 14 - 1,140 - - - 2,530 - - 446 < 100 - 75 2,390 757 1,540 - - - - < 1.0 - - 27 - -
DUP1-20131114 Duplicate - 1,130 - - - 2,500 - - 444 < 100 - 73 2,500 776 1,610 - - - - < 1.0 - - 20 - -
QA/QC RPD% - 1 - - - 1 - - 0 * - 3 4 2 4 - - - - * - - * - -
GL7-1-20140604 2014 06 04 - 1,190 - - - 2,560 - - 435 < 100 - 57 2,420 671 1,780 - - - - < 1.0 - - 24 - < 0.0010
GL7-1-20141125 2014 11 25 - 1,110 - - - 2,480 - - 411 < 100 - 71 2,300 759 1,230 - - - - < 1.0 - - 30 - < 0.0010
GL7-1-20150609 2015 06 09 7.32 1,090 - - - 2,430 - - 408 < 25 - 58.4 1,770 669 1,800 - - - - 0.54 - - 28 - 0.0014
GL7-1-20151109 2015 11 09 6.61 1,080 - - - 2,470 - - 412 < 100 - 61 2,180 704 1,430 - - - - < 1.0 - - 29 - < 0.0010
GL8-1 GL 8-1-20091110 2009 11 10 - 60 - - - - - - - - - - - - - - - - - - - - - - -
GL8-1-20100810 2010 08 10 - 630 - - - 2,710 - - 430 - - 55.9 - 1,230 550 - - - - - - - < 10 - 0.037
GL8-2 GL 8-2-20091110 2009 11 10 - 1,190 - - - - - - - - - - - - - - - - - - - - - - -
GL8-2-20100810 2010 08 10 - 928 - - - 8,530 - - 20 - - 528 - 2,830 2,800 - - - - - - - 120 - 0.298
GL8-2-20110627 2011 06 27 - 1,040 - - - 7,520 - - 220 - - 512 - 2,760 2,520 - - - - - - - 100 - 0.158
GL8-2-20111217 2011 12 17 - 652 - - - 7,360 - - 60 < 100 - 511 - 2,940 2,470 - - - - - - - 120 - 0.35
GL 8-2-20120626 2012 06 26 - 800 - - - 5,610 - - 130 - - 390 - 1,970 2,080 - - - - - - - 120 - -
DUP B-20120626 Duplicate - 800 - - - 7,250 - - 140 - - 467 - 2,550 2,510 - - - - - - - 90 - -
QA/QC RPD% - 0 - - - 26 - - 7 - - 18 - 26 19 - - - - - - - 29 - -GL 8-2-20120704 2012 07 04 - - - - - - - - - - - - - - - - - - - - - - - - 0.05
GL8-2-20121204 2012 12 04 - 581 - - - 7,350 - - 90 220 - 478 - 2,830 2,600 - - - - - - - 113 - 0.324
GL8-2-20130626 2013 06 26 - 1,180 - - - 7,140 - - 64.4 350 - 459 3,200 3,260 1,930 - - - - 3.6 - - 487 - -
GL8-2-20131113 2013 11 13 - 800 - - - 7,050 - - 25.8 < 250 - 460 3,600 2,870 2,210 - - - - - - - 76 - -
DUP2-20131113 Duplicate - 808 - - - 7,070 - - 22.6 < 250 - 459 3,600 2,870 2,130 - - - - - - - 80 - -
QA/QC RPD% - 1 - - - 0 - - * * - 0 0 0 4 - - - - - - - 5 - -
GL8-2-20140605 2014 06 05 - 768 - - - 6,600 - - 14 6,340 - 390 3,000 3,000 1,850 - - - - 3.4 - - 68 - 0.0704
GL8-2-20141118 2014 11 18 - 626 - - - 5,580 - - 15.6 2,770 - 389 3,700 2,840 2,040 - - - - 2.5 - - 78 - 0.166
Associated CARO files available upon request.
Associated Exova file(s): 712940, 714233, 714243, 756693, 756810, 757047, 811364, 811710, 812030, 812741, 812985, 813438, 846260, 878316, 879073, 909346, 909448, 909654.
All terms defined within the body of SNC-Lavalin's report.
< Denotes concentration less than indicated detection limit or RPD less than indicated value.a Laboratory detection limit exceeds regulatory standard/guideline.
- Denotes analysis not conducted.b Standard to protect freshwater aquatic life.
n/a Denotes no applicable standard/guideline.c Guideline to protect irrigation water. Guideline for surface water, shown here for comparison purposes only.
QA/QC RPD Denotes quality assurance/quality control relative percent differenced Guideline to protect freshwater aquatic life, long-term average (i.e. "chronic"). Guideline for surface water, shown here for comparison purposes only.
* RPDs are not calculated where one or more concentrations are less than five times RDL.e Guideline to protect freshwater aquatic life, short-term maximum (i.e. "acute"). Guideline for surface water, shown here for comparison purposes only.
RDL Denotes reported detection limit.f Standard varies with pH.g Standard varies with Chloride.
BOLD Concentration greater than CSR Aquatic Life (AW) standardh guideline varies with pH and temperature.
SHADED Concentration greater than CSR Irrigation Watering (IW) standardi guideline varies with hardness
RED Concentration greater than BCWQG Irrigation Water (IW) guidelinej Conductivity guidelines varies with crop. Guideline range 700-5,000, most stringent guideline for low tolerance crops applied (strawberry, raspberry, bean and carrot.
BLUE SHADED Concentration greater than BCWQG Aquatic Life Long-Term Average (AW) guideline
BLUE SHADED Concentration greater than BCWQG Aquatic Life Short-term Maximum (AW) guideline
SNC-LAVALIN INC. Page 6 of 20
662036 / 2021 02 0920210309_662036_TAB_Historical.xlsx
QAQC CN 2021 03 09
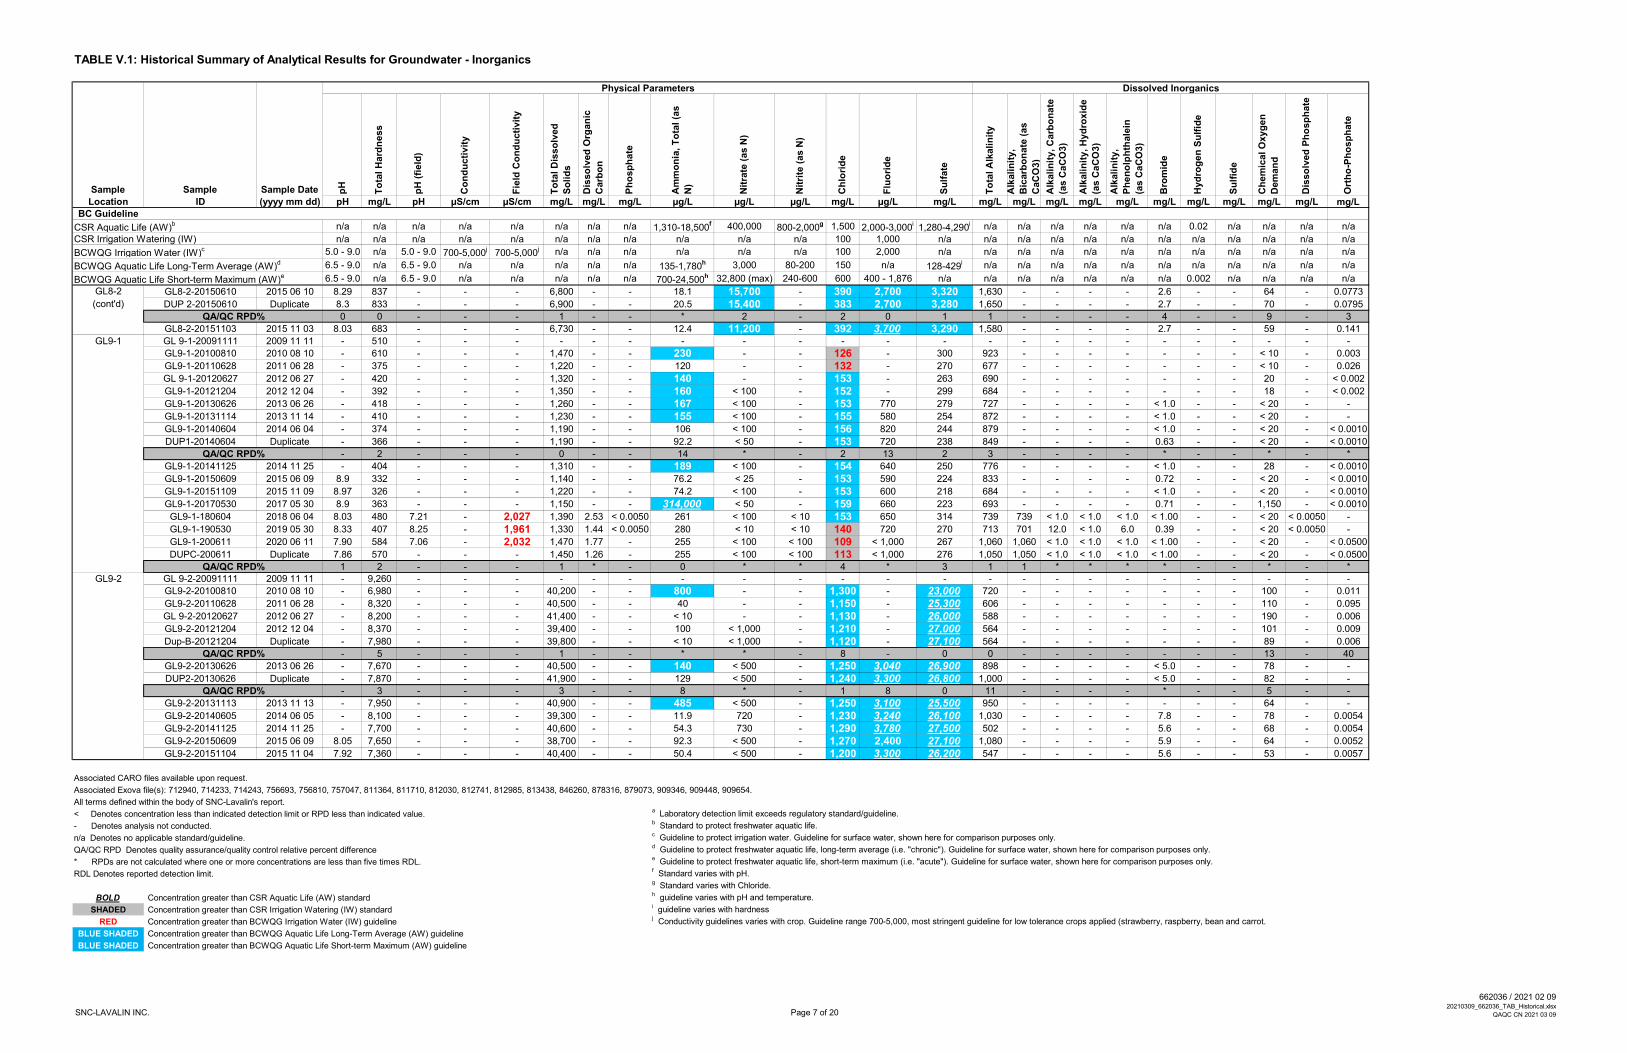
TABLE V.1: Historical Summary of Analytical Results for Groundwater - Inorganics
Physical Parameters Dissolved Inorganics
Sample Sample Sample Date pH
To
tal H
ard
ness
pH
(fi
eld
)
Co
nd
ucti
vit
y
Fie
ld C
on
du
cti
vit
y
To
tal D
isso
lved
So
lid
s
Dis
so
lved
Org
an
ic
Carb
on
Ph
osp
hate
Am
mo
nia
, T
ota
l (a
s
N)
Nit
rate
(as N
)
Nit
rite
(as N
)
Ch
lori
de
Flu
ori
de
Su
lfate
To
tal A
lkali
nit
y
Alk
ali
nit
y,
Bic
arb
on
ate
(as
CaC
O3)
Alk
ali
nit
y, C
arb
on
ate
(as C
aC
O3)
Alk
ali
nit
y, H
yd
roxid
e
(as C
aC
O3)
Alk
ali
nit
y,
Ph
en
olp
hth
ale
in
(as C
aC
O3)
Bro
mid
e
Hyd
rog
en
Su
lfid
e
Su
lfid
e
Ch
em
ical O
xyg
en
Dem
an
d
Dis
so
lved
Ph
osp
hate
Ort
ho
-Ph
osp
hate
Location ID (yyyy mm dd) pH mg/L pH µS/cm µS/cm mg/L mg/L mg/L µg/L µg/L µg/L mg/L µg/L mg/L mg/L mg/L mg/L mg/L mg/L mg/L mg/L mg/L mg/L mg/L mg/LBC Guideline
CSR Aquatic Life (AW)b n/a n/a n/a n/a n/a n/a n/a n/a 1,310-18,500
f 400,000 800-2,000g 1,500 2,000-3,000
i1,280-4,290
i n/a n/a n/a n/a n/a n/a 0.02 n/a n/a n/a n/a
CSR Irrigation Watering (IW) n/a n/a n/a n/a n/a n/a n/a n/a n/a n/a n/a 100 1,000 n/a n/a n/a n/a n/a n/a n/a n/a n/a n/a n/a n/a
BCWQG Irrigation Water (IW)c 5.0 - 9.0 n/a 5.0 - 9.0 700-5,000
j700-5,000
j n/a n/a n/a n/a n/a n/a 100 2,000 n/a n/a n/a n/a n/a n/a n/a n/a n/a n/a n/a n/a
BCWQG Aquatic Life Long-Term Average (AW)d 6.5 - 9.0 n/a 6.5 - 9.0 n/a n/a n/a n/a n/a 135-1,780
h 3,000 80-200 150 n/a 128-429i n/a n/a n/a n/a n/a n/a n/a n/a n/a n/a n/a
BCWQG Aquatic Life Short-term Maximum (AW)e 6.5 - 9.0 n/a 6.5 - 9.0 n/a n/a n/a n/a n/a 700-24,500
h 32,800 (max) 240-600 600 400 - 1,876 n/a n/a n/a n/a n/a n/a n/a 0.002 n/a n/a n/a n/a
GL8-2 GL8-2-20150610 2015 06 10 8.29 837 - - - 6,800 - - 18.1 15,700 - 390 2,700 3,320 1,630 - - - - 2.6 - - 64 - 0.0773
(cont'd) DUP 2-20150610 Duplicate 8.3 833 - - - 6,900 - - 20.5 15,400 - 383 2,700 3,280 1,650 - - - - 2.7 - - 70 - 0.0795
QA/QC RPD% 0 0 - - - 1 - - * 2 - 2 0 1 1 - - - - 4 - - 9 - 3
GL8-2-20151103 2015 11 03 8.03 683 - - - 6,730 - - 12.4 11,200 - 392 3,700 3,290 1,580 - - - - 2.7 - - 59 - 0.141
GL9-1 GL 9-1-20091111 2009 11 11 - 510 - - - - - - - - - - - - - - - - - - - - - - -
GL9-1-20100810 2010 08 10 - 610 - - - 1,470 - - 230 - - 126 - 300 923 - - - - - - - < 10 - 0.003
GL9-1-20110628 2011 06 28 - 375 - - - 1,220 - - 120 - - 132 - 270 677 - - - - - - - < 10 - 0.026
GL 9-1-20120627 2012 06 27 - 420 - - - 1,320 - - 140 - - 153 - 263 690 - - - - - - - 20 - < 0.002
GL9-1-20121204 2012 12 04 - 392 - - - 1,350 - - 160 < 100 - 152 - 299 684 - - - - - - - 18 - < 0.002
GL9-1-20130626 2013 06 26 - 418 - - - 1,260 - - 167 < 100 - 153 770 279 727 - - - - < 1.0 - - < 20 - -
GL9-1-20131114 2013 11 14 - 410 - - - 1,230 - - 155 < 100 - 155 580 254 872 - - - - < 1.0 - - < 20 - -
GL9-1-20140604 2014 06 04 - 374 - - - 1,190 - - 106 < 100 - 156 820 244 879 - - - - < 1.0 - - < 20 - < 0.0010
DUP1-20140604 Duplicate - 366 - - - 1,190 - - 92.2 < 50 - 153 720 238 849 - - - - 0.63 - - < 20 - < 0.0010
QA/QC RPD% - 2 - - - 0 - - 14 * - 2 13 2 3 - - - - * - - * - *
GL9-1-20141125 2014 11 25 - 404 - - - 1,310 - - 189 < 100 - 154 640 250 776 - - - - < 1.0 - - 28 - < 0.0010
GL9-1-20150609 2015 06 09 8.9 332 - - - 1,140 - - 76.2 < 25 - 153 590 224 833 - - - - 0.72 - - < 20 - < 0.0010
GL9-1-20151109 2015 11 09 8.97 326 - - - 1,220 - - 74.2 < 100 - 153 600 218 684 - - - - < 1.0 - - < 20 - < 0.0010
GL9-1-20170530 2017 05 30 8.9 363 - - - 1,150 - - 314,000 < 50 - 159 660 223 693 - - - - 0.71 - - 1,150 - < 0.0010
GL9-1-180604 2018 06 04 8.03 480 7.21 - 2,027 1,390 2.53 < 0.0050 261 < 100 < 10 153 650 314 739 739 < 1.0 < 1.0 < 1.0 < 1.00 - - < 20 < 0.0050 -
GL9-1-190530 2019 05 30 8.33 407 8.25 - 1,961 1,330 1.44 < 0.0050 280 < 10 < 10 140 720 270 713 701 12.0 < 1.0 6.0 0.39 - - < 20 < 0.0050 -
GL9-1-200611 2020 06 11 7.90 584 7.06 - 2,032 1,470 1.77 - 255 < 100 < 100 109 < 1,000 267 1,060 1,060 < 1.0 < 1.0 < 1.0 < 1.00 - - < 20 - < 0.0500
DUPC-200611 Duplicate 7.86 570 - - - 1,450 1.26 - 255 < 100 < 100 113 < 1,000 276 1,050 1,050 < 1.0 < 1.0 < 1.0 < 1.00 - - < 20 - < 0.0500
QA/QC RPD% 1 2 - - - 1 * - 0 * * 4 * 3 1 1 * * * * - - * - *GL9-2 GL 9-2-20091111 2009 11 11 - 9,260 - - - - - - - - - - - - - - - - - - - - - - -
GL9-2-20100810 2010 08 10 - 6,980 - - - 40,200 - - 800 - - 1,300 - 23,000 720 - - - - - - - 100 - 0.011
GL9-2-20110628 2011 06 28 - 8,320 - - - 40,500 - - 40 - - 1,150 - 25,300 606 - - - - - - - 110 - 0.095
GL 9-2-20120627 2012 06 27 - 8,200 - - - 41,400 - - < 10 - - 1,130 - 26,000 588 - - - - - - - 190 - 0.006
GL9-2-20121204 2012 12 04 - 8,370 - - - 39,400 - - 100 < 1,000 - 1,210 - 27,000 564 - - - - - - - 101 - 0.009
Dup-B-20121204 Duplicate - 7,980 - - - 39,800 - - < 10 < 1,000 - 1,120 - 27,100 564 - - - - - - - 89 - 0.006
QA/QC RPD% - 5 - - - 1 - - * * - 8 - 0 0 - - - - - - - 13 - 40
GL9-2-20130626 2013 06 26 - 7,670 - - - 40,500 - - 140 < 500 - 1,250 3,040 26,900 898 - - - - < 5.0 - - 78 - -
DUP2-20130626 Duplicate - 7,870 - - - 41,900 - - 129 < 500 - 1,240 3,300 26,800 1,000 - - - - < 5.0 - - 82 - -
QA/QC RPD% - 3 - - - 3 - - 8 * - 1 8 0 11 - - - - * - - 5 - -
GL9-2-20131113 2013 11 13 - 7,950 - - - 40,900 - - 485 < 500 - 1,250 3,100 25,500 950 - - - - - - - 64 - -
GL9-2-20140605 2014 06 05 - 8,100 - - - 39,300 - - 11.9 720 - 1,230 3,240 26,100 1,030 - - - - 7.8 - - 78 - 0.0054
GL9-2-20141125 2014 11 25 - 7,700 - - - 40,600 - - 54.3 730 - 1,290 3,780 27,500 502 - - - - 5.6 - - 68 - 0.0054
GL9-2-20150609 2015 06 09 8.05 7,650 - - - 38,700 - - 92.3 < 500 - 1,270 2,400 27,100 1,080 - - - - 5.9 - - 64 - 0.0052
GL9-2-20151104 2015 11 04 7.92 7,360 - - - 40,400 - - 50.4 < 500 - 1,200 3,300 26,200 547 - - - - 5.6 - - 53 - 0.0057
Associated CARO files available upon request.
Associated Exova file(s): 712940, 714233, 714243, 756693, 756810, 757047, 811364, 811710, 812030, 812741, 812985, 813438, 846260, 878316, 879073, 909346, 909448, 909654.
All terms defined within the body of SNC-Lavalin's report.
< Denotes concentration less than indicated detection limit or RPD less than indicated value.a Laboratory detection limit exceeds regulatory standard/guideline.
- Denotes analysis not conducted.b Standard to protect freshwater aquatic life.
n/a Denotes no applicable standard/guideline.c Guideline to protect irrigation water. Guideline for surface water, shown here for comparison purposes only.
QA/QC RPD Denotes quality assurance/quality control relative percent differenced Guideline to protect freshwater aquatic life, long-term average (i.e. "chronic"). Guideline for surface water, shown here for comparison purposes only.
* RPDs are not calculated where one or more concentrations are less than five times RDL.e Guideline to protect freshwater aquatic life, short-term maximum (i.e. "acute"). Guideline for surface water, shown here for comparison purposes only.
RDL Denotes reported detection limit.f Standard varies with pH.g Standard varies with Chloride.
BOLD Concentration greater than CSR Aquatic Life (AW) standardh guideline varies with pH and temperature.
SHADED Concentration greater than CSR Irrigation Watering (IW) standardi guideline varies with hardness
RED Concentration greater than BCWQG Irrigation Water (IW) guidelinej Conductivity guidelines varies with crop. Guideline range 700-5,000, most stringent guideline for low tolerance crops applied (strawberry, raspberry, bean and carrot.
BLUE SHADED Concentration greater than BCWQG Aquatic Life Long-Term Average (AW) guideline
BLUE SHADED Concentration greater than BCWQG Aquatic Life Short-term Maximum (AW) guideline
SNC-LAVALIN INC. Page 7 of 20
662036 / 2021 02 0920210309_662036_TAB_Historical.xlsx
QAQC CN 2021 03 09

TABLE V.1: Historical Summary of Analytical Results for Groundwater - Inorganics
Physical Parameters Dissolved Inorganics
Sample Sample Sample Date pH
To
tal H
ard
ness
pH
(fi
eld
)
Co
nd
ucti
vit
y
Fie
ld C
on
du
cti
vit
y
To
tal D
isso
lved
So
lid
s
Dis
so
lved
Org
an
ic
Carb
on
Ph
osp
hate
Am
mo
nia
, T
ota
l (a
s
N)
Nit
rate
(as N
)
Nit
rite
(as N
)
Ch
lori
de
Flu
ori
de
Su
lfate
To
tal A
lkali
nit
y
Alk
ali
nit
y,
Bic
arb
on
ate
(as
CaC
O3)
Alk
ali
nit
y, C
arb
on
ate
(as C
aC
O3)
Alk
ali
nit
y, H
yd
roxid
e
(as C
aC
O3)
Alk
ali
nit
y,
Ph
en
olp
hth
ale
in
(as C
aC
O3)
Bro
mid
e
Hyd
rog
en
Su
lfid
e
Su
lfid
e
Ch
em
ical O
xyg
en
Dem
an
d
Dis
so
lved
Ph
osp
hate
Ort
ho
-Ph
osp
hate
Location ID (yyyy mm dd) pH mg/L pH µS/cm µS/cm mg/L mg/L mg/L µg/L µg/L µg/L mg/L µg/L mg/L mg/L mg/L mg/L mg/L mg/L mg/L mg/L mg/L mg/L mg/L mg/LBC Guideline
CSR Aquatic Life (AW)b n/a n/a n/a n/a n/a n/a n/a n/a 1,310-18,500
f 400,000 800-2,000g 1,500 2,000-3,000
i1,280-4,290
i n/a n/a n/a n/a n/a n/a 0.02 n/a n/a n/a n/a
CSR Irrigation Watering (IW) n/a n/a n/a n/a n/a n/a n/a n/a n/a n/a n/a 100 1,000 n/a n/a n/a n/a n/a n/a n/a n/a n/a n/a n/a n/a
BCWQG Irrigation Water (IW)c 5.0 - 9.0 n/a 5.0 - 9.0 700-5,000
j700-5,000
j n/a n/a n/a n/a n/a n/a 100 2,000 n/a n/a n/a n/a n/a n/a n/a n/a n/a n/a n/a n/a
BCWQG Aquatic Life Long-Term Average (AW)d 6.5 - 9.0 n/a 6.5 - 9.0 n/a n/a n/a n/a n/a 135-1,780
h 3,000 80-200 150 n/a 128-429i n/a n/a n/a n/a n/a n/a n/a n/a n/a n/a n/a
BCWQG Aquatic Life Short-term Maximum (AW)e 6.5 - 9.0 n/a 6.5 - 9.0 n/a n/a n/a n/a n/a 700-24,500
h 32,800 (max) 240-600 600 400 - 1,876 n/a n/a n/a n/a n/a n/a n/a 0.002 n/a n/a n/a n/a
GL9-3 GL 9-3-20091111 2009 11 11 - 217 - - - - - - - - - - - - - - - - - - - - - - -
GL9-3-20100810 2010 08 10 - 10,500 - - - 48,500 - - < 10 - - 1,610 - 29,400 944 - - - - - - - 100 - 0.028
GL9-3-20110628 2011 06 28 - 12,300 - - - 49,600 - - 20 - - 1,450 - 31,400 930 - - - - - - - 180 - 0.033
GL9-A-20110628 Duplicate - 11,400 - - - 50,100 - - 30 - - 1,400 - 31,500 932 - - - - - - - 190 - 0.032
QA/QC RPD% - 8 - - - 1 - - * - - 4 - 0 0 - - - - - - - 5 - 3
GL 9-3-20120627 2012 06 27 - 11,000 - - - 51,700 - - 30 - - 1,360 - 31,400 948 - - - - - - - 230 - 0.008
GL9-3-20121204 2012 12 04 - 10,400 - - - 50,200 - - < 10 < 1,000 - 1,500 - 31,800 947 - - - - - - - 156 - < 0.002
GL9-3-20130626 2013 06 26 - 10,400 - - - 51,900 - - 17.1 < 500 - 1,540 2,340 32,600 1,420 - - - - < 5.0 - - 100 - -
GL9-3-20131113 2013 11 13 - 10,500 - - - 49,000 - - 9.6 560 - 1,590 2,420 31,500 1,450 - - - - - - - 281 - -
GL9-3-20140605 2014 06 05 - 10,800 - - - 48,700 - - 7.4 < 500 - 1,530 2,320 31,800 1,580 - - - - 10.5 - - 88 - 0.0051
GL9-3-20141125 2014 11 25 - 10,400 - - - 49,300 - - 10.5 < 500 - 1,600 3,020 32,800 989 - - - - 7.2 - - 105 - 0.0054
DUP4-20141124 Duplicate - 10,400 - - - 49,800 - - 10.7 650 - 1,610 3,030 33,100 1,010 - - - - 8 - - 121 - 0.0074
QA/QC RPD% - 0 - - - 1 - - * * - 1 0 1 2 - - - - 11 - - 14 - 31
GL9-3-20150609 2015 06 09 7.92 10,400 - - - 48,200 - - 16.5 < 500 - 1,590 < 2,000a 33,500 1,530 - - - - 8.5 - - 91 - 0.0042
GL9-3-20151109 2015 11 09 7.69 9,720 - - - 50,200 - - 9.9 < 500 - 1,530 3,200 32,100 926 - - - - 6.2 - - 124 - 0.0043
GL9-3-20160526 2016 05 26 7.78 10,600 - - - 62,800 - - 10.4 < 500 - 1,780 3,500 37,100 915 - - - - 10.8 - - 78 - 0.0049
GL9-3-20170529 2017 05 29 7.9 11,100 - - - 46,400 - - 30.5 < 500 - 1,680 2,700 34,600 834 - - - - 11.2 - - 80 - 0.0065
GL9-3-180528 2018 05 28 7.68 11,300 7.22 - 3,210 53,000 25.1 < 0.0050 69 6,320 < 1,000a 238 4,350 199 862 862 < 1.0 < 1.0 < 1.0 < 10.0 - - 86 < 0.0050 -
GL9-3-190527 2019 05 27 7.73 12,600 7.54 - 44,350 52,300 24.8 < 0.500 73 < 1,000 < 1,000a 1,540 < 10,000a 31,700 859 859 < 1.0 < 1.0 < 1.0 < 10.0 - - 83 < 0.500 -
GL9-3-200608 2020 06 08 7.80 10,200 7.32 - 36,600 52,600 23.6 - < 50 < 5,000a < 5,000a 1,400 < 50,000a 34,500 921 921 < 1.0 < 1.0 < 1.0 < 50.0 - - 79 - < 2.50
GL10-1 GL10-1-20091112 2009 11 12 - 7,010 - - - - - - - - - - - - - - - - - - - - - - -
GL10-1-20100810 2010 08 10 - 6,430 - - - 31,200 - - 170 - - 1,400 - 14,800 3,470 - - - - - - - 480 - 0.059
GL10-1-20110704 2011 07 04 - 8,310 - - - 31,700 - - 140 - - 1,420 - 17,600 3,200 - - - - - - - 210 - 0.035
GL10-1-20120626 2012 06 26 - 8,760 - - - 33,800 - - 140 - - 1,450 - 19,300 2,640 - - - - - - - 230 - 0.006
GL10-1-20121204 2012 12 04 - 8,350 - - - 33,000 - - 210 < 1,000 - 1,270 - 19,400 267 - - - - - - - 228 - 0.004
GL10-1-20130626 2013 06 26 - 7,720 - - - 31,400 - - 142 < 500 - 1,270 1,860 18,800 2,540 - - - - 10.5 - - 166 - -
GL10-1-20140605 2014 06 05 - 6,550 - - - 28,900 - - 81.5 < 500 - 1,130 1,900 17,400 2,560 - - - - 11.1 - - 145 - 0.0044
GL10-1-20141125 2014 11 25 - 6,570 - - - 28,000 - - 129 710 - 1,250 2,250 19,100 2,180 - - - - 9.5 - - 177 - 0.0063
GL10-1-20150610 2015 06 10 7.95 6,240 - - - 26,600 - - 170 < 500 - 1,020 < 2,000a 16,300 2,300 - - - - 8.7 - - 145 - 0.0024
GL10-1-20151109 2015 11 09 7.57 5,980 - - - 25,100 - - 152 < 500 - 963 < 2,000a 15,500 1,950 - - - - 7.4 - - 210 - 0.0019
DUP2-20151109 Duplicate 7.64 5,800 - - - 25,200 - - 173 < 500 - 998 2,200 16,100 1,960 - - - - 7.9 - - 126 - 0.0028
QA/QC RPD% 1 3 - - - 0 - - 13 * - 4 * 4 1 - - - - 7 - - 50 - *
Associated CARO files available upon request.
Associated Exova file(s): 712940, 714233, 714243, 756693, 756810, 757047, 811364, 811710, 812030, 812741, 812985, 813438, 846260, 878316, 879073, 909346, 909448, 909654.
All terms defined within the body of SNC-Lavalin's report.
< Denotes concentration less than indicated detection limit or RPD less than indicated value.a Laboratory detection limit exceeds regulatory standard/guideline.
- Denotes analysis not conducted.b Standard to protect freshwater aquatic life.
n/a Denotes no applicable standard/guideline.c Guideline to protect irrigation water. Guideline for surface water, shown here for comparison purposes only.
QA/QC RPD Denotes quality assurance/quality control relative percent differenced Guideline to protect freshwater aquatic life, long-term average (i.e. "chronic"). Guideline for surface water, shown here for comparison purposes only.
* RPDs are not calculated where one or more concentrations are less than five times RDL.e Guideline to protect freshwater aquatic life, short-term maximum (i.e. "acute"). Guideline for surface water, shown here for comparison purposes only.
RDL Denotes reported detection limit.f Standard varies with pH.g Standard varies with Chloride.
BOLD Concentration greater than CSR Aquatic Life (AW) standardh guideline varies with pH and temperature.
SHADED Concentration greater than CSR Irrigation Watering (IW) standardi guideline varies with hardness
RED Concentration greater than BCWQG Irrigation Water (IW) guidelinej Conductivity guidelines varies with crop. Guideline range 700-5,000, most stringent guideline for low tolerance crops applied (strawberry, raspberry, bean and carrot.
BLUE SHADED Concentration greater than BCWQG Aquatic Life Long-Term Average (AW) guideline
BLUE SHADED Concentration greater than BCWQG Aquatic Life Short-term Maximum (AW) guideline
SNC-LAVALIN INC. Page 8 of 20
662036 / 2021 02 0920210309_662036_TAB_Historical.xlsx
QAQC CN 2021 03 09
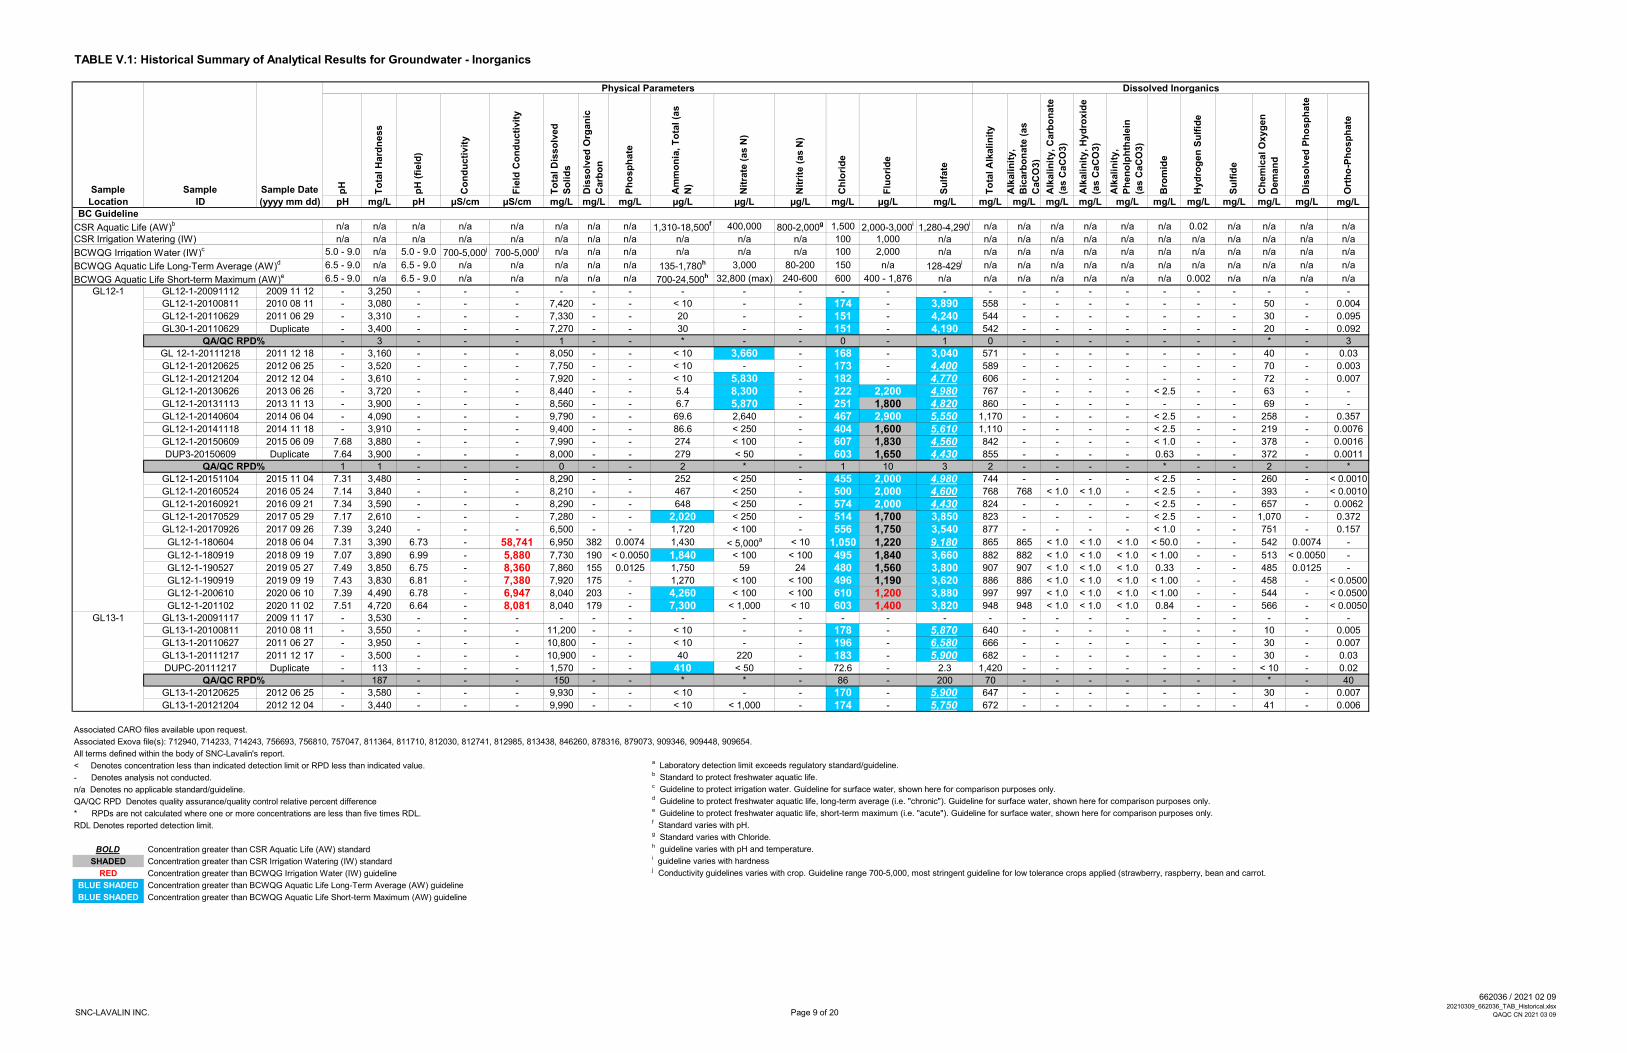
TABLE V.1: Historical Summary of Analytical Results for Groundwater - Inorganics
Physical Parameters Dissolved Inorganics
Sample Sample Sample Date pH
To
tal H
ard
ness
pH
(fi
eld
)
Co
nd
ucti
vit
y
Fie
ld C
on
du
cti
vit
y
To
tal D
isso
lved
So
lid
s
Dis
so
lved
Org
an
ic
Carb
on
Ph
osp
hate
Am
mo
nia
, T
ota
l (a
s
N)
Nit
rate
(as N
)
Nit
rite
(as N
)
Ch
lori
de
Flu
ori
de
Su
lfate
To
tal A
lkali
nit
y
Alk
ali
nit
y,
Bic
arb
on
ate
(as
CaC
O3)
Alk
ali
nit
y, C
arb
on
ate
(as C
aC
O3)
Alk
ali
nit
y, H
yd
roxid
e
(as C
aC
O3)
Alk
ali
nit
y,
Ph
en
olp
hth
ale
in
(as C
aC
O3)
Bro
mid
e
Hyd
rog
en
Su
lfid
e
Su
lfid
e
Ch
em
ical O
xyg
en
Dem
an
d
Dis
so
lved
Ph
osp
hate
Ort
ho
-Ph
osp
hate
Location ID (yyyy mm dd) pH mg/L pH µS/cm µS/cm mg/L mg/L mg/L µg/L µg/L µg/L mg/L µg/L mg/L mg/L mg/L mg/L mg/L mg/L mg/L mg/L mg/L mg/L mg/L mg/LBC Guideline
CSR Aquatic Life (AW)b n/a n/a n/a n/a n/a n/a n/a n/a 1,310-18,500
f 400,000 800-2,000g 1,500 2,000-3,000
i1,280-4,290
i n/a n/a n/a n/a n/a n/a 0.02 n/a n/a n/a n/a
CSR Irrigation Watering (IW) n/a n/a n/a n/a n/a n/a n/a n/a n/a n/a n/a 100 1,000 n/a n/a n/a n/a n/a n/a n/a n/a n/a n/a n/a n/a
BCWQG Irrigation Water (IW)c 5.0 - 9.0 n/a 5.0 - 9.0 700-5,000
j700-5,000
j n/a n/a n/a n/a n/a n/a 100 2,000 n/a n/a n/a n/a n/a n/a n/a n/a n/a n/a n/a n/a
BCWQG Aquatic Life Long-Term Average (AW)d 6.5 - 9.0 n/a 6.5 - 9.0 n/a n/a n/a n/a n/a 135-1,780
h 3,000 80-200 150 n/a 128-429i n/a n/a n/a n/a n/a n/a n/a n/a n/a n/a n/a
BCWQG Aquatic Life Short-term Maximum (AW)e 6.5 - 9.0 n/a 6.5 - 9.0 n/a n/a n/a n/a n/a 700-24,500
h 32,800 (max) 240-600 600 400 - 1,876 n/a n/a n/a n/a n/a n/a n/a 0.002 n/a n/a n/a n/a
GL12-1 GL12-1-20091112 2009 11 12 - 3,250 - - - - - - - - - - - - - - - - - - - - - - -
GL12-1-20100811 2010 08 11 - 3,080 - - - 7,420 - - < 10 - - 174 - 3,890 558 - - - - - - - 50 - 0.004
GL12-1-20110629 2011 06 29 - 3,310 - - - 7,330 - - 20 - - 151 - 4,240 544 - - - - - - - 30 - 0.095
GL30-1-20110629 Duplicate - 3,400 - - - 7,270 - - 30 - - 151 - 4,190 542 - - - - - - - 20 - 0.092
QA/QC RPD% - 3 - - - 1 - - * - - 0 - 1 0 - - - - - - - * - 3
GL 12-1-20111218 2011 12 18 - 3,160 - - - 8,050 - - < 10 3,660 - 168 - 3,040 571 - - - - - - - 40 - 0.03
GL12-1-20120625 2012 06 25 - 3,520 - - - 7,750 - - < 10 - - 173 - 4,400 589 - - - - - - - 70 - 0.003
GL12-1-20121204 2012 12 04 - 3,610 - - - 7,920 - - < 10 5,830 - 182 - 4,770 606 - - - - - - - 72 - 0.007
GL12-1-20130626 2013 06 26 - 3,720 - - - 8,440 - - 5.4 8,300 - 222 2,200 4,980 767 - - - - < 2.5 - - 63 - -
GL12-1-20131113 2013 11 13 - 3,900 - - - 8,560 - - 6.7 5,870 - 251 1,800 4,820 860 - - - - - - - 69 - -
GL12-1-20140604 2014 06 04 - 4,090 - - - 9,790 - - 69.6 2,640 - 467 2,900 5,550 1,170 - - - - < 2.5 - - 258 - 0.357
GL12-1-20141118 2014 11 18 - 3,910 - - - 9,400 - - 86.6 < 250 - 404 1,600 5,610 1,110 - - - - < 2.5 - - 219 - 0.0076
GL12-1-20150609 2015 06 09 7.68 3,880 - - - 7,990 - - 274 < 100 - 607 1,830 4,560 842 - - - - < 1.0 - - 378 - 0.0016
DUP3-20150609 Duplicate 7.64 3,900 - - - 8,000 - - 279 < 50 - 603 1,650 4,430 855 - - - - 0.63 - - 372 - 0.0011
QA/QC RPD% 1 1 - - - 0 - - 2 * - 1 10 3 2 - - - - * - - 2 - *
GL12-1-20151104 2015 11 04 7.31 3,480 - - - 8,290 - - 252 < 250 - 455 2,000 4,980 744 - - - - < 2.5 - - 260 - < 0.0010
GL12-1-20160524 2016 05 24 7.14 3,840 - - - 8,210 - - 467 < 250 - 500 2,000 4,600 768 768 < 1.0 < 1.0 - < 2.5 - - 393 - < 0.0010
GL12-1-20160921 2016 09 21 7.34 3,590 - - - 8,290 - - 648 < 250 - 574 2,000 4,430 824 - - - - < 2.5 - - 657 - 0.0062
GL12-1-20170529 2017 05 29 7.17 2,610 - - - 7,280 - - 2,020 < 250 - 514 1,700 3,850 823 - - - - < 2.5 - - 1,070 - 0.372
GL12-1-20170926 2017 09 26 7.39 3,240 - - - 6,500 - - 1,720 < 100 - 556 1,750 3,540 877 - - - - < 1.0 - - 751 - 0.157
GL12-1-180604 2018 06 04 7.31 3,390 6.73 - 58,741 6,950 382 0.0074 1,430 < 5,000a < 10 1,050 1,220 9,180 865 865 < 1.0 < 1.0 < 1.0 < 50.0 - - 542 0.0074 -
GL12-1-180919 2018 09 19 7.07 3,890 6.99 - 5,880 7,730 190 < 0.0050 1,840 < 100 < 100 495 1,840 3,660 882 882 < 1.0 < 1.0 < 1.0 < 1.00 - - 513 < 0.0050 -
GL12-1-190527 2019 05 27 7.49 3,850 6.75 - 8,360 7,860 155 0.0125 1,750 59 24 480 1,560 3,800 907 907 < 1.0 < 1.0 < 1.0 0.33 - - 485 0.0125 -
GL12-1-190919 2019 09 19 7.43 3,830 6.81 - 7,380 7,920 175 - 1,270 < 100 < 100 496 1,190 3,620 886 886 < 1.0 < 1.0 < 1.0 < 1.00 - - 458 - < 0.0500
GL12-1-200610 2020 06 10 7.39 4,490 6.78 - 6,947 8,040 203 - 4,260 < 100 < 100 610 1,200 3,880 997 997 < 1.0 < 1.0 < 1.0 < 1.00 - - 544 - < 0.0500
GL12-1-201102 2020 11 02 7.51 4,720 6.64 - 8,081 8,040 179 - 7,300 < 1,000 < 10 603 1,400 3,820 948 948 < 1.0 < 1.0 < 1.0 0.84 - - 566 - < 0.0050
GL13-1 GL13-1-20091117 2009 11 17 - 3,530 - - - - - - - - - - - - - - - - - - - - - - -
GL13-1-20100811 2010 08 11 - 3,550 - - - 11,200 - - < 10 - - 178 - 5,870 640 - - - - - - - 10 - 0.005
GL13-1-20110627 2011 06 27 - 3,950 - - - 10,800 - - < 10 - - 196 - 6,580 666 - - - - - - - 30 - 0.007
GL13-1-20111217 2011 12 17 - 3,500 - - - 10,900 - - 40 220 - 183 - 5,900 682 - - - - - - - 30 - 0.03
DUPC-20111217 Duplicate - 113 - - - 1,570 - - 410 < 50 - 72.6 - 2.3 1,420 - - - - - - - < 10 - 0.02
QA/QC RPD% - 187 - - - 150 - - * * - 86 - 200 70 - - - - - - - * - 40
GL13-1-20120625 2012 06 25 - 3,580 - - - 9,930 - - < 10 - - 170 - 5,900 647 - - - - - - - 30 - 0.007
GL13-1-20121204 2012 12 04 - 3,440 - - - 9,990 - - < 10 < 1,000 - 174 - 5,750 672 - - - - - - - 41 - 0.006
Associated CARO files available upon request.
Associated Exova file(s): 712940, 714233, 714243, 756693, 756810, 757047, 811364, 811710, 812030, 812741, 812985, 813438, 846260, 878316, 879073, 909346, 909448, 909654.
All terms defined within the body of SNC-Lavalin's report.
< Denotes concentration less than indicated detection limit or RPD less than indicated value.a Laboratory detection limit exceeds regulatory standard/guideline.
- Denotes analysis not conducted.b Standard to protect freshwater aquatic life.
n/a Denotes no applicable standard/guideline.c Guideline to protect irrigation water. Guideline for surface water, shown here for comparison purposes only.
QA/QC RPD Denotes quality assurance/quality control relative percent differenced Guideline to protect freshwater aquatic life, long-term average (i.e. "chronic"). Guideline for surface water, shown here for comparison purposes only.
* RPDs are not calculated where one or more concentrations are less than five times RDL.e Guideline to protect freshwater aquatic life, short-term maximum (i.e. "acute"). Guideline for surface water, shown here for comparison purposes only.
RDL Denotes reported detection limit.f Standard varies with pH.g Standard varies with Chloride.
BOLD Concentration greater than CSR Aquatic Life (AW) standardh guideline varies with pH and temperature.
SHADED Concentration greater than CSR Irrigation Watering (IW) standardi guideline varies with hardness
RED Concentration greater than BCWQG Irrigation Water (IW) guidelinej Conductivity guidelines varies with crop. Guideline range 700-5,000, most stringent guideline for low tolerance crops applied (strawberry, raspberry, bean and carrot.
BLUE SHADED Concentration greater than BCWQG Aquatic Life Long-Term Average (AW) guideline
BLUE SHADED Concentration greater than BCWQG Aquatic Life Short-term Maximum (AW) guideline
SNC-LAVALIN INC. Page 9 of 20
662036 / 2021 02 0920210309_662036_TAB_Historical.xlsx
QAQC CN 2021 03 09

TABLE V.1: Historical Summary of Analytical Results for Groundwater - Inorganics
Physical Parameters Dissolved Inorganics
Sample Sample Sample Date pH
To
tal H
ard
ness
pH
(fi
eld
)
Co
nd
ucti
vit
y
Fie
ld C
on
du
cti
vit
y
To
tal D
isso
lved
So
lid
s
Dis
so
lved
Org
an
ic
Carb
on
Ph
osp
hate
Am
mo
nia
, T
ota
l (a
s
N)
Nit
rate
(as N
)
Nit
rite
(as N
)
Ch
lori
de
Flu
ori
de
Su
lfate
To
tal A
lkali
nit
y
Alk
ali
nit
y,
Bic
arb
on
ate
(as
CaC
O3)
Alk
ali
nit
y, C
arb
on
ate
(as C
aC
O3)
Alk
ali
nit
y, H
yd
roxid
e
(as C
aC
O3)
Alk
ali
nit
y,
Ph
en
olp
hth
ale
in
(as C
aC
O3)
Bro
mid
e
Hyd
rog
en
Su
lfid
e
Su
lfid
e
Ch
em
ical O
xyg
en
Dem
an
d
Dis
so
lved
Ph
osp
hate
Ort
ho
-Ph
osp
hate
Location ID (yyyy mm dd) pH mg/L pH µS/cm µS/cm mg/L mg/L mg/L µg/L µg/L µg/L mg/L µg/L mg/L mg/L mg/L mg/L mg/L mg/L mg/L mg/L mg/L mg/L mg/L mg/LBC Guideline
CSR Aquatic Life (AW)b n/a n/a n/a n/a n/a n/a n/a n/a 1,310-18,500
f 400,000 800-2,000g 1,500 2,000-3,000
i1,280-4,290
i n/a n/a n/a n/a n/a n/a 0.02 n/a n/a n/a n/a
CSR Irrigation Watering (IW) n/a n/a n/a n/a n/a n/a n/a n/a n/a n/a n/a 100 1,000 n/a n/a n/a n/a n/a n/a n/a n/a n/a n/a n/a n/a
BCWQG Irrigation Water (IW)c 5.0 - 9.0 n/a 5.0 - 9.0 700-5,000
j700-5,000
j n/a n/a n/a n/a n/a n/a 100 2,000 n/a n/a n/a n/a n/a n/a n/a n/a n/a n/a n/a n/a
BCWQG Aquatic Life Long-Term Average (AW)d 6.5 - 9.0 n/a 6.5 - 9.0 n/a n/a n/a n/a n/a 135-1,780
h 3,000 80-200 150 n/a 128-429i n/a n/a n/a n/a n/a n/a n/a n/a n/a n/a n/a
BCWQG Aquatic Life Short-term Maximum (AW)e 6.5 - 9.0 n/a 6.5 - 9.0 n/a n/a n/a n/a n/a 700-24,500
h 32,800 (max) 240-600 600 400 - 1,876 n/a n/a n/a n/a n/a n/a n/a 0.002 n/a n/a n/a n/a
GL14-1 GL14-1-20091116 2009 11 16 - 40 - - - - - - - - - - - - - - - - - - - - - - -GL14-1-20100811 2010 08 11 - 40 - - - 1,120 - - 40 - - 7 - 141 783 - - - - - - - < 10 - 0.051GL14-1-20110704 2011 07 04 - 48 - - - 1,100 - - 60 - - 8.6 - 132 809 - - - - - - - 30 - 0.11GL14-1-20120627 2012 06 27 - 40 - - - - - - 50 - - - - - - - - - - - - - 40 - -
GL14-1-20120704 2012 07 04 - - - - - 1,120 - - - - - 0.11 - 141 799 - - - - - - - - - 0.125
GL14-1-20121204 2012 12 04 - 35 - - - 1,190 - - 70 < 100 - 8.66 - 145 790 - - - - - - - 26 - 0.137GL15-1 GL15-1-20091117 2009 11 17 - 702 - - - - - - - - - - - - - - - - - - - - - - -
GL30-3-20091117 Duplicate - 662 - - - - - - - - - - - - - - - - - - - - - - -QA/QC RPD% - 6 - - - - - - - - - - - - - - - - - - - - - - -
GL15-1-20140604 2014 06 04 - 335 - - - 782 - - 15.2 233 - 6.7 2,190 261 446 - - - - < 0.50 - - < 20 - 0.076
GL15-1-20141117 2014 11 17 - 340 - - - 793 - - 38.3 72 - 10 1,950 280 479 - - - - < 0.50 - - < 20 - 0.0409
GL15-1-20150610 2015 06 10 8.32 339 - - - 959 - - 32.2 < 25 - 4.9 1,310 175 468 - - - - < 0.25 - - < 20 - 0.0308
DUP4-20150610 Duplicate 8.3 326 - - - 804 - - 32 < 25 - 7.2 1,960 269 469 - - - - < 0.25 - - < 20 - 0.0283
QA/QC RPD% 0 4 - - - 18 - - 1 * - 38 40 42 0 - - - - * - - * - 8
GL15-1-20151103 2015 11 03 8.12 336 - - - 814 - - 47.7 < 25 - 8.5 1,900 269 457 - - - - < 0.25 - - < 20 - 0.155
GL15-1-20160920 2016 09 20 8.01 385 - - - 874 - - 17.8 89 - 12.3 1,760 295 446 - - - - < 0.25 - - < 20 - 0.0562
GL15-1-20170925 2017 09 25 8.1 326 - - - 767 - - 12.5 98 - 8.1 2,090 264 428 - - - - < 0.25 - - < 20 - 0.0338
GL15-1-180928 2018 09 28 7.87 333 7.47 - 1,320 819 1.75 < 0.0050 78 23 < 10 8.32 1,810 280 441 441 < 1.0 < 1.0 < 1.0 < 0.10 - - 21 < 0.0050 -
GL15-1-190924 2019 09 24 8.09 327 7.35 - 1,259 826 1.68 - 240 < 10 < 10 7.96 1,970 263 442 442 < 1.0 < 1.0 < 1.0 < 0.10 - - < 20 - < 0.0050
GL15-1-201104 2020 11 04 7.80 1,530 7.18 - 3,904 3,210 10.8 - 51 2,440 < 10 241 860 1,200 644 644 < 1.0 < 1.0 < 1.0 < 1.00 - - 32 - < 0.0050
GL15-2 GL15-2-20110704 2011 07 04 - 2,090 - - - 3,760 - - < 10 - - 52.4 - 1,900 650 - - - - - - - 20 - 0.024
GL15-2-20120627 2012 06 27 - 3,300 - - - 6,180 - - 40 - - 121 - 3,230 644 - - - - - - - 30 - 0.017
GL15-2-20121205 2012 12 05 - 3,580 - - - 6,750 - - < 10 < 10,000a - 155 - 4,020 686 - - - - - - - 63 - 0.018
GL15-2-20130708 2013 07 08 - 3,920 - - - 7,970 - - < 5.0 8,850 - 143 < 1,000 4,190 822 - - - - < 2.5 - - 30 - -
GL15-2-20140604 2014 06 04 - 3,290 - - - 7,380 - - < 5.0 7,610 - 159 2,100 4,000 1,030 - - - - < 2.5 - - 36 - 0.0188
GL15-2-20141117 2014 11 17 - 3,250 - - - 6,750 - - < 5.0 8,200 - 185 < 1,000 4,040 972 - - - - < 2.5 - - 39 - 0.0193
GL15-2-20150610 2015 06 10 7.84 3,700 - - - 7,960 - - < 5.0 7,690 - 197 1,000 4,800 900 - - - - < 2.5 - - 38 - 0.017
GL15-2-20151103 2015 11 03 7.5 3,910 - - - 7,970 - - < 5.0 7,470 - 182 1,100 4,800 807 - - - - < 2.5 - - 32 - 0.0186
GL15-2-20160920 2016 09 20 7.4 5,010 - - - 10,400 - - < 5.0 3,700 - 259 1,400 6,740 807 - - - - < 2.5 - - 45 - 0.0166
GL15-2-20170925 2017 09 25 7.59 4,190 - - - 8,470 - - 7.6 3,120 - 181 1,300 4,560 794 - - - - < 2.5 - - 41 - 0.0179
GL15-2-180928 2018 09 28 7.41 3,300 6.88 - 7,089 6,990 15.4 < 0.0050 73 2,590 < 10 214 1,030 3,730 765 765 < 1.0 < 1.0 < 1.0 < 1.00 - - 38 < 0.0050 -
GL15-2-190924 2019 09 24 7.70 3,470 6.77 - 7,047 7,220 12.2 - < 20 3,550 < 100 246 < 1,000 4,060 748 748 < 1.0 < 1.0 < 1.0 < 1.00 - - 26 - < 0.0500
GL15-2-201104 2020 11 04 7.69 6,230 6.94 - 10,680 11,900 19.0 - < 50 1,690 < 10 360 1,020 7,190 794 794 < 1.0 < 1.0 < 1.0 < 10.0 - - 33 - < 0.0050
DUP2-201104 Duplicate 7.67 6,360 - - - 11,200 19.5 - < 50 1,790 < 10 367 970 7,160 797 797 < 1.0 < 1.0 < 1.0 < 10.0 - - 32 - < 0.0050
QA/QC RPD% 0 2 - - - 6 3 - * 6 * 2 5 0 0 0 * * * * - - * - *
Associated CARO files available upon request.
Associated Exova file(s): 712940, 714233, 714243, 756693, 756810, 757047, 811364, 811710, 812030, 812741, 812985, 813438, 846260, 878316, 879073, 909346, 909448, 909654.
All terms defined within the body of SNC-Lavalin's report.
< Denotes concentration less than indicated detection limit or RPD less than indicated value.a Laboratory detection limit exceeds regulatory standard/guideline.
- Denotes analysis not conducted.b Standard to protect freshwater aquatic life.
n/a Denotes no applicable standard/guideline.c Guideline to protect irrigation water. Guideline for surface water, shown here for comparison purposes only.
QA/QC RPD Denotes quality assurance/quality control relative percent differenced Guideline to protect freshwater aquatic life, long-term average (i.e. "chronic"). Guideline for surface water, shown here for comparison purposes only.
* RPDs are not calculated where one or more concentrations are less than five times RDL.e Guideline to protect freshwater aquatic life, short-term maximum (i.e. "acute"). Guideline for surface water, shown here for comparison purposes only.
RDL Denotes reported detection limit.f Standard varies with pH.g Standard varies with Chloride.
BOLD Concentration greater than CSR Aquatic Life (AW) standardh guideline varies with pH and temperature.
SHADED Concentration greater than CSR Irrigation Watering (IW) standardi guideline varies with hardness
RED Concentration greater than BCWQG Irrigation Water (IW) guidelinej Conductivity guidelines varies with crop. Guideline range 700-5,000, most stringent guideline for low tolerance crops applied (strawberry, raspberry, bean and carrot.
BLUE SHADED Concentration greater than BCWQG Aquatic Life Long-Term Average (AW) guideline
BLUE SHADED Concentration greater than BCWQG Aquatic Life Short-term Maximum (AW) guideline
SNC-LAVALIN INC. Page 10 of 20
662036 / 2021 02 0920210309_662036_TAB_Historical.xlsx
QAQC CN 2021 03 09

TABLE V.1: Historical Summary of Analytical Results for Groundwater - Inorganics
Physical Parameters Dissolved Inorganics
Sample Sample Sample Date pH
To
tal H
ard
ness
pH
(fi
eld
)
Co
nd
ucti
vit
y
Fie
ld C
on
du
cti
vit
y
To
tal D
isso
lved
So
lid
s
Dis
so
lved
Org
an
ic
Carb
on
Ph
osp
hate
Am
mo
nia
, T
ota
l (a
s
N)
Nit
rate
(as N
)
Nit
rite
(as N
)
Ch
lori
de
Flu
ori
de
Su
lfate
To
tal A
lkali
nit
y
Alk
ali
nit
y,
Bic
arb
on
ate
(as
CaC
O3)
Alk
ali
nit
y, C
arb
on
ate
(as C
aC
O3)
Alk
ali
nit
y, H
yd
roxid
e
(as C
aC
O3)
Alk
ali
nit
y,
Ph
en
olp
hth
ale
in
(as C
aC
O3)
Bro
mid
e
Hyd
rog
en
Su
lfid
e
Su
lfid
e
Ch
em
ical O
xyg
en
Dem
an
d
Dis
so
lved
Ph
osp
hate
Ort
ho
-Ph
osp
hate
Location ID (yyyy mm dd) pH mg/L pH µS/cm µS/cm mg/L mg/L mg/L µg/L µg/L µg/L mg/L µg/L mg/L mg/L mg/L mg/L mg/L mg/L mg/L mg/L mg/L mg/L mg/L mg/LBC Guideline
CSR Aquatic Life (AW)b n/a n/a n/a n/a n/a n/a n/a n/a 1,310-18,500
f 400,000 800-2,000g 1,500 2,000-3,000
i1,280-4,290
i n/a n/a n/a n/a n/a n/a 0.02 n/a n/a n/a n/a
CSR Irrigation Watering (IW) n/a n/a n/a n/a n/a n/a n/a n/a n/a n/a n/a 100 1,000 n/a n/a n/a n/a n/a n/a n/a n/a n/a n/a n/a n/a
BCWQG Irrigation Water (IW)c 5.0 - 9.0 n/a 5.0 - 9.0 700-5,000
j700-5,000
j n/a n/a n/a n/a n/a n/a 100 2,000 n/a n/a n/a n/a n/a n/a n/a n/a n/a n/a n/a n/a
BCWQG Aquatic Life Long-Term Average (AW)d 6.5 - 9.0 n/a 6.5 - 9.0 n/a n/a n/a n/a n/a 135-1,780
h 3,000 80-200 150 n/a 128-429i n/a n/a n/a n/a n/a n/a n/a n/a n/a n/a n/a
BCWQG Aquatic Life Short-term Maximum (AW)e 6.5 - 9.0 n/a 6.5 - 9.0 n/a n/a n/a n/a n/a 700-24,500
h 32,800 (max) 240-600 600 400 - 1,876 n/a n/a n/a n/a n/a n/a n/a 0.002 n/a n/a n/a n/a
GL16-1 GL 16-1-20091111 2009 11 11 - 1,840 - - - - - - - - - - - - - - - - - - - - - - -
GL 16-1-20111217 2011 12 17 - 987 - - - 4,500 - - < 10 220 - 166 - 2,240 985 - - - - - - - 10 - 0.04
GL16-1-20100811 2010 08 11 - 1,700 - - - 6,750 - - 470 - - 252 - 3,520 1,170 - - - - - - - < 10 - 0.012
GL16-1-20110627 2011 06 27 - 1,210 - - - 4,780 - - < 10 - - 168 - 2,480 982 - - - - - - - 10 - 0.024
GL30-1-20110627 Duplicate - 1,200 - - - 4,790 - - 30 - - 165 - 2,330 980 - - - - - - - 20 - 0.023
QA/QC RPD% - 1 - - - 0 - - * - - 2 - 6 0 - - - - - - - * - 4
GL16-1-20120626 2012 06 26 - 1,260 - - - 4,490 - - 500 - - 162 - 2,270 1,170 - - - - - - - 30 - 0.011
GL16-1-20121204 2012 12 04 - 1,020 - - - 4,170 - - 1,130 120 - 154 - 2,110 1,190 - - - - - - - 34 - 0.018
GL16-1-20130626 2013 06 26 - 1,040 - - - 4,200 - - 448 < 250 - 153 1,500 2,080 1,100 - - - - < 2.5 - - 35 - -
GL16-1-20131113 2013 11 13 - 949 - - - 4,160 - - 39.9 590 - 158 < 1,000 1,940 1,120 - - - - - - - < 20 - -
GL16-1-20140605 2014 06 05 - 930 - - - 3,880 - - 382 < 100 - 154 900 1,970 1,200 - - - - < 1.0 - - < 20 - 0.0033
GL16-1-20141118 2014 11 18 - 845 - - - 3,830 - - 125 150 - 148 890 1,850 1,170 - - - - < 1.0 - - < 20 - 0.017
GL16-1-20150610 2015 06 10 7.96 900 - - - 3,880 - - 350 < 100 - 155 880 1,960 1,050 - - - - < 1.0 - - < 20 - 0.0046
GL16-1-20151103 2015 11 03 7.76 827 - - - 3,670 - - 34.9 260 - 151 940 1,860 1,180 - - - - < 1.0 - - < 20 - 0.0451
DUP3-20151103 Duplicate 7.64 828 - - - 3,630 - - 36.3 230 - 145 900 1,780 943 - - - - < 1.0 - - < 20 - 0.0448
QA/QC RPD% 2 0 - - - 1 - - 4 12 - 4 4 4 22 - - - - * - - * - 1
GL16-1-20160524 2016 05 24 7.84 803 - - - 3,470 - - < 5.0 250 - 145 1,020 1,770 938 938 < 1.0 < 1.0 - < 1.0 - - < 20 - 0.0526
GL16-1-20170525 2017 05 25 8.51 833 - - - 3,530 - - < 5.0 330 - 139 940 1,710 898 - - - - < 1.0 - - < 20 - 0.0517
DUP2-20170525 Duplicate 8.45 847 - - - 3,510 - - < 5.0 280 - 142 990 1,750 866 - - - - < 1.0 - - < 20 - 0.0528
QA/QC RPD% 1 2 - - - 1 - - * 16 - 2 5 2 4 - - - - * - - * - 2
GL16-1-180604 2018 06 04 7.67 762 7.11 - 3,660 3,180 2.93 0.0072 27 < 5,000a < 10 273 690 4,040 944 944 < 1.0 < 1.0 < 1.0 < 50.0 - - 24 0.0072 -
GL16-1-190529 2019 05 29 7.83 756 7.03 - 4,453 3,390 3.06 < 0.0500 68 < 100 < 100 133 1,240 1,480 965 965 < 1.0 < 1.0 < 1.0 < 1.00 - - < 20 < 0.0500 -
GL16-1-200608 2020 06 08 7.98 699 7.08 - 3,720 3,020 1.59 - 256 < 1,000 < 1,000a 95.1 < 10,000a 1,270 973 973 < 1.0 < 1.0 < 1.0 < 10.0 - - < 20 - < 0.500
GL17-1 GL17-1-20091112 2009 11 12 - 3,390 - - - - - - - - - - - - - - - - - - - - - - -
GL17-1-20100811 2010 08 11 - 3,280 - - - 9,080 - - 50 - - 172 - 4,600 678 - - - - - - - 30 - 0.003
GL30-4-20100811 Duplicate - 3,170 - - - 8,730 - - 70 - - 174 - 4,710 679 - - - - - - - 40 - 0.003
QA/QC RPD% - 3 - - - 4 - - 33 - - 1 - 2 0 - - - - - - - * - *
GL17-1-20110628 2011 06 28 - 3,580 - - - 8,930 - - 180 - - 164 - 5,060 664 - - - - - - - 40 - 0.088
GL17-1-20120625 2012 06 25 - 130 - - - 1,610 - - 340 - - 71.5 - 6.7 1,480 - - - - - - - 20 - 0.034
GL17-1-20121204 2012 12 04 - 98 - - - 1,570 - - 360 < 100 - 72.6 - 6.3 614 - - - - - - - 33 - 0.031
GL17-1-20160526 2016 05 26 8.18 118 - - - 1,480 - - 371 < 100 - 71 2,040 < 6.0 1,330 - - - - < 1.0 - - < 20 - 0.0152
GL17-1-20160919 2016 09 19 8.32 123 - - - 1,490 - - 184 < 100 - 93 1,930 29.3 1,240 - - - - < 1.0 - - < 20 - 0.053
GL17-1-20170531 2017 05 31 8.13 125 - - - 1,530 - - 353 < 100 - 78 1,890 < 6.0 1,350 - - - - < 1.0 - - < 20 - 0.0146
GL17-1-20170926 2017 09 26 7.95 121 - - - 1,480 - - 334 < 100 - 81 1,950 7.6 1,310 - - - - < 1.0 - - < 20 - 0.0114
GL17-1-180604 2018 06 04 7.83 127 7.3 - 2,044 1,480 2.54 < 0.0050 373 < 10 < 10 68.9 1,710 18.3 1,330 1,330 < 1.0 < 1.0 < 1.0 < 1.00 - - < 20 < 0.0050 -
GL17-1-180919 2018 09 19 7.80 130 7.5 - 2,197 1,480 2.83 < 0.0050 287 < 100 < 10 88.4 2,060 45.7 1,220 1,220 < 1.0 < 1.0 < 1.0 0.40 - - < 20 < 0.0050 -
Associated CARO files available upon request.
Associated Exova file(s): 712940, 714233, 714243, 756693, 756810, 757047, 811364, 811710, 812030, 812741, 812985, 813438, 846260, 878316, 879073, 909346, 909448, 909654.
All terms defined within the body of SNC-Lavalin's report.
< Denotes concentration less than indicated detection limit or RPD less than indicated value.a Laboratory detection limit exceeds regulatory standard/guideline.
- Denotes analysis not conducted.b Standard to protect freshwater aquatic life.
n/a Denotes no applicable standard/guideline.c Guideline to protect irrigation water. Guideline for surface water, shown here for comparison purposes only.
QA/QC RPD Denotes quality assurance/quality control relative percent differenced Guideline to protect freshwater aquatic life, long-term average (i.e. "chronic"). Guideline for surface water, shown here for comparison purposes only.
* RPDs are not calculated where one or more concentrations are less than five times RDL.e Guideline to protect freshwater aquatic life, short-term maximum (i.e. "acute"). Guideline for surface water, shown here for comparison purposes only.
RDL Denotes reported detection limit.f Standard varies with pH.g Standard varies with Chloride.
BOLD Concentration greater than CSR Aquatic Life (AW) standardh guideline varies with pH and temperature.
SHADED Concentration greater than CSR Irrigation Watering (IW) standardi guideline varies with hardness
RED Concentration greater than BCWQG Irrigation Water (IW) guidelinej Conductivity guidelines varies with crop. Guideline range 700-5,000, most stringent guideline for low tolerance crops applied (strawberry, raspberry, bean and carrot.
BLUE SHADED Concentration greater than BCWQG Aquatic Life Long-Term Average (AW) guideline
BLUE SHADED Concentration greater than BCWQG Aquatic Life Short-term Maximum (AW) guideline
SNC-LAVALIN INC. Page 11 of 20
662036 / 2021 02 0920210309_662036_TAB_Historical.xlsx
QAQC CN 2021 03 09

TABLE V.1: Historical Summary of Analytical Results for Groundwater - Inorganics
Physical Parameters Dissolved Inorganics
Sample Sample Sample Date pH
To
tal H
ard
ness
pH
(fi
eld
)
Co
nd
ucti
vit
y
Fie
ld C
on
du
cti
vit
y
To
tal D
isso
lved
So
lid
s
Dis
so
lved
Org
an
ic
Carb
on
Ph
osp
hate
Am
mo
nia
, T
ota
l (a
s
N)
Nit
rate
(as N
)
Nit
rite
(as N
)
Ch
lori
de
Flu
ori
de
Su
lfate
To
tal A
lkali
nit
y
Alk
ali
nit
y,
Bic
arb
on
ate
(as
CaC
O3)
Alk
ali
nit
y, C
arb
on
ate
(as C
aC
O3)
Alk
ali
nit
y, H
yd
roxid
e
(as C
aC
O3)
Alk
ali
nit
y,
Ph
en
olp
hth
ale
in
(as C
aC
O3)
Bro
mid
e
Hyd
rog
en
Su
lfid
e
Su
lfid
e
Ch
em
ical O
xyg
en
Dem
an
d
Dis
so
lved
Ph
osp
hate
Ort
ho
-Ph
osp
hate
Location ID (yyyy mm dd) pH mg/L pH µS/cm µS/cm mg/L mg/L mg/L µg/L µg/L µg/L mg/L µg/L mg/L mg/L mg/L mg/L mg/L mg/L mg/L mg/L mg/L mg/L mg/L mg/LBC Guideline
CSR Aquatic Life (AW)b n/a n/a n/a n/a n/a n/a n/a n/a 1,310-18,500
f 400,000 800-2,000g 1,500 2,000-3,000
i1,280-4,290
i n/a n/a n/a n/a n/a n/a 0.02 n/a n/a n/a n/a
CSR Irrigation Watering (IW) n/a n/a n/a n/a n/a n/a n/a n/a n/a n/a n/a 100 1,000 n/a n/a n/a n/a n/a n/a n/a n/a n/a n/a n/a n/a
BCWQG Irrigation Water (IW)c 5.0 - 9.0 n/a 5.0 - 9.0 700-5,000
j700-5,000
j n/a n/a n/a n/a n/a n/a 100 2,000 n/a n/a n/a n/a n/a n/a n/a n/a n/a n/a n/a n/a
BCWQG Aquatic Life Long-Term Average (AW)d 6.5 - 9.0 n/a 6.5 - 9.0 n/a n/a n/a n/a n/a 135-1,780
h 3,000 80-200 150 n/a 128-429i n/a n/a n/a n/a n/a n/a n/a n/a n/a n/a n/a
BCWQG Aquatic Life Short-term Maximum (AW)e 6.5 - 9.0 n/a 6.5 - 9.0 n/a n/a n/a n/a n/a 700-24,500
h 32,800 (max) 240-600 600 400 - 1,876 n/a n/a n/a n/a n/a n/a n/a 0.002 n/a n/a n/a n/a
GL17-1 GL17-1-190527 2019 05 27 8.11 124 7.56 - 2,558 1,490 2.02 < 0.0050 445 < 10 < 10 75.7 1,960 14.4 1,380 1,380 < 1.0 < 1.0 < 1.0 0.18 - - < 20 < 0.0050 -
(cont'd) DUP1-190527 Duplicate 8.13 120 7.56 - 2,558 1,470 1.76 < 0.0050 481 < 10 < 10 75.5 1,940 13.8 1,400 1,400 < 1.0 < 1.0 < 1.0 0.20 - - < 20 < 0.0050 -
QA/QC RPD% 0 3 * - * 1 * * 8 * * 0 1 4 1 1 * * * * - - * * -
GL17-1-190923 2019 09 23 8.11 128 7.67 - 2,421 1,550 1.92 - 351 < 10 < 10 78.7 1,940 14.3 1,360 1,360 < 1.0 < 1.0 < 1.0 0.42 - - < 20 - 0.0715
GL17-1-200608 2020 06 08 8.20 121 7.35 - 2,138 1,590 2.32 - 349 < 10 < 10 62.6 1,820 3.9 1,400 1,400 < 1.0 < 1.0 < 1.0 < 1.00 - - < 20 - 0.0500
GL17-1-201020 2020 10 20 8.01 132 7.43 - 2,457 1,530 2.22 - 402 < 10 < 10 69.6 1,990 4.4 1,300 1,300 < 1.0 < 1.0 < 1.0 0.33 - - < 20 - 0.0103
GL17-2 GL17-2-20091112 2009 11 12 - 128 - - - - - - - - - - - - - - - - - - - - - - -GL30-2-20091112 Duplicate - 119 - - - - - - - - - - - - - - - - - - - - - - -
QA/QC RPD% - 7 - - - - - - - - - - - - - - - - - - - - - - -
GL17-2-20100811 2010 08 11 - 110 - - - 1,630 - - 350 - - 65.2 - 6.2 1,480 - - - - - - - 10 - 0.058
GL17-2-20110628 2011 06 28 - 109 - - - 1,510 - - 220 - - 68 - 60 135 - - - - - - - 10 - 0.109
GL17-2-20120625 2012 06 25 - 3,440 - - - 9,700 - - 190 - - 204 - 5,740 606 - - - - - - - 40 - < 0.002
GL17-2-20121204 2012 12 04 - 3,920 - - - 10,000 - - 110 2,500 - 180 - 6,120 652 - - - - - - - 33 - < 0.002
GL17-2-20130626 2013 06 26 - 4,000 - - - 10,800 - - < 5.0 2,610 - 191 2,300 6,330 780 - - - - < 2.5 - - 33 - -
GL17-2-20131113 2013 11 13 - 4,190 - - - 10,800 - - 22.6 1,840 - 262 1,700 6,380 864 - - - - - - - 24 - -
GL17-2-20140605 2014 06 05 - 3,650 - - - 10,500 - - 32.4 1,490 - 226 1,300 6,290 822 - - - - < 2.5 - - 29 - 0.0025
GL17-2-20141118 2014 11 18 - 3,860 - - - 11,300 - - 47 1,330 - 247 1,400 6,820 966 - - - - < 2.5 - - 40 - 0.0014
GL17-2-20150608 2015 06 08 7.5 4,010 - - - 10,300 - - 33.2 1,680 - 241 1,700 6,660 870 - - - - < 2.5 - - 32 - 0.0025
GL17-2-20151104 2015 11 04 7.65 3,760 - - - 11,100 - - 9.3 1,970 - 257 1,700 7,000 705 - - - - < 2.5 - - 26 - 0.0033
GL18-2 GL 18-2-20091110 2009 11 10 - 1,060 - - - - - - - - - - - - - - - - - - - - - - -
GL18-2-20100811 2010 08 11 - 1,380 - - - 6,930 - - 1,400 - - 568 - 3,800 154 - - - - - - - 40 - 0.005
GL18-2-20110629 2011 06 29 - 1,510 - - - 6,440 - - 710 - - 572 - 3,770 260 - - - - - - - 40 - 0.078
GL18-2-20120626 2012 06 26 - 1,480 - - - 6,820 - - 1,020 - - 572 - 3,620 156 - - - - - - - 40 - 0.004
DUP-A-20120626 Duplicate - 1,520 - - - 6,670 - - 1,280 - - 585 - 3,670 167 - - - - - - - 60 - 0.004
QA/QC RPD% - 3 - - - 2 - - 23 - - 2 - 1 7 - - - - - - - * - *
GL18-2-20121205 2012 12 05 - 1,380 - - - 6,600 - - 1,450 < 10,000a - 785 - 8,090 165 - - - - - - - 22 - 0.005
GL18-2-20130627 2013 06 27 - 1,400 - - - 6,660 - - 1,330 < 250 - 611 < 1,000 3,900 177 - - - - 3.7 - - 47 - -
GL18-2-20131114 2013 11 14 - 1,380 - - - 6,670 - - 1,370 < 250 - 618 < 1,000 3,870 181 - - - - 3.7 - - 32 - -
GL18-2-20140609 2014 06 09 - 1,380 - - - 6,260 - - 1,440 < 250 - 608 < 1,000 3,820 180 - - - - 3.4 - - 150 - 0.0043
GL18-2-20141126 2014 11 26 - 1,380 - - - 6,330 - - 1,370 760 - 613 < 1,000 3,780 680 - - - - 3.5 - - 38 - 0.0042
DUP3-20141126 Duplicate - 1,390 - - - 6,080 - - 1,440 420 - 627 < 1,000 3,860 170 - - - - 3.8 - - 40 - 0.0033
QA/QC RPD% - 1 - - - 4 - - 5 58 - 2 * 2 120 - - - - 8 - - * - *
GL18-2-20150615 2015 06 15 7.98 1,340 - - - 6,410 - - 1,330 < 250 - 608 < 1,000 3,780 170 - - - - 3.7 - - 35 - 0.0043
GL18-2-20170529 2017 05 29 7.95 1,370 - - - 6,310 - - 1,390 < 250 - 619 < 1,000 3,820 141 - - - - 3.2 - - < 20 - 0.0027
GL18-2-180604 2018 06 04 7.38 1,410 7.797.8 8,140 7,172 6,140 2.92 0.0231 1,520 < 5,000a < 10 1,130 230 8,810 138 138 < 1.0 < 1.0 < 1.0 < 50.0 < 0.01
a < 0.020 38 0.0231 -
DUP-180604 Duplicate 7.43 1,430 7.79 - 7,172 6,310 2.91 0.0216 1,530 < 5,000a < 10 1,130 250 8,740 139 139 < 1.0 < 1.0 < 1.0 < 50.0 - - 36 0.0216 -
QA/QC RPD% 1 1 * - * 3 0 * 1 * * 0 * 1 1 1 * * * * - - * * -
Associated CARO files available upon request.
Associated Exova file(s): 712940, 714233, 714243, 756693, 756810, 757047, 811364, 811710, 812030, 812741, 812985, 813438, 846260, 878316, 879073, 909346, 909448, 909654.
All terms defined within the body of SNC-Lavalin's report.
< Denotes concentration less than indicated detection limit or RPD less than indicated value.a Laboratory detection limit exceeds regulatory standard/guideline.
- Denotes analysis not conducted.b Standard to protect freshwater aquatic life.
n/a Denotes no applicable standard/guideline.c Guideline to protect irrigation water. Guideline for surface water, shown here for comparison purposes only.
QA/QC RPD Denotes quality assurance/quality control relative percent differenced Guideline to protect freshwater aquatic life, long-term average (i.e. "chronic"). Guideline for surface water, shown here for comparison purposes only.
* RPDs are not calculated where one or more concentrations are less than five times RDL.e Guideline to protect freshwater aquatic life, short-term maximum (i.e. "acute"). Guideline for surface water, shown here for comparison purposes only.
RDL Denotes reported detection limit.f Standard varies with pH.g Standard varies with Chloride.
BOLD Concentration greater than CSR Aquatic Life (AW) standardh guideline varies with pH and temperature.
SHADED Concentration greater than CSR Irrigation Watering (IW) standardi guideline varies with hardness
RED Concentration greater than BCWQG Irrigation Water (IW) guidelinej Conductivity guidelines varies with crop. Guideline range 700-5,000, most stringent guideline for low tolerance crops applied (strawberry, raspberry, bean and carrot.
BLUE SHADED Concentration greater than BCWQG Aquatic Life Long-Term Average (AW) guideline
BLUE SHADED Concentration greater than BCWQG Aquatic Life Short-term Maximum (AW) guideline
SNC-LAVALIN INC. Page 12 of 20
662036 / 2021 02 0920210309_662036_TAB_Historical.xlsx
QAQC CN 2021 03 09
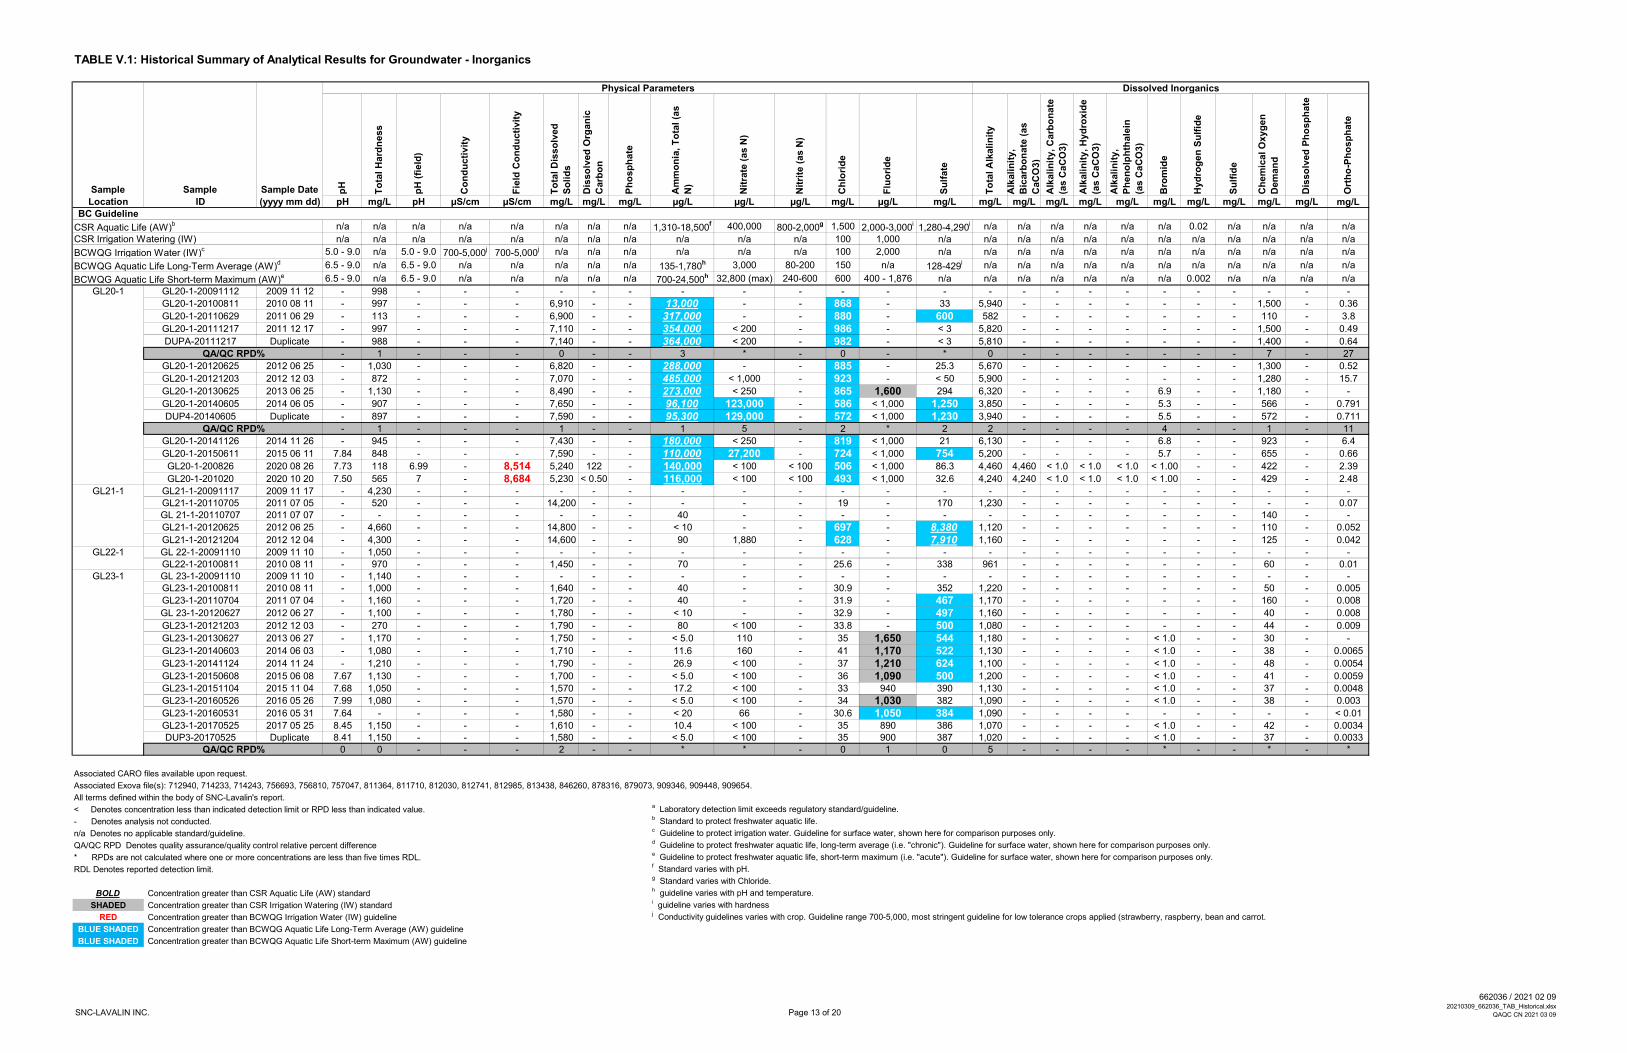
TABLE V.1: Historical Summary of Analytical Results for Groundwater - Inorganics
Physical Parameters Dissolved Inorganics
Sample Sample Sample Date pH
To
tal H
ard
ness
pH
(fi
eld
)
Co
nd
ucti
vit
y
Fie
ld C
on
du
cti
vit
y
To
tal D
isso
lved
So
lid
s
Dis
so
lved
Org
an
ic
Carb
on
Ph
osp
hate
Am
mo
nia
, T
ota
l (a
s
N)
Nit
rate
(as N
)
Nit
rite
(as N
)
Ch
lori
de
Flu
ori
de
Su
lfate
To
tal A
lkali
nit
y
Alk
ali
nit
y,
Bic
arb
on
ate
(as
CaC
O3)
Alk
ali
nit
y, C
arb
on
ate
(as C
aC
O3)
Alk
ali
nit
y, H
yd
roxid
e
(as C
aC
O3)
Alk
ali
nit
y,
Ph
en
olp
hth
ale
in
(as C
aC
O3)
Bro
mid
e
Hyd
rog
en
Su
lfid
e
Su
lfid
e
Ch
em
ical O
xyg
en
Dem
an
d
Dis
so
lved
Ph
osp
hate
Ort
ho
-Ph
osp
hate
Location ID (yyyy mm dd) pH mg/L pH µS/cm µS/cm mg/L mg/L mg/L µg/L µg/L µg/L mg/L µg/L mg/L mg/L mg/L mg/L mg/L mg/L mg/L mg/L mg/L mg/L mg/L mg/LBC Guideline
CSR Aquatic Life (AW)b n/a n/a n/a n/a n/a n/a n/a n/a 1,310-18,500
f 400,000 800-2,000g 1,500 2,000-3,000
i1,280-4,290
i n/a n/a n/a n/a n/a n/a 0.02 n/a n/a n/a n/a
CSR Irrigation Watering (IW) n/a n/a n/a n/a n/a n/a n/a n/a n/a n/a n/a 100 1,000 n/a n/a n/a n/a n/a n/a n/a n/a n/a n/a n/a n/a
BCWQG Irrigation Water (IW)c 5.0 - 9.0 n/a 5.0 - 9.0 700-5,000
j700-5,000
j n/a n/a n/a n/a n/a n/a 100 2,000 n/a n/a n/a n/a n/a n/a n/a n/a n/a n/a n/a n/a
BCWQG Aquatic Life Long-Term Average (AW)d 6.5 - 9.0 n/a 6.5 - 9.0 n/a n/a n/a n/a n/a 135-1,780
h 3,000 80-200 150 n/a 128-429i n/a n/a n/a n/a n/a n/a n/a n/a n/a n/a n/a
BCWQG Aquatic Life Short-term Maximum (AW)e 6.5 - 9.0 n/a 6.5 - 9.0 n/a n/a n/a n/a n/a 700-24,500
h 32,800 (max) 240-600 600 400 - 1,876 n/a n/a n/a n/a n/a n/a n/a 0.002 n/a n/a n/a n/a
GL20-1 GL20-1-20091112 2009 11 12 - 998 - - - - - - - - - - - - - - - - - - - - - - -
GL20-1-20100811 2010 08 11 - 997 - - - 6,910 - - 13,000 - - 868 - 33 5,940 - - - - - - - 1,500 - 0.36
GL20-1-20110629 2011 06 29 - 113 - - - 6,900 - - 317,000 - - 880 - 600 582 - - - - - - - 110 - 3.8
GL20-1-20111217 2011 12 17 - 997 - - - 7,110 - - 354,000 < 200 - 986 - < 3 5,820 - - - - - - - 1,500 - 0.49
DUPA-20111217 Duplicate - 988 - - - 7,140 - - 364,000 < 200 - 982 - < 3 5,810 - - - - - - - 1,400 - 0.64
QA/QC RPD% - 1 - - - 0 - - 3 * - 0 - * 0 - - - - - - - 7 - 27
GL20-1-20120625 2012 06 25 - 1,030 - - - 6,820 - - 288,000 - - 885 - 25.3 5,670 - - - - - - - 1,300 - 0.52
GL20-1-20121203 2012 12 03 - 872 - - - 7,070 - - 485,000 < 1,000 - 923 - < 50 5,900 - - - - - - - 1,280 - 15.7
GL20-1-20130625 2013 06 25 - 1,130 - - - 8,490 - - 273,000 < 250 - 865 1,600 294 6,320 - - - - 6.9 - - 1,180 - -
GL20-1-20140605 2014 06 05 - 907 - - - 7,650 - - 96,100 123,000 - 586 < 1,000 1,250 3,850 - - - - 5.3 - - 566 - 0.791
DUP4-20140605 Duplicate - 897 - - - 7,590 - - 95,300 129,000 - 572 < 1,000 1,230 3,940 - - - - 5.5 - - 572 - 0.711
QA/QC RPD% - 1 - - - 1 - - 1 5 - 2 * 2 2 - - - - 4 - - 1 - 11
GL20-1-20141126 2014 11 26 - 945 - - - 7,430 - - 180,000 < 250 - 819 < 1,000 21 6,130 - - - - 6.8 - - 923 - 6.4
GL20-1-20150611 2015 06 11 7.84 848 - - - 7,590 - - 110,000 27,200 - 724 < 1,000 754 5,200 - - - - 5.7 - - 655 - 0.66
GL20-1-200826 2020 08 26 7.73 118 6.99 - 8,514 5,240 122 - 140,000 < 100 < 100 506 < 1,000 86.3 4,460 4,460 < 1.0 < 1.0 < 1.0 < 1.00 - - 422 - 2.39
GL20-1-201020 2020 10 20 7.50 565 7 - 8,684 5,230 < 0.50 - 116,000 < 100 < 100 493 < 1,000 32.6 4,240 4,240 < 1.0 < 1.0 < 1.0 < 1.00 - - 429 - 2.48
GL21-1 GL21-1-20091117 2009 11 17 - 4,230 - - - - - - - - - - - - - - - - - - - - - - -GL21-1-20110705 2011 07 05 - 520 - - - 14,200 - - - - - 19 - 170 1,230 - - - - - - - - - 0.07GL 21-1-20110707 2011 07 07 - - - - - - - - 40 - - - - - - - - - - - - - 140 - -
GL21-1-20120625 2012 06 25 - 4,660 - - - 14,800 - - < 10 - - 697 - 8,380 1,120 - - - - - - - 110 - 0.052
GL21-1-20121204 2012 12 04 - 4,300 - - - 14,600 - - 90 1,880 - 628 - 7,910 1,160 - - - - - - - 125 - 0.042
GL22-1 GL 22-1-20091110 2009 11 10 - 1,050 - - - - - - - - - - - - - - - - - - - - - - -GL22-1-20100811 2010 08 11 - 970 - - - 1,450 - - 70 - - 25.6 - 338 961 - - - - - - - 60 - 0.01
GL23-1 GL 23-1-20091110 2009 11 10 - 1,140 - - - - - - - - - - - - - - - - - - - - - - -GL23-1-20100811 2010 08 11 - 1,000 - - - 1,640 - - 40 - - 30.9 - 352 1,220 - - - - - - - 50 - 0.005
GL23-1-20110704 2011 07 04 - 1,160 - - - 1,720 - - 40 - - 31.9 - 467 1,170 - - - - - - - 160 - 0.008
GL 23-1-20120627 2012 06 27 - 1,100 - - - 1,780 - - < 10 - - 32.9 - 497 1,160 - - - - - - - 40 - 0.008
GL23-1-20121203 2012 12 03 - 270 - - - 1,790 - - 80 < 100 - 33.8 - 500 1,080 - - - - - - - 44 - 0.009
GL23-1-20130627 2013 06 27 - 1,170 - - - 1,750 - - < 5.0 110 - 35 1,650 544 1,180 - - - - < 1.0 - - 30 - -
GL23-1-20140603 2014 06 03 - 1,080 - - - 1,710 - - 11.6 160 - 41 1,170 522 1,130 - - - - < 1.0 - - 38 - 0.0065
GL23-1-20141124 2014 11 24 - 1,210 - - - 1,790 - - 26.9 < 100 - 37 1,210 624 1,100 - - - - < 1.0 - - 48 - 0.0054
GL23-1-20150608 2015 06 08 7.67 1,130 - - - 1,700 - - < 5.0 < 100 - 36 1,090 500 1,200 - - - - < 1.0 - - 41 - 0.0059
GL23-1-20151104 2015 11 04 7.68 1,050 - - - 1,570 - - 17.2 < 100 - 33 940 390 1,130 - - - - < 1.0 - - 37 - 0.0048
GL23-1-20160526 2016 05 26 7.99 1,080 - - - 1,570 - - < 5.0 < 100 - 34 1,030 382 1,090 - - - - < 1.0 - - 38 - 0.003
GL23-1-20160531 2016 05 31 7.64 - - - - 1,580 - - < 20 66 - 30.6 1,050 384 1,090 - - - - - - - - - < 0.01
GL23-1-20170525 2017 05 25 8.45 1,150 - - - 1,610 - - 10.4 < 100 - 35 890 386 1,070 - - - - < 1.0 - - 42 - 0.0034DUP3-20170525 Duplicate 8.41 1,150 - - - 1,580 - - < 5.0 < 100 - 35 900 387 1,020 - - - - < 1.0 - - 37 - 0.0033
QA/QC RPD% 0 0 - - - 2 - - * * - 0 1 0 5 - - - - * - - * - *
Associated CARO files available upon request.
Associated Exova file(s): 712940, 714233, 714243, 756693, 756810, 757047, 811364, 811710, 812030, 812741, 812985, 813438, 846260, 878316, 879073, 909346, 909448, 909654.
All terms defined within the body of SNC-Lavalin's report.
< Denotes concentration less than indicated detection limit or RPD less than indicated value.a Laboratory detection limit exceeds regulatory standard/guideline.
- Denotes analysis not conducted.b Standard to protect freshwater aquatic life.
n/a Denotes no applicable standard/guideline.c Guideline to protect irrigation water. Guideline for surface water, shown here for comparison purposes only.
QA/QC RPD Denotes quality assurance/quality control relative percent differenced Guideline to protect freshwater aquatic life, long-term average (i.e. "chronic"). Guideline for surface water, shown here for comparison purposes only.
* RPDs are not calculated where one or more concentrations are less than five times RDL.e Guideline to protect freshwater aquatic life, short-term maximum (i.e. "acute"). Guideline for surface water, shown here for comparison purposes only.
RDL Denotes reported detection limit.f Standard varies with pH.g Standard varies with Chloride.
BOLD Concentration greater than CSR Aquatic Life (AW) standardh guideline varies with pH and temperature.
SHADED Concentration greater than CSR Irrigation Watering (IW) standardi guideline varies with hardness
RED Concentration greater than BCWQG Irrigation Water (IW) guidelinej Conductivity guidelines varies with crop. Guideline range 700-5,000, most stringent guideline for low tolerance crops applied (strawberry, raspberry, bean and carrot.
BLUE SHADED Concentration greater than BCWQG Aquatic Life Long-Term Average (AW) guideline
BLUE SHADED Concentration greater than BCWQG Aquatic Life Short-term Maximum (AW) guideline
SNC-LAVALIN INC. Page 13 of 20
662036 / 2021 02 0920210309_662036_TAB_Historical.xlsx
QAQC CN 2021 03 09

TABLE V.1: Historical Summary of Analytical Results for Groundwater - Inorganics
Physical Parameters Dissolved Inorganics
Sample Sample Sample Date pH
To
tal H
ard
ness
pH
(fi
eld
)
Co
nd
ucti
vit
y
Fie
ld C
on
du
cti
vit
y
To
tal D
isso
lved
So
lid
s
Dis
so
lved
Org
an
ic
Carb
on
Ph
osp
hate
Am
mo
nia
, T
ota
l (a
s
N)
Nit
rate
(as N
)
Nit
rite
(as N
)
Ch
lori
de
Flu
ori
de
Su
lfate
To
tal A
lkali
nit
y
Alk
ali
nit
y,
Bic
arb
on
ate
(as
CaC
O3)
Alk
ali
nit
y, C
arb
on
ate
(as C
aC
O3)
Alk
ali
nit
y, H
yd
roxid
e
(as C
aC
O3)
Alk
ali
nit
y,
Ph
en
olp
hth
ale
in
(as C
aC
O3)
Bro
mid
e
Hyd
rog
en
Su
lfid
e
Su
lfid
e
Ch
em
ical O
xyg
en
Dem
an
d
Dis
so
lved
Ph
osp
hate
Ort
ho
-Ph
osp
hate
Location ID (yyyy mm dd) pH mg/L pH µS/cm µS/cm mg/L mg/L mg/L µg/L µg/L µg/L mg/L µg/L mg/L mg/L mg/L mg/L mg/L mg/L mg/L mg/L mg/L mg/L mg/L mg/LBC Guideline
CSR Aquatic Life (AW)b n/a n/a n/a n/a n/a n/a n/a n/a 1,310-18,500
f 400,000 800-2,000g 1,500 2,000-3,000
i1,280-4,290
i n/a n/a n/a n/a n/a n/a 0.02 n/a n/a n/a n/a
CSR Irrigation Watering (IW) n/a n/a n/a n/a n/a n/a n/a n/a n/a n/a n/a 100 1,000 n/a n/a n/a n/a n/a n/a n/a n/a n/a n/a n/a n/a
BCWQG Irrigation Water (IW)c 5.0 - 9.0 n/a 5.0 - 9.0 700-5,000
j700-5,000
j n/a n/a n/a n/a n/a n/a 100 2,000 n/a n/a n/a n/a n/a n/a n/a n/a n/a n/a n/a n/a
BCWQG Aquatic Life Long-Term Average (AW)d 6.5 - 9.0 n/a 6.5 - 9.0 n/a n/a n/a n/a n/a 135-1,780
h 3,000 80-200 150 n/a 128-429i n/a n/a n/a n/a n/a n/a n/a n/a n/a n/a n/a
BCWQG Aquatic Life Short-term Maximum (AW)e 6.5 - 9.0 n/a 6.5 - 9.0 n/a n/a n/a n/a n/a 700-24,500
h 32,800 (max) 240-600 600 400 - 1,876 n/a n/a n/a n/a n/a n/a n/a 0.002 n/a n/a n/a n/a
GL23-1 GL23-1-180529 2018 05 29 7.86 1,260 7.22 - 2,014 1,560 14.3 0.0062 36 < 10 66 34.2 710 341 1,090 1,090 < 1.0 < 1.0 < 1.0 0.27 - - 39 0.0062 -
(cont'd) GL23-1-190523 2019 05 23 8.01 1,170 7.7 - 2,332 1,590 14.8 < 0.0050 33 72 < 10 34.0 660 384 1,120 1,120 < 1.0 < 1.0 < 1.0 0.27 - - 30 < 0.0050 -
GL23-1-190917 2019 09 17 7.78 1,130 - - - 1,610 16.4 - 60 < 10 < 10 35.0 750 394 1,090 1,090 < 1.0 < 1.0 < 1.0 < 0.10 - - - - < 0.0050
GL23-1-200617 2020 06 17 7.97 1,000 6.95 - 2,150 1,530 14.6 - < 50 134 < 100 32.3 < 1,000 405 964 964 < 1.0 < 1.0 < 1.0 < 1.00 - - 33 - < 0.0500
GL23-1-200910 2020 09 10 7.98 1,130 - - - 1,660 14.8 - < 50 28 < 10 33.1 780 402 1,110 1,110 < 1.0 < 1.0 < 1.0 0.32 - - - - < 0.0050GL24-1 GL24-1-20100811 2010 08 11 - 1,200 - - - 2,110 - - < 10 - - 91.4 - 762 852 - - - - - - - 20 - 0.034
GL24-1-20160531 2016 05 31 7.64 - - - - 1,570 - - < 20 11,700 - 188 1,270 349 778 - - - - - - - - - 0.1
GL24-1-20180927 2018 09 27 - 1,760 - - - - - - 31 61,600 - 99.1 1,140 1,450 - - - - - < 0.10 - - - - < 0.0050
GL24-1-180612 2018 06 12 7.63 1,300 - - - 2,380 - 0.0083 60 13,100 29 216 1,090 742 1,060 1,060 < 1.0 < 1.0 < 1.0 < 0.10 - - - 0.0083 -
GL24-1-190917 2019 09 17 7.92 1,100 - - - 1,870 9.09 - 47 6,540 < 100 163 1,200 591 921 921 < 1.0 < 1.0 < 1.0 < 1.00 - - - - < 0.0500
GL24-1-200910 2020 09 10 8.04 856 - - - 1,750 6.56 - < 50 1,690 < 10 123 1,390 418 930 930 < 1.0 < 1.0 < 1.0 0.30 - - - - < 0.0050
GL25-1 GL25-1-20091117 2009 11 17 - 1,540 - - - - - - - - - - - - - - - - - - - - - - -
GL25-1-20100812 2010 08 12 - 1,480 - - - 2,630 - - < 10 - - 67 - 1,350 455 - - - - - - - 60 - 0.016
GL26-1 GL26-1-20091112 2009 11 12 - 654 - - - - - - - - - - - - - - - - - - - - - - -GL26-1-20100812 2010 08 12 - 527 - - - 1,230 - - 30 - - 8.9 - 309 706 - - - - - - - 10 - 0.005GL30-5-20100812 Duplicate - 575 - - - 1,250 - - 50 - - 8.8 - 306 705 - - - - - - - 10 - 0.005
QA/QC RPD% - 9 - - - 2 - - 50 - - 1 - 1 0 - - - - - - - * - 0GL26-2 GL26-2-20091116 2009 11 16 - 629 - - - - - - - - - - - - - - - - - - - - - - -
GL26-2-20100812 2010 08 12 - 491 - - - 1,210 - - < 10 - - 15.5 - 346 655 - - - - - - - 20 - 0.013GL26-2-20110629 2011 06 29 - 634 - - - 1,160 - - < 10 - - 14.8 - 357 644 - - - - - - - < 10 - 0.108GL26-2-20120625 2012 06 25 - 670 - - - 1,210 - - 30 - - 18.3 - 367 644 - - - - - - - 20 - 0.006GL26-2-20121204 2012 12 04 - 572 - - - 1,200 - - 100 < 100 - 14.9 - 357 643 - - - - - - - 23 - < 0.002
GL26-2-20130626 2013 06 26 - 673 - - - 1,170 - - 62.7 120 - 15 1,380 410 666 - - - - < 1.0 - - < 20 - -
GL26-2-20131114 2013 11 14 - 639 - - - 1,160 - - 68.3 < 50 - 19.3 1,320 417 818 - - - - < 0.50 - - < 20 - -
GL26-2-20140605 2014 06 05 - 665 - - - 1,130 - - 52 < 50 - 14.3 1,170 400 782 - - - - < 0.50 - - < 20 - 0.0021
DUP2-20140605 Duplicate - 668 - - - 1,130 - - 58.7 < 50 - 14.2 1,170 396 816 - - - - < 0.50 - - < 20 - 0.0014
QA/QC RPD% - 0 - - - 0 - - 12 * - 1 0 1 4 - - - - * - - * - *
GL26-2-20141117 2014 11 17 - 638 - - - 1,120 - - 50.8 < 100 - 20 1,160 403 830 - - - - < 1.0 - - < 20 - 0.0023
GL26-2-20150608 2015 06 08 7.58 643 - - - 1,120 - - 80.2 99 - 19.1 1,170 406 735 - - - - < 0.50 - - < 20 - 0.0096
GL26-2-20151104 2015 11 04 7.73 617 - - - 1,170 - - 62.4 < 50 - 13.6 1,170 388 613 - - - - < 0.50 - - < 20 - < 0.0010
GL26-3 GL26-3-20091111 2009 11 11 - 682 - - - - - - - - - - - - - - - - - - - - - - -
GL26-3-20100812 2010 08 12 - 538 - - - 1,500 - - < 10 - - 62 - 499 604 - - - - - - - 20 - 0.03
Associated CARO files available upon request.
Associated Exova file(s): 712940, 714233, 714243, 756693, 756810, 757047, 811364, 811710, 812030, 812741, 812985, 813438, 846260, 878316, 879073, 909346, 909448, 909654.
All terms defined within the body of SNC-Lavalin's report.
< Denotes concentration less than indicated detection limit or RPD less than indicated value.a Laboratory detection limit exceeds regulatory standard/guideline.
- Denotes analysis not conducted.b Standard to protect freshwater aquatic life.
n/a Denotes no applicable standard/guideline.c Guideline to protect irrigation water. Guideline for surface water, shown here for comparison purposes only.
QA/QC RPD Denotes quality assurance/quality control relative percent differenced Guideline to protect freshwater aquatic life, long-term average (i.e. "chronic"). Guideline for surface water, shown here for comparison purposes only.
* RPDs are not calculated where one or more concentrations are less than five times RDL.e Guideline to protect freshwater aquatic life, short-term maximum (i.e. "acute"). Guideline for surface water, shown here for comparison purposes only.
RDL Denotes reported detection limit.f Standard varies with pH.g Standard varies with Chloride.
BOLD Concentration greater than CSR Aquatic Life (AW) standardh guideline varies with pH and temperature.
SHADED Concentration greater than CSR Irrigation Watering (IW) standardi guideline varies with hardness
RED Concentration greater than BCWQG Irrigation Water (IW) guidelinej Conductivity guidelines varies with crop. Guideline range 700-5,000, most stringent guideline for low tolerance crops applied (strawberry, raspberry, bean and carrot.
BLUE SHADED Concentration greater than BCWQG Aquatic Life Long-Term Average (AW) guideline
BLUE SHADED Concentration greater than BCWQG Aquatic Life Short-term Maximum (AW) guideline
SNC-LAVALIN INC. Page 14 of 20
662036 / 2021 02 0920210309_662036_TAB_Historical.xlsx
QAQC CN 2021 03 09

TABLE V.1: Historical Summary of Analytical Results for Groundwater - Inorganics
Physical Parameters Dissolved Inorganics
Sample Sample Sample Date pH
To
tal H
ard
ness
pH
(fi
eld
)
Co
nd
ucti
vit
y
Fie
ld C
on
du
cti
vit
y
To
tal D
isso
lved
So
lid
s
Dis
so
lved
Org
an
ic
Carb
on
Ph
osp
hate
Am
mo
nia
, T
ota
l (a
s
N)
Nit
rate
(as N
)
Nit
rite
(as N
)
Ch
lori
de
Flu
ori
de
Su
lfate
To
tal A
lkali
nit
y
Alk
ali
nit
y,
Bic
arb
on
ate
(as
CaC
O3)
Alk
ali
nit
y, C
arb
on
ate
(as C
aC
O3)
Alk
ali
nit
y, H
yd
roxid
e
(as C
aC
O3)
Alk
ali
nit
y,
Ph
en
olp
hth
ale
in
(as C
aC
O3)
Bro
mid
e
Hyd
rog
en
Su
lfid
e
Su
lfid
e
Ch
em
ical O
xyg
en
Dem
an
d
Dis
so
lved
Ph
osp
hate
Ort
ho
-Ph
osp
hate
Location ID (yyyy mm dd) pH mg/L pH µS/cm µS/cm mg/L mg/L mg/L µg/L µg/L µg/L mg/L µg/L mg/L mg/L mg/L mg/L mg/L mg/L mg/L mg/L mg/L mg/L mg/L mg/LBC Guideline
CSR Aquatic Life (AW)b n/a n/a n/a n/a n/a n/a n/a n/a 1,310-18,500
f 400,000 800-2,000g 1,500 2,000-3,000
i1,280-4,290
i n/a n/a n/a n/a n/a n/a 0.02 n/a n/a n/a n/a
CSR Irrigation Watering (IW) n/a n/a n/a n/a n/a n/a n/a n/a n/a n/a n/a 100 1,000 n/a n/a n/a n/a n/a n/a n/a n/a n/a n/a n/a n/a
BCWQG Irrigation Water (IW)c 5.0 - 9.0 n/a 5.0 - 9.0 700-5,000
j700-5,000
j n/a n/a n/a n/a n/a n/a 100 2,000 n/a n/a n/a n/a n/a n/a n/a n/a n/a n/a n/a n/a
BCWQG Aquatic Life Long-Term Average (AW)d 6.5 - 9.0 n/a 6.5 - 9.0 n/a n/a n/a n/a n/a 135-1,780
h 3,000 80-200 150 n/a 128-429i n/a n/a n/a n/a n/a n/a n/a n/a n/a n/a n/a
BCWQG Aquatic Life Short-term Maximum (AW)e 6.5 - 9.0 n/a 6.5 - 9.0 n/a n/a n/a n/a n/a 700-24,500
h 32,800 (max) 240-600 600 400 - 1,876 n/a n/a n/a n/a n/a n/a n/a 0.002 n/a n/a n/a n/a
GL27-1 GL27-1-20091116 2009 11 16 - 94 - - - - - - - - - - - - - - - - - - - - - - -
GL27-1-20100812 2010 08 12 - 67 - - - 1,650 - - 210 - - 68 - 57 1,580 - - - - - - - 10 - 0.041
GL27-1-20110629 2011 06 29 - 88 - - - 1,600 - - 70 - - 44 - 70 161 - - - - - - - < 10 - 0.165GL 27-1-20120626 2012 06 26 - 94 - - - 1,660 - - 70 - - 36.5 - 8 1,600 - - - - - - - 20 - -GL 27-1-20120704 2012 07 04 - - - - - - - - - - - - - - - - - - - - - - - - 0.121GL27-1-20121204 2012 12 04 - 73 - - - 1,670 - - 100 < 100 - 39.8 - 6.3 1,570 - - - - - - - 18 - 0.128
GL27-1-20130626 2013 06 26 - 88.4 - - - 1,730 - - 126 < 100 - 37 3,540 < 10 1,550 - - - - < 1.0 - - < 20 - -
GL27-1-20131113 2013 11 13 - 93.5 - - - 1,630 - - 107 < 100 - 41 3,400 < 10 1,500 - - - - - - - < 20 - -
GL27-1-20140605 2014 06 05 - 94.4 - - - 1,630 - - 126 < 100 - 38 3,420 < 10 1,560 - - - - < 1.0 - - < 20 - 0.12
GL27-1-20141118 2014 11 18 - 86.8 - - - 1,640 - - 171 < 100 - 39 3,280 < 10 1,640 - - - - < 1.0 - - 38 - 0.115
GL27-1-20150610 2015 06 10 8.41 87.1 - - - 1,470 - - 122 < 100 - 38 3,250 < 6.0 1,590 - - - - < 1.0 - - < 20 - 0.102
GL27-1-20151104 2015 11 04 8.18 86.6 - - - 1,610 - - 180 < 100 - 36 3,080 < 6.0 1,500 - - - - < 1.0 - - < 20 - 0.0954
GL27-1-20160526 2016 05 26 8.27 91.8 - - - 1,620 - - 116 < 100 - 38 3,450 < 6.0 1,500 - - - - < 1.0 - - < 20 - 0.0886
DUP-1-20160526 Duplicate 8.31 85.7 - - - 1,690 - - 111 < 100 - 38 3,490 < 6.0 1,480 - - - - < 1.0 - - < 20 - 0.0902
QA/QC RPD% 0 7 - - - 4 - - 4 * - 0 1 * 1 - - - - * - - * - 2
GL27-1-20160919 2016 09 19 8.34 90.8 - - - 1,630 - - 152 < 100 - 36 3,000 < 6.0 1,530 - - - - < 1.0 - - < 20 - 0.112
GL27-1-20170525 2017 05 25 8.83 95.2 - - - 1,640 - - 70.1 < 100 - 38 3,310 6 1,560 - - - - < 1.0 - - < 20 - 0.0674
GL27-1-20170925 2017 09 25 8.14 92 - - - 1,650 - - 155 < 100 - 32 3,260 6.6 1,450 - - - - < 1.0 - - < 20 - 0.0553
GL27-1-180815 2018 08 15 7.98 89.6 7.63 - 1,870 1,680 2.57 0.0407 276 18 < 10 33.6 3,100 27.5 1,500 1,500 < 1.0 < 1.0 < 1.0 < 0.10 - - < 20 0.0407 -
GL27-1-180919 2018 09 19 7.91 99.9 7.62 - 2,388 1,620 3.45 0.0445 220 < 10 < 10 35.1 3,210 19.2 1,450 1,450 < 1.0 < 1.0 < 1.0 < 0.10 - - < 20 0.0445 -
GL27-1-190527 2019 05 27 8.20 90.6 7.67 - 2,620 1,430 2.89 0.0794 272 < 10 < 10 36.2 3,020 21.8 1,480 1,480 < 1.0 < 1.0 < 1.0 < 0.10 - - < 20 0.0794 -
GL27-1-190919 2019 09 19 8.22 92.8 7.48 - 2,471 1,610 2.84 - 242 < 10 < 10 35.6 3,290 19.9 1,490 1,490 < 1.0 < 1.0 < 1.0 < 0.10 - - < 20 - 0.0424
GL27-1-200608 2020 06 08 8.31 93.2 7.5 - 2,216 1,530 2.12 - 230 < 10 < 10 35.5 3,060 17.0 1,500 1,480 22.6 < 1.0 11.3 < 0.10 - - < 20 - < 0.0050
GL27-1-201022 2020 10 22 8.10 85.2 7.63 - 2,525 1,600 2.79 - 243 < 10 < 10 37.7 3,330 7.8 1,420 1,420 < 1.0 < 1.0 < 1.0 < 0.10 - - < 20 - 0.0567
GL27-2 GL27-1-20111217 2011 12 17 - 83 - - - 1,630 - - 80 < 50 - 40.1 - 20.4 1,500 - - - - - - - 10 - 0.08GL27-2-20091116 2009 11 16 - 3,760 - - - - - - - - - - - - - - - - - - - - - - -
GL27-2-20100812 2010 08 12 - 3,540 - - - 14,300 - - 290 - - 740 - 6,590 708 - - - - - - - 130 - 0.057
GL27-3 GL27-3-20091112 2009 11 12 - 5,800 - - - - - - - - - - - - - - - - - - - - - - -
GL27-3-20100812 2010 08 12 - 4,700 - - - 17,800 - - 500 - - 800 - 8,490 645 - - - - - - - 60 - 0.007
GL27-3-20110629 2011 06 29 - 5,170 - - - 16,700 - - 470 - - 610 - 9,700 639 - - - - - - - 30 - 0.268
GL27-3-20111217 2011 12 17 - 4,500 - - - 17,100 - - 410 < 200 - 582 - 10,900 653 - - - - - - - 40 - 0.04
GL27-3-20120625 2012 06 25 - 5,060 - - - 16,400 - - 520 - - 543 - 9,620 638 - - - - - - - 70 - 0.003
GL27-3-20121204 2012 12 04 - 4,480 - - - 15,900 - - 660 < 1,000 - 502 - 9,230 626 - - - - - - - 62 - 0.002
GL27-3-20130626 2013 06 26 - 5,280 - - - 17,200 - - 730 < 500 - 589 1,300 11,100 864 - - - - < 5.0 - - 53 - -
GL27-3-20131113 2013 11 13 - 4,890 - - - 16,200 - - 552 < 500 - 577 1,390 9,840 876 - - - - - - - 31 - -
GL27-3-20140605 2014 06 05 - 5,120 - - - 16,300 - - 564 < 250 - 586 < 1,000 10,600 967 - - - - 4 - - 47 - 0.0024
GL27-3-20141118 2014 11 18 - 4,560 - - - 13,300 - - 416 < 500 - 545 1,200 9,930 947 - - - - < 5.0 - - 38 - 0.0055
Associated CARO files available upon request.
Associated Exova file(s): 712940, 714233, 714243, 756693, 756810, 757047, 811364, 811710, 812030, 812741, 812985, 813438, 846260, 878316, 879073, 909346, 909448, 909654.
All terms defined within the body of SNC-Lavalin's report.
< Denotes concentration less than indicated detection limit or RPD less than indicated value.a Laboratory detection limit exceeds regulatory standard/guideline.
- Denotes analysis not conducted.b Standard to protect freshwater aquatic life.
n/a Denotes no applicable standard/guideline.c Guideline to protect irrigation water. Guideline for surface water, shown here for comparison purposes only.
QA/QC RPD Denotes quality assurance/quality control relative percent differenced Guideline to protect freshwater aquatic life, long-term average (i.e. "chronic"). Guideline for surface water, shown here for comparison purposes only.
* RPDs are not calculated where one or more concentrations are less than five times RDL.e Guideline to protect freshwater aquatic life, short-term maximum (i.e. "acute"). Guideline for surface water, shown here for comparison purposes only.
RDL Denotes reported detection limit.f Standard varies with pH.g Standard varies with Chloride.
BOLD Concentration greater than CSR Aquatic Life (AW) standardh guideline varies with pH and temperature.
SHADED Concentration greater than CSR Irrigation Watering (IW) standardi guideline varies with hardness
RED Concentration greater than BCWQG Irrigation Water (IW) guidelinej Conductivity guidelines varies with crop. Guideline range 700-5,000, most stringent guideline for low tolerance crops applied (strawberry, raspberry, bean and carrot.
BLUE SHADED Concentration greater than BCWQG Aquatic Life Long-Term Average (AW) guideline
BLUE SHADED Concentration greater than BCWQG Aquatic Life Short-term Maximum (AW) guideline
SNC-LAVALIN INC. Page 15 of 20
662036 / 2021 02 0920210309_662036_TAB_Historical.xlsx
QAQC CN 2021 03 09

TABLE V.1: Historical Summary of Analytical Results for Groundwater - Inorganics
Physical Parameters Dissolved Inorganics
Sample Sample Sample Date pH
To
tal H
ard
ness
pH
(fi
eld
)
Co
nd
ucti
vit
y
Fie
ld C
on
du
cti
vit
y
To
tal D
isso
lved
So
lid
s
Dis
so
lved
Org
an
ic
Carb
on
Ph
osp
hate
Am
mo
nia
, T
ota
l (a
s
N)
Nit
rate
(as N
)
Nit
rite
(as N
)
Ch
lori
de
Flu
ori
de
Su
lfate
To
tal A
lkali
nit
y
Alk
ali
nit
y,
Bic
arb
on
ate
(as
CaC
O3)
Alk
ali
nit
y, C
arb
on
ate
(as C
aC
O3)
Alk
ali
nit
y, H
yd
roxid
e
(as C
aC
O3)
Alk
ali
nit
y,
Ph
en
olp
hth
ale
in
(as C
aC
O3)
Bro
mid
e
Hyd
rog
en
Su
lfid
e
Su
lfid
e
Ch
em
ical O
xyg
en
Dem
an
d
Dis
so
lved
Ph
osp
hate
Ort
ho
-Ph
osp
hate
Location ID (yyyy mm dd) pH mg/L pH µS/cm µS/cm mg/L mg/L mg/L µg/L µg/L µg/L mg/L µg/L mg/L mg/L mg/L mg/L mg/L mg/L mg/L mg/L mg/L mg/L mg/L mg/LBC Guideline
CSR Aquatic Life (AW)b n/a n/a n/a n/a n/a n/a n/a n/a 1,310-18,500
f 400,000 800-2,000g 1,500 2,000-3,000
i1,280-4,290
i n/a n/a n/a n/a n/a n/a 0.02 n/a n/a n/a n/a
CSR Irrigation Watering (IW) n/a n/a n/a n/a n/a n/a n/a n/a n/a n/a n/a 100 1,000 n/a n/a n/a n/a n/a n/a n/a n/a n/a n/a n/a n/a
BCWQG Irrigation Water (IW)c 5.0 - 9.0 n/a 5.0 - 9.0 700-5,000
j700-5,000
j n/a n/a n/a n/a n/a n/a 100 2,000 n/a n/a n/a n/a n/a n/a n/a n/a n/a n/a n/a n/a
BCWQG Aquatic Life Long-Term Average (AW)d 6.5 - 9.0 n/a 6.5 - 9.0 n/a n/a n/a n/a n/a 135-1,780
h 3,000 80-200 150 n/a 128-429i n/a n/a n/a n/a n/a n/a n/a n/a n/a n/a n/a
BCWQG Aquatic Life Short-term Maximum (AW)e 6.5 - 9.0 n/a 6.5 - 9.0 n/a n/a n/a n/a n/a 700-24,500
h 32,800 (max) 240-600 600 400 - 1,876 n/a n/a n/a n/a n/a n/a n/a 0.002 n/a n/a n/a n/a
GL27-3 GL27-3-20150610 2015 06 10 8.07 4,990 - - - 17,900 - - 615 < 500 - 600 < 2,000a 11,100 840 - - - - < 5.0 - - 44 - 0.0015
(cont'd) GL27-3-20151104 2015 11 04 7.88 4,380 - - - 16,000 - - 487 < 500 - 557 < 2,000a 10,400 624 - - - - < 5.0 - - 33 - 0.0043
GL27-3-20160524 2016 05 24 7.85 4,850 - - - 16,200 - - 582 < 500 - 620 < 2,000a 11,400 604 604 < 1.0 < 1.0 - < 5.0 - - 27 - 0.0025
GL27-3-20170925 2017 09 25 7.82 5,080 - - - 15,200 - - 600 < 500 - 543 < 2,000a 10,500 601 - - - - < 5.0 - - 31 - 0.0027
GL27-3-180815 2018 08 15 7.71 5,450 7.91 - 9,589 18,000 9.12 < 0.500 589 < 1,000 < 1,000a 516 970 10,200 622 622 < 1.0 < 1.0 < 1.0 < 10.0 - - < 20 < 0.500 -
GL27-3-190527 2019 05 27 7.90 5,350 7.45 - 16,199 13,500 7.11 < 0.500 57 1,470 < 1,000a 475 < 10,000
a 9,330 610 610 < 1.0 < 1.0 < 1.0 < 10.0 - - < 20 < 0.500 -
GL27-3-200608 2020 06 08 7.88 5,540 7.3 - 15,172 18,200 6.30 - 806 6,600 < 5,000a 442 < 50,000
a 10,400 586 586 < 1.0 < 1.0 < 1.0 < 50.0 - - 21 - < 2.50
GL27-4 GL27-4-20100812 2010 08 12 - 4,380 - - - 13,400 - - 14,000 - - 780 - 4,900 3,370 - - - - - - - 360 - 4.76
GL28-1 GL28-1-20091116 2009 11 16 - 1,680 - - - - - - - - - - - - - - - - - - - - - - -GL30-5-20091116 Duplicate - 1,720 - - - - - - - - - - - - - - - - - - - - - - -
QA/QC RPD% - 2 - - - - - - - - - - - - - - - - - - - - - - -
GL28-1-20100812 2010 08 12 - 1,600 - - - 3,990 - - 210 - - 64 - 1,840 655 - - - - - - - 20 - 0.009
GL28-1-20110627 2011 06 27 - 944 - - - 3,060 - - < 10 - - 27 - 1,700 346 - - - - - - - 10 - 0.009
GL28-1-20120626 2012 06 26 - 550 - - - 1,610 - - 130 - - 11.3 - 954 139 - - - - - - - < 10 - 0.003
GL28-1-20121203 2012 12 03 - 1,680 - - - 3,870 - - 220 < 100 - 38.7 - 2,240 649 - - - - - - - 18 - < 0.002
DUP-A-20121203 Duplicate - 1,700 - - - 3,830 - - 170 < 100 - 39.4 - 2,240 647 - - - - - - - 33 - < 0.002
QA/QC RPD% - 1 - - - 1 - - 26 * - 2 - 0 0 - - - - - - - * - *
GL28-1-20130708 2013 07 08 - 1,740 - - - 3,530 - - 175 < 100 - 28 680 1,510 368 - - - - < 1.0 - - < 20 - -
DUP1-20130708 Duplicate - 1,740 - - - 4,220 - - 178 < 100 - 34 890 1,890 619 - - - - < 1.0 - - < 20 - -
QA/QC RPD% - 0 - - - 18 - - 2 * - 19 27 22 51 - - - - * - - * - -
GL28-1-20140603 2014 06 03 - 1,600 - - - 3,930 - - 162 < 250 - 59 1,100 2,230 778 - - - - < 2.5 - - 53 - < 0.0010
GL28-1-20141117 2014 11 17 - 1,690 - - - 3,970 - - 165 130 - 53 1,070 2,270 897 - - - - < 1.0 - - < 20 - < 0.0010
GL28-1-20150611 2015 06 11 7.93 1,630 - - - 3,920 - - 166 < 100 - 48 1,110 2,270 730 - - - - < 1.0 - - 30 - < 0.0010
GL28-1-20151105 2015 11 05 7.65 1,600 - - - 3,930 - - 170 < 100 - 50 1,150 2,280 626 626 < 1.0 < 1.0 - < 1.0 - - 46 - < 0.0010
GL28-1-20160524 2016 05 24 7.97 1,710 - - - 3,950 - - 179 < 100 - 67 1,510 2,950 624 624 < 1.0 < 1.0 - < 1.0 - - < 20 - < 0.0010
GL28-1-20160920 2016 09 20 7.69 1,740 - - - 4,080 - - 173 < 100 - 54 1,220 2,380 612 - - - - < 1.0 - - < 20 - 0.0014
GL28-1-20170711 2017 07 11 8.21 1,620 - - - 3,740 - - 163 < 100 - 50 1,160 2,270 579 - - - - < 1.0 - - < 20 - < 0.0010
GL28-1-20170926 2017 09 26 7.67 1,620 - - - 3,460 - - 145 < 100 - 48 1,110 2,190 554 - - - - < 1.0 - - < 20 - < 0.0010
GL28-1-180528 2018 05 28 7.72 1,710 6.99 - 3,741 3,730 4.85 < 0.0050 122 1,480 < 10 45.0 700 2,040 551 551 < 1.0 < 1.0 < 1.0 < 10.0 - - < 20 < 0.0050 -
GL28-1-180925 2018 09 25 7.72 1,750 7.21 - 3,761 3,770 4.88 < 0.0050 163 < 1,000 < 10 41.8 960 2,150 531 531 < 1.0 < 1.0 < 1.0 < 0.10 - - < 20 < 0.0050 -
DUP1-180925 Duplicate 7.73 1,730 7.21 - 3,761 3,930 4.81 < 0.0050 176 < 1,000 < 10 40.5 1,000 2,220 528 528 < 1.0 < 1.0 < 1.0 < 0.10 - - < 20 < 0.0050 -
QA/QC RPD% 0 1 * - * 4 1 * 8 * * 3 4 3 1 1 * * * * - - * * -
GL28-1-190528 2019 05 28 7.81 1,690 7.12 - 3,741 3,650 4.74 < 0.0500 236 < 100 < 100 38.3 1,100 2,060 531 531 < 1.0 < 1.0 < 1.0 < 1.00 - - < 20 < 0.0500 -
GL28-1-190919 2019 09 19 7.78 1,650 7.39 - 3,802 3,470 4.47 - 98 < 100 < 100 40.6 1,010 2,010 521 521 < 1.0 < 1.0 < 1.0 < 1.00 - - < 20 - < 0.0500
GL28-1-200610 2020 06 10 7.71 1,770 7.15 - 3,321 3,300 4.43 - 120 < 100 < 100 37.8 < 1,000 2,080 554 554 < 1.0 < 1.0 < 1.0 < 1.00 - - < 20 - < 0.0500
DUPB-200610 Duplicate 7.75 1,630 7.15 - 3,321 3,680 3.83 - 124 < 100 < 100 38.1 < 1,000 2,140 544 544 < 1.0 < 1.0 < 1.0 < 1.00 - - < 20 - < 0.0500
QA/QC RPD% 1 8 * - * 11 15 - * * * 1 * 3 2 2 * * * * - - * - *
Associated CARO files available upon request.
Associated Exova file(s): 712940, 714233, 714243, 756693, 756810, 757047, 811364, 811710, 812030, 812741, 812985, 813438, 846260, 878316, 879073, 909346, 909448, 909654.
All terms defined within the body of SNC-Lavalin's report.
< Denotes concentration less than indicated detection limit or RPD less than indicated value.a Laboratory detection limit exceeds regulatory standard/guideline.
- Denotes analysis not conducted.b Standard to protect freshwater aquatic life.
n/a Denotes no applicable standard/guideline.c Guideline to protect irrigation water. Guideline for surface water, shown here for comparison purposes only.
QA/QC RPD Denotes quality assurance/quality control relative percent differenced Guideline to protect freshwater aquatic life, long-term average (i.e. "chronic"). Guideline for surface water, shown here for comparison purposes only.
* RPDs are not calculated where one or more concentrations are less than five times RDL.e Guideline to protect freshwater aquatic life, short-term maximum (i.e. "acute"). Guideline for surface water, shown here for comparison purposes only.
RDL Denotes reported detection limit.f Standard varies with pH.g Standard varies with Chloride.
BOLD Concentration greater than CSR Aquatic Life (AW) standardh guideline varies with pH and temperature.
SHADED Concentration greater than CSR Irrigation Watering (IW) standardi guideline varies with hardness
RED Concentration greater than BCWQG Irrigation Water (IW) guidelinej Conductivity guidelines varies with crop. Guideline range 700-5,000, most stringent guideline for low tolerance crops applied (strawberry, raspberry, bean and carrot.
BLUE SHADED Concentration greater than BCWQG Aquatic Life Long-Term Average (AW) guideline
BLUE SHADED Concentration greater than BCWQG Aquatic Life Short-term Maximum (AW) guideline
SNC-LAVALIN INC. Page 16 of 20
662036 / 2021 02 0920210309_662036_TAB_Historical.xlsx
QAQC CN 2021 03 09

TABLE V.1: Historical Summary of Analytical Results for Groundwater - Inorganics
Physical Parameters Dissolved Inorganics
Sample Sample Sample Date pH
To
tal H
ard
ness
pH
(fi
eld
)
Co
nd
ucti
vit
y
Fie
ld C
on
du
cti
vit
y
To
tal D
isso
lved
So
lid
s
Dis
so
lved
Org
an
ic
Carb
on
Ph
osp
hate
Am
mo
nia
, T
ota
l (a
s
N)
Nit
rate
(as N
)
Nit
rite
(as N
)
Ch
lori
de
Flu
ori
de
Su
lfate
To
tal A
lkali
nit
y
Alk
ali
nit
y,
Bic
arb
on
ate
(as
CaC
O3)
Alk
ali
nit
y, C
arb
on
ate
(as C
aC
O3)
Alk
ali
nit
y, H
yd
roxid
e
(as C
aC
O3)
Alk
ali
nit
y,
Ph
en
olp
hth
ale
in
(as C
aC
O3)
Bro
mid
e
Hyd
rog
en
Su
lfid
e
Su
lfid
e
Ch
em
ical O
xyg
en
Dem
an
d
Dis
so
lved
Ph
osp
hate
Ort
ho
-Ph
osp
hate
Location ID (yyyy mm dd) pH mg/L pH µS/cm µS/cm mg/L mg/L mg/L µg/L µg/L µg/L mg/L µg/L mg/L mg/L mg/L mg/L mg/L mg/L mg/L mg/L mg/L mg/L mg/L mg/LBC Guideline
CSR Aquatic Life (AW)b n/a n/a n/a n/a n/a n/a n/a n/a 1,310-18,500
f 400,000 800-2,000g 1,500 2,000-3,000
i1,280-4,290
i n/a n/a n/a n/a n/a n/a 0.02 n/a n/a n/a n/a
CSR Irrigation Watering (IW) n/a n/a n/a n/a n/a n/a n/a n/a n/a n/a n/a 100 1,000 n/a n/a n/a n/a n/a n/a n/a n/a n/a n/a n/a n/a
BCWQG Irrigation Water (IW)c 5.0 - 9.0 n/a 5.0 - 9.0 700-5,000
j700-5,000
j n/a n/a n/a n/a n/a n/a 100 2,000 n/a n/a n/a n/a n/a n/a n/a n/a n/a n/a n/a n/a
BCWQG Aquatic Life Long-Term Average (AW)d 6.5 - 9.0 n/a 6.5 - 9.0 n/a n/a n/a n/a n/a 135-1,780
h 3,000 80-200 150 n/a 128-429i n/a n/a n/a n/a n/a n/a n/a n/a n/a n/a n/a
BCWQG Aquatic Life Short-term Maximum (AW)e 6.5 - 9.0 n/a 6.5 - 9.0 n/a n/a n/a n/a n/a 700-24,500
h 32,800 (max) 240-600 600 400 - 1,876 n/a n/a n/a n/a n/a n/a n/a 0.002 n/a n/a n/a n/a
GL28-1 GL28-1-201104 2020 11 04 7.82 1,850 7.14 - 4,082 3,840 6.24 - 128 < 1,000 < 10 46.9 1,020 2,240 516 516 < 1.0 < 1.0 < 1.0 < 10.0 - - < 20 - < 0.0050
(cont'd) DUP3-201104 Duplicate 7.80 1,850 - - - 3,450 6.09 - 127 < 1,000 < 10 46.3 1,000 2,190 515 515 < 1.0 < 1.0 < 1.0 < 10.0 - - < 20 - < 0.0050
QA/QC RPD% 0 0 - - - 11 2 - * * * 1 2 2 0 0 * * * * - - * - *GL28-2 GL28-2-20091116 2009 11 16 - 1,530 - - - - - - - - - - - - - - - - - - - - - - -
GL28-2-20160524 2016 05 24 7.72 1,840 - - - 4,530 - - 5.1 11,200 - 46 < 1,000 2,870 696 696 < 1.0 < 1.0 - < 2.5 - - < 20 - 0.0082
GL28-2-20160920 2016 09 20 7.5 1,810 - - - 4,760 - - < 5.0 12,100 - 49 < 1,000 2,760 693 - - - - < 2.5 - - < 20 - 0.0097
DUP1-20160920 Duplicate 7.51 3,610 - - - 4,750 - - < 5.0 12,000 - 48 < 1,000 2,740 693 - - - - < 2.5 - - < 20 - 0.0089
QA/QC RPD% 0 66 - - - 0 - - * 1 - 2 * 1 0 - - - - * - - * - 9
GL28-2-20170711 2017 07 11 8.03 1,680 - - - 4,400 - - < 5.0 13,100 - 47 < 400 2,590 671 - - - - < 1.0 - - < 20 - 0.0093
GL28-2-20170926 2017 09 26 7.48 1,920 - - - 4,640 - - < 5.0 12,100 - 50 < 400 2,840 670 - - - - < 1.0 - - < 20 - 0.0095
GL28-2-180528 2018 05 28 7.42 1,900 6.77 - 4,680 4,730 6.09 < 0.0050 24 8,440 < 10 44.0 110 2,690 686 686 < 1.0 < 1.0 < 1.0 < 10.0 - - < 20 < 0.0050 -
DUP1-180528 Duplicate 7.51 1,860 6.77 - 4,680 4,960 6.55 < 0.0050 27 8,560 < 1,000a 44.5 100 2,690 709 709 < 1.0 < 1.0 < 1.0 < 10.0 - - < 20 < 0.0050 -
QA/QC RPD% 1 2 * - * 5 7 * * 1 * 1 * 0 3 3 * * * * - - * * -
GL28-2-180925 2018 09 25 7.60 2,280 6.97 - 5,093 5,370 8.34 < 0.0050 63 9,480 < 10 44.2 140 3,160 700 700 < 1.0 < 1.0 < 1.0 < 0.10 - - 24 < 0.0050 -
GL28-2-190528 2019 05 28 7.70 2,170 6.97 - 5,200 5,280 6.36 < 0.0500 24 11,600 < 100 48.6 < 1,000 2,830 723 723 < 1.0 < 1.0 < 1.0 < 1.00 - - < 20 < 0.0500 -
GL28-2-190919 2019 09 19 7.64 2,030 7.24 - 5,225 5,380 5.96 - 48 10,600 < 100 51.7 < 1,000 2,790 700 700 < 1.0 < 1.0 < 1.0 < 1.00 - - < 20 - < 0.0500
GL28-2-200610 2020 06 10 7.66 1,730 6.95 - 3,882 4,250 4.99 - < 50 9,190 < 100 32.0 < 1,000 2,490 587 587 < 1.0 < 1.0 < 1.0 < 1.00 - - < 20 - < 0.0500
GL28-2-201104 2020 11 04 7.70 2,200 6.9 - 5,499 4,790 6.26 - < 50 9,400 < 10 42.9 130 3,020 677 677 < 1.0 < 1.0 < 1.0 < 0.10 - - < 20 - < 0.0050
GL28-3 GL28-3-20091116 2009 11 16 - 1,760 - - - - - - - - - - - - - - - - - - - - - - -
GL28-3-20100812 2010 08 12 - 1,580 - - - 4,230 - - < 10 - - 60 - 1,950 702 - - - - - - - 30 - 0.038
GL28-3-20160524 2016 05 24 7.52 2,740 - - - 6,310 - - < 5.0 2,380 - 48 < 1,000 4,070 782 782 < 1.0 < 1.0 - < 2.5 - - < 20 - 0.018
GL28-3-20160920 2016 09 20 7.57 1,280 - - - 6,550 - - < 5.0 < 250 - 49 < 1,000 4,140 858 - - - - < 2.5 - - 20 - 0.0332
GL28-3-20170711 2017 07 11 8.13 2,480 - - - 6,160 - - 8.4 690 - 48 < 1,000 4,000 840 - - - - < 2.5 - - < 20 - 0.0373
GL28-3-20170926 2017 09 26 7.6 2,520 - - - 6,150 - - < 5.0 1,120 - 49 < 400 4,100 807 - - - - < 1.0 - - < 20 - 0.0358
GL28-3-180528 2018 05 28 7.51 2,770 6.8 - 6,392 7,280 10.3 < 0.0050 29 5,640 < 10 45.9 230 3,780 870 870 < 1.0 < 1.0 < 1.0 < 10.0 - - 23 < 0.0050 -
GL28-3-180925 2018 09 25 7.60 3,080 7 - 6,777 7,490 12.1 < 0.0050 76 7,780 47 49.6 280 4,350 827 827 < 1.0 < 1.0 < 1.0 < 0.10 - - 35 < 0.0050 -
GL28-3-190528 2019 05 28 7.78 2,880 7 - 6,743 6,780 8.29 < 0.0500 40 5,880 < 100 49.4 < 1,000 4,040 846 846 < 1.0 < 1.0 < 1.0 < 1.00 - - < 20 < 0.0500 -
DUP2-190528 Duplicate 7.63 2,830 7 - 6,743 7,120 7.97 < 0.0500 44 6,130 < 100 62.1 < 1,000 4,170 855 855 < 1.0 < 1.0 < 1.0 < 1.00 - - < 20 < 0.0500 -
QA/QC RPD% 2 2 * - 5 4 * 10 4 * 23 * 3 1 1 * * * * - - * * -
GL28-3-190919 2019 09 19 7.65 2,790 7.19 - 6,895 7,490 8.62 - 26 4,180 < 100 51.7 < 1,000 4,100 865 865 < 1.0 < 1.0 < 1.0 < 1.00 - - < 20 - < 0.0500
DUP1-190919 Duplicate 7.78 2,830 7.19 - 6,895 7,330 8.84 - 37 4,000 < 100 48.8 < 1,000 3,900 844 844 < 1.0 < 1.0 < 1.0 < 1.00 - - < 20 - < 0.0500
QA/QC RPD% 2 1 * - * 2 3 - 35 4 * 6 * 5 2 2 * * * * - - * - *
GL28-3-200610 2020 06 10 7.67 2,890 6.92 - 630.3 7,680 9.25 - < 50 5,160 < 100 56.6 < 1,000 4,550 864 864 < 1.0 < 1.0 < 1.0 < 1.00 - - 26 - < 0.0500
GL28-3-201105 2020 11 05 7.75 2,870 6.96 - 277.6 7,810 9.33 - < 50 5,150 18 49.4 280 4,500 839 839 < 1.0 < 1.0 < 1.0 < 10.0 - - < 20 - < 0.0050
Associated CARO files available upon request.
Associated Exova file(s): 712940, 714233, 714243, 756693, 756810, 757047, 811364, 811710, 812030, 812741, 812985, 813438, 846260, 878316, 879073, 909346, 909448, 909654.
All terms defined within the body of SNC-Lavalin's report.
< Denotes concentration less than indicated detection limit or RPD less than indicated value.a Laboratory detection limit exceeds regulatory standard/guideline.
- Denotes analysis not conducted.b Standard to protect freshwater aquatic life.
n/a Denotes no applicable standard/guideline.c Guideline to protect irrigation water. Guideline for surface water, shown here for comparison purposes only.
QA/QC RPD Denotes quality assurance/quality control relative percent differenced Guideline to protect freshwater aquatic life, long-term average (i.e. "chronic"). Guideline for surface water, shown here for comparison purposes only.
* RPDs are not calculated where one or more concentrations are less than five times RDL.e Guideline to protect freshwater aquatic life, short-term maximum (i.e. "acute"). Guideline for surface water, shown here for comparison purposes only.
RDL Denotes reported detection limit.f Standard varies with pH.g Standard varies with Chloride.
BOLD Concentration greater than CSR Aquatic Life (AW) standardh guideline varies with pH and temperature.
SHADED Concentration greater than CSR Irrigation Watering (IW) standardi guideline varies with hardness
RED Concentration greater than BCWQG Irrigation Water (IW) guidelinej Conductivity guidelines varies with crop. Guideline range 700-5,000, most stringent guideline for low tolerance crops applied (strawberry, raspberry, bean and carrot.
BLUE SHADED Concentration greater than BCWQG Aquatic Life Long-Term Average (AW) guideline
BLUE SHADED Concentration greater than BCWQG Aquatic Life Short-term Maximum (AW) guideline
SNC-LAVALIN INC. Page 17 of 20
662036 / 2021 02 0920210309_662036_TAB_Historical.xlsx
QAQC CN 2021 03 09

TABLE V.1: Historical Summary of Analytical Results for Groundwater - Inorganics
Physical Parameters Dissolved Inorganics
Sample Sample Sample Date pH
To
tal H
ard
ness
pH
(fi
eld
)
Co
nd
ucti
vit
y
Fie
ld C
on
du
cti
vit
y
To
tal D
isso
lved
So
lid
s
Dis
so
lved
Org
an
ic
Carb
on
Ph
osp
hate
Am
mo
nia
, T
ota
l (a
s
N)
Nit
rate
(as N
)
Nit
rite
(as N
)
Ch
lori
de
Flu
ori
de
Su
lfate
To
tal A
lkali
nit
y
Alk
ali
nit
y,
Bic
arb
on
ate
(as
CaC
O3)
Alk
ali
nit
y, C
arb
on
ate
(as C
aC
O3)
Alk
ali
nit
y, H
yd
roxid
e
(as C
aC
O3)
Alk
ali
nit
y,
Ph
en
olp
hth
ale
in
(as C
aC
O3)
Bro
mid
e
Hyd
rog
en
Su
lfid
e
Su
lfid
e
Ch
em
ical O
xyg
en
Dem
an
d
Dis
so
lved
Ph
osp
hate
Ort
ho
-Ph
osp
hate
Location ID (yyyy mm dd) pH mg/L pH µS/cm µS/cm mg/L mg/L mg/L µg/L µg/L µg/L mg/L µg/L mg/L mg/L mg/L mg/L mg/L mg/L mg/L mg/L mg/L mg/L mg/L mg/LBC Guideline
CSR Aquatic Life (AW)b n/a n/a n/a n/a n/a n/a n/a n/a 1,310-18,500
f 400,000 800-2,000g 1,500 2,000-3,000
i1,280-4,290
i n/a n/a n/a n/a n/a n/a 0.02 n/a n/a n/a n/a
CSR Irrigation Watering (IW) n/a n/a n/a n/a n/a n/a n/a n/a n/a n/a n/a 100 1,000 n/a n/a n/a n/a n/a n/a n/a n/a n/a n/a n/a n/a
BCWQG Irrigation Water (IW)c 5.0 - 9.0 n/a 5.0 - 9.0 700-5,000
j700-5,000
j n/a n/a n/a n/a n/a n/a 100 2,000 n/a n/a n/a n/a n/a n/a n/a n/a n/a n/a n/a n/a
BCWQG Aquatic Life Long-Term Average (AW)d 6.5 - 9.0 n/a 6.5 - 9.0 n/a n/a n/a n/a n/a 135-1,780
h 3,000 80-200 150 n/a 128-429i n/a n/a n/a n/a n/a n/a n/a n/a n/a n/a n/a
BCWQG Aquatic Life Short-term Maximum (AW)e 6.5 - 9.0 n/a 6.5 - 9.0 n/a n/a n/a n/a n/a 700-24,500
h 32,800 (max) 240-600 600 400 - 1,876 n/a n/a n/a n/a n/a n/a n/a 0.002 n/a n/a n/a n/a
GL29-1 GL29-1-20130708 2013 07 08 - 444 - - - 1,160 - - 216 < 100 - 24 1,000 186 910 - - - - < 1.0 - - < 20 - -
GL29-1-20131113 2013 11 13 - 493 - - - 1,280 - - 219 < 100 - 36 1,190 356 836 - - - - - - - < 20 - -
DUP3-20131113 Duplicate - 495 - - - 1,240 - - 206 < 100 - 37 1,180 358 750 - - - - - - - < 20 - -
QA/QC RPD% - 0 - - - 3 - - 6 * - 3 1 1 11 - - - - - - - * - -
GL29-1-20140603 2014 06 03 - 516 - - - 1,430 - - 135 < 100 - 48 1,240 514 764 - - - - < 1.0 - - < 20 - 0.0088
GL29-1-20141118 2014 11 18 - 699 - - - 1,950 - - 253 < 100 - 74 1,230 958 708 - - - - < 1.0 - - 37 - 0.002
GL29-1-20150609 2015 06 09 8.12 629 - - - 1,900 - - 244 < 25 - 63.5 1,200 804 692 - - - - 0.29 - - 27 - 0.0097
GL29-1-20151105 2015 11 05 7.85 671 - - - 1,780 - - 226 < 100 - 72 1,210 785 579 - - - - < 1.0 - - 74 - 0.0161
GL29-1-20160524 2016 05 24 7.94 682 - - - 1,650 - - 61 640 - 77 1,220 667 593 593 < 1.0 < 1.0 - < 1.0 - - 116 - 0.0187
GL29-1-20160921 2016 09 21 8.08 639 - - - 1,590 - - 32.2 260 - 67 1,230 573 586 - - - - < 1.0 - - 110 - 0.0231
GL29-1-20170529 2017 05 29 8.1 586 - - - 1,300 - - 20.6 1,100 - 57.9 1,130 408 642 - - - - < 0.50 - - 90 - 0.0199
GL29-1-20170926 2017 09 26 7.88 542 - - - 1,290 - - 15.3 415 - 51.6 1,240 389 644 - - - - < 0.50 - - 72 - 0.0243
DUP1-20170926 Duplicate 7.88 539 - - - 1,330 - - 17.9 383 - 53.1 1,240 401 645 - - - - < 0.50 - - 72 - 0.0243
QA/QC RPD% 0 1 - - - 3 - - * 8 - 3 0 3 0 - - - - * - - 0 - 0
GL29-1-180604 2018 06 04 7.71 659 7.24 - 1,240 1,220 118 0.0343 166 26,900 < 10 58.1 310 161 450 450 < 1.0 < 1.0 < 1.0 < 0.10 - - 321 0.0343 -
GL29-1-180919 2018 09 19 7.70 683 7.38 - 1,389 1,190 93.7 < 0.0050 137 23,800 88 63.8 470 181 463 463 < 1.0 < 1.0 < 1.0 < 0.10 - - 302 < 0.0050 -
GL29-1-190603 2019 06 03 7.76 467 7.06 - 1,715 1,160 12.8 < 0.0500 192 < 10 < 10 23.3 1,030 176 885 885 < 1.0 < 1.0 < 1.0 < 0.10 - - 21 < 0.0500 -
GL29-1-190924 2019 09 24 7.89 448 7 - 1,731 1,160 11.1 - 102 < 10 < 10 29.7 1,180 211 820 820 < 1.0 < 1.0 < 1.0 < 0.10 - - 25 - < 0.0050
GL29-1-200612 2020 06 12 7.04 421 7.01 - 1,380 1,110 6.25 - 199 < 100 < 100 21.8 < 1,000 185 758 - - - - < 1.00 - - 31 - < 0.0500
GL29-1-201120 2020 11 20 7.84 442 7.07 - 1,723 1,050 3.16 - 230 < 10 < 10 22.9 1,290 172 814 814 < 1.0 < 1.0 < 1.0 < 0.10 - - < 20 - < 0.0050
GL29-2 GL29-2-20130627 2013 06 27 - 2,830 - - - 7,910 - - 67.9 < 250 - 243 2,200 5,020 335 - - - - < 2.5 - - 69 - -
GL29-2-20131113 2013 11 13 - 2,910 - - - 7,890 - - 99.1 < 250 - 252 1,400 4,820 351 - - - - - - - 53 - -
GL31-1 GL31-3-20130627 2013 06 27 - 4,240 - - - 15,300 - - 2,300 < 500 - 863 600 8,470 2,810 - - - - < 5.0 - - 85 - -
GL31-3-20141126 2014 11 26 - 4,280 - - - 14,700 - - 2,500 1,210 - 866 416 8,360 2,620 - - - - < 5.0 - - 63 - 0.0085
GL31-3 BH 11-18C-20120627 2012 06 27 - 4,600 - - - 15,500 - - 2,300 - - 821 - 7,800 2,580 - - - - - - - 80 - 0.013
GL31-3-20121205 2012 12 05 - 4,470 - - - 15,400 - - 2,450 < 10,000a - 569 - 3,820 2,560 - - - - - - - 39 - 0.004
GL31-3-20131114 2013 11 14 - 4,310 - - - 15,800 - - 2,240 < 500 - 875 393 8,510 2,700 - - - - < 5.0 - - 58 - -
GL31-3-20140609 2014 06 09 - 4,420 - - - 14,900 - - 2,460 < 250 - 833 < 1,000 8,070 2,780 - - - - 4 - - 60 - 0.0049
GL31-3-20150611 2015 06 11 7.83 4,460 - - - 13,400 - - 2,490 < 500 - 839 < 2,000a 8,140 2,920 - - - - < 5.0 - - 62 - 0.0046
GL31-3-20151109 2015 11 09 7.55 4,060 - - - 15,200 - - 2,640 < 500 - 857 < 2,000a 8,440 2,590 - - - - < 5.0 - - 34 - 0.0076
DUP4-20151109 Duplicate 7.5 4,060 - - - 15,200 - - 2,380 < 500 - 861 < 2,000a 8,460 2,600 - - - - < 5.0 - - 33 - 0.0094
QA/QC RPD% 1 0 - - - 0 - - 10 * - 0 * 0 0 - - - - * - - * - 21
Associated CARO files available upon request.
Associated Exova file(s): 712940, 714233, 714243, 756693, 756810, 757047, 811364, 811710, 812030, 812741, 812985, 813438, 846260, 878316, 879073, 909346, 909448, 909654.
All terms defined within the body of SNC-Lavalin's report.
< Denotes concentration less than indicated detection limit or RPD less than indicated value.a Laboratory detection limit exceeds regulatory standard/guideline.
- Denotes analysis not conducted.b Standard to protect freshwater aquatic life.
n/a Denotes no applicable standard/guideline.c Guideline to protect irrigation water. Guideline for surface water, shown here for comparison purposes only.
QA/QC RPD Denotes quality assurance/quality control relative percent differenced Guideline to protect freshwater aquatic life, long-term average (i.e. "chronic"). Guideline for surface water, shown here for comparison purposes only.
* RPDs are not calculated where one or more concentrations are less than five times RDL.e Guideline to protect freshwater aquatic life, short-term maximum (i.e. "acute"). Guideline for surface water, shown here for comparison purposes only.
RDL Denotes reported detection limit.f Standard varies with pH.g Standard varies with Chloride.
BOLD Concentration greater than CSR Aquatic Life (AW) standardh guideline varies with pH and temperature.
SHADED Concentration greater than CSR Irrigation Watering (IW) standardi guideline varies with hardness
RED Concentration greater than BCWQG Irrigation Water (IW) guidelinej Conductivity guidelines varies with crop. Guideline range 700-5,000, most stringent guideline for low tolerance crops applied (strawberry, raspberry, bean and carrot.
BLUE SHADED Concentration greater than BCWQG Aquatic Life Long-Term Average (AW) guideline
BLUE SHADED Concentration greater than BCWQG Aquatic Life Short-term Maximum (AW) guideline
SNC-LAVALIN INC. Page 18 of 20
662036 / 2021 02 0920210309_662036_TAB_Historical.xlsx
QAQC CN 2021 03 09
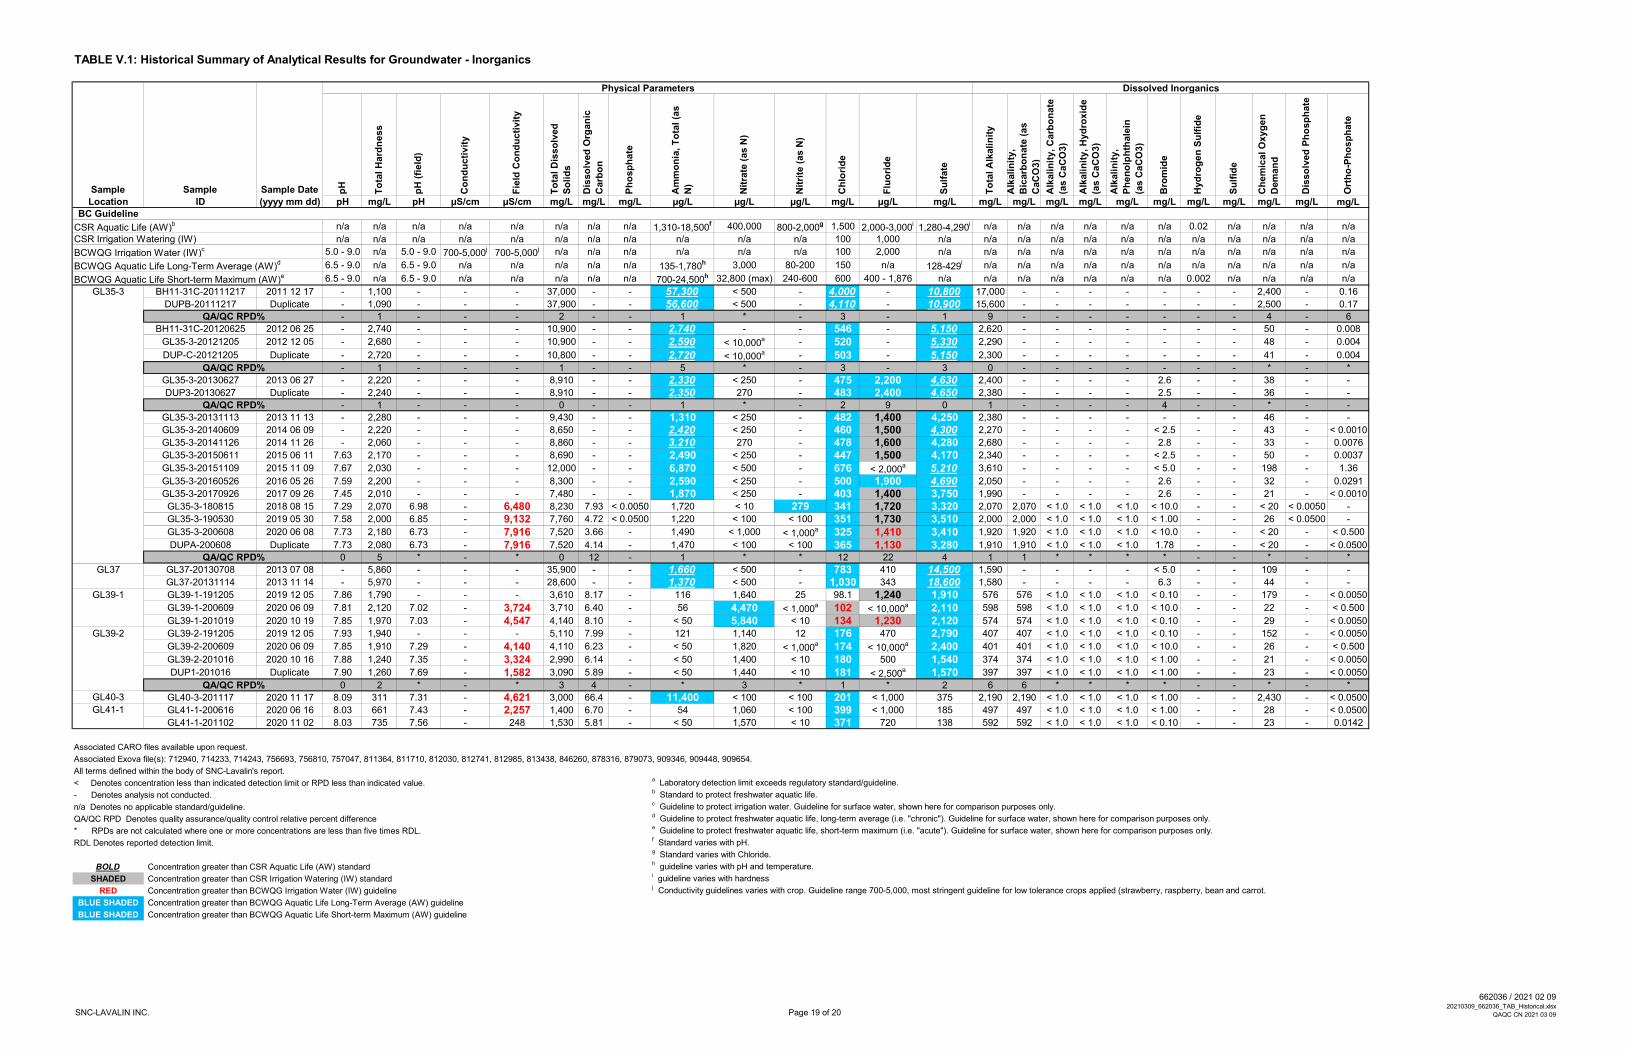
TABLE V.1: Historical Summary of Analytical Results for Groundwater - Inorganics
Physical Parameters Dissolved Inorganics
Sample Sample Sample Date pH
To
tal H
ard
ness
pH
(fi
eld
)
Co
nd
ucti
vit
y
Fie
ld C
on
du
cti
vit
y
To
tal D
isso
lved
So
lid
s
Dis
so
lved
Org
an
ic
Carb
on
Ph
osp
hate
Am
mo
nia
, T
ota
l (a
s
N)
Nit
rate
(as N
)
Nit
rite
(as N
)
Ch
lori
de
Flu
ori
de
Su
lfate
To
tal A
lkali
nit
y
Alk
ali
nit
y,
Bic
arb
on
ate
(as
CaC
O3)
Alk
ali
nit
y, C
arb
on
ate
(as C
aC
O3)
Alk
ali
nit
y, H
yd
roxid
e
(as C
aC
O3)
Alk
ali
nit
y,
Ph
en
olp
hth
ale
in
(as C
aC
O3)
Bro
mid
e
Hyd
rog
en
Su
lfid
e
Su
lfid
e
Ch
em
ical O
xyg
en
Dem
an
d
Dis
so
lved
Ph
osp
hate
Ort
ho
-Ph
osp
hate
Location ID (yyyy mm dd) pH mg/L pH µS/cm µS/cm mg/L mg/L mg/L µg/L µg/L µg/L mg/L µg/L mg/L mg/L mg/L mg/L mg/L mg/L mg/L mg/L mg/L mg/L mg/L mg/LBC Guideline
CSR Aquatic Life (AW)b n/a n/a n/a n/a n/a n/a n/a n/a 1,310-18,500
f 400,000 800-2,000g 1,500 2,000-3,000
i1,280-4,290
i n/a n/a n/a n/a n/a n/a 0.02 n/a n/a n/a n/a
CSR Irrigation Watering (IW) n/a n/a n/a n/a n/a n/a n/a n/a n/a n/a n/a 100 1,000 n/a n/a n/a n/a n/a n/a n/a n/a n/a n/a n/a n/a
BCWQG Irrigation Water (IW)c 5.0 - 9.0 n/a 5.0 - 9.0 700-5,000
j700-5,000
j n/a n/a n/a n/a n/a n/a 100 2,000 n/a n/a n/a n/a n/a n/a n/a n/a n/a n/a n/a n/a
BCWQG Aquatic Life Long-Term Average (AW)d 6.5 - 9.0 n/a 6.5 - 9.0 n/a n/a n/a n/a n/a 135-1,780
h 3,000 80-200 150 n/a 128-429i n/a n/a n/a n/a n/a n/a n/a n/a n/a n/a n/a
BCWQG Aquatic Life Short-term Maximum (AW)e 6.5 - 9.0 n/a 6.5 - 9.0 n/a n/a n/a n/a n/a 700-24,500
h 32,800 (max) 240-600 600 400 - 1,876 n/a n/a n/a n/a n/a n/a n/a 0.002 n/a n/a n/a n/a
GL35-3 BH11-31C-20111217 2011 12 17 - 1,100 - - - 37,000 - - 57,300 < 500 - 4,000 - 10,800 17,000 - - - - - - - 2,400 - 0.16
DUPB-20111217 Duplicate - 1,090 - - - 37,900 - - 56,600 < 500 - 4,110 - 10,900 15,600 - - - - - - - 2,500 - 0.17
QA/QC RPD% - 1 - - - 2 - - 1 * - 3 - 1 9 - - - - - - - 4 - 6
BH11-31C-20120625 2012 06 25 - 2,740 - - - 10,900 - - 2,740 - - 546 - 5,150 2,620 - - - - - - - 50 - 0.008
GL35-3-20121205 2012 12 05 - 2,680 - - - 10,900 - - 2,590 < 10,000a - 520 - 5,330 2,290 - - - - - - - 48 - 0.004
DUP-C-20121205 Duplicate - 2,720 - - - 10,800 - - 2,720 < 10,000a - 503 - 5,150 2,300 - - - - - - - 41 - 0.004
QA/QC RPD% - 1 - - - 1 - - 5 * - 3 - 3 0 - - - - - - - * - *
GL35-3-20130627 2013 06 27 - 2,220 - - - 8,910 - - 2,330 < 250 - 475 2,200 4,630 2,400 - - - - 2.6 - - 38 - -
DUP3-20130627 Duplicate - 2,240 - - - 8,910 - - 2,350 270 - 483 2,400 4,650 2,380 - - - - 2.5 - - 36 - -
QA/QC RPD% - 1 - - - 0 - - 1 * - 2 9 0 1 - - - - 4 - - * - -
GL35-3-20131113 2013 11 13 - 2,280 - - - 9,430 - - 1,310 < 250 - 482 1,400 4,250 2,380 - - - - - - - 46 - -
GL35-3-20140609 2014 06 09 - 2,220 - - - 8,650 - - 2,420 < 250 - 460 1,500 4,300 2,270 - - - - < 2.5 - - 43 - < 0.0010
GL35-3-20141126 2014 11 26 - 2,060 - - - 8,860 - - 3,210 270 - 478 1,600 4,280 2,680 - - - - 2.8 - - 33 - 0.0076
GL35-3-20150611 2015 06 11 7.63 2,170 - - - 8,690 - - 2,490 < 250 - 447 1,500 4,170 2,340 - - - - < 2.5 - - 50 - 0.0037
GL35-3-20151109 2015 11 09 7.67 2,030 - - - 12,000 - - 6,870 < 500 - 676 < 2,000a 5,210 3,610 - - - - < 5.0 - - 198 - 1.36
GL35-3-20160526 2016 05 26 7.59 2,200 - - - 8,300 - - 2,590 < 250 - 500 1,900 4,690 2,050 - - - - 2.6 - - 32 - 0.0291
GL35-3-20170926 2017 09 26 7.45 2,010 - - - 7,480 - - 1,870 < 250 - 403 1,400 3,750 1,990 - - - - 2.6 - - 21 - < 0.0010
GL35-3-180815 2018 08 15 7.29 2,070 6.98 - 6,480 8,230 7.93 < 0.0050 1,720 < 10 279 341 1,720 3,320 2,070 2,070 < 1.0 < 1.0 < 1.0 < 10.0 - - < 20 < 0.0050 -
GL35-3-190530 2019 05 30 7.58 2,000 6.85 - 9,132 7,760 4.72 < 0.0500 1,220 < 100 < 100 351 1,730 3,510 2,000 2,000 < 1.0 < 1.0 < 1.0 < 1.00 - - 26 < 0.0500 -
GL35-3-200608 2020 06 08 7.73 2,180 6.73 - 7,916 7,520 3.66 - 1,490 < 1,000 < 1,000a 325 1,410 3,410 1,920 1,920 < 1.0 < 1.0 < 1.0 < 10.0 - - < 20 - < 0.500
DUPA-200608 Duplicate 7.73 2,080 6.73 - 7,916 7,520 4.14 - 1,470 < 100 < 100 365 1,130 3,280 1,910 1,910 < 1.0 < 1.0 < 1.0 1.78 - - < 20 - < 0.0500
QA/QC RPD% 0 5 * - * 0 12 - 1 * * 12 22 4 1 1 * * * * - - * - *
GL37 GL37-20130708 2013 07 08 - 5,860 - - - 35,900 - - 1,660 < 500 - 783 410 14,500 1,590 - - - - < 5.0 - - 109 - -
GL37-20131114 2013 11 14 - 5,970 - - - 28,600 - - 1,370 < 500 - 1,030 343 18,600 1,580 - - - - 6.3 - - 44 - -
GL39-1 GL39-1-191205 2019 12 05 7.86 1,790 - - - 3,610 8.17 - 116 1,640 25 98.1 1,240 1,910 576 576 < 1.0 < 1.0 < 1.0 < 0.10 - - 179 - < 0.0050
GL39-1-200609 2020 06 09 7.81 2,120 7.02 - 3,724 3,710 6.40 - 56 4,470 < 1,000a 102 < 10,000a 2,110 598 598 < 1.0 < 1.0 < 1.0 < 10.0 - - 22 - < 0.500
GL39-1-201019 2020 10 19 7.85 1,970 7.03 - 4,547 4,140 8.10 - < 50 5,840 < 10 134 1,230 2,120 574 574 < 1.0 < 1.0 < 1.0 < 0.10 - - 29 - < 0.0050
GL39-2 GL39-2-191205 2019 12 05 7.93 1,940 - - - 5,110 7.99 - 121 1,140 12 176 470 2,790 407 407 < 1.0 < 1.0 < 1.0 < 0.10 - - 152 - < 0.0050
GL39-2-200609 2020 06 09 7.85 1,910 7.29 - 4,140 4,110 6.23 - < 50 1,820 < 1,000a 174 < 10,000a 2,400 401 401 < 1.0 < 1.0 < 1.0 < 10.0 - - 26 - < 0.500
GL39-2-201016 2020 10 16 7.88 1,240 7.35 - 3,324 2,990 6.14 - < 50 1,400 < 10 180 500 1,540 374 374 < 1.0 < 1.0 < 1.0 < 1.00 - - 21 - < 0.0050
DUP1-201016 Duplicate 7.90 1,260 7.69 - 1,582 3,090 5.89 - < 50 1,440 < 10 181 < 2,500a 1,570 397 397 < 1.0 < 1.0 < 1.0 < 1.00 - - 23 - < 0.0050
QA/QC RPD% 0 2 * - * 3 4 - * 3 * 1 * 2 6 6 * * * * - - * - *GL40-3 GL40-3-201117 2020 11 17 8.09 311 7.31 - 4,621 3,000 66.4 - 11,400 < 100 < 100 201 < 1,000 375 2,190 2,190 < 1.0 < 1.0 < 1.0 < 1.00 - - 2,430 - < 0.0500
GL41-1 GL41-1-200616 2020 06 16 8.03 661 7.43 - 2,257 1,400 6.70 - 54 1,060 < 100 399 < 1,000 185 497 497 < 1.0 < 1.0 < 1.0 < 1.00 - - 28 - < 0.0500
GL41-1-201102 2020 11 02 8.03 735 7.56 - 248 1,530 5.81 - < 50 1,570 < 10 371 720 138 592 592 < 1.0 < 1.0 < 1.0 < 0.10 - - 23 - 0.0142
Associated CARO files available upon request.
Associated Exova file(s): 712940, 714233, 714243, 756693, 756810, 757047, 811364, 811710, 812030, 812741, 812985, 813438, 846260, 878316, 879073, 909346, 909448, 909654.
All terms defined within the body of SNC-Lavalin's report.
< Denotes concentration less than indicated detection limit or RPD less than indicated value.a Laboratory detection limit exceeds regulatory standard/guideline.
- Denotes analysis not conducted.b Standard to protect freshwater aquatic life.
n/a Denotes no applicable standard/guideline.c Guideline to protect irrigation water. Guideline for surface water, shown here for comparison purposes only.
QA/QC RPD Denotes quality assurance/quality control relative percent differenced Guideline to protect freshwater aquatic life, long-term average (i.e. "chronic"). Guideline for surface water, shown here for comparison purposes only.
* RPDs are not calculated where one or more concentrations are less than five times RDL.e Guideline to protect freshwater aquatic life, short-term maximum (i.e. "acute"). Guideline for surface water, shown here for comparison purposes only.
RDL Denotes reported detection limit.f Standard varies with pH.g Standard varies with Chloride.
BOLD Concentration greater than CSR Aquatic Life (AW) standardh guideline varies with pH and temperature.
SHADED Concentration greater than CSR Irrigation Watering (IW) standardi guideline varies with hardness
RED Concentration greater than BCWQG Irrigation Water (IW) guidelinej Conductivity guidelines varies with crop. Guideline range 700-5,000, most stringent guideline for low tolerance crops applied (strawberry, raspberry, bean and carrot.
BLUE SHADED Concentration greater than BCWQG Aquatic Life Long-Term Average (AW) guideline
BLUE SHADED Concentration greater than BCWQG Aquatic Life Short-term Maximum (AW) guideline
SNC-LAVALIN INC. Page 19 of 20
662036 / 2021 02 0920210309_662036_TAB_Historical.xlsx
QAQC CN 2021 03 09
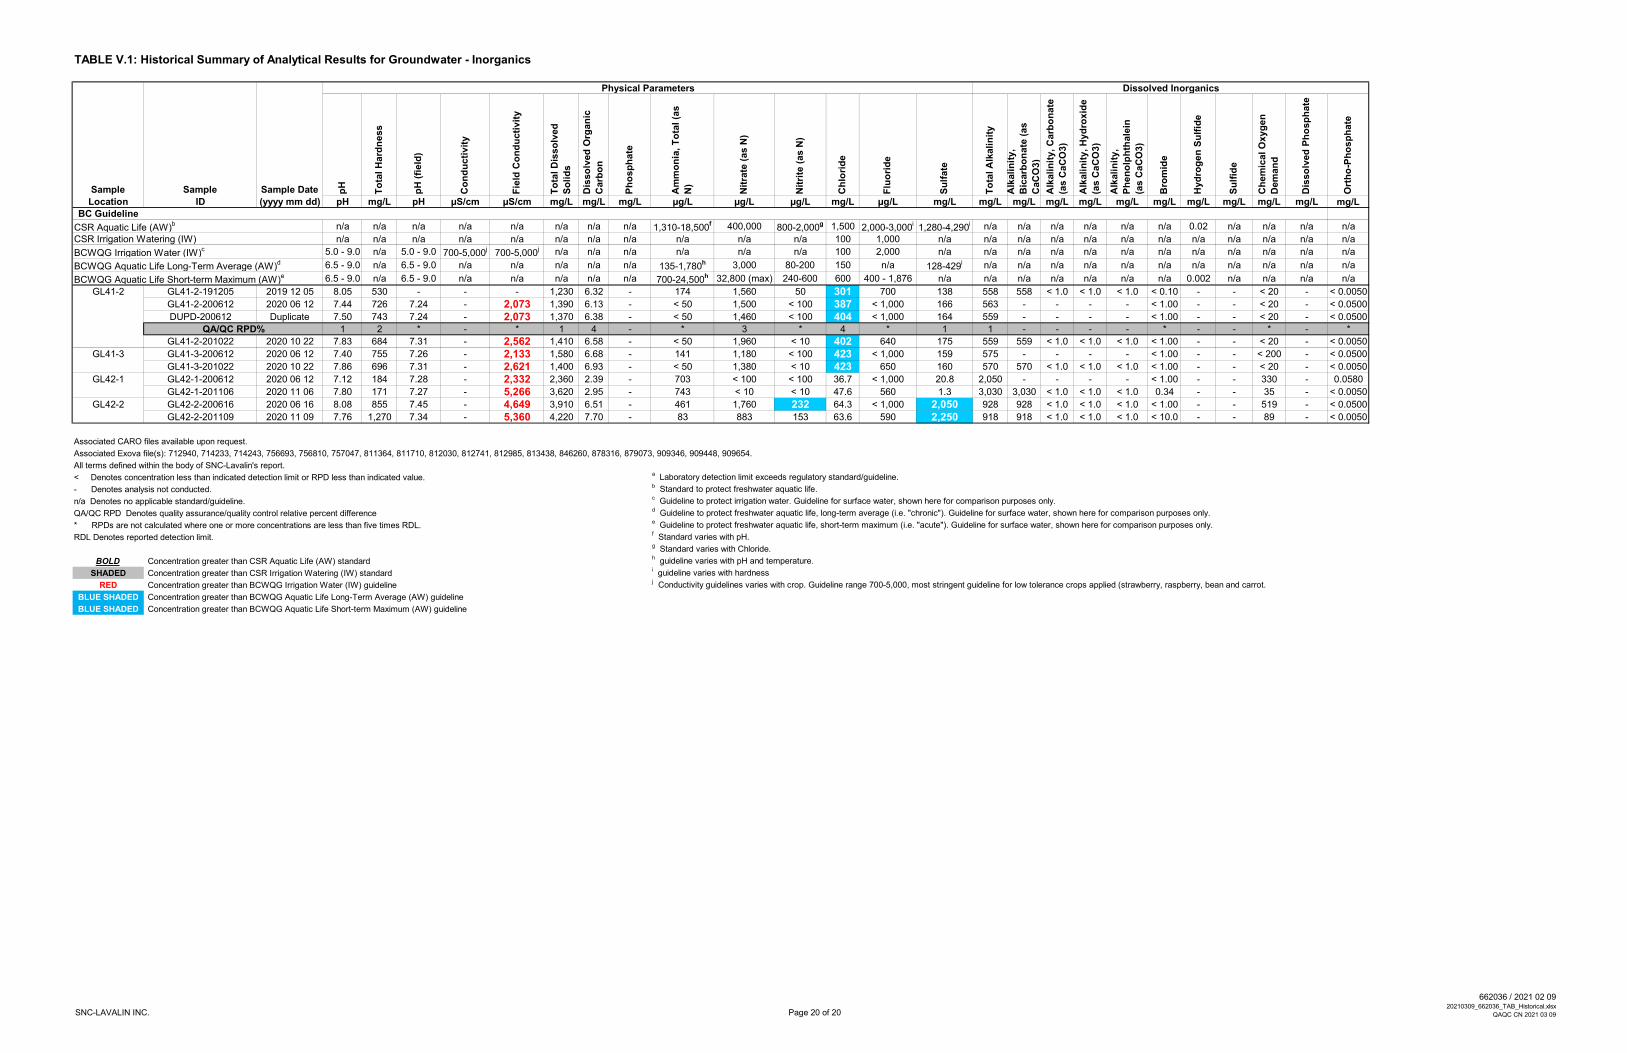
TABLE V.1: Historical Summary of Analytical Results for Groundwater - Inorganics
Physical Parameters Dissolved Inorganics
Sample Sample Sample Date pH
To
tal H
ard
ness
pH
(fi
eld
)
Co
nd
ucti
vit
y
Fie
ld C
on
du
cti
vit
y
To
tal D
isso
lved
So
lid
s
Dis
so
lved
Org
an
ic
Carb
on
Ph
osp
hate
Am
mo
nia
, T
ota
l (a
s
N)
Nit
rate
(as N
)
Nit
rite
(as N
)
Ch
lori
de
Flu
ori
de
Su
lfate
To
tal A
lkali
nit
y
Alk
ali
nit
y,
Bic
arb
on
ate
(as
CaC
O3)
Alk
ali
nit
y, C
arb
on
ate
(as C
aC
O3)
Alk
ali
nit
y, H
yd
roxid
e
(as C
aC
O3)
Alk
ali
nit
y,
Ph
en
olp
hth
ale
in
(as C
aC
O3)
Bro
mid
e
Hyd
rog
en
Su
lfid
e
Su
lfid
e
Ch
em
ical O
xyg
en
Dem
an
d
Dis
so
lved
Ph
osp
hate
Ort
ho
-Ph
osp
hate
Location ID (yyyy mm dd) pH mg/L pH µS/cm µS/cm mg/L mg/L mg/L µg/L µg/L µg/L mg/L µg/L mg/L mg/L mg/L mg/L mg/L mg/L mg/L mg/L mg/L mg/L mg/L mg/LBC Guideline
CSR Aquatic Life (AW)b n/a n/a n/a n/a n/a n/a n/a n/a 1,310-18,500
f 400,000 800-2,000g 1,500 2,000-3,000
i1,280-4,290
i n/a n/a n/a n/a n/a n/a 0.02 n/a n/a n/a n/a
CSR Irrigation Watering (IW) n/a n/a n/a n/a n/a n/a n/a n/a n/a n/a n/a 100 1,000 n/a n/a n/a n/a n/a n/a n/a n/a n/a n/a n/a n/a
BCWQG Irrigation Water (IW)c 5.0 - 9.0 n/a 5.0 - 9.0 700-5,000
j700-5,000
j n/a n/a n/a n/a n/a n/a 100 2,000 n/a n/a n/a n/a n/a n/a n/a n/a n/a n/a n/a n/a
BCWQG Aquatic Life Long-Term Average (AW)d 6.5 - 9.0 n/a 6.5 - 9.0 n/a n/a n/a n/a n/a 135-1,780
h 3,000 80-200 150 n/a 128-429i n/a n/a n/a n/a n/a n/a n/a n/a n/a n/a n/a
BCWQG Aquatic Life Short-term Maximum (AW)e 6.5 - 9.0 n/a 6.5 - 9.0 n/a n/a n/a n/a n/a 700-24,500
h 32,800 (max) 240-600 600 400 - 1,876 n/a n/a n/a n/a n/a n/a n/a 0.002 n/a n/a n/a n/a
GL41-2 GL41-2-191205 2019 12 05 8.05 530 - - - 1,230 6.32 - 174 1,560 50 301 700 138 558 558 < 1.0 < 1.0 < 1.0 < 0.10 - - < 20 - < 0.0050
GL41-2-200612 2020 06 12 7.44 726 7.24 - 2,073 1,390 6.13 - < 50 1,500 < 100 387 < 1,000 166 563 - - - - < 1.00 - - < 20 - < 0.0500
DUPD-200612 Duplicate 7.50 743 7.24 - 2,073 1,370 6.38 - < 50 1,460 < 100 404 < 1,000 164 559 - - - - < 1.00 - - < 20 - < 0.0500
QA/QC RPD% 1 2 * - * 1 4 - * 3 * 4 * 1 1 - - - - * - - * - *
GL41-2-201022 2020 10 22 7.83 684 7.31 - 2,562 1,410 6.58 - < 50 1,960 < 10 402 640 175 559 559 < 1.0 < 1.0 < 1.0 < 1.00 - - < 20 - < 0.0050
GL41-3 GL41-3-200612 2020 06 12 7.40 755 7.26 - 2,133 1,580 6.68 - 141 1,180 < 100 423 < 1,000 159 575 - - - - < 1.00 - - < 200 - < 0.0500
GL41-3-201022 2020 10 22 7.86 696 7.31 - 2,621 1,400 6.93 - < 50 1,380 < 10 423 650 160 570 570 < 1.0 < 1.0 < 1.0 < 1.00 - - < 20 - < 0.0050
GL42-1 GL42-1-200612 2020 06 12 7.12 184 7.28 - 2,332 2,360 2.39 - 703 < 100 < 100 36.7 < 1,000 20.8 2,050 - - - - < 1.00 - - 330 - 0.0580
GL42-1-201106 2020 11 06 7.80 171 7.27 - 5,266 3,620 2.95 - 743 < 10 < 10 47.6 560 1.3 3,030 3,030 < 1.0 < 1.0 < 1.0 0.34 - - 35 - < 0.0050
GL42-2 GL42-2-200616 2020 06 16 8.08 855 7.45 - 4,649 3,910 6.51 - 461 1,760 232 64.3 < 1,000 2,050 928 928 < 1.0 < 1.0 < 1.0 < 1.00 - - 519 - < 0.0500
GL42-2-201109 2020 11 09 7.76 1,270 7.34 - 5,360 4,220 7.70 - 83 883 153 63.6 590 2,250 918 918 < 1.0 < 1.0 < 1.0 < 10.0 - - 89 - < 0.0050
Associated CARO files available upon request.
Associated Exova file(s): 712940, 714233, 714243, 756693, 756810, 757047, 811364, 811710, 812030, 812741, 812985, 813438, 846260, 878316, 879073, 909346, 909448, 909654.
All terms defined within the body of SNC-Lavalin's report.
< Denotes concentration less than indicated detection limit or RPD less than indicated value.a Laboratory detection limit exceeds regulatory standard/guideline.
- Denotes analysis not conducted.b Standard to protect freshwater aquatic life.
n/a Denotes no applicable standard/guideline.c Guideline to protect irrigation water. Guideline for surface water, shown here for comparison purposes only.
QA/QC RPD Denotes quality assurance/quality control relative percent differenced Guideline to protect freshwater aquatic life, long-term average (i.e. "chronic"). Guideline for surface water, shown here for comparison purposes only.
* RPDs are not calculated where one or more concentrations are less than five times RDL.e Guideline to protect freshwater aquatic life, short-term maximum (i.e. "acute"). Guideline for surface water, shown here for comparison purposes only.
RDL Denotes reported detection limit.f Standard varies with pH.g Standard varies with Chloride.
BOLD Concentration greater than CSR Aquatic Life (AW) standardh guideline varies with pH and temperature.
SHADED Concentration greater than CSR Irrigation Watering (IW) standardi guideline varies with hardness
RED Concentration greater than BCWQG Irrigation Water (IW) guidelinej Conductivity guidelines varies with crop. Guideline range 700-5,000, most stringent guideline for low tolerance crops applied (strawberry, raspberry, bean and carrot.
BLUE SHADED Concentration greater than BCWQG Aquatic Life Long-Term Average (AW) guideline
BLUE SHADED Concentration greater than BCWQG Aquatic Life Short-term Maximum (AW) guideline
SNC-LAVALIN INC. Page 20 of 20
662036 / 2021 02 0920210309_662036_TAB_Historical.xlsx
QAQC CN 2021 03 09

TABLE V.2: Historical Summary of Analytical Results for Groundwater - Dissolved Metals
Physical Parameters Dissolved Metals
Sample Sample Sample Date pH
To
tal
Ha
rdn
ess
pH
(fi
eld
)
Co
nd
ucti
vit
y
Fie
ld
Co
nd
ucti
vit
y
To
tal
Dis
so
lve
d
So
lid
s
Dis
so
lve
d
Org
an
ic
Ca
rbo
n
Ph
osp
hate
Dis
so
lve
d
Alu
min
um
Dis
so
lve
d
Ca
lciu
m
Dis
so
lve
d Iro
n
Dis
so
lve
d
Mag
nes
ium
Dis
so
lve
d
Man
gan
ese
Dis
so
lve
d
Po
tass
ium
Dis
so
lve
d
So
diu
m
An
tim
on
y
Ars
en
ic
Ba
riu
m
Be
rylliu
m
Bo
ron
Ca
dm
ium
Ch
rom
ium
Co
ba
lt
Co
pp
er
Le
ad
Lit
hiu
m
Merc
ury
Mo
lyb
den
um
Nic
ke
l
Se
len
ium
Sil
ve
r
Str
on
tiu
m
Th
all
ium
Tin
Tit
an
ium
Tu
ng
ste
n
Ura
niu
m
Va
nad
ium
Zin
cf
Location ID (yyyy mm dd) pH mg/L pH µS/cm µS/cm mg/L mg/L mg/L µg/L mg/L µg/L mg/L µg/L mg/L mg/L µg/L µg/L µg/L µg/L µg/L µg/L µg/L µg/L µg/L µg/L µg/L µg/L µg/L µg/L µg/L µg/L µg/L µg/L µg/L µg/L µg/L µg/L µg/L µg/L
BC Guideline
CSR Aquatic Life (AW)b n/a n/a n/a n/a n/a n/a n/a n/a n/a n/a n/a n/a n/a n/a n/a 90 50 10,000 1.5 12,000 0.5-4k 10g 40 20-90k40-
160k n/a 0.25 10,000250-
1,500k 20 0.5-15k n/a 3 n/a 1,000 n/a 85 n/a
75-
2,400k
CSR Irrigation Watering (IW) n/a n/a n/a n/a n/a n/a n/a n/a 5,000 n/a 5,000h n/a 200h n/a n/a n/a 100 n/a 100 500 5 5g 50 200 200 2,500 1 10 200 20 n/a n/a n/a n/a n/a n/a 10 1001,000-
5,000j
BCWQG Irrigation Water (IW)c 5.0 - 9.0 n/a 5.0 - 9.0 700 - 5,000l 700 - 5,000l n/a n/a n/a n/a n/a n/a n/a n/a n/a n/a n/a n/a n/a n/a n/a n/a n/a n/a n/a n/a n/a n/a n/a n/a n/a n/a n/a n/a n/a n/a n/a n/a n/a n/a
BCWQG Aquatic Life Long-Term Average (AW)d 6.5 - 9.0 n/a 6.5 - 9.0 n/a n/a n/a n/a n/a 5 - 50 n/a n/a n/a n/a n/a n/a n/a n/a n/a n/a n/a 0.017 - 0.46 n/a n/a 0.2i n/a n/a n/a n/a n/a n/a n/a n/a n/a n/a n/a n/a n/a n/a n/a
BCWQG Aquatic Life Short-term Maximum (AW)e 6.5 - 9.0 n/a 6.5 - 9.0 n/a n/a n/a n/a n/a 20 - 100 n/a 350 (max) n/a n/a n/a n/a n/a n/a n/a n/a n/a 0.038 - 2.8 n/a n/a 0.2i n/a n/a n/a n/a n/a n/a n/a n/a n/a n/a n/a n/a n/a n/a n/a
09BH03 09BH03-20151105 2015 11 05 7.65 661 - - - 2,040 - - < 10 87.9 < 30 107 < 10 5 458 < 0.50 < 1.0 < 20 < 5.0a < 100 < 0.050 11.1 < 0.50 < 1.0a < 1.0 < 50 < 0.20 25.2 < 5.0 15.3 < 0.050 1,960 < 0.020 < 30 < 50 - 130 < 30 < 5.0
09BH03-20170601 2017 06 01 8.13 940 - - - 2,270 - - < 10 132 < 30 149 < 10 6.4 494 < 0.50 < 1.0 23 < 5.0a < 100 < 0.050 11.5 < 0.50 1.7 < 1.0 < 50 < 0.20 21.5 < 5.0 45.8 < 0.050 2,570 < 0.020 < 30 < 50 - 124 < 30 < 5.0
09BH03-180604 2018 06 04 7.53 1,130 6.87 - 3,665 2,800 7.39 0.0075 < 5.0 156 153 179 < 0.20 6.95 604 < 0.20 0.63 17.4 < 0.10 14.4 0.045 21.0 0.17 8.16 < 0.20 29.9 < 0.010 26.4 3.25 44.8 < 0.050 3,300 < 0.020 < 0.20 < 5.0 < 1.0 168 1.5 < 4.0
09BH03-190530 2019 05 30 7.80 929 6.81 - 3,120 2,460 5.85 0.0090 < 5.0 129 < 10 147 3.51 5.53 449 < 0.20 < 0.50 15.8 < 0.10 13.0 0.039 18.8 0.12 1.24 < 0.20 33.3 < 0.010 20.8 0.75 26.0 < 0.050 3,040 < 0.020 < 0.20 < 5.0 < 1.0 161 < 1.0 < 4.0
09BH03-200609 2020 06 09 7.80 1,270 7.04 - 3,178 3,020 7.88 - 1.2 184 < 2.0 197 0.089 7.9 92.3 0.064 0.500 24.1 < 0.010 13.3 0.0278 34.1 0.145 1.96 < 0.050 31.0 < 0.010 26.3 1.26 52.4 < 0.010 1,390 < 0.0040< 0.050 < 0.20 < 0.20 207 1.91 1.1
09BH04 09BH04-20151105 2015 11 05 7.19 1,120 - - - 2,730 - - < 10 147 10,100 183 681 14 617 < 0.50 5 30 < 5.0a < 100 < 0.050 < 0.50 1.12 < 1.0a < 1.0 252 < 0.20 14.9 < 5.0 < 1.0 < 0.050 3,080 < 0.020 < 30 < 50 - 48.5 < 30 < 5.0
09BH06-S 09BH06-S-20131112 2013 11 12 - 353 - - - 700 - - < 10a 56.5 131 51.4 146 4.3 125 < 0.50 2.2 32 < 5.0a < 100 < 0.050 < 0.50 < 0.50 < 1.0a < 1.0 < 50 < 0.20 15 < 5.0 < 1.0 < 0.050 1,290 < 0.20 < 30 < 50 - 8.48 < 30 < 5.0
09BH06-S-20140602 2014 06 02 - 358 - - - 700 - - < 10a 56.6 152 52.5 159 4.2 130 < 0.50 2.2 34 < 5.0a < 100 < 0.050 < 0.50 < 0.50 < 1.0a < 1.0 < 50 < 0.20 14.8 < 5.0 < 1.0 < 0.050 1,270 < 0.20 < 30 < 50 - 8.2 < 30 < 5.0
09BH06-S-20141117 2014 11 17 - 354 - - - 713 - - < 10a 56.5 195 51.7 158 4.2 127 < 0.50 2.5 35 < 5.0a < 100 < 0.050 < 0.50 < 0.50 < 1.0a < 1.0 < 50 < 0.20 14.6 < 5.0 < 1.0 < 0.050 1,280 < 0.20 < 30 < 50 - 7.83 < 30 < 5.0
09BH06-S-20150610 2015 06 10 8.22 351 - - - 716 - - 16 56.9 485 50.7 162 4.2 127 < 0.50 3.3 35 < 5.0a < 100 < 0.050 < 0.50 < 0.50 < 1.0a < 1.0 < 50 < 0.20 14.6 < 5.0 < 1.0 < 0.050 1,270 < 0.010 < 30 < 50 - 7.26 < 30 < 5.0
09BH06-S-20151105 2015 11 05 7.91 349 - - - 724 - - < 10 57.8 220 49.7 161 4.3 130 < 0.50 2.5 35 < 5.0a < 100 < 0.050 < 0.50 < 0.50 < 1.0a < 1.0 < 50 < 0.20 14.4 < 5.0 < 1.0 < 0.050 1,320 < 0.010 < 30 < 50 - 7.72 < 30 < 5.0
09BH06-D 09BH06-D-20131112 2013 11 12 - 372 - - - 706 - - < 10a 60.5 371 53.6 164 4.3 129 < 0.50 2.7 40 < 5.0a < 100 < 0.050 < 0.50 < 0.50 < 1.0a < 1.0 < 50 < 0.20 14.4 < 5.0 < 1.0 < 0.050 1,390 < 0.20 < 30 < 50 - 9.62 < 30 < 5.0
DUP4-20131112 Duplicate - 369 - - - 715 - - < 10a 59.9 360 53.3 160 4.2 127 < 0.50 2.7 39 < 5.0a < 100 < 0.050 < 0.50 < 0.50 < 1.0a < 1.0 < 50 < 0.20 14.4 < 5.0 < 1.0 < 0.050 1,370 < 0.20 < 30 < 50 - 9.36 < 30 < 5.0
QA/QC RPD% - 1 - - - 1 - - * 1 3 1 2 * 2 * 0 3 * * * * * * * * * 0 * * * 1 * * * - 3 * *
09BH06-D-20140602 2014 06 02 - 366 - - - 720 - - < 10a 58.9 351 53.2 158 4.2 127 < 0.50 2.6 40 < 5.0a < 100 < 0.050 < 0.50 < 0.50 < 1.0a < 1.0 < 50 < 0.20 14.2 < 5.0 < 1.0 < 0.050 1,330 < 0.20 < 30 < 50 - 9.13 < 30 < 5.0
09BH06-D-20141117 2014 11 17 - 372 - - - 743 - - < 10a 60.4 359 53.6 165 4.1 128 < 0.50 2.6 41 < 5.0a < 100 < 0.050 < 0.50 < 0.50 < 1.0a < 1.0 < 50 < 0.20 14.1 < 5.0 < 1.0 < 0.050 1,360 < 0.20 < 30 < 50 - 8.87 < 30 < 5.0
09BH06-D-20150610 2015 06 10 8.21 385 - - - 770 - - < 10 64 385 54.7 168 4.3 131 < 0.50 2.6 42 < 5.0a < 100 < 0.050 < 0.50 < 0.50 < 1.0a < 1.0 < 50 < 0.20 14.1 < 5.0 < 1.0 < 0.050 1,430 < 0.010 < 30 < 50 - 9 < 30 < 5.0
09BH06-D-20151105 2015 11 05 7.93 369 - - - 760 - - < 10 62 374 51.9 167 4.2 131 < 0.50 2.5 42 < 5.0a < 100 < 0.050 < 0.50 < 0.50 < 1.0a < 1.0 < 50 < 0.20 15.9 < 5.0 < 1.0 < 0.050 1,420 < 0.010 < 30 < 50 - 9.32 < 30 < 5.0
09BH06-D-20170606 2017 06 06 8.42 364 - - - 699 - - < 10 60.1 395 51.9 182 4.3 142 < 0.50 2.9 41 < 5.0a < 100 < 0.050 < 0.50 < 0.50 < 1.0a < 1.0 < 50 < 0.20 15.6 < 5.0 < 1.0 < 0.050 1,440 < 0.010 < 30 < 50 - 6.31 < 30 < 5.0
09BH06-D-180604 2018 06 04 7.76 387 6.99 - 1,289 800 2.98 0.0055 < 5.0 62.2 526 56.1 190 4.52 142 < 0.20 3.06 41.9 < 0.10 15.0 0.016 0.55 0.13 1.63 < 0.20 48.5 < 0.010 15.9 1.24 1.07 < 0.050 1,480 < 0.020 < 0.20 < 5.0 < 1.0 8.62 < 1.0 < 4.0
09BH06-D-190528 2019 05 28 8.04 435 7.08 - 1,229 968 2.88 0.0073 < 5.0 69.2 431 63.5 199 4.69 151 < 0.20 2.80 52.5 < 0.10 8.5 0.011 0.91 0.22 0.63 < 0.20 60.3 < 0.010 17.0 < 0.40 < 0.50 < 0.050 1,740 < 0.020 < 0.20 < 5.0 < 1.0 11.6 < 1.0 < 4.0
09BH06-D-200609 2020 06 09 7.95 422 7.3 - 1,038 849 2.26 - < 1.0 70.1 459 60 199 4.73 156 < 0.050 2.85 48.2 < 0.010 15.0 0.0048 < 0.10 0.190 < 0.10 < 0.050 59.9 < 0.010 18.0 0.377 < 0.10 < 0.010 1,650 0.0045 < 0.050 < 0.20 < 0.20 10.2 < 0.20 < 1.0
GL0-1 GL0-1-20130625 2013 06 25 - 427 - - - 771 - - 38 71.2 99 60.6 763 11.4 83.7 1 4.8 92 < 5.0a < 100 0.059 < 0.50 1.82 < 1.0a < 1.0 < 50 < 0.20 29.8 23.2 1.7 < 0.050 1,210 < 0.20 < 30 < 50 - 11.2 < 30 < 5.0
GL0-1-20140603 2014 06 03 - 416 - - - 711 - - < 10a 63.9 < 30 62.3 135 10.2 69.8 < 0.50 3.2 66 < 5.0a < 100 < 0.050 < 0.50 < 0.50 < 1.0a < 1.0 < 50 < 0.20 24.1 < 5.0 < 1.0 < 0.050 1,370 < 0.20 < 30 < 50 - 4.93 < 30 < 5.0
GL0-1-20141124 2014 11 24 - 436 - - - 711 - - < 10a 66.8 < 30 65.3 160 10.7 69.2 < 0.50 3.3 60 < 5.0a < 100 < 0.050 < 0.50 < 0.50 < 1.0a < 1.0 < 50 < 0.20 22.7 < 5.0 < 1.0 < 0.050 1,300 < 0.20 < 30 < 50 - 4.18 < 30 < 5.0
DUP1-20141124 Duplicate - 430 - - - 680 - - < 10a 66.6 < 30 64.1 159 10.7 68.5 < 0.50 3.3 60 < 5.0a < 100 < 0.050 < 0.50 < 0.50 < 1.0a < 1.0 < 50 < 0.20 23.2 < 5.0 < 1.0 < 0.050 1,300 < 0.20 < 30 < 50 - 4.39 < 30 < 5.0
QA/QC RPD% - 1 - - - 4 - - * 0 * 2 1 0 1 * 0 0 * * * * * * * * * 2 * * * 0 * * * - 5 * *
GL0-1-20150608 2015 06 08 7.59 423 - - - 665 - - < 10 64.6 < 30 63.5 108 10.5 66.4 < 0.50 3.2 58 < 5.0a < 100 < 0.050 < 0.50 < 0.50 < 1.0a < 1.0 < 50 < 0.20 25.3 < 5.0 < 1.0 < 0.050 1,460 < 0.010 < 30 < 50 - 4.16 < 30 < 5.0
GL0-1-20151103 2015 11 03 7.65 423 - - - 682 - - < 10 66.2 32 62.6 160 10.4 67.2 < 0.50 3.3 54 < 5.0a < 100 < 0.050 < 0.50 < 0.50 < 1.0a < 1.0 < 50 < 0.20 24.6 < 5.0 < 1.0 < 0.050 1,490 < 0.010 < 30 < 50 - 3.87 < 30 < 5.0
GL0-1-20160524 2016 05 24 8.19 423 - - - 673 - - < 10 63.6 < 30 64.2 100 10.4 66.9 < 0.50 3.3 50 < 5.0a < 100 < 0.050 < 0.50 < 0.50 < 1.0a < 1.0 < 50 < 0.20 24.6 < 5.0 < 1.0 < 0.050 1,450 < 0.010 < 30 < 50 - 3.93 < 30 < 5.0
GL0-1-20170524 2017 05 24 8.32 418 - - - 671 - - < 10 64 < 30 62.7 29 10.6 69.4 < 0.50 3.1 47 < 5.0a < 100 < 0.050 < 0.50 < 0.50 < 1.0a < 1.0 < 50 < 0.20 27.1 < 5.0 < 1.0 < 0.050 1,640 < 0.010 < 30 < 50 - 4.26 < 30 < 5.0
GL0-1-180529 2018 05 29 7.81 415 7.65 - 934 690 0.87 0.0516 < 5.0 58.1 < 10 65.5 19.5 10.3 69.8 < 0.20 2.87 37.1 < 0.10 36.8 0.038 < 0.50 < 0.10 < 0.40a < 0.20 16.6 < 0.010 27.2 0.82 < 0.50 < 0.050 1,370 < 0.020 < 0.20 < 5.0 < 1.0 4.53 < 1.0 < 4.0
GL0-1-190523 2019 05 23 8.09 384 7.65 - 859 691 1.69 0.0174 < 5.0 54.9 < 10 59.8 13.9 9.85 63.1 < 0.20 3.23 39.9 < 0.10 42.3 0.118 0.77 < 0.10 0.58 < 0.20 15.7 < 0.010 30.5 0.69 < 0.50 < 0.050 1,560 < 0.020 < 0.20 < 5.0 < 1.0 4.31 < 1.0 < 4.0
GL0-1-200310 2020 03 10 7.94 405 - - - 705 1.01 - < 5.0 58.4 13 62.9 25.7 9.93 65.6 < 0.20 3.44 39.9 < 0.10 58.4 0.019 < 0.50 < 0.10 0.12 < 0.20 15.6 < 0.010 29.9 0.41 < 0.50 < 0.050 1,500 < 0.020 < 0.20 < 5.0 < 1.0 4.80 < 1.0 < 4.0
GL0-2 GL0-2-20130627 2013 06 27 - 506 - - - 956 - - < 10a 83.9 < 30 71.9 432 10.6 136 0.53 1.6 93 < 5.0a < 100 < 0.050 < 0.50 1.14 < 1.0a < 1.0 < 50 < 0.20 26.7 6.4 < 1.0 < 0.050 1,460 < 0.20 < 30 < 50 - 37.5 < 30 < 5.0
GL0-2-20140603 2014 06 03 - 465 - - - 744 - - < 10a 75.3 < 30 67.4 169 10.1 72.6 < 0.50 3.4 61 < 5.0a < 100 < 0.050 < 0.50 0.54 < 1.0a < 1.0 < 50 < 0.20 23 < 5.0 < 1.0 < 0.050 1,400 < 0.20 < 30 < 50 - 7.73 < 30 < 5.0
GL0-2-20141124 2014 11 24 - 496 - - - 814 - - < 10a 80.2 < 30 71.9 146 10.8 78.2 < 0.50 2.9 58 < 5.0a < 100 0.067 < 0.50 < 0.50 < 1.0a < 1.0 < 50 < 0.20 22.3 < 5.0 < 1.0 < 0.050 1,360 < 0.20 < 30 < 50 - 11 < 30 < 5.0
GL0-2-20150608 2015 06 08 7.8 479 - - - 675 - - < 10 78 276 68.9 228 10.8 63.3 < 0.50 4.6 56 < 5.0a < 100 < 0.050 < 0.50 < 0.50 < 1.0a < 1.0 < 50 < 0.20 22.5 < 5.0 < 1.0 < 0.050 1,460 < 0.010 < 30 < 50 - 3.27 < 30 < 5.0
GL0-2-20151103 2015 11 03 7.94 500 - - - 726 - - < 10 83.8 143 70.7 234 10.3 92.7 < 0.50 3 61 < 5.0a < 100 < 0.050 < 0.50 < 0.50 < 1.0a < 1.0 < 50 < 0.20 25.8 < 5.0 < 1.0 < 0.050 1,650 < 0.010 < 30 < 50 - 19.5 < 30 < 5.0
DUP1-20151103 Duplicate 7.94 510 - - - 774 - - < 10 86.4 142 71.4 238 11 90.9 < 0.50 2.8 62 < 5.0a < 100 < 0.050 < 0.50 < 0.50 < 1.0a < 1.0 < 50 < 0.20 25.1 < 5.0 < 1.0 < 0.050 1,590 0.013 < 30 < 50 - 18.9 < 30 < 5.0
QA/QC RPD% 0 2 - - - 6 - - * 3 1 1 2 7 2 * 7 2 * * * * * * * * * 3 * * * 4 * * * - 3 * *
GL0-2-20160524 2016 05 24 8.22 468 - - - 700 - - < 10 76 205 67.5 183 10.6 56.7 < 0.50 3.9 53 < 5.0a < 100 < 0.050 < 0.50 < 0.50 < 1.0a < 1.0 < 50 < 0.20 21.3 < 5.0 < 1.0 < 0.050 1,420 < 0.010 < 30 < 50 - 1.92 < 30 < 5.0
GL0-2-20170524 2017 05 24 8.4 482 - - - 696 - - < 10 79.9 121 68.6 126 11.2 60.4 < 0.50 3.8 54 < 5.0a < 100 < 0.050 < 0.50 < 0.50 < 1.0a < 1.0 < 50 < 0.20 24.9 < 5.0 < 1.0 < 0.050 1,670 < 0.010 < 30 < 50 - 2.05 < 30 6.6
GL0-2-180529 2018 05 29 7.82 473 7.43 - 931 726 1.12 0.0173 < 5.0 76.2 202 68.7 156 10.4 63.2 < 0.20 3.45 46.5 < 0.10 41.1 < 0.010 < 0.50 0.26 < 0.40a < 0.20 32.0 < 0.010 22.8 1.07 < 0.50 < 0.050 1,360 < 0.020 < 0.20 < 5.0 < 1.0 3.10 < 1.0 5.1
DUP2-180529 Duplicate 7.85 469 7.43 - 931 698 1.17 0.0093 < 5.0 74.8 199 68.6 152 10.5 63.2 < 0.20 3.41 45.5 < 0.10 40.7 0.010 < 0.50 0.23 < 0.40a < 0.20 31.5 < 0.010 22.8 1.05 < 0.50 < 0.050 1,310 < 0.020 < 0.20 < 5.0 < 1.0 3.09 < 1.0 < 4.0
QA/QC RPD% 0 1 * - * 4 * * * 2 1 0 3 1 0 * 1 2 * 1 * * * * * 2 * 0 * * * 4 * * * * 0 * *
GL0-2-190529 2019 05 29 8.01 546 7.5 - 1,406 1,050 3.70 < 0.0050 11.6 86.4 225 80.2 177 9.99 116 < 0.20 1.60 64.3 < 0.10 33.5 0.037 0.87 0.43 0.95 < 0.20 27.0 < 0.010 28.1 1.98 < 0.50 0.070 2,020 < 0.020 < 0.20 < 5.0 < 1.0 55.3 < 1.0 < 4.0
GL0-2-200310 2020 03 10 7.95 456 - - - 721 1.18 - < 5.0 73.1 113 66.4 179 10.4 58.3 < 0.20 3.78 51.5 < 0.10 56.8 0.021 < 0.50 0.24 < 0.10 < 0.20 32.0 < 0.010 25.8 1.03 < 0.50 < 0.050 1,500 < 0.020 < 0.20 < 5.0 < 1.0 3.01 < 1.0 < 4.0
Associated CARO file(s): 8052631, 8052802, 8060237, 8060737, 8061100, 8081412, 8091680, 8092458, 8092618, 9052219, 9052399, 9052558, 9052754, 9052937, 9060273, 9091657, 9092001, 9092208, 9092404, 9120616.
Associated Exova file(s): 622178, 653600, 712940, 714233, 714243, 756693, 756810, 757047, 811364, 811710, 812030, 812741, 812985, 846260, 878316, 879073, 909346, 909448, 909654.
All terms defined within the body of SNC-Lavalin's report.
< Denotes concentration less than indicated detection limit or RPD less than indicated value.a Laboratory detection limit exceeds regulatory standard/guideline.
- Denotes analysis not conducted.b Standard to protect freshwater aquatic life.
n/a Denotes no applicable standard/guideline.c Guideline to protect irrigation water. Guideline for surface water, shown here for comparison purposes only.
QA/QC RPD Denotes quality assurance/quality control relative percent differenced Guideline to protect freshwater aquatic life, long-term average (i.e. "chronic"). Guideline for surface water, shown here for comparison purposes only.
* RPDs are not calculated where one or more concentrations are less than five times RDL.e Guideline to protect freshwater aquatic life, short-term maximum (i.e. "acute"). Guideline for surface water, shown here for comparison purposes only.
RDL Denotes reported detection limit.f There is no Zinc standard specified for H > 400; therefore, the standard for H=300-<400 is applied as a conservative comparison.g Individual standards exist for Cr +3 and Cr +6. Reported value represents more stringent standard.
BOLD Concentration greater than CSR Aquatic Life (AW) standardh Only applies for specific Schedule 2 Site Activities; verify for your site.
SHADED Concentration greater than CSR Irrigation Watering (IW) standardi Guideline is temperature, pH, DOC and hardness dependent. Calculate using BLM software!
RED Concentration greater than BCWQG Irrigation Water (IW) guidelinej Guideline is pH dependent
BLUE SHADED Concentration greater than BCWQG Aquatic Life Long-Term Average (AW) guidelinek Guideline is hardness dependent
BLUE SHADED Concentration greater than BCWQG Aquatic Life Short-term Maximum (AW) guideline l Conductivity guidelines varies with crop. Guideline range 700-5,000, most stringent guideline for low tolerance crops applied (strawberry, raspberry, bean and carrot.
SNC-LAVALIN INC. Page 1 of 15
662036 / 2021 02 0920210309_662036_TAB_Historical.xlsx
QAQC CN 2021 03 09

TABLE V.2: Historical Summary of Analytical Results for Groundwater - Dissolved Metals
Physical Parameters Dissolved Metals
Sample Sample Sample Date pH
To
tal
Ha
rdn
ess
pH
(fi
eld
)
Co
nd
ucti
vit
y
Fie
ld
Co
nd
ucti
vit
y
To
tal
Dis
so
lve
d
So
lid
s
Dis
so
lve
d
Org
an
ic
Ca
rbo
n
Ph
osp
hate
Dis
so
lve
d
Alu
min
um
Dis
so
lve
d
Ca
lciu
m
Dis
so
lve
d Iro
n
Dis
so
lve
d
Mag
nes
ium
Dis
so
lve
d
Man
gan
ese
Dis
so
lve
d
Po
tass
ium
Dis
so
lve
d
So
diu
m
An
tim
on
y
Ars
en
ic
Ba
riu
m
Be
rylliu
m
Bo
ron
Ca
dm
ium
Ch
rom
ium
Co
ba
lt
Co
pp
er
Le
ad
Lit
hiu
m
Merc
ury
Mo
lyb
den
um
Nic
ke
l
Se
len
ium
Sil
ve
r
Str
on
tiu
m
Th
all
ium
Tin
Tit
an
ium
Tu
ng
ste
n
Ura
niu
m
Va
nad
ium
Zin
cf
Location ID (yyyy mm dd) pH mg/L pH µS/cm µS/cm mg/L mg/L mg/L µg/L mg/L µg/L mg/L µg/L mg/L mg/L µg/L µg/L µg/L µg/L µg/L µg/L µg/L µg/L µg/L µg/L µg/L µg/L µg/L µg/L µg/L µg/L µg/L µg/L µg/L µg/L µg/L µg/L µg/L µg/L
BC Guideline
CSR Aquatic Life (AW)b n/a n/a n/a n/a n/a n/a n/a n/a n/a n/a n/a n/a n/a n/a n/a 90 50 10,000 1.5 12,000 0.5-4k 10g 40 20-90k40-
160k n/a 0.25 10,000250-
1,500k 20 0.5-15k n/a 3 n/a 1,000 n/a 85 n/a
75-
2,400k
CSR Irrigation Watering (IW) n/a n/a n/a n/a n/a n/a n/a n/a 5,000 n/a 5,000h n/a 200h n/a n/a n/a 100 n/a 100 500 5 5g 50 200 200 2,500 1 10 200 20 n/a n/a n/a n/a n/a n/a 10 1001,000-
5,000j
BCWQG Irrigation Water (IW)c 5.0 - 9.0 n/a 5.0 - 9.0 700 - 5,000l 700 - 5,000l n/a n/a n/a n/a n/a n/a n/a n/a n/a n/a n/a n/a n/a n/a n/a n/a n/a n/a n/a n/a n/a n/a n/a n/a n/a n/a n/a n/a n/a n/a n/a n/a n/a n/a
BCWQG Aquatic Life Long-Term Average (AW)d 6.5 - 9.0 n/a 6.5 - 9.0 n/a n/a n/a n/a n/a 5 - 50 n/a n/a n/a n/a n/a n/a n/a n/a n/a n/a n/a 0.017 - 0.46 n/a n/a 0.2i n/a n/a n/a n/a n/a n/a n/a n/a n/a n/a n/a n/a n/a n/a n/a
BCWQG Aquatic Life Short-term Maximum (AW)e 6.5 - 9.0 n/a 6.5 - 9.0 n/a n/a n/a n/a n/a 20 - 100 n/a 350 (max) n/a n/a n/a n/a n/a n/a n/a n/a n/a 0.038 - 2.8 n/a n/a 0.2i n/a n/a n/a n/a n/a n/a n/a n/a n/a n/a n/a n/a n/a n/a n/a
GL0-3 GL0-3-20130627 2013 06 27 - 762 - - - 1,500 - - < 10a 117 < 30 114 29 11 191 < 0.50 < 1.0 33 < 5.0a < 100 0.096 < 0.50 1.79 < 1.0a < 1.0 < 50 < 0.20 14.6 < 5.0 2.3 < 0.050 1,930 < 0.20 < 30 < 50 - 123 < 30 < 5.0
GL0-3-20140603 2014 06 03 - 747 - - - 1,440 - - < 10a 114 < 30 112 < 10 10.2 180 < 0.50 < 1.0 27 < 5.0a < 100 0.185 < 0.50 2.32 < 1.0a < 1.0 < 50 < 0.20 15.1 < 5.0 2.4 < 0.050 1,960 < 0.20 < 30 < 50 - 120 < 30 < 5.0
GL0-3-20141124 2014 11 24 - 797 - - - 1,440 - - < 10a 123 < 30 119 13 11.3 192 < 0.50 < 1.0 27 < 5.0a < 100 0.087 < 0.50 3.55 44.9 < 1.0 < 50 < 0.20 14.8 < 5.0 2.5 < 0.050 1,930 < 0.20 < 30 < 50 - 119 < 30 26.9
GL0-3-20150608 2015 06 08 7.65 772 - - - 1,390 - - < 10 120 < 30 115 < 10 10.7 179 < 0.50 < 1.0 26 < 5.0a < 100 0.149 < 0.50 1.67 3.4 < 1.0 < 50 < 0.20 15.4 < 5.0 2.2 < 0.050 2,050 < 0.010 < 30 < 50 - 119 < 30 18.7
GL0-3-20151103 2015 11 03 7.53 751 - - - 1,460 - - < 10 118 < 30 111 < 10 10.2 188 < 0.50 < 1.0 24 < 5.0a < 100 0.132 < 0.50 1.71 2.2 < 1.0 < 50 < 0.20 15.2 < 5.0 1.8 < 0.050 2,100 < 0.010 < 30 < 50 - 122 < 30 12.3
GL0-3-20160524 2016 05 24 8.1 754 - - - 1,450 - - < 10 117 < 30 112 < 10 10.2 179 < 0.50 < 1.0 23 < 5.0a < 100 0.216 < 0.50 1.26 1.7 < 1.0 < 50 < 0.20 14.1 < 5.0 2.2 < 0.050 1,930 < 0.010 < 30 < 50 - 111 < 30 10.7
GL0-3-20170524 2017 05 24 8.05 769 - - - 1,420 - - < 10 120 < 30 114 < 10 10.4 180 < 0.50 < 1.0 24 < 5.0a < 100 < 0.050 < 0.50 < 0.50 < 1.0a < 1.0 < 50 < 0.20 15.9 < 5.0 1.3 < 0.050 2,160 < 0.010 < 30 < 50 - 124 < 30 7.1
GL0-3-180529 2018 05 29 7.81 799 7.28 - 1,826 1,480 5.47 0.0084 < 5.0 123 < 10 120 1.88 10.4 187 < 0.20 < 0.50 21.7 0.26 23.8 0.028 < 0.50 0.32 1.79 < 0.20 41.1 < 0.010 14.4 1.86 1.14 < 0.050 1,910 < 0.020 0.40 < 5.0 < 1.0 130 < 1.0 10.8
GL0-3-190529 2019 05 29 7.77 1,110 7.12 - 2,776 2,060 6.89 < 0.0050 < 5.0 176 < 10 163 1.91 12.4 239 < 0.20 < 0.50 30.4 0.26 29.3 0.059 1.60 0.59 3.11 < 0.20 52.3 < 0.010 13.8 2.67 10.8 < 0.050 2,980 < 0.020 0.57 < 5.0 < 1.0 198 < 1.0 26.2
GL0-3-200310 2020 03 10 7.82 1,000 - - - 1,970 6.19 - < 5.0 154 64 150 1.85 11.9 230 < 0.20 < 0.50 28.3 0.17 37.7 0.046 1.12 0.49 2.43 < 0.20 50.1 < 0.010 14.4 2.60 6.33 < 0.050 2,800 < 0.020 < 0.20 < 5.0 < 1.0 178 < 1.0 9.3
GL1-1 GL 1-1-20091109 2009 11 09 - 866 - - - - - - 78 67.1 < 100 170 23 10.2 147 < 2 < 2 40 < 0.4 60 < 0.1 < 4 0.4 < 10a < 1 40 - 21 < 10 < 6 < 0.10 3,120 < 0.1 < 1 < 10 - 36 1 < 10
GL1-1-20100810 2010 08 10 - 790 - - - 1,250 - - < 50a 62 < 100 155 9 10 140 < 2 < 2 40 < 0.4 70 < 0.10 < 4 0.3 < 10a < 1 40 - 23 < 10 < 6 < 0.1 3,010 < 0.1 < 1 < 100 - 48 < 1 < 10
GL30-1-20100810 Duplicate - 780 - - - 1,300 - - 85 61 160 152 35 14 154 < 2 6 40 < 0.4 50 < 0.10 < 4 0.4 < 10a < 1 40 - 24 < 10 < 6 < 0.1 3,130 < 0.1 < 1 < 100 - 51 2 < 10
QA/QC RPD% - 1 - - - 4 - - * 2 * 2 118 33 10 * * 0 * 33 * * * * * 0 - 4 * * * 4 * * * - 6 * *
GL1-1-20160531 2016 05 31 7.43 - - - - 1,290 - - < 50 71.2 < 100 182 27 - 174 < 1 < 5 50 < 1 60 < 0.1a < 5 < 0.5 < 2a < 1 49 - 24 < 2 < 5 < 0.5 3,410 < 0.2 - < 50 - 56.3 < 10 -
GL1-1-20180927 2018 09 27 - 730 - - - - - - < 5.0 58.9 < 10 142 53 9.78 154 < 0.20 0.51 41 < 0.10 63.7 0.142 < 0.50 0.2 1.06 < 0.20 38.9 < 0.010 27.3 1.77 1.02 < 0.050 2,830 < 0.020 < 0.20 < 5.0 - 48.9 < 1.0 < 4.0
GL1-1-180612 2018 06 12 7.75 743 - - - 1,160 - 0.0115 < 5.0 58.3 < 10 145 36.5 9.94 155 < 0.20 < 0.50 42.6 < 0.10 44.7 0.118 < 0.50 0.17 1.01 < 0.20 41.8 < 0.010 26.8 1.78 1.71 < 0.050 2,890 < 0.020 < 0.20 < 5.0 < 1.0 49.6 < 1.0 < 4.0
GL1-1-190917 2019 09 17 7.94 763 - - - 1,200 4.15 - < 5.0 60.0 < 10 149 33.2 9.61 164 < 0.20 0.61 45.7 < 0.10 55.3 0.154 1.14 0.17 0.95 < 0.20 43.7 - 33.2 1.96 < 0.50 < 0.050 3,160 < 0.020 < 0.20 < 5.0 < 1.0 55.1 < 1.0 < 4.0
GL1-1-200910 2020 09 10 8.12 746 - - - 1,200 3.45 - 2.4 63.4 3.4 143 29.4 9.46 153 0.095 0.624 43.0 < 0.010 45.8 0.123 0.19 0.156 1.28 0.078 39.7 - 29.6 1.85 0.41 < 0.010 3,120 0.0073 < 0.050 0.20 0.42 54.6 0.21 2.9
GL1-2 GL 1-2-20091109 2009 11 09 - 909 - - - - - - 66 65.4 < 100 181 2 10.2 144 < 2 < 2 40 < 0.4 60 < 0.1 < 4 0.3 < 10a < 1 50 - 20 < 10 < 6 < 0.10 3,160 < 0.1 < 1 < 10 - 36 2 < 10
GL1-2-20100810 2010 08 10 - 840 - - - 1,140 - - < 50a 65 < 100 164 < 2 10 132 < 2 < 2 40 < 0.4 70 < 0.1 < 4 0.4 < 10a < 1 40 - 20 < 10 < 6 < 0.1 3,220 < 0.1 < 1 < 100 - 46 2 < 10
GL1-2-20160531 2016 05 31 7.66 - - - - 1,190 - - < 50 69.3 < 100 174 < 2 - 161 < 1 < 5 < 50 < 1 60 < 0.1a < 5 < 0.5 < 2a < 1 49 - 21 < 2 < 5 < 0.5 3,310 < 0.2 - < 50 - 49 < 10 < 40
GL1-2-180612 2018 06 12 7.84 790 - - - 1,230 - 0.0102 < 5.0 61.7 < 10 154 0.34 10.8 169 < 0.20 0.99 64.4 < 0.10 49.8 0.022 < 0.50 < 0.10 1.83 < 0.20 38.1 < 0.010 28.0 1.34 0.78 < 0.050 3,040 < 0.020 < 0.20 < 5.0 < 1.0 61.6 4.2 < 4.0
GL1-2-20180927 2018 09 27 - 759 - - - - - - < 5.0 59.2 < 10 148 14.7 10.6 149 < 0.20 0.7 47.1 < 0.10 45.4 0.029 < 0.50 0.1 0.95 < 0.20 38.5 < 0.010 18.5 1.18 1.59 < 0.050 2,910 < 0.020 < 0.20 < 5.0 - 49.8 3.2 < 4.0
GL1-2-190917 2019 09 17 7.98 762 - - - 1,240 4.46 - < 5.0 60.7 < 10 148 4.15 9.95 147 < 0.20 0.56 47.0 < 0.10 43.6 0.036 1.03 < 0.10 0.88 < 0.20 42.7 - 23.0 1.24 0.75 < 0.050 3,160 < 0.020 < 0.20 < 5.0 < 1.0 58.1 2.5 < 4.0
GL1-2-200910 2020 09 10 8.14 814 - - - 1,300 4.98 - 2.2 68.1 < 2.0 156 3.48 10.8 157 0.087 0.752 49.8 < 0.010 39.2 0.0328 0.13 0.143 1.24 < 0.050 40.0 - 23.5 1.24 0.26 < 0.010 3,510 < 0.0040< 0.050 0.26 < 0.20 59.8 2.34 < 1.0
GL2-1 GL 2-1-20091109 2009 11 09 - 348 - - - - - - 64 75.8 230 38.6 124 3.6 75.2 < 2 2 120 < 0.4 < 40 < 0.1 < 4 0.5 < 10a < 1 10 - 7 < 10 < 6 < 0.10 2,470 < 0.1 < 1 < 10 - 6 < 1 < 10
GL2-1-20100810 2010 08 10 - 360 - - - 604 - - 76 77 240 41 144 3 74 < 2 2 100 < 0.4 < 40 < 0.10 < 4 0.3 < 10a < 1 10 - 7 < 10 < 6 < 0.1 2,710 < 0.1 < 1 < 100 - 8 < 1 < 10
GL30-2-20100810 Duplicate - 350 - - - 650 - - 95 76 220 40 161 6 76 < 2 4 120 < 0.4 < 40 < 0.10 < 4 0.6 < 10a < 1 10 - 7 < 10 < 6 < 0.1 2,670 < 0.1 < 1 < 100 - 8 1 10
QA/QC RPD% - 3 - - - 7 - - 22 1 9 2 11 * 3 * 67 18 * * * * * * * 0 - 0 * * * 1 * * * - 0 * *
GL2-1-20110629 2011 06 29 - 359 - - - 638 - - < 5 77.6 474 40.2 145 3.2 75.7 < 0.2 2.4 118 < 0.04 4 0.02 1.1 1.39 < 1a < 0.1 12 - 9.2 2 < 0.6 < 0.01 3,410 < 0.01 < 0.1 < 10 - 6.3 0.5 < 1
GL2-1-20111217 2011 12 17 - 372 - - - 640 - - < 50a 81.6 698 41 111 3.2 73.8 < 2 2 110 < 0.4 < 40 < 0.1 5 < 0.2 10 < 1 10 - 9 < 10 < 6 < 0.10 3,100 0.11 < 1 < 10 - 7 2 < 10
GL 2-1-20120627 2012 06 27 - 380 - - - 670 - - < 50a 81 260 42 < 10 2 76 < 2 < 2 100 < 0.4 < 40 < 0.1 < 4 < 0.2 < 10a < 1 10 - 5 < 10 < 6 < 0.10 2,900 < 0.1 < 1 < 100 - 7 < 1 < 10
GL2-1-20121204 2012 12 04 - 348 - - - 642 - - < 50a 74.8 503 39.2 160 3.3 74.1 < 2.0 < 2.0 110 < 0.40 < 40 < 0.10 < 4.0 10.7 < 10a < 1 < 10 - 7.64 < 10 < 6.0 < 0.10 2,950 < 0.10 < 1.0 < 10 - 8.8 1.02 < 10
GL2-1-20130626 2013 06 26 - 418 - - - 660 - - < 10a 91 613 46.3 117 3.6 82.8 < 0.50 1.8 113 < 5.0a < 100 < 0.050 < 0.50 < 0.50 < 1.0a < 1.0 < 50 < 0.20 9.6 < 5.0 < 1.0 < 0.050 2,730 < 0.20 < 30 < 50 - 6.78 < 30 < 5.0
GL2-1-20140603 2014 06 03 - 418 - - - 707 - - < 10a 89.4 381 47.2 91 3.6 85 < 0.50 1.4 119 < 5.0a < 100 0.059 < 0.50 < 0.50 < 1.0a < 1.0 < 50 < 0.20 9.8 < 5.0 < 1.0 < 0.050 2,870 < 0.20 < 30 < 50 - 6.15 < 30 < 5.0
DUP3-20140603 Duplicate - 412 - - - 710 - - < 10a 89.3 402 46 96 3.5 84.3 < 0.50 1.4 118 < 5.0a < 100 < 0.050 < 0.50 < 0.50 < 1.0a < 1.0 < 50 < 0.20 9.5 < 5.0 < 1.0 < 0.050 2,830 < 0.20 < 30 < 50 - 6.12 < 30 < 5.0
QA/QC RPD% - 1 - - - 0 - - * 0 5 3 5 * 1 * 0 1 * * * * * * * * * 3 * * * 1 * * * - 0 * *
GL2-1-20141124 2014 11 24 - 429 - - - 688 - - < 10a 92.4 629 48.2 157 3.7 82.4 < 0.50 1.6 120 < 5.0a < 100 < 0.050 < 0.50 < 0.50 < 1.0a < 1.0 < 50 < 0.20 8.7 < 5.0 < 1.0 < 0.050 3,040 < 0.20 < 30 < 50 - 6.28 < 30 < 5.0
GL2-1-20150608 2015 06 08 7.89 444 - - - 713 - - < 10 97 226 49.1 54 3.7 85.8 < 0.50 1 127 < 5.0a < 100 < 0.050 < 0.50 < 0.50 < 1.0a < 1.0 < 50 < 0.20 9.5 < 5.0 < 1.0 < 0.050 3,170 < 0.010 < 30 < 50 - 6.16 < 30 < 5.0
GL2-1-20151103 2015 11 03 8.05 424 - - - 688 - - < 10 95 330 45.4 186 3.7 83 < 0.50 < 1.0 119 < 5.0a < 100 0.052 < 0.50 < 0.50 < 1.0a < 1.0 < 50 < 0.20 8.8 < 5.0 < 1.0 < 0.050 3,070 < 0.010 < 30 < 50 - 6.09 < 30 < 5.0
GL2-1-20160524 2016 05 24 8.21 445 - - - 730 - - < 10 98.9 85 48.2 17 3.7 90.8 < 0.50 < 1.0 117 < 5.0a < 100 < 0.050 < 0.50 < 0.50 < 1.0a < 1.0 < 50 < 0.20 8.7 < 5.0 < 1.0 < 0.050 3,240 < 0.010 < 30 < 50 - 5.48 < 30 < 5.0
DUP2-20160524 Duplicate 8.2 439 - - - 718 - - < 10 95.7 62 48.5 13 3.7 86.1 < 0.50 < 1.0 116 < 5.0a < 100 < 0.050 < 0.50 < 0.50 < 1.0a < 1.0 < 50 < 0.20 9 < 5.0 < 1.0 < 0.050 3,110 < 0.010 < 30 < 50 - 5.72 < 30 < 5.0
QA/QC RPD% 0 1 - - - 2 - - * 3 31 1 27 * 5 * * 1 * * * * * * * * * 3 * * * 4 * * * - 4 * *
GL2-1-20170524 2017 05 24 8.25 466 - - - 815 - - < 10 103 651 50.6 158 3.7 95.5 < 0.50 1.3 112 < 5.0a < 100 < 0.050 < 0.50 < 0.50 < 1.0a < 1.0 < 50 < 0.20 11.4 < 5.0 < 1.0 < 0.050 3,480 < 0.010 < 30 < 50 - 5.58 < 30 < 5.0
GL2-1-180528 2018 05 28 7.90 457 - - - 845 1.46 < 0.0050 < 5.0 83.5 796 60.3 151 4.12 116 < 0.20 1.34 103 < 0.10 9.7 0.039 < 0.50 < 0.10 < 0.40a < 0.20 11.5 < 0.010 11.1 < 0.40 < 0.50 < 0.050 3,470 < 0.020 < 0.20 < 5.0 < 1.0 5.11 < 1.0 < 4.0
GL2-1-190523 2019 05 23 8.11 505 7.57 - 1,119 903 1.77 < 0.0050 < 5.0 109 29 56.6 231 4.20 106 < 0.20 0.59 103 < 0.10 15.9 0.071 < 0.50 < 0.10 < 0.40a < 0.20 15.6 < 0.010 12.9 < 0.40 < 0.50 < 0.050 4,100 < 0.020 < 0.20 < 5.0 < 1.0 5.30 < 1.0 < 4.0
Associated CARO file(s): 8052631, 8052802, 8060237, 8060737, 8061100, 8081412, 8091680, 8092458, 8092618, 9052219, 9052399, 9052558, 9052754, 9052937, 9060273, 9091657, 9092001, 9092208, 9092404, 9120616.
Associated Exova file(s): 622178, 653600, 712940, 714233, 714243, 756693, 756810, 757047, 811364, 811710, 812030, 812741, 812985, 846260, 878316, 879073, 909346, 909448, 909654.
All terms defined within the body of SNC-Lavalin's report.
< Denotes concentration less than indicated detection limit or RPD less than indicated value.a Laboratory detection limit exceeds regulatory standard/guideline.
- Denotes analysis not conducted.b Standard to protect freshwater aquatic life.
n/a Denotes no applicable standard/guideline.c Guideline to protect irrigation water. Guideline for surface water, shown here for comparison purposes only.
QA/QC RPD Denotes quality assurance/quality control relative percent differenced Guideline to protect freshwater aquatic life, long-term average (i.e. "chronic"). Guideline for surface water, shown here for comparison purposes only.
* RPDs are not calculated where one or more concentrations are less than five times RDL.e Guideline to protect freshwater aquatic life, short-term maximum (i.e. "acute"). Guideline for surface water, shown here for comparison purposes only.
RDL Denotes reported detection limit.f There is no Zinc standard specified for H > 400; therefore, the standard for H=300-<400 is applied as a conservative comparison.g Individual standards exist for Cr +3 and Cr +6. Reported value represents more stringent standard.
BOLD Concentration greater than CSR Aquatic Life (AW) standardh Only applies for specific Schedule 2 Site Activities; verify for your site.
SHADED Concentration greater than CSR Irrigation Watering (IW) standardi Guideline is temperature, pH, DOC and hardness dependent. Calculate using BLM software!
RED Concentration greater than BCWQG Irrigation Water (IW) guidelinej Guideline is pH dependent
BLUE SHADED Concentration greater than BCWQG Aquatic Life Long-Term Average (AW) guidelinek Guideline is hardness dependent
BLUE SHADED Concentration greater than BCWQG Aquatic Life Short-term Maximum (AW) guideline l Conductivity guidelines varies with crop. Guideline range 700-5,000, most stringent guideline for low tolerance crops applied (strawberry, raspberry, bean and carrot.
SNC-LAVALIN INC. Page 2 of 15
662036 / 2021 02 0920210309_662036_TAB_Historical.xlsx
QAQC CN 2021 03 09

TABLE V.2: Historical Summary of Analytical Results for Groundwater - Dissolved Metals
Physical Parameters Dissolved Metals
Sample Sample Sample Date pH
To
tal
Ha
rdn
ess
pH
(fi
eld
)
Co
nd
ucti
vit
y
Fie
ld
Co
nd
ucti
vit
y
To
tal
Dis
so
lve
d
So
lid
s
Dis
so
lve
d
Org
an
ic
Ca
rbo
n
Ph
osp
hate
Dis
so
lve
d
Alu
min
um
Dis
so
lve
d
Ca
lciu
m
Dis
so
lve
d Iro
n
Dis
so
lve
d
Mag
nes
ium
Dis
so
lve
d
Man
gan
ese
Dis
so
lve
d
Po
tass
ium
Dis
so
lve
d
So
diu
m
An
tim
on
y
Ars
en
ic
Ba
riu
m
Be
rylliu
m
Bo
ron
Ca
dm
ium
Ch
rom
ium
Co
ba
lt
Co
pp
er
Le
ad
Lit
hiu
m
Merc
ury
Mo
lyb
den
um
Nic
ke
l
Se
len
ium
Sil
ve
r
Str
on
tiu
m
Th
all
ium
Tin
Tit
an
ium
Tu
ng
ste
n
Ura
niu
m
Va
nad
ium
Zin
cf
Location ID (yyyy mm dd) pH mg/L pH µS/cm µS/cm mg/L mg/L mg/L µg/L mg/L µg/L mg/L µg/L mg/L mg/L µg/L µg/L µg/L µg/L µg/L µg/L µg/L µg/L µg/L µg/L µg/L µg/L µg/L µg/L µg/L µg/L µg/L µg/L µg/L µg/L µg/L µg/L µg/L µg/L
BC Guideline
CSR Aquatic Life (AW)b n/a n/a n/a n/a n/a n/a n/a n/a n/a n/a n/a n/a n/a n/a n/a 90 50 10,000 1.5 12,000 0.5-4k 10g 40 20-90k40-
160k n/a 0.25 10,000250-
1,500k 20 0.5-15k n/a 3 n/a 1,000 n/a 85 n/a
75-
2,400k
CSR Irrigation Watering (IW) n/a n/a n/a n/a n/a n/a n/a n/a 5,000 n/a 5,000h n/a 200h n/a n/a n/a 100 n/a 100 500 5 5g 50 200 200 2,500 1 10 200 20 n/a n/a n/a n/a n/a n/a 10 1001,000-
5,000j
BCWQG Irrigation Water (IW)c 5.0 - 9.0 n/a 5.0 - 9.0 700 - 5,000l 700 - 5,000l n/a n/a n/a n/a n/a n/a n/a n/a n/a n/a n/a n/a n/a n/a n/a n/a n/a n/a n/a n/a n/a n/a n/a n/a n/a n/a n/a n/a n/a n/a n/a n/a n/a n/a
BCWQG Aquatic Life Long-Term Average (AW)d 6.5 - 9.0 n/a 6.5 - 9.0 n/a n/a n/a n/a n/a 5 - 50 n/a n/a n/a n/a n/a n/a n/a n/a n/a n/a n/a 0.017 - 0.46 n/a n/a 0.2i n/a n/a n/a n/a n/a n/a n/a n/a n/a n/a n/a n/a n/a n/a n/a
BCWQG Aquatic Life Short-term Maximum (AW)e 6.5 - 9.0 n/a 6.5 - 9.0 n/a n/a n/a n/a n/a 20 - 100 n/a 350 (max) n/a n/a n/a n/a n/a n/a n/a n/a n/a 0.038 - 2.8 n/a n/a 0.2i n/a n/a n/a n/a n/a n/a n/a n/a n/a n/a n/a n/a n/a n/a n/a
GL2-1 GL2-1-200609 2020 06 09 7.90 556 7.36 - 1,202 970 1.54 - < 1.0 124 1,220 60 157 4.45 122 < 0.050 2.46 92.7 < 0.010 12.3 0.0075 < 0.10 0.0524 0.23 < 0.050 14.1 < 0.010 14.3 0.127 < 0.10 < 0.010 29.0 < 0.0040< 0.050 < 0.20 < 0.20 5.07 < 0.20 < 1.0
(Cont'd) GL2-1-200820 2020 08 20 8.10 473 7.46 - 1,435 1,000 1.72 - 1.6 106 1,210 50.8 129 3.92 98.7 < 0.050 2.82 88.1 < 0.010 11.7 0.0068 0.15 0.0583 < 0.10 < 0.050 12.8 < 0.010 13.8 0.077 < 0.10 < 0.010 39.0 < 0.0040< 0.050 < 0.20 < 0.20 4.13 < 0.20 < 1.0
DUPA-200820 Duplicate 8.10 476 7.46 - 1,435 992 2.18 - 3.0 107 1,200 51 130 3.98 99.4 < 0.050 2.81 87.3 < 0.010 11.4 0.0057 0.12 0.0449 < 0.10 < 0.050 12.9 < 0.010 13.7 0.079 < 0.10 < 0.010 39.5 < 0.0040 0.113 < 0.20 < 0.20 4.13 < 0.20 < 1.0
QA/QC RPD% 0 1 * - * 1 * - * 1 1 0 1 2 1 * 0 1 * 3 * * 26 * * 1 * 1 * * * * * * * * 0 * *
GL2-1-201019 2020 10 19 8.10 513 7.6 - 1,508 1,030 2.10 - < 1.0 125 1,490 48.8 129 4.18 101 < 0.050 3.25 76.5 < 0.010 6.3 < 0.0020 < 0.10 0.0526 < 0.10 < 0.050 11.2 < 0.010 14.9 0.087 < 0.10 < 0.010 3,840 < 0.0040< 0.050 < 0.20 < 0.20 4.03 < 0.20 < 1.0
GL2-2 GL 2-2-20091109 2009 11 09 - 359 - - - - - - 417 70.2 380 44.7 68 3.8 72.7 < 2 < 2 70 < 0.4 < 40 < 0.1 < 4 0.6 < 10a < 1 10 - 5 < 10 < 6 < 0.10 2,430 < 0.1 < 1 < 10 - < 4 1 < 10
GL2-2-20100810 2010 08 10 - 350 - - - 598 - - < 50a 70 < 100 43 20 3 67 < 2 < 2 60 < 0.4 < 40 < 0.10 < 4 < 0.2 < 10a < 1 10 - 5 < 10 < 6 < 0.1 2,480 < 0.1 < 1 < 100 - 8 < 1 < 10
GL2-2-200826 2020 08 26 8.06 405 7.36 - 1,142 751 1.29 - 16.9 81.7 42.9 48.8 128 3.59 74.7 < 0.050 1.17 90.3 < 0.010 9.4 0.0666 0.18 0.0636 0.38 < 0.050 9.73 < 0.010 9.21 0.396 < 0.10 < 0.010 3,280 < 0.0040 0.062 1.15 < 0.20 4.38 0.61 < 1.0
GL2-2-201020 2020 10 20 7.91 464 7.55 - 1,234 810 1.25 - < 1.0 108 23.7 47.2 98.6 3.96 74.5 < 0.050 1.21 109 < 0.010 6.6 0.0744 0.27 0.232 0.27 < 0.050 10.2 < 0.010 10.4 0.268 < 0.10 < 0.010 4,010 < 0.0040< 0.050 < 0.20 < 0.20 4.14 < 0.20 1.8
GL3-2 GL3-2-20080529 2008 05 29 - - - - - - - - 370 35.6 630 56.1 175 6.8 161 < 2 6 50 < 1 < 20 < 0.1a < 5 7 < 10a 2 < 10 - 30 < 5 2 < 0.10 1,210 < 0.5 < 10 31 - 9 2 < 10
GL3-2-20081104 2008 11 04 - - - - - - - - 177 36 460 55.6 124 6.4 156 < 0.2 5.1 42 < 0.1 18 < 0.01 0.8 0.4 1 0.2 11 - 37 1.8 < 0.2 < 0.01 1,280 < 0.05 < 1 17.2 - 6.7 0.7 5
GL3-2-20091116 2009 11 16 - 337 - - - - - - 74 40.7 270 57.3 115 6.7 171 < 2 6 40 < 0.4 < 40 < 0.1 < 4 0.2 < 10a < 1 < 10 - 34 < 10 < 6 < 0.10 1,200 < 0.1 < 1 < 10 - 6 < 1 < 10
GL3-2-20100810 2010 08 10 - 320 - - - 750 - - 88 34 < 100 57 135 6 162 < 2 4 40 < 0.4 < 40 < 0.10 < 4 0.2 < 10a < 1 10 - 31 < 10 < 6 < 0.1 1,180 < 0.1 < 1 < 100 - 8 < 1 < 10
GL3-3 GL3-3-19990505 1999 05 05 - - - - - - - - 67 104 1,620 258 664 53.9 335 < 5 < 10 241 < 0.5 825 < 0.5a < 0.8 4.8 2 < 2 33 - < 1 2 < 4 < 1a 2,480 < 4a 13 < 0.4 - - < 0.1 < 0.6
GL3-3-19990928 1999 09 28 - - - - - - - - 73 110 1,060 261 585 59.4 321 < 5 < 10 242 < 0.5 944 < 0.5a < 0.8 7 1 7 37 - < 1 5 < 4 < 1a 2,380 < 4a 17 < 0.4 - - 3 0.6
GL3-3-19991202 1999 12 02 - - - - - - - - 44 109 2,530 268 584 67.8 330 < 5 < 10 244 < 0.5 992 < 0.5a < 0.8 5.5 2 3 40 - < 1 3 < 4 < 1a 2,510 < 4a 11 < 0.4 - - 1 2.1
GL3-3-20080529 2008 05 29 - - - - - - - - < 50a 32.5 6,180 52.2 131 6 151 < 2 < 2 20 < 1 < 20 < 0.1a < 5 < 1 < 10a 2 < 10 - 20 < 5 < 2 < 0.10 1,160 < 0.5 < 10 10 - 8 < 1 < 10
GL3-3-20081104 2008 11 04 - - - - - - - - 25 37.1 1,160 61.8 178 7.1 158 < 0.2 1.7 24 < 0.1 29 < 0.01 0.6 0.2 < 1a < 0.1 12 - 30 1.7 < 0.2 < 0.01 1,350 < 0.05 < 1 8.4 - 8.8 0.6 3
GL3-5 GL3-5-20130627 2013 06 27 - 1,260 - - - 1,950 - - < 10a 179 13,700 199 677 61.9 237 < 0.50 < 1.0 485 < 5.0a 1,810 < 0.050 0.68 3.12 < 1.0a < 1.0 < 50 < 0.20 < 1.0 < 5.0 < 1.0 < 0.050 2,950 < 0.20 < 30 < 50 - < 0.20 < 30 < 5.0
GL3-5 (2012)-20140609 2014 06 09 - 1,230 - - - 1,920 - - < 10a 165 5,700 200 487 59.7 229 < 0.50 < 1.0 441 < 5.0a 1,760 < 0.050 0.55 3.86 < 1.0a < 1.0 < 50 < 0.20 < 1.0 < 5.0 < 1.0 < 0.050 2,830 < 0.20 < 30 < 50 - < 0.20 < 30 < 5.0
GL3-5 (2012)-20141125 2014 11 25 - 1,330 - - - 2,030 - - < 10a 168 19,500 222 569 56.5 232 < 0.50 1.7 490 < 5.0a 1,790 < 0.050 0.7 3.36 < 1.0a < 1.0 < 50 < 0.20 < 1.0 < 5.0 < 1.0 < 0.050 3,270 < 0.20 < 30 < 50 - 0.31 < 30 < 5.0
GL3-5 (2012)-20150609 2015 06 09 7.43 1,240 - - - 1,850 - - 11 170 27,800 199 414 67.5 243 < 0.50 2.4 470 < 5.0a 1,800 < 0.050 1.03 7.3 < 1.0a < 1.0 < 50 < 0.20 < 1.0 < 5.0 < 1.0 < 0.050 3,080 < 0.010 < 30 < 50 - < 0.20 < 30 < 5.0
DUP1-20150609 Duplicate 7.41 1,230 - - - 1,860 - - 10 163 27,200 201 412 66 238 < 0.50 2.3 469 < 5.0a 1,790 < 0.050 0.96 7.08 < 1.0a < 1.0 < 50 < 0.20 < 1.0 < 5.0 < 1.0 < 0.050 3,040 < 0.020 < 30 < 50 - < 0.20 < 30 < 5.0
QA/QC RPD% 0 1 - - - 1 - - * 4 2 1 0 2 2 * 4 0 * 1 * * 3 * * * * * * * * 1 * * * - * * *
GL3-5 (2012)-20151109 2015 11 09 6.8 1,280 - - - 1,990 - - < 10 172 14,000 205 416 61.6 229 < 0.50 1.3 481 < 5.0a 1,780 < 0.050 0.73 3.82 < 1.0a < 1.0 < 50 < 0.20 < 1.0 < 5.0 < 1.0 < 0.050 3,130 < 0.010 < 30 < 50 - 0.21 < 30 < 5.0
GL4-1 GL 4-1-20091110 2009 11 10 - 630 - - - - - - < 50a 51 390 122 82 6.6 205 < 2 4 10 < 0.4 < 40 < 0.1 < 4 0.3 < 10a < 1 40 - 30 < 10 < 6 < 0.10 2,010 < 0.1 < 1 < 10 - 33 < 1 10
GL4-1-20100810 2010 08 10 - 600 - - - 1,210 - - < 50a 48 < 100 117 90 6 206 < 2 < 2 20 < 0.4 < 40 < 0.10 < 4 0.3 < 10a < 1 40 - 31 < 10 < 6 < 0.1 2,180 < 0.1 < 1 < 100 - 49 < 1 < 10
GL4-1-20110629 2011 06 29 - 613 - - - 1,190 - - < 5 50.8 574 118 90 6.2 186 < 0.2 5.9 16 < 0.04 7 0.02 3.1 0.44 3 < 0.1 34 - 19.2 < 1 9.8 < 0.01 2,560 < 0.01 < 0.1 < 10 - 35.9 1 3
GL4-1-20120625 2012 06 25 - 610 - - - 1,230 - - < 50a 51 410 117 50 7 188 < 2 < 2 10 < 0.4 < 40 < 0.1 < 4 0.7 < 10a < 1 30 - 20 < 10 < 6 < 0.10 2,070 < 0.1 < 1 < 100 - 38 < 1 < 10
GL 4-1-20120626 2012 06 26 - - - - - 1,170 - - - - - - - - - - - - - - - - - - - - - - - - - - - - - - - - -
GL 4-1-20120704 2012 07 04 - 580 - - - - - - < 5 49 140 112 50 7 186 < 0.2 2.2 14 < 0.04 15 < 0.01 7.2 0.14 < 1a < 0.1 34 - 7.4 < 1 16.5 < 0.01 2,440 < 0.01 < 0.1 < 100 - 37 2 1
GL4-1-20121203 2012 12 03 - 548 - - - 1,210 - - < 50a 44.2 624 106 78 6.3 192 < 2 2.4 10 < 0.40 < 40 < 0.10 5.7 < 0.20 < 10a < 1.0 20 - 37.6 < 10 < 6.0 < 0.10 2,190 < 0.10 < 1.0 < 10 - 47.4 1.44 < 10
GL4-1-20130627 2013 06 27 - 622 - - - 1,140 - - < 10a 50.4 820 121 92 6.8 206 < 0.50 2.8 < 20 < 5.0a < 100 < 0.050 < 0.50 < 0.50 < 1.0a < 1.0 < 50 < 0.20 38.1 < 5.0 < 1.0 < 0.050 2,070 < 0.20 < 30 < 50 - 45.4 < 30 < 5.0
DUP4-20130627 Duplicate - 638 - - - 1,130 - - < 10a 52 840 123 95 7.2 210 < 0.50 2.6 < 20 < 5.0a < 100 < 0.050 < 0.50 < 0.50 < 1.0a < 1.0 < 50 < 0.20 36.9 < 5.0 < 1.0 < 0.050 2,050 < 0.20 < 30 < 50 - 46.1 < 30 < 5.0
QA/QC RPD% - 3 - - - 1 - - * 3 2 2 3 6 2 * 7 * * * * * * * * * * 3 * * * 1 * * * - 2 * *
GL4-1-20140603 2014 06 03 - 597 - - - 1,140 - - < 10a 50.5 820 114 89 6.4 199 < 0.50 2.7 < 20 < 5.0a < 100 < 0.050 < 0.50 < 0.50 < 1.0a < 1.0 < 50 < 0.20 38.3 < 5.0 < 1.0 < 0.050 2,040 < 0.20 < 30 < 50 - 42.3 < 30 < 5.0
GL4-1-20141124 2014 11 24 - 646 - - - 1,160 - - < 10a 52.1 833 125 93 7.1 209 < 0.50 2.7 < 20 < 5.0a < 100 < 0.050 < 0.50 < 0.50 < 1.0a < 1.0 < 50 < 0.20 35.9 < 5.0 < 1.0 < 0.050 1,960 < 0.20 < 30 < 50 - 41.9 < 30 < 5.0
GL4-1-20150608 2015 06 08 8 625 - - - 1,110 - - < 10 51.4 784 121 90 6.8 200 < 0.50 2.7 < 20 < 5.0a < 100 < 0.050 < 0.50 < 0.50 < 1.0a < 1.0 < 50 < 0.20 35.6 < 5.0 < 1.0 < 0.050 2,190 < 0.010 < 30 < 50 - 41.4 < 30 < 5.0
GL4-1-20151104 2015 11 04 8.09 591 - - - 1,130 - - < 10 49.3 765 114 85 6.4 192 < 0.50 2.6 < 20 < 5.0a < 100 < 0.050 < 0.50 < 0.50 < 1.0a < 1.0 < 50 < 0.20 35.1 < 5.0 < 1.0 < 0.050 2,000 < 0.010 < 30 < 50 - 41.2 < 30 < 5.0
GL4-1-200814 2020 08 14 8.18 642 7.95 - 1,846 1,280 2.82 - < 1.0 54.1 786 123 85.7 7.03 207 < 0.050 2.90 16.5 < 0.010 17.7 0.0079 0.66 0.0329 < 0.10 < 0.050 40.2 < 0.010 35.6 0.387 < 0.10 < 0.010 2,470 < 0.0040< 0.050 < 0.20 < 0.20 45.9 < 0.20 < 1.0
GL4-1-201016 2020 10 16 8.11 616 7.69 - 1,582 1,260 3.18 - 1.9 51.8 732 118 81.0 6.73 198 < 0.050 2.58 16.0 < 0.010 15.8 0.0244 < 0.10 0.0360 0.11 < 0.050 37.8 < 0.010 33.6 0.356 < 0.10 < 0.010 2,380 < 0.0040 0.116 < 0.20 < 0.20 44.0 < 0.20 1.2
GL4-2 GL4-2-20091116 2009 11 16 - 1,040 - - - - - - < 50a 54.2 < 100 220 44 9 194 < 2 < 2 40 < 0.4 < 40 < 0.1 < 4 1.4 < 10a < 1 30 - 80 < 10 < 6 < 0.10 3,060 < 0.1 < 1 < 10 - 101 2 10
GL4-2-20100810 2010 08 10 - 1,000 - - - 1,760 - - < 50a 52 < 100 216 42 8 202 < 2 < 2 40 < 0.4 < 40 < 0.10 < 4 < 0.2 < 10a < 1 30 - 72 < 10 < 6 < 0.1 3,140 < 0.1 < 1 < 100 - 103 2 < 10
GL4-2-20110629 2011 06 29 - 1,010 - - - 1,540 - - 5 51.5 62 213 170 7.8 183 < 0.2 2 35 < 0.04 6 0.12 6.8 0.97 3 < 0.1 30 - 72.6 4 9.6 < 0.01 3,980 < 0.01 < 0.1 < 10 - 86.8 3.4 4
GL4-2-20120626 2012 06 26 - 1,000 - - - 1,550 - - < 50a 53 360 210 230 8 191 < 2 < 2 40 < 0.4 < 40 < 0.1 < 4 1.1 < 10a < 1 20 - 61 < 10 < 6 < 0.10 3,030 < 0.1 < 1 < 100 - 69 2 < 10
GL4-2-20121203 2012 12 03 - 973 - - - 1,700 - - < 50a 43 131 210 208 7.7 181 < 2 < 2.0 40 < 0.40 < 40 < 0.10 9.1 1.55 < 10a < 1.0 20 - 69.2 < 10 < 6.0 < 0.10 3,020 < 0.10 < 1.0 < 10 - 84.8 3.3 < 10
GL4-2-200814 2020 08 14 8.04 846 2.71 - 2,259 1,610 5.89 - 11.6 51.9 168 174 197 9.14 258 < 0.050 0.729 44.9 < 0.010 29.3 0.143 0.57 0.842 2.95 0.214 32.8 < 0.010 72.2 3.68 0.22 < 0.010 3,410 0.0071 < 0.050 0.79 0.26 78.0 1.30 4.1
GL4-2-201030 2020 10 30 8.01 765 7.46 - 2,207 1,460 4.41 - < 1.0 47.5 11.0 157 47.9 8.63 231 0.129 0.833 38.3 < 0.010 23.1 0.0457 < 0.10 0.211 0.90 < 0.050 29.6 < 0.010 98.3 2.10 0.86 < 0.010 2,910 < 0.0040< 0.050 0.25 < 0.20 86.2 1.40 1.5
Associated CARO file(s): 8052631, 8052802, 8060237, 8060737, 8061100, 8081412, 8091680, 8092458, 8092618, 9052219, 9052399, 9052558, 9052754, 9052937, 9060273, 9091657, 9092001, 9092208, 9092404, 9120616.
Associated Exova file(s): 622178, 653600, 712940, 714233, 714243, 756693, 756810, 757047, 811364, 811710, 812030, 812741, 812985, 846260, 878316, 879073, 909346, 909448, 909654.
All terms defined within the body of SNC-Lavalin's report.
< Denotes concentration less than indicated detection limit or RPD less than indicated value.a Laboratory detection limit exceeds regulatory standard/guideline.
- Denotes analysis not conducted.b Standard to protect freshwater aquatic life.
n/a Denotes no applicable standard/guideline.c Guideline to protect irrigation water. Guideline for surface water, shown here for comparison purposes only.
QA/QC RPD Denotes quality assurance/quality control relative percent differenced Guideline to protect freshwater aquatic life, long-term average (i.e. "chronic"). Guideline for surface water, shown here for comparison purposes only.
* RPDs are not calculated where one or more concentrations are less than five times RDL.e Guideline to protect freshwater aquatic life, short-term maximum (i.e. "acute"). Guideline for surface water, shown here for comparison purposes only.
RDL Denotes reported detection limit.f There is no Zinc standard specified for H > 400; therefore, the standard for H=300-<400 is applied as a conservative comparison.g Individual standards exist for Cr +3 and Cr +6. Reported value represents more stringent standard.
BOLD Concentration greater than CSR Aquatic Life (AW) standardh Only applies for specific Schedule 2 Site Activities; verify for your site.
SHADED Concentration greater than CSR Irrigation Watering (IW) standardi Guideline is temperature, pH, DOC and hardness dependent. Calculate using BLM software!
RED Concentration greater than BCWQG Irrigation Water (IW) guidelinej Guideline is pH dependent
BLUE SHADED Concentration greater than BCWQG Aquatic Life Long-Term Average (AW) guidelinek Guideline is hardness dependent
BLUE SHADED Concentration greater than BCWQG Aquatic Life Short-term Maximum (AW) guideline l Conductivity guidelines varies with crop. Guideline range 700-5,000, most stringent guideline for low tolerance crops applied (strawberry, raspberry, bean and carrot.
SNC-LAVALIN INC. Page 3 of 15
662036 / 2021 02 0920210309_662036_TAB_Historical.xlsx
QAQC CN 2021 03 09

TABLE V.2: Historical Summary of Analytical Results for Groundwater - Dissolved Metals
Physical Parameters Dissolved Metals
Sample Sample Sample Date pH
To
tal
Ha
rdn
ess
pH
(fi
eld
)
Co
nd
ucti
vit
y
Fie
ld
Co
nd
ucti
vit
y
To
tal
Dis
so
lve
d
So
lid
s
Dis
so
lve
d
Org
an
ic
Ca
rbo
n
Ph
osp
hate
Dis
so
lve
d
Alu
min
um
Dis
so
lve
d
Ca
lciu
m
Dis
so
lve
d Iro
n
Dis
so
lve
d
Mag
nes
ium
Dis
so
lve
d
Man
gan
ese
Dis
so
lve
d
Po
tass
ium
Dis
so
lve
d
So
diu
m
An
tim
on
y
Ars
en
ic
Ba
riu
m
Be
rylliu
m
Bo
ron
Ca
dm
ium
Ch
rom
ium
Co
ba
lt
Co
pp
er
Le
ad
Lit
hiu
m
Merc
ury
Mo
lyb
den
um
Nic
ke
l
Se
len
ium
Sil
ve
r
Str
on
tiu
m
Th
all
ium
Tin
Tit
an
ium
Tu
ng
ste
n
Ura
niu
m
Va
nad
ium
Zin
cf
Location ID (yyyy mm dd) pH mg/L pH µS/cm µS/cm mg/L mg/L mg/L µg/L mg/L µg/L mg/L µg/L mg/L mg/L µg/L µg/L µg/L µg/L µg/L µg/L µg/L µg/L µg/L µg/L µg/L µg/L µg/L µg/L µg/L µg/L µg/L µg/L µg/L µg/L µg/L µg/L µg/L µg/L
BC Guideline
CSR Aquatic Life (AW)b n/a n/a n/a n/a n/a n/a n/a n/a n/a n/a n/a n/a n/a n/a n/a 90 50 10,000 1.5 12,000 0.5-4k 10g 40 20-90k40-
160k n/a 0.25 10,000250-
1,500k 20 0.5-15k n/a 3 n/a 1,000 n/a 85 n/a
75-
2,400k
CSR Irrigation Watering (IW) n/a n/a n/a n/a n/a n/a n/a n/a 5,000 n/a 5,000h n/a 200h n/a n/a n/a 100 n/a 100 500 5 5g 50 200 200 2,500 1 10 200 20 n/a n/a n/a n/a n/a n/a 10 1001,000-
5,000j
BCWQG Irrigation Water (IW)c 5.0 - 9.0 n/a 5.0 - 9.0 700 - 5,000l 700 - 5,000l n/a n/a n/a n/a n/a n/a n/a n/a n/a n/a n/a n/a n/a n/a n/a n/a n/a n/a n/a n/a n/a n/a n/a n/a n/a n/a n/a n/a n/a n/a n/a n/a n/a n/a
BCWQG Aquatic Life Long-Term Average (AW)d 6.5 - 9.0 n/a 6.5 - 9.0 n/a n/a n/a n/a n/a 5 - 50 n/a n/a n/a n/a n/a n/a n/a n/a n/a n/a n/a 0.017 - 0.46 n/a n/a 0.2i n/a n/a n/a n/a n/a n/a n/a n/a n/a n/a n/a n/a n/a n/a n/a
BCWQG Aquatic Life Short-term Maximum (AW)e 6.5 - 9.0 n/a 6.5 - 9.0 n/a n/a n/a n/a n/a 20 - 100 n/a 350 (max) n/a n/a n/a n/a n/a n/a n/a n/a n/a 0.038 - 2.8 n/a n/a 0.2i n/a n/a n/a n/a n/a n/a n/a n/a n/a n/a n/a n/a n/a n/a n/a
GL5-1 GL5-1-20091116 2009 11 16 - 77 - - - - - - < 50a 3.4 < 100 16.6 4 10.6 539 < 2 < 2 < 10 < 0.4 < 40 < 0.1 < 4 < 0.2 < 10a < 1 580 - 7 < 10 < 6 < 0.10 1,050 < 0.1 < 1 < 10 - < 4 < 1 < 10
GL5-1-20100810 2010 08 10 - 110 - - - 1,690 - - 71 13 840 20 34 9 604 < 2 < 2 10 < 0.4 40 < 0.1 < 4 < 0.2 < 10a 1 750 - 7 < 10 < 6 < 0.1 2,030 < 0.1 < 1 < 100 - < 4 < 1 50
GL5-2-20180528 2018 05 28 7.83 671 - - - 1,370 - - < 5.0 79.8 < 10 115 0.44 7.77 268 < 0.20 < 0.50 60.6 < 0.10 30.8 0.02 3.92 < 0.10 1.03 < 0.20 39.3 < 0.010 9.37 < 0.40 4.95 < 0.050 4,900 < 0.020 < 0.20 < 5.0 - 20 3.7 < 4.0
GL5-2 GL5-2-20091116 2009 11 16 - 602 - - - - - - 132 68 180 105 12 7.6 128 < 2 < 2 30 < 0.4 < 40 < 0.1 < 4 0.2 < 10a < 1 40 - 16 < 10 < 6 < 0.10 3,680 < 0.1 < 1 20 - 26 5 < 10
GL30-1-20091116 Duplicate - 597 - - - - - - < 50a 67.5 < 100 104 10 7.7 124 < 2 < 2 30 < 0.4 < 40 < 0.1 < 4 < 0.2 < 10a < 1 40 - 17 < 10 < 6 < 0.10 3,590 < 0.1 < 1 < 10 - 25 4 < 10
QA/QC RPD% - 1 - - - - - - * 1 * 1 18 1 3 * * 0 * * * * * * * 0 - 6 * * * 2 * * * - 4 22 *
GL5-2-20100810 2010 08 10 - 640 - - - 1,050 - - 134 68 < 100 113 10 8 129 < 2 < 2 30 < 0.4 < 40 < 0.10 < 4 0.4 < 10a < 1 40 - 15 < 10 < 6 < 0.1 3,750 < 0.1 < 1 < 100 - 27 4 < 10
GL30-3-20100810 Duplicate - 640 - - - 1,120 - - 147 69 150 113 11 10 134 < 2 < 2 40 < 0.4 < 40 < 0.10 < 4 0.2 < 10a < 1 40 - 14 < 10 < 6 < 0.1 3,870 < 0.1 < 1 < 100 - 28 5 10
QA/QC RPD% - 0 - - - 6 - - 9 1 * 0 10 22 4 * * 29 * * * * * * * 0 - 7 * * * 3 * * * - 4 22 *
GL5-2-20110704 2011 07 04 - 778 - - - 1,080 - - < 5 84.4 6 138 4 8.6 152 < 0.2 0.5 34 < 0.04 33 0.02 0.9 0.45 < 1a < 0.1 45 - 17.1 1 1.8 < 0.01 4,300 < 0.01 < 0.1 < 10 - 24.3 7.4 < 1
GL 5-2-20120627 2012 06 27 - 710 - - - 1,160 - - < 50a 78 100 126 < 10 8 150 < 2 < 2 30 < 0.4 < 40 < 0.1 7 < 0.2 < 10a < 1 40 - 14 < 10 < 6 < 0.10 4,160 < 0.1 < 1 < 100 - 23 5 < 10
DUP C-20120627 Duplicate - 730 - - - 1,130 - - < 50a 79 140 129 < 10 7 158 < 2 < 2 40 < 0.4 < 40 < 0.1 4 < 0.2 < 10a < 1 40 - 15 < 10 < 6 < 0.10 4,100 < 0.1 < 1 < 100 - 26 5 < 10
QA/QC RPD% - 3 - - - 3 - - * 1 33 2 * 13 5 * * 29 * * * 55 * * * 0 - 7 * * * 1 * * * - 12 0 *
GL5-2-20121205 2012 12 05 - 659 - - - 1,060 - - 52 72.3 97 116 < 10 7.7 145 < 2.0 < 2.0 30 < 0.40 50 < 0.10 5.1 < 0.20 < 10a < 1 50 - 17.4 < 10 < 6.0 < 0.10 3,980 < 0.10 < 1.0 < 100 - 27.7 5.28 < 10
GL5-2-20130626 2013 06 26 - 726 - - - 1,150 - - < 10a 80.9 < 30 127 10 8.9 163 < 0.50 < 1.0 35 < 5.0a < 100 < 0.050 < 0.50 < 0.50 < 1.0a < 1.0 < 50 < 0.20 18.6 < 5.0 < 1.0 < 0.050 3,770 < 0.20 < 30 < 50 - 28.1 < 30 < 5.0
GL5-2-20131114 2013 11 14 - 687 - - - 1,110 - - < 10a 77.6 < 30 120 11 8.8 187 < 0.50 < 1.0 34 < 5.0a < 100 < 0.050 < 0.50 < 0.50 < 1.0a < 1.0 < 50 < 0.20 19.3 < 5.0 < 1.0 < 0.050 3,870 < 0.20 < 30 < 50 - 27.9 < 30 < 5.0
GL5-2-20140603 2014 06 03 - 655 - - - 1,130 - - < 10a 73.7 < 30 114 < 10 8.1 174 < 0.50 < 1.0 37 < 5.0a < 100 0.06 < 0.50 < 0.50 < 1.0a < 1.0 51 < 0.20 19.2 < 5.0 < 1.0 < 0.050 3,660 < 0.20 < 30 < 50 - 26.7 < 30 < 5.0
GL5-2-20141118 2014 11 18 - 636 - - - 1,000 - - < 10a 71.1 < 30 111 12 8.1 160 < 0.50 < 1.0 33 < 5.0a < 100 < 0.050 < 0.50 < 0.50 < 1.0a < 1.0 < 50 < 0.20 19.1 < 5.0 < 1.0 < 0.050 3,750 < 0.20 < 30 < 50 - 27.2 < 30 < 5.0
DUP2-20141118 Duplicate - 635 - - - 1,070 - - < 10a 70.2 < 30 112 12 8.2 161 < 0.50 < 1.0 33 < 5.0a < 100 < 0.050 < 0.50 < 0.50 < 1.0a < 1.0 < 50 < 0.20 17.4 < 5.0 < 1.0 < 0.050 3,730 < 0.20 < 30 < 50 - 24 < 30 < 5.0
QA/QC RPD% - 0 - - - 7 - - * 1 * 1 0 1 1 * * 0 * * * * * * * * * 9 * * * 1 * * * - 12 * *
GL5-2-20150608 2015 06 08 7.65 956 - - - 1,890 - - < 10 121 < 30 159 < 10 10.4 315 < 0.50 < 1.0 64 < 5.0a < 100 < 0.050 1.7 < 0.50 < 1.0a < 1.0 68 < 0.20 12.1 < 5.0 < 1.0 < 0.050 6,010 < 0.010 < 30 < 50 - 24.1 < 30 < 5.0
GL5-2-20151103 2015 11 03 7.94 623 - - - 1,060 - - < 10 74.8 < 30 106 < 10 8.1 183 < 0.50 < 1.0 34 < 5.0a < 100 < 0.050 < 0.50 < 0.50 < 1.0a < 1.0 < 50 < 0.20 17.4 < 5.0 < 1.0 < 0.050 3,980 < 0.010 < 30 < 50 - 26.9 < 30 < 5.0
GL5-2-20160526 2016 05 26 7.97 879 - - - 1,960 - - < 10 116 < 30 143 < 10 10 384 < 0.50 < 1.0 69 < 5.0a < 100 2.39 4.26 < 0.50 < 1.0a < 1.0 74 < 0.20 11.6 < 5.0 2.9 < 0.050 5,680 < 0.020 < 30 < 50 - 20.7 < 30 < 5.0
GL5-2-20170525 2017 05 25 8.22 782 - - - 1,690 - - < 10 102 < 30 128 < 10 9.1 331 < 0.50 < 1.0 63 < 5.0a < 100 < 0.050 3.64 < 0.50 < 1.0a < 1.0 65 < 0.20 11.3 < 5.0 3.6 < 0.050 5,330 < 0.020 < 30 < 50 - 20.7 < 30 < 5.0
DUP1-20170525 Duplicate 8.28 787 - - - 1,670 - - < 10 102 < 30 129 < 10 9.3 336 < 0.50 < 1.0 64 < 5.0a < 100 < 0.050 3.59 < 0.50 < 1.0a < 1.0 65 < 0.20 11.5 < 5.0 3.5 < 0.050 5,370 < 0.020 < 30 < 50 - 20.4 < 30 < 5.0
QA/QC RPD% 1 1 - - - 1 - - * 0 * 1 * 2 1 * * 2 * * * 1 * * * 0 * 2 * 3 * 1 * * * - 1 * *
GL5-2-180528 2018 05 28 7.83 671 7.08 - 2,100 1,370 4.60 < 0.0050 < 5.0 79.8 < 10 115 0.44 7.77 268 < 0.20 < 0.50 60.6 < 0.10 30.8 0.020 3.92 < 0.10 1.03 < 0.20 39.3 < 0.010 9.37 < 0.40 4.95 < 0.050 4,900 < 0.020 < 0.20 < 5.0 < 1.0 20.0 3.7 < 4.0
GL5-2-190527 2019 05 27 7.96 638 7.43 - 2,396 1,300 4.40 0.0051 5.9 87.3 < 10 102 0.75 7.33 249 < 0.20 < 0.50 66.8 < 0.10 38.8 0.057 2.09 < 0.10 3.18 < 0.20 50.3 < 0.010 12.2 0.52 6.80 < 0.050 5,240 < 0.020 < 0.20 < 5.0 < 1.0 23.1 3.6 < 4.0
GL5-2-200611 2020 06 11 7.83 501 7.21 - 1,529 1,120 2.31 - 4.2 65.3 < 2.0 82.1 0.187 6.98 195 < 0.050 0.339 48.2 < 0.010 24.9 0.0230 0.37 0.0245 0.47 < 0.050 36.8 < 0.010 12.5 0.325 0.36 < 0.010 3,720 < 0.0040< 0.050 < 0.20 < 0.20 28.8 3.95 < 1.0
GL5-3 GL5-3-20091116 2009 11 16 - 596 - - - - - - 74 108 150 79.5 9 5.8 125 < 2 < 2 120 < 0.4 < 40 < 0.1 < 4 0.5 < 10a < 1 30 - 8 10 < 6 < 0.10 5,190 < 0.1 < 1 < 10 - 19 2 < 10
GL5-3-20100810 2010 08 10 - 600 - - - 974 - - 61 105 < 100 81 97 6 116 < 2 < 2 120 < 0.4 < 40 < 0.10 < 4 0.4 < 10a < 1 30 - 6 < 10 < 6 < 0.1 5,320 < 0.1 < 1 < 100 - 20 2 < 10
GL6-1 (2011) GL6-1-19990505 1999 05 05 - - - - - - - - 60 226 228 812 740 182 6,740 25 50 37 < 0.5 470 < 0.5a 13.8 5.3 < 1a < 2 30 - 45 6 < 4 < 1a 4,890 < 4a 17 26.2 - - < 0.1 < 0.6
GL6-1-19990928 1999 09 28 - - - - - - - - < 8a 226 110 829 675 194 7,270 13 20 21.3 < 0.5 230 < 0.5a 3.5 4.3 < 1a 4 35 - 20 6 < 4 < 1a 4,940 < 4a 11 2.8 - - 1 < 0.6
GL6-1-19991202 1999 12 02 - - - - - - - - 26 223 58 738 580 222 7,470 36 40 28.3 < 0.5 377 < 0.5a 8.7 4.3 < 1a 2 42 - 25 8 < 4 < 1a 5,110 < 4a 8 13 - - 4 2.9
GL6-1-20080529 2008 05 29 - - - - - - - - 80 172 120 485 567 225 6,980 10 65 90 < 1 1,410 < 0.1a 47 6 30 2 40 < 0.1 30 20 22 0.1 5,010 < 0.5 20 500 - 29 13 20
GL6-1-20081104 2008 11 04 - - - - - - - - 60 207 < 100 594 470 306 5,940 30 131 120 < 1 2,100 < 0.10a 167 11 20 < 1 40 < 0.1 80 45 10 0.22 4,650 < 0.5 40 335 - 33 258 20
GL30-2-20081104 Duplicate - - - - - - - - 130 220 < 500a 656 660 290 6,480 28 125 120 < 1 1,990 < 0.10a 171 11 20 < 1 40 - 50 55 7 0.27 4,160 < 0.5 40 387 - 31 285 10
QA/QC RPD% - - - - - - - - 74 6 * 10 34 5 9 7 5 0 * 5 * 2 0 0 * 0 - 46 20 35 20 11 * 0 14 - 6 10 67
GL 6-1-20091110 2009 11 10 - 3,530 - - - - - - < 50a 249 < 100 706 1,130 200 6,270 7 55 30 < 0.4 630 < 0.1 20 2.5 < 10a < 1 40 - 31 20 17 < 0.10 6,880 < 0.1 10 < 10 - 34 7 < 10
GL6-1-20110704 2011 07 04 - 1,220 - - - 9,120 - - 123 107 118 232 218 540 2,270 2.3 35.1 329 < 0.04 3,430 0.01 418 26.7 3 < 0.1 46 - 3.4 42 29.5 0.02 3,340 < 0.01 2.9 59 - 1.3 116 3
GL 6-1 (2011)-20120626 2012 06 26 - 1,510 - - - 10,100 - - 214 127 2,890 290 500 500 3,030 5 12 290 < 0.4 2,850 < 0.1 53 26.1 20 < 1 170 - < 1 40 11 < 0.10 3,480 < 0.1 8 110 - 53 15 < 10
GL6-1 (2011)-20130627 2013 06 27 - 1,200 - - - 9,310 - - 107 80.7 1,320 243 293 504 2,600 1.2 10.3 356 < 25a 3,090 < 0.50a 24.3 28.8 < 5.0a < 1.0 53 < 0.20 2.9 36 < 10 < 0.10 3,690 < 1.0 < 150 77 - 9.94 < 150a < 25
GL6-1-20131114 2013 11 14 - 1,650 - - - 12,400 - - 85 100 1,380 339 495 465 3,450 < 2.0 8.4 337 < 25a 2,810 < 1.0a 23 23 < 10a < 1.0 54 < 0.20 6.2 30 < 20 < 0.20 4,110 < 2.0 < 150 86 - 87.5 < 150a < 25
GL6-1 (2011)-20140609 2014 06 09 - 1,300 - - - 9,450 - - 86 79.4 640 268 299 410 2,750 1.5 6.9 309 < 25a 2,600 < 0.50a 19.9 19.4 < 5.0a < 1.0 54 < 0.20 2.3 27.8 < 10 < 0.10 3,740 < 1.0 < 150 56 - 12.1 < 150a < 25
GL6-1 (2011)-20141127 2014 11 27 - 1,580 - - - 13,800 - - < 60a 76.2 1,240 337 319 413 3,560 < 2.0 4.7 290 < 50a 2,600 < 1.0a 18 10.1 < 10a < 1.0 < 100 < 0.20 1.9 23 < 20 < 0.20 4,920 < 2.0 < 300 < 100 - 15.1 < 300a < 50
GL6-1 (2011)-20150615 2015 06 15 7.83 1,030 - - - 9,280 - - 104 74.2 242 206 243 382 2,250 < 1.0 6.6 312 < 15a 2,460 < 0.050 22 27.3 < 2.0a < 1.0 < 50 < 0.20 2 28.7 < 1.0 < 0.10 3,410 < 0.10 < 90 51 - 3.43 < 90 < 15
GL6-1 (2011)-20170530 2017 05 30 7.4 1,260 - - - 7,540 - - 124 136 374 223 334 498 2,110 < 1.0 5.8 449 < 15a 3,110 < 0.050 22.3 30.2 < 2.0a < 1.0 < 50 < 0.20 1.4 35.1 1.6 < 0.10 3,670 < 0.10 < 90 < 50 - 0.92 < 90 < 15
GL6-1(2011)-20121205 2012 12 05 - 1,980 - - - 9,940 - - 700 143 561 394 690 510 4,060 < 20.0 < 20.0 200 < 4.0a 3,400 < 1.00a 61.9 < 2.0 < 100a < 10 < 100 - 37.5 < 100 < 60a < 1.00 3,770 < 1.00 < 10 < 1,000 - 257 23.5 < 100
GL6-1-180604 2018 06 04 7.45 1,900 6.987.0 15,700 14,230 10,800 339 0.224 78.7 183 3,150 351 618 476 2,680 0.91 4.95 376 < 0.10 2,660 < 0.010 15.4 25.7 0.47 < 0.20 61.0 < 0.010 5.86 23.6 0.92 < 0.050 3,880 < 0.020 4.94 18.1 2.4 122 4.2 < 4.0
Associated CARO file(s): 8052631, 8052802, 8060237, 8060737, 8061100, 8081412, 8091680, 8092458, 8092618, 9052219, 9052399, 9052558, 9052754, 9052937, 9060273, 9091657, 9092001, 9092208, 9092404, 9120616.
Associated Exova file(s): 622178, 653600, 712940, 714233, 714243, 756693, 756810, 757047, 811364, 811710, 812030, 812741, 812985, 846260, 878316, 879073, 909346, 909448, 909654.
All terms defined within the body of SNC-Lavalin's report.
< Denotes concentration less than indicated detection limit or RPD less than indicated value.a Laboratory detection limit exceeds regulatory standard/guideline.
- Denotes analysis not conducted.b Standard to protect freshwater aquatic life.
n/a Denotes no applicable standard/guideline.c Guideline to protect irrigation water. Guideline for surface water, shown here for comparison purposes only.
QA/QC RPD Denotes quality assurance/quality control relative percent differenced Guideline to protect freshwater aquatic life, long-term average (i.e. "chronic"). Guideline for surface water, shown here for comparison purposes only.
* RPDs are not calculated where one or more concentrations are less than five times RDL.e Guideline to protect freshwater aquatic life, short-term maximum (i.e. "acute"). Guideline for surface water, shown here for comparison purposes only.
RDL Denotes reported detection limit.f There is no Zinc standard specified for H > 400; therefore, the standard for H=300-<400 is applied as a conservative comparison.g Individual standards exist for Cr +3 and Cr +6. Reported value represents more stringent standard.
BOLD Concentration greater than CSR Aquatic Life (AW) standardh Only applies for specific Schedule 2 Site Activities; verify for your site.
SHADED Concentration greater than CSR Irrigation Watering (IW) standardi Guideline is temperature, pH, DOC and hardness dependent. Calculate using BLM software!
RED Concentration greater than BCWQG Irrigation Water (IW) guidelinej Guideline is pH dependent
BLUE SHADED Concentration greater than BCWQG Aquatic Life Long-Term Average (AW) guidelinek Guideline is hardness dependent
BLUE SHADED Concentration greater than BCWQG Aquatic Life Short-term Maximum (AW) guideline l Conductivity guidelines varies with crop. Guideline range 700-5,000, most stringent guideline for low tolerance crops applied (strawberry, raspberry, bean and carrot.
SNC-LAVALIN INC. Page 4 of 15
662036 / 2021 02 0920210309_662036_TAB_Historical.xlsx
QAQC CN 2021 03 09
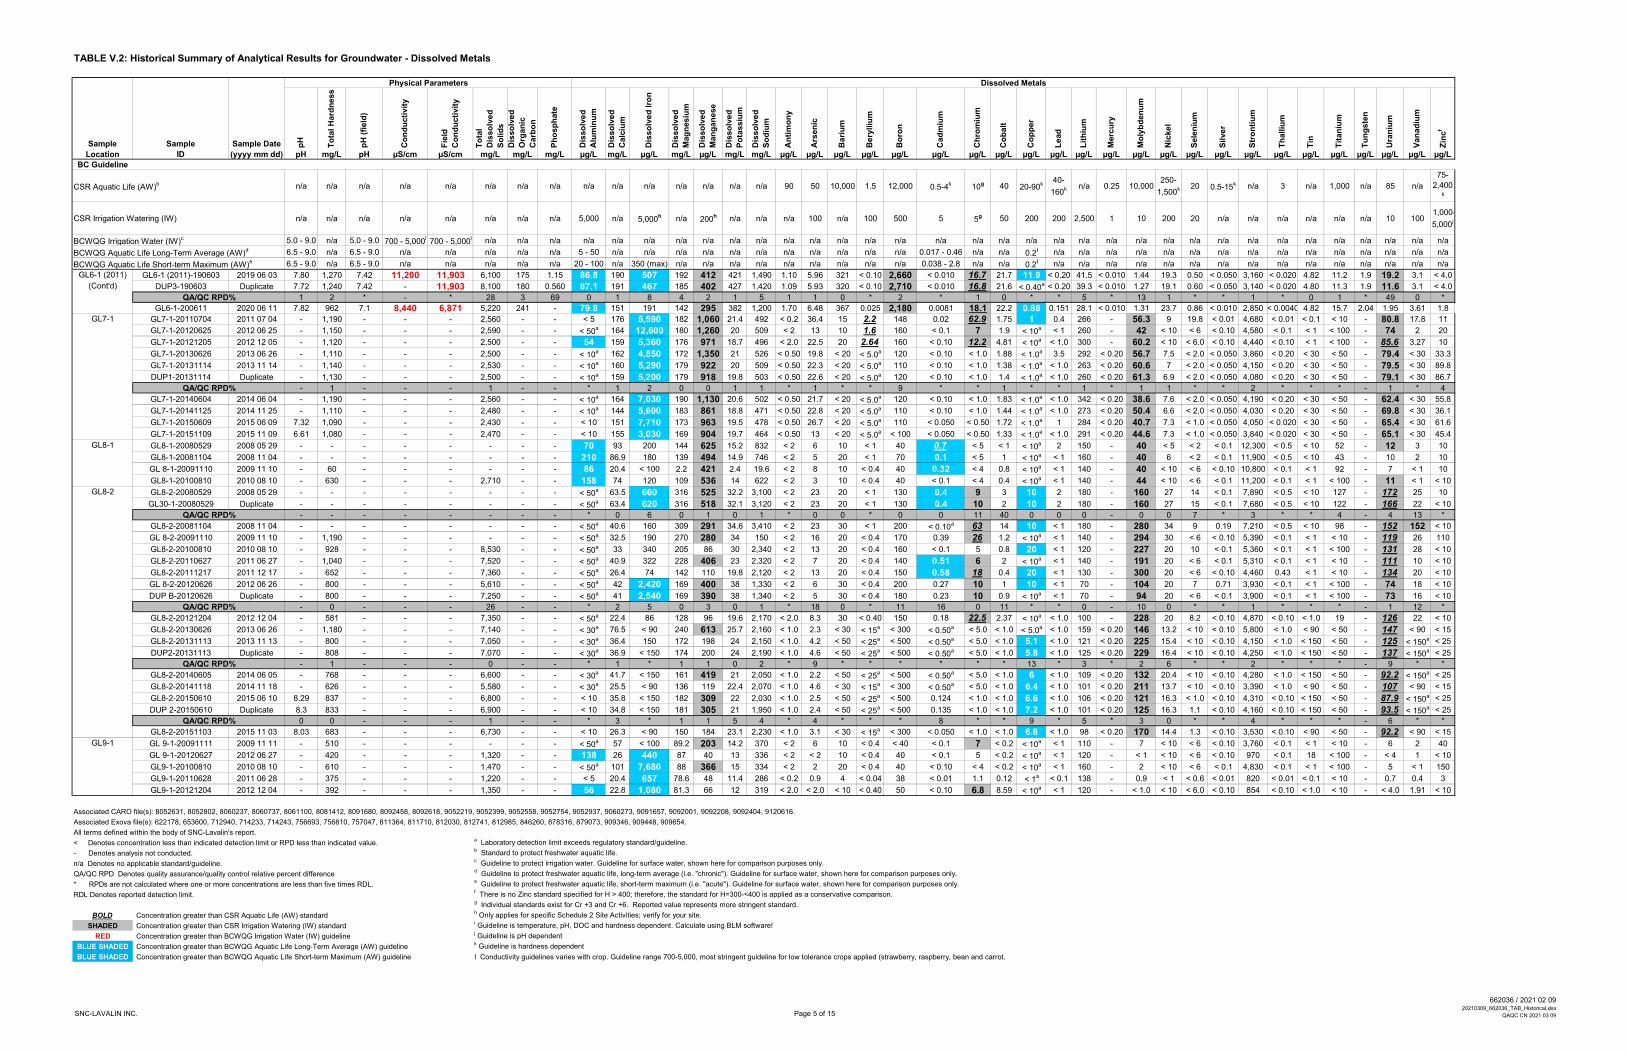
TABLE V.2: Historical Summary of Analytical Results for Groundwater - Dissolved Metals
Physical Parameters Dissolved Metals
Sample Sample Sample Date pH
To
tal
Ha
rdn
ess
pH
(fi
eld
)
Co
nd
ucti
vit
y
Fie
ld
Co
nd
ucti
vit
y
To
tal
Dis
so
lve
d
So
lid
s
Dis
so
lve
d
Org
an
ic
Ca
rbo
n
Ph
osp
hate
Dis
so
lve
d
Alu
min
um
Dis
so
lve
d
Ca
lciu
m
Dis
so
lve
d Iro
n
Dis
so
lve
d
Mag
nes
ium
Dis
so
lve
d
Man
gan
ese
Dis
so
lve
d
Po
tass
ium
Dis
so
lve
d
So
diu
m
An
tim
on
y
Ars
en
ic
Ba
riu
m
Be
rylliu
m
Bo
ron
Ca
dm
ium
Ch
rom
ium
Co
ba
lt
Co
pp
er
Le
ad
Lit
hiu
m
Merc
ury
Mo
lyb
den
um
Nic
ke
l
Se
len
ium
Sil
ve
r
Str
on
tiu
m
Th
all
ium
Tin
Tit
an
ium
Tu
ng
ste
n
Ura
niu
m
Va
nad
ium
Zin
cf
Location ID (yyyy mm dd) pH mg/L pH µS/cm µS/cm mg/L mg/L mg/L µg/L mg/L µg/L mg/L µg/L mg/L mg/L µg/L µg/L µg/L µg/L µg/L µg/L µg/L µg/L µg/L µg/L µg/L µg/L µg/L µg/L µg/L µg/L µg/L µg/L µg/L µg/L µg/L µg/L µg/L µg/L
BC Guideline
CSR Aquatic Life (AW)b n/a n/a n/a n/a n/a n/a n/a n/a n/a n/a n/a n/a n/a n/a n/a 90 50 10,000 1.5 12,000 0.5-4k 10g 40 20-90k40-
160k n/a 0.25 10,000250-
1,500k 20 0.5-15k n/a 3 n/a 1,000 n/a 85 n/a
75-
2,400k
CSR Irrigation Watering (IW) n/a n/a n/a n/a n/a n/a n/a n/a 5,000 n/a 5,000h n/a 200h n/a n/a n/a 100 n/a 100 500 5 5g 50 200 200 2,500 1 10 200 20 n/a n/a n/a n/a n/a n/a 10 1001,000-
5,000j
BCWQG Irrigation Water (IW)c 5.0 - 9.0 n/a 5.0 - 9.0 700 - 5,000l 700 - 5,000l n/a n/a n/a n/a n/a n/a n/a n/a n/a n/a n/a n/a n/a n/a n/a n/a n/a n/a n/a n/a n/a n/a n/a n/a n/a n/a n/a n/a n/a n/a n/a n/a n/a n/a
BCWQG Aquatic Life Long-Term Average (AW)d 6.5 - 9.0 n/a 6.5 - 9.0 n/a n/a n/a n/a n/a 5 - 50 n/a n/a n/a n/a n/a n/a n/a n/a n/a n/a n/a 0.017 - 0.46 n/a n/a 0.2i n/a n/a n/a n/a n/a n/a n/a n/a n/a n/a n/a n/a n/a n/a n/a
BCWQG Aquatic Life Short-term Maximum (AW)e 6.5 - 9.0 n/a 6.5 - 9.0 n/a n/a n/a n/a n/a 20 - 100 n/a 350 (max) n/a n/a n/a n/a n/a n/a n/a n/a n/a 0.038 - 2.8 n/a n/a 0.2i n/a n/a n/a n/a n/a n/a n/a n/a n/a n/a n/a n/a n/a n/a n/a
GL6-1 (2011) GL6-1 (2011)-190603 2019 06 03 7.80 1,270 7.42 11,200 11,903 6,100 175 1.15 86.8 190 507 192 412 421 1,490 1.10 5.96 321 < 0.10 2,660 < 0.010 16.7 21.7 11.9 < 0.20 41.5 < 0.010 1.44 19.3 0.50 < 0.050 3,160 < 0.020 4.82 11.2 1.9 19.2 3.1 < 4.0
(Cont'd) DUP3-190603 Duplicate 7.72 1,240 7.42 - 11,903 8,100 180 0.560 87.1 191 467 185 402 427 1,420 1.09 5.93 320 < 0.10 2,710 < 0.010 16.8 21.6 < 0.40a < 0.20 39.3 < 0.010 1.27 19.1 0.60 < 0.050 3,140 < 0.020 4.80 11.3 1.9 11.6 3.1 < 4.0
QA/QC RPD% 1 2 * - * 28 3 69 0 1 8 4 2 1 5 1 1 0 * 2 * 1 0 * * 5 * 13 1 * * 1 * 0 1 * 49 0 *
GL6-1-200611 2020 06 11 7.82 962 7.1 8,440 6,871 5,220 241 - 79.8 151 191 142 295 382 1,200 1.70 6.48 367 0.025 2,180 0.0081 18.1 22.2 0.88 0.151 28.1 < 0.010 1.31 23.7 0.86 < 0.010 2,850 < 0.0040 4.82 15.7 2.04 1.95 3.61 1.8
GL7-1 GL7-1-20110704 2011 07 04 - 1,190 - - - 2,560 - - < 5 176 5,590 182 1,060 21.4 492 < 0.2 36.4 15 2.2 148 0.02 62.9 1.75 1 0.4 266 - 56.3 9 19.8 < 0.01 4,680 < 0.01 < 0.1 < 10 - 80.8 17.8 11
GL7-1-20120625 2012 06 25 - 1,150 - - - 2,590 - - < 50a 164 12,600 180 1,260 20 509 < 2 13 10 1.6 160 < 0.1 7 1.9 < 10a < 1 260 - 42 < 10 < 6 < 0.10 4,580 < 0.1 < 1 < 100 - 74 2 20
GL7-1-20121205 2012 12 05 - 1,120 - - - 2,500 - - 54 159 5,360 176 971 18.7 496 < 2.0 22.5 20 2.64 160 < 0.10 12.2 4.81 < 10a < 1.0 300 - 60.2 < 10 < 6.0 < 0.10 4,440 < 0.10 < 1 < 100 - 85.6 3.27 10
GL7-1-20130626 2013 06 26 - 1,110 - - - 2,500 - - < 10a 162 4,850 172 1,350 21 526 < 0.50 19.8 < 20 < 5.0a 120 < 0.10 < 1.0 1.88 < 1.0a 3.5 292 < 0.20 56.7 7.5 < 2.0 < 0.050 3,860 < 0.20 < 30 < 50 - 79.4 < 30 33.3
GL7-1-20131114 2013 11 14 - 1,140 - - - 2,530 - - < 10a 160 5,290 179 922 20 509 < 0.50 22.3 < 20 < 5.0a 110 < 0.10 < 1.0 1.38 < 1.0a < 1.0 263 < 0.20 60.6 7 < 2.0 < 0.050 4,150 < 0.20 < 30 < 50 - 79.5 < 30 89.8
DUP1-20131114 Duplicate - 1,130 - - - 2,500 - - < 10a 159 5,200 179 918 19.8 503 < 0.50 22.6 < 20 < 5.0a 120 < 0.10 < 1.0 1.4 < 1.0a < 1.0 260 < 0.20 61.3 6.9 < 2.0 < 0.050 4,080 < 0.20 < 30 < 50 - 79.1 < 30 86.7
QA/QC RPD% - 1 - - - 1 - - * 1 2 0 0 1 1 * 1 * * 9 * * 1 * * 1 * 1 1 * * 2 * * * - 1 * 4
GL7-1-20140604 2014 06 04 - 1,190 - - - 2,560 - - < 10a 164 7,030 190 1,130 20.6 502 < 0.50 21.7 < 20 < 5.0a 120 < 0.10 < 1.0 1.83 < 1.0a < 1.0 342 < 0.20 38.6 7.6 < 2.0 < 0.050 4,190 < 0.20 < 30 < 50 - 62.4 < 30 55.8
GL7-1-20141125 2014 11 25 - 1,110 - - - 2,480 - - < 10a 144 5,600 183 861 18.8 471 < 0.50 22.8 < 20 < 5.0a 110 < 0.10 < 1.0 1.44 < 1.0a < 1.0 273 < 0.20 50.4 6.6 < 2.0 < 0.050 4,030 < 0.20 < 30 < 50 - 69.8 < 30 36.1
GL7-1-20150609 2015 06 09 7.32 1,090 - - - 2,430 - - < 10 151 7,710 173 963 19.5 478 < 0.50 26.7 < 20 < 5.0a 110 < 0.050 < 0.50 1.72 < 1.0a 1 284 < 0.20 40.7 7.3 < 1.0 < 0.050 4,050 < 0.020 < 30 < 50 - 65.4 < 30 61.6
GL7-1-20151109 2015 11 09 6.61 1,080 - - - 2,470 - - < 10 155 3,030 169 904 19.7 464 < 0.50 13 < 20 < 5.0a < 100 < 0.050 < 0.50 1.33 < 1.0a < 1.0 291 < 0.20 44.6 7.3 < 1.0 < 0.050 3,840 < 0.020 < 30 < 50 - 65.1 < 30 45.4
GL8-1 GL8-1-20080529 2008 05 29 - - - - - - - - 70 93 200 144 625 15.2 832 < 2 6 10 < 1 40 0.7 < 5 < 1 < 10a 2 150 - 40 < 5 < 2 < 0.1 12,300 < 0.5 < 10 52 - 12 3 10
GL8-1-20081104 2008 11 04 - - - - - - - - 210 86.9 180 139 494 14.9 746 < 2 5 20 < 1 70 0.1 < 5 1 < 10a < 1 160 - 40 6 < 2 < 0.1 11,900 < 0.5 < 10 43 - 10 2 10
GL 8-1-20091110 2009 11 10 - 60 - - - - - - 86 20.4 < 100 2.2 421 2.4 19.6 < 2 8 10 < 0.4 40 0.32 < 4 0.8 < 10a < 1 140 - 40 < 10 < 6 < 0.10 10,800 < 0.1 < 1 92 - 7 < 1 10
GL8-1-20100810 2010 08 10 - 630 - - - 2,710 - - 158 74 120 109 536 14 622 < 2 3 10 < 0.4 40 < 0.1 < 4 0.4 < 10a < 1 140 - 44 < 10 < 6 < 0.1 11,200 < 0.1 < 1 < 100 - 11 < 1 < 10
GL8-2 GL8-2-20080529 2008 05 29 - - - - - - - - < 50a 63.5 660 316 525 32.2 3,100 < 2 23 20 < 1 130 0.4 9 3 10 2 180 - 160 27 14 < 0.1 7,890 < 0.5 < 10 127 - 172 25 10
GL30-1-20080529 Duplicate - - - - - - - - < 50a 63.4 620 316 518 32.1 3,120 < 2 23 20 < 1 130 0.4 10 2 10 2 180 - 160 27 15 < 0.1 7,680 < 0.5 < 10 122 - 166 22 < 10
QA/QC RPD% - - - - - - - - * 0 6 0 1 0 1 * 0 0 * 0 0 11 40 0 0 0 - 0 0 7 * 3 * * 4 - 4 13 *
GL8-2-20081104 2008 11 04 - - - - - - - - < 50a 40.6 160 309 291 34.6 3,410 < 2 23 30 < 1 200 < 0.10a 63 14 10 < 1 180 - 280 34 9 0.19 7,210 < 0.5 < 10 98 - 152 152 < 10
GL 8-2-20091110 2009 11 10 - 1,190 - - - - - - < 50a 32.5 190 270 280 34 150 < 2 16 20 < 0.4 170 0.39 26 1.2 < 10a < 1 140 - 294 30 < 6 < 0.10 5,390 < 0.1 < 1 < 10 - 119 26 110
GL8-2-20100810 2010 08 10 - 928 - - - 8,530 - - < 50a 33 340 205 86 30 2,340 < 2 13 20 < 0.4 160 < 0.1 5 0.8 20 < 1 120 - 227 20 10 < 0.1 5,360 < 0.1 < 1 < 100 - 131 28 < 10
GL8-2-20110627 2011 06 27 - 1,040 - - - 7,520 - - < 50a 40.9 322 228 406 23 2,320 < 2 7 20 < 0.4 140 0.51 6 2 < 10a < 1 140 - 191 20 < 6 < 0.1 5,310 < 0.1 < 1 < 10 - 111 10 < 10
GL8-2-20111217 2011 12 17 - 652 - - - 7,360 - - < 50a 26.4 74 142 110 19.8 2,120 < 2 13 20 < 0.4 150 0.58 18 0.4 20 < 1 130 - 300 20 < 6 < 0.10 4,460 0.43 < 1 < 10 - 134 20 < 10
GL 8-2-20120626 2012 06 26 - 800 - - - 5,610 - - < 50a 42 2,420 169 400 38 1,330 < 2 6 30 < 0.4 200 0.27 10 1 10 < 1 70 - 104 20 7 0.71 3,930 < 0.1 < 1 < 100 - 74 18 < 10
DUP B-20120626 Duplicate - 800 - - - 7,250 - - < 50a 41 2,540 169 390 38 1,340 < 2 5 30 < 0.4 180 0.23 10 0.9 < 10a < 1 70 - 94 20 < 6 < 0.1 3,900 < 0.1 < 1 < 100 - 73 16 < 10
QA/QC RPD% - 0 - - - 26 - - * 2 5 0 3 0 1 * 18 0 * 11 16 0 11 * * 0 - 10 0 * * 1 * * * - 1 12 *
GL8-2-20121204 2012 12 04 - 581 - - - 7,350 - - < 50a 22.4 86 128 96 19.6 2,170 < 2.0 8.3 30 < 0.40 150 0.18 22.5 2.37 < 10a < 1.0 100 - 228 20 8.2 < 0.10 4,870 < 0.10 < 1.0 19 - 126 22 < 10
GL8-2-20130626 2013 06 26 - 1,180 - - - 7,140 - - < 30a 76.5 < 90 240 613 25.7 2,160 < 1.0 2.3 < 30 < 15a < 300 < 0.50a < 5.0 < 1.0 < 5.0a < 1.0 159 < 0.20 146 13.2 < 10 < 0.10 5,800 < 1.0 < 90 < 50 - 147 < 90 < 15
GL8-2-20131113 2013 11 13 - 800 - - - 7,050 - - < 30a 36.4 150 172 198 24 2,150 < 1.0 4.2 < 50 < 25a < 500 < 0.50a < 5.0 < 1.0 5.1 < 1.0 121 < 0.20 225 15.4 < 10 < 0.10 4,150 < 1.0 < 150 < 50 - 125 < 150a < 25
DUP2-20131113 Duplicate - 808 - - - 7,070 - - < 30a 36.9 < 150 174 200 24 2,190 < 1.0 4.6 < 50 < 25a < 500 < 0.50a < 5.0 < 1.0 5.8 < 1.0 125 < 0.20 229 16.4 < 10 < 0.10 4,250 < 1.0 < 150 < 50 - 137 < 150a < 25
QA/QC RPD% - 1 - - - 0 - - * 1 * 1 1 0 2 * 9 * * * * * * 13 * 3 * 2 6 * * 2 * * * - 9 * *
GL8-2-20140605 2014 06 05 - 768 - - - 6,600 - - < 30a 41.7 < 150 161 419 21 2,050 < 1.0 2.2 < 50 < 25a < 500 < 0.50a < 5.0 < 1.0 6 < 1.0 109 < 0.20 132 20.4 < 10 < 0.10 4,280 < 1.0 < 150 < 50 - 92.2 < 150a < 25
GL8-2-20141118 2014 11 18 - 626 - - - 5,580 - - < 30a 25.5 < 90 136 119 22.4 2,070 < 1.0 4.6 < 30 < 15a < 300 < 0.50a < 5.0 < 1.0 6.4 < 1.0 101 < 0.20 211 13.7 < 10 < 0.10 3,390 < 1.0 < 90 < 50 - 107 < 90 < 15
GL8-2-20150610 2015 06 10 8.29 837 - - - 6,800 - - < 10 35.8 < 150 182 309 22 2,030 < 1.0 2.5 < 50 < 25a < 500 0.124 < 1.0 < 1.0 6.6 < 1.0 106 < 0.20 121 16.3 < 1.0 < 0.10 4,310 < 0.10 < 150 < 50 - 87.9 < 150a < 25
DUP 2-20150610 Duplicate 8.3 833 - - - 6,900 - - < 10 34.8 < 150 181 305 21 1,950 < 1.0 2.4 < 50 < 25a < 500 0.135 < 1.0 < 1.0 7.2 < 1.0 101 < 0.20 125 16.3 1.1 < 0.10 4,160 < 0.10 < 150 < 50 - 93.5 < 150a < 25
QA/QC RPD% 0 0 - - - 1 - - * 3 * 1 1 5 4 * 4 * * * 8 * * 9 * 5 * 3 0 * * 4 * * * - 6 * *
GL8-2-20151103 2015 11 03 8.03 683 - - - 6,730 - - < 10 26.3 < 90 150 184 23.1 2,230 < 1.0 3.1 < 30 < 15a < 300 < 0.050 < 1.0 < 1.0 6.8 < 1.0 98 < 0.20 170 14.4 1.3 < 0.10 3,530 < 0.10 < 90 < 50 - 92.2 < 90 < 15
GL9-1 GL 9-1-20091111 2009 11 11 - 510 - - - - - - < 50a 57 < 100 89.2 203 14.2 370 < 2 6 10 < 0.4 < 40 < 0.1 7 < 0.2 < 10a < 1 110 - 7 < 10 < 6 < 0.10 3,760 < 0.1 < 1 < 10 - 6 2 40
GL 9-1-20120627 2012 06 27 - 420 - - - 1,320 - - 138 26 440 87 40 13 336 < 2 < 2 10 < 0.4 40 < 0.1 5 < 0.2 < 10a < 1 120 - < 1 < 10 < 6 < 0.10 970 < 0.1 18 < 100 - < 4 1 < 10
GL9-1-20100810 2010 08 10 - 610 - - - 1,470 - - < 50a 101 7,680 88 366 15 334 < 2 2 20 < 0.4 40 < 0.10 < 4 < 0.2 < 10a < 1 160 - 2 < 10 < 6 < 0.1 4,830 < 0.1 < 1 < 100 - 5 < 1 150
GL9-1-20110628 2011 06 28 - 375 - - - 1,220 - - < 5 20.4 657 78.6 48 11.4 286 < 0.2 0.9 4 < 0.04 38 < 0.01 1.1 0.12 < 1a < 0.1 138 - 0.9 < 1 < 0.6 < 0.01 820 < 0.01 < 0.1 < 10 - 0.7 0.4 3
GL9-1-20121204 2012 12 04 - 392 - - - 1,350 - - 56 22.8 1,080 81.3 66 12 319 < 2.0 < 2.0 < 10 < 0.40 50 < 0.10 6.8 8.59 < 10a < 1 120 - < 1.0 < 10 < 6.0 < 0.10 854 < 0.10 < 1.0 < 10 - < 4.0 1.91 < 10
Associated CARO file(s): 8052631, 8052802, 8060237, 8060737, 8061100, 8081412, 8091680, 8092458, 8092618, 9052219, 9052399, 9052558, 9052754, 9052937, 9060273, 9091657, 9092001, 9092208, 9092404, 9120616.
Associated Exova file(s): 622178, 653600, 712940, 714233, 714243, 756693, 756810, 757047, 811364, 811710, 812030, 812741, 812985, 846260, 878316, 879073, 909346, 909448, 909654.
All terms defined within the body of SNC-Lavalin's report.
< Denotes concentration less than indicated detection limit or RPD less than indicated value.a Laboratory detection limit exceeds regulatory standard/guideline.
- Denotes analysis not conducted.b Standard to protect freshwater aquatic life.
n/a Denotes no applicable standard/guideline.c Guideline to protect irrigation water. Guideline for surface water, shown here for comparison purposes only.
QA/QC RPD Denotes quality assurance/quality control relative percent differenced Guideline to protect freshwater aquatic life, long-term average (i.e. "chronic"). Guideline for surface water, shown here for comparison purposes only.
* RPDs are not calculated where one or more concentrations are less than five times RDL.e Guideline to protect freshwater aquatic life, short-term maximum (i.e. "acute"). Guideline for surface water, shown here for comparison purposes only.
RDL Denotes reported detection limit.f There is no Zinc standard specified for H > 400; therefore, the standard for H=300-<400 is applied as a conservative comparison.g Individual standards exist for Cr +3 and Cr +6. Reported value represents more stringent standard.
BOLD Concentration greater than CSR Aquatic Life (AW) standardh Only applies for specific Schedule 2 Site Activities; verify for your site.
SHADED Concentration greater than CSR Irrigation Watering (IW) standardi Guideline is temperature, pH, DOC and hardness dependent. Calculate using BLM software!
RED Concentration greater than BCWQG Irrigation Water (IW) guidelinej Guideline is pH dependent
BLUE SHADED Concentration greater than BCWQG Aquatic Life Long-Term Average (AW) guidelinek Guideline is hardness dependent
BLUE SHADED Concentration greater than BCWQG Aquatic Life Short-term Maximum (AW) guideline l Conductivity guidelines varies with crop. Guideline range 700-5,000, most stringent guideline for low tolerance crops applied (strawberry, raspberry, bean and carrot.
SNC-LAVALIN INC. Page 5 of 15
662036 / 2021 02 0920210309_662036_TAB_Historical.xlsx
QAQC CN 2021 03 09

TABLE V.2: Historical Summary of Analytical Results for Groundwater - Dissolved Metals
Physical Parameters Dissolved Metals
Sample Sample Sample Date pH
To
tal
Ha
rdn
ess
pH
(fi
eld
)
Co
nd
ucti
vit
y
Fie
ld
Co
nd
ucti
vit
y
To
tal
Dis
so
lve
d
So
lid
s
Dis
so
lve
d
Org
an
ic
Ca
rbo
n
Ph
osp
hate
Dis
so
lve
d
Alu
min
um
Dis
so
lve
d
Ca
lciu
m
Dis
so
lve
d Iro
n
Dis
so
lve
d
Mag
nes
ium
Dis
so
lve
d
Man
gan
ese
Dis
so
lve
d
Po
tass
ium
Dis
so
lve
d
So
diu
m
An
tim
on
y
Ars
en
ic
Ba
riu
m
Be
rylliu
m
Bo
ron
Ca
dm
ium
Ch
rom
ium
Co
ba
lt
Co
pp
er
Le
ad
Lit
hiu
m
Merc
ury
Mo
lyb
den
um
Nic
ke
l
Se
len
ium
Sil
ve
r
Str
on
tiu
m
Th
all
ium
Tin
Tit
an
ium
Tu
ng
ste
n
Ura
niu
m
Va
nad
ium
Zin
cf
Location ID (yyyy mm dd) pH mg/L pH µS/cm µS/cm mg/L mg/L mg/L µg/L mg/L µg/L mg/L µg/L mg/L mg/L µg/L µg/L µg/L µg/L µg/L µg/L µg/L µg/L µg/L µg/L µg/L µg/L µg/L µg/L µg/L µg/L µg/L µg/L µg/L µg/L µg/L µg/L µg/L µg/L
BC Guideline
CSR Aquatic Life (AW)b n/a n/a n/a n/a n/a n/a n/a n/a n/a n/a n/a n/a n/a n/a n/a 90 50 10,000 1.5 12,000 0.5-4k 10g 40 20-90k40-
160k n/a 0.25 10,000250-
1,500k 20 0.5-15k n/a 3 n/a 1,000 n/a 85 n/a
75-
2,400k
CSR Irrigation Watering (IW) n/a n/a n/a n/a n/a n/a n/a n/a 5,000 n/a 5,000h n/a 200h n/a n/a n/a 100 n/a 100 500 5 5g 50 200 200 2,500 1 10 200 20 n/a n/a n/a n/a n/a n/a 10 1001,000-
5,000j
BCWQG Irrigation Water (IW)c 5.0 - 9.0 n/a 5.0 - 9.0 700 - 5,000l 700 - 5,000l n/a n/a n/a n/a n/a n/a n/a n/a n/a n/a n/a n/a n/a n/a n/a n/a n/a n/a n/a n/a n/a n/a n/a n/a n/a n/a n/a n/a n/a n/a n/a n/a n/a n/a
BCWQG Aquatic Life Long-Term Average (AW)d 6.5 - 9.0 n/a 6.5 - 9.0 n/a n/a n/a n/a n/a 5 - 50 n/a n/a n/a n/a n/a n/a n/a n/a n/a n/a n/a 0.017 - 0.46 n/a n/a 0.2i n/a n/a n/a n/a n/a n/a n/a n/a n/a n/a n/a n/a n/a n/a n/a
BCWQG Aquatic Life Short-term Maximum (AW)e 6.5 - 9.0 n/a 6.5 - 9.0 n/a n/a n/a n/a n/a 20 - 100 n/a 350 (max) n/a n/a n/a n/a n/a n/a n/a n/a n/a 0.038 - 2.8 n/a n/a 0.2i n/a n/a n/a n/a n/a n/a n/a n/a n/a n/a n/a n/a n/a n/a n/a
GL9-1 GL9-1-20130626 2013 06 26 - 418 - - - 1,260 - - < 10a 19.7 1,380 89.5 70 14.1 346 < 0.50 < 1.0 < 20 < 5.0a < 100 < 0.10 < 1.0 < 0.50 < 1.0a < 1.0 129 < 0.20 < 1.0 < 5.0 < 2.0 < 0.050 730 < 0.20 < 30 < 50 - 0.65 < 30 < 5.0
(Cont'd) GL9-1-20131114 2013 11 14 - 410 - - - 1,230 - - < 10a 12.5 471 91.9 32 14.1 353 < 0.50 < 1.0 < 20 < 5.0a < 100 < 0.10 < 1.0 < 0.50 < 1.0a < 1.0 127 < 0.20 < 1.0 < 5.0 < 2.0 < 0.050 464 < 0.20 < 30 < 50 - 0.31 < 30 < 5.0
GL9-1-20140604 2014 06 04 - 374 - - - 1,190 - - < 10a 9.15 191 85.3 25 13.9 348 < 0.50 < 1.0 < 20 < 5.0a < 100 < 0.10 < 1.0 < 0.50 < 1.0a < 1.0 117 < 0.20 < 1.0 < 5.0 < 2.0 < 0.050 356 < 0.20 < 30 < 50 - 0.76 < 30 < 5.0
DUP1-20140604 Duplicate - 366 - - - 1,190 - - < 10a 9.21 184 83.4 24 13.5 342 < 0.50 < 1.0 < 20 < 5.0a < 100 < 0.10 < 1.0 < 0.50 < 1.0a < 1.0 117 < 0.20 < 1.0 < 5.0 < 2.0 < 0.050 356 < 0.20 < 30 < 50 - 0.25 < 30 < 5.0
QA/QC RPD% - 2 - - - 0 - - * 1 4 2 4 3 2 * * * * * * * * * * 0 * * * * * 0 * * * - 101 * *
GL9-1-20141125 2014 11 25 - 404 - - - 1,310 - - < 10a 12.8 60 90.3 15 13.8 348 < 0.50 < 1.0 < 20 < 5.0a < 100 < 0.10 < 1.0 < 0.50 < 1.0a < 1.0 126 < 0.20 < 1.0 < 5.0 < 2.0 < 0.050 572 < 0.20 < 30 < 50 - < 0.20 < 30 < 5.0
GL9-1-20150609 2015 06 09 8.9 332 - - - 1,140 - - < 10 7.76 80 75.9 19 12.9 332 < 0.50 < 1.0 < 20 < 5.0a < 100 < 0.050 < 0.50 < 0.50 < 1.0a < 1.0 101 < 0.20 1.2 < 5.0 < 1.0 < 0.050 316 < 0.020 < 30 < 50 - < 0.20 < 30 < 5.0
GL9-1-20151109 2015 11 09 8.97 326 - - - 1,220 - - < 10 8.97 103 73.7 25 12.9 313 < 0.50 < 1.0 < 20 < 5.0a < 100 < 0.050 < 0.50 < 0.50 < 1.0a < 1.0 98 < 0.20 1.7 < 5.0 < 1.0 < 0.050 372 < 0.020 < 30 < 50 - 0.41 < 30 < 5.0
GL9-1-20170530 2017 05 30 8.9 363 - - - 1,150 - - < 10 9.1 127 82.7 27 13.7 359 < 0.50 < 1.0 < 20 < 5.0a < 100 < 0.050 < 0.50 < 0.50 < 1.0a < 1.0 112 < 0.20 2 < 5.0 < 1.0 < 0.050 357 < 0.020 < 30 < 50 - 0.3 < 30 < 5.0
GL9-1-180604 2018 06 04 8.03 480 7.21 - 2,027 1,390 2.53 < 0.0050 < 5.0 49.8 253 86.3 104 13.8 340 < 0.20 0.80 7.7 < 0.10 44.3 < 0.010 < 0.50 < 0.10 < 0.40a < 0.20 114 < 0.010 2.04 < 0.40 < 0.50 < 0.050 2,090 < 0.020 < 0.20 < 5.0 < 1.0 1.38 < 1.0 17.6
GL9-1-190530 2019 05 30 8.33 407 8.25 - 1,961 1,330 1.44 < 0.0050 9.0 28.2 54 81.8 20.5 13.4 336 < 0.20 < 0.50 7.8 < 0.10 38.8 < 0.010 0.77 < 0.10 < 0.40a < 0.20 130 < 0.010 0.37 < 0.40 < 0.50 < 0.050 1,430 < 0.020 < 0.20 < 5.0 < 1.0 0.225 < 1.0 < 4.0
GL9-1-200611 2020 06 11 7.90 584 7.06 - 2,032 1,470 1.77 - < 1.0 100 19,300 80.9 411 14.8 320 < 0.050 0.238 28.6 0.070 36.3 0.0022 0.11 0.116 < 0.10 < 0.050 126 < 0.010 0.743 0.166 < 0.10 < 0.010 5,030 < 0.0040< 0.050 < 0.20 < 0.20 1.96 0.23 < 1.0
DUPC-200611 Duplicate 7.86 570 - - - 1,450 1.26 - < 1.0 98.1 18,800 78.8 400 14.4 313 < 0.050 0.187 27.9 0.068 34.8 0.0131 0.12 0.120 < 0.10 < 0.050 128 < 0.010 0.726 0.152 < 0.10 < 0.010 5,110 < 0.0040< 0.050 < 0.20 < 0.20 1.97 0.21 1.2
QA/QC RPD% 1 2 - - - 1 * - * 2 3 3 3 3 2 * * 2 3 4 * * 3 * * 2 * 2 * * * 2 * * * * 1 * *
GL9-2 GL9-2-20080529 2008 05 29 - - - - - - - - < 50a 294 < 10 1,760 313 84.2 9,840 < 2 17 < 10 < 1 < 20 0.3 < 5 4 50 2 90 - 80 < 5 11 < 0.10 11,200 < 0.5 < 10 814 - 987 4 30
GL9-2-20081104 2008 11 04 - - - - - - - - 60 290 1,480 1,740 289 79.3 9,950 < 2 21 < 10 < 1 < 20 < 0.1a 10 2 30 < 1 80 - 90 23 5 < 0.1 11,000 < 0.5 < 10 603 - 950 4 40
GL 9-2-20091111 2009 11 11 - 9,260 - - - - - - 659 79.5 2,670 2,200 473 110 12,400 < 2 16 < 10 < 0.4 < 40 0.14 4 2.3 < 10a < 1 80 - 88 20 8 < 0.10 12,000 < 0.1 < 1 < 10 - 1,100 2 30
GL 9-2-20120627 2012 06 27 - 8,200 - - - 41,400 - - 960 408 140 1,800 370 91 9,800 < 2 6 10 < 0.4 < 40 0.2 6 1.2 20 < 1 60 - 100 10 20 < 0.10 12,200 < 0.1 < 1 < 100 - 542 2 10
GL9-2-20100810 2010 08 10 - 6,980 - - - 40,200 - - 144 345 2,170 1,490 500 104 9,940 < 2 18 < 10 < 0.4 < 40 < 0.1 4 2.8 10 < 1 60 - 93 20 11 < 0.1 12,000 < 0.1 < 1 < 100 - 874 3 20
GL9-2-20110628 2011 06 28 - 8,320 - - - 40,500 - - < 5 398 296 1,780 296 85 9,780 < 0.2 4.1 12 < 0.04 < 4 0.3 1.3 2.57 18 < 0.1 50 - 101 14 24.4 < 0.01 11,300 0.01 < 0.1 < 10 - 794 1.2 13
GL9-2-20121204 2012 12 04 - 8,370 - - - 39,400 - - < 50a 394 365 1,800 407 66.3 10,400 < 2.0 6.2 10 < 0.40 < 40 0.34 9 2.95 10 < 1.0 80 - 108 10 18.5 < 0.10 12,600 < 0.10 < 1.0 < 100 - 621 3.37 < 10
Dup-B-20121204 Duplicate - 7,980 - - - 39,800 - - < 50a 399 318 1,700 416 64.6 9,660 < 2.0 5.3 10 < 0.40 < 40 0.36 8.3 1.16 20 < 1.0 60 - 108 10 15.6 < 0.10 12,300 < 0.10 < 1.0 < 100 - 644 2.78 10
QA/QC RPD% - 5 - - - 1 - - * 1 14 6 2 3 7 * 16 0 * * 6 8 87 67 * 29 - 0 0 17 * 2 * * * - 4 19 *
GL9-2-20130626 2013 06 26 - 7,670 - - - 40,500 - - < 150a 378 860 1,630 440 79 9,650 < 5.0 < 5.0 < 200 < 100a < 2,000a < 2.5a < 25a < 5.0 < 25a < 2.5 < 200 < 0.20 104 < 25 < 50a < 0.50 9,840 < 5.0a < 600 < 200 - 578 < 600a < 100
DUP2-20130626 Duplicate - 7,870 - - - 41,900 - - < 150a 387 880 1,680 450 81 9,960 < 5.0 < 5.0 < 200 < 100a < 2,000a < 2.5a < 25a < 5.0 < 25a < 2.5 < 200 < 0.20 93.8 < 25 < 50a < 0.50 10,100 < 5.0a < 600 < 200 - 507 < 600a < 100
QA/QC RPD% - 3 - - - 3 - - * 2 2 3 2 2 3 * * * * * * * * * * * * 10 * * * 3 * * * - 13 * *
GL9-2-20131113 2013 11 13 - 7,950 - - - 40,900 - - < 150a 406 980 1,680 590 82 9,970 < 5.0 < 5.0 < 100 < 50a < 1,000a < 2.5a < 25a < 5.0 < 25a < 2.5 130 < 0.20 99.5 < 25 < 50a < 0.50 10,000 < 5.0a < 300 < 100 - 598 < 300a < 50
GL9-2-20140605 2014 06 05 - 8,100 - - - 39,300 - - < 150a 412 < 600a 1,720 380 84 10,300 < 5.0 < 5.0 < 200 < 100a < 2,000a < 2.5a < 25a < 5.0 < 25a < 2.5 < 200 < 0.20 89.6 < 25 < 50a < 0.50 11,200 < 5.0a < 600 < 200 - 536 < 600a < 100
GL9-2-20141125 2014 11 25 - 7,700 - - - 40,600 - - < 150a 396 450 1,630 381 80 9,660 < 5.0 < 5.0 < 100 < 50a < 1,000a < 2.5a < 25a < 5.0 < 25a 4.2 < 100 < 0.20 92.1 < 25 < 50a < 0.50 10,200 < 5.0a < 300 < 100 - 478 < 300a < 50
GL9-2-20150609 2015 06 09 8.05 7,650 - - - 38,700 - - < 50 404 570 1,610 134 75 9,660 < 5.0 < 5.0 < 100 < 50a < 1,000a 1.07 < 5.0 < 5.0 < 10a < 2.5 < 100 < 0.20 96.7 < 25 < 2.5 < 0.50 10,300 < 0.50 < 300 < 100 - 483 < 300a < 50
GL9-2-20151104 2015 11 04 7.92 7,360 - - - 40,400 - - < 50 380 480 1,560 211 74 9,170 < 5.0 < 5.0 < 100 < 50a < 1,000a 1.05 < 5.0 < 5.0 < 10a < 2.5 < 100 < 0.20 98.7 < 25 < 2.5 < 0.50 9,750 < 0.50 < 300 < 100 - 496 < 300a < 50
GL9-3 GL9-3-20080529 2008 05 29 - - - - - - - - 60 280 40 2,440 66 108 12,600 < 2 27 10 < 1 < 20 0.3 6 < 1 60 2 130 - 70 < 5 19 < 0.10 13,100 < 0.5 < 10 1,040 - 1,760 6 50
GL9-3-20081104 2008 11 04 - - - - - - - - < 50a 269 20 2,530 116 98.9 12,800 < 2 23 20 < 1 < 20 < 0.10a 10 2 40 < 1 110 - 80 30 15 < 0.1 11,200 0.5 < 10 809 - 1,370 3 60
GL 9-3-20091111 2009 11 11 - 217 - - - - - - 723 87 380 < 0.1 378 148 14,000 < 2 19 20 < 0.4 < 40 0.35 9 2.2 10 < 1 120 - 96 20 10 < 0.10 11,700 0.52 < 1 < 10 - 1,480 6 20
GL9-3-20100810 2010 08 10 - 10,500 - - - 48,500 - - 80 344 580 2,330 377 130 12,700 < 2 18 10 < 0.4 < 40 < 0.1 5 1.8 20 < 1 90 - 82 20 20 < 0.1 13,400 0.24 < 1 < 100 - 1,550 4 20
GL9-3-20110628 2011 06 28 - 12,300 - - - 49,600 - - < 5 393 < 5 2,760 68 103 12,900 < 0.2 2.9 12 < 0.04 < 4 0.21 2.1 1.41 22 < 0.1 57 - 75.1 11 32.1 < 0.01 12,900 0.34 < 0.1 < 10 - 1,510 1.8 15
GL9-A-20110628 Duplicate - 11,400 - - - 50,100 - - < 5 407 5 2,520 52 108 11,800 < 0.2 1.5 12 < 0.04 < 4 0.23 2.3 1.65 27 < 0.1 60 - 77.3 12 42.2 0.02 12,700 0.32 < 0.1 < 10 - 1,440 2.1 19
QA/QC RPD% - 8 - - - 1 - - * 4 * 9 27 5 9 * 64 0 * * 9 * 16 20 * 5 - 3 9 27 * 2 6 * * - 5 15 24
GL 9-3-20120627 2012 06 27 - 11,000 - - - 51,700 - - < 50a 400 150 2,500 110 114 11,900 < 2 5 10 < 0.4 < 40 0.1 11 1.1 20 < 1 80 - 74 10 16 < 0.1 12,800 0.24 < 1 < 100 - 1,190 5 20
GL9-3-20121204 2012 12 04 - 10,400 - - - 50,200 - - < 50a 370 < 50 2,300 35 97.2 12,000 < 2 7 < 10 < 0.40 < 40 < 0.10 11.7 2.91 20 < 1 90 - 86.2 10 22.1 < 0.10 13,700 0.47 < 1.0 < 100 - 1,680 5.11 10
GL9-3-20130626 2013 06 26 - 10,400 - - - 51,900 - - < 150a 382 < 600a 2,280 < 100 110 11,500 < 5.0 < 5.0 < 200 < 100a < 2,000a < 2.5a < 25a < 5.0 < 25a < 2.5 < 200 < 0.20 72 < 25 < 50a < 0.50 10,800 < 5.0a < 600 < 200 - 1,450 < 600a < 100
GL9-3-20131113 2013 11 13 - 10,500 - - - 49,000 - - < 150a 383 < 600a 2,310 110 116 11,300 < 5.0 < 5.0 < 200 < 100a < 2,000a < 2.5a < 25a < 5.0 < 25a < 2.5 < 200 < 0.20 78.7 < 25 < 50a < 0.50 11,000 < 5.0a < 600 < 200 - 1,470 < 600a < 100
GL9-3-20140605 2014 06 05 - 10,800 - - - 48,700 - - < 150a 398 < 600a 2,380 110 114 11,800 < 5.0 < 5.0 < 200 < 100a < 2,000a < 2.5a < 25a < 5.0 < 25a < 2.5 < 200 < 0.20 75.7 < 25 < 50a < 0.50 11,700 < 5.0a < 600 < 200 - 1,510 < 600a < 100
GL9-3-20141125 2014 11 25 - 10,400 - - - 49,300 - - < 150a 390 < 600a 2,300 < 100 121 11,600 < 5.0 < 5.0 < 200 < 100a < 2,000a < 2.5a < 25a < 5.0 < 25a < 2.5 < 200 < 0.20 74.4 < 25 < 50a < 0.50 11,400 < 5.0a < 600 < 200 - 1,400 < 600a < 100
DUP4-20141124 Duplicate - 10,400 - - - 49,800 - - < 150a 395 < 600a 2,300 < 100 123 11,700 < 5.0 < 5.0 < 200 < 100a < 2,000a < 2.5a < 25a < 5.0 < 25a < 2.5 < 200 < 0.20 75.5 < 25 < 50a < 0.50 11,500 < 5.0a < 600 < 200 - 1,410 < 600a < 100
QA/QC RPD% - 0 - - - 1 - - * 1 * 0 * 2 1 * * * * * * * * * * * * 1 * * * 1 * * * - 1 * *
GL9-3-20150609 2015 06 09 7.92 10,400 - - - 48,200 - - < 50 392 < 600a 2,280 < 100 113 11,300 < 5.0 < 5.0 < 200 < 100a < 2,000a < 0.25 < 5.0 < 5.0 < 10a < 2.5 < 200 < 0.20 75.4 < 25 < 2.5 < 0.50 11,400 < 0.50 < 600 < 200 - 1,380 < 600a < 100
GL9-3-20151109 2015 11 09 7.69 9,720 - - - 50,200 - - < 50 369 < 600a 2,140 < 100 112 10,800 < 5.0 < 5.0 < 200 < 100a < 2,000a < 0.25 < 5.0 < 5.0 < 10a < 2.5 < 200 < 0.20 83.5 < 25 < 2.5 < 0.50 10,600 < 0.50 < 600 < 200 - 1,440 < 600a < 100
Associated CARO file(s): 8052631, 8052802, 8060237, 8060737, 8061100, 8081412, 8091680, 8092458, 8092618, 9052219, 9052399, 9052558, 9052754, 9052937, 9060273, 9091657, 9092001, 9092208, 9092404, 9120616.
Associated Exova file(s): 622178, 653600, 712940, 714233, 714243, 756693, 756810, 757047, 811364, 811710, 812030, 812741, 812985, 846260, 878316, 879073, 909346, 909448, 909654.
All terms defined within the body of SNC-Lavalin's report.
< Denotes concentration less than indicated detection limit or RPD less than indicated value.a Laboratory detection limit exceeds regulatory standard/guideline.
- Denotes analysis not conducted.b Standard to protect freshwater aquatic life.
n/a Denotes no applicable standard/guideline.c Guideline to protect irrigation water. Guideline for surface water, shown here for comparison purposes only.
QA/QC RPD Denotes quality assurance/quality control relative percent differenced Guideline to protect freshwater aquatic life, long-term average (i.e. "chronic"). Guideline for surface water, shown here for comparison purposes only.
* RPDs are not calculated where one or more concentrations are less than five times RDL.e Guideline to protect freshwater aquatic life, short-term maximum (i.e. "acute"). Guideline for surface water, shown here for comparison purposes only.
RDL Denotes reported detection limit.f There is no Zinc standard specified for H > 400; therefore, the standard for H=300-<400 is applied as a conservative comparison.g Individual standards exist for Cr +3 and Cr +6. Reported value represents more stringent standard.
BOLD Concentration greater than CSR Aquatic Life (AW) standardh Only applies for specific Schedule 2 Site Activities; verify for your site.
SHADED Concentration greater than CSR Irrigation Watering (IW) standardi Guideline is temperature, pH, DOC and hardness dependent. Calculate using BLM software!
RED Concentration greater than BCWQG Irrigation Water (IW) guidelinej Guideline is pH dependent
BLUE SHADED Concentration greater than BCWQG Aquatic Life Long-Term Average (AW) guidelinek Guideline is hardness dependent
BLUE SHADED Concentration greater than BCWQG Aquatic Life Short-term Maximum (AW) guideline l Conductivity guidelines varies with crop. Guideline range 700-5,000, most stringent guideline for low tolerance crops applied (strawberry, raspberry, bean and carrot.
SNC-LAVALIN INC. Page 6 of 15
662036 / 2021 02 0920210309_662036_TAB_Historical.xlsx
QAQC CN 2021 03 09

TABLE V.2: Historical Summary of Analytical Results for Groundwater - Dissolved Metals
Physical Parameters Dissolved Metals
Sample Sample Sample Date pH
To
tal
Ha
rdn
ess
pH
(fi
eld
)
Co
nd
ucti
vit
y
Fie
ld
Co
nd
ucti
vit
y
To
tal
Dis
so
lve
d
So
lid
s
Dis
so
lve
d
Org
an
ic
Ca
rbo
n
Ph
osp
hate
Dis
so
lve
d
Alu
min
um
Dis
so
lve
d
Ca
lciu
m
Dis
so
lve
d Iro
n
Dis
so
lve
d
Mag
nes
ium
Dis
so
lve
d
Man
gan
ese
Dis
so
lve
d
Po
tass
ium
Dis
so
lve
d
So
diu
m
An
tim
on
y
Ars
en
ic
Ba
riu
m
Be
rylliu
m
Bo
ron
Ca
dm
ium
Ch
rom
ium
Co
ba
lt
Co
pp
er
Le
ad
Lit
hiu
m
Merc
ury
Mo
lyb
den
um
Nic
ke
l
Se
len
ium
Sil
ve
r
Str
on
tiu
m
Th
all
ium
Tin
Tit
an
ium
Tu
ng
ste
n
Ura
niu
m
Va
nad
ium
Zin
cf
Location ID (yyyy mm dd) pH mg/L pH µS/cm µS/cm mg/L mg/L mg/L µg/L mg/L µg/L mg/L µg/L mg/L mg/L µg/L µg/L µg/L µg/L µg/L µg/L µg/L µg/L µg/L µg/L µg/L µg/L µg/L µg/L µg/L µg/L µg/L µg/L µg/L µg/L µg/L µg/L µg/L µg/L
BC Guideline
CSR Aquatic Life (AW)b n/a n/a n/a n/a n/a n/a n/a n/a n/a n/a n/a n/a n/a n/a n/a 90 50 10,000 1.5 12,000 0.5-4k 10g 40 20-90k40-
160k n/a 0.25 10,000250-
1,500k 20 0.5-15k n/a 3 n/a 1,000 n/a 85 n/a
75-
2,400k
CSR Irrigation Watering (IW) n/a n/a n/a n/a n/a n/a n/a n/a 5,000 n/a 5,000h n/a 200h n/a n/a n/a 100 n/a 100 500 5 5g 50 200 200 2,500 1 10 200 20 n/a n/a n/a n/a n/a n/a 10 1001,000-
5,000j
BCWQG Irrigation Water (IW)c 5.0 - 9.0 n/a 5.0 - 9.0 700 - 5,000l 700 - 5,000l n/a n/a n/a n/a n/a n/a n/a n/a n/a n/a n/a n/a n/a n/a n/a n/a n/a n/a n/a n/a n/a n/a n/a n/a n/a n/a n/a n/a n/a n/a n/a n/a n/a n/a
BCWQG Aquatic Life Long-Term Average (AW)d 6.5 - 9.0 n/a 6.5 - 9.0 n/a n/a n/a n/a n/a 5 - 50 n/a n/a n/a n/a n/a n/a n/a n/a n/a n/a n/a 0.017 - 0.46 n/a n/a 0.2i n/a n/a n/a n/a n/a n/a n/a n/a n/a n/a n/a n/a n/a n/a n/a
BCWQG Aquatic Life Short-term Maximum (AW)e 6.5 - 9.0 n/a 6.5 - 9.0 n/a n/a n/a n/a n/a 20 - 100 n/a 350 (max) n/a n/a n/a n/a n/a n/a n/a n/a n/a 0.038 - 2.8 n/a n/a 0.2i n/a n/a n/a n/a n/a n/a n/a n/a n/a n/a n/a n/a n/a n/a n/a
GL9-3 GL9-3-20160526 2016 05 26 7.78 10,600 - - - 62,800 - - < 50 385 < 600a 2,350 < 100 118 11,900 < 5.0 < 5.0 < 200 < 100a < 2,000a < 0.25 < 5.0 < 5.0 < 10a < 2.5 < 200 < 0.20 75.9 < 25 < 2.5 < 0.50 11,200 < 0.50 < 600 < 200 - 1,410 < 600a < 100
(Cont'd) GL9-3-20170529 2017 05 29 7.9 11,100 - - - 46,400 - - < 50 377 < 600a 2,470 140 121 12,800 < 5.0 5.1 < 200 < 100a < 2,000a < 0.25 < 5.0 < 5.0 16 < 2.5 < 200 < 0.20 116 < 25 < 2.5 < 0.50 10,700 < 0.50 < 600 < 200 - 1,430 < 600a < 100
GL9-3-180528 2018 05 28 7.68 11,300 7.22 - 3,210 53,000 25.1 < 0.0050 < 5.0 445 12 2,480 271 165 12,600 < 0.20 0.89 14.8 < 0.10 8.8 0.302 < 0.50 0.90 2.87 < 0.20 89.6 < 0.010 98.4 5.90 1.39 < 0.050 15,300 0.440 < 0.20 < 5.0 1.0 1,680 < 1.0 < 4.0
GL9-3-190527 2019 05 27 7.73 12,600 7.54 - 44,350 52,300 24.8 < 0.500 13.7 516 16 2,760 153 167 13,900 < 0.20 1.16 14.9 < 0.10 8.7 0.212 1.37 0.64 4.83 < 0.20 139 < 0.010 112 5.29 1.24 < 0.050 12,900 0.429 < 0.20 < 5.0 < 1.0 1,620 < 1.0 < 4.0
GL9-3-200608 2020 06 08 7.80 10,200 7.32 - 36,600 52,600 23.6 - 159 430 19.3 2,230 217 238 12,900 0.150 1.19 15.8 0.021 11.2 0.145 1.31 1.07 3.44 < 0.050 135 < 0.010 110 6.26 1.94 0.016 13,000 0.409 < 0.050 0.83 0.50 1,780 1.05 1.5
GL10-1 GL10-1-20091112 2009 11 12 - 7,010 - - - - - - < 50a 190 460 1,590 1,820 46 7,710 < 2 17 20 < 0.4 < 40 0.23 < 4 4.2 < 10a < 1 400 - 98 50 7 < 0.1 17,400 0.6 < 1 < 10 - 2,540 3 10
GL10-1-20100810 2010 08 10 - 6,430 - - - 31,200 - - < 50a 198 480 1,440 2,120 57 7,660 < 2 32 20 < 0.4 < 40 < 0.1 6 5 20 < 1 310 - 91 60 12 0.26 19,200 0.21 < 1 < 100 - 2,190 6 10
GL10-1-20110704 2011 07 04 - 8,310 - - - 31,700 - - < 5 215 558 1,890 1,830 46 7,700 < 0.2 1.1 19 < 0.04 22 0.12 107 5.3 11 < 0.1 310 - 82.3 56 88.9 0.1 18,600 0.23 < 0.1 < 10 - 2,470 31.8 9
GL10-1-20120626 2012 06 26 - 8,760 - - - 33,800 - - < 50a 259 1,150 1,970 1,940 46 7,670 < 2 10 20 < 0.4 < 40 < 0.1 14 4.9 10 < 1 350 - 71 60 24 < 0.10 20,300 0.22 < 1 < 100 - 2,230 6 20
GL10-1-20121204 2012 12 04 - 8,350 - - - 33,000 - - < 50a 231 247 1,890 1,760 38.4 7,800 < 2 9.6 10 < 0.40 < 40 < 0.10 19.9 9.25 10 < 1.0 270 - 76.2 50 29.6 < 0.10 19,500 0.3 < 1.0 < 100 - 2,490 7.07 < 10
GL10-1-20130626 2013 06 26 - 7,720 - - - 31,400 - - < 150a 250 1,050 1,720 1,810 44 7,920 < 5.0 < 5.0 < 100 < 50a < 1,000a < 2.5a < 25a < 5.0 < 25a < 2.5 360 < 0.20 61.5 35 < 50a < 0.50 15,200 < 5.0a < 300 < 100 - 1,930 < 300a < 50
GL10-1-20140605 2014 06 05 - 6,550 - - - 28,900 - - < 150a 214 710 1,460 1,530 39 6,440 < 5.0 < 5.0 < 100 < 50a < 1,000a < 2.5a < 25a < 5.0 < 25a < 2.5 310 < 0.20 66.8 39 < 50a < 0.50 13,600 < 5.0a < 300 < 100 - 1,770 < 300a < 50
GL10-1-20141125 2014 11 25 - 6,570 - - - 28,000 - - < 150a 217 1,450 1,460 1,540 40 6,460 < 5.0 < 5.0 < 100 < 50a < 1,000a < 2.5a < 25a < 5.0 < 25a < 2.5 320 < 0.20 66.4 26 < 50a < 0.50 13,600 < 5.0a < 300 < 100 - 1,640 < 300a < 50
GL10-1-20150610 2015 06 10 7.95 6,240 - - - 26,600 - - < 50 231 1,330 1,380 1,450 35 5,830 < 5.0 < 5.0 < 100 < 50a < 1,000a < 0.25 < 5.0 < 5.0 < 10a < 2.5 290 < 0.20 64.3 28 < 2.5 < 0.50 14,100 < 0.50 < 300 < 100 - 1,660 < 300a < 50
GL10-1-20151109 2015 11 09 7.57 5,980 - - - 25,100 - - < 20 228 < 300 1,310 1,370 36 5,530 < 2.0 < 2.0 < 100 < 50a < 1,000a < 0.10 < 2.0 3 4.1 < 1.0 290 < 0.20 67.2 25 < 1.0 < 0.20 13,300 < 0.20 < 300 < 100 - 1,660 < 300a < 50
DUP2-20151109 Duplicate 7.64 5,800 - - - 25,200 - - < 20 225 < 300 1,270 1,350 36 5,470 < 2.0 < 2.0 < 100 < 50a < 1,000a < 0.10 < 2.0 2.8 < 4.0a < 1.0 280 < 0.20 61.1 24 < 1.0 < 0.20 13,200 < 0.20 < 300 < 100 - 1,540 < 300a < 50
QA/QC RPD% 1 3 - - - 0 - - * 1 * 3 1 0 1 * * * * * * * 7 * * 4 * 10 4 * * 1 * * * - 8 * *
GL12-1 GL 12-1-20111218 2011 12 18 - 3,160 - - - 8,050 - - < 50a 420 < 5 513 466 17.6 863 7 2 10 < 0.4 50 0.4 6 0.9 30 < 1 160 - 30 30 < 6 < 0.10 13,600 0.62 2 < 10 - 272 < 1 < 10
GL12-1-20091112 2009 11 12 - 3,250 - - - - - - 77 411 140 540 19 18.6 883 < 2 < 2 < 10 < 0.4 < 40 0.1 < 4 0.7 10 < 1 130 - 16 10 < 6 < 0.10 11,300 0.13 < 1 < 10 - 250 < 1 10
GL12-1-20100811 2010 08 11 - 3,080 - - - 7,420 - - < 50a 400 140 504 68 17 896 < 2 < 2 < 10 < 0.4 < 40 < 0.1 < 4 0.9 < 10a < 1 120 - 18 20 < 6 < 0.1 11,700 0.13 < 1 < 100 - 206 < 1 < 10
GL12-1-20110629 2011 06 29 - 3,310 - - - 7,330 - - < 5 435 13 541 < 1 17.9 870 0.6 < 0.2 10 < 0.04 8 0.12 3.2 0.84 8 < 0.1 123 - 24.2 14 18.1 < 0.01 11,200 0.09 < 0.1 < 10 - 205 1.3 4
GL30-1-20110629 Duplicate - 3,400 - - - 7,270 - - < 5 445 5 557 < 1 17.4 892 0.4 0.2 9 < 0.04 8 0.12 3.4 0.69 9 < 0.1 111 - 20.7 12 17.1 < 0.01 11,100 0.07 < 0.1 < 10 - 206 1.4 4
QA/QC RPD% - 3 - - - 1 - - * 2 * 3 * 3 2 * * 11 * * 0 6 20 12 * 10 - 16 15 6 * 1 25 * * - 0 7 0
GL12-1-20120625 2012 06 25 - 3,520 - - - 7,750 - - < 50a 473 640 569 790 21 952 < 2 < 2 10 < 0.4 < 40 0.15 < 4 1.6 20 < 1 140 - 23 20 < 6 < 0.10 12,900 0.19 < 1 < 100 - 210 1 10
GL12-1-20121204 2012 12 04 - 3,610 - - - 7,920 - - < 50a 472 < 5 591 778 19.2 1,010 < 2.0 < 2.0 10 < 0.40 < 40 0.33 6.8 2.43 20 < 1.0 140 - 27.6 20 < 6.0 < 0.10 13,300 0.3 < 1.0 < 10 - 272 2.51 < 10
GL12-1-20130626 2013 06 26 - 3,720 - - - 8,440 - - < 15a 472 < 60 616 549 23.5 1,130 < 0.50 < 1.0 < 20 < 10a < 200 0.31 < 2.5 0.51 16.8 < 1.0 177 < 0.20 30.4 12 < 5.0 < 0.050 11,000 < 0.50 < 60 < 50 - 325 < 60 < 10
GL12-1-20131113 2013 11 13 - 3,900 - - - 8,560 - - < 15a 489 < 60 652 696 24.8 1,110 0.55 < 1.0 < 20 < 10a < 200 0.36 < 2.5 1.03 18.5 < 1.0 262 < 0.20 35.6 14.9 < 5.0 < 0.050 11,000 < 0.50 < 60 < 50 - 332 < 60 < 10
GL12-1-20140604 2014 06 04 - 4,090 - - - 9,790 - - < 15a 493 62 694 2,280 55.7 1,290 < 0.50 8.6 < 20 < 10a < 200 0.47 < 2.5 6.31 47.7 < 1.0 213 < 0.20 48.4 32 < 5.0 < 0.050 11,100 < 0.50 < 60 < 50 - 278 < 60 < 10
GL12-1-20141118 2014 11 18 - 3,910 - - - 9,400 - - < 15a 467 786 667 4,640 42.8 1,240 < 0.50 6.1 < 30 < 15a < 300 < 0.25 < 2.5 30 3.8 < 1.0 192 < 0.20 47.6 30.7 < 5.0 < 0.050 11,500 < 0.50 < 90 < 50 - 343 < 90 < 15
GL12-1-20150609 2015 06 09 7.68 3,880 - - - 7,990 - - < 10 503 4,410 638 8,750 32.7 982 < 0.50 17.1 22 < 10a < 200 < 0.050 0.83 13 1.4 < 1.0 185 < 0.20 41.5 39.2 < 1.0 < 0.050 10,600 0.073 < 60 < 50 - 312 < 60 < 10
DUP3-20150609 Duplicate 7.64 3,900 - - - 8,000 - - 10 502 4,340 642 8,580 31.8 969 < 0.50 16.9 21 < 10a < 200 < 0.050 0.72 12.7 1.4 < 1.0 176 < 0.20 40.6 39 < 1.0 < 0.050 10,500 0.083 < 60 < 50 - 304 < 60 < 10
QA/QC RPD% 1 1 - - - 0 - - * 0 2 1 2 3 1 * 1 5 * * * * 2 0 * 5 * 2 1 * * 1 13 * * - 3 * *
GL12-1-20151104 2015 11 04 7.31 3,480 - - - 8,290 - - < 10 451 3,880 572 4,230 32.1 982 < 0.50 9.3 < 20 < 10a < 200 < 0.050 < 0.50 10.6 1.1 < 1.0 161 < 0.20 33 27.7 < 1.0 < 0.050 10,500 0.153 < 60 < 50 - 263 < 60 < 10
GL12-1-20160524 2016 05 24 7.14 3,840 - - - 8,210 - - 23 497 8,900 631 10,100 57.3 1,070 < 0.50 16.7 25 < 10a < 200 < 0.050 1.8 9.8 < 1.0a < 1.0 179 < 0.20 30.4 29.5 < 1.0 < 0.050 11,000 < 0.050 < 60 62 - 204 < 60 < 10
GL12-1-20160921 2016 09 21 7.34 3,590 - - - 8,290 - - 103 481 5,340 579 13,800 87.8 983 < 0.50 16.5 32 < 10a 330 < 0.050 3.26 5.4 < 1.0a < 1.0 188 < 0.20 15.6 28.6 < 1.0 < 0.050 10,400 < 0.050 < 60 < 50 - 207 < 60 < 10
GL12-1-20170529 2017 05 29 7.17 2,610 - - - 7,280 - - 293 378 6,070 404 8,180 195 712 0.66 31.7 37 < 5.0a 540 < 0.050 12.8 4.08 1 < 1.0 137 < 0.20 10.6 25.2 < 1.0 < 0.050 7,740 < 0.050 < 30 < 50 - 120 < 30 < 5.0
GL12-1-20170926 2017 09 26 7.39 3,240 - - - 6,500 - - 86 449 12,700 513 11,600 145 805 < 0.50 24.2 40 < 10a 340 < 0.050 6.58 4.92 1.5 < 1.0 133 < 0.20 14.9 23.4 < 1.0 < 0.050 9,860 < 0.050 < 60 < 50 - 127 < 60 < 10
GL12-1-180604 2018 06 04 7.31 3,390 6.73 - 58,741 6,950 382 0.0074 19.6 469 8,590 539 15,000 87.9 805 < 0.20 10.7 39.4 < 0.10 201 0.030 3.31 3.43 0.50 < 0.20 118 < 0.010 24.2 17.6 0.50 < 0.050 10,600 0.030 < 0.20 5.9 < 1.0 151 4.2 < 4.0
GL12-1-180919 2018 09 19 7.07 3,890 6.99 - 5,880 7,730 190 < 0.0050 20.8 521 19,600 628 15,700 79.2 919 < 0.20 24.0 45.8 < 0.10 167 0.017 3.34 4.79 0.56 < 0.20 143 < 0.010 29.3 21.3 < 0.50 < 0.050 10,800 < 0.020 < 0.20 7.8 < 1.0 205 6.0 < 4.0
GL12-1-190527 2019 05 27 7.49 3,850 6.75 - 8,360 7,860 155 0.0125 17.4 474 12,500 648 14,800 66.6 909 < 0.20 13.3 37.2 < 0.10 137 0.026 2.99 4.60 0.55 < 0.20 128 < 0.010 30.7 20.9 < 0.50 < 0.050 12,300 0.021 < 0.20 < 5.0 < 1.0 225 3.0 < 4.0
GL12-1-190919 2019 09 19 7.43 3,830 6.81 - 7,380 7,920 175 - 12.4 500 20,500 626 16,700 61.4 859 < 0.20 24.2 35.0 < 0.10 117 < 0.010 2.53 4.91 0.41 < 0.20 126 < 0.010 28.5 20.3 < 0.50 < 0.050 13,100 < 0.020 < 0.20 < 5.0 < 1.0 227 3.6 < 4.0
GL12-1-200610 2020 06 10 7.39 4,490 6.78 - 6,947 8,040 203 - < 100a 583 19,700 736 22,000 85.1 780 < 5.00 21.0 48.7 < 1.00 214 < 0.200 < 10.0a 4.54 < 10.0a < 5.00 144 < 0.010 21.2 27.1 < 10.0 < 1.00 13,600 < 0.400 < 5.00 < 20.0 < 20.0 288 < 20.0 < 100
GL12-1-201102 2020 11 02 7.51 4,720 6.64 - 8,081 8,040 179 - 15.9 642 24,400 757 21,300 82.4 895 0.114 22.0 43.9 0.073 94.2 0.0075 1.99 5.17 0.50 < 0.050 133 < 0.010 21.4 24.7 0.51 < 0.010 15,000 0.0204 < 0.050 2.44 < 0.20 260 1.84 1.3
GL13-1 GL13-1-20091117 2009 11 17 - 3,530 - - - - - - 74 278 200 689 325 21 1,640 < 2 3 < 10 < 0.4 < 40 0.18 < 4 1 < 10a < 1 90 - 53 10 < 6 < 0.10 7,550 < 0.1 5 < 10 - 142 < 1 < 10
GL13-1-20100811 2010 08 11 - 3,550 - - - 11,200 - - 79 308 340 675 138 22 1,660 < 2 3 < 10 < 0.4 < 40 < 0.1 < 4 0.9 < 10a < 1 80 - 43 20 < 6 < 0.1 8,060 < 0.1 < 1 < 100 - 128 1 < 10
GL13-1-20110627 2011 06 27 - 3,950 - - - 10,800 - - < 50a 326 47 762 207 20.2 1,760 < 2 2 < 10 < 0.4 < 40 0.13 < 4 1.4 < 10a < 1 100 - 44 10 < 6 < 0.10 8,180 < 0.1 < 1 < 10 - 178 1 20
Associated CARO file(s): 8052631, 8052802, 8060237, 8060737, 8061100, 8081412, 8091680, 8092458, 8092618, 9052219, 9052399, 9052558, 9052754, 9052937, 9060273, 9091657, 9092001, 9092208, 9092404, 9120616.
Associated Exova file(s): 622178, 653600, 712940, 714233, 714243, 756693, 756810, 757047, 811364, 811710, 812030, 812741, 812985, 846260, 878316, 879073, 909346, 909448, 909654.
All terms defined within the body of SNC-Lavalin's report.
< Denotes concentration less than indicated detection limit or RPD less than indicated value.a Laboratory detection limit exceeds regulatory standard/guideline.
- Denotes analysis not conducted.b Standard to protect freshwater aquatic life.
n/a Denotes no applicable standard/guideline.c Guideline to protect irrigation water. Guideline for surface water, shown here for comparison purposes only.
QA/QC RPD Denotes quality assurance/quality control relative percent differenced Guideline to protect freshwater aquatic life, long-term average (i.e. "chronic"). Guideline for surface water, shown here for comparison purposes only.
* RPDs are not calculated where one or more concentrations are less than five times RDL.e Guideline to protect freshwater aquatic life, short-term maximum (i.e. "acute"). Guideline for surface water, shown here for comparison purposes only.
RDL Denotes reported detection limit.f There is no Zinc standard specified for H > 400; therefore, the standard for H=300-<400 is applied as a conservative comparison.g Individual standards exist for Cr +3 and Cr +6. Reported value represents more stringent standard.
BOLD Concentration greater than CSR Aquatic Life (AW) standardh Only applies for specific Schedule 2 Site Activities; verify for your site.
SHADED Concentration greater than CSR Irrigation Watering (IW) standardi Guideline is temperature, pH, DOC and hardness dependent. Calculate using BLM software!
RED Concentration greater than BCWQG Irrigation Water (IW) guidelinej Guideline is pH dependent
BLUE SHADED Concentration greater than BCWQG Aquatic Life Long-Term Average (AW) guidelinek Guideline is hardness dependent
BLUE SHADED Concentration greater than BCWQG Aquatic Life Short-term Maximum (AW) guideline l Conductivity guidelines varies with crop. Guideline range 700-5,000, most stringent guideline for low tolerance crops applied (strawberry, raspberry, bean and carrot.
SNC-LAVALIN INC. Page 7 of 15
662036 / 2021 02 0920210309_662036_TAB_Historical.xlsx
QAQC CN 2021 03 09

TABLE V.2: Historical Summary of Analytical Results for Groundwater - Dissolved Metals
Physical Parameters Dissolved Metals
Sample Sample Sample Date pH
To
tal
Ha
rdn
ess
pH
(fi
eld
)
Co
nd
ucti
vit
y
Fie
ld
Co
nd
ucti
vit
y
To
tal
Dis
so
lve
d
So
lid
s
Dis
so
lve
d
Org
an
ic
Ca
rbo
n
Ph
osp
hate
Dis
so
lve
d
Alu
min
um
Dis
so
lve
d
Ca
lciu
m
Dis
so
lve
d Iro
n
Dis
so
lve
d
Mag
nes
ium
Dis
so
lve
d
Man
gan
ese
Dis
so
lve
d
Po
tass
ium
Dis
so
lve
d
So
diu
m
An
tim
on
y
Ars
en
ic
Ba
riu
m
Be
rylliu
m
Bo
ron
Ca
dm
ium
Ch
rom
ium
Co
ba
lt
Co
pp
er
Le
ad
Lit
hiu
m
Merc
ury
Mo
lyb
den
um
Nic
ke
l
Se
len
ium
Sil
ve
r
Str
on
tiu
m
Th
all
ium
Tin
Tit
an
ium
Tu
ng
ste
n
Ura
niu
m
Va
nad
ium
Zin
cf
Location ID (yyyy mm dd) pH mg/L pH µS/cm µS/cm mg/L mg/L mg/L µg/L mg/L µg/L mg/L µg/L mg/L mg/L µg/L µg/L µg/L µg/L µg/L µg/L µg/L µg/L µg/L µg/L µg/L µg/L µg/L µg/L µg/L µg/L µg/L µg/L µg/L µg/L µg/L µg/L µg/L µg/L
BC Guideline
CSR Aquatic Life (AW)b n/a n/a n/a n/a n/a n/a n/a n/a n/a n/a n/a n/a n/a n/a n/a 90 50 10,000 1.5 12,000 0.5-4k 10g 40 20-90k40-
160k n/a 0.25 10,000250-
1,500k 20 0.5-15k n/a 3 n/a 1,000 n/a 85 n/a
75-
2,400k
CSR Irrigation Watering (IW) n/a n/a n/a n/a n/a n/a n/a n/a 5,000 n/a 5,000h n/a 200h n/a n/a n/a 100 n/a 100 500 5 5g 50 200 200 2,500 1 10 200 20 n/a n/a n/a n/a n/a n/a 10 1001,000-
5,000j
BCWQG Irrigation Water (IW)c 5.0 - 9.0 n/a 5.0 - 9.0 700 - 5,000l 700 - 5,000l n/a n/a n/a n/a n/a n/a n/a n/a n/a n/a n/a n/a n/a n/a n/a n/a n/a n/a n/a n/a n/a n/a n/a n/a n/a n/a n/a n/a n/a n/a n/a n/a n/a n/a
BCWQG Aquatic Life Long-Term Average (AW)d 6.5 - 9.0 n/a 6.5 - 9.0 n/a n/a n/a n/a n/a 5 - 50 n/a n/a n/a n/a n/a n/a n/a n/a n/a n/a n/a 0.017 - 0.46 n/a n/a 0.2i n/a n/a n/a n/a n/a n/a n/a n/a n/a n/a n/a n/a n/a n/a n/a
BCWQG Aquatic Life Short-term Maximum (AW)e 6.5 - 9.0 n/a 6.5 - 9.0 n/a n/a n/a n/a n/a 20 - 100 n/a 350 (max) n/a n/a n/a n/a n/a n/a n/a n/a n/a 0.038 - 2.8 n/a n/a 0.2i n/a n/a n/a n/a n/a n/a n/a n/a n/a n/a n/a n/a n/a n/a n/a
GL13-1 GL13-1-20111217 2011 12 17 - 3,500 - - - 10,900 - - < 50a 292 < 5 673 46 19 1,610 < 2 4 < 10 < 0.4 < 40 0.12 7 0.4 10 < 1 120 - 55 20 < 6 < 0.10 9,590 0.43 < 1 < 10 - 193 4 < 10
(Cont'd) DUPC-20111217 Duplicate - 113 - - - 1,570 - - < 50a 19.2 453 15.8 83 11.8 555 < 2 4 220 < 0.4 70 < 0.1 10 0.2 < 10a < 1 250 - < 1 < 10 < 6 < 0.10 4,020 0.31 < 1 < 10 - < 4 4 < 10
QA/QC RPD% - 187 - - - 150 - - * 175 * 191 57 47 97 * * * * * * 35 * * * 70 - * * * * 82 32 * * - * 0 *
GL13-1-20120625 2012 06 25 - 3,580 - - - 9,930 - - < 50a 305 < 50 684 520 20 1,670 < 2 < 2 < 10 < 0.4 < 40 0.2 < 4 0.7 < 10a < 1 80 - 50 10 9 < 0.10 8,250 < 0.1 < 1 < 100 - 124 1 10
GL13-1-20121204 2012 12 04 - 3,440 - - - 9,990 - - < 50a 284 < 50 664 23 18.3 1,660 < 2 < 2.0 < 10 < 0.40 < 40 < 0.10 7.6 8.8 10 < 1.0 60 - 45.8 < 10 7.3 < 0.10 8,720 < 0.10 < 1.0 < 100 - 194 2.72 < 10
GL14-1 GL14-1-20091116 2009 11 16 - 40 - - - - - - 535 5.8 490 6.2 42 1.1 381 < 2 3 20 < 0.4 190 < 0.1 < 4 0.5 < 10a < 1 140 - 9 < 10 < 6 < 0.10 1,470 < 0.1 < 1 < 10 - < 4 8 20
GL14-1-20100811 2010 08 11 - 40 - - - 1,120 - - 146 5 150 6 32 3 399 < 2 3 20 < 0.4 200 < 0.10 < 4 0.4 < 10a < 1 130 - 9 < 10 < 6 < 0.1 1,470 < 0.1 < 1 < 100 - < 4 9 < 10
GL14-1-20110704 2011 07 04 - 48 - - - 1,100 - - 87 7.3 72 7.2 41 1.6 413 < 0.2 2.2 19 < 0.04 185 0.02 16.9 0.36 2 < 0.1 121 - 8.2 < 1 19 < 0.01 1,390 < 0.01 < 0.1 < 10 - 1.3 9.4 2
GL14-1-20120627 2012 06 27 - 40 - - - - - - < 50a 6 330 6 < 10 < 1 424 < 2 < 2 20 < 0.4 200 < 0.1 4 < 0.2 < 10a < 1 130 - 5 < 10 < 6 < 0.10 1,490 < 0.1 < 1 < 100 - < 4 5 < 10
GL14-1-20120704 2012 07 04 - - - - - 1,120 - - - - - - - - - - - - - - - - - - - - - - - - - - - - - - - - -
GL14-1-20121204 2012 12 04 - 35 - - - 1,190 - - 659 5.36 483 5.35 26 1.1 418 < 2.0 < 2.0 20 < 0.40 210 < 0.10a 6.7 9.04 < 10a < 1.0 110 - 8.44 < 10 < 6.0 < 0.10 1,510 < 0.10 < 1.0 36 - < 4.0 7.42 < 10
GL15-1 GL15-1-20091117 2009 11 17 - 702 - - - - - - < 50a 101 < 100 109 21 2.9 163 < 2 < 2 70 < 0.4 < 40 0.2 < 4 0.4 < 10a < 1 20 - 6 < 10 < 6 < 0.10 5,710 < 0.1 < 1 < 10 - 31 2 < 10
GL30-3-20091117 Duplicate - 662 - - - - - - < 50a 94.5 < 100 104 20 2.5 157 < 2 < 2 60 < 0.4 < 40 < 0.1 < 4 0.4 20 < 1 20 - 6 < 10 < 6 < 0.10 5,710 < 0.1 < 1 < 10 - 30 2 10
QA/QC RPD% - 6 - - - - - - * 7 * 5 5 * 4 * * 15 * * * * * * * 0 - 0 * * * 0 * * * - 3 0 *
GL15-1-20140604 2014 06 04 - 335 - - - 782 - - < 10a 31.9 < 30 62.1 67 < 2.0 176 < 0.50 < 1.0 29 < 5.0a < 100 0.339 < 0.50 < 0.50 < 1.0a < 1.0 < 50 < 0.20 5.7 < 5.0 < 1.0 < 0.050 3,260 < 0.20 < 30 < 50 - 5.16 < 30 < 5.0
GL15-1-20141117 2014 11 17 - 340 - - - 793 - - < 10a 32.3 < 30 63.1 148 < 2.0 178 < 0.50 < 1.0 31 < 5.0a < 100 < 0.050 < 0.50 0.5 < 1.0a < 1.0 < 50 < 0.20 6 < 5.0 < 1.0 < 0.050 3,440 < 0.20 < 30 < 50 - 5.76 < 30 < 5.0
GL15-1-20150610 2015 06 10 8.32 339 - - - 959 - - < 10 32.7 < 30 62.4 88 < 2.0 191 < 0.50 < 1.0 28 < 5.0a < 100 0.136 < 0.50 < 0.50 < 1.0a < 1.0 < 50 < 0.20 5.6 < 5.0 < 1.0 < 0.050 3,550 < 0.010 < 30 < 50 - 5.13 < 30 < 5.0
DUP4-20150610 Duplicate 8.3 326 - - - 804 - - < 10 32.4 < 30 59.7 85 < 2.0 188 < 0.50 < 1.0 28 < 5.0a < 100 0.141 < 0.50 < 0.50 < 1.0a < 1.0 < 50 < 0.20 5.9 < 5.0 < 1.0 < 0.050 3,540 < 0.010 < 30 < 50 - 5.23 < 30 < 5.0
QA/QC RPD% 0 4 - - - 18 - - * 1 * 4 3 * 2 * * 0 * * 4 * * * * * * 5 * * * 0 * * * - 2 * *
GL15-1-20151103 2015 11 03 8.12 336 - - - 814 - - < 10 32.8 73 61.7 210 < 2.0 189 < 0.50 < 1.0 32 < 5.0a < 100 < 0.050 < 0.50 1.69 < 1.0a < 1.0 < 50 < 0.20 5.8 < 5.0 < 1.0 < 0.050 3,700 < 0.010 < 30 < 50 - 5.66 < 30 < 5.0
GL15-1-20160920 2016 09 20 8.01 385 - - - 874 - - < 10 36.3 < 30 71.3 24 < 2.0 182 < 0.50 < 1.0 36 < 5.0a < 100 0.363 < 0.50 < 0.50 < 1.0a < 1.0 < 50 < 0.20 5.9 < 5.0 < 1.0 < 0.050 3,850 0.012 < 30 < 50 - 6.74 < 30 < 5.0
GL15-1-20170925 2017 09 25 8.1 326 - - - 767 - - < 10 31.9 < 30 59.8 20 < 2.0 175 < 0.50 < 1.0 28 < 5.0a < 100 0.141 < 0.50 < 0.50 < 1.0a < 1.0 < 50 < 0.20 5.4 < 5.0 < 1.0 < 0.050 3,480 < 0.010 < 30 < 50 - 5.97 < 30 < 5.0
GL15-1-180928 2018 09 28 7.87 333 7.47 - 1,320 819 1.75 < 0.0050 5.8 31.3 < 10 61.8 32.8 1.44 177 < 0.20 < 0.50 27.6 < 0.10 9.0 0.038 < 0.50 < 0.10 < 0.40a < 0.20 17.8 < 0.010 5.71 < 0.40 < 0.50 < 0.050 3,470 < 0.020 < 0.20 < 5.0 < 1.0 5.67 < 1.0 < 4.0
GL15-1-190924 2019 09 24 8.09 327 7.35 - 1,259 826 1.68 - < 5.0 31.0 < 10 60.6 45.2 1.55 173 < 0.20 < 0.50 30.5 < 0.10 14.0 0.020 < 0.50 < 0.10 0.14 < 0.20 17.8 < 0.010 6.18 0.63 < 0.50 < 0.050 3,690 < 0.020 < 0.20 < 5.0 < 1.0 6.04 1.0 < 4.0
GL15-1-201104 2020 11 04 7.80 1,530 7.18 - 3,904 3,210 10.8 - < 1.0 220 5.9 238 52.1 5.5 437 0.261 0.633 136 < 0.010 16.1 0.528 0.37 0.526 4.01 < 0.050 32.5 < 0.010 10.2 4.73 19.9 < 0.010 12,900 0.0152 < 0.050 < 0.20 < 0.20 95.8 5.75 2.2
GL15-2 GL15-2-20110704 2011 07 04 - 2,090 - - - 3,760 - - < 5 261 10 350 < 1 10 406 < 0.2 1.3 18 < 0.04 17 0.15 17.8 0.67 5 < 0.1 39 - 11.7 23 49.8 < 0.01 7,230 0.03 < 0.1 < 10 - 149 5.9 6
GL15-2-20120627 2012 06 27 - 3,300 - - - 6,180 - - < 50a 397 400 562 < 10 10 590 < 2 < 2 20 < 0.4 < 40 < 0.1 7 < 0.2 < 10a < 1 40 - 7 < 10 32 < 0.10 9,840 < 0.1 < 1 < 100 - 258 2 < 10
GL15-2-20121205 2012 12 05 - 3,580 - - - 6,750 - - 54 414 < 5 618 < 1 9.1 670 < 2.0 < 2.0 20 < 0.40 40 0.1 9 < 0.20 < 10a < 1.0 60 - 12.7 < 10 34.9 < 0.10 10,400 < 0.10 < 1.0 < 1,000 - 332 2.65 < 10
GL15-2-20130708 2013 07 08 - 3,920 - - - 7,970 - - < 15a 423 < 60 696 < 10 14.1 786 < 0.50 < 1.0 < 20 < 10a < 200 < 0.25 5.9 < 0.50 2.6 < 1.0 58 < 0.20 13 < 5.0 47.3 < 0.050 8,850 < 0.50 < 60 < 50 - 393 < 60 < 10
GL15-2-20140604 2014 06 04 - 3,290 - - - 7,380 - - < 15a 346 < 60 588 < 10 12.5 763 < 0.50 < 1.0 < 20 < 10a < 200 < 0.25 5.5 < 0.50 < 2.5a < 1.0 61 < 0.20 12.2 < 5.0 36.4 < 0.050 7,560 < 0.50 < 60 < 50 - 336 < 60 < 10
GL15-2-20141117 2014 11 17 - 3,250 - - - 6,750 - - < 15a 339 < 60 584 < 10 13.2 720 < 0.50 < 1.0 < 20 < 10a < 200 0.55 4.2 < 0.50 2.6 < 1.0 51 < 0.20 13.1 < 5.0 30.3 < 0.050 7,680 < 0.50 < 60 < 50 - 316 < 60 < 10
GL15-2-20150610 2015 06 10 7.84 3,700 - - - 7,960 - - < 10 393 < 60 661 < 10 13 814 < 0.50 < 1.0 < 20 < 10a < 200 0.276 6.68 < 0.50 2.3 < 1.0 < 50 < 0.20 12.5 < 5.0 41.9 < 0.050 8,660 < 0.050 < 60 < 50 - 349 < 60 < 10
GL15-2-20151103 2015 11 03 7.5 3,910 - - - 7,970 - - < 10 409 < 60 703 < 10 13.3 858 < 0.50 < 1.0 < 20 < 10a < 200 0.129 6.98 < 0.50 2.7 < 1.0 < 50 < 0.20 14.1 < 5.0 44.1 < 0.050 9,520 < 0.050 < 60 < 50 - 383 < 60 < 10
GL15-2-20160920 2016 09 20 7.4 5,010 - - - 10,400 - - < 10 458 < 150 938 < 25 16 1,150 < 0.50 < 1.0 < 50 < 25a < 500 0.06 9.67 < 0.50 2.8 < 1.0 63 < 0.20 14.1 < 5.0 62.8 < 0.050 11,400 < 0.050 < 150 < 50 - 511 < 150a < 25
GL15-2-20170925 2017 09 25 7.59 4,190 - - - 8,470 - - < 10 368 < 60 795 < 10 15.1 1,070 < 0.50 < 1.0 < 20 < 10a < 200 0.061 8.64 < 0.50 3 < 1.0 55 < 0.20 15 < 5.0 51.9 < 0.050 8,810 < 0.050 < 60 < 50 - 423 < 60 < 10
GL15-2-180928 2018 09 28 7.41 3,300 6.88 - 7,089 6,990 15.4 < 0.0050 < 5.0 284 < 10 629 < 0.20 13.9 992 < 0.20 0.73 12.8 < 0.10 12.2 0.041 4.77 0.19 2.92 < 0.20 49.2 < 0.010 17.8 1.69 19.3 < 0.050 6,020 < 0.020 < 0.20 < 5.0 < 1.0 318 2.1 < 4.0
GL15-2-190924 2019 09 24 7.70 3,470 6.77 - 7,047 7,220 12.2 - < 5.0 336 < 10 638 0.28 13.0 794 < 0.20 0.72 20.1 < 0.10 17.0 0.045 5.62 0.19 2.61 < 0.20 52.8 < 0.010 17.4 1.66 28.3 < 0.050 8,810 < 0.020 < 0.20 < 5.0 < 1.0 355 2.0 < 4.0
GL15-2-201104 2020 11 04 7.69 6,230 6.94 - 10,680 11,900 19.0 - 1.1 538 < 2.0 1,190 0.088 20.3 1,630 0.103 0.950 20.8 < 0.010 9.8 0.0432 22.4 0.297 4.75 < 0.050 64.9 < 0.010 21.3 2.80 82.1 < 0.010 14,900 0.0104 < 0.050 < 0.20 0.32 549 2.84 < 1.0
DUP2-201104 Duplicate 7.67 6,360 - - - 11,200 19.5 - 1.0 542 < 2.0 1,220 0.091 20.6 1,660 0.107 0.948 21.4 < 0.010 9.5 0.0446 22.6 0.296 4.78 < 0.050 64.5 < 0.010 21.0 2.80 79.3 < 0.010 14,100 0.0101 < 0.050 < 0.20 0.32 545 2.80 < 1.0
QA/QC RPD% 0 2 - - - 6 3 - * 1 * 2 * 1 2 * 0 3 * * 3 1 0 1 * 1 * 1 0 3 * 6 * * * * 1 1 *
GL16-1 GL 16-1-20091111 2009 11 11 - 1,840 - - - - - - 124 180 620 339 960 28 26.8 < 2 15 10 < 0.4 60 0.14 < 4 2.6 < 10a < 1 320 - 15 10 < 6 < 0.10 21,100 < 0.1 < 1 < 10 - 5 2 10
GL 16-1-20111217 2011 12 17 - 987 - - - 4,500 - - < 50a 108 < 5 174 40 18.4 991 2 5 10 < 0.4 80 0.21 7 < 0.2 10 < 1 320 - 15 < 10 < 6 < 0.10 20,600 0.34 < 1 < 10 - 12 4 < 10
GL16-1-20100811 2010 08 11 - 1,700 - - - 6,750 - - 379 174 450 307 1,060 27 1,470 < 2 6 10 < 0.4 70 < 0.1 < 4 2.2 < 10a < 1 260 - 12 10 < 6 < 0.1 19,800 < 0.1 < 1 < 100 - 13 2 < 10
GL16-1-20110627 2011 06 27 - 1,210 - - - 4,780 - - < 50a 127 7 216 58 21.1 1,130 < 2 4 20 < 0.4 80 < 0.1 < 4 0.2 < 10a < 1 300 - 15 < 10 < 6 < 0.1 20,600 < 0.1 < 1 < 10 - 13 1 < 10
GL30-1-20110627 Duplicate - 1,200 - - - 4,790 - - < 50a 130 15 214 63 21.8 1,130 < 2 4 20 < 0.4 60 < 0.1 < 4 0.7 < 10a < 1 290 - 14 < 10 < 6 < 0.10 20,200 < 0.1 < 1 < 10 - 13 < 1 10
QA/QC RPD% - 1 - - - 0 - - * 2 * 1 8 3 0 * 0 0 * 29 * * * * * 3 - 7 * * * 2 * * * - 0 * *
GL16-1-20120626 2012 06 26 - 1,260 - - - 4,490 - - < 50a 143 2,400 220 900 23 1,120 < 2 21 20 < 0.4 50 < 0.1 < 4 1.9 < 10a < 1 270 - 12 < 10 < 6 < 0.10 23,200 < 0.1 < 1 < 100 - 10 2 10
GL16-1-20121204 2012 12 04 - 1,020 - - - 4,170 - - < 50a 103 4,510 186 1,020 18 1,030 < 2.0 23 20 < 0.40 70 < 0.10 9.6 1.77 < 10a < 1 230 - 10.6 < 10 < 6.0 < 0.10 20,800 < 0.10 < 1.0 < 10 - 9.2 2.94 < 10
GL16-1-20130626 2013 06 26 - 1,040 - - - 4,200 - - < 15a 123 1,380 179 821 20.9 1,060 < 0.50 16.4 < 20 < 10a < 200 < 0.25 < 2.5 1.56 < 2.5a < 1.0 267 < 0.20 14.7 < 5.0 < 5.0 < 0.050 17,800 < 0.50 < 60 < 50 - 10.3 < 60 < 10
Associated CARO file(s): 8052631, 8052802, 8060237, 8060737, 8061100, 8081412, 8091680, 8092458, 8092618, 9052219, 9052399, 9052558, 9052754, 9052937, 9060273, 9091657, 9092001, 9092208, 9092404, 9120616.
Associated Exova file(s): 622178, 653600, 712940, 714233, 714243, 756693, 756810, 757047, 811364, 811710, 812030, 812741, 812985, 846260, 878316, 879073, 909346, 909448, 909654.
All terms defined within the body of SNC-Lavalin's report.
< Denotes concentration less than indicated detection limit or RPD less than indicated value.a Laboratory detection limit exceeds regulatory standard/guideline.
- Denotes analysis not conducted.b Standard to protect freshwater aquatic life.
n/a Denotes no applicable standard/guideline.c Guideline to protect irrigation water. Guideline for surface water, shown here for comparison purposes only.
QA/QC RPD Denotes quality assurance/quality control relative percent differenced Guideline to protect freshwater aquatic life, long-term average (i.e. "chronic"). Guideline for surface water, shown here for comparison purposes only.
* RPDs are not calculated where one or more concentrations are less than five times RDL.e Guideline to protect freshwater aquatic life, short-term maximum (i.e. "acute"). Guideline for surface water, shown here for comparison purposes only.
RDL Denotes reported detection limit.f There is no Zinc standard specified for H > 400; therefore, the standard for H=300-<400 is applied as a conservative comparison.g Individual standards exist for Cr +3 and Cr +6. Reported value represents more stringent standard.
BOLD Concentration greater than CSR Aquatic Life (AW) standardh Only applies for specific Schedule 2 Site Activities; verify for your site.
SHADED Concentration greater than CSR Irrigation Watering (IW) standardi Guideline is temperature, pH, DOC and hardness dependent. Calculate using BLM software!
RED Concentration greater than BCWQG Irrigation Water (IW) guidelinej Guideline is pH dependent
BLUE SHADED Concentration greater than BCWQG Aquatic Life Long-Term Average (AW) guidelinek Guideline is hardness dependent
BLUE SHADED Concentration greater than BCWQG Aquatic Life Short-term Maximum (AW) guideline l Conductivity guidelines varies with crop. Guideline range 700-5,000, most stringent guideline for low tolerance crops applied (strawberry, raspberry, bean and carrot.
SNC-LAVALIN INC. Page 8 of 15
662036 / 2021 02 0920210309_662036_TAB_Historical.xlsx
QAQC CN 2021 03 09

TABLE V.2: Historical Summary of Analytical Results for Groundwater - Dissolved Metals
Physical Parameters Dissolved Metals
Sample Sample Sample Date pH
To
tal
Ha
rdn
ess
pH
(fi
eld
)
Co
nd
ucti
vit
y
Fie
ld
Co
nd
ucti
vit
y
To
tal
Dis
so
lve
d
So
lid
s
Dis
so
lve
d
Org
an
ic
Ca
rbo
n
Ph
osp
hate
Dis
so
lve
d
Alu
min
um
Dis
so
lve
d
Ca
lciu
m
Dis
so
lve
d Iro
n
Dis
so
lve
d
Mag
nes
ium
Dis
so
lve
d
Man
gan
ese
Dis
so
lve
d
Po
tass
ium
Dis
so
lve
d
So
diu
m
An
tim
on
y
Ars
en
ic
Ba
riu
m
Be
rylliu
m
Bo
ron
Ca
dm
ium
Ch
rom
ium
Co
ba
lt
Co
pp
er
Le
ad
Lit
hiu
m
Merc
ury
Mo
lyb
den
um
Nic
ke
l
Se
len
ium
Sil
ve
r
Str
on
tiu
m
Th
all
ium
Tin
Tit
an
ium
Tu
ng
ste
n
Ura
niu
m
Va
nad
ium
Zin
cf
Location ID (yyyy mm dd) pH mg/L pH µS/cm µS/cm mg/L mg/L mg/L µg/L mg/L µg/L mg/L µg/L mg/L mg/L µg/L µg/L µg/L µg/L µg/L µg/L µg/L µg/L µg/L µg/L µg/L µg/L µg/L µg/L µg/L µg/L µg/L µg/L µg/L µg/L µg/L µg/L µg/L µg/L
BC Guideline
CSR Aquatic Life (AW)b n/a n/a n/a n/a n/a n/a n/a n/a n/a n/a n/a n/a n/a n/a n/a 90 50 10,000 1.5 12,000 0.5-4k 10g 40 20-90k40-
160k n/a 0.25 10,000250-
1,500k 20 0.5-15k n/a 3 n/a 1,000 n/a 85 n/a
75-
2,400k
CSR Irrigation Watering (IW) n/a n/a n/a n/a n/a n/a n/a n/a 5,000 n/a 5,000h n/a 200h n/a n/a n/a 100 n/a 100 500 5 5g 50 200 200 2,500 1 10 200 20 n/a n/a n/a n/a n/a n/a 10 1001,000-
5,000j
BCWQG Irrigation Water (IW)c 5.0 - 9.0 n/a 5.0 - 9.0 700 - 5,000l 700 - 5,000l n/a n/a n/a n/a n/a n/a n/a n/a n/a n/a n/a n/a n/a n/a n/a n/a n/a n/a n/a n/a n/a n/a n/a n/a n/a n/a n/a n/a n/a n/a n/a n/a n/a n/a
BCWQG Aquatic Life Long-Term Average (AW)d 6.5 - 9.0 n/a 6.5 - 9.0 n/a n/a n/a n/a n/a 5 - 50 n/a n/a n/a n/a n/a n/a n/a n/a n/a n/a n/a 0.017 - 0.46 n/a n/a 0.2i n/a n/a n/a n/a n/a n/a n/a n/a n/a n/a n/a n/a n/a n/a n/a
BCWQG Aquatic Life Short-term Maximum (AW)e 6.5 - 9.0 n/a 6.5 - 9.0 n/a n/a n/a n/a n/a 20 - 100 n/a 350 (max) n/a n/a n/a n/a n/a n/a n/a n/a n/a 0.038 - 2.8 n/a n/a 0.2i n/a n/a n/a n/a n/a n/a n/a n/a n/a n/a n/a n/a n/a n/a n/a
GL16-1 GL16-1-20131113 2013 11 13 - 949 - - - 4,160 - - < 15a 104 91 168 90 19.9 945 < 0.50 7.1 < 20 < 5.0a < 100 < 0.25 < 2.5 < 0.50 < 2.5a < 1.0 256 < 0.20 15.2 12.7 < 5.0 < 0.050 15,800 < 0.50 < 30 < 50 - 10 < 30 < 5.0
(Cont'd) GL16-1-20140605 2014 06 05 - 930 - - - 3,880 - - < 15a 108 860 160 767 19.5 972 < 0.50 12.2 < 20 < 10a < 200 < 0.25 < 2.5 1.14 < 2.5a < 1.0 266 < 0.20 13.2 < 5.0 < 5.0 < 0.050 17,200 < 0.50 < 60 < 50 - 8.43 < 60 < 10
GL16-1-20141118 2014 11 18 - 845 - - - 3,830 - - < 15a 92.3 256 149 277 19.5 950 < 0.50 8.7 < 20 < 5.0a < 100 < 0.25 < 2.5 < 0.50 < 2.5a < 1.0 268 < 0.20 15.5 < 5.0 < 5.0 < 0.050 15,900 < 0.50 < 30 < 50 - 9.17 < 30 < 5.0
GL16-1-20150610 2015 06 10 7.96 900 - - - 3,880 - - < 10 106 1,020 154 819 19.1 933 < 0.50 14.4 < 20 < 10a < 200 0.101 < 0.50 1.24 < 1.0a < 1.0 260 < 0.20 14.4 < 5.0 < 1.0 < 0.050 16,600 < 0.050 < 60 < 50 - 9.18 < 60 < 10
GL16-1-20151103 2015 11 03 7.76 827 - - - 3,670 - - < 10 95.4 < 30 143 60 18.7 997 < 0.50 7.1 < 20 < 5.0a < 100 1.64 < 0.50 < 0.50 1.3 < 1.0 256 < 0.20 15.1 < 5.0 < 1.0 < 0.050 16,400 < 0.050 < 30 < 50 - 8.66 < 30 < 5.0
DUP3-20151103 Duplicate 7.64 828 - - - 3,630 - - < 10 95.8 < 30 143 60 18.7 993 < 0.50 6.5 < 20 < 5.0a < 100 1.61 < 0.50 < 0.50 1.1 < 1.0 254 < 0.20 14.2 < 5.0 < 1.0 < 0.050 16,200 < 0.050 < 30 < 50 - 8.1 < 30 < 5.0
QA/QC RPD% 2 0 - - - 1 - - * 0 * 0 0 0 0 * 9 * * * 2 * * 17 * 1 * 6 * * * 1 * * * - 7 * *
GL16-1-20160524 2016 05 24 7.84 803 - - - 3,470 - - < 10 90.1 < 30 140 < 10 18.7 943 < 0.50 7.5 < 20 < 5.0a < 100 0.508 < 0.50 < 0.50 < 1.0a < 1.0 250 < 0.20 15.5 < 5.0 < 1.0 < 0.050 15,200 < 0.050 < 30 < 50 - 8.88 < 30 < 5.0
GL16-1-20170525 2017 05 25 8.51 833 - - - 3,530 - - < 10 92.8 < 30 146 < 10 19.7 952 < 0.50 7.5 < 20 < 5.0a < 100 0.418 < 0.50 < 0.50 < 1.0a < 1.0 276 < 0.20 14.6 < 5.0 < 1.0 < 0.050 16,400 < 0.050 < 30 < 50 - 8.43 < 30 < 5.0
DUP2-20170525 Duplicate 8.45 847 - - - 3,510 - - < 10 93.3 < 30 149 < 10 19.8 955 < 0.50 7.3 < 20 < 5.0a < 100 0.385 < 0.50 < 0.50 < 1.0a < 1.0 280 < 0.20 14.8 < 5.0 < 1.0 < 0.050 16,400 < 0.050 < 30 < 50 - 8.37 < 30 < 5.0
QA/QC RPD% 1 2 - - - 1 - - * 1 * 2 * 1 0 * 3 * * * 8 * * * * 1 * 1 * * * 0 * * * - 1 * *
GL16-1-180604 2018 06 04 7.67 762 7.11 - 3,660 3,180 2.93 0.0072 < 5.0 96.5 < 10 126 0.45 18.1 815 < 0.20 5.98 13.4 < 0.10 71.0 0.172 < 0.50 < 0.10 0.63 < 0.20 256 < 0.010 15.5 < 0.40 < 0.50 < 0.050 15,400 < 0.020 < 0.20 < 5.0 < 1.0 7.93 < 1.0 < 4.0
GL16-1-190529 2019 05 29 7.83 756 7.03 - 4,453 3,390 3.06 < 0.0500 15.5 89.6 < 10 129 4.19 18.5 849 < 0.20 6.51 16.2 < 0.10 71.1 0.154 0.81 < 0.10 0.57 < 0.20 259 < 0.010 18.0 1.19 < 0.50 0.070 15,600 0.037 < 0.20 < 5.0 < 1.0 8.53 < 1.0 < 4.0
GL16-1-200608 2020 06 08 7.98 699 7.08 - 3,720 3,020 1.59 - 3.6 95.1 424 112 335 19.9 832 0.062 18.4 13.6 0.011 65.3 0.0570 0.60 0.567 0.93 0.200 249 < 0.010 16.7 1.05 < 0.10 < 0.010 17,200 0.0192 < 0.050 < 0.20 1.71 6.69 < 0.20 1.7
GL17-1 GL17-1-20091112 2009 11 12 - 3,390 - - - - - - 72 341 4,680 617 3,640 20 1,240 < 2 3 10 < 0.4 < 40 < 0.1 < 4 4.8 < 10a < 1 110 - 38 30 < 6 < 0.10 9,310 < 0.1 < 1 11 - 133 1 10
GL17-1-20100811 2010 08 11 - 3,280 - - - 9,080 - - < 50a 355 920 582 3,290 22 1,250 < 2 3 10 < 0.4 < 40 < 0.10 < 4 5.1 < 10a < 1 90 - 36 30 < 6 < 0.1 8,820 < 0.1 < 1 < 100 - 119 < 1 < 10
GL30-4-20100811 Duplicate - 3,170 - - - 8,730 - - 62 341 1,160 563 3,640 21 1,210 < 2 3 10 < 0.4 < 40 < 0.10 < 4 5.2 < 10a < 1 90 - 38 30 < 6 < 0.1 9,450 < 0.1 < 1 < 100 - 129 1 10
QA/QC RPD% - 3 - - - 4 - - * 4 23 3 10 5 3 * 0 0 * * * * 2 * * 0 - 5 0 * * 7 * * * - 8 * *
GL17-1-20110628 2011 06 28 - 3,580 - - - 8,930 - - < 5 381 2,170 638 3,260 17.3 1,290 < 0.2 1.8 16 < 0.04 14 0.11 1.1 7.97 4 < 0.1 94 - 35 31 3.3 < 0.01 8,700 0.01 < 0.1 < 10 - 143 0.9 9
GL17-1-20120625 2012 06 25 - 130 - - - 1,610 - - < 50a 20 880 18 70 15 582 < 2 2 220 < 0.4 40 < 0.1 4 1 < 10a < 1 200 - < 1 < 10 < 6 < 0.10 3,990 < 0.1 < 1 < 100 - < 4 2 < 10
GL17-1-20121204 2012 12 04 - 98 - - - 1,570 - - < 50a 15.9 643 14.2 111 13.2 596 < 2 3.2 220 < 0.40 40 < 0.10 11.2 6.11 < 10a < 1.0 170 - < 1.0 < 10 < 6.0 < 0.10 3,920 < 0.10 < 1.0 < 10 - < 4.0 3.33 < 10
GL17-1-20160526 2016 05 26 8.18 118 - - - 1,480 - - < 10 18.8 961 17.4 62 14.9 616 < 0.50 < 1.0 231 < 5.0a < 100 < 0.050 < 0.50 < 0.50 < 1.0a < 1.0 243 < 0.20 < 1.0 < 5.0 < 1.0 < 0.050 3,630 < 0.050 < 30 < 50 - < 0.20 < 30 < 5.0
GL17-1-20160919 2016 09 19 8.32 123 - - - 1,490 - - < 10 19.8 836 17.8 58 14 564 < 0.50 1.4 178 < 5.0a < 100 < 0.050 < 0.50 < 0.50 < 1.0a < 1.0 184 < 0.20 < 1.0 < 5.0 < 1.0 < 0.050 3,510 < 0.010 < 30 < 50 - 0.31 < 30 < 5.0
GL17-1-20170531 2017 05 31 8.13 125 - - - 1,530 - - < 10 20 1,680 18.2 69 15 614 < 0.50 2.4 216 < 5.0a < 100 < 0.050 < 0.50 < 0.50 < 1.0a < 1.0 227 < 0.20 < 1.0 < 5.0 < 1.0 < 0.050 3,840 < 0.020 < 30 < 50 - < 0.20 < 30 < 5.0
GL17-1-20170926 2017 09 26 7.95 121 - - - 1,480 - - < 10 19.5 1,430 17.5 57 14.9 563 < 0.50 2.1 212 < 5.0a < 100 < 0.050 < 0.50 < 0.50 < 1.0a < 1.0 227 < 0.20 < 1.0 < 5.0 < 1.0 < 0.050 3,720 < 0.020 < 30 < 50 - < 0.20 < 30 < 5.0
GL17-1-180604 2018 06 04 7.83 127 7.3 - 2,044 1,480 2.54 < 0.0050 < 5.0 22.0 1,250 17.4 46.5 14.4 562 < 0.20 1.64 198 < 0.10 81.8 < 0.010 < 0.50 0.26 < 0.40a < 0.20 231 < 0.010 0.42 < 0.40 < 0.50 < 0.050 3,650 < 0.020 < 0.20 < 5.0 < 1.0 0.125 < 1.0 < 4.0
GL17-1-180919 2018 09 19 7.80 130 7.5 - 2,197 1,480 2.83 < 0.0050 < 5.0 22.6 626 17.9 42.5 13.7 571 < 0.20 1.06 185 < 0.10 74.7 < 0.010 < 0.50 0.12 < 0.40a < 0.20 206 < 0.010 0.35 < 0.40 < 0.50 < 0.050 3,650 < 0.020 < 0.20 < 5.0 < 1.0 0.276 < 1.0 < 4.0
GL17-1-190527 2019 05 27 8.11 124 7.56 - 2,558 1,490 2.02 < 0.0050 < 5.0 20.8 1,450 17.4 53.8 14.2 567 < 0.20 2.22 220 < 0.10 87.1 < 0.010 0.85 0.23 < 0.40a < 0.20 237 < 0.010 0.45 0.51 < 0.50 < 0.050 4,140 < 0.020 < 0.20 < 5.0 < 1.0 0.175 < 1.0 < 4.0
DUP1-190527 Duplicate 8.13 120 7.56 - 2,558 1,470 1.76 < 0.0050 < 5.0 20.0 1,370 16.9 49.9 13.9 561 < 0.20 2.14 217 < 0.10 78.0 < 0.010 0.79 0.22 < 0.40a < 0.20 227 < 0.010 0.48 0.51 < 0.50 < 0.050 3,950 < 0.020 < 0.20 < 5.0 < 1.0 0.297 < 1.0 < 4.0
QA/QC RPD% 0 3 * - * 1 * * * 4 6 3 8 2 1 * 4 1 * 11 * * * * * 4 * * * * * 5 * * * * 52 * *
GL17-1-190923 2019 09 23 8.11 128 7.67 - 2,421 1,550 1.92 - < 5.0 21.9 1,450 17.9 54.9 14.3 583 < 0.20 2.32 215 < 0.10 89.0 < 0.010 < 0.50 0.16 < 0.10 < 0.20 252 < 0.010 0.36 < 0.40 < 0.50 < 0.050 4,040 < 0.020 < 0.20 < 5.0 < 1.0 0.144 < 1.0 < 4.0
GL17-1-200608 2020 06 08 8.20 121 7.35 - 2,138 1,590 2.32 - 1.2 22.6 1,750 15.7 46.9 15.4 629 < 0.050 3.27 218 0.015 69.1 0.0051 0.74 0.202 0.49 < 0.050 197 < 0.010 0.388 0.695 < 0.10 < 0.010 4,080 < 0.0040< 0.050 < 0.20 0.38 0.0970 < 0.20 < 1.0
GL17-1-201020 2020 10 20 8.01 132 7.43 - 2,457 1,530 2.22 - 1.4 23.9 1,790 17.4 51.3 17.4 531 < 0.050 2.61 277 0.011 52.6 < 0.0020 0.23 0.192 < 0.10 < 0.050 199 < 0.010 0.477 0.264 < 0.10 < 0.010 4,180 < 0.0040< 0.050 0.23 0.44 0.129 < 0.20 1.1
GL17-2 GL17-2-20091112 2009 11 12 - 128 - - - - - - 4,020 20.6 2,560 18.6 194 15.7 554 < 2 < 2 190 < 0.4 < 40 < 0.1 5 1.3 < 10a 1 220 - < 1 < 10 < 6 < 0.10 3,520 < 0.1 < 1 20 - < 4 6 20
GL30-2-20091112 Duplicate - 119 - - - - - - < 50a 19.3 < 100 17.2 252 14.7 569 < 2 < 2 160 < 0.4 40 < 0.1 < 4 0.6 10 < 1 230 - < 1 < 10 < 6 < 0.10 3,270 < 0.1 < 1 < 10 - < 4 1 < 10
QA/QC RPD% - 7 - - - - - - * 7 * 8 26 7 3 * * 17 * * * * 74 * * 4 - * * * * 7 * * * - * 143 *
GL17-2-20100811 2010 08 11 - 110 - - - 1,630 - - 130 19 770 17 247 15 562 < 2 3 210 < 0.4 60 < 0.10 < 4 0.8 < 10a < 1 220 - < 1 < 10 < 6 < 0.1 3,570 < 0.1 < 1 < 100 - < 4 2 < 10
GL17-2-20110628 2011 06 28 - 109 - - - 1,510 - - 13 18.8 364 15.2 61 11.7 580 < 0.2 1.6 222 < 0.04 70 < 0.01 4.7 0.83 1 < 0.1 235 - 0.7 < 1 < 0.6 < 0.01 3,940 < 0.01 < 0.1 40 - < 0.4 1.5 1
GL17-2-20120625 2012 06 25 - 3,440 - - - 9,700 - - < 50a 318 6,180 643 2,480 20 1,580 < 2 4 20 < 0.4 < 40 < 0.10 < 4 1.6 < 10a < 1 70 - 53 10 < 6 < 0.10 8,300 < 0.1 < 1 < 100 - 81 < 1 10
GL17-2-20121204 2012 12 04 - 3,920 - - - 10,000 - - < 50a 394 569 712 2,800 17.6 1,520 < 2 < 2.0 20 < 0.40 < 40 0.26 7.2 7.1 < 10a < 1.0 70 - 50.1 30 < 6.0 < 0.10 9,920 < 0.10 < 1.0 < 10 - 150 2.44 < 10
GL17-2-20130626 2013 06 26 - 4,000 - - - 10,800 - - < 30a 404 < 90 727 2,380 21.8 1,700 < 1.0 < 1.0 < 30 < 15a < 300 < 0.50a < 5.0 3.4 < 5.0a < 1.0 101 < 0.20 57.5 20.6 < 10 < 0.10 8,720 < 1.0 < 90 < 50 - 176 < 90 < 15
GL17-2-20131113 2013 11 13 - 4,190 - - - 10,800 - - < 30a 427 390 759 2,600 24 1,710 < 1.0 < 1.0 < 50 < 25a < 500 < 0.50a < 5.0 4.2 < 5.0a < 1.0 179 < 0.20 54.1 20.1 < 10 < 0.10 9,350 < 1.0 < 150 53 - 172 < 150a < 25
GL17-2-20140605 2014 06 05 - 3,650 - - - 10,500 - - < 30a 346 585 676 1,430 20.4 1,690 < 1.0 < 1.0 < 20 < 10a < 200 < 0.50a < 5.0 2.2 < 5.0a < 1.0 104 < 0.20 58.3 15.1 < 10 < 0.10 7,610 < 1.0 < 60 < 50 - 155 < 60 < 10
GL17-2-20141118 2014 11 18 - 3,860 - - - 11,300 - - < 30a 367 938 716 1,950 22.1 1,670 < 1.0 < 1.0 < 30 < 15a < 300 < 0.50a < 5.0 3.1 < 5.0a < 1.0 93 < 0.20 54.4 14.1 < 10 < 0.10 7,930 < 1.0 < 90 < 50 - 163 < 90 < 15
GL17-2-20150608 2015 06 08 7.5 4,010 - - - 10,300 - - < 10 378 442 745 1,180 22.2 1,710 < 1.0 < 1.0 < 30 < 15a < 300 0.338 < 1.0 1.8 4.5 < 1.0 95 < 0.20 51.8 14.7 3.6 < 0.10 7,910 < 0.10 < 90 < 50 - 152 < 90 < 15
GL17-2-20151104 2015 11 04 7.65 3,760 - - - 11,100 - - < 10 383 183 680 1,280 21.1 1,550 < 1.0 < 1.0 < 30 < 15a < 300 0.144 < 1.0 2.9 < 2.0a < 1.0 101 < 0.20 46 15.4 < 1.0 < 0.10 8,190 < 0.10 < 90 < 50 - 182 < 90 < 15
Associated CARO file(s): 8052631, 8052802, 8060237, 8060737, 8061100, 8081412, 8091680, 8092458, 8092618, 9052219, 9052399, 9052558, 9052754, 9052937, 9060273, 9091657, 9092001, 9092208, 9092404, 9120616.
Associated Exova file(s): 622178, 653600, 712940, 714233, 714243, 756693, 756810, 757047, 811364, 811710, 812030, 812741, 812985, 846260, 878316, 879073, 909346, 909448, 909654.
All terms defined within the body of SNC-Lavalin's report.
< Denotes concentration less than indicated detection limit or RPD less than indicated value.a Laboratory detection limit exceeds regulatory standard/guideline.
- Denotes analysis not conducted.b Standard to protect freshwater aquatic life.
n/a Denotes no applicable standard/guideline.c Guideline to protect irrigation water. Guideline for surface water, shown here for comparison purposes only.
QA/QC RPD Denotes quality assurance/quality control relative percent differenced Guideline to protect freshwater aquatic life, long-term average (i.e. "chronic"). Guideline for surface water, shown here for comparison purposes only.
* RPDs are not calculated where one or more concentrations are less than five times RDL.e Guideline to protect freshwater aquatic life, short-term maximum (i.e. "acute"). Guideline for surface water, shown here for comparison purposes only.
RDL Denotes reported detection limit.f There is no Zinc standard specified for H > 400; therefore, the standard for H=300-<400 is applied as a conservative comparison.g Individual standards exist for Cr +3 and Cr +6. Reported value represents more stringent standard.
BOLD Concentration greater than CSR Aquatic Life (AW) standardh Only applies for specific Schedule 2 Site Activities; verify for your site.
SHADED Concentration greater than CSR Irrigation Watering (IW) standardi Guideline is temperature, pH, DOC and hardness dependent. Calculate using BLM software!
RED Concentration greater than BCWQG Irrigation Water (IW) guidelinej Guideline is pH dependent
BLUE SHADED Concentration greater than BCWQG Aquatic Life Long-Term Average (AW) guidelinek Guideline is hardness dependent
BLUE SHADED Concentration greater than BCWQG Aquatic Life Short-term Maximum (AW) guideline l Conductivity guidelines varies with crop. Guideline range 700-5,000, most stringent guideline for low tolerance crops applied (strawberry, raspberry, bean and carrot.
SNC-LAVALIN INC. Page 9 of 15
662036 / 2021 02 0920210309_662036_TAB_Historical.xlsx
QAQC CN 2021 03 09

TABLE V.2: Historical Summary of Analytical Results for Groundwater - Dissolved Metals
Physical Parameters Dissolved Metals
Sample Sample Sample Date pH
To
tal
Ha
rdn
ess
pH
(fi
eld
)
Co
nd
ucti
vit
y
Fie
ld
Co
nd
ucti
vit
y
To
tal
Dis
so
lve
d
So
lid
s
Dis
so
lve
d
Org
an
ic
Ca
rbo
n
Ph
osp
hate
Dis
so
lve
d
Alu
min
um
Dis
so
lve
d
Ca
lciu
m
Dis
so
lve
d Iro
n
Dis
so
lve
d
Mag
nes
ium
Dis
so
lve
d
Man
gan
ese
Dis
so
lve
d
Po
tass
ium
Dis
so
lve
d
So
diu
m
An
tim
on
y
Ars
en
ic
Ba
riu
m
Be
rylliu
m
Bo
ron
Ca
dm
ium
Ch
rom
ium
Co
ba
lt
Co
pp
er
Le
ad
Lit
hiu
m
Merc
ury
Mo
lyb
den
um
Nic
ke
l
Se
len
ium
Sil
ve
r
Str
on
tiu
m
Th
all
ium
Tin
Tit
an
ium
Tu
ng
ste
n
Ura
niu
m
Va
nad
ium
Zin
cf
Location ID (yyyy mm dd) pH mg/L pH µS/cm µS/cm mg/L mg/L mg/L µg/L mg/L µg/L mg/L µg/L mg/L mg/L µg/L µg/L µg/L µg/L µg/L µg/L µg/L µg/L µg/L µg/L µg/L µg/L µg/L µg/L µg/L µg/L µg/L µg/L µg/L µg/L µg/L µg/L µg/L µg/L
BC Guideline
CSR Aquatic Life (AW)b n/a n/a n/a n/a n/a n/a n/a n/a n/a n/a n/a n/a n/a n/a n/a 90 50 10,000 1.5 12,000 0.5-4k 10g 40 20-90k40-
160k n/a 0.25 10,000250-
1,500k 20 0.5-15k n/a 3 n/a 1,000 n/a 85 n/a
75-
2,400k
CSR Irrigation Watering (IW) n/a n/a n/a n/a n/a n/a n/a n/a 5,000 n/a 5,000h n/a 200h n/a n/a n/a 100 n/a 100 500 5 5g 50 200 200 2,500 1 10 200 20 n/a n/a n/a n/a n/a n/a 10 1001,000-
5,000j
BCWQG Irrigation Water (IW)c 5.0 - 9.0 n/a 5.0 - 9.0 700 - 5,000l 700 - 5,000l n/a n/a n/a n/a n/a n/a n/a n/a n/a n/a n/a n/a n/a n/a n/a n/a n/a n/a n/a n/a n/a n/a n/a n/a n/a n/a n/a n/a n/a n/a n/a n/a n/a n/a
BCWQG Aquatic Life Long-Term Average (AW)d 6.5 - 9.0 n/a 6.5 - 9.0 n/a n/a n/a n/a n/a 5 - 50 n/a n/a n/a n/a n/a n/a n/a n/a n/a n/a n/a 0.017 - 0.46 n/a n/a 0.2i n/a n/a n/a n/a n/a n/a n/a n/a n/a n/a n/a n/a n/a n/a n/a
BCWQG Aquatic Life Short-term Maximum (AW)e 6.5 - 9.0 n/a 6.5 - 9.0 n/a n/a n/a n/a n/a 20 - 100 n/a 350 (max) n/a n/a n/a n/a n/a n/a n/a n/a n/a 0.038 - 2.8 n/a n/a 0.2i n/a n/a n/a n/a n/a n/a n/a n/a n/a n/a n/a n/a n/a n/a n/a
GL18-2 GL 18-2-20091110 2009 11 10 - 1,060 - - - - - - < 50a 99.7 940 196 503 19 22.4 < 2 17 10 < 0.4 < 40 < 0.1 < 4 0.6 < 10a < 1 10 - 32 < 10 < 6 < 0.10 4,990 < 0.1 < 1 < 10 - < 4 < 1 20
GL18-2-20100811 2010 08 11 - 1,380 - - - 6,930 - - 258 281 1,640 164 544 20 1,460 < 2 12 20 < 0.4 < 40 < 0.10 < 4 0.8 < 10a < 1 < 10 - 34 < 10 < 6 < 0.1 4,840 < 0.1 < 1 < 100 - < 4 2 < 10
GL18-2-20110629 2011 06 29 - 1,510 - - - 6,440 - - 25 315 294 175 405 20.9 1,500 1.8 13.7 21 < 0.04 24 0.06 1.2 2.07 4 < 0.1 12 - 42.4 7 24 < 0.01 6,800 < 0.01 < 0.1 < 10 - 2.5 5.2 4
GL18-2-20120626 2012 06 26 - 1,480 - - - 6,820 - - < 50a 314 1,210 169 460 19 1,550 8 9 10 < 0.4 < 40 < 0.1 < 4 0.6 < 10a < 1 10 - 35 < 10 < 6 < 0.10 4,970 < 0.1 < 1 < 100 - < 4 < 1 20
DUP-A-20120626 Duplicate - 1,520 - - - 6,670 - - < 50a 324 1,030 173 480 20 1,590 < 2 10 10 < 0.4 < 40 < 0.1 < 4 0.8 < 10a < 1 10 - 36 < 10 6 < 0.10 5,230 < 0.1 < 1 < 100 - < 4 1 < 10
QA/QC RPD% - 3 - - - 2 - - * 3 16 2 4 5 3 * 11 0 * * * * 29 * * 0 - 3 * * * 5 * * * - * * *
GL18-2-20121205 2012 12 05 - 1,380 - - - 6,600 - - 53 286 2,330 161 180 17.2 1,380 < 2.0 9.4 10 < 0.40 40 < 0.10 < 4.0 2.85 < 10a < 1 10 - 38.6 < 10 6.4 < 0.10 4,890 < 0.10 < 1.0 < 1,000 - < 4.0 < 1.0 < 10
GL18-2-20130627 2013 06 27 - 1,400 - - - 6,660 - - < 30a 288 1,600 166 466 17.9 1,620 < 1.0 6.7 < 20 < 10a < 200 < 0.50a < 5.0 < 1.0 < 5.0a < 1.0 < 50 < 0.20 37.4 < 5.0 < 10 < 0.10 4,230 < 1.0 < 60 < 50 - < 0.20 < 60 < 10
GL18-2-20131114 2013 11 14 - 1,380 - - - 6,670 - - < 15a 284 1,560 162 467 17.4 1,550 < 0.50 7.3 < 20 < 10a < 200 < 0.25 < 2.5 < 0.50 < 2.5a < 1.0 < 50 < 0.20 41.8 < 5.0 < 5.0 < 0.050 4,120 < 0.50 < 60 < 50 - 0.26 < 60 < 10
GL18-2-20140609 2014 06 09 - 1,380 - - - 6,260 - - < 30a 280 1,640 164 472 17.7 1,540 < 1.0 7.3 < 20 < 10a < 200 < 0.50a < 5.0 < 1.0 < 5.0a < 1.0 < 50 < 0.20 40.5 < 5.0 < 10 < 0.10 4,160 < 1.0 < 60 < 50 - < 0.20 < 60 < 10
GL18-2-20141126 2014 11 26 - 1,380 - - - 6,330 - - < 15a 283 1,550 163 465 17.6 1,540 < 0.50 6.5 < 20 < 10a < 200 < 0.25 < 2.5 < 0.50 < 2.5a < 1.0 < 50 < 0.20 39.3 < 5.0 < 5.0 < 0.050 4,230 < 0.50 < 60 < 50 - < 0.20 < 60 < 10
DUP3-20141126 Duplicate - 1,390 - - - 6,080 - - < 30a 287 1,560 164 470 17.7 1,540 < 1.0 7.1 < 20 < 10a < 200 < 0.50a < 5.0 < 1.0 < 5.0a < 1.0 < 50 < 0.20 39.7 < 5.0 < 10 < 0.10 4,230 < 1.0 < 60 < 50 - < 0.20 < 60 < 10
QA/QC RPD% - 1 - - - 4 - - * 1 1 1 1 1 0 * 9 * * * * * * * * * * 1 * * * 0 * * * - * * *
GL18-2-20150615 2015 06 15 7.98 1,340 - - - 6,410 - - < 10 284 1,410 154 425 17.3 1,550 < 1.0 6.6 < 20 < 10a < 200 < 0.050 < 1.0 < 1.0 < 2.0a < 1.0 < 50 < 0.20 37.4 < 5.0 < 1.0 < 0.10 4,200 < 0.10 < 60 < 50 - < 0.20 < 60 < 10
GL18-2-20170529 2017 05 29 7.95 1,370 - - - 6,310 - - < 10 282 1,390 161 476 16.9 1,460 < 1.0 7.1 < 30 < 15a < 300 < 0.050 < 1.0 < 1.0 2.4 < 1.0 < 50 < 0.20 41.1 < 5.0 < 1.0 < 0.10 4,260 < 0.10 < 90 < 50 - 2.23 < 90 < 15
GL18-2-180604 2018 06 04 7.38 1,410 7.797.8 8,140 7,172 6,140 2.92 0.0231 < 5.0 306 1,610 158 524 17.7 1,450 < 0.20 6.92 9.7 < 0.10 32.6 0.018 < 0.50 < 0.10 < 0.40a < 0.20 11.6 < 0.010 41.5 < 0.40 < 0.50 < 0.050 4,630 < 0.020 < 0.20 < 5.0 < 1.0 0.134 < 1.0 < 4.0
DUP-180604 Duplicate 7.43 1,430 7.79 - 7,172 6,310 2.91 0.0216 < 5.0 311 1,600 158 521 17.9 1,450 < 0.20 6.95 9.5 < 0.10 31.5 0.027 < 0.50 < 0.10 < 0.40a < 0.20 11.0 < 0.010 41.6 < 0.40 < 0.50 < 0.050 4,590 < 0.020 < 0.20 < 5.0 < 1.0 0.132 < 1.0 < 4.0
QA/QC RPD% 1 1 * - * 3 0 * * 2 1 0 1 1 0 * 0 2 * 3 * * * * * 5 * 0 * * * 1 * * * * 2 * *
GL20-1 GL20-1-20091112 2009 11 12 - 998 - - - - - - 124 145 10,400 154 452 390 1,780 < 2 27 290 < 0.4 6,230 < 0.1 35 30.3 < 10a 5 90 - 10 60 < 6 < 0.10 2,290 < 0.1 8 93 - < 4 33 < 10
GL20-1-20100811 2010 08 11 - 997 - - - 6,910 - - 209 132 17,400 162 471 490 1,730 < 2 34 410 < 0.4 6,190 < 0.1 44 35.7 < 10a < 1 70 - 6 60 < 6 < 0.1 2,370 < 0.1 9 < 100 - < 4 33 < 10
GL20-1-20110629 2011 06 29 - 113 - - - 6,900 - - 13 14.5 923 18.6 34 400 201 < 0.2 11.2 31 < 0.04 531 < 0.01 5.3 3.47 7 < 0.1 8 - 1.2 7 24.6 < 0.01 263 < 0.01 0.8 < 10 - < 0.4 3 8
GL20-1-20111217 2011 12 17 - 997 - - - 7,110 - - 1,340 128 13,500 165 320 520 1,950 < 20 40 300 < 4a 6,300 < 1a 80 31 < 100a < 10 < 100 - < 10 < 100 < 60a < 1.0 2,300 3.3 < 10 < 100 - < 40a 20 < 100
DUPA-20111217 Duplicate - 988 - - - 7,140 - - < 500a 127 8,430 163 310 510 1,820 < 20 40 200 < 4a 6,400 < 1a 80 33 < 100a < 10 < 100 - < 10 < 100 < 60a < 1.0 2,300 2.8 < 10 < 100 - < 40a 30 < 100
QA/QC RPD% - 1 - - - 0 - - * 1 46 1 3 2 7 * 0 40 * 2 * 0 6 * * * - * * * * 0 16 * * - * 40 *
GL20-1-20120625 2012 06 25 - 1,030 - - - 6,820 - - 120 133 15,400 170 340 420 1,960 3 14 280 < 0.4 4,480 < 0.1 52 27 < 10a < 1 70 - 1 60 < 6 < 0.10 2,260 < 0.1 8 < 100 - 4 21 10
GL20-1-20121203 2012 12 03 - 872 - - - 7,070 - - < 500a 102 13,400 150 261 547 1,860 < 20 < 20.0 300 < 4.0a 4,800 < 1.00a 92.1 43.3 < 100a < 10 < 100 - < 10 < 100 < 60a < 1.00 2,270 < 1.00 < 10 < 100 - < 40a 29.2 < 100
GL20-1-20130625 2013 06 25 - 1,130 - - - 8,490 - - 116 87.4 4,040 221 1,120 390 2,640 2.5 23.3 250 < 25a 4,130 < 0.50a 35 28.4 5.9 3.5 69 < 0.20 10 76.4 < 10 < 0.10 2,890 < 1.0 < 150 104 - 2.79 < 150a 32
GL20-1-20140605 2014 06 05 - 907 - - - 7,650 - - 74 65.4 2,750 181 494 229 2,430 3.9 19.4 117 < 25a 2,700 0.56 16.9 19.1 17.9 5 69 < 0.20 27.4 54.9 < 10 < 0.10 2,520 < 1.0 < 150 < 50 - 42.7 < 150a < 25
DUP4-20140605 Duplicate - 897 - - - 7,590 - - 80 65.7 2,800 178 489 225 2,390 4.3 21.2 117 < 25a 2,620 0.57 19.1 21.3 20.1 5.3 65 < 0.20 28.1 60.5 < 10 0.11 2,500 < 1.0 < 150 < 50 - 43.5 < 150a < 25
QA/QC RPD% - 1 - - - 1 - - 8 0 2 2 1 2 2 10 9 0 * 3 2 12 11 12 6 6 * 3 10 * * 1 * * * - 2 * *
GL20-1-20141126 2014 11 26 - 945 - - - 7,430 - - 173 93.8 6,170 173 310 275 2,090 1.6 20.6 374 < 15a 3,410 < 0.50a 34.2 22.6 < 5.0a < 1.0 61 < 0.20 11.6 45.8 < 10 < 0.10 2,850 < 1.0 < 90 95 - 0.95 < 90 < 15
GL20-1-20150611 2015 06 11 7.84 848 - - - 7,590 - - 74 64.3 2,080 167 424 236 2,460 4 14.5 122 < 25a 3,010 0.636 16.9 29.9 19.2 1.5 86 < 0.20 29.3 87.6 2.4 0.2 2,210 0.11 < 150 < 50 - 48.2 < 150a < 25
GL20-1-200826 2020 08 26 7.73 118 6.99 - 2,514 5,240 122 - 19.6 5.1 897 25.6 54.1 40.5 404 0.198 3.46 58.9 0.099 24.3 0.0021 5.18 3.82 < 0.10 0.359 0.614 < 0.010 1.01 8.64 < 0.10 < 0.010 519 0.170 0.865 12.5 < 0.200.0021 2.43 < 1.0
GL20-1-201020 2020 10 20 7.50 565 7 - 8,684 5,230 < 0.50 - 66.5 88.1 8,910 83.7 247 173 1,540 0.678 12.2 280 0.023 1,760 0.0205 25.0 18.7 0.36 0.051 65.4 < 0.010 3.93 32.7 0.27 < 0.010 2,500 < 0.0040 3.94 88.8 0.76 2.55 22.3 1.2
GL21-1 GL21-1-20091117 2009 11 17 - 4,230 - - - - - - 174 216 140 897 30 37 2,590 < 2 6 20 < 0.4 < 40 0.13 8 0.9 < 10a < 1 140 - 68 20 < 6 < 0.10 12,700 0.36 < 1 16 - 792 3 < 10
GL21-1-20110705 2011 07 05 - 520 - - - 14,200 - - < 5 201 10 4 < 1 < 1 386 0.3 3.8 21 < 0.04 6 0.2 22.6 0.7 15 < 0.1 120 - 61.4 16 43.8 < 0.01 13,600 0.18 < 0.1 < 10 - 848 4 10
GL21-1-20120625 2012 06 25 - 4,660 - - - 14,800 - - < 50a 219 < 50 1,000 < 10 36 2,920 < 2 4 20 < 0.4 < 40 0.14 26 1.2 10 < 1 120 - 63 10 10 < 0.10 14,600 0.13 < 1 < 100 - 799 4 10
GL21-1-20121204 2012 12 04 - 4,300 - - - 14,600 - - < 50a 206 < 50 919 < 10 34.1 2,940 < 2.0 4.4 20 < 0.40 < 40 < 0.10 22.9 < 0.20 10 < 1.0 100 - 64.3 20 11.2 < 0.10 15,000 0.2 < 1.0 < 100 - 999 4.71 < 10
GL22-1 GL 22-1-20091110 2009 11 10 - 1,050 - - - - - - 109 95 < 100 198 951 16.5 166 < 2 6 110 < 0.4 < 40 < 0.1 < 4 3.1 < 10a < 1 20 - 14 20 < 6 < 0.10 3,700 < 0.1 < 1 < 10 - 42 3 10
GL22-1-20100811 2010 08 11 - 970 - - - 1,450 - - 395 82 600 186 1,260 16 139 < 2 3 110 < 0.4 70 < 0.10 < 4 3.1 < 10a < 1 20 - 14 20 < 6 < 0.1 3,800 < 0.1 < 1 < 100 - 51 2 < 10
GL23-1 GL 23-1-20091110 2009 11 10 - 1,140 - - - - - - < 50a 88 < 100 224 951 17.6 222 < 2 3 80 < 0.4 < 40 0.22 < 4 3.1 < 10a < 1 30 - 15 20 < 6 < 0.10 3,770 < 0.1 < 1 < 10 - 75 2 < 10
GL 23-1-20120627 2012 06 27 - 1,100 - - - 1,780 - - < 50a 81 60 228 80 15 231 < 2 < 2 70 < 0.4 < 40 < 0.1 7 < 0.2 < 10a < 1 30 - 17 10 < 6 < 0.10 4,010 < 0.1 2 < 100 - 149 3 < 10
GL23-1-20100811 2010 08 11 - 1,000 - - - 1,640 - - < 50a 77 160 201 638 15 207 < 2 2 80 < 0.4 40 < 0.1 < 4 1.6 < 10a < 1 30 - 16 20 < 6 < 0.1 4,050 < 0.1 < 1 < 100 - 95 2 < 10
GL23-1-20110704 2011 07 04 - 1,160 - - - 1,720 - - < 5 87.1 25 229 368 16.6 238 < 0.2 1.2 68 < 0.04 24 0.09 20.9 2.14 2 < 0.1 38 - 19.9 14 2.5 < 0.01 4,120 < 0.01 < 0.1 < 10 - 168 7.4 2
GL23-1-20121203 2012 12 03 - 270 - - - 1,790 - - < 50a 72.4 17 21.8 454 16.4 233 < 2 < 2.0 70 < 0.40 < 40 0.18 12 7.61 < 10a < 1 20 - 19.9 20 < 6.0 < 0.10 4,100 0.1 11.2 < 10 - 151 4.64 < 10
GL23-1-20130627 2013 06 27 - 1,170 - - - 1,750 - - < 10a 82.6 35 233 253 16.5 238 < 0.50 < 1.0 72 < 5.0a < 100 0.112 < 0.50 1.05 1.6 < 1.0 < 50 < 0.20 16.5 11.1 < 1.0 < 0.050 3,670 < 0.20 < 30 < 50 - 141 < 30 < 5.0
GL23-1-20140603 2014 06 03 - 1,080 - - - 1,710 - - < 10a 75.8 < 30 215 185 14.7 219 < 0.50 < 1.0 67 < 5.0a < 100 0.345 < 0.50 0.77 1.5 < 1.0 < 50 < 0.20 18.6 9.5 < 1.0 < 0.050 3,430 < 0.20 < 30 < 50 - 143 < 30 < 5.0
Associated CARO file(s): 8052631, 8052802, 8060237, 8060737, 8061100, 8081412, 8091680, 8092458, 8092618, 9052219, 9052399, 9052558, 9052754, 9052937, 9060273, 9091657, 9092001, 9092208, 9092404, 9120616.
Associated Exova file(s): 622178, 653600, 712940, 714233, 714243, 756693, 756810, 757047, 811364, 811710, 812030, 812741, 812985, 846260, 878316, 879073, 909346, 909448, 909654.
All terms defined within the body of SNC-Lavalin's report.
< Denotes concentration less than indicated detection limit or RPD less than indicated value.a Laboratory detection limit exceeds regulatory standard/guideline.
- Denotes analysis not conducted.b Standard to protect freshwater aquatic life.
n/a Denotes no applicable standard/guideline.c Guideline to protect irrigation water. Guideline for surface water, shown here for comparison purposes only.
QA/QC RPD Denotes quality assurance/quality control relative percent differenced Guideline to protect freshwater aquatic life, long-term average (i.e. "chronic"). Guideline for surface water, shown here for comparison purposes only.
* RPDs are not calculated where one or more concentrations are less than five times RDL.e Guideline to protect freshwater aquatic life, short-term maximum (i.e. "acute"). Guideline for surface water, shown here for comparison purposes only.
RDL Denotes reported detection limit.f There is no Zinc standard specified for H > 400; therefore, the standard for H=300-<400 is applied as a conservative comparison.g Individual standards exist for Cr +3 and Cr +6. Reported value represents more stringent standard.
BOLD Concentration greater than CSR Aquatic Life (AW) standardh Only applies for specific Schedule 2 Site Activities; verify for your site.
SHADED Concentration greater than CSR Irrigation Watering (IW) standardi Guideline is temperature, pH, DOC and hardness dependent. Calculate using BLM software!
RED Concentration greater than BCWQG Irrigation Water (IW) guidelinej Guideline is pH dependent
BLUE SHADED Concentration greater than BCWQG Aquatic Life Long-Term Average (AW) guidelinek Guideline is hardness dependent
BLUE SHADED Concentration greater than BCWQG Aquatic Life Short-term Maximum (AW) guideline l Conductivity guidelines varies with crop. Guideline range 700-5,000, most stringent guideline for low tolerance crops applied (strawberry, raspberry, bean and carrot.
SNC-LAVALIN INC. Page 10 of 15
662036 / 2021 02 0920210309_662036_TAB_Historical.xlsx
QAQC CN 2021 03 09

TABLE V.2: Historical Summary of Analytical Results for Groundwater - Dissolved Metals
Physical Parameters Dissolved Metals
Sample Sample Sample Date pH
To
tal
Ha
rdn
ess
pH
(fi
eld
)
Co
nd
ucti
vit
y
Fie
ld
Co
nd
ucti
vit
y
To
tal
Dis
so
lve
d
So
lid
s
Dis
so
lve
d
Org
an
ic
Ca
rbo
n
Ph
osp
hate
Dis
so
lve
d
Alu
min
um
Dis
so
lve
d
Ca
lciu
m
Dis
so
lve
d Iro
n
Dis
so
lve
d
Mag
nes
ium
Dis
so
lve
d
Man
gan
ese
Dis
so
lve
d
Po
tass
ium
Dis
so
lve
d
So
diu
m
An
tim
on
y
Ars
en
ic
Ba
riu
m
Be
rylliu
m
Bo
ron
Ca
dm
ium
Ch
rom
ium
Co
ba
lt
Co
pp
er
Le
ad
Lit
hiu
m
Merc
ury
Mo
lyb
den
um
Nic
ke
l
Se
len
ium
Sil
ve
r
Str
on
tiu
m
Th
all
ium
Tin
Tit
an
ium
Tu
ng
ste
n
Ura
niu
m
Va
nad
ium
Zin
cf
Location ID (yyyy mm dd) pH mg/L pH µS/cm µS/cm mg/L mg/L mg/L µg/L mg/L µg/L mg/L µg/L mg/L mg/L µg/L µg/L µg/L µg/L µg/L µg/L µg/L µg/L µg/L µg/L µg/L µg/L µg/L µg/L µg/L µg/L µg/L µg/L µg/L µg/L µg/L µg/L µg/L µg/L
BC Guideline
CSR Aquatic Life (AW)b n/a n/a n/a n/a n/a n/a n/a n/a n/a n/a n/a n/a n/a n/a n/a 90 50 10,000 1.5 12,000 0.5-4k 10g 40 20-90k40-
160k n/a 0.25 10,000250-
1,500k 20 0.5-15k n/a 3 n/a 1,000 n/a 85 n/a
75-
2,400k
CSR Irrigation Watering (IW) n/a n/a n/a n/a n/a n/a n/a n/a 5,000 n/a 5,000h n/a 200h n/a n/a n/a 100 n/a 100 500 5 5g 50 200 200 2,500 1 10 200 20 n/a n/a n/a n/a n/a n/a 10 1001,000-
5,000j
BCWQG Irrigation Water (IW)c 5.0 - 9.0 n/a 5.0 - 9.0 700 - 5,000l 700 - 5,000l n/a n/a n/a n/a n/a n/a n/a n/a n/a n/a n/a n/a n/a n/a n/a n/a n/a n/a n/a n/a n/a n/a n/a n/a n/a n/a n/a n/a n/a n/a n/a n/a n/a n/a
BCWQG Aquatic Life Long-Term Average (AW)d 6.5 - 9.0 n/a 6.5 - 9.0 n/a n/a n/a n/a n/a 5 - 50 n/a n/a n/a n/a n/a n/a n/a n/a n/a n/a n/a 0.017 - 0.46 n/a n/a 0.2i n/a n/a n/a n/a n/a n/a n/a n/a n/a n/a n/a n/a n/a n/a n/a
BCWQG Aquatic Life Short-term Maximum (AW)e 6.5 - 9.0 n/a 6.5 - 9.0 n/a n/a n/a n/a n/a 20 - 100 n/a 350 (max) n/a n/a n/a n/a n/a n/a n/a n/a n/a 0.038 - 2.8 n/a n/a 0.2i n/a n/a n/a n/a n/a n/a n/a n/a n/a n/a n/a n/a n/a n/a n/a
GL23-1 GL23-1-20141124 2014 11 24 - 1,210 - - - 1,790 - - < 10a 87.1 39 240 208 17.5 249 < 0.50 < 1.0 75 < 5.0a < 100 0.313 < 0.50 0.7 1.6 < 1.0 < 50 < 0.20 16.8 9.5 < 1.0 < 0.050 3,990 < 0.20 < 30 < 50 - 139 < 30 < 5.0
(Cont'd) GL23-1-20150608 2015 06 08 7.67 1,130 - - - 1,700 - - < 10 82.6 < 30 224 19 15.3 211 < 0.50 < 1.0 72 < 5.0a < 100 0.327 < 0.50 < 0.50 2.4 < 1.0 < 50 < 0.20 15.8 9 < 1.0 < 0.050 3,870 < 0.010 < 30 < 50 - 116 < 30 < 5.0
GL23-1-20151104 2015 11 04 7.68 1,050 - - - 1,570 - - < 10 79 < 30 208 642 14.8 194 < 0.50 < 1.0 67 < 5.0a < 100 0.307 < 0.50 0.56 1.2 < 1.0 < 50 < 0.20 17.3 13.4 < 1.0 < 0.050 3,700 0.011 < 30 < 50 - 99.1 < 30 < 5.0
GL23-1-20160526 2016 05 26 7.99 1,080 - - - 1,570 - - < 10 78.4 < 30 215 77 14.9 203 < 0.50 < 1.0 70 < 5.0a < 100 0.312 < 0.50 < 0.50 3 < 1.0 < 50 < 0.20 13.8 10.5 < 1.0 < 0.050 3,750 < 0.010 < 30 < 50 - 84.1 < 30 < 5.0
GL23-1-20160531 2016 05 31 7.64 - - - - 1,580 - - < 50 84.8 < 100 228 25 - 205 < 1 < 5 70 < 1 40 0.4 < 5 < 0.5 < 2a < 1 39 - 17 9 < 5 < 0.5 4,040 < 0.2 - < 50 - 90 < 10 < 40
GL23-1-20170525 2017 05 25 8.45 1,150 - - - 1,610 - - < 10 82.6 < 30 229 33 14.9 191 < 0.50 < 1.0 72 < 5.0a < 100 0.216 < 0.50 < 0.50 3.5 < 1.0 < 50 < 0.20 13.6 9.7 < 1.0 < 0.050 4,100 < 0.010 < 30 < 50 - 74.7 < 30 < 5.0
DUP3-20170525 Duplicate 8.41 1,150 - - - 1,580 - - < 10 85 < 30 228 43 15.8 203 < 0.50 < 1.0 78 < 5.0a < 100 0.219 < 0.50 < 0.50 3.4 < 1.0 < 50 < 0.20 13.7 9.8 < 1.0 < 0.050 4,270 < 0.010 < 30 < 50 - 73.4 < 30 < 5.0
QA/QC RPD% 0 0 - - - 2 - - * 3 * 0 26 6 6 * * 8 * * 1 * * 3 * * * 1 1 * * 4 * * * - 2 * *
GL23-1-180529 2018 05 29 7.86 1,260 7.22 - 2,014 1,560 14.3 0.0062 < 5.0 86.2 < 10 254 19.3 15.0 201 < 0.20 < 0.50 63.0 < 0.10 29.9 0.100 < 0.50 0.35 20.0 0.60 38.9 < 0.010 12.4 10.0 < 0.50 < 0.050 4,000 < 0.020 0.82 < 5.0 < 1.0 77.7 < 1.0 < 4.0
GL23-1-190523 2019 05 23 8.01 1,170 7.7 - 2,332 1,590 14.8 < 0.0050 < 5.0 87.3 < 10 231 5.34 15.7 199 < 0.20 0.56 71.7 < 0.10 34.4 0.076 0.80 0.35 1.95 < 0.20 42.5 < 0.010 13.6 10.6 < 0.50 < 0.050 4,940 < 0.020 < 0.20 < 5.0 < 1.0 80.5 < 1.0 < 4.0
GL23-1-190917 2019 09 17 7.78 1,130 - - - 1,610 16.4 - < 5.0 85.2 < 10 222 455 14.5 191 < 0.20 0.52 72.8 < 0.10 31.0 0.409 1.23 0.42 2.72 < 0.20 39.8 - 16.7 13.5 < 0.50 < 0.050 4,780 < 0.020 < 0.20 < 5.0 < 1.0 75.6 1.1 < 4.0
GL23-1-200617 2020 06 17 7.97 1,000 6.95 - 2,150 1,530 14.6 - < 1.0 85.7 < 2.0 192 316 13.7 178 < 0.050 0.581 64.8 < 0.010 30.4 0.0823 0.11 0.746 1.97 < 0.050 36.7 < 0.010 15.0 10.4 0.34 < 0.010 4,430 0.0073 < 0.050 < 0.20 < 0.20 68.9 0.97 1.2
GL23-1-200910 2020 09 10 7.98 1,130 - - - 1,660 14.8 - 1.2 101 < 2.0 213 870 14.9 189 < 0.050 0.561 69.6 < 0.010 29.5 0.321 0.15 0.690 3.02 < 0.050 41.7 - 17.0 13.3 0.26 < 0.010 4,640 0.0139 < 0.050 < 0.20 < 0.20 74.7 0.79 2.2
GL24-1 GL24-1-20100811 2010 08 11 - 1,200 - - - 2,110 - - 94 93 190 242 1,400 15 254 < 2 2 80 < 0.4 90 0.19 < 4 1.4 < 10a < 1 20 - 38 20 < 6 < 0.1 4,170 < 0.1 < 1 < 100 - 94 2 < 10
GL24-1-20160531 2016 05 31 7.64 - - - - 1,570 - - < 50 73.6 < 100 203 7 - 210 < 1 < 5 70 < 1 100 < 0.1a < 5 < 0.5 < 2a < 1 25 - 11 3 9 < 0.5 2,470 < 0.2 - < 50 - 75.9 < 10 < 40
GL24-1-180612 2018 06 12 7.63 1,300 - - - 2,380 - 0.0083 < 5.0 91.6 < 10 260 342 12.6 391 < 0.20 1.60 61.7 < 0.10 78.6 0.342 < 0.50 1.95 5.47 < 0.20 43.1 < 0.010 24.9 15.1 2.39 < 0.050 3,760 < 0.020 < 0.20 < 5.0 < 1.0 154 2.8 < 4.0
GL24-1-20180927 2018 09 27 - 1,760 - - - - - - < 5.0 130 < 10 349 810 15.2 516 0.21 1.67 83.3 < 0.10 89.1 0.256 < 0.50 2.12 6.55 < 0.20 46.2 < 0.010 22.6 19.8 6.22 < 0.050 5,100 0.029 < 0.20 < 5.0 - 192 3.3 < 4.0
GL24-1-190917 2019 09 17 7.92 1,100 - - - 1,870 9.09 - 36.6 76.8 23 220 104 10.9 308 < 0.20 1.66 46.1 < 0.10 95.9 0.139 1.51 0.90 2.51 < 0.20 42.7 - 24.2 8.71 2.49 < 0.050 3,320 0.020 < 0.20 < 5.0 < 1.0 126 3.0 45.2
GL24-1-200910 2020 09 10 8.04 856 - - - 1,750 6.56 - < 1.0 64.6 < 2.0 169 24.7 9.03 226 0.148 1.18 35.2 < 0.010 77.2 0.105 0.35 0.555 1.85 < 0.050 31.6 - 23.6 4.64 2.35 < 0.010 2,620 0.0154 0.053 0.88 < 0.20 101 0.84 1.1
GL25-1 GL25-1-20091117 2009 11 17 - 1,540 - - - - - - < 50a 246 < 100 223 3,030 13.3 242 < 2 2 80 < 0.4 < 40 0.2 < 4 6.7 < 10a < 1 20 - 20 20 < 6 < 0.10 7,760 0.18 < 1 < 10 - 49 < 1 10
GL25-1-20100812 2010 08 12 - 1,480 - - - 2,630 - - 221 209 < 100 233 2,330 12.5 234 < 2 < 2 50 < 0.4 < 40 0.1 10 5.3 < 10a < 1 20 - 7 20 < 6 < 0.1 7,640 < 0.1 < 1 < 10 - 8 4 < 10
GL26-1 GL26-1-20091112 2009 11 12 - 654 - - - - - - < 50a 159 460 62.7 1,730 15.2 167 2 42 20 0.6 < 40 0.28 < 4 7 < 10a < 1 180 - 275 30 < 6 < 0.10 1,670 < 0.1 < 1 < 10 - 52 < 1 < 10
GL26-1-20100812 2010 08 12 - 527 - - - 1,230 - - < 50a 128 850 50.5 1,800 13.9 135 < 2 33 20 0.7 < 40 < 0.1 6 0.8 < 10a < 1 200 - 56 < 10 < 6 < 0.1 1,670 < 0.1 < 1 < 10 - 12 2 10
GL30-5-20100812 Duplicate - 575 - - - 1,250 - - 62 140 1,070 55.1 1,830 15.4 152 < 2 26 20 1.2 < 40 < 0.10 6 0.6 < 10a < 1 190 - 51 < 10 < 6 < 0.1 1,670 < 0.1 < 1 < 10 - 11 2 10
QA/QC RPD% - 9 - - - 2 - - * 9 23 9 2 10 12 * 24 0 53 * * 0 29 * * 5 - 9 * * * 0 * * * - 9 0 0
GL26-2 GL26-2-20091116 2009 11 16 - 629 - - - - - - < 50a 122 960 78.8 2,440 8.8 185 < 2 5 90 < 0.4 < 40 < 0.1 < 4 4 < 10a < 1 60 - 25 < 10 < 6 < 0.10 1,550 < 0.1 < 1 < 10 - 27 1 < 10
GL26-2-20100812 2010 08 12 - 491 - - - 1,210 - - 83 93.9 890 62.3 1,130 8.3 141 < 2 5 60 < 0.4 < 40 < 0.10 5 2.6 < 10a < 1 60 - 24 < 10 < 6 < 0.1 1,590 < 0.1 < 1 < 10 - 27 2 < 10
GL26-2-20110629 2011 06 29 - 634 - - - 1,160 - - < 5 120 2,230 81.4 1,140 7.4 173 < 0.2 7 58 < 0.04 16 0.01 3.8 2.26 2 < 0.1 64 - 16.4 4 8.7 < 0.01 2,120 < 0.01 < 0.1 < 10 - 24.1 1.2 2
GL26-2-20120625 2012 06 25 - 670 - - - 1,210 - - < 50a 127 2,280 86 1,060 8 182 < 2 4 50 < 0.4 < 40 < 0.10 < 4 1.6 < 10a < 1 60 - 11 < 10 < 6 < 0.10 1,720 < 0.1 < 1 < 100 - 26 < 1 < 10
GL26-2-20121204 2012 12 04 - 572 - - - 1,200 - - < 50a 108 2,070 73.6 883 7.7 172 < 2.0 5.2 50 < 0.40 < 40 < 0.10 5.6 7.16 < 10a < 1.0 50 - 14.1 < 10 < 6.0 < 0.10 1,700 < 0.10 < 1.0 < 10 - 26.1 1.63 < 10
GL26-2-20130626 2013 06 26 - 673 - - - 1,170 - - < 10a 129 2,300 85.5 731 8.7 189 < 0.50 4.3 37 < 5.0a < 100 < 0.050 < 0.50 1.09 < 1.0a < 1.0 70 < 0.20 19 < 5.0 < 1.0 < 0.050 1,610 < 0.20 < 30 < 50 - 28.2 < 30 < 5.0
GL26-2-20131114 2013 11 14 - 639 - - - 1,160 - - < 10a 120 1,360 82.2 679 8.3 171 < 0.50 2.9 33 < 5.0a < 100 < 0.050 < 0.50 0.69 < 1.0a < 1.0 64 < 0.20 19.5 < 5.0 < 1.0 < 0.050 1,570 < 0.20 < 30 < 50 - 25.7 < 30 < 5.0
GL26-2-20140605 2014 06 05 - 665 - - - 1,130 - - < 10a 126 1,530 85.1 698 8.9 191 < 0.50 3 37 < 5.0a < 100 < 0.050 < 0.50 0.67 < 1.0a < 1.0 73 < 0.20 18.3 < 5.0 < 1.0 < 0.050 1,610 < 0.20 < 30 < 50 - 24.7 < 30 < 5.0
DUP2-20140605 Duplicate - 668 - - - 1,130 - - < 10a 128 1,550 84.6 705 8.9 193 < 0.50 2.9 37 < 5.0a < 100 < 0.050 < 0.50 0.6 < 1.0a < 1.0 74 < 0.20 17.8 < 5.0 < 1.0 < 0.050 1,610 < 0.20 < 30 < 50 - 24.8 < 30 < 5.0
QA/QC RPD% - 0 - - - 0 - - * 2 1 1 1 * 1 * * * * * * * * * * * * 3 * * * 0 * * * - 0 * *
GL26-2-20141117 2014 11 17 - 638 - - - 1,120 - - < 10a 121 877 81.7 658 8.5 176 < 0.50 1.8 32 < 5.0a < 100 < 0.050 < 0.50 0.54 < 1.0a < 1.0 73 < 0.20 20.4 < 5.0 < 1.0 < 0.050 1,610 < 0.20 < 30 < 50 - 23.8 < 30 < 5.0
GL26-2-20150608 2015 06 08 7.58 643 - - - 1,120 - - < 10 122 276 82 615 8.3 189 < 0.50 < 1.0 32 < 5.0a < 100 < 0.050 < 0.50 0.58 < 1.0a < 1.0 75 < 0.20 17.9 < 5.0 < 1.0 < 0.050 1,620 < 0.010 < 30 < 50 - 26.2 < 30 < 5.0
GL26-2-20151104 2015 11 04 7.73 617 - - - 1,170 - - < 10 121 921 76.2 597 8.5 174 < 0.50 1.8 28 < 5.0a < 100 < 0.050 < 0.50 < 0.50 < 1.0a < 1.0 69 < 0.20 22 < 5.0 < 1.0 < 0.050 1,620 < 0.010 < 30 < 50 - 24.9 < 30 < 5.0
GL26-3 GL26-3-20091111 2009 11 11 - 682 - - - - - - < 50a 99.8 1,470 105 3,960 8.1 259 < 2 5 100 < 0.4 < 40 0.13 < 4 11.7 < 10a < 1 20 - 24 < 10 < 6 < 0.10 1,710 < 0.1 < 1 < 10 - 45 1 30
GL26-3-20100812 2010 08 12 - 538 - - - 1,500 - - 62 75.3 170 84.9 1,090 8 197 < 2 2 70 < 0.4 < 40 < 0.1 4 2 < 10a < 1 30 - 40 < 10 < 6 < 0.1 1,700 < 0.1 < 1 < 10 - 52 3 < 10
GL27-1 GL27-1-20091116 2009 11 16 - 94 - - - - - - < 50a 14.5 340 14 243 14.6 632 < 2 95 410 < 0.4 < 40 0.26 < 4 < 0.2 < 10a < 1 210 - 243 < 10 < 6 < 0.10 2,970 < 0.1 < 1 < 10 - < 4 3 < 10
GL27-1-20100812 2010 08 12 - 67 - - - 1,650 - - 129 10 700 10.2 123 14.6 645 < 2 68 440 < 0.4 50 < 0.10 9 < 0.2 < 10a < 1 210 - 174 < 10 < 6 < 0.1 2,920 < 0.1 < 1 < 10 - < 4 4 20
GL27-1-20110629 2011 06 29 - 88 - - - 1,600 - - 21 14 1,400 12.9 202 13.3 622 1.7 44.9 452 < 0.04 46 0.07 11 0.43 1 < 0.1 187 - 54.1 < 1 8.1 < 0.01 3,230 < 0.01 < 0.1 < 10 - 1 3.8 < 1
GL 27-1-20120626 2012 06 26 - 94 - - - 1,660 - - < 50a 14 1,500 14 140 13 655 < 2 38 400 < 0.4 80 < 0.1 36 < 0.2 < 10a < 1 190 - 48 < 10 < 6 < 0.1 3,020 < 0.1 < 1 < 100 - < 4 4 < 10
GL27-1-20121204 2012 12 04 - 73 - - - 1,670 - - < 50a 11.6 482 10.6 126 12.7 648 < 2.0 32 380 < 0.40 60 < 0.10 13.3 3.62 < 10a < 1.0 160 - 43.2 < 10 < 6.0 < 0.10 3,040 < 0.10 < 1.0 < 10 - < 4.0 4.14 < 10
GL27-1-20130626 2013 06 26 - 88.4 - - - 1,730 - - < 15a 13.5 988 13.3 136 14.1 665 0.63 51.3 415 < 5.0a < 100 < 0.25a < 2.5 < 0.50 < 2.5a < 1.0 220 < 0.20 72.6 < 5.0 < 5.0 0.103 2,670 < 0.50 < 30 < 50 - 1.54 < 30 < 5.0
GL27-1-20131113 2013 11 13 - 93.5 - - - 1,630 - - < 15a 14.5 852 13.9 146 14.1 704 < 0.50 35.5 422 < 5.0a < 100 < 0.25a < 2.5 < 0.50 < 2.5a < 1.0 219 < 0.20 56.6 < 5.0 < 5.0 < 0.050 2,960 < 0.50 < 30 < 50 - 1.41 < 30 < 5.0
GL27-1-20140605 2014 06 05 - 94.4 - - - 1,630 - - < 10a 14.6 1,080 14.1 129 14.9 704 < 0.50 34.8 439 < 5.0a < 100 < 0.10 < 1.0 < 0.50 < 1.0a < 1.0 222 < 0.20 44.5 < 5.0 < 2.0 < 0.050 3,060 < 0.20 < 30 < 50 - 1.08 < 30 < 5.0
Associated CARO file(s): 8052631, 8052802, 8060237, 8060737, 8061100, 8081412, 8091680, 8092458, 8092618, 9052219, 9052399, 9052558, 9052754, 9052937, 9060273, 9091657, 9092001, 9092208, 9092404, 9120616.
Associated Exova file(s): 622178, 653600, 712940, 714233, 714243, 756693, 756810, 757047, 811364, 811710, 812030, 812741, 812985, 846260, 878316, 879073, 909346, 909448, 909654.
All terms defined within the body of SNC-Lavalin's report.
< Denotes concentration less than indicated detection limit or RPD less than indicated value.a Laboratory detection limit exceeds regulatory standard/guideline.
- Denotes analysis not conducted.b Standard to protect freshwater aquatic life.
n/a Denotes no applicable standard/guideline.c Guideline to protect irrigation water. Guideline for surface water, shown here for comparison purposes only.
QA/QC RPD Denotes quality assurance/quality control relative percent differenced Guideline to protect freshwater aquatic life, long-term average (i.e. "chronic"). Guideline for surface water, shown here for comparison purposes only.
* RPDs are not calculated where one or more concentrations are less than five times RDL.e Guideline to protect freshwater aquatic life, short-term maximum (i.e. "acute"). Guideline for surface water, shown here for comparison purposes only.
RDL Denotes reported detection limit.f There is no Zinc standard specified for H > 400; therefore, the standard for H=300-<400 is applied as a conservative comparison.g Individual standards exist for Cr +3 and Cr +6. Reported value represents more stringent standard.
BOLD Concentration greater than CSR Aquatic Life (AW) standardh Only applies for specific Schedule 2 Site Activities; verify for your site.
SHADED Concentration greater than CSR Irrigation Watering (IW) standardi Guideline is temperature, pH, DOC and hardness dependent. Calculate using BLM software!
RED Concentration greater than BCWQG Irrigation Water (IW) guidelinej Guideline is pH dependent
BLUE SHADED Concentration greater than BCWQG Aquatic Life Long-Term Average (AW) guidelinek Guideline is hardness dependent
BLUE SHADED Concentration greater than BCWQG Aquatic Life Short-term Maximum (AW) guideline l Conductivity guidelines varies with crop. Guideline range 700-5,000, most stringent guideline for low tolerance crops applied (strawberry, raspberry, bean and carrot.
SNC-LAVALIN INC. Page 11 of 15
662036 / 2021 02 0920210309_662036_TAB_Historical.xlsx
QAQC CN 2021 03 09

TABLE V.2: Historical Summary of Analytical Results for Groundwater - Dissolved Metals
Physical Parameters Dissolved Metals
Sample Sample Sample Date pH
To
tal
Ha
rdn
ess
pH
(fi
eld
)
Co
nd
ucti
vit
y
Fie
ld
Co
nd
ucti
vit
y
To
tal
Dis
so
lve
d
So
lid
s
Dis
so
lve
d
Org
an
ic
Ca
rbo
n
Ph
osp
hate
Dis
so
lve
d
Alu
min
um
Dis
so
lve
d
Ca
lciu
m
Dis
so
lve
d Iro
n
Dis
so
lve
d
Mag
nes
ium
Dis
so
lve
d
Man
gan
ese
Dis
so
lve
d
Po
tass
ium
Dis
so
lve
d
So
diu
m
An
tim
on
y
Ars
en
ic
Ba
riu
m
Be
rylliu
m
Bo
ron
Ca
dm
ium
Ch
rom
ium
Co
ba
lt
Co
pp
er
Le
ad
Lit
hiu
m
Merc
ury
Mo
lyb
den
um
Nic
ke
l
Se
len
ium
Sil
ve
r
Str
on
tiu
m
Th
all
ium
Tin
Tit
an
ium
Tu
ng
ste
n
Ura
niu
m
Va
nad
ium
Zin
cf
Location ID (yyyy mm dd) pH mg/L pH µS/cm µS/cm mg/L mg/L mg/L µg/L mg/L µg/L mg/L µg/L mg/L mg/L µg/L µg/L µg/L µg/L µg/L µg/L µg/L µg/L µg/L µg/L µg/L µg/L µg/L µg/L µg/L µg/L µg/L µg/L µg/L µg/L µg/L µg/L µg/L µg/L
BC Guideline
CSR Aquatic Life (AW)b n/a n/a n/a n/a n/a n/a n/a n/a n/a n/a n/a n/a n/a n/a n/a 90 50 10,000 1.5 12,000 0.5-4k 10g 40 20-90k40-
160k n/a 0.25 10,000250-
1,500k 20 0.5-15k n/a 3 n/a 1,000 n/a 85 n/a
75-
2,400k
CSR Irrigation Watering (IW) n/a n/a n/a n/a n/a n/a n/a n/a 5,000 n/a 5,000h n/a 200h n/a n/a n/a 100 n/a 100 500 5 5g 50 200 200 2,500 1 10 200 20 n/a n/a n/a n/a n/a n/a 10 1001,000-
5,000j
BCWQG Irrigation Water (IW)c 5.0 - 9.0 n/a 5.0 - 9.0 700 - 5,000l 700 - 5,000l n/a n/a n/a n/a n/a n/a n/a n/a n/a n/a n/a n/a n/a n/a n/a n/a n/a n/a n/a n/a n/a n/a n/a n/a n/a n/a n/a n/a n/a n/a n/a n/a n/a n/a
BCWQG Aquatic Life Long-Term Average (AW)d 6.5 - 9.0 n/a 6.5 - 9.0 n/a n/a n/a n/a n/a 5 - 50 n/a n/a n/a n/a n/a n/a n/a n/a n/a n/a n/a 0.017 - 0.46 n/a n/a 0.2i n/a n/a n/a n/a n/a n/a n/a n/a n/a n/a n/a n/a n/a n/a n/a
BCWQG Aquatic Life Short-term Maximum (AW)e 6.5 - 9.0 n/a 6.5 - 9.0 n/a n/a n/a n/a n/a 20 - 100 n/a 350 (max) n/a n/a n/a n/a n/a n/a n/a n/a n/a 0.038 - 2.8 n/a n/a 0.2i n/a n/a n/a n/a n/a n/a n/a n/a n/a n/a n/a n/a n/a n/a n/a
GL27-1 GL27-1-20141118 2014 11 18 - 86.8 - - - 1,640 - - < 15a 13.4 882 12.9 117 13 619 < 0.50 28 419 < 5.0a < 100 < 0.25a < 2.5 < 0.50 < 2.5a < 1.0 207 < 0.20 34.9 < 5.0 < 5.0 < 0.050 2,900 < 0.50 < 30 < 50 - 1.08 < 30 < 5.0
(Cont'd) GL27-1-20150610 2015 06 10 8.41 87.1 - - - 1,470 - - < 10 13.7 878 12.9 110 13.9 706 < 0.50 26.5 406 < 5.0a < 100 < 0.050 < 0.50 < 0.50 < 1.0a < 1.0 204 < 0.20 42.6 < 5.0 < 1.0 < 0.050 2,930 < 0.050 < 30 < 50 - 1.23 < 30 < 5.0
GL27-1-20151104 2015 11 04 8.18 86.6 - - - 1,610 - - < 10 13.4 39 12.9 106 13.2 626 < 0.50 20.5 365 < 5.0a < 100 < 0.050 < 0.50 < 0.50 < 1.0a < 1.0 198 < 0.20 36.2 < 5.0 < 1.0 < 0.050 2,770 < 0.020 < 30 < 50 - 1.02 < 30 < 5.0
GL27-1-20160526 2016 05 26 8.27 91.8 - - - 1,620 - - < 10 13.9 662 13.8 102 14.1 708 < 0.50 17.4 432 < 5.0a < 100 < 0.050 < 0.50 < 0.50 < 1.0a < 1.0 221 < 0.20 43.2 < 5.0 < 1.0 < 0.050 2,900 < 0.050 < 30 < 50 - 1.02 < 30 < 5.0
DUP-1-20160526 Duplicate 8.31 85.7 - - - 1,690 - - < 10 13.1 637 12.9 99 13.4 684 < 0.50 17.9 412 < 5.0a < 100 < 0.050 < 0.50 < 0.50 < 1.0a < 1.0 212 < 0.20 43.5 < 5.0 < 1.0 < 0.050 2,810 < 0.050 < 30 < 50 - 1.02 < 30 < 5.0
QA/QC RPD% 0 7 - - - 4 - - * 6 4 7 3 5 3 * 3 5 * * * * * * * 4 * 1 * * * 3 * * * - 0 * *
GL27-1-20160919 2016 09 19 8.34 90.8 - - - 1,630 - - < 10 14.2 695 13.5 104 13.5 633 < 0.50 17.8 433 < 5.0a < 100 < 0.050 < 0.50 < 0.50 < 1.0a < 1.0 204 < 0.20 37.2 < 5.0 < 1.0 < 0.050 2,970 < 0.050 < 30 < 50 - 0.9 < 30 < 5.0
GL27-1-20170525 2017 05 25 8.83 95.2 - - - 1,640 - - < 10 14.5 713 14.3 101 14.2 710 < 0.50 33.1 451 < 5.0a < 100 < 0.050 < 0.50 < 0.50 < 1.0a < 1.0 233 < 0.20 79 < 5.0 < 1.0 < 0.050 3,120 < 0.050 < 30 < 50 - 0.94 < 30 < 5.0
GL27-1-20170925 2017 09 25 8.14 92 - - - 1,650 - - < 10 14.1 690 13.8 95 13.7 645 < 0.50 17 438 < 5.0a < 100 < 0.050 < 0.50 < 0.50 < 1.0a < 1.0 220 < 0.20 44.9 < 5.0 < 1.0 < 0.050 2,960 < 0.020 < 30 < 50 - 0.82 < 30 < 5.0
GL27-1-180815 2018 08 15 7.98 89.6 7.63 - 1,870 1,680 2.57 0.0407 < 5.0 14.9 521 12.7 82.1 12.4 584 < 0.20 28.7 470 < 0.10 75.0 0.038 < 0.50 < 0.10 < 0.40a < 0.20 217 < 0.010 51.2 < 0.40 < 0.50 < 0.050 3,200 < 0.020 < 0.20 < 5.0 < 1.0 1.40 < 1.0 < 4.0
GL27-1-180919 2018 09 19 7.91 99.9 7.62 - 2,388 1,620 3.45 0.0445 < 5.0 17.1 633 13.8 83.2 13.0 650 < 0.20 23.7 479 < 0.10 64.6 0.010 < 0.50 < 0.10 < 0.40a < 0.20 228 < 0.010 29.2 < 0.40 < 0.50 < 0.050 3,180 < 0.020 < 0.20 < 5.0 1.2 0.965 < 1.0 < 4.0
GL27-1-190527 2019 05 27 8.20 90.6 7.67 - 2,620 1,430 2.89 0.0794 7.8 14.8 630 13.0 91.5 12.6 602 < 0.20 18.0 472 < 0.10 70.0 < 0.010 0.86 < 0.10 < 0.40a < 0.20 216 < 0.010 20.9 < 0.40 < 0.50 < 0.050 3,220 < 0.020 < 0.20 < 5.0 1.4 0.983 < 1.0 < 4.0
GL27-1-190919 2019 09 19 8.22 92.8 7.48 - 2,471 1,610 2.84 - < 5.0 15.3 560 13.2 90.6 13.2 605 < 0.20 16.4 443 < 0.10 69.6 < 0.010 < 0.50 < 0.10 < 0.10 < 0.20 212 < 0.010 7.11 < 0.40 < 0.50 < 0.050 3,070 < 0.020 < 0.20 < 5.0 1.2 0.933 < 1.0 < 4.0
GL27-1-200608 2020 06 08 8.31 93.2 7.5 - 2,216 1,530 2.12 - 2.8 16.7 636 12.5 90.8 13.5 712 < 0.050 17.7 474 0.025 60.4 0.0051 0.80 0.0068 0.46 < 0.050 194 < 0.010 16.7 0.067 < 0.10 < 0.010 3,320 < 0.0040< 0.050 0.24 1.35 0.666 0.31 1.0
GL27-1-201022 2020 10 22 8.10 85.2 7.63 - 2,525 1,600 2.79 - < 1.0 14.2 551 12.1 82.8 11 566 < 0.050 8.73 424 0.028 64.7 0.0099 < 0.10 0.0068 < 0.10 < 0.050 200 < 0.010 13.4 < 0.040 < 0.10 < 0.010 2,880 < 0.0040< 0.050 < 0.20 1.25 0.585 0.27 < 1.0
GL27-2 GL27-1-20111217 2011 12 17 - 83 - - - 1,630 - - < 50a 13.6 1,140 12 178 11.2 604 2 59 410 < 0.4 70 0.13 8 < 0.2 < 10a < 1 230 - 68 < 10 < 6 < 0.10 3,180 0.23 < 1 < 10 - < 4 2 < 10
GL27-2-20091116 2009 11 16 - 3,760 - - - - - - 458 300 2,420 731 5,380 33 2,720 < 2 6 60 < 0.4 < 40 0.1 < 4 19.9 < 10a < 1 50 - 59 30 < 6 < 0.10 15,000 0.28 < 1 15 - 90 3 < 10
GL27-2-20100812 2010 08 12 - 3,540 - - - 14,300 - - 410 298 690 679 1,940 40 2,900 < 2 7 40 < 0.4 60 < 0.1 8 9.2 < 10a < 1 80 - 53 20 < 6 < 0.1 16,900 0.17 < 1 15 - 91 9 < 10
GL27-3 GL27-3-20091112 2009 11 12 - 5,800 - - - - - - < 50a 354 1,440 1,200 996 26 3,300 < 2 9 20 < 0.4 < 40 0.17 < 4 7 < 10a < 1 70 - 51 20 < 6 < 0.10 11,500 0.22 < 1 < 10 - 94 1 20
GL27-3-20100812 2010 08 12 - 4,700 - - - 17,800 - - 131 332 2,440 940 588 31 3,190 < 2 10 20 < 0.4 < 40 < 0.10 8 3.8 < 10a < 1 80 - 53 10 6 < 0.1 11,500 < 0.1 < 1 < 10 - 70 3 10
GL27-3-20110629 2011 06 29 - 5,170 - - - 16,700 - - 32 370 1,690 1,030 374 25.6 3,070 < 0.2 1.7 14 < 0.04 15 0.1 4.8 4.04 6 < 0.1 71 - 64.4 10 41.6 < 0.01 11,000 0.02 < 0.1 < 10 - 66 1.8 5
GL27-3-20111217 2011 12 17 - 4,500 - - - 17,100 - - < 50a 320 1,270 900 270 23.4 2,800 < 2 7 < 10 < 0.4 < 40 0.13 8 2.3 10 < 1 100 - 69 20 < 6 < 0.10 11,600 0.43 < 1 < 10 - 98 6 < 10
GL27-3-20120625 2012 06 25 - 5,060 - - - 16,400 - - < 50a 359 2,190 1,010 350 24 3,050 < 2 7 10 < 0.4 < 40 < 0.1 < 4 3.2 < 10a < 1 70 - 58 10 < 6 < 0.10 11,400 < 0.1 < 1 < 100 - 75 1 20
GL27-3-20121204 2012 12 04 - 4,480 - - - 15,900 - - < 50a 315 2,540 897 253 21.6 2,960 < 2.0 7.5 20 < 0.40 < 40 < 0.10 7.5 2.86 < 10a < 1 70 - 62.3 10 6.2 < 0.10 9,440 < 0.10 < 1.0 < 100 - 97.4 2.16 < 10
GL27-3-20130626 2013 06 26 - 5,280 - - - 17,200 - - < 60a 382 2,600 1,050 563 26 3,760 < 2.0 5.9 < 50 < 25a < 500 < 1.0a < 10a 2.6 < 10a < 1.0 73 < 0.20 58.4 < 10 < 20 0.25 10,100 < 2.0 < 150 < 50 - 87.3 < 150a < 25
GL27-3-20131113 2013 11 13 - 4,890 - - - 16,200 - - < 60a 363 2,880 967 372 26 3,190 < 2.0 6.4 < 50 < 25a < 500 < 1.0a < 10a < 2.0 < 10a < 1.0 145 < 0.20 59.1 < 10 < 20 < 0.20 10,100 < 2.0 < 150 < 50 - 85.9 < 150a < 25
GL27-3-20140605 2014 06 05 - 5,120 - - - 16,300 - - < 60a 359 1,840 1,030 479 25 3,440 < 2.0 5.4 < 50 < 25a < 500 < 1.0a < 10a < 2.0 < 10a < 1.0 85 < 0.20 56.7 < 10 < 20 < 0.20 10,200 < 2.0 < 150 < 50 - 82.4 < 150a < 25
GL27-3-20141118 2014 11 18 - 4,560 - - - 13,300 - - < 30a 326 1,620 910 331 24 2,990 < 1.0 4.3 < 50 < 25a < 500 < 0.50a < 5.0 1.4 < 5.0a < 1.0 73 < 0.20 58.6 < 5.0 < 10 < 0.10 9,270 < 1.0 < 150 < 50 - 84 < 150a < 25
GL27-3-20150610 2015 06 10 8.07 4,990 - - - 17,900 - - < 20 354 2,190 997 438 24 3,210 < 2.0 6 < 50 < 25a < 500 < 0.10 < 2.0 < 2.0 < 4.0a < 1.0 63 < 0.20 52.9 < 10 < 1.0 < 0.20 10,200 < 0.20 < 150 < 50 - 72.1 < 150a < 25
GL27-3-20151104 2015 11 04 7.88 4,380 - - - 16,000 - - < 10 316 1,190 873 298 22 2,780 < 1.0 3.3 < 50 < 25a < 500 0.17 < 1.0 1.2 < 2.0a < 1.0 72 < 0.20 57.6 < 5.0 < 1.0 < 0.10 9,000 < 0.10 < 150 < 50 - 79.4 < 150a < 25
GL27-3-20160524 2016 05 24 7.85 4,850 - - - 16,200 - - < 20 342 2,060 970 357 24 3,050 < 2.0 5 < 50 < 25a < 500 0.12 < 2.0 < 2.0 < 4.0a < 1.0 67 < 0.20 53.5 < 10 < 1.0 < 0.20 9,350 < 0.20 < 150 < 50 - 73.2 < 150a < 25
GL27-3-20170925 2017 09 25 7.82 5,080 - - - 15,200 - - < 10 361 2,630 1,010 435 25 3,400 < 1.0 5.8 < 50 < 25a < 500 0.066 < 1.0 1.7 < 2.0a < 1.0 69 < 0.20 49.8 < 5.0 < 1.0 < 0.10 9,860 < 0.10 < 150 < 50 - 79.4 < 150a < 25
GL27-3-180815 2018 08 15 7.71 5,450 7.91 - 9,589 18,000 9.12 < 0.500 < 5.0 392 2,260 1,090 688 27.7 3,000 < 0.20 5.73 14.6 < 0.10 42.9 0.127 < 0.50 2.83 < 0.40a < 0.20 78.2 < 0.010 67.0 4.50 < 0.50 < 0.050 11,100 < 0.020 < 0.20 < 5.0 < 1.0 86.2 < 1.0 < 4.0
GL27-3-190527 2019 05 27 7.90 5,350 7.45 - 16,199 13,500 7.11 < 0.500 < 5.0 372 < 10 1,070 203 28.6 3,430 0.39 1.45 9.1 < 0.10 34.9 0.809 1.40 0.79 2.10 < 0.20 93.9 < 0.010 73.8 3.09 < 0.50 < 0.050 12,300 < 0.020 < 0.20 < 5.0 < 1.0 91.2 < 1.0 8.6
GL27-3-200608 2020 06 08 7.88 5,540 7.3 - 15,172 18,200 6.30 - 1.4 439 4,610 1,080 555 42 3,830 < 0.050 9.61 9.77 0.014 33.7 0.0349 0.58 2.10 5.33 < 0.050 90.2 < 0.010 69.3 3.26 0.42 < 0.010 12,500 0.0162 < 0.050 0.41 < 0.20 73.6 0.23 1.1
GL27-4 GL27-4-20100812 2010 08 12 - 4,380 - - - 13,400 - - < 50a 420 3,510 809 8,160 121 2,480 < 2 12 90 < 0.4 190 < 0.10 31 6.2 < 10a < 1 20 - 2 20 7 < 0.1 10,400 < 0.1 < 1 30 - 20 24 < 10
GL28-1 GL28-1-20091116 2009 11 16 - 1,680 - - - - - - < 50a 211 390 282 1,390 11.2 550 < 2 3 50 < 0.4 < 40 < 0.1 < 4 5.4 < 10a < 1 80 - 14 10 < 6 < 0.10 6,000 < 0.1 < 1 < 10 - 113 < 1 10
GL30-5-20091116 Duplicate - 1,720 - - - - - - 62 218 990 286 1,140 11.5 556 < 2 4 50 < 0.4 < 40 < 0.1 < 4 4.1 < 10a < 1 110 - 14 10 < 6 < 0.10 6,150 < 0.1 < 1 < 10 - 119 < 1 20
QA/QC RPD% - 2 - - - - - - * 3 87 1 20 3 1 * 29 0 * * * * 27 * * 32 - 0 0 * * 2 * * * - 5 * 67
GL28-1-20100812 2010 08 12 - 1,600 - - - 3,990 - - < 50a 171 660 284 804 12.5 571 < 2 3 40 < 0.4 < 40 < 0.10 7 3.2 < 10a < 1 90 - 11 < 10 < 6 < 0.1 6,310 < 0.1 < 1 < 10 - 62 2 20
GL28-1-20110627 2011 06 27 - 944 - - - 3,060 - - < 50a 148 6 140 < 1 6.8 562 < 2 2 10 < 0.4 < 40 < 0.1 < 4 0.7 < 10a < 1 60 - 35 < 10 < 6 < 0.10 3,090 < 0.1 < 1 < 10 - 97 < 1 < 10
GL28-1-20120626 2012 06 26 - 550 - - - 1,610 - - < 50a 130 180 56 140 6 284 < 2 < 2 < 10 < 0.4 < 40 < 0.1 < 4 0.4 < 10a < 1 10 - 33 < 10 < 6 < 0.10 1,710 < 0.1 < 1 < 100 - 15 < 1 < 10
GL28-1-20121203 2012 12 03 - 1,680 - - - 3,870 - - < 50a 181 1,110 299 258 8.6 560 < 2.0 3 20 < 0.40 < 40 0.14 6.1 7.37 < 10a 1.1 70 - 14.8 < 10 < 6.0 0.2 6,850 0.24 < 1.0 < 10 - 120 3.82 < 10
DUP-A-20121203 Duplicate - 1,700 - - - 3,830 - - < 50a 183 1,150 304 262 8.4 564 < 2.0 2.5 20 < 0.40 < 40 < 0.10 6.6 4.8 < 10a < 1.0 70 - 12.2 < 10 < 6.0 < 0.10 6,880 < 0.10 < 1.0 < 10 - 122 1.79 < 10
QA/QC RPD% - 1 - - - 1 - - * 1 4 2 2 2 1 * 18 0 * * * 8 42 * * 0 - 19 * * * 0 * * * - 2 72 *
GL28-1-20130708 2013 07 08 - 1,740 - - - 3,530 - - < 10a 204 1,440 299 253 10.5 549 < 0.50 3.2 < 20 < 5.0a < 100 < 0.10 < 1.0 1 < 1.0a < 1.0 105 < 0.20 12.5 < 5.0 < 2.0 < 0.050 5,560 < 0.20 < 30 < 50 - 122 < 30 < 5.0
DUP1-20130708 Duplicate - 1,740 - - - 4,220 - - < 10a 205 1,460 299 253 10.6 547 < 0.50 3.3 < 20 < 5.0a < 100 < 0.10 < 1.0 1 < 1.0a < 1.0 107 < 0.20 13.1 < 5.0 < 2.0 < 0.050 5,560 < 0.20 < 30 < 50 - 125 < 30 < 5.0
QA/QC RPD% - 0 - - - 18 - - * 0 1 0 0 1 0 * 3 * * * * * 0 * * 2 * 5 * * * 0 * * * - 2 * *
Associated CARO file(s): 8052631, 8052802, 8060237, 8060737, 8061100, 8081412, 8091680, 8092458, 8092618, 9052219, 9052399, 9052558, 9052754, 9052937, 9060273, 9091657, 9092001, 9092208, 9092404, 9120616.
Associated Exova file(s): 622178, 653600, 712940, 714233, 714243, 756693, 756810, 757047, 811364, 811710, 812030, 812741, 812985, 846260, 878316, 879073, 909346, 909448, 909654.
All terms defined within the body of SNC-Lavalin's report.
< Denotes concentration less than indicated detection limit or RPD less than indicated value.a Laboratory detection limit exceeds regulatory standard/guideline.
- Denotes analysis not conducted.b Standard to protect freshwater aquatic life.
n/a Denotes no applicable standard/guideline.c Guideline to protect irrigation water. Guideline for surface water, shown here for comparison purposes only.
QA/QC RPD Denotes quality assurance/quality control relative percent differenced Guideline to protect freshwater aquatic life, long-term average (i.e. "chronic"). Guideline for surface water, shown here for comparison purposes only.
* RPDs are not calculated where one or more concentrations are less than five times RDL.e Guideline to protect freshwater aquatic life, short-term maximum (i.e. "acute"). Guideline for surface water, shown here for comparison purposes only.
RDL Denotes reported detection limit.f There is no Zinc standard specified for H > 400; therefore, the standard for H=300-<400 is applied as a conservative comparison.g Individual standards exist for Cr +3 and Cr +6. Reported value represents more stringent standard.
BOLD Concentration greater than CSR Aquatic Life (AW) standardh Only applies for specific Schedule 2 Site Activities; verify for your site.
SHADED Concentration greater than CSR Irrigation Watering (IW) standardi Guideline is temperature, pH, DOC and hardness dependent. Calculate using BLM software!
RED Concentration greater than BCWQG Irrigation Water (IW) guidelinej Guideline is pH dependent
BLUE SHADED Concentration greater than BCWQG Aquatic Life Long-Term Average (AW) guidelinek Guideline is hardness dependent
BLUE SHADED Concentration greater than BCWQG Aquatic Life Short-term Maximum (AW) guideline l Conductivity guidelines varies with crop. Guideline range 700-5,000, most stringent guideline for low tolerance crops applied (strawberry, raspberry, bean and carrot.
SNC-LAVALIN INC. Page 12 of 15
662036 / 2021 02 0920210309_662036_TAB_Historical.xlsx
QAQC CN 2021 03 09

TABLE V.2: Historical Summary of Analytical Results for Groundwater - Dissolved Metals
Physical Parameters Dissolved Metals
Sample Sample Sample Date pH
To
tal
Ha
rdn
ess
pH
(fi
eld
)
Co
nd
ucti
vit
y
Fie
ld
Co
nd
ucti
vit
y
To
tal
Dis
so
lve
d
So
lid
s
Dis
so
lve
d
Org
an
ic
Ca
rbo
n
Ph
osp
hate
Dis
so
lve
d
Alu
min
um
Dis
so
lve
d
Ca
lciu
m
Dis
so
lve
d Iro
n
Dis
so
lve
d
Mag
nes
ium
Dis
so
lve
d
Man
gan
ese
Dis
so
lve
d
Po
tass
ium
Dis
so
lve
d
So
diu
m
An
tim
on
y
Ars
en
ic
Ba
riu
m
Be
rylliu
m
Bo
ron
Ca
dm
ium
Ch
rom
ium
Co
ba
lt
Co
pp
er
Le
ad
Lit
hiu
m
Merc
ury
Mo
lyb
den
um
Nic
ke
l
Se
len
ium
Sil
ve
r
Str
on
tiu
m
Th
all
ium
Tin
Tit
an
ium
Tu
ng
ste
n
Ura
niu
m
Va
nad
ium
Zin
cf
Location ID (yyyy mm dd) pH mg/L pH µS/cm µS/cm mg/L mg/L mg/L µg/L mg/L µg/L mg/L µg/L mg/L mg/L µg/L µg/L µg/L µg/L µg/L µg/L µg/L µg/L µg/L µg/L µg/L µg/L µg/L µg/L µg/L µg/L µg/L µg/L µg/L µg/L µg/L µg/L µg/L µg/L
BC Guideline
CSR Aquatic Life (AW)b n/a n/a n/a n/a n/a n/a n/a n/a n/a n/a n/a n/a n/a n/a n/a 90 50 10,000 1.5 12,000 0.5-4k 10g 40 20-90k40-
160k n/a 0.25 10,000250-
1,500k 20 0.5-15k n/a 3 n/a 1,000 n/a 85 n/a
75-
2,400k
CSR Irrigation Watering (IW) n/a n/a n/a n/a n/a n/a n/a n/a 5,000 n/a 5,000h n/a 200h n/a n/a n/a 100 n/a 100 500 5 5g 50 200 200 2,500 1 10 200 20 n/a n/a n/a n/a n/a n/a 10 1001,000-
5,000j
BCWQG Irrigation Water (IW)c 5.0 - 9.0 n/a 5.0 - 9.0 700 - 5,000l 700 - 5,000l n/a n/a n/a n/a n/a n/a n/a n/a n/a n/a n/a n/a n/a n/a n/a n/a n/a n/a n/a n/a n/a n/a n/a n/a n/a n/a n/a n/a n/a n/a n/a n/a n/a n/a
BCWQG Aquatic Life Long-Term Average (AW)d 6.5 - 9.0 n/a 6.5 - 9.0 n/a n/a n/a n/a n/a 5 - 50 n/a n/a n/a n/a n/a n/a n/a n/a n/a n/a n/a 0.017 - 0.46 n/a n/a 0.2i n/a n/a n/a n/a n/a n/a n/a n/a n/a n/a n/a n/a n/a n/a n/a
BCWQG Aquatic Life Short-term Maximum (AW)e 6.5 - 9.0 n/a 6.5 - 9.0 n/a n/a n/a n/a n/a 20 - 100 n/a 350 (max) n/a n/a n/a n/a n/a n/a n/a n/a n/a 0.038 - 2.8 n/a n/a 0.2i n/a n/a n/a n/a n/a n/a n/a n/a n/a n/a n/a n/a n/a n/a n/a
GL28-1 GL28-1-20140603 2014 06 03 - 1,600 - - - 3,930 - - < 10a 188 1,420 274 209 9.4 537 < 0.50 3.4 < 20 < 5.0a < 100 < 0.10 < 1.0 0.77 < 1.0a < 1.0 99 < 0.20 13.4 < 5.0 < 2.0 < 0.050 5,370 < 0.20 < 30 < 50 - 116 < 30 < 5.0
(Cont'd) GL28-1-20141117 2014 11 17 - 1,690 - - - 3,970 - - < 10a 197 1,540 292 212 9.9 559 < 0.50 3 < 20 < 5.0a < 100 < 0.10 < 1.0 0.63 < 1.0a < 1.0 91 < 0.20 13.2 < 5.0 < 2.0 < 0.050 5,700 < 0.20 < 30 < 50 - 118 < 30 < 5.0
GL28-1-20150611 2015 06 11 7.93 1,630 - - - 3,920 - - < 10 192 1,520 280 208 9.4 518 < 0.50 3.2 < 20 < 5.0a < 100 < 0.050 < 0.50 0.6 < 1.0a < 1.0 81 < 0.20 14 < 5.0 < 1.0 < 0.050 5,370 < 0.020 < 30 < 50 - 131 < 30 < 5.0
GL28-1-20151105 2015 11 05 7.65 1,600 - - - 3,930 - - < 10 190 1,600 274 214 9.6 553 < 0.50 3.1 < 20 < 5.0a < 100 < 0.050 < 0.50 0.5 < 1.0a < 1.0 88 < 0.20 13.9 < 5.0 < 1.0 < 0.050 5,850 < 0.020 < 30 < 50 - 122 < 30 < 5.0
GL28-1-20160524 2016 05 24 7.97 1,710 - - - 3,950 - - < 10 197 1,750 295 220 10.1 561 < 0.50 3.9 < 20 < 5.0a < 100 < 0.050 < 0.50 0.58 < 1.0a < 1.0 93 < 0.20 14.2 < 5.0 < 1.0 < 0.050 5,710 < 0.020 < 30 < 50 - 121 < 30 < 5.0
GL28-1-20160920 2016 09 20 7.69 1,740 - - - 4,080 - - < 10 194 1,800 305 260 10.4 557 < 0.50 3.5 < 20 < 5.0a < 100 < 0.050 < 0.50 0.6 < 1.0a < 1.0 87 < 0.20 12.5 < 5.0 < 1.0 < 0.050 5,790 < 0.020 < 30 < 50 - 123 < 30 < 5.0
GL28-1-20170711 2017 07 11 8.21 1,620 - - - 3,740 - - < 10 193 1,680 276 230 10 560 < 0.50 2.6 < 20 < 5.0a < 100 < 0.050 < 0.50 < 0.50 < 1.0a < 1.0 90 < 0.20 12.2 < 5.0 < 1.0 < 0.050 5,500 < 0.020 < 30 < 50 - 109 < 30 < 5.0
GL28-1-20170926 2017 09 26 7.67 1,620 - - - 3,460 - - < 10 189 1,720 279 237 10.4 519 < 0.50 3.3 < 20 < 5.0a < 100 < 0.050 < 0.50 0.55 < 1.0a < 1.0 88 < 0.20 12.4 < 5.0 < 1.0 < 0.050 5,480 < 0.020 < 30 < 50 - 107 < 30 < 5.0
GL28-1-180528 2018 05 28 7.72 1,710 6.99 - 3,741 3,730 4.85 < 0.0050 < 5.0 201 333 292 148 11.7 536 < 0.20 1.01 14.7 < 0.10 18.3 0.193 < 0.50 0.48 0.98 < 0.20 81.1 < 0.010 12.4 1.96 0.72 < 0.050 5,950 < 0.020 < 0.20 < 5.0 < 1.0 123 < 1.0 < 4.0
GL28-1-180925 2018 09 25 7.72 1,750 7.21 - 3,761 3,770 4.88 < 0.0050 < 5.0 207 1,220 300 301 11.3 553 < 0.20 1.49 9.7 < 0.10 20.2 0.041 < 0.50 0.70 < 0.40a < 0.20 85.9 < 0.010 12.9 1.85 < 0.50 < 0.050 6,000 < 0.020 < 0.20 < 5.0 < 1.0 115 < 1.0 < 4.0
DUP1-180925 Duplicate 7.73 1,730 7.21 - 3,761 3,930 4.81 < 0.0050 < 5.0 207 1,280 295 313 11.9 544 < 0.20 1.75 10.0 < 0.10 10.1 0.039 < 0.50 0.71 1.15 < 0.20 69.3 < 0.010 13.1 1.93 < 0.50 < 0.050 5,910 < 0.020 < 0.20 < 5.0 < 1.0 114 < 1.0 < 4.0
QA/QC RPD% 0 1 * - * 4 1 * * 0 5 2 4 5 2 * 16 3 * 67 * * 1 * * 21 * 2 * * * 2 * * * * 1 * *
GL28-1-190528 2019 05 28 7.81 1,690 7.12 - 3,741 3,650 4.74 < 0.0500 < 5.0 195 1,720 293 297 10.2 489 < 0.20 2.30 10.8 < 0.10 14.5 0.034 1.04 0.64 < 0.40a < 0.20 91.1 < 0.010 13.0 1.66 < 0.50 < 0.050 6,420 < 0.020 < 0.20 < 5.0 < 1.0 119 < 1.0 < 4.0
GL28-1-190919 2019 09 19 7.78 1,650 7.39 - 3,802 3,470 4.47 - < 5.0 193 1,710 284 300 9.94 448 < 0.20 2.36 10.0 < 0.10 18.8 0.021 < 0.50 0.60 < 0.10 < 0.20 80.7 < 0.010 12.4 1.71 < 0.50 < 0.050 6,190 < 0.020 < 0.20 < 5.0 < 1.0 120 < 1.0 < 4.0
GL28-1-200610 2020 06 10 7.71 1,770 7.15 - 3,321 3,300 4.43 - < 1.0 214 1,720 300 287 10.7 461 < 0.050 3.37 10.1 0.014 18.6 0.0107 0.14 0.536 0.21 < 0.050 83.0 < 0.010 12.6 0.871 < 0.10 < 0.010 6,210 0.0044 < 0.050 < 0.20 < 0.20 112 0.30 1.3
DUPB-200610 Duplicate 7.75 1,630 7.15 - 3,321 3,680 3.83 - < 1.0 208 1,760 269 276 10.3 415 < 0.050 3.67 10.9 0.019 11.1 0.0120 0.17 0.541 0.22 < 0.050 62.6 < 0.010 13.1 0.906 < 0.10 < 0.010 6,270 0.0050 < 0.050 < 0.20 < 0.20 112 0.24 1.4
QA/QC RPD% 1 8 * - * 11 15 - * 3 2 11 4 4 11 * 9 8 * 51 11 * 1 * * 28 * 4 4 * * 1 * * * * 0 * *
GL28-1-201104 2020 11 04 7.82 1,850 7.14 - 4,082 3,840 6.24 - < 1.0 237 1,770 306 320 11.5 454 < 0.050 2.90 9.69 0.022 16.4 0.0046 < 0.10 0.589 0.40 < 0.050 82.5 < 0.010 13.3 1.79 < 0.10 < 0.010 7,000 0.0045 < 0.050 < 0.20 < 0.20 118 < 0.20 1.4
DUP3-201104 Duplicate 7.80 1,850 - - - 3,450 6.09 - < 1.0 236 1,760 307 316 11.5 451 < 0.050 2.86 9.59 0.072 16.4 0.0059 < 0.10 0.577 2.83 < 0.050 84.1 < 0.010 13.1 1.76 < 0.10 < 0.010 7,000 0.0043 < 0.050 < 0.20 < 0.20 119 < 0.20 < 1.0
QA/QC RPD% 0 0 - - - 11 2 - * 0 1 0 1 0 1 * 1 1 * 0 * * 2 * * 2 * 2 2 * * 0 * * * * 1 * *
GL28-2 GL28-2-20091116 2009 11 16 - 1,530 - - - - - - < 50a 245 < 100 224 62 12 561 < 2 < 2 20 < 0.4 < 40 0.1 < 4 0.5 < 10a < 1 40 - 4 < 10 < 6 < 0.10 4,940 < 0.1 < 1 < 10 - 130 1 < 10
GL28-2-20160524 2016 05 24 7.72 1,840 - - - 4,530 - - < 10 308 < 30 261 33 11.4 698 < 0.50 < 1.0 < 20 < 5.0a < 100 0.065 < 0.50 < 0.50 < 1.0a < 1.0 < 50 < 0.20 5.5 < 5.0 1.6 < 0.050 5,890 < 0.050 < 30 < 50 - 183 < 30 < 5.0
GL28-2-20160920 2016 09 20 7.5 1,810 - - - 4,760 - - 94 306 127 255 19 11.6 743 < 0.50 < 1.0 < 20 < 5.0a < 100 0.221 < 0.50 < 0.50 < 1.0a < 1.0 < 50 < 0.20 4.1 < 5.0 2.2 < 0.050 6,160 < 0.050 < 30 < 50 - 184 < 30 < 5.0
DUP1-20160920 Duplicate 7.51 3,610 - - - 4,750 - - 76 608 235 508 37 23.4 1,480 < 0.50 < 1.0 27 < 10a < 200 0.247 < 0.50 < 0.50 < 1.0a < 1.0 95 < 0.20 3.9 < 5.0 2.1 < 0.050 12,300 < 0.050 < 60 < 50 - 178 < 60 < 10
QA/QC RPD% 0 66 - - - 0 - - 21 66 60 66 64 67 66 * * * * * 11 * * * * * * 5 * 5 * 67 * * * - 3 * *
GL28-2-20170711 2017 07 11 8.03 1,680 - - - 4,400 - - < 10 284 < 30 236 12 11 751 < 0.50 < 1.0 < 20 < 5.0a < 100 0.105 < 0.50 < 0.50 < 1.0a < 1.0 < 50 < 0.20 4.9 < 5.0 1.7 < 0.050 5,460 < 0.050 < 30 < 50 - 170 < 30 < 5.0
GL28-2-20170926 2017 09 26 7.48 1,920 - - - 4,640 - - < 10 317 < 30 275 18 12 714 < 0.50 < 1.0 < 20 < 5.0a < 100 0.072 < 0.50 < 0.50 1.3 < 1.0 < 50 < 0.20 4.3 < 5.0 1.8 < 0.050 6,300 < 0.020 < 30 < 50 - 168 < 30 < 5.0
GL28-2-180528 2018 05 28 7.42 1,900 6.77 - 4,680 4,730 6.09 < 0.0050 < 5.0 303 < 10 278 17.4 12.8 735 < 0.20 < 0.50 13.2 < 0.10 16.3 0.065 < 0.50 0.29 0.69 < 0.20 45.5 < 0.010 4.81 2.58 1.49 < 0.050 7,280 < 0.020 < 0.20 < 5.0 < 1.0 181 < 1.0 < 4.0
DUP1-180528 Duplicate 7.51 1,860 6.77 - 4,680 4,960 6.55 < 0.0050 < 5.0 274 < 10 286 17.6 13.4 772 < 0.20 < 0.50 13.5 < 0.10 13.4 0.073 < 0.50 0.28 0.68 < 0.20 38.1 < 0.010 4.84 2.60 1.59 < 0.050 7,320 < 0.020 < 0.20 < 5.0 < 1.0 190 < 1.0 5.4
QA/QC RPD% 1 2 * - * 5 7 * * 10 * 3 1 5 5 * * 2 * 20 12 * * 1 * 18 * 1 1 6 * 1 * * * * 5 * *
GL28-2-180925 2018 09 25 7.60 2,280 6.97 - 5,093 5,370 8.34 < 0.0050 39.7 382 < 10 322 20.4 14.1 862 < 0.20 < 0.50 14.1 < 0.10 17.8 0.075 < 0.50 0.31 1.06 < 0.20 51.0 < 0.010 5.07 2.85 1.33 < 0.050 7,980 < 0.020 < 0.20 < 5.0 < 1.0 196 1.1 < 4.0
GL28-2-190528 2019 05 28 7.70 2,170 6.97 - 5,200 5,280 6.36 < 0.0500 < 5.0 352 < 10 312 21.5 12.8 820 < 0.20 < 0.50 14.0 < 0.10 14.6 0.079 < 0.50 0.36 0.85 < 0.20 58.8 < 0.010 5.41 2.88 1.18 < 0.050 8,620 < 0.020 < 0.20 < 5.0 < 1.0 200 1.0 < 4.0
GL28-2-190919 2019 09 19 7.64 2,030 7.24 - 5,225 5,380 5.96 - 47.9 340 17 286 20.2 12.4 762 < 0.20 < 0.50 13.9 < 0.10 19.1 0.072 1.02 0.34 0.71 < 0.20 52.8 < 0.010 4.99 2.86 1.57 < 0.050 7,880 < 0.020 0.43 < 5.0 < 1.0 199 < 1.0 14.0
GL28-2-200610 2020 06 10 7.66 1,730 6.95 - 3,882 4,250 4.99 - < 1.0 301 < 2.0 237 8.74 12 657 < 0.050 0.466 12.5 < 0.010 18.6 0.0520 0.30 0.189 0.58 < 0.050 43.8 < 0.010 5.31 1.33 0.60 < 0.010 6,550 0.0053 < 0.050 < 0.20 < 0.20 151 1.15 1.1
GL28-2-201104 2020 11 04 7.70 2,200 6.9 - 5,499 4,790 6.26 - < 1.0 397 171 293 19.2 14.2 955 < 0.050 0.414 13.4 < 0.010 16.9 0.0582 28.2 0.310 1.13 < 0.050 53.9 < 0.010 5.86 3.06 1.05 < 0.010 8,600 0.0089 < 0.050 < 0.20 < 0.20 196 1.15 < 1.0
GL28-3 GL28-3-20091116 2009 11 16 - 1,760 - - - - - - < 50a 279 < 100 260 353 11.9 556 < 2 < 2 30 < 0.4 < 40 0.17 < 4 1.6 10 < 1 40 - 8 20 < 6 < 0.10 5,490 < 0.1 < 1 < 10 - 145 1 10
GL28-3-20100812 2010 08 12 - 1,580 - - - 4,230 - - 91 207 < 100 257 82 12.2 610 < 2 < 2 40 < 0.4 < 40 < 0.1 7 0.3 < 10a < 1 30 - 5 10 < 6 < 0.1 5,430 < 0.1 < 1 < 10 - 73 3 < 10
GL28-3-20160524 2016 05 24 7.52 2,740 - - - 6,310 - - < 10 377 < 60 438 173 12.3 1,000 < 0.50 < 1.0 20 < 10a < 200 0.213 < 0.50 0.65 < 1.0a < 1.0 52 < 0.20 11.4 8.8 < 1.0 < 0.050 7,550 < 0.050 < 60 51 - 238 < 60 < 10
GL28-3-20160920 2016 09 20 7.57 1,280 - - - 6,550 - - < 10 158 < 30 215 194 5.5 514 < 0.50 < 1.0 < 20 < 5.0a < 100 0.265 < 0.50 1.16 < 1.0a < 1.0 < 50 < 0.20 11.9 11.6 < 1.0 < 0.050 3,660 < 0.050 < 30 < 50 - 263 < 30 < 5.0
GL28-3-20170711 2017 07 11 8.13 2,480 - - - 6,160 - - < 10 296 < 60 423 18 10.2 1,000 < 0.50 < 1.0 < 20 < 10a < 200 0.164 < 0.50 < 0.50 < 1.0a < 1.0 < 50 < 0.20 12 < 5.0 < 1.0 < 0.050 6,650 < 0.050 < 60 < 50 - 245 < 60 < 10
GL28-3-20170926 2017 09 26 7.6 2,520 - - - 6,150 - - < 10 300 < 60 430 192 10.6 1,020 < 0.50 < 1.0 < 20 < 10a < 200 0.343 < 0.50 < 0.50 1.5 < 1.0 < 50 < 0.20 13.2 9.8 < 1.0 < 0.050 7,040 0.052 < 60 < 50 - 232 < 60 < 10
GL28-3-180528 2018 05 28 7.51 2,770 6.8 - 6,392 7,280 10.3 < 0.0050 38.0 282 84 501 146 13.0 1,110 < 0.20 0.76 21.6 < 0.10 5.6 0.382 0.56 0.44 1.72 < 0.20 35.0 < 0.010 12.5 10.0 < 0.50 < 0.050 9,150 0.038 < 0.20 < 5.0 < 1.0 239 1.4 < 4.0
GL28-3-180925 2018 09 25 7.60 3,080 7 - 6,777 7,490 12.1 < 0.0050 < 5.0 378 < 10 518 321 13.8 1,230 < 0.20 0.82 19.1 < 0.10 5.5 0.316 < 0.50 0.51 1.50 < 0.20 42.9 < 0.010 14.2 12.0 < 0.50 < 0.050 8,940 0.052 < 0.20 < 5.0 < 1.0 278 1.5 < 4.0
GL28-3-190528 2019 05 28 7.78 2,880 7 - 6,743 6,780 8.29 < 0.0500 6.7 343 < 10 491 50.2 12.0 1,170 < 0.20 0.71 18.1 < 0.10 < 5.0 0.128 1.12 0.19 1.14 < 0.20 51.3 < 0.010 13.6 7.20 < 0.50 < 0.050 9,270 0.033 < 0.20 < 5.0 < 1.0 268 1.4 < 4.0
DUP2-190528 Duplicate 7.63 2,830 7 - 6,743 7,120 7.97 < 0.0500 < 5.0 341 < 10 481 50.0 11.8 1,150 < 0.20 0.67 17.9 < 0.10 < 5.0 0.134 < 0.50 0.19 1.15 < 0.20 50.7 < 0.010 13.3 7.27 < 0.50 < 0.050 9,220 0.028 < 0.20 < 5.0 < 1.0 265 1.4 < 4.0
QA/QC RPD% 2 2 * - * 5 4 * * 1 * 2 0 2 2 * * 1 * * 5 * * 1 * 1 * 2 1 * * 1 * * * * 1 0 *
GL28-3-190919 2019 09 19 7.65 2,790 7.19 - 6,895 7,490 8.62 - < 5.0 342 < 10 469 175 11.5 1,090 < 0.20 0.62 18.5 < 0.10 10.0 0.212 < 0.50 0.25 1.14 < 0.20 45.4 < 0.010 13.0 9.41 < 0.50 < 0.050 8,880 0.041 < 0.20 < 5.0 < 1.0 274 1.3 < 4.0
DUP1-190919 Duplicate 7.78 2,830 7.19 - 6,895 7,330 8.84 - < 5.0 352 < 10 475 174 11.7 1,110 < 0.20 0.68 17.9 < 0.10 16.3 0.225 1.18 0.27 1.13 < 0.20 46.5 < 0.010 13.3 9.41 < 0.50 < 0.050 8,890 0.039 < 0.20 < 5.0 < 1.0 272 1.3 < 4.0
QA/QC RPD% 2 1 * - * 2 3 - * 3 * 1 1 2 2 * * 3 * 48 6 * * 1 * 2 * 2 0 * * 0 * * * * 1 0 *
Associated CARO file(s): 8052631, 8052802, 8060237, 8060737, 8061100, 8081412, 8091680, 8092458, 8092618, 9052219, 9052399, 9052558, 9052754, 9052937, 9060273, 9091657, 9092001, 9092208, 9092404, 9120616.
Associated Exova file(s): 622178, 653600, 712940, 714233, 714243, 756693, 756810, 757047, 811364, 811710, 812030, 812741, 812985, 846260, 878316, 879073, 909346, 909448, 909654.
All terms defined within the body of SNC-Lavalin's report.
< Denotes concentration less than indicated detection limit or RPD less than indicated value.a Laboratory detection limit exceeds regulatory standard/guideline.
- Denotes analysis not conducted.b Standard to protect freshwater aquatic life.
n/a Denotes no applicable standard/guideline.c Guideline to protect irrigation water. Guideline for surface water, shown here for comparison purposes only.
QA/QC RPD Denotes quality assurance/quality control relative percent differenced Guideline to protect freshwater aquatic life, long-term average (i.e. "chronic"). Guideline for surface water, shown here for comparison purposes only.
* RPDs are not calculated where one or more concentrations are less than five times RDL.e Guideline to protect freshwater aquatic life, short-term maximum (i.e. "acute"). Guideline for surface water, shown here for comparison purposes only.
RDL Denotes reported detection limit.f There is no Zinc standard specified for H > 400; therefore, the standard for H=300-<400 is applied as a conservative comparison.g Individual standards exist for Cr +3 and Cr +6. Reported value represents more stringent standard.
BOLD Concentration greater than CSR Aquatic Life (AW) standardh Only applies for specific Schedule 2 Site Activities; verify for your site.
SHADED Concentration greater than CSR Irrigation Watering (IW) standardi Guideline is temperature, pH, DOC and hardness dependent. Calculate using BLM software!
RED Concentration greater than BCWQG Irrigation Water (IW) guidelinej Guideline is pH dependent
BLUE SHADED Concentration greater than BCWQG Aquatic Life Long-Term Average (AW) guidelinek Guideline is hardness dependent
BLUE SHADED Concentration greater than BCWQG Aquatic Life Short-term Maximum (AW) guideline l Conductivity guidelines varies with crop. Guideline range 700-5,000, most stringent guideline for low tolerance crops applied (strawberry, raspberry, bean and carrot.
SNC-LAVALIN INC. Page 13 of 15
662036 / 2021 02 0920210309_662036_TAB_Historical.xlsx
QAQC CN 2021 03 09

TABLE V.2: Historical Summary of Analytical Results for Groundwater - Dissolved Metals
Physical Parameters Dissolved Metals
Sample Sample Sample Date pH
To
tal
Ha
rdn
ess
pH
(fi
eld
)
Co
nd
ucti
vit
y
Fie
ld
Co
nd
ucti
vit
y
To
tal
Dis
so
lve
d
So
lid
s
Dis
so
lve
d
Org
an
ic
Ca
rbo
n
Ph
osp
hate
Dis
so
lve
d
Alu
min
um
Dis
so
lve
d
Ca
lciu
m
Dis
so
lve
d Iro
n
Dis
so
lve
d
Mag
nes
ium
Dis
so
lve
d
Man
gan
ese
Dis
so
lve
d
Po
tass
ium
Dis
so
lve
d
So
diu
m
An
tim
on
y
Ars
en
ic
Ba
riu
m
Be
rylliu
m
Bo
ron
Ca
dm
ium
Ch
rom
ium
Co
ba
lt
Co
pp
er
Le
ad
Lit
hiu
m
Merc
ury
Mo
lyb
den
um
Nic
ke
l
Se
len
ium
Sil
ve
r
Str
on
tiu
m
Th
all
ium
Tin
Tit
an
ium
Tu
ng
ste
n
Ura
niu
m
Va
nad
ium
Zin
cf
Location ID (yyyy mm dd) pH mg/L pH µS/cm µS/cm mg/L mg/L mg/L µg/L mg/L µg/L mg/L µg/L mg/L mg/L µg/L µg/L µg/L µg/L µg/L µg/L µg/L µg/L µg/L µg/L µg/L µg/L µg/L µg/L µg/L µg/L µg/L µg/L µg/L µg/L µg/L µg/L µg/L µg/L
BC Guideline
CSR Aquatic Life (AW)b n/a n/a n/a n/a n/a n/a n/a n/a n/a n/a n/a n/a n/a n/a n/a 90 50 10,000 1.5 12,000 0.5-4k 10g 40 20-90k40-
160k n/a 0.25 10,000250-
1,500k 20 0.5-15k n/a 3 n/a 1,000 n/a 85 n/a
75-
2,400k
CSR Irrigation Watering (IW) n/a n/a n/a n/a n/a n/a n/a n/a 5,000 n/a 5,000h n/a 200h n/a n/a n/a 100 n/a 100 500 5 5g 50 200 200 2,500 1 10 200 20 n/a n/a n/a n/a n/a n/a 10 1001,000-
5,000j
BCWQG Irrigation Water (IW)c 5.0 - 9.0 n/a 5.0 - 9.0 700 - 5,000l 700 - 5,000l n/a n/a n/a n/a n/a n/a n/a n/a n/a n/a n/a n/a n/a n/a n/a n/a n/a n/a n/a n/a n/a n/a n/a n/a n/a n/a n/a n/a n/a n/a n/a n/a n/a n/a
BCWQG Aquatic Life Long-Term Average (AW)d 6.5 - 9.0 n/a 6.5 - 9.0 n/a n/a n/a n/a n/a 5 - 50 n/a n/a n/a n/a n/a n/a n/a n/a n/a n/a n/a 0.017 - 0.46 n/a n/a 0.2i n/a n/a n/a n/a n/a n/a n/a n/a n/a n/a n/a n/a n/a n/a n/a
BCWQG Aquatic Life Short-term Maximum (AW)e 6.5 - 9.0 n/a 6.5 - 9.0 n/a n/a n/a n/a n/a 20 - 100 n/a 350 (max) n/a n/a n/a n/a n/a n/a n/a n/a n/a 0.038 - 2.8 n/a n/a 0.2i n/a n/a n/a n/a n/a n/a n/a n/a n/a n/a n/a n/a n/a n/a n/a
GL28-3 GL28-3-200610 2020 06 10 7.67 2,890 6.92 - 630.3 7,680 9.25 - < 1.0 395 < 2.0 462 130 12.7 1,190 0.110 0.893 19.9 0.012 6.0 0.180 0.35 0.356 1.45 < 0.050 40.5 < 0.010 13.1 8.14 0.23 < 0.010 9,460 0.0300 < 0.050 0.22 < 0.20 273 1.68 1.8
(Cont'd) GL28-3-201105 2020 11 05 7.75 2,870 6.96 - 277.6 7,810 9.33 - < 1.0 408 4.2 448 281 12.3 1,170 0.142 0.815 19.2 < 0.010 5.0 0.227 0.28 0.484 1.69 < 0.050 46.5 < 0.010 16.5 11.6 0.17 < 0.010 8,710 0.0416 0.087 0.34 < 0.20 269 2.02 3.0
GL29-1 GL29-1-20130708 2013 07 08 - 444 - - - 1,160 - - < 10a 82.5 217 57.8 658 10.5 272 < 0.50 3 60 < 5.0a < 100 < 0.050 < 0.50 1.25 < 1.0a < 1.0 114 < 0.20 8.8 < 5.0 < 1.0 < 0.050 2,530 < 0.20 < 30 < 50 - 12.1 < 30 < 5.0
GL29-1-20131113 2013 11 13 - 493 - - - 1,280 - - < 10a 83.7 597 69 1,130 9.8 315 < 0.50 5.1 98 < 5.0a < 100 < 0.050 < 0.50 2.91 < 1.0a < 1.0 82 < 0.20 15.8 8.3 < 1.0 < 0.050 2,580 < 0.20 < 30 < 50 - 23.7 < 30 < 5.0
DUP3-20131113 Duplicate - 495 - - - 1,240 - - < 10a 84 593 69.3 1,130 9.7 311 < 0.50 5.1 96 < 5.0a < 100 < 0.10 < 1.0 2.97 < 1.0a < 1.0 79 < 0.20 15.8 8.5 < 2.0 < 0.050 2,570 < 0.20 < 30 < 50 - 22.8 < 30 < 5.0
QA/QC RPD% - 0 - - - 3 - - * 0 1 0 0 1 1 * 0 2 * * * * 2 * * 4 * 0 2 * * 0 * * * - 4 * *
GL29-1-20140603 2014 06 03 - 516 - - - 1,430 - - < 10a 84.6 438 73.9 946 8.6 320 < 0.50 3.8 108 < 5.0a < 100 < 0.050 < 0.50 7.65 < 1.0a < 1.0 63 < 0.20 16.5 8.2 < 1.0 < 0.050 2,520 < 0.20 < 30 < 50 - 27.9 < 30 < 5.0
GL29-1-20141118 2014 11 18 - 699 - - - 1,950 - - < 10a 106 1,980 105 1,530 9.8 411 < 0.50 6.5 134 < 5.0a < 100 < 0.10 < 1.0 14.4 < 1.0a < 1.0 61 < 0.20 21 8.8 < 2.0 < 0.050 3,460 < 0.20 < 30 < 50 - 30.4 < 30 < 5.0
GL29-1-20150609 2015 06 09 8.12 629 - - - 1,900 - - < 10 99.5 823 92.4 1,250 9.3 391 < 0.50 4.5 111 < 5.0a < 100 < 0.050 < 0.50 8.07 < 1.0a < 1.0 51 < 0.20 20.2 8.8 < 1.0 < 0.050 3,370 < 0.020 < 30 < 50 - 31.6 < 30 < 5.0
GL29-1-20151105 2015 11 05 7.85 671 - - - 1,780 - - < 10 116 176 92.5 1,070 9.6 347 < 0.50 1.9 93 < 5.0a < 100 0.057 < 0.50 12.6 5.3 < 1.0 < 50 < 0.20 23.3 18.7 < 1.0 < 0.050 3,100 < 0.020 < 30 < 50 - 36 < 30 < 5.0
GL29-1-20160524 2016 05 24 7.94 682 - - - 1,650 - - < 10 128 94 87.9 861 10.2 306 < 0.50 2.4 83 < 5.0a 240 0.097 0.58 5.88 13.5 < 1.0 < 50 < 0.20 29.9 30.1 < 1.0 < 0.050 2,880 < 0.020 < 30 < 50 - 46.9 < 30 < 5.0
GL29-1-20160921 2016 09 21 8.08 639 - - - 1,590 - - < 10 118 47 83.6 885 9.7 312 0.5 2.3 86 < 5.0a 190 0.2 < 0.50 14.5 13.5 < 1.0 < 50 < 0.20 28.9 30.1 < 1.0 < 0.050 3,050 < 0.020 < 30 < 50 - 49.9 < 30 < 5.0
GL29-1-20170529 2017 05 29 8.1 586 - - - 1,300 - - < 10 115 < 30 72.8 < 10 10.2 272 0.54 2.1 68 < 5.0a 210 0.07 < 0.50 1.64 13.4 < 1.0 51 < 0.20 23.8 19.8 < 1.0 < 0.050 2,770 < 0.010 < 30 < 50 - 41.1 < 30 < 5.0
GL29-1-20170926 2017 09 26 7.88 542 - - - 1,290 - - < 10 101 < 30 70.2 312 9.8 262 0.52 2.1 69 < 5.0a 170 0.297 < 0.50 12.6 8.8 < 1.0 52 < 0.20 21.4 21.2 < 1.0 < 0.050 2,730 < 0.010 < 30 < 50 - 38.2 < 30 < 5.0
DUP1-20170926 Duplicate 7.88 539 - - - 1,330 - - < 10 99.6 < 30 70.6 307 9.8 258 0.53 2.2 68 < 5.0a 170 0.305 < 0.50 13 9.1 < 1.0 53 < 0.20 21.6 22.3 < 1.0 < 0.050 2,690 < 0.010 < 30 < 50 - 38.6 < 30 < 5.0
QA/QC RPD% 0 1 - - - 3 - - * 1 * 1 2 0 2 * 5 1 * 0 3 * 3 3 * 2 * 1 5 * * 1 * * * - 1 * *
GL29-1-180604 2018 06 04 7.71 659 7.24 - 1,240 1,220 118 0.0343 6.1 191 73 43.7 39.8 16.0 70.9 1.30 3.64 51.9 < 0.10 512 0.267 2.08 2.15 84.0 < 0.20 16.4 < 0.010 40.1 30.8 0.69 < 0.050 1,570 0.039 < 0.20 < 5.0 1.7 21.5 5.5 6.1
GL29-1-180919 2018 09 19 7.70 683 7.38 - 1,389 1,190 93.7 < 0.0050 < 5.0 192 78 49.2 637 15.8 83.2 1.70 3.88 63.4 < 0.10 518 0.371 1.97 53.0 84.5 < 0.20 18.6 < 0.010 45.0 39.2 0.79 < 0.050 1,720 0.054 < 0.20 < 5.0 5.1 27.3 5.2 7.7
GL29-1-190603 2019 06 03 7.76 467 7.06 - 1,715 1,160 12.8 < 0.0500 38.8 87.4 65 60.3 557 11.1 284 0.80 1.67 52.4 0.20 92.0 0.053 < 0.50 20.1 1.92 < 0.20 118 < 0.010 9.71 6.47 0.60 < 0.050 3,190 < 0.020 < 0.20 < 5.0 1.0 19.0 < 1.0 < 4.0
GL29-1-190924 2019 09 24 7.89 448 7 - 1,731 1,160 11.1 - 8.3 79.6 584 60.6 704 9.74 267 0.33 2.08 68.5 < 0.10 75.2 < 0.010 0.71 3.33 < 0.10 < 0.20 89.8 < 0.010 1.67 2.82 0.66 < 0.050 2,860 < 0.020 < 0.20 < 5.0 5.2 31.4 1.2 < 4.0
GL29-1-200612 2020 06 12 7.04 421 7.01 - 1,380 1,110 6.25 - 1.9 74.4 1,030 57 674 9.32 263 0.478 4.78 68.4 0.089 59.8 0.0043 0.19 33.0 < 0.10 < 0.050 99.1 < 0.010 8.96 2.52 0.11 < 0.010 2,880 < 0.0040 0.051 0.29 4.51 25.2 0.30 < 1.0
GL29-1-201120 2020 11 20 7.84 442 7.07 - 1,723 1,050 3.16 - 1.1 84.5 898 56.1 532 10.3 276 < 0.050 3.99 56.0 0.122 43.4 < 0.0020 0.15 47.6 < 0.10 < 0.050 95.0 < 0.010 8.94 1.39 < 0.10 < 0.010 3,000 < 0.0040< 0.050 < 0.20 3.08 21.1 < 0.20 < 1.0
GL29-2 GL29-2-20130627 2013 06 27 - 2,830 - - - 7,910 - - < 15a 333 276 486 3,310 20.2 1,230 < 0.50 4.1 55 < 10a < 200 < 0.25 < 2.5 17.7 < 2.5a < 1.0 58 < 0.20 46.3 60.5 < 5.0 < 0.050 7,280 < 0.50 < 60 < 50 - 106 < 60 < 10
GL29-2-20131113 2013 11 13 - 2,910 - - - 7,890 - - < 30a 346 1,080 496 3,410 20.4 1,260 < 1.0 4.5 49 < 10a < 200 < 0.50a < 5.0 8.6 < 5.0a < 1.0 109 < 0.20 31.2 30.1 < 10 < 0.10 7,240 < 1.0 < 60 < 50 - 66.7 < 60 < 10
GL31-1 GL31-3-20130627 2013 06 27 - 4,240 - - - 15,300 - - < 60a 199 < 150 909 485 38 3,470 < 2.0 4 < 50 < 25a < 500 < 1.0a < 10a 5.4 < 10a < 1.0 55 < 0.20 33.7 < 10 < 20 < 0.20 9,270 < 2.0 < 150 < 50 - 25.6 < 150a < 25
GL31-3-20141126 2014 11 26 - 4,280 - - - 14,700 - - < 60a 195 7,070 921 435 38 3,250 < 2.0 26.2 < 50 < 25a < 500 < 1.0a < 10a 4.6 < 10a < 1.0 < 50 < 0.20 33 < 10 < 20 < 0.20 9,560 < 2.0 < 150 < 50 - 26 < 150a < 25
GL31-3 BH 11-18C-20120627 2012 06 27 - 4,600 - - - 15,500 - - < 50a 207 4,440 992 1,240 41 3,460 < 2 19 30 < 0.4 < 40 < 0.1 18 11.1 40 < 1 50 - 33 20 11 < 0.10 10,900 < 0.1 < 1 < 100 - 28 6 < 10
GL31-3-20121205 2012 12 05 - 4,470 - - - 15,400 - - 56 202 6,580 964 1,020 37.3 3,350 < 2.0 19.1 30 < 0.40 50 < 0.10 18.2 7.67 < 10a < 1.0 70 - 37.9 20 10.7 < 0.10 11,300 < 0.10 < 1.0 < 1,000 - 29.8 5.86 < 10
GL31-3-20131114 2013 11 14 - 4,310 - - - 15,800 - - < 60a 195 6,250 929 454 37 3,410 < 2.0 23.5 < 50 < 25a < 500 < 1.0a < 10a 4.9 < 10a < 1.0 53 < 0.20 36.4 11 < 20 < 0.20 9,260 < 2.0 < 150 < 50 - 27.3 < 150a < 25
GL31-3-20140609 2014 06 09 - 4,420 - - - 14,900 - - < 60a 194 1,690 955 521 39 3,490 < 2.0 11.1 < 50 < 25a < 500 < 1.0a < 10a 5.1 < 10a < 1.0 62 < 0.20 34.4 10 < 20 < 0.20 9,540 < 2.0 < 150 < 50 - 24.7 < 150a < 25
GL31-3-20150611 2015 06 11 7.83 4,460 - - - 13,400 - - < 20 202 9,360 961 446 40 3,660 < 2.0 31.3 < 50 < 25a < 500 < 0.10 < 2.0 4.2 < 4.0a < 1.0 < 50 < 0.20 34.7 < 10 < 1.0 < 0.20 9,820 < 0.20 < 150 < 50 - 27.4 < 150a < 25
GL31-3-20151109 2015 11 09 7.55 4,060 - - - 15,200 - - 21 190 2,000 870 421 38 3,430 < 2.0 16.2 < 50 < 25a < 500 < 0.10 < 2.0 3.5 4.1 < 1.0 51 < 0.20 22.6 < 10 < 1.0 < 0.20 9,440 < 0.20 < 150 < 50 - 22.8 < 150a < 25
DUP4-20151109 Duplicate 7.5 4,060 - - - 15,200 - - < 20 189 720 871 420 38 3,450 < 2.0 14.3 < 50 < 25a < 500 < 0.10 < 2.0 3.6 < 4.0a < 1.0 52 < 0.20 22.9 < 10 < 1.0 < 0.20 9,280 < 0.20 < 150 < 50 - 23.2 < 150a < 25
QA/QC RPD% 1 0 - - - 0 - - * 1 94 0 0 0 1 * 12 * * * * * 3 * * 2 * 1 * * * 2 * * * - 2 * *
GL35-3 BH11-31C-20111217 2011 12 17 - 1,100 - - - 37,000 - - < 500a 8 < 50 264 < 10 400 13,100 100 300 < 100 < 4a 1,300 8.1 250 < 2 200 < 10 < 100 - 10 < 100 < 60a < 1.0 2,300 < 1 130 < 100 - 260 80 < 100
DUPB-20111217 Duplicate - 1,090 - - - 37,900 - - < 500a 8 < 50 260 < 10 400 12,800 100 300 < 100 < 4a 1,200 6.8 220 < 2 200 < 10 < 100 - 30 < 100 < 60a < 1.0 2,200 < 1 140 100 - 270 70 < 100
QA/QC RPD% - 1 - - - 2 - - * 0 * 2 * 0 2 0 0 * * 8 17 13 * 0 * * - 100 * * * 4 * 7 * - 4 13 *
BH11-31C-20120625 2012 06 25 - 2,740 - - - 10,900 - - < 50a 265 10,800 505 480 46 2,630 < 2 3 20 < 0.4 60 < 0.10 12 0.9 < 10a < 1 370 - < 1 < 10 6 < 0.10 12,300 < 0.1 < 1 < 100 - 20 6 10
GL35-3-20121205 2012 12 05 - 2,680 - - - 10,900 - - 58 258 11,400 495 250 39.6 2,490 < 2.0 3.8 20 < 0.40 130 < 0.10 14.7 < 0.20 < 10a < 1 490 - < 1.0 < 10 < 6.0 < 0.10 12,500 < 0.10 < 1.0 < 1,000 - 26.3 5.55 < 10
DUP-C-20121205 Duplicate - 2,720 - - - 10,800 - - 57 260 14,700 504 290 39.7 2,510 < 2.0 4 20 < 0.40 120 < 0.10 15.1 < 0.20 < 10a < 1 490 - < 1.0 < 10 8.2 < 0.10 12,400 < 0.10 54.1 < 1,000 - 25.8 5.84 < 10
QA/QC RPD% - 1 - - - 1 - - 2 1 25 2 15 0 1 * 5 0 * 8 * 3 * * * 0 - * * * * 1 * * * - 2 5 *
GL35-3-20130627 2013 06 27 - 2,220 - - - 8,910 - - < 30a 219 < 90 406 467 36.8 2,320 < 1.0 < 1.0 < 30 < 15a < 300 < 0.50a < 5.0 < 1.0 < 5.0a < 1.0 377 < 0.20 < 1.0 < 5.0 < 10 < 0.10 8,740 < 1.0 < 90 < 50 - 10 < 90 < 15
DUP3-20130627 Duplicate - 2,240 - - - 8,910 - - < 30a 220 < 90 410 470 37.2 2,340 < 1.0 < 1.0 < 30 < 15a < 300 < 0.50a < 5.0 < 1.0 < 5.0a < 1.0 380 < 0.20 < 1.0 < 5.0 < 10 < 0.10 8,840 < 1.0 < 90 < 50 - 9.03 < 90 < 15
QA/QC RPD% - 1 - - - 0 - - * 0 * 1 1 1 1 * * * * * * * * * * 1 * * * * * 1 * * * - 10 * *
GL35-3-20131113 2013 11 13 - 2,280 - - - 9,430 - - < 30a 221 15,100 419 471 38 2,270 < 1.0 1.7 < 50 < 25a < 500 < 0.50a < 5.0 < 1.0 < 5.0a < 1.0 402 < 0.20 < 1.0 < 5.0 < 10 < 0.10 9,040 < 1.0 < 150 < 50 - 10.1 < 150a < 25
GL35-3-20140609 2014 06 09 - 2,220 - - - 8,650 - - < 30a 207 10,300 413 407 36.3 2,310 < 1.0 < 1.0 < 30 < 15a < 300 < 0.50a < 5.0 < 1.0 < 5.0a < 1.0 406 < 0.20 < 1.0 < 5.0 < 10 < 0.10 8,080 < 1.0 < 90 < 50 - 9.53 < 90 < 15
GL35-3-20141126 2014 11 26 - 2,060 - - - 8,860 - - < 30a 186 6,480 387 391 38 2,200 < 1.0 2.3 < 50 < 25a < 500 < 0.50a < 5.0 < 1.0 < 5.0a < 1.0 353 < 0.20 < 1.0 < 5.0 < 10 < 0.10 8,070 < 1.0 < 150 < 50 - 6.6 < 150a < 25
GL35-3-20150611 2015 06 11 7.63 2,170 - - - 8,690 - - < 10 205 18,700 402 438 37 2,290 < 1.0 1.1 < 50 < 25a < 500 < 0.050 < 1.0 < 1.0 < 2.0a < 1.0 368 < 0.20 < 1.0 < 5.0 < 1.0 < 0.10 8,730 < 0.10 < 150 < 50 - 4.21 < 150a < 25
GL35-3-20151109 2015 11 09 7.67 2,030 - - - 12,000 - - < 20 175 < 150 387 385 61 3,180 2.1 12 < 50 < 25a < 500 < 0.10 4.4 < 2.0 < 4.0a < 1.0 305 < 0.20 < 1.0 < 10 4 < 0.20 8,100 < 0.20 < 150 < 50 - 16.5 < 150a < 25
GL35-3-20160526 2016 05 26 7.59 2,200 - - - 8,300 - - < 10 209 20,700 407 442 35.6 2,340 < 1.0 1.4 < 30 < 15a < 300 < 0.050 < 1.0 < 1.0 < 2.0a < 1.0 377 < 0.20 < 1.0 < 5.0 < 1.0 < 0.10 8,350 < 0.10 < 90 < 50 - 3.83 < 90 < 15
Associated CARO file(s): 8052631, 8052802, 8060237, 8060737, 8061100, 8081412, 8091680, 8092458, 8092618, 9052219, 9052399, 9052558, 9052754, 9052937, 9060273, 9091657, 9092001, 9092208, 9092404, 9120616.
Associated Exova file(s): 622178, 653600, 712940, 714233, 714243, 756693, 756810, 757047, 811364, 811710, 812030, 812741, 812985, 846260, 878316, 879073, 909346, 909448, 909654.
All terms defined within the body of SNC-Lavalin's report.
< Denotes concentration less than indicated detection limit or RPD less than indicated value.a Laboratory detection limit exceeds regulatory standard/guideline.
- Denotes analysis not conducted.b Standard to protect freshwater aquatic life.
n/a Denotes no applicable standard/guideline.c Guideline to protect irrigation water. Guideline for surface water, shown here for comparison purposes only.
QA/QC RPD Denotes quality assurance/quality control relative percent differenced Guideline to protect freshwater aquatic life, long-term average (i.e. "chronic"). Guideline for surface water, shown here for comparison purposes only.
* RPDs are not calculated where one or more concentrations are less than five times RDL.e Guideline to protect freshwater aquatic life, short-term maximum (i.e. "acute"). Guideline for surface water, shown here for comparison purposes only.
RDL Denotes reported detection limit.f There is no Zinc standard specified for H > 400; therefore, the standard for H=300-<400 is applied as a conservative comparison.g Individual standards exist for Cr +3 and Cr +6. Reported value represents more stringent standard.
BOLD Concentration greater than CSR Aquatic Life (AW) standardh Only applies for specific Schedule 2 Site Activities; verify for your site.
SHADED Concentration greater than CSR Irrigation Watering (IW) standardi Guideline is temperature, pH, DOC and hardness dependent. Calculate using BLM software!
RED Concentration greater than BCWQG Irrigation Water (IW) guidelinej Guideline is pH dependent
BLUE SHADED Concentration greater than BCWQG Aquatic Life Long-Term Average (AW) guidelinek Guideline is hardness dependent
BLUE SHADED Concentration greater than BCWQG Aquatic Life Short-term Maximum (AW) guideline l Conductivity guidelines varies with crop. Guideline range 700-5,000, most stringent guideline for low tolerance crops applied (strawberry, raspberry, bean and carrot.
SNC-LAVALIN INC. Page 14 of 15
662036 / 2021 02 0920210309_662036_TAB_Historical.xlsx
QAQC CN 2021 03 09

TABLE V.2: Historical Summary of Analytical Results for Groundwater - Dissolved Metals
Physical Parameters Dissolved Metals
Sample Sample Sample Date pH
To
tal
Ha
rdn
ess
pH
(fi
eld
)
Co
nd
ucti
vit
y
Fie
ld
Co
nd
ucti
vit
y
To
tal
Dis
so
lve
d
So
lid
s
Dis
so
lve
d
Org
an
ic
Ca
rbo
n
Ph
osp
hate
Dis
so
lve
d
Alu
min
um
Dis
so
lve
d
Ca
lciu
m
Dis
so
lve
d Iro
n
Dis
so
lve
d
Mag
nes
ium
Dis
so
lve
d
Man
gan
ese
Dis
so
lve
d
Po
tass
ium
Dis
so
lve
d
So
diu
m
An
tim
on
y
Ars
en
ic
Ba
riu
m
Be
rylliu
m
Bo
ron
Ca
dm
ium
Ch
rom
ium
Co
ba
lt
Co
pp
er
Le
ad
Lit
hiu
m
Merc
ury
Mo
lyb
den
um
Nic
ke
l
Se
len
ium
Sil
ve
r
Str
on
tiu
m
Th
all
ium
Tin
Tit
an
ium
Tu
ng
ste
n
Ura
niu
m
Va
nad
ium
Zin
cf
Location ID (yyyy mm dd) pH mg/L pH µS/cm µS/cm mg/L mg/L mg/L µg/L mg/L µg/L mg/L µg/L mg/L mg/L µg/L µg/L µg/L µg/L µg/L µg/L µg/L µg/L µg/L µg/L µg/L µg/L µg/L µg/L µg/L µg/L µg/L µg/L µg/L µg/L µg/L µg/L µg/L µg/L
BC Guideline
CSR Aquatic Life (AW)b n/a n/a n/a n/a n/a n/a n/a n/a n/a n/a n/a n/a n/a n/a n/a 90 50 10,000 1.5 12,000 0.5-4k 10g 40 20-90k40-
160k n/a 0.25 10,000250-
1,500k 20 0.5-15k n/a 3 n/a 1,000 n/a 85 n/a
75-
2,400k
CSR Irrigation Watering (IW) n/a n/a n/a n/a n/a n/a n/a n/a 5,000 n/a 5,000h n/a 200h n/a n/a n/a 100 n/a 100 500 5 5g 50 200 200 2,500 1 10 200 20 n/a n/a n/a n/a n/a n/a 10 1001,000-
5,000j
BCWQG Irrigation Water (IW)c 5.0 - 9.0 n/a 5.0 - 9.0 700 - 5,000l 700 - 5,000l n/a n/a n/a n/a n/a n/a n/a n/a n/a n/a n/a n/a n/a n/a n/a n/a n/a n/a n/a n/a n/a n/a n/a n/a n/a n/a n/a n/a n/a n/a n/a n/a n/a n/a
BCWQG Aquatic Life Long-Term Average (AW)d 6.5 - 9.0 n/a 6.5 - 9.0 n/a n/a n/a n/a n/a 5 - 50 n/a n/a n/a n/a n/a n/a n/a n/a n/a n/a n/a 0.017 - 0.46 n/a n/a 0.2i n/a n/a n/a n/a n/a n/a n/a n/a n/a n/a n/a n/a n/a n/a n/a
BCWQG Aquatic Life Short-term Maximum (AW)e 6.5 - 9.0 n/a 6.5 - 9.0 n/a n/a n/a n/a n/a 20 - 100 n/a 350 (max) n/a n/a n/a n/a n/a n/a n/a n/a n/a 0.038 - 2.8 n/a n/a 0.2i n/a n/a n/a n/a n/a n/a n/a n/a n/a n/a n/a n/a n/a n/a n/a
GL35-3 GL35-3-20170926 2017 09 26 7.45 2,010 - - - 7,480 - - < 10 196 25,000 369 374 32.9 2,110 < 0.50 < 1.0 < 30 < 15a < 300 < 0.050 < 0.50 < 0.50 < 1.0a < 1.0 368 < 0.20 < 1.0 < 5.0 < 1.0 < 0.050 8,380 < 0.050 < 90 < 50 - 3.75 < 90 < 15
(Cont'd) GL35-3-180815 2018 08 15 7.29 2,070 6.98 - 6,480 8,230 7.93 < 0.0050 < 5.0 211 24,800 374 443 34.1 1,980 < 0.20 0.67 17.2 < 0.10 87.0 < 0.010 0.52 < 0.10 < 0.40a < 0.20 413 < 0.010 0.21 < 0.40 < 0.50 < 0.050 8,860 < 0.020 < 0.20 < 5.0 < 1.0 4.17 1.2 < 4.0
GL35-3-190530 2019 05 30 7.58 2,000 6.85 - 9,132 7,760 4.72 < 0.0500 5.1 194 23,200 368 348 32.0 1,980 0.21 0.61 16.3 < 0.10 76.9 < 0.010 1.28 < 0.10 < 0.40a < 0.20 421 < 0.010 0.27 0.46 < 0.50 < 0.050 9,410 < 0.020 < 0.20 < 5.0 < 1.0 7.01 1.3 < 4.0
GL35-3-200608 2020 06 08 7.73 2,180 6.73 - 7,916 7,520 3.66 - 3.0 228 16,700 392 377 37.1 2,040 < 0.050 0.842 15.9 0.066 55.4 0.0077 1.73 0.0296 0.90 < 0.050 350 < 0.010 2.34 0.361 0.10 < 0.010 9,340 < 0.0040< 0.050 1.16 < 0.20 21.9 1.25 < 1.0
DUPA-200608 Duplicate 7.73 2,080 6.73 - 7,916 7,520 4.14 - 2.9 213 15,900 376 363 36.2 2,090 < 0.050 0.820 15.8 0.059 50.2 0.0067 1.62 0.0297 0.97 < 0.050 316 < 0.010 2.29 0.350 0.11 < 0.010 9,410 < 0.0040< 0.050 1.19 < 0.20 21.0 1.23 < 1.0
QA/QC RPD% 0 5 * - * 0 12 - * 7 5 4 4 2 2 * 3 1 11 10 * 7 0 7 * 10 * 2 3 * * 1 * * 3 * 4 2 *
GL37 GL37-20130708 2013 07 08 - 5,860 - - - 35,900 - - < 150a 285 6,850 1,250 1,160 200 6,650 < 5.0 15.2 < 100 < 50a < 1,000a < 2.5a < 25a < 5.0 176 < 2.5 < 100 < 0.20 104 57 < 50a < 0.50 7,660 < 5.0a < 300 < 100 - 251 < 300a < 50
GL37-20131114 2013 11 14 - 5,970 - - - 28,600 - - < 150a 298 7,060 1,270 1,150 210 7,010 < 5.0 16.1 < 100 < 50a < 1,000a < 2.5a < 25a < 5.0 < 25a < 2.5 < 100 < 0.20 103 < 25 < 50a < 0.50 8,160 < 5.0a < 300 < 100 - 236 < 300a < 50
GL39-1 GL39-1-191205 2019 12 05 7.86 1,790 - - - 3,610 8.17 - < 5.0 180 < 10 326 161 12.4 406 < 0.20 < 0.50 14.8 < 0.10 20.4 0.070 < 0.50 1.40 0.89 < 0.20 61.6 < 0.010 21.5 1.89 4.89 < 0.050 5,690 0.034 < 0.20 < 5.0 < 1.0 191 < 1.0 < 4.0
GL39-1-200609 2020 06 09 7.81 2,120 7.02 - 3,724 3,710 6.40 - 1.1 229 < 2.0 376 31.8 14.2 476 < 0.050 0.333 13.5 < 0.010 15.9 0.0609 0.50 0.286 1.19 < 0.050 67.4 < 0.010 22.4 1.07 10.6 < 0.010 45.5 0.0157 < 0.050 < 0.20 < 0.20 219 0.42 1.4
GL39-1-201019 2020 10 19 7.85 1,970 2.03 - 4,547 4,140 8.10 - 1.7 253 3.9 324 10.2 13.5 380 < 0.050 0.472 12.4 < 0.010 8.4 0.0459 0.35 0.207 1.16 < 0.050 59.5 < 0.010 22.4 1.02 5.58 < 0.010 6,840 0.0144 < 0.050 0.24 < 0.20 219 0.23 1.4
GL39-2 GL39-2-191205 2019 12 05 7.93 1,940 - - - 5,110 7.99 - 5.7 183 < 10 360 13.3 11.3 741 < 0.20 0.51 16.2 < 0.10 15.2 0.050 12.9 0.16 1.75 < 0.20 28.6 < 0.010 21.5 2.18 12.2 < 0.050 4,940 < 0.020 < 0.20 < 5.0 < 1.0 131 < 1.0 < 4.0
GL39-2-200609 2020 06 09 7.85 1,910 7.29 - 4,140 4,110 6.23 - 4.5 188 8.8 349 6.72 9.71 1.27 0.059 0.419 12.3 < 0.010 9.7 0.0480 7.30 0.137 1.74 < 0.050 23.6 < 0.010 23.2 1.33 4.73 < 0.010 27.6 0.0111 < 0.050 0.31 < 0.20 120 0.79 < 1.0
GL39-2-201016 2020 10 16 7.88 1,240 7.35 - 3,324 2,990 6.14 - 1.6 117 < 2.0 230 4.88 7.93 531 0.082 0.422 12.9 < 0.010 10.9 0.0236 3.31 0.109 1.63 < 0.050 22.2 < 0.010 26.8 1.02 5.17 < 0.010 2,870 0.0089 0.132 < 0.20 < 0.20 89.8 0.61 < 1.0
DUP1-201016 Duplicate 7.90 1,260 7.69 - 1,582 3,090 5.89 - 1.6 121 < 2.0 233 4.86 7.9 545 0.085 0.421 12.8 < 0.010 10.3 0.0213 3.29 0.105 1.48 < 0.050 22.0 < 0.010 26.9 1.02 5.22 < 0.010 2,840 0.0084 0.217 < 0.20 < 0.20 91.1 0.60 < 1.0
QA/QC RPD% 0 2 * - * 3 4 - * 3 * 1 0 0 3 * 0 1 * 6 10 1 4 10 * 1 * 0 0 1 * 1 * * * * 1 * *
GL40-3 GL40-3-201117 2020 11 17 8.09 311 7.31 - 4,621 3,000 66.4 - 2.1 75.4 66.6 29.7 466 10.6 1,230 1.45 15.4 585 < 0.010 76.9 0.0058 0.24 0.119 < 0.10 < 0.050 283 < 0.010 1.52 1.13 < 0.10 < 0.010 8,370 < 0.0040 0.176 1.29 0.66 8.49 1.22 < 1.0
GL41-1 GL41-1-200616 2020 06 16 8.03 661 7.43 - 2,257 1,400 6.70 - 3.4 69.4 4.0 118 669 17.4 249 0.122 1.30 192 < 0.010 45.7 0.393 0.58 1.01 1.17 < 0.050 38.3 < 0.010 12.0 4.80 0.79 < 0.010 2,540 0.0521 0.200 < 0.20 < 0.20 29.2 1.85 5.6
GL41-1-201102 2020 11 02 8.03 735 7.56 - 248 1,530 5.81 - 2.1 61.4 < 2.0 141 215 18.6 312 0.156 1.20 118 < 0.010 50.6 0.311 1.68 0.229 1.69 < 0.050 44.2 < 0.010 11.0 2.40 0.54 < 0.010 2,830 0.0260 < 0.050 0.26 < 0.20 27.7 2.73 4.7
GL41-2 GL41-2-191205 2019 12 05 8.05 530 - - - 1,230 6.32 - 75.7 53.6 97 96.3 164 15.1 234 < 0.20 1.19 67.3 < 0.10 30.0 0.044 3.18 0.29 1.52 0.24 36.9 < 0.010 10.9 1.55 0.64 < 0.050 2,320 < 0.020 < 0.20 < 5.0 < 1.0 20.3 2.6 < 4.0
GL41-2-200612 2020 06 12 7.44 726 7.24 - 2,073 1,390 6.13 - < 1.0 71.1 < 2.0 133 0.111 16 279 0.073 1.05 87.9 < 0.010 25.2 0.0102 2.26 0.0429 1.13 < 0.050 45.2 < 0.010 7.49 0.479 0.49 0.010 3,120 0.0064 < 0.050 < 0.20 < 0.20 26.3 2.29 < 1.0
DUPD-200612 Duplicate 7.50 743 7.24 - 2,073 1,370 6.38 - < 1.0 71.4 < 2.0 137 0.085 16.3 284 0.074 1.06 87.8 < 0.010 25.2 0.0119 2.26 0.0404 1.13 < 0.050 45.3 < 0.010 7.45 0.454 0.51 < 0.010 3,080 0.0065 < 0.050 < 0.20 < 0.20 26.1 2.32 < 1.0
QA/QC RPD% 1 2 * - * 1 4 - * 0 * 3 * 2 2 * 1 0 * 0 15 0 6 0 * 0 * 1 5 * * 1 * * * * 1 1 *
GL41-2-201022 2020 10 22 7.83 684 7.31 - 2,562 1,410 6.58 - < 1.0 72.6 < 2.0 122 0.070 15.1 256 0.072 1.05 85.2 0.011 29.7 0.0149 2.44 0.0438 1.24 < 0.050 41.7 < 0.010 7.10 0.516 0.49 0.011 2,840 < 0.0040< 0.050 < 0.20 < 0.20 25.8 2.54 < 1.0
GL42-1 GL42-1-200612 2020 06 12 7.12 184 7.28 - 2,332 2,360 2.39 - < 1.0 35 2,940 23.4 343 9.87 1,530 0.225 2.67 551 0.025 82.3 0.0270 0.30 0.154 < 0.10 0.110 1,270 < 0.010 4.00 0.610 0.12 < 0.010 3,460 < 0.0040 0.115 1.00 0.24 1.73 1.36 1.7
GL42-1-201106 2020 11 06 7.80 171 7.27 - 5,266 3,620 2.95 - 1.7 33.4 3,500 21.3 467 9.63 1,440 0.655 5.24 640 0.014 55.3 0.0334 0.48 0.292 0.19 0.065 1,270 < 0.010 3.08 0.932 < 0.10 < 0.010 3,360 < 0.0040 0.269 1.78 0.22 0.956 1.50 1.9
GL42-2 GL42-2-200616 2020 06 16 8.08 855 7.45 - 4,649 3,910 6.51 - 55.4 89.2 122 153 1,320 7.78 973 0.353 2.53 102 0.013 48.3 0.195 0.18 1.88 0.63 0.167 105 < 0.010 18.4 6.50 0.21 < 0.010 4,000 0.0497 0.346 1.62 < 0.20 85.4 0.77 2.8
GL42-2-201109 2020 11 09 7.76 1,270 7.34 - 5,360 4,220 7.70 - 30.2 117 51.3 238 606 8.76 1,350 0.868 1.74 47.2 < 0.010 43.1 0.719 3.51 1.88 2.36 0.068 200 < 0.010 21.7 9.37 0.73 < 0.010 5,560 0.0787 0.429 2.24 < 0.20 100 1.56 4.2
GL41-3 GL41-3-200612 2020 06 12 7.40 755 7.26 - 2,133 1,580 6.68 - < 1.0 69.3 2.2 141 7.31 17.2 290 0.080 1.07 104 < 0.010 24.2 0.0240 2.09 0.0981 1.37 < 0.050 47.5 < 0.010 8.33 0.925 0.53 < 0.010 3,080 0.0242 < 0.050 < 0.20 < 0.20 27.7 1.82 < 1.0
GL41-3-201022 2020 10 22 7.86 696 7.31 - 2,621 1,400 6.93 - 2.1 70.9 4.7 126 5.82 17.1 273 0.075 1.14 91.5 < 0.010 27.7 0.0231 2.02 0.0589 2.26 < 0.050 41.3 < 0.010 8.25 0.910 0.35 < 0.010 2,840 0.0135 < 0.050 < 0.20 < 0.20 26.9 2.14 4.9
Associated CARO file(s): 8052631, 8052802, 8060237, 8060737, 8061100, 8081412, 8091680, 8092458, 8092618, 9052219, 9052399, 9052558, 9052754, 9052937, 9060273, 9091657, 9092001, 9092208, 9092404, 9120616.
Associated Exova file(s): 622178, 653600, 712940, 714233, 714243, 756693, 756810, 757047, 811364, 811710, 812030, 812741, 812985, 846260, 878316, 879073, 909346, 909448, 909654.
All terms defined within the body of SNC-Lavalin's report.
< Denotes concentration less than indicated detection limit or RPD less than indicated value.a Laboratory detection limit exceeds regulatory standard/guideline.
- Denotes analysis not conducted.b Standard to protect freshwater aquatic life.
n/a Denotes no applicable standard/guideline.c Guideline to protect irrigation water. Guideline for surface water, shown here for comparison purposes only.
QA/QC RPD Denotes quality assurance/quality control relative percent differenced Guideline to protect freshwater aquatic life, long-term average (i.e. "chronic"). Guideline for surface water, shown here for comparison purposes only.
* RPDs are not calculated where one or more concentrations are less than five times RDL.e Guideline to protect freshwater aquatic life, short-term maximum (i.e. "acute"). Guideline for surface water, shown here for comparison purposes only.
RDL Denotes reported detection limit.f There is no Zinc standard specified for H > 400; therefore, the standard for H=300-<400 is applied as a conservative comparison.g Individual standards exist for Cr +3 and Cr +6. Reported value represents more stringent standard.
BOLD Concentration greater than CSR Aquatic Life (AW) standardh Only applies for specific Schedule 2 Site Activities; verify for your site.
SHADED Concentration greater than CSR Irrigation Watering (IW) standardi Guideline is temperature, pH, DOC and hardness dependent. Calculate using BLM software!
RED Concentration greater than BCWQG Irrigation Water (IW) guidelinej Guideline is pH dependent
BLUE SHADED Concentration greater than BCWQG Aquatic Life Long-Term Average (AW) guidelinek Guideline is hardness dependent
BLUE SHADED Concentration greater than BCWQG Aquatic Life Short-term Maximum (AW) guideline l Conductivity guidelines varies with crop. Guideline range 700-5,000, most stringent guideline for low tolerance crops applied (strawberry, raspberry, bean and carrot.
SNC-LAVALIN INC. Page 15 of 15
662036 / 2021 02 0920210309_662036_TAB_Historical.xlsx
QAQC CN 2021 03 09

TABLE V.3: Historical Summary of Analytical Results for Groundwater - Drinking Water Comparison - Inorganics
Physical Parameters Dissolved Inorganics
Sample Sample Sample Date pH
To
tal
Hard
ne
ss
pH
(fi
eld
)
Fie
ld
Co
nd
ucti
vit
y
To
tal
Dis
so
lved
So
lid
s
Dis
so
lved
Org
an
ic
Carb
on
Ph
os
ph
ate
Am
mo
nia
,
To
tal
(as
N)
Nit
rate
(as
N)
Nit
rite
(as
N)
Ch
lori
de
Flu
ori
de
Su
lfa
te
To
tal
Alk
alin
ity
Alk
alin
ity,
Bic
arb
on
ate
(as
CaC
O3
)
Alk
alin
ity,
Carb
on
ate
(as
CaC
O3
)
Alk
alin
ity,
Hyd
rox
ide
(as
CaC
O3
)
Alk
alin
ity,
Ph
en
olp
hth
al
ein
(as
CaC
O3
)
Bro
mid
e
Ch
em
ical
Ox
yg
en
Dem
an
d
Dis
so
lved
Ph
os
ph
ate
Location ID (yyyy mm dd) pH mg/L pH µS/cm mg/L mg/L mg/L µg/L µg/L µg/L mg/L µg/L mg/L mg/L mg/L mg/L mg/L mg/L mg/L mg/L mg/LBC Guideline
Canadian Drinking Water Quality Guidelines (CDWQG)a7.0-10.5 n/a 7.0-10.5 n/a 500 n/a n/a n/a 10,000 1,000 250 1,500 500 n/a n/a n/a n/a n/a n/a n/a n/a
BCWQG Drinking Water (DW)b 6.5 - 8.5 n/a 6.5 - 8.5 n/a n/a n/a n/a n/a 10,000 1,000 250 1,500 500 n/a n/a n/a n/a n/a n/a n/a n/a
CSR Drinking Water (DW) n/a n/a n/a n/a n/a n/a n/a n/a 10,000 1,000 250 1,500 500 n/a n/a n/a n/a n/a n/a n/a n/a
09BH03 09BH03-20151105 2015 11 05 7.65 661 - - 2,040 - - < 5.0 1,330 - 20 1,580 990 736 736 < 1.0 < 1.0 - < 1.0 < 20 -
09BH03-20170601 2017 06 01 8.13 940 - - 2,270 - - 39.8 690 - 15 1,030 1,240 698 - - - - < 1.0 < 20 -
09BH03-180604 2018 06 04 7.53 1,130 6.87 3,665 2,800 7.39 0.0075 < 20 < 10 < 10 26.2 790 1,500 788 788 < 1.0 < 1.0 < 1.0 < 0.10 30 0.0075
09BH03-190530 2019 05 30 7.80 929 6.81 3,120 2,460 5.85 0.0090 274 1,880 < 10 27.9 1,510 1,090 780 780 < 1.0 < 1.0 < 1.0 < 0.10 26 0.0090
09BH03-200609 2020 06 09 7.80 1,270 7.04 3,178 3,020 7.88 - < 50 1,750 < 10 25.3 950 1,540 776 776 < 1.0 < 1.0 < 1.0 < 0.10 22 -
09BH06-D 09BH06-D-20131112 2013 11 12 - 372 - - 706 - - 94 < 50 - 9.1 940 243 397 - - - - - < 20 -
DUP4-20131112 Duplicate - 369 - - 715 - - 92 < 50 - 9 950 244 383 - - - - - < 20 -
QA/QC RPD% - 1 - - 1 - - 2 * - 1 1 0 4 - - - - - * -
09BH06-D-20140602 2014 06 02 - 366 - - 720 - - 96 < 50 - 9.5 1,000 254 376 - - - - < 0.50 < 20 -
09BH06-D-20141117 2014 11 17 - 372 - - 743 - - 99.5 < 50 - 8.3 1,010 272 407 - - - - < 0.50 42 -
09BH06-D-20150610 2015 06 10 8.21 385 - - 770 - - 102 < 25 - 7.9 940 285 398 - - - - < 0.25 < 20 -
09BH06-D-20151105 2015 11 05 7.93 369 - - 760 - - 100 < 25 - 7.7 940 295 365 365 < 1.0 < 1.0 - < 0.25 < 20 -
09BH06-D-20170606 2017 06 06 8.42 364 - - 699 - - 107 < 25 - 8.2 970 286 343 - - - - < 0.25 < 20 -
09BH06-D-180604 2018 06 04 7.76 387 6.99 1,289 800 2.98 0.0055 167 < 10 < 10 7.16 450 282 355 355 < 1.0 < 1.0 < 1.0 < 0.10 < 20 0.0055
09BH06-D-190528 2019 05 28 8.04 435 7.08 1,229 968 2.88 0.0073 199 < 10 < 10 9.45 800 392 377 377 < 1.0 < 1.0 < 1.0 < 0.10 < 20 0.0073
09BH06-D-200609 2020 06 09 7.95 422 7.3 1,038 849 2.26 - 96 < 10 < 10 8.22 790 327 373 373 < 1.0 < 1.0 < 1.0 < 0.10 < 20 -
GL1-2 GL 1-2-20091109 2009 11 09 - 909 - - - - - - - - - - - - - - - - - - -
GL1-2-20100810 2010 08 10 - 840 - - 1,140 - - < 10 - - 191 - 201 675 - - - - - 60 -
GL1-2-20160531 2016 05 31 7.66 - - - 1,190 - - < 20 29 - 232 1,420 209 660 - - - - - - -
GL1-2-180612 2018 06 12 7.84 790 - - 1,230 - 0.0102 71 < 10 < 10 216 1,270 238 640 640 < 1.0 < 1.0 < 1.0 < 0.10 - 0.0102
GL1-2-20180927 2018 09 27 - 759 - - - - - < 20 44 - 181 1,100 228 - - - - - < 0.10 - -
GL1-2-190917 2019 09 17 7.98 762 - - 1,240 4.46 - 32 < 10 < 10 166 1,330 256 662 662 < 1.0 < 1.0 < 1.0 < 0.10 - -
GL1-2-200910 2020 09 10 8.14 814 - - 1,300 4.98 - < 50 < 10 < 10 117 1,430 283 676 676 < 1.0 < 1.0 < 1.0 < 0.10 - -
GL23-1 GL 23-1-20091110 2009 11 10 - 1,140 - - - - - - - - - - - - - - - - - - -
GL 23-1-20120627 2012 06 27 - 1,100 - - 1,780 - - < 10 - - 32.9 - 497 1,160 - - - - - 40 -
GL23-1-20100811 2010 08 11 - 1,000 - - 1,640 - - 40 - - 30.9 - 352 1,220 - - - - - 50 -
GL23-1-20110704 2011 07 04 - 1,160 - - 1,720 - - 40 - - 31.9 - 467 1,170 - - - - - 160 -
GL23-1-20121203 2012 12 03 - 270 - - 1,790 - - 80 < 100 - 33.8 - 500 1,080 - - - - - 44 -
GL23-1-20130627 2013 06 27 - 1,170 - - 1,750 - - < 5.0 110 - 35 1,650 544 1,180 - - - - < 1.0 30 -
GL23-1-20140603 2014 06 03 - 1,080 - - 1,710 - - 11.6 160 - 41 1,170 522 1,130 - - - - < 1.0 38 -
GL23-1-20141124 2014 11 24 - 1,210 - - 1,790 - - 26.9 < 100 - 37 1,210 624 1,100 - - - - < 1.0 48 -
GL23-1-20150608 2015 06 08 7.67 1,130 - - 1,700 - - < 5.0 < 100 - 36 1,090 500 1,200 - - - - < 1.0 41 -
GL23-1-20151104 2015 11 04 7.68 1,050 - - 1,570 - - 17.2 < 100 - 33 940 390 1,130 - - - - < 1.0 37 -
GL23-1-20160526 2016 05 26 7.99 1,080 - - 1,570 - - < 5.0 < 100 - 34 1,030 382 1,090 - - - - < 1.0 38 -
GL23-1-20160531 2016 05 31 7.64 - - - 1,580 - - < 20 66 - 30.6 1,050 384 1,090 - - - - - - -
GL23-1-20170525 2017 05 25 8.45 1,150 - - 1,610 - - 10.4 < 100 - 35 890 386 1,070 - - - - < 1.0 42 -
DUP3-20170525 Duplicate 8.41 1,150 - - 1,580 - - < 5.0 < 100 - 35 900 387 1,020 - - - - < 1.0 37 -
QA/QC RPD% 0 0 - - 2 - - * * - 0 1 0 5 - - - - * * -
Associated CARO file(s): 8052631, 8052802, 8060737, 8061100, 8092458, 9052219, 9052558, 9052937, 9091657, 9092001.
Associated Exova file(s): 712940, 714233, 756693, 756810, 757047, 811364, 812741, 878316, 879073, 909448.
All terms defined within the body of SNC-Lavalin's report.
< Denotes concentration less than indicated detection limit or RPD less than indicated value.
- Denotes analysis not conducted.
n/a Denotes no applicable standard/guideline.
QA/QC RPD Denotes quality assurance/quality control relative percent difference
* RPDs are not calculated where one or more concentrations are less than five times RDL.
RDL Denotes reported detection limit.
BOLD Concentration greater than Canadian Drinking Water Quality Guidelines (CDWQG) Guideline
SHADED Concentration greater than BCWQG Drinking Water (DW) guideline
RED Concentration greater than CSR Drinking Water (DW) standard
a Pathways Included: Aesthethic Objectives, Maximum Acceptable Concentrations.b Pathways Included: Drinking Water - AO, Drinking Water - MAC,
SNC-LAVALIN INC. Page 1 of 3
662036 / 2021 02 09 20210309_662036_TAB_Historical.xlsx
QAQC CN 2021 03 09

TABLE V.3: Historical Summary of Analytical Results for Groundwater - Drinking Water Comparison - Inorganics
Physical Parameters Dissolved Inorganics
Sample Sample Sample Date pH
To
tal
Hard
ne
ss
pH
(fi
eld
)
Fie
ld
Co
nd
ucti
vit
y
To
tal
Dis
so
lved
So
lid
s
Dis
so
lved
Org
an
ic
Carb
on
Ph
os
ph
ate
Am
mo
nia
,
To
tal
(as
N)
Nit
rate
(as
N)
Nit
rite
(as
N)
Ch
lori
de
Flu
ori
de
Su
lfa
te
To
tal
Alk
alin
ity
Alk
alin
ity,
Bic
arb
on
ate
(as
CaC
O3
)
Alk
alin
ity,
Carb
on
ate
(as
CaC
O3
)
Alk
alin
ity,
Hyd
rox
ide
(as
CaC
O3
)
Alk
alin
ity,
Ph
en
olp
hth
al
ein
(as
CaC
O3
)
Bro
mid
e
Ch
em
ical
Ox
yg
en
Dem
an
d
Dis
so
lved
Ph
os
ph
ate
Location ID (yyyy mm dd) pH mg/L pH µS/cm mg/L mg/L mg/L µg/L µg/L µg/L mg/L µg/L mg/L mg/L mg/L mg/L mg/L mg/L mg/L mg/L mg/LBC Guideline
Canadian Drinking Water Quality Guidelines (CDWQG)a7.0-10.5 n/a 7.0-10.5 n/a 500 n/a n/a n/a 10,000 1,000 250 1,500 500 n/a n/a n/a n/a n/a n/a n/a n/a
BCWQG Drinking Water (DW)b 6.5 - 8.5 n/a 6.5 - 8.5 n/a n/a n/a n/a n/a 10,000 1,000 250 1,500 500 n/a n/a n/a n/a n/a n/a n/a n/a
CSR Drinking Water (DW) n/a n/a n/a n/a n/a n/a n/a n/a 10,000 1,000 250 1,500 500 n/a n/a n/a n/a n/a n/a n/a n/a
GL23-1 GL23-1-180529 2018 05 29 7.86 1,260 7.22 2,014 1,560 14.3 0.0062 36 < 10 66 34.2 710 341 1,090 1,090 < 1.0 < 1.0 < 1.0 0.27 39 0.0062
(Cont'd) GL23-1-190523 2019 05 23 8.01 1,170 7.7 2,332 1,590 14.8 < 0.0050 33 72 < 10 34.0 660 384 1,120 1,120 < 1.0 < 1.0 < 1.0 0.27 30 < 0.0050
GL23-1-190917 2019 09 17 7.78 1,130 - - 1,610 16.4 - 60 < 10 < 10 35.0 750 394 1,090 1,090 < 1.0 < 1.0 < 1.0 < 0.10 - -
GL23-1-200617 2020 06 17 7.97 1,000 6.95 2,150 1,530 14.6 - < 50 134 < 100 32.3 < 1,000 405 964 964 < 1.0 < 1.0 < 1.0 < 1.00 33 -
GL23-1-200910 2020 09 10 7.98 1,130 - - 1,660 14.8 - < 50 28 < 10 33.1 780 402 1,110 1,110 < 1.0 < 1.0 < 1.0 0.32 - -
GL28-1 GL28-1-20091116 2009 11 16 - 1,680 - - - - - - - - - - - - - - - - - - -
GL30-5-20091116 Duplicate - 1,720 - - - - - - - - - - - - - - - - - - -
QA/QC RPD% - 2 - - - - - - - - - - - - - - - - - - -
GL28-1-20100812 2010 08 12 - 1,600 - - 3,990 - - 210 - - 64 - 1,840 655 - - - - - 20 -
GL28-1-20110627 2011 06 27 - 944 - - 3,060 - - < 10 - - 27 - 1,700 346 - - - - - 10 -
GL28-1-20120626 2012 06 26 - 550 - - 1,610 - - 130 - - 11.3 - 954 139 - - - - - < 10 -
GL28-1-20121203 2012 12 03 - 1,680 - - 3,870 - - 220 < 100 - 38.7 - 2,240 649 - - - - - 18 -
DUP-A-20121203 Duplicate - 1,700 - - 3,830 - - 170 < 100 - 39.4 - 2,240 647 - - - - - 33 -
QA/QC RPD% - 1 - - 1 - - 26 * - 2 - 0 0 - - - - - * -
GL28-1-20130708 2013 07 08 - 1,740 - - 3,530 - - 175 < 100 - 28 680 1,510 368 - - - - < 1.0 < 20 -
DUP1-20130708 Duplicate - 1,740 - - 4,220 - - 178 < 100 - 34 890 1,890 619 - - - - < 1.0 < 20 -
QA/QC RPD% - 0 - - 18 - - 2 * - 19 27 22 51 - - - - * * -
GL28-1-20140603 2014 06 03 - 1,600 - - 3,930 - - 162 < 250 - 59 1,100 2,230 778 - - - - < 2.5 53 -
GL28-1-20141117 2014 11 17 - 1,690 - - 3,970 - - 165 130 - 53 1,070 2,270 897 - - - - < 1.0 < 20 -
GL28-1-20150611 2015 06 11 7.93 1,630 - - 3,920 - - 166 < 100 - 48 1,110 2,270 730 - - - - < 1.0 30 -
GL28-1-20151105 2015 11 05 7.65 1,600 - - 3,930 - - 170 < 100 - 50 1,150 2,280 626 626 < 1.0 < 1.0 - < 1.0 46 -
GL28-1-20160524 2016 05 24 7.97 1,710 - - 3,950 - - 179 < 100 - 67 1,510 2,950 624 624 < 1.0 < 1.0 - < 1.0 < 20 -
GL28-1-20160920 2016 09 20 7.69 1,740 - - 4,080 - - 173 < 100 - 54 1,220 2,380 612 - - - - < 1.0 < 20 -
GL28-1-20170711 2017 07 11 8.21 1,620 - - 3,740 - - 163 < 100 - 50 1,160 2,270 579 - - - - < 1.0 < 20 -
GL28-1-20170926 2017 09 26 7.67 1,620 - - 3,460 - - 145 < 100 - 48 1,110 2,190 554 - - - - < 1.0 < 20 -
GL28-1-180528 2018 05 28 7.72 1,710 6.99 3,741 3,730 4.85 < 0.0050 122 1,480 < 10 45.0 700 2,040 551 551 < 1.0 < 1.0 < 1.0 < 10.0 < 20 < 0.0050
GL28-1-180925 2018 09 25 7.72 1,750 7.21 3,761 3,770 4.88 < 0.0050 163 < 1,000 < 10 41.8 960 2,150 531 531 < 1.0 < 1.0 < 1.0 < 0.10 < 20 < 0.0050
DUP1-180925 Duplicate 7.73 1,730 7.21 3,761 3,930 4.81 < 0.0050 176 < 1,000 < 10 40.5 1,000 2,220 528 528 < 1.0 < 1.0 < 1.0 < 0.10 < 20 < 0.0050
QA/QC RPD% 0 1 * * 4 1 * 8 * * 3 4 3 1 1 * * * * * *
GL28-1-190528 2019 05 28 7.81 1,690 7.12 3,741 3,650 4.74 < 0.0500 236 < 100 < 100 38.3 1,100 2,060 531 531 < 1.0 < 1.0 < 1.0 < 1.00 < 20 < 0.0500
GL28-1-190919 2019 09 19 7.78 1,650 7.39 3,802 3,470 4.47 - 98 < 100 < 100 40.6 1,010 2,010 521 521 < 1.0 < 1.0 < 1.0 < 1.00 < 20 -
GL28-1-200610 2020 06 10 7.71 1,770 7.15 3,321 3,300 4.43 - 120 < 100 < 100 37.8 < 1,000 2,080 554 554 < 1.0 < 1.0 < 1.0 < 1.00 < 20 -
DUPB-200610 Duplicate 7.75 1,630 7.15 3,321 3,680 3.83 - 124 < 100 < 100 38.1 < 1,000 2,140 544 544 < 1.0 < 1.0 < 1.0 < 1.00 < 20 -
QA/QC RPD% 1 8 * * 11 15 - * * * 1 * 3 2 2 * * * * * -
GL28-1-201104 2020 11 04 7.82 1,850 7.14 4,082 3,840 6.24 - 128 < 1,000 < 10 46.9 1,020 2,240 516 516 < 1.0 < 1.0 < 1.0 < 10.0 < 20 -
DUP3-201104 Duplicate 7.80 1,850 - - 3,450 6.09 - 127 < 1,000 < 10 46.3 1,000 2,190 515 515 < 1.0 < 1.0 < 1.0 < 10.0 < 20 -
QA/QC RPD% 0 0 - - 11 2 - * * * 1 2 2 0 0 * * * * * -
Associated CARO file(s): 8052631, 8052802, 8060737, 8061100, 8092458, 9052219, 9052558, 9052937, 9091657, 9092001.
Associated Exova file(s): 712940, 714233, 756693, 756810, 757047, 811364, 812741, 878316, 879073, 909448.
All terms defined within the body of SNC-Lavalin's report.
< Denotes concentration less than indicated detection limit or RPD less than indicated value.
- Denotes analysis not conducted.
n/a Denotes no applicable standard/guideline.
QA/QC RPD Denotes quality assurance/quality control relative percent difference
* RPDs are not calculated where one or more concentrations are less than five times RDL.
RDL Denotes reported detection limit.
BOLD Concentration greater than Canadian Drinking Water Quality Guidelines (CDWQG) Guideline
SHADED Concentration greater than BCWQG Drinking Water (DW) guideline
RED Concentration greater than CSR Drinking Water (DW) standard
a Pathways Included: Aesthethic Objectives, Maximum Acceptable Concentrations.b Pathways Included: Drinking Water - AO, Drinking Water - MAC,
SNC-LAVALIN INC. Page 2 of 3
662036 / 2021 02 09 20210309_662036_TAB_Historical.xlsx
QAQC CN 2021 03 09

TABLE V.3: Historical Summary of Analytical Results for Groundwater - Drinking Water Comparison - Inorganics
Physical Parameters Dissolved Inorganics
Sample Sample Sample Date pH
To
tal
Hard
ne
ss
pH
(fi
eld
)
Fie
ld
Co
nd
ucti
vit
y
To
tal
Dis
so
lved
So
lid
s
Dis
so
lved
Org
an
ic
Carb
on
Ph
os
ph
ate
Am
mo
nia
,
To
tal
(as
N)
Nit
rate
(as
N)
Nit
rite
(as
N)
Ch
lori
de
Flu
ori
de
Su
lfa
te
To
tal
Alk
alin
ity
Alk
alin
ity,
Bic
arb
on
ate
(as
CaC
O3
)
Alk
alin
ity,
Carb
on
ate
(as
CaC
O3
)
Alk
alin
ity,
Hyd
rox
ide
(as
CaC
O3
)
Alk
alin
ity,
Ph
en
olp
hth
al
ein
(as
CaC
O3
)
Bro
mid
e
Ch
em
ical
Ox
yg
en
Dem
an
d
Dis
so
lved
Ph
os
ph
ate
Location ID (yyyy mm dd) pH mg/L pH µS/cm mg/L mg/L mg/L µg/L µg/L µg/L mg/L µg/L mg/L mg/L mg/L mg/L mg/L mg/L mg/L mg/L mg/LBC Guideline
Canadian Drinking Water Quality Guidelines (CDWQG)a7.0-10.5 n/a 7.0-10.5 n/a 500 n/a n/a n/a 10,000 1,000 250 1,500 500 n/a n/a n/a n/a n/a n/a n/a n/a
BCWQG Drinking Water (DW)b 6.5 - 8.5 n/a 6.5 - 8.5 n/a n/a n/a n/a n/a 10,000 1,000 250 1,500 500 n/a n/a n/a n/a n/a n/a n/a n/a
CSR Drinking Water (DW) n/a n/a n/a n/a n/a n/a n/a n/a 10,000 1,000 250 1,500 500 n/a n/a n/a n/a n/a n/a n/a n/a
GL28-2 GL28-2-20091116 2009 11 16 - 1,530 - - - - - - - - - - - - - - - - - - -
GL28-2-20160524 2016 05 24 7.72 1,840 - - 4,530 - - 5.1 11,200 - 46 < 1,000 2,870 696 696 < 1.0 < 1.0 - < 2.5 < 20 -
GL28-2-20160920 2016 09 20 7.5 1,810 - - 4,760 - - < 5.0 12,100 - 49 < 1,000 2,760 693 - - - - < 2.5 < 20 -
DUP1-20160920 Duplicate 7.51 3,610 - - 4,750 - - < 5.0 12,000 - 48 < 1,000 2,740 693 - - - - < 2.5 < 20 -
QA/QC RPD% 0 66 - - 0 - - * 1 - 2 * 1 0 - - - - * * -
GL28-2-20170711 2017 07 11 8.03 1,680 - - 4,400 - - < 5.0 13,100 - 47 < 400 2,590 671 - - - - < 1.0 < 20 -
GL28-2-20170926 2017 09 26 7.48 1,920 - - 4,640 - - < 5.0 12,100 - 50 < 400 2,840 670 - - - - < 1.0 < 20 -
GL28-2-180528 2018 05 28 7.42 1,900 6.77 4,680 4,730 6.09 < 0.0050 24 8,440 < 10 44.0 110 2,690 686 686 < 1.0 < 1.0 < 1.0 < 10.0 < 20 < 0.0050
DUP1-180528 Duplicate 7.51 1,860 6.77 4,680 4,960 6.55 < 0.0050 27 8,560 < 1,000 44.5 100 2,690 709 709 < 1.0 < 1.0 < 1.0 < 10.0 < 20 < 0.0050
QA/QC RPD% 1 2 * * 5 7 * * 1 * 1 * 0 3 3 * * * * * *
GL28-2-200610 2020 06 10 7.66 1,730 6.95 3,882 4,250 4.99 - < 50 9,190 < 100 32.0 < 1,000 2,490 587 587 < 1.0 < 1.0 < 1.0 < 1.00 < 20 -
GL28-2-201104 2020 11 04 7.70 2,200 6.9 5,499 4,790 6.26 - < 50 9,400 < 10 42.9 130 3,020 677 677 < 1.0 < 1.0 < 1.0 < 0.10 < 20 -
GL28-3 GL28-3-20091116 2009 11 16 - 1,760 - - - - - - - - - - - - - - - - - - -
GL28-3-20100812 2010 08 12 - 1,580 - - 4,230 - - < 10 - - 60 - 1,950 702 - - - - - 30 -
GL28-3-20160524 2016 05 24 7.52 2,740 - - 6,310 - - < 5.0 2,380 - 48 < 1,000 4,070 782 782 < 1.0 < 1.0 - < 2.5 < 20 -
GL28-3-20160920 2016 09 20 7.57 1,280 - - 6,550 - - < 5.0 < 250 - 49 < 1,000 4,140 858 - - - - < 2.5 20 -
GL28-3-20170711 2017 07 11 8.13 2,480 - - 6,160 - - 8.4 690 - 48 < 1,000 4,000 840 - - - - < 2.5 < 20 -
GL28-3-20170926 2017 09 26 7.6 2,520 - - 6,150 - - < 5.0 1,120 - 49 < 400 4,100 807 - - - - < 1.0 < 20 -
GL28-3-180528 2018 05 28 7.51 2,770 6.8 6,392 7,280 10.3 < 0.0050 29 5,640 < 10 45.9 230 3,780 870 870 < 1.0 < 1.0 < 1.0 < 10.0 23 < 0.0050
GL28-2-180925 2018 09 25 7.60 2,280 6.97 5,093 5,370 8.34 < 0.0050 63 9,480 < 10 44.2 140 3,160 700 700 < 1.0 < 1.0 < 1.0 < 0.10 24 < 0.0050
GL28-2-190528 2019 05 28 7.70 2,170 6.97 5,200 5,280 6.36 < 0.0500 24 11,600 < 100 48.6 < 1,000 2,830 723 723 < 1.0 < 1.0 < 1.0 < 1.00 < 20 < 0.0500
GL28-2-190919 2019 09 19 7.64 2,030 7.24 5,225 5,380 5.96 - 48 10,600 < 100 51.7 < 1,000 2,790 700 700 < 1.0 < 1.0 < 1.0 < 1.00 < 20 -
GL28-3-180925 2018 09 25 7.60 3,080 7 6,777 7,490 12.1 < 0.0050 76 7,780 47 49.6 280 4,350 827 827 < 1.0 < 1.0 < 1.0 < 0.10 35 < 0.0050
GL28-3-190528 2019 05 28 7.78 2,880 7 6,743 6,780 8.29 < 0.0500 40 5,880 < 100 49.4 < 1,000 4,040 846 846 < 1.0 < 1.0 < 1.0 < 1.00 < 20 < 0.0500
DUP2-190528 Duplicate 7.63 2,830 7 6,743 7,120 7.97 < 0.0500 44 6,130 < 100 62.1 < 1,000 4,170 855 855 < 1.0 < 1.0 < 1.0 < 1.00 < 20 < 0.0500
QA/QC RPD% 2 2 * * 5 4 * 10 4 * 23 * 3 1 1 * * * * * *
GL28-3-190919 2019 09 19 7.65 2,790 7.19 6,895 7,490 8.62 - 26 4,180 < 100 51.7 < 1,000 4,100 865 865 < 1.0 < 1.0 < 1.0 < 1.00 < 20 -
DUP1-190919 Duplicate 7.78 2,830 7.19 6,895 7,330 8.84 - 37 4,000 < 100 48.8 < 1,000 3,900 844 844 < 1.0 < 1.0 < 1.0 < 1.00 < 20 -
QA/QC RPD% 2 1 * * 2 3 - 35 4 * 6 * 5 2 2 * * * * * -
GL28-3-200610 2020 06 10 7.67 2,890 6.92 630.3 7,680 9.25 - < 50 5,160 < 100 56.6 < 1,000 4,550 864 864 < 1.0 < 1.0 < 1.0 < 1.00 26 -
GL28-3-201105 2020 11 05 7.75 2,870 6.96 277.6 7,810 9.33 - < 50 5,150 18 49.4 280 4,500 839 839 < 1.0 < 1.0 < 1.0 < 10.0 < 20 -
Associated CARO file(s): 8052631, 8052802, 8060737, 8061100, 8092458, 9052219, 9052558, 9052937, 9091657, 9092001.
Associated Exova file(s): 712940, 714233, 756693, 756810, 757047, 811364, 812741, 878316, 879073, 909448.
All terms defined within the body of SNC-Lavalin's report.
< Denotes concentration less than indicated detection limit or RPD less than indicated value.
- Denotes analysis not conducted.
n/a Denotes no applicable standard/guideline.
QA/QC RPD Denotes quality assurance/quality control relative percent difference
* RPDs are not calculated where one or more concentrations are less than five times RDL.
RDL Denotes reported detection limit.
BOLD Concentration greater than Canadian Drinking Water Quality Guidelines (CDWQG) Guideline
SHADED Concentration greater than BCWQG Drinking Water (DW) guideline
RED Concentration greater than CSR Drinking Water (DW) standard
a Pathways Included: Aesthethic Objectives, Maximum Acceptable Concentrations.b Pathways Included: Drinking Water - AO, Drinking Water - MAC,
SNC-LAVALIN INC. Page 3 of 3
662036 / 2021 02 09 20210309_662036_TAB_Historical.xlsx
QAQC CN 2021 03 09
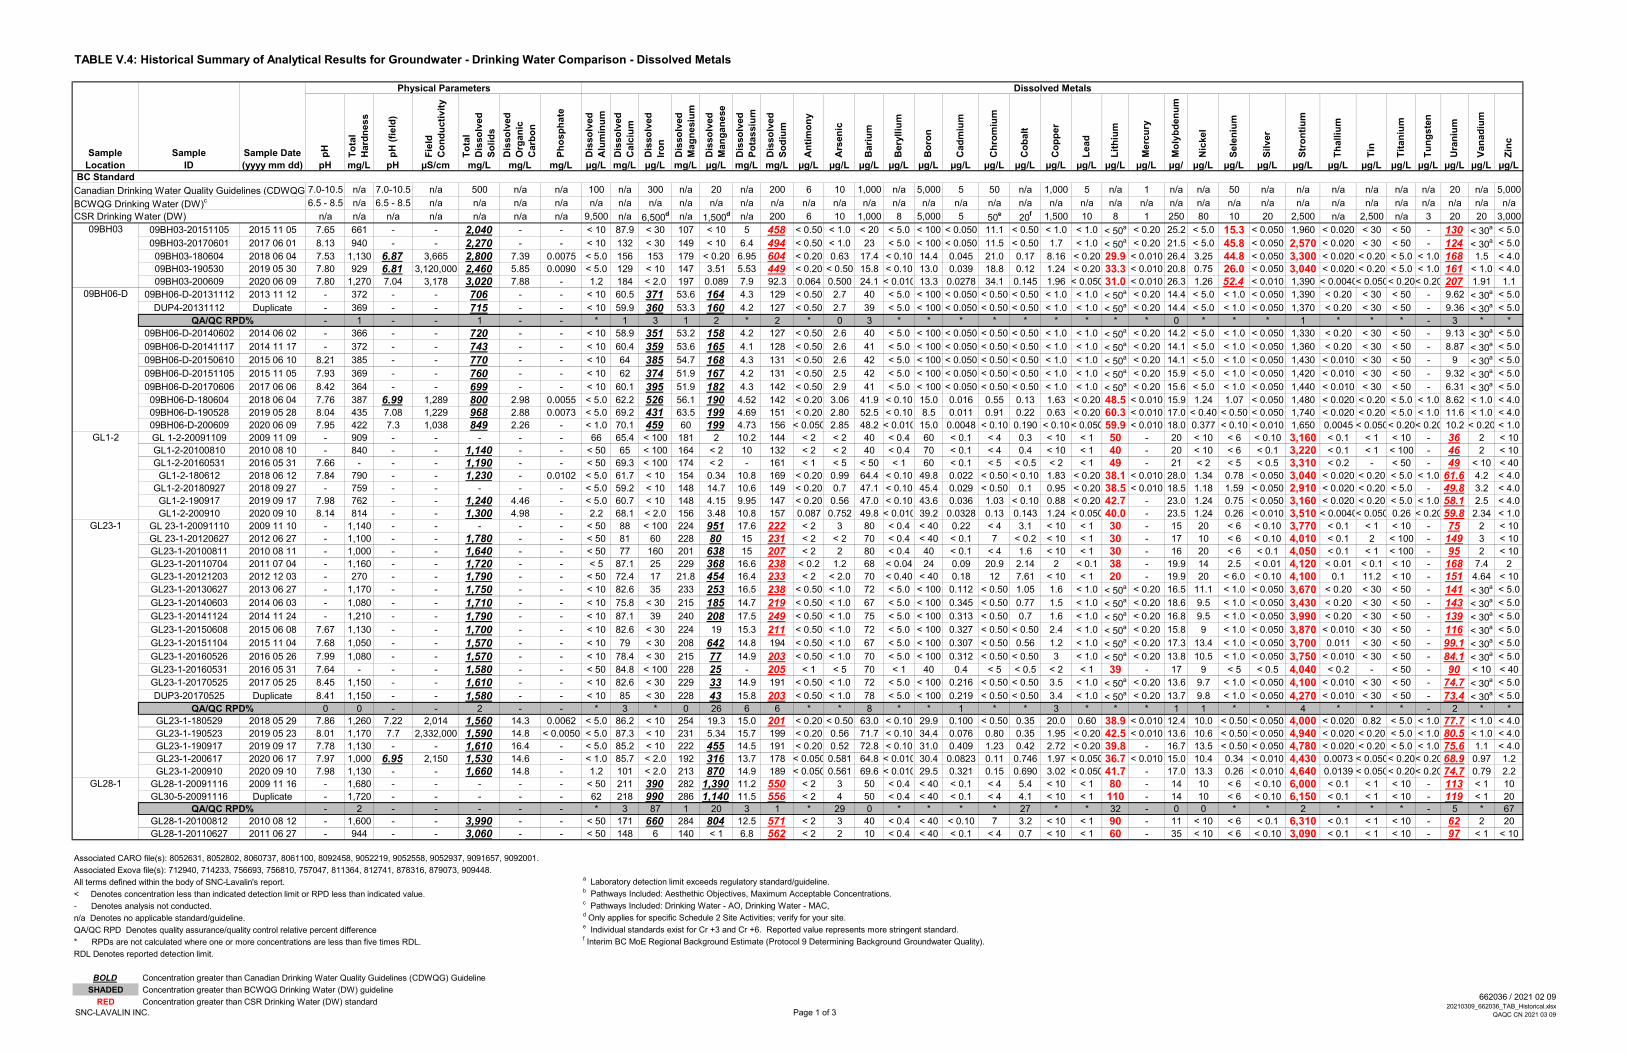
TABLE V.4: Historical Summary of Analytical Results for Groundwater - Drinking Water Comparison - Dissolved Metals
Physical Parameters Dissolved Metals
Sample Sample Sample Date pH
To
tal
Hard
ness
pH
(fi
eld
)
Fi e
ld
Co
nd
ucti
vit
y
To
tal
Dis
so
lved
So
lid
s
Dis
so
lved
Org
an
ic
Carb
on
Ph
osp
hate
Dis
so
lved
Alu
min
um
Dis
so
lved
Calc
ium
Dis
so
lved
Iro
n
Dis
so
lved
Mag
nesiu
m
Dis
so
lved
Man
gan
ese
Dis
so
lved
Po
tassiu
m
Dis
so
lved
So
diu
m
An
tim
on
y
Ars
en
ic
Bari
um
Bery
lliu
m
Bo
ron
Cad
miu
m
Ch
rom
ium
Co
balt
Co
pp
er
Lead
Lit
hiu
m
Merc
ury
Mo
lyb
den
um
Nic
kel
Sele
niu
m
Sil
ver
Str
on
tiu
m
Th
alliu
m
Tin
Tit
an
ium
Tu
ng
ste
n
Ura
niu
m
Van
ad
ium
Zin
c
Location ID (yyyy mm dd) pH mg/L pH µS/cm mg/L mg/L mg/L µg/L mg/L µg/L mg/L µg/L mg/L mg/L µg/L µg/L µg/L µg/L µg/L µg/L µg/L µg/L µg/L µg/L µg/L µg/L µg/ µg/L µg/L µg/L µg/L µg/L µg/L µg/L µg/L µg/L µg/L µg/LBC Standard
Canadian Drinking Water Quality Guidelines (CDWQG)7.0-10.5 n/a 7.0-10.5 n/a 500 n/a n/a 100 n/a 300 n/a 20 n/a 200 6 10 1,000 n/a 5,000 5 50 n/a 1,000 5 n/a 1 n/a n/a 50 n/a n/a n/a n/a n/a n/a 20 n/a 5,000
BCWQG Drinking Water (DW)c 6.5 - 8.5 n/a 6.5 - 8.5 n/a n/a n/a n/a n/a n/a n/a n/a n/a n/a n/a n/a n/a n/a n/a n/a n/a n/a n/a n/a n/a n/a n/a n/a n/a n/a n/a n/a n/a n/a n/a n/a n/a n/a n/a
CSR Drinking Water (DW) n/a n/a n/a n/a n/a n/a n/a 9,500 n/a 6,500d n/a 1,500d n/a 200 6 10 1,000 8 5,000 5 50e 20f 1,500 10 8 1 250 80 10 20 2,500 n/a 2,500 n/a 3 20 20 3,000
09BH03 09BH03-20151105 2015 11 05 7.65 661 - - 2,040 - - < 10 87.9 < 30 107 < 10 5 458 < 0.50 < 1.0 < 20 < 5.0 < 100 < 0.050 11.1 < 0.50 < 1.0 < 1.0 < 50a < 0.20 25.2 < 5.0 15.3 < 0.050 1,960 < 0.020 < 30 < 50 - 130 < 30a < 5.0
09BH03-20170601 2017 06 01 8.13 940 - - 2,270 - - < 10 132 < 30 149 < 10 6.4 494 < 0.50 < 1.0 23 < 5.0 < 100 < 0.050 11.5 < 0.50 1.7 < 1.0 < 50a < 0.20 21.5 < 5.0 45.8 < 0.050 2,570 < 0.020 < 30 < 50 - 124 < 30a < 5.0
09BH03-180604 2018 06 04 7.53 1,130 6.87 3,665 2,800 7.39 0.0075 < 5.0 156 153 179 < 0.20 6.95 604 < 0.20 0.63 17.4 < 0.10 14.4 0.045 21.0 0.17 8.16 < 0.20 29.9 < 0.010 26.4 3.25 44.8 < 0.050 3,300 < 0.020 < 0.20 < 5.0 < 1.0 168 1.5 < 4.0
09BH03-190530 2019 05 30 7.80 929 6.81 3,120,000 2,460 5.85 0.0090 < 5.0 129 < 10 147 3.51 5.53 449 < 0.20 < 0.50 15.8 < 0.10 13.0 0.039 18.8 0.12 1.24 < 0.20 33.3 < 0.010 20.8 0.75 26.0 < 0.050 3,040 < 0.020 < 0.20 < 5.0 < 1.0 161 < 1.0 < 4.0
09BH03-200609 2020 06 09 7.80 1,270 7.04 3,178 3,020 7.88 - 1.2 184 < 2.0 197 0.089 7.9 92.3 0.064 0.500 24.1 < 0.010 13.3 0.0278 34.1 0.145 1.96 < 0.050 31.0 < 0.010 26.3 1.26 52.4 < 0.010 1,390 < 0.0040< 0.050< 0.20< 0.20 207 1.91 1.1
09BH06-D 09BH06-D-20131112 2013 11 12 - 372 - - 706 - - < 10 60.5 371 53.6 164 4.3 129 < 0.50 2.7 40 < 5.0 < 100 < 0.050 < 0.50 < 0.50 < 1.0 < 1.0 < 50a < 0.20 14.4 < 5.0 < 1.0 < 0.050 1,390 < 0.20 < 30 < 50 - 9.62 < 30a < 5.0
DUP4-20131112 Duplicate - 369 - - 715 - - < 10 59.9 360 53.3 160 4.2 127 < 0.50 2.7 39 < 5.0 < 100 < 0.050 < 0.50 < 0.50 < 1.0 < 1.0 < 50a < 0.20 14.4 < 5.0 < 1.0 < 0.050 1,370 < 0.20 < 30 < 50 - 9.36 < 30a < 5.0
QA/QC RPD% - 1 - - 1 - - * 1 3 1 2 * 2 * 0 3 * * * * * * * * * 0 * * * 1 * * * - 3 * *
09BH06-D-20140602 2014 06 02 - 366 - - 720 - - < 10 58.9 351 53.2 158 4.2 127 < 0.50 2.6 40 < 5.0 < 100 < 0.050 < 0.50 < 0.50 < 1.0 < 1.0 < 50a < 0.20 14.2 < 5.0 < 1.0 < 0.050 1,330 < 0.20 < 30 < 50 - 9.13 < 30a < 5.0
09BH06-D-20141117 2014 11 17 - 372 - - 743 - - < 10 60.4 359 53.6 165 4.1 128 < 0.50 2.6 41 < 5.0 < 100 < 0.050 < 0.50 < 0.50 < 1.0 < 1.0 < 50a < 0.20 14.1 < 5.0 < 1.0 < 0.050 1,360 < 0.20 < 30 < 50 - 8.87 < 30a < 5.0
09BH06-D-20150610 2015 06 10 8.21 385 - - 770 - - < 10 64 385 54.7 168 4.3 131 < 0.50 2.6 42 < 5.0 < 100 < 0.050 < 0.50 < 0.50 < 1.0 < 1.0 < 50a < 0.20 14.1 < 5.0 < 1.0 < 0.050 1,430 < 0.010 < 30 < 50 - 9 < 30a < 5.0
09BH06-D-20151105 2015 11 05 7.93 369 - - 760 - - < 10 62 374 51.9 167 4.2 131 < 0.50 2.5 42 < 5.0 < 100 < 0.050 < 0.50 < 0.50 < 1.0 < 1.0 < 50a < 0.20 15.9 < 5.0 < 1.0 < 0.050 1,420 < 0.010 < 30 < 50 - 9.32 < 30a < 5.0
09BH06-D-20170606 2017 06 06 8.42 364 - - 699 - - < 10 60.1 395 51.9 182 4.3 142 < 0.50 2.9 41 < 5.0 < 100 < 0.050 < 0.50 < 0.50 < 1.0 < 1.0 < 50a < 0.20 15.6 < 5.0 < 1.0 < 0.050 1,440 < 0.010 < 30 < 50 - 6.31 < 30a < 5.0
09BH06-D-180604 2018 06 04 7.76 387 6.99 1,289 800 2.98 0.0055 < 5.0 62.2 526 56.1 190 4.52 142 < 0.20 3.06 41.9 < 0.10 15.0 0.016 0.55 0.13 1.63 < 0.20 48.5 < 0.010 15.9 1.24 1.07 < 0.050 1,480 < 0.020 < 0.20 < 5.0 < 1.0 8.62 < 1.0 < 4.0
09BH06-D-190528 2019 05 28 8.04 435 7.08 1,229 968 2.88 0.0073 < 5.0 69.2 431 63.5 199 4.69 151 < 0.20 2.80 52.5 < 0.10 8.5 0.011 0.91 0.22 0.63 < 0.20 60.3 < 0.010 17.0 < 0.40 < 0.50 < 0.050 1,740 < 0.020 < 0.20 < 5.0 < 1.0 11.6 < 1.0 < 4.0
09BH06-D-200609 2020 06 09 7.95 422 7.3 1,038 849 2.26 - < 1.0 70.1 459 60 199 4.73 156 < 0.050 2.85 48.2 < 0.010 15.0 0.0048 < 0.10 0.190 < 0.10 < 0.050 59.9 < 0.010 18.0 0.377 < 0.10 < 0.010 1,650 0.0045 < 0.050< 0.20< 0.20 10.2 < 0.20 < 1.0
GL1-2 GL 1-2-20091109 2009 11 09 - 909 - - - - - 66 65.4 < 100 181 2 10.2 144 < 2 < 2 40 < 0.4 60 < 0.1 < 4 0.3 < 10 < 1 50 - 20 < 10 < 6 < 0.10 3,160 < 0.1 < 1 < 10 - 36 2 < 10
GL1-2-20100810 2010 08 10 - 840 - - 1,140 - - < 50 65 < 100 164 < 2 10 132 < 2 < 2 40 < 0.4 70 < 0.1 < 4 0.4 < 10 < 1 40 - 20 < 10 < 6 < 0.1 3,220 < 0.1 < 1 < 100 - 46 2 < 10
GL1-2-20160531 2016 05 31 7.66 - - - 1,190 - - < 50 69.3 < 100 174 < 2 - 161 < 1 < 5 < 50 < 1 60 < 0.1 < 5 < 0.5 < 2 < 1 49 - 21 < 2 < 5 < 0.5 3,310 < 0.2 - < 50 - 49 < 10 < 40
GL1-2-180612 2018 06 12 7.84 790 - - 1,230 - 0.0102 < 5.0 61.7 < 10 154 0.34 10.8 169 < 0.20 0.99 64.4 < 0.10 49.8 0.022 < 0.50 < 0.10 1.83 < 0.20 38.1 < 0.010 28.0 1.34 0.78 < 0.050 3,040 < 0.020 < 0.20 < 5.0 < 1.0 61.6 4.2 < 4.0
GL1-2-20180927 2018 09 27 - 759 - - - - - < 5.0 59.2 < 10 148 14.7 10.6 149 < 0.20 0.7 47.1 < 0.10 45.4 0.029 < 0.50 0.1 0.95 < 0.20 38.5 < 0.010 18.5 1.18 1.59 < 0.050 2,910 < 0.020 < 0.20 < 5.0 - 49.8 3.2 < 4.0
GL1-2-190917 2019 09 17 7.98 762 - - 1,240 4.46 - < 5.0 60.7 < 10 148 4.15 9.95 147 < 0.20 0.56 47.0 < 0.10 43.6 0.036 1.03 < 0.10 0.88 < 0.20 42.7 - 23.0 1.24 0.75 < 0.050 3,160 < 0.020 < 0.20 < 5.0 < 1.0 58.1 2.5 < 4.0
GL1-2-200910 2020 09 10 8.14 814 - - 1,300 4.98 - 2.2 68.1 < 2.0 156 3.48 10.8 157 0.087 0.752 49.8 < 0.010 39.2 0.0328 0.13 0.143 1.24 < 0.050 40.0 - 23.5 1.24 0.26 < 0.010 3,510 < 0.0040< 0.050 0.26 < 0.2059.8 2.34 < 1.0
GL23-1 GL 23-1-20091110 2009 11 10 - 1,140 - - - - - < 50 88 < 100 224 951 17.6 222 < 2 3 80 < 0.4 < 40 0.22 < 4 3.1 < 10 < 1 30 - 15 20 < 6 < 0.10 3,770 < 0.1 < 1 < 10 - 75 2 < 10
GL 23-1-20120627 2012 06 27 - 1,100 - - 1,780 - - < 50 81 60 228 80 15 231 < 2 < 2 70 < 0.4 < 40 < 0.1 7 < 0.2 < 10 < 1 30 - 17 10 < 6 < 0.10 4,010 < 0.1 2 < 100 - 149 3 < 10
GL23-1-20100811 2010 08 11 - 1,000 - - 1,640 - - < 50 77 160 201 638 15 207 < 2 2 80 < 0.4 40 < 0.1 < 4 1.6 < 10 < 1 30 - 16 20 < 6 < 0.1 4,050 < 0.1 < 1 < 100 - 95 2 < 10
GL23-1-20110704 2011 07 04 - 1,160 - - 1,720 - - < 5 87.1 25 229 368 16.6 238 < 0.2 1.2 68 < 0.04 24 0.09 20.9 2.14 2 < 0.1 38 - 19.9 14 2.5 < 0.01 4,120 < 0.01 < 0.1 < 10 - 168 7.4 2
GL23-1-20121203 2012 12 03 - 270 - - 1,790 - - < 50 72.4 17 21.8 454 16.4 233 < 2 < 2.0 70 < 0.40 < 40 0.18 12 7.61 < 10 < 1 20 - 19.9 20 < 6.0 < 0.10 4,100 0.1 11.2 < 10 - 151 4.64 < 10
GL23-1-20130627 2013 06 27 - 1,170 - - 1,750 - - < 10 82.6 35 233 253 16.5 238 < 0.50 < 1.0 72 < 5.0 < 100 0.112 < 0.50 1.05 1.6 < 1.0 < 50a < 0.20 16.5 11.1 < 1.0 < 0.050 3,670 < 0.20 < 30 < 50 - 141 < 30a < 5.0
GL23-1-20140603 2014 06 03 - 1,080 - - 1,710 - - < 10 75.8 < 30 215 185 14.7 219 < 0.50 < 1.0 67 < 5.0 < 100 0.345 < 0.50 0.77 1.5 < 1.0 < 50a < 0.20 18.6 9.5 < 1.0 < 0.050 3,430 < 0.20 < 30 < 50 - 143 < 30a < 5.0
GL23-1-20141124 2014 11 24 - 1,210 - - 1,790 - - < 10 87.1 39 240 208 17.5 249 < 0.50 < 1.0 75 < 5.0 < 100 0.313 < 0.50 0.7 1.6 < 1.0 < 50a < 0.20 16.8 9.5 < 1.0 < 0.050 3,990 < 0.20 < 30 < 50 - 139 < 30a < 5.0
GL23-1-20150608 2015 06 08 7.67 1,130 - - 1,700 - - < 10 82.6 < 30 224 19 15.3 211 < 0.50 < 1.0 72 < 5.0 < 100 0.327 < 0.50 < 0.50 2.4 < 1.0 < 50a < 0.20 15.8 9 < 1.0 < 0.050 3,870 < 0.010 < 30 < 50 - 116 < 30a < 5.0
GL23-1-20151104 2015 11 04 7.68 1,050 - - 1,570 - - < 10 79 < 30 208 642 14.8 194 < 0.50 < 1.0 67 < 5.0 < 100 0.307 < 0.50 0.56 1.2 < 1.0 < 50a < 0.20 17.3 13.4 < 1.0 < 0.050 3,700 0.011 < 30 < 50 - 99.1 < 30a < 5.0
GL23-1-20160526 2016 05 26 7.99 1,080 - - 1,570 - - < 10 78.4 < 30 215 77 14.9 203 < 0.50 < 1.0 70 < 5.0 < 100 0.312 < 0.50 < 0.50 3 < 1.0 < 50a < 0.20 13.8 10.5 < 1.0 < 0.050 3,750 < 0.010 < 30 < 50 - 84.1 < 30a < 5.0
GL23-1-20160531 2016 05 31 7.64 - - - 1,580 - - < 50 84.8 < 100 228 25 - 205 < 1 < 5 70 < 1 40 0.4 < 5 < 0.5 < 2 < 1 39 - 17 9 < 5 < 0.5 4,040 < 0.2 - < 50 - 90 < 10 < 40
GL23-1-20170525 2017 05 25 8.45 1,150 - - 1,610 - - < 10 82.6 < 30 229 33 14.9 191 < 0.50 < 1.0 72 < 5.0 < 100 0.216 < 0.50 < 0.50 3.5 < 1.0 < 50a < 0.20 13.6 9.7 < 1.0 < 0.050 4,100 < 0.010 < 30 < 50 - 74.7 < 30a < 5.0
DUP3-20170525 Duplicate 8.41 1,150 - - 1,580 - - < 10 85 < 30 228 43 15.8 203 < 0.50 < 1.0 78 < 5.0 < 100 0.219 < 0.50 < 0.50 3.4 < 1.0 < 50a < 0.20 13.7 9.8 < 1.0 < 0.050 4,270 < 0.010 < 30 < 50 - 73.4 < 30
a < 5.0
QA/QC RPD% 0 0 - - 2 - - * 3 * 0 26 6 6 * * 8 * * 1 * * 3 * * * 1 1 * * 4 * * * - 2 * *
GL23-1-180529 2018 05 29 7.86 1,260 7.22 2,014 1,560 14.3 0.0062 < 5.0 86.2 < 10 254 19.3 15.0 201 < 0.20 < 0.50 63.0 < 0.10 29.9 0.100 < 0.50 0.35 20.0 0.60 38.9 < 0.010 12.4 10.0 < 0.50 < 0.050 4,000 < 0.020 0.82 < 5.0 < 1.0 77.7 < 1.0 < 4.0
GL23-1-190523 2019 05 23 8.01 1,170 7.7 2,332,000 1,590 14.8 < 0.0050 < 5.0 87.3 < 10 231 5.34 15.7 199 < 0.20 0.56 71.7 < 0.10 34.4 0.076 0.80 0.35 1.95 < 0.20 42.5 < 0.010 13.6 10.6 < 0.50 < 0.050 4,940 < 0.020 < 0.20 < 5.0 < 1.0 80.5 < 1.0 < 4.0
GL23-1-190917 2019 09 17 7.78 1,130 - - 1,610 16.4 - < 5.0 85.2 < 10 222 455 14.5 191 < 0.20 0.52 72.8 < 0.10 31.0 0.409 1.23 0.42 2.72 < 0.20 39.8 - 16.7 13.5 < 0.50 < 0.050 4,780 < 0.020 < 0.20 < 5.0 < 1.0 75.6 1.1 < 4.0
GL23-1-200617 2020 06 17 7.97 1,000 6.95 2,150 1,530 14.6 - < 1.0 85.7 < 2.0 192 316 13.7 178 < 0.050 0.581 64.8 < 0.010 30.4 0.0823 0.11 0.746 1.97 < 0.050 36.7 < 0.010 15.0 10.4 0.34 < 0.010 4,430 0.0073 < 0.050< 0.20< 0.2068.9 0.97 1.2
GL23-1-200910 2020 09 10 7.98 1,130 - - 1,660 14.8 - 1.2 101 < 2.0 213 870 14.9 189 < 0.050 0.561 69.6 < 0.010 29.5 0.321 0.15 0.690 3.02 < 0.050 41.7 - 17.0 13.3 0.26 < 0.010 4,640 0.0139 < 0.050< 0.20< 0.2074.7 0.79 2.2
GL28-1 GL28-1-20091116 2009 11 16 - 1,680 - - - - - < 50 211 390 282 1,390 11.2 550 < 2 3 50 < 0.4 < 40 < 0.1 < 4 5.4 < 10 < 1 80 - 14 10 < 6 < 0.10 6,000 < 0.1 < 1 < 10 - 113 < 1 10
GL30-5-20091116 Duplicate - 1,720 - - - - - 62 218 990 286 1,140 11.5 556 < 2 4 50 < 0.4 < 40 < 0.1 < 4 4.1 < 10 < 1 110 - 14 10 < 6 < 0.10 6,150 < 0.1 < 1 < 10 - 119 < 1 20
QA/QC RPD% - 2 - - - - - * 3 87 1 20 3 1 * 29 0 * * * * 27 * * 32 - 0 0 * * 2 * * * - 5 * 67
GL28-1-20100812 2010 08 12 - 1,600 - - 3,990 - - < 50 171 660 284 804 12.5 571 < 2 3 40 < 0.4 < 40 < 0.10 7 3.2 < 10 < 1 90 - 11 < 10 < 6 < 0.1 6,310 < 0.1 < 1 < 10 - 62 2 20
GL28-1-20110627 2011 06 27 - 944 - - 3,060 - - < 50 148 6 140 < 1 6.8 562 < 2 2 10 < 0.4 < 40 < 0.1 < 4 0.7 < 10 < 1 60 - 35 < 10 < 6 < 0.10 3,090 < 0.1 < 1 < 10 - 97 < 1 < 10
Associated CARO file(s): 8052631, 8052802, 8060737, 8061100, 8092458, 9052219, 9052558, 9052937, 9091657, 9092001.
Associated Exova file(s): 712940, 714233, 756693, 756810, 757047, 811364, 812741, 878316, 879073, 909448.
All terms defined within the body of SNC-Lavalin's report.a Laboratory detection limit exceeds regulatory standard/guideline.
< Denotes concentration less than indicated detection limit or RPD less than indicated value.b Pathways Included: Aesthethic Objectives, Maximum Acceptable Concentrations.
- Denotes analysis not conducted.c Pathways Included: Drinking Water - AO, Drinking Water - MAC,
n/a Denotes no applicable standard/guideline.d Only applies for specific Schedule 2 Site Activities; verify for your site.
QA/QC RPD Denotes quality assurance/quality control relative percent differencee Individual standards exist for Cr +3 and Cr +6. Reported value represents more stringent standard.
* RPDs are not calculated where one or more concentrations are less than five times RDL.f Interim BC MoE Regional Background Estimate (Protocol 9 Determining Background Groundwater Quality).
RDL Denotes reported detection limit.
BOLD Concentration greater than Canadian Drinking Water Quality Guidelines (CDWQG) Guideline
SHADED Concentration greater than BCWQG Drinking Water (DW) guideline
RED Concentration greater than CSR Drinking Water (DW) standard
SNC-LAVALIN INC. Page 1 of 3
662036 / 2021 02 0920210309_662036_TAB_Historical.xlsx
QAQC CN 2021 03 09

TABLE V.4: Historical Summary of Analytical Results for Groundwater - Drinking Water Comparison - Dissolved Metals
Physical Parameters Dissolved Metals
Sample Sample Sample Date pH
To
tal
Hard
ness
pH
(fi
eld
)
Fi e
ld
Co
nd
ucti
vit
y
To
tal
Dis
so
lved
So
lid
s
Dis
so
lved
Org
an
ic
Carb
on
Ph
osp
hate
Dis
so
lved
Alu
min
um
Dis
so
lved
Calc
ium
Dis
so
lved
Iro
n
Dis
so
lved
Mag
nesiu
m
Dis
so
lved
Man
gan
ese
Dis
so
lved
Po
tassiu
m
Dis
so
lved
So
diu
m
An
tim
on
y
Ars
en
ic
Bari
um
Bery
lliu
m
Bo
ron
Cad
miu
m
Ch
rom
ium
Co
balt
Co
pp
er
Lead
Lit
hiu
m
Merc
ury
Mo
lyb
den
um
Nic
kel
Sele
niu
m
Sil
ver
Str
on
tiu
m
Th
alliu
m
Tin
Tit
an
ium
Tu
ng
ste
n
Ura
niu
m
Van
ad
ium
Zin
c
Location ID (yyyy mm dd) pH mg/L pH µS/cm mg/L mg/L mg/L µg/L mg/L µg/L mg/L µg/L mg/L mg/L µg/L µg/L µg/L µg/L µg/L µg/L µg/L µg/L µg/L µg/L µg/L µg/L µg/ µg/L µg/L µg/L µg/L µg/L µg/L µg/L µg/L µg/L µg/L µg/LBC Standard
Canadian Drinking Water Quality Guidelines (CDWQG)7.0-10.5 n/a 7.0-10.5 n/a 500 n/a n/a 100 n/a 300 n/a 20 n/a 200 6 10 1,000 n/a 5,000 5 50 n/a 1,000 5 n/a 1 n/a n/a 50 n/a n/a n/a n/a n/a n/a 20 n/a 5,000
BCWQG Drinking Water (DW)c 6.5 - 8.5 n/a 6.5 - 8.5 n/a n/a n/a n/a n/a n/a n/a n/a n/a n/a n/a n/a n/a n/a n/a n/a n/a n/a n/a n/a n/a n/a n/a n/a n/a n/a n/a n/a n/a n/a n/a n/a n/a n/a n/a
CSR Drinking Water (DW) n/a n/a n/a n/a n/a n/a n/a 9,500 n/a 6,500d n/a 1,500d n/a 200 6 10 1,000 8 5,000 5 50e 20f 1,500 10 8 1 250 80 10 20 2,500 n/a 2,500 n/a 3 20 20 3,000
GL28-1 GL28-1-20120626 2012 06 26 - 550 - - 1,610 - - < 50 130 180 56 140 6 284 < 2 < 2 < 10 < 0.4 < 40 < 0.1 < 4 0.4 < 10 < 1 10 - 33 < 10 < 6 < 0.10 1,710 < 0.1 < 1 < 100 - 15 < 1 < 10
(Cont'd) GL28-1-20121203 2012 12 03 - 1,680 - - 3,870 - - < 50 181 1,110 299 258 8.6 560 < 2.0 3 20 < 0.40 < 40 0.14 6.1 7.37 < 10 1.1 70 - 14.8 < 10 < 6.0 0.2 6,850 0.24 < 1.0 < 10 - 120 3.82 < 10
DUP-A-20121203 Duplicate - 1,700 - - 3,830 - - < 50 183 1,150 304 262 8.4 564 < 2.0 2.5 20 < 0.40 < 40 < 0.10 6.6 4.8 < 10 < 1.0 70 - 12.2 < 10 < 6.0 < 0.10 6,880 < 0.10 < 1.0 < 10 - 122 1.79 < 10
QA/QC RPD% - 1 - - 1 - - * 1 4 2 2 * 1 * 18 * * * * 8 42 * * 0 - 19 * * * 0 * * * - 2 * *
GL28-1-20130708 2013 07 08 - 1,740 - - 3,530 - - < 10 204 1,440 299 253 10.5 549 < 0.50 3.2 < 20 < 5.0 < 100 < 0.10 < 1.0 1 < 1.0 < 1.0 105 < 0.20 12.5 < 5.0 < 2.0 < 0.050 5,560 < 0.20 < 30 < 50 - 122 < 30a < 5.0
DUP1-20130708 Duplicate - 1,740 - - 4,220 - - < 10 205 1,460 299 253 10.6 547 < 0.50 3.3 < 20 < 5.0 < 100 < 0.10 < 1.0 1 < 1.0 < 1.0 107 < 0.20 13.1 < 5.0 < 2.0 < 0.050 5,560 < 0.20 < 30 < 50 - 125 < 30a < 5.0
QA/QC RPD% - 0 - - 18 - - * 0 1 0 0 1 0 * 3 * * * * * 0 * * 2 * 5 * * * 0 * * * - 2 * *
GL28-1-20140603 2014 06 03 - 1,600 - - 3,930 - - < 10 188 1,420 274 209 9.4 537 < 0.50 3.4 < 20 < 5.0 < 100 < 0.10 < 1.0 0.77 < 1.0 < 1.0 99 < 0.20 13.4 < 5.0 < 2.0 < 0.050 5,370 < 0.20 < 30 < 50 - 116 < 30a < 5.0
GL28-1-20141117 2014 11 17 - 1,690 - - 3,970 - - < 10 197 1,540 292 212 9.9 559 < 0.50 3 < 20 < 5.0 < 100 < 0.10 < 1.0 0.63 < 1.0 < 1.0 91 < 0.20 13.2 < 5.0 < 2.0 < 0.050 5,700 < 0.20 < 30 < 50 - 118 < 30a < 5.0
GL28-1-20150611 2015 06 11 7.93 1,630 - - 3,920 - - < 10 192 1,520 280 208 9.4 518 < 0.50 3.2 < 20 < 5.0 < 100 < 0.050 < 0.50 0.6 < 1.0 < 1.0 81 < 0.20 14 < 5.0 < 1.0 < 0.050 5,370 < 0.020 < 30 < 50 - 131 < 30a < 5.0
GL28-1-20151105 2015 11 05 7.65 1,600 - - 3,930 - - < 10 190 1,600 274 214 9.6 553 < 0.50 3.1 < 20 < 5.0 < 100 < 0.050 < 0.50 0.5 < 1.0 < 1.0 88 < 0.20 13.9 < 5.0 < 1.0 < 0.050 5,850 < 0.020 < 30 < 50 - 122 < 30a < 5.0
GL28-1-20160524 2016 05 24 7.97 1,710 - - 3,950 - - < 10 197 1,750 295 220 10.1 561 < 0.50 3.9 < 20 < 5.0 < 100 < 0.050 < 0.50 0.58 < 1.0 < 1.0 93 < 0.20 14.2 < 5.0 < 1.0 < 0.050 5,710 < 0.020 < 30 < 50 - 121 < 30a < 5.0
GL28-1-20160920 2016 09 20 7.69 1,740 - - 4,080 - - < 10 194 1,800 305 260 10.4 557 < 0.50 3.5 < 20 < 5.0 < 100 < 0.050 < 0.50 0.6 < 1.0 < 1.0 87 < 0.20 12.5 < 5.0 < 1.0 < 0.050 5,790 < 0.020 < 30 < 50 - 123 < 30a < 5.0
GL28-1-20170711 2017 07 11 8.21 1,620 - - 3,740 - - < 10 193 1,680 276 230 10 560 < 0.50 2.6 < 20 < 5.0 < 100 < 0.050 < 0.50 < 0.50 < 1.0 < 1.0 90 < 0.20 12.2 < 5.0 < 1.0 < 0.050 5,500 < 0.020 < 30 < 50 - 109 < 30a < 5.0
GL28-1-20170926 2017 09 26 7.67 1,620 - - 3,460 - - < 10 189 1,720 279 237 10.4 519 < 0.50 3.3 < 20 < 5.0 < 100 < 0.050 < 0.50 0.55 < 1.0 < 1.0 88 < 0.20 12.4 < 5.0 < 1.0 < 0.050 5,480 < 0.020 < 30 < 50 - 107 < 30a < 5.0
GL28-1-180528 2018 05 28 7.72 1,710 6.99 3,741 3,730 4.85 < 0.0050 < 5.0 201 333 292 148 11.7 536 < 0.20 1.01 14.7 < 0.10 18.3 0.193 < 0.50 0.48 0.98 < 0.20 81.1 < 0.010 12.4 1.96 0.72 < 0.050 5,950 < 0.020 < 0.20 < 5.0 < 1.0 123 < 1.0 < 4.0
GL28-1-180925 2018 09 25 7.72 1,750 7.21 3,761 3,770 4.88 < 0.0050 < 5.0 207 1,220 300 301 11.3 553 < 0.20 1.49 9.7 < 0.10 20.2 0.041 < 0.50 0.70 < 0.40 < 0.20 85.9 < 0.010 12.9 1.85 < 0.50 < 0.050 6,000 < 0.020 < 0.20 < 5.0 < 1.0 115 < 1.0 < 4.0
DUP1-180925 Duplicate 7.73 1,730 7.21 3,761 3,930 4.81 < 0.0050 < 5.0 207 1,280 295 313 11.9 544 < 0.20 1.75 10.0 < 0.10 10.1 0.039 < 0.50 0.71 1.15 < 0.20 69.3 < 0.010 13.1 1.93 < 0.50 < 0.050 5,910 < 0.020 < 0.20 < 5.0 < 1.0 114 < 1.0 < 4.0
QA/QC RPD% 0 1 * * 4 1 * * 0 5 2 4 5 2 * * * * * * * 1 * * 21 * 2 * * * 2 * * * * 1 * *
GL28-1-190528 2019 05 28 7.81 1,690 7.12 3,741,000 3,650 4.74 < 0.0500 < 5.0 195 1,720 293 297 10.2 489 < 0.20 2.30 10.8 < 0.10 14.5 0.034 1.04 0.64 < 0.40 < 0.20 91.1 < 0.010 13.0 1.66 < 0.50 < 0.050 6,420 < 0.020 < 0.20 < 5.0 < 1.0 119 < 1.0 < 4.0
GL28-1-190919 2019 09 19 7.78 1,650 7.39 3,802,000 3,470 4.47 - < 5.0 193 1,710 284 300 9.94 448 < 0.20 2.36 10.0 < 0.10 18.8 0.021 < 0.50 0.60 < 0.10 < 0.20 80.7 < 0.010 12.4 1.71 < 0.50 < 0.050 6,190 < 0.020 < 0.20 < 5.0 < 1.0 120 < 1.0 < 4.0
GL28-1-200610 2020 06 10 7.71 1,770 7.15 3,321 3,300 4.43 - < 1.0 214 1,720 300 287 10.7 461 < 0.050 3.37 10.1 0.014 18.6 0.0107 0.14 0.536 0.21 < 0.050 83.0 < 0.010 12.6 0.871 < 0.10 < 0.010 6,210 0.0044 < 0.050< 0.20< 0.20 112 0.30 1.3
DUPB-200610 Duplicate 7.75 1,630 7.15 3,321 3,680 3.83 - < 1.0 208 1,760 269 276 10.3 415 < 0.050 3.67 10.9 0.019 11.1 0.0120 0.17 0.541 0.22 < 0.050 62.6 < 0.010 13.1 0.906 < 0.10 < 0.010 6,270 0.0050 < 0.050< 0.20< 0.20 112 0.24 1.4
QA/QC RPD% 1 8 * * 11 15 - * 3 2 11 4 4 11 * 9 8 * 51 11 * 1 * * 28 * 4 4 * * 1 * * * * 0 * *
GL28-1-201104 2020 11 04 7.82 1,850 7.14 4,082 3,840 6.24 - < 1.0 237 1,770 306 320 11.5 454 < 0.050 2.90 9.69 0.022 16.4 0.0046 < 0.10 0.589 0.40 < 0.050 82.5 < 0.010 13.3 1.79 < 0.10 < 0.010 7,000 0.0045 < 0.050< 0.20< 0.20 118 < 0.20 1.4
DUP3-201104 Duplicate 7.80 1,850 - - 3,450 6.09 - < 1.0 236 1,760 307 316 11.5 451 < 0.050 2.86 9.59 0.072 16.4 0.0059 < 0.10 0.577 2.83 < 0.050 84.1 < 0.010 13.1 1.76 < 0.10 < 0.010 7,000 0.0043 < 0.050< 0.20< 0.20 119 < 0.20 < 1.0
QA/QC RPD% 0 0 - - 11 2 - * 0 1 0 1 0 1 * 1 1 * 0 * * 2 * * 2 * 2 2 * * 0 * * * * 1 * *GL28-2 GL28-2-20091116 2009 11 16 - 1,530 - - - - - < 50 245 < 100 224 62 12 561 < 2 < 2 20 < 0.4 < 40 0.1 < 4 0.5 < 10 < 1 40 - 4 < 10 < 6 < 0.10 4,940 < 0.1 < 1 < 10 - 130 1 < 10
GL28-2-20160524 2016 05 24 7.72 1,840 - - 4,530 - - < 10 308 < 30 261 33 11.4 698 < 0.50 < 1.0 < 20 < 5.0 < 100 0.065 < 0.50 < 0.50 < 1.0 < 1.0 < 50a < 0.20 5.5 < 5.0 1.6 < 0.050 5,890 < 0.050 < 30 < 50 - 183 < 30a < 5.0
GL28-2-20160920 2016 09 20 7.5 1,810 - - 4,760 - - 94 306 127 255 19 11.6 743 < 0.50 < 1.0 < 20 < 5.0 < 100 0.221 < 0.50 < 0.50 < 1.0 < 1.0 < 50a < 0.20 4.1 < 5.0 2.2 < 0.050 6,160 < 0.050 < 30 < 50 - 184 < 30a < 5.0
DUP1-20160920 Duplicate 7.51 3,610 - - 4,750 - - 76 608 235 508 37 23.4 1,480 < 0.50 < 1.0 27 < 10a < 200 0.247 < 0.50 < 0.50 < 1.0 < 1.0 95 < 0.20 3.9 < 5.0 2.1 < 0.050 12,300 < 0.050 < 60 < 50 - 178 < 60a < 10
QA/QC RPD% 0 66 - - 0 - - 21 66 60 66 64 67 66 * * * * * 11 * * * * * * * * * * 67 * * * - 3 * *
GL28-2-20170711 2017 07 11 8.03 1,680 - - 4,400 - - < 10 284 < 30 236 12 11 751 < 0.50 < 1.0 < 20 < 5.0 < 100 0.105 < 0.50 < 0.50 < 1.0 < 1.0 < 50a < 0.20 4.9 < 5.0 1.7 < 0.050 5,460 < 0.050 < 30 < 50 - 170 < 30a < 5.0
GL28-2-20170926 2017 09 26 7.48 1,920 - - 4,640 - - < 10 317 < 30 275 18 12 714 < 0.50 < 1.0 < 20 < 5.0 < 100 0.072 < 0.50 < 0.50 1.3 < 1.0 < 50a < 0.20 4.3 < 5.0 1.8 < 0.050 6,300 < 0.020 < 30 < 50 - 168 < 30a < 5.0
GL28-2-180528 2018 05 28 7.42 1,900 6.77 4,680 4,730 6.09 < 0.0050 < 5.0 303 < 10 278 17.4 12.8 735 < 0.20 < 0.50 13.2 < 0.10 16.3 0.065 < 0.50 0.29 0.69 < 0.20 45.5 < 0.010 4.81 2.58 1.49 < 0.050 7,280 < 0.020 < 0.20 < 5.0 < 1.0 181 < 1.0 < 4.0
DUP1-180528 Duplicate 7.51 1,860 6.77 4,680 4,960 6.55 < 0.0050 < 5.0 274 < 10 286 17.6 13.4 772 < 0.20 < 0.50 13.5 < 0.10 13.4 0.073 < 0.50 0.28 0.68 < 0.20 38.1 < 0.010 4.84 2.60 1.59 < 0.050 7,320 < 0.020 < 0.20 < 5.0 < 1.0 190 < 1.0 5.4
QA/QC RPD% 1 2 * * 5 7 * * 10 * 3 1 5 5 * * * * * 12 * * 1 * 18 * * 1 * * 1 * * * * 5 * *
GL28-2-180925 2018 09 25 7.60 2,280 6.97 5,093 5,370 8.34 < 0.0050 39.7 382 < 10 322 20.4 14.1 862 < 0.20 < 0.50 14.1 < 0.10 17.8 0.075 < 0.50 0.31 1.06 < 0.20 51.0 < 0.010 5.07 2.85 1.33 < 0.050 7,980 < 0.020 < 0.20 < 5.0 < 1.0 196 1.1 < 4.0
GL28-2-190528 2019 05 28 7.70 2,170 6.97 5,200,000 5,280 6.36 < 0.0500 < 5.0 352 < 10 312 21.5 12.8 820 < 0.20 < 0.50 14.0 < 0.10 14.6 0.079 < 0.50 0.36 0.85 < 0.20 58.8 < 0.010 5.41 2.88 1.18 < 0.050 8,620 < 0.020 < 0.20 < 5.0 < 1.0 200 1.0 < 4.0
GL28-2-190919 2019 09 19 7.64 2,030 7.24 5,225,000 5,380 5.96 - 47.9 340 17 286 20.2 12.4 762 < 0.20 < 0.50 13.9 < 0.10 19.1 0.072 1.02 0.34 0.71 < 0.20 52.8 < 0.010 4.99 2.86 1.57 < 0.050 7,880 < 0.020 0.43 < 5.0 < 1.0 199 < 1.0 14.0
GL28-2-200610 2020 06 10 7.66 1,730 6.95 3,882 4,250 4.99 - < 1.0 301 < 2.0 237 8.74 12 657 < 0.050 0.466 12.5 < 0.010 18.6 0.0520 0.30 0.189 0.58 < 0.050 43.8 < 0.010 5.31 1.33 0.60 < 0.010 6,550 0.0053 < 0.050< 0.20< 0.20 151 1.15 1.1
GL28-2-201104 2020 11 04 7.70 2,200 6.9 5,499 4,790 6.26 - < 1.0 397 171 293 19.2 14.2 955 < 0.050 0.414 13.4 < 0.010 16.9 0.0582 28.2 0.310 1.13 < 0.050 53.9 < 0.010 5.86 3.06 1.05 < 0.010 8,600 0.0089 < 0.050< 0.20< 0.20 196 1.15 < 1.0
Associated CARO file(s): 8052631, 8052802, 8060737, 8061100, 8092458, 9052219, 9052558, 9052937, 9091657, 9092001.
Associated Exova file(s): 712940, 714233, 756693, 756810, 757047, 811364, 812741, 878316, 879073, 909448.
All terms defined within the body of SNC-Lavalin's report.a Laboratory detection limit exceeds regulatory standard/guideline.
< Denotes concentration less than indicated detection limit or RPD less than indicated value.b Pathways Included: Aesthethic Objectives, Maximum Acceptable Concentrations.
- Denotes analysis not conducted.c Pathways Included: Drinking Water - AO, Drinking Water - MAC,
n/a Denotes no applicable standard/guideline.d Only applies for specific Schedule 2 Site Activities; verify for your site.
QA/QC RPD Denotes quality assurance/quality control relative percent differencee Individual standards exist for Cr +3 and Cr +6. Reported value represents more stringent standard.
* RPDs are not calculated where one or more concentrations are less than five times RDL.f Interim BC MoE Regional Background Estimate (Protocol 9 Determining Background Groundwater Quality).
RDL Denotes reported detection limit.
BOLD Concentration greater than Canadian Drinking Water Quality Guidelines (CDWQG) Guideline
SHADED Concentration greater than BCWQG Drinking Water (DW) guideline
RED Concentration greater than CSR Drinking Water (DW) standard
SNC-LAVALIN INC. Page 2 of 3
662036 / 2021 02 0920210309_662036_TAB_Historical.xlsx
QAQC CN 2021 03 09

TABLE V.4: Historical Summary of Analytical Results for Groundwater - Drinking Water Comparison - Dissolved Metals
Physical Parameters Dissolved Metals
Sample Sample Sample Date pH
To
tal H
ard
ness
pH
(fi
eld
)
Fie
ld
Co
nd
ucti
vit
y
To
tal D
isso
lved
So
lid
s
Dis
so
lved
Org
an
ic C
arb
on
Ph
osp
hate
Dis
so
lved
Alu
min
um
Dis
so
lved
Calc
ium
Dis
so
lved
Iro
n
Dis
so
lved
Mag
nesiu
m
Dis
so
lved
Man
gan
ese
Dis
so
lved
Po
tassiu
m
Dis
so
lved
So
diu
m
An
tim
on
y
Ars
en
ic
Bari
um
Bery
lliu
m
Bo
ron
Cad
miu
m
Ch
rom
ium
Co
balt
Co
pp
er
Lead
Lit
hiu
m
Merc
ury
Mo
lyb
den
um
Nic
kel
Sele
niu
m
Sil
ver
Str
on
tiu
m
Th
alliu
m
Tin
Tit
an
ium
Tu
ng
ste
n
Ura
niu
m
Van
ad
ium
Zin
c
Location ID (yyyy mm dd) pH mg/L pH µS/cm mg/L mg/L mg/L µg/L mg/L µg/L mg/L µg/L mg/L mg/L µg/L µg/L µg/L µg/L µg/L µg/L µg/L µg/L µg/L µg/L µg/L µg/L µg/ µg/L µg/L µg/L µg/L µg/L µg/L µg/L µg/L µg/L µg/L µg/LBC Standard
Canadian Drinking Water Quality Guidelines (CDWQG)7.0-10.5 n/a 7.0-10.5 n/a 500 n/a n/a 100 n/a 300 n/a 20 n/a 200 6 10 1,000 n/a 5,000 5 50 n/a 1,000 5 n/a 1 n/a n/a 50 n/a n/a n/a n/a n/a n/a 20 n/a 5,000
BCWQG Drinking Water (DW)c 6.5 - 8.5 n/a 6.5 - 8.5 n/a n/a n/a n/a n/a n/a n/a n/a n/a n/a n/a n/a n/a n/a n/a n/a n/a n/a n/a n/a n/a n/a n/a n/a n/a n/a n/a n/a n/a n/a n/a n/a n/a n/a n/a
CSR Drinking Water (DW) n/a n/a n/a n/a n/a n/a n/a 9,500 n/a 6,500d n/a 1,500
d n/a 200 6 10 1,000 8 5,000 5 50e
20f 1,500 10 8 1 250 80 10 20 2,500 n/a 2,500 n/a 3 20 20 3,000
GL28-3 GL28-3-20091116 2009 11 16 - 1,760 - - - - - < 50 279 < 100 260 353 11.9 556 < 2 < 2 30 < 0.4 < 40 0.17 < 4 1.6 10 < 1 40 - 8 20 < 6 < 0.10 5,490 < 0.1 < 1 < 10 - 145 1 10
GL28-3-20100812 2010 08 12 - 1,580 - - 4,230 - - 91 207 < 100 257 82 12.2 610 < 2 < 2 40 < 0.4 < 40 < 0.1 7 0.3 < 10 < 1 30 - 5 10 < 6 < 0.1 5,430 < 0.1 < 1 < 10 - 73 3 < 10
GL28-3-20160524 2016 05 24 7.52 2,740 - - 6,310 - - < 10 377 < 60 438 173 12.3 1,000 < 0.50 < 1.0 20 < 10a < 200 0.213 < 0.50 0.65 < 1.0 < 1.0 52 < 0.20 11.4 8.8 < 1.0 < 0.050 7,550 < 0.050 < 60 51 - 238 < 60
a < 10
GL28-3-20160920 2016 09 20 7.57 1,280 - - 6,550 - - < 10 158 < 30 215 194 5.5 514 < 0.50 < 1.0 < 20 < 5.0 < 100 0.265 < 0.50 1.16 < 1.0 < 1.0 < 50a < 0.20 11.9 11.6 < 1.0 < 0.050 3,660 < 0.050 < 30 < 50 - 263 < 30
a < 5.0
GL28-3-20170711 2017 07 11 8.13 2,480 - - 6,160 - - < 10 296 < 60 423 18 10.2 1,000 < 0.50 < 1.0 < 20 < 10a < 200 0.164 < 0.50 < 0.50 < 1.0 < 1.0 < 50a < 0.20 12 < 5.0 < 1.0 < 0.050 6,650 < 0.050 < 60 < 50 - 245 < 60a < 10
GL28-3-20170926 2017 09 26 7.6 2,520 - - 6,150 - - < 10 300 < 60 430 192 10.6 1,020 < 0.50 < 1.0 < 20 < 10a < 200 0.343 < 0.50 < 0.50 1.5 < 1.0 < 50a < 0.20 13.2 9.8 < 1.0 < 0.050 7,040 0.052 < 60 < 50 - 232 < 60a < 10
GL28-3-180528 2018 05 28 7.51 2,770 6.8 6,392 7,280 10.3 < 0.0050 38.0 282 84 501 146 13.0 1,110 < 0.20 0.76 21.6 < 0.10 5.6 0.382 0.56 0.44 1.72 < 0.20 35.0 < 0.010 12.5 10.0 < 0.50 < 0.050 9,150 0.038 < 0.20 < 5.0 < 1.0 239 1.4 < 4.0
GL28-3-180925 2018 09 25 7.60 3,080 7 6,777 7,490 12.1 < 0.0050 < 5.0 378 < 10 518 321 13.8 1,230 < 0.20 0.82 19.1 < 0.10 5.5 0.316 < 0.50 0.51 1.50 < 0.20 42.9 < 0.010 14.2 12.0 < 0.50 < 0.050 8,940 0.052 < 0.20 < 5.0 < 1.0 278 1.5 < 4.0
GL28-3-190528 2019 05 28 7.78 2,880 7 6,743,000 6,780 8.29 < 0.0500 6.7 343 < 10 491 50.2 12.0 1,170 < 0.20 0.71 18.1 < 0.10 < 5.0 0.128 1.12 0.19 1.14 < 0.20 51.3 < 0.010 13.6 7.20 < 0.50 < 0.050 9,270 0.033 < 0.20 < 5.0 < 1.0 268 1.4 < 4.0
DUP2-190528 Duplicate 7.63 2,830 7 6,743,000 7,120 7.97 < 0.0500 < 5.0 341 < 10 481 50.0 11.8 1,150 < 0.20 0.67 17.9 < 0.10 < 5.0 0.134 < 0.50 0.19 1.15 < 0.20 50.7 < 0.010 13.3 7.27 < 0.50 < 0.050 9,220 0.028 < 0.20 < 5.0 < 1.0 265 1.4 < 4.0
QA/QC RPD% 2 2 * * 5 4 * * 1 * 2 0 2 2 * * * * * 5 * * 1 * 1 * 2 1 * * 1 * * * * 1 * *
GL28-3-190919 2019 09 19 7.65 2,790 7.19 6,895,000 7,490 8.62 - < 5.0 342 < 10 469 175 11.5 1,090 < 0.20 0.62 18.5 < 0.10 10.0 0.212 < 0.50 0.25 1.14 < 0.20 45.4 < 0.010 13.0 9.41 < 0.50 < 0.050 8,880 0.041 < 0.20 < 5.0 < 1.0 274 1.3 < 4.0
DUP1-190919 Duplicate 7.78 2,830 7.19 6,895,000 7,330 8.84 - < 5.0 352 < 10 475 174 11.7 1,110 < 0.20 0.68 17.9 < 0.10 16.3 0.225 1.18 0.27 1.13 < 0.20 46.5 < 0.010 13.3 9.41 < 0.50 < 0.050 8,890 0.039 < 0.20 < 5.0 < 1.0 272 1.3 < 4.0
QA/QC RPD% 2 1 * * 2 3 - * 3 * 1 1 2 2 * * * * * 6 * * 1 * 2 * 2 0 * * 0 * * * * 1 * *
GL28-3-200610 2020 06 10 7.67 2,890 6.92 630.3 7,680 9.25 - < 1.0 395 < 2.0 462 130 12.7 1,190 0.110 0.893 19.9 0.012 6.0 0.180 0.35 0.356 1.45 < 0.050 40.5 < 0.010 13.1 8.14 0.23 < 0.010 9,460 0.0300 < 0.050 0.22 < 0.20 273 1.68 1.8
GL28-3-201105 2020 11 05 7.75 2,870 6.96 277.6 7,810 9.33 - < 1.0 408 4.2 448 281 12.3 1,170 0.142 0.815 19.2 < 0.010 5.0 0.227 0.28 0.484 1.69 < 0.050 46.5 < 0.010 16.5 11.6 0.17 < 0.010 8,710 0.0416 0.087 0.34 < 0.20 269 2.02 3.0
Associated CARO file(s): 8052631, 8052802, 8060737, 8061100, 8092458, 9052219, 9052558, 9052937, 9091657, 9092001.
Associated Exova file(s): 712940, 714233, 756693, 756810, 757047, 811364, 812741, 878316, 879073, 909448.
All terms defined within the body of SNC-Lavalin's report.a Laboratory detection limit exceeds regulatory standard/guideline.
< Denotes concentration less than indicated detection limit or RPD less than indicated value.b Pathways Included: Aesthethic Objectives, Maximum Acceptable Concentrations.
- Denotes analysis not conducted.c Pathways Included: Drinking Water - AO, Drinking Water - MAC,
n/a Denotes no applicable standard/guideline.d Only applies for specific Schedule 2 Site Activities; verify for your site.
QA/QC RPD Denotes quality assurance/quality control relative percent differencee Individual standards exist for Cr +3 and Cr +6. Reported value represents more stringent standard.
* RPDs are not calculated where one or more concentrations are less than five times RDL.f Interim BC MoE Regional Background Estimate (Protocol 9 Determining Background Groundwater Quality).
RDL Denotes reported detection limit.
BOLD Concentration greater than Canadian Drinking Water Quality Guidelines (CDWQG) Guideline
SHADED Concentration greater than BCWQG Drinking Water (DW) guideline
RED Concentration greater than CSR Drinking Water (DW) standard
SNC-LAVALIN INC. Page 3 of 3
662036 / 2021 02 0920210309_662036_TAB_Historical.xlsx
QAQC CN 2021 03 09

TABLE V.5: Historical Summary of Analytical Results for Surface Water - Inorganics
Physical Parameters Dissolved Inorganics
Sample Sample Sample Date pH
Ha
rdn
ess
pH
(fi
eld
)
Te
mp
era
ture
Co
nd
uc
tivit
y
Fie
ld C
on
du
cti
vit
y
To
tal D
iss
olv
ed
So
lid
s
To
tal S
us
pe
nd
ed
So
lid
s
Dis
so
lve
d O
rga
nic
Ca
rbo
n
To
tal N
itro
ge
n-N
Ph
os
ph
ate
To
tal D
iss
olv
ed
So
lid
s
To
tal A
lka
lin
ity
Am
mo
nia
, T
ota
l (a
s N
)
Nit
rate
(as
N)
Nit
rite
(as
N)
Nit
rate
+N
itri
te N
itro
ge
n
Ch
lori
de
Flu
ori
de
Su
lfate
Alk
alin
ity, B
ica
rbo
nate
(as
Ca
CO
3)
Alk
alin
ity, C
arb
on
ate
(as
Ca
CO
3)
Alk
alin
ity, H
yd
rox
ide
(as
Ca
CO
3)
Alk
alin
ity, P
he
no
lph
tha
lein
(as
Ca
CO
3)
Bic
arb
on
ate
Kje
lda
hl N
itro
gen
-N
Bro
mid
e
Ch
em
ica
l O
xyg
en
De
ma
nd
Ph
os
ph
ate
Ort
ho
-Ph
osp
ha
te
To
tal O
rga
nic
Ca
rbo
n
To
tal P
ho
sp
ho
rou
s
as
P
Location ID (yyyy mm dd) pH mg/L pH C µS/cm µS/cm mg/L mg/L mg/L mg/L mg/L mg/L mg/L µg/L µg/L µg/L µg/L mg/L µg/L mg/L mg/L mg/L mg/L mg/L mg/L mg/L mg/L mg/L mg/L mg/L mg/L mg/L
BC Guideline
BCWQG Aquatic Life Long-Term Average (AW)b 6.5 - 9.0 n/a 6.5 - 9.0 n/a n/a n/a n/a n/a n/a n/a n/a n/a n/a 135-365f 3,000 200k n/a 150 n/a 128-429f n/a n/a n/a n/a n/a n/a n/a n/a n/a n/a n/a n/a
BCWQG Aquatic Life Short-term Maximum (AW)c 6.5 - 9.0 n/a 6.5 - 9.0 n/a n/a n/a n/a n/a n/a n/a n/a n/a n/a 700-19,700f 32,800 (max) 600k n/a 600 1,775 - 1,870 n/a n/a n/a n/a n/a n/a n/a n/a n/a n/a n/a n/a n/a
BCWQG Irrigation Water (IW)d 5.0 - 9.0 n/a 5.0 - 9.0 n/a 700 - 5,000j 700 - 5,000j 500 - 3500 20 n/a n/a n/a 500 - 3500 n/a n/a n/a n/a n/a 100 2,000 n/a n/a n/a n/a n/a n/a n/a n/a n/a n/a n/a n/a n/a
CSR Irrigation Watering (IW)e n/a n/a n/a n/a n/a n/a n/a n/a n/a n/a n/a n/a n/a n/a n/a n/a n/a 100 1,000 n/a n/a n/a n/a n/a n/a n/a n/a n/a n/a n/a n/a n/a
BREDIN POND Bredin Pond-20010611 2001 06 11 - - - - - - 1,180 - - - - - - - - - - - - 320 - - - - - - - - - - 10 -
Bredin Pond-20010815 2001 08 15 - - - - - - 1,360 - - - - - - - - - - - - 375 - - - - - - - - - - 18 -
Bredin Pond-20010920 2001 09 20 - - - - - - 1,400 - - - - - - - - - - - - - - - - - - - - - - - 16.3 -
Bredin Pond-20080506 2008 05 06 8.46 - - - 1,470 - 1,000 - - - - - 546 140 < 20 - - 79.8 - 198 - - - - - 0.75 - 14 - < 0.01 11.2 -
Bredin Pond-20080507 2008 05 07 - - - - - - - < 1 - - - - - - - - - - - - - - - - - - - - - - - -
Bredin Pond-20080520 2008 05 20 8.39 728 - - 1,470 - 994 < 1 - - - - 542 120 189 - - 94 - 216 - - - - - 1.16 - 20 - < 0.01 11.8 -
Bredin Pond-20090521 2009 05 21 - 85 - - - - - - - - - - - - - - - - - - - - - - - - - - - - - -
Bredin Pond-20091119 2009 11 19 - 716 - - - - - - - - - - - - - - - - - - - - - - - - - - - - - -
Bredin Pond-20130429 2013 04 29 8.82 757 - - 1,860 - 1,170 < 3.0 - - - - - 28.9 < 100 - - 128 1,530 285 - - - - - - < 1.0 42 - 0.0099 11.5 -
Bredin Pond-20130528 2013 05 28 8.56 745 - - 1,910 - 1,050 < 3.0 - - - - - 90.8 < 100 - - 135 1,150 286 - - - - - - < 1.0 35 - 0.105 9.4 -
Bredin Pond-20130718 2013 07 18 8.76 789 - - 1,990 - 1,230 10.3 - - - - 736 < 5.0 < 100 - - 133 1,540 309 611 124 < 1.0 - - 1.82 < 1.0 43 - 0.176 16.2 -
Bredin Pond-20131016 2013 10 16 8.9 766 - - 1,930 - 1,310 6.3 - - - - 739 22.4 < 100 - - 140 1,010 308 581 158 < 1.0 - - 1.46 < 1.0 43 - 0.0011 11.2 -
Bredin Pond-20140331 2014 03 31 8.66 759 - - 1,950 - 1,240 < 3.0 - - - - 724 96.8 460 - - 129 1,170 307 617 107 < 1.0 - - 1.09 < 1.0 34 - 0.056 9.83 -
Bredin Pond-20140528 2014 05 28 8.86 754 - - 1,960 - 1,280 3.1 - - - - 628 12.3 < 100 - - 134 1,480 315 494 134 < 1.0 - - 1 < 1.0 34 - 0.0479 10.4 -
Bredin Pond-20140828 2014 08 28 9.01 673 - - 1,830 - 1,180 13.5 - - - - 661 14.5 < 100 - - 131 1,820 273 477 184 < 1.0 - - 2.32 < 1.0 64 - 0.0016 15.2 -
Bredin Pond-20150311 2015 03 11 - 721 - - 1,790 - 1,110 < 3.0 - - - - 638 80 1,080 - - 120 1,190 257 542 96.2 < 1.0 - - 0.965 < 0.50 22 - 0.0697 8.52 -
Bredin Pond-20150616 2015 06 16 - 623 - - 1,520 - 1,040 3.2 - - - - 639 11.7 < 50 - - 113 1,170 238 478 162 < 1.0 - - 0.922 < 0.50 30 - 0.0045 9.01 -
Bredin Pond-20151029 2015 10 29 9.27 553 - - 1,560 - 980 < 3.0 - - - - 574 34.1 356 - - 107 1,100 216 390 184 < 1.0 - - 0.938 < 0.50 32 - 0.0184 8.55 -
BREDIN POND-20160518 2016 05 18 - 506 - - 1,380 - 838 < 3.0 - - - - 520 18.3 < 25 - - 98.4 1,030 200 183 337 < 1.0 - - 0.73 < 0.25 24 - 0.0048 8.31 -
BREDIN POND-20160914 2016 09 14 - 597 - - 1,540 - 980 < 3.0 - - - - 592 8.5 < 50 - - 112 1,190 222 421 171 < 1.0 - - 0.866 < 0.50 38 - < 0.0010 11.1 -
BREDIN POND-20161116 2016 11 16 8.52 611 - - 1,670 - 1,080 < 3.0 - - - - 611 75.3 419 - - 110 1,160 252 572 38.8 < 1.0 - - 0.895 < 0.50 36 - 0.008 9.28 -
BREDIN POND-20170418 2017 04 18 8.63 684 - - 1,770 - 1,180 < 3.0 - - - - 659 61.8 192 - - 113 1,060 271 597 61.8 < 1.0 - - 1.34 < 0.50 35 - 0.0033 11 -
BREDIN POND-20170607 2017 06 07 8.72 732 - - 1,880 - 1,170 4.9 - - - - 705 73.6 < 50 - - 125 1,250 306 619 86.4 < 1.0 - - 0.976 < 0.50 28 - 0.0213 10.6 -
BREDIN POND-20170907 2017 09 07 8.73 685 - - 1,810 - 1,190 22.4 - - - - 654 308 < 50 - - 145 1,150 252 570 83.8 < 1.0 - - 3.61 < 0.50 71 - < 0.0010 19 -
BREDIN POND-20171101 2017 11 01 8.41 649 - - 1,720 - 1,030 3 - - - - 617 215 939 - - 145 1,220 223 591 26.6 < 1.0 - - 1.19 < 0.50 21 - 0.0284 7 -
BREDIN POND-180404 2018 04 04 8.77 580 9.08 9.4 1,450 1,235 918 65.3 - 3.27 0.0108 - 477 176 897 < 10 897 128 870 144 389 88.2 < 1.0 44.1 - 2.37 0.17 76 0.0108 - 9.18 1.00
BREDIN POND-180523 2018 05 23 8.36 604 8.7 21.6 1,710 1,764 1,070 < 3.3 - 2.69 0.100 - 519 449 1,360 48 1,410 153 450 211 504 14.7 < 1.0 7.4 - 1.28 < 0.10 < 20 0.100 - 7.65 0.257
BREDIN POND-180906 2018 09 06 8.87 581 9.03 19.4 1,560 1,580 1,020 3.4 - 1.90 < 0.0050 - 471 439 556 39 595 129 870 206 471 < 1.0 < 1.0 < 1.0 - 1.30 < 0.10 58 < 0.0050 - 10.8 0.159
BREDIN POND-181107 2018 11 07 8.31 586 8.24 8 1,600 1,389 964 2.6 - 2.60 0.0653 - 509 880 1,110 82 1,190 149 760 207 501 7.3 < 1.0 3.6 - 1.42 < 1.00 29 0.0653 - 7.15 0.172
BREDIN POND-190329 2019 03 29 8.24 640 8.16 8.8 1,680 1,418 986 2.3 - 2.98 0.108 923 556 128 2,150 18 2,170 142 830 197 - < 1.0 < 1.0 < 1.0 556 0.810 0.15 21 0.108 - 6.38 0.253
BREDIN POND-190605 2019 06 05 8.84 750 8.62 21.7 1,880 1,671 1,330 3.0 - 0.875 < 0.0050 1,085 653 54 33 16 48.6 160 880 296 451 202 < 1.0 101 - 0.826 < 0.10 < 20 < 0.0050 - 8.11 0.288
BREDIN POND-190904 2019 09 04 9.17 721 9.63 21.6 1,870 1,715 1,220 5.0 9.45 1.04 - 1,118 624 135 < 10 < 10 < 10.0 178 980 281 328 296 < 1.0 148 - 1.04 < 0.10 27 - 0.0068 10.5 0.112
BREDIN POND-191023 2019 10 23 8.60 663 9.43 9.6 1,790 1,788 1,120 7.7 6.89 1.53 - 1,163.5 557 42 562 15 577 169 840 224 557 < 1.0 < 1.0 < 1.0 - 0.950 < 0.10 22 - < 0.0050 7.25 0.0803
BREDINPOND-200407 2020 04 07 8.44 627 9.05 8.8 1,630 1,470 1,040 7.2 5.93 1.92 - - 481 206 664 21 685 166 680 184 452 29.3 < 1.0 14.6 - 1.24 < 0.10 < 20 - < 0.0050 6.84 0.0920
BREDINPOND-200605 2020 06 05 8.80 565 8.76 19.4 1,460 1,344 935 2.0 6.99 0.615 - - 493 < 50 < 10 < 10 < 10.0 159 600 155 356 137 < 1.0 68.5 - 0.615 0.12 < 20 - < 0.0050 7.04 0.0593
BREDINPOND-200917 2020 09 17 8.89 736 8.98 21.6 1,860 1,945 1,270 21.2 11.7 2.25 - - 608 84 < 10 < 10 - 164 970 280 409 199 < 1.0 99.3 - 2.25 < 0.10 62 - < 0.0050 13.4 0.146
BREDINPOND-201028 2020 10 28 8.62 755 8.85 5.5 2,010 2,025 1,300 18.7 14.8 3.06 - - 664 115 301 79 380 157 990 296 559 105 < 1.0 52.4 - 2.68 < 0.10 53 - < 0.0050 14.8 0.219
NORTHEAST POND NE Pond-20130429 2013 04 29 8.72 899 - - 2,220 - 1,260 3.1 - - - - - 95.1 < 100 - - 137 2,080 417 - - - - - - < 1.0 43 - 0.369 14.9 -
NE Pond-20130528 2013 05 28 8.76 948 - - 2,360 - 1,670 4 - - - - - 56.9 < 100 - - 145 1,640 465 - - - - - - < 1.0 51 - 0.503 13.5 -
NE Pond-20130718 2013 07 18 8.83 951 - - 2,400 - 1,540 < 3.0 - - - - 870 65.1 < 100 - - 150 1,820 446 684 186 < 1.0 - - 1.88 < 1.0 41 - 0.445 17.7 -
NE Pond-20131016 2013 10 16 8.78 937 - - 2,430 - 1,750 6 - - - - 871 149 < 100 - - 157 1,700 432 726 145 < 1.0 - - 1.59 < 1.0 48 - 0.157 16.9 -
NE Pond-20140331 2014 03 31 8.66 858 - - 2,230 - 1,490 5.5 - - - - 808 8.2 < 100 - - 133 1,400 405 696 112 < 1.0 - - 1.29 < 1.0 39 - 0.27 12.1 -
NE Pond-20140528 2014 05 28 8.77 814 - - 2,190 - 1,190 < 3.0 - - - - 785 62.2 < 100 - - 137 1,800 379 659 127 < 1.0 - - 1.17 < 1.0 37 - 0.353 11 -
NE Pond-20140828 2014 08 28 8.96 775 - - 2,160 - 1,440 10.3 - - - - 780 17.6 < 100 - - 150 1,940 363 581 199 < 1.0 - - 2.35 < 1.0 80 - 0.114 18.8 -
Associated CARO file(s): 8040426, 8041402, 8041784, 8050436, 8052167, 8061543, 8071280, 8090442, 8110640, 8110821, 9032473, 9050543, 9060474, 9090312, N000861, 0040546, 0060737, 0091922, 20J3095.
All terms defined within the body of SNC-Lavalin's report.
< Denotes concentration less than indicated detection limit or RPD less than indicated value.a Laboratory detection limit exceeds regulatory standard/guideline.
- Denotes analysis not conducted.b Guideline to protect freshwater aquatic life, long-term average (i.e. "chronic").
n/a Denotes no applicable standard/guideline.c Guideline to protect freshwater aquatic life, short-term maximum (i.e. "acute").
QA/QC RPD Denotes quality assurance/quality control relative percent differenced Guideline to protect irrigation watering.
* RPDs are not calculated where one or more concentrations are less than five times RDL.e Standard for groundwater, shown here for comparison purposes only.
RDL Denotes reported detection limit.f guideline varies with pH and temperature.j Conductivity guidelines varies with crop. Guideline range 700-5,000, most stringent guideline for low tolerance crops applied (strawberry, raspberry, bean and carrot.
BOLD Concentration greater than BCWQG Aquatic Life Long-Term Average (AW) guidelinek Standard/Guideline varies with chloride
BOLD Concentration greater than BCWQG Aquatic Life Short-term Maximum (AW) guideline
SHADED Concentration greater than BCWQG Irrigation Water (IW) guideline
RED Concentration greater than CSR Irrigation Watering (IW) standard
SNC-LAVALIN INC. Page 1 of 5
662036 / 2021 02 0920210309_662036_TAB_Historical.xlsx
QAQC CN 2021 03 09
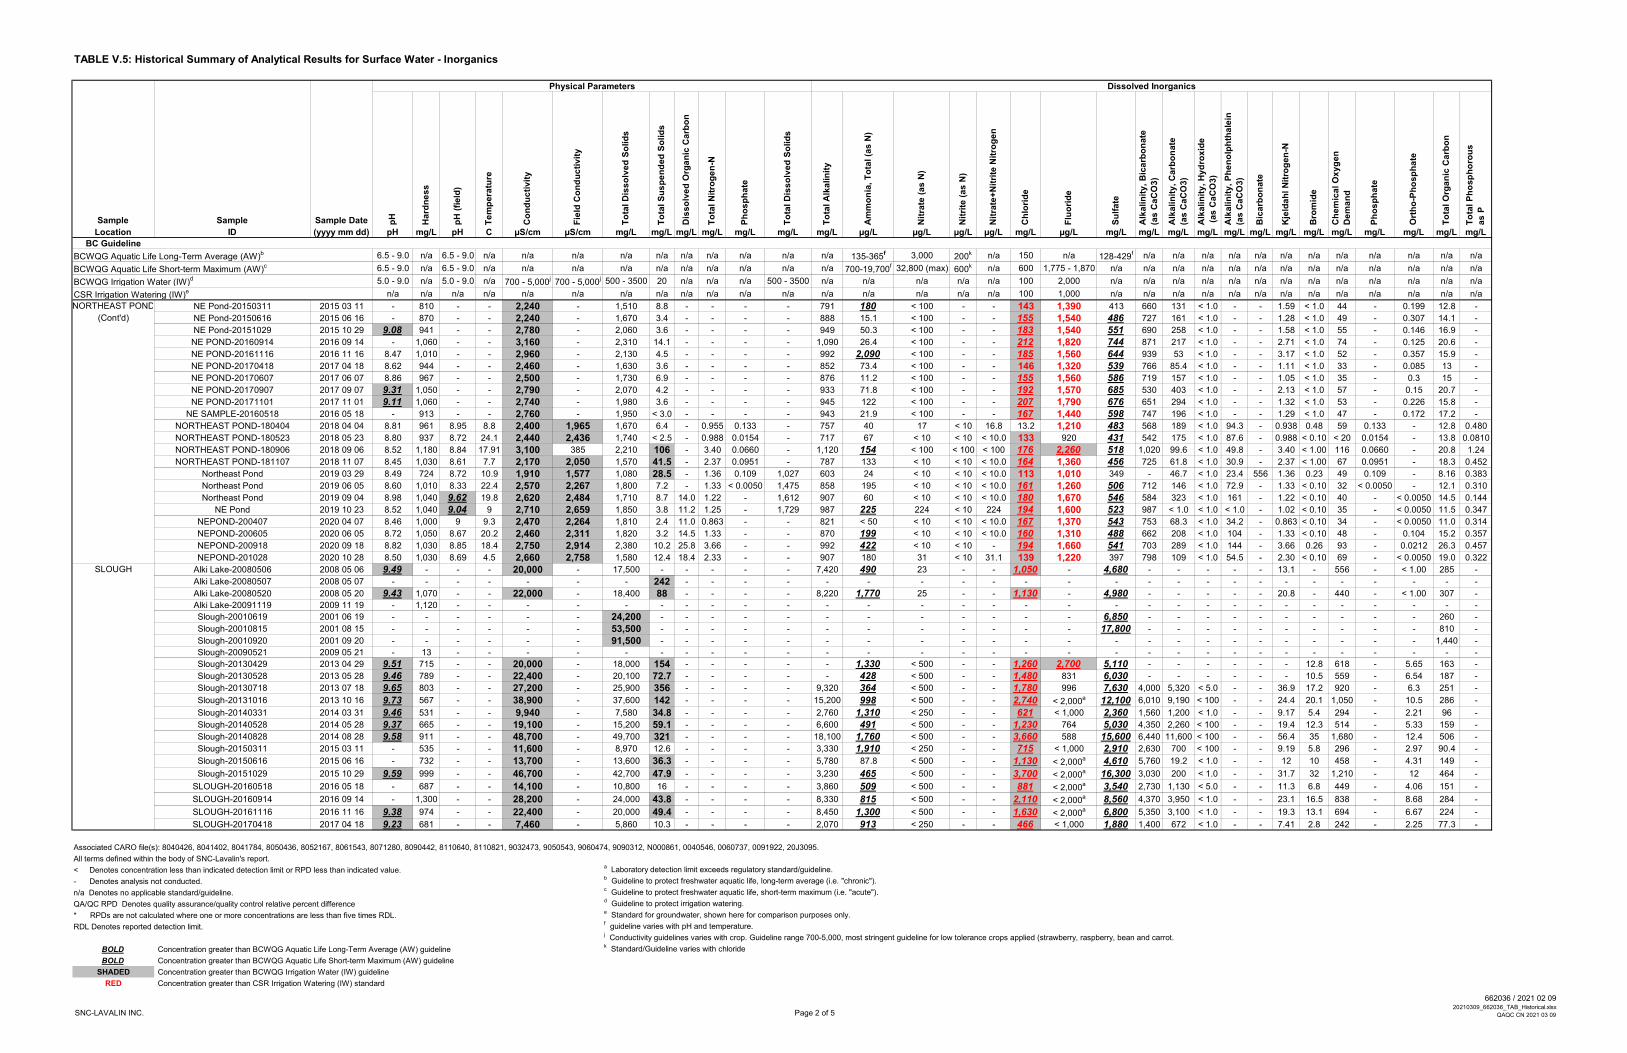
TABLE V.5: Historical Summary of Analytical Results for Surface Water - Inorganics
Physical Parameters Dissolved Inorganics
Sample Sample Sample Date pH
Ha
rdn
ess
pH
(fi
eld
)
Te
mp
era
ture
Co
nd
uc
tivit
y
Fie
ld C
on
du
cti
vit
y
To
tal D
iss
olv
ed
So
lid
s
To
tal S
us
pe
nd
ed
So
lid
s
Dis
so
lve
d O
rga
nic
Ca
rbo
n
To
tal N
itro
ge
n-N
Ph
os
ph
ate
To
tal D
iss
olv
ed
So
lid
s
To
tal A
lka
lin
ity
Am
mo
nia
, T
ota
l (a
s N
)
Nit
rate
(as
N)
Nit
rite
(as
N)
Nit
rate
+N
itri
te N
itro
ge
n
Ch
lori
de
Flu
ori
de
Su
lfate
Alk
alin
ity, B
ica
rbo
nate
(as
Ca
CO
3)
Alk
alin
ity, C
arb
on
ate
(as
Ca
CO
3)
Alk
alin
ity, H
yd
rox
ide
(as
Ca
CO
3)
Alk
alin
ity, P
he
no
lph
tha
lein
(as
Ca
CO
3)
Bic
arb
on
ate
Kje
lda
hl N
itro
gen
-N
Bro
mid
e
Ch
em
ica
l O
xyg
en
De
ma
nd
Ph
os
ph
ate
Ort
ho
-Ph
osp
ha
te
To
tal O
rga
nic
Ca
rbo
n
To
tal P
ho
sp
ho
rou
s
as
P
Location ID (yyyy mm dd) pH mg/L pH C µS/cm µS/cm mg/L mg/L mg/L mg/L mg/L mg/L mg/L µg/L µg/L µg/L µg/L mg/L µg/L mg/L mg/L mg/L mg/L mg/L mg/L mg/L mg/L mg/L mg/L mg/L mg/L mg/L
BC Guideline
BCWQG Aquatic Life Long-Term Average (AW)b 6.5 - 9.0 n/a 6.5 - 9.0 n/a n/a n/a n/a n/a n/a n/a n/a n/a n/a 135-365f 3,000 200k n/a 150 n/a 128-429f n/a n/a n/a n/a n/a n/a n/a n/a n/a n/a n/a n/a
BCWQG Aquatic Life Short-term Maximum (AW)c 6.5 - 9.0 n/a 6.5 - 9.0 n/a n/a n/a n/a n/a n/a n/a n/a n/a n/a 700-19,700f 32,800 (max) 600k n/a 600 1,775 - 1,870 n/a n/a n/a n/a n/a n/a n/a n/a n/a n/a n/a n/a n/a
BCWQG Irrigation Water (IW)d 5.0 - 9.0 n/a 5.0 - 9.0 n/a 700 - 5,000j 700 - 5,000j 500 - 3500 20 n/a n/a n/a 500 - 3500 n/a n/a n/a n/a n/a 100 2,000 n/a n/a n/a n/a n/a n/a n/a n/a n/a n/a n/a n/a n/a
CSR Irrigation Watering (IW)e n/a n/a n/a n/a n/a n/a n/a n/a n/a n/a n/a n/a n/a n/a n/a n/a n/a 100 1,000 n/a n/a n/a n/a n/a n/a n/a n/a n/a n/a n/a n/a n/a
NORTHEAST POND NE Pond-20150311 2015 03 11 - 810 - - 2,240 - 1,510 8.8 - - - - 791 180 < 100 - - 143 1,390 413 660 131 < 1.0 - - 1.59 < 1.0 44 - 0.199 12.8 -
(Cont'd) NE Pond-20150616 2015 06 16 - 870 - - 2,240 - 1,670 3.4 - - - - 888 15.1 < 100 - - 155 1,540 486 727 161 < 1.0 - - 1.28 < 1.0 49 - 0.307 14.1 -
NE Pond-20151029 2015 10 29 9.08 941 - - 2,780 - 2,060 3.6 - - - - 949 50.3 < 100 - - 183 1,540 551 690 258 < 1.0 - - 1.58 < 1.0 55 - 0.146 16.9 -
NE POND-20160914 2016 09 14 - 1,060 - - 3,160 - 2,310 14.1 - - - - 1,090 26.4 < 100 - - 212 1,820 744 871 217 < 1.0 - - 2.71 < 1.0 74 - 0.125 20.6 -
NE POND-20161116 2016 11 16 8.47 1,010 - - 2,960 - 2,130 4.5 - - - - 992 2,090 < 100 - - 185 1,560 644 939 53 < 1.0 - - 3.17 < 1.0 52 - 0.357 15.9 -
NE POND-20170418 2017 04 18 8.62 944 - - 2,460 - 1,630 3.6 - - - - 852 73.4 < 100 - - 146 1,320 539 766 85.4 < 1.0 - - 1.11 < 1.0 33 - 0.085 13 -
NE POND-20170607 2017 06 07 8.86 967 - - 2,500 - 1,730 6.9 - - - - 876 11.2 < 100 - - 155 1,560 586 719 157 < 1.0 - - 1.05 < 1.0 35 - 0.3 15 -
NE POND-20170907 2017 09 07 9.31 1,050 - - 2,790 - 2,070 4.2 - - - - 933 71.8 < 100 - - 192 1,570 685 530 403 < 1.0 - - 2.13 < 1.0 57 - 0.15 20.7 -
NE POND-20171101 2017 11 01 9.11 1,060 - - 2,740 - 1,980 3.6 - - - - 945 122 < 100 - - 207 1,790 676 651 294 < 1.0 - - 1.32 < 1.0 53 - 0.226 15.8 -
NE SAMPLE-20160518 2016 05 18 - 913 - - 2,760 - 1,950 < 3.0 - - - - 943 21.9 < 100 - - 167 1,440 598 747 196 < 1.0 - - 1.29 < 1.0 47 - 0.172 17.2 -
NORTHEAST POND-180404 2018 04 04 8.81 961 8.95 8.8 2,400 1,965 1,670 6.4 - 0.955 0.133 - 757 40 17 < 10 16.8 13.2 1,210 483 568 189 < 1.0 94.3 - 0.938 0.48 59 0.133 - 12.8 0.480
NORTHEAST POND-180523 2018 05 23 8.80 937 8.72 24.1 2,440 2,436 1,740 < 2.5 - 0.988 0.0154 - 717 67 < 10 < 10 < 10.0 133 920 431 542 175 < 1.0 87.6 - 0.988 < 0.10 < 20 0.0154 - 13.8 0.0810
NORTHEAST POND-180906 2018 09 06 8.52 1,180 8.84 17.91 3,100 385 2,210 106 - 3.40 0.0660 - 1,120 154 < 100 < 100 < 100 176 2,260 518 1,020 99.6 < 1.0 49.8 - 3.40 < 1.00 116 0.0660 - 20.8 1.24
NORTHEAST POND-181107 2018 11 07 8.45 1,030 8.61 7.7 2,170 2,050 1,570 41.5 - 2.37 0.0951 - 787 133 < 10 < 10 < 10.0 164 1,360 456 725 61.8 < 1.0 30.9 - 2.37 < 1.00 67 0.0951 - 18.3 0.452
Northeast Pond 2019 03 29 8.49 724 8.72 10.9 1,910 1,577 1,080 28.5 - 1.36 0.109 1,027 603 24 < 10 < 10 < 10.0 113 1,010 349 - 46.7 < 1.0 23.4 556 1.36 0.23 49 0.109 - 8.16 0.383
Northeast Pond 2019 06 05 8.60 1,010 8.33 22.4 2,570 2,267 1,800 7.2 - 1.33 < 0.0050 1,475 858 195 < 10 < 10 < 10.0 161 1,260 506 712 146 < 1.0 72.9 - 1.33 < 0.10 32 < 0.0050 - 12.1 0.310
Northeast Pond 2019 09 04 8.98 1,040 9.62 19.8 2,620 2,484 1,710 8.7 14.0 1.22 - 1,612 907 60 < 10 < 10 < 10.0 180 1,670 546 584 323 < 1.0 161 - 1.22 < 0.10 40 - < 0.0050 14.5 0.144
NE Pond 2019 10 23 8.52 1,040 9.04 9 2,710 2,659 1,850 3.8 11.2 1.25 - 1,729 987 225 224 < 10 224 194 1,600 523 987 < 1.0 < 1.0 < 1.0 - 1.02 < 0.10 35 - < 0.0050 11.5 0.347
NEPOND-200407 2020 04 07 8.46 1,000 9 9.3 2,470 2,264 1,810 2.4 11.0 0.863 - - 821 < 50 < 10 < 10 < 10.0 167 1,370 543 753 68.3 < 1.0 34.2 - 0.863 < 0.10 34 - < 0.0050 11.0 0.314
NEPOND-200605 2020 06 05 8.72 1,050 8.67 20.2 2,460 2,311 1,820 3.2 14.5 1.33 - - 870 199 < 10 < 10 < 10.0 160 1,310 488 662 208 < 1.0 104 - 1.33 < 0.10 48 - 0.104 15.2 0.357
NEPOND-200918 2020 09 18 8.82 1,030 8.85 18.4 2,750 2,914 2,380 10.2 25.8 3.66 - - 992 422 < 10 < 10 - 194 1,660 541 703 289 < 1.0 144 - 3.66 0.26 93 - 0.0212 26.3 0.457
NEPOND-201028 2020 10 28 8.50 1,030 8.69 4.5 2,660 2,758 1,580 12.4 18.4 2.33 - - 907 180 31 < 10 31.1 139 1,220 397 798 109 < 1.0 54.5 - 2.30 < 0.10 69 - < 0.0050 19.0 0.322
SLOUGH Alki Lake-20080506 2008 05 06 9.49 - - - 20,000 - 17,500 - - - - - 7,420 490 23 - - 1,050 - 4,680 - - - - - 13.1 - 556 - < 1.00 285 -
Alki Lake-20080507 2008 05 07 - - - - - - - 242 - - - - - - - - - - - - - - - - - - - - - - - -
Alki Lake-20080520 2008 05 20 9.43 1,070 - - 22,000 - 18,400 88 - - - - 8,220 1,770 25 - - 1,130 - 4,980 - - - - - 20.8 - 440 - < 1.00 307 -
Alki Lake-20091119 2009 11 19 - 1,120 - - - - - - - - - - - - - - - - - - - - - - - - - - - - - -
Slough-20010619 2001 06 19 - - - - - - 24,200 - - - - - - - - - - - - 6,850 - - - - - - - - - - 260 -
Slough-20010815 2001 08 15 - - - - - - 53,500 - - - - - - - - - - - - 17,800 - - - - - - - - - - 810 -
Slough-20010920 2001 09 20 - - - - - - 91,500 - - - - - - - - - - - - - - - - - - - - - - - 1,440 -
Slough-20090521 2009 05 21 - 13 - - - - - - - - - - - - - - - - - - - - - - - - - - - - - -
Slough-20130429 2013 04 29 9.51 715 - - 20,000 - 18,000 154 - - - - - 1,330 < 500 - - 1,260 2,700 5,110 - - - - - - 12.8 618 - 5.65 163 -
Slough-20130528 2013 05 28 9.46 789 - - 22,400 - 20,100 72.7 - - - - - 428 < 500 - - 1,480 831 6,030 - - - - - - 10.5 559 - 6.54 187 -
Slough-20130718 2013 07 18 9.65 803 - - 27,200 - 25,900 356 - - - - 9,320 364 < 500 - - 1,780 996 7,630 4,000 5,320 < 5.0 - - 36.9 17.2 920 - 6.3 251 -
Slough-20131016 2013 10 16 9.73 567 - - 38,900 - 37,600 142 - - - - 15,200 998 < 500 - - 2,740 < 2,000a 12,100 6,010 9,190 < 100 - - 24.4 20.1 1,050 - 10.5 286 -
Slough-20140331 2014 03 31 9.46 531 - - 9,940 - 7,580 34.8 - - - - 2,760 1,310 < 250 - - 621 < 1,000 2,360 1,560 1,200 < 1.0 - - 9.17 5.4 294 - 2.21 96 -
Slough-20140528 2014 05 28 9.37 665 - - 19,100 - 15,200 59.1 - - - - 6,600 491 < 500 - - 1,230 764 5,030 4,350 2,260 < 100 - - 19.4 12.3 514 - 5.33 159 -
Slough-20140828 2014 08 28 9.58 911 - - 48,700 - 49,700 321 - - - - 18,100 1,760 < 500 - - 3,660 588 15,600 6,440 11,600 < 100 - - 56.4 35 1,680 - 12.4 506 -
Slough-20150311 2015 03 11 - 535 - - 11,600 - 8,970 12.6 - - - - 3,330 1,910 < 250 - - 715 < 1,000 2,910 2,630 700 < 100 - - 9.19 5.8 296 - 2.97 90.4 -
Slough-20150616 2015 06 16 - 732 - - 13,700 - 13,600 36.3 - - - - 5,780 87.8 < 500 - - 1,130 < 2,000a 4,610 5,760 19.2 < 1.0 - - 12 10 458 - 4.31 149 -
Slough-20151029 2015 10 29 9.59 999 - - 46,700 - 42,700 47.9 - - - - 3,230 465 < 500 - - 3,700 < 2,000a 16,300 3,030 200 < 1.0 - - 31.7 32 1,210 - 12 464 -
SLOUGH-20160518 2016 05 18 - 687 - - 14,100 - 10,800 16 - - - - 3,860 509 < 500 - - 881 < 2,000a 3,540 2,730 1,130 < 5.0 - - 11.3 6.8 449 - 4.06 151 -
SLOUGH-20160914 2016 09 14 - 1,300 - - 28,200 - 24,000 43.8 - - - - 8,330 815 < 500 - - 2,110 < 2,000a 8,560 4,370 3,950 < 1.0 - - 23.1 16.5 838 - 8.68 284 -
SLOUGH-20161116 2016 11 16 9.38 974 - - 22,400 - 20,000 49.4 - - - - 8,450 1,300 < 500 - - 1,630 < 2,000a 6,800 5,350 3,100 < 1.0 - - 19.3 13.1 694 - 6.67 224 -
SLOUGH-20170418 2017 04 18 9.23 681 - - 7,460 - 5,860 10.3 - - - - 2,070 913 < 250 - - 466 < 1,000 1,880 1,400 672 < 1.0 - - 7.41 2.8 242 - 2.25 77.3 -
Associated CARO file(s): 8040426, 8041402, 8041784, 8050436, 8052167, 8061543, 8071280, 8090442, 8110640, 8110821, 9032473, 9050543, 9060474, 9090312, N000861, 0040546, 0060737, 0091922, 20J3095.
All terms defined within the body of SNC-Lavalin's report.
< Denotes concentration less than indicated detection limit or RPD less than indicated value.a Laboratory detection limit exceeds regulatory standard/guideline.
- Denotes analysis not conducted.b Guideline to protect freshwater aquatic life, long-term average (i.e. "chronic").
n/a Denotes no applicable standard/guideline.c Guideline to protect freshwater aquatic life, short-term maximum (i.e. "acute").
QA/QC RPD Denotes quality assurance/quality control relative percent differenced Guideline to protect irrigation watering.
* RPDs are not calculated where one or more concentrations are less than five times RDL.e Standard for groundwater, shown here for comparison purposes only.
RDL Denotes reported detection limit.f guideline varies with pH and temperature.j Conductivity guidelines varies with crop. Guideline range 700-5,000, most stringent guideline for low tolerance crops applied (strawberry, raspberry, bean and carrot.
BOLD Concentration greater than BCWQG Aquatic Life Long-Term Average (AW) guidelinek Standard/Guideline varies with chloride
BOLD Concentration greater than BCWQG Aquatic Life Short-term Maximum (AW) guideline
SHADED Concentration greater than BCWQG Irrigation Water (IW) guideline
RED Concentration greater than CSR Irrigation Watering (IW) standard
SNC-LAVALIN INC. Page 2 of 5
662036 / 2021 02 0920210309_662036_TAB_Historical.xlsx
QAQC CN 2021 03 09

TABLE V.5: Historical Summary of Analytical Results for Surface Water - Inorganics
Physical Parameters Dissolved Inorganics
Sample Sample Sample Date pH
Ha
rdn
ess
pH
(fi
eld
)
Te
mp
era
ture
Co
nd
uc
tivit
y
Fie
ld C
on
du
cti
vit
y
To
tal D
iss
olv
ed
So
lid
s
To
tal S
us
pe
nd
ed
So
lid
s
Dis
so
lve
d O
rga
nic
Ca
rbo
n
To
tal N
itro
ge
n-N
Ph
os
ph
ate
To
tal D
iss
olv
ed
So
lid
s
To
tal A
lka
lin
ity
Am
mo
nia
, T
ota
l (a
s N
)
Nit
rate
(as
N)
Nit
rite
(as
N)
Nit
rate
+N
itri
te N
itro
ge
n
Ch
lori
de
Flu
ori
de
Su
lfate
Alk
alin
ity, B
ica
rbo
nate
(as
Ca
CO
3)
Alk
alin
ity, C
arb
on
ate
(as
Ca
CO
3)
Alk
alin
ity, H
yd
rox
ide
(as
Ca
CO
3)
Alk
alin
ity, P
he
no
lph
tha
lein
(as
Ca
CO
3)
Bic
arb
on
ate
Kje
lda
hl N
itro
gen
-N
Bro
mid
e
Ch
em
ica
l O
xyg
en
De
ma
nd
Ph
os
ph
ate
Ort
ho
-Ph
osp
ha
te
To
tal O
rga
nic
Ca
rbo
n
To
tal P
ho
sp
ho
rou
s
as
P
Location ID (yyyy mm dd) pH mg/L pH C µS/cm µS/cm mg/L mg/L mg/L mg/L mg/L mg/L mg/L µg/L µg/L µg/L µg/L mg/L µg/L mg/L mg/L mg/L mg/L mg/L mg/L mg/L mg/L mg/L mg/L mg/L mg/L mg/L
BC Guideline
BCWQG Aquatic Life Long-Term Average (AW)b 6.5 - 9.0 n/a 6.5 - 9.0 n/a n/a n/a n/a n/a n/a n/a n/a n/a n/a 135-365f 3,000 200k n/a 150 n/a 128-429f n/a n/a n/a n/a n/a n/a n/a n/a n/a n/a n/a n/a
BCWQG Aquatic Life Short-term Maximum (AW)c 6.5 - 9.0 n/a 6.5 - 9.0 n/a n/a n/a n/a n/a n/a n/a n/a n/a n/a 700-19,700f 32,800 (max) 600k n/a 600 1,775 - 1,870 n/a n/a n/a n/a n/a n/a n/a n/a n/a n/a n/a n/a n/a
BCWQG Irrigation Water (IW)d 5.0 - 9.0 n/a 5.0 - 9.0 n/a 700 - 5,000j 700 - 5,000j 500 - 3500 20 n/a n/a n/a 500 - 3500 n/a n/a n/a n/a n/a 100 2,000 n/a n/a n/a n/a n/a n/a n/a n/a n/a n/a n/a n/a n/a
CSR Irrigation Watering (IW)e n/a n/a n/a n/a n/a n/a n/a n/a n/a n/a n/a n/a n/a n/a n/a n/a n/a 100 1,000 n/a n/a n/a n/a n/a n/a n/a n/a n/a n/a n/a n/a n/a
SLOUGH SLOUGH-20170607 2017 06 07 9.04 738 - - 7,660 - 5,880 11.3 - - - - 2,160 574 < 250 - - 504 < 1,000 2,010 1,650 505 < 1.0 - - 6.85 4.1 245 - 2.54 89 -
(Cont'd) SLOUGH-20170907 2017 09 07 9.03 1,070 - - 13,500 - 11,000 15.8 - - - - 4,700 1,090 < 500 - - 944 < 2,000a 3,580 3,410 1,300 < 1.0 - - 17.2 5.6 644 - 5.6 232 -
SLOUGH-20171101 2017 11 01 9.1 1,210 - - 15,000 - 12,000 39.6 - - - - 4,050 701 < 500 - - 1,060 < 2,000a 3,980 2,820 1,220 < 1.0 - - 19.4 6.8 630 - 5.68 261 -
SLOUGH-180404 2018 04 04 8.94 744 8.85 10.5 3,660 2,328 2,440 41.0 - 9.47 1.00 - 902 168 1,080 108 1,190 274 660 791 656 246 < 1.0 123 - 8.28 1.09 250 1.00 - 65.1 2.78
SLOUGH-180523 2018 05 23 8.82 840 8.63 26.3 6,050 6,029 4,440 11.5 - 10.5 2.57 - 1,540 1,330 < 250 < 10 < 250 391 590 1,310 1,220 322 < 1.0 161 - 10.5 < 2.50 299 2.57 - 117 3.46
SLOUGH-180906 2018 09 06 9.02 1,170 9.16 18.9 12,100 11,069 10,200 26.2 - 20.0 2.28 - 3,480 516 < 100 < 100 < 100 695 1,230 2,480 3,480 < 1.0 < 1.0 < 1.0 - 20.0 3.90 627 2.28 - 306 6.33
SLOUGH-181107 2018 11 07 9.04 1,120 8.97 7.4 6,930 6,117 5,520 41.2 - 12.5 1.94 - 1,830 926 101 < 100 101 544 < 1,000 1,910 1,270 552 < 1.0 276 - 12.4 1.14 355 1.94 - 193 2.67
Slough 2019 03 29 8.94 662 9.11 9.8 3,670 3,169 2,470 20.0 - 6.49 0.797 2,067 946 138 < 100 < 100 < 100 257 < 1,000 766 - 245 < 1.0 122 701 6.49 < 1.00 176 0.797 - 53.0 1.44
Slough 2019 06 05 8.92 879 8.69 21 6,270 5,270 4,620 14.8 - 8.16 0.814 3,425 1,660 627 < 100 < 100 < 100 438 < 1,000 1,470 1,230 435 < 1.0 217 - 8.16 < 1.00 241 0.814 - 89.2 2.34
Slough 2019 09 04 9.11 1,010 9.21 21.3 10,200 9,072 7,930 43.7 135 13.5 - 5,895 2,590 281 < 100 < 100 < 100 748 < 1,000 2,460 1,740 848 < 1.0 424 - 13.5 2.95 399 - 1.12 139 2.65
Slough 2019 10 23 9.14 1,090 9.44 11 10,200 9,820 8,030 97.7 132 13.7 - 6,389.5 2,430 408 < 100 < 100 < 100 759 < 1,000 2,560 2,430 < 1.0 < 1.0 < 1.0 - 13.7 3.50 525 - 0.825 142 3.61
SLOUGH-200407 2020 04 07 9.03 778 9.41 9.9 5,070 4,428 3,770 37.5 74.6 9.78 - - 1,170 192 < 10 < 10 < 10.0 365 500 1,210 810 365 < 1.0 182 - 9.78 1.44 281 - 0.360 84.3 1.67
SLOUGH-200605 2020 06 05 9.02 867 9.01 20.6 5,220 5,012 4,260 18.4 78.6 6.93 - - 1,430 382 < 10 34 33.8 385 530 1,280 973 457 < 1.0 229 - 6.89 1.62 199 - 0.864 80.0 1.77
SLOUGH-200918 2020 09 18 9.61 893 9.63 18.6 8,600 9,004 7,100 13.8 117 7.88 - - 2,100 211 < 10 < 10 - 699 710 2,280 821 1,280 < 1.0 642 - 7.88 < 2.50 291 - < 0.0050 119 0.196
SLOUGH-201028 2020 10 28 9.29 895 9.56 3.6 8,480 8,543 6,200 39.7 121 10.7 - - 2,010 115 < 250 < 10 < 250 648 590 2,080 1,140 864 < 1.0 432 - 10.7 < 2.50 291 - < 0.0050 137 1.19
TUTT POND Tutt Pond-20010611 2001 06 11 - - - - - - 630 - - - - - - - - - - - - 89 - - - - - - - - - - 31.7 -
Tutt Pond-20010815 2001 08 15 - - - - - - 4,140 - - - - - - - - - - - - 1,200 - - - - - - - - - - 44 -
Tutt Pond-20010920 2001 09 20 - - - - - - 300 - - - - - - - - - - - - - - - - - - - - - - - 14.8 -
Tutt Pond-20080506 2008 05 06 8.35 - - - 2,130 - 1,320 - - - - - 605 240 65 - - 123 - 318 - - - - - 1.07 - 28 - 0.15 18.1 -
Tutt Pond-20080507 2008 05 07 - - - - - - - 3 - - - - - - - - - - - - - - - - - - - - - - - -
Tutt Pond-20080520 2008 05 20 8.3 850 - - 2,000 - 1,420 2 - - - - 636 230 60 - - 142 - 371 - - - - - 1.58 - 31 - 0.3 20 -
Tutt Pond-20090521 2009 05 21 - 150 - - - - - - - - - - - - - - - - - - - - - - - - - - - - - -
Tutt Pond-20091119 2009 11 19 - 967 - - - - - - - - - - - - - - - - - - - - - - - - - - - - - -
Tutt Pond-20130429 2013 04 29 8.65 831 - - 2,340 - 1,620 7.1 - - - - - 335 < 100 - - 176 1,300 529 - - - - - - < 1.0 35 - 0.355 12.6 -
Tutt Pond-20130528 2013 05 28 8.71 894 - - 2,460 - 1,670 3.3 - - - - - 81.6 < 100 - - 182 900 540 - - - - - - < 1.0 37 - 0.33 11.6 -
Tutt Pond-20130718 2013 07 18 8.82 869 - - 2,430 - 1,560 3 - - - - 665 20 < 100 - - 184 1,300 542 535 130 < 1.0 - - 1.26 < 1.0 36 - 0.273 12.3 -
Tutt Pond-20130819 2013 08 19 8.69 874 - - 2,540 - 1,720 3.9 - - - - 699 52 < 100 - - 191 1,430 566 584 116 < 1.0 - - 1.43 < 1.0 44 - 0.353 13.5 -
Tutt Pond-20130911 2013 09 11 8.82 906 - - 2,550 - 1,920 16.3 - - - - 739 18.5 < 100 - - 197 970 573 623 116 < 1.0 - - 1.98 < 1.0 53 - 0.43 16.7 -
Tutt Pond-20131016 2013 10 16 8.5 943 - - 2,700 - 1,920 < 3.0 - - - - 764 1,520 < 100 - - 205 820 623 733 31.6 < 1.0 - - 2.67 < 1.0 38 - 0.679 13.3 -
Tutt Pond-20140331 2014 03 31 8.56 923 - - 2,510 - 1,690 3.1 - - - - 710 440 530 - - 190 920 565 637 73.4 < 1.0 - - 1.63 < 1.0 34 - 0.332 11.8 -
Tutt Pond-20140528 2014 05 28 8.68 984 - - 2,680 - 1,810 3 - - - - 710 48.4 < 100 - - 204 1,190 693 614 96.7 < 1.0 - - 0.977 < 1.0 35 - 0.187 11.4 -
Tutt Pond-20140731 2014 07 31 8.79 964 - - 2,740 - 1,940 < 3.0 - - - - 674 63 < 100 - - 219 1,240 753 531 143 < 1.0 - - 1.24 < 1.0 44 - 0.236 13.4 -
Tutt Pond-20140828 2014 08 28 8.78 967 - - 2,870 - 2,140 15.4 - - - - 705 15.7 < 100 - - 232 1,510 780 564 141 < 1.0 - - 1.36 < 1.0 52 - 0.277 13.1 -
Tutt Pond-20140930 2014 09 30 8.54 999 - - 2,680 - 1,840 < 3.0 - - - - 720 1,160 < 100 - - 214 1,280 706 649 71.9 < 1.0 - - 2.37 < 1.0 52 - 0.664 25.6 -
Tutt Pond-20150311 2015 03 11 - 822 - - 2,190 - 1,460 11.8 - - - - 665 15.3 < 100 - - 182 1,070 454 554 112 < 1.0 - - 3.33 < 1.0 58 - 0.068 12.8 -
Tutt Pond-20150616 2015 06 16 - 864 - - 2,170 - 1,530 < 3.0 - - - - 667 13.3 < 100 - - 189 980 594 537 129 < 1.0 - - 1.05 < 1.0 39 - 0.137 12.3 -
Tutt Pond-20150902 2015 09 02 8.5 1,060 - - 2,960 - 2,100 8.8 - - - - 718 712 110 - - 212 940 784 669 48.4 < 1.0 - - 1.84 < 1.0 45 - 0.602 12.6 -
Tutt Pond-20151029 2015 10 29 8.46 960 - - 2,840 - 1,910 4.4 - - - - 721 1,090 160 - - 195 920 740 681 39.8 < 1.0 - - 2.3 < 1.0 39 - 0.464 10.9 -
TUTT POND-20160518 2016 05 18 - 843 - - 2,480 - 1,660 < 3.0 - - - - 606 34.9 < 100 - - 181 850 627 537 68.4 < 1.0 - - 0.927 < 1.0 36 - 0.103 12.4 -
TUTT POND-20160914 2016 09 14 - 960 - - 2,660 - 1,860 < 3.0 - - - - 687 234 < 100 - - 193 940 702 608 78.6 < 1.0 - - 1.36 < 1.0 44 - 0.318 12 -
TUTT POND-20161116 2016 11 16 8.44 820 - - 2,310 - 1,610 4.7 - - - - 652 720 310 - - 169 1,000 571 621 31.6 < 1.0 - - 1.71 < 1.0 38 - 0.348 11.7 -
TUTT POND-20170418 2017 04 18 8.63 777 - - 2,090 - 1,420 < 3.0 - - - - 633 99.2 59 - - 146 840 462 570 63 < 1.0 - - 0.987 < 0.50 34 - 0.107 10.8 -
TUTT POND-20170607 2017 06 07 8.75 860 - - 2,220 - 1,500 3.3 - - - - 682 9.5 < 100 - - 164 1,070 510 586 96.2 < 1.0 - - 0.957 < 1.0 38 - 0.166 13.1 -
TUTT POND-20170907 2017 09 07 8.54 1,010 - - 2,790 - 2,020 < 3.0 - - - - 744 58.9 < 100 - - 203 980 743 680 64 < 1.0 - - 1.32 < 1.0 47 - 0.23 14.8 -
Associated CARO file(s): 8040426, 8041402, 8041784, 8050436, 8052167, 8061543, 8071280, 8090442, 8110640, 8110821, 9032473, 9050543, 9060474, 9090312, N000861, 0040546, 0060737, 0091922, 20J3095.
All terms defined within the body of SNC-Lavalin's report.
< Denotes concentration less than indicated detection limit or RPD less than indicated value.a Laboratory detection limit exceeds regulatory standard/guideline.
- Denotes analysis not conducted.b Guideline to protect freshwater aquatic life, long-term average (i.e. "chronic").
n/a Denotes no applicable standard/guideline.c Guideline to protect freshwater aquatic life, short-term maximum (i.e. "acute").
QA/QC RPD Denotes quality assurance/quality control relative percent differenced Guideline to protect irrigation watering.
* RPDs are not calculated where one or more concentrations are less than five times RDL.e Standard for groundwater, shown here for comparison purposes only.
RDL Denotes reported detection limit.f guideline varies with pH and temperature.j Conductivity guidelines varies with crop. Guideline range 700-5,000, most stringent guideline for low tolerance crops applied (strawberry, raspberry, bean and carrot.
BOLD Concentration greater than BCWQG Aquatic Life Long-Term Average (AW) guidelinek Standard/Guideline varies with chloride
BOLD Concentration greater than BCWQG Aquatic Life Short-term Maximum (AW) guideline
SHADED Concentration greater than BCWQG Irrigation Water (IW) guideline
RED Concentration greater than CSR Irrigation Watering (IW) standard
SNC-LAVALIN INC. Page 3 of 5
662036 / 2021 02 0920210309_662036_TAB_Historical.xlsx
QAQC CN 2021 03 09

TABLE V.5: Historical Summary of Analytical Results for Surface Water - Inorganics
Physical Parameters Dissolved Inorganics
Sample Sample Sample Date pH
Ha
rdn
ess
pH
(fi
eld
)
Te
mp
era
ture
Co
nd
uc
tivit
y
Fie
ld C
on
du
cti
vit
y
To
tal D
iss
olv
ed
So
lid
s
To
tal S
us
pe
nd
ed
So
lid
s
Dis
so
lve
d O
rga
nic
Ca
rbo
n
To
tal N
itro
ge
n-N
Ph
os
ph
ate
To
tal D
iss
olv
ed
So
lid
s
To
tal A
lka
lin
ity
Am
mo
nia
, T
ota
l (a
s N
)
Nit
rate
(as
N)
Nit
rite
(as
N)
Nit
rate
+N
itri
te N
itro
ge
n
Ch
lori
de
Flu
ori
de
Su
lfate
Alk
alin
ity, B
ica
rbo
nate
(as
Ca
CO
3)
Alk
alin
ity, C
arb
on
ate
(as
Ca
CO
3)
Alk
alin
ity, H
yd
rox
ide
(as
Ca
CO
3)
Alk
alin
ity, P
he
no
lph
tha
lein
(as
Ca
CO
3)
Bic
arb
on
ate
Kje
lda
hl N
itro
gen
-N
Bro
mid
e
Ch
em
ica
l O
xyg
en
De
ma
nd
Ph
os
ph
ate
Ort
ho
-Ph
osp
ha
te
To
tal O
rga
nic
Ca
rbo
n
To
tal P
ho
sp
ho
rou
s
as
P
Location ID (yyyy mm dd) pH mg/L pH C µS/cm µS/cm mg/L mg/L mg/L mg/L mg/L mg/L mg/L µg/L µg/L µg/L µg/L mg/L µg/L mg/L mg/L mg/L mg/L mg/L mg/L mg/L mg/L mg/L mg/L mg/L mg/L mg/L
BC Guideline
BCWQG Aquatic Life Long-Term Average (AW)b 6.5 - 9.0 n/a 6.5 - 9.0 n/a n/a n/a n/a n/a n/a n/a n/a n/a n/a 135-365f 3,000 200k n/a 150 n/a 128-429f n/a n/a n/a n/a n/a n/a n/a n/a n/a n/a n/a n/a
BCWQG Aquatic Life Short-term Maximum (AW)c 6.5 - 9.0 n/a 6.5 - 9.0 n/a n/a n/a n/a n/a n/a n/a n/a n/a n/a 700-19,700f 32,800 (max) 600k n/a 600 1,775 - 1,870 n/a n/a n/a n/a n/a n/a n/a n/a n/a n/a n/a n/a n/a
BCWQG Irrigation Water (IW)d 5.0 - 9.0 n/a 5.0 - 9.0 n/a 700 - 5,000j 700 - 5,000j 500 - 3500 20 n/a n/a n/a 500 - 3500 n/a n/a n/a n/a n/a 100 2,000 n/a n/a n/a n/a n/a n/a n/a n/a n/a n/a n/a n/a n/a
CSR Irrigation Watering (IW)e n/a n/a n/a n/a n/a n/a n/a n/a n/a n/a n/a n/a n/a n/a n/a n/a n/a 100 1,000 n/a n/a n/a n/a n/a n/a n/a n/a n/a n/a n/a n/a n/a
TUTT POND TUTT POND-20171101 2017 11 01 8.39 1,100 - - 2,930 - 2,100 6 - - - - 780 973 150 - - 216 990 852 749 31.4 < 1.0 - - 2.2 < 1.0 36 - 0.502 12.8 -
(Cont'd) TUTT POND-180404 2018 04 04 8.68 792 8 6.6 1,970 2,158 1,390 63.3 - 1.93 0.0069 - 476 135 11 < 10 11.2 141 720 409 401 74.8 < 1.0 37.4 - 1.92 0.24 73 0.0069 - 14.3 0.388
TUTT POND-180417 2018 04 17 8.64 799 8.66 9.3 2,080 2,184 1,470 22.7 - 12.6 < 0.0050 - 510 39 4,930 < 10 4,930 145 570 443 449 61.2 < 1.0 30.6 - 7.67 0.18 34 < 0.0050 - 11.0 0.0651
TUTT POND-180503 2018 05 03 8.62 681 8.02 6.1 1,740 1,539 1,110 < 5.0 - 3.13 0.0240 - 475 442 584 22 606 157 650 225 413 61.2 < 1.0 30.6 - 2.52 < 0.10 24 0.0240 - 10.6 0.0873
TUTT POND-180523 2018 05 23 8.46 708 8.49 22.4 1,930 1,987 1,210 < 2.0 - 2.11 0.0578 - 530 161 803 65 868 182 540 276 500 30.3 < 1.0 15.2 - 1.24 < 0.10 < 20 0.0578 - 9.64 0.227
TUTT POND-180615 2018 06 15 8.46 831 8.83 17.9 2,140 1,821 1,420 7.3 - 2.15 0.0180 - 573 78 225 32 256 174 930 364 539 33.7 < 1.0 16.9 - 1.89 0.21 44 0.0180 - 10.6 0.232
TUTT POND-180712 2018 07 12 8.82 748 9.04 23.7 2,050 1,902 1,410 3.0 - 1.01 0.0821 - 586 46 < 100 < 10 < 100 160 830 354 433 152 < 1.0 76.2 - 1.01 < 1.00 32 0.0821 - 11.6 0.197
TUTT POND-180906 2018 09 06 8.64 857 8.9 18.7 2,300 228.3 1,620 15.2 - 1.46 < 0.0500 - 527 337 157 < 100 157 177 1,280 507 441 85.9 < 1.0 42.9 - 1.30 < 1.00 49 < 0.0500 - 14.2 0.362
TUTT POND-181107 2018 11 07 8.39 909 8.37 7.9 2,150 1,882 1,400 8.4 - 1.71 0.132 - 586 297 500 53 552 175 790 504 562 23.9 < 1.0 11.9 - 1.16 < 1.00 39 0.132 - 11.1 0.322
Tutt Pond 2019 03 29 8.22 792 8.33 9.00 1,940 1,618 1,230 12.3 - 2.50 0.230 1,053 498 248 1,180 23 1,200 136 600 396 - < 1.0 < 1.0 < 1.0 498 1.30 0.13 28 0.230 - 7.49 0.472
Tutt Pond 2019 05 06 8.47 975 8.5 17.3 2,400 2,076 1,660 5.4 - 1.02 0.0646 1,352 628 191 64 12 75.3 192 650 636 582 46.6 < 1.0 23.3 - 0.944 0.16 45 0.0646 - 9.54 0.233
Tutt Pond 2019 06 05 8.69 865 8.67 21.6 2,260 2,031 1,690 4.6 - 1.27 0.0075 1,320 664 94 174 14 188 182 740 484 525 139 < 1.0 69.6 - 1.08 < 0.10 31 0.0075 - 9.46 0.330
Tutt Pond 2019 09 04 8.76 912 8.84 21.3 2,500 2,312 1,660 10.7 12.1 1.37 - 1,501.5 680 181 < 10 < 10 < 10.0 202 870 565 510 170 < 1.0 85.1 - 1.37 < 0.10 52 - 0.0082 13.0 0.343
Tutt Pond 2019 10 23 8.48 1,040 8.76 9.3 2,860 2,818 2,080 3.0 11.3 1.74 - 1,833 688 669 44 42 86.6 211 820 723 688 < 1.0 < 1.0 < 1.0 - 1.65 < 0.10 32 - 0.0988 11.3 0.494
TUTTPOND-200407 2020 04 07 8.40 842 8.95 8 2,330 2,032 1,630 4.4 8.99 1.02 - - 551 132 15 < 10 14.8 199 690 536 523 28.4 < 1.0 14.2 - 1.00 < 0.10 29 - 0.0128 9.20 0.124
TUTTPOND-200605 2020 06 05 8.68 819 8.72 19.1 2,140 1,981 1,560 3.4 10.5 0.947 - - 608 < 50 < 10 < 10 < 10.0 189 640 442 468 140 < 1.0 70.1 - 0.947 0.16 35 - 0.0982 11.0 0.312
TUTTPOND-200918 2020 09 18 8.58 917 8.7 19.1 2,520 2,688 2,050 3.0 16.2 1.38 - - 665 226 < 10 < 10 - 212 840 591 558 108 < 1.0 53.8 - 1.38 < 1.00 53 - 0.0431 16.4 0.306
TUTTPOND-201028 2020 10 28 8.12 1,130 8.07 6.1 3,050 3,131 2,040 9.3 19.4 3.16 - - 748 1,590 10 < 10 10.2 227 790 788 748 < 1.0 < 1.0 < 1.0 - 3.14 0.26 48 - < 0.0050 19.4 0.935
BUBNA SLOUGH Bubna Slough-20150616 2015 06 16 - 1,280 - - 4,340 - 3,250 12.8 - - - - 857 26.2 < 250 - - 1,000 < 1,000 623 693 165 < 1.0 - - 2.52 < 2.5 145 - < 0.0010 43.9 -
BUBNA DISCHARGE-180420 2018 04 20 8.29 858 - - 2,810 - 1,900 3.5 - 1.33 < 0.0050 - 548 30 < 10 < 10 < 10.0 555 320 214 548 < 1.0 < 1.0 < 1.0 - 1.33 < 0.10 75 < 0.0050 - 20.6 0.0457
BUBNA DISCHARGE-180503 2018 05 03 8.56 963 8.08 15.6 2,920 2,584 1,850 5.7 - 1.41 < 0.0050 - 561 56 < 1,000 < 10 < 1,000 476 360 170 495 65.7 < 1.0 32.9 - 1.41 < 0.10 69 < 0.0050 - 24.1 0.0172
BUBNA DISCHARGE-180615 2018 06 15 8.91 940 9.06 15.7 2,950 2,484 5,980 3.8 - 1.97 < 0.0050 - 516 23 < 10 < 10 < 10.0 542 410 201 355 161 < 1.0 80.3 - 1.97 0.19 87 < 0.0050 - 27.6 0.0325
BUBNA SLOUGH-181108 2018 11 08 8.36 1,110 8.43 3.1 3,330 3,359 2,200 4.7 - 1.32 < 0.0500 - 661 38 < 100 < 100 < 100 630 < 1,000 268 639 21.6 < 1.0 10.8 - 1.32 < 1.00 75 < 0.0500 - 24.5 0.0336
Bubna 2019 03 29 8.39 300 8.56 10.9 1,060 866 559 5.0 - 0.760 < 0.0050 565.5 218 41 < 10 < 10 < 10.0 173 150 58.8 - 5.8 < 1.0 2.9 212 0.760 < 0.10 27 < 0.0050 - 6.68 0.0417
Bubna 2019 05 06 8.71 961 8.41 19.2 3,050 2,559 1,790 16.0 - 1.57 < 0.0050 1,664 646 90 < 10 < 10 < 10.0 573 340 207 514 132 < 1.0 66.1 - 1.57 0.13 74 < 0.0050 - 27.9 0.0372
BUBNASLOUGH-200407 2020 04 07 8.33 819 8.66 8.7 2,620 2,431 1,710 2.8 20.9 1.02 - - 502 < 50 < 10 < 10 < 10.0 506 320 158 489 12.3 < 1.0 6.2 - 1.02 < 0.10 53 - < 0.0050 21.2 0.0165
BUBNASLOUGH-200605 2020 06 05 8.44 724 8.44 19.8 2,690 2,573 1,790 3.8 24.7 1.36 - - 627 78 < 10 < 10 < 10.0 540 320 166 572 54.7 < 1.0 27.4 - 1.36 < 0.10 66 - < 0.0050 25.3 0.0216
BUBNASLOUGH-200928 2020 09 28 8.28 897 7.97 14.9 3,200 3,317 2,070 2.6 21.3 1.66 - - 655 285 < 100 < 100 - 635 < 1,000 213 655 < 1.0 < 1.0 < 1.0 - 1.66 < 1.00 62 - < 0.0500 30.2 0.0156
BUBNASLOUGH-201029 2020 10 29 8.29 888 8.32 4.3 3,230 3,248 1,710 3.8 23.0 2.00 - - 692 637 < 100 < 100 < 100 518 < 1,000 204 692 < 1.0 < 1.0 < 1.0 - 2.00 < 1.00 121 - < 0.0500 25.0 0.0222
SLOUGH #2 SLOUGH #2-200407 2020 04 07 8.58 590 - - 4,260 - 2,950 4.8 36.8 2.53 - 2,950 671 339 12 < 10 11.9 492 630 897 586 85.4 < 1.0 42.7 - 2.52 0.95 96 - < 0.0050 37.3 0.0690
SLOUGH #2-200605 2020 06 05 9.00 506 - - 4,230 - 3,070 6.4 49.5 2.85 - 3,070 766 < 50 < 10 < 10 < 10.0 512 660 933 487 278 < 1.0 139 - 2.85 < 10.0 142 - < 0.0050 52.0 0.0660
SLOUGH #2-200917 2020 09 17 8.70 811 - - 5,320 - 3,880 4.0 46.4 3.21 - 3,880 841 550 < 10 < 10 - 623 830 1,180 677 164 < 1.0 82.2 - 3.21 < 0.10 133 - < 0.0050 48.3 0.0714
SLOUGH #2-201029 2020 10 29 8.51 657 - - 5,420 - 3,580 2.4 46.4 3.61 - 3,580 862 1,160 < 100 < 100 < 100 617 < 1,000 1,190 782 79.7 < 1.0 39.8 - 3.61 1.68 110 - < 0.0500 48.4 0.0398
LITTLE ROBERT LK Little Robert Lake-20150616 2015 06 16 - 990 - - 3,340 - 2,750 22.4 - - - - 782 36.7 < 100 - - 86 < 400 1,570 531 252 < 1.0 - - 2.79 < 1.0 104 - 1.18 34.6 -
LITTLE ROBERT'S LAKE-20160921 2016 09 21 8.45 1,200 - - 4,400 - 3,680 5.3 - - - - 934 - 160 - - 102 410 1,860 - - - - - - < 1.0 - - - 30.9 -
LITTLE ROBERT LK-180417 2018 04 17 8.73 1,240 8.92 11 3,780 3,334 3,140 21.5 - 1.83 1.32 - 626 54 < 10 < 10 < 10.0 76.5 310 1,490 495 130 < 1.0 65.2 - 1.83 0.16 59 1.32 - 46.6 1.43
LITTLE ROBERT LK-180503 2018 05 03 8.56 763 8.34 17.2 2,000 1,779 1,450 4.3 - 1.67 0.150 - 511 173 442 22 464 151 650 400 465 46.5 < 1.0 23.3 - 1.20 < 0.10 37 0.150 - 14.2 0.448
LITTLE ROBERT LK-180615 2018 06 15 8.51 855 9.19 17.1 2,140 1,940 1,470 12.7 - 1.71 < 0.0500 - 590 53 405 < 10 405 172 880 403 543 47.1 < 1.0 23.6 - 1.30 0.24 42 < 0.0500 - 16.0 0.235
Little Robert Lk 2019 05 06 8.67 1,170 8.59 18.7 3,060 2,656 2,350 4.7 - 1.29 0.413 1,722 690 113 132 13 146 154 590 1,030 563 128 < 1.0 63.8 - 1.15 0.19 38 0.413 - 15.6 0.865
Little Robert Lk 2019 06 05 9.02 987 8.84 22.3 2,690 2,335 2,010 3.8 - 1.32 0.209 1,531 637 84 < 100 < 100 < 100 181 < 1,000 749 384 253 < 1.0 127 - 1.32 < 1.00 36 0.209 - 12.7 0.787
Little Robert Lk 2019 09 04 8.98 1,110 8.19 25 3,100 3,090 2,160 4.4 23.7 1.82 - 2,008.5 745 45 < 100 < 100 < 100 165 < 1,000 972 478 267 < 1.0 133 - 1.82 < 1.00 49 - 0.387 25.5 1.16
LITTLEROBERTLAKE-200928 2020 09 28 8.72 1,330 8.76 14.2 4,350 4,285 3,490 153 24.0 2.85 - - 675 211 < 100 < 100 - 115 < 1,000 1,720 520 155 < 1.0 77.7 - 2.85 < 1.00 93 - 0.564 27.2 1.50
LITTLEROBERTLAKE-201029 2020 10 29 8.50 1,300 8.71 5 4,150 4,187 3,210 6.4 19.5 2.65 - - 697 440 309 < 100 309 103 < 1,000 1,540 621 75.8 < 1.0 37.9 - 2.34 < 1.00 52 - 0.618 23.3 1.58
LTTILEROBERTLAKE-200605 2020 06 05 8.86 1,240 8.97 20.5 3,520 3,393 3,040 8.8 23.5 1.78 - - 648 < 50 < 10 < 10 < 10.0 116 430 1,630 414 234 < 1.0 117 - 1.78 < 1.00 50 - 0.604 25.7 0.592
Associated CARO file(s): 8040426, 8041402, 8041784, 8050436, 8052167, 8061543, 8071280, 8090442, 8110640, 8110821, 9032473, 9050543, 9060474, 9090312, N000861, 0040546, 0060737, 0091922, 20J3095.
All terms defined within the body of SNC-Lavalin's report.
< Denotes concentration less than indicated detection limit or RPD less than indicated value.a Laboratory detection limit exceeds regulatory standard/guideline.
- Denotes analysis not conducted.b Guideline to protect freshwater aquatic life, long-term average (i.e. "chronic").
n/a Denotes no applicable standard/guideline.c Guideline to protect freshwater aquatic life, short-term maximum (i.e. "acute").
QA/QC RPD Denotes quality assurance/quality control relative percent differenced Guideline to protect irrigation watering.
* RPDs are not calculated where one or more concentrations are less than five times RDL.e Standard for groundwater, shown here for comparison purposes only.
RDL Denotes reported detection limit.f guideline varies with pH and temperature.j Conductivity guidelines varies with crop. Guideline range 700-5,000, most stringent guideline for low tolerance crops applied (strawberry, raspberry, bean and carrot.
BOLD Concentration greater than BCWQG Aquatic Life Long-Term Average (AW) guidelinek Standard/Guideline varies with chloride
BOLD Concentration greater than BCWQG Aquatic Life Short-term Maximum (AW) guideline
SHADED Concentration greater than BCWQG Irrigation Water (IW) guideline
RED Concentration greater than CSR Irrigation Watering (IW) standard
SNC-LAVALIN INC. Page 4 of 5
662036 / 2021 02 0920210309_662036_TAB_Historical.xlsx
QAQC CN 2021 03 09
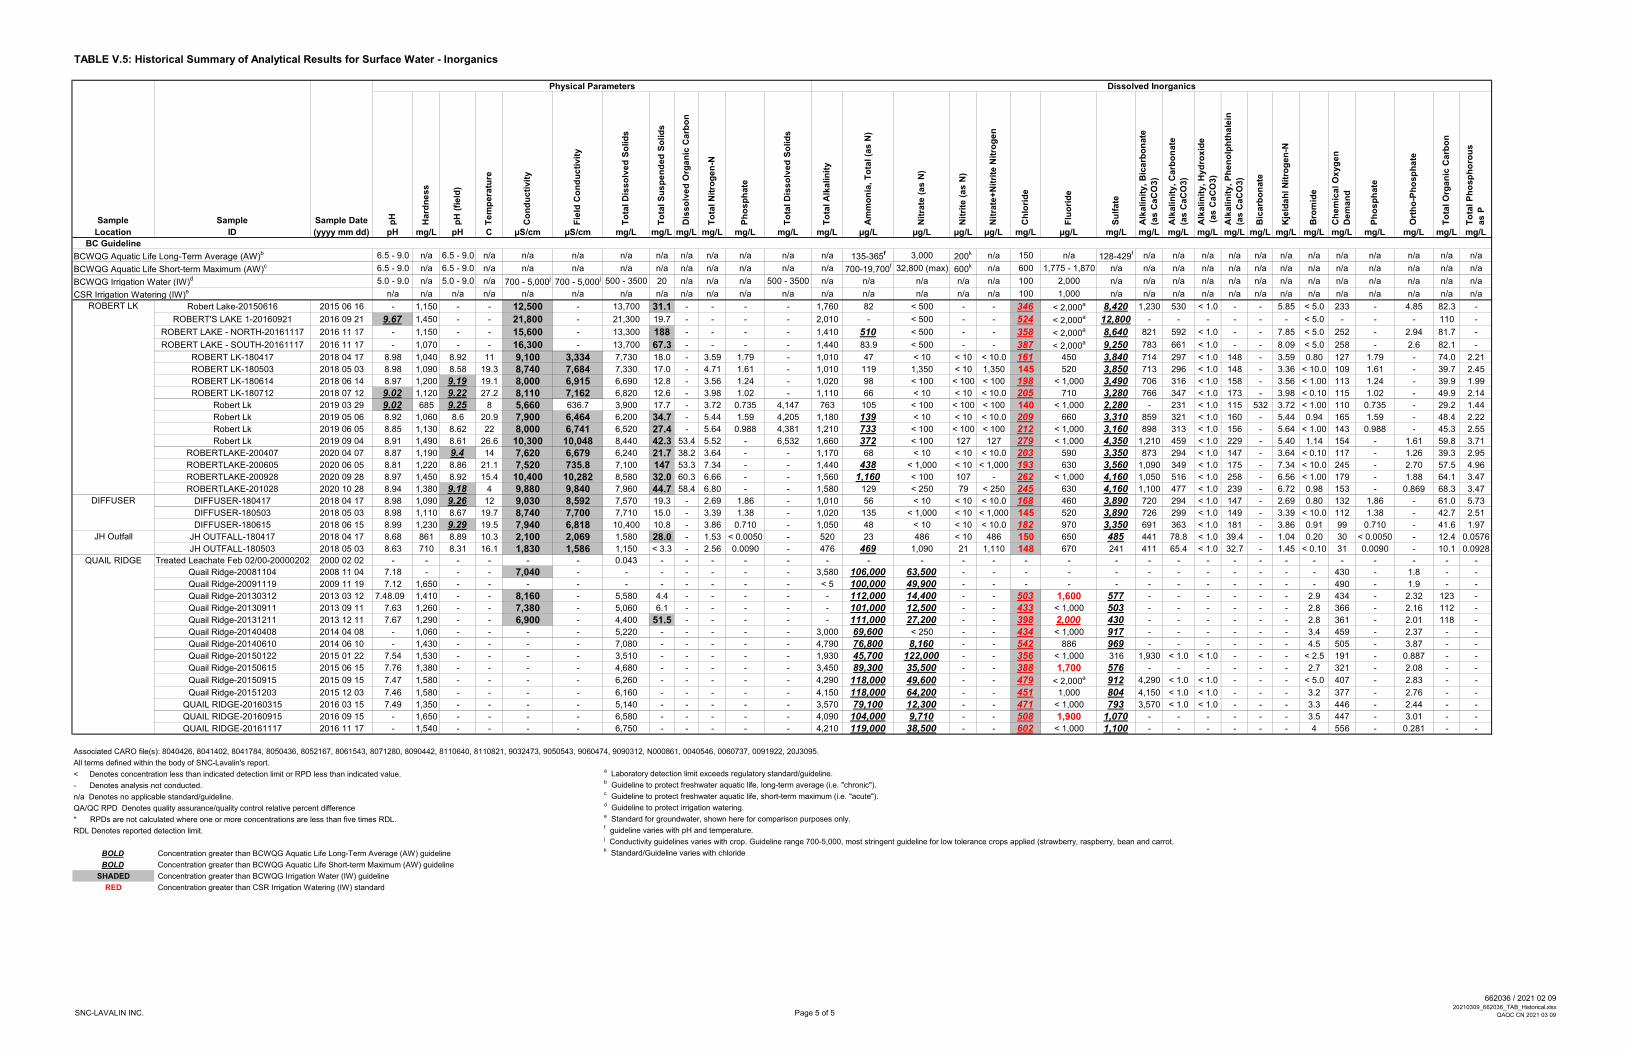
TABLE V.5: Historical Summary of Analytical Results for Surface Water - Inorganics
Physical Parameters Dissolved Inorganics
Sample Sample Sample Date pH
Ha
rdn
ess
pH
(fi
eld
)
Te
mp
era
ture
Co
nd
uc
tivit
y
Fie
ld C
on
du
cti
vit
y
To
tal D
iss
olv
ed
So
lid
s
To
tal S
us
pe
nd
ed
So
lid
s
Dis
so
lve
d O
rga
nic
Ca
rbo
n
To
tal N
itro
ge
n-N
Ph
os
ph
ate
To
tal D
iss
olv
ed
So
lid
s
To
tal A
lka
lin
ity
Am
mo
nia
, T
ota
l (a
s N
)
Nit
rate
(as
N)
Nit
rite
(as
N)
Nit
rate
+N
itri
te N
itro
ge
n
Ch
lori
de
Flu
ori
de
Su
lfate
Alk
alin
ity, B
ica
rbo
nate
(as
Ca
CO
3)
Alk
alin
ity, C
arb
on
ate
(as
Ca
CO
3)
Alk
alin
ity, H
yd
rox
ide
(as
Ca
CO
3)
Alk
alin
ity, P
he
no
lph
tha
lein
(as
Ca
CO
3)
Bic
arb
on
ate
Kje
lda
hl N
itro
gen
-N
Bro
mid
e
Ch
em
ica
l O
xyg
en
De
ma
nd
Ph
os
ph
ate
Ort
ho
-Ph
osp
ha
te
To
tal O
rga
nic
Ca
rbo
n
To
tal P
ho
sp
ho
rou
s
as
P
Location ID (yyyy mm dd) pH mg/L pH C µS/cm µS/cm mg/L mg/L mg/L mg/L mg/L mg/L mg/L µg/L µg/L µg/L µg/L mg/L µg/L mg/L mg/L mg/L mg/L mg/L mg/L mg/L mg/L mg/L mg/L mg/L mg/L mg/L
BC Guideline
BCWQG Aquatic Life Long-Term Average (AW)b 6.5 - 9.0 n/a 6.5 - 9.0 n/a n/a n/a n/a n/a n/a n/a n/a n/a n/a 135-365f 3,000 200k n/a 150 n/a 128-429f n/a n/a n/a n/a n/a n/a n/a n/a n/a n/a n/a n/a
BCWQG Aquatic Life Short-term Maximum (AW)c 6.5 - 9.0 n/a 6.5 - 9.0 n/a n/a n/a n/a n/a n/a n/a n/a n/a n/a 700-19,700f 32,800 (max) 600k n/a 600 1,775 - 1,870 n/a n/a n/a n/a n/a n/a n/a n/a n/a n/a n/a n/a n/a
BCWQG Irrigation Water (IW)d 5.0 - 9.0 n/a 5.0 - 9.0 n/a 700 - 5,000j 700 - 5,000j 500 - 3500 20 n/a n/a n/a 500 - 3500 n/a n/a n/a n/a n/a 100 2,000 n/a n/a n/a n/a n/a n/a n/a n/a n/a n/a n/a n/a n/a
CSR Irrigation Watering (IW)e n/a n/a n/a n/a n/a n/a n/a n/a n/a n/a n/a n/a n/a n/a n/a n/a n/a 100 1,000 n/a n/a n/a n/a n/a n/a n/a n/a n/a n/a n/a n/a n/a
ROBERT LK Robert Lake-20150616 2015 06 16 - 1,150 - - 12,500 - 13,700 31.1 - - - - 1,760 82 < 500 - - 346 < 2,000a 8,420 1,230 530 < 1.0 - - 5.85 < 5.0 233 - 4.85 82.3 -
ROBERT'S LAKE 1-20160921 2016 09 21 9.67 1,450 - - 21,800 - 21,300 19.7 - - - - 2,010 - < 500 - - 524 < 2,000a 12,800 - - - - - - < 5.0 - - - 110 -
ROBERT LAKE - NORTH-20161117 2016 11 17 - 1,150 - - 15,600 - 13,300 188 - - - - 1,410 510 < 500 - - 358 < 2,000a 8,640 821 592 < 1.0 - - 7.85 < 5.0 252 - 2.94 81.7 -
ROBERT LAKE - SOUTH-20161117 2016 11 17 - 1,070 - - 16,300 - 13,700 67.3 - - - - 1,440 83.9 < 500 - - 387 < 2,000a 9,250 783 661 < 1.0 - - 8.09 < 5.0 258 - 2.6 82.1 -
ROBERT LK-180417 2018 04 17 8.98 1,040 8.92 11 9,100 3,334 7,730 18.0 - 3.59 1.79 - 1,010 47 < 10 < 10 < 10.0 161 450 3,840 714 297 < 1.0 148 - 3.59 0.80 127 1.79 - 74.0 2.21
ROBERT LK-180503 2018 05 03 8.98 1,090 8.58 19.3 8,740 7,684 7,330 17.0 - 4.71 1.61 - 1,010 119 1,350 < 10 1,350 145 520 3,850 713 296 < 1.0 148 - 3.36 < 10.0 109 1.61 - 39.7 2.45
ROBERT LK-180614 2018 06 14 8.97 1,200 9.19 19.1 8,000 6,915 6,690 12.8 - 3.56 1.24 - 1,020 98 < 100 < 100 < 100 198 < 1,000 3,490 706 316 < 1.0 158 - 3.56 < 1.00 113 1.24 - 39.9 1.99
ROBERT LK-180712 2018 07 12 9.02 1,120 9.22 27.2 8,110 7,162 6,820 12.6 - 3.98 1.02 - 1,110 66 < 10 < 10 < 10.0 205 710 3,280 766 347 < 1.0 173 - 3.98 < 0.10 115 1.02 - 49.9 2.14
Robert Lk 2019 03 29 9.02 685 9.25 8 5,660 636.7 3,900 17.7 - 3.72 0.735 4,147 763 105 < 100 < 100 < 100 140 < 1,000 2,280 - 231 < 1.0 115 532 3.72 < 1.00 110 0.735 - 29.2 1.44
Robert Lk 2019 05 06 8.92 1,060 8.6 20.9 7,900 6,464 6,200 34.7 - 5.44 1.59 4,205 1,180 139 < 10 < 10 < 10.0 209 660 3,310 859 321 < 1.0 160 - 5.44 0.94 165 1.59 - 48.4 2.22
Robert Lk 2019 06 05 8.85 1,130 8.62 22 8,000 6,741 6,520 27.4 - 5.64 0.988 4,381 1,210 733 < 100 < 100 < 100 212 < 1,000 3,160 898 313 < 1.0 156 - 5.64 < 1.00 143 0.988 - 45.3 2.55
Robert Lk 2019 09 04 8.91 1,490 8.61 26.6 10,300 10,048 8,440 42.3 53.4 5.52 - 6,532 1,660 372 < 100 127 127 279 < 1,000 4,350 1,210 459 < 1.0 229 - 5.40 1.14 154 - 1.61 59.8 3.71
ROBERTLAKE-200407 2020 04 07 8.87 1,190 9.4 14 7,620 6,679 6,240 21.7 38.2 3.64 - - 1,170 68 < 10 < 10 < 10.0 203 590 3,350 873 294 < 1.0 147 - 3.64 < 0.10 117 - 1.26 39.3 2.95
ROBERTLAKE-200605 2020 06 05 8.81 1,220 8.86 21.1 7,520 735.8 7,100 147 53.3 7.34 - - 1,440 438 < 1,000 < 10 < 1,000 193 630 3,560 1,090 349 < 1.0 175 - 7.34 < 10.0 245 - 2.70 57.5 4.96
ROBERTLAKE-200928 2020 09 28 8.97 1,450 8.92 15.4 10,400 10,282 8,580 32.0 60.3 6.66 - - 1,560 1,160 < 100 107 - 262 < 1,000 4,160 1,050 516 < 1.0 258 - 6.56 < 1.00 179 - 1.88 64.1 3.47
ROBERTLAKE-201028 2020 10 28 8.94 1,380 9.18 4 9,880 9,840 7,960 44.7 58.4 6.80 - - 1,580 129 < 250 79 < 250 245 630 4,160 1,100 477 < 1.0 239 - 6.72 0.98 153 - 0.869 68.3 3.47
DIFFUSER DIFFUSER-180417 2018 04 17 8.98 1,090 9.26 12 9,030 8,592 7,570 19.3 - 2.69 1.86 - 1,010 56 < 10 < 10 < 10.0 168 460 3,890 720 294 < 1.0 147 - 2.69 0.80 132 1.86 - 61.0 5.73
DIFFUSER-180503 2018 05 03 8.98 1,110 8.67 19.7 8,740 7,700 7,710 15.0 - 3.39 1.38 - 1,020 135 < 1,000 < 10 < 1,000 145 520 3,890 726 299 < 1.0 149 - 3.39 < 10.0 112 1.38 - 42.7 2.51
DIFFUSER-180615 2018 06 15 8.99 1,230 9.29 19.5 7,940 6,818 10,400 10.8 - 3.86 0.710 - 1,050 48 < 10 < 10 < 10.0 182 970 3,350 691 363 < 1.0 181 - 3.86 0.91 99 0.710 - 41.6 1.97
JH Outfall JH OUTFALL-180417 2018 04 17 8.68 861 8.89 10.3 2,100 2,069 1,580 28.0 - 1.53 < 0.0050 - 520 23 486 < 10 486 150 650 485 441 78.8 < 1.0 39.4 - 1.04 0.20 30 < 0.0050 - 12.4 0.0576
JH OUTFALL-180503 2018 05 03 8.63 710 8.31 16.1 1,830 1,586 1,150 < 3.3 - 2.56 0.0090 - 476 469 1,090 21 1,110 148 670 241 411 65.4 < 1.0 32.7 - 1.45 < 0.10 31 0.0090 - 10.1 0.0928
QUAIL RIDGE Treated Leachate Feb 02/00-20000202 2000 02 02 - - - - - - 0.043 - - - - - - - - - - - - - - - - - - - - - - - - -
Quail Ridge-20081104 2008 11 04 7.18 - - - 7,040 - - - - - - - 3,580 106,000 63,500 - - - - - - - - - - - - 430 - 1.8 - -
Quail Ridge-20091119 2009 11 19 7.12 1,650 - - - - - - - - - - < 5 100,000 49,900 - - - - - - - - - - - - 490 - 1.9 - -
Quail Ridge-20130312 2013 03 12 7.48.09 1,410 - - 8,160 - 5,580 4.4 - - - - - 112,000 14,400 - - 503 1,600 577 - - - - - - 2.9 434 - 2.32 123 -
Quail Ridge-20130911 2013 09 11 7.63 1,260 - - 7,380 - 5,060 6.1 - - - - - 101,000 12,500 - - 433 < 1,000 503 - - - - - - 2.8 366 - 2.16 112 -
Quail Ridge-20131211 2013 12 11 7.67 1,290 - - 6,900 - 4,400 51.5 - - - - - 111,000 27,200 - - 398 2,000 430 - - - - - - 2.8 361 - 2.01 118 -
Quail Ridge-20140408 2014 04 08 - 1,060 - - - - 5,220 - - - - - 3,000 69,600 < 250 - - 434 < 1,000 917 - - - - - - 3.4 459 - 2.37 - -
Quail Ridge-20140610 2014 06 10 - 1,430 - - - - 7,080 - - - - - 4,790 76,800 8,160 - - 542 886 969 - - - - - - 4.5 505 - 3.87 - -
Quail Ridge-20150122 2015 01 22 7.54 1,530 - - - - 3,510 - - - - - 1,930 45,700 122,000 - - 356 < 1,000 316 1,930 < 1.0 < 1.0 - - - < 2.5 191 - 0.887 - -
Quail Ridge-20150615 2015 06 15 7.76 1,380 - - - - 4,680 - - - - - 3,450 89,300 35,500 - - 388 1,700 576 - - - - - - 2.7 321 - 2.08 - -
Quail Ridge-20150915 2015 09 15 7.47 1,580 - - - - 6,260 - - - - - 4,290 118,000 49,600 - - 479 < 2,000a 912 4,290 < 1.0 < 1.0 - - - < 5.0 407 - 2.83 - -
Quail Ridge-20151203 2015 12 03 7.46 1,580 - - - - 6,160 - - - - - 4,150 118,000 64,200 - - 451 1,000 804 4,150 < 1.0 < 1.0 - - - 3.2 377 - 2.76 - -
QUAIL RIDGE-20160315 2016 03 15 7.49 1,350 - - - - 5,140 - - - - - 3,570 79,100 12,300 - - 471 < 1,000 793 3,570 < 1.0 < 1.0 - - - 3.3 446 - 2.44 - -
QUAIL RIDGE-20160915 2016 09 15 - 1,650 - - - - 6,580 - - - - - 4,090 104,000 9,710 - - 508 1,900 1,070 - - - - - - 3.5 447 - 3.01 - -
QUAIL RIDGE-20161117 2016 11 17 - 1,540 - - - - 6,750 - - - - - 4,210 119,000 38,500 - - 602 < 1,000 1,100 - - - - - - 4 556 - 0.281 - -
Associated CARO file(s): 8040426, 8041402, 8041784, 8050436, 8052167, 8061543, 8071280, 8090442, 8110640, 8110821, 9032473, 9050543, 9060474, 9090312, N000861, 0040546, 0060737, 0091922, 20J3095.
All terms defined within the body of SNC-Lavalin's report.
< Denotes concentration less than indicated detection limit or RPD less than indicated value.a Laboratory detection limit exceeds regulatory standard/guideline.
- Denotes analysis not conducted.b Guideline to protect freshwater aquatic life, long-term average (i.e. "chronic").
n/a Denotes no applicable standard/guideline.c Guideline to protect freshwater aquatic life, short-term maximum (i.e. "acute").
QA/QC RPD Denotes quality assurance/quality control relative percent differenced Guideline to protect irrigation watering.
* RPDs are not calculated where one or more concentrations are less than five times RDL.e Standard for groundwater, shown here for comparison purposes only.
RDL Denotes reported detection limit.f guideline varies with pH and temperature.j Conductivity guidelines varies with crop. Guideline range 700-5,000, most stringent guideline for low tolerance crops applied (strawberry, raspberry, bean and carrot.
BOLD Concentration greater than BCWQG Aquatic Life Long-Term Average (AW) guidelinek Standard/Guideline varies with chloride
BOLD Concentration greater than BCWQG Aquatic Life Short-term Maximum (AW) guideline
SHADED Concentration greater than BCWQG Irrigation Water (IW) guideline
RED Concentration greater than CSR Irrigation Watering (IW) standard
SNC-LAVALIN INC. Page 5 of 5
662036 / 2021 02 0920210309_662036_TAB_Historical.xlsx
QAQC CN 2021 03 09
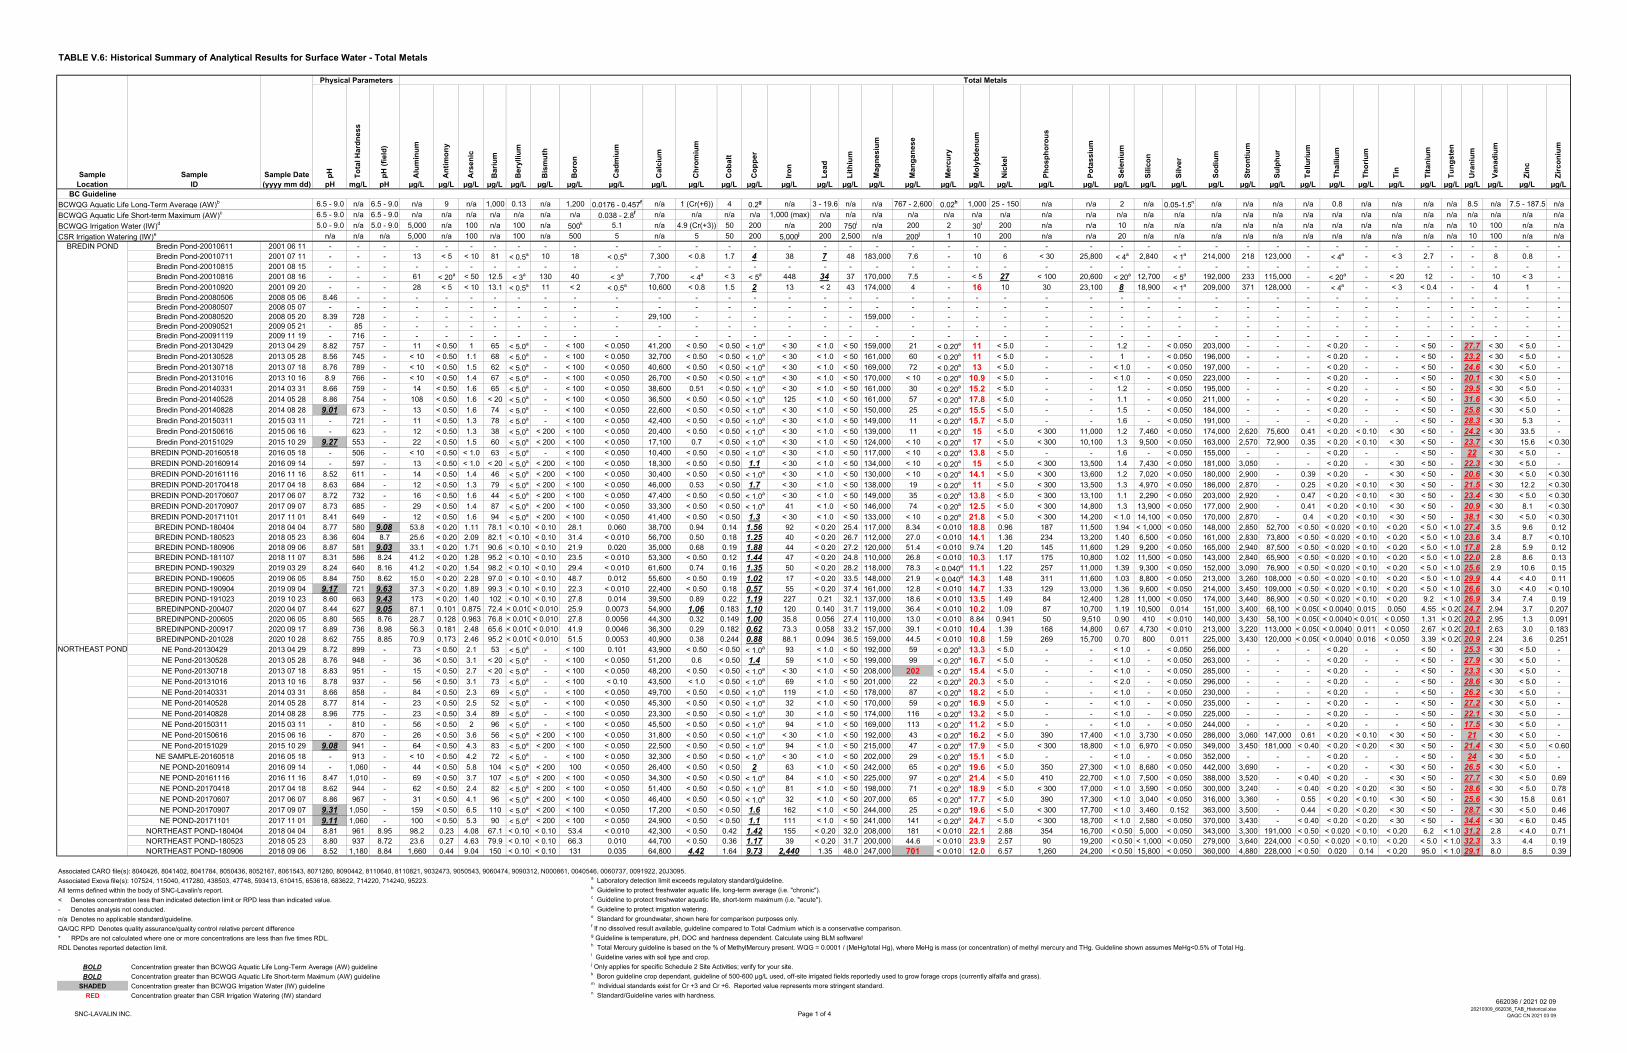
TABLE V.6: Historical Summary of Analytical Results for Surface Water - Total Metals
Physical Parameters Total Metals
Sample Sample Sample Date pH
To
tal H
ard
ness
pH
(fi
eld
)
Alu
min
um
An
tim
on
y
Ars
en
ic
Bari
um
Bery
lliu
m
Bis
mu
th
Bo
ron
Cad
miu
m
Calc
ium
Ch
rom
ium
Co
balt
Co
pp
er
Iro
n
Lead
Lit
hiu
m
Mag
nesiu
m
Man
gan
ese
Merc
ury
Mo
lyb
den
um
Nic
kel
Ph
osp
ho
rou
s
Po
tassiu
m
Sele
niu
m
Silic
on
Silver
So
diu
m
Str
on
tiu
m
Su
lph
ur
Tellu
riu
m
Th
alliu
m
Th
ori
um
Tin
Tit
an
ium
Tu
ng
ste
n
Ura
niu
m
Van
ad
ium
Zin
c
Zir
co
niu
m
Location ID (yyyy mm dd) pH mg/L pH µg/L µg/L µg/L µg/L µg/L µg/L µg/L µg/L µg/L µg/L µg/L µg/L µg/L µg/L µg/L µg/L µg/L µg/L µg/L µg/L µg/L µg/L µg/L µg/L µg/L µg/L µg/L µg/L µg/L µg/L µg/L µg/L µg/L µg/L µg/L µg/L µg/L µg/L
BC Guideline
BCWQG Aquatic Life Long-Term Average (AW)b 6.5 - 9.0 n/a 6.5 - 9.0 n/a 9 n/a 1,000 0.13 n/a 1,200 0.0176 - 0.457f n/a 1 (Cr(+6)) 4 0.2g n/a 3 - 19.6 n/a n/a 767 - 2,600 0.02h 1,000 25 - 150 n/a n/a 2 n/a 0.05-1.5n n/a n/a n/a n/a 0.8 n/a n/a n/a n/a 8.5 n/a 7.5 - 187.5 n/a
BCWQG Aquatic Life Short-term Maximum (AW)c 6.5 - 9.0 n/a 6.5 - 9.0 n/a n/a n/a n/a n/a n/a n/a 0.038 - 2.8f n/a n/a n/a n/a 1,000 (max) n/a n/a n/a n/a n/a n/a n/a n/a n/a n/a n/a n/a n/a n/a n/a n/a n/a n/a n/a n/a n/a n/a n/a n/a n/a
BCWQG Irrigation Water (IW)d 5.0 - 9.0 n/a 5.0 - 9.0 5,000 n/a 100 n/a 100 n/a 500k 5.1 n/a 4.9 (Cr(+3)) 50 200 n/a 200 750i n/a 200 2 30i 200 n/a n/a 10 n/a n/a n/a n/a n/a n/a n/a n/a n/a n/a n/a 10 100 n/a n/a
CSR Irrigation Watering (IW)e n/a n/a n/a 5,000 n/a 100 n/a 100 n/a 500 5 n/a 5 50 200 5,000j 200 2,500 n/a 200j 1 10 200 n/a n/a 20 n/a n/a n/a n/a n/a n/a n/a n/a n/a n/a n/a 10 100 n/a n/a
BREDIN POND Bredin Pond-20010611 2001 06 11 - - - - - - - - - - - - - - - - - - - - - - - - - - - - - - - - - - - - - - - - -
Bredin Pond-20010711 2001 07 11 - - - 13 < 5 < 10 81 < 0.5a 10 18 < 0.5a 7,300 < 0.8 1.7 4 38 7 48 183,000 7.6 - 10 6 < 30 25,800 < 4a 2,840 < 1a 214,000 218 123,000 - < 4a - < 3 2.7 - - 8 0.8 -
Bredin Pond-20010815 2001 08 15 - - - - - - - - - - - - - - - - - - - - - - - - - - - - - - - - - - - - - - - - -
Bredin Pond-20010816 2001 08 16 - - - 61 < 20a < 50 12.5 < 3a 130 40 < 3a 7,700 < 4a < 3 < 5a 448 34 37 170,000 7.5 - < 5 27 < 100 20,600 < 20a 12,700 < 5a 192,000 233 115,000 - < 20a - < 20 12 - - 10 < 3 -
Bredin Pond-20010920 2001 09 20 - - - 28 < 5 < 10 13.1 < 0.5a 11 < 2 < 0.5a 10,600 < 0.8 1.5 2 13 < 2 43 174,000 4 - 16 10 30 23,100 8 18,900 < 1a 209,000 371 128,000 - < 4a - < 3 < 0.4 - - 4 1 -
Bredin Pond-20080506 2008 05 06 8.46 - - - - - - - - - - - - - - - - - - - - - - - - - - - - - - - - - - - - - - - -
Bredin Pond-20080507 2008 05 07 - - - - - - - - - - - - - - - - - - - - - - - - - - - - - - - - - - - - - - - - -
Bredin Pond-20080520 2008 05 20 8.39 728 - - - - - - - - - 29,100 - - - - - - 159,000 - - - - - - - - - - - - - - - - - - - - - -
Bredin Pond-20090521 2009 05 21 - 85 - - - - - - - - - - - - - - - - - - - - - - - - - - - - - - - - - - - - - - -
Bredin Pond-20091119 2009 11 19 - 716 - - - - - - - - - - - - - - - - - - - - - - - - - - - - - - - - - - - - - - -
Bredin Pond-20130429 2013 04 29 8.82 757 - 11 < 0.50 1 65 < 5.0a - < 100 < 0.050 41,200 < 0.50 < 0.50 < 1.0a < 30 < 1.0 < 50 159,000 21 < 0.20a 11 < 5.0 - - 1.2 - < 0.050 203,000 - - - < 0.20 - - < 50 - 27.7 < 30 < 5.0 -
Bredin Pond-20130528 2013 05 28 8.56 745 - < 10 < 0.50 1.1 68 < 5.0a - < 100 < 0.050 32,700 < 0.50 < 0.50 < 1.0a < 30 < 1.0 < 50 161,000 60 < 0.20a 11 < 5.0 - - 1 - < 0.050 196,000 - - - < 0.20 - - < 50 - 23.2 < 30 < 5.0 -
Bredin Pond-20130718 2013 07 18 8.76 789 - < 10 < 0.50 1.5 62 < 5.0a - < 100 < 0.050 40,600 < 0.50 < 0.50 < 1.0a < 30 < 1.0 < 50 169,000 72 < 0.20a 13 < 5.0 - - < 1.0 - < 0.050 197,000 - - - < 0.20 - - < 50 - 24.6 < 30 < 5.0 -
Bredin Pond-20131016 2013 10 16 8.9 766 - < 10 < 0.50 1.4 67 < 5.0a - < 100 < 0.050 26,700 < 0.50 < 0.50 < 1.0a < 30 < 1.0 < 50 170,000 < 10 < 0.20a 10.9 < 5.0 - - < 1.0 - < 0.050 223,000 - - - < 0.20 - - < 50 - 20.1 < 30 < 5.0 -
Bredin Pond-20140331 2014 03 31 8.66 759 - 14 < 0.50 1.6 65 < 5.0a - < 100 < 0.050 38,600 0.51 < 0.50 < 1.0a < 30 < 1.0 < 50 161,000 30 < 0.20a 15.2 < 5.0 - - 1.2 - < 0.050 195,000 - - - < 0.20 - - < 50 - 29.5 < 30 < 5.0 -
Bredin Pond-20140528 2014 05 28 8.86 754 - 108 < 0.50 1.6 < 20 < 5.0a - < 100 < 0.050 36,500 < 0.50 < 0.50 < 1.0a 125 < 1.0 < 50 161,000 57 < 0.20a 17.8 < 5.0 - - 1.1 - < 0.050 211,000 - - - < 0.20 - - < 50 - 31.6 < 30 < 5.0 -
Bredin Pond-20140828 2014 08 28 9.01 673 - 13 < 0.50 1.6 74 < 5.0a - < 100 < 0.050 22,600 < 0.50 < 0.50 < 1.0a < 30 < 1.0 < 50 150,000 25 < 0.20a 15.5 < 5.0 - - 1.5 - < 0.050 184,000 - - - < 0.20 - - < 50 - 25.8 < 30 < 5.0 -
Bredin Pond-20150311 2015 03 11 - 721 - 11 < 0.50 1.3 78 < 5.0a - < 100 < 0.050 42,400 < 0.50 < 0.50 < 1.0a < 30 < 1.0 < 50 149,000 11 < 0.20a 15.7 < 5.0 - - 1.6 - < 0.050 191,000 - - - < 0.20 - - < 50 - 28.3 < 30 5.3 -
Bredin Pond-20150616 2015 06 16 - 623 - 12 < 0.50 1.3 38 < 5.0a < 200 < 100 < 0.050 20,400 < 0.50 < 0.50 < 1.0a < 30 < 1.0 < 50 139,000 11 < 0.20a 15 < 5.0 < 300 11,000 1.2 7,460 < 0.050 174,000 2,620 75,600 0.41 < 0.20 < 0.10 < 30 < 50 - 24.2 < 30 33.5 -
Bredin Pond-20151029 2015 10 29 9.27 553 - 22 < 0.50 1.5 60 < 5.0a < 200 < 100 < 0.050 17,100 0.7 < 0.50 < 1.0a < 30 < 1.0 < 50 124,000 < 10 < 0.20a 17 < 5.0 < 300 10,100 1.3 9,500 < 0.050 163,000 2,570 72,900 0.35 < 0.20 < 0.10 < 30 < 50 - 23.7 < 30 15.6 < 0.30
BREDIN POND-20160518 2016 05 18 - 506 - < 10 < 0.50 < 1.0 63 < 5.0a - < 100 < 0.050 10,400 < 0.50 < 0.50 < 1.0a < 30 < 1.0 < 50 117,000 < 10 < 0.20a 13.8 < 5.0 - - 1.6 - < 0.050 155,000 - - - < 0.20 - - < 50 - 22 < 30 < 5.0 -
BREDIN POND-20160914 2016 09 14 - 597 - 13 < 0.50 < 1.0 < 20 < 5.0a < 200 < 100 < 0.050 18,300 < 0.50 < 0.50 1.1 < 30 < 1.0 < 50 134,000 < 10 < 0.20a 15 < 5.0 < 300 13,500 1.4 7,430 < 0.050 181,000 3,050 - - < 0.20 - < 30 < 50 - 22.3 < 30 < 5.0 -
BREDIN POND-20161116 2016 11 16 8.52 611 - 14 < 0.50 1.4 46 < 5.0a < 200 < 100 < 0.050 30,400 < 0.50 < 0.50 < 1.0a < 30 < 1.0 < 50 130,000 < 10 < 0.20a 14.1 < 5.0 < 300 13,600 1.2 7,020 < 0.050 180,000 2,900 - 0.39 < 0.20 - < 30 < 50 - 20.6 < 30 < 5.0 < 0.30
BREDIN POND-20170418 2017 04 18 8.63 684 - 12 < 0.50 1.3 79 < 5.0a < 200 < 100 < 0.050 46,000 0.53 < 0.50 1.7 < 30 < 1.0 < 50 138,000 19 < 0.20a 11 < 5.0 < 300 13,500 1.3 4,970 < 0.050 186,000 2,870 - 0.25 < 0.20 < 0.10 < 30 < 50 - 21.5 < 30 12.2 < 0.30
BREDIN POND-20170607 2017 06 07 8.72 732 - 16 < 0.50 1.6 44 < 5.0a < 200 < 100 < 0.050 47,400 < 0.50 < 0.50 < 1.0a < 30 < 1.0 < 50 149,000 35 < 0.20a 13.8 < 5.0 < 300 13,100 1.1 2,290 < 0.050 203,000 2,920 - 0.47 < 0.20 < 0.10 < 30 < 50 - 23.4 < 30 < 5.0 < 0.30
BREDIN POND-20170907 2017 09 07 8.73 685 - 29 < 0.50 1.4 87 < 5.0a < 200 < 100 < 0.050 33,300 < 0.50 < 0.50 < 1.0a 41 < 1.0 < 50 146,000 74 < 0.20a 12.5 < 5.0 < 300 14,800 1.3 13,900 < 0.050 177,000 2,900 - 0.41 < 0.20 < 0.10 < 30 < 50 - 20.9 < 30 8.1 < 0.30
BREDIN POND-20171101 2017 11 01 8.41 649 - 12 < 0.50 1.6 94 < 5.0a < 200 < 100 < 0.050 41,400 < 0.50 < 0.50 1.3 < 30 < 1.0 < 50 133,000 < 10 < 0.20a 21.8 < 5.0 < 300 14,200 < 1.0 14,100 < 0.050 170,000 2,870 - 0.4 < 0.20 < 0.10 < 30 < 50 - 38.1 < 30 < 5.0 < 0.30
BREDIN POND-180404 2018 04 04 8.77 580 9.08 53.8 < 0.20 1.11 78.1 < 0.10 < 0.10 28.1 0.060 38,700 0.94 0.14 1.56 92 < 0.20 25.4 117,000 8.34 < 0.010 18.8 0.96 187 11,500 1.94 < 1,000 < 0.050 148,000 2,850 52,700 < 0.50 < 0.020 < 0.10 < 0.20 < 5.0 < 1.0 27.4 3.5 9.6 0.12
BREDIN POND-180523 2018 05 23 8.36 604 8.7 25.6 < 0.20 2.09 82.1 < 0.10 < 0.10 31.4 < 0.010 56,700 0.50 0.18 1.25 40 < 0.20 26.7 112,000 27.0 < 0.010 14.1 1.36 234 13,200 1.40 6,500 < 0.050 161,000 2,830 73,800 < 0.50 < 0.020 < 0.10 < 0.20 < 5.0 < 1.0 23.6 3.4 8.7 < 0.10
BREDIN POND-180906 2018 09 06 8.87 581 9.03 33.1 < 0.20 1.71 90.6 < 0.10 < 0.10 21.9 0.020 35,000 0.68 0.19 1.88 44 < 0.20 27.2 120,000 51.4 < 0.010 9.74 1.20 145 11,600 1.29 9,200 < 0.050 165,000 2,940 87,500 < 0.50 < 0.020 < 0.10 < 0.20 < 5.0 < 1.0 17.8 2.8 5.9 0.12
BREDIN POND-181107 2018 11 07 8.31 586 8.24 41.2 < 0.20 1.28 95.2 < 0.10 < 0.10 23.5 < 0.010 53,300 < 0.50 0.12 1.44 47 < 0.20 24.8 110,000 26.8 < 0.010 10.3 1.17 175 10,800 1.02 11,500 < 0.050 143,000 2,840 65,900 < 0.50 < 0.020 < 0.10 < 0.20 < 5.0 < 1.0 22.0 2.8 8.6 0.13
BREDIN POND-190329 2019 03 29 8.24 640 8.16 41.2 < 0.20 1.54 98.2 < 0.10 < 0.10 29.4 < 0.010 61,600 0.74 0.16 1.35 50 < 0.20 28.2 118,000 78.3 < 0.040a 11.1 1.22 257 11,000 1.39 9,300 < 0.050 152,000 3,090 76,900 < 0.50 < 0.020 < 0.10 < 0.20 < 5.0 < 1.0 25.6 2.9 10.6 0.15
BREDIN POND-190605 2019 06 05 8.84 750 8.62 15.0 < 0.20 2.28 97.0 < 0.10 < 0.10 48.7 0.012 55,600 < 0.50 0.19 1.02 17 < 0.20 33.5 148,000 21.9 < 0.040a 14.3 1.48 311 11,600 1.03 8,800 < 0.050 213,000 3,260 108,000 < 0.50 < 0.020 < 0.10 < 0.20 < 5.0 < 1.0 29.9 4.4 < 4.0 0.11
BREDIN POND-190904 2019 09 04 9.17 721 9.63 37.3 < 0.20 1.89 99.3 < 0.10 < 0.10 22.3 < 0.010 22,400 < 0.50 0.18 0.57 55 < 0.20 37.4 161,000 12.8 < 0.010 14.7 1.33 129 13,000 1.36 9,600 < 0.050 214,000 3,450 109,000 < 0.50 < 0.020 < 0.10 < 0.20 < 5.0 < 1.0 26.6 3.0 < 4.0 < 0.10
BREDIN POND-191023 2019 10 23 8.60 663 9.43 173 < 0.20 1.40 102 < 0.10 < 0.10 27.8 0.014 39,500 0.89 0.22 1.19 227 0.21 32.1 137,000 18.6 < 0.010 13.5 1.49 84 12,400 1.28 11,000 < 0.050 174,000 3,440 86,900 < 0.50 < 0.020 < 0.10 < 0.20 9.2 < 1.0 26.9 3.4 7.4 0.19
BREDINPOND-200407 2020 04 07 8.44 627 9.05 87.1 0.101 0.875 72.4 < 0.010 < 0.010 25.9 0.0073 54,900 1.06 0.183 1.10 120 0.140 31.7 119,000 36.4 < 0.010 10.2 1.09 87 10,700 1.19 10,500 0.014 151,000 3,400 68,100 < 0.050 < 0.0040 0.015 0.050 4.55 < 0.20 24.7 2.94 3.7 0.207
BREDINPOND-200605 2020 06 05 8.80 565 8.76 28.7 0.128 0.963 76.8 < 0.010 < 0.010 27.8 0.0056 44,300 0.32 0.149 1.00 35.8 0.056 27.4 110,000 13.0 < 0.010 8.84 0.941 50 9,510 0.90 410 < 0.010 140,000 3,430 58,100 < 0.050 < 0.0040 < 0.010 < 0.050 1.31 < 0.20 20.2 2.95 1.3 0.091
BREDINPOND-200917 2020 09 17 8.89 736 8.98 56.3 0.181 2.48 65.6 < 0.010 < 0.010 41.9 0.0046 36,300 0.29 0.182 0.62 73.3 0.058 33.2 157,000 39.1 < 0.010 10.4 1.39 168 14,800 0.67 4,730 < 0.010 213,000 3,220 113,000 < 0.050 < 0.0040 0.011 < 0.050 2.67 < 0.20 20.1 2.63 3.0 0.183
BREDINPOND-201028 2020 10 28 8.62 755 8.85 70.9 0.173 2.46 95.2 < 0.010 < 0.010 51.5 0.0053 40,900 0.38 0.244 0.88 88.1 0.094 36.5 159,000 44.5 < 0.010 10.8 1.59 269 15,700 0.70 800 0.011 225,000 3,430 120,000 < 0.050 < 0.0040 0.016 < 0.050 3.39 < 0.20 20.9 2.24 3.6 0.251
NORTHEAST POND NE Pond-20130429 2013 04 29 8.72 899 - 73 < 0.50 2.1 53 < 5.0a - < 100 0.101 43,900 < 0.50 < 0.50 < 1.0a 93 < 1.0 < 50 192,000 59 < 0.20a 13.3 < 5.0 - - < 1.0 - < 0.050 256,000 - - - < 0.20 - - < 50 - 25.3 < 30 < 5.0 -
NE Pond-20130528 2013 05 28 8.76 948 - 36 < 0.50 3.1 < 20 < 5.0a - < 100 < 0.050 51,200 0.6 < 0.50 1.4 59 < 1.0 < 50 199,000 99 < 0.20a 16.7 < 5.0 - - < 1.0 - < 0.050 263,000 - - - < 0.20 - - < 50 - 27.9 < 30 < 5.0 -
NE Pond-20130718 2013 07 18 8.83 951 - 15 < 0.50 2.7 < 20 < 5.0a - < 100 < 0.050 48,200 < 0.50 < 0.50 < 1.0a < 30 < 1.0 < 50 208,000 202 < 0.20a 15.4 < 5.0 - - < 1.0 - < 0.050 285,000 - - - < 0.20 - - < 50 - 23.3 < 30 < 5.0 -
NE Pond-20131016 2013 10 16 8.78 937 - 56 < 0.50 3.1 73 < 5.0a - < 100 < 0.10 43,500 < 1.0 < 0.50 < 1.0a 69 < 1.0 < 50 201,000 22 < 0.20a 20.3 < 5.0 - - < 2.0 - < 0.050 296,000 - - - < 0.20 - - < 50 - 28.6 < 30 < 5.0 -
NE Pond-20140331 2014 03 31 8.66 858 - 84 < 0.50 2.3 69 < 5.0a - < 100 < 0.050 49,700 < 0.50 < 0.50 < 1.0a 119 < 1.0 < 50 178,000 87 < 0.20a 18.2 < 5.0 - - < 1.0 - < 0.050 230,000 - - - < 0.20 - - < 50 - 26.2 < 30 < 5.0 -
NE Pond-20140528 2014 05 28 8.77 814 - 23 < 0.50 2.5 52 < 5.0a - < 100 < 0.050 45,300 < 0.50 < 0.50 < 1.0a 32 < 1.0 < 50 170,000 59 < 0.20a 16.9 < 5.0 - - < 1.0 - < 0.050 235,000 - - - < 0.20 - - < 50 - 27.2 < 30 < 5.0 -
NE Pond-20140828 2014 08 28 8.96 775 - 23 < 0.50 3.4 89 < 5.0a - < 100 < 0.050 23,300 < 0.50 < 0.50 < 1.0a 30 < 1.0 < 50 174,000 116 < 0.20a 13.2 < 5.0 - - < 1.0 - < 0.050 225,000 - - - < 0.20 - - < 50 - 22.1 < 30 < 5.0 -
NE Pond-20150311 2015 03 11 - 810 - 56 < 0.50 2 96 < 5.0a - < 100 < 0.050 45,500 < 0.50 < 0.50 < 1.0a 94 < 1.0 < 50 169,000 113 < 0.20a 11.2 < 5.0 - - < 1.0 - < 0.050 244,000 - - - < 0.20 - - < 50 - 17.5 < 30 < 5.0 -
NE Pond-20150616 2015 06 16 - 870 - 26 < 0.50 3.6 56 < 5.0a < 200 < 100 < 0.050 31,800 < 0.50 < 0.50 < 1.0a < 30 < 1.0 < 50 192,000 43 < 0.20a 16.2 < 5.0 390 17,400 < 1.0 3,730 < 0.050 286,000 3,060 147,000 0.61 < 0.20 < 0.10 < 30 < 50 - 21 < 30 < 5.0 -
NE Pond-20151029 2015 10 29 9.08 941 - 64 < 0.50 4.3 83 < 5.0a < 200 < 100 < 0.050 22,500 < 0.50 < 0.50 < 1.0a 94 < 1.0 < 50 215,000 47 < 0.20a 17.9 < 5.0 < 300 18,800 < 1.0 6,970 < 0.050 349,000 3,450 181,000 < 0.40 < 0.20 < 0.20 < 30 < 50 - 21.4 < 30 < 5.0 < 0.60
NE SAMPLE-20160518 2016 05 18 - 913 - < 10 < 0.50 4.2 72 < 5.0a - < 100 < 0.050 32,300 < 0.50 < 0.50 < 1.0a < 30 < 1.0 < 50 202,000 29 < 0.20a 15.1 < 5.0 - - < 1.0 - < 0.050 352,000 - - - < 0.20 - - < 50 - 24 < 30 < 5.0 -
NE POND-20160914 2016 09 14 - 1,060 - 44 < 0.50 5.8 104 < 5.0a < 200 100 < 0.050 26,400 < 0.50 < 0.50 2 63 < 1.0 < 50 242,000 65 < 0.20a 19.6 < 5.0 350 27,300 < 1.0 8,680 < 0.050 442,000 3,690 - - < 0.20 - < 30 < 50 - 26.5 < 30 < 5.0 -
NE POND-20161116 2016 11 16 8.47 1,010 - 69 < 0.50 3.7 107 < 5.0a < 200 < 100 < 0.050 34,300 < 0.50 < 0.50 < 1.0a 84 < 1.0 < 50 225,000 97 < 0.20a 21.4 < 5.0 410 22,700 < 1.0 7,500 < 0.050 388,000 3,520 - < 0.40 < 0.20 - < 30 < 50 - 27.7 < 30 < 5.0 0.69
NE POND-20170418 2017 04 18 8.62 944 - 62 < 0.50 2.4 82 < 5.0a < 200 < 100 < 0.050 51,400 < 0.50 < 0.50 < 1.0a 81 < 1.0 < 50 198,000 71 < 0.20a 18.9 < 5.0 < 300 17,000 < 1.0 3,590 < 0.050 300,000 3,240 - < 0.40 < 0.20 < 0.20 < 30 < 50 - 28.6 < 30 < 5.0 0.78
NE POND-20170607 2017 06 07 8.86 967 - 31 < 0.50 4.1 96 < 5.0a < 200 < 100 < 0.050 46,400 < 0.50 < 0.50 < 1.0a 32 < 1.0 < 50 207,000 65 < 0.20a 17.7 < 5.0 390 17,300 < 1.0 3,040 < 0.050 316,000 3,360 - 0.55 < 0.20 < 0.10 < 30 < 50 - 25.6 < 30 15.8 0.61
NE POND-20170907 2017 09 07 9.31 1,050 - 159 < 0.50 6.5 110 < 5.0a < 200 < 100 < 0.050 17,200 < 0.50 < 0.50 1.6 162 < 1.0 < 50 244,000 25 < 0.20a 19.6 < 5.0 < 300 17,700 < 1.0 3,460 0.152 363,000 3,500 - 0.44 < 0.20 < 0.20 < 30 < 50 - 28.7 < 30 < 5.0 0.46
NE POND-20171101 2017 11 01 9.11 1,060 - 100 < 0.50 5.3 90 < 5.0a < 200 < 100 < 0.050 24,900 < 0.50 < 0.50 1.1 111 < 1.0 < 50 241,000 141 < 0.20a 24.7 < 5.0 < 300 18,700 < 1.0 2,580 < 0.050 370,000 3,430 - < 0.40 < 0.20 < 0.20 < 30 < 50 - 34.4 < 30 < 6.0 0.45
NORTHEAST POND-180404 2018 04 04 8.81 961 8.95 98.2 0.23 4.08 67.1 < 0.10 < 0.10 53.4 < 0.010 42,300 < 0.50 0.42 1.42 155 < 0.20 32.0 208,000 181 < 0.010 22.1 2.88 354 16,700 < 0.50 5,000 < 0.050 343,000 3,300 191,000 < 0.50 < 0.020 < 0.10 < 0.20 6.2 < 1.0 31.2 2.8 < 4.0 0.71
NORTHEAST POND-180523 2018 05 23 8.80 937 8.72 23.6 0.27 4.63 79.9 < 0.10 < 0.10 66.3 0.010 44,700 < 0.50 0.36 1.17 39 < 0.20 31.7 200,000 44.6 < 0.010 23.9 2.57 90 19,200 < 0.50 < 1,000 < 0.050 279,000 3,640 224,000 < 0.50 < 0.020 < 0.10 < 0.20 < 5.0 < 1.0 32.3 3.3 4.4 0.19
NORTHEAST POND-180906 2018 09 06 8.52 1,180 8.84 1,660 0.44 9.04 150 < 0.10 < 0.10 131 0.035 64,800 4.42 1.64 9.73 2,440 1.35 48.0 247,000 701 < 0.010 12.0 6.57 1,260 24,200 < 0.50 15,800 < 0.050 360,000 4,880 228,000 < 0.50 0.020 0.14 < 0.20 95.0 < 1.0 29.1 8.0 8.5 0.39
Associated CARO file(s): 8040426, 8041402, 8041784, 8050436, 8052167, 8061543, 8071280, 8090442, 8110640, 8110821, 9032473, 9050543, 9060474, 9090312, N000861, 0040546, 0060737, 0091922, 20J3095.
Associated Exova file(s): 107524, 115040, 417280, 438503, 47748, 593413, 610415, 653618, 683622, 714220, 714240, 95223.a Laboratory detection limit exceeds regulatory standard/guideline.
All terms defined within the body of SNC-Lavalin's report.b Guideline to protect freshwater aquatic life, long-term average (i.e. "chronic").
< Denotes concentration less than indicated detection limit or RPD less than indicated value.c Guideline to protect freshwater aquatic life, short-term maximum (i.e. "acute").
- Denotes analysis not conducted.d Guideline to protect irrigation watering.
n/a Denotes no applicable standard/guideline.e Standard for groundwater, shown here for comparison purposes only.
QA/QC RPD Denotes quality assurance/quality control relative percent differencef If no dissolved result available, guideline compared to Total Cadmium which is a conservative comparison.
* RPDs are not calculated where one or more concentrations are less than five times RDL.g Guideline is temperature, pH, DOC and hardness dependent. Calculate using BLM software!
RDL Denotes reported detection limit.h Total Mercury guideline is based on the % of MethylMercury present. WQG = 0.0001 / (MeHg/total Hg), where MeHg is mass (or concentration) of methyl mercury and THg. Guideline shown assumes MeHg<0.5% of Total Hg.i Guideline varies with soil type and crop.
BOLD Concentration greater than BCWQG Aquatic Life Long-Term Average (AW) guidelinej Only applies for specific Schedule 2 Site Activities; verify for your site.
BOLD Concentration greater than BCWQG Aquatic Life Short-term Maximum (AW) guidelinek Boron guideline crop dependant, guideline of 500-600 µg/L used, off-site irrigated fields reportedly used to grow forage crops (currently alfalfa and grass).
SHADED Concentration greater than BCWQG Irrigation Water (IW) guidelinem Individual standards exist for Cr +3 and Cr +6. Reported value represents more stringent standard.
RED Concentration greater than CSR Irrigation Watering (IW) standardn Standard/Guideline varies with hardness.
SNC-LAVALIN INC. Page 1 of 4
662036 / 2021 02 0920210309_662036_TAB_Historical.xlsx
QAQC CN 2021 03 09
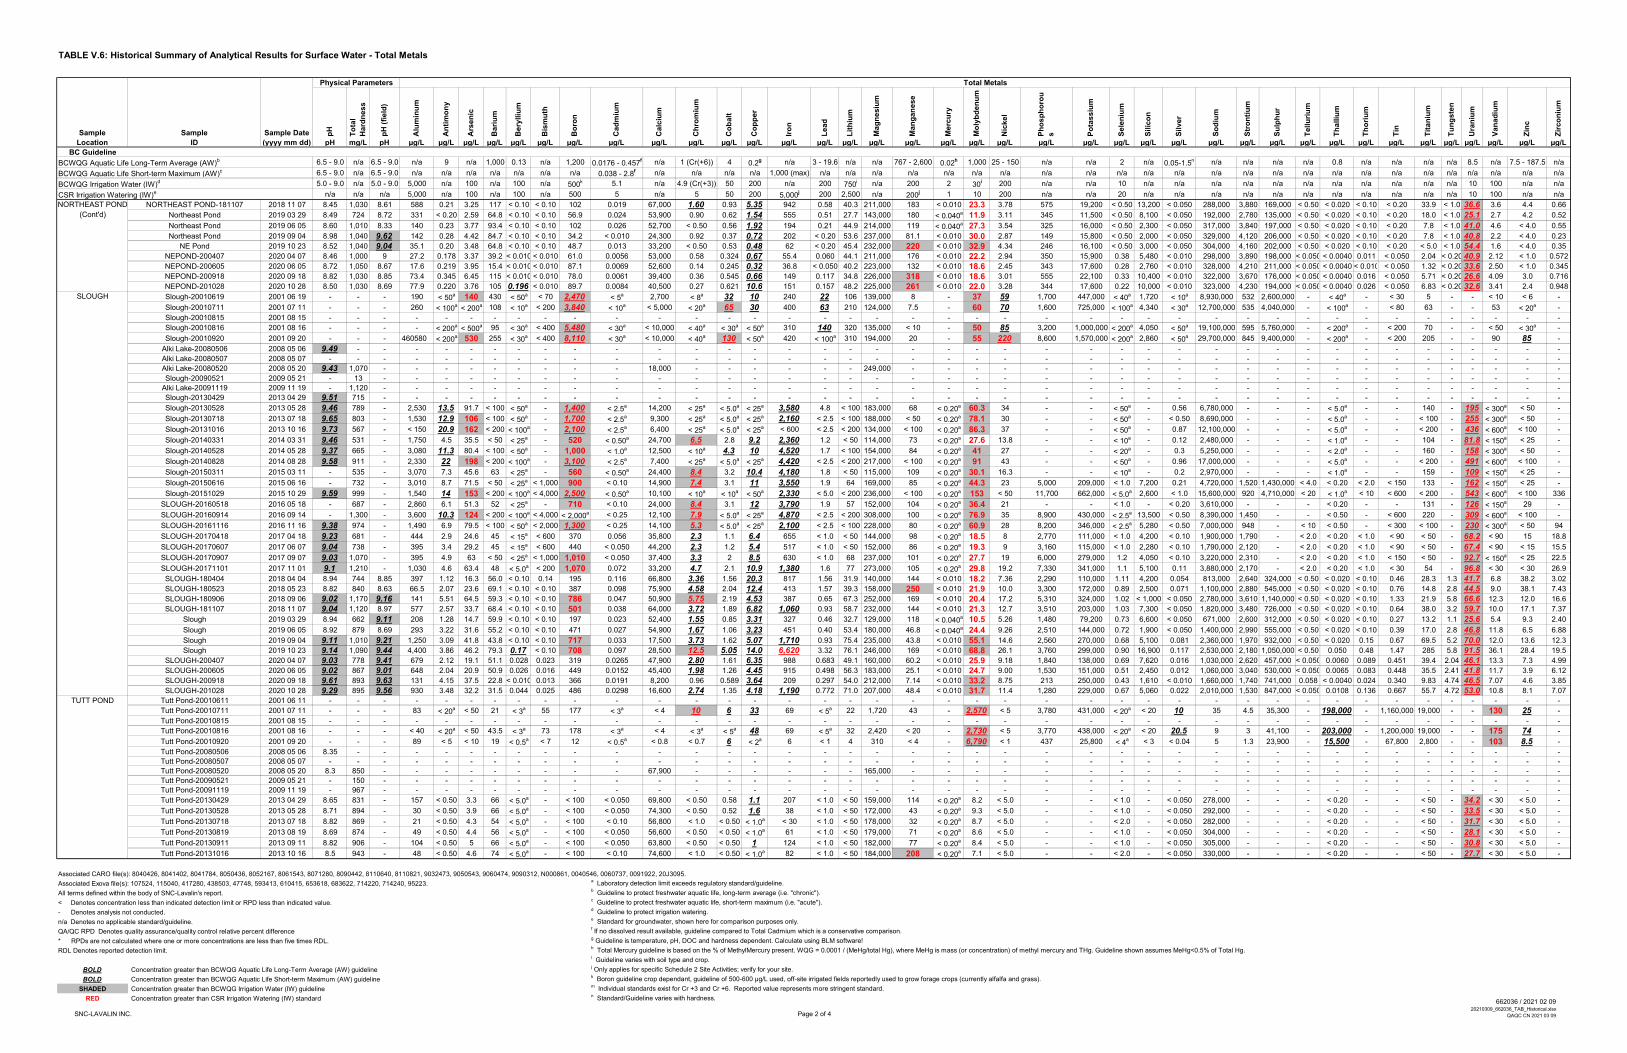
TABLE V.6: Historical Summary of Analytical Results for Surface Water - Total Metals
Physical Parameters Total Metals
Sample Sample Sample Date pH
To
tal
Hard
ness
pH
(fi
eld
)
Alu
min
um
An
tim
on
y
Ars
en
ic
Bari
um
Bery
lliu
m
Bis
mu
th
Bo
ron
Cad
miu
m
Calc
ium
Ch
rom
ium
Co
balt
Co
pp
er
Iro
n
Lead
Lit
hiu
m
Mag
nesiu
m
Man
gan
ese
Merc
ury
Mo
lyb
den
um
Nic
kel
Ph
osp
ho
rou
s Po
tassiu
m
Sele
niu
m
Silic
on
Silver
So
diu
m
Str
on
tiu
m
Su
lph
ur
Tellu
riu
m
Th
alliu
m
Th
ori
um
Tin
Tit
an
ium
Tu
ng
ste
n
Ura
niu
m
Van
ad
ium
Zin
c
Zir
co
niu
m
Location ID (yyyy mm dd) pH mg/L pH µg/L µg/L µg/L µg/L µg/L µg/L µg/L µg/L µg/L µg/L µg/L µg/L µg/L µg/L µg/L µg/L µg/L µg/L µg/L µg/L µg/L µg/L µg/L µg/L µg/L µg/L µg/L µg/L µg/L µg/L µg/L µg/L µg/L µg/L µg/L µg/L µg/L µg/L
BC Guideline
BCWQG Aquatic Life Long-Term Average (AW)b 6.5 - 9.0 n/a 6.5 - 9.0 n/a 9 n/a 1,000 0.13 n/a 1,200 0.0176 - 0.457f n/a 1 (Cr(+6)) 4 0.2g n/a 3 - 19.6 n/a n/a 767 - 2,600 0.02h 1,000 25 - 150 n/a n/a 2 n/a 0.05-1.5n n/a n/a n/a n/a 0.8 n/a n/a n/a n/a 8.5 n/a 7.5 - 187.5 n/a
BCWQG Aquatic Life Short-term Maximum (AW)c 6.5 - 9.0 n/a 6.5 - 9.0 n/a n/a n/a n/a n/a n/a n/a 0.038 - 2.8f n/a n/a n/a n/a 1,000 (max) n/a n/a n/a n/a n/a n/a n/a n/a n/a n/a n/a n/a n/a n/a n/a n/a n/a n/a n/a n/a n/a n/a n/a n/a n/a
BCWQG Irrigation Water (IW)d 5.0 - 9.0 n/a 5.0 - 9.0 5,000 n/a 100 n/a 100 n/a 500k 5.1 n/a 4.9 (Cr(+3)) 50 200 n/a 200 750i n/a 200 2 30i 200 n/a n/a 10 n/a n/a n/a n/a n/a n/a n/a n/a n/a n/a n/a 10 100 n/a n/a
CSR Irrigation Watering (IW)e n/a n/a n/a 5,000 n/a 100 n/a 100 n/a 500 5 n/a 5 50 200 5,000j 200 2,500 n/a 200j 1 10 200 n/a n/a 20 n/a n/a n/a n/a n/a n/a n/a n/a n/a n/a n/a 10 100 n/a n/a
NORTHEAST POND NORTHEAST POND-181107 2018 11 07 8.45 1,030 8.61 588 0.21 3.25 117 < 0.10 < 0.10 102 0.019 67,000 1.60 0.93 5.35 942 0.58 40.3 211,000 183 < 0.010 23.3 3.78 575 19,200 < 0.50 13,200 < 0.050 288,000 3,880 169,000 < 0.50 < 0.020 < 0.10 < 0.20 33.9 < 1.0 36.6 3.6 4.4 0.66
(Cont'd) Northeast Pond 2019 03 29 8.49 724 8.72 331 < 0.20 2.59 64.8 < 0.10 < 0.10 56.9 0.024 53,900 0.90 0.62 1.54 555 0.51 27.7 143,000 180 < 0.040a 11.9 3.11 345 11,500 < 0.50 8,100 < 0.050 192,000 2,780 135,000 < 0.50 < 0.020 < 0.10 < 0.20 18.0 < 1.0 25.1 2.7 4.2 0.52
Northeast Pond 2019 06 05 8.60 1,010 8.33 140 0.23 3.77 93.4 < 0.10 < 0.10 102 0.026 52,700 < 0.50 0.56 1.92 194 0.21 44.9 214,000 119 < 0.040a 27.3 3.54 325 16,000 < 0.50 2,300 < 0.050 317,000 3,840 197,000 < 0.50 < 0.020 < 0.10 < 0.20 7.8 < 1.0 41.0 4.6 < 4.0 0.55
Northeast Pond 2019 09 04 8.98 1,040 9.62 142 0.28 4.42 84.7 < 0.10 < 0.10 34.2 < 0.010 24,300 0.92 0.37 0.72 202 < 0.20 53.6 237,000 81.1 < 0.010 30.0 2.87 149 15,800 < 0.50 2,000 < 0.050 329,000 4,120 206,000 < 0.50 < 0.020 < 0.10 < 0.20 7.8 < 1.0 40.8 2.2 < 4.0 0.23
NE Pond 2019 10 23 8.52 1,040 9.04 35.1 0.20 3.48 64.8 < 0.10 < 0.10 48.7 0.013 33,200 < 0.50 0.53 0.48 62 < 0.20 45.4 232,000 220 < 0.010 32.9 4.34 246 16,100 < 0.50 3,000 < 0.050 304,000 4,160 202,000 < 0.50 < 0.020 < 0.10 < 0.20 < 5.0 < 1.0 54.4 1.6 < 4.0 0.35
NEPOND-200407 2020 04 07 8.46 1,000 9 27.2 0.178 3.37 39.2 < 0.010 < 0.010 61.0 0.0056 53,000 0.58 0.324 0.67 55.4 0.060 44.1 211,000 176 < 0.010 22.2 2.94 350 15,900 0.38 5,480 < 0.010 298,000 3,890 198,000 < 0.050 < 0.0040 0.011 < 0.050 2.04 < 0.20 40.9 2.12 < 1.0 0.572
NEPOND-200605 2020 06 05 8.72 1,050 8.67 17.6 0.219 3.95 15.4 < 0.010 < 0.010 87.1 0.0069 52,600 0.14 0.245 0.32 36.8 < 0.050 40.2 223,000 132 < 0.010 18.6 2.45 343 17,600 0.28 2,760 < 0.010 328,000 4,210 211,000 < 0.050 < 0.0040 < 0.010 < 0.050 1.32 < 0.20 33.6 2.50 < 1.0 0.345
NEPOND-200918 2020 09 18 8.82 1,030 8.85 73.4 0.345 6.45 115 < 0.010 < 0.010 78.0 0.0061 39,400 0.36 0.545 0.66 149 0.117 34.8 226,000 318 < 0.010 18.6 3.01 555 22,100 0.33 10,400 < 0.010 322,000 3,670 176,000 < 0.050 < 0.0040 0.016 < 0.050 5.71 < 0.20 26.6 4.09 3.0 0.716
NEPOND-201028 2020 10 28 8.50 1,030 8.69 77.9 0.220 3.76 105 0.196 < 0.010 89.7 0.0084 40,500 0.27 0.621 10.6 151 0.157 48.2 225,000 261 < 0.010 22.0 3.28 344 17,600 0.22 10,000 < 0.010 323,000 4,230 194,000 < 0.050 < 0.0040 0.026 < 0.050 6.83 < 0.20 32.6 3.41 2.4 0.948
SLOUGH Slough-20010619 2001 06 19 - - - 190 < 50a 140 430 < 50a < 70 2,470 < 5a 2,700 < 8a 32 10 240 22 106 139,000 8 - 37 59 1,700 447,000 < 40a 1,720 < 10a 8,930,000 532 2,600,000 - < 40a - < 30 5 - - < 10 < 6 -
Slough-20010711 2001 07 11 - - - 260 < 100a < 200a 108 < 10a < 200 3,840 < 10a < 5,000 < 20a 65 30 400 63 210 124,000 7.5 - 60 70 1,600 725,000 < 100a 4,340 < 30a 12,700,000 535 4,040,000 - < 100a - < 80 63 - - 53 < 20a -
Slough-20010815 2001 08 15 - - - - - - - - - - - - - - - - - - - - - - - - - - - - - - - - - - - - - - - - -
Slough-20010816 2001 08 16 - - - - < 200a < 500a 95 < 30a < 400 5,480 < 30a < 10,000 < 40a < 30a < 50a 310 140 320 135,000 < 10 - 50 85 3,200 1,000,000 < 200a 4,050 < 50a 19,100,000 595 5,760,000 - < 200a - < 200 70 - - < 50 < 30a -
Slough-20010920 2001 09 20 - - - 460580 < 200a 530 255 < 30a < 400 8,110 < 30a < 10,000 < 40a 130 < 50a 420 < 100a 310 194,000 20 - 55 220 8,600 1,570,000 < 200a 2,860 < 50a 29,700,000 845 9,400,000 - < 200a - < 200 205 - - 90 85 -
Alki Lake-20080506 2008 05 06 9.49 - - - - - - - - - - - - - - - - - - - - - - - - - - - - - - - - - - - - - - - -
Alki Lake-20080507 2008 05 07 - - - - - - - - - - - - - - - - - - - - - - - - - - - - - - - - - - - - - - - - -
Alki Lake-20080520 2008 05 20 9.43 1,070 - - - - - - - - - 18,000 - - - - - - 249,000 - - - - - - - - - - - - - - - - - - - - - -
Slough-20090521 2009 05 21 - 13 - - - - - - - - - - - - - - - - - - - - - - - - - - - - - - - - - - - - - - -
Alki Lake-20091119 2009 11 19 - 1,120 - - - - - - - - - - - - - - - - - - - - - - - - - - - - - - - - - - - - - - -
Slough-20130429 2013 04 29 9.51 715 - - - - - - - - - - - - - - - - - - - - - - - - - - - - - - - - - - - - - - -
Slough-20130528 2013 05 28 9.46 789 - 2,530 13.5 91.7 < 100 < 50a - 1,400 < 2.5a 14,200 < 25a < 5.0a < 25a 3,580 4.8 < 100 183,000 68 < 0.20a 60.3 34 - - < 50a - 0.56 6,780,000 - - - < 5.0a - - 140 - 195 < 300a < 50 -
Slough-20130718 2013 07 18 9.65 803 - 1,530 12.9 106 < 100 < 50a - 1,700 < 2.5a 9,300 < 25a < 5.0a < 25a 2,160 < 2.5 < 100 188,000 < 50 < 0.20a 78.1 30 - - < 50a - < 0.50 8,690,000 - - - < 5.0a - - < 100 - 255 < 300a < 50 -
Slough-20131016 2013 10 16 9.73 567 - < 150 20.9 162 < 200 < 100a - 2,100 < 2.5a 6,400 < 25a < 5.0a < 25a < 600 < 2.5 < 200 134,000 < 100 < 0.20a 86.3 37 - - < 50a - 0.87 12,100,000 - - - < 5.0a - - < 200 - 436 < 600a < 100 -
Slough-20140331 2014 03 31 9.46 531 - 1,750 4.5 35.5 < 50 < 25a - 520 < 0.50a 24,700 6.5 2.8 9.2 2,360 1.2 < 50 114,000 73 < 0.20a 27.6 13.8 - - < 10a - 0.12 2,480,000 - - - < 1.0a - - 104 - 81.8 < 150a < 25 -
Slough-20140528 2014 05 28 9.37 665 - 3,080 11.3 80.4 < 100 < 50a - 1,000 < 1.0a 12,500 < 10a 4.3 10 4,520 1.7 < 100 154,000 84 < 0.20a 41 27 - - < 20a - 0.3 5,250,000 - - - < 2.0a - - 160 - 158 < 300a < 50 -
Slough-20140828 2014 08 28 9.58 911 - 2,330 22 198 < 200 < 100a - 3,100 < 2.5a 7,400 < 25a < 5.0a < 25a 4,420 < 2.5 < 200 217,000 < 100 < 0.20a 91 43 - - < 50a - 0.96 17,000,000 - - - < 5.0a - - < 200 - 491 < 600a < 100 -
Slough-20150311 2015 03 11 - 535 - 3,070 7.3 45.6 63 < 25a - 560 < 0.50a 24,400 8.4 3.2 10.4 4,180 1.8 < 50 115,000 109 < 0.20a 30.1 16.3 - - < 10a - 0.2 2,970,000 - - - < 1.0a - - 159 - 109 < 150a < 25 -
Slough-20150616 2015 06 16 - 732 - 3,010 8.7 71.5 < 50 < 25a < 1,000 900 < 0.10 14,900 7.4 3.1 11 3,550 1.9 64 169,000 85 < 0.20a 44.3 23 5,000 209,000 < 1.0 7,200 0.21 4,720,000 1,520 1,430,000 < 4.0 < 0.20 < 2.0 < 150 133 - 162 < 150a < 25 -
Slough-20151029 2015 10 29 9.59 999 - 1,540 14 153 < 200 < 100a < 4,000 2,500 < 0.50a 10,100 < 10a < 10a < 50a 2,330 < 5.0 < 200 236,000 < 100 < 0.20a 153 < 50 11,700 662,000 < 5.0a 2,600 < 1.0 15,600,000 920 4,710,000 < 20 < 1.0a < 10 < 600 < 200 - 543 < 600a < 100 336
SLOUGH-20160518 2016 05 18 - 687 - 2,860 6.1 51.3 52 < 25a - 710 < 0.10 24,000 8.4 3.1 12 3,790 1.9 57 152,000 104 < 0.20a 36.4 21 - - < 1.0 - < 0.20 3,610,000 - - - < 0.20 - - 131 - 126 < 150a 29 -
SLOUGH-20160914 2016 09 14 - 1,300 - 3,600 10.3 124 < 200 < 100a < 4,000 < 2,000a < 0.25 12,100 7.9 < 5.0a < 25a 4,870 < 2.5 < 200 308,000 100 < 0.20a 76.9 35 8,900 430,000 < 2.5a 13,500 < 0.50 8,390,000 1,450 - - < 0.50 - < 600 220 - 309 < 600a < 100 -
SLOUGH-20161116 2016 11 16 9.38 974 - 1,490 6.9 79.5 < 100 < 50a < 2,000 1,300 < 0.25 14,100 5.3 < 5.0a < 25a 2,100 < 2.5 < 100 228,000 80 < 0.20a 60.9 28 8,200 346,000 < 2.5a 5,280 < 0.50 7,000,000 948 - < 10 < 0.50 - < 300 < 100 - 230 < 300a < 50 94
SLOUGH-20170418 2017 04 18 9.23 681 - 444 2.9 24.6 45 < 15a < 600 370 0.056 35,800 2.3 1.1 6.4 655 < 1.0 < 50 144,000 98 < 0.20a 18.5 8 2,770 111,000 < 1.0 4,200 < 0.10 1,900,000 1,790 - < 2.0 < 0.20 < 1.0 < 90 < 50 - 68.2 < 90 15 18.8
SLOUGH-20170607 2017 06 07 9.04 738 - 395 3.4 29.2 45 < 15a < 600 440 < 0.050 44,200 2.3 1.2 5.4 517 < 1.0 < 50 152,000 86 < 0.20a 19.3 9 3,160 115,000 < 1.0 2,280 < 0.10 1,790,000 2,120 - < 2.0 < 0.20 < 1.0 < 90 < 50 - 67.4 < 90 < 15 15.5
SLOUGH-20170907 2017 09 07 9.03 1,070 - 395 4.9 63 < 50 < 25a < 1,000 1,010 < 0.050 37,400 3.3 2 8.5 630 < 1.0 68 237,000 101 < 0.20a 27.7 19 6,000 279,000 1.2 4,050 < 0.10 3,220,000 2,310 - < 2.0 < 0.20 < 1.0 < 150 < 50 - 92.7 < 150a < 25 22.5
SLOUGH-20171101 2017 11 01 9.1 1,210 - 1,030 4.6 63.4 48 < 5.0a < 200 1,070 0.072 33,200 4.7 2.1 10.9 1,380 1.6 77 273,000 105 < 0.20a 29.8 19.2 7,330 341,000 1.1 5,100 0.11 3,880,000 2,170 - < 2.0 < 0.20 < 1.0 < 30 54 - 96.8 < 30 < 30 26.9
SLOUGH-180404 2018 04 04 8.94 744 8.85 397 1.12 16.3 56.0 < 0.10 0.14 195 0.116 66,800 3.36 1.56 20.3 817 1.56 31.9 140,000 144 < 0.010 18.2 7.36 2,290 110,000 1.11 4,200 0.054 813,000 2,640 324,000 < 0.50 < 0.020 < 0.10 0.46 28.3 1.3 41.7 6.8 38.2 3.02
SLOUGH-180523 2018 05 23 8.82 840 8.63 66.5 2.07 23.6 69.1 < 0.10 < 0.10 387 0.098 75,900 4.58 2.04 12.4 413 1.57 39.3 158,000 250 < 0.010 21.9 10.0 3,300 172,000 0.89 2,500 0.071 1,100,000 2,880 545,000 < 0.50 < 0.020 < 0.10 0.76 14.8 2.8 44.5 9.0 38.1 7.43
SLOUGH-180906 2018 09 06 9.02 1,170 9.16 141 5.51 64.5 59.3 < 0.10 < 0.10 786 0.047 50,900 5.75 2.19 4.53 387 0.65 67.3 252,000 169 < 0.010 20.4 17.2 5,310 324,000 1.02 < 1,000 < 0.050 2,780,000 3,610 1,140,000 < 0.50 < 0.020 < 0.10 1.33 21.9 5.8 66.6 12.3 12.0 16.6
SLOUGH-181107 2018 11 07 9.04 1,120 8.97 577 2.57 33.7 68.4 < 0.10 < 0.10 501 0.038 64,000 3.72 1.89 6.82 1,060 0.93 58.7 232,000 144 < 0.010 21.3 12.7 3,510 203,000 1.03 7,300 < 0.050 1,820,000 3,480 726,000 < 0.50 < 0.020 < 0.10 0.64 38.0 3.2 59.7 10.0 17.1 7.37
Slough 2019 03 29 8.94 662 9.11 208 1.28 14.7 59.9 < 0.10 < 0.10 197 0.023 52,400 1.55 0.85 3.31 327 0.46 32.7 129,000 118 < 0.040a 10.5 5.26 1,480 79,200 0.73 6,600 < 0.050 671,000 2,600 312,000 < 0.50 < 0.020 < 0.10 0.27 13.2 1.1 25.6 5.4 9.3 2.40
Slough 2019 06 05 8.92 879 8.69 293 3.22 31.6 55.2 < 0.10 < 0.10 471 0.027 54,900 1.67 1.06 3.23 451 0.40 53.4 180,000 46.8 < 0.040a 24.4 9.26 2,510 144,000 0.72 1,900 < 0.050 1,400,000 2,990 555,000 < 0.50 < 0.020 < 0.10 0.39 17.0 2.8 46.8 11.8 6.5 6.88
Slough 2019 09 04 9.11 1,010 9.21 1,250 3.09 41.8 43.8 < 0.10 < 0.10 717 0.033 17,500 3.73 1.62 5.07 1,710 0.93 75.4 235,000 43.8 < 0.010 55.1 14.6 2,560 270,000 0.68 5,100 0.081 2,360,000 1,970 932,000 < 0.50 < 0.020 0.15 0.67 69.5 5.2 70.0 12.0 13.6 12.3
Slough 2019 10 23 9.14 1,090 9.44 4,400 3.86 46.2 79.3 0.17 < 0.10 708 0.097 28,500 12.5 5.05 14.0 6,620 3.32 76.1 246,000 169 < 0.010 68.8 26.1 3,760 299,000 0.90 16,900 0.117 2,530,000 2,180 1,050,000 < 0.50 0.050 0.48 1.47 285 5.8 91.5 36.1 28.4 19.5
SLOUGH-200407 2020 04 07 9.03 778 9.41 679 2.12 19.1 51.1 0.028 0.023 319 0.0265 47,900 2.80 1.61 6.35 988 0.683 49.1 160,000 60.2 < 0.010 25.9 9.18 1,840 138,000 0.69 7,620 0.016 1,030,000 2,620 457,000 < 0.050 0.0060 0.089 0.451 39.4 2.04 46.1 13.3 7.3 4.99
SLOUGH-200605 2020 06 05 9.02 867 9.01 648 2.04 20.9 50.9 0.026 0.016 449 0.0152 45,400 1.98 1.26 4.45 915 0.498 56.3 183,000 25.1 < 0.010 24.7 9.00 1,530 151,000 0.51 2,450 0.012 1,060,000 3,040 530,000 < 0.050 0.0065 0.083 0.448 35.5 2.41 41.8 11.7 3.9 6.12
SLOUGH-200918 2020 09 18 9.61 893 9.63 131 4.15 37.5 22.8 < 0.010 0.013 366 0.0191 8,200 0.96 0.589 3.64 209 0.297 54.0 212,000 7.14 < 0.010 33.2 8.75 213 250,000 0.43 1,610 < 0.010 1,660,000 1,740 741,000 0.058 < 0.0040 0.024 0.340 9.83 4.74 46.5 7.07 4.6 3.85
SLOUGH-201028 2020 10 28 9.29 895 9.56 930 3.48 32.2 31.5 0.044 0.025 486 0.0298 16,600 2.74 1.35 4.18 1,190 0.772 71.0 207,000 48.4 < 0.010 31.7 11.4 1,280 229,000 0.67 5,060 0.022 2,010,000 1,530 847,000 < 0.050 0.0108 0.136 0.667 55.7 4.72 53.0 10.8 8.1 7.07
TUTT POND Tutt Pond-20010611 2001 06 11 - - - - - - - - - - - - - - - - - - - - - - - - - - - - - - - - - - - - - - - - -
Tutt Pond-20010711 2001 07 11 - - - 83 < 20a < 50 21 < 3a 55 177 < 3a < 4 10 6 33 69 < 5a 22 1,720 43 - 2,570 < 5 3,780 431,000 < 20a < 20 10 35 4.5 35,300 - 198,000 - 1,160,000 19,000 - - 130 25 -
Tutt Pond-20010815 2001 08 15 - - - - - - - - - - - - - - - - - - - - - - - - - - - - - - - - - - - - - - - - -
Tutt Pond-20010816 2001 08 16 - - - < 40 < 20a < 50 43.5 < 3a 73 178 < 3a < 4 < 3a < 5a 48 69 < 5a 32 2,420 < 20 - 2,730 < 5 3,770 438,000 < 20a < 20 20.5 9 3 41,100 - 203,000 - 1,200,000 19,000 - - 175 74 -
Tutt Pond-20010920 2001 09 20 - - - 89 < 5 < 10 19 < 0.5a < 7 12 < 0.5a < 0.8 < 0.7 6 < 2a 6 < 1 4 310 < 4 - 6,790 < 1 437 25,800 < 4a < 3 < 0.04 5 1.3 23,900 - 15,500 - 67,800 2,800 - - 103 8.5 -
Tutt Pond-20080506 2008 05 06 8.35 - - - - - - - - - - - - - - - - - - - - - - - - - - - - - - - - - - - - - - - -
Tutt Pond-20080507 2008 05 07 - - - - - - - - - - - - - - - - - - - - - - - - - - - - - - - - - - - - - - - - -
Tutt Pond-20080520 2008 05 20 8.3 850 - - - - - - - - - 67,900 - - - - - - 165,000 - - - - - - - - - - - - - - - - - - - - - -
Tutt Pond-20090521 2009 05 21 - 150 - - - - - - - - - - - - - - - - - - - - - - - - - - - - - - - - - - - - - - -
Tutt Pond-20091119 2009 11 19 - 967 - - - - - - - - - - - - - - - - - - - - - - - - - - - - - - - - - - - - - - -
Tutt Pond-20130429 2013 04 29 8.65 831 - 157 < 0.50 3.3 66 < 5.0a - < 100 < 0.050 69,800 < 0.50 0.58 1.1 207 < 1.0 < 50 159,000 114 < 0.20a 8.2 < 5.0 - - < 1.0 - < 0.050 278,000 - - - < 0.20 - - < 50 - 34.2 < 30 < 5.0 -
Tutt Pond-20130528 2013 05 28 8.71 894 - 30 < 0.50 3.9 66 < 5.0a - < 100 < 0.050 74,300 < 0.50 0.52 1.6 38 < 1.0 < 50 172,000 43 < 0.20a 9.3 < 5.0 - - < 1.0 - < 0.050 292,000 - - - < 0.20 - - < 50 - 33.5 < 30 < 5.0 -
Tutt Pond-20130718 2013 07 18 8.82 869 - 21 < 0.50 4.3 54 < 5.0a - < 100 < 0.10 56,800 < 1.0 < 0.50 < 1.0a < 30 < 1.0 < 50 178,000 32 < 0.20a 8.7 < 5.0 - - < 2.0 - < 0.050 282,000 - - - < 0.20 - - < 50 - 31.7 < 30 < 5.0 -
Tutt Pond-20130819 2013 08 19 8.69 874 - 49 < 0.50 4.4 56 < 5.0a - < 100 < 0.050 56,600 < 0.50 < 0.50 < 1.0a 61 < 1.0 < 50 179,000 71 < 0.20a 8.6 < 5.0 - - < 1.0 - < 0.050 304,000 - - - < 0.20 - - < 50 - 28.1 < 30 < 5.0 -
Tutt Pond-20130911 2013 09 11 8.82 906 - 104 < 0.50 5 66 < 5.0a - < 100 < 0.050 63,800 < 0.50 < 0.50 1 124 < 1.0 < 50 182,000 77 < 0.20a 8.4 < 5.0 - - < 1.0 - < 0.050 305,000 - - - < 0.20 - - < 50 - 30.8 < 30 < 5.0 -
Tutt Pond-20131016 2013 10 16 8.5 943 - 48 < 0.50 4.6 74 < 5.0a - < 100 < 0.10 74,600 < 1.0 < 0.50 < 1.0a 82 < 1.0 < 50 184,000 208 < 0.20a 7.1 < 5.0 - - < 2.0 - < 0.050 330,000 - - - < 0.20 - - < 50 - 27.7 < 30 < 5.0 -
Associated CARO file(s): 8040426, 8041402, 8041784, 8050436, 8052167, 8061543, 8071280, 8090442, 8110640, 8110821, 9032473, 9050543, 9060474, 9090312, N000861, 0040546, 0060737, 0091922, 20J3095.
Associated Exova file(s): 107524, 115040, 417280, 438503, 47748, 593413, 610415, 653618, 683622, 714220, 714240, 95223.a Laboratory detection limit exceeds regulatory standard/guideline.
All terms defined within the body of SNC-Lavalin's report.b Guideline to protect freshwater aquatic life, long-term average (i.e. "chronic").
< Denotes concentration less than indicated detection limit or RPD less than indicated value.c Guideline to protect freshwater aquatic life, short-term maximum (i.e. "acute").
- Denotes analysis not conducted.d Guideline to protect irrigation watering.
n/a Denotes no applicable standard/guideline.e Standard for groundwater, shown here for comparison purposes only.
QA/QC RPD Denotes quality assurance/quality control relative percent differencef If no dissolved result available, guideline compared to Total Cadmium which is a conservative comparison.
* RPDs are not calculated where one or more concentrations are less than five times RDL.g Guideline is temperature, pH, DOC and hardness dependent. Calculate using BLM software!
RDL Denotes reported detection limit.h Total Mercury guideline is based on the % of MethylMercury present. WQG = 0.0001 / (MeHg/total Hg), where MeHg is mass (or concentration) of methyl mercury and THg. Guideline shown assumes MeHg<0.5% of Total Hg.i Guideline varies with soil type and crop.
BOLD Concentration greater than BCWQG Aquatic Life Long-Term Average (AW) guidelinej Only applies for specific Schedule 2 Site Activities; verify for your site.
BOLD Concentration greater than BCWQG Aquatic Life Short-term Maximum (AW) guidelinek Boron guideline crop dependant, guideline of 500-600 µg/L used, off-site irrigated fields reportedly used to grow forage crops (currently alfalfa and grass).
SHADED Concentration greater than BCWQG Irrigation Water (IW) guidelinem Individual standards exist for Cr +3 and Cr +6. Reported value represents more stringent standard.
RED Concentration greater than CSR Irrigation Watering (IW) standardn Standard/Guideline varies with hardness.
SNC-LAVALIN INC. Page 2 of 4
662036 / 2021 02 0920210309_662036_TAB_Historical.xlsx
QAQC CN 2021 03 09

TABLE V.6: Historical Summary of Analytical Results for Surface Water - Total Metals
Physical Parameters Total Metals
Sample Sample Sample Date pH
To
tal
Hard
ness
pH
(fi
eld
)
Alu
min
um
An
tim
on
y
Ars
en
ic
Bari
um
Bery
lliu
m
Bis
mu
th
Bo
ron
Cad
miu
m
Calc
ium
Ch
rom
ium
Co
balt
Co
pp
er
Iro
n
Lead
Lit
hiu
m
Mag
nesiu
m
Man
gan
ese
Merc
ury
Mo
lyb
den
um
Nic
kel
Ph
osp
ho
rou
s Po
tassiu
m
Sele
niu
m
Silic
on
Silver
So
diu
m
Str
on
tiu
m
Su
lph
ur
Tellu
riu
m
Th
alliu
m
Th
ori
um
Tin
Tit
an
ium
Tu
ng
ste
n
Ura
niu
m
Van
ad
ium
Zin
c
Zir
co
niu
m
Location ID (yyyy mm dd) pH mg/L pH µg/L µg/L µg/L µg/L µg/L µg/L µg/L µg/L µg/L µg/L µg/L µg/L µg/L µg/L µg/L µg/L µg/L µg/L µg/L µg/L µg/L µg/L µg/L µg/L µg/L µg/L µg/L µg/L µg/L µg/L µg/L µg/L µg/L µg/L µg/L µg/L µg/L µg/L
BC Guideline
BCWQG Aquatic Life Long-Term Average (AW)b 6.5 - 9.0 n/a 6.5 - 9.0 n/a 9 n/a 1,000 0.13 n/a 1,200 0.0176 - 0.457f n/a 1 (Cr(+6)) 4 0.2g n/a 3 - 19.6 n/a n/a 767 - 2,600 0.02h 1,000 25 - 150 n/a n/a 2 n/a 0.05-1.5n n/a n/a n/a n/a 0.8 n/a n/a n/a n/a 8.5 n/a 7.5 - 187.5 n/a
BCWQG Aquatic Life Short-term Maximum (AW)c 6.5 - 9.0 n/a 6.5 - 9.0 n/a n/a n/a n/a n/a n/a n/a 0.038 - 2.8f n/a n/a n/a n/a 1,000 (max) n/a n/a n/a n/a n/a n/a n/a n/a n/a n/a n/a n/a n/a n/a n/a n/a n/a n/a n/a n/a n/a n/a n/a n/a n/a
BCWQG Irrigation Water (IW)d 5.0 - 9.0 n/a 5.0 - 9.0 5,000 n/a 100 n/a 100 n/a 500k 5.1 n/a 4.9 (Cr(+3)) 50 200 n/a 200 750i n/a 200 2 30i 200 n/a n/a 10 n/a n/a n/a n/a n/a n/a n/a n/a n/a n/a n/a 10 100 n/a n/a
CSR Irrigation Watering (IW)e n/a n/a n/a 5,000 n/a 100 n/a 100 n/a 500 5 n/a 5 50 200 5,000j 200 2,500 n/a 200j 1 10 200 n/a n/a 20 n/a n/a n/a n/a n/a n/a n/a n/a n/a n/a n/a 10 100 n/a n/a
TUTT POND Tutt Pond-20140331 2014 03 31 8.56 923 - 84 < 0.50 2.7 75 < 5.0a - < 100 < 0.050 81,100 < 0.50 0.53 < 1.0a 119 < 1.0 < 50 175,000 157 < 0.20a 9.3 < 5.0 - - < 1.0 - < 0.050 284,000 - - - < 0.20 - - < 50 - 33.4 < 30 < 5.0 -
(Cont'd) Tutt Pond-20140528 2014 05 28 8.68 984 - 119 < 0.50 3.8 66 < 5.0a - < 100 < 0.10 85,400 < 1.0 0.61 1.4 146 < 1.0 < 50 187,000 41 < 0.20a 9.6 < 5.0 - - < 2.0 - < 0.050 329,000 - - - < 0.20 - - < 50 - 38 < 30 < 5.0 -
Tutt Pond-20140731 2014 07 31 8.79 964 - 26 < 0.50 4.7 < 20 < 5.0a - < 100 < 0.10 52,300 < 1.0 < 0.50 < 1.0a 32 < 1.0 < 50 202,000 55 < 0.20a 8.6 < 5.0 - - < 2.0 - < 0.050 364,000 - - - < 0.20 - - < 50 - 29.3 < 30 < 5.0 -
Tutt Pond-20140828 2014 08 28 8.78 967 - 372 < 0.50 5.3 39 < 5.0a - < 100 < 0.10 64,700 < 1.0 0.62 1.2 461 < 1.0 < 50 195,000 156 < 0.20a 8.6 < 5.0 - - < 2.0 - < 0.050 337,000 - - - < 0.20 - - < 50 - 31.1 < 30 < 5.0 -
Tutt Pond-20140930 2014 09 30 8.54 999 - 198 < 0.50 5.6 66 < 5.0a - < 100 < 0.10 77,600 < 1.0 0.64 1.1 253 < 1.0 < 50 195,000 320 < 0.20a 8.8 < 5.0 - - < 2.0 - < 0.050 338,000 - - - < 0.20 - - < 50 - 31.2 < 30 5.7 -
Tutt Pond-20150311 2015 03 11 - 822 - 65 < 0.50 2.5 71 < 5.0a - < 100 < 0.050 70,600 < 0.50 < 0.50 1.3 90 < 1.0 < 50 157,000 51 < 0.20a 12.1 < 5.0 - - < 1.0 - < 0.050 247,000 - - - < 0.20 - - < 50 - 30.6 < 30 < 5.0 -
Tutt Pond-20150616 2015 06 16 - 864 - 22 < 0.50 3.2 58 < 5.0a < 200 < 100 < 0.050 47,300 < 0.50 < 0.50 1.1 < 30 < 1.0 < 50 181,000 13 < 0.20a 11 < 5.0 < 300 13,100 < 1.0 1,610 < 0.050 286,000 4,130 188,000 0.61 < 0.20 < 0.20 < 30 < 50 - 31 < 30 < 5.0 -
Tutt Pond-20150902 2015 09 02 8.5 1,060 - 305 < 0.50 5.9 85 < 5.0a < 200 < 100 < 0.050 91,600 0.64 0.79 < 1.0a 383 < 1.0 < 50 202,000 279 < 0.20a 10.3 < 5.0 660 15,900 < 1.0 9,670 < 0.050 359,000 5,280 269,000 0.54 < 0.20 < 0.20 < 30 < 50 - 40.6 < 30 6.4 0.7
Tutt Pond-20151029 2015 10 29 8.46 960 - 131 < 0.50 4.6 75 < 5.0a < 200 < 100 < 0.050 89,300 < 0.50 0.72 < 1.0a 149 < 1.0 < 50 179,000 251 < 0.20a 13.2 < 5.0 500 12,700 < 1.0 9,270 < 0.050 302,000 4,950 239,000 0.71 < 0.20 < 0.20 < 30 < 50 - 41.8 < 30 < 5.0 0.63
TUTT POND-20160518 2016 05 18 - 843 - 35 < 0.50 2.5 62 < 5.0a - < 100 < 0.050 78,600 < 0.50 < 0.50 2 44 < 1.0 < 50 157,000 20 < 0.20a 13.6 < 5.0 - - 1 - < 0.050 281,000 - - - < 0.20 - - < 50 - 43.4 < 30 < 5.0 -
TUTT POND-20160914 2016 09 14 - 960 - 117 < 0.50 3.9 72 < 5.0a < 200 < 100 < 0.050 79,300 < 0.50 < 0.50 < 1.0a 139 < 1.0 < 50 185,000 102 < 0.20a 12.1 < 5.0 390 14,800 < 1.0 7,550 < 0.050 333,000 4,990 - - < 0.20 - < 30 < 50 - 40.1 < 30 < 5.0 -
TUTT POND-20161116 2016 11 16 8.44 820 - 199 < 0.50 3.6 63 < 5.0a < 200 < 100 < 0.050 72,400 < 0.50 0.66 1.4 220 < 1.0 < 50 155,000 164 < 0.20a 12.6 < 5.0 410 14,000 < 1.0 8,100 < 0.050 267,000 3,990 - < 0.40 < 0.20 - < 30 < 50 - 36.9 < 30 < 5.0 < 0.60
TUTT POND-20170418 2017 04 18 8.63 777 - 73 < 0.50 2 72 < 5.0a < 200 < 100 < 0.050 76,500 < 0.50 < 0.50 1.3 87 < 1.0 < 50 142,000 55 < 0.20a 10.7 < 5.0 < 300 12,400 < 1.0 6,190 < 0.050 234,000 3,650 - 0.35 < 0.20 < 0.10 < 30 < 50 - 31.9 < 30 < 5.0 0.69
TUTT POND-20170607 2017 06 07 8.75 860 - 26 < 0.50 2.2 80 < 5.0a < 200 < 100 < 0.050 79,100 < 0.50 < 0.50 1.3 32 < 1.0 < 50 161,000 20 < 0.20a 11.1 < 5.0 < 300 13,300 1 470 < 0.050 265,000 3,850 - 0.59 < 0.20 < 0.10 < 30 < 50 - 32.2 < 30 < 5.0 < 0.30
TUTT POND-20170907 2017 09 07 8.54 1,010 - 42 < 0.50 3.6 56 < 5.0a < 200 < 100 < 0.050 90,900 < 0.50 < 0.50 1.1 50 < 1.0 < 50 190,000 70 < 0.20a 10.9 < 5.0 300 14,800 < 1.0 5,170 < 0.050 304,000 4,790 - 0.48 < 0.20 < 0.20 < 30 < 50 - 43 < 30 < 5.0 0.38
TUTT POND-20171101 2017 11 01 8.39 1,100 - 45 < 0.50 4.1 74 < 5.0a < 200 < 100 < 0.050 120,000 < 0.50 0.56 < 1.0a 71 < 1.0 < 50 194,000 314 < 0.20a 10.5 < 5.0 610 15,300 < 1.0 10,400 < 0.050 329,000 5,790 - 0.55 < 0.20 < 0.20 < 30 < 50 - 49.4 < 30 < 6.0 0.58
TUTT POND-180404 2018 04 04 8.68 792 8 291 < 0.20 2.05 56.5 < 0.10 < 0.10 39.8 0.011 70,600 1.02 0.57 4.76 419 < 0.20 25.5 149,000 61.5 < 0.010 14.8 2.31 226 13,600 1.38 < 1,000 < 0.050 249,000 3,690 162,000 < 0.50 < 0.020 < 0.10 < 0.20 18.3 < 1.0 38.7 4.0 6.5 0.46
TUTT POND-180417 2018 04 17 8.64 799 8.66 181 < 0.20 1.82 60.1 < 0.10 < 0.10 47.6 < 0.010 67,200 1.12 0.53 1.89 269 < 0.20 25.3 153,000 61.0 < 0.010 14.6 2.41 115 13,000 1.10 < 1,000 < 0.050 248,000 3,590 183,000 < 0.50 < 0.020 < 0.10 < 0.20 10.6 < 1.0 38.0 3.6 5.2 0.36
TUTT POND-180503 2018 05 03 8.62 681 8.02 22.8 0.22 1.95 69.3 < 0.10 < 0.10 46.6 0.017 56,900 0.68 0.29 2.50 37 < 0.20 30.1 131,000 23.4 - 15.6 1.55 82 14,800 1.48 2,000 < 0.050 200,000 3,090 98,500 < 0.50 < 0.020 < 0.10 < 0.20 < 5.0 < 1.0 26.4 4.4 7.2 0.24
TUTT POND-180523 2018 05 23 8.46 708 8.49 1,170 < 0.20 2.28 83.2 < 0.10 < 0.10 34.9 < 0.010 68,200 10.2 0.38 2.14 104 < 0.20 27.7 131,000 53.1 < 0.010 14.3 8.73 219 14,700 1.23 3,500 < 0.050 206,000 3,610 114,000 < 0.50 < 0.020 < 0.10 < 0.20 < 5.0 < 1.0 26.9 4.3 8.0 0.16
TUTT POND-180615 2018 06 15 8.46 831 8.83 34.7 < 0.20 2.70 84.5 < 0.10 < 0.10 37.9 0.011 73,800 < 0.50 0.34 1.80 59 < 0.20 34.9 157,000 45.6 < 0.010 14.9 1.93 244 13,900 1.05 3,300 < 0.050 246,000 3,820 149,000 < 0.50 < 0.020 < 0.10 < 0.20 < 5.0 < 1.0 31.2 3.7 5.3 0.16
TUTT POND-180712 2018 07 12 8.82 748 9.04 57.3 < 0.20 2.81 80.7 < 0.10 < 0.10 41.1 0.014 53,000 < 0.50 0.32 2.28 80 < 0.20 31.1 150,000 26.8 < 0.010 13.7 1.87 221 13,100 0.86 4,600 < 0.050 230,000 3,410 137,000 < 0.50 < 0.020 < 0.10 < 0.20 < 5.0 < 1.0 26.1 3.2 < 4.0 0.13
TUTT POND-180906 2018 09 06 8.64 857 8.9 472 0.24 3.26 99.5 < 0.10 < 0.10 37.1 0.022 69,200 1.54 0.90 3.91 719 0.35 28.9 166,000 141 < 0.010 13.5 3.49 329 14,500 1.09 10,800 < 0.050 271,000 4,550 206,000 < 0.50 < 0.020 0.10 < 0.20 29.2 < 1.0 34.3 6.3 6.8 0.67
TUTT POND-181107 2018 11 07 8.39 909 8.37 138 < 0.20 2.77 96.3 < 0.10 < 0.10 45.7 < 0.010 91,600 0.58 0.58 2.00 234 < 0.20 29.7 165,000 116 < 0.010 12.0 3.10 368 14,400 1.05 9,600 < 0.050 262,000 4,190 189,000 < 0.50 < 0.020 < 0.10 < 0.20 8.5 < 1.0 36.6 4.7 5.1 0.38
Tutt Pond 2019 03 29 8.22 792 8.33 202 < 0.20 2.25 91.7 < 0.10 < 0.10 31.1 0.018 93,900 0.73 0.62 2.02 308 0.25 26.6 135,000 301 < 0.040a 8.58 4.08 541 11,900 0.89 8,700 < 0.050 214,000 4,190 175,000 < 0.50 < 0.020 < 0.10 < 0.20 13.7 < 1.0 33.0 3.7 10.0 0.39
Tutt Pond 2019 05 06 8.47 975 8.5 76.2 < 0.20 2.60 86.7 < 0.10 < 0.10 33.1 0.010 111,000 < 0.50 0.58 1.89 122 < 0.20 31.7 169,000 102 < 0.040a 9.12 2.34 227 11,400 0.80 1,100 < 0.050 285,000 5,450 230,000 < 0.50 < 0.020 < 0.10 < 0.20 < 5.0 < 1.0 44.5 3.4 < 4.0 0.26
Tutt Pond 2019 06 05 8.69 865 8.67 43.6 < 0.20 3.08 76.6 < 0.10 < 0.10 45.3 0.010 78,400 < 0.50 0.39 1.04 66 < 0.20 33.8 162,000 55.8 < 0.040a 12.0 2.06 358 11,900 0.72 1,100 < 0.050 263,000 4,100 177,000 < 0.50 < 0.020 < 0.10 < 0.20 < 5.0 < 1.0 38.0 4.8 < 4.0 0.19
Tutt Pond 2019 09 04 8.76 912 8.84 119 0.27 4.27 96.1 < 0.10 < 0.10 37.5 < 0.010 61,900 0.67 0.64 1.76 178 < 0.20 34.4 184,000 128 < 0.010 13.7 2.66 381 14,900 1.09 10,300 < 0.050 296,000 4,720 206,000 < 0.50 < 0.020 < 0.10 < 0.20 8.1 < 1.0 39.5 5.4 < 4.0 0.41
Tutt Pond 2019 10 23 8.48 1,040 8.76 47.9 0.29 4.72 92.2 < 0.10 < 0.10 43.7 < 0.010 94,300 0.66 0.61 0.74 92 < 0.20 33.5 196,000 147 < 0.010 12.8 2.92 539 14,400 0.95 11,700 < 0.050 326,000 5,930 272,000 < 0.50 < 0.020 < 0.10 < 0.20 < 5.0 < 1.0 49.7 5.5 < 4.0 0.44
TUTTPOND-200407 2020 04 07 8.40 842 8.95 41.9 0.149 2.33 60.9 < 0.010 < 0.010 57.6 0.0053 84,100 0.95 0.446 0.85 65.6 0.050 33.1 154,000 92.1 < 0.010 10.1 2.01 132 11,800 0.88 8,960 < 0.010 245,000 4,710 186,000 < 0.050 < 0.0040 0.013 < 0.050 2.72 < 0.20 37.0 3.82 1.8 0.407
TUTTPOND-200605 2020 06 05 8.68 819 8.72 31.2 0.207 2.66 63.4 < 0.010 < 0.010 34.6 0.0062 81,800 0.21 0.418 1.19 59.8 0.054 28.7 149,000 39.0 < 0.010 10.1 1.98 296 12,300 0.70 550 < 0.010 237,000 4,810 168,000 < 0.050 < 0.0040 < 0.010 < 0.050 1.78 < 0.20 33.6 4.67 < 1.0 0.276
TUTTPOND-200918 2020 09 18 8.58 917 8.7 47.8 0.276 4.25 73.2 < 0.010 < 0.010 30.2 0.0090 77,200 0.30 0.624 1.23 87.2 0.083 23.6 176,000 131 < 0.010 13.7 2.61 335 16,700 0.78 6,820 < 0.010 286,000 4,490 196,000 0.068 < 0.0040 0.013 < 0.050 3.75 < 0.20 36.0 5.49 1.3 0.646
TUTTPOND-201028 2020 10 28 8.12 1,130 8.07 178 0.318 4.84 94.7 0.013 < 0.010 44.0 0.0133 114,000 0.71 0.811 1.48 273 0.178 33.5 205,000 470 < 0.010 11.0 3.85 1,120 16,400 1.69 8,250 < 0.010 364,000 5,650 314,000 < 0.050 < 0.0040 0.034 < 0.050 11.3 < 0.20 49.1 4.95 2.5 1.04
BUBNA DISCHARGE Bubna Slough-20150616 2015 06 16 - 1,280 - < 15 0.54 4.3 < 20 < 5.0a < 200 < 100 < 0.050 41,500 < 0.50 < 0.50 < 2.5a < 30 < 1.0 127 285,000 < 10 < 0.20a 4.6 < 5.0 < 300 51,700 < 1.0 7,070 < 0.050 571,000 2,990 191,000 < 1.0 < 0.20 < 0.50 < 30 < 50 - 15.4 < 30 18.9 -
BUBNA DISCHARGE-180420 2018 04 20 8.29 858 - 13.1 0.25 2.24 23.0 < 0.10 < 0.10 21.1 < 0.010 60,900 < 0.50 < 0.10 0.61 20 < 0.20 67.1 171,000 6.71 < 0.040a 1.95 0.87 < 50 26,800 < 0.50 4,200 < 0.050 344,000 3,280 77,700 < 0.50 < 0.020 < 0.10 < 0.20 < 5.0 < 1.0 7.55 3.1 < 4.0 0.17
BUBNA DISCHARGE-180503 2018 05 03 8.56 963 8.08 7.9 0.31 2.91 15.8 < 0.10 < 0.10 24.0 < 0.010 65,700 < 0.50 < 0.10 0.44 11 < 0.20 76.5 194,000 10.1 - 1.97 0.79 < 50 32,800 < 0.50 2,200 < 0.050 400,000 3,600 92,800 < 0.50 < 0.020 < 0.10 < 0.20 < 5.0 < 1.0 7.37 3.6 < 4.0 0.19
BUBNA DISCHARGE-180615 2018 06 15 8.91 940 9.06 22.4 0.30 2.63 12.1 < 0.10 < 0.10 15.9 0.037 32,300 < 0.50 < 0.10 0.56 32 0.33 89.1 209,000 7.14 < 0.010 2.02 0.89 < 50 33,300 < 0.50 3,000 < 0.050 408,000 1,550 95,400 < 0.50 < 0.020 < 0.10 < 0.20 < 5.0 < 1.0 6.48 2.1 15.4 0.18
BUBNA SLOUGH-181108 2018 11 08 8.36 1,110 8.43 82.5 0.28 2.17 19.7 < 0.10 < 0.10 36.2 < 0.010 45,800 < 0.50 < 0.10 < 0.40a 65 < 0.20 101 242,000 13.6 - 1.66 0.52 < 50 37,700 < 0.50 9,000 < 0.050 460,000 2,460 105,000 < 0.50 < 0.020 < 0.10 < 0.20 < 5.0 < 1.0 6.10 1.6 < 4.0 0.45
Bubna-20190329 2019 03 29 8.39 300 - 176 < 0.20 1.13 14 < 0.10 < 0.10 13.6 < 0.010 23,500 < 0.50 < 0.10 0.51 59 < 0.20 25.4 58,600 11.9 < 0.040a 0.71 < 0.40 < 5041.7 9,620 < 0.50 2,500 < 0.050 113,000 1,160 - < 0.50 < 0.020 < 0.10 < 0.20 < 5.0 - 2.04 1.9 < 4.0 0.23
Bubna 2019 03 29 8.39 300 8.56 176 < 0.20 1.13 14.0 < 0.10 < 0.10 13.6 < 0.010 23,500 < 0.50 < 0.10 0.51 59 < 0.20 25.4 58,600 11.9 < 0.040a 0.71 < 0.40 < 50 9,620 < 0.50 2,500 < 0.050 113,000 1,160 24,400 < 0.50 < 0.020 < 0.10 < 0.20 < 5.0 < 1.0 2.04 1.9 < 4.0 0.23
Bubna 2019 05 06 8.71 961 8.41 145 0.27 2.30 20.7 < 0.10 < 0.10 24.1 < 0.010 50,200 < 0.50 0.18 0.87 197 0.22 88.8 203,000 12.7 < 0.040a 1.29 0.95 < 50 30,500 < 0.50 < 1,000 < 0.050 405,000 2,830 85,200 < 0.50 < 0.020 < 0.10 < 0.20 9.5 < 1.0 5.59 2.4 < 4.0 0.31
Bubna-20190506 2019 05 06 8.71 961 - 145 0.27 2.3 20.7 < 0.10 < 0.10 24.1 < 0.010 50,200 < 0.50 0.18 0.87 197 0.22 88.8 203,000 12.7 < 0.040a 1.29 0.95 < 5037.2 30,500 < 0.50 < 1,000 < 0.050 405,000 2,830 - < 0.50 < 0.020 < 0.10 < 0.20 9.5 - 5.59 2.4 < 4.0 0.31
BUBNASLOUGH-200407 2020 04 07 8.33 819 8.66 6.7 0.171 1.60 21.3 < 0.010 < 0.010 30.2 0.0093 53,900 0.14 0.0420 0.26 11.7 < 0.050 73.1 166,000 7.23 < 0.010 0.936 0.494 19 25,400 0.12 7,090 < 0.010 325,000 2,580 69,800 < 0.050 < 0.0040 < 0.010 < 0.050 0.46 < 0.20 4.01 2.13 3.0 0.065
BUBNASLOUGH-200605 2020 06 05 8.44 724 8.44 3.1 0.218 1.68 11.1 < 0.010 < 0.010 17.2 < 0.0020 38,200 0.11 0.0370 0.44 7.5 < 0.050 44.7 153,000 6.79 < 0.010 0.815 0.437 13 25,000 < 0.10 5,080 < 0.010 289,000 2,270 61,500 < 0.050 < 0.0040 < 0.010 < 0.050 0.32 < 0.20 3.26 1.00 < 1.0 0.049
BUBNASLOUGH-200928 2020 09 28 8.28 897 7.97 3.5 0.192 1.66 21.0 < 0.010 < 0.010 39.8 < 0.0020 42,600 0.13 0.0353 0.83 7.1 < 0.050 86.7 192,000 20.6 < 0.010 0.561 0.444 15 30,600 < 0.10 14,600 < 0.010 375,000 2,070 83,400 < 0.050 < 0.0040 < 0.010 < 0.050 0.25 < 0.20 2.25 0.81 1.6 0.036
BUBNASLOUGH-201029 2020 10 29 8.29 888 8.32 3.3 0.147 1.45 20.2 < 0.010 < 0.010 32.0 < 0.0020 41,500 < 0.10 0.0365 0.33 5.3 < 0.050 98.6 190,000 3.80 < 0.010 0.940 0.456 26 31,500 < 0.10 14,900 < 0.010 378,000 2,140 79,500 < 0.050 < 0.0040 < 0.010 < 0.050 0.30 < 0.20 3.70 0.80 1.1 0.035
SLOUGH #2 SLOUGH #2-200407 2020 04 07 8.58 590 - 16.8 0.354 4.08 15.0 < 0.010 < 0.010 29.6 0.0047 52,000 0.32 0.290 1.09 51.4 0.072 109 112,000 129 < 0.010 3.46 1.19 68 71,700 0.20 7,290 < 0.010 782,000 1,300 347,000 < 0.050 < 0.0040 < 0.010 < 0.050 1.77 < 0.20 15.9 1.38 2.4 0.527
SLOUGH #2-200605 2020 06 05 9.00 506 - 23.3 0.466 5.23 7.94 < 0.010 < 0.010 12.3 0.0061 35,800 0.59 0.322 0.70 64.3 0.101 67.8 101,000 41.0 < 0.010 3.77 1.49 46 71,400 0.16 6,470 < 0.010 823,000 1,260 335,000 < 0.050 < 0.0040 < 0.010 < 0.050 2.02 < 0.20 16.1 1.50 < 1.0 0.395
SLOUGH #2-200917 2020 09 17 8.70 811 - 12.5 0.616 7.92 29.1 < 0.010 < 0.010 19.8 0.0081 38,500 0.30 0.265 0.55 37.5 0.062 122 174,000 37.1 < 0.010 6.94 1.76 75 118,000 0.20 9,930 0.015 997,000 1,470 595,000 < 0.050 < 0.0040 < 0.010 < 0.050 1.29 < 0.20 22.2 2.27 1.7 0.475
SLOUGH #2-201029 2020 10 29 8.51 657 - 8.3 0.474 5.19 18.4 < 0.010 < 0.010 19.3 < 0.0020 37,100 0.13 0.181 < 0.20 33.2 0.070 156 137,000 39.2 < 0.010 5.18 1.18 55 96,100 0.20 8,580 < 0.010 1,100,000 1,180 481,000 < 0.050 < 0.0040 < 0.010 < 0.050 1.50 < 0.20 22.6 0.71 < 1.0 0.364
LITTLE ROBERT LK Little Robert Lake-20150616 2015 06 16 - 990 - 173 0.66 8.8 30 < 5.0a < 200 < 100 < 0.050 73,200 0.61 0.64 < 2.5a 203 < 1.0 < 50 196,000 442 < 0.20a 5.1 < 5.0 1,220 36,200 < 1.0 3,690 < 0.050 619,000 2,050 471,000 < 1.0 < 0.20 < 0.50 < 30 < 50 - 14.5 < 30 < 5.0 -
LITTLE ROBERT'S LAKE-20160921 2016 09 21 8.45 1,200 - 105 < 0.50 9.6 34 < 5.0a < 200 < 100 < 0.050 118,000 < 0.50 < 0.50 < 2.5a 155 < 1.0 < 50 225,000 756 < 0.20a 5.6 < 5.0 3,8103,830 46,200 < 1.0 11,700 < 0.050 791,000 2,690 - - < 0.20 - < 30 < 50 - 19.9 < 30 < 5.0 -
LITTLE ROBERT LK-180417 2018 04 17 8.73 1,240 8.92 189 0.49 6.31 38.6 < 0.10 < 0.10 38.4 < 0.010 141,000 0.75 0.76 1.51 273 < 0.20 25.5 216,000 1,120 < 0.010 10.6 2.33 1,830 26,300 0.61 6,600 < 0.050 624,000 3,400 593,000 < 0.50 < 0.020 < 0.10 < 0.20 12.3 < 1.0 40.7 3.9 < 4.0 0.46
LITTLE ROBERT LK-180503 2018 05 03 8.56 763 8.34 42.6 0.26 2.67 57.0 < 0.10 < 0.10 45.5 0.011 70,800 0.54 0.36 1.54 59 < 0.20 29.8 142,000 106 - 15.0 1.74 415 15,300 1.29 1,200 < 0.050 255,000 3,230 161,000 < 0.50 < 0.020 < 0.10 < 0.20 < 5.0 < 1.0 29.9 3.6 6.5 0.25
LITTLE ROBERT LK-180615 2018 06 15 8.51 855 9.19 55.4 0.22 2.74 79.7 < 0.10 < 0.10 37.7 0.023 76,800 < 0.50 0.34 1.44 81 < 0.20 35.3 161,000 75.2 < 0.010 14.3 1.85 275 14,100 1.00 2,700 < 0.050 246,000 3,830 163,000 < 0.50 < 0.020 < 0.10 < 0.20 < 5.0 < 1.0 31.5 3.4 15.2 0.20
Little Robert Lk 2019 05 06 8.67 1,170 8.59 112 0.30 3.61 60.7 < 0.10 < 0.10 35.6 < 0.010 139,000 < 0.50 0.55 1.57 162 < 0.20 35.3 199,000 68.1 < 0.040a 10.0 2.31 943 14,800 < 0.50 < 1,000 < 0.050 423,000 5,390 374,000 < 0.50 < 0.020 < 0.10 < 0.20 6.6 < 1.0 52.7 3.1 < 4.0 0.25
Little Robert Lk 2019 06 05 9.02 987 8.84 32.1 0.32 4.17 70.2 < 0.10 < 0.10 38.3 < 0.010 82,100 < 0.50 0.36 0.68 52 < 0.20 39.0 190,000 81.7 < 0.040a 9.77 1.90 749 11,500 0.55 1,300 < 0.050 369,000 4,560 291,000 < 0.50 < 0.020 < 0.10 < 0.20 < 5.0 < 1.0 37.0 3.3 < 4.0 0.10
Little Robert Lk 2019 09 04 8.98 1,110 8.19 18.8 0.57 7.15 65.0 < 0.10 < 0.10 80.0 < 0.010 101,000 0.63 0.25 0.35 31 < 0.20 37.9 208,000 93.8 < 0.010 6.60 1.48 1,280 22,000 < 0.50 3,700 < 0.050 442,000 4,940 379,000 < 0.50 < 0.020 < 0.10 < 0.20 < 5.0 < 1.0 24.2 1.0 < 4.0 0.10
LITTLEROBERTLAKE-200928 2020 09 28 8.72 1,330 8.76 7,380 0.542 7.05 126 0.276 0.096 40.3 0.0648 167,000 15.5 5.09 12.5 8,430 3.93 50.3 221,000 376 < 0.010 7.20 13.7 1,520 25,900 0.48 16,800 0.037 632,000 4,300 673,000 < 0.050 0.0819 1.29 0.275 424 < 0.20 35.8 19.9 23.2 4.95
LITTLEROBERTLAKE-201029 2020 10 29 8.50 1,300 8.71 224 0.521 6.26 46.4 < 0.010 < 0.010 35.9 0.0049 142,000 0.60 0.426 0.69 249 0.148 45.1 229,000 131 < 0.010 6.79 1.67 1,900 26,100 0.38 2,750 < 0.010 658,000 4,240 684,000 < 0.050 < 0.0040 0.036 < 0.050 13.5 < 0.20 34.3 2.82 1.6 0.400
LTTILEROBERTLAKE-200605 2020 06 05 8.86 1,240 8.97 189 0.404 4.94 52.1 0.013 < 0.010 26.9 0.0088 144,000 0.54 0.639 1.11 274 0.182 20.1 213,000 63.5 < 0.010 9.98 2.17 1,430 19,700 0.25 1,060 < 0.010 561,000 4,750 602,000 < 0.050 < 0.0040 0.037 < 0.050 12.0 < 0.20 42.1 3.78 1.3 0.401
ROBERT LK Robert Lake-20150616 2015 06 16 - 1,150 - 1,910 < 2.0 21.8 < 50 < 25a < 1,000 < 500 < 0.10 60,100 3.6 < 2.0 < 10a 1,690 1.4 < 50 243,000 107 < 0.20a 72.7 11 5,000 90,000 1.2 9,200 < 0.20 4,290,000 4,130 2,580,000 < 4.0 < 0.20 < 2.0 < 150 82 - 145 < 150a < 25 -
ROBERT'S LAKE 1-20160921 2016 09 21 9.67 1,450 - < 150 < 5.0 13.2 < 100 < 50a < 2,000 < 1,000a < 0.25 23,000 < 5.0a < 5.0a < 25a < 300 < 2.5 < 100 331,000 < 50 < 0.20a 112 < 25 < 3,0002,720 120,000 < 2.5a 1,970 < 0.50 5,980,000 5,070 - - < 0.50 - < 300 < 100 - 172 < 300a < 50 -
ROBERT LAKE - NORTH-20161117 2016 11 17 - 1,150 - 2,990 < 2.0 10.8 51 < 25a < 1,000 < 500 < 0.10 40,700 4.3 < 2.0 < 10a 3,000 1.6 < 50 255,000 169 < 0.20a 85.9 < 10 3,700 89,000 < 1.0 11,400 < 0.20 4,430,000 3,710 - - < 0.20 - < 150 149 - 131 < 150a < 25 -
Associated CARO file(s): 8040426, 8041402, 8041784, 8050436, 8052167, 8061543, 8071280, 8090442, 8110640, 8110821, 9032473, 9050543, 9060474, 9090312, N000861, 0040546, 0060737, 0091922, 20J3095.
Associated Exova file(s): 107524, 115040, 417280, 438503, 47748, 593413, 610415, 653618, 683622, 714220, 714240, 95223.a Laboratory detection limit exceeds regulatory standard/guideline.
All terms defined within the body of SNC-Lavalin's report.b Guideline to protect freshwater aquatic life, long-term average (i.e. "chronic").
< Denotes concentration less than indicated detection limit or RPD less than indicated value.c Guideline to protect freshwater aquatic life, short-term maximum (i.e. "acute").
- Denotes analysis not conducted.d Guideline to protect irrigation watering.
n/a Denotes no applicable standard/guideline.e Standard for groundwater, shown here for comparison purposes only.
QA/QC RPD Denotes quality assurance/quality control relative percent differencef If no dissolved result available, guideline compared to Total Cadmium which is a conservative comparison.
* RPDs are not calculated where one or more concentrations are less than five times RDL.g Guideline is temperature, pH, DOC and hardness dependent. Calculate using BLM software!
RDL Denotes reported detection limit.h Total Mercury guideline is based on the % of MethylMercury present. WQG = 0.0001 / (MeHg/total Hg), where MeHg is mass (or concentration) of methyl mercury and THg. Guideline shown assumes MeHg<0.5% of Total Hg.i Guideline varies with soil type and crop.
BOLD Concentration greater than BCWQG Aquatic Life Long-Term Average (AW) guidelinej Only applies for specific Schedule 2 Site Activities; verify for your site.
BOLD Concentration greater than BCWQG Aquatic Life Short-term Maximum (AW) guidelinek Boron guideline crop dependant, guideline of 500-600 µg/L used, off-site irrigated fields reportedly used to grow forage crops (currently alfalfa and grass).
SHADED Concentration greater than BCWQG Irrigation Water (IW) guidelinem Individual standards exist for Cr +3 and Cr +6. Reported value represents more stringent standard.
RED Concentration greater than CSR Irrigation Watering (IW) standardn Standard/Guideline varies with hardness.
SNC-LAVALIN INC. Page 3 of 4
662036 / 2021 02 0920210309_662036_TAB_Historical.xlsx
QAQC CN 2021 03 09

TABLE V.6: Historical Summary of Analytical Results for Surface Water - Total Metals
Physical Parameters Total Metals
Sample Sample Sample Date pH
To
tal
Hard
ness
pH
(fi
eld
)
Alu
min
um
An
tim
on
y
Ars
en
ic
Bari
um
Bery
lliu
m
Bis
mu
th
Bo
ron
Cad
miu
m
Calc
ium
Ch
rom
ium
Co
balt
Co
pp
er
Iro
n
Lead
Lit
hiu
m
Mag
nesiu
m
Man
gan
ese
Merc
ury
Mo
lyb
den
um
Nic
kel
Ph
osp
ho
rou
s Po
tassiu
m
Sele
niu
m
Silic
on
Silver
So
diu
m
Str
on
tiu
m
Su
lph
ur
Tellu
riu
m
Th
alliu
m
Th
ori
um
Tin
Tit
an
ium
Tu
ng
ste
n
Ura
niu
m
Van
ad
ium
Zin
c
Zir
co
niu
m
Location ID (yyyy mm dd) pH mg/L pH µg/L µg/L µg/L µg/L µg/L µg/L µg/L µg/L µg/L µg/L µg/L µg/L µg/L µg/L µg/L µg/L µg/L µg/L µg/L µg/L µg/L µg/L µg/L µg/L µg/L µg/L µg/L µg/L µg/L µg/L µg/L µg/L µg/L µg/L µg/L µg/L µg/L µg/L
BC Guideline
BCWQG Aquatic Life Long-Term Average (AW)b 6.5 - 9.0 n/a 6.5 - 9.0 n/a 9 n/a 1,000 0.13 n/a 1,200 0.0176 - 0.457f n/a 1 (Cr(+6)) 4 0.2g n/a 3 - 19.6 n/a n/a 767 - 2,600 0.02h 1,000 25 - 150 n/a n/a 2 n/a 0.05-1.5n n/a n/a n/a n/a 0.8 n/a n/a n/a n/a 8.5 n/a 7.5 - 187.5 n/a
BCWQG Aquatic Life Short-term Maximum (AW)c 6.5 - 9.0 n/a 6.5 - 9.0 n/a n/a n/a n/a n/a n/a n/a 0.038 - 2.8f n/a n/a n/a n/a 1,000 (max) n/a n/a n/a n/a n/a n/a n/a n/a n/a n/a n/a n/a n/a n/a n/a n/a n/a n/a n/a n/a n/a n/a n/a n/a n/a
BCWQG Irrigation Water (IW)d 5.0 - 9.0 n/a 5.0 - 9.0 5,000 n/a 100 n/a 100 n/a 500k 5.1 n/a 4.9 (Cr(+3)) 50 200 n/a 200 750i n/a 200 2 30i 200 n/a n/a 10 n/a n/a n/a n/a n/a n/a n/a n/a n/a n/a n/a 10 100 n/a n/a
CSR Irrigation Watering (IW)e n/a n/a n/a 5,000 n/a 100 n/a 100 n/a 500 5 n/a 5 50 200 5,000j 200 2,500 n/a 200j 1 10 200 n/a n/a 20 n/a n/a n/a n/a n/a n/a n/a n/a n/a n/a n/a 10 100 n/a n/a
ROBERT LK ROBERT LAKE - SOUTH-20161117 2016 11 17 - 1,070 - 2,750 < 2.0 11 < 50 < 25a < 1,000 < 500 < 0.10 33,100 5.3 2.2 < 10a 3,410 1.6 < 50 241,000 123 < 0.20a 90.3 < 10 3,300 90,000 < 1.0 9,480 < 0.20 4,500,000 3,630 - - < 0.20 - < 150 147 - 131 < 150a < 25 -
(Cont'd) ROBERT LK-180417 2018 04 17 8.98 1,040 8.92 150 0.91 9.89 31.0 < 0.10 < 0.10 22.3 0.025 55,600 1.19 0.82 2.20 198 0.20 8.81 220,000 345 < 0.010 61.1 4.42 2,750 58,600 0.59 7,000 < 0.050 2,710,000 3,190 1,780,000 < 0.50 < 0.020 < 0.10 < 0.20 10.8 1.4 89.9 6.0 < 4.0 2.31
ROBERT LK-180503 2018 05 03 8.98 1,090 8.58 58.8 0.65 10.2 32.8 < 0.10 < 0.10 31.7 0.033 63,000 < 0.50 0.74 1.83 77 < 0.20 12.3 225,000 242 - 55.5 4.05 2,610 57,100 0.58 5,800 < 0.050 2,460,000 3,540 1,700,000 < 0.50 < 0.020 < 0.10 < 0.20 5.0 1.0 82.2 6.2 4.8 1.86
ROBERT LK-180614 2018 06 14 8.97 1,200 9.19 47.0 0.80 11.1 33.6 < 0.10 < 0.10 29.3 0.033 79,500 < 0.50 0.39 1.06 70 < 0.20 21.0 244,000 238 < 0.010 45.2 2.85 2,390 57,500 < 0.50 3,400 < 0.050 2,020,000 4,080 1,570,000 < 0.50 < 0.020 < 0.10 < 0.20 < 5.0 < 1.0 74.3 3.1 4.3 1.19
ROBERT LK-180712 2018 07 12 9.02 1,120 9.22 110 0.57 9.51 23.8 < 0.10 < 0.10 44.8 0.029 71,300 0.52 0.31 1.18 101 < 0.20 19.8 229,000 95.7 < 0.010 47.5 2.92 2,270 51,700 < 0.50 1,700 < 0.050 1,840,000 4,050 1,310,000 < 0.50 < 0.020 < 0.10 < 0.20 5.5 < 1.0 73.3 2.4 < 4.0 0.85
Robert Lk 2019 03 29 9.02 685 9.25 118 0.29 5.21 25.9 < 0.10 < 0.10 17.2 0.021 36,000 < 0.50 0.50 1.56 165 0.23 10.7 144,000 206 < 0.040a 36.8 2.70 1,530 31,100 < 0.50 4,600 < 0.050 1,240,000 2,170 890,000 < 0.50 < 0.020 < 0.10 < 0.20 7.5 < 1.0 54.1 3.1 < 4.0 1.30
Robert Lk 2019 05 06 8.92 1,060 8.6 691 0.53 7.39 42.8 < 0.10 < 0.10 32.0 0.061 59,300 1.49 0.88 2.42 777 0.59 17.0 221,000 172 < 0.040a 47.5 4.42 2,400 46,600 0.51 8,200 < 0.050 1,960,000 3,530 1,300,000 < 0.50 < 0.020 < 0.10 < 0.20 40.7 < 1.0 76.8 5.0 7.1 2.33
Robert Lk 2019 06 05 8.85 1,130 8.62 631 0.58 8.52 51.9 < 0.10 < 0.10 49.1 0.030 68,200 1.37 0.80 1.95 731 0.53 20.9 234,000 236 < 0.040a 39.2 4.41 2,700 47,700 0.71 6,900 < 0.050 2,020,000 3,750 1,290,000 < 0.50 < 0.020 < 0.10 < 0.20 34.2 < 1.0 71.7 5.0 7.1 1.64
Robert Lk 2019 09 04 8.91 1,490 8.61 1,040 0.76 13.8 55.8 < 0.10 < 0.10 81.9 0.027 92,800 2.51 1.15 3.00 1,230 0.81 25.5 306,000 153 < 0.010 45.2 5.87 4,280 68,500 0.85 8,500 0.072 2,630,000 5,420 1,750,000 < 0.50 < 0.020 0.15 < 0.20 61.5 1.2 90.9 8.1 6.7 2.93
ROBERTLAKE-200407 2020 04 07 8.87 1,190 9.4 420 0.436 8.04 42.6 0.016 < 0.010 51.1 0.0189 63,900 0.98 1.02 2.84 515 0.399 19.4 250,000 192 < 0.010 53.2 4.56 3,000 48,700 0.56 8,020 < 0.010 1,740,000 3,380 1,350,000 < 0.050 < 0.0040 0.080 < 0.050 26.5 0.85 91.5 10.2 3.2 3.68
ROBERTLAKE-200605 2020 06 05 8.81 1,220 8.86 850 0.558 8.90 56.7 0.038 0.014 43.1 0.0434 96,800 2.19 1.64 2.84 1,150 0.660 15.1 239,000 373 < 0.010 56.6 5.80 4,250 51,100 0.49 4,780 < 0.010 1,800,000 4,530 1,230,000 0.052 0.0080 0.124 0.075 71.6 1.00 94.6 10.0 5.3 4.69
ROBERTLAKE-200928 2020 09 28 8.97 1,450 8.92 1,430 0.611 11.9 58.8 0.046 0.019 63.4 0.0379 93,200 2.70 1.23 3.38 1,330 0.864 24.0 296,000 168 < 0.010 52.9 6.02 3,770 63,200 0.79 9,630 < 0.010 2,410,000 4,650 1,740,000 0.054 0.0113 0.212 0.066 77.4 1.29 90.7 7.73 7.7 3.46
ROBERTLAKE-201028 2020 10 28 8.94 1,380 9.18 1,790 0.621 12.1 61.6 0.077 0.021 65.9 0.0484 66,400 3.08 1.48 3.97 1,770 1.24 27.4 295,000 145 < 0.010 56.6 6.68 3,920 62,600 1.08 13,100 0.018 2,280,000 4,100 1,680,000 < 0.050 0.0165 0.228 0.071 104 1.48 90.0 11.3 9.2 3.72
DIFFUSER DIFFUSER-180417 2018 04 17 8.98 1,090 9.26 176 0.59 10.1 31.2 < 0.10 < 0.10 20.6 0.017 57,400 0.97 1.05 2.44 248 0.27 8.99 230,000 355 < 0.010 60.8 4.72 2,900 60,800 0.57 7,400 < 0.050 2,440,000 3,170 1,840,000 < 0.50 < 0.020 < 0.10 < 0.20 12.7 1.2 90.2 6.2 4.5 2.30
DIFFUSER-180503 2018 05 03 8.98 1,110 8.67 51.5 0.67 10.5 33.2 < 0.10 < 0.10 30.0 0.033 64,700 < 0.50 0.74 1.64 69 < 0.20 12.5 230,000 250 - 56.4 4.08 2,710 58,700 0.57 5,900 < 0.050 2,540,000 3,610 1,740,000 < 0.50 < 0.020 < 0.10 < 0.20 < 5.0 < 1.0 83.9 6.4 6.5 1.90
DIFFUSER-180615 2018 06 15 8.99 1,230 9.29 70.1 0.75 11.1 33.3 < 0.10 < 0.10 28.2 0.032 82,100 < 0.50 0.41 0.99 109 < 0.20 20.3 249,000 243 < 0.010 44.9 2.99 2,410 59,400 < 0.50 3,600 < 0.050 2,000,000 4,130 1,600,000 < 0.50 < 0.020 < 0.10 0.26 5.3 < 1.0 73.0 3.2 5.3 1.15
JH Outfall JH OUTFALL-180417 2018 04 17 8.68 861 8.89 312 < 0.20 1.92 59.3 < 0.10 < 0.10 41.8 < 0.010 76,100 1.13 0.65 2.13 452 0.30 27.2 163,000 84.2 < 0.010 14.9 2.72 96 13,700 1.22 < 1,000 < 0.050 272,000 3,630 201,000 < 0.50 < 0.020 < 0.10 < 0.20 17.7 < 1.0 38.4 4.1 5.4 0.45
JH OUTFALL-180503 2018 05 03 8.63 710 8.31 29.1 0.20 2.05 70.0 < 0.10 < 0.10 42.1 0.014 63,500 0.76 0.31 2.04 47 < 0.20 32.0 134,000 27.3 - 15.8 1.67 84 15,200 1.55 2,300 < 0.050 212,000 3,320 113,000 < 0.50 < 0.020 < 0.10 < 0.20 < 5.0 < 1.0 28.3 4.5 6.1 0.24
QUAIL RIDGE Treated Leachate Feb 02/00-20000202 2000 02 02 - - - - - - - - - - - - - - - - - - - - - - - - - - - - - - - - - - - - - - - - -
Quail Ridge Leachate-20001115 2000 11 15 - - - 244 < 10a < 20 245 < 1a < 10 2,350 < 1a 102,000 19.6 16.2 56 476 < 4a 39 287,000 468 - < 2 26 4,220 327,000 < 8a 18,500 < 2a 1,980,000 2,550 - - < 8a - < 6 86.6 - - 15 22.4 -
Quail Ridge Leachate-20010223 2001 02 23 - - - 740 - - - - - - - 148,000 - - - 1,750 - - 325,000 1,120 - - - - 262,000 - 19,000 - 1,710,000 - - - - - - - - - - - -
Quail Ridge Leachate-20010423 2001 04 23 - - - 780 - - - - - - - 125,000 - - - 1,090 - - 253,000 914 - - - - 204,000 - 17,600 - 1,240,000 - - - - - - - - - - - -
Quail Ridge Leachate-20050124 2005 01 24 - - - 74 1.9 15.6 272 0.4 < 0.5 1,880 < 0.01 110,000 15.9 9.8 196 700 2.5 38 302,000 579 - 3 21.4 - 245,000 1.8 16,200 0.1 1,660,000 3,430 - - < 0.05 - 5 71.1 - 4.1 11.6 16 21
Quail Ridge Leachate-20051018 2005 10 18 - - - 110 3 27 340 < 1a < 5 2,680 < 0.1a 109,000 25 14 1,650 800 23 40 310,000 614 < 0.1a < 10 25 - 280,000 < 2 17,200 < 1a 1,880,000 3,960 - - < 0.5 - 10 102 - < 5 16 50 30
Quail Ridge-20071218 2007 12 18 - - - 84 2 13 330 < 0.5a < 2 1,720 < 0.05a 137,000 17 8.8 340 2,000 9.5 53 282,000 938 - < 5 17 - 170,000 1 17,500 < 0.5a 1,140,000 3,920 - - < 0.2 - 8 62.7 - 6.7 13 54 20
Quail Ridge-20080331 2008 03 31 - - - < 100 < 1 5 220 < 0.2a - 1,140 < 0.4a 106,000 8.5 5.62 160 1,200 4 40 225,000 676 - 0.8 20 1,600 124,000 < 3.0a 7,060 < 1a 806,000 2,900 - < 0.5 < 0.05 < 0.1 < 4 30 - 6.2 7.6 20 10
Quail Ridge-20081104 2008 11 04 7.18 - - 69 2 9.7 310 < 0.5a < 2 1,790 0.3 251,000 18 8.2 150 1,000 1 50 248,000 898 - < 5 16 - 156,000 < 1 17,500 0.17 1,020,000 4,850 - - < 0.2 - < 5 63.6 - 5.6 14 30 20
Quail Ridge-20091119 2009 11 19 7.12 1,650 - - - - - - - - - - - - - - - - - - - - - - - - - - - - - - - - - - - - - - -
Quail Ridge-20130312 2013 03 12 7.48.09 1,410 - 52 7.36 13.6 285 < 10a - 1,710 < 0.25 151,000 15.7 8.82 214 703 4.8 < 50 252,000 650 < 0.20a 2.1 17.7 - - < 5.0a - 0.061 1,420,000 - - - < 0.50 - - 71 - 4.1 < 60 68 -
Quail Ridge-20130911 2013 09 11 7.63 1,260 - 75 5.33 10.1 265 < 10a - 1,730 < 0.25 142,000 14.1 7.76 388 1,530 7.3 < 50 219,000 588 < 0.20a 1.5 19.5 - - < 5.0a - 0.064 1,390,000 - - - < 0.50 - - 78 - 3.29 < 60 142 -
Quail Ridge-20131211 2013 12 11 7.67 1,290 - 2,600 4.24 9.7 283 < 10a - 1,680 < 0.25 149,000 16.8 8.61 168 3,620 6.3 < 50 222,000 548 < 2.5a 5.8 18.3 - - < 5.0a - 0.13 1,160,000 - - - < 0.50 - - 181 - 3.87 < 60 67 -
Quail Ridge-20140408 2014 04 08 - 1,060 - - - - - - - - - - - - - - - - - - - - - - - - - - - - - - - - - - - - - - -
Quail Ridge-20140610 2014 06 10 - 1,430 - - - - - - - - - - - - - - - - - - - - - - - - - - - - - - - - - - - - - - -
Quail Ridge-20150122 2015 01 22 7.54 1,530 - - - - - - - - - - - - - - - - - - - - - - - - - - - - - - - - - - - - - - -
Quail Ridge-20150615 2015 06 15 7.76 1,380 - - - - - - - - - - - - - - - - - - - - - - - - - - - - - - - - - - - - - - -
Quail Ridge-20150915 2015 09 15 7.47 1,580 - - - - - - - - - - - - - - - - - - - - - - - - - - - - - - - - - - - - - - -
Quail Ridge-20151203 2015 12 03 7.46 1,580 - - - - - - - - - - - - - - - - - - - - - - - - - - - - - - - - - - - - - - -
QUAIL RIDGE-20160315 2016 03 15 7.49 1,350 - - - - - - - - - - - - - - - - - - - - - - - - - - - - - - - - - - - - - - -
QUAIL RIDGE-20160915 2016 09 15 - 1,650 - - - - - - - - - - - - - - - - - - - - - - - - - - - - - - - - - - - - - - -
QUAIL RIDGE-20161117 2016 11 17 - 1,540 - - - - - - - - - - - - - - - - - - - - - - - - - - - - - - - - - - - - - - -
Associated CARO file(s): 8040426, 8041402, 8041784, 8050436, 8052167, 8061543, 8071280, 8090442, 8110640, 8110821, 9032473, 9050543, 9060474, 9090312, N000861, 0040546, 0060737, 0091922, 20J3095.
Associated Exova file(s): 107524, 115040, 417280, 438503, 47748, 593413, 610415, 653618, 683622, 714220, 714240, 95223.a Laboratory detection limit exceeds regulatory standard/guideline.
All terms defined within the body of SNC-Lavalin's report.b Guideline to protect freshwater aquatic life, long-term average (i.e. "chronic").
< Denotes concentration less than indicated detection limit or RPD less than indicated value.c Guideline to protect freshwater aquatic life, short-term maximum (i.e. "acute").
- Denotes analysis not conducted.d Guideline to protect irrigation watering.
n/a Denotes no applicable standard/guideline.e Standard for groundwater, shown here for comparison purposes only.
QA/QC RPD Denotes quality assurance/quality control relative percent differencef If no dissolved result available, guideline compared to Total Cadmium which is a conservative comparison.
* RPDs are not calculated where one or more concentrations are less than five times RDL.g Guideline is temperature, pH, DOC and hardness dependent. Calculate using BLM software!
RDL Denotes reported detection limit.h Total Mercury guideline is based on the % of MethylMercury present. WQG = 0.0001 / (MeHg/total Hg), where MeHg is mass (or concentration) of methyl mercury and THg. Guideline shown assumes MeHg<0.5% of Total Hg.i Guideline varies with soil type and crop.
BOLD Concentration greater than BCWQG Aquatic Life Long-Term Average (AW) guidelinej Only applies for specific Schedule 2 Site Activities; verify for your site.
BOLD Concentration greater than BCWQG Aquatic Life Short-term Maximum (AW) guidelinek Boron guideline crop dependant, guideline of 500-600 µg/L used, off-site irrigated fields reportedly used to grow forage crops (currently alfalfa and grass).
SHADED Concentration greater than BCWQG Irrigation Water (IW) guidelinem Individual standards exist for Cr +3 and Cr +6. Reported value represents more stringent standard.
RED Concentration greater than CSR Irrigation Watering (IW) standardn Standard/Guideline varies with hardness.
SNC-LAVALIN INC. Page 4 of 4
662036 / 2021 02 0920210309_662036_TAB_Historical.xlsx
QAQC CN 2021 03 09

TABLE V.7: Historical Summary of Analytical Results for Leachate
Sample Location N Pumphouse MH
Sample ID
LEACHATE-
PUMPHOUSE
MANHOLE-
20130312
N Pumphouse
MH-20080205
N Pumphouse
MH-20080219
N Pumphouse
MH-20080304
N Pumphouse
MH-20080325
N Pumphouse
MH-20080408
N Pumphouse
MH-20080424
N Pumphouse
MH-20080507
N Pumphouse
MH-20080521
N Pumphouse
MH-20080617
N Pumphouse
MH-20080626
N Pumphouse
MH-20080708
Sample Date (yyyy mm dd) 2013 03 12 2008 02 05 2008 02 19 2008 03 04 2008 03 25 2008 04 08 2008 04 24 2008 05 07 2008 05 21 2008 06 17 2008 06 26 2008 07 08
Parameter Units Analytical Results
Dissolved Inorganics
Ammonia, Total (as N) µg/L 118,000 - - - - - - - - - - -
Nitrate (as N) µg/L < 250 - - - - - - - - - - -
Nitrite (as N) µg/L - - - - - - - - - - - -
Chloride mg/L 490 - - - - - - - - - - -
Fluoride µg/L 5,200 - - - - - - - - - - -
Sulfate mg/L 503 - - - - - - - - - - -
Total Alkalinity mg/L - - - - - - - - - - - -
Alkalinity, Bicarbonate (as CaCO3) mg/L - - - - - - - - - - - -
Alkalinity, Carbonate (as CaCO3) mg/L - - - - - - - - - - - -
Alkalinity, Hydroxide (as CaCO3) mg/L - - - - - - - - - - - -
Alkalinity, Phenolphthalein (as CaCO3) mg/L - - - - - - - - - - - -
Bromide mg/L 3.3 - - - - - - - - - - -
Sulfide mg/L - - - - - - - - - - - -
Biochemical Oxygen Demand mg/L - - - - - - - - - - - -
Chemical Oxygen Demand mg/L 454 - - - - - - - - - - -
Phosphate mg/L - - - - - - - - - - - -
Ortho-Phosphate mg/L 2.5 - - - - - - - - - - -
Total Organic Carbon mg/L 120 - - - - - - - - - - -
Total Phosphorous as P mg/L - - - - - - - - - - - -
Dissolved Metals
Dissolved Aluminum µg/L - - - - - - - - - - - -
Dissolved Calcium mg/L - - - - - - - - - - - -
Dissolved Iron µg/L - - - - - - - - - - - -
Dissolved Magnesium mg/L - - - - - - - - - - - -
Dissolved Manganese µg/L - - - - - - - - - - - -
Dissolved Potassium mg/L - - - - - - - - - - - -
Dissolved Sodium mg/L - - - - - - - - - - - -
Antimony µg/L - - - - - - - - - - - -
Arsenic µg/L - - - - - - - - - - - -
Barium µg/L - - - - - - - - - - - -
Beryllium µg/L - - - - - - - - - - - -
Boron µg/L - - - - - - - - - - - -
Cadmium µg/L - - - - - - - - - - - -
Chromium µg/L - - - - - - - - - - - -
Cobalt µg/L - - - - - - - - - - - -
Copper µg/L - - - - - - - - - - - -
Lead µg/L - - - - - - - - - - - -
Lithium µg/L - - - - - - - - - - - -
Mercury µg/L - - - - - - - - - - - -
Molybdenum µg/L - - - - - - - - - - - -
Nickel µg/L - - - - - - - - - - - -
Selenium µg/L - - - - - - - - - - - -
Silver µg/L - - - - - - - - - - - -
Thallium µg/L - - - - - - - - - - - -
Titanium µg/L - - - - - - - - - - - -
Tungsten µg/L - - - - - - - - - - - -
Uranium µg/L - - - - - - - - - - - -
Vanadium µg/L - - - - - - - - - - - -
Zinc µg/L - - - - - - - - - - - -
Bismuth µg/L - - - - - - - - - - - -
Phosphorous µg/L - - - - - - - - - - - -
Silicon µg/L - - - - - - - - - - - -
Strontium µg/L - - - - - - - - - - - -
Sulphur µg/L - - - - - - - - - - - -
Tellurium µg/L - - - - - - - - - - - -
Thorium µg/L - - - - - - - - - - - -
Tin µg/L - - - - - - - - - - - -
Zirconium µg/L - - - - - - - - - - - -
Monocyclic Aromatic Hydrocarbons
Benzene µg/L 3.13 16 11 14 13 11 7 9 8 11 12 8
Ethylbenzene µg/L 19.3 63 46 64 60 56 47 56 44 49 49 38
Toluene µg/L 1.03 2 2 3 3 2 2 2 2 2 3 2
Xylenes µg/L 9.35 9 9 11 13 12 10 12 7 11 8 9
Styrene µg/L - - - - - - - - - - - -
Polycyclic Aromatic Hydrocarbons
Naphthalene µg/L - - - - - - - - - - - -
Methylnaphthalene, 1- µg/L - - - - - - - - - - - -
Methylnaphthalene, 2- µg/L - - - - - - - - - - - -
Acenaphthylene µg/L - - - - - - - - - - - -
Acenaphthene µg/L - - - - - - - - - - - -
Fluorene µg/L - - - - - - - - - - - -
Phenanthrene µg/L - - - - - - - - - - - -
Anthracene µg/L - - - - - - - - - - - -
Acridine µg/L - - - - - - - - - - - -
Fluoranthene µg/L - - - - - - - - - - - -
Pyrene µg/L - - - - - - - - - - - -
Benz(a)anthracene µg/L - - - - - - - - - - - -
Chrysene µg/L - - - - - - - - - - - -
Benzo(b)fluoranthene µg/L - - - - - - - - - - - -
Benzo(b+j)fluoranthene µg/L - - - - - - - - - - - -
Benzo(k)fluoranthene µg/L - - - - - - - - - - - -
Benzo(a)pyrene µg/L - - - - - - - - - - - -
Indeno(1,2,3-cd)pyrene µg/L - - - - - - - - - - - -
Dibenz(a,h)anthracene µg/L - - - - - - - - - - - -
Benzo(g,h,i)perylene µg/L - - - - - - - - - - - -
Chloronaphthalene, 2- µg/L - - - - - - - - - - - -
Quinoline µg/L - - - - - - - - - - - -
Volatile Organic Compounds
Bromodichloromethane [BDCM] µg/L < 1.0 < 1 < 1 < 1 < 1 < 1 < 1 < 1 < 1 < 1 < 1 < 1
Bromoform µg/L < 1.0 < 1 < 1 < 1 < 1 < 1 < 1 < 1 < 1 < 1 < 1 < 1
Carbon Tetrachloride µg/L < 0.50 < 1 < 1 < 1 < 1 < 1 < 1 < 1 < 1 < 1 < 1 < 1
Chlorobenzene µg/L 3.8 3 2 2 3 3 3 3 3 2 3 2
Chloroethane µg/L 9.7 20 10 30 20 10 < 10 20 20 20 20 10
Chloroform µg/L < 1.0 < 1 < 1 < 1 < 1 < 1 < 1 < 1 < 1 < 1 < 1 < 1
Chloromethane µg/L < 5.0 < 10 < 10 < 10 < 10 < 10 < 10 < 10 < 10 < 10 < 10 < 10
Dibromochloromethane [DBCM] µg/L < 1.0 < 1 < 1 < 1 < 1 < 1 < 1 < 1 < 1 < 1 < 1 < 1
Dibromoethane, 1,2- µg/L - - - - - - - - - - - -
Dibromomethane µg/L - - - - - - - - - - - -
Dichlorobenzene, 1,2- µg/L < 0.70 < 1 < 1 < 1 < 1 < 1 < 1 < 1 < 1 < 1 < 1 < 1
Dichlorobenzene, 1,3- µg/L < 1.0 1 < 1 < 1 < 1 < 1 1 < 1 < 1 < 1 < 1 < 1
Dichlorobenzene, 1,4- µg/L 1.1 < 1 1 1 1 1 1 1 < 1 1 1 1
Dichloroethane, 1,1- µg/L 17.6 13 12 13 12 11 11 15 15 19 21 11
Dichloroethane, 1,2- µg/L < 1.0 < 1 < 1 < 1 < 1 < 1 < 1 < 1 < 1 < 1 < 1 < 1
Dichloroethylene, 1,1- µg/L < 1.0 < 1 < 1 < 1 < 1 < 1 < 1 < 1 < 1 < 1 < 1 < 1
Dichloroethylene, 1,2-cis- µg/L < 1.0 < 1 < 1 < 1 < 1 < 1 < 1 < 1 < 1 < 1 < 1 1
Dichloroethylene, 1,2-trans- µg/L < 1.0 < 1 < 1 < 1 < 1 < 1 < 1 < 1 < 1 < 1 < 1 < 1
Dichloromethane µg/L < 5.0 < 5 < 5 < 5 < 5 < 5 < 5 < 5 < 5 < 5 < 5 < 5
Dichloropropane, 1,2- µg/L < 1.0 < 1 < 1 < 1 < 1 < 1 < 1 < 1 < 1 < 1 < 1 < 1
Dichloropropene, 1,3- (cis+trans) µg/L < 1.4 - - - - - - - - - - -
Dichloropropene, 1,3-cis- µg/L < 1.0 < 1 < 1 < 1 < 1 < 1 < 1 < 1 < 1 < 1 < 1 < 1
Dichloropropene, 1,3-trans- µg/L < 1.0 < 1 < 1 < 1 < 1 < 1 < 1 < 1 < 1 < 1 < 1 < 1
Tetrachloroethane, 1,1,1,2- µg/L < 1.0 - - - - - - - - - - -
Tetrachloroethane, 1,1,2,2- µg/L < 1.0 < 1 < 1 < 1 < 1 < 1 < 1 < 1 < 1 < 1 < 1 < 1
Tetrachloroethylene µg/L < 1.0 < 1 < 1 < 1 < 1 < 1 < 1 < 1 < 1 < 1 < 1 < 1
Trichloroethane, 1,1,1- µg/L < 1.0 8 5 5 6 5 5 6 6 3 9 3
Trichloroethane, 1,1,2- µg/L < 1.0 < 1 < 1 < 1 < 1 < 1 < 1 < 1 < 1 < 1 < 1 < 1
Trichloroethylene µg/L < 1.0 < 1 < 1 < 1 < 1 < 1 < 1 < 1 < 1 < 1 < 1 < 1
Trichlorofluoromethane µg/L < 1.0 < 1 < 1 < 1 < 1 < 1 < 1 < 1 < 1 < 1 < 1 < 1
Vinyl Chloride µg/L < 1.0 < 2 < 2 < 2 < 2 < 2 < 2 < 2 < 2 < 2 < 2 < 2
Gross Parameters
VH (C6-C10) µg/L - - - - - - - - - - - -
VPH (C6-C10) µg/L - - - - - - - - - - - -
EPH (C10-C19) µg/L - - - - - - - - - - - -
LEPH (C10-C19) µg/L - - - - - - - - - - - -
EPH (C19-C32) µg/L - - - - - - - - - - - -
HEPH (C19-C32) µg/L - - - - - - - - - - - -
MTBE
Methyl Tert-butyl Ether [MTBE] µg/L - - - - - - - - - - - -
Resin and Fatty Acids
Acetic Acid mg/L - - - - - - - - - - - -
Butyric Acid mg/L - - - - - - - - - - - -
Caporic Acid mg/L - - - - - - - - - - - -
Heptanoic Acid mg/L - - - - - - - - - - - -
Isobutyric Acid mg/L - - - - - - - - - - - -
Isocaproic Acid mg/L - - - - - - - - - - - -
Isovaleric Acid mg/L - - - - - - - - - - - -
Propionic Acid mg/L - - - - - - - - - - - -
Valeric Acid mg/L - - - - - - - - - - - -
Associated CARO file(s): 8031228, 8052345, 8081555, 8110837, 9031248, 9060275, 9090105, mg/l, N000833, ug/L.
Associated Exova file(s): 506479, 507801, 509233, 600276, 602695, 605393, 608922, 611891, 614770, 617175, 619914, 625680, 627511, 629501.
All terms defined within the body of SNC-Lavalin's report.
< Denotes concentration less than indicated detection limit or RPD less than indicated value.
- Denotes analysis not conducted.
n/a Denotes no applicable standard/guideline.
QA/QC RPD Denotes quality assurance/quality control relative percent difference
* RPDs are not calculated where one or more concentrations are less than five times RDL.
RDL Denotes reported detection limit.
SNC-LAVALIN INC. Page 1 of 8
662036 / 2021 03 09
20210309_662036_TAB_Historical.xlsx QAQC CN 2021 03 09

TABLE V.7: Historical Summary of Analytical Results for Leachate
Sample Location N Pumphouse MH
Sample IDN Pumphouse
MH-20131211
N Pumphouse
MH-20140408
N Pumphouse
MH-20140610
N Pumphouse
MH-20150122
N Pumphouse
MH-20150615
N Pumphouse
MH-20150915
N Pumphouse
MH-20151203
N PUMPHOUSE
MH-20160315
N PUMPHOUSE
MH-20160623
N PUMPHOUSE
MH-20160915
N PUMPHOUSE
MH-20161117
N PUMPHOUSE
MH-20170914
Sample Date (yyyy mm dd) 2013 12 11 2014 04 08 2014 06 10 2015 01 22 2015 06 15 2015 09 15 2015 12 03 2016 03 15 2016 06 23 2016 09 15 2016 11 17 2017 09 14
Parameter Units Analytical Results
Dissolved Inorganics
Ammonia, Total (as N) µg/L 108,000 64,800 65,300 40,600 95,000 99,700 111,000 76,800 11,400 99,000 140,000 87,000
Nitrate (as N) µg/L < 250 < 250 350 < 250 < 250 < 250 350 < 250 5,710 < 250 < 250 < 250
Nitrite (as N) µg/L - - - - - - - - - - - -
Chloride mg/L 380 506 553 368 377 416 441 420 217 502 671 503
Fluoride µg/L 2,200 < 1,000 778 < 1,000 1,600 < 1,000 < 1,000 < 1,000 1,280 < 1,000 < 1,000 1,100
Sulfate mg/L 376 1,130 860 299 545 548 698 573 347 893 996 954
Total Alkalinity mg/L - 3,440 4,930 2,100 3,470 3,640 3,640 3,190 934 3,920 4,680 3,760
Alkalinity, Bicarbonate (as CaCO3) mg/L - - - 2,100 - 3,640 3,640 3,190 - - - -
Alkalinity, Carbonate (as CaCO3) mg/L - - - < 1.0 - < 1.0 < 1.0 < 1.0 - - - -
Alkalinity, Hydroxide (as CaCO3) mg/L - - - < 1.0 - < 1.0 < 1.0 < 1.0 - - - -
Alkalinity, Phenolphthalein (as CaCO3) mg/L - - - - - - - - - - - -
Bromide mg/L 2.6 4.2 4.7 < 2.5 2.6 3.3 2.9 2.8 < 1.0 3.7 5.3 3.4
Sulfide mg/L - - - - - - - - - - - -
Biochemical Oxygen Demand mg/L - - - - - - - - - - - -
Chemical Oxygen Demand mg/L 381 626 660 205 357 421 415 518 46 482 681 508
Phosphate mg/L - - - - - - - - - - - -
Ortho-Phosphate mg/L 2.2 3.07 4.55 0.8 2.3 2.46 2.63 2.29 0.222 3.01 0.392 3.33
Total Organic Carbon mg/L 106 - - - - - - - - - - -
Total Phosphorous as P mg/L - - - - - - - - - - - -
Dissolved Metals
Dissolved Aluminum µg/L - 94 82 20 36 42 46 59 < 10 49 58 70
Dissolved Calcium mg/L - 66.2 64.4 115 104 95 96.2 84.6 58.7 113 89.6 96.8
Dissolved Iron µg/L - 261 144 1,060 116 106 76 89 130 122 84 < 90
Dissolved Magnesium mg/L - 185 257 214 250 265 286 236 149 291 262 270
Dissolved Manganese µg/L - 283 299 841 423 377 395 494 90 493 355 411
Dissolved Potassium mg/L - - - - - 166 169 182 31.6 177 243 177
Dissolved Sodium mg/L - 1,770 2,260 686 1,140 1,370 1,520 1,580 308 1,760 2,020 1,700
Antimony µg/L - 3.8 11.8 < 0.50 3.3 7.69 8 7.85 0.73 12.3 9.3 8.5
Arsenic µg/L - 16.5 33.9 1.7 9.6 14.1 16 21.8 2.3 24.8 23.5 17.2
Barium µg/L - 100 148 201 238 247 256 151 97 303 234 233
Beryllium µg/L - < 10 < 15 < 5.0 < 10 < 10 < 10 < 10 < 5.0 < 10 < 10 < 15
Boron µg/L - 1,590 1,640 890 1,390 1,490 1,520 1,650 230 1,680 2,060 1,520
Cadmium µg/L - < 0.50 < 0.50 < 0.25 < 0.050 < 0.050 < 0.050 < 0.050 < 0.050 < 0.050 < 0.050 < 0.050
Chromium µg/L - 16.1 22.3 5.2 11.1 13.4 15 16.1 3.14 17 22.5 12.6
Cobalt µg/L - 6.6 6.1 3.27 7.03 6.92 7.7 6.57 0.84 8.5 11.5 5.2
Copper µg/L - < 5.0 < 5.0 < 2.5 < 1.0 < 1.0 < 2.0 < 1.0 < 1.0 < 2.0 < 2.0 < 2.0
Lead µg/L - < 1.0 < 1.0 < 1.0 < 1.0 < 1.0 < 1.0 < 1.0 < 1.0 < 1.0 < 1.0 < 1.0
Lithium µg/L - < 50 59 < 50 < 50 < 50 < 50 < 50 < 50 52 < 50 52
Mercury µg/L - < 0.20 < 0.20 < 0.20 < 0.20 < 0.20 < 0.20 < 0.20 < 0.20 < 0.20 < 0.20 < 0.20
Molybdenum µg/L - 3 4.6 < 1.0 1.4 2.2 1.3 2.5 13.4 2 2 1.8
Nickel µg/L - 25.8 26 8.5 14.1 16.1 17.6 21.8 < 5.0 19.7 25.5 18
Selenium µg/L - < 10 < 10 < 5.0 < 1.0 1.7 < 1.0 11.4 5 < 1.0 3.964 11.6
Silver µg/L - < 0.10 < 0.10 < 0.050 < 0.050 < 0.050 < 0.10 < 0.050 < 0.050 < 0.10 < 0.10 < 0.10
Thallium µg/L - < 1.0 < 1.0 < 0.50 < 0.050 < 0.20 < 0.10 < 0.050 < 0.010 < 0.10 < 0.10 < 0.10
Titanium µg/L - 59 73 < 50 < 50 55 55 < 50 < 50 58 67 59
Tungsten µg/L - - - - - - - - - - - -
Uranium µg/L - 22.5 16.2 3.61 5.43 5.09 4.55 8.59 33.3 5.43 4.77 9.1
Vanadium µg/L - < 60 < 90 < 30 < 60 < 60 < 60 < 60 < 30 < 60 < 60 < 90
Zinc µg/L - < 10 < 15 < 5.0 < 10 < 10 < 10 < 10 < 5.0 < 10 < 10 < 15
Bismuth µg/L - - - - - < 400 < 400 < 400 < 200 < 400 < 400 < 600
Phosphorous µg/L - - - - - 2,640 3,180 3,180 < 300 3,190 4,140 3,410
Silicon µg/L - - - - - 15,700 15,400 12,700 10,100 16,700 16,200 14,500
Strontium µg/L - - - - - 3,610 3,440 2,660 2,670 3,960 3,100 3,400
Sulphur µg/L - - - - 179,000 720,000 657,000 793,000 93,800 322,000 520,000 604,000
Tellurium µg/L - - - - < 1.0 < 1.0 < 2.0 < 1.0 < 0.20 - - < 2.0
Thorium µg/L - - - - < 0.50 < 0.50 < 1.0 < 0.50 < 0.10 - - < 1.0
Tin µg/L - - - - - < 60 < 60 < 60 < 30 < 60 < 60 < 90
Zirconium µg/L - - - - 17.8 19.2 22.3 17.5 2.64 - - 19.6
Monocyclic Aromatic Hydrocarbons
Benzene µg/L 3.74 2.05 4.75 - 2.86 3.08 2.98 2.96 - - 3.43 3.34
Ethylbenzene µg/L 11.9 22.1 45.9 - 9.41 11 13.4 15.8 - - 22.8 18.8
Toluene µg/L 0.79 3.8 4.01 - 0.76 0.88 0.72 1.04 - - 1.29 0.7
Xylenes µg/L 9.62 19.8 40.5 - 5.25 5.45 7.9 9.68 - - 14.3 13.4
Styrene µg/L - - - - - - - - - - - -
Polycyclic Aromatic Hydrocarbons
Naphthalene µg/L - 3.19 3.09 0.36 1.45 2.11 2.76 2.94 0.19 1.57 3.55 1.53
Methylnaphthalene, 1- µg/L - - - - - - - - - - - -
Methylnaphthalene, 2- µg/L - - - - - - - - - - - -
Acenaphthylene µg/L - < 0.050 < 0.050 < 0.050 < 0.050 < 0.050 < 0.050 < 0.050 < 0.050 < 0.050 < 0.050 < 0.050
Acenaphthene µg/L - 0.33 0.263 0.2 0.328 0.508 0.415 0.346 < 0.050 0.222 0.4 0.325
Fluorene µg/L - 0.229 0.159 0.142 0.229 0.362 0.298 0.201 < 0.050 0.176 0.238 0.259
Phenanthrene µg/L - 0.245 0.184 0.074 0.09 0.154 0.125 0.124 < 0.050 0.081 0.16 0.154
Anthracene µg/L - < 0.050 < 0.050 < 0.050 < 0.050 < 0.050 < 0.050 < 0.050 < 0.050 < 0.050 < 0.050 < 0.050
Acridine µg/L - < 0.050 < 0.060 < 0.050 < 0.050 < 0.050 < 0.050 < 0.050 < 0.050 < 0.050 < 0.070 < 0.050
Fluoranthene µg/L - < 0.050 < 0.050 < 0.050 < 0.050 < 0.050 < 0.050 < 0.050 < 0.050 < 0.050 < 0.050 < 0.050
Pyrene µg/L - < 0.050 < 0.050 < 0.050 < 0.050 < 0.050 < 0.050 < 0.050 < 0.050 < 0.050 < 0.050 < 0.050
Benz(a)anthracene µg/L - < 0.050 < 0.050 < 0.050 < 0.050 < 0.050 < 0.050 < 0.050 < 0.050 < 0.050 < 0.050 < 0.050
Chrysene µg/L - < 0.050 < 0.050 < 0.050 < 0.050 < 0.050 < 0.050 < 0.050 < 0.050 < 0.050 < 0.050 < 0.050
Benzo(b)fluoranthene µg/L - < 0.050 < 0.050 < 0.050 < 0.050 < 0.050 < 0.050 < 0.050 < 0.050 < 0.050 < 0.050 -
Benzo(b+j)fluoranthene µg/L - - - - - - - - - - - -
Benzo(k)fluoranthene µg/L - < 0.050 < 0.050 < 0.050 < 0.050 < 0.050 < 0.050 < 0.050 < 0.050 < 0.050 < 0.050 < 0.050
Benzo(a)pyrene µg/L - < 0.010 < 0.010 < 0.010 < 0.010 < 0.010 < 0.010 < 0.010 < 0.010 < 0.0050 < 0.0050 < 0.0050
Indeno(1,2,3-cd)pyrene µg/L - < 0.050 < 0.050 < 0.050 < 0.050 < 0.050 < 0.050 < 0.050 < 0.050 < 0.050 < 0.050 < 0.050
Dibenz(a,h)anthracene µg/L - < 0.050 < 0.050 < 0.050 < 0.050 < 0.050 < 0.050 < 0.050 < 0.050 < 0.0050 < 0.0050 < 0.0050
Benzo(g,h,i)perylene µg/L - < 0.050 < 0.050 < 0.050 < 0.050 < 0.050 < 0.050 < 0.050 < 0.050 < 0.050 < 0.050 < 0.050
Chloronaphthalene, 2- µg/L - - - - - - - - - - - -
Quinoline µg/L - < 0.050 < 0.050 < 0.050 < 0.050 < 0.070 < 0.050 < 0.070 < 0.050 < 0.050 < 0.050 < 0.070
Volatile Organic Compounds
Bromodichloromethane [BDCM] µg/L < 1.0 < 1.0 - - < 1.0 < 1.0 < 1.0 < 1.0 - - < 1.0 < 1.0
Bromoform µg/L < 1.0 < 1.0 - - < 1.0 < 1.0 < 1.0 < 1.0 - - < 1.0 < 1.0
Carbon Tetrachloride µg/L < 0.50 < 0.50 - - < 0.50 < 0.50 < 0.50 < 0.50 - - < 0.50 < 0.50
Chlorobenzene µg/L 4.2 < 1.0 - - 2.7 2.4 2.3 1.7 - - 2.3 1.8
Chloroethane µg/L 6.3 1.3 - - 6 6 4.3 5.2 - - 3.7 9
Chloroform µg/L < 1.0 < 1.0 - - < 1.0 < 1.0 < 1.0 < 1.0 - - < 1.0 < 1.0
Chloromethane µg/L < 5.0 < 5.0 - - < 5.0 < 5.0 < 5.0 < 5.0 - - < 5.0 < 5.0
Dibromochloromethane [DBCM] µg/L < 1.0 < 1.0 - - < 1.0 < 1.0 < 1.0 < 1.0 - - < 1.0 < 1.0
Dibromoethane, 1,2- µg/L - - - - - - - - - - - -
Dibromomethane µg/L - - - - - - - - - - - -
Dichlorobenzene, 1,2- µg/L < 0.70 < 0.70 - - < 0.70 < 0.70 < 0.70 < 0.70 - - < 0.70 < 0.50
Dichlorobenzene, 1,3- µg/L < 1.0 < 1.0 - - < 1.0 < 1.0 < 1.0 < 1.0 - - < 1.0 < 1.0
Dichlorobenzene, 1,4- µg/L 1.5 < 1.0 - - 1.1 1.2 1.1 < 1.0 - - 1.1 1.3
Dichloroethane, 1,1- µg/L 16.2 1.5 - - 12.4 9.4 6.4 12.6 - - 13.3 10.1
Dichloroethane, 1,2- µg/L < 1.0 < 1.0 - - < 1.0 < 1.0 < 1.0 < 1.0 - - < 1.0 < 1.0
Dichloroethylene, 1,1- µg/L < 1.0 < 1.0 - - < 1.0 < 1.0 < 1.0 < 1.0 - - < 1.0 < 1.0
Dichloroethylene, 1,2-cis- µg/L < 1.0 < 1.0 - - < 1.0 < 1.0 < 1.0 < 1.0 - - < 1.0 < 1.0
Dichloroethylene, 1,2-trans- µg/L < 1.0 < 1.0 - - < 1.0 < 1.0 < 1.0 < 1.0 - - < 1.0 < 1.0
Dichloromethane µg/L < 5.0 < 5.0 - - < 5.0 < 5.0 < 5.0 < 5.0 - - < 5.0 < 5.0
Dichloropropane, 1,2- µg/L < 1.0 < 1.0 - - < 1.0 < 1.0 < 1.0 < 1.0 - - < 1.0 < 1.0
Dichloropropene, 1,3- (cis+trans) µg/L < 1.4 < 1.4 - - < 1.4 < 1.4 < 1.4 < 1.4 - - < 1.4 < 1.0
Dichloropropene, 1,3-cis- µg/L < 1.0 < 1.0 - - < 1.0 < 1.0 < 1.0 < 1.0 - - < 1.0 < 0.50
Dichloropropene, 1,3-trans- µg/L < 1.0 < 1.0 - - < 1.0 < 1.0 < 1.0 < 1.0 - - < 1.0 < 0.50
Tetrachloroethane, 1,1,1,2- µg/L < 1.0 < 1.0 - - < 1.0 < 1.0 < 1.0 < 1.0 - - < 1.0 < 1.0
Tetrachloroethane, 1,1,2,2- µg/L < 1.0 < 1.0 - - < 1.0 < 1.0 < 1.0 < 1.0 - - < 1.0 < 0.20
Tetrachloroethylene µg/L < 1.0 < 1.0 - - < 1.0 < 1.0 < 1.0 < 1.0 - - < 1.0 < 1.0
Trichloroethane, 1,1,1- µg/L 1.6 < 1.0 - - 1.6 1.1 < 1.0 < 1.0 - - < 1.0 < 1.0
Trichloroethane, 1,1,2- µg/L < 1.0 < 1.0 - - < 1.0 < 1.0 < 1.0 < 1.0 - - < 1.0 < 0.50
Trichloroethylene µg/L < 1.0 < 1.0 - - < 1.0 < 1.0 < 1.0 < 1.0 - - < 1.0 < 1.0
Trichlorofluoromethane µg/L < 1.0 < 1.0 - - < 1.0 < 1.0 < 1.0 < 1.0 - - < 1.0 < 1.0
Vinyl Chloride µg/L < 1.0 < 1.0 - - < 1.0 < 1.0 < 1.0 < 1.0 - - < 1.0 < 0.40
Gross Parameters
VH (C6-C10) µg/L - < 100 < 100 - < 100 < 100 < 100 < 100 - - < 100 -
VPH (C6-C10) µg/L - < 100 < 100 - < 100 < 100 < 100 < 100 - - < 100 -
EPH (C10-C19) µg/L - 1,110 1,180 650 < 250 260 310 260 < 250 < 250 400 < 250
LEPH (C10-C19) µg/L - 1,110 1,170 650 < 250 250 310 260 < 250 < 250 400 < 250
EPH (C19-C32) µg/L - 640 850 720 < 250 < 250 < 250 < 250 < 250 < 250 < 250 < 250
HEPH (C19-C32) µg/L - 640 850 720 < 250 < 250 < 250 < 250 < 250 < 250 < 250 < 250
MTBE
Methyl Tert-butyl Ether [MTBE] µg/L - - - - - - - - - - - -
Resin and Fatty Acids
Acetic Acid mg/L - - - - - - - - - - - -
Butyric Acid mg/L - - - - - - - - - - - -
Caporic Acid mg/L - - - - - - - - - - - -
Heptanoic Acid mg/L - - - - - - - - - - - -
Isobutyric Acid mg/L - - - - - - - - - - - -
Isocaproic Acid mg/L - - - - - - - - - - - -
Isovaleric Acid mg/L - - - - - - - - - - - -
Propionic Acid mg/L - - - - - - - - - - - -
Valeric Acid mg/L - - - - - - - - - - - -
Associated CARO file(s): 8031228, 8052345, 8081555, 8110837, 9031248, 9060275, 9090105, mg/l, N000833, ug/L.
Associated Exova file(s): 506479, 507801, 509233, 600276, 602695, 605393, 608922, 611891, 614770, 617175, 619914, 625680, 627511, 629501.
All terms defined within the body of SNC-Lavalin's report.
< Denotes concentration less than indicated detection limit or RPD less than indicated value.
- Denotes analysis not conducted.
n/a Denotes no applicable standard/guideline.
QA/QC RPD Denotes quality assurance/quality control relative percent difference
* RPDs are not calculated where one or more concentrations are less than five times RDL.
RDL Denotes reported detection limit.
SNC-LAVALIN INC. Page 2 of 8
662036 / 2021 03 09
20210309_662036_TAB_Historical.xlsx QAQC CN 2021 03 09

TABLE V.7: Historical Summary of Analytical Results for Leachate
Sample Location N Pumphouse MH
Sample IDN PUMPHOUSE
MH-20171204
N Pumphouse
MH
N Pumphouse
MH
N Pumphouse
MH-20180524
N Pumphouse
MH
N Pumphouse
MH-20181108
N Pumphouse
MH
N Pumphouse
MH-20190315
N Pumphouse
MH
N Pumphouse
MH-20190603
N Pumphouse
MH
N Pumphouse
MH-20190903
Sample Date (yyyy mm dd) 2017 12 04 2018 03 15 2018 05 24 2018 05 24 2018 11 08 2018 11 08 2019 03 15 2019 03 15 2019 06 03 2019 06 03 2019 09 03 2019 09 03
Parameter Units Analytical Results
Dissolved Inorganics
Ammonia, Total (as N) µg/L 65,600 171 52,900 52,900 50,200 50,200 14,600 14,600 39,500 39,500 33,800 33,800
Nitrate (as N) µg/L < 250 7,230 < 100 < 100 < 250 < 250 3,530 3,530 < 100 < 100 < 10 < 10
Nitrite (as N) µg/L - < 100 < 100 - < 250 - 390 - < 100 - < 10 -
Chloride mg/L 554 131 437 437 936 936 501 501 410 410 89.9 89.9
Fluoride µg/L < 1,000 < 1,000 < 1,000 < 1,000 < 2,500 < 2,500 < 1,000 < 1,000 1,100 1,100 110 110
Sulfate mg/L 1,160 236 1,010 1,010 2,660 2,660 1,340 1,340 1,120 1,120 240 240
Total Alkalinity mg/L 5,390 575 2,740 2,740 6,350 6,350 2,890 2,890 3,310 3,310 6,780 6,780
Alkalinity, Bicarbonate (as CaCO3) mg/L - 575 2,740 2,740 6,350 6,350 2,790 2,790 3,310 3,310 6,780 6,780
Alkalinity, Carbonate (as CaCO3) mg/L - < 1.0 < 1.0 < 1.0 < 1.0 < 1.0 102 102 < 1.0 < 1.0 < 1.0 < 1.0
Alkalinity, Hydroxide (as CaCO3) mg/L - < 1.0 < 1.0 < 1.0 < 1.0 < 1.0 < 1.0 < 1.0 < 1.0 < 1.0 < 1.0 < 1.0
Alkalinity, Phenolphthalein (as CaCO3) mg/L - < 1.0 < 1.0 - < 1.0 - 50.8 - < 1.0 - < 1.0 -
Bromide mg/L 3.9 < 1.00 < 1.00 < 1.00 < 2.50 < 2.50 2.37 2.37 < 1.00 < 1.00 < 1.00 < 1.00
Sulfide mg/L - < 0.020 31.7 - 102 - 26.7 - 46.1 - 129 -
Biochemical Oxygen Demand mg/L - < 5.5 63.7 - 301 - 111 - 58.3 - 275 -
Chemical Oxygen Demand mg/L 529 < 20 382 382 925 925 436 436 430 430 947 947
Phosphate mg/L - 0.0860 3.02 - 6.51 - - - 2.90 - - -
Ortho-Phosphate mg/L 4.5 - - 3.02 - 6.51 3.27 3.27 - 2.9 0.865 0.865
Total Organic Carbon mg/L - - - - - - - - - - - -
Total Phosphorous as P mg/L - 0.143 4.00 - 8.06 - 4.30 - 3.99 - 10.1 -
Dissolved Metals
Dissolved Aluminum µg/L 156 < 5.0 78.3 78.3 180 180 81.6 81.6 72.4 72.4 168 168
Dissolved Calcium mg/L 66.2 69.3 83.0 83 54.6 54.6 57.9 57.9 83.1 83.1 50.6 50.6
Dissolved Iron µg/L 53 11 97 97 68 68 48 48 52 52 62 62
Dissolved Magnesium mg/L 305 136 205 205 257 257 204 204 232 232 215 215
Dissolved Manganese µg/L 317 27.9 305 305 196 196 157 157 316 316 154 154
Dissolved Potassium mg/L 253 16.7 151 151 307 307 134 134 158 158 251 251
Dissolved Sodium mg/L 3,250 184 1,330 1,330 4,180 4,180 1,960 1,960 1,720 1,720 4,200 4,200
Antimony µg/L 4.66 < 0.20 9.61 9.61 25.1 25.1 8.90 8.9 6.92 6.92 11.2 11.2
Arsenic µg/L 15.8 1.15 25.8 25.8 89.9 89.9 20.8 20.8 19.8 19.8 34.5 34.5
Barium µg/L 172 78.9 205 205 142 142 85.7 85.7 159 159 156 156
Beryllium µg/L < 0.50 < 0.10 < 0.10 < 0.10 < 0.10 < 0.10 < 0.10 < 0.10 < 0.10 < 0.10 < 0.10 < 0.10
Boron µg/L 1,930 28.0 1,350 1,350 1,740 1,740 978 978 1,240 1,240 2,260 2,260
Cadmium µg/L < 0.025 0.015 0.011 0.011 0.012 0.012 0.013 0.013 < 0.010 < 0.010 0.014 0.014
Chromium µg/L 26.5 2.63 15.7 15.7 45.7 45.7 14.3 14.3 15.3 15.3 47.6 47.6
Cobalt µg/L 5 0.12 3.88 3.88 5.46 5.46 2.14 2.14 4.59 4.59 5.77 5.77
Copper µg/L 2 1.09 < 0.40 < 0.40 < 0.40 < 0.40 0.68 0.68 0.43 0.43 0.48 0.41
Lead µg/L < 0.25 < 0.20 < 0.20 < 0.20 0.22 0.22 < 0.20 < 0.20 < 0.20 < 0.20 < 0.20 < 0.20
Lithium µg/L 65.8 36.9 54.6 54.6 49.2 49.2 55.4 55.4 48.8 48.8 64.5 64.5
Mercury µg/L < 0.25 < 0.010 < 0.010 < 0.010 < 0.200 < 0.200 < 0.100 < 0.100 < 0.010 < 0.010 < 0.010 < 0.010
Molybdenum µg/L 2.33 18.9 6.22 6.22 5.33 5.33 7.16 7.16 3.32 3.32 5.46 5.46
Nickel µg/L 27.5 1.02 21.8 21.8 33.6 33.6 13.2 13.2 16.6 16.6 33.1 33.1
Selenium µg/L 14.4 7.41 2.58 2.58 1.35 1.35 2.42 2.42 0.96 0.96 20.7 20.7
Silver µg/L 0.078 < 0.050 < 0.050 < 0.050 < 0.050 < 0.050 < 0.050 < 0.050 < 0.050 < 0.050 < 0.050 < 0.050
Thallium µg/L < 0.050 < 0.020 < 0.020 < 0.020 < 0.020 < 0.020 < 0.020 < 0.020 < 0.020 < 0.020 < 0.020 < 0.020
Titanium µg/L 60.1 < 5.0 40.4 40.4 116 116 30.4 30.4 45.2 45.2 118 118
Tungsten µg/L - < 1.0 2.3 - 4.8 - 1.8 - 2.4 - 4.9 -
Uranium µg/L 14.2 39.5 25.0 25 37.2 37.2 33.3 33.3 16.8 16.8 26.2 26.2
Vanadium µg/L 19.1 3.3 13.0 13 27.6 27.6 8.5 8.5 11.6 11.6 24.1 24.1
Zinc µg/L < 5.0 < 4.0 < 4.0 < 4.0 < 4.0 < 4.0 < 4.0 < 4.0 < 4.0 < 4.0 < 4.0 < 4.0
Bismuth µg/L < 0.25 < 0.10 < 0.10 < 0.10 < 0.10 < 0.10 < 0.10 < 0.10 < 0.10 < 0.10 < 0.10 < 0.10
Phosphorous µg/L 8,100 158 4,380 4,380 9,480 9,480 4,530 4,530 4,100 4,100 9,920 9,920
Silicon µg/L 13,100 10,700 14,200 14,200 14,700 14,700 10,300 10,300 13,500 13,500 15,300 15,300
Strontium µg/L 2,800 3,160 3,480 3,480 2,510 2,510 2,320 2,320 3,410 3,410 2,440 2,440
Sulphur µg/L 1,180,000 100,000 431,000 - 1,420,000 - 581,000 - 473,000 - 2,810,000 -
Tellurium µg/L < 1.0 < 0.50 < 0.50 < 0.50 < 0.50 < 0.50 < 0.50 < 0.50 < 0.50 < 0.50 < 0.50 < 0.50
Thorium µg/L < 0.50 < 0.10 < 0.10 < 0.10 < 0.10 < 0.10 < 0.10 < 0.10 < 0.10 < 0.10 < 0.10 < 0.10
Tin µg/L 14.7 < 0.20 15.4 15.4 59.9 59.9 18.8 18.8 11.4 11.4 53.3 53.3
Zirconium µg/L 32.7 0.18 21.5 21.5 51.1 51.1 15.1 15.1 18.7 18.7 50.6 50.6
Monocyclic Aromatic Hydrocarbons
Benzene µg/L 5.43 < 0.5 4.9 4.9 8.7 8.7 2.9 2.9 3.0 3 8.8 8.8
Ethylbenzene µg/L 41.4 < 1.0 79.4 79.4 53.4 53.4 5.9 5.9 47.0 47 79.3 79.3
Toluene µg/L 1.23 < 1.0 3.8 3.8 2.3 2.3 1.7 1.7 < 1.0 < 1.0 2.7 2.7
Xylenes µg/L 31.1 < 2.0 59.6 59.6 86.4 86.4 7.3 7.3 26.8 26.8 99.6 99.6
Styrene µg/L - < 1.0 < 1.0 - < 1.0 - < 1.0 - < 1.0 - < 1.0 -
Polycyclic Aromatic Hydrocarbons
Naphthalene µg/L 2.06 < 0.200 2.08 2.08 3.52 3.52 5.93 5.93 3.41 3.41 6.98 6.98
Methylnaphthalene, 1- µg/L - < 0.100 0.620 - 0.545 - 1.06 - 0.644 - 0.947 -
Methylnaphthalene, 2- µg/L - < 0.100 0.721 - 0.407 - 1.10 - 0.568 - 0.886 -
Acenaphthylene µg/L < 0.010 < 0.200 < 0.200 < 0.200 < 0.200 < 0.200 < 0.200 < 0.200 < 0.200 < 0.200 < 0.200 < 0.200
Acenaphthene µg/L 0.312 < 0.050 0.233 0.233 0.293 0.293 0.386 0.386 0.518 0.518 0.410 0.41
Fluorene µg/L 0.234 < 0.050 0.164 0.164 0.212 0.212 0.221 0.221 0.336 0.336 0.271 0.271
Phenanthrene µg/L 0.213 < 0.100 0.190 0.19 0.341 0.341 0.242 0.242 0.419 0.419 0.395 0.395
Anthracene µg/L < 0.030 < 0.010 0.019 0.019 < 0.010 < 0.010 0.019 0.019 0.023 0.023 0.045 0.045
Acridine µg/L < 0.050 < 0.050 < 0.050 < 0.050 < 0.050 < 0.050 < 0.050 < 0.050 < 0.050 < 0.050 < 0.050 < 0.050
Fluoranthene µg/L 0.05 < 0.030 < 0.030 < 0.030 0.172 0.172 0.090 0.09 0.118 0.118 0.150 0.15
Pyrene µg/L 0.043 < 0.020 0.033 0.033 0.091 0.091 0.064 0.064 0.025 0.025 0.115 0.115
Benz(a)anthracene µg/L < 0.010 < 0.010 < 0.010 < 0.010 0.017 0.017 < 0.010 < 0.010 < 0.010 < 0.010 0.017 0.017
Chrysene µg/L < 0.010 < 0.050 < 0.050 < 0.050 < 0.050 < 0.050 < 0.050 < 0.050 < 0.050 < 0.050 < 0.050 < 0.050
Benzo(b)fluoranthene µg/L - - - - - - - - - - - -
Benzo(b+j)fluoranthene µg/L - < 0.050 < 0.050 - < 0.050 - < 0.050 - < 0.050 - < 0.050 -
Benzo(k)fluoranthene µg/L < 0.010 < 0.050 < 0.050 < 0.050 < 0.050 < 0.050 < 0.050 < 0.050 < 0.050 < 0.050 < 0.050 < 0.050
Benzo(a)pyrene µg/L < 0.0050 < 0.010 < 0.010 < 0.010 < 0.010 < 0.010 < 0.010 < 0.010 < 0.010 < 0.010 < 0.010 < 0.010
Indeno(1,2,3-cd)pyrene µg/L < 0.010 < 0.050 < 0.050 < 0.050 < 0.050 < 0.050 < 0.050 < 0.050 < 0.050 < 0.050 < 0.050 < 0.050
Dibenz(a,h)anthracene µg/L < 0.0050 < 0.010 < 0.010 < 0.010 < 0.010 < 0.010 < 0.010 < 0.010 < 0.010 < 0.010 < 0.010 < 0.010
Benzo(g,h,i)perylene µg/L < 0.010 < 0.050 < 0.050 - < 0.050 - < 0.050 - < 0.050 - < 0.050 -
Chloronaphthalene, 2- µg/L - < 0.100 < 0.100 - < 0.100 - < 0.100 - < 0.100 - < 0.100 -
Quinoline µg/L < 0.070 < 0.050 < 0.050 < 0.050 < 0.050 < 0.050 < 0.050 < 0.050 < 0.050 < 0.050 < 0.050 < 0.050
Volatile Organic Compounds
Bromodichloromethane [BDCM] µg/L < 1.0 < 1.0 < 1.0 < 1.0 < 1.0 < 1.0 < 1.0 < 1.0 < 1.0 < 1.0 < 1.0 < 1.0
Bromoform µg/L < 1.0 < 1.0 < 1.0 < 1.0 < 1.0 < 1.0 < 1.0 < 1.0 < 1.0 < 1.0 < 1.0 < 1.0
Carbon Tetrachloride µg/L < 0.50 < 0.5 < 0.5 < 0.5 < 0.5 < 0.5 < 0.5 < 0.5 < 0.5 < 0.5 < 0.5 < 0.5
Chlorobenzene µg/L < 2.0 < 1.0 < 1.0 < 1.0 < 1.0 < 1.0 < 1.0 < 1.0 < 1.1 < 1.1 < 1.0 < 1.0
Chloroethane µg/L < 3.0 < 2.0 < 2.0 < 2.0 < 2.0 < 2.0 < 2.0 < 2.0 2.0 2 < 2.0 < 2.0
Chloroform µg/L < 1.0 < 1.0 < 1.0 < 1.0 < 1.0 < 1.0 < 1.0 < 1.0 < 1.0 < 1.0 < 1.0 < 1.0
Chloromethane µg/L < 5.0 - - - - - - - - - - -
Dibromochloromethane [DBCM] µg/L < 1.0 < 1.0 < 1.0 < 1.0 < 1.0 < 1.0 < 1.0 < 1.0 < 1.0 < 1.0 < 1.0 < 1.0
Dibromoethane, 1,2- µg/L - < 0.3 < 0.3 - < 0.3 - < 0.3 - < 0.3 - < 0.3 -
Dibromomethane µg/L - < 1.0 < 1.0 - < 1.0 - < 1.0 - < 1.0 - < 1.0 -
Dichlorobenzene, 1,2- µg/L < 0.50 < 0.5 < 0.5 < 0.5 0.6 0.6 < 0.5 < 0.5 < 0.5 < 0.5 < 0.5 < 0.5
Dichlorobenzene, 1,3- µg/L < 1.0 < 1.0 < 1.0 < 1.0 < 1.0 < 1.0 < 1.0 < 1.0 2.1 2.1 < 1.0 < 1.0
Dichlorobenzene, 1,4- µg/L 1.6 < 1.0 < 2.3 < 2.3 3.0 3 < 1.0 < 1.0 2.1 2.1 3.0 3
Dichloroethane, 1,1- µg/L 3.2 < 1.0 1.8 1.8 10.8 10.8 2.6 2.6 3.6 3.6 9.0 9
Dichloroethane, 1,2- µg/L < 1.0 < 1.0 < 1.0 < 1.0 < 1.0 < 1.0 < 1.0 < 1.0 < 1.0 < 1.0 < 1.0 < 1.0
Dichloroethylene, 1,1- µg/L < 1.0 < 1.0 < 1.0 < 1.0 < 1.0 < 1.0 < 1.0 < 1.0 < 1.0 < 1.0 < 1.0 < 1.0
Dichloroethylene, 1,2-cis- µg/L < 1.0 < 1.0 < 1.0 < 1.0 < 1.0 < 1.0 < 1.0 < 1.0 < 1.0 < 1.0 < 1.0 < 1.0
Dichloroethylene, 1,2-trans- µg/L < 1.0 < 1.0 < 1.0 < 1.0 < 1.0 < 1.0 < 1.0 < 1.0 < 1.0 < 1.0 < 1.0 < 1.0
Dichloromethane µg/L < 5.0 < 3.0 < 3.0 < 3.0 < 3.0 < 3.0 < 3.0 < 3.0 < 3.0 < 3.0 < 3.0 < 3.0
Dichloropropane, 1,2- µg/L < 1.0 < 1.0 < 1.0 < 1.0 < 1.0 < 1.0 < 1.0 < 1.0 < 1.0 < 1.0 < 1.0 < 1.0
Dichloropropene, 1,3- (cis+trans) µg/L < 1.0 < 1.0 < 1.0 - < 1.0 - < 1.0 - < 1.0 - < 1.0 -
Dichloropropene, 1,3-cis- µg/L < 0.50 - - - - - - - - - - -
Dichloropropene, 1,3-trans- µg/L < 0.50 - - - - - - - - - - -
Tetrachloroethane, 1,1,1,2- µg/L < 1.0 - - - - - - - - - - -
Tetrachloroethane, 1,1,2,2- µg/L < 0.20 < 0.5 < 0.5 < 0.5 < 0.5 < 0.5 < 0.5 < 0.5 < 0.5 < 0.5 < 0.5 < 0.5
Tetrachloroethylene µg/L < 1.0 < 1.0 < 1.0 < 1.0 < 1.0 < 1.0 < 1.0 < 1.0 < 1.0 < 1.0 < 1.0 < 1.0
Trichloroethane, 1,1,1- µg/L < 1.0 < 1.0 < 1.0 < 1.0 < 1.0 < 1.0 < 1.0 < 1.0 < 1.0 < 1.0 < 1.0 < 1.0
Trichloroethane, 1,1,2- µg/L < 0.50 < 1.0 < 1.0 < 1.0 < 1.0 < 1.0 < 1.0 < 1.0 < 1.0 < 1.0 < 1.0 < 1.0
Trichloroethylene µg/L < 1.0 < 1.0 < 1.0 < 1.0 < 1.0 < 1.0 < 1.0 < 1.0 < 1.0 < 1.0 < 1.0 < 1.0
Trichlorofluoromethane µg/L < 1.0 < 1.0 < 1.0 < 1.0 < 1.0 < 1.0 < 1.0 < 1.0 < 1.0 < 1.0 < 1.0 < 1.0
Vinyl Chloride µg/L < 0.40 < 1.0 < 1.0 < 1.0 1.0 1 < 1.0 < 1.0 < 1.0 < 1.0 < 1.0 < 1.0
Gross Parameters
VH (C6-C10) µg/L - < 100 147 147 181 181 < 100 < 100 < 100 < 100 224 224
VPH (C6-C10) µg/L - < 100 < 100 < 100 < 100 < 100 < 100 < 100 < 100 < 100 < 100 < 100
EPH (C10-C19) µg/L 250 < 250 766 766 346 346 681 681 724 724 953 953
LEPH (C10-C19) µg/L 250 < 250 763 763 342 342 675 675 719 719 945 945
EPH (C19-C32) µg/L < 250 < 250 660 660 < 250 < 250 429 429 474 474 858 858
HEPH (C19-C32) µg/L < 250 < 250 660 660 < 250 < 250 429 429 474 474 858 858
MTBE
Methyl Tert-butyl Ether [MTBE] µg/L - < 1.0 < 1.0 - < 1.0 - < 1.0 - < 1.0 - < 1.0 -
Resin and Fatty Acids
Acetic Acid mg/L - - - - - - < 3.0 - < 3.0 - 3.0 -
Butyric Acid mg/L - - - - - - < 2.0 - < 2.0 - < 2.0 -
Caporic Acid mg/L - - - - - - < 2.0 - 2.4 - < 2.0 -
Heptanoic Acid mg/L - - - - - - < 2.0 - < 2.0 - < 2.0 -
Isobutyric Acid mg/L - - - - - - < 2.0 - < 2.0 - < 2.0 -
Isocaproic Acid mg/L - - - - - - < 2.0 - < 2.0 - < 2.0 -
Isovaleric Acid mg/L - - - - - - < 2.0 - < 2.0 - < 2.0 -
Propionic Acid mg/L - - - - - - < 2.0 - < 2.0 - < 2.0 -
Valeric Acid mg/L - - - - - - < 2.0 - < 2.0 - < 2.0 -
Associated CARO file(s): 8031228, 8052345, 8081555, 8110837, 9031248, 9060275, 9090105, mg/l, N000833, ug/L.
Associated Exova file(s): 506479, 507801, 509233, 600276, 602695, 605393, 608922, 611891, 614770, 617175, 619914, 625680, 627511, 629501.
All terms defined within the body of SNC-Lavalin's report.
< Denotes concentration less than indicated detection limit or RPD less than indicated value.
- Denotes analysis not conducted.
n/a Denotes no applicable standard/guideline.
QA/QC RPD Denotes quality assurance/quality control relative percent difference
* RPDs are not calculated where one or more concentrations are less than five times RDL.
RDL Denotes reported detection limit.
SNC-LAVALIN INC. Page 3 of 8
662036 / 2021 03 09
20210309_662036_TAB_Historical.xlsx QAQC CN 2021 03 09
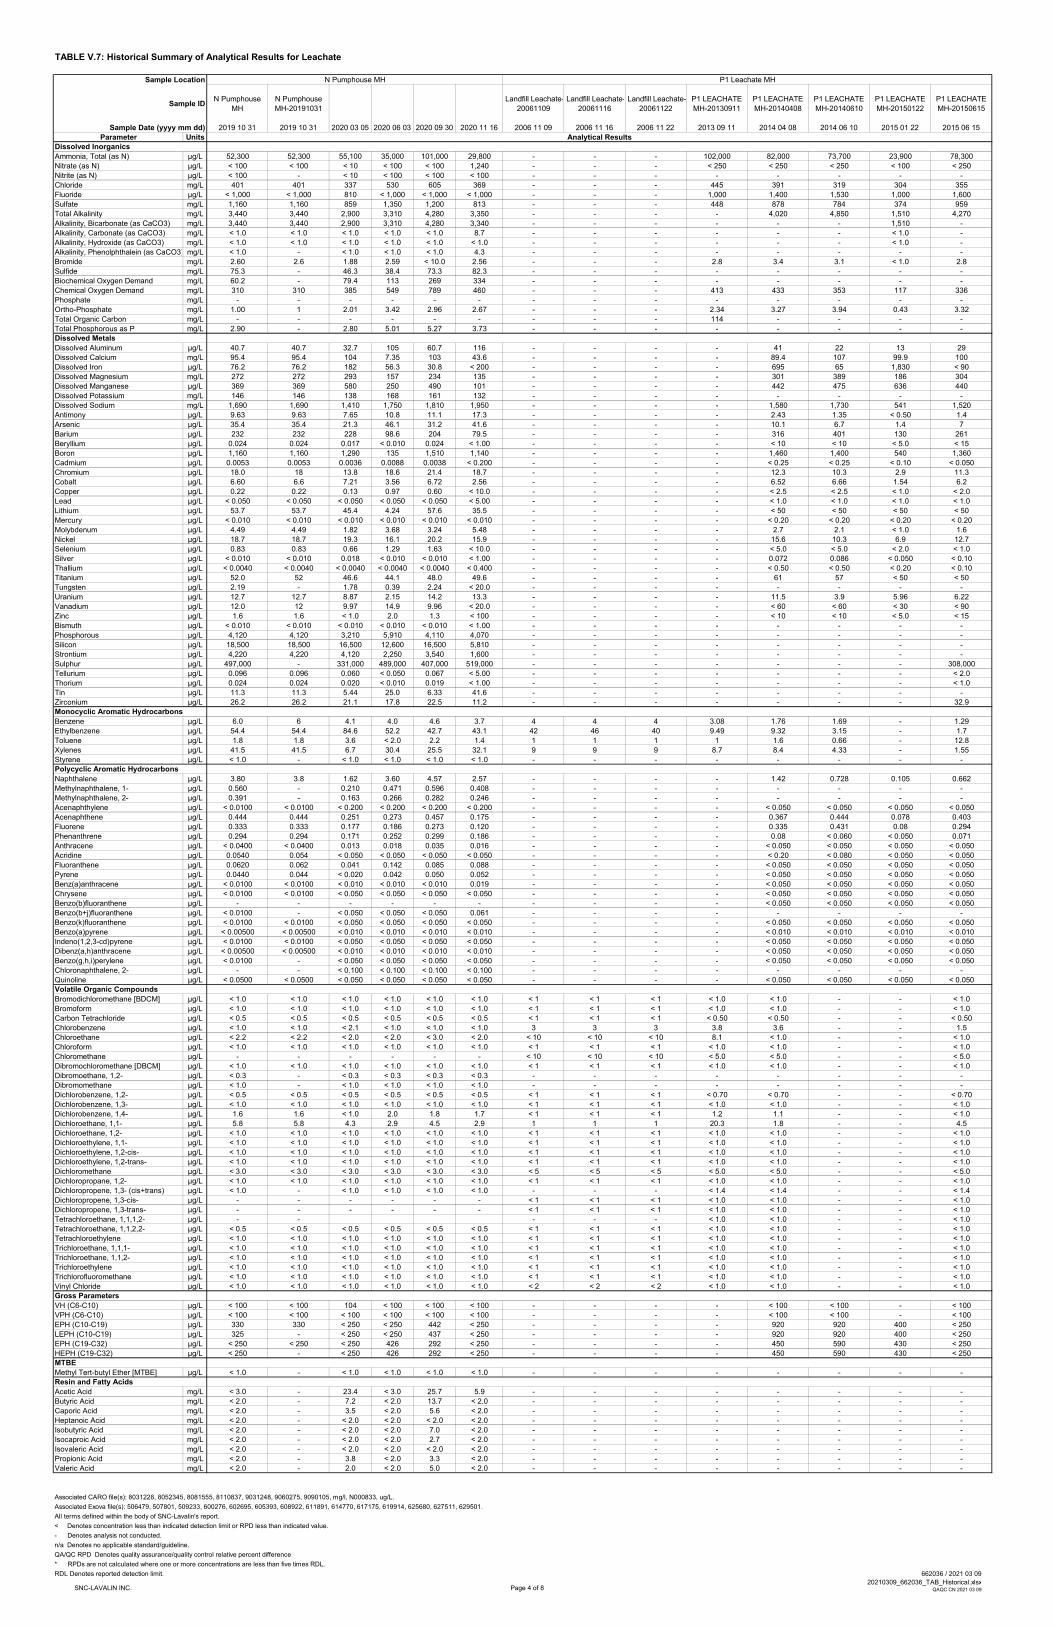
TABLE V.7: Historical Summary of Analytical Results for Leachate
Sample Location N Pumphouse MH P1 Leachate MH
Sample IDN Pumphouse
MH
N Pumphouse
MH-20191031
Landfill Leachate-
20061109
Landfill Leachate-
20061116
Landfill Leachate-
20061122
P1 LEACHATE
MH-20130911
P1 LEACHATE
MH-20140408
P1 LEACHATE
MH-20140610
P1 LEACHATE
MH-20150122
P1 LEACHATE
MH-20150615
Sample Date (yyyy mm dd) 2019 10 31 2019 10 31 2020 03 05 2020 06 03 2020 09 30 2020 11 16 2006 11 09 2006 11 16 2006 11 22 2013 09 11 2014 04 08 2014 06 10 2015 01 22 2015 06 15
Parameter Units Analytical Results
Dissolved Inorganics
Ammonia, Total (as N) µg/L 52,300 52,300 55,100 35,000 101,000 29,800 - - - 102,000 82,000 73,700 23,900 78,300
Nitrate (as N) µg/L < 100 < 100 < 10 < 100 < 100 1,240 - - - < 250 < 250 < 250 < 100 < 250
Nitrite (as N) µg/L < 100 - < 10 < 100 < 100 < 100 - - - - - - - -
Chloride mg/L 401 401 337 530 605 369 - - - 445 391 319 304 355
Fluoride µg/L < 1,000 < 1,000 810 < 1,000 < 1,000 < 1,000 - - - 1,000 1,400 1,530 1,000 1,600
Sulfate mg/L 1,160 1,160 859 1,350 1,200 813 - - - 448 878 784 374 959
Total Alkalinity mg/L 3,440 3,440 2,900 3,310 4,280 3,350 - - - - 4,020 4,850 1,510 4,270
Alkalinity, Bicarbonate (as CaCO3) mg/L 3,440 3,440 2,900 3,310 4,280 3,340 - - - - - - 1,510 -
Alkalinity, Carbonate (as CaCO3) mg/L < 1.0 < 1.0 < 1.0 < 1.0 < 1.0 8.7 - - - - - - < 1.0 -
Alkalinity, Hydroxide (as CaCO3) mg/L < 1.0 < 1.0 < 1.0 < 1.0 < 1.0 < 1.0 - - - - - - < 1.0 -
Alkalinity, Phenolphthalein (as CaCO3) mg/L < 1.0 - < 1.0 < 1.0 < 1.0 4.3 - - - - - - - -
Bromide mg/L 2.60 2.6 1.88 2.59 < 10.0 2.56 - - - 2.8 3.4 3.1 < 1.0 2.8
Sulfide mg/L 75.3 - 46.3 38.4 73.3 82.3 - - - - - - - -
Biochemical Oxygen Demand mg/L 60.2 - 79.4 113 269 334 - - - - - - - -
Chemical Oxygen Demand mg/L 310 310 385 549 789 460 - - - 413 433 353 117 336
Phosphate mg/L - - - - - - - - - - - - - -
Ortho-Phosphate mg/L 1.00 1 2.01 3.42 2.96 2.67 - - - 2.34 3.27 3.94 0.43 3.32
Total Organic Carbon mg/L - - - - - - - - - 114 - - - -
Total Phosphorous as P mg/L 2.90 - 2.80 5.01 5.27 3.73 - - - - - - - -
Dissolved Metals
Dissolved Aluminum µg/L 40.7 40.7 32.7 105 60.7 116 - - - - 41 22 13 29
Dissolved Calcium mg/L 95.4 95.4 104 7.35 103 43.6 - - - - 89.4 107 99.9 100
Dissolved Iron µg/L 76.2 76.2 182 56.3 30.8 < 200 - - - - 695 65 1,830 < 90
Dissolved Magnesium mg/L 272 272 293 157 234 135 - - - - 301 389 186 304
Dissolved Manganese µg/L 369 369 580 250 490 101 - - - - 442 475 636 440
Dissolved Potassium mg/L 146 146 138 168 161 132 - - - - - - - -
Dissolved Sodium mg/L 1,690 1,690 1,410 1,750 1,810 1,950 - - - - 1,580 1,730 541 1,520
Antimony µg/L 9.63 9.63 7.65 10.8 11.1 17.3 - - - - 2.43 1.35 < 0.50 1.4
Arsenic µg/L 35.4 35.4 21.3 46.1 31.2 41.6 - - - - 10.1 6.7 1.4 7
Barium µg/L 232 232 228 98.6 204 79.5 - - - - 316 401 130 261
Beryllium µg/L 0.024 0.024 0.017 < 0.010 0.024 < 1.00 - - - - < 10 < 10 < 5.0 < 15
Boron µg/L 1,160 1,160 1,290 135 1,510 1,140 - - - - 1,460 1,400 540 1,360
Cadmium µg/L 0.0053 0.0053 0.0036 0.0088 0.0038 < 0.200 - - - - < 0.25 < 0.25 < 0.10 < 0.050
Chromium µg/L 18.0 18 13.8 18.6 21.4 18.7 - - - - 12.3 10.3 2.9 11.3
Cobalt µg/L 6.60 6.6 7.21 3.56 6.72 2.56 - - - - 6.52 6.66 1.54 6.2
Copper µg/L 0.22 0.22 0.13 0.97 0.60 < 10.0 - - - - < 2.5 < 2.5 < 1.0 < 2.0
Lead µg/L < 0.050 < 0.050 < 0.050 < 0.050 < 0.050 < 5.00 - - - - < 1.0 < 1.0 < 1.0 < 1.0
Lithium µg/L 53.7 53.7 45.4 4.24 57.6 35.5 - - - - < 50 < 50 < 50 < 50
Mercury µg/L < 0.010 < 0.010 < 0.010 < 0.010 < 0.010 < 0.010 - - - - < 0.20 < 0.20 < 0.20 < 0.20
Molybdenum µg/L 4.49 4.49 1.82 3.68 3.24 5.48 - - - - 2.7 2.1 < 1.0 1.6
Nickel µg/L 18.7 18.7 19.3 16.1 20.2 15.9 - - - - 15.6 10.3 6.9 12.7
Selenium µg/L 0.83 0.83 0.66 1.29 1.63 < 10.0 - - - - < 5.0 < 5.0 < 2.0 < 1.0
Silver µg/L < 0.010 < 0.010 0.018 < 0.010 < 0.010 < 1.00 - - - - 0.072 0.086 < 0.050 < 0.10
Thallium µg/L < 0.0040 < 0.0040 < 0.0040 < 0.0040 < 0.0040 < 0.400 - - - - < 0.50 < 0.50 < 0.20 < 0.10
Titanium µg/L 52.0 52 46.6 44.1 48.0 49.6 - - - - 61 57 < 50 < 50
Tungsten µg/L 2.19 - 1.78 0.39 2.24 < 20.0 - - - - - - - -
Uranium µg/L 12.7 12.7 8.87 2.15 14.2 13.3 - - - - 11.5 3.9 5.96 6.22
Vanadium µg/L 12.0 12 9.97 14.9 9.96 < 20.0 - - - - < 60 < 60 < 30 < 90
Zinc µg/L 1.6 1.6 < 1.0 2.0 1.3 < 100 - - - - < 10 < 10 < 5.0 < 15
Bismuth µg/L < 0.010 < 0.010 < 0.010 < 0.010 < 0.010 < 1.00 - - - - - - - -
Phosphorous µg/L 4,120 4,120 3,210 5,910 4,110 4,070 - - - - - - - -
Silicon µg/L 18,500 18,500 16,500 12,600 16,500 5,810 - - - - - - - -
Strontium µg/L 4,220 4,220 4,120 2,250 3,540 1,600 - - - - - - - -
Sulphur µg/L 497,000 - 331,000 489,000 407,000 519,000 - - - - - - - 308,000
Tellurium µg/L 0.096 0.096 0.060 < 0.050 0.067 < 5.00 - - - - - - - < 2.0
Thorium µg/L 0.024 0.024 0.020 < 0.010 0.019 < 1.00 - - - - - - - < 1.0
Tin µg/L 11.3 11.3 5.44 25.0 6.33 41.6 - - - - - - - -
Zirconium µg/L 26.2 26.2 21.1 17.8 22.5 11.2 - - - - - - - 32.9
Monocyclic Aromatic Hydrocarbons
Benzene µg/L 6.0 6 4.1 4.0 4.6 3.7 4 4 4 3.08 1.76 1.69 - 1.29
Ethylbenzene µg/L 54.4 54.4 84.6 52.2 42.7 43.1 42 46 40 9.49 9.32 3.15 - 1.7
Toluene µg/L 1.8 1.8 3.6 < 2.0 2.2 1.4 1 1 1 1 1.6 0.66 - 12.8
Xylenes µg/L 41.5 41.5 6.7 30.4 25.5 32.1 9 9 9 8.7 8.4 4.33 - 1.55
Styrene µg/L < 1.0 - < 1.0 < 1.0 < 1.0 < 1.0 - - - - - - - -
Polycyclic Aromatic Hydrocarbons
Naphthalene µg/L 3.80 3.8 1.62 3.60 4.57 2.57 - - - - 1.42 0.728 0.105 0.662
Methylnaphthalene, 1- µg/L 0.560 - 0.210 0.471 0.596 0.408 - - - - - - - -
Methylnaphthalene, 2- µg/L 0.391 - 0.163 0.266 0.282 0.246 - - - - - - - -
Acenaphthylene µg/L < 0.0100 < 0.0100 < 0.200 < 0.200 < 0.200 < 0.200 - - - - < 0.050 < 0.050 < 0.050 < 0.050
Acenaphthene µg/L 0.444 0.444 0.251 0.273 0.457 0.175 - - - - 0.367 0.444 0.078 0.403
Fluorene µg/L 0.333 0.333 0.177 0.186 0.273 0.120 - - - - 0.335 0.431 0.08 0.294
Phenanthrene µg/L 0.294 0.294 0.171 0.252 0.299 0.186 - - - - 0.08 < 0.060 < 0.050 0.071
Anthracene µg/L < 0.0400 < 0.0400 0.013 0.018 0.035 0.016 - - - - < 0.050 < 0.050 < 0.050 < 0.050
Acridine µg/L 0.0540 0.054 < 0.050 < 0.050 < 0.050 < 0.050 - - - - < 0.20 < 0.080 < 0.050 < 0.050
Fluoranthene µg/L 0.0620 0.062 0.041 0.142 0.085 0.088 - - - - < 0.050 < 0.050 < 0.050 < 0.050
Pyrene µg/L 0.0440 0.044 < 0.020 0.042 0.050 0.052 - - - - < 0.050 < 0.050 < 0.050 < 0.050
Benz(a)anthracene µg/L < 0.0100 < 0.0100 < 0.010 < 0.010 < 0.010 0.019 - - - - < 0.050 < 0.050 < 0.050 < 0.050
Chrysene µg/L < 0.0100 < 0.0100 < 0.050 < 0.050 < 0.050 < 0.050 - - - - < 0.050 < 0.050 < 0.050 < 0.050
Benzo(b)fluoranthene µg/L - - - - - - - - - - < 0.050 < 0.050 < 0.050 < 0.050
Benzo(b+j)fluoranthene µg/L < 0.0100 - < 0.050 < 0.050 < 0.050 0.061 - - - - - - - -
Benzo(k)fluoranthene µg/L < 0.0100 < 0.0100 < 0.050 < 0.050 < 0.050 < 0.050 - - - - < 0.050 < 0.050 < 0.050 < 0.050
Benzo(a)pyrene µg/L < 0.00500 < 0.00500 < 0.010 < 0.010 < 0.010 < 0.010 - - - - < 0.010 < 0.010 < 0.010 < 0.010
Indeno(1,2,3-cd)pyrene µg/L < 0.0100 < 0.0100 < 0.050 < 0.050 < 0.050 < 0.050 - - - - < 0.050 < 0.050 < 0.050 < 0.050
Dibenz(a,h)anthracene µg/L < 0.00500 < 0.00500 < 0.010 < 0.010 < 0.010 < 0.010 - - - - < 0.050 < 0.050 < 0.050 < 0.050
Benzo(g,h,i)perylene µg/L < 0.0100 - < 0.050 < 0.050 < 0.050 < 0.050 - - - - < 0.050 < 0.050 < 0.050 < 0.050
Chloronaphthalene, 2- µg/L - - < 0.100 < 0.100 < 0.100 < 0.100 - - - - - - - -
Quinoline µg/L < 0.0500 < 0.0500 < 0.050 < 0.050 < 0.050 < 0.050 - - - - < 0.050 < 0.050 < 0.050 < 0.050
Volatile Organic Compounds
Bromodichloromethane [BDCM] µg/L < 1.0 < 1.0 < 1.0 < 1.0 < 1.0 < 1.0 < 1 < 1 < 1 < 1.0 < 1.0 - - < 1.0
Bromoform µg/L < 1.0 < 1.0 < 1.0 < 1.0 < 1.0 < 1.0 < 1 < 1 < 1 < 1.0 < 1.0 - - < 1.0
Carbon Tetrachloride µg/L < 0.5 < 0.5 < 0.5 < 0.5 < 0.5 < 0.5 < 1 < 1 < 1 < 0.50 < 0.50 - - < 0.50
Chlorobenzene µg/L < 1.0 < 1.0 < 2.1 < 1.0 < 1.0 < 1.0 3 3 3 3.8 3.6 - - 1.5
Chloroethane µg/L < 2.2 < 2.2 < 2.0 < 2.0 < 3.0 < 2.0 < 10 < 10 < 10 8.1 < 1.0 - - < 1.0
Chloroform µg/L < 1.0 < 1.0 < 1.0 < 1.0 < 1.0 < 1.0 < 1 < 1 < 1 < 1.0 < 1.0 - - < 1.0
Chloromethane µg/L - - - - - - < 10 < 10 < 10 < 5.0 < 5.0 - - < 5.0
Dibromochloromethane [DBCM] µg/L < 1.0 < 1.0 < 1.0 < 1.0 < 1.0 < 1.0 < 1 < 1 < 1 < 1.0 < 1.0 - - < 1.0
Dibromoethane, 1,2- µg/L < 0.3 - < 0.3 < 0.3 < 0.3 < 0.3 - - - - - - - -
Dibromomethane µg/L < 1.0 - < 1.0 < 1.0 < 1.0 < 1.0 - - - - - - - -
Dichlorobenzene, 1,2- µg/L < 0.5 < 0.5 < 0.5 < 0.5 < 0.5 < 0.5 < 1 < 1 < 1 < 0.70 < 0.70 - - < 0.70
Dichlorobenzene, 1,3- µg/L < 1.0 < 1.0 < 1.0 < 1.0 < 1.0 < 1.0 < 1 < 1 < 1 < 1.0 < 1.0 - - < 1.0
Dichlorobenzene, 1,4- µg/L 1.6 1.6 < 1.0 2.0 1.8 1.7 < 1 < 1 < 1 1.2 1.1 - - < 1.0
Dichloroethane, 1,1- µg/L 5.8 5.8 4.3 2.9 4.5 2.9 1 1 1 20.3 1.8 - - 4.5
Dichloroethane, 1,2- µg/L < 1.0 < 1.0 < 1.0 < 1.0 < 1.0 < 1.0 < 1 < 1 < 1 < 1.0 < 1.0 - - < 1.0
Dichloroethylene, 1,1- µg/L < 1.0 < 1.0 < 1.0 < 1.0 < 1.0 < 1.0 < 1 < 1 < 1 < 1.0 < 1.0 - - < 1.0
Dichloroethylene, 1,2-cis- µg/L < 1.0 < 1.0 < 1.0 < 1.0 < 1.0 < 1.0 < 1 < 1 < 1 < 1.0 < 1.0 - - < 1.0
Dichloroethylene, 1,2-trans- µg/L < 1.0 < 1.0 < 1.0 < 1.0 < 1.0 < 1.0 < 1 < 1 < 1 < 1.0 < 1.0 - - < 1.0
Dichloromethane µg/L < 3.0 < 3.0 < 3.0 < 3.0 < 3.0 < 3.0 < 5 < 5 < 5 < 5.0 < 5.0 - - < 5.0
Dichloropropane, 1,2- µg/L < 1.0 < 1.0 < 1.0 < 1.0 < 1.0 < 1.0 < 1 < 1 < 1 < 1.0 < 1.0 - - < 1.0
Dichloropropene, 1,3- (cis+trans) µg/L < 1.0 - < 1.0 < 1.0 < 1.0 < 1.0 - - - < 1.4 < 1.4 - - < 1.4
Dichloropropene, 1,3-cis- µg/L - - - - - - < 1 < 1 < 1 < 1.0 < 1.0 - - < 1.0
Dichloropropene, 1,3-trans- µg/L - - - - - - < 1 < 1 < 1 < 1.0 < 1.0 - - < 1.0
Tetrachloroethane, 1,1,1,2- µg/L - - - - - < 1.0 < 1.0 - - < 1.0
Tetrachloroethane, 1,1,2,2- µg/L < 0.5 < 0.5 < 0.5 < 0.5 < 0.5 < 0.5 < 1 < 1 < 1 < 1.0 < 1.0 - - < 1.0
Tetrachloroethylene µg/L < 1.0 < 1.0 < 1.0 < 1.0 < 1.0 < 1.0 < 1 < 1 < 1 < 1.0 < 1.0 - - < 1.0
Trichloroethane, 1,1,1- µg/L < 1.0 < 1.0 < 1.0 < 1.0 < 1.0 < 1.0 < 1 < 1 < 1 < 1.0 < 1.0 - - < 1.0
Trichloroethane, 1,1,2- µg/L < 1.0 < 1.0 < 1.0 < 1.0 < 1.0 < 1.0 < 1 < 1 < 1 < 1.0 < 1.0 - - < 1.0
Trichloroethylene µg/L < 1.0 < 1.0 < 1.0 < 1.0 < 1.0 < 1.0 < 1 < 1 < 1 < 1.0 < 1.0 - - < 1.0
Trichlorofluoromethane µg/L < 1.0 < 1.0 < 1.0 < 1.0 < 1.0 < 1.0 < 1 < 1 < 1 < 1.0 < 1.0 - - < 1.0
Vinyl Chloride µg/L < 1.0 < 1.0 < 1.0 < 1.0 < 1.0 < 1.0 < 2 < 2 < 2 < 1.0 < 1.0 - - < 1.0
Gross Parameters
VH (C6-C10) µg/L < 100 < 100 104 < 100 < 100 < 100 - - - - < 100 < 100 - < 100
VPH (C6-C10) µg/L < 100 < 100 < 100 < 100 < 100 < 100 - - - - < 100 < 100 - < 100
EPH (C10-C19) µg/L 330 330 < 250 < 250 442 < 250 - - - - 920 920 400 < 250
LEPH (C10-C19) µg/L 325 - < 250 < 250 437 < 250 - - - - 920 920 400 < 250
EPH (C19-C32) µg/L < 250 < 250 < 250 426 292 < 250 - - - - 450 590 430 < 250
HEPH (C19-C32) µg/L < 250 - < 250 426 292 < 250 - - - - 450 590 430 < 250
MTBE
Methyl Tert-butyl Ether [MTBE] µg/L < 1.0 - < 1.0 < 1.0 < 1.0 < 1.0 - - - - - - - -
Resin and Fatty Acids
Acetic Acid mg/L < 3.0 - 23.4 < 3.0 25.7 5.9 - - - - - - - -
Butyric Acid mg/L < 2.0 - 7.2 < 2.0 13.7 < 2.0 - - - - - - - -
Caporic Acid mg/L < 2.0 - 3.5 < 2.0 5.6 < 2.0 - - - - - - - -
Heptanoic Acid mg/L < 2.0 - < 2.0 < 2.0 < 2.0 < 2.0 - - - - - - - -
Isobutyric Acid mg/L < 2.0 - < 2.0 < 2.0 7.0 < 2.0 - - - - - - - -
Isocaproic Acid mg/L < 2.0 - < 2.0 < 2.0 2.7 < 2.0 - - - - - - - -
Isovaleric Acid mg/L < 2.0 - < 2.0 < 2.0 < 2.0 < 2.0 - - - - - - - -
Propionic Acid mg/L < 2.0 - 3.8 < 2.0 3.3 < 2.0 - - - - - - - -
Valeric Acid mg/L < 2.0 - 2.0 < 2.0 5.0 < 2.0 - - - - - - - -
Associated CARO file(s): 8031228, 8052345, 8081555, 8110837, 9031248, 9060275, 9090105, mg/l, N000833, ug/L.
Associated Exova file(s): 506479, 507801, 509233, 600276, 602695, 605393, 608922, 611891, 614770, 617175, 619914, 625680, 627511, 629501.
All terms defined within the body of SNC-Lavalin's report.
< Denotes concentration less than indicated detection limit or RPD less than indicated value.
- Denotes analysis not conducted.
n/a Denotes no applicable standard/guideline.
QA/QC RPD Denotes quality assurance/quality control relative percent difference
* RPDs are not calculated where one or more concentrations are less than five times RDL.
RDL Denotes reported detection limit.
SNC-LAVALIN INC. Page 4 of 8
662036 / 2021 03 09
20210309_662036_TAB_Historical.xlsx QAQC CN 2021 03 09
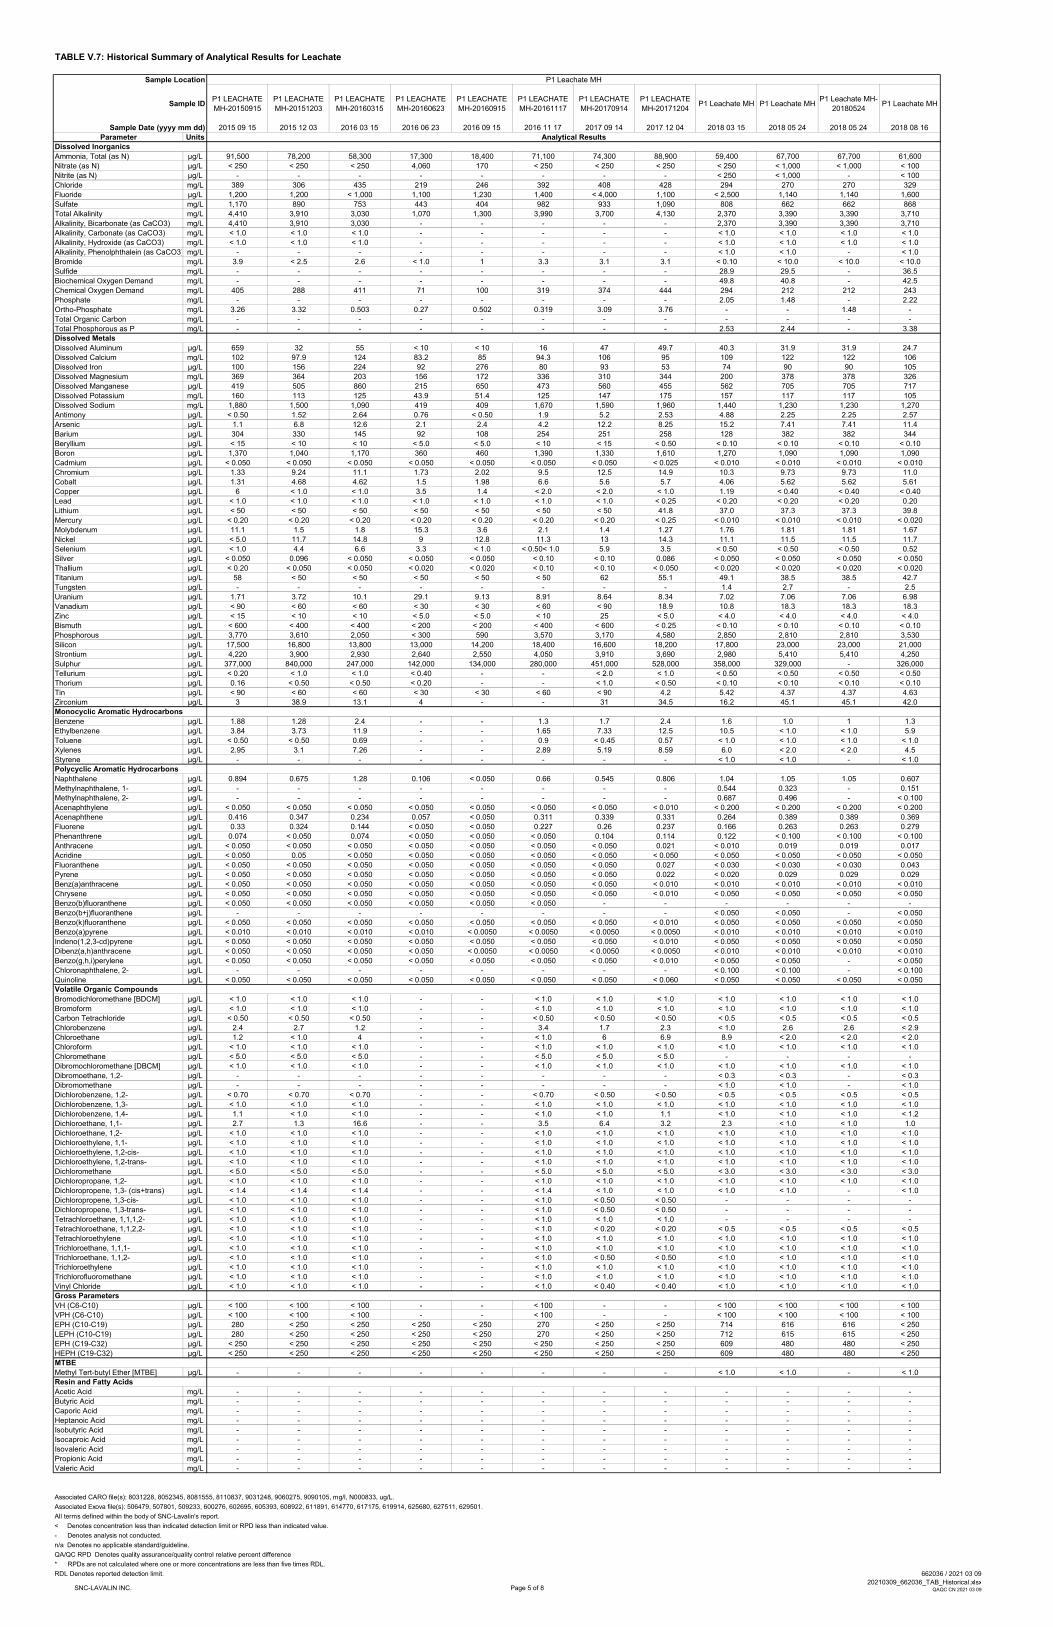
TABLE V.7: Historical Summary of Analytical Results for Leachate
Sample Location P1 Leachate MH
Sample IDP1 LEACHATE
MH-20150915
P1 LEACHATE
MH-20151203
P1 LEACHATE
MH-20160315
P1 LEACHATE
MH-20160623
P1 LEACHATE
MH-20160915
P1 LEACHATE
MH-20161117
P1 LEACHATE
MH-20170914
P1 LEACHATE
MH-20171204P1 Leachate MH P1 Leachate MH
P1 Leachate MH-
20180524P1 Leachate MH
Sample Date (yyyy mm dd) 2015 09 15 2015 12 03 2016 03 15 2016 06 23 2016 09 15 2016 11 17 2017 09 14 2017 12 04 2018 03 15 2018 05 24 2018 05 24 2018 08 16
Parameter Units Analytical Results
Dissolved Inorganics
Ammonia, Total (as N) µg/L 91,500 78,200 58,300 17,300 18,400 71,100 74,300 88,900 59,400 67,700 67,700 61,600
Nitrate (as N) µg/L < 250 < 250 < 250 4,060 170 < 250 < 250 < 250 < 250 < 1,000 < 1,000 < 100
Nitrite (as N) µg/L - - - - - - - - < 250 < 1,000 - < 100
Chloride mg/L 389 306 435 219 246 392 408 428 294 270 270 329
Fluoride µg/L 1,200 1,200 < 1,000 1,100 1,230 1,400 < 4,000 1,100 < 2,500 1,140 1,140 1,600
Sulfate mg/L 1,170 890 753 443 404 982 933 1,090 808 662 662 868
Total Alkalinity mg/L 4,410 3,910 3,030 1,070 1,300 3,990 3,700 4,130 2,370 3,390 3,390 3,710
Alkalinity, Bicarbonate (as CaCO3) mg/L 4,410 3,910 3,030 - - - - - 2,370 3,390 3,390 3,710
Alkalinity, Carbonate (as CaCO3) mg/L < 1.0 < 1.0 < 1.0 - - - - - < 1.0 < 1.0 < 1.0 < 1.0
Alkalinity, Hydroxide (as CaCO3) mg/L < 1.0 < 1.0 < 1.0 - - - - - < 1.0 < 1.0 < 1.0 < 1.0
Alkalinity, Phenolphthalein (as CaCO3) mg/L - - - - - - - - < 1.0 < 1.0 - < 1.0
Bromide mg/L 3.9 < 2.5 2.6 < 1.0 1 3.3 3.1 3.1 < 0.10 < 10.0 < 10.0 < 10.0
Sulfide mg/L - - - - - - - - 28.9 29.5 - 36.5
Biochemical Oxygen Demand mg/L - - - - - - - - 49.8 40.8 - 42.5
Chemical Oxygen Demand mg/L 405 288 411 71 100 319 374 444 294 212 212 243
Phosphate mg/L - - - - - - - - 2.05 1.48 - 2.22
Ortho-Phosphate mg/L 3.26 3.32 0.503 0.27 0.502 0.319 3.09 3.76 - - 1.48 -
Total Organic Carbon mg/L - - - - - - - - - - - -
Total Phosphorous as P mg/L - - - - - - - - 2.53 2.44 - 3.38
Dissolved Metals
Dissolved Aluminum µg/L 659 32 55 < 10 < 10 16 47 49.7 40.3 31.9 31.9 24.7
Dissolved Calcium mg/L 102 97.9 124 83.2 85 94.3 106 95 109 122 122 106
Dissolved Iron µg/L 100 156 224 92 276 80 93 53 74 90 90 105
Dissolved Magnesium mg/L 369 364 203 156 172 336 310 344 200 378 378 326
Dissolved Manganese µg/L 419 505 860 215 650 473 560 455 562 705 705 717
Dissolved Potassium mg/L 160 113 125 43.9 51.4 125 147 175 157 117 117 105
Dissolved Sodium mg/L 1,880 1,500 1,090 419 409 1,670 1,590 1,960 1,440 1,230 1,230 1,270
Antimony µg/L < 0.50 1.52 2.64 0.76 < 0.50 1.9 5.2 2.53 4.88 2.25 2.25 2.57
Arsenic µg/L 1.1 6.8 12.6 2.1 2.4 4.2 12.2 8.25 15.2 7.41 7.41 11.4
Barium µg/L 304 330 145 92 108 254 251 258 128 382 382 344
Beryllium µg/L < 15 < 10 < 10 < 5.0 < 5.0 < 10 < 15 < 0.50 < 0.10 < 0.10 < 0.10 < 0.10
Boron µg/L 1,370 1,040 1,170 360 460 1,390 1,330 1,610 1,270 1,090 1,090 1,090
Cadmium µg/L < 0.050 < 0.050 < 0.050 < 0.050 < 0.050 < 0.050 < 0.050 < 0.025 < 0.010 < 0.010 < 0.010 < 0.010
Chromium µg/L 1.33 9.24 11.1 1.73 2.02 9.5 12.5 14.9 10.3 9.73 9.73 11.0
Cobalt µg/L 1.31 4.68 4.62 1.5 1.98 6.6 5.6 5.7 4.06 5.62 5.62 5.61
Copper µg/L 6 < 1.0 < 1.0 3.5 1.4 < 2.0 < 2.0 < 1.0 1.19 < 0.40 < 0.40 < 0.40
Lead µg/L < 1.0 < 1.0 < 1.0 < 1.0 < 1.0 < 1.0 < 1.0 < 0.25 < 0.20 < 0.20 < 0.20 0.20
Lithium µg/L < 50 < 50 < 50 < 50 < 50 < 50 < 50 41.8 37.0 37.3 37.3 39.8
Mercury µg/L < 0.20 < 0.20 < 0.20 < 0.20 < 0.20 < 0.20 < 0.20 < 0.25 < 0.010 < 0.010 < 0.010 < 0.020
Molybdenum µg/L 11.1 1.5 1.8 15.3 3.6 2.1 1.4 1.27 1.76 1.81 1.81 1.67
Nickel µg/L < 5.0 11.7 14.8 9 12.8 11.3 13 14.3 11.1 11.5 11.5 11.7
Selenium µg/L < 1.0 4.4 6.6 3.3 < 1.0 < 0.50< 1.0 5.9 3.5 < 0.50 < 0.50 < 0.50 0.52
Silver µg/L < 0.050 0.096 < 0.050 < 0.050 < 0.050 < 0.10 < 0.10 0.086 < 0.050 < 0.050 < 0.050 < 0.050
Thallium µg/L < 0.20 < 0.050 < 0.050 < 0.020 < 0.020 < 0.10 < 0.10 < 0.050 < 0.020 < 0.020 < 0.020 < 0.020
Titanium µg/L 58 < 50 < 50 < 50 < 50 < 50 62 55.1 49.1 38.5 38.5 42.7
Tungsten µg/L - - - - - - - - 1.4 2.7 - 2.5
Uranium µg/L 1.71 3.72 10.1 29.1 9.13 8.91 8.64 8.34 7.02 7.06 7.06 6.98
Vanadium µg/L < 90 < 60 < 60 < 30 < 30 < 60 < 90 18.9 10.8 18.3 18.3 18.3
Zinc µg/L < 15 < 10 < 10 < 5.0 < 5.0 < 10 25 < 5.0 < 4.0 < 4.0 < 4.0 < 4.0
Bismuth µg/L < 600 < 400 < 400 < 200 < 200 < 400 < 600 < 0.25 < 0.10 < 0.10 < 0.10 < 0.10
Phosphorous µg/L 3,770 3,610 2,050 < 300 590 3,570 3,170 4,580 2,850 2,810 2,810 3,530
Silicon µg/L 17,500 16,800 13,800 13,000 14,200 18,400 16,600 18,200 17,800 23,000 23,000 21,000
Strontium µg/L 4,220 3,900 2,930 2,640 2,550 4,050 3,910 3,690 2,980 5,410 5,410 4,250
Sulphur µg/L 377,000 840,000 247,000 142,000 134,000 280,000 451,000 528,000 358,000 329,000 - 326,000
Tellurium µg/L < 0.20 < 1.0 < 1.0 < 0.40 - - < 2.0 < 1.0 < 0.50 < 0.50 < 0.50 < 0.50
Thorium µg/L 0.16 < 0.50 < 0.50 < 0.20 - - < 1.0 < 0.50 < 0.10 < 0.10 < 0.10 < 0.10
Tin µg/L < 90 < 60 < 60 < 30 < 30 < 60 < 90 4.2 5.42 4.37 4.37 4.63
Zirconium µg/L 3 38.9 13.1 4 - - 31 34.5 16.2 45.1 45.1 42.0
Monocyclic Aromatic Hydrocarbons
Benzene µg/L 1.88 1.28 2.4 - - 1.3 1.7 2.4 1.6 1.0 1 1.3
Ethylbenzene µg/L 3.84 3.73 11.9 - - 1.65 7.33 12.5 10.5 < 1.0 < 1.0 5.9
Toluene µg/L < 0.50 < 0.50 0.69 - - 0.9 < 0.45 0.57 < 1.0 < 1.0 < 1.0 < 1.0
Xylenes µg/L 2.95 3.1 7.26 - - 2.89 5.19 8.59 6.0 < 2.0 < 2.0 4.5
Styrene µg/L - - - - - - - - < 1.0 < 1.0 - < 1.0
Polycyclic Aromatic Hydrocarbons
Naphthalene µg/L 0.894 0.675 1.28 0.106 < 0.050 0.66 0.545 0.806 1.04 1.05 1.05 0.607
Methylnaphthalene, 1- µg/L - - - - - - - - 0.544 0.323 - 0.151
Methylnaphthalene, 2- µg/L - - - - - - - - 0.687 0.496 - < 0.100
Acenaphthylene µg/L < 0.050 < 0.050 < 0.050 < 0.050 < 0.050 < 0.050 < 0.050 < 0.010 < 0.200 < 0.200 < 0.200 < 0.200
Acenaphthene µg/L 0.416 0.347 0.234 0.057 < 0.050 0.311 0.339 0.331 0.264 0.389 0.389 0.369
Fluorene µg/L 0.33 0.324 0.144 < 0.050 < 0.050 0.227 0.26 0.237 0.166 0.263 0.263 0.279
Phenanthrene µg/L 0.074 < 0.050 0.074 < 0.050 < 0.050 < 0.050 0.104 0.114 0.122 < 0.100 < 0.100 < 0.100
Anthracene µg/L < 0.050 < 0.050 < 0.050 < 0.050 < 0.050 < 0.050 < 0.050 0.021 < 0.010 0.019 0.019 0.017
Acridine µg/L < 0.050 0.05 < 0.050 < 0.050 < 0.050 < 0.050 < 0.050 < 0.050 < 0.050 < 0.050 < 0.050 < 0.050
Fluoranthene µg/L < 0.050 < 0.050 < 0.050 < 0.050 < 0.050 < 0.050 < 0.050 0.027 < 0.030 < 0.030 < 0.030 0.043
Pyrene µg/L < 0.050 < 0.050 < 0.050 < 0.050 < 0.050 < 0.050 < 0.050 0.022 < 0.020 0.029 0.029 0.029
Benz(a)anthracene µg/L < 0.050 < 0.050 < 0.050 < 0.050 < 0.050 < 0.050 < 0.050 < 0.010 < 0.010 < 0.010 < 0.010 < 0.010
Chrysene µg/L < 0.050 < 0.050 < 0.050 < 0.050 < 0.050 < 0.050 < 0.050 < 0.010 < 0.050 < 0.050 < 0.050 < 0.050
Benzo(b)fluoranthene µg/L < 0.050 < 0.050 < 0.050 < 0.050 < 0.050 < 0.050 - - - - - -
Benzo(b+j)fluoranthene µg/L - - - - - - - - < 0.050 < 0.050 - < 0.050
Benzo(k)fluoranthene µg/L < 0.050 < 0.050 < 0.050 < 0.050 < 0.050 < 0.050 < 0.050 < 0.010 < 0.050 < 0.050 < 0.050 < 0.050
Benzo(a)pyrene µg/L < 0.010 < 0.010 < 0.010 < 0.010 < 0.0050 < 0.0050 < 0.0050 < 0.0050 < 0.010 < 0.010 < 0.010 < 0.010
Indeno(1,2,3-cd)pyrene µg/L < 0.050 < 0.050 < 0.050 < 0.050 < 0.050 < 0.050 < 0.050 < 0.010 < 0.050 < 0.050 < 0.050 < 0.050
Dibenz(a,h)anthracene µg/L < 0.050 < 0.050 < 0.050 < 0.050 < 0.0050 < 0.0050 < 0.0050 < 0.0050 < 0.010 < 0.010 < 0.010 < 0.010
Benzo(g,h,i)perylene µg/L < 0.050 < 0.050 < 0.050 < 0.050 < 0.050 < 0.050 < 0.050 < 0.010 < 0.050 < 0.050 - < 0.050
Chloronaphthalene, 2- µg/L - - - - - - - - < 0.100 < 0.100 - < 0.100
Quinoline µg/L < 0.050 < 0.050 < 0.050 < 0.050 < 0.050 < 0.050 < 0.050 < 0.060 < 0.050 < 0.050 < 0.050 < 0.050
Volatile Organic Compounds
Bromodichloromethane [BDCM] µg/L < 1.0 < 1.0 < 1.0 - - < 1.0 < 1.0 < 1.0 < 1.0 < 1.0 < 1.0 < 1.0
Bromoform µg/L < 1.0 < 1.0 < 1.0 - - < 1.0 < 1.0 < 1.0 < 1.0 < 1.0 < 1.0 < 1.0
Carbon Tetrachloride µg/L < 0.50 < 0.50 < 0.50 - - < 0.50 < 0.50 < 0.50 < 0.5 < 0.5 < 0.5 < 0.5
Chlorobenzene µg/L 2.4 2.7 1.2 - - 3.4 1.7 2.3 < 1.0 2.6 2.6 < 2.9
Chloroethane µg/L 1.2 < 1.0 4 - - < 1.0 6 6.9 8.9 < 2.0 < 2.0 < 2.0
Chloroform µg/L < 1.0 < 1.0 < 1.0 - - < 1.0 < 1.0 < 1.0 < 1.0 < 1.0 < 1.0 < 1.0
Chloromethane µg/L < 5.0 < 5.0 < 5.0 - - < 5.0 < 5.0 < 5.0 - - - -
Dibromochloromethane [DBCM] µg/L < 1.0 < 1.0 < 1.0 - - < 1.0 < 1.0 < 1.0 < 1.0 < 1.0 < 1.0 < 1.0
Dibromoethane, 1,2- µg/L - - - - - - - - < 0.3 < 0.3 - < 0.3
Dibromomethane µg/L - - - - - - - - < 1.0 < 1.0 - < 1.0
Dichlorobenzene, 1,2- µg/L < 0.70 < 0.70 < 0.70 - - < 0.70 < 0.50 < 0.50 < 0.5 < 0.5 < 0.5 < 0.5
Dichlorobenzene, 1,3- µg/L < 1.0 < 1.0 < 1.0 - - < 1.0 < 1.0 < 1.0 < 1.0 < 1.0 < 1.0 < 1.0
Dichlorobenzene, 1,4- µg/L 1.1 < 1.0 < 1.0 - - < 1.0 < 1.0 1.1 < 1.0 < 1.0 < 1.0 < 1.2
Dichloroethane, 1,1- µg/L 2.7 1.3 16.6 - - 3.5 6.4 3.2 2.3 < 1.0 < 1.0 1.0
Dichloroethane, 1,2- µg/L < 1.0 < 1.0 < 1.0 - - < 1.0 < 1.0 < 1.0 < 1.0 < 1.0 < 1.0 < 1.0
Dichloroethylene, 1,1- µg/L < 1.0 < 1.0 < 1.0 - - < 1.0 < 1.0 < 1.0 < 1.0 < 1.0 < 1.0 < 1.0
Dichloroethylene, 1,2-cis- µg/L < 1.0 < 1.0 < 1.0 - - < 1.0 < 1.0 < 1.0 < 1.0 < 1.0 < 1.0 < 1.0
Dichloroethylene, 1,2-trans- µg/L < 1.0 < 1.0 < 1.0 - - < 1.0 < 1.0 < 1.0 < 1.0 < 1.0 < 1.0 < 1.0
Dichloromethane µg/L < 5.0 < 5.0 < 5.0 - - < 5.0 < 5.0 < 5.0 < 3.0 < 3.0 < 3.0 < 3.0
Dichloropropane, 1,2- µg/L < 1.0 < 1.0 < 1.0 - - < 1.0 < 1.0 < 1.0 < 1.0 < 1.0 < 1.0 < 1.0
Dichloropropene, 1,3- (cis+trans) µg/L < 1.4 < 1.4 < 1.4 - - < 1.4 < 1.0 < 1.0 < 1.0 < 1.0 - < 1.0
Dichloropropene, 1,3-cis- µg/L < 1.0 < 1.0 < 1.0 - - < 1.0 < 0.50 < 0.50 - - - -
Dichloropropene, 1,3-trans- µg/L < 1.0 < 1.0 < 1.0 - - < 1.0 < 0.50 < 0.50 - - - -
Tetrachloroethane, 1,1,1,2- µg/L < 1.0 < 1.0 < 1.0 - - < 1.0 < 1.0 < 1.0 - - - -
Tetrachloroethane, 1,1,2,2- µg/L < 1.0 < 1.0 < 1.0 - - < 1.0 < 0.20 < 0.20 < 0.5 < 0.5 < 0.5 < 0.5
Tetrachloroethylene µg/L < 1.0 < 1.0 < 1.0 - - < 1.0 < 1.0 < 1.0 < 1.0 < 1.0 < 1.0 < 1.0
Trichloroethane, 1,1,1- µg/L < 1.0 < 1.0 < 1.0 - - < 1.0 < 1.0 < 1.0 < 1.0 < 1.0 < 1.0 < 1.0
Trichloroethane, 1,1,2- µg/L < 1.0 < 1.0 < 1.0 - - < 1.0 < 0.50 < 0.50 < 1.0 < 1.0 < 1.0 < 1.0
Trichloroethylene µg/L < 1.0 < 1.0 < 1.0 - - < 1.0 < 1.0 < 1.0 < 1.0 < 1.0 < 1.0 < 1.0
Trichlorofluoromethane µg/L < 1.0 < 1.0 < 1.0 - - < 1.0 < 1.0 < 1.0 < 1.0 < 1.0 < 1.0 < 1.0
Vinyl Chloride µg/L < 1.0 < 1.0 < 1.0 - - < 1.0 < 0.40 < 0.40 < 1.0 < 1.0 < 1.0 < 1.0
Gross Parameters
VH (C6-C10) µg/L < 100 < 100 < 100 - - < 100 - - < 100 < 100 < 100 < 100
VPH (C6-C10) µg/L < 100 < 100 < 100 - - < 100 - - < 100 < 100 < 100 < 100
EPH (C10-C19) µg/L 280 < 250 < 250 < 250 < 250 270 < 250 < 250 714 616 616 < 250
LEPH (C10-C19) µg/L 280 < 250 < 250 < 250 < 250 270 < 250 < 250 712 615 615 < 250
EPH (C19-C32) µg/L < 250 < 250 < 250 < 250 < 250 < 250 < 250 < 250 609 480 480 < 250
HEPH (C19-C32) µg/L < 250 < 250 < 250 < 250 < 250 < 250 < 250 < 250 609 480 480 < 250
MTBE
Methyl Tert-butyl Ether [MTBE] µg/L - - - - - - - - < 1.0 < 1.0 - < 1.0
Resin and Fatty Acids
Acetic Acid mg/L - - - - - - - - - - - -
Butyric Acid mg/L - - - - - - - - - - - -
Caporic Acid mg/L - - - - - - - - - - - -
Heptanoic Acid mg/L - - - - - - - - - - - -
Isobutyric Acid mg/L - - - - - - - - - - - -
Isocaproic Acid mg/L - - - - - - - - - - - -
Isovaleric Acid mg/L - - - - - - - - - - - -
Propionic Acid mg/L - - - - - - - - - - - -
Valeric Acid mg/L - - - - - - - - - - - -
Associated CARO file(s): 8031228, 8052345, 8081555, 8110837, 9031248, 9060275, 9090105, mg/l, N000833, ug/L.
Associated Exova file(s): 506479, 507801, 509233, 600276, 602695, 605393, 608922, 611891, 614770, 617175, 619914, 625680, 627511, 629501.
All terms defined within the body of SNC-Lavalin's report.
< Denotes concentration less than indicated detection limit or RPD less than indicated value.
- Denotes analysis not conducted.
n/a Denotes no applicable standard/guideline.
QA/QC RPD Denotes quality assurance/quality control relative percent difference
* RPDs are not calculated where one or more concentrations are less than five times RDL.
RDL Denotes reported detection limit.
SNC-LAVALIN INC. Page 5 of 8
662036 / 2021 03 09
20210309_662036_TAB_Historical.xlsx QAQC CN 2021 03 09

TABLE V.7: Historical Summary of Analytical Results for Leachate
Sample Location P1 Leachate MH P1 Leachate MH P1 Leachate MH 2 S Leachate Wet Well
Sample IDP1 Leachate MH-
20180816P1 Leachate MH P1 Leachate MH
P1 Leachate MH-
20190315
S LEACHATE
WET WELL-
20131211
S LEACHATE
WET WELL-
20140408
S LEACHATE
WET WELL-
20140610
S LEACHATE
WET WELL-
20150615
S LEACHATE
WET WELL-
20150915
S LEACHATE
WET WELL-
20151203
S LEACHATE
WET WELL-
20160315
Sample Date (yyyy mm dd) 2018 08 16 2018 11 08 2019 03 15 2019 03 15 2020 09 29 2020 11 16 2013 12 11 2014 04 08 2014 06 10 2015 06 15 2015 09 15 2015 12 03 2016 03 15
Parameter Units Analytical Results
Dissolved Inorganics
Ammonia, Total (as N) µg/L 61,600 60,700 43,000 43,000 462,000 110,000 128,000 65,400 46,500 189,000 255,000 224,000 99,200
Nitrate (as N) µg/L < 100 < 100 < 100 < 100 < 100 < 100 < 500 < 250 < 250 < 500 < 500 < 500 < 250
Nitrite (as N) µg/L - < 100 < 100 - < 100 191 - - - - - - -
Chloride mg/L 329 244 238 238 976 849 909 524 352 803 924 886 598
Fluoride µg/L 1,600 1,770 1,590 1,590 < 1,000 < 1,000 2,200 < 1,000 668 < 2,000 < 2,000 < 2,000 < 1,000
Sulfate mg/L 868 795 661 661 326 261 1,860 1,190 533 2,370 2,310 1,620 857
Total Alkalinity mg/L 3,710 3,360 2,500 2,500 5,110 4,600 - 3,250 2,990 7,730 8,640 6,960 4,450
Alkalinity, Bicarbonate (as CaCO3) mg/L 3,710 3,360 2,500 2,500 5,110 4,600 - - - - 8,640 6,960 4,450
Alkalinity, Carbonate (as CaCO3) mg/L < 1.0 < 1.0 < 1.0 < 1.0 < 1.0 < 1.0 - - - - < 1.0 < 1.0 < 1.0
Alkalinity, Hydroxide (as CaCO3) mg/L < 1.0 < 1.0 < 1.0 < 1.0 < 1.0 < 1.0 - - - - < 1.0 < 1.0 < 1.0
Alkalinity, Phenolphthalein (as CaCO3) mg/L - < 1.0 < 1.0 - < 1.0 < 1.0 - - - - - - -
Bromide mg/L < 10.0 < 10.0 1.39 1.39 < 1.00 32.2 9.1 4.6 3 7.1 8.3 6.9 4.7
Sulfide mg/L - 26.2 18.9 - < 2.00 3.38 - - - - - - -
Biochemical Oxygen Demand mg/L - 36.1 38.7 - 8,120 2,770 - - - - - - -
Chemical Oxygen Demand mg/L 243 223 184 184 13,600 3,910 1,090 676 398 982 1,130 996 705
Phosphate mg/L - 0.975 - - - - - - - - - - -
Ortho-Phosphate mg/L 2.22 - 1.10 1.1 8.27 10.8 7.66 3.37 3.05 6.68 8.29 7.03 3.71
Total Organic Carbon mg/L - - - - - 273 - - - - - -
Total Phosphorous as P mg/L - 2.36 2.15 - 29.1 20.6 - - - - - - -
Dissolved Metals
Dissolved Aluminum µg/L 24.7 22.9 14.6 14.6 67.4 101 - 96 103 82 77 66 62
Dissolved Calcium mg/L 106 107 104 104 1,030 691 - 60.6 64.2 94.8 78.8 73.5 79.6
Dissolved Iron µg/L 105 69 87 87 14,400 1,210 - 198 < 120 < 150 < 300 < 150 70
Dissolved Magnesium mg/L 326 342 363 363 239 278 - 178 294 319 374 344 250
Dissolved Manganese µg/L 717 593 661 661 14,300 8,140 - 251 335 320 297 308 460
Dissolved Potassium mg/L 105 104 91.1 91.1 566 588 - - - - 426 364 224
Dissolved Sodium mg/L 1,270 1,210 1,080 1,080 1,190 972 - 1,850 3,100 3,590 4,490 3,530 1,820
Antimony µg/L 2.57 2.08 0.53 0.53 17.2 10.9 - 3.9 15.5 19 27.4 16.1 7.8
Arsenic µg/L 11.4 7.73 2.72 2.72 36.9 30.9 - 17.7 46.7 60.9 75.3 46.9 21.7
Barium µg/L 344 288 268 268 80.1 72.7 - 80 166 247 270 224 125
Beryllium µg/L < 0.10 < 0.10 < 0.10 < 0.10 0.010 < 1.00 - < 10 < 20 < 25 < 50 < 25 < 10
Boron µg/L 1,090 1,110 1,280 1,280 4,720 3,210 - 1,650 2,170 2,670 3,300 3,050 1,980
Cadmium µg/L < 0.010 < 0.010 < 0.010 < 0.010 0.0254 < 0.200 - < 0.50 < 0.50 < 0.10 < 0.10 < 0.10 < 0.050
Chromium µg/L 11 8.15 5.07 5.07 95.7 104 - 16.6 26.2 43.2 55.1 44.4 18.1
Cobalt µg/L 5.61 5.13 4.95 4.95 51.5 16.2 - 6.4 7.2 13.8 15.5 14.9 7.6
Copper µg/L < 0.40 < 0.40 < 0.40 < 0.40 1.86 < 10.0 - < 5.0 < 5.0 < 4.0 < 4.0 < 4.0 < 2.0
Lead µg/L 0.2 < 0.20 < 0.20 < 0.20 0.239 < 5.00 - < 1.0 < 1.0 < 1.0 < 1.0 < 1.0 < 1.0
Lithium µg/L 39.8 33.9 42.0 42 233 153 - < 50 75 < 50 < 100 < 50 50
Mercury µg/L < 0.020 < 0.010 < 0.010 < 0.010 < 0.010 < 0.010 - < 0.20 < 0.20 < 0.20 < 0.20 < 0.20 < 0.20
Molybdenum µg/L 1.67 2.00 1.23 1.23 4.62 2.92 - 3.2 4.3 3.1 3.3 3 2.6
Nickel µg/L 11.7 9.42 9.33 9.33 204 128 - 26.8 30.2 36 40 37 23.7
Selenium µg/L 0.52 < 0.50 < 0.50 < 0.50 3.34 < 10.0 - < 10 < 10 11 3.6 2.1 8.3
Silver µg/L < 0.050 < 0.050 < 0.050 < 0.050 < 0.010 < 1.00 - < 0.10 < 0.10 < 0.20 < 0.20 < 0.20 < 0.10
Thallium µg/L < 0.020 < 0.020 < 0.020 < 0.020 0.0068 < 0.400 - < 1.0 < 1.0 < 0.20 < 0.20 < 0.20 < 0.10
Titanium µg/L 42.7 33.0 20.4 20.4 11.5 45.6 - 62 84 129 150 132 52
Tungsten µg/L - 2.2 1.6 - 1.16 < 20.0 - - - - - - -
Uranium µg/L 6.98 5.96 4.96 4.96 0.702 3.19 - 23.8 13.4 2.88 2.61 3.12 8.51
Vanadium µg/L 18.3 15.3 11.1 11.1 8.45 < 20.0 - < 60 < 120 < 150 < 300 < 150 < 60
Zinc µg/L < 4.0 < 4.0 < 4.0 < 4.0 59.9 < 100 - < 10 < 20 < 25 < 50 < 25 < 10
Bismuth µg/L < 0.10 < 0.10 < 0.10 < 0.10 0.023 < 1.00 - - - - < 2,000 < 1,000 < 400
Phosphorous µg/L 3,530 2,670 2,410 2,410 2,470 14,500 - - - - 9,000 7,100 3,890
Silicon µg/L 21,000 21,000 20,300 20,300 33,600 23,400 - - - - 17,300 16,200 12,000
Strontium µg/L 4,250 4,260 4,100 4,100 5,490 4,530 - - - - 3,390 3,020 2,360
Sulphur µg/L - 317,000 278,000 - 182,000 160,000 - - - 2,160,000 1,270,000 1,780,000 603,000
Tellurium µg/L < 0.50 < 0.50 < 0.50 < 0.50 0.159 < 5.00 - - - < 4.0 < 4.0 < 4.0 < 2.0
Thorium µg/L < 0.10 < 0.10 < 0.10 < 0.10 0.020 < 1.00 - - - < 2.0 < 2.0 < 2.0 < 1.0
Tin µg/L 4.63 3.83 1.12 1.12 2.63 < 5.00 - - - - < 300 < 150 < 60
Zirconium µg/L 42 34.8 25.8 25.8 7.22 12.9 - - - 46.4 60.9 46.2 19.6
Monocyclic Aromatic Hydrocarbons
Benzene µg/L 1.3 0.7 0.5 0.5 5.8 7.0 11.9 2.08 7.19 7.9 8.08 5.73 3.85
Ethylbenzene µg/L 5.9 < 1.0 < 1.0 < 1.0 25.0 29.1 123 26.2 70.4 44.4 43.9 42.1 27.2
Toluene µg/L < 1.0 < 1.0 < 1.0 < 1.0 268 274 18.6 4.61 6.26 2.36 2.08 1.52 1.49
Xylenes µg/L 4.5 < 2.0 < 2.0 < 2.0 45.0 57.0 121 23.7 60.1 43.7 40.7 33.9 18.9
Styrene µg/L - < 1.0 < 1.0 - 28.4 96.9 - - - - - - -
Polycyclic Aromatic Hydrocarbons
Naphthalene µg/L 0.607 0.254 0.313 0.313 1.12 1.19 - 3.6 4.91 10.8 3.41 11.8 4.43
Methylnaphthalene, 1- µg/L - < 0.100 < 0.116 - < 0.100 0.105 - - - - - - -
Methylnaphthalene, 2- µg/L - < 0.100 < 0.100 - 0.135 0.165 - - - - - - -
Acenaphthylene µg/L < 0.200 < 0.200 < 0.200 < 0.200 < 0.200 < 0.200 - < 0.050 < 0.050 < 0.050 < 0.050 < 0.050 < 0.050
Acenaphthene µg/L 0.369 0.213 0.321 0.321 < 0.050 < 0.050 - 0.358 0.42 0.454 0.504 0.457 0.465
Fluorene µg/L 0.279 0.185 0.268 0.268 < 0.050 < 0.050 - 0.225 0.212 0.235 0.333 0.236 0.27
Phenanthrene µg/L < 0.100 < 0.100 < 0.100 < 0.100 < 0.100 < 0.100 - 0.272 0.261 0.205 0.157 0.185 0.189
Anthracene µg/L 0.017 < 0.010 0.015 0.015 < 0.010 < 0.010 - < 0.050 < 0.050 < 0.050 < 0.050 < 0.050 < 0.050
Acridine µg/L < 0.050 < 0.050 < 0.050 < 0.050 < 0.092 0.082 - < 0.080 < 0.070 < 0.050 < 0.050 < 0.070 < 0.050
Fluoranthene µg/L 0.043 < 0.040 0.072 0.072 < 0.030 < 0.030 - < 0.050 < 0.050 < 0.050 < 0.050 < 0.050 < 0.050
Pyrene µg/L 0.029 < 0.020 0.037 0.037 < 0.020 < 0.020 - < 0.050 < 0.050 < 0.050 < 0.050 < 0.050 < 0.050
Benz(a)anthracene µg/L < 0.010 < 0.010 < 0.010 < 0.010 < 0.010 < 0.010 - < 0.050 < 0.050 < 0.050 < 0.050 < 0.050 < 0.050
Chrysene µg/L < 0.050 < 0.050 < 0.050 < 0.050 < 0.050 < 0.050 - < 0.050 < 0.050 < 0.050 < 0.050 < 0.050 < 0.050
Benzo(b)fluoranthene µg/L - - - - - - < 0.050 < 0.050 < 0.050 < 0.050 < 0.050 < 0.050
Benzo(b+j)fluoranthene µg/L - < 0.050 < 0.050 - < 0.050 0.053 - - - - - - -
Benzo(k)fluoranthene µg/L < 0.050 < 0.050 < 0.050 < 0.050 < 0.050 < 0.050 - < 0.050 < 0.050 < 0.050 < 0.050 < 0.050 < 0.050
Benzo(a)pyrene µg/L < 0.010 < 0.010 < 0.010 < 0.010 < 0.010 < 0.010 - < 0.010 < 0.010 < 0.010 < 0.010 < 0.010 < 0.010
Indeno(1,2,3-cd)pyrene µg/L < 0.050 < 0.050 < 0.050 < 0.050 < 0.050 < 0.050 - < 0.050 < 0.050 < 0.050 < 0.050 < 0.050 < 0.050
Dibenz(a,h)anthracene µg/L < 0.010 < 0.010 < 0.010 < 0.010 < 0.010 < 0.010 - < 0.050 < 0.050 < 0.050 < 0.050 < 0.050 < 0.050
Benzo(g,h,i)perylene µg/L - < 0.050 < 0.050 - < 0.050 < 0.050 - < 0.050 < 0.050 < 0.050 < 0.050 < 0.050 < 0.050
Chloronaphthalene, 2- µg/L - < 0.100 < 0.100 - < 0.100 < 0.100 - - - - - - -
Quinoline µg/L < 0.050 < 0.050 < 0.050 < 0.050 < 0.456 0.253 - < 0.050 < 0.050 < 0.20 < 0.080 < 0.050 < 0.050
Volatile Organic Compounds
Bromodichloromethane [BDCM] µg/L < 1.0 < 1.0 < 1.0 < 1.0 < 1.0 < 1.0 < 2.0 < 1.0 - < 1.0 < 1.0 < 1.0 < 1.0
Bromoform µg/L < 1.0 < 1.0 < 1.0 < 1.0 < 1.0 < 1.0 < 2.0 < 1.0 - < 1.0 < 1.0 < 1.0 < 1.0
Carbon Tetrachloride µg/L < 0.5 < 0.5 < 0.5 < 0.5 < 0.5 < 0.5 < 1.0 < 0.50 - < 0.50 < 0.50 < 0.50 < 0.50
Chlorobenzene µg/L < 2.9 3.1 3.9 3.9 < 1.0 < 1.0 < 2.0 < 1.0 - 2.3 2.1 1.2 < 1.0
Chloroethane µg/L < 2.0 < 2.0 < 2.0 < 2.0 < 8.0 9.9 < 2.0 < 1.0 - 1.4 1.1 < 1.0 < 1.0
Chloroform µg/L < 1.0 < 1.0 < 1.0 < 1.0 < 1.0 < 1.0 < 2.0 < 1.0 - < 1.0 < 1.0 < 1.0 < 1.0
Chloromethane µg/L - - - - - < 10 < 5.0 - < 5.0 < 5.0 < 5.0 < 5.0
Dibromochloromethane [DBCM] µg/L < 1.0 < 1.0 < 1.0 < 1.0 < 1.0 < 1.0 < 2.0 < 1.0 - < 1.0 < 1.0 < 1.0 < 1.0
Dibromoethane, 1,2- µg/L - < 0.3 < 0.3 - < 0.3 < 0.3 - - - - - - -
Dibromomethane µg/L - < 1.0 < 1.0 - < 1.0 < 1.0 - - - - - - -
Dichlorobenzene, 1,2- µg/L < 0.5 < 0.5 < 0.5 < 0.5 < 0.5 < 0.5 < 1.4 < 0.70 - < 0.70 < 0.70 < 0.70 < 0.70
Dichlorobenzene, 1,3- µg/L < 1.0 < 1.0 < 1.0 < 1.0 < 1.0 < 1.0 < 2.0 < 1.0 - < 1.0 < 1.0 < 1.0 < 1.0
Dichlorobenzene, 1,4- µg/L < 1.2 < 1.0 < 1.0 < 1.0 < 1.0 < 1.0 2.9 < 1.0 - 2 2.2 1.3 1.1
Dichloroethane, 1,1- µg/L 1 < 1.0 < 1.0 < 1.0 6.8 5.0 5.2 < 1.0 - < 1.0 < 1.0 < 1.0 1.1
Dichloroethane, 1,2- µg/L < 1.0 < 1.0 < 1.0 < 1.0 60.9 65.2 < 2.0 < 1.0 - < 1.0 < 1.0 < 1.0 < 1.0
Dichloroethylene, 1,1- µg/L < 1.0 < 1.0 < 1.0 < 1.0 < 1.0 < 1.0 < 2.0 < 1.0 - < 1.0 < 1.0 < 1.0 < 1.0
Dichloroethylene, 1,2-cis- µg/L < 1.0 < 1.0 < 1.0 < 1.0 5.0 8.3 < 2.0 < 1.0 - < 1.0 < 1.0 < 1.0 < 1.0
Dichloroethylene, 1,2-trans- µg/L < 1.0 < 1.0 < 1.0 < 1.0 15.2 19.0 < 2.0 < 1.0 - < 1.0 < 1.0 < 1.0 < 1.0
Dichloromethane µg/L < 3.0 < 3.0 < 3.0 < 3.0 264 234 < 10 < 5.0 - < 5.0 < 5.0 < 5.0 < 5.0
Dichloropropane, 1,2- µg/L < 1.0 < 1.0 < 1.0 < 1.0 < 2.5 1.8 < 2.0 < 1.0 - < 1.0 < 1.0 < 1.0 < 1.0
Dichloropropene, 1,3- (cis+trans) µg/L - < 1.0 < 1.0 - < 1.0 < 1.0 < 2.8 < 1.4 - < 1.4 < 1.4 < 1.4 < 1.4
Dichloropropene, 1,3-cis- µg/L - - - - - < 2.0 < 1.0 - < 1.0 < 1.0 < 1.0 < 1.0
Dichloropropene, 1,3-trans- µg/L - - - - - < 2.0 < 1.0 - < 1.0 < 1.0 < 1.0 < 1.0
Tetrachloroethane, 1,1,1,2- µg/L - - - < 2.0 < 1.0 - < 1.0 < 1.0 < 1.0 < 1.0
Tetrachloroethane, 1,1,2,2- µg/L < 0.5 < 0.5 < 0.5 < 0.5 < 0.5 < 0.5 < 2.0 < 1.0 - < 1.0 < 1.0 < 1.0 < 1.0
Tetrachloroethylene µg/L < 1.0 < 1.0 < 1.0 < 1.0 < 3.3 1.8 < 2.0 < 1.0 - < 1.0 < 1.0 < 1.0 < 1.0
Trichloroethane, 1,1,1- µg/L < 1.0 < 1.0 < 1.0 < 1.0 < 1.0 < 1.0 < 2.0 < 1.0 - < 1.0 < 1.0 < 1.0 < 1.0
Trichloroethane, 1,1,2- µg/L < 1.0 < 1.0 < 1.0 < 1.0 < 1.0 < 1.0 < 2.0 < 1.0 - < 1.0 < 1.0 < 1.0 < 1.0
Trichloroethylene µg/L < 1.0 < 1.0 < 1.0 < 1.0 < 2.4 2.7 < 2.0 < 1.0 - < 1.0 < 1.0 < 1.0 < 1.0
Trichlorofluoromethane µg/L < 1.0 < 1.0 < 1.0 < 1.0 < 1.0 1.1 < 2.0 < 1.0 - < 1.0 < 1.0 < 1.0 < 1.0
Vinyl Chloride µg/L < 1.0 < 1.0 < 1.0 < 1.0 < 1.0 < 3.0 < 2.0 < 1.0 - < 1.0 < 1.0 < 1.0 < 1.0
Gross Parameters
VH (C6-C10) µg/L < 100 < 100 < 100 < 100 1,430 889 - < 100 120 130 140 < 100 < 100
VPH (C6-C10) µg/L < 100 < 100 < 100 < 100 1,050 425 - < 100 < 100 < 100 < 100 < 100 < 100
EPH (C10-C19) µg/L < 250 < 250 < 250 < 250 615 1,250 - 1,230 1,960 770 260 640 380
LEPH (C10-C19) µg/L < 250 < 250 < 250 < 250 614 1,250 - 1,230 1,950 750 250 620 370
EPH (C19-C32) µg/L < 250 < 250 < 250 < 250 405 352 - 710 1,340 < 250 < 250 < 250 < 250
HEPH (C19-C32) µg/L < 250 < 250 < 250 < 250 405 352 - 710 1,340 < 250 < 250 < 250 < 250
MTBE
Methyl Tert-butyl Ether [MTBE] µg/L - < 1.0 < 1.0 - < 1.3 7.2 - - - - - - -
Resin and Fatty Acids
Acetic Acid mg/L - - < 3.0 - 3,610 848 - - - - - - -
Butyric Acid mg/L - - < 2.0 - 1,730 169 - - - - - - -
Caporic Acid mg/L - - < 2.0 - 771 86.7 - - - - - - -
Heptanoic Acid mg/L - - < 2.0 - 124 11.6 - - - - - - -
Isobutyric Acid mg/L - - < 2.0 - 2,540 102 - - - - - - -
Isocaproic Acid mg/L - - < 2.0 - 19.0 6.6 - - - - - - -
Isovaleric Acid mg/L - - < 2.0 - 359 53.6 - - - - - - -
Propionic Acid mg/L - - < 2.0 - 445 466 - - - - - - -
Valeric Acid mg/L - - < 2.0 - 870 89.9 - - - - - - -
Associated CARO file(s): 8031228, 8052345, 8081555, 8110837, 9031248, 9060275, 9090105, mg/l, N000833, ug/L.
Associated Exova file(s): 506479, 507801, 509233, 600276, 602695, 605393, 608922, 611891, 614770, 617175, 619914, 625680, 627511, 629501.
All terms defined within the body of SNC-Lavalin's report.
< Denotes concentration less than indicated detection limit or RPD less than indicated value.
- Denotes analysis not conducted.
n/a Denotes no applicable standard/guideline.
QA/QC RPD Denotes quality assurance/quality control relative percent difference
* RPDs are not calculated where one or more concentrations are less than five times RDL.
RDL Denotes reported detection limit.
SNC-LAVALIN INC. Page 6 of 8
662036 / 2021 03 09
20210309_662036_TAB_Historical.xlsx QAQC CN 2021 03 09
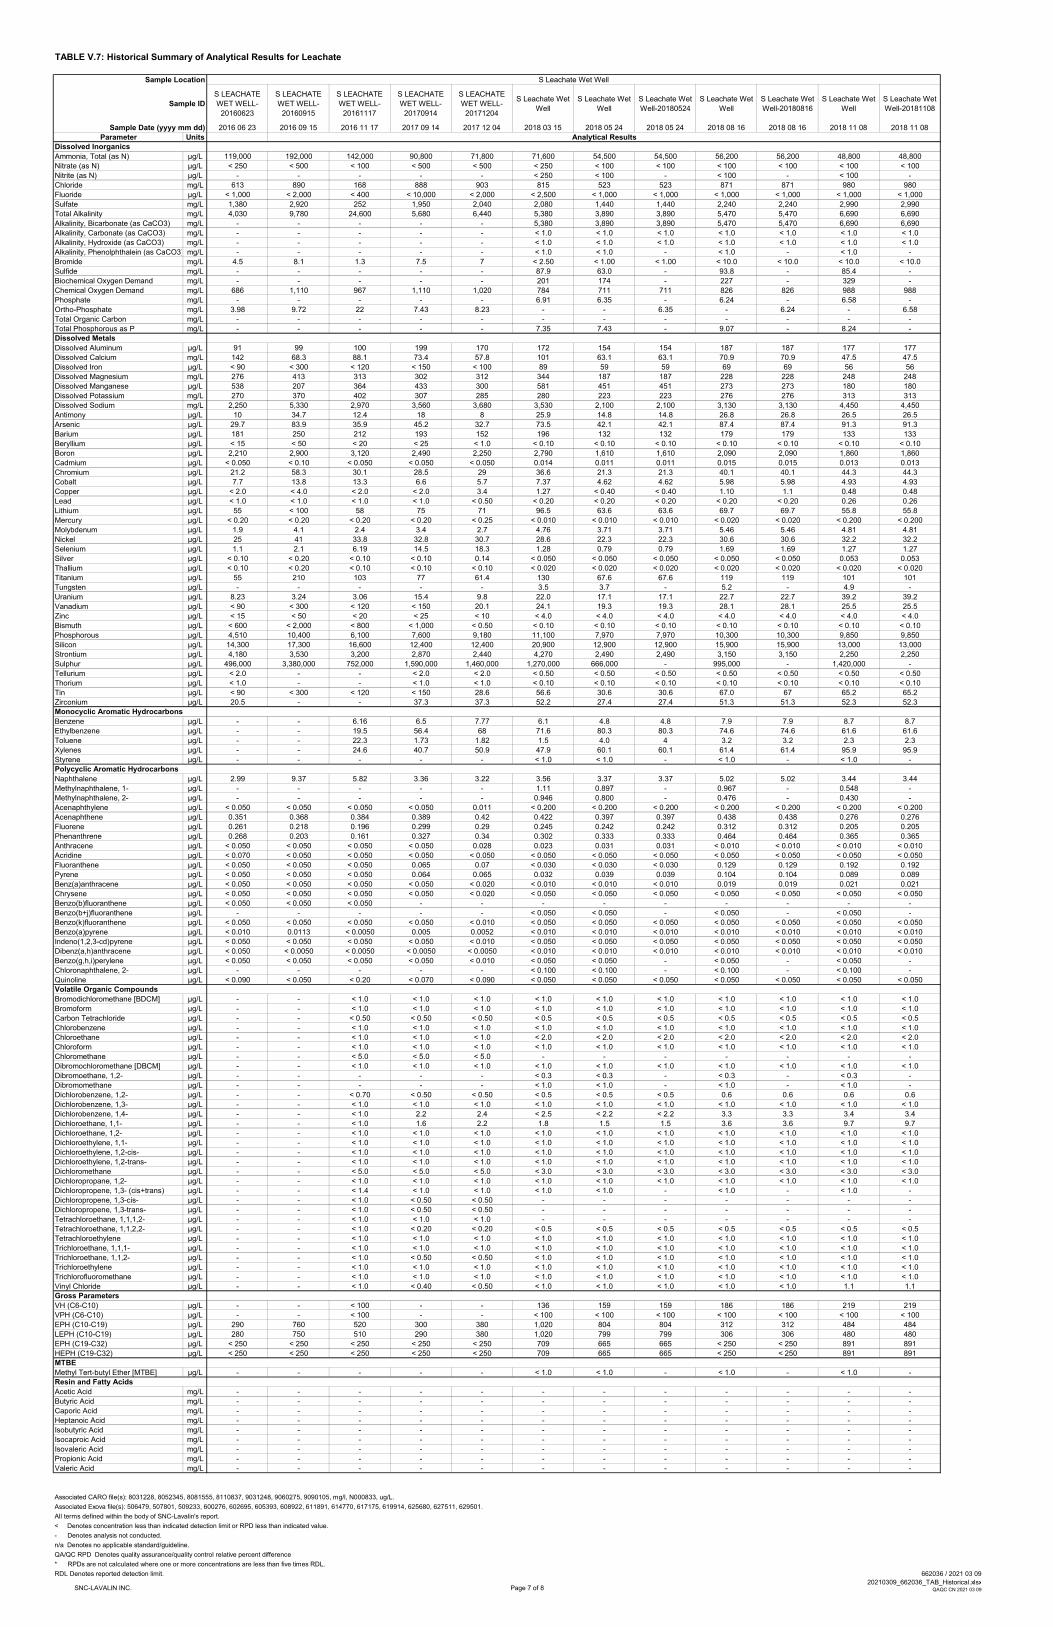
TABLE V.7: Historical Summary of Analytical Results for Leachate
Sample Location S Leachate Wet Well
Sample ID
S LEACHATE
WET WELL-
20160623
S LEACHATE
WET WELL-
20160915
S LEACHATE
WET WELL-
20161117
S LEACHATE
WET WELL-
20170914
S LEACHATE
WET WELL-
20171204
S Leachate Wet
Well
S Leachate Wet
Well
S Leachate Wet
Well-20180524
S Leachate Wet
Well
S Leachate Wet
Well-20180816
S Leachate Wet
Well
S Leachate Wet
Well-20181108
Sample Date (yyyy mm dd) 2016 06 23 2016 09 15 2016 11 17 2017 09 14 2017 12 04 2018 03 15 2018 05 24 2018 05 24 2018 08 16 2018 08 16 2018 11 08 2018 11 08
Parameter Units Analytical Results
Dissolved Inorganics
Ammonia, Total (as N) µg/L 119,000 192,000 142,000 90,800 71,800 71,600 54,500 54,500 56,200 56,200 48,800 48,800
Nitrate (as N) µg/L < 250 < 500 < 100 < 500 < 500 < 250 < 100 < 100 < 100 < 100 < 100 < 100
Nitrite (as N) µg/L - - - - - < 250 < 100 - < 100 - < 100 -
Chloride mg/L 613 890 168 888 903 815 523 523 871 871 980 980
Fluoride µg/L < 1,000 < 2,000 < 400 < 10,000 < 2,000 < 2,500 < 1,000 < 1,000 < 1,000 < 1,000 < 1,000 < 1,000
Sulfate mg/L 1,380 2,920 252 1,950 2,040 2,080 1,440 1,440 2,240 2,240 2,990 2,990
Total Alkalinity mg/L 4,030 9,780 24,600 5,680 6,440 5,380 3,890 3,890 5,470 5,470 6,690 6,690
Alkalinity, Bicarbonate (as CaCO3) mg/L - - - - - 5,380 3,890 3,890 5,470 5,470 6,690 6,690
Alkalinity, Carbonate (as CaCO3) mg/L - - - - - < 1.0 < 1.0 < 1.0 < 1.0 < 1.0 < 1.0 < 1.0
Alkalinity, Hydroxide (as CaCO3) mg/L - - - - - < 1.0 < 1.0 < 1.0 < 1.0 < 1.0 < 1.0 < 1.0
Alkalinity, Phenolphthalein (as CaCO3) mg/L - - - - - < 1.0 < 1.0 - < 1.0 - < 1.0 -
Bromide mg/L 4.5 8.1 1.3 7.5 7 < 2.50 < 1.00 < 1.00 < 10.0 < 10.0 < 10.0 < 10.0
Sulfide mg/L - - - - - 87.9 63.0 - 93.8 - 85.4 -
Biochemical Oxygen Demand mg/L - - - - - 201 174 - 227 - 329 -
Chemical Oxygen Demand mg/L 686 1,110 967 1,110 1,020 784 711 711 826 826 988 988
Phosphate mg/L - - - - - 6.91 6.35 - 6.24 - 6.58 -
Ortho-Phosphate mg/L 3.98 9.72 22 7.43 8.23 - - 6.35 - 6.24 - 6.58
Total Organic Carbon mg/L - - - - - - - - - - - -
Total Phosphorous as P mg/L - - - - - 7.35 7.43 - 9.07 - 8.24 -
Dissolved Metals
Dissolved Aluminum µg/L 91 99 100 199 170 172 154 154 187 187 177 177
Dissolved Calcium mg/L 142 68.3 88.1 73.4 57.8 101 63.1 63.1 70.9 70.9 47.5 47.5
Dissolved Iron µg/L < 90 < 300 < 120 < 150 < 100 89 59 59 69 69 56 56
Dissolved Magnesium mg/L 276 413 313 302 312 344 187 187 228 228 248 248
Dissolved Manganese µg/L 538 207 364 433 300 581 451 451 273 273 180 180
Dissolved Potassium mg/L 270 370 402 307 285 280 223 223 276 276 313 313
Dissolved Sodium mg/L 2,250 5,330 2,970 3,560 3,680 3,530 2,100 2,100 3,130 3,130 4,450 4,450
Antimony µg/L 10 34.7 12.4 18 8 25.9 14.8 14.8 26.8 26.8 26.5 26.5
Arsenic µg/L 29.7 83.9 35.9 45.2 32.7 73.5 42.1 42.1 87.4 87.4 91.3 91.3
Barium µg/L 181 250 212 193 152 196 132 132 179 179 133 133
Beryllium µg/L < 15 < 50 < 20 < 25 < 1.0 < 0.10 < 0.10 < 0.10 < 0.10 < 0.10 < 0.10 < 0.10
Boron µg/L 2,210 2,900 3,120 2,490 2,250 2,790 1,610 1,610 2,090 2,090 1,860 1,860
Cadmium µg/L < 0.050 < 0.10 < 0.050 < 0.050 < 0.050 0.014 0.011 0.011 0.015 0.015 0.013 0.013
Chromium µg/L 21.2 58.3 30.1 28.5 29 36.6 21.3 21.3 40.1 40.1 44.3 44.3
Cobalt µg/L 7.7 13.8 13.3 6.6 5.7 7.37 4.62 4.62 5.98 5.98 4.93 4.93
Copper µg/L < 2.0 < 4.0 < 2.0 < 2.0 3.4 1.27 < 0.40 < 0.40 1.10 1.1 0.48 0.48
Lead µg/L < 1.0 < 1.0 < 1.0 < 1.0 < 0.50 < 0.20 < 0.20 < 0.20 < 0.20 < 0.20 0.26 0.26
Lithium µg/L 55 < 100 58 75 71 96.5 63.6 63.6 69.7 69.7 55.8 55.8
Mercury µg/L < 0.20 < 0.20 < 0.20 < 0.20 < 0.25 < 0.010 < 0.010 < 0.010 < 0.020 < 0.020 < 0.200 < 0.200
Molybdenum µg/L 1.9 4.1 2.4 3.4 2.7 4.76 3.71 3.71 5.46 5.46 4.81 4.81
Nickel µg/L 25 41 33.8 32.8 30.7 28.6 22.3 22.3 30.6 30.6 32.2 32.2
Selenium µg/L 1.1 2.1 6.19 14.5 18.3 1.28 0.79 0.79 1.69 1.69 1.27 1.27
Silver µg/L < 0.10 < 0.20 < 0.10 < 0.10 0.14 < 0.050 < 0.050 < 0.050 < 0.050 < 0.050 0.053 0.053
Thallium µg/L < 0.10 < 0.20 < 0.10 < 0.10 < 0.10 < 0.020 < 0.020 < 0.020 < 0.020 < 0.020 < 0.020 < 0.020
Titanium µg/L 55 210 103 77 61.4 130 67.6 67.6 119 119 101 101
Tungsten µg/L - - - - - 3.5 3.7 - 5.2 - 4.9 -
Uranium µg/L 8.23 3.24 3.06 15.4 9.8 22.0 17.1 17.1 22.7 22.7 39.2 39.2
Vanadium µg/L < 90 < 300 < 120 < 150 20.1 24.1 19.3 19.3 28.1 28.1 25.5 25.5
Zinc µg/L < 15 < 50 < 20 < 25 < 10 < 4.0 < 4.0 < 4.0 < 4.0 < 4.0 < 4.0 < 4.0
Bismuth µg/L < 600 < 2,000 < 800 < 1,000 < 0.50 < 0.10 < 0.10 < 0.10 < 0.10 < 0.10 < 0.10 < 0.10
Phosphorous µg/L 4,510 10,400 6,100 7,600 9,180 11,100 7,970 7,970 10,300 10,300 9,850 9,850
Silicon µg/L 14,300 17,300 16,600 12,400 12,400 20,900 12,900 12,900 15,900 15,900 13,000 13,000
Strontium µg/L 4,180 3,530 3,200 2,870 2,440 4,270 2,490 2,490 3,150 3,150 2,250 2,250
Sulphur µg/L 496,000 3,380,000 752,000 1,590,000 1,460,000 1,270,000 666,000 - 995,000 - 1,420,000 -
Tellurium µg/L < 2.0 - - < 2.0 < 2.0 < 0.50 < 0.50 < 0.50 < 0.50 < 0.50 < 0.50 < 0.50
Thorium µg/L < 1.0 - - < 1.0 < 1.0 < 0.10 < 0.10 < 0.10 < 0.10 < 0.10 < 0.10 < 0.10
Tin µg/L < 90 < 300 < 120 < 150 28.6 56.6 30.6 30.6 67.0 67 65.2 65.2
Zirconium µg/L 20.5 - - 37.3 37.3 52.2 27.4 27.4 51.3 51.3 52.3 52.3
Monocyclic Aromatic Hydrocarbons
Benzene µg/L - - 6.16 6.5 7.77 6.1 4.8 4.8 7.9 7.9 8.7 8.7
Ethylbenzene µg/L - - 19.5 56.4 68 71.6 80.3 80.3 74.6 74.6 61.6 61.6
Toluene µg/L - - 22.3 1.73 1.82 1.5 4.0 4 3.2 3.2 2.3 2.3
Xylenes µg/L - - 24.6 40.7 50.9 47.9 60.1 60.1 61.4 61.4 95.9 95.9
Styrene µg/L - - - - - < 1.0 < 1.0 - < 1.0 - < 1.0 -
Polycyclic Aromatic Hydrocarbons
Naphthalene µg/L 2.99 9.37 5.82 3.36 3.22 3.56 3.37 3.37 5.02 5.02 3.44 3.44
Methylnaphthalene, 1- µg/L - - - - - 1.11 0.897 - 0.967 - 0.548 -
Methylnaphthalene, 2- µg/L - - - - - 0.946 0.800 - 0.476 - 0.430 -
Acenaphthylene µg/L < 0.050 < 0.050 < 0.050 < 0.050 0.011 < 0.200 < 0.200 < 0.200 < 0.200 < 0.200 < 0.200 < 0.200
Acenaphthene µg/L 0.351 0.368 0.384 0.389 0.42 0.422 0.397 0.397 0.438 0.438 0.276 0.276
Fluorene µg/L 0.261 0.218 0.196 0.299 0.29 0.245 0.242 0.242 0.312 0.312 0.205 0.205
Phenanthrene µg/L 0.268 0.203 0.161 0.327 0.34 0.302 0.333 0.333 0.464 0.464 0.365 0.365
Anthracene µg/L < 0.050 < 0.050 < 0.050 < 0.050 0.028 0.023 0.031 0.031 < 0.010 < 0.010 < 0.010 < 0.010
Acridine µg/L < 0.070 < 0.050 < 0.050 < 0.050 < 0.050 < 0.050 < 0.050 < 0.050 < 0.050 < 0.050 < 0.050 < 0.050
Fluoranthene µg/L < 0.050 < 0.050 < 0.050 0.065 0.07 < 0.030 < 0.030 < 0.030 0.129 0.129 0.192 0.192
Pyrene µg/L < 0.050 < 0.050 < 0.050 0.064 0.065 0.032 0.039 0.039 0.104 0.104 0.089 0.089
Benz(a)anthracene µg/L < 0.050 < 0.050 < 0.050 < 0.050 < 0.020 < 0.010 < 0.010 < 0.010 0.019 0.019 0.021 0.021
Chrysene µg/L < 0.050 < 0.050 < 0.050 < 0.050 < 0.020 < 0.050 < 0.050 < 0.050 < 0.050 < 0.050 < 0.050 < 0.050
Benzo(b)fluoranthene µg/L < 0.050 < 0.050 < 0.050 - - - - - - - - -
Benzo(b+j)fluoranthene µg/L - - - - - < 0.050 < 0.050 - < 0.050 - < 0.050 -
Benzo(k)fluoranthene µg/L < 0.050 < 0.050 < 0.050 < 0.050 < 0.010 < 0.050 < 0.050 < 0.050 < 0.050 < 0.050 < 0.050 < 0.050
Benzo(a)pyrene µg/L < 0.010 0.0113 < 0.0050 0.005 0.0052 < 0.010 < 0.010 < 0.010 < 0.010 < 0.010 < 0.010 < 0.010
Indeno(1,2,3-cd)pyrene µg/L < 0.050 < 0.050 < 0.050 < 0.050 < 0.010 < 0.050 < 0.050 < 0.050 < 0.050 < 0.050 < 0.050 < 0.050
Dibenz(a,h)anthracene µg/L < 0.050 < 0.0050 < 0.0050 < 0.0050 < 0.0050 < 0.010 < 0.010 < 0.010 < 0.010 < 0.010 < 0.010 < 0.010
Benzo(g,h,i)perylene µg/L < 0.050 < 0.050 < 0.050 < 0.050 < 0.010 < 0.050 < 0.050 - < 0.050 - < 0.050 -
Chloronaphthalene, 2- µg/L - - - - - < 0.100 < 0.100 - < 0.100 - < 0.100 -
Quinoline µg/L < 0.090 < 0.050 < 0.20 < 0.070 < 0.090 < 0.050 < 0.050 < 0.050 < 0.050 < 0.050 < 0.050 < 0.050
Volatile Organic Compounds
Bromodichloromethane [BDCM] µg/L - - < 1.0 < 1.0 < 1.0 < 1.0 < 1.0 < 1.0 < 1.0 < 1.0 < 1.0 < 1.0
Bromoform µg/L - - < 1.0 < 1.0 < 1.0 < 1.0 < 1.0 < 1.0 < 1.0 < 1.0 < 1.0 < 1.0
Carbon Tetrachloride µg/L - - < 0.50 < 0.50 < 0.50 < 0.5 < 0.5 < 0.5 < 0.5 < 0.5 < 0.5 < 0.5
Chlorobenzene µg/L - - < 1.0 < 1.0 < 1.0 < 1.0 < 1.0 < 1.0 < 1.0 < 1.0 < 1.0 < 1.0
Chloroethane µg/L - - < 1.0 < 1.0 < 1.0 < 2.0 < 2.0 < 2.0 < 2.0 < 2.0 < 2.0 < 2.0
Chloroform µg/L - - < 1.0 < 1.0 < 1.0 < 1.0 < 1.0 < 1.0 < 1.0 < 1.0 < 1.0 < 1.0
Chloromethane µg/L - - < 5.0 < 5.0 < 5.0 - - - - - - -
Dibromochloromethane [DBCM] µg/L - - < 1.0 < 1.0 < 1.0 < 1.0 < 1.0 < 1.0 < 1.0 < 1.0 < 1.0 < 1.0
Dibromoethane, 1,2- µg/L - - - - - < 0.3 < 0.3 - < 0.3 - < 0.3 -
Dibromomethane µg/L - - - - - < 1.0 < 1.0 - < 1.0 - < 1.0 -
Dichlorobenzene, 1,2- µg/L - - < 0.70 < 0.50 < 0.50 < 0.5 < 0.5 < 0.5 0.6 0.6 0.6 0.6
Dichlorobenzene, 1,3- µg/L - - < 1.0 < 1.0 < 1.0 < 1.0 < 1.0 < 1.0 < 1.0 < 1.0 < 1.0 < 1.0
Dichlorobenzene, 1,4- µg/L - - < 1.0 2.2 2.4 < 2.5 < 2.2 < 2.2 3.3 3.3 3.4 3.4
Dichloroethane, 1,1- µg/L - - < 1.0 1.6 2.2 1.8 1.5 1.5 3.6 3.6 9.7 9.7
Dichloroethane, 1,2- µg/L - - < 1.0 < 1.0 < 1.0 < 1.0 < 1.0 < 1.0 < 1.0 < 1.0 < 1.0 < 1.0
Dichloroethylene, 1,1- µg/L - - < 1.0 < 1.0 < 1.0 < 1.0 < 1.0 < 1.0 < 1.0 < 1.0 < 1.0 < 1.0
Dichloroethylene, 1,2-cis- µg/L - - < 1.0 < 1.0 < 1.0 < 1.0 < 1.0 < 1.0 < 1.0 < 1.0 < 1.0 < 1.0
Dichloroethylene, 1,2-trans- µg/L - - < 1.0 < 1.0 < 1.0 < 1.0 < 1.0 < 1.0 < 1.0 < 1.0 < 1.0 < 1.0
Dichloromethane µg/L - - < 5.0 < 5.0 < 5.0 < 3.0 < 3.0 < 3.0 < 3.0 < 3.0 < 3.0 < 3.0
Dichloropropane, 1,2- µg/L - - < 1.0 < 1.0 < 1.0 < 1.0 < 1.0 < 1.0 < 1.0 < 1.0 < 1.0 < 1.0
Dichloropropene, 1,3- (cis+trans) µg/L - - < 1.4 < 1.0 < 1.0 < 1.0 < 1.0 - < 1.0 - < 1.0 -
Dichloropropene, 1,3-cis- µg/L - - < 1.0 < 0.50 < 0.50 - - - - - - -
Dichloropropene, 1,3-trans- µg/L - - < 1.0 < 0.50 < 0.50 - - - - - - -
Tetrachloroethane, 1,1,1,2- µg/L - - < 1.0 < 1.0 < 1.0 - - - - - - -
Tetrachloroethane, 1,1,2,2- µg/L - - < 1.0 < 0.20 < 0.20 < 0.5 < 0.5 < 0.5 < 0.5 < 0.5 < 0.5 < 0.5
Tetrachloroethylene µg/L - - < 1.0 < 1.0 < 1.0 < 1.0 < 1.0 < 1.0 < 1.0 < 1.0 < 1.0 < 1.0
Trichloroethane, 1,1,1- µg/L - - < 1.0 < 1.0 < 1.0 < 1.0 < 1.0 < 1.0 < 1.0 < 1.0 < 1.0 < 1.0
Trichloroethane, 1,1,2- µg/L - - < 1.0 < 0.50 < 0.50 < 1.0 < 1.0 < 1.0 < 1.0 < 1.0 < 1.0 < 1.0
Trichloroethylene µg/L - - < 1.0 < 1.0 < 1.0 < 1.0 < 1.0 < 1.0 < 1.0 < 1.0 < 1.0 < 1.0
Trichlorofluoromethane µg/L - - < 1.0 < 1.0 < 1.0 < 1.0 < 1.0 < 1.0 < 1.0 < 1.0 < 1.0 < 1.0
Vinyl Chloride µg/L - - < 1.0 < 0.40 < 0.50 < 1.0 < 1.0 < 1.0 < 1.0 < 1.0 1.1 1.1
Gross Parameters
VH (C6-C10) µg/L - - < 100 - - 136 159 159 186 186 219 219
VPH (C6-C10) µg/L - - < 100 - - < 100 < 100 < 100 < 100 < 100 < 100 < 100
EPH (C10-C19) µg/L 290 760 520 300 380 1,020 804 804 312 312 484 484
LEPH (C10-C19) µg/L 280 750 510 290 380 1,020 799 799 306 306 480 480
EPH (C19-C32) µg/L < 250 < 250 < 250 < 250 < 250 709 665 665 < 250 < 250 891 891
HEPH (C19-C32) µg/L < 250 < 250 < 250 < 250 < 250 709 665 665 < 250 < 250 891 891
MTBE
Methyl Tert-butyl Ether [MTBE] µg/L - - - - - < 1.0 < 1.0 - < 1.0 - < 1.0 -
Resin and Fatty Acids
Acetic Acid mg/L - - - - - - - - - - - -
Butyric Acid mg/L - - - - - - - - - - - -
Caporic Acid mg/L - - - - - - - - - - - -
Heptanoic Acid mg/L - - - - - - - - - - - -
Isobutyric Acid mg/L - - - - - - - - - - - -
Isocaproic Acid mg/L - - - - - - - - - - - -
Isovaleric Acid mg/L - - - - - - - - - - - -
Propionic Acid mg/L - - - - - - - - - - - -
Valeric Acid mg/L - - - - - - - - - - - -
Associated CARO file(s): 8031228, 8052345, 8081555, 8110837, 9031248, 9060275, 9090105, mg/l, N000833, ug/L.
Associated Exova file(s): 506479, 507801, 509233, 600276, 602695, 605393, 608922, 611891, 614770, 617175, 619914, 625680, 627511, 629501.
All terms defined within the body of SNC-Lavalin's report.
< Denotes concentration less than indicated detection limit or RPD less than indicated value.
- Denotes analysis not conducted.
n/a Denotes no applicable standard/guideline.
QA/QC RPD Denotes quality assurance/quality control relative percent difference
* RPDs are not calculated where one or more concentrations are less than five times RDL.
RDL Denotes reported detection limit.
SNC-LAVALIN INC. Page 7 of 8
662036 / 2021 03 09
20210309_662036_TAB_Historical.xlsx QAQC CN 2021 03 09
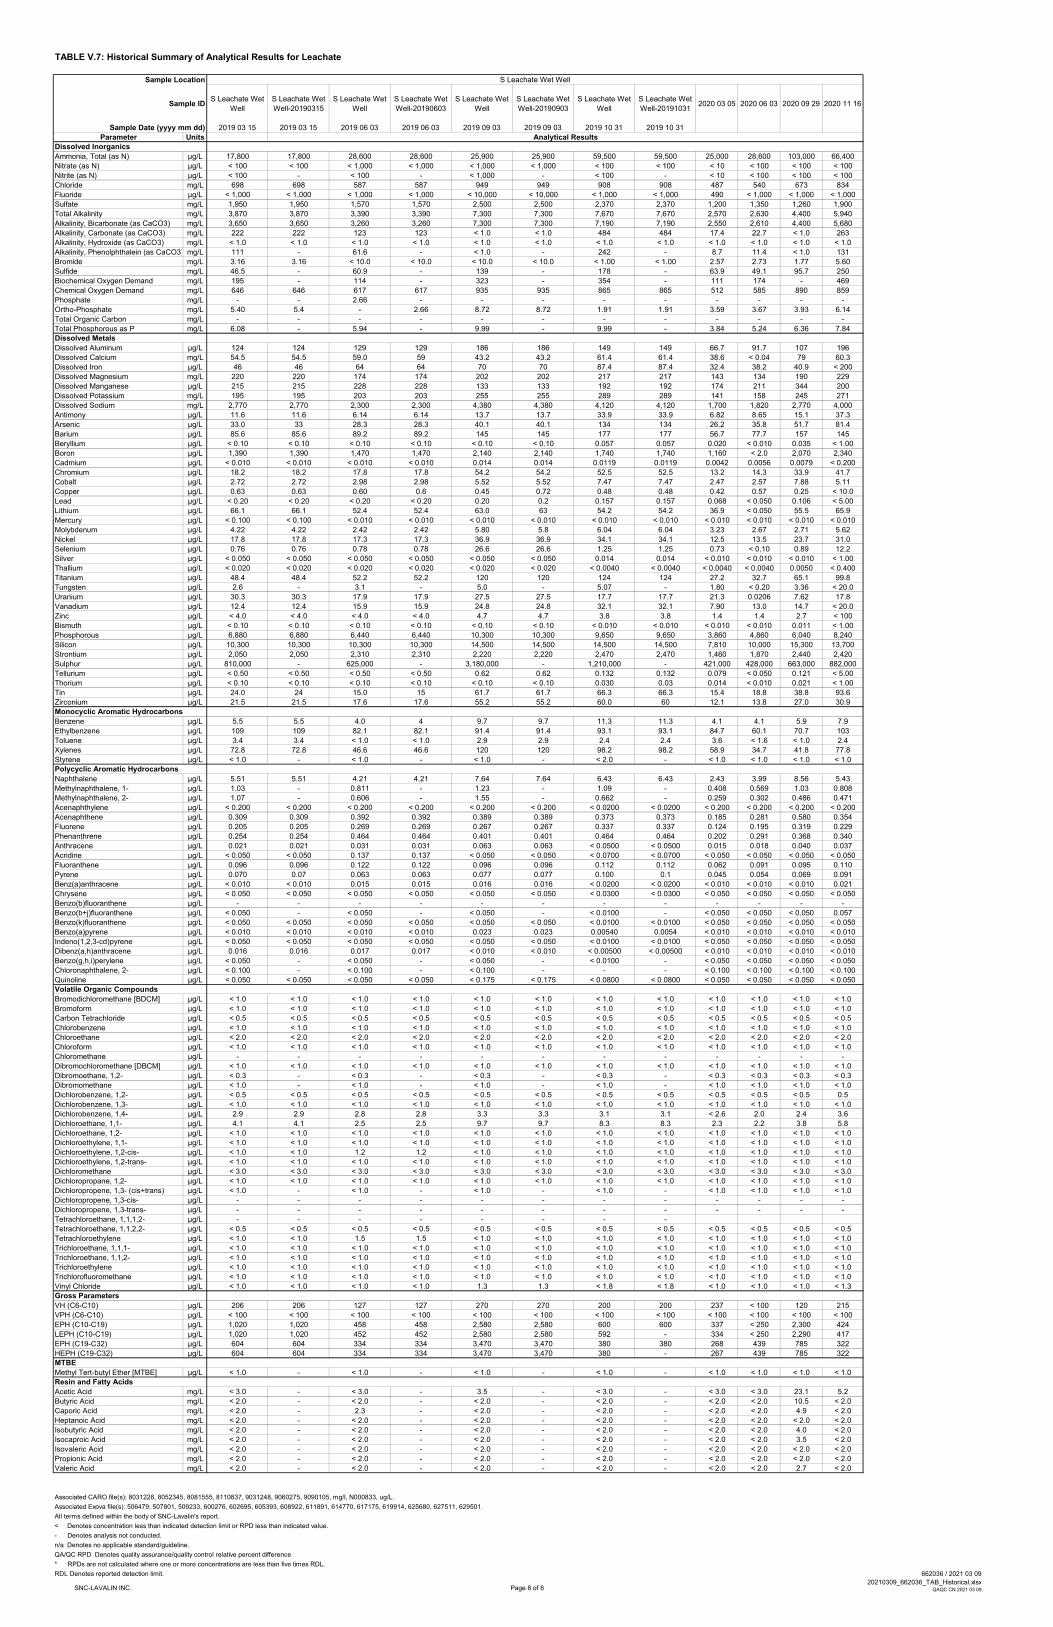
TABLE V.7: Historical Summary of Analytical Results for Leachate
Sample Location S Leachate Wet Well
Sample IDS Leachate Wet
Well
S Leachate Wet
Well-20190315
S Leachate Wet
Well
S Leachate Wet
Well-20190603
S Leachate Wet
Well
S Leachate Wet
Well-20190903
S Leachate Wet
Well
S Leachate Wet
Well-201910312020 03 05 2020 06 03 2020 09 29 2020 11 16
Sample Date (yyyy mm dd) 2019 03 15 2019 03 15 2019 06 03 2019 06 03 2019 09 03 2019 09 03 2019 10 31 2019 10 31
Parameter Units Analytical Results
Dissolved Inorganics
Ammonia, Total (as N) µg/L 17,800 17,800 28,600 28,600 25,900 25,900 59,500 59,500 25,000 28,600 103,000 66,400
Nitrate (as N) µg/L < 100 < 100 < 1,000 < 1,000 < 1,000 < 1,000 < 100 < 100 < 10 < 100 < 100 < 100
Nitrite (as N) µg/L < 100 - < 100 - < 1,000 - < 100 - < 10 < 100 < 100 < 100
Chloride mg/L 698 698 587 587 949 949 908 908 487 540 673 834
Fluoride µg/L < 1,000 < 1,000 < 1,000 < 1,000 < 10,000 < 10,000 < 1,000 < 1,000 490 < 1,000 < 1,000 < 1,000
Sulfate mg/L 1,950 1,950 1,570 1,570 2,500 2,500 2,370 2,370 1,200 1,350 1,260 1,900
Total Alkalinity mg/L 3,870 3,870 3,390 3,390 7,300 7,300 7,670 7,670 2,570 2,630 4,400 5,940
Alkalinity, Bicarbonate (as CaCO3) mg/L 3,650 3,650 3,260 3,260 7,300 7,300 7,190 7,190 2,550 2,610 4,400 5,680
Alkalinity, Carbonate (as CaCO3) mg/L 222 222 123 123 < 1.0 < 1.0 484 484 17.4 22.7 < 1.0 263
Alkalinity, Hydroxide (as CaCO3) mg/L < 1.0 < 1.0 < 1.0 < 1.0 < 1.0 < 1.0 < 1.0 < 1.0 < 1.0 < 1.0 < 1.0 < 1.0
Alkalinity, Phenolphthalein (as CaCO3) mg/L 111 - 61.6 - < 1.0 - 242 - 8.7 11.4 < 1.0 131
Bromide mg/L 3.16 3.16 < 10.0 < 10.0 < 10.0 < 10.0 < 1.00 < 1.00 2.57 2.73 1.77 5.60
Sulfide mg/L 46.5 - 60.9 - 139 - 178 - 63.9 49.1 95.7 250
Biochemical Oxygen Demand mg/L 195 - 114 - 323 - 354 - 111 174 - 469
Chemical Oxygen Demand mg/L 646 646 617 617 935 935 865 865 512 585 890 859
Phosphate mg/L - - 2.66 - - - - - - - - -
Ortho-Phosphate mg/L 5.40 5.4 - 2.66 8.72 8.72 1.91 1.91 3.59 3.67 3.93 6.14
Total Organic Carbon mg/L - - - - - - - - - - - -
Total Phosphorous as P mg/L 6.08 - 5.94 - 9.99 - 9.99 - 3.84 5.24 6.36 7.84
Dissolved Metals
Dissolved Aluminum µg/L 124 124 129 129 186 186 149 149 66.7 91.7 107 196
Dissolved Calcium mg/L 54.5 54.5 59.0 59 43.2 43.2 61.4 61.4 38.6 < 0.04 79 60.3
Dissolved Iron µg/L 46 46 64 64 70 70 87.4 87.4 32.4 38.2 40.9 < 200
Dissolved Magnesium mg/L 220 220 174 174 202 202 217 217 143 134 190 229
Dissolved Manganese µg/L 215 215 228 228 133 133 192 192 174 211 344 200
Dissolved Potassium mg/L 195 195 203 203 255 255 289 289 141 158 245 271
Dissolved Sodium mg/L 2,770 2,770 2,300 2,300 4,380 4,380 4,120 4,120 1,700 1,820 2,770 4,000
Antimony µg/L 11.6 11.6 6.14 6.14 13.7 13.7 33.9 33.9 6.82 8.65 15.1 37.3
Arsenic µg/L 33.0 33 28.3 28.3 40.1 40.1 134 134 26.2 35.8 51.7 81.4
Barium µg/L 85.6 85.6 89.2 89.2 145 145 177 177 56.7 77.7 157 145
Beryllium µg/L < 0.10 < 0.10 < 0.10 < 0.10 < 0.10 < 0.10 0.057 0.057 0.020 < 0.010 0.035 < 1.00
Boron µg/L 1,390 1,390 1,470 1,470 2,140 2,140 1,740 1,740 1,160 < 2.0 2,070 2,340
Cadmium µg/L < 0.010 < 0.010 < 0.010 < 0.010 0.014 0.014 0.0119 0.0119 0.0042 0.0056 0.0079 < 0.200
Chromium µg/L 18.2 18.2 17.8 17.8 54.2 54.2 52.5 52.5 13.2 14.3 33.9 41.7
Cobalt µg/L 2.72 2.72 2.98 2.98 5.52 5.52 7.47 7.47 2.47 2.57 7.88 5.11
Copper µg/L 0.63 0.63 0.60 0.6 0.45 0.72 0.48 0.48 0.42 0.57 0.25 < 10.0
Lead µg/L < 0.20 < 0.20 < 0.20 < 0.20 0.20 0.2 0.157 0.157 0.068 < 0.050 0.106 < 5.00
Lithium µg/L 66.1 66.1 52.4 52.4 63.0 63 54.2 54.2 36.9 < 0.050 55.5 65.9
Mercury µg/L < 0.100 < 0.100 < 0.010 < 0.010 < 0.010 < 0.010 < 0.010 < 0.010 < 0.010 < 0.010 < 0.010 < 0.010
Molybdenum µg/L 4.22 4.22 2.42 2.42 5.80 5.8 6.04 6.04 3.23 2.67 2.71 5.62
Nickel µg/L 17.8 17.8 17.3 17.3 36.9 36.9 34.1 34.1 12.5 13.5 23.7 31.0
Selenium µg/L 0.76 0.76 0.78 0.78 26.6 26.6 1.25 1.25 0.73 < 0.10 0.89 12.2
Silver µg/L < 0.050 < 0.050 < 0.050 < 0.050 < 0.050 < 0.050 0.014 0.014 < 0.010 < 0.010 < 0.010 < 1.00
Thallium µg/L < 0.020 < 0.020 < 0.020 < 0.020 < 0.020 < 0.020 < 0.0040 < 0.0040 < 0.0040 < 0.0040 0.0050 < 0.400
Titanium µg/L 48.4 48.4 52.2 52.2 120 120 124 124 27.2 32.7 65.1 99.8
Tungsten µg/L 2.6 - 3.1 - 5.0 - 5.07 - 1.80 < 0.20 3.36 < 20.0
Uranium µg/L 30.3 30.3 17.9 17.9 27.5 27.5 17.7 17.7 21.3 0.0206 7.62 17.8
Vanadium µg/L 12.4 12.4 15.9 15.9 24.8 24.8 32.1 32.1 7.90 13.0 14.7 < 20.0
Zinc µg/L < 4.0 < 4.0 < 4.0 < 4.0 4.7 4.7 3.8 3.8 1.4 1.4 2.7 < 100
Bismuth µg/L < 0.10 < 0.10 < 0.10 < 0.10 < 0.10 < 0.10 < 0.010 < 0.010 < 0.010 < 0.010 0.011 < 1.00
Phosphorous µg/L 6,880 6,880 6,440 6,440 10,300 10,300 9,650 9,650 3,860 4,860 6,040 8,240
Silicon µg/L 10,300 10,300 10,300 10,300 14,500 14,500 14,500 14,500 7,810 10,000 15,300 13,700
Strontium µg/L 2,050 2,050 2,310 2,310 2,220 2,220 2,470 2,470 1,460 1,870 2,440 2,420
Sulphur µg/L 810,000 - 625,000 - 3,180,000 - 1,210,000 - 421,000 428,000 663,000 882,000
Tellurium µg/L < 0.50 < 0.50 < 0.50 < 0.50 0.62 0.62 0.132 0.132 0.079 < 0.050 0.121 < 5.00
Thorium µg/L < 0.10 < 0.10 < 0.10 < 0.10 < 0.10 < 0.10 0.030 0.03 0.014 < 0.010 0.021 < 1.00
Tin µg/L 24.0 24 15.0 15 61.7 61.7 66.3 66.3 15.4 18.8 38.8 93.6
Zirconium µg/L 21.5 21.5 17.6 17.6 55.2 55.2 60.0 60 12.1 13.8 27.0 30.9
Monocyclic Aromatic Hydrocarbons
Benzene µg/L 5.5 5.5 4.0 4 9.7 9.7 11.3 11.3 4.1 4.1 5.9 7.9
Ethylbenzene µg/L 109 109 82.1 82.1 91.4 91.4 93.1 93.1 84.7 60.1 70.7 103
Toluene µg/L 3.4 3.4 < 1.0 < 1.0 2.9 2.9 2.4 2.4 3.6 < 1.6 < 1.0 2.4
Xylenes µg/L 72.8 72.8 46.6 46.6 120 120 98.2 98.2 58.9 34.7 41.8 77.8
Styrene µg/L < 1.0 - < 1.0 - < 1.0 - < 2.0 - < 1.0 < 1.0 < 1.0 < 1.0
Polycyclic Aromatic Hydrocarbons
Naphthalene µg/L 5.51 5.51 4.21 4.21 7.64 7.64 6.43 6.43 2.43 3.99 8.56 5.43
Methylnaphthalene, 1- µg/L 1.03 - 0.811 - 1.23 - 1.09 - 0.408 0.569 1.03 0.808
Methylnaphthalene, 2- µg/L 1.07 - 0.606 - 1.55 - 0.662 - 0.259 0.302 0.486 0.471
Acenaphthylene µg/L < 0.200 < 0.200 < 0.200 < 0.200 < 0.200 < 0.200 < 0.0200 < 0.0200 < 0.200 < 0.200 < 0.200 < 0.200
Acenaphthene µg/L 0.309 0.309 0.392 0.392 0.389 0.389 0.373 0.373 0.185 0.281 0.580 0.354
Fluorene µg/L 0.205 0.205 0.269 0.269 0.267 0.267 0.337 0.337 0.124 0.195 0.319 0.229
Phenanthrene µg/L 0.254 0.254 0.464 0.464 0.401 0.401 0.464 0.464 0.202 0.291 0.368 0.340
Anthracene µg/L 0.021 0.021 0.031 0.031 0.063 0.063 < 0.0500 < 0.0500 0.015 0.018 0.040 0.037
Acridine µg/L < 0.050 < 0.050 0.137 0.137 < 0.050 < 0.050 < 0.0700 < 0.0700 < 0.050 < 0.050 < 0.050 < 0.050
Fluoranthene µg/L 0.096 0.096 0.122 0.122 0.096 0.096 0.112 0.112 0.062 0.091 0.095 0.110
Pyrene µg/L 0.070 0.07 0.063 0.063 0.077 0.077 0.100 0.1 0.045 0.054 0.069 0.091
Benz(a)anthracene µg/L < 0.010 < 0.010 0.015 0.015 0.016 0.016 < 0.0200 < 0.0200 < 0.010 < 0.010 < 0.010 0.021
Chrysene µg/L < 0.050 < 0.050 < 0.050 < 0.050 < 0.050 < 0.050 < 0.0300 < 0.0300 < 0.050 < 0.050 < 0.050 < 0.050
Benzo(b)fluoranthene µg/L - - - - - - - - - - - -
Benzo(b+j)fluoranthene µg/L < 0.050 - < 0.050 - < 0.050 - < 0.0100 - < 0.050 < 0.050 < 0.050 0.057
Benzo(k)fluoranthene µg/L < 0.050 < 0.050 < 0.050 < 0.050 < 0.050 < 0.050 < 0.0100 < 0.0100 < 0.050 < 0.050 < 0.050 < 0.050
Benzo(a)pyrene µg/L < 0.010 < 0.010 < 0.010 < 0.010 0.023 0.023 0.00540 0.0054 < 0.010 < 0.010 < 0.010 < 0.010
Indeno(1,2,3-cd)pyrene µg/L < 0.050 < 0.050 < 0.050 < 0.050 < 0.050 < 0.050 < 0.0100 < 0.0100 < 0.050 < 0.050 < 0.050 < 0.050
Dibenz(a,h)anthracene µg/L 0.016 0.016 0.017 0.017 < 0.010 < 0.010 < 0.00500 < 0.00500 < 0.010 < 0.010 < 0.010 < 0.010
Benzo(g,h,i)perylene µg/L < 0.050 - < 0.050 - < 0.050 - < 0.0100 - < 0.050 < 0.050 < 0.050 < 0.050
Chloronaphthalene, 2- µg/L < 0.100 - < 0.100 - < 0.100 - - - < 0.100 < 0.100 < 0.100 < 0.100
Quinoline µg/L < 0.050 < 0.050 < 0.050 < 0.050 < 0.175 < 0.175 < 0.0800 < 0.0800 < 0.050 < 0.050 < 0.050 < 0.050
Volatile Organic Compounds
Bromodichloromethane [BDCM] µg/L < 1.0 < 1.0 < 1.0 < 1.0 < 1.0 < 1.0 < 1.0 < 1.0 < 1.0 < 1.0 < 1.0 < 1.0
Bromoform µg/L < 1.0 < 1.0 < 1.0 < 1.0 < 1.0 < 1.0 < 1.0 < 1.0 < 1.0 < 1.0 < 1.0 < 1.0
Carbon Tetrachloride µg/L < 0.5 < 0.5 < 0.5 < 0.5 < 0.5 < 0.5 < 0.5 < 0.5 < 0.5 < 0.5 < 0.5 < 0.5
Chlorobenzene µg/L < 1.0 < 1.0 < 1.0 < 1.0 < 1.0 < 1.0 < 1.0 < 1.0 < 1.0 < 1.0 < 1.0 < 1.0
Chloroethane µg/L < 2.0 < 2.0 < 2.0 < 2.0 < 2.0 < 2.0 < 2.0 < 2.0 < 2.0 < 2.0 < 2.0 < 2.0
Chloroform µg/L < 1.0 < 1.0 < 1.0 < 1.0 < 1.0 < 1.0 < 1.0 < 1.0 < 1.0 < 1.0 < 1.0 < 1.0
Chloromethane µg/L - - - - - - - - - - - -
Dibromochloromethane [DBCM] µg/L < 1.0 < 1.0 < 1.0 < 1.0 < 1.0 < 1.0 < 1.0 < 1.0 < 1.0 < 1.0 < 1.0 < 1.0
Dibromoethane, 1,2- µg/L < 0.3 - < 0.3 - < 0.3 - < 0.3 - < 0.3 < 0.3 < 0.3 < 0.3
Dibromomethane µg/L < 1.0 - < 1.0 - < 1.0 - < 1.0 - < 1.0 < 1.0 < 1.0 < 1.0
Dichlorobenzene, 1,2- µg/L < 0.5 < 0.5 < 0.5 < 0.5 < 0.5 < 0.5 < 0.5 < 0.5 < 0.5 < 0.5 < 0.5 0.5
Dichlorobenzene, 1,3- µg/L < 1.0 < 1.0 < 1.0 < 1.0 < 1.0 < 1.0 < 1.0 < 1.0 < 1.0 < 1.0 < 1.0 < 1.0
Dichlorobenzene, 1,4- µg/L 2.9 2.9 2.8 2.8 3.3 3.3 3.1 3.1 < 2.6 2.0 2.4 3.6
Dichloroethane, 1,1- µg/L 4.1 4.1 2.5 2.5 9.7 9.7 8.3 8.3 2.3 2.2 3.8 5.8
Dichloroethane, 1,2- µg/L < 1.0 < 1.0 < 1.0 < 1.0 < 1.0 < 1.0 < 1.0 < 1.0 < 1.0 < 1.0 < 1.0 < 1.0
Dichloroethylene, 1,1- µg/L < 1.0 < 1.0 < 1.0 < 1.0 < 1.0 < 1.0 < 1.0 < 1.0 < 1.0 < 1.0 < 1.0 < 1.0
Dichloroethylene, 1,2-cis- µg/L < 1.0 < 1.0 1.2 1.2 < 1.0 < 1.0 < 1.0 < 1.0 < 1.0 < 1.0 < 1.0 < 1.0
Dichloroethylene, 1,2-trans- µg/L < 1.0 < 1.0 < 1.0 < 1.0 < 1.0 < 1.0 < 1.0 < 1.0 < 1.0 < 1.0 < 1.0 < 1.0
Dichloromethane µg/L < 3.0 < 3.0 < 3.0 < 3.0 < 3.0 < 3.0 < 3.0 < 3.0 < 3.0 < 3.0 < 3.0 < 3.0
Dichloropropane, 1,2- µg/L < 1.0 < 1.0 < 1.0 < 1.0 < 1.0 < 1.0 < 1.0 < 1.0 < 1.0 < 1.0 < 1.0 < 1.0
Dichloropropene, 1,3- (cis+trans) µg/L < 1.0 - < 1.0 - < 1.0 - < 1.0 - < 1.0 < 1.0 < 1.0 < 1.0
Dichloropropene, 1,3-cis- µg/L - - - - - - - - - - - -
Dichloropropene, 1,3-trans- µg/L - - - - - - - - - - - -
Tetrachloroethane, 1,1,1,2- µg/L - - - - - - - -
Tetrachloroethane, 1,1,2,2- µg/L < 0.5 < 0.5 < 0.5 < 0.5 < 0.5 < 0.5 < 0.5 < 0.5 < 0.5 < 0.5 < 0.5 < 0.5
Tetrachloroethylene µg/L < 1.0 < 1.0 1.5 1.5 < 1.0 < 1.0 < 1.0 < 1.0 < 1.0 < 1.0 < 1.0 < 1.0
Trichloroethane, 1,1,1- µg/L < 1.0 < 1.0 < 1.0 < 1.0 < 1.0 < 1.0 < 1.0 < 1.0 < 1.0 < 1.0 < 1.0 < 1.0
Trichloroethane, 1,1,2- µg/L < 1.0 < 1.0 < 1.0 < 1.0 < 1.0 < 1.0 < 1.0 < 1.0 < 1.0 < 1.0 < 1.0 < 1.0
Trichloroethylene µg/L < 1.0 < 1.0 < 1.0 < 1.0 < 1.0 < 1.0 < 1.0 < 1.0 < 1.0 < 1.0 < 1.0 < 1.0
Trichlorofluoromethane µg/L < 1.0 < 1.0 < 1.0 < 1.0 < 1.0 < 1.0 < 1.0 < 1.0 < 1.0 < 1.0 < 1.0 < 1.0
Vinyl Chloride µg/L < 1.0 < 1.0 < 1.0 < 1.0 1.3 1.3 < 1.8 < 1.8 < 1.0 < 1.0 < 1.0 < 1.3
Gross Parameters
VH (C6-C10) µg/L 206 206 127 127 270 270 200 200 237 < 100 120 215
VPH (C6-C10) µg/L < 100 < 100 < 100 < 100 < 100 < 100 < 100 < 100 < 100 < 100 < 100 < 100
EPH (C10-C19) µg/L 1,020 1,020 458 458 2,580 2,580 600 600 337 < 250 2,300 424
LEPH (C10-C19) µg/L 1,020 1,020 452 452 2,580 2,580 592 - 334 < 250 2,290 417
EPH (C19-C32) µg/L 604 604 334 334 3,470 3,470 380 380 268 439 785 322
HEPH (C19-C32) µg/L 604 604 334 334 3,470 3,470 380 - 267 439 785 322
MTBE
Methyl Tert-butyl Ether [MTBE] µg/L < 1.0 - < 1.0 - < 1.0 - < 1.0 - < 1.0 < 1.0 < 1.0 < 1.0
Resin and Fatty Acids
Acetic Acid mg/L < 3.0 - < 3.0 - 3.5 - < 3.0 - < 3.0 < 3.0 23.1 5.2
Butyric Acid mg/L < 2.0 - < 2.0 - < 2.0 - < 2.0 - < 2.0 < 2.0 10.5 < 2.0
Caporic Acid mg/L < 2.0 - 2.3 - < 2.0 - < 2.0 - < 2.0 < 2.0 4.9 < 2.0
Heptanoic Acid mg/L < 2.0 - < 2.0 - < 2.0 - < 2.0 - < 2.0 < 2.0 < 2.0 < 2.0
Isobutyric Acid mg/L < 2.0 - < 2.0 - < 2.0 - < 2.0 - < 2.0 < 2.0 4.0 < 2.0
Isocaproic Acid mg/L < 2.0 - < 2.0 - < 2.0 - < 2.0 - < 2.0 < 2.0 3.5 < 2.0
Isovaleric Acid mg/L < 2.0 - < 2.0 - < 2.0 - < 2.0 - < 2.0 < 2.0 < 2.0 < 2.0
Propionic Acid mg/L < 2.0 - < 2.0 - < 2.0 - < 2.0 - < 2.0 < 2.0 < 2.0 < 2.0
Valeric Acid mg/L < 2.0 - < 2.0 - < 2.0 - < 2.0 - < 2.0 < 2.0 2.7 < 2.0
Associated CARO file(s): 8031228, 8052345, 8081555, 8110837, 9031248, 9060275, 9090105, mg/l, N000833, ug/L.
Associated Exova file(s): 506479, 507801, 509233, 600276, 602695, 605393, 608922, 611891, 614770, 617175, 619914, 625680, 627511, 629501.
All terms defined within the body of SNC-Lavalin's report.
< Denotes concentration less than indicated detection limit or RPD less than indicated value.
- Denotes analysis not conducted.
n/a Denotes no applicable standard/guideline.
QA/QC RPD Denotes quality assurance/quality control relative percent difference
* RPDs are not calculated where one or more concentrations are less than five times RDL.
RDL Denotes reported detection limit.
SNC-LAVALIN INC. Page 8 of 8
662036 / 2021 03 09
20210309_662036_TAB_Historical.xlsx QAQC CN 2021 03 09

SNC-Lavalin Inc. Suite 100 - 1358 St. Paul Street
Kelowna, British Columbia, Canada V1Y 2E1 250.861.9070 604.515.5150
www.snclavalin.com