
company certificate
89
PROJECT REPORT on “A STUDY ON TECHNICAL ANALYSIS OF SELETED STOCKS IN SHAREKHAN COMPANY” BY KRISHNA N AGADI 1NH18MBA35 Submitted to DEPARTMENT OF MANAGEMENT STUDIES NEW HORIZON COLLEGE OF ENGINEERING, OUTER RING ROAD, MARATHALLI, BENGALURU In partial fulfilment of the requirements for the award of the degree of MASTER OF BUSINESS ADMINISTRATION Under the guidance of Ms. JAYASHREE N ASSISTANT PROFESSOR 2018 - 2020
-
Upload
khangminh22 -
Category
Documents
-
view
4 -
download
0
Transcript of company certificate

PROJECT REPORT
on
“A STUDY ON TECHNICAL ANALYSIS OF SELETED
STOCKS IN SHAREKHAN COMPANY”
BY
KRISHNA N AGADI
1NH18MBA35
Submitted to
DEPARTMENT OF MANAGEMENT STUDIES
NEW HORIZON COLLEGE OF ENGINEERING,
OUTER RING ROAD, MARATHALLI,
BENGALURU
In partial fulfilment of the requirements for the award of the degree of
MASTER OF BUSINESS ADMINISTRATION
Under the guidance of
Ms. JAYASHREE N
ASSISTANT PROFESSOR
2018 - 2020

CERTIFICATE This is to certify that KRISHNA N AGADI bearing USN 1NH18MBA35, is a bonafide
student of Master of Business Administration course of the Institute 2018-20, autonomous
program, affiliated to Visvesvaraya Technological University, Belgaum. The project report on
“A STUDY ON TECHNICAL ANALYSIS OF SELECTED STOCKS IN SHAREKHAN
COMPANY” is prepared by him under the guidance of Ms. JAYASHREE N, in partial
fulfilment of requirements for the award of the degree of Master of Business Administration
of Visvesvaraya Technological University, Belgaum Karnataka.
Signature of Internal Guide Signature of HOD Signature of Principal
Name of the Examiners with affiliation Signature with date
1. External Examiner
2. Internal Examiner


DECLARATION
I, KRISHNA N AGADI, hereby declare that the project report on “A STUDY ON
TECHNICAL ANALYSIS OF SELECTED STOCKS IN SHAREKHAN COMPANY” with
reference to “SHAREKHAN LTD” prepared by me under the guidance of Ms. JAYASHREE
N, faculty of M.B.A Department, New Horizon College of Engineering.
I also declare that this project report is towards the partial fulfilment of the university
regulations for the award of the degree of Master of Business Administration by Visvesvaraya
Technological University, Belgaum.
I have undergone an industry project for a period of Eight weeks. I further declare that this
report is based on the original study undertaken by me and has not been submitted for the award
of a degree/diploma from any other University / Institution.
Signature of Student
Place:
Date:

ACKNOWLEDGEMENT The successful completion of the project would not have been possible without
the guidance and support of many people. I express my sincere gratitude to
Mr.Praveen Kumar N Assistant Manager, Sharekhan Ltd, Bengaluru, for
allowing to do my project at Sharekhan Ltd.
I thank the staff of Sharekhan Ltd, Bengaluru for their support and guidance
and helping me in completion of the report.
I am thankful to my internal guide Ms. Jayashree N, for her constant support and
inspiration throughout the project and invaluable suggestions, guidance and also
for providing valuable information.
Finally, I express my gratitude towards my parents and family for their
continuous support during the study.
STUDENT NAME: KRISHNA N AGADO
USN NO: 1NH18MBA35

1
TABLE OF CONTENTS
SL. NUMBER CONTENTS PAGE NUMBERS
1 Executive Summary 1
2 Theoretical Background Of The Study 2-13
3 Industry Profile &Company Profile 14-23
4 Application Of Theoretical Framework 24-32
5 Analysis And Interpretation Of Financial
Statement And Report 33-75
6 Learning Experience- Findings,
Suggestions And Conclusion 76-79
7 Bibliography 80-81

2
EX ECUTIVE SUMMARY
This study is focused on the technical analysis of selected stocks from financial industry. For
the study of daily. Closing prices of the stocks from BSE website pertaining to the period of
2017 to 2019 three years data by quarterly. The objective of the study was to determine the
future price trends of selected stocks, which would help investor in making profitable
decisions in short term. The tools used for the Technical Analysis are Exponential Moving
Averages (EMA), Relative Strength Index (RSI), Moving Averages Convergence Divergence
(MACD), Rate of Change (ROC), STOCH, SUPER TREND LINE, VOLUME. The research
method aimed at examining & predicting the trends by using charts of different analytical
tool results.
The study is focused on understanding the uses & advantages of technical analysis. In market
the entry & exit plays a vital role, people fail to understand the market conditions & the
opportunities, leading to huge losses. By understanding trends & signals, these losses can be
made good by profitable investment decisions. Technical analysis doesn’t predict the future
price absolutely, instead it helps to anticipate the possibility of prices to happen over a period
of time, which in turn reduces the risk involved to a great length & results in satisfactory
returns. And to make a good decision on basis of technical analysis in long run, one must
know the fundamental knowledge too.
This study is making more efforts in the price estimation of the stocks and this will also guide
the investors, how to invest and where to invest this will be the best tool to analysis the price
of stocks. Then the technical analysis is the best tool of the measuring the price value of the
stocks.

3
CHAPTER- 1
INTRODUCTION

4
.
➢ INTRODUCTION
Stock market means it is the market where the more number purchasing and selling of
securities in term stocks of thecompany. The company wants to create the high level of
capital, so for that they are collecting the money from the stock market by issuing the shares.
Then there are investors are ready to buy the shares, for that buying and selling of the shares
controlling purpose SEBI is formed, and it regulates the stock market.
Stock Market has the greater number of chances to gain money in a short time and a swell as
in long time also. That makes the more confidence on the investors that should be encourage
the stockholders to invest the currency in stock market.
Securities showcase has the most essentially inaccessible into three types of members, to be
accurate the holder of stocks, financial experts in securities and the middle- and high-class
people, they are using these as the side income earnings. And some of the people are saved
the money to participate in the stock market, and they are hoping that it will helpful in future
it will give some benefits to investors.
Stock market having the good opportunities to gain money and it will give returns as a
dividend. And in this market the companies are showing the good performance day by day
that also depends on news of the share market price. companies’ income and expenses are
also mattered by indirectly to market price of the company. And sales also based in the
company performance if good that will help more to gain the money by investing in that
company.
• Financial services:
Financial services are the fiscal services, providing by the finance business to succeed
money, covering a broad range of sectors like banking, insurance, mutual funds, accountancy,
consumer finance, stock broking, speculation funds, etc.
Financial services businesses are present in all carefully developed geographic location and
they collection in resident, national, local and worldwide money centre.

5
But financial services commerce is majorly concerned about the various sector more because
majority a financial sector with all it efforts, holds 64% of the full assets detained by the
financial system. Hence it makes stock broking alone would suit the industry rather than the
financial services trade.
Secondary market is also Known as the stock exchange is the place in the place where the
current shares of various companies are listed and traded. The stock trades here are the once
which are already issues in the primary market. The shares and securities are bought and sold
between the potential investor and the existing investors.
Financial service industry:
Capital market of India is one of the major and eldest capital market in the world. A financial
service which helps the company’s management of their finance related problems.
Types of financial services in India,
1) Banking
2) Insurance
3) Debt instruments
4) Wealth administration
5) Mutual funds
6) Tax advisors and review firms
7) Stock market

6
INTRODUCTION TO STUDY
The undertaking commonly isolated into securities that check and collection the
administration. That centre of the securities considers is a valuation of the budgetary assets.
The regard, in this way that thelimit of risk and returns. These two thoughts are in the
examination of endeavour. Theory the most described as the responsibility advantages for
unique or new properties that will be held more completed for some future day and age.
In nowadays brisk rising world various open entryways are existing, in instruction to change
with variations and get the best open entryways in the field of hypotheses, a specialist store
chief is major. Thusly, in the current circumstance, the Portfolio Management Facilities
(PMS) is snappy grabbing import an endeavour elective for the High Net worth Stockholders.
The technical analysis of selected stocks is the main intention to study the company’s shares
price increasing and decreasing to get the proper knowledge of the stocks. This technical
analysis is the estimation of the future price may or may not it right or wrong, but it will be
the near to the answer. For that technically we can analysis the data of the stock that should
be helpful to get purchasing and selling of the stocks in market. It’s an estimation of the share
price in the market it will be helping to do study on shares. Investment of money in market is
very risky for that we must be aver of the market continuously.
Methods of raising funds from primary market:
Initial Public Offering(IPO): when unlisted company raises money from general public for
the first time, it is called as initial public offering. Generally,when any entity (government or
corporate) needs money they issue the securities to the general public and raise money.Once
the securities are listed in stock exchange, they are available for trading in the secondary
market.
Rights issue: A rights issue includesmarketing securities in the primary market by issuing the
rights to the present shareholders.
Private placement: This includes market of securities to limited number of refined investors,
for example, money related organizations, shared assets, investment assets, bank etc.

7
• Early History:
The 1st stock broking began in Rome, where the first registered buying and selling of shares
happened. But after Rome fell. Stockbroking did not become a accurate career. In the current
era new stock exchange started to operate in 16th and 17th centuries.
In 1585, Europe’s oldest Stock conversation Frankfurt stock exchange was recognized
In 1602, Dutch East India Company developed the 1st publicly traded company.
In 1698 London Stock Exchange was established.
➢ 1850 – Shares of banks and securities of east India Business traded in Mumbai below a
extensive banyan tree in opposite of urban hall, which is now in the hanuman round park.
➢ 1875 – Agents planned an association recognized as the natural share brokers reminder,
and the nation’s first stock exchange the Bombay stock exchange (BSE), set up in
Mumbai with 318 members. The association fee slowly improved from Rs 1 in 1887 to
Rs 1000 in 1896, and Rs 48000 in 1920.
➢ 1956 – Securities contract guideline Act approved.
➢ 1957 – The BSE and eight other stock exchange registered below the refuges exchange
agreement act.
➢ 1982 – The BSE categorizes writings into group A for carry forward, and group B for
cash transaction.
➢ 1986 – The BSE 30 – share compassion index compiled. modernized every two minutes.
➢ 1987 – Stock field corporation of India set dynamic.
➢ 1992 – Ordinance promulgated for granting statutory powers to the SEBI. The over- the
pledge conversation of India begins operations. The national stock exchange combined.

8
➢ 1994 – The NSE’s obligation section instigates operation on June 30 and the wealth
market part starts online handwriting less trading on November 3.
➢ 1995 – the BSE mechanizes its exchange operation, signalling the end of 120 years of
ground transaction with exposed outcry scheme of share exchange and the opening of
screen-based interchange on the BSE.
➢ 1996 – NSE 50 catalogue started April 22. NSDL usual up as the primary depositary
India, and the NSE begins trading in dematerialized safeties on December 26.
➢ 2000 – The SEBI supports the reports on remaining exchange brought out by the SEBI
board on net-based trading and facilities. Pursuant towards the circular, stock exchanges
are requiring giving authorization to members to flinch net founded trading after
safeguarding fulfilment of the smallest situations
• Indian Scenario:
In India completely 21 stock exchange are operated in the Counter Exchanges. Out of these
Exchange BSE and NSE are the largest stock exchange functioning in India.
SEBI:
The SEBI were recognized on April 12, 1992 as per the arrangements of the SEBI of India
Act 1992.
Amis to ensure the consideration of the contributors in securities and help the development
of, and to control the securities showcase and for matter related there with or accidental
thereto"

9
Objectives:
• Another essential occasion is the support of exchanging stock records (Nifty and Sensex) in
2000. A market Index is an important and persuading thing on account of the running with
reasons.
• It is utilized as a bit of subordinate instruments like rundown prospects and record choices
• It can be utilized for disengaged assets association as if there should develop an occasion of
Index funds
Functions:
✓ SEBI is required to control the corporate in stock trade and some other securities showcase.
✓ Recording and directing the occupied of aggregate venture plans, including shared assets is
an obligation of SEBI.
✓ SEBI is in charge of restricting fake and out of line argument works on finding with
securities advertise.
✓ Prohibiting insider exchanging securities, with the burden of money related punishments, on
blundering market delegates.
✓ Regulating considerable obtaining of shares and takeover of organizations.
• Bombay Stock Exchange Ltd (BSE):
BSE is unique of the eldest stock exchanges of Asia and the very 1st of India. It was
recognized in the time of 1875 as “The Natural Share and Stockbrokers Associations”. With
the Past of 140 Years BSE have BSE have seen it’s share of ups and Downs, but today it has
grown up to developed 11th major stock exchange in the world.
BSE currently hold 5749 companies listed under it, through a market capitalization of $2
trillion as of July 2017.
• BSE SENSEX
In the year 1986 BSE invented up with stock market index called ‘SENSEX’. Today
SENSEX is a well Known as stock market index in India and it replicates the strength of
Indian Economy. SENSEX consists of the top 30 stock listed on BSE. As on 23rd Mar 2018
SENSEX read Rs.32596.54.

10
➢ The Stock Exchange, Mumbai, generally recognized as "BSE" remained familiar in 1875
as "The Native Share and Agents Association". It is the most seasoned one in Asia, even
more experienced than the Tokyo Stock Exchange, which remained set up in 1878.
➢ It is a volunteer non-profit creation Association of Peoples (AOP) and is currently
involved in the procedure of adapting itself into demutualized and business entity.
➢ It advanced during the years into its current grade as the chief Stock Exchange in the
nation. It is main Stock Exchange in the Nation to have developed perpetual salutation in
1956 from the Govt. of India below the Securities Agreements (Regulation) Act, 1956.
➢ Exchange, though given that an well-organized and translucent market for trading in
securities, debt and derivatives provisions the welfares of the stockholders and safeguards
redressal of their criticisms whether against the businesses or its own member-brokers.
➢ It also strives to teach and instruct the stockholders by conducting investor education
package and making obtainable to them necessary informative contributions.
• National Stock Exchange Ltd (NSE):
NSE was established in the year 1992 by the group of the leading financial organization with
reference of the Govt. NSE is wold’s 12th largest stock exchange after BSE. NSE was the 1st
stock conversation to introduce completely involuntary shade based electronic transaction
system with all modern facilities, and the first electronic stock exchange in India.
NSE currently hold 1696 companies listed under it, with a market capitalisation of the $1.41
trillion as of July 2017.
• NIFTY 50:
In the year 1995 NSE came up with the stock market index called NIFTY 50, NIFTY reflects
the Indian economy and its healthy just like a SENSEX. But here in NIFTY it consists of top
50 companies listed on NSE. As on 23rd Mar 2018 NIFTY index reads Rs.9998.0

11
➢ NSE was participated in 1992 and erected assumed affirmation as a stock conversation
April 1993. It in progress the undertaking in June 1994, with exchange on the Extensive
Debt Market Section. As such it pushed the Capital Market Section in November 1994 as
a trading phase for qualities and the Commodities and Options Section in June 2000 for
numerous subordinate tools.
➢ NSE consumes possessed the capacity to receipts the share trading system to the
approaches of the financial specialists. Innovation been outfit to convey the
administrations towards the financial specialists the nation over at least expensive
conceivable expense.
➢ It delivers a nation-wide, screen-based, automated trading scheme, with a high degree of
slide and equal contact to investors irrespective of environmental location. The tall level
of information distribution through on-line system has helped in integrating retail
investors on a nation-wide base.
➢ The standards set by the conversation in footings of market performs, Products,
technology and facility standards have developed industry levels and are being replicated
by additional market contributors.
12
IDEA OF INDUSTRY
An industry is commonly depicted as a homogenous gathering of organizations. We may
characterize an industry "as a gathering of firms delivering sensibly comparable items which
serve the a few needs of a typical arrangement of purchasers." Industries are generally
ordered based on items. As per this item savvy arrangement we have concrete industry, steel
industry, cotton material industry, pharmaceutical industry, etc. In any case, industry
arrangement becomes troublesome when managing firms having a differentiated product
offering. What's more, such firms are currently on the expansion. Despite the fact that
characterization of industry presents pragmatic troubles, every nation follows a normalized
grouping to encourage information assortment and detailing.
A) INDUSTRY LIFE CYCLE
Advertising specialists accept that every item has an actual existence cycle. They have
distinguished four phases m the life of an item, in particular presentation stage, development
stage, development stage and the decay stage. Similarly, an industry is additionally said to
have an actual existence cycle. As indicated by the business life cycle hypothesis, the life of
an industry can be isolated into the spearheading stage, the extension stage, the stagnation
stage, and the rot stage. This sort of isolation is incredibly valuable to a speculator on the
grounds that the gainfulness of workmanship industry relies on its phase of development in
truth every improvement stage is novel and displays various qualities.
PIONEERING STAGE
This is the principal stage in the modern life pattern of another industry where the innovation
just as the item are moderately new and have not arrived at a condition of flawlessness. The
spearheading stage is described by fast development sought after for the yield of industry.

13
Therefore there is an incredible open door for benefit. Numerous organizations contend with
one another energetically. As enormous number of organizations endeavor to catch a lot of
the market, there emerges high business death rates. Powerless firms are wiped out and a
lesser number of firms endure the spearheading stage.
It is hard for the examiner to recognize those organizations that are probably going to endure
and come out unequivocally later on. Along these lines, interest in organizations in an
industry that is in the spearheading stage is exceptionally unsafe. Businesses in the
spearheading stage are called dawn enterprises.
EXPANSION STAGE
When an industry has set up itself it enters the second phase of extension or development.
The business presently incorporates just those organizations that have endure the
spearheading stage. These organizations keep on getting more grounded. Each organization
finds a business opportunity for itself and builds up its own procedures to sell and keep up its
situation in the market. The opposition among the enduring organizations achieves improved
items at lower costs.
Organizations in the development phase of an industry are very alluring for speculation
purposes. Financial specialists can get exceptional yields at lower chance since request
surpasses supply in this stage. Organizations will win expanding measures of benefits and
deliver alluring profits.
STAGNATION STAGE
This is the third stage in the business life cycle, In this stage, the development of the business
balances out. The capacity of the business to develop seems to have been lost. Deals might be
expanding yet at a more slow rate than that accomplished by serious businesses or by the

14
general economy. The business starts to deteriorate. The progress of the business from the
development stage to the stagnation stage is frequently exceptionally moderate. Two
significant purposes behind this progress are change in social propensities and advancement
of improved innovation.
DECAY STAGE
From the stagnation stage the business goes to the rot stage. This happens when the results of
the business are not, at this point sought after. New items and new advances have gone to the
market. Clients have changed their propensities, style and connecting. Subsequently, the
industry gets old and step by step stops to exist. Along these lines, changes in social
propensities, changes in innovation and declining request are the reasons for rot of an
industry. A financial specialist ought to get out the business before the beginning of the rot
stage.
The business life cycle approach has significant ramifications for the financial specialists. It
gives a knowledge into the obvious benefits of interest in a given industry at a given time. An
industry as a rule shows how productivity in the spearheading stage, high gainfulness in the
development or extension stage, medium however consistent benefit in the stagnation or
development stage and declining gainfulness in the rot stage.

15
CHAPTER- 3
Industry Profile &Company Profile

16
INTRODUTION:
Sharekhan is the major separate marketing brokerage in the country. And 3rd major in
brokers in relationships of customer base preceded by ICICI Direct and HDFC Securities.
Sharekhan is single innovators of online interchange in India. It offers a broad range of
financial products and services including securities brokerage, equity trading, derivatives
trading, currency trading, mutual fund delivery, loan against shares, ESOP financing, IPO
financing and wealth organization.
Headquarters : Mumbai, India.
Established In : 2000
Established by : ShripalMorakhia
CEO : Kiran kumar km
Industry : Financial service
Parent : BNP Paribas

17
Website : Sharekhan.com
Sharekhan be located started by Mumbai-based businessperson ShripalMorakhia in 2000.
Sharekhan established the online retail broking business and utilized on the primary flood of
digitization, when dematerialization (Demat) of protections began into impact and electronic
trade was presented in the stock trades
Currently Sharekhan is working with 5000+ employees working for 16 lakh customers, at
180 divisions and more than 4000+ commercial partners spread across over 575 places. On
an usual, Sharekhan executes more than 400,000 employments regular.
➢ Guiding India's retail stock investors for 19 years
▪ This company registered with NSE and BSE for wealth market, futures, choices and
money segments and CDSL and NSDL for depository services.
▪ A full-service of stock broking secure provided that online services right from online
account opening to trading and investment.
▪ This company Created India’s greatest online tradingstage: Website Trade Tiger.
▪ Sharekhan App (accessible for Android and iOS devices) and Sharekhan Mini (a low
bandwidth website specially for mobile browsers.)
▪ It has a strong brick-and-mortar system with over 2600 outlets in 575+ cities.
▪ Research-based financial advice on all asset classes to suit all investing and trading styles.
▪ Keen Instruction and training courses for investors and dealers in suggestion with Online
Trading Conservatory

18
➢ Vision:
“To become the Largest retail player in India providing Wealth Management Services with
most satisfied customers through unbeatable platform and services offerings yielding superior
returns.”
➢ Mission:
“To educate & empower the Individual Investor to make better investment decisions through
Quality advice & superior service”
PRODUCT PROFILE
Sharekhan is one of the main merchandizing businesses of City Undertaking which is
successively viably subsequently 1922 in the country. Past it was the retail broking arm of the
Mumbai-based SSKI Group, which has extra than eight many years of participation in the
stockbroking business. Offer khan offers its clients an extensive variety of value associated
directions including exchange execution on BSE, NSE, Derivatives, store managements,
internet swapping, speculation exhortation and so on. Prior with an inheritance of over 80
years in the securities exchanges, the SSKI assemble wandered into official broking and
corporate back 18 years prior. SSKI is one of the main players in institutional broking and
corporate fund exercises. SSKI holds a sizeable segment of the market in every one of these
portions. SSKI's institutional broking arm speaks to 7% of the market for Foreign
Institutional portfolio theory and 5% of all Local Institutional portfolio enthusiasm for the
country. It has 60 institutional customers spread over India, Far East, UK, and the US.
Outside Institutional Investors produce about 65% of the association's income, with a day by
day turnover of over US$ 2million. The substance rich and research-arranged entry has
emerged among its counterparts in view of its unflinching devotion to offering clients best-
of-breed innovation and unrivalled
Market information. The objective has been to let customers make knowledgeable decisions
and to simplify the process of investing in stocks.
WORK STRUCUTRE OF SHAREKHAN
Sharekhan has continuously supposed in capitalizing in technology to body its businessThe
firm has utilized around of the most popular titles in the IT business, similar to Sun
Microsystems, Oracle, Microsoft, Cambridge Technologies, Nexgenix, Vignette, Verisign

19
Financial Skills India Ltd, Spider Software Pvt. Ltd. to manufacture its trade motor and
satisfied. The City Undertaking holds a majority stake in the business. HSBC, Intel & Carlyle
are the extra depositors. On April 17, 2002 Sharekhan propelled Speed Trade and Trade
Tiger, are net-based executable reason that coordinates the merchant terminals alongside host
of other information identified with the Day Buyers. This was for the primary time that a net-
based exchange station of this
PRODUCT AND SERVICES OFFERD BY SHAREKHAN
A. Equity Exchange Stage (Online/Offline).
B. Commodities Trading Stand (Online/Offline).
C. Portfolio Management Service.
D. Mutual Fund Suggested and Dispersal.
E. Insurance Dispersal.
F. Forex
COMPETITORS:
1. Reliance Capital
2. Indian bulls
3. Angle broking
4. Karvy
5. MotilalOswal
6. Zerodha
7. HDFC Securities
Areas of Operation:
Presently Sharekhan is operating with 5000+ employees working for 16 lakh customers, at
180 divisions and more than 4000+ commercial partners spread crossways over 575
locations. On an normal Sharekhan performs 400,000 and more trades daily. And more than
250 business associates.
AWARDS AND RECOGNITIONS
We cherish what we do and our activity is fulfilling for clients. Truly, it feels incredible each
time we are lauded by our clients and perceived by recognized associations. Here we share a
20
portion of the numerous honours we have gotten for our managements, items and activities in
the previous 18 years.
CNBS AWAAZ 2005:
Named as most Preferred broker Brand at Awaaz Consumer Awards.
UTVi AND STARMINE 2009:
Voted among top 10 at Starline Broker Awards for BSE Sensex Recommendation.
EDGE INFORMATION WEEK EDGE AWARD 2011:
Awarded as “IT Securities” category at the information week awards by EDGE.
ONLINE TRADING ACADEMY 2011:
Granted in five classifications, Start-up for the year, Marketer of the year, World class
execution, Silver focus club and brilliant focus club, at Annual International Conference of
OTA by Online Trading Academy.
ZEE BUSUNESS 2011:
Given as Best Pharma Analysts.
BLOOMBERG AND UTV 2012:
Awarded as Greatest Equity broker in the investors Education and Category Enhancement
cluster at the Bloomberg- UTV Financial leadership award
REASON TO CHOOSE SAHREKHAN LIMITED
Sharekhan has over eight several years of trust and firm quality in the Indian securities
conversation. In the Asia Currency intermediary's examination held as of late, SSKI earned
the 'India's best broking house for 2004award. As far back as it pushed Sharekhan as its retail
broking separation in February 2000. has been given that institutional-level investigation and
booking administrations to singular speculators.
➢ Technology
Through their web-based trading account, one can acquisition and move partakes in a second
from any PC with a web suggestion. Clients gain admittance to the ground-breaking internet
switching devices that will assist them with taking complete command over their interest in
offer.

21
➢ Accessibility
Sharekhan gives ADVICE, EDUCATION, TOOLS AND EXECUTION managements for
financial specialists. These managements are open amid numerous motivations the nation
completed the Internet (through the site www.sharekhan.com) and additionally finished the
Voice Tool.
➢ Knowledge
In a corporate where the accurate data at the correct time can translate into straight revenues,
stockholders get access to a wide choice of information on the content-rich gateway,
Stockholders will also get a helpful set of knowledge-based tools that resolve allow them to
take knowledgeable decision
Convenience
One can call Sharekhan’s Dial-N-Trade amount to get investment advice and implement
his/her trades. They have a enthusiastic call-centre to offer this service through a Toll-Free
Number 1800 22-7500 & 39707500 from anyplace in India.
Customer Service
Its purchaser service team assists their customer for any help that they necessity linking to
transactions, billing, demat and additional questions. Their customer service can be contact
through a toll-free number, email or live conversation on www.Sharekhn.com
Investment Advice
Sharekhan has committed study players of supplementary than 30people for basic and
technical research. Their forecasters continually track the pulse of the market and deliver
timely investment advice to customer in the form of daily investigation emails, online chat,
published information etc…
Benefits:
▪ Free Depository A/c
▪ Instant Cash Transfer
▪ Multiple Bank Option.
▪ Secure Order by Voice Tool Dial-n-Trade.
▪ Automated Portfolio to keep track of the value of your actual purchases.

22
▪ 24x7 Voice Tool access to your trading account.
▪ Personalized Price and Account Alerts delivered instantly to your Mobile Phone
&E-mail Address.
▪ Live Chat facility with Relationship Manager on Yahoo Messenger
▪ Special Personal Inbox for order and trade confirmations.
▪ On-line Customer Service via Web Chat.
▪ Enjoy Automated Portfolio.
▪ Buy or sell even single share
▪ Anytime Ordering.
Products & Services:
• Equity Trading
• Derivatives Trading
• Currency Trading
• Mutual Funds & SIP
• Bonds
• IPO
• Portfolio Management
• Learn to Trade
• NRI Services
• Trade Tiger
• Sharekhan App
• Sharekhan Mini

23
• Dial-N-Trade
• Pattern Finder
SWOTAnalysis:
• Strength:
Wide range of Financial Product
Strong customer layout
Strong online platform
Efficient research team
• Weakness:
Less emphasis on Advertising
Lack of awareness among customers
More Focus on HNI reduces the market share
• Opportunities:
Increase in Incomes
Increased interest in savings
Technological Advancements
Awareness among investors
Strict regulations by Govt. & SEBI
• Threats:
Increasing Competition.
Price war from existing brokers.

24
• Future Growth & Prospects:
Loan against Shares
Preference to Business Partners
Consumer Loans
Getting into Banking by 2020

25
CHAPTER-4
Application Of Theoretical Framework

26
Review of Literature:
• (Cunningham, 2004)
The consumers financial issues generally and objectively covered into the book. It has the
most effective twelve chapters. The basic financial issues are such as creating a will,
construction a savings nest and making the most effective for the best more effective for the
more effective understanding of the financial circulation of money. That shows the most
value of the uses of the currency. The survey in this book showed that people who plays their
bills as they come in where more satisfied and very less stressed than those who did not. With
this the second chapter focused on how to gain the control over the expenditure. This chapter
helps to solve and have good credit record.
Cunningham. (2004). your Financial action plan explained into twelve stages for achieving
money success.
• (Polkovnichenko, 2005)
A case for Rank Development Preference has maintained for rank dependent preference that
the rank Dependent expected utility model also known as anticipated utility should be the
matter. This model clarified the performance of the people has makes matter in investment of
their money that should be the main point of the investment. By investment gaining the
amount back for as a reward of the speculation they are getting the dividends from that makes
happier them that purpose only the matter of the returns.
Domestic as an investment in well diversified funds. They had poor portfolio of stock market
that is the main reason for lack of investment. Second are households who more savings but
their investment in equity was very low, he argued that portfolio choice model with rank
dependent preference are used.
Parameters as possible and with fully rational assumption which are constant and
Quantitative with the observed diversification. He suggested there is need to integrated the
model of rank dependent preference in portfolio theory and asset pricing is makes more
effective to analyses the data for more understanding purpose.
Polkovnichenko. (2005). Household portfolio Diversification.

27
• (Roberts)
Common and appropriate name for examination of stock market designs is “Technical
Analysis” Possibly no one in the financial world totally disregards technical analysis. Its
terminology is fixed in market writing and really nearly rely intensively on it.
In bright of this powerful curiosity in design and of promotional assumed to statistics in new
years, it appears curious that there has not been extensive recognition amongst the monetary
analysts that the plans of technical analysis may be slight.
Roberts, H. V. (n.d.). Stock-Market "Patterns" and Financial Analysis: Methodological
Suggestions.
• (Hirotaka Mizuno)
Stock market estimate several methods for the technical analysis and technical analysis have
been industrialized and are existence used this method to foresee the trend of the upcoming
price change of stocks and make it more effective for analysing. Several statistical methods
have been planned, but the results are insufficient in forecast truth.
Hirotaka Mizuno, M. K. (n.d.). Application of Technical Analysis of Stocks Market Prediction
.
• (Wang & Chan, 2006)
The experiential results specified that all of the practical trading rules and regulation suitably
forecast the course of variations in the NASDQ and TWI. Conclusion may provide investors
with the more effectual important data on asset division, the empirical grades established that
the average return of trading rules trained on bull flag and dear flag meaningfully better that
ordering every day and the period of the market. Technical study educations records or charts
of past stock of the values. Hopping to find designs that can be oppressed to achieve excess
gains.
Wang, J.-L., & Chan, S. (2006). Stock market exchange rule discovery using pattern
recognition and technical analysis.

28
• (Pandian, 2013)
In this book savings is the employment of funds on properties with the aim of grossing of
returns or money obligation. Investment has the two attributes, namely, time and risk. In the
process of investment, the present feasting is sacrificed to get a return in the future.
Capitalizing in various types of properties in an motivating activity that charms people from
all walks of life for that it is very vital for investing in the stock market it has the best future
in the life.
Pandian, P. (2013). Security Analysis and Portfolio Management.
• (Kahn)
In this book the author has mentioned that, the fine art of investing is developing into the
science of participating. This growth has been trendy slow and will stay for some time. Way
of investing should be the accurate and proper planed, as new generations of gradually
technical investment managers come to the duty, they will rely the more on analysis, process
and structure than on intuition, advice. The first necessary element for success in active
organization is a gratitude of the contest for any kind of problems and the risk management
that makes more changes in the personal skills development.
Kahn, R. C. (n.d.). Active Portfolio M management
• (Vince, 1990)
In this book the tradition of mathematical signs has hardly been stastic. The author had the
more curios to see what the known mathematical symbols will be 100 years from now. The
Random process and Gambling Theory he explained more number of methemetical aspects
which are relatedto trading. In trading the algorithum trading also there that purely based on
the methemetics that makes the perfectness in the trading and the trading should be accurate
and more helful to do the algorithum trading
Vince, R. (1990). Portfolio Management Formulas.

29
• (Zuckerman, 2004)
This paper says that the effectiveness of the situation procedure in the stock market is
contingent on the rationality of a stock position in the industry based classificatory structure
that directors estimate. While this building help investors interpret ambiguous economic
news. It is imperfect because stocks vary in the extent to which they are coherently
confidential, as discovered by the stocks place in the network coverage by securities analysis.
Zuckerman, E. W. (2004). Structural Incoherence and Stock Market Activity.
• (Kreps, 2014)
In this book the negligible reliable price scheme is in fact uniquely consistent in the finite
horizon case. In general, is the only constant price scheme that can be gotten as the limit of
consistent price schemes that can be gotten as the limit of dependable price schemes for the
natural classification of approximating. In one sense, we think that our analysis is consistent
with the fundamentalist spirit, opening with the view that stock price are formed by investors.
Kreps, J. M. (2014). SPECULATION INVESTOR BEHAVIOR IN A STOCK MARKET WITH
HETEROGENEOUS EXPECTATIONS.
• (Montazer, 2010)
In this book the main point of the Important issue decision making in stock exchange is
collection of the right stock at the right time. In order to choice the superior stocks and the
replacements for savings, in a finite number of alternatives have to be ranked considering the
several and sometimes conflicting criteria that often are vague and have uncertainty
conditions. Therefore, we are handled with the special multiple criteria decision creation
problem. The author has told about the what time we should buy the share and what time we
have to sell the stocks and it makes more efficient returns to the investor for that it may
helpful to the investor they should knowt the market situation before that investing in any
securities.
Montazer, M. F. (2010). Design and implementation of fuzzy expert system

30
Ansari V. Ahmed (2006) concentrated the IPO under-valuing in India amid the time of 2005
and found that the normal first-day return (under-estimating) was 40.9 percent which is very
significant. He likewise found that amid the period 84 percent of the IPOs were under pricing
and 16 percent were over rated.
Paula Hill (2006) utilized extraordinary information identifying with shareholdings of firms
posting on the London Stock Exchange, and gives convincing confirmation that IPO under-
pricing does not emerge from endeavours to decide the possession structure of the post IPO
firm. It is proposed that exploration is coordinated somewhere else to discover a response to
the under-pricing marvel, and for means other than IPO under-pricing to influence post Initial
public offering possession structure.
Ghosh (2005) did a review to discover the components clarifying IPO under estimating
utilizing 1842 organizations that got recorded on Bombay Stock Exchange from 1993-2001.
His review bolstered the flagging hypothesis. As opposed to the worldwide experience, he
announced that under estimating was less amid the high volume (hot) period as looked at to
the droop time frame in the Indian securities exchange.
Marisetty and Subrahmanyam (2005) reported the impact of gathering connection on the
2713 IPOs made in India amid three administrative administrations amid the period 1990-
2004. The review found that, the normal under valuing of gathering organizations was higher
than that of independent organizations. Specifically, they detailed that under evaluating was
higher for organizations subsidiary to private outside (multinational) and private Indian
bunches.
OnurArugaslanetal.(2004): Analysed the contentions for "why observing contemplations
make impetuses for chiefs to under value their organizations' IPOs" utilizing a test of U.S.
Initial public offerings. They found that the determinants of introductory returns, institutional
shareholdings, and post-IPO probability of securing were not predictable with these
contentions. They reasoned that observing contemplations are not critical determinants of
IPO under-pricing.
Shake (1986) proposed the "Champ Curse theory" to sensibly clarify an IPO's positive
starting return. The theory suggests that more questionable issues ought to have higher
starting returns. Backers and their speculation brokers endeavour to decrease data asymmetry
and starting returns by scattering data about the IPO firm. Speculators, then again, attempt to
judge the development capability of an organization opening up to the world from the
accessible data, which incorporates age, measure, data about promoters, and industry order.

31
Allen and Faulhaber's (1989) exact confirmation proposed the presence of `hot issue'
markets for starting open offerings: in specific periods and in specific enterprises, new issues
are under-priced and proportioning happened. This examination paper builds up a
demonstrate steady with this perception, which accept the firm itself best knows its prospects.
In specific conditions, firms with the most ideal prospects discover it ideal to flag their sort
by under-pricing their underlying issue of shares, and financial specialists realize that
exclusive the best can recover the cost of this flag from resulting issues.
STATEMENT OF PROBLEM:
In market there are more numbers of investors are don’t know about the technical analysis of
the stocks for that it may be a big problem to them to analysis the future price of the share.
for that purpose, the investors are having the knowledge of stock market. but some investors
are not known about this so for that to solve this problem this study may helpful to them.
How people are ready to solve these types of problems or not that will be the big difference in
the share marketplace.
The stock bazaar is one of the maximum significant ways for businesses to increase money.
Some of the traders are not knowing about the technical analysis, so for that deprived of
knowing of the stocks past and present routine of the stocks prices they will do trade, from
that they will lose money sometimes for that purpose, to avoiding of this problem technical
analysis will be helpful and it should be helps in the future estimation of the market price, and
it reduces the risk percentage of investors.
OBJECTIVES OF THE STUDY:
• To learn the technical analysis of the stocks.
• To estimate the future price of shares in market.
• To study the stock market share price of the company and Company performance of future
by using past data in the technical analysis method.
SCOPE OF THE STUDY:
To begin an awareness of technical analysis of the stocks in market. And taking the initial
part in the price decision making of shares, to buy and selling of stocks in market.
32
RESEARCH METHODOLOGY:
This report is founded on as secondary data, though secondary data collecting and combing
was given more importance since it is hearing factor in boldness of the studies. One of the
greatest main users of research methodology is that it helps in the identifying the problems,
and solving the problem. gathering, analysing the required info data and provided that an
alternative explanation to the problem.
It also assistances in gathering the energetic data that is essential by the topmost management
to support them for the better judgment and result creation of both day to day critical ones,
The study contains of around Investors Awareness around the Technical analysis of stocks in
Sharekhan Limited.
Data Collection
Secondary Data
Published resources from company andwebsites such as publications, journals, newspapers,
also websites.
Sampling Methods:
Probability sampling is need full information about all sampling units in the market world
due to time constraint Random sampling method was taken for the learning.
SAMPLE SIZE:
The sample size is 10 banks stock price
SAMPLING AREA:
• Data base provided by the Sharekhan Company limited.
• Money control websites
• Zerodha site

33
Plan of Analysis:
In this part the data has to analysis on the bases of random selection of some stock market. In
the stock market which are highly useful sectors in the economic development and nation
development that stocks are taken. And the data are collected from past 3 years share price as
a quarterly based.
Limitations of the Study:
• In this project the data are limited.
• It should be very difficult to understand normal people, those who are not having the stock
market knowledge.
• Maybe it is very difficult to understand the technical analysis, because it all are contain full
of charts and tables only, there is no any oral teaching so candidate should not understand
himself.
Chapter Scheme:
This chapter is containing the brief introduction about the securities why I should choose this
stock and the reasons, and this contains the selected stock price fluctuation between one time
to another time from opening price of the stock to end price of the stock. and how much
percentage it has changed in the certain period that also shown and the picture of the
technical analysis of that stocks by using certain technical tools.

34
CHAPTER-5
Analysis And Interpretation Of Financial
Statements And Reports

35
NIFTY:
The NIFTY means National Stock Exchange Fifty. It characterizes the weighted average of
total 50 Indian firm Stocks in 13 sectors, and is unique of the 2 main stock catalogues used in
India, the other existence the BSE Sensex.
The stock market is separated into 11 main sectors they are on behalf of key areas of the
Economy. If these segments are not performing well it will result in low economic growth
and the GDP also will decrease for that, these sectors are very important for development of
the economy.
They are: -
1) Financials:
In this sector, Banks, Investment funds, Insurance companies and Real estate companies.
2) Utilities:
In this sector, Electric, Gas, and Water Companies as well as integrated providers.
3)Consumer Discretionary:
It contains of retailers, Media company, Customer service providers, Apparel company and
Buyer durables product manufacturers.
4) Consumer Staples:
It consists of Food and Beverage companies as well as product manufactures.
5) Energy:
In this segment contains of Oil and Gas exploration and Production firms, and united
power forms.
6) Healthcare:
It involves of Biotechnology companies, Hospitals management firms and medical
device manufacturers.

36
7) Industrials:
It contains of Aerospace, Défense, Machinery, Construction, Fabrication and Manufacturing
companies.
8) Technologies:
It contains of Electronics manufacturing, software development and Information
technology firms.
9) Telecom:
It contains of Wireless providers, Cable company, Internet service providers and
Satellite companies.
10) Materials:
It contains of Mining, Refining, Chemicals, Forestry and related companies that are
focused on discovering and developing raw materials.
11) Real Estate:
It contains of businesses invested in inhabited, industrial, and Trade Real Estate.
These are the sector of NIFTY and taking some of the sectors which are more helpful
in development of economy and GDP development of the nation, that’s helps to analyse the
sector which are growing and falling and the reason why behind this problem.
Example: - Financial, Energy, Telecom, Healthcare, Consumer Discretionary.
And it helps to guide the investors to analyse the market based on the performance of the
sector and it will be the more effective to help to grow the investors returns.
By investing in the good sector, it will help for economic development and as well as nation
GDP will grow and it makes more effective in the analysing the stock market. Sometimes the
good and bad news of the companies or any rules and regulations of the government make
more difference in the stock market price fluctuation.

37
1) Financials:
• Banks:
• State Bank of India:
The State Bank of India (SBI) is an Indian global, open part banking and
monetary administrations legal body. It is an administration enterprise legal body
headquartered in Mumbai, Maharashtra. SBI is positioned as 236th in the Fortune
Global 500 rundown of the world's greatest partnerships of 2019. It is the biggest
bank in India with a 23% piece of the overall industry in resources, other than a
portion of one-fourth of the absolute credit and stores advertise.
The bank slips from the Bank of Calcutta, established in 1806, through the
Imperial Bank of India, making it the most seasoned business bank in the Indian
subcontinent. The Government of India assumed responsibility for the Imperial Bank
of India in 1955, with Reserve Bank of (India's national bank) taking a 60% stake,
renaming it the State Bank of India.
38
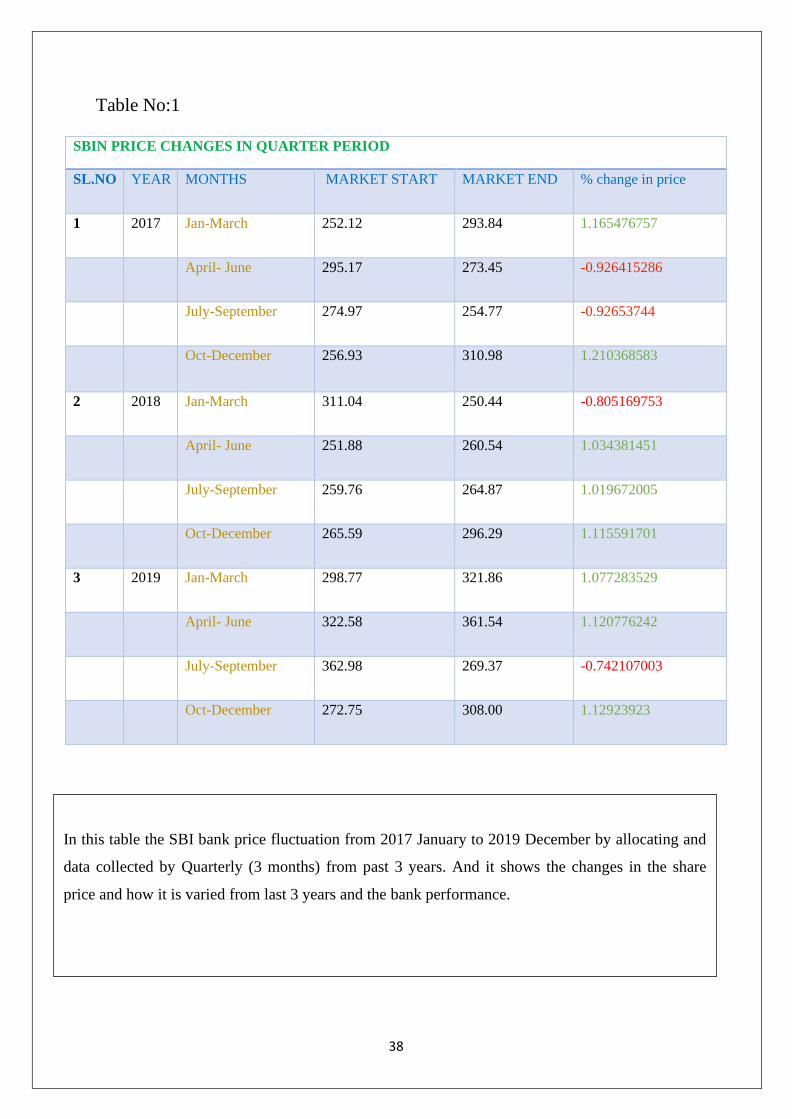
Chart No:1
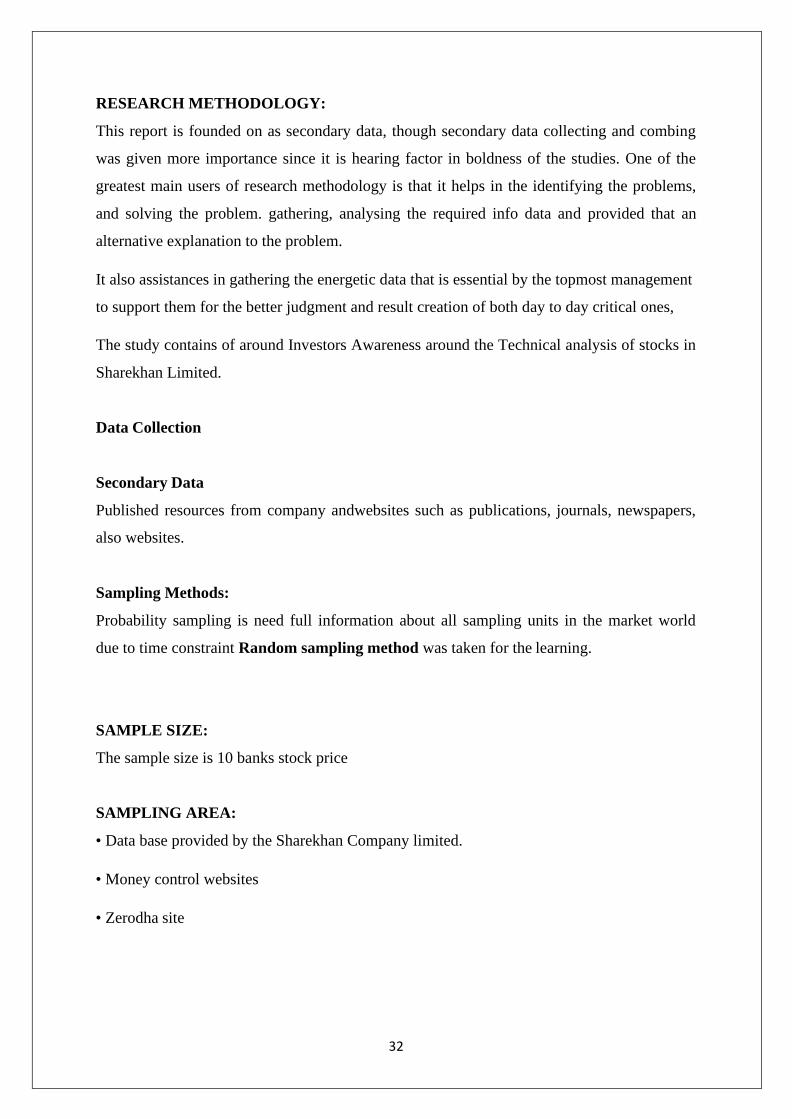
Table No:1
SBIN PRICE CHANGES IN QUARTER PERIOD
SL.NO YEAR MONTHS MARKET START MARKET END % change in price
1 2017 Jan-March 252.12 293.84 1.165476757
April- June 295.17 273.45 -0.926415286
July-September 274.97 254.77 -0.92653744
Oct-December 256.93 310.98 1.210368583
2 2018 Jan-March 311.04 250.44 -0.805169753
April- June 251.88 260.54 1.034381451
July-September 259.76 264.87 1.019672005
Oct-December 265.59 296.29 1.115591701
3 2019 Jan-March 298.77 321.86 1.077283529
April- June 322.58 361.54 1.120776242
July-September 362.98 269.37 -0.742107003
Oct-December 272.75 308.00 1.12923923
In this table the SBI bank price fluctuation from 2017 January to 2019 December by allocating and
data collected by Quarterly (3 months) from past 3 years. And it shows the changes in the share
price and how it is varied from last 3 years and the bank performance.

39
➢ Interpretation
In this chart the price is fluctuating between the 250 to 362, this shows very clearly that the
company is performing good to gain money in long term. When we saw that past data how
the price is increasing monthly it shows that this stock is very helpful for those who are ready
to invest the money in long term this will give a greater number of returns, on this base we
can say this is more helpful in the eyes of investors to get more number of returns.
Jan
-Mar
ch
Ap
ril-
Ju
ne
Jan
-Mar
ch
Ap
ril-
Ju
ne
Jan
-Mar
ch
Ap
ril-
Ju
ne
400
350
300
250
200
150
100
50
0
-50
MARKET START
MARKET END
% change in price
2017 2018 2019
1 2 3
July
-Sep
tem
be
r
Oct
-Dec
em
ber
July
-Sep
tem
be
r
Oct
-Dec
em
ber
July
-Sep
tem
be
r
Oct
-Dec
em
ber

40
This is the chart where the technical analysis are made, the Green colour candles are showing
the bullish (increasing) in the price and red colour candle are showing the Bearish
(Decreasing) in the price of the stock. And this is showing the past price changes in the stock
here For Example: There are a greater number of tools are there for analysing purpose but I
am using technical tools like Volume, Stoch and Super trend lines to analyse the future price
what could be there. The candles fluctuation are showing the price of the stock in that
particular time.
In this chart the Stoch line are showing there are red and white lines if the price is decreasing
the Stoch red will cross the white line For example : In this chart between March and June
there is big number of decrease in share price for that the redline crosses the white line that
shows the price decrease in the that period.

41
➢ HDFC Bank:
The HDFC Bank was consolidated on August 1994 by the name of 'HDFC Bank Limited',
with its enrolled office in Mumbai, India. The Housing Development Finance Corporation
(HDFC) was among the first to get an 'on a fundamental level' endorsement from the Reserve
Bank of India (RBI) to set up a bank in the private division, as a component of the RBI's
advancement of the Indian Banking Industry in 1994.
HDFC Bank is headquartered in Mumbai. The Bank at present has an advantageous system
of more than 1416 branches spread more than 550 urban areas across India. All branches are
connected on an online continuous premise. Clients in more than 500 areas are additionally
overhauled through Telephone Banking. The Bank likewise has a system of about more than
3382 organized ATMs over these urban communities.
The advertiser of the organization HDFC was incepted in 1977 is India's chief lodging money
organization and appreciates a perfect reputation in India just as in global markets. HDFC has
created huge skill in retail contract advances to various market portions and furthermore has a
huge corporate customer base for its lodging related credit offices. With its involvement with
the money related markets, a solid market notoriety, huge investor base and novel customer
establishment, HDFC was undeniably situated to advance a bank in the Indian condition

42
Table No:2
HDFC BANK PRICE CHANGES IN QUARTER PERIOD
SL.NO YEAR MONTHS MARKET START MARKET END % change in price
1 2017 Jan-March 606.43 721.28 1.189387069
April- June 725.53 829.74 1.14363293
July-September 827.62 902.05 1.089932578
Oct-December 897.8 936.08 1.042637558
2 2018 Jan-March 938.21 946.72 1.009070464
April- June 946.72 1050.93 1.110074785
July-September 1055.18 1002.01 -0.949610493
Oct-December 955.22 1059.44 1.109105756
3 2019 Jan-March 1065.82 1161.52 1.089790021
April- June 1159.39 1225.32 1.056866111
July-September 1229.58 1227.45 -0.998267701
Oct-December 1230.35 1272.10 1.033933433

43
Chart No: 2
➢ Interpretation
In this Financial sector the HDFC bank is one of the secluded sector bank and this bank is
performing very well in the stock market and it is the most increased stock in the previous 3
years. And this bank is price is in the January 2017 toDecember 2019 the price rate of this
company has changed grammatically increased the price that is 606.43 to 1227.45 the
changes in these period is 2.024% so this stock increasing day by day so it’s helpful to long
term investors and it creates the more returns to investors. For technical analysis you can use
the Stoch trend line based on you can analyse the stock price.
1400
1200
1000
800
600
400
200
0
MARKET START
MARKET END
% change in price
-200
2017 2018 2019
1 2 3
Jan
-Mar
ch
Ap
ril-
Ju
ne
July
-Sep
tem
be
r
Oct
-Dec
em
ber
Jan
-Mar
ch
Ap
ril-
Ju
ne
July
-Sep
tem
be
r
Oct
-Dec
em
ber
Jan
-Mar
ch
Ap
ril-
Ju
ne
July
-Sep
tem
be
r
Oct
-Dec
em
ber

44

45
2) Energy:
➢ POWERGRID:
Is an Indian state-possessed Maharatna organization headquartered in Gurugram, India and
connected for the most part in Transmission of Power. POWERGRID transmits about half of
the complete force created in India on its transmission arrange. Its previous auxiliary
organization, Power System Operation Corporation Limited (POSOCO) handles power the
board for National Grid and all state transmission utilities. POWERGRID likewise works a
telecom business under the name POWERTEL. Shri Kandikuppa Sreekant fills in as the
Chairman and Managing Director of the organization.
POWERGRID began working on the executives premise with impact from August, 1991 and
consequently it took over transmission resources from NTPC, NHPC, NEEPCO, NLC, NPC,
THDC, SJVNL and so forth in a staged way and it initiated business activity in 1992–93.
Moreover, it likewise assumed control over the activity of existing Regional Load Despatch
Centers (RLDCs) from Central Electricity Authority (CEA), in a staged way from 1994 to
1996, which have been overhauled and modernized with State of-the-craftsmanship Unified
Load Despatch and Communication (ULDC) plans. Thusly, National Load Despatch Center
(NLDC) was set up in 2009 for generally speaking coordination at National level.

46
Table No:3
POWERGRID PRICE CHANGES IN QUARTER PERIOD
SL.NO YEAR MONTHS MARKET
START
MARKET
END
% change in price
1 2017 Jan-March 183.57 197.28 1.074685406
April- June 199.74 210.43 1.053519575
July-September 210.16 210.98 1.003901789
Oct-December 212.62 200.02 -0.940739347
2 2018 Jan-March 199.47 193.44 -0.96976989
April- June 192.89 186.59 -0.967338898
July-September 186.86 188.51 1.00883014
Oct-December 188.78 198.65 1.052283081
3 2019 Jan-March 197.82 198.37 1.002780305
April- June 198.1 207.14 1.045633518
July-September 207.69 198.92 -0.957773605
Oct-December 198.35 190.25 0.959163095

47
Chart No:3
➢ Interpretation
POWERGRID is the one of the companies which is more helpful to the economic growth and
the nation development.
In this chart is POWERGRID company price is very fluctuating and it makes more increase
and decrease in the price value from January 2017 to December 2019 these price is changed
that is 183.57 to 190.92 there is small number of increase but it fluctuated more in the price
and it reaches the maximum of 225 in 2017 July and it may helpful to intraday trader.
These power grid fluctuation shows in the chart no:3 in that the analysis will say the more
changes in the amount from one retro to another period besides it will be the more effective.
This is having the good future because powergrid having the more opportunities now a days.
250
200
150
100
50
0
MARKET START
MARKET END
% change in price
-50
2017 2018 2019
1 2 3
Jan
-Mar
ch
Ap
ril-
Ju
ne
July
-Sep
tem
be
r
Oct
-Dec
em
ber
Jan
-Mar
ch
Ap
ril-
Ju
ne
July
-Sep
tem
be
r
Oct
-Dec
em
ber
Jan
-Mar
ch
Ap
ril-
Ju
ne
July
-Sep
tem
be
r
Oct
-Dec
em
ber

48
.

49
ADANIPOWER:
The organization is India's biggest private warm influence maker, with limit of 12,410 MW
The firm was positioned as the 73rd biggest partnership in India in Fortune India 500
rundown of 2018. The organization works five supercritical boilers of 660 MW each and 4
supercritical boilers of 330 MW each at Mundra, Gujarat; five 660 MW units at Tiroda,
Maharashtra.
The plant is the main warm force plant in India to be confirmed by United Nations
Framework Convention on Climate Change (UNFCCC) under Clean Development
Mechanism. The organization is actualizing 1,600 MW at Godda and numerous different
plants which are at various phases of planning. The organization has gone to long haul PPAs
of around 9,153 MW with legislature of Gujarat, Maharashtra, Haryana, Rajasthan,
Karnataka and Punjab.

50
Table No: 4
ADANI POWER PRICE CHANGES IN QUARTER PERIOD
SL.NO YEAR MONTHS MARKET START MARKET END % change in price
1 2017 Jan-March 30.15 40 1.326699834
April- June 40 29.69 -0.74225
July-September 30 29.9 -0.996666667
Oct-December 29.7 41.82 1.408080808
2 2018 Jan-March 41.82 23.78 -0.568627451
April- June 24.54 16.21 0.660554197
July-September 16.36 23.78 1.453545232
Oct-December 23.78 51.07 2.147603028
3 2019 Jan-March 51.07 48.19 -0.943606814
April- June 48.49 51.52 1.062487111
July-September 52.28 64.4 1.231828615
Oct-December 66.05 61.08 0.924753974

51
Chart No: 4
➢ Interpretation
The Adani power company’s share price is more variable in the share price of the company,
this is helps to buyers those who are buying the bulk order shares that time it will be useful.
when they are perfect in the technical analysis the ordered share will be gives the more
returns on the investment that will be the higher returns.
The price is varied more and the candles are changed very high sometimes it may high and
some time it may reduced that will be the more. If you buy the share between the 2018 June
and December the price is increased more in that time definitely you will get more returns.
250
200
150
100
50
MARKET START
MARKET END
% change in price 0
-50
2017 2018 2019
1 2 3
Jan
-Mar
ch
Ap
ril-
Ju
ne
July
-Sep
tem
be
r
Oct
-Dec
em
ber
Jan
-Mar
ch
Ap
ril-
Ju
ne
July
-Sep
tem
be
r
Oct
-Dec
em
ber
Jan
-Mar
ch
Ap
ril-
Ju
ne
July
-Sep
tem
be
r
Oct
-Dec
em
ber

52

53
3) Telecom:
➢ IDEA:
Idea Cellular is a significant cell phone administration administrator in India and positioned
third in the nation by supporter numbers. It has a place with the Aditya Birla Group, one of
the three biggest combinations in India. Established in 1995, Idea was overseen for quite a
while as an organization mutually possessed by Birla, the Tata Group, another top Indian
combination, and the AT&T Group of the U.S. AT&T therefore pulled back its capital from
Idea and Tata sold its value stake in 2006 on the grounds that it set up a telecom organization.
Accordingly, Birla has put Idea under its administration. Thought procured its opponent
Spice Communications in 2008 and has continued growing its market nearness to turn into
India's third biggest portable transporter after Bharti Airtel and Vodafone. It has been
winning new supporters by advancing third-age cell phone benefits in provincial regions.
Aditya Birla Nuvo, the center organization of the Birla gathering, is Idea's greatest investor.
Other gathering organizations, for example, Hindalco Industries and Grasim Industries, are
additionally significant partners. The Birla bunch all in all possesses an almost 40% stake in
Idea.

54
Table No:5
IDIA PRICE CHANGES IN QUARTER PERIOD
SL.NO YEAR MONTHS MARKET START MARKET END % change in price
1 2017 Jan-March 74.8 85.74 1.146256684
April- June 84.18 86.26 1.024708957
July-September 86.26 77.4 -0.897287271
Oct-December 77.93 108.66 1.394328243
2 2018 Jan-March 107.62 75.84 -0.704701728
April- June 77.4 59.17 -0.764470284
July-September 59.17 38.33 -0.64779449
Oct-December 38.33 38.85 1.013566397
3 2019 Jan-March 38.85 18.01 -0.463577864
April- June 18.1 12.8 -0.70718232
July-September 12.8 7.07 -0.55234375
Oct-December 6.30 6.15 -0.97619047

55
Chart No: 5
➢ Interpretation
The Idea Company is one of the best telecom companies in India. But some compotator
effects it losses more number of profit that will be the main impact of the falling in the share
price. The government rules and regulations are affected more. The share value of the Idea
Company reducing day by day and it losing the more money in the market and the
performance of the company is also reduced for that the price is falling more from last 3
years.
The company’s price is reducing more for that the investors are not having the interest on
investing the money in this company. But this will be affected to nation the telecom industry
will be effects to nation development in a big manner, this will not good to nation telecom
industry is very important to development.
250
200
150
100
50
0
MARKET START
MARKET END
% change in price
-50
2017 2018 2019
1 2 3
Jan
-Mar
ch
Ap
ril-
Ju
ne
July
-Sep
tem
be
r
Oct
-Dec
em
ber
Jan
-Mar
ch
Ap
ril-
Ju
ne
July
-Sep
tem
be
r
Oct
-Dec
em
ber
Jan
-Mar
ch
Ap
ril-
Ju
ne
July
-Sep
tem
be
r
Oct
-Dec
em
ber

56

57
➢ BHARATIAIRTEL:
Bharti Airtel Limited, otherwise called Airtel, is an Indian worldwide media communications
administrations organization situated in New Delhi, India. It works in 18 nations across South
Asia and Africa, and furthermore in the Channel Islands. Airtel gives GSM, 3G, 4G LTE,
4G+ versatile administrations, fixed line broadband and voice administrations relying on the
nation of activity. Airtel had likewise revealed its VoLTE innovation over all Indian telecom
circles. It is the third biggest versatile system administrator in India and the second biggest
portable system administrator on the planet with over 411.42 million subscribers. Airtel was
named India's second most significant brand in the first ever Brandz positioning by Millward
Brown and WPP plc. Airtel is credited with spearheading the business system of re-
appropriating the entirety of its business activities aside from advertising, deals and fund and
building the 'minutes industrial facility' model of ease and high volumes. The technique has
since been received by a few operators. Airtel's gear is given and kept up by Ericsson,
Huawei, and Nokia Networks though IT support is given by Amdocs. The transmission
towers are kept up by auxiliaries and joint endeavor organizations of Bharti including Bharti
Infratel and Indus Towers in India.
58
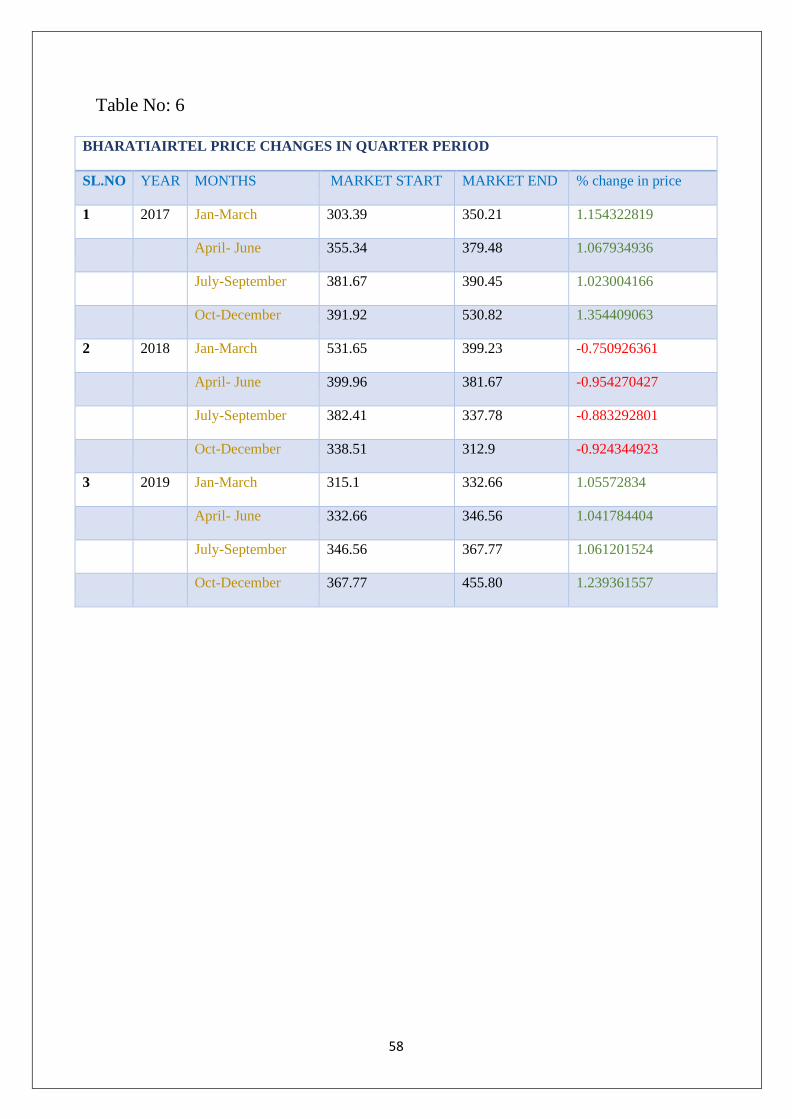
Table No: 6
BHARATIAIRTEL PRICE CHANGES IN QUARTER PERIOD
SL.NO YEAR MONTHS MARKET START MARKET END % change in price
1 2017 Jan-March 303.39 350.21 1.154322819
April- June 355.34 379.48 1.067934936
July-September 381.67 390.45 1.023004166
Oct-December 391.92 530.82 1.354409063
2 2018 Jan-March 531.65 399.23 -0.750926361
April- June 399.96 381.67 -0.954270427
July-September 382.41 337.78 -0.883292801
Oct-December 338.51 312.9 -0.924344923
3 2019 Jan-March 315.1 332.66 1.05572834
April- June 332.66 346.56 1.041784404
July-September 346.56 367.77 1.061201524
Oct-December 367.77 455.80 1.239361557

59
Chart No: 6
➢ Interpretation
This is the Indian telecom company which is performing well in India presently it will be the
one of the best telecom company. This company is maintaining the constant growth in the
share price this is good to nation and it is required.
It reached the high price at the time of 2018 June the price of Rs 399.23 and it is increasing
more now a days. If the investor knows the Technical analysis, he can make money in this
company. And it will be the more effective returns are given to investors those who are
invested money in this company.
250
200
150
100
50
MARKET START
MARKET END
% change in price 0
-50
2017 2018 2019
1 2 3
Jan
-Mar
ch
Ap
ril-
Ju
ne
July
-Sep
tem
be
r
Oct
-Dec
em
ber
Jan
-Mar
ch
Ap
ril-
Ju
ne
July
-Sep
tem
be
r
Oct
-Dec
em
ber
Jan
-Mar
ch
Ap
ril-
Ju
ne
July
-Sep
tem
be
r
Oct
-Dec
em
ber

60

61
4) Healthcare: DR REDDY:
Dr. Reddy's Laboratories is a worldwide pharmaceutical organization. The organization was
established by Anji Reddy, who recently worked in the tutor foundation Indian Drugs and
Pharmaceuticals Limited, of Hyderabad, India. Dr. Reddy's makes and markets a wide scope
of pharmaceuticals in India and abroad. The organization has more than 190 prescriptions, 60
dynamic pharmaceutical fixings (APIs) for tranquilize make, demonstrative packs, basic
consideration, and biotechnology items. Dr. Reddy's started as a provider to Indian
medication producers, however it before long began sending out to different less-directed
markets that had the benefit of not investing energy and cash on an assembling plant that
would pick up endorsement from a medication permitting body, for example, the U.S.
Nourishment and Drug Administration (FDA). By the mid 1990s, the extended scale and
productivity from these unregulated markets empowered the organization to start
concentrating on getting endorsement from sedate controllers for their details and mass
medication fabricating plants - in increasingly created economies. This permitted their
development into managed markets, for example, the US and Europe. In 2014, Dr. Reddy
Laboratories was recorded among 1200 of India's most believed brands as indicated by the
Brand Trust Report 2014, an investigation led by Trust Research Advisory, a brand
examination company. By 2007, Dr. Reddy's had seven FDA plants creating dynamic
pharmaceutical fixings in India and seven FDA-reviewed and ISO 9001 (quality) and ISO
14001 (ecological administration) affirmed plants preparing tolerant drugs – five of them in
India and two in the UK.

62
Table No: 7
DRREDDYs LABORATARIES PRICE CHANGES IN QUARTER PERIOD
SL.NO YEAR MONTHS MARKET START MARKET END % change in price
1 2017 Jan-March 3070 2633 -0.857654723
April- June 2643 2694 2643
July-September 2709 2328 -0.859357697
Oct-December 2417 2417 1
2 2018 Jan-March 2417 2084 -0.8622259
April- June 2084 2239 1.0743762
July-September 2234 2535 1.1347359
Oct-December 2530 2624 1.03715415
3 2019 Jan-March 2624 2788 1.0625
April- June 2798 2549 -0.911007863
July-September 2582 2704 1.047250194
Oct-December 2783 2874 1.032698526

63
Chart No: 7
➢ Interpretation
Health care sector is very important sector for economic development. This is also
performing well the changes in the share price is more. But this is maintaining continuous
consistency between the price changing. This will be the finest to invest and become the
returns. Because healthcare sector having good opportunity in India because of population.
We can assume the future of the stock by using the technical analysis tools, for Example in
STOCH tool the white and red lines are there they are showing the situation of the price for
certain period base, what will be happening in the next step like that we can assume the price
of the share price in the technical analysis.
250
200
150
100
50
0
MARKET START
MARKET END
% change in price
-50
2017 2018 2019
1 2 3
Jan
-Mar
ch
Ap
ril-
Ju
ne
July
-Sep
tem
be
r
Oct
-Dec
em
ber
Jan
-Mar
ch
Ap
ril-
Ju
ne
July
-Sep
tem
be
r
Oct
-Dec
em
ber
Jan
-Mar
ch
Ap
ril-
Ju
ne
July
-Sep
tem
be
r
Oct
-Dec
em
ber

64

65
➢ APOLLO Hospital:
Apollo Hospitals Enterprise Limited is an Indian medical clinic chain situated in Chennai,
India. It was established by Dr Prathap C. Reddy in 1983 as the first corporate medicinal
services in Quite a while. A few of the gathering's medical clinics have been among the first
in Quite a while to get universal medicinal services accreditation by America-based Joint
Commission International (JCI) just as 13 NABH National Accreditation Board for Hospitals
and Healthcare Providers hospitals. The gathering has created benefits in telemedicine, in the
wake of beginning a pilot venture in 2000 at Aragonda, Prathap Reddy's home village.
Apollo Hospitals in Visakhapatnam The association marked a 'reminder of comprehension'
with Health Education England in April 2017 to give countless specialists to fill opportunities
in the English National Health Service. The association is recorded on the Bombay Stock
Exchange (BSE: 508869) and the National Stock Exchange

66
Table No: 8
APOLLO HOSPITAL PRICE CHANGES IN QUARTER PERIOD
SL.NO YEAR MONTHS MARKET START MARKET END % change in price
1 2017 Jan-March 1181.72 1166.14 -0.986815828
April- June 1174.01 1276.89 1.087631281
July-September 1269.97 1006.95 -0.792892745
Oct-December 1012.14 1205.94 1.191475488
2 2018 Jan-March 1216.32 1064.05 -0.874810905
April- June 1069.24 1050.21 -0.982202312
July-September 1064.05 1043.29 -0.980489639
Oct-December 1034.64 1256.12 1.214064795
3 2019 Jan-March 1254.39 1230.17 -0.98069181
April- June 1233.63 1358.21 1.100986519
July-September 1361.67 1396.28 1.025417318
Oct-December 1484.80 1442.00 -0.971174568

67
Chart No: 8
➢ Interpretation
The health care sector is also one of the important factor which helps to develop
the economy of the nation, this sector is always growing sector and it makes the
investors attracts and the risk factor is also less if you invest in the right time by
using the technical analysis you will get the returns definitely.
In the Chart 15 the price changing and the chart 16 the technical analysing
methods are shown and make it clear more and the price changes from January
2017 to December 2019 the price is changed the 1442.72 to 1396.28 this is
varied from the year to year that is based on the performance of the company.
2500
2000
1500
1000
500
SL.NO
YEAR
MONTHS
MARKET START
MARKET END
% change in price
0
1 2 3 4 5 6 7 8 9 10 11 12 13
-500

68

69
5) Consumer Discretionary: Varun Beverages:
The Company was fused as Varun Beverages Limited on June 16, 1995 at New Delhi as an
open restricted organization under the Companies Act, 1956. the Company got a declaration
of initiation of business on July 4, 1995. We have been related with PepsiCo since the 1990s
and have more than two and half decades united the business relationship with PepsiCo,
expanding the quantity of authorized regions and sub-regions secured by us, delivering and
disseminating a more extensive scope of PepsiCo refreshments, presenting different SKUs in
the portfolio, and extending the appropriation arrange.

70
Table No:9
VARUN BEVERAGES PRICE CHANGES IN QUARTER PERIOD
SL.NO YEAR MONTHS MARKET START MARKET END % change in price
1 2017 Jan-March 258.58 270.21 1.04497641
April- June 270.2 355.94 1.317320503
July-September 355.94 341.41 -0.959178513
Oct-December 341.41 435.87 1.276676137
2 2018 Jan-March 435.87 419.89 -0.963337692
April- June 424.25 504.17 1.188379493
July-September 502.72 492.55 -0.979770051
Oct-December 483.83 524.52 1.084099787
3 2019 Jan-March 528.88 579.74 1.096165482
April- June 579.74 633.51 1.092748473
July-September 636.41 624.79 -0.98174133
Oct-December 620.15 708.60 1.14262678

71
Chart No: 9
➢ Interpretation
This stock having the big opportunity because of it is increasing in nature from the
beginning of the company to still now this is performing well and increasing day by day
its price. And the Technical indicators are also showing good. Increased in the price
that’s also good and the annual income and the balance sheet of the company also use in
the technical analysis. The changes in the price are showed in the chart 17 and 18.
800
700
600
500
400
300
200
100
0
-100
MARKET START
MARKET END
% change in price
2017 2018 2019
1 2 3
Jan
-Mar
ch
Ap
ril-
Ju
ne
July
-Sep
tem
be
r
Oct
-Dec
em
ber
Jan
-Mar
ch
Ap
ril-
Ju
ne
July
-Sep
tem
be
r
Oct
-Dec
em
ber
Jan
-Mar
ch
Ap
ril-
Ju
ne
July
-Sep
tem
be
r
Oct
-Dec
em
ber

72

73
➢ COFFEDAY:
Cafe Coffee Day Global Limited Company is a Chikkamagaluru-based business which
develops espresso in its own bequests of 20,000 acres. It is the biggest maker of arabica
beans in Asia, sending out to different nations including the U.S., Europe, and Japan. V.
G. Siddhartha began the coffe chain in 1996 when he fused Coffee Day Global, which is
the parent of the Coffee Day chain. The first CCD outlet was set up on July 11, 1996, at
Brigade Road, Bangalore, Karnataka. It quickly extended to different urban areas in
India, with more than 1000 coffes open the country over by 2011. In 2010, it was
reported that a consortium drove by Kohlberg Kravis Roberts would contribute ₹10
billion (US$140 million) in Coffee Day Resorts, possessed by the company. that year,
the logo was changed to the present logo, which the organization expressed was to
feature the chain as a spot to talk. This was finished with significant changes in the
format of the stores, including the expansion of parlors and an all out redo of the insides.

74
Table No: 10
COFFEEDAY PRICE CHANGES IN QUARTER PERIOD
SL.NO YEAR MONTHS MARKET START MARKET END % change in price
1 2017 Jan-March 200 231.61 1.15805
April- June 234.31 246 1.04989117
July-September 251.4 218.12 -0.867621321
Oct-December 218.12 273.88 1.255639098
2 2018 Jan-March 279.28 303 1.084932684
April- June 306.25 274.78 -0.897240816
July-September 268.48 281.07 1.046893623
Oct-December 278.38 278.38 1
3 2019 Jan-March 278.38 289.17 1.038759968
April- June 287.37 231.61 -0.805964436
July-September 237.01 48.16 -0.203198177
Oct-December 45.65 40.30 -0.882803943

75
Chart No: 10
➢ Interpretation
In this chart the greater number of prices is falling down because of the company’s bad news.
Initially the company is performing good but now the company owner has changed so for the
all the investors are taken their money back this made more changes in the price from 2017
January to September 2019 the price is comes very low from 200 to 48.16. because of the
changing in the ownership of the company, this will affect to the stock market and this is the
reason for falling in the price. And the company news also very important to technical
analysis.
250
200
150
100
50
0
-50 199.74
210.43
1.053519575
2018 2019
2 3
July
-Sep
tem
be
r
Oct
-Dec
em
ber
Jan
-Mar
ch
Ap
ril-
Ju
ne
July
-Sep
tem
be
r
Oct
-Dec
em
ber
Jan
-Mar
ch
Ap
ril-
Ju
ne
July
-Sep
tem
be
r
Oct
-Dec
em
ber

76

77
CHAPTER-6
Learning Experience- Findings, Suggestions And
Conclusion

78
FINDINGS:
Observations and Findings
• An about 10 of companies of 5 different sectors are considered in this project 2 each
in one sector they are Financial, Energy, Telecom, Healthcare, Consumer
Discretionary.
• In financial sector the SBI bank has the most increased in the share price that makes
more attractive to stockholders. The price is fluctuating between the 250 to 362 in
past 3 years and it more effective changes.
• And the technical analysis of the stock price is more useful to analysis the price of
future. that will be the more effective part in the price estimation of these above share
price companies, that showing the more changes in the price and according to that
technical analysis base only.
• There are the greater number of the technical analysis tools are there but few are more
effective part will take and that will more big effective changes in the price
fluctuation. Like: STOCH, SUPERTREND, and VOLUME.
• In this above data charts, here showing the main changes of the stock price based on
the technical analysis that sure help to analysis technical analysis base only that will
be the more effective part of this chapter. There will be the date facility also available
you can see any price of the stock based on the time. That will help to see the market
situation in the short period, that will help to intraday traders.
• The stock market price increase and decrease depend upon the current situation of the
company if the company is not performing well then, the stock holders will ready to
sell that stock and sometimes the government rules and regulations also effected to
stocks.
• In this data sometimes the assumptions also may wrong but the greater number of
traders are going through the technical analysis it will help to them finance in the right
stock at the right time.
• If the technical analysis went wrong it will create a bad impression on the trade so for
that the we have to think to reach the investors satisfaction level.
• There are lot off investors are looking to be in the technical analysis if it go wrong
they will lose interest on the technical analysis for that it should be accurate and
correct assumptions.
79
Conclusion and Suggestions
Based on the examination, it is discovered that Technical analysis is the best way of
measuring the future price of stocks in market. And the selected stocks of Sharekhan
company which are an example of the stocks are more helpful to the economic and national
development purpose. for that this sectors stock are chosen to explain the technical analysis
and what stocks to purchase and move. In this sector we have to find the solutions by using
the data base only that will be the more effective to measure the price of the company. By
using the past data you can measure the things how can it will be the in future performance
that should be the foremost objective of this study.
• Technical analysis is the best way of expressive the future market performance.
• It gives the confidence to the investors those who are ready to invest the money in
stock market.
• It will give the proper knowledge about the market price of the companies.
• More number of investors are not known about the technical analysis for them it will
be helpful.

80
Suggestions:
• The technical analysis is the best option to know the market price of the company so
everyone should know about this.
• Don’t lose your money unless you don’t about the proper estimation of the market.
• Investors should be known about the market price and the recent news about that
sector or that company.
• If you are a new investor don’t go for direct trading just know about the company and
the stock market fluctuations and also try to learn the technical analysis of the stocks.
• How much amount of time will you spend in the market to know the fluctuations of
markets that much will you become perfect in trading.
• If you are the intraday trader just go with current news and the technical analysis this
is the best to get some returns in the market.

81
CHAPTER-7
Bibliography

82
Cunningham. (2004). your Financial action plan explained into twelve stages for achieving
money success.
▪ Hirotaka Mizuno, M. K. (n.d.). Application of Technical Analysis of Stocks Market
Prediction.
▪ Kahn, R. C. (n.d.). Active Portfolio M anagement.
▪ Kreps, J. M. (2014). SPECULATION INVESTOR BEHAVIOR IN A STOCK MARKET
WITH HETEROGENEOUS EXPECTATIONS.
▪ Montazer, M. F. (2010). Design and implementation of fuzzy expert system for Tehran
Stock Exchange portfolio recommendation.
▪ Pandian, P. (2013). Security Analysis and Portfolio Management .
▪ Polkovnichenko. (2005). Household portfolio Diversification .
▪ Roberts, H. V. (n.d.). Stock-Market "Patterns" and Financial Analysis: Methodological
Suggestions.
▪ Vince, R. (1990). Portfolio Management Formulas.
▪ Wang, J.-L., & Chan, S. (2006). Stock market trading rule discovery using pattern
recognition and technical analysis.
▪ Zuckerman, E. W. (2004). Structural Incoherence and Stock Market Activity
OTHER REFFERANCE:
Websites.
Sharekhan company data.