Quantitative integration of geophysical methods for archaeological prospection
11
Quantitative Integration of Geophysical Methods for Archaeological Prospection S. PIRO,* P. MAURIELLO AND F. CAMMARANO Istituto per le Tecnologie Applicate ai Beni Culturali, CNR, PO Box 10 — 00016 Monterotondo Sc., Rome, Italy ABSTRACT Multi-method surveys have been used with the aim of detecting either sharp discontinuities (boundary of the cavity, fractures in the medium, etc.) or volumetric variations (bodies with different physical properties), at three different archaeological test sites. For the survey a com- bination of passive and active methods (magnetic, GPR and dipole–dipole geoelectric method) has been used. With all methods a high-resolution data acquisition method has been adopted with the aim of reconstructing a global vision of the area investigated. The enhancement of the processing technique towards the integration of different geophysical methods, enabling one to better define the location, depth and geometry of any archaeological body, has been adopted. Copyright * c 2000 John Wiley & Sons, Ltd. Key words: applied geophysics; archaeology; fluxgate gradiometer; ground-penetrating radar; dipole–dipole geoelectric; integrated surveying; integrated elaboration Introduction, objectives and aims Ground surface geophysical prospecting methods have been used as valuable techniques for non- invasive detection of shallow-depth bodies of archaeological interest (Aitken, 1974; Linington, 1974; Hesse, 1991; Scollar et al, 1990; Hesse et al, 1997). This situation depends on the physical property contrast, generated by the buried struc- tures with respect to the surrounding medium. Generally the often limited size and depth of the archaeological remains, the presence of structures made with the same material as the host rocks, soil inhomogeneity and the environ- mental and anthropogenic disturbances, make it rather difficult to define the position and the extent because of the low signal-to-noise ratio (S/N). Some approaches have been considered, during the last ten years, in an effort to overcome such shortcomings (Weymouth, 1986; Brizzolari et al, 1992a,b; La Penna et al, 1992; Piro, 1996). They are based on improving data acquisition techniques and processing methods (Bernabini et al, 1988; Brizzolari et al, 1993; Becker, 1995; Malagodi et al, 1996; Tsokas et al, 1997; Mauriello et al, 1998); although many others have attempted to integrate different geophysical techniques (Brizzolari et al, 1992a,b; Bozzo et al, 1994; Camerlynck et al, 1994; Cammarano et al, 1997a,b, 1998; Neubauer et al, 1997; Piro, 1998a). The aim of the present work is to demonstrate the advantages of integrating the results obtained using different geophysical methods. The flux- gate differential magnetic (FDM), the ground- penetrating radar (GPR) and the dipole–dipole geoelectric (DDG) methods and their results have been integrated and used to investigate three different archaeological sites. Copyright # 2000 John Wiley & Sons, Ltd. Received 6 July 1999 Accepted 4 October 1999 Archaeological Prospection Archaeol. Prospect. 7, 203–213 (2000) *Correspondence to: Dr S. Piro, Istituto per le Tecnologie Applicate ai Beni Culturali, CNR, PO Box 10 — 00016 Monterotondo Sc., Rome, Italy.
-
Upload
independent -
Category
Documents
-
view
1 -
download
0
Transcript of Quantitative integration of geophysical methods for archaeological prospection
Quantitative Integration ofGeophysical Methods forArchaeological Prospection
S. PIRO,* P. MAURIELLO AND F. CAMMARANO
Istituto per le Tecnologie Applicate ai Beni Culturali, CNR,
PO Box 10 Ð 00016 Monterotondo Sc., Rome, Italy
ABSTRACT Multi-method surveys have been used with the aim of detecting either sharp discontinuities(boundary of the cavity, fractures in the medium, etc.) or volumetric variations (bodies withdifferent physical properties), at three different archaeological test sites. For the survey a com-bination of passive and active methods (magnetic, GPR and dipole±dipole geoelectric method)has been used. With all methods a high-resolution data acquisition method has been adoptedwith the aim of reconstructing a global vision of the area investigated. The enhancement of theprocessing technique towards the integration of different geophysical methods, enabling one tobetter de®ne the location, depth and geometry of any archaeological body, has been adopted.Copyright *c 2000 John Wiley & Sons, Ltd.
Key words: applied geophysics; archaeology; ¯uxgate gradiometer; ground-penetrating radar;dipole±dipole geoelectric; integrated surveying; integrated elaboration
Introduction, objectives and aims
Ground surface geophysical prospecting methodshave been used as valuable techniques for non-invasive detection of shallow-depth bodies ofarchaeological interest (Aitken, 1974; Linington,1974; Hesse, 1991; Scollar et al, 1990; Hesse et al,1997). This situation depends on the physicalproperty contrast, generated by the buried struc-tures with respect to the surrounding medium.
Generally the often limited size and depth ofthe archaeological remains, the presence ofstructures made with the same material as thehost rocks, soil inhomogeneity and the environ-mental and anthropogenic disturbances, make itrather difficult to define the position and theextent because of the low signal-to-noise ratio
(S/N). Some approaches have been considered,during the last ten years, in an effort to overcomesuch shortcomings (Weymouth, 1986; Brizzolariet al, 1992a,b; La Penna et al, 1992; Piro, 1996).They are based on improving data acquisitiontechniques and processing methods (Bernabiniet al, 1988; Brizzolari et al, 1993; Becker, 1995;Malagodi et al, 1996; Tsokas et al, 1997; Maurielloet al, 1998); although many others have attemptedto integrate different geophysical techniques(Brizzolari et al, 1992a,b; Bozzo et al, 1994;Camerlynck et al, 1994; Cammarano et al,1997a,b, 1998; Neubauer et al, 1997; Piro, 1998a).
The aim of the present work is to demonstratethe advantages of integrating the results obtainedusing different geophysical methods. The flux-gate differential magnetic (FDM), the ground-penetrating radar (GPR) and the dipole±dipolegeoelectric (DDG) methods and their results havebeen integrated and used to investigate threedifferent archaeological sites.
Copyright # 2000 John Wiley & Sons, Ltd. Received 6 July 1999Accepted 4 October 1999
Archaeological ProspectionArchaeol. Prospect. 7, 203±213 (2000)
*Correspondence to: Dr S. Piro, Istituto per le TecnologieApplicate ai Beni Culturali, CNR, PO Box 10 Ð 00016Monterotondo Sc., Rome, Italy.
The integrated method
Let us indicate by M the number of geophysicalmethods applied in the surveying of a given area.Even if not all the adopted methods lead to atomographic reconstruction of the geophysicalproperties underground, we suppose that theresult of the survey mi , with i � 1; . . . ;M; is adata function fmi
(r), where r is a three-dimensional position vector in a fixed cartesianreference system with the x±y plane on theground surface and the z axis pointing down-wards. In other words, fmi
(r) is a presenceindicator of the anomaly source observed withthe method mi . Further, let us indicate by zm thedepth at which the archaeological target is to beexpected by observing the behaviour of fmi
(r) andwith fmi
(x, y) the restriction of fmi(r) on the plane
z � zm .The aim of this work is to perform a
quantitative integration of different methodsused in the study of the same area. In orderto achieve this purpose, the single data func-tions fmi
(x, y) must be numerically comparedwith each other. This means that we have towork with non-dimensional values of the para-meters defined directly from the experimentalobservations.
Let us start with the definition of ~fmias the
`undisturbed' value of the data function fmi(x, y),
i.e. the response of the mith method if noanomalous bodies are present underground.Thus the function of fmi
(x, y)ÿ ~fmiindicates the
departure of the physical properties investigatedby the mith method, at the pseudo-depth zm fromthe uniform half space. Carrying out a normal-ization of this function, we may define a newdata function
Fmi�x; y� �
jfmi�x; y� ÿ ~fmi
jmaxjfmi
�x; y� ÿ ~fmij
�1�
which obviously satisfies the condition
04 Fmi�x; y�4 1 �2�
It is clear that fmi(x, y) is equal to 1 at those points
where the departure of the data function from theundisturbed value is maximum. The use of the
normalization (1) cancels out any dependence offmi
(x, y) on the strength coefficients in theanomaly geometry. Further, the condition (2)permits us to assert that the new data function,being deprived of the physical dimensionality, isa suitable indicator of source occurrence (ISO) ofarchaeological targets.
Establishing now the hypothesis that eachgeophysical method investigates the sameevent, i.e. the presence of anomalous volumesunderground, we are able to quantitativelyintegrate the results of the different methods.Notwithstanding the non-total conformity of theISO functions with the idea of source occurrenceprobability, we study in this paper the effect ofcombining the ISO functions derived from theapplications of several geophysical methods.More precisely, we first discuss in the nextsections the information obtainable by perform-ing a mean of the ISO functions, that is
�F�x; y� � 1
M
XMmi
Fmi�x; y� �3�
which is an indicator of the spatial distribution ofthe anomaly's source occurrence detected by atleast one of the methods used. In fact �F(x, y) isequal to 1 only at those points where the methodsgive the maximum anomaly pattern and is equalto 0 where all methods do not reveal geophysicalanomalies. At the other points �F(x, y), being just amean of the ISO functions, takes into account thecontributions of the M methods.
Moreover, we study the behaviour of thefunction
F*�x; y� �YMmi
Fmi�x; y� �4�
which is an indicator of the spatial distribution ofthe anomaly's source occurrence detected by allthe methods used. In fact, F*(x, y) is equal to 1, asin the previous case, only at those points whereall methods give the maximum anomaly pattern.The function F*(x, y) is equal to 0 at those pointswhere also only one of the methods does notreveal geophysical anomalies.
204 S. Piro, P. Mauriello and F. Cammarano
Copyright # 2000 John Wiley & Sons, Ltd. Archaeol. Prospect., 7, 203±213 (2000)
The employed geophysical methods
Magnetic survey
For the magnetic surveys at three different sites,the measurements were carried out using theGeoscan FM 36 fluxgate gradiometer. During themeasurements the bottom sensor was used at aconstant height (0.3 m) above the ground surface.Taking into account the depth and dimensions ofthe possible targets at three different sites (cavity,wall and road remains), the measurements weretaken at a sampling spatial interval of 0.5 malong S±N trending profiles. After the commonpre-elaboration techniques (de-spiking, filteringand re-ranging) the results have been representedas coloured contour maps of the residual valuesof the gradient of the z component (Brizzolariet al, 1992b; Piro, 1996).
To enhance the S/N ratio and to better definethe spatial location and orientation of the possibletargets, the two-dimensional cross-correlationtechnique was applied (Piro et al, 1998). Thetheoretical magnetic anomalies for a body withdimensions of 1� 1� 1 (grid units) were com-puted using the relationships proposed byTalwani (1965). The calculations were performedwith geomagnetic parameters: F � 45,000 nT,I � 558, D � 08 and uniform magnetization Mof the body. For the uniform susceptibilitycontrast, different values have been used inrelation to the different archaeological siteconditions.
GPR survey
The different archaeological sites were surveyedwith SIR System 10 (A), equipped with differentantennae (100 and 500 MHz), in the bistaticconfiguration and in single-fold mode, operatingwith 16 bits dynamic range, 1024 (512) samplesper scan and stack 8. The radar system was usedin a discrete or continuous profiling mode. Thefirst corresponds to a three-dimensional acquisi-tion technique, with sampling spatial intervalsless than the body's dimensions. Generally, inorder to obtain a regular grid over the areainvestigated, the measurements were carried outwith spacing grid interval of 0.20±0.25 m. Theradar traces were collected within a specific time
window, in true amplitude mode and withoutintroducing any filtering or gain (Malagodi et al,1996).
In the second mode, data were continuouslycollected along the profile traverse at 16 scan sÿ1.Variations in the radar velocity over the ground,and therefore the number of scans measuredbetween 1-m field markers, were later adjustedwith software to a constant 50±60 scan sÿ1.Successively, the scans between 1-m fieldmarkers were stacked by obtaining a trace every0.20 or 0.25 m (Cammarano et al, 1997b; Piro,1998b). For the case-histories shown here, thesurface topography was sufficiently planar,therefore elevation statics were not applied.
Physically, these two acquisition modes werecharacterized by a series of parallel two-dimensional lines that were then combined toform the volume.
With the aim of obtaining a planimetric visionof all possible anomalous bodies the time-slicerepresentation technique was applied using allfield and elaborated data. Time-slices are calcu-lated by creating two-dimensional horizontalcontour-maps of the averaged absolute value ofthe wave amplitude from a specified time valueacross parallel profiles. With regard to thefeatures to be imaged, time-slice windows froma pulse width to greater window lengths can beused effectively to show different features, whichmay have large or narrow vertical extents. Thetime-window used to average the reflectedreturns was several pulse widths of the trans-mitted radar waves (Goodman et al, 1995).
Geoelectric survey
In archaeological prospecting, due to the gener-ally limited dimensions of the targets, high-resolution techniques are needed. To thispurpose, the dipole±dipole geoelectric pseudo-section technique along a selected profile canlead to an extremely detailed picture of theelectric resistivity behaviour across the verticalplane through the profile (Aspinall et al, 1997;Cammarano et al, 1997a,b). In fact, followingWorthington (1984), the high-resolution geo-electrical pseudo-section can be classified as afirst-order tomography, for it can provide, in atruly objective way and prior to any data
Quantitative Integration of Geophysical Methods 205
Copyright # 2000 John Wiley & Sons, Ltd. Archaeol. Prospect., 7, 203±213 (2000)
inversion program, symptomatic resistivityanomaly images across the section investigated.
During the surveys the measurements wereperformed with a BRGM SYSCAL R2 resistivitymeter, which can operate in the stacking signalenhancement mode. Each apparent resistivitydatum was obtained with dipoles of 0.5 m oflength and attributed at a pseudo-depth equal tohalf the spacing between the centres of thetransmitting and receiving dipoles along themedian vertical axis through the line joiningthem. The step-by-step continuous displacementof the dipoles along each profile provided adense network of experimental data points in thevertical pseudo-sections.
The measured values of the apparent resistiv-ities in the sections of each area were then drawntogether in order to obtain a three-dimensionalmatrix. In this way we were at least able torepresent the horizontal apparent resistivity slicesat different pseudo-depths.
Analysis of field applications
We performed integrated geophysical surveys,using the above approach, on three differentarchaeological sites, each characterized by differ-ent lithological conditions and the kind ofarchaeological structures present, with the aimof demonstrating the real effectiveness of thisprocedure. They are: (i) Sabine Necropolis atColle del Forno (Montelibretti, Roma); (ii) AncientAcropolis of Veio (Roma); (iii) a Roman Villa atPassolombardo (Roma).
The Sabine Necropolis at Colle del Forno(Montelibretti, , Roma) is characterized by thepresence of numerous dromos-chamber tombsexcavated into the lithified tuff (about 10 mthick). At the surface, the tuff is covered by alayer of topsoil of 0.20±0.30 m. From the resultsof previous studies the tombs can be consideredas cavities with average dimensions of2 m� 2 m� 1.5 m. The roof is usually found atabout 1 m below the ground surface. Each tombpresents a dromos (corridor) with dimensions of6 m in length and 0.8 m in width. The discoveredtombs show different states of preservation.Some of them have been found in good conditionwhereas others have been filled with sediments.
We performed two integrated surveys in a9 m� 9 m square area; the first survey was madewhere a previous GPR survey (Malagodi et al,1996) located the presence of a well-preservedtomb; the second area was located near the firstone. The two areas have been surveyed applyingthe high-resolution acquisition technique, whichinvolves measurements with a spatial samplinginterval of 0.5 m for the gradiometric and dipole±dipole geoelectric methods along a series ofparallel profiles trending S±N; for the GPRsurvey a discrete acquisition mode, in singlefold configuration, with a spatial samplinginterval of 0.20 m was adopted.
Figure 1(a±c) shows the results of the differentgeophysical methods after the application ofspecific elaboration techniques. All data sets aretransferred to a range of [0, 1] in order to achievenormalization. These normalized contour mapsshow, in the first area investigated, the presenceof an intact chamber tomb with the dromos(corridor) filled with fine sediments. The GPR,dipole geoelectric and gradiometric data showgood matching anomalies corresponding to theinner chamber. For the corridor (dromos) themethods show contrasting effects, as to beexpected by an elongated body filled withconductive fine sediments, conditioning theelectromagnetic wave propagation.
Figure 2(a±c) shows the normalized results fordifferent geophysical methods, after the applica-tion of specific elaboration techniques, for thesecond test area in the Sabine Necropolis. In thisarea the situation is completely different than theprevious one. The very low GPR signals and thesmall gradiometric minimum, in the zone wherea high-resistivity anomaly occurs, would beindicative of a chamber body very likely filledwith collapsed tuff blocks from the top.
The second test site was located inside theancient Acropolis of Veio, one of the mostimportant Etruscan sites near Rome. The Acro-polis, surrounded by walls, contains manystructures. In particular, the archaeologistsdiscovered wall remains, a portion of anancient road, a cistern and some dwellings. Thegeology of the area is similar to that of theSabine Necropolis. Indeed, there are a series oflithified tuffs, covered by a 0.30±0.35 cm layer oftopsoil.
206 S. Piro, P. Mauriello and F. Cammarano
Copyright # 2000 John Wiley & Sons, Ltd. Archaeol. Prospect., 7, 203±213 (2000)
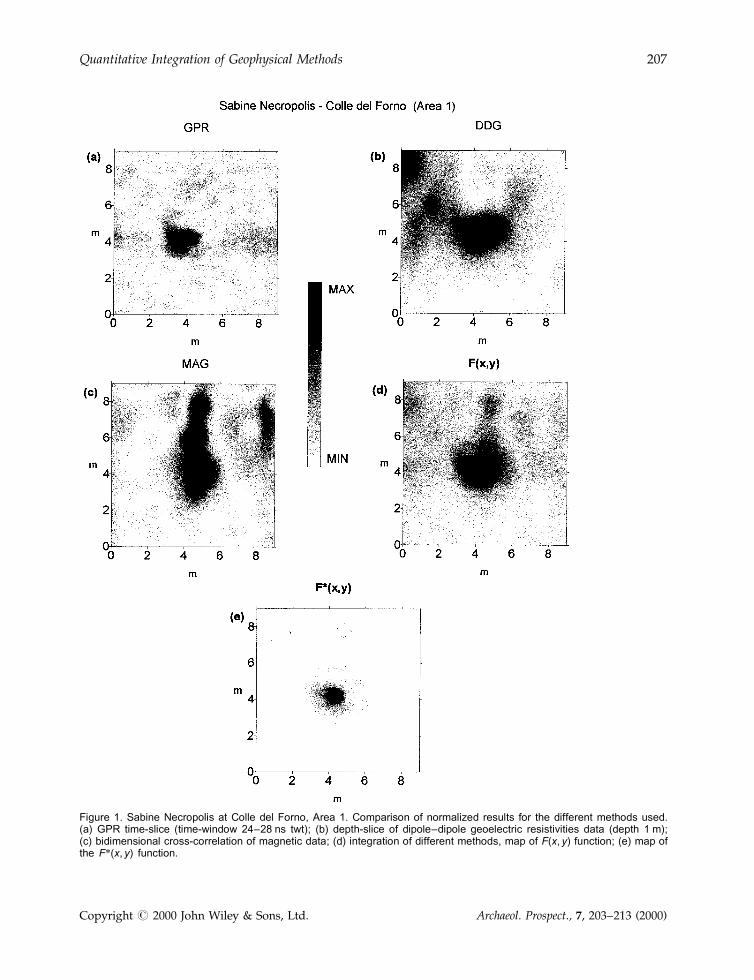
Figure 1. Sabine Necropolis at Colle del Forno, Area 1. Comparison of normalized results for the different methods used.(a) GPR time-slice (time-window 24±28 ns twt); (b) depth-slice of dipole±dipole geoelectric resistivities data (depth 1 m);(c) bidimensional cross-correlation of magnetic data; (d) integration of different methods, map of F(x, y) function; (e) map ofthe F*(x, y) function.
Quantitative Integration of Geophysical Methods 207
Copyright # 2000 John Wiley & Sons, Ltd. Archaeol. Prospect., 7, 203±213 (2000)
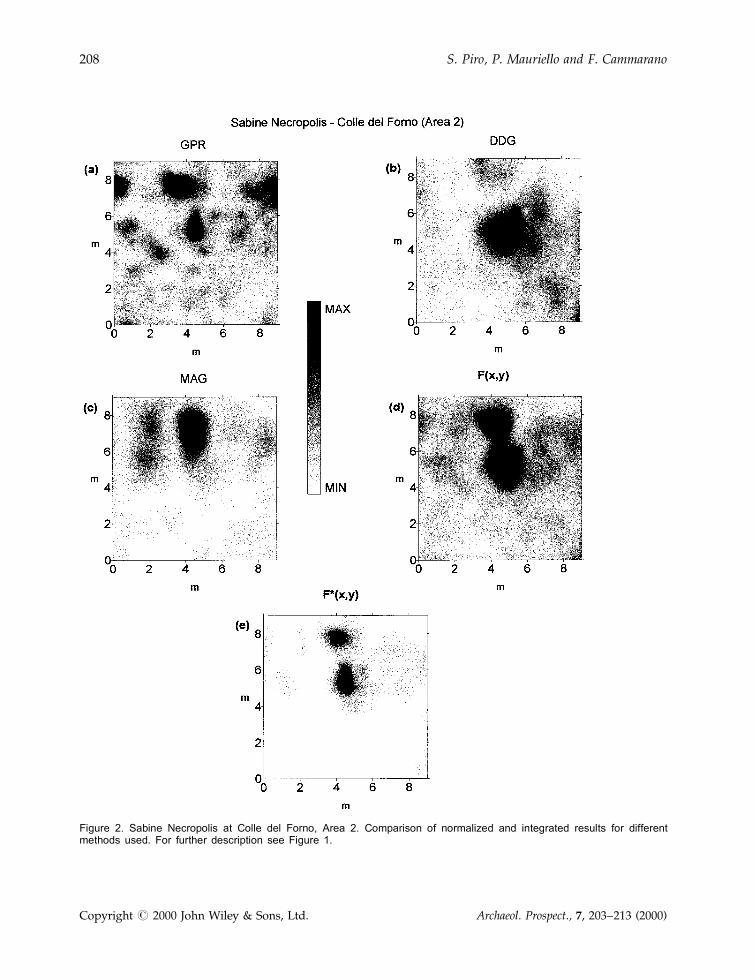
Figure 2. Sabine Necropolis at Colle del Forno, Area 2. Comparison of normalized and integrated results for differentmethods used. For further description see Figure 1.
208 S. Piro, P. Mauriello and F. Cammarano
Copyright # 2000 John Wiley & Sons, Ltd. Archaeol. Prospect., 7, 203±213 (2000)

The results of archaeological studies show thestructures are made with the same material (tuff).Therefore, we can suppose that the possiblerelated anomalies should be small and may bemasked by geoenvironmental disturbances.
We have performed an integrated survey on a20 m� 20 m area (Cammarano et al, 1997b). Fordata acquisition with gradiometric and geo-electric methods a spatial sampling interval of0.5 m along parallel profiles, was adopted. Forthe GPR survey, data were continuously collectedalong the profile traverse at 16 scan sÿ1. After thedata treatment previously indicated, the scansbetween 1-m field markers were stacked, obtain-ing a trace every 0.20 m.
Figure 3(a±c) shows the normalized results ofdifferent geophysical methods, after the applica-tion of specific elaboration techniques. The time-slice of GPR data (Figure 3a), in the time-window9±16 ns (twt), shows reflectors with parallel andperpendicular orientations in the subsurface. Inthe map of Figure 3b we can see a distribution ofresistivity values in the range between 65 and95 Om at a depth range between 0.5 m and 1 m.Finally, the cross-correlated magnetic contourmap of Figure 3c shows the position and spatialorientation of anomalous bodies with a particulargeometric distribution. Such a feature can berelated to the presence of a portion of wall.
The third test site is situated at Passolombardo(Rome), in a zone characterized by the presenceof remains of a Roman Villa. In this case, thestructures (pavements, wall remains) areembedded in sandy±clayey sediments. Weinvestigated a 10 m� 10 m area. For data acquisi-tion with gradiometric and geoelectric methods aspatial sampling interval of 0.5 m, along parallelprofiles, was adopted. For the GPR measure-ments, data were collected using the sameacquisition adopted in the Veio area.
Figure 4(a±c) shows the normalized results ofdifferent geophysical methods, after the applica-tion of specific elaboration techniques. The time-slice of GPR data, in the time-window 13±15 ns(twt), Figure 4a, shows a reflector with linearorientation in the subsurface. In the map ofFigure 4b, the resistivity values show at a depthrange between 0.5 and 1 m, the presence ofarchaeological bodies (walls) with a differentorientation than the GPR results. Finally, the
cross-correlated magnetic contour map ofFigure 4c shows the presence in the subsurfaceof anomalous bodies with limited dimensions.
Discussion of the integrated results
The integrated interpretation for the three differ-ent test sites are shown in d and e of Figures 1±4.We at first analysed the information obtainable bythe ISO function, �F(x, y), as defined in Equation(3). This function is an indicator of the spatialdistribution of the anomaly's source occurrencedetected by at least one of the methods used. Thepoints where the F(x, y) value is near or equal to 1,correspond to those where all methods give themaximum anomaly pattern. At the other pointsthis function, corresponding to a mean of the ISOfunctions, takes into account the contributions ofeach method.
The result shown in Figure 1d is very impres-sive, where both the dromos and the chamber ofthe tomb appear clearly. It is also interesting tocompare this result with the result in the adjacentarea, Figure 2d. This second result still indicatesthe position of a tomb, but we can argue that thepreservation state is quite different. Indeed, it ispossible to note the clear presence of the chamberonly with the geoelectrical method, whereas themagnetic and GPR methods indicate only theanomaly due to the dromos. So the integrationavoids misinterpretations, easily possible with aone-method survey.
The results shown in Figure 3d point toevidence of features attributable to two perpen-dicular wall remains and traces of an ancient road.The excavations, made after the prospection,confirmed the presence of the hypothesizedstructures.
The result of Figure 4d displays variousanomalies. In particular, it is possible to note thecontinuation of an excavated wall in the top leftcorner and another linear anomaly, perpendicularto the previous one, probably due to another wall.Also in this case, the follow-up excavationsconfirmed the geophysical interpretation.
In the case of the F*(x, y) function, as defined inEquation (4), we have obtained an indication ofthe spatial distribution of the anomaly's sourceoccurrence detected by all the methods used. This
Quantitative Integration of Geophysical Methods 209
Copyright # 2000 John Wiley & Sons, Ltd. Archaeol. Prospect., 7, 203±213 (2000)
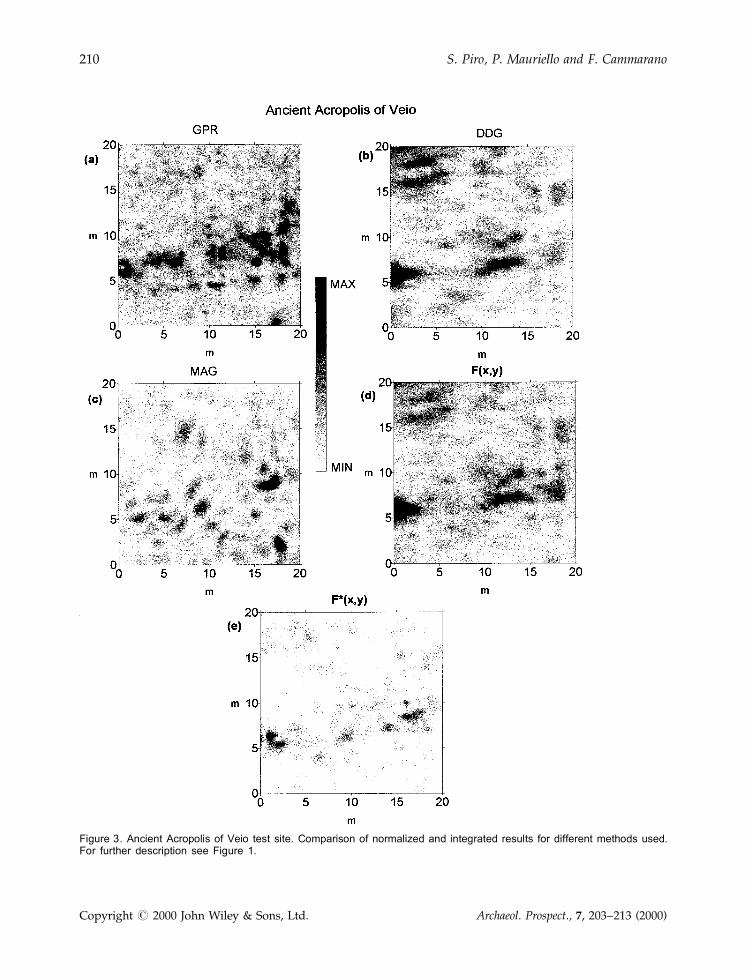
Figure 3. Ancient Acropolis of Veio test site. Comparison of normalized and integrated results for different methods used.For further description see Figure 1.
210 S. Piro, P. Mauriello and F. Cammarano
Copyright # 2000 John Wiley & Sons, Ltd. Archaeol. Prospect., 7, 203±213 (2000)
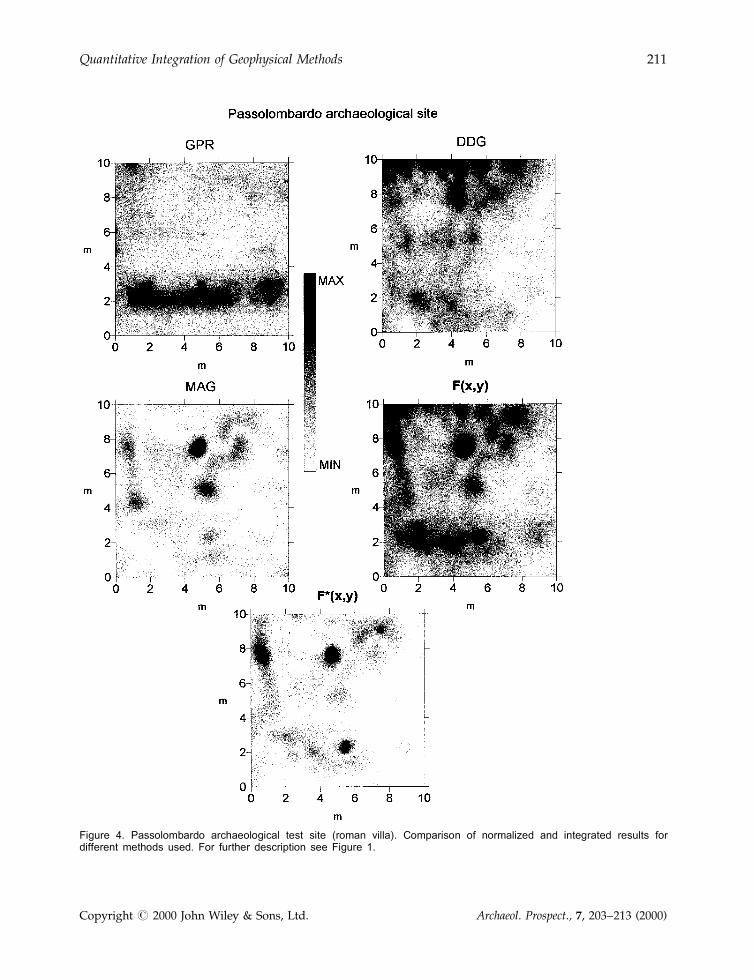
Figure 4. Passolombardo archaeological test site (roman villa). Comparison of normalized and integrated results fordifferent methods used. For further description see Figure 1.
Quantitative Integration of Geophysical Methods 211
Copyright # 2000 John Wiley & Sons, Ltd. Archaeol. Prospect., 7, 203±213 (2000)

function is equal to 1 only at those points whereall methods have given the maximum anomaly,and is equal to 0 where only one of the methodsdid not reveal geophysical anomalies. Therefore,the results shown in the Figures 1e, 2e, 3e and 4eare related to the points where the fmi
(x, y)functions are near or equal to 1.
Conclusion and prospects
The improvement of the processing techniquesthrough an integration of different geophysicalmethods enables one to better define position,extension, depth, thickness and physical charac-teristics of any anomalous body within its geo-logical context. Also the discrimination powerbetween close but distinct archaeological struc-tures is notably enhanced. There is no doubt thatif more geophysical methods are introducedarising from the same cultural source demand,their potentialities are interwoven. Their singleside indeterminate aspects are greatly entangledto the extent of the target; therefore the totalproperty of which nearly always emergesthrough a kind of interrelationship. Con-sequently, only integrated geophysical methodscan now provide the kind of synoptic siteexamination formerly available with aerial pho-tography.
Although the cost of an integrated approach islikely to exceed the cost of any single methodsurvey, the benefit is so high that the cost-to-benefit ratio of the whole operation drasticallylowers and makes the financing effort wellrewarded.
References
Aitken, M. J. (1974). Physics and Archaeology. Oxford:Clarendon Press, 286.
Aspinall, A. and Crummett, J. G. (1997). The electricalpseudo-section. Archaeological Prospection 4(1): 37±47.
Becker, H. (1995). From nanotesla to picotesla. A newwindow for magnetic prospecting in archaeology.Archaeological Prospection 2: 217±228.
Bernabini, M., Brizzolari, E. and Piro, S. (1988).Improvement of signal-to-noise ratio in resistivityprofiles. Geophysical Prospecting 36: 559±570.
Brizzolari, E., Ermolli, F., Orlando, L., Piro, S. andVersino, L. (1992a). Integrated geophysical methodsin archaeological surveys. Journal of Applied Geo-physics 29: 47±55.
Brizzolari, E., Piro, S. and Versino, L. (1992b). Mono-graph on the geophysical exploration of the Selin-unte Archaeological Park. Bollettino di GeofisicaTeorica ed Applicata XXXIV: 134±135.
Brizzolari, E., Cardarelli, E., Piro, S. and Versino, L.(1993). Detection of subsurface magnetic anomaliesof archaeological interest: computation of tridimen-sional magnetic anomalies and interpretation usingbidimensional cross-correlation. In Vogel, A.(editor), Theory and Practice of Applied Geophysics,Vol. 7. Wiesbaden: Vieweg Publishing, 3±15.
Bozzo, E., Lombardo, S., Merlanti, F. and Pavan, M.(1994). Integrated geophysical investigations at anEtrurian Settlement in Northern Appennines (Italy).Archaeological Prospection 1(1): 19±35.
Camerlynck, C., Dabas, M. and Panissod, C. (1994).Comparison between GPR and four electromagneticmethods for stone features characterization: anexample. Archaeological Prospection 1: 5±17.
Cammarano, F., Mauriello, P., Patella, D. and Piro, S.(1997a). Integrated geophysical methods for archae-ological prospectings. In Cortini, M. and De Vivo, B.(editors), Volcanism and Archaeology in MediterraneanArea. Trivandrum, India: Research Signpost Publish-ers, 7±34.
Cammarano, F., Mauriello, P. and Piro, S. (1997b).High resolution geophysical prospecting withintegrated methods. The Ancient Acropolis of Veio(Rome, Italy). Archaeological Prospection 4(4):157±164.
Cammarano, F., Mauriello, P., Patella, D., Piro, S.,Rosso, F. and Versino, L. (1998). Integration of highresolution geophysical methods. Detection of shal-low depth bodies of archaeological interest. Annali diGeofisica 41(3): 359±368.
Goodman, D., Nishimura, Y. and Rogers, J. D. (1995).GPR time-slices in Archaeological Prospection.Archaeological Prospection 3: 85±89.
Hesse, A. (1991). Les methods de prospection electro-magnetique appliques aux sites archaeologiques. Atti delSeminario Geofisica per l'Archeologia Quaderno n.1, ITABC±CNR: 41±52.
Hesse, A., Barba, L., Link, K. and Ortiz, A. (1997). Amagnetic and electrical study of archaeologicalstructures at Loma Alta, Michoacan, Mexico. Archae-ological Prospection 4(2): 53±67.
Lapenna, V., Mastrantuono, M., Patelle, D., Di Bello, G.(1992). Magnetic and geoelectric prospecting in thearchaeological area of Selinunte (Sicily, Italy).Bollettino di Geofisica Teorica ed Applicata vol. XXXIV,n. 134±135: 133±143.
Linington, R. E. (1974). Magnetic, electric and coringsurvey at Colle del Forno, Montelibretti 1970±73.Prospezioni Archeologiche 9: 47±59.
212 S. Piro, P. Mauriello and F. Cammarano
Copyright # 2000 John Wiley & Sons, Ltd. Archaeol. Prospect., 7, 203±213 (2000)
Malagodi, S., Orlando, L., Piro, S. and Rosso, F. (1996).Location of archaeological structures using GPRmethod: three-dimensional data acquisition andradar signal processing. Archaeological Prospection 3:13±23.
Mauriello, P., Monna, D. and Patella, D. (1998). 3Dgeoelectrical tomography and archaeological appli-cations. Geophysical Prospecting 46: 543±570.
Neubauer, W. and Eder-Hinterleitner, A. (1997).Resistivity and magnetics of the Roman TownCarnuntum, Austria: an example of combinedinterpretation of prospection data. ArchaeologicalProspection 4(4): 179±189.
Piro, S. (1996). Integrated geophysical prospecting atRipa Tetta Neolithic site (Lucera, Foggia Ð Italy).Archaeological Prospection 3: 81±88.
Piro, S. (1998a). Multimethodological approach usingGPR, magnetic and geoelectric methods to detectarchaeological structures. Prospezioni Archeologiche(in press).
Piro, S., Samir, A. and Versino, L. (1998b). Position andspatial orientation of magnetic bodies from archaeo-logical magnetic surveys. Annali di Geofisica 41(3):343±358.
Scollar, I., Tabbagh, A., Hesse, A. and Herzog, I.(1990). Archaeological Prospecting and Remote Sensing.Cambridge: Cambridge University Press.
Talwani, M. (1965). Computation with the help of adigital computer of magnetic anomalies caused bybodies of arbitrary shape. Geophysics, vol. XXX, n. 5:797±817.
Tsokas, G. N. and Tsourlos, P. (1997). Transformationof the resistivity anomalies from archaeological sitesby inversion filtering. Geophysics 62(1): 36±43.
Weymouth, J. W. (1986). Geophysical methods ofarchaeological site surveying. In Advances in Archae-ological Method and Theory, Vol. 9. Academic Press,311±395.
Worthington, M. H. (1984). An introduction to geo-physical tomography. First Break 2: 20±26.
Quantitative Integration of Geophysical Methods 213
Copyright # 2000 John Wiley & Sons, Ltd. Archaeol. Prospect., 7, 203±213 (2000)