Complex conductivity of volcanic rocks and the geophysical ...
23
HAL Id: hal-02324339 https://hal.archives-ouvertes.fr/hal-02324339 Submitted on 23 Nov 2020 HAL is a multi-disciplinary open access archive for the deposit and dissemination of sci- entific research documents, whether they are pub- lished or not. The documents may come from teaching and research institutions in France or abroad, or from public or private research centers. L’archive ouverte pluridisciplinaire HAL, est destinée au dépôt et à la diffusion de documents scientifiques de niveau recherche, publiés ou non, émanant des établissements d’enseignement et de recherche français ou étrangers, des laboratoires publics ou privés. Complex conductivity of volcanic rocks and the geophysical mapping of alteration in volcanoes A. Ghorbani, A. Revil, A. Coperey, A Soueid Ahmed, S. Roque, M.J. Heap, H. Grandis, F. Viveiros, A. Soueid Ahmed To cite this version: A. Ghorbani, A. Revil, A. Coperey, A Soueid Ahmed, S. Roque, et al.. Complex conductivity of volcanic rocks and the geophysical mapping of alteration in volcanoes. Journal of Volcanology and Geothermal Research, Elsevier, 2018, 357, pp.106-127. 10.1016/j.jvolgeores.2018.04.014. hal- 02324339
-
Upload
khangminh22 -
Category
Documents
-
view
4 -
download
0
Transcript of Complex conductivity of volcanic rocks and the geophysical ...
HAL Id: hal-02324339https://hal.archives-ouvertes.fr/hal-02324339
Submitted on 23 Nov 2020
HAL is a multi-disciplinary open accessarchive for the deposit and dissemination of sci-entific research documents, whether they are pub-lished or not. The documents may come fromteaching and research institutions in France orabroad, or from public or private research centers.
L’archive ouverte pluridisciplinaire HAL, estdestinée au dépôt et à la diffusion de documentsscientifiques de niveau recherche, publiés ou non,émanant des établissements d’enseignement et derecherche français ou étrangers, des laboratoirespublics ou privés.
Complex conductivity of volcanic rocks and thegeophysical mapping of alteration in volcanoes
A. Ghorbani, A. Revil, A. Coperey, A Soueid Ahmed, S. Roque, M.J. Heap,H. Grandis, F. Viveiros, A. Soueid Ahmed
To cite this version:A. Ghorbani, A. Revil, A. Coperey, A Soueid Ahmed, S. Roque, et al.. Complex conductivityof volcanic rocks and the geophysical mapping of alteration in volcanoes. Journal of Volcanologyand Geothermal Research, Elsevier, 2018, 357, pp.106-127. �10.1016/j.jvolgeores.2018.04.014�. �hal-02324339�

Journal of Volcanology and Geothermal Research 357 (2018) 106–127
Contents lists available at ScienceDirect
Journal of Volcanology and Geothermal Research
j ourna l homepage: www.e lsev ie r .com/ locate / jvo lgeores
Complex conductivity of volcanic rocks and the geophysical mapping ofalteration in volcanoes
A. Ghorbani a, A. Revil b,⁎, A. Coperey b, A. Soueid Ahmed b, S. Roque b, M.J. Heap c, H. Grandis d, F. Viveiros e
a Department of Mining and Metallurgical Engineering, Yazd University, Yazd, Iranb Univ. Grenoble Alpes, Univ. Savoie Mont Blanc, CNRS, IRD, IFSTTAR, ISTerre, 38000 Grenoble, Francec Géophysique Expérimentale, Institut de Physique de Globe de Strasbourg, UMR 7516 CNRS, Université de Strasbourg/EOST, Strasbourg Cedex, Franced Applied and Exploration Geophysics Group, Faculty of Mining and Petroleum Engineering, Institut Teknologi Bandung (ITB), Bandung, Indonesiae Instituto de Investigação em Vulcanologia e Avaliação de Riscos, Universidade dos Açores, Ponta Delgada, Portugal
⁎ Corresponding author.E-mail addresses: [email protected] (A. Ghorbani),
(A. Revil), [email protected] (A. Coperey), abde(A. Soueid Ahmed), [email protected] (S. Roque), [email protected] (H. Grandis), Maria.FB.Viveiros@a
https://doi.org/10.1016/j.jvolgeores.2018.04.0140377-0273/© 2018 Elsevier B.V. All rights reserved.
a b s t r a c t
a r t i c l e i n f oArticle history:Received 23 February 2018Received in revised form 16 April 2018Accepted 17 April 2018Available online 22 April 2018
Induced polarization measurements can be used to image alteration at the scale of volcanic edifices to a depth offew kilometers. Such a goal cannot be achievedwith electrical conductivity alone, because toomany textural andenvironmental parameters influence the electrical conductivity of volcanic rocks. We investigate the spectral in-duced polarizationmeasurements (complex conductivity) in the frequency band 10mHz–45 kHz of 85 core sam-ples from five volcanoes: Merapi and Papandayan in Indonesia (32 samples), Furnas in Portugal (5 samples),Yellowstone in the USA (26 samples), andWhakaari (White Island) in New Zealand (22 samples). This collectionof samples covers not only different rock compositions (basaltic andesite, andesite, trachyte and rhyolite), butalso various degrees of alteration. The specific surface area is found to be correlated to the cation exchange capac-ity (CEC) of the samples measured by the cobalthexamine method, both serving as rough proxies of the hydro-thermal alteration experienced by these materials. The in-phase (real) conductivity of the samples is the sumof a bulk contribution associated with conduction in the pore network and a surface conductivity that increaseswith alteration. The quadrature conductivity and the normalized chargeability are two parameters related to thepolarization of the electrical double layer coating the minerals of the volcanic rocks. Both parameters increasewith the degree of alteration. The surface conductivity, the quadrature conductivity, and the normalizedchargeability (defined as the difference between the in-phase conductivity at high and low frequencies) are lin-early correlated to the CEC normalized by the bulk tortuosity of the pore space. The effects of temperature andpyrite-content are also investigated and can be understood in terms of a physics-based model. Finally, we per-formed a numerical study of the use of induced polarization to image the normalized chargeability of a volcanicedifice. Induced polarization tomography can be used to map alteration of volcanic edifices with applications togeohazard mapping.
© 2018 Elsevier B.V. All rights reserved.
1. Introduction
Geophysical methods and themethods developed in the frameworkof hydrogeophysics are increasingly used on volcanoes to determine thedistribution of material properties (e.g., seismic velocities, bulk density,electrical properties) with application to volcanic eruption forecasting,geohazard mapping, and hydrogeology. Electrical conductivity tomog-raphy can be used to image the 3D distribution of the electrical conduc-tivity of volcanoes (e.g., Johnson et al., 2010; Revil et al., 2010; Rosas-
[email protected]@[email protected] (M.J. Heap),zores.gov.pt (F. Viveiros).
Carbajal et al., 2016; Gresse et al., 2017). Electrical conductivity of volca-nic rocks depends on two contributions. The first is a bulk contributioncontrolled by the water content and pore water salinity. It correspondsto electrical conduction through the connected pore network of thema-terial (e.g., Archie, 1942). The second contribution is an interfacial con-tribution called surface conductivity. This contribution is associatedwith conduction in the electrical double layer coating themineral grains(e.g., Revil et al., 2002 for volcanic rocks and Waxman and Smits, 1968for sedimentary materials). This electrical double layer consists of theStern layer (with weakly or strongly adsorbed counterions dependingon their affinity for themineral surface) and the diffuse layer. Since elec-trical conductivity of volcanic rocks depends on these two contribu-tions, electrical conductivity tomography is rather difficult to interpretand therefore cannot be used as a stand-alone geophysical method(see discussion in Bernard et al., 2007; Komori et al., 2010; Kemna
107A. Ghorbani et al. / Journal of Volcanology and Geothermal Research 357 (2018) 106–127
et al., 2012; Usui et al., 2016; Soueid Ahmed et al., 2018a, 2018b). For in-stance, a volcano can be a highly conductive body because of the highsalinity of the pore water or a high degree of alteration (or both). In-duced polarization can be used to discriminate these effects as long asthe content in metallic particles (e.g., pyrite and magnetite) is not toohigh (i.e., 1% in vol.).
In the context of thepresent paper, itmaybeuseful to recallwhatwemean by alteration. Classically, the alteration of volcanic rocks is pro-duced by the circulation of hydrothermal fluids and involves the re-placement of primary igneous glass and minerals (e.g., plagioclase,pyroxene, amphibole) by secondaryminerals that are stable at the ther-modynamic conditions of alteration (e.g., Bonnet and Corriveau, 2007).We are especially interested by the case where these secondary min-erals are clay minerals (kaolinite, chlorite, illite, and smectite, seeHonnorez et al., 1998). Note that some volcanic rocks can also be alteredthrough surface weathering.
Complex conductivity characterizes the reversible storage of electri-cal charges in rocks (Schlumberger, 1920; Bleil, 1953; Seigel, 1959), aprocess known as (induced) polarization. This “polarization” is a lowfrequency (b10 kHz) characteristic of rocks that is unrelated to the di-electric polarization phenomena observed at higher frequencies(N10 kHz) (e.g., Revil, 2013). The origin of the low-frequency polariza-tion of rocks is generally associated with the polarization of the electri-cal double layer around the mineral grains and can be described withtwo interrelated parameters: the quadrature conductivity and the nor-malized chargeability (see Revil et al., 2017b). The quadrature conduc-tivity corresponds to the imaginary component of the complexconductivity. The normalized chargeability measures the dispersion ofthe in-phase conductivity with the frequency. Since the polarizationand surface conductivity are both controlled by the properties of theelectrical double layer, it is therefore unsurprising that these parametersare also interrelated (Revil et al., 2017b). This relationship is very im-portant to interpret electrical resistivity and induced polarization to-mographies that can be carried out at the scale of volcanic structures.As a side note, measurements of induced polarization can be per-formed in the field with the same equipment used for electrical resis-tivity tomography (e.g., Kemna et al., 2012). Induced polarizationmay therefore appear as an attractive method to study volcanic andgeothermal systems.
The key questions wewant to address are (1) Is the relationship de-veloped in a previous paper for basaltic rocks (Revil et al., 2017a) validfor all types of volcanic rocks? (2) Is the cation exchange capacity (CEC)a proxy of the alteration of the volcanic rocks? (3) How do the surfaceand quadrature conductivities of volcanic rocks depend on their cationexchange capacity (CEC) and specific surface area? (4) How can thequadrature conductivity and the normalized chargeability be relatedto each other? (5) How is the polarization affected by temperatureand the volume content of metallic particles? (6) Can we image electri-cal conductivity and normalized chargeability of a volcanic edifice andoffer a combined approach to interpret these data? Answers to thesequestions are important to use induced polarization tomography toimage the alteration of volcanic rocks. Since alteration is responsiblefor the weakening of the mechanical properties of volcanic rocks (seePola et al., 2012; Frolova et al., 2014; Wyering et al., 2014; Heap et al.,2015), our study has strong implications regarding the mapping ofgeohazards in volcanic environments (Day, 1996; Reid et al., 2001;Finn et al., 2001; Reid, 2004).
We investigate here the complex conductivity of a set of 85 newcore samples from five active volcanoes in the world: Merapi andPapandayan in Indonesia, Furnas in Portugal, Yellowstone in theUSA, and Whakaari (White Island) in New Zealand. The laboratorymeasurements were collected in the frequency range 10 mHz–45 kHz with a very sensitive impedance meter. The interpretationof the laboratory data will be based on the dynamic Stern layer polar-ization model developed in Revil (2013) and recently updated inRevil et al. (2017a, 2017b, 2018).
2. Theory
2.1. The dynamic stern layer model
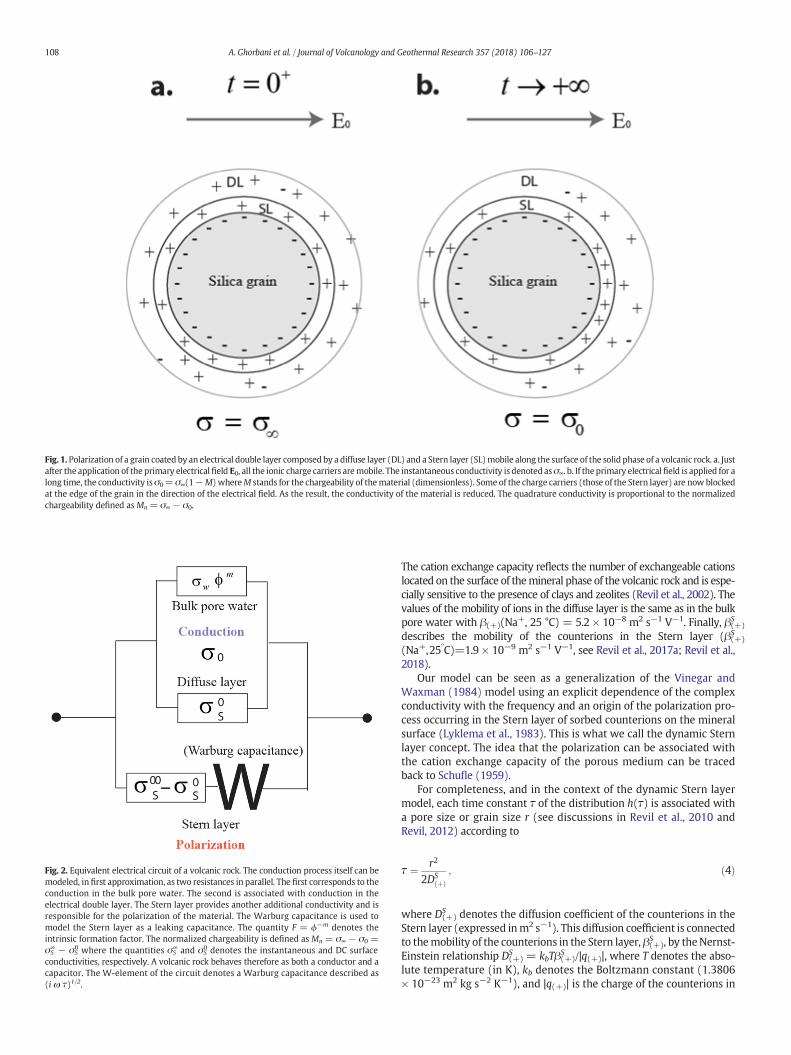
The (in-phase) conductivity of a volcanic rock represents its abilityto carry electrical current. A volcanic rock can also reversibly store elec-trical charges (Revil et al., 2017c), a phenomenon known as polariza-tion. This polarization is responsible for a phase lag between theelectrical current and the electrical field for frequency-domain mea-surements (Kemna et al., 2012) or a secondary voltage for time-domain measurements (Schlumberger, 1920). The polarization phe-nomenon is represented both by a quadrature (imaginary) componentof the complex electrical conductivity and by a dispersion of the in-phase conductivitywith the frequency. The high frequency conductivityσ∞ is the instantaneous conductivity of a material once electromagneticdiffusion has fully occurred. Conversely, the conductivityσ0 is theDirectCurrent (DC) conductivity obtained once all the polarization phenom-ena are fully established. Some of the charge carriers are blocked atthe end of the polarization length scales and do not participate anymoreto the conduction (Fig. 1). Obviously, we have σ0 ≤ σ∞ and σ0= σ∞(1−M) where M (dimensionless) denotes the chargeability of the material(Fig. 1). The polarization is also described by a distribution of relaxationtimes associated with the polarization of a distribution of length scales(pore sizes or grain sizes). The main relaxation time of the problem τcorresponds to the time, once the primary electrical field or current isstopped, required for the accumulated charge carriers to return totheir equilibrium state (in a statistical sense) (Fig. 1).
In the following, a harmonic external electrical field of the form E=E0 exp (+iω t) is applied to a volcanic rock. In the realm of the dynamicStern layer model, the complex conductivity σ∗ = σ' + iσ" of a porousgranular material without metallic grains is then given by (Revil,2013; Revil et al., 2014; Revil et al., 2017a, 2017b),
σ� ωð Þ ¼ σ∞ 1−MZ∞0
h τð Þ1þ iωτð Þ1=2
dτ
0@
1Aþ iωε∞; ð1Þ
where i denotes the pure imaginary number, σ' denotes the in-phaseconductivity (real component, a positive quantity), σ" denotes thequadrature conductivity (imaginary component, a negative quan-tity), ε∞ (in F m−1 = A s V−1 m−1) corresponds to the permittivityassociated with the Maxwell-Wagner polarization, ω denotes theangular frequency (rad s−1), τ is a time constant (in s), and h(τ) de-notes a (normalized) probability density for distribution of the timeconstants of the material, and M = (σ∞ − σ0)/σ∞ is the (dimension-less) chargeability. In first approximation, the electrical circuitshown in Fig. 2 can be used to provide some understanding of theconduction/polarization mechanisms occurring in a volcanic rock.
The expressions of the high and low frequency conductivities of avolcanic rock (see Fig. 1 for the underlying physics) can be obtainedthrough a volume averaging method. According to Revil (2013), theyare given by
σ0 ¼ 1Fσw þ 1
Fϕ
� �ρgβ þð Þ 1− fð ÞCEC; ð2Þ
σ∞ ¼ 1Fσw þ 1
Fϕ
� �ρg β þð Þ 1− fð Þ þ βS
þð Þ fh i
CEC: ð3Þ
In these equations,σw (in Sm−1) denotes the porewater conductivity(proportional to the salinity in isothermal conditions), ϕ denotes the(connected) porosity, F (dimensionless) the intrinsic formation factor, f(dimensionless) denotes the partition coefficient (fraction of counterionsin the Stern layer versus the concentration of counterions populating en-tire double layer), ρg is the grain density (typically 2800–3100 kg m−3),and CEC denotes the cation exchange capacity of the material (in C kg−1).
)
)
Fig. 1. Polarization of a grain coated by an electrical double layer composed by a diffuse layer (DL) and a Stern layer (SL)mobile along the surface of the solid phase of a volcanic rock. a. Justafter the application of the primary electrical field E0, all the ionic charge carriers aremobile. The instantaneous conductivity is denoted asσ∞. b. If the primary electricalfield is applied for along time, the conductivity isσ0= σ∞(1−M) whereM stands for the chargeability of thematerial (dimensionless). Some of the charge carriers (those of the Stern layer) are now blockedat the edge of the grain in the direction of the electrical field. As the result, the conductivity of the material is reduced. The quadrature conductivity is proportional to the normalizedchargeability defined asMn = σ∞ − σ0.
Fig. 2. Equivalent electrical circuit of a volcanic rock. The conduction process itself can bemodeled, in first approximation, as two resistances in parallel. The first corresponds to theconduction in the bulk pore water. The second is associated with conduction in theelectrical double layer. The Stern layer provides another additional conductivity and isresponsible for the polarization of the material. The Warburg capacitance is used tomodel the Stern layer as a leaking capacitance. The quantity F = ϕ−m denotes theintrinsic formation factor. The normalized chargeability is defined as Mn = σ∞ − σ0 =σS∞ − σS
0 where the quantities σS∞ and σS
0 denotes the instantaneous and DC surfaceconductivities, respectively. A volcanic rock behaves therefore as both a conductor and acapacitor. The W-element of the circuit denotes a Warburg capacitance described as(i ω τ)1/2.
108 A. Ghorbani et al. / Journal of Volcanology and Geothermal Research 357 (2018) 106–127
The cation exchange capacity reflects the number of exchangeable cationslocated on the surface of themineral phase of the volcanic rock and is espe-cially sensitive to the presence of clays and zeolites (Revil et al., 2002). Thevalues of the mobility of ions in the diffuse layer is the same as in the bulkpore water with β(+)(Na+, 25 °C) = 5.2 × 10⁻⁸ m2 s−1 V−1. Finally, β(+
S
describes the mobility of the counterions in the Stern layer (β(+S
(Na+,25°C)=1.9 × 10⁻⁹ m2 s−1 V−1, see Revil et al., 2017a; Revil et al.,2018).
Our model can be seen as a generalization of the Vinegar andWaxman (1984) model using an explicit dependence of the complexconductivity with the frequency and an origin of the polarization pro-cess occurring in the Stern layer of sorbed counterions on the mineralsurface (Lyklema et al., 1983). This is what we call the dynamic Sternlayer concept. The idea that the polarization can be associated withthe cation exchange capacity of the porous medium can be tracedback to Schufle (1959).
For completeness, and in the context of the dynamic Stern layermodel, each time constant τ of the distribution h(τ) is associated witha pore size or grain size r (see discussions in Revil et al., 2010 andRevil, 2012) according to
τ ¼ r2
2DSþð Þ
; ð4Þ
where D(+)S denotes the diffusion coefficient of the counterions in the
Stern layer (expressed inm2 s−1). This diffusion coefficient is connectedto themobility of the counterions in the Stern layer, β(+)
S , by theNernst-Einstein relationship D(+)
S = kbTβ(+)S /|q(+)|, where T denotes the abso-
lute temperature (in K), kb denotes the Boltzmann constant (1.3806× 10⁻²³ m2 kg s−2 K−1), and |q(+)| is the charge of the counterions in

109A. Ghorbani et al. / Journal of Volcanology and Geothermal Research 357 (2018) 106–127
the Stern layer coating the surface of the grains (|q(+)|= ewhere e is theelementary charge for Na+). Therefore, according to Eq. (4), the proba-bility density h(τ) can be transformed into a grain size (or pore size)probability density or (normalized) distribution, which would controlin turn the transition between low and high frequencies in Eq. (1). Fora broad distribution of polarization length scales, we can expect thecomplex conductivity to be characterized by a very broad distributionof relaxation times such that the phase may appear rather flat at leastover a few orders of magnitude in frequency. We will come back tothis point below (in terms of what is called Drake's model) since itcalls for simplification of the equations.
The associated electrical circuit of a volcanic rock can be simpli-fied to the model shown in Fig. 2. The in-phase conductivity can bewritten as
σ0ωð Þ ¼ 1
Fσw þ σS ωð Þ; ð5Þ
where σS(ω) (in S m−1) denotes a frequency dependent surface con-ductivity. This surface conductivity takes place in the electrical dou-ble layer coating the surface of the grains and comprises twocontributions: one from the diffuse layer (frequency independent)and one from the Stern layer (which is frequency dependent). Thissurface conductivity has low-frequency and high-frequency asymp-totic expressions given by (Fig. 2)
σ0S ¼ 1
Fϕ
� �ρgβ þð Þ 1− fð ÞCEC; ð6Þ
σ∞S ¼ 1
Fϕ
� �ρgBCEC; ð7Þ
respectively (see also Niu et al., 2016a, 2016b) and where B is an ap-parent mobility defined by B = β(+)(1 − f) + β(+)
S f. The normalizedchargeabilityMn =Mσ∞ = σ∞ − σ0, (in S m−1) is proportional to thecation exchange capacity of the material according to
Mn ¼ 1Fϕ
� �ρgλCEC; ð8Þ
and where λ = β(+)S f is an equivalent surface mobility for the quad-
rature conductivity and the normalized chargeability (see Vinegarand Waxman, 1984). We note that the phase lag tanφ = σ"/σ' andthe chargeability M = Mn/σ∞ (dimensionless) cannot be consideredas true polarization parameters since they represent the ratio of a po-larization parameter by a conduction parameter.
The introduction of a normalized chargeability with units inS m−1 may seem inappropriate to some research scientists sincechargeability is already a normalized (dimensionless) quantity.The normalized chargeability was introduced in environmental geo-physics to normalize the chargeability by the resistivity (pixel bypixel) in order to remove the fingerprint of resistivity on theinverted chargeability tomograms in absence of metallic particles(see Lesmes and Frye, 2001; Slater and Glaser, 2003; Mansoor andSlater, 2007). Indeed, Mn is proportional to the cation exchange ca-pacity of the porous body while the chargeability and the conductiv-ity depend strongly on the pore water salinity. In the presence ofpyrite and magnetite, the chargeability remains the key parametersto plot since it is directly related to the volume content of metallicparticles (Revil et al., 2015a, 2015b).
2.2. Influence of temperature
Since the present paper is dedicated to volcanic environments, it isimportant to study the effect of temperature on the complex conductiv-ity. The temperature dependence of the conductivity depends on thetemperature dependence of the mobility of the charge carriers, which
in turn depend on the viscosity of the pore water. In this case, the useof an Arrhenius (semi-empirical) equation yields,
σw Tð Þ ¼ σo exp −Ewa
kbNT
� �; ð9Þ
σw Tð Þ ¼ σw T0ð Þ exp −EwakbN
1T−
1T0
� �� �; ð10Þ
where T and T0 are expressed in degreeKelvin (K) (T0=298K, i.e., 25 °C),σo is a constant that has the dimension of a temperature independentconductivity, the product kbN (product of the Boltzmann constant bythe Avogadro number N = 6.02 × 10²³ mol−1) denotes the universalgas constant (kbN = 8.314 J mol−1 K−1), and Ea
w (expressed here inJ mol−1) denotes the activation energy associated with the viscosity ofthe pore water.
λ Tð Þ ¼ λ T0ð Þ exp −ESakbN
1T−
1T0
� �" #; ð11Þ
B Tð Þ ¼ B T0ð Þ exp −ESakbN
1T−
1T0
� �" #; ð12Þ
which corresponds to the temperature variations ofβ(+) (for Eq. (6)) andβ(+)S (for Eqs. (7) and (8)), respectively, T0 = 25 °C (reference tempera-
ture), and EaS denote the activation energy for the viscosity of the bound
water. Eqs. (11) to (12) implies that the surface conductivity, the normal-ized chargeability, and the quadrature conductivity depends on the tem-perature as
σ∞S Tð Þ ¼ σ∞
S T0ð Þ exp −ESakbN
1T−
1T0
� �" #; ð13Þ
Mn Tð Þ ¼ Mn T0ð Þ exp −ESakbN
1T−
1T0
� �" #; ð14Þ
σ} Tð Þ ¼ σ} T0ð Þ exp −ESakbN
1T−
1T0
� �" #: ð15Þ
The chargeability of volcanic rocks M is expected to be temperatureindependent since it is a ratio of two quantities that have the same tem-perature dependence (Revil et al., 2017a, 2018).
2.3. Relationship between the normalized chargeability and the quadratureconductivity
According Revil et al. (2017a), the normalized chargeabilityMn (de-termined between a low frequency and a high frequency) and the quad-rature conductivity,σ″ (determined at themean geometric frequency ofthe two frequencies used to define Mn) is given by
Mn ¼ −ασ}; ð16Þ
where the proportionality factor α is given explicitly by
α ≈2πln A; ð17Þ
andwhere ln(A) denotes the number of decades separating high and lowfrequencies. These equations can be derived in the context of the so-calledconstant phase model (i.e., the phase does not change toomuchwith thefrequency), also called the Drake's model (see Van Voorhis et al., 1973;Jonscher, 1981; Börner, 1992). Typically, α is in the range 5–10. Notethat in Eq. (16) the quadrature conductivity is a negative quantity andthe normalized chargeability is a positive quantity.
110 A. Ghorbani et al. / Journal of Volcanology and Geothermal Research 357 (2018) 106–127
We can consider also the ratio between the high frequency surfaceconductivity and the quadrature conductivity
−σ }
σ∞S¼ Mn
ασ∞S¼ λ
αB: ð18Þ
In our previous works (e.g., Revil et al., 2017a, 2017b), we definedthe dimensionless number R as the ratio of the normalized chargeabilityby the surface conductivity, i.e.,
R ≡Mn
σ∞S
≈ −ασ}
σ∞S
� �; ð19Þ
and therefore−σ"/σS∞ =R/α. The dimensionless number R = λ / B can
be related to the partition coefficient f and the mobility of the counter-ions in the Stern and diffuse layers
R ¼ βSþð Þ f
β þð Þ 1− fð Þ þ βSþð Þ f
h i : ð20Þ
This dimensionless parameter is of paramount importance to gofrom the polarization parameters (Mn or σ") to the surface conductivity.
2.4. Influence of metallic particles
Volcanic areas can host sulfide deposits (Ohmoto, 1996) and basalticrocks can contain significant amounts of magnetite. Metallic particlescan also exert a very strong influence on the complex conductivity ofporous rocks (e.g., VanVoorhis et al., 1973). For volcanic rocks, a volumecontent of pyrite, magnetite or other metals and semi-metals (in abroad sense) higher than 0.3% can have a significant impact on thechargeability and phase (see discussions in Revil et al., 2015a, 2015b).The chargeability M entering Eq. (1) is directly related to the (dimen-sionless) volume content of metallic particles φm (Revil et al., 2015a,their Equations 69 and 70),
M ≈ 1− 1−92φm
� �1−Mbð Þ; ð21Þ
M ≈92φm þMb: ð22Þ
In Eq. (22), Mb (dimensionless) denotes the chargeability of thebackground volcanic rock material given by
Mb ¼ 1Fϕ
� �ρgλCECσ∞
b; ð23Þ
where σb∞ denotes the instantaneous conductivity of the background
rock material. It is given by
σ∞b ¼ 1
Fσw þ 1
Fϕ
� �ρgBCEC; ð24Þ
Therefore the background chargeability is given by
Mb ¼ ρgλCECϕσw þ ρgBCEC
; ð25Þ
Interestingly, at low salinitie (i.e., for freshwater-saturated volcanicrocks), the background chargeability is given by a constant valueequal to R.
limσwbbσ S
Mb ¼ λB¼ R; ð26Þ
Therefore at low salinities, we have
M ¼ 92φm þ R: ð27Þ
Wewill test this equation in this paper in order to test the influenceof pyrite on the chargeability of pyrite-rich volcanic rocks.
3. Origin of the core samples
3.1. Merapi and Papadayan volcanoes, Indonesia
The lavas from Papandayan (Fig. 3) are mainly basaltic andesite, py-roxene andesite, and pyroxene dacite (Asmoro et al., 1989). ThePapandayan samples contain pyroclasts with clinopyroxene crystalswith simple core-rim zoning (typically ~ 5–15 vol%), euhedral magne-tite crystals, unresorbed amphiboles, and iron oxides. Petrological stud-ies on Papandayan lavas show that the most abundant alterationminerals in the altered materials are polymorphs of silica, pyrite, pyro-phyllite, natroalunite, and kaolinite (Mazot, 2005).
Merapi (Fig. 4) is an almost persistently active basaltic to basaltic an-desite volcanic complex in Central Java (Indonesia) (e.g., Voight et al.,2000; Surono Jousset et al., 2012) and often referred to as the type vol-cano for small-volume pyroclastic flows generated by gravitational lavadome failures. The lavas of Merapi are typically basaltic andesites with aporphyritic texture consisting of a glassy groundmass with abundantmicrolites that hosts phenocrysts of plagioclase, clinopyroxene, amphi-bole, and Fe-Ti oxides (Erdmann et al., 2014, 2016; Kushnir et al., 2016).Altered domematerials, light grey in color, are cristobalite-rich and con-tain diktytaxitic textures (Kushnir et al., 2016).
Our laboratory measurements were performed on 16 consolidatedcubic samples and 16 unconsolidated samples (see Tables 1 and 2).The average length and width of the cubic samples is 5 and 2.5 cm, re-spectively (Fig. 5). These sampleswere extracted from larger cores sam-pled on the outcropping formations of these two volcanoes.
3.2. Furnas volcano, Azores, Portugal
The second set of samples is 5 unconsolidated volcanic rocks fromFurnas trachytic volcano in Portugal (Table 3 and Fig. 6) that must be-long to the last explosive eruptions that occurred in this volcanic sys-tem. Furnas volcano is a central volcano located in the Eastern side ofSão Miguel Island, in the Azores volcanic archipelago. Furnas volcanocomprises an impressive summit depression 5 × 8 km wide formed bytwo nested calderas (Guest et al., 1999, 2015) and volcanic productsup to 100,000 years BP old (see Moore, 1990). Furnas volcanic activityhas been characterized by several eruptive styles, ranging from mid-effusive activity to caldera-forming explosive events (Guest et al.,1999, 2015). Ten intracaldera moderately explosive trachytic eruptionsoccurred in this volcano in the last 5000 years, two of which occurred inhistorical times (1439–43; 1630) (Guest et al., 2015). These historicalsubplinian/phreatomagmatic eruptions formed two tuff and pumicerings with central trachytic domes and its deposits mantle the calderafloor. The collected samples represent this type of material. Nowadays,volcanic activity at Furnas volcano is characterized by secondary mani-festations of volcanism, which comprises low temperature fumaroles(95 to 100 °C), steaming ground, thermal and cold CO2-rich springs, aswell as soil diffuse outgassing areas (e.g., Viveiros et al., 2010; Silvaet al., 2015). The caldera of Furnas volcano also contains several mono-genetic trachytic domes in addition to the historical ones. A recent studycarried out by Jeffery et al. (2016) indicates that Furnas trachytes aremainly derived from fractional crystallisation of alkali basalt parentalmagmas, at depths between approximately 3 and 4 km.

Fig. 3. Papandayan volcano, Indonesia. The samples were extracted from the area around Kawah Baru (literally “new crater”) that was formed during the last 2002 phreatic eruption. Thisfigure shows the position of the samples with their code names (coordinate system, UTM WGS84, 48M). The inset shows a map of the Western part of Java Island (Indonesia) with theposition of Papadayan volcano (red triangle). (For interpretation of the references to color in this figure legend, the reader is referred to the web version of this article.)
111A. Ghorbani et al. / Journal of Volcanology and Geothermal Research 357 (2018) 106–127
3.3. Yellowstone Caldera, USA
The next set of volcanic rock samples consists of 26 samples col-lected at Yellowstone National Park (USA, Fig. 7). The first subsetcomes from the ground surface in the Solfatara Plateau Thermal Area(SPTA), which corresponds to an acid-sulfate vapor-dominated areanear the northern rim of the 0.63 Ma Yellowstone Caldera (16YS seriesin Table 3, Fig. 8). An additional set of samples is from drill hole Y-2(drilled to a depth of 157 m) in Yellowstone's Lower Geyser Basin anddrill hole Y-8 in the Upper Geyser Basin (Y2 and Y8 series Table 3). Sam-ples of the 16YS series consist of acid-sulfate altered glacial depositswhich, in turn, consist mainly of fragments from the 110 ± 3 ka Solfa-tara Plateau flow rhyolite (Christiansen, 2001) with various levels of al-teration. Detailed descriptions of alteration mineralogy from drill holeY-2 can be found in Bargar and Beeson (1981) and for Y-8 in Keithet al. (1978). The chemical composition of the core from both drillholes is provided in Beeson and Bargar (1984). The samples we usedhave a cylindrical shape with a diameter of 2.5 cm and a length of2 cm. The cylinder plugs were obtained by drilling perpendicular tothe main core axis (Fig. 8). The samples are from rhyolite flows andbreccia. Core from drill hole Y-2 consists of interbedded glacial sedi-ments interlayered with pumiceous tuff from 10 to 32 m, and rhyoliticof the 0.153 ± 0.002 Ma Elephant Back rhyolite flow (Christiansen,
2001) and the 0.151 ± 0.004 Mallard Lake rhyolite flow from 32 to157m (Bargar and Beeson, 1981) (Fig. 8). Pervasive hydrothermal alter-ation of the rhyolite is nearly continuous throughout the drill core. Corefrom drill hole Y-8 consists of 54 m of glacial sediments, 8 m of rhyoliteflow breccia, and 91 m of pumiceous tuff.
3.4. Whakaari volcano (White Island), New Zealand
The last set of samples was sourced from Whakaari volcano (WhiteIsland), an active andesitic-dacitic stratovolcano located at the north-eastern end of the Taupō Volcanic Zone, New Zealand (Fig. 9). The 22core samples are shown in Fig. 10. The volcano hosts a hydrothermalsystem (Giggenbach et al., 2003) that is expressed at the surface ashot springs, bubbling mud pools, sulphur-encrusted fumaroles andchimneys, and acid streams and pools. The result of this hydrothermalactivity is that a large proportion of the rocks forming the crater floorand walls are hydrothermally altered (Hedenquist et al., 1993; Moonet al., 2005; Heap et al., 2015, 2017). Although Strombolian activity oc-curred during the late seventies andmid-eighties (Houghton and Nairn,1991), volcanic activity at Whakaari is characterized by phreatic andphreatomagmatic eruptions (Mayer et al., 2015).
The present-day crater walls chiefly comprise interbedded lavas, lavabreccias, and tuffs with a dominantly ash-sized particle size (“ash tuffs”)
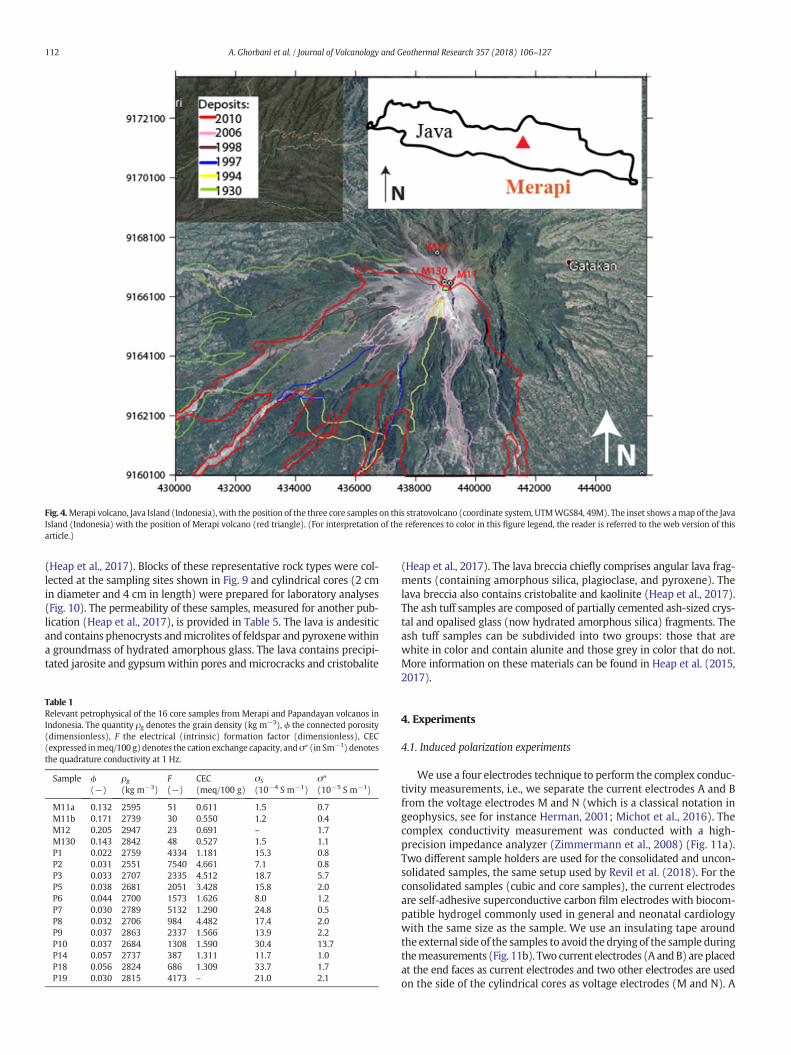
Fig. 4.Merapi volcano, Java Island (Indonesia), with the position of the three core samples on this stratovolcano (coordinate system, UTMWGS84, 49M). The inset shows amap of the JavaIsland (Indonesia) with the position of Merapi volcano (red triangle). (For interpretation of the references to color in this figure legend, the reader is referred to the web version of thisarticle.)
112 A. Ghorbani et al. / Journal of Volcanology and Geothermal Research 357 (2018) 106–127
(Heap et al., 2017). Blocks of these representative rock types were col-lected at the sampling sites shown in Fig. 9 and cylindrical cores (2 cmin diameter and 4 cm in length) were prepared for laboratory analyses(Fig. 10). The permeability of these samples, measured for another pub-lication (Heap et al., 2017), is provided in Table 5. The lava is andesiticand contains phenocrysts andmicrolites of feldspar and pyroxenewithina groundmass of hydrated amorphous glass. The lava contains precipi-tated jarosite and gypsumwithin pores andmicrocracks and cristobalite
Table 1Relevant petrophysical of the 16 core samples from Merapi and Papandayan volcanos inIndonesia. The quantity ρg denotes the grain density (kg m−3), ϕ the connected porosity(dimensionless), F the electrical (intrinsic) formation factor (dimensionless), CEC(expressed inmeq/100 g)denotes the cation exchange capacity, andσ″ (in Sm−1) denotesthe quadrature conductivity at 1 Hz.
Sample ϕ(−)
ρg(kg m−3)
F(−)
CEC(meq/100 g)
σS
(10−4 S m−1)σ″(10−5 S m−1)
M11a 0.132 2595 51 0.611 1.5 0.7M11b 0.171 2739 30 0.550 1.2 0.4M12 0.205 2947 23 0.691 – 1.7M130 0.143 2842 48 0.527 1.5 1.1P1 0.022 2759 4334 1.181 15.3 0.8P2 0.031 2551 7540 4.661 7.1 0.8P3 0.033 2707 2335 4.512 18.7 5.7P5 0.038 2681 2051 3.428 15.8 2.0P6 0.044 2700 1573 1.626 8.0 1.2P7 0.030 2789 5132 1.290 24.8 0.5P8 0.032 2706 984 4.482 17.4 2.0P9 0.037 2863 2337 1.566 13.9 2.2P10 0.037 2684 1308 1.590 30.4 13.7P14 0.057 2737 387 1.311 11.7 1.0P18 0.056 2824 686 1.309 33.7 1.7P19 0.030 2815 4173 – 21.0 2.1
(Heap et al., 2017). The lava breccia chiefly comprises angular lava frag-ments (containing amorphous silica, plagioclase, and pyroxene). Thelava breccia also contains cristobalite and kaolinite (Heap et al., 2017).The ash tuff samples are composed of partially cemented ash-sized crys-tal and opalised glass (now hydrated amorphous silica) fragments. Theash tuff samples can be subdivided into two groups: those that arewhite in color and contain alunite and those grey in color that do not.More information on these materials can be found in Heap et al. (2015,2017).
4. Experiments
4.1. Induced polarization experiments
We use a four electrodes technique to perform the complex conduc-tivity measurements, i.e., we separate the current electrodes A and Bfrom the voltage electrodes M and N (which is a classical notation ingeophysics, see for instance Herman, 2001; Michot et al., 2016). Thecomplex conductivity measurement was conducted with a high-precision impedance analyzer (Zimmermann et al., 2008) (Fig. 11a).Two different sample holders are used for the consolidated and uncon-solidated samples, the same setup used by Revil et al. (2018). For theconsolidated samples (cubic and core samples), the current electrodesare self-adhesive superconductive carbon film electrodes with biocom-patible hydrogel commonly used in general and neonatal cardiologywith the same size as the sample. We use an insulating tape aroundthe external side of the samples to avoid the drying of the sample duringthemeasurements (Fig. 11b). Two current electrodes (A andB) are placedat the end faces as current electrodes and two other electrodes are usedon the side of the cylindrical cores as voltage electrodes (M and N). A
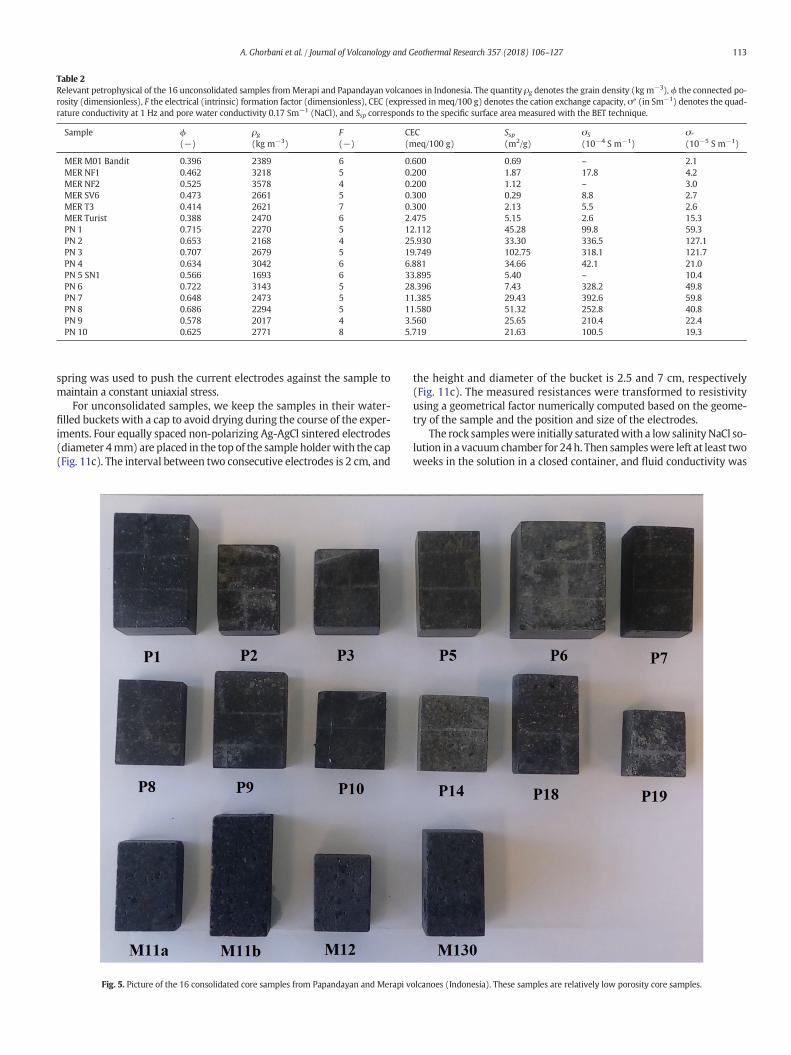
Table 2Relevant petrophysical of the 16 unconsolidated samples fromMerapi and Papandayan volcanoes in Indonesia. The quantity ρg denotes the grain density (kg m−3), ϕ the connected po-rosity (dimensionless), F the electrical (intrinsic) formation factor (dimensionless), CEC (expressed in meq/100 g) denotes the cation exchange capacity, σ″ (in Sm−1) denotes the quad-rature conductivity at 1 Hz and pore water conductivity 0.17 Sm−1 (NaCl), and Ssp corresponds to the specific surface area measured with the BET technique.
Sample ϕ(−)
ρg(kg m−3)
F(−)
CEC(meq/100 g)
Ssp(m2/g)
σS
(10−4 S m−1)σ″
(10−5 S m−1)
MER M01 Bandit 0.396 2389 6 0.600 0.69 – 2.1MER NF1 0.462 3218 5 0.200 1.87 17.8 4.2MER NF2 0.525 3578 4 0.200 1.12 – 3.0MER SV6 0.473 2661 5 0.300 0.29 8.8 2.7MER T3 0.414 2621 7 0.300 2.13 5.5 2.6MER Turist 0.388 2470 6 2.475 5.15 2.6 15.3PN 1 0.715 2270 5 12.112 45.28 99.8 59.3PN 2 0.653 2168 4 25.930 33.30 336.5 127.1PN 3 0.707 2679 5 19.749 102.75 318.1 121.7PN 4 0.634 3042 6 6.881 34.66 42.1 21.0PN 5 SN1 0.566 1693 6 33.895 5.40 – 10.4PN 6 0.722 3143 5 28.396 7.43 328.2 49.8PN 7 0.648 2473 5 11.385 29.43 392.6 59.8PN 8 0.686 2294 5 11.580 51.32 252.8 40.8PN 9 0.578 2017 4 3.560 25.65 210.4 22.4PN 10 0.625 2771 8 5.719 21.63 100.5 19.3
113A. Ghorbani et al. / Journal of Volcanology and Geothermal Research 357 (2018) 106–127
spring was used to push the current electrodes against the sample tomaintain a constant uniaxial stress.
For unconsolidated samples, we keep the samples in their water-filled buckets with a cap to avoid drying during the course of the exper-iments. Four equally spaced non-polarizing Ag-AgCl sintered electrodes(diameter 4mm) are placed in the top of the sample holderwith the cap(Fig. 11c). The interval between two consecutive electrodes is 2 cm, and
Fig. 5. Picture of the 16 consolidated core samples from Papandayan and Merapi v
the height and diameter of the bucket is 2.5 and 7 cm, respectively(Fig. 11c). The measured resistances were transformed to resistivityusing a geometrical factor numerically computed based on the geome-try of the sample and the position and size of the electrodes.
The rock sampleswere initially saturatedwith a low salinity NaCl so-lution in a vacuumchamber for 24h. Then sampleswere left at least twoweeks in the solution in a closed container, and fluid conductivity was
olcanoes (Indonesia). These samples are relatively low porosity core samples.
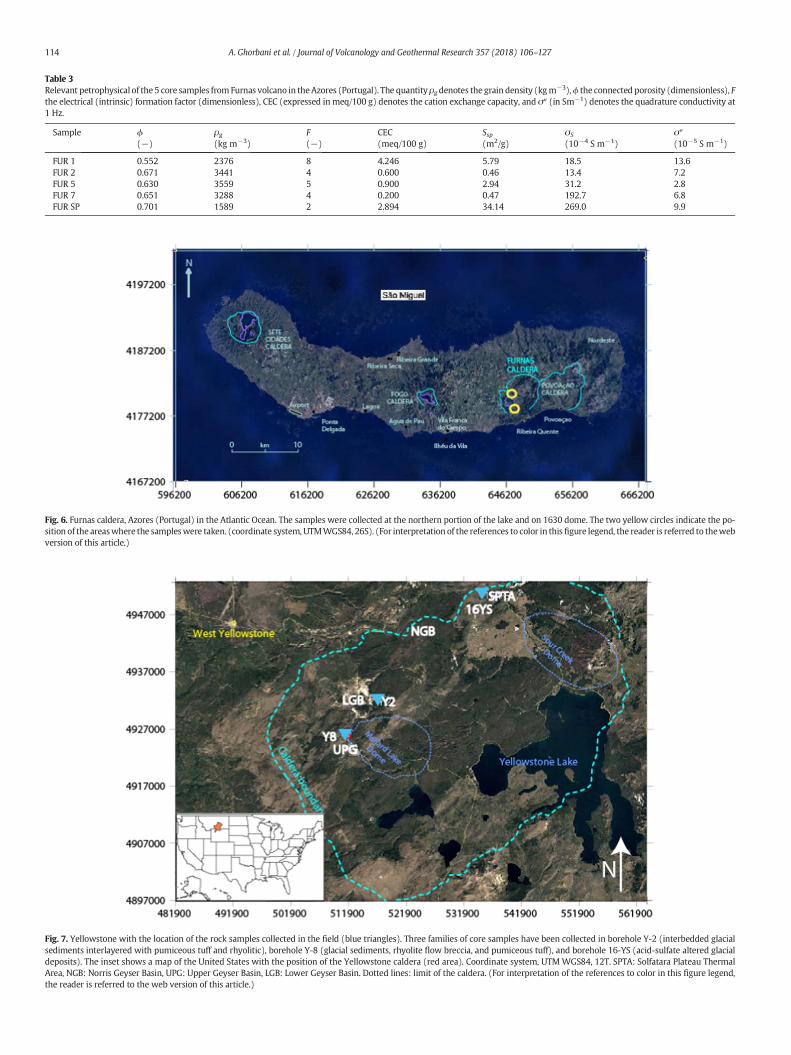
Fig. 6. Furnas caldera, Azores (Portugal) in the Atlantic Ocean. The samples were collected at the northern portion of the lake and on 1630 dome. The two yellow circles indicate the po-sition of the areaswhere the sampleswere taken. (coordinate system, UTMWGS84, 26S). (For interpretation of the references to color in thisfigure legend, the reader is referred to thewebversion of this article.)
Fig. 7. Yellowstone with the location of the rock samples collected in the field (blue triangles). Three families of core samples have been collected in borehole Y-2 (interbedded glacialsediments interlayered with pumiceous tuff and rhyolitic), borehole Y-8 (glacial sediments, rhyolite flow breccia, and pumiceous tuff), and borehole 16-YS (acid-sulfate altered glacialdeposits). The inset shows a map of the United States with the position of the Yellowstone caldera (red area). Coordinate system, UTMWGS84, 12T. SPTA: Solfatara Plateau ThermalArea, NGB: Norris Geyser Basin, UPG: Upper Geyser Basin, LGB: Lower Geyser Basin. Dotted lines: limit of the caldera. (For interpretation of the references to color in this figure legend,the reader is referred to the web version of this article.)
Table 3Relevant petrophysical of the 5 core samples from Furnas volcano in theAzores (Portugal). The quantity ρgdenotes the grain density (kgm−3),ϕ the connected porosity (dimensionless), Fthe electrical (intrinsic) formation factor (dimensionless), CEC (expressed in meq/100 g) denotes the cation exchange capacity, and σ″ (in Sm−1) denotes the quadrature conductivity at1 Hz.
Sample ϕ(−)
ρg(kg m−3)
F(−)
CEC(meq/100 g)
Ssp(m2/g)
σS
(10−4 S m−1)σ″(10−5 S m−1)
FUR 1 0.552 2376 8 4.246 5.79 18.5 13.6FUR 2 0.671 3441 4 0.600 0.46 13.4 7.2FUR 5 0.630 3559 5 0.900 2.94 31.2 2.8FUR 7 0.651 3288 4 0.200 0.47 192.7 6.8FUR SP 0.701 1589 2 2.894 34.14 269.0 9.9
114 A. Ghorbani et al. / Journal of Volcanology and Geothermal Research 357 (2018) 106–127
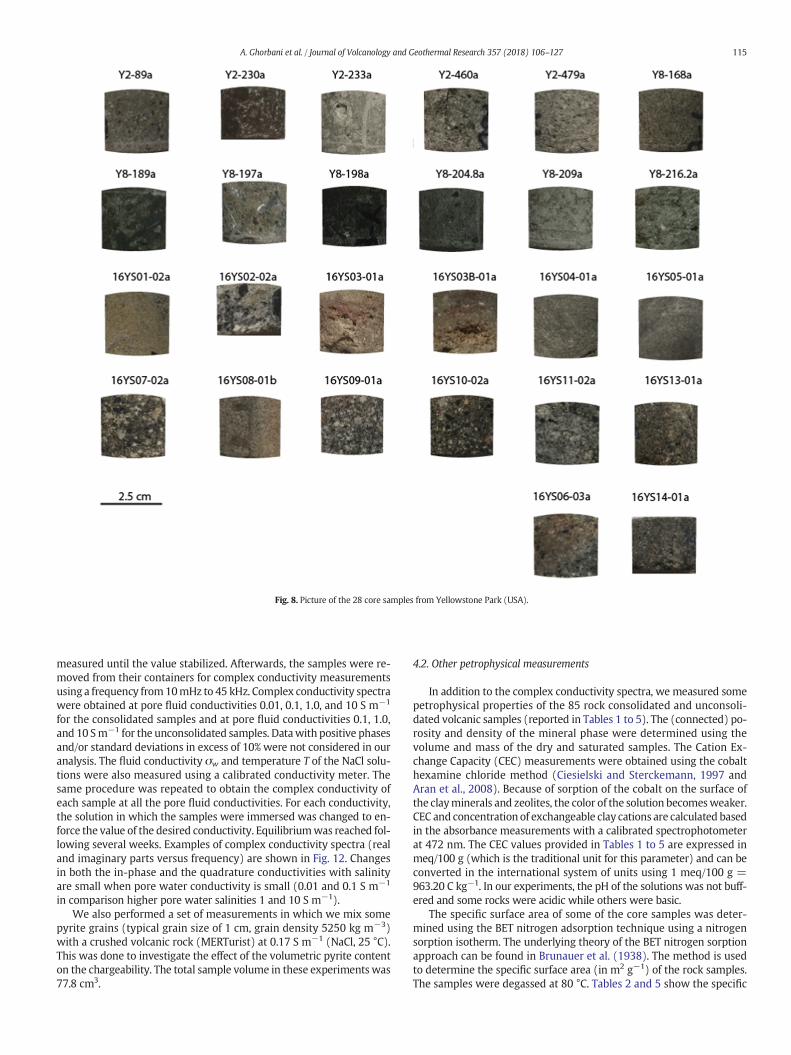
Fig. 8. Picture of the 28 core samples from Yellowstone Park (USA).
115A. Ghorbani et al. / Journal of Volcanology and Geothermal Research 357 (2018) 106–127
measured until the value stabilized. Afterwards, the samples were re-moved from their containers for complex conductivity measurementsusing a frequency from10mHz to 45 kHz. Complex conductivity spectrawere obtained at pore fluid conductivities 0.01, 0.1, 1.0, and 10 S m−1
for the consolidated samples and at pore fluid conductivities 0.1, 1.0,and 10 Sm−1 for the unconsolidated samples. Datawith positive phasesand/or standard deviations in excess of 10% were not considered in ouranalysis. The fluid conductivity σw and temperature T of the NaCl solu-tions were also measured using a calibrated conductivity meter. Thesame procedure was repeated to obtain the complex conductivity ofeach sample at all the pore fluid conductivities. For each conductivity,the solution in which the samples were immersed was changed to en-force the value of the desired conductivity. Equilibriumwas reached fol-lowing several weeks. Examples of complex conductivity spectra (realand imaginary parts versus frequency) are shown in Fig. 12. Changesin both the in-phase and the quadrature conductivities with salinityare small when pore water conductivity is small (0.01 and 0.1 S m−1
in comparison higher pore water salinities 1 and 10 S m−1).We also performed a set of measurements in which we mix some
pyrite grains (typical grain size of 1 cm, grain density 5250 kg m−3)with a crushed volcanic rock (MERTurist) at 0.17 S m−1 (NaCl, 25 °C).This was done to investigate the effect of the volumetric pyrite contenton the chargeability. The total sample volume in these experiments was77.8 cm3.
4.2. Other petrophysical measurements
In addition to the complex conductivity spectra, we measured somepetrophysical properties of the 85 rock consolidated and unconsoli-dated volcanic samples (reported in Tables 1 to 5). The (connected) po-rosity and density of the mineral phase were determined using thevolume and mass of the dry and saturated samples. The Cation Ex-change Capacity (CEC) measurements were obtained using the cobalthexamine chloride method (Ciesielski and Sterckemann, 1997 andAran et al., 2008). Because of sorption of the cobalt on the surface ofthe clayminerals and zeolites, the color of the solution becomesweaker.CEC and concentration of exchangeable clay cations are calculated basedin the absorbance measurements with a calibrated spectrophotometerat 472 nm. The CEC values provided in Tables 1 to 5 are expressed inmeq/100 g (which is the traditional unit for this parameter) and can beconverted in the international system of units using 1 meq/100 g =963.20 C kg−1. In our experiments, the pH of the solutions was not buff-ered and some rocks were acidic while others were basic.
The specific surface area of some of the core samples was deter-mined using the BET nitrogen adsorption technique using a nitrogensorption isotherm. The underlying theory of the BET nitrogen sorptionapproach can be found in Brunauer et al. (1938). The method is usedto determine the specific surface area (in m2 g−1) of the rock samples.The samples were degassed at 80 °C. Tables 2 and 5 show the specific
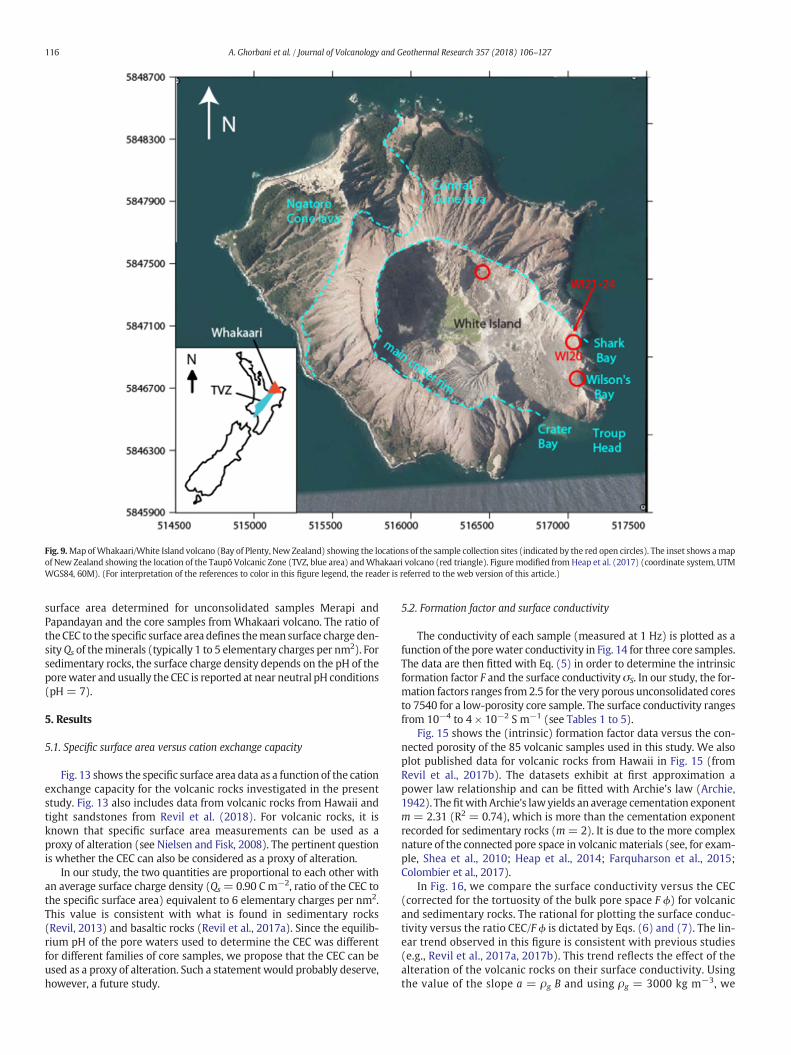
Fig. 9.Map ofWhakaari/White Island volcano (Bay of Plenty, New Zealand) showing the locations of the sample collection sites (indicated by the red open circles). The inset shows amapof New Zealand showing the location of the Taupō Volcanic Zone (TVZ, blue area) andWhakaari volcano (red triangle). Figure modified from Heap et al. (2017) (coordinate system, UTMWGS84, 60M). (For interpretation of the references to color in this figure legend, the reader is referred to the web version of this article.)
116 A. Ghorbani et al. / Journal of Volcanology and Geothermal Research 357 (2018) 106–127
surface area determined for unconsolidated samples Merapi andPapandayan and the core samples from Whakaari volcano. The ratio oftheCEC to the specific surface area defines themean surface charge den-sityQs of theminerals (typically 1 to 5 elementary charges per nm2). Forsedimentary rocks, the surface charge density depends on the pH of theporewater and usually the CEC is reported at near neutral pH conditions(pH = 7).
5. Results
5.1. Specific surface area versus cation exchange capacity
Fig. 13 shows the specific surface area data as a function of the cationexchange capacity for the volcanic rocks investigated in the presentstudy. Fig. 13 also includes data from volcanic rocks from Hawaii andtight sandstones from Revil et al. (2018). For volcanic rocks, it isknown that specific surface area measurements can be used as aproxy of alteration (see Nielsen and Fisk, 2008). The pertinent questionis whether the CEC can also be considered as a proxy of alteration.
In our study, the two quantities are proportional to each other withan average surface charge density (Qs =0.90 C m−2, ratio of the CEC tothe specific surface area) equivalent to 6 elementary charges per nm2.This value is consistent with what is found in sedimentary rocks(Revil, 2013) and basaltic rocks (Revil et al., 2017a). Since the equilib-rium pH of the pore waters used to determine the CEC was differentfor different families of core samples, we propose that the CEC can beused as a proxy of alteration. Such a statement would probably deserve,however, a future study.
5.2. Formation factor and surface conductivity
The conductivity of each sample (measured at 1 Hz) is plotted as afunction of the porewater conductivity in Fig. 14 for three core samples.The data are then fitted with Eq. (5) in order to determine the intrinsicformation factor F and the surface conductivity σS. In our study, the for-mation factors ranges from 2.5 for the very porous unconsolidated coresto 7540 for a low-porosity core sample. The surface conductivity rangesfrom 10−4 to 4 × 10⁻² S m−1 (see Tables 1 to 5).
Fig. 15 shows the (intrinsic) formation factor data versus the con-nected porosity of the 85 volcanic samples used in this study. We alsoplot published data for volcanic rocks from Hawaii in Fig. 15 (fromRevil et al., 2017b). The datasets exhibit at first approximation apower law relationship and can be fitted with Archie's law (Archie,1942). Thefit with Archie's lawyields an average cementation exponentm = 2.31 (R2 = 0.74), which is more than the cementation exponentrecorded for sedimentary rocks (m= 2). It is due to the more complexnature of the connected pore space in volcanic materials (see, for exam-ple, Shea et al., 2010; Heap et al., 2014; Farquharson et al., 2015;Colombier et al., 2017).
In Fig. 16, we compare the surface conductivity versus the CEC(corrected for the tortuosity of the bulk pore space F ϕ) for volcanicand sedimentary rocks. The rational for plotting the surface conduc-tivity versus the ratio CEC/F ϕ is dictated by Eqs. (6) and (7). The lin-ear trend observed in this figure is consistent with previous studies(e.g., Revil et al., 2017a, 2017b). This trend reflects the effect of thealteration of the volcanic rocks on their surface conductivity. Usingthe value of the slope a = ρg B and using ρg = 3000 kg m−3, we
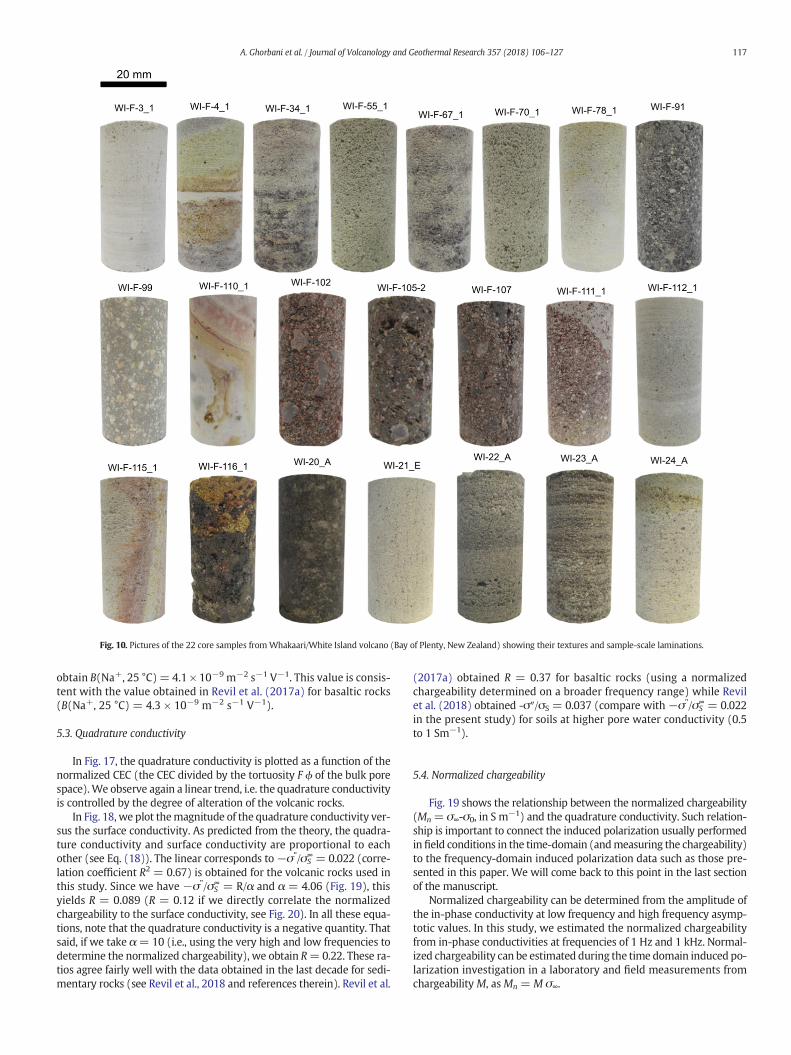
Fig. 10. Pictures of the 22 core samples from Whakaari/White Island volcano (Bay of Plenty, New Zealand) showing their textures and sample-scale laminations.
117A. Ghorbani et al. / Journal of Volcanology and Geothermal Research 357 (2018) 106–127
obtain B(Na+, 25 °C)= 4.1 × 10⁻⁹ m−2 s−1 V−1. This value is consis-tent with the value obtained in Revil et al. (2017a) for basaltic rocks(B(Na+, 25 °C) = 4.3 × 10⁻⁹ m−2 s−1 V−1).
5.3. Quadrature conductivity
In Fig. 17, the quadrature conductivity is plotted as a function of thenormalized CEC (the CEC divided by the tortuosity F ϕ of the bulk porespace).We observe again a linear trend, i.e. the quadrature conductivityis controlled by the degree of alteration of the volcanic rocks.
In Fig. 18, we plot themagnitude of the quadrature conductivity ver-sus the surface conductivity. As predicted from the theory, the quadra-ture conductivity and surface conductivity are proportional to eachother (see Eq. (18)). The linear corresponds to−σ"/σS
∞ = 0.022 (corre-lation coefficient R2 = 0.67) is obtained for the volcanic rocks used inthis study. Since we have −σ"/σS
∞ = R/α and α = 4.06 (Fig. 19), thisyields R = 0.089 (R = 0.12 if we directly correlate the normalizedchargeability to the surface conductivity, see Fig. 20). In all these equa-tions, note that the quadrature conductivity is a negative quantity. Thatsaid, if we take α= 10 (i.e., using the very high and low frequencies todetermine the normalized chargeability), we obtain R=0.22. These ra-tios agree fairly well with the data obtained in the last decade for sedi-mentary rocks (see Revil et al., 2018 and references therein). Revil et al.
(2017a) obtained R = 0.37 for basaltic rocks (using a normalizedchargeability determined on a broader frequency range) while Revilet al. (2018) obtained -σ″/σS = 0.037 (compare with −σ"/σS
∞ = 0.022in the present study) for soils at higher pore water conductivity (0.5to 1 Sm−1).
5.4. Normalized chargeability
Fig. 19 shows the relationship between the normalized chargeability(Mn = σ∞-σ0, in S m−1) and the quadrature conductivity. Such relation-ship is important to connect the induced polarization usually performedin field conditions in the time-domain (andmeasuring the chargeability)to the frequency-domain induced polarization data such as those pre-sented in this paper. We will come back to this point in the last sectionof the manuscript.
Normalized chargeability can be determined from the amplitude ofthe in-phase conductivity at low frequency and high frequency asymp-totic values. In this study, we estimated the normalized chargeabilityfrom in-phase conductivities at frequencies of 1 Hz and 1 kHz. Normal-ized chargeability can be estimated during the time domain induced po-larization investigation in a laboratory and field measurements fromchargeability M, asMn = M σ∞.
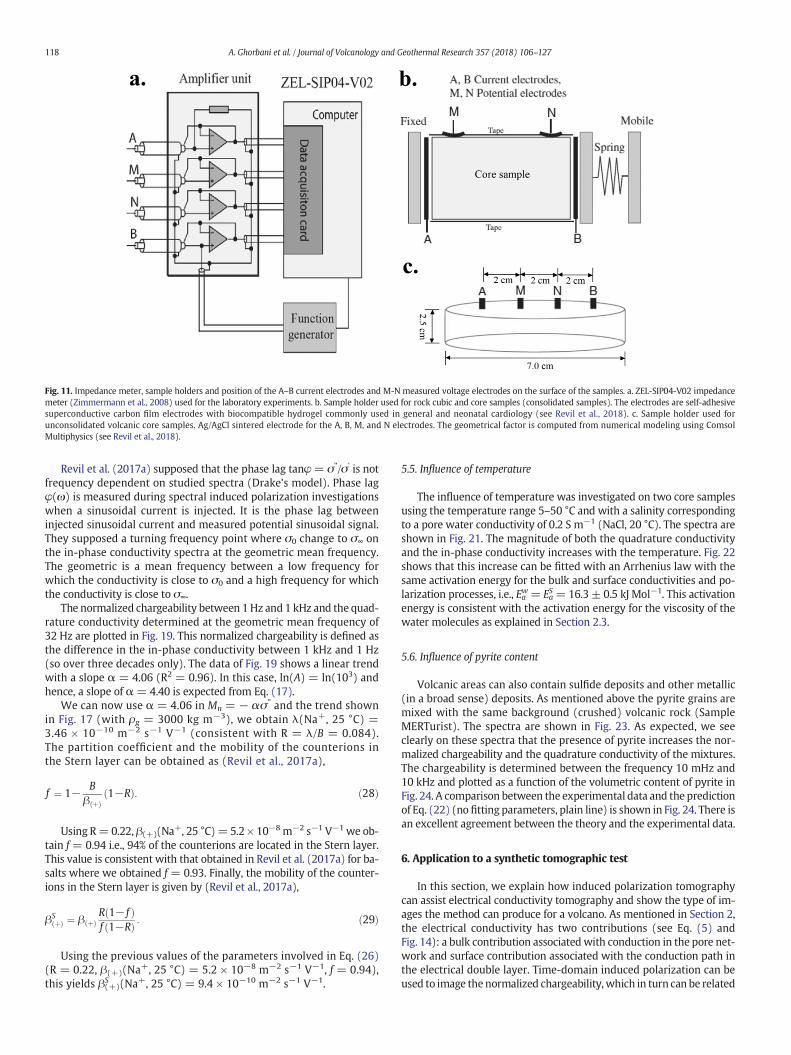
Fig. 11. Impedance meter, sample holders and position of the A–B current electrodes and M-N measured voltage electrodes on the surface of the samples. a. ZEL-SIP04-V02 impedancemeter (Zimmermann et al., 2008) used for the laboratory experiments. b. Sample holder used for rock cubic and core samples (consolidated samples). The electrodes are self-adhesivesuperconductive carbon film electrodes with biocompatible hydrogel commonly used in general and neonatal cardiology (see Revil et al., 2018). c. Sample holder used forunconsolidated volcanic core samples. Ag/AgCl sintered electrode for the A, B, M, and N electrodes. The geometrical factor is computed from numerical modeling using ComsolMultiphysics (see Revil et al., 2018).
118 A. Ghorbani et al. / Journal of Volcanology and Geothermal Research 357 (2018) 106–127
Revil et al. (2017a) supposed that the phase lag tanφ = σ"/σ' is notfrequency dependent on studied spectra (Drake's model). Phase lagφ(ω) is measured during spectral induced polarization investigationswhen a sinusoidal current is injected. It is the phase lag betweeninjected sinusoidal current and measured potential sinusoidal signal.They supposed a turning frequency point where σ0 change to σ∞ onthe in-phase conductivity spectra at the geometric mean frequency.The geometric is a mean frequency between a low frequency forwhich the conductivity is close to σ0 and a high frequency for whichthe conductivity is close to σ∞.
The normalized chargeability between 1Hz and 1 kHz and the quad-rature conductivity determined at the geometric mean frequency of32 Hz are plotted in Fig. 19. This normalized chargeability is defined asthe difference in the in-phase conductivity between 1 kHz and 1 Hz(so over three decades only). The data of Fig. 19 shows a linear trendwith a slope α = 4.06 (R2 = 0.96). In this case, ln(A) = ln(103) andhence, a slope of α = 4.40 is expected from Eq. (17).
We can now use α = 4.06 in Mn = − ασ" and the trend shownin Fig. 17 (with ρg = 3000 kg m−3), we obtain λ(Na+, 25 °C) =3.46 × 10⁻¹⁰ m−2 s−1 V−1 (consistent with R = λ/B = 0.084).The partition coefficient and the mobility of the counterions inthe Stern layer can be obtained as (Revil et al., 2017a),
f ¼ 1−B
β þð Þ1−Rð Þ: ð28Þ
Using R= 0.22, β(+)(Na+, 25 °C)= 5.2 × 10⁻⁸ m−2 s−1 V−1 we ob-tain f = 0.94 i.e., 94% of the counterions are located in the Stern layer.This value is consistent with that obtained in Revil et al. (2017a) for ba-salts where we obtained f = 0.93. Finally, the mobility of the counter-ions in the Stern layer is given by (Revil et al., 2017a),
βSþð Þ ¼ β þð Þ
R 1− fð Þf 1−Rð Þ : ð29Þ
Using the previous values of the parameters involved in Eq. (26)(R = 0.22, β(+)(Na+, 25 °C) = 5.2 × 10⁻⁸ m−2 s−1 V−1, f = 0.94),this yields β(+)
S (Na+, 25 °C) = 9.4 × 10⁻¹⁰ m−2 s−1 V−1.
5.5. Influence of temperature
The influence of temperature was investigated on two core samplesusing the temperature range 5–50 °C and with a salinity correspondingto a pore water conductivity of 0.2 S m−1 (NaCl, 20 °C). The spectra areshown in Fig. 21. The magnitude of both the quadrature conductivityand the in-phase conductivity increases with the temperature. Fig. 22shows that this increase can be fitted with an Arrhenius law with thesame activation energy for the bulk and surface conductivities and po-larization processes, i.e., Eaw = Ea
S =16.3 ± 0.5 kJ Mol−1. This activationenergy is consistent with the activation energy for the viscosity of thewater molecules as explained in Section 2.3.
5.6. Influence of pyrite content
Volcanic areas can also contain sulfide deposits and other metallic(in a broad sense) deposits. As mentioned above the pyrite grains aremixed with the same background (crushed) volcanic rock (SampleMERTurist). The spectra are shown in Fig. 23. As expected, we seeclearly on these spectra that the presence of pyrite increases the nor-malized chargeability and the quadrature conductivity of the mixtures.The chargeability is determined between the frequency 10 mHz and10 kHz and plotted as a function of the volumetric content of pyrite inFig. 24. A comparison between the experimental data and the predictionof Eq. (22) (no fitting parameters, plain line) is shown in Fig. 24. There isan excellent agreement between the theory and the experimental data.
6. Application to a synthetic tomographic test
In this section, we explain how induced polarization tomographycan assist electrical conductivity tomography and show the type of im-ages the method can produce for a volcano. As mentioned in Section 2,the electrical conductivity has two contributions (see Eq. (5) andFig. 14): a bulk contribution associatedwith conduction in the pore net-work and surface contribution associated with the conduction path inthe electrical double layer. Time-domain induced polarization can beused to image thenormalized chargeability,which in turn can be related
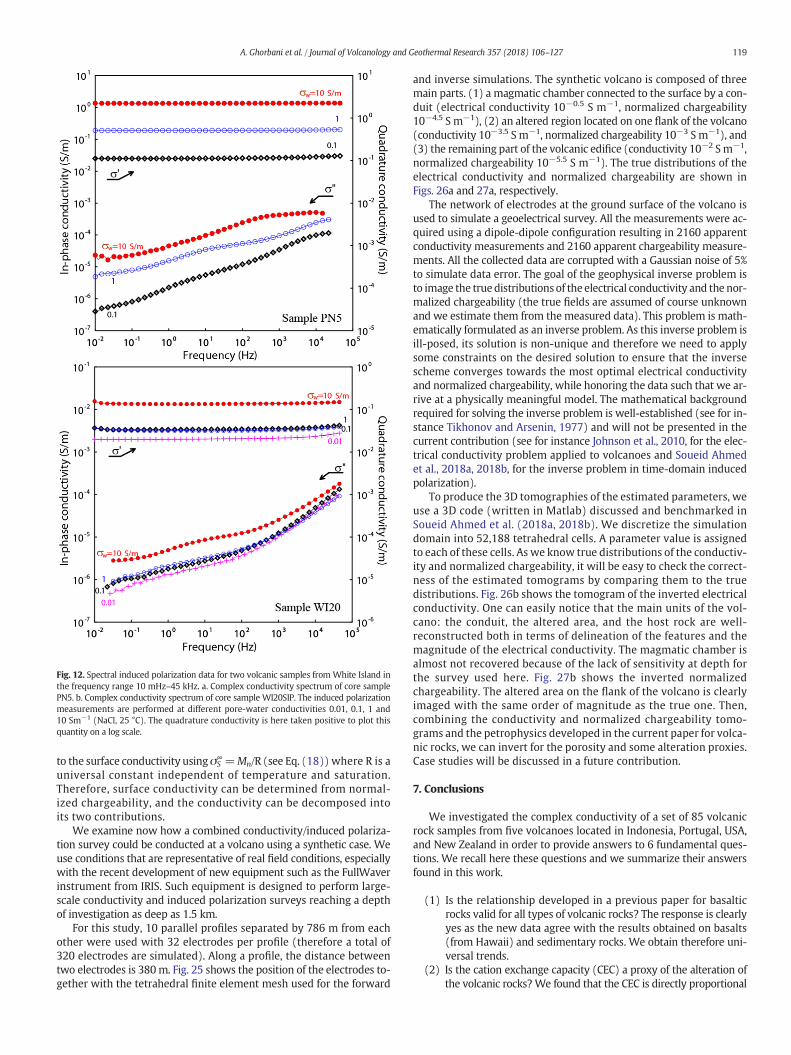
Fig. 12. Spectral induced polarization data for two volcanic samples from White Island inthe frequency range 10 mHz–45 kHz. a. Complex conductivity spectrum of core samplePN5. b. Complex conductivity spectrum of core sample WI20SIP. The induced polarizationmeasurements are performed at different pore-water conductivities 0.01, 0.1, 1 and10 Sm−1 (NaCl, 25 °C). The quadrature conductivity is here taken positive to plot thisquantity on a log scale.
119A. Ghorbani et al. / Journal of Volcanology and Geothermal Research 357 (2018) 106–127
to the surface conductivity usingσS∞=Mn/R (see Eq. (18)) where R is a
universal constant independent of temperature and saturation.Therefore, surface conductivity can be determined from normal-ized chargeability, and the conductivity can be decomposed intoits two contributions.
We examine now how a combined conductivity/induced polariza-tion survey could be conducted at a volcano using a synthetic case. Weuse conditions that are representative of real field conditions, especiallywith the recent development of new equipment such as the FullWaverinstrument from IRIS. Such equipment is designed to perform large-scale conductivity and induced polarization surveys reaching a depthof investigation as deep as 1.5 km.
For this study, 10 parallel profiles separated by 786 m from eachother were used with 32 electrodes per profile (therefore a total of320 electrodes are simulated). Along a profile, the distance betweentwo electrodes is 380m. Fig. 25 shows the position of the electrodes to-gether with the tetrahedral finite element mesh used for the forward
and inverse simulations. The synthetic volcano is composed of threemain parts. (1) a magmatic chamber connected to the surface by a con-duit (electrical conductivity 10−0.5 S m−1, normalized chargeability10−4.5 S m−1), (2) an altered region located on one flank of the volcano(conductivity 10−3.5 S m−1, normalized chargeability 10−3 S m−1), and(3) the remaining part of the volcanic edifice (conductivity 10−2 Sm−1,normalized chargeability 10−5.5 S m−1). The true distributions of theelectrical conductivity and normalized chargeability are shown inFigs. 26a and 27a, respectively.
The network of electrodes at the ground surface of the volcano isused to simulate a geoelectrical survey. All the measurements were ac-quired using a dipole-dipole configuration resulting in 2160 apparentconductivity measurements and 2160 apparent chargeability measure-ments. All the collected data are corrupted with a Gaussian noise of 5%to simulate data error. The goal of the geophysical inverse problem isto image the true distributions of the electrical conductivity and the nor-malized chargeability (the true fields are assumed of course unknownand we estimate them from the measured data). This problem is math-ematically formulated as an inverse problem. As this inverse problem isill-posed, its solution is non-unique and therefore we need to applysome constraints on the desired solution to ensure that the inversescheme converges towards the most optimal electrical conductivityand normalized chargeability, while honoring the data such that we ar-rive at a physically meaningful model. The mathematical backgroundrequired for solving the inverse problem is well-established (see for in-stance Tikhonov and Arsenin, 1977) and will not be presented in thecurrent contribution (see for instance Johnson et al., 2010, for the elec-trical conductivity problem applied to volcanoes and Soueid Ahmedet al., 2018a, 2018b, for the inverse problem in time-domain inducedpolarization).
To produce the 3D tomographies of the estimated parameters, weuse a 3D code (written in Matlab) discussed and benchmarked inSoueid Ahmed et al. (2018a, 2018b). We discretize the simulationdomain into 52,188 tetrahedral cells. A parameter value is assignedto each of these cells. As we know true distributions of the conductiv-ity and normalized chargeability, it will be easy to check the correct-ness of the estimated tomograms by comparing them to the truedistributions. Fig. 26b shows the tomogram of the inverted electricalconductivity. One can easily notice that the main units of the vol-cano: the conduit, the altered area, and the host rock are well-reconstructed both in terms of delineation of the features and themagnitude of the electrical conductivity. The magmatic chamber isalmost not recovered because of the lack of sensitivity at depth forthe survey used here. Fig. 27b shows the inverted normalizedchargeability. The altered area on the flank of the volcano is clearlyimaged with the same order of magnitude as the true one. Then,combining the conductivity and normalized chargeability tomo-grams and the petrophysics developed in the current paper for volca-nic rocks, we can invert for the porosity and some alteration proxies.Case studies will be discussed in a future contribution.
7. Conclusions
We investigated the complex conductivity of a set of 85 volcanicrock samples from five volcanoes located in Indonesia, Portugal, USA,and New Zealand in order to provide answers to 6 fundamental ques-tions. We recall here these questions and we summarize their answersfound in this work.
(1) Is the relationship developed in a previous paper for basalticrocks valid for all types of volcanic rocks? The response is clearlyyes as the new data agree with the results obtained on basalts(from Hawaii) and sedimentary rocks. We obtain therefore uni-versal trends.
(2) Is the cation exchange capacity (CEC) a proxy of the alteration ofthe volcanic rocks?We found that the CEC is directly proportional
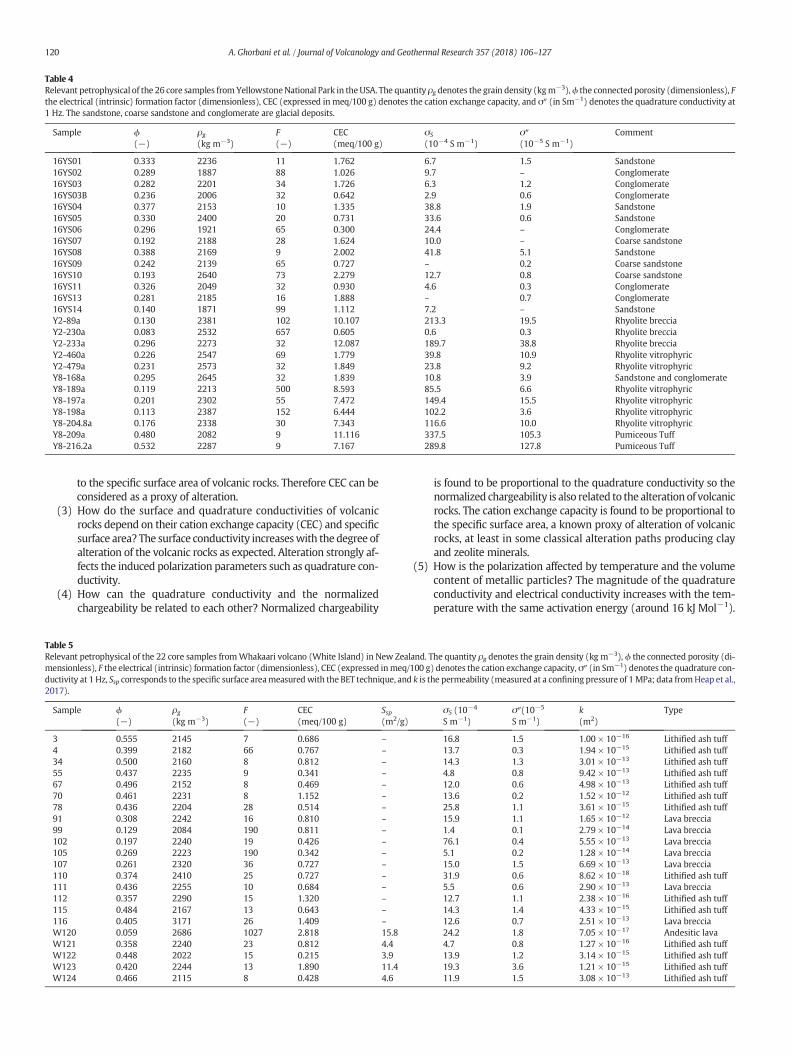
Table 4Relevant petrophysical of the 26 core samples fromYellowstoneNational Park in theUSA. The quantity ρg denotes the grain density (kgm−3),ϕ the connected porosity (dimensionless), Fthe electrical (intrinsic) formation factor (dimensionless), CEC (expressed in meq/100 g) denotes the cation exchange capacity, and σ″ (in Sm−1) denotes the quadrature conductivity at1 Hz. The sandstone, coarse sandstone and conglomerate are glacial deposits.
Sample ϕ(−)
ρg(kg m−3)
F(−)
CEC(meq/100 g)
σS
(10−4 S m−1)σ″(10−5 S m−1)
Comment
16YS01 0.333 2236 11 1.762 6.7 1.5 Sandstone16YS02 0.289 1887 88 1.026 9.7 – Conglomerate16YS03 0.282 2201 34 1.726 6.3 1.2 Conglomerate16YS03B 0.236 2006 32 0.642 2.9 0.6 Conglomerate16YS04 0.377 2153 10 1.335 38.8 1.9 Sandstone16YS05 0.330 2400 20 0.731 33.6 0.6 Sandstone16YS06 0.296 1921 65 0.300 24.4 – Conglomerate16YS07 0.192 2188 28 1.624 10.0 – Coarse sandstone16YS08 0.388 2169 9 2.002 41.8 5.1 Sandstone16YS09 0.242 2139 65 0.727 – 0.2 Coarse sandstone16YS10 0.193 2640 73 2.279 12.7 0.8 Coarse sandstone16YS11 0.326 2049 32 0.930 4.6 0.3 Conglomerate16YS13 0.281 2185 16 1.888 – 0.7 Conglomerate16YS14 0.140 1871 99 1.112 7.2 – SandstoneY2-89a 0.130 2381 102 10.107 213.3 19.5 Rhyolite brecciaY2-230a 0.083 2532 657 0.605 0.6 0.3 Rhyolite brecciaY2-233a 0.296 2273 32 12.087 189.7 38.8 Rhyolite brecciaY2-460a 0.226 2547 69 1.779 39.8 10.9 Rhyolite vitrophyricY2-479a 0.231 2573 32 1.849 23.8 9.2 Rhyolite vitrophyricY8-168a 0.295 2645 32 1.839 10.8 3.9 Sandstone and conglomerateY8-189a 0.119 2213 500 8.593 85.5 6.6 Rhyolite vitrophyricY8-197a 0.201 2302 55 7.472 149.4 15.5 Rhyolite vitrophyricY8-198a 0.113 2387 152 6.444 102.2 3.6 Rhyolite vitrophyricY8-204.8a 0.176 2338 30 7.343 116.6 10.0 Rhyolite vitrophyricY8-209a 0.480 2082 9 11.116 337.5 105.3 Pumiceous TuffY8-216.2a 0.532 2287 9 7.167 289.8 127.8 Pumiceous Tuff
120 A. Ghorbani et al. / Journal of Volcanology and Geothermal Research 357 (2018) 106–127
to the specific surface area of volcanic rocks. Therefore CEC can beconsidered as a proxy of alteration.
(3) How do the surface and quadrature conductivities of volcanicrocks depend on their cation exchange capacity (CEC) and specificsurface area? The surface conductivity increaseswith the degree ofalteration of the volcanic rocks as expected. Alteration strongly af-fects the induced polarization parameters such as quadrature con-ductivity.
(4) How can the quadrature conductivity and the normalizedchargeability be related to each other? Normalized chargeability
Table 5Relevant petrophysical of the 22 core samples fromWhakaari volcano (White Island) in New Zmensionless), F the electrical (intrinsic) formation factor (dimensionless), CEC (expressed inmeductivity at 1 Hz, Ssp corresponds to the specific surface areameasuredwith the BET technique, a2017).
Sample ϕ(−)
ρg(kg m−3)
F(−)
CEC(meq/100 g)
Ssp(m2/
3 0.555 2145 7 0.686 –4 0.399 2182 66 0.767 –34 0.500 2160 8 0.812 –55 0.437 2235 9 0.341 –67 0.496 2152 8 0.469 –70 0.461 2231 8 1.152 –78 0.436 2204 28 0.514 –91 0.308 2242 16 0.810 –99 0.129 2084 190 0.811 –102 0.197 2240 19 0.426 –105 0.269 2223 190 0.342 –107 0.261 2320 36 0.727 –110 0.374 2410 25 0.727 –111 0.436 2255 10 0.684 –112 0.357 2290 15 1.320 –115 0.484 2167 13 0.643 –116 0.405 3171 26 1.409 –W120 0.059 2686 1027 2.818 15.8W121 0.358 2240 23 0.812 4.4W122 0.448 2022 15 0.215 3.9W123 0.420 2244 13 1.890 11.4W124 0.466 2115 8 0.428 4.6
is found to be proportional to the quadrature conductivity so thenormalized chargeability is also related to the alteration of volcanicrocks. The cation exchange capacity is found to be proportional tothe specific surface area, a known proxy of alteration of volcanicrocks, at least in some classical alteration paths producing clayand zeolite minerals.
(5) How is the polarization affected by temperature and the volumecontent of metallic particles? The magnitude of the quadratureconductivity and electrical conductivity increases with the tem-perature with the same activation energy (around 16 kJ Mol−1).
ealand. The quantity ρg denotes the grain density (kg m−3), ϕ the connected porosity (di-q/100 g) denotes the cation exchange capacity, σ″ (in Sm−1) denotes the quadrature con-nd k is the permeability (measured at a confining pressure of 1MPa; data fromHeap et al.,
g)σS (10−4
S m−1)σ″(10−5
S m−1)k(m2)
Type
16.8 1.5 1.00 × 10⁻¹⁶ Lithified ash tuff13.7 0.3 1.94 × 10⁻¹⁵ Lithified ash tuff14.3 1.3 3.01 × 10⁻¹³ Lithified ash tuff4.8 0.8 9.42 × 10⁻¹³ Lithified ash tuff12.0 0.6 4.98 × 10⁻¹³ Lithified ash tuff13.6 0.2 1.52 × 10⁻¹² Lithified ash tuff25.8 1.1 3.61 × 10⁻¹⁵ Lithified ash tuff15.9 1.1 1.65 × 10⁻¹² Lava breccia1.4 0.1 2.79 × 10⁻¹⁴ Lava breccia76.1 0.4 5.55 × 10⁻¹³ Lava breccia5.1 0.2 1.28 × 10⁻¹⁴ Lava breccia15.0 1.5 6.69 × 10⁻¹³ Lava breccia31.9 0.6 8.62 × 10⁻¹⁸ Lithified ash tuff5.5 0.6 2.90 × 10⁻¹³ Lava breccia12.7 1.1 2.38 × 10⁻¹⁶ Lithified ash tuff14.3 1.4 4.33 × 10⁻¹⁵ Lithified ash tuff12.6 0.7 2.51 × 10⁻¹³ Lava breccia24.2 1.8 7.05 × 10⁻¹⁷ Andesitic lava4.7 0.8 1.27 × 10⁻¹⁶ Lithified ash tuff13.9 1.2 3.14 × 10⁻¹⁵ Lithified ash tuff19.3 3.6 1.21 × 10⁻¹⁵ Lithified ash tuff11.9 1.5 3.08 × 10⁻¹³ Lithified ash tuff
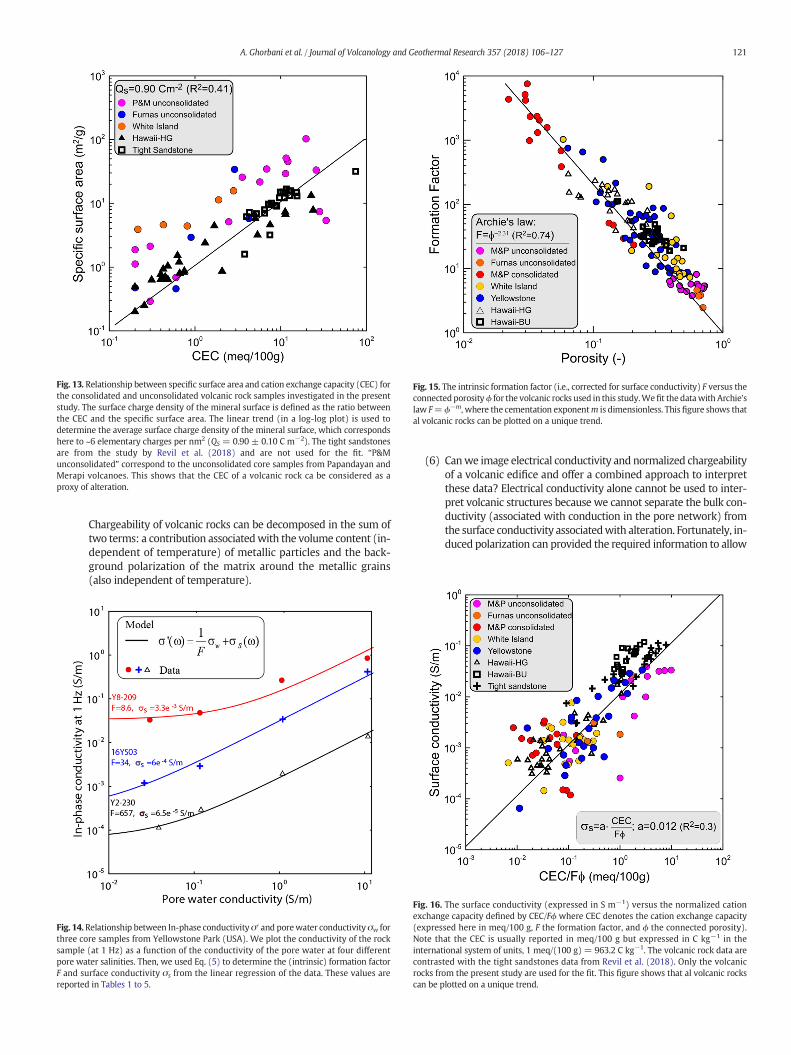
Fig. 13. Relationship between specific surface area and cation exchange capacity (CEC) forthe consolidated and unconsolidated volcanic rock samples investigated in the presentstudy. The surface charge density of the mineral surface is defined as the ratio betweenthe CEC and the specific surface area. The linear trend (in a log-log plot) is used todetermine the average surface charge density of the mineral surface, which correspondshere to ~6 elementary charges per nm2 (QS = 0.90 ± 0.10 C m−2). The tight sandstonesare from the study by Revil et al. (2018) and are not used for the fit. “P&Munconsolidated” correspond to the unconsolidated core samples from Papandayan andMerapi volcanoes. This shows that the CEC of a volcanic rock ca be considered as aproxy of alteration.
Fig. 15. The intrinsic formation factor (i.e., corrected for surface conductivity) F versus theconnectedporosityϕ for the volcanic rocks used in this study.Wefit the datawith Archie'slaw F= ϕ−m, where the cementation exponentm is dimensionless. Thisfigure shows thatal volcanic rocks can be plotted on a unique trend.
121A. Ghorbani et al. / Journal of Volcanology and Geothermal Research 357 (2018) 106–127
Chargeability of volcanic rocks can be decomposed in the sum oftwo terms: a contribution associatedwith the volume content (in-dependent of temperature) of metallic particles and the back-ground polarization of the matrix around the metallic grains(also independent of temperature).
Fig. 14. Relationship between In-phase conductivityσ′ and porewater conductivityσw forthree core samples from Yellowstone Park (USA). We plot the conductivity of the rocksample (at 1 Hz) as a function of the conductivity of the pore water at four differentpore water salinities. Then, we used Eq. (5) to determine the (intrinsic) formation factorF and surface conductivity σs from the linear regression of the data. These values arereported in Tables 1 to 5.
(6) Canwe image electrical conductivity and normalized chargeabilityof a volcanic edifice and offer a combined approach to interpretthese data? Electrical conductivity alone cannot be used to inter-pret volcanic structures because we cannot separate the bulk con-ductivity (associated with conduction in the pore network) fromthe surface conductivity associatedwith alteration. Fortunately, in-duced polarization can provided the required information to allow
Fig. 16. The surface conductivity (expressed in S m−1) versus the normalized cationexchange capacity defined by CEC/Fϕ where CEC denotes the cation exchange capacity(expressed here in meq/100 g, F the formation factor, and ϕ the connected porosity).Note that the CEC is usually reported in meq/100 g but expressed in C kg−1 in theinternational system of units, 1 meq/(100 g) = 963.2 C kg−1. The volcanic rock data arecontrasted with the tight sandstones data from Revil et al. (2018). Only the volcanicrocks from the present study are used for the fit. This figure shows that al volcanic rockscan be plotted on a unique trend.
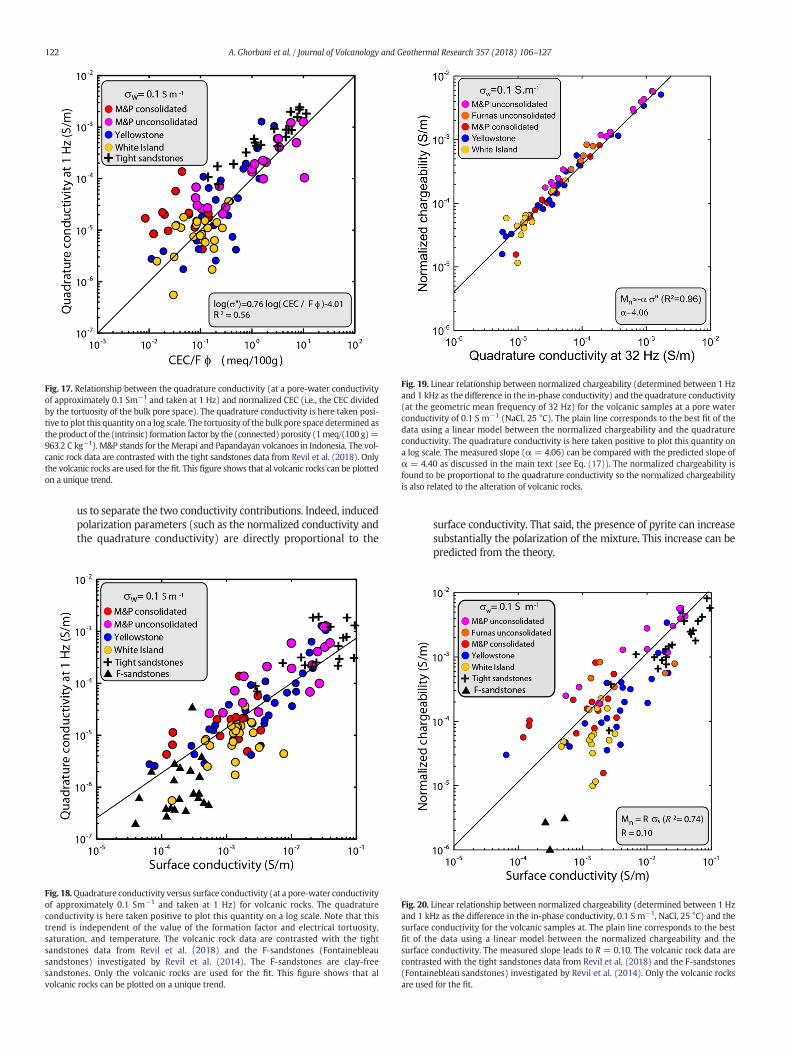
Fig. 19. Linear relationship between normalized chargeability (determined between 1 Hzand 1 kHz as the difference in the in-phase conductivity) and the quadrature conductivity(at the geometric mean frequency of 32 Hz) for the volcanic samples at a pore waterconductivity of 0.1 S m−1 (NaCl, 25 °C). The plain line corresponds to the best fit of thedata using a linear model between the normalized chargeability and the quadratureconductivity. The quadrature conductivity is here taken positive to plot this quantity ona log scale. The measured slope (α = 4.06) can be compared with the predicted slope ofα = 4.40 as discussed in the main text (see Eq. (17)). The normalized chargeability isfound to be proportional to the quadrature conductivity so the normalized chargeabilityis also related to the alteration of volcanic rocks.
Fig. 17. Relationship between the quadrature conductivity (at a pore-water conductivityof approximately 0.1 Sm−1 and taken at 1 Hz) and normalized CEC (i.e., the CEC dividedby the tortuosity of the bulk pore space). The quadrature conductivity is here taken posi-tive to plot this quantity on a log scale. The tortuosity of the bulk pore space determined asthe product of the (intrinsic) formation factor by the (connected) porosity (1meq/(100 g)=963.2 C kg−1). M&P stands for the Merapi and Papandayan volcanoes in Indonesia. The vol-canic rock data are contrasted with the tight sandstones data from Revil et al. (2018). Onlythe volcanic rocks are used for the fit. This figure shows that al volcanic rocks can be plottedon a unique trend.
122 A. Ghorbani et al. / Journal of Volcanology and Geothermal Research 357 (2018) 106–127
us to separate the two conductivity contributions. Indeed, inducedpolarization parameters (such as the normalized conductivity andthe quadrature conductivity) are directly proportional to the
Fig. 18.Quadrature conductivity versus surface conductivity (at a pore-water conductivityof approximately 0.1 Sm−1 and taken at 1 Hz) for volcanic rocks. The quadratureconductivity is here taken positive to plot this quantity on a log scale. Note that thistrend is independent of the value of the formation factor and electrical tortuosity,saturation, and temperature. The volcanic rock data are contrasted with the tightsandstones data from Revil et al. (2018) and the F-sandstones (Fontainebleausandstones) investigated by Revil et al. (2014). The F-sandstones are clay-freesandstones. Only the volcanic rocks are used for the fit. This figure shows that alvolcanic rocks can be plotted on a unique trend.
surface conductivity. That said, the presence of pyrite can increasesubstantially the polarization of the mixture. This increase can bepredicted from the theory.
Fig. 20. Linear relationship between normalized chargeability (determined between 1 Hzand 1 kHz as the difference in the in-phase conductivity, 0.1 S m−1, NaCl, 25 °C) and thesurface conductivity for the volcanic samples at. The plain line corresponds to the bestfit of the data using a linear model between the normalized chargeability and thesurface conductivity. The measured slope leads to R = 0.10. The volcanic rock data arecontrasted with the tight sandstones data from Revil et al. (2018) and the F-sandstones(Fontainebleau sandstones) investigated by Revil et al. (2014). Only the volcanic rocksare used for the fit.
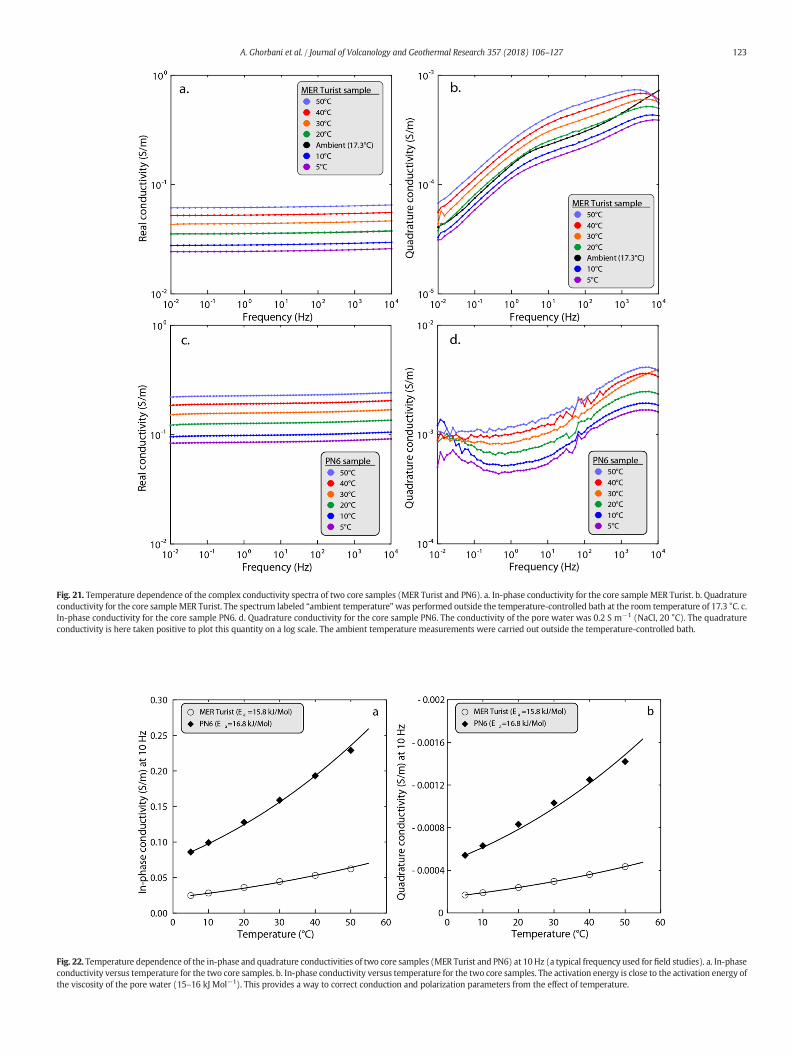
Fig. 21. Temperature dependence of the complex conductivity spectra of two core samples (MER Turist and PN6). a. In-phase conductivity for the core sample MER Turist. b. Quadratureconductivity for the core sample MER Turist. The spectrum labeled “ambient temperature”was performed outside the temperature-controlled bath at the room temperature of 17.3 °C. c.In-phase conductivity for the core sample PN6. d. Quadrature conductivity for the core sample PN6. The conductivity of the pore water was 0.2 S m−1 (NaCl, 20 °C). The quadratureconductivity is here taken positive to plot this quantity on a log scale. The ambient temperature measurements were carried out outside the temperature-controlled bath.
Fig. 22. Temperature dependence of the in-phase and quadrature conductivities of two core samples (MER Turist and PN6) at 10Hz (a typical frequency used for field studies). a. In-phaseconductivity versus temperature for the two core samples. b. In-phase conductivity versus temperature for the two core samples. The activation energy is close to the activation energy ofthe viscosity of the pore water (15–16 kJ Mol−1). This provides a way to correct conduction and polarization parameters from the effect of temperature.
123A. Ghorbani et al. / Journal of Volcanology and Geothermal Research 357 (2018) 106–127
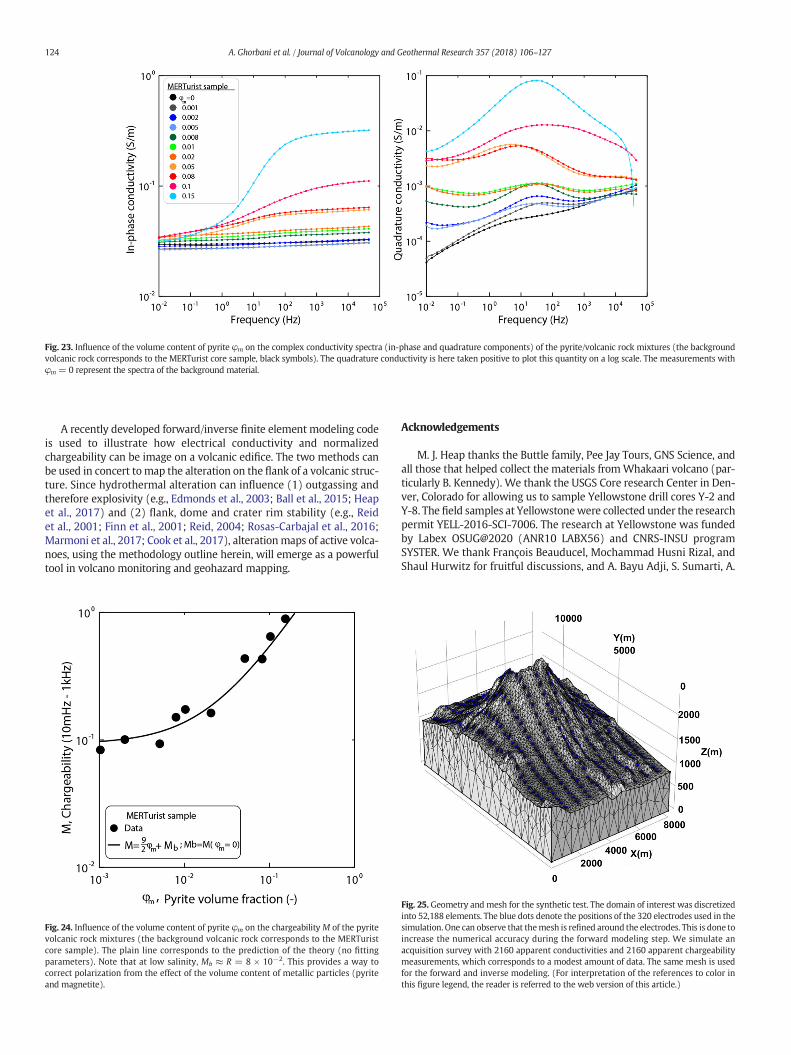
Fig. 23. Influence of the volume content of pyrite φm on the complex conductivity spectra (in-phase and quadrature components) of the pyrite/volcanic rock mixtures (the backgroundvolcanic rock corresponds to the MERTurist core sample, black symbols). The quadrature conductivity is here taken positive to plot this quantity on a log scale. The measurements withφm = 0 represent the spectra of the background material.
124 A. Ghorbani et al. / Journal of Volcanology and Geothermal Research 357 (2018) 106–127
A recently developed forward/inverse finite element modeling codeis used to illustrate how electrical conductivity and normalizedchargeability can be image on a volcanic edifice. The two methods canbe used in concert tomap the alteration on the flank of a volcanic struc-ture. Since hydrothermal alteration can influence (1) outgassing andtherefore explosivity (e.g., Edmonds et al., 2003; Ball et al., 2015; Heapet al., 2017) and (2) flank, dome and crater rim stability (e.g., Reidet al., 2001; Finn et al., 2001; Reid, 2004; Rosas-Carbajal et al., 2016;Marmoni et al., 2017; Cook et al., 2017), alterationmaps of active volca-noes, using the methodology outline herein, will emerge as a powerfultool in volcano monitoring and geohazard mapping.
Fig. 24. Influence of the volume content of pyrite φm on the chargeability M of the pyritevolcanic rock mixtures (the background volcanic rock corresponds to the MERTuristcore sample). The plain line corresponds to the prediction of the theory (no fittingparameters). Note that at low salinity, Mb ≈ R = 8 × 10⁻². This provides a way tocorrect polarization from the effect of the volume content of metallic particles (pyriteand magnetite).
Acknowledgements
M. J. Heap thanks the Buttle family, Pee Jay Tours, GNS Science, andall those that helped collect the materials fromWhakaari volcano (par-ticularly B. Kennedy). We thank the USGS Core research Center in Den-ver, Colorado for allowing us to sample Yellowstone drill cores Y-2 andY-8. The field samples at Yellowstonewere collected under the researchpermit YELL-2016-SCI-7006. The research at Yellowstone was fundedby Labex OSUG@2020 (ANR10 LABX56) and CNRS-INSU programSYSTER. We thank François Beauducel, Mochammad Husni Rizal, andShaul Hurwitz for fruitful discussions, and A. Bayu Adji, S. Sumarti, A.
Fig. 25. Geometry and mesh for the synthetic test. The domain of interest was discretizedinto 52,188 elements. The blue dots denote the positions of the 320 electrodes used in thesimulation. One can observe that themesh is refined around the electrodes. This is done toincrease the numerical accuracy during the forward modeling step. We simulate anacquisition survey with 2160 apparent conductivities and 2160 apparent chargeabilitymeasurements, which corresponds to a modest amount of data. The same mesh is usedfor the forward and inverse modeling. (For interpretation of the references to color inthis figure legend, the reader is referred to the web version of this article.)
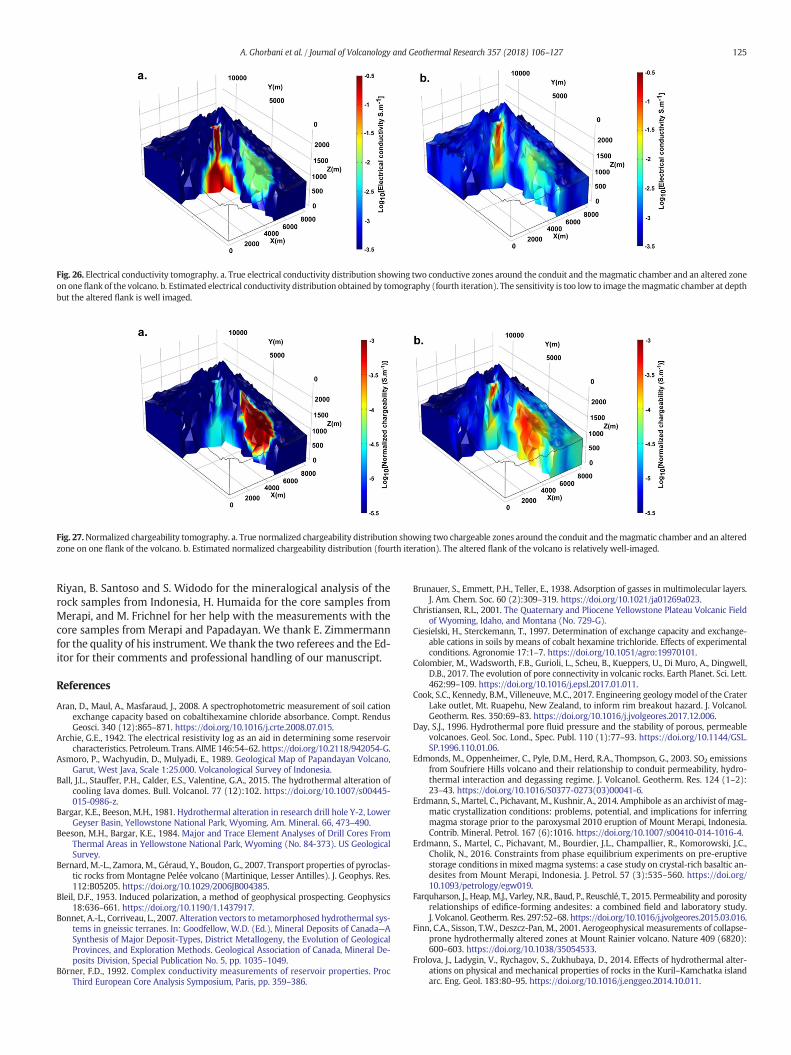
Fig. 26. Electrical conductivity tomography. a. True electrical conductivity distribution showing two conductive zones around the conduit and themagmatic chamber and an altered zoneon one flank of the volcano. b. Estimated electrical conductivity distribution obtained by tomography (fourth iteration). The sensitivity is too low to image themagmatic chamber at depthbut the altered flank is well imaged.
Fig. 27.Normalized chargeability tomography. a. True normalized chargeability distribution showing two chargeable zones around the conduit and themagmatic chamber and an alteredzone on one flank of the volcano. b. Estimated normalized chargeability distribution (fourth iteration). The altered flank of the volcano is relatively well-imaged.
125A. Ghorbani et al. / Journal of Volcanology and Geothermal Research 357 (2018) 106–127
Riyan, B. Santoso and S. Widodo for the mineralogical analysis of therock samples from Indonesia, H. Humaida for the core samples fromMerapi, and M. Frichnel for her help with the measurements with thecore samples from Merapi and Papadayan. We thank E. Zimmermannfor the quality of his instrument. We thank the two referees and the Ed-itor for their comments and professional handling of our manuscript.
References
Aran, D., Maul, A., Masfaraud, J., 2008. A spectrophotometric measurement of soil cationexchange capacity based on cobaltihexamine chloride absorbance. Compt. RendusGeosci. 340 (12):865–871. https://doi.org/10.1016/j.crte.2008.07.015.
Archie, G.E., 1942. The electrical resistivity log as an aid in determining some reservoircharacteristics. Petroleum. Trans. AIME 146:54–62. https://doi.org/10.2118/942054-G.
Asmoro, P., Wachyudin, D., Mulyadi, E., 1989. Geological Map of Papandayan Volcano,Garut, West Java, Scale 1:25.000. Volcanological Survey of Indonesia.
Ball, J.L., Stauffer, P.H., Calder, E.S., Valentine, G.A., 2015. The hydrothermal alteration ofcooling lava domes. Bull. Volcanol. 77 (12):102. https://doi.org/10.1007/s00445-015-0986-z.
Bargar, K.E., Beeson, M.H., 1981. Hydrothermal alteration in research drill hole Y-2, LowerGeyser Basin, Yellowstone National Park, Wyoming. Am. Mineral. 66, 473–490.
Beeson, M.H., Bargar, K.E., 1984. Major and Trace Element Analyses of Drill Cores FromThermal Areas in Yellowstone National Park, Wyoming (No. 84-373). US GeologicalSurvey.
Bernard, M.-L., Zamora, M., Géraud, Y., Boudon, G., 2007. Transport properties of pyroclas-tic rocks from Montagne Pelée volcano (Martinique, Lesser Antilles). J. Geophys. Res.112:B05205. https://doi.org/10.1029/2006JB004385.
Bleil, D.F., 1953. Induced polarization, a method of geophysical prospecting. Geophysics18:636–661. https://doi.org/10.1190/1.1437917.
Bonnet, A.-L., Corriveau, L., 2007. Alteration vectors to metamorphosed hydrothermal sys-tems in gneissic terranes. In: Goodfellow, W.D. (Ed.), Mineral Deposits of Canada—ASynthesis of Major Deposit-Types, District Metallogeny, the Evolution of GeologicalProvinces, and Exploration Methods. Geological Association of Canada, Mineral De-posits Division, Special Publication No. 5, pp. 1035–1049.
Börner, F.D., 1992. Complex conductivity measurements of reservoir properties. ProcThird European Core Analysis Symposium, Paris, pp. 359–386.
Brunauer, S., Emmett, P.H., Teller, E., 1938. Adsorption of gasses in multimolecular layers.J. Am. Chem. Soc. 60 (2):309–319. https://doi.org/10.1021/ja01269a023.
Christiansen, R.L., 2001. The Quaternary and Pliocene Yellowstone Plateau Volcanic Fieldof Wyoming, Idaho, and Montana (No. 729-G).
Ciesielski, H., Sterckemann, T., 1997. Determination of exchange capacity and exchange-able cations in soils by means of cobalt hexamine trichloride. Effects of experimentalconditions. Agronomie 17:1–7. https://doi.org/10.1051/agro:19970101.
Colombier, M., Wadsworth, F.B., Gurioli, L., Scheu, B., Kueppers, U., Di Muro, A., Dingwell,D.B., 2017. The evolution of pore connectivity in volcanic rocks. Earth Planet. Sci. Lett.462:99–109. https://doi.org/10.1016/j.epsl.2017.01.011.
Cook, S.C., Kennedy, B.M., Villeneuve, M.C., 2017. Engineering geologymodel of the CraterLake outlet, Mt. Ruapehu, New Zealand, to inform rim breakout hazard. J. Volcanol.Geotherm. Res. 350:69–83. https://doi.org/10.1016/j.jvolgeores.2017.12.006.
Day, S.J., 1996. Hydrothermal pore fluid pressure and the stability of porous, permeablevolcanoes. Geol. Soc. Lond., Spec. Publ. 110 (1):77–93. https://doi.org/10.1144/GSL.SP.1996.110.01.06.
Edmonds, M., Oppenheimer, C., Pyle, D.M., Herd, R.A., Thompson, G., 2003. SO2 emissionsfrom Soufriere Hills volcano and their relationship to conduit permeability, hydro-thermal interaction and degassing regime. J. Volcanol. Geotherm. Res. 124 (1–2):23–43. https://doi.org/10.1016/S0377-0273(03)00041-6.
Erdmann, S., Martel, C., Pichavant, M., Kushnir, A., 2014. Amphibole as an archivist ofmag-matic crystallization conditions: problems, potential, and implications for inferringmagma storage prior to the paroxysmal 2010 eruption of Mount Merapi, Indonesia.Contrib. Mineral. Petrol. 167 (6):1016. https://doi.org/10.1007/s00410-014-1016-4.
Erdmann, S., Martel, C., Pichavant, M., Bourdier, J.L., Champallier, R., Komorowski, J.C.,Cholik, N., 2016. Constraints from phase equilibrium experiments on pre-eruptivestorage conditions in mixedmagma systems: a case study on crystal-rich basaltic an-desites from Mount Merapi, Indonesia. J. Petrol. 57 (3):535–560. https://doi.org/10.1093/petrology/egw019.
Farquharson, J., Heap, M.J., Varley, N.R., Baud, P., Reuschlé, T., 2015. Permeability and porosityrelationships of edifice-forming andesites: a combined field and laboratory study.J. Volcanol. Geotherm. Res. 297:52–68. https://doi.org/10.1016/j.jvolgeores.2015.03.016.
Finn, C.A., Sisson, T.W., Deszcz-Pan, M., 2001. Aerogeophysical measurements of collapse-prone hydrothermally altered zones at Mount Rainier volcano. Nature 409 (6820):600–603. https://doi.org/10.1038/35054533.
Frolova, J., Ladygin, V., Rychagov, S., Zukhubaya, D., 2014. Effects of hydrothermal alter-ations on physical and mechanical properties of rocks in the Kuril–Kamchatka islandarc. Eng. Geol. 183:80–95. https://doi.org/10.1016/j.enggeo.2014.10.011.
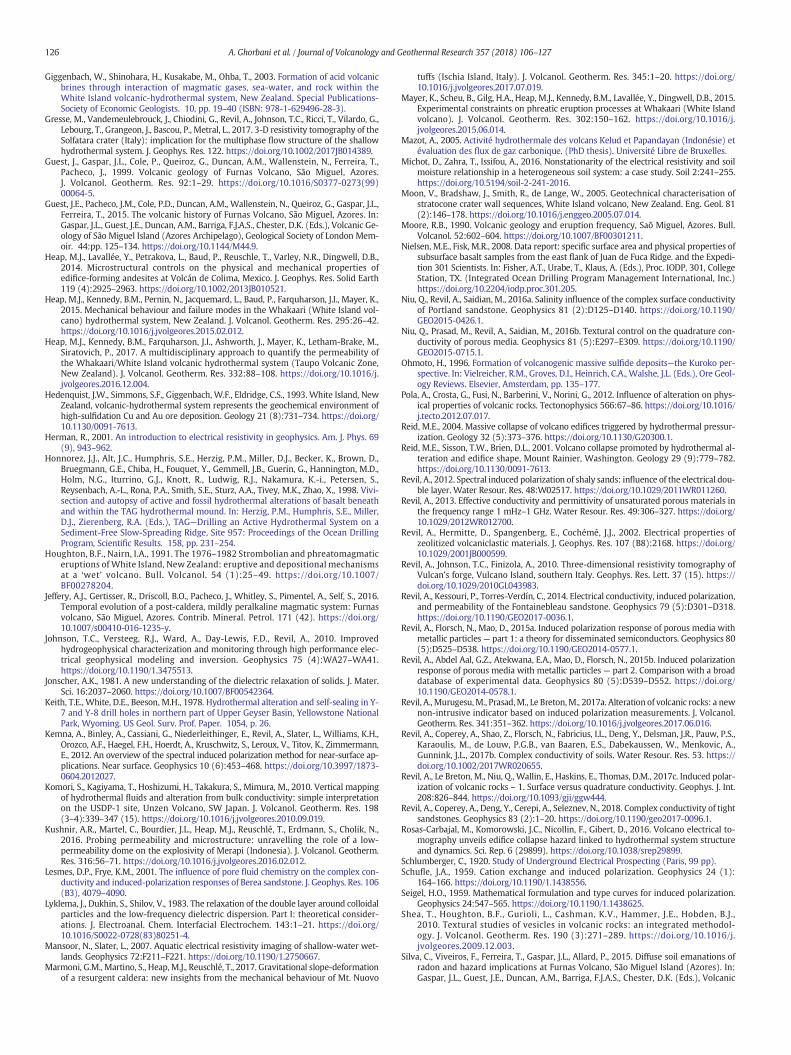
126 A. Ghorbani et al. / Journal of Volcanology and Geothermal Research 357 (2018) 106–127
Giggenbach, W., Shinohara, H., Kusakabe, M., Ohba, T., 2003. Formation of acid volcanicbrines through interaction of magmatic gases, sea-water, and rock within theWhite Island volcanic-hydrothermal system, New Zealand. Special Publications-Society of Economic Geologists. 10, pp. 19–40 (ISBN: 978-1-629496-28-3).
Gresse, M., Vandemeulebrouck, J., Chiodini, G., Revil, A., Johnson, T.C., Ricci, T., Vilardo, G.,Lebourg, T., Grangeon, J., Bascou, P., Metral, L., 2017. 3-D resistivity tomography of theSolfatara crater (Italy): implication for the multiphase flow structure of the shallowhydrothermal system. J. Geophys. Res. 122. https://doi.org/10.1002/2017JB014389.
Guest, J., Gaspar, J.L., Cole, P., Queiroz, G., Duncan, A.M., Wallenstein, N., Ferreira, T.,Pacheco, J., 1999. Volcanic geology of Furnas Volcano, São Miguel, Azores.J. Volcanol. Geotherm. Res. 92:1–29. https://doi.org/10.1016/S0377-0273(99)00064-5.
Guest, J.E., Pacheco, J.M., Cole, P.D., Duncan, A.M., Wallenstein, N., Queiroz, G., Gaspar, J.L.,Ferreira, T., 2015. The volcanic history of Furnas Volcano, São Miguel, Azores. In:Gaspar, J.L., Guest, J.E., Duncan, A.M., Barriga, F.J.A.S., Chester, D.K. (Eds.), Volcanic Ge-ology of São Miguel Island (Azores Archipelago), Geological Society of London Mem-oir. 44:pp. 125–134. https://doi.org/10.1144/M44.9.
Heap, M.J., Lavallée, Y., Petrakova, L., Baud, P., Reuschle, T., Varley, N.R., Dingwell, D.B.,2014. Microstructural controls on the physical and mechanical properties ofedifice-forming andesites at Volcán de Colima, Mexico. J. Geophys. Res. Solid Earth119 (4):2925–2963. https://doi.org/10.1002/2013JB010521.
Heap, M.J., Kennedy, B.M., Pernin, N., Jacquemard, L., Baud, P., Farquharson, J.I., Mayer, K.,2015. Mechanical behaviour and failure modes in the Whakaari (White Island vol-cano) hydrothermal system, New Zealand. J. Volcanol. Geotherm. Res. 295:26–42.https://doi.org/10.1016/j.jvolgeores.2015.02.012.
Heap, M.J., Kennedy, B.M., Farquharson, J.I., Ashworth, J., Mayer, K., Letham-Brake, M.,Siratovich, P., 2017. A multidisciplinary approach to quantify the permeability ofthe Whakaari/White Island volcanic hydrothermal system (Taupo Volcanic Zone,New Zealand). J. Volcanol. Geotherm. Res. 332:88–108. https://doi.org/10.1016/j.jvolgeores.2016.12.004.
Hedenquist, J.W., Simmons, S.F., Giggenbach, W.F., Eldridge, C.S., 1993. White Island, NewZealand, volcanic-hydrothermal system represents the geochemical environment ofhigh-sulfidation Cu and Au ore deposition. Geology 21 (8):731–734. https://doi.org/10.1130/0091-7613.
Herman, R., 2001. An introduction to electrical resistivity in geophysics. Am. J. Phys. 69(9), 943–962.
Honnorez, J.J., Alt, J.C., Humphris, S.E., Herzig, P.M., Miller, D.J., Becker, K., Brown, D.,Bruegmann, G.E., Chiba, H., Fouquet, Y., Gemmell, J.B., Guerin, G., Hannington, M.D.,Holm, N.G., Iturrino, G.J., Knott, R., Ludwig, R.J., Nakamura, K.-i., Petersen, S.,Reysenbach, A.-L., Rona, P.A., Smith, S.E., Sturz, A.A., Tivey, M.K., Zhao, X., 1998. Vivi-section and autopsy of active and fossil hydrothermal alterations of basalt beneathand within the TAG hydrothermal mound. In: Herzig, P.M., Humphris, S.E., Miller,D.J., Zierenberg, R.A. (Eds.), TAG—Drilling an Active Hydrothermal System on aSediment-Free Slow-Spreading Ridge, Site 957: Proceedings of the Ocean DrillingProgram, Scientific Results. 158, pp. 231–254.
Houghton, B.F., Nairn, I.A., 1991. The 1976–1982 Strombolian and phreatomagmaticeruptions of White Island, New Zealand: eruptive and depositional mechanismsat a ‘wet’ volcano. Bull. Volcanol. 54 (1):25–49. https://doi.org/10.1007/BF00278204.
Jeffery, A.J., Gertisser, R., Driscoll, B.O., Pacheco, J., Whitley, S., Pimentel, A., Self, S., 2016.Temporal evolution of a post-caldera, mildly peralkaline magmatic system: Furnasvolcano, São Miguel, Azores. Contrib. Mineral. Petrol. 171 (42). https://doi.org/10.1007/s00410-016-1235-y.
Johnson, T.C., Versteeg, R.J., Ward, A., Day-Lewis, F.D., Revil, A., 2010. Improvedhydrogeophysical characterization and monitoring through high performance elec-trical geophysical modeling and inversion. Geophysics 75 (4):WA27–WA41.https://doi.org/10.1190/1.3475513.
Jonscher, A.K., 1981. A new understanding of the dielectric relaxation of solids. J. Mater.Sci. 16:2037–2060. https://doi.org/10.1007/BF00542364.
Keith, T.E., White, D.E., Beeson, M.H., 1978. Hydrothermal alteration and self-sealing in Y-7 and Y-8 drill holes in northern part of Upper Geyser Basin, Yellowstone NationalPark, Wyoming. US Geol. Surv. Prof. Paper. 1054, p. 26.
Kemna, A., Binley, A., Cassiani, G., Niederleithinger, E., Revil, A., Slater, L., Williams, K.H.,Orozco, A.F., Haegel, F.H., Hoerdt, A., Kruschwitz, S., Leroux, V., Titov, K., Zimmermann,E., 2012. An overview of the spectral induced polarization method for near-surface ap-plications. Near surface. Geophysics 10 (6):453–468. https://doi.org/10.3997/1873-0604.2012027.
Komori, S., Kagiyama, T., Hoshizumi, H., Takakura, S., Mimura, M., 2010. Vertical mappingof hydrothermal fluids and alteration from bulk conductivity: simple interpretationon the USDP-1 site, Unzen Volcano, SW Japan. J. Volcanol. Geotherm. Res. 198(3–4):339–347 (15). https://doi.org/10.1016/j.jvolgeores.2010.09.019.
Kushnir, A.R., Martel, C., Bourdier, J.L., Heap, M.J., Reuschlé, T., Erdmann, S., Cholik, N.,2016. Probing permeability and microstructure: unravelling the role of a low-permeability dome on the explosivity of Merapi (Indonesia). J. Volcanol. Geotherm.Res. 316:56–71. https://doi.org/10.1016/j.jvolgeores.2016.02.012.
Lesmes, D.P., Frye, K.M., 2001. The influence of pore fluid chemistry on the complex con-ductivity and induced-polarization responses of Berea sandstone. J. Geophys. Res. 106(B3), 4079–4090.
Lyklema, J., Dukhin, S., Shilov, V., 1983. The relaxation of the double layer around colloidalparticles and the low-frequency dielectric dispersion. Part I: theoretical consider-ations. J. Electroanal. Chem. Interfacial Electrochem. 143:1–21. https://doi.org/10.1016/S0022-0728(83)80251-4.
Mansoor, N., Slater, L., 2007. Aquatic electrical resistivity imaging of shallow-water wet-lands. Geophysics 72:F211–F221. https://doi.org/10.1190/1.2750667.
Marmoni, G.M., Martino, S., Heap,M.J., Reuschlé, T., 2017. Gravitational slope-deformationof a resurgent caldera: new insights from the mechanical behaviour of Mt. Nuovo
tuffs (Ischia Island, Italy). J. Volcanol. Geotherm. Res. 345:1–20. https://doi.org/10.1016/j.jvolgeores.2017.07.019.
Mayer, K., Scheu, B., Gilg, H.A., Heap, M.J., Kennedy, B.M., Lavallée, Y., Dingwell, D.B., 2015.Experimental constraints on phreatic eruption processes at Whakaari (White Islandvolcano). J. Volcanol. Geotherm. Res. 302:150–162. https://doi.org/10.1016/j.jvolgeores.2015.06.014.
Mazot, A., 2005. Activité hydrothermale des volcans Kelud et Papandayan (Indonésie) etévaluation des flux de gaz carbonique. (PhD thesis). Université Libre de Bruxelles.
Michot, D., Zahra, T., Issifou, A., 2016. Nonstationarity of the electrical resistivity and soilmoisture relationship in a heterogeneous soil system: a case study. Soil 2:241–255.https://doi.org/10.5194/soil-2-241-2016.
Moon, V., Bradshaw, J., Smith, R., de Lange, W., 2005. Geotechnical characterisation ofstratocone crater wall sequences, White Island volcano, New Zealand. Eng. Geol. 81(2):146–178. https://doi.org/10.1016/j.enggeo.2005.07.014.
Moore, R.B., 1990. Volcanic geology and eruption frequency, Saõ Miguel, Azores. Bull.Volcanol. 52:602–604. https://doi.org/10.1007/BF00301211.
Nielsen, M.E., Fisk, M.R., 2008. Data report: specific surface area and physical properties ofsubsurface basalt samples from the east flank of Juan de Fuca Ridge. and the Expedi-tion 301 Scientists. In: Fisher, A.T., Urabe, T., Klaus, A. (Eds.), Proc. IODP, 301, CollegeStation, TX. (Integrated Ocean Drilling Program Management International, Inc.)https://doi.org/10.2204/iodp.proc.301.205.
Niu, Q., Revil, A., Saidian, M., 2016a. Salinity influence of the complex surface conductivityof Portland sandstone. Geophysics 81 (2):D125–D140. https://doi.org/10.1190/GEO2015-0426.1.
Niu, Q., Prasad, M., Revil, A., Saidian, M., 2016b. Textural control on the quadrature con-ductivity of porous media. Geophysics 81 (5):E297–E309. https://doi.org/10.1190/GEO2015-0715.1.
Ohmoto, H., 1996. Formation of volcanogenic massive sulfide deposits—the Kuroko per-spective. In: Vielreicher, R.M., Groves, D.I., Heinrich, C.A., Walshe, J.L. (Eds.), Ore Geol-ogy Reviews. Elsevier, Amsterdam, pp. 135–177.
Pola, A., Crosta, G., Fusi, N., Barberini, V., Norini, G., 2012. Influence of alteration on phys-ical properties of volcanic rocks. Tectonophysics 566:67–86. https://doi.org/10.1016/j.tecto.2012.07.017.
Reid, M.E., 2004. Massive collapse of volcano edifices triggered by hydrothermal pressur-ization. Geology 32 (5):373–376. https://doi.org/10.1130/G20300.1.
Reid, M.E., Sisson, T.W., Brien, D.L., 2001. Volcano collapse promoted by hydrothermal al-teration and edifice shape, Mount Rainier, Washington. Geology 29 (9):779–782.https://doi.org/10.1130/0091-7613.
Revil, A., 2012. Spectral induced polarization of shaly sands: influence of the electrical dou-ble layer. Water Resour. Res. 48:W02517. https://doi.org/10.1029/2011WR011260.
Revil, A., 2013. Effective conductivity and permittivity of unsaturated porous materials inthe frequency range 1 mHz–1 GHz. Water Resour. Res. 49:306–327. https://doi.org/10.1029/2012WR012700.
Revil, A., Hermitte, D., Spangenberg, E., Cochémé, J.J., 2002. Electrical properties ofzeolitized volcaniclastic materials. J. Geophys. Res. 107 (B8):2168. https://doi.org/10.1029/2001JB000599.
Revil, A., Johnson, T.C., Finizola, A., 2010. Three-dimensional resistivity tomography ofVulcan's forge, Vulcano Island, southern Italy. Geophys. Res. Lett. 37 (15). https://doi.org/10.1029/2010GL043983.
Revil, A., Kessouri, P., Torres-Verdín, C., 2014. Electrical conductivity, induced polarization,and permeability of the Fontainebleau sandstone. Geophysics 79 (5):D301–D318.https://doi.org/10.1190/GEO2017-0036.1.
Revil, A., Florsch, N., Mao, D., 2015a. Induced polarization response of porous media withmetallic particles— part 1: a theory for disseminated semiconductors. Geophysics 80(5):D525–D538. https://doi.org/10.1190/GEO2014-0577.1.
Revil, A., Abdel Aal, G.Z., Atekwana, E.A., Mao, D., Florsch, N., 2015b. Induced polarizationresponse of porous media with metallic particles — part 2. Comparison with a broaddatabase of experimental data. Geophysics 80 (5):D539–D552. https://doi.org/10.1190/GEO2014-0578.1.
Revil, A., Murugesu,M., Prasad,M., Le Breton,M., 2017a. Alteration of volcanic rocks: a newnon-intrusive indicator based on induced polarization measurements. J. Volcanol.Geotherm. Res. 341:351–362. https://doi.org/10.1016/j.jvolgeores.2017.06.016.
Revil, A., Coperey, A., Shao, Z., Florsch, N., Fabricius, I.L., Deng, Y., Delsman, J.R., Pauw, P.S.,Karaoulis, M., de Louw, P.G.B., van Baaren, E.S., Dabekaussen, W., Menkovic, A.,Gunnink, J.L., 2017b. Complex conductivity of soils. Water Resour. Res. 53. https://doi.org/10.1002/2017WR020655.
Revil, A., Le Breton, M., Niu, Q., Wallin, E., Haskins, E., Thomas, D.M., 2017c. Induced polar-ization of volcanic rocks – 1. Surface versus quadrature conductivity. Geophys. J. Int.208:826–844. https://doi.org/10.1093/gji/ggw444.
Revil, A., Coperey, A., Deng, Y., Cerepi, A., Seleznev, N., 2018. Complex conductivity of tightsandstones. Geophysics 83 (2):1–20. https://doi.org/10.1190/geo2017-0096.1.
Rosas-Carbajal, M., Komorowski, J.C., Nicollin, F., Gibert, D., 2016. Volcano electrical to-mography unveils edifice collapse hazard linked to hydrothermal system structureand dynamics. Sci. Rep. 6 (29899). https://doi.org/10.1038/srep29899.
Schlumberger, C., 1920. Study of Underground Electrical Prospecting (Paris, 99 pp).Schufle, J.A., 1959. Cation exchange and induced polarization. Geophysics 24 (1):
164–166. https://doi.org/10.1190/1.1438556.Seigel, H.O., 1959. Mathematical formulation and type curves for induced polarization.
Geophysics 24:547–565. https://doi.org/10.1190/1.1438625.Shea, T., Houghton, B.F., Gurioli, L., Cashman, K.V., Hammer, J.E., Hobden, B.J.,
2010. Textural studies of vesicles in volcanic rocks: an integrated methodol-ogy. J. Volcanol. Geotherm. Res. 190 (3):271–289. https://doi.org/10.1016/j.jvolgeores.2009.12.003.
Silva, C., Viveiros, F., Ferreira, T., Gaspar, J.L., Allard, P., 2015. Diffuse soil emanations ofradon and hazard implications at Furnas Volcano, São Miguel Island (Azores). In:Gaspar, J.L., Guest, J.E., Duncan, A.M., Barriga, F.J.A.S., Chester, D.K. (Eds.), Volcanic

127A. Ghorbani et al. / Journal of Volcanology and Geothermal Research 357 (2018) 106–127
Geology of S. Miguel Island (Azores archipelago). 44. Geological Society, London:pp. 197–211 (Memoirs). https://doi.org/10.1144/M44.15.
Slater, L., Glaser, D., 2003. Controls on induced-polarization in sandy unconsolidated sed-iments and application to aquifer characterization. Geophysics 68:1547–1558.https://doi.org/10.1190/1.1620628.
Soueid Ahmed, A., Revil, A., Byrdina, S., Coperey, A., Gailler, L., Grobbe, N., Viveiros, F.,Silva, C., Jougnot, D., Ghorbani, A., Hogg, C., Kiyan, D., Rath, V., Heap, M.J., Grandis,H., Humaida, H., 2018a. 3D electrical conductivity tomography of volcanoes. (inpress). J. Volcanol. Geotherm. Res. https://doi.org/10.1016/j.jvolgeores.2018.03.017.
Soueid Ahmed, A., Revil, A., Jardani, A., Chen, R., 2018b. Geostatistical inversion of inducedpolarization data. Geophysics 83 (3):1–18. https://doi.org/10.1190/GEO2017-0232.1.
Surono Jousset, P., Pallister, J., Boichu, M., Buongiorno, M.F., Budisantoso, A., Costa, F.,Humaida, H., 2012. The 2010 explosive eruption of Java's Merapi volcano-a ‘100-year’ event. J. Volcanol. Geotherm. Res. 241:121–135. https://doi.org/10.1016/j.jvolgeores.2012.06.018.
Tikhonov, A.N., Arsenin, V.Y., 1977. Solutions of Ill-Posed Problems. John Wiley & Sons,Washington https://doi.org/10.1137/1021044.
Usui, Y., Ogawa, Y., Aizawa, K., Hashimoto, T., Koyama, T., Kagiyama, T., 2016. Three-dimensional resistivity structure of Asama Volcano revealed by data-spacemagnetotelluric inversion using unstructured tetrahedral elements. Geophys. J. Int.208 (3):1359–1372. https://doi.org/10.1093/gji/ggw459.
Van Voorhis, G.D., Nelson, P.H., Drake, T.L., 1973. Complex resistivity spectra of porphyrycopper mineralization. Geophysics 38 (1):49–60. https://doi.org/10.1190/1.1440333.
Vinegar, H.J., Waxman, M.H., 1984. Induced polarization of shaly sands. Geophysics 49:1267–1287. https://doi.org/10.1190/1.1441755.
Viveiros, F., Cardellini, C., Ferreira, T., Caliro, S., Chiodini, G., Silva, C., 2010. Soil CO2 emis-sions at Furnas volcano, São Miguel Island, Azores archipelago: volcano monitoringperspectives, geomorphologic studies, and land use planning application. J. Geophys.Res. 115:B12208. https://doi.org/10.1029/2010JB007555.
Voight, B., Constantine, E.K., Siswowidjoyo, S., Torley, R., 2000. Historical eruptions ofMerapi volcano, central Java, Indonesia, 1768–1998. J. Volcanol. Geotherm. Res. 100(1):69–138. https://doi.org/10.1016/S0377-0273(00)00134-7.
Waxman, M.H., Smits, L.J.M., 1968. Electrical conductivities in oil bearing shaly sands. Soc.Pet. Eng. J. 243:107–122. https://doi.org/10.2118/1863-A.
Wyering, L.D., Villeneuve, M.C., Wallis, I.C., Siratovich, P.A., Kennedy, B.M., Gravley, D.M.,Cant, J.L., 2014. Mechanical and physical properties of hydrothermally altered rocks,Taupo Volcanic Zone, New Zealand. J. Volcanol. Geotherm. Res. 288:76–93. https://doi.org/10.1016/j.jvolgeores.2014.10.008.
Zimmermann, E., Kemna, A., Berwix, J., Glaas, W., Munch, H., Huisman, J., 2008. A high-accuracy impedance spectrometer for measuring sediments with low polarizability.Meas. Sci. Technol. 19 (10):105603. https://doi.org/10.1088/0957-0233/19/10/105603.