Measuring Conductivity in Saline Water Solutions (Teacher's ...
16
© 2012 WARD’S Science. v.11/12 All Rights Reserved For technical assistance, call WARD’S at 1-800-962-2660 Liquid Conductivity: Measuring Conductivity in Saline Water Solutions (Teacher’s Guide)
-
Upload
khangminh22 -
Category
Documents
-
view
6 -
download
0
Transcript of Measuring Conductivity in Saline Water Solutions (Teacher's ...

© 2012 WARD’S Science. v.11/12All Rights Reserved
For technical assistance, call WARD’S at 1-800-962-2660
TM
DataHub
Liquid Conductivity:Measuring Conductivity in
Saline Water Solutions(Teacher’s Guide)

1Teacher’s Guide – Liquid Conductivity
© 2012 WARD’S Science. v.11/12All Rights Reserved
For technical assistance, call WARD’S at 1-800-962-2660
OVERVIEW
Students measure the conductivity of a solution of distilled water with varying amounts of NaCl and will use the Ward’s DataHub software to visualize their results and carry out a preliminary analysis. They will also calculate molar conductivity of this solution and then
construct a scatter plot using the Excel tools.
MATERIALS NEEDED
Ward’s DataHubUSB connector cable*
500 mL beakerConductivity electrode
Stir barDistilled water
Salt
*– The USB connector cable is not needed if you are using a Bluetooth enabled device.
NUMBER OF USES
This demonstration can be performed repeatedly.

2Teacher’s Guide – Liquid Conductivity
© 2012 WARD’S Science. v.11/12All Rights Reserved
For technical assistance, call WARD’S at 1-800-962-2660
FRAMEWORK FOR K-12 SCIENCE EDUCATION © 2012* The Dimension I practices listed below are called out as bold words throughout the activity.
Dim
ensi
on 1
Scie
nce
and
Engi
neer
ing
Prac
tices
Asking questions (for science) and defining problems (for engineering) Use mathematics and computational thinking
Developing and using models Constructing explanations (for science) and designing solutions (for engineering)
Planning and carrying out investigations Engaging in argument from evidence
Analyzing and interpreting data Obtaining, evaluating, and communicating information
Dim
ensi
on 2
Cros
s Cu
ttin
g Co
ncep
ts
Patterns Energy and matter: Flows, cycles, and conservation
Cause and effect: Mechanism and explanation Structure and function
Scale, proportion, and quantity Stability and change
Systems and system models
Dim
ensi
on 3
Core
Con
cept
s
Discipline Core Idea Focus
Physical Science
PS1: Matter and Its Interactions
PS1.A: Structure and Properties of Matter
PS3: Energy
PS3.D: Energy in Chemical Processes and Everyday Life
NG
SS
Stan
dard
s Middle School Standards Covered High School Standards Covered
MS.PS-SFIP: Structure, Function and Information Processing HS.PS-SFIP: Structure, Function and Information Processing
MS.PS-E: Energy HS.PS-E: Energy
NATIONAL SCIENCE EDUCATION STANDARDS © 2002Content Standards (K-12)
Systems, order, and organization Evolution and equilibrium
Evidence, models, and explanation Form and Function
Constancy, change, and measurement
Physical Science Standards Middle School Physical Science Standards High School
Properties and Changes of Properties in Matter Structure of Atoms
Motion and Forces Structure and Properties of Matter
Transfer of Energy Chemical Reactions
Motion and Forces
Conservation of Energy and Increase in Disorder
Interactions of Energy and Matter
Indicates Standards Covered in Activity

�Teacher’s Guide – Liquid Conductivity
© 2012 WARD’S Science. v.11/12All Rights Reserved
For technical assistance, call WARD’S at 1-800-962-2660
LEARNING OBJECTIVES
Core Objectives (National Standards):
• Develop the ability to refine ill-defined questions and direct to phenomena that can be described, explained, or predicted through scientific means.
• Develop the ability to observe, measure accurately, identify and control variables.
• Decide what evidence can be used to support or refute a hypothesis.
• Gather, store, retrieve, and analyze data.
• Become confident at communicating methods, instructions, observations, and results with others.
Activity Objectives:
The purpose of this activity is to study the relationship between dissolved ions and the conductivity of a saline water solution, determine and interpret the molar conductivity, create a hypothesis and proceed to test it using the Ward’s DataHub conductivity sensor.
Time Requirement:
60-90 minutes

�Teacher’s Guide – Liquid Conductivity
© 2012 WARD’S Science. v.11/12All Rights Reserved
For technical assistance, call WARD’S at 1-800-962-2660
VOCABULARY
Concentration: The relative amount of a given substance contained within a solution or in a particular volume of space. The amount of solute per unit volume of solution.
Conductivity: The degree to which a specified material conducts electricity, calculated as the ratio of the current density in the material to the electric field that causes the flow of current. It is the reciprocal of the resistivity.
Electric Flux: Proportional to the number of electric field lines going through a virtual surface.
Electricity: The form of energy resulting from the existence of charged particles (such as electrons or protons) either statically as an accumulation of charge or dynamically as a current.
Electrolysis: Chemical decomposition produced by passing an electric current through a liquid or solution containing ions.
Electrolyte: A liquid or gel that contains ions and can be broken down by the electrolysis process.
Ion: An atom or molecule with a net electric charge due to the loss or gain of one or more electrons.
Ionic Solution: Any solution that contains dissolved ions and can usually conduct electricity.
Solute: The minor component in a solution, dissolved in the solvent.
Solution: A liquid mixture in which the minor component (the solute) is uniformly distributed within the major component (the solvent).
Solvent: The liquid in which a solute is dissolved to form a solution.

For technical assistance, call WARD’S at 1-800-962-2660
�Teacher’s Guide – Liquid Conductivity
© 2012 WARD’S Science. v.11/12All Rights Reserved
INTRODUCTION
An aqueous medium is necessary for both an organic and inorganic viewpoint. We approach this aspect of nature through the study of solutions which have different characteristics in terms of their components. In particular, electrolytic solutions have moving dissolved ions which are capable of conducting electric current in the presence of electric potential.
• Do you know of some examples of conductive solutions?
• What are some of the advantages and disadvantages of an electrolytic solution?
Carry out the experiment with your class so that at the end students will be able to answer the following question:
• What directly determines the conductivity of a solution?
BACKGROUND
In ionic solutions it is important to know how easily the electric current passes (i.e., conductivity). The conductivity depends on the solute’s features, and on the concentration of dissolved ions which are responsible for the electric flux. Strong electrolytes are solutes that completely dissociate in a solution (HCl, NaCl, KOH) and show the general relation for electrolytes:
cΛ = k
Where,Λ = Molar conductivity (mS cm-1 M-1)k = Conductivity (mS cm-1)c = Concentration (mol/L or M)
The molar conductivity is the proportion between the solution conductivity and its concentration.
At this point, encourage students to formulate a hypothesis to test as part of this activity. Students may find it helpful to formulate their hypothesis as an answer to the following question:
• How are the solution concentration and conductivity related?
Teacher Notes
6Teacher’s Guide – Liquid Conductivity
© 2012 WARD’S Science. v.11/12All Rights Reserved
For technical assistance, call WARD’S at 1-800-962-2660
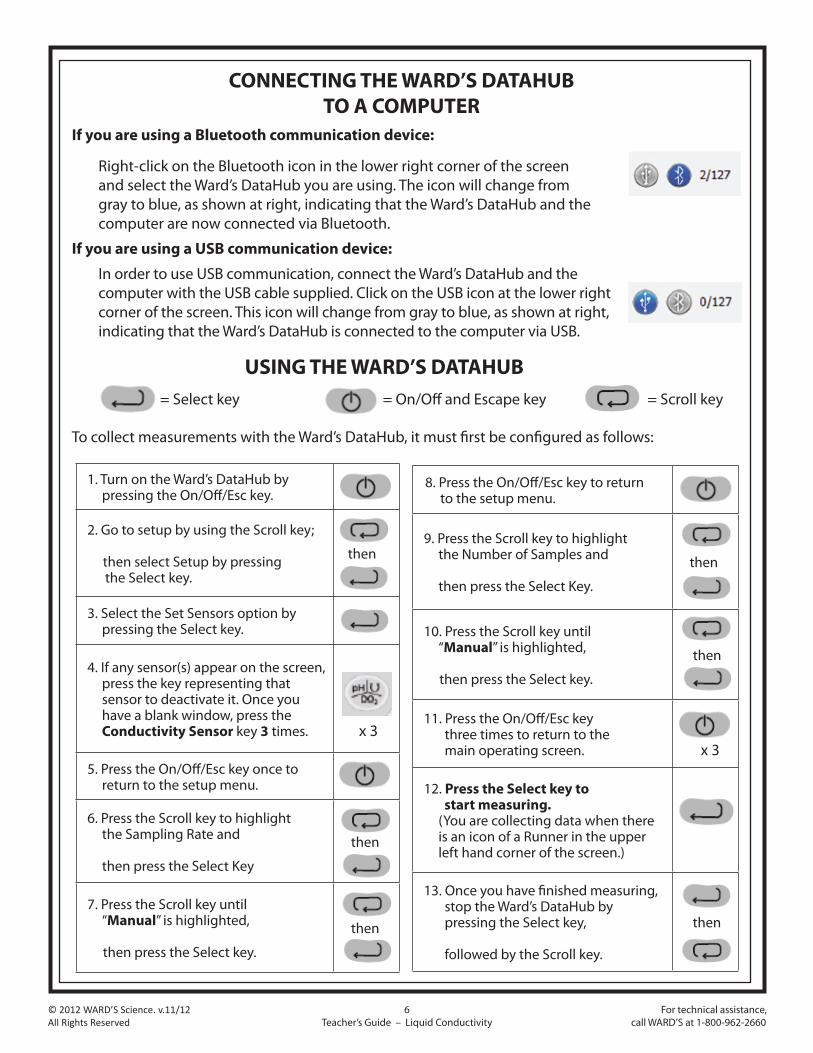
CONNECTING THE WARD’S DATAHUB TO A COMPUTER
If you are using a Bluetooth communication device:
Right-click on the Bluetooth icon in the lower right corner of the screen and select the Ward’s DataHub you are using. The icon will change from gray to blue, as shown at right, indicating that the Ward’s DataHub and the computer are now connected via Bluetooth.
If you are using a USB communication device:
In order to use USB communication, connect the Ward’s DataHub and the computer with the USB cable supplied. Click on the USB icon at the lower right corner of the screen. This icon will change from gray to blue, as shown at right, indicating that the Ward’s DataHub is connected to the computer via USB.
USING THE WARD’S DATAHUB = Select key = On/Off and Escape key = Scroll key
To collect measurements with the Ward’s DataHub, it must first be configured as follows:
8. Press the On/Off/Esc key to return to the setup menu.
9. Press the Scroll key to highlight the Number of Samples and then press the Select Key.
then
10. Press the Scroll key until “Manual” is highlighted,
then press the Select key.
then
11. Press the On/Off/Esc key three times to return to the main operating screen. x 3
12. Press the Select key to start measuring. (You are collecting data when there is an icon of a Runner in the upper left hand corner of the screen.)
13. Once you have finished measuring, stop the Ward’s DataHub by pressing the Select key, followed by the Scroll key.
then
1. Turn on the Ward’s DataHub by pressing the On/Off/Esc key.
2. Go to setup by using the Scroll key;
then select Setup by pressing the Select key.
then
3. Select the Set Sensors option by pressing the Select key.
4. If any sensor(s) appear on the screen, press the key representing that sensor to deactivate it. Once you have a blank window, press the Conductivity Sensor key 3 times. x 3
5. Press the On/Off/Esc key once to return to the setup menu.
6. Press the Scroll key to highlight the Sampling Rate and then press the Select Key
then
7. Press the Scroll key until “Manual” is highlighted,
then press the Select key.
then

For technical assistance, call WARD’S at 1-800-962-2660
�Teacher’s Guide – Liquid Conductivity
© 2012 WARD’S Science. v.11/12All Rights Reserved
ACTIVITY
1. Turn on the Ward’s DataHub
2. Set the software to display a bar graph.
3. Put 500 mL of distilled water in a beaker and measure its conductivity (Sample 1). Click on .
4. Mix 0.05 g of NaCl (Sample 2) until it dissolves completely using the stir bar and measure the conductivity.
5. Repeat the previous step, measuring the saline water and adding 0.05 g of salt each time. The five samples are shown in the following table.
Sample NaCl (g) Concentration (M)1 0.00 0.00002 0.05 0.00173 0.10 0.00344 0.15 0.00525 0.20 0.0069
Note: The molar concentration is equivalent to (Mol/L)
6. Once you have finished, stop the Ward’s DataHub.
The graph below should be similar to the one the students come up with.
DID YOU KNOW?
Environmentalists use conductivity to predict and
solve problems within marine environments. Soil scientists
also use conductivity to connect soil conditions and periods of drought, heavy
rain, and other environmental conditions. Farmers greatly appreciate this because it
takes the guess work out of irrigation and fertilization.

For technical assistance, call WARD’S at 1-800-962-2660
8Teacher’s Guide – Liquid Conductivity
© 2012 WARD’S Science. v.11/12All Rights Reserved
RESULTS AND ANALYSIS
1. Use the Annotation function to annotate the Bar Graph.
2. Export the data to Excel clicking on . Save the data on your computer.
3. Paste the concentration values from the previous table. Organize the data from the second sample to the last and calculate the molar concentration values in each case. Data should be organized as shown in the following table.
4. Calculate the average molar conductivity from the four obtained values and interpret its meaning based on the units.
5. Create a line graph of conductivity as a function of concentration. To do this, first create a scatter plot and add a regressing line to the graph by right-clicking on the points and selecting “Add Trendline”. Select the linear regression type.
• Was the hypothesis proven? Explain how.
• How did conductivity change with increasing salt concentration in the solution?
• What was the conductivity value of pure distilled water. Did you expect that value?
• What are the Λ units of measurement?
The graph below should be similar to the one the students come up with.
DID YOU KNOW?
Conductivity increases with temperature. Therefore at higher temperatures, water will have a higher
conductivity. You could have students try warming up the salt water in the beaker and see how the conductivities
change.

9Teacher’s Guide – Liquid Conductivity
© 2012 WARD’S Science. v.11/12All Rights Reserved
For technical assistance, call WARD’S at 1-800-962-2660
CONCLUSIONS AND ASSESSMENTS
1. Why is saline solution conductive? Argue your answer in terms of the experiment.
Students should point out that the salt dissociates into its Na+ and Cl- ions when it dissolves in water allowing the transportation of charges in the presence of an electrical potential.
2. Why is conductivity made higher by increasing the amount of NaCl in the solution?
Students should indicate that increasing sodium chloride in the solution produces an increment of dissolved charge that facilitates the flow of electric current.
3. How would you interpret molar conductivity? Explain your answer in terms of the experiment.
Students should suggest that according to the units of measurement from this value, they are proportionally constant, indicating the increased rate of the conductivity per unit of concentration in the solution.

For technical assistance, call WARD’S at 1-800-962-2660
© 2012 WARD’S Science. v.11/12All Rights Reserved
10Teacher’s Guide – Liquid Conductivity
ACTIVITIES FOR FURTHER APPLICATION
The aim of this section is for students to extrapolate the knowledge acquired during this class and apply it to different contexts and situations. Furthermore, it is intended that students question and present possible explanations for the experimentally observed phenomena.
1. If you wanted to monitor the purity of water, would you use conductivity as an indicator? Explain.
Students might point out that the purity of water is given by the concentration of different types of dissolved solutes. Many of them are separated into ions, such as sodium chloride, so that the conductivity reports give us an approximate value of the concentration of dissolved solutes.
2. If you stir a volume of distilled water with your fingers, will the conductivity vary?
Students should suggest that the excretion of salts through the skin produces a little conductivity change in distilled water.
DID YOU KNOW?
The composition of the rocks and soil around a
body of water determines the water’s conductivity. Therefore different areas of the country will have
different water conductivity levels. Limestone in
particular leads to a high conductivity because it
allows the dissolution of carbonate materials into the
surrounding waters.

For technical assistance, call WARD’S at 1-800-962-2660
S1Student Guide – Liquid Conductivity
© 2012 WARD’S Science. v.11/12All Rights Reserved
Liquid Conductivity:Measuring Conductivity in
Saline Water Solutions(Student Guide)
INTRODUCTION
An aqueous medium is necessary for both an organic and inorganic viewpoint. We approach this aspect of nature through the study of solutions which have different characteristics in terms of their components. In particular, electrolytic solutions have moving dissolved ions which are capable of conducting electric current in the presence of electric potential.
• Do you know of some examples of conductive solutions?
• What are some of the advantages and disadvantages of an electrolytic solution?
After carrying out this experiment, you should be able to answer the following question:
• What directly determines the conductivity of a solution?
TM
DataHub

For technical assistance, call WARD’S at 1-800-962-2660
S2Student Guide – Liquid Conductivity
© 2012 WARD’S Science. v.11/12All Rights Reserved
CONNECTING THE WARD’S DATAHUB TO A COMPUTER
If you are using a Bluetooth communication device:
Right-click on the Bluetooth icon in the lower right corner of the screen and select the Ward’s DataHub you are using. The icon will change from gray to blue, as shown at right, indicating that the Ward’s DataHub and the computer are now connected via Bluetooth.
If you are using a USB communication device:
In order to use USB communication, connect the Ward’s DataHub and the computer with the USB cable supplied. Click on the USB icon at the lower right corner of the screen. This icon will change from gray to blue, as shown at right, indicating that the Ward’s DataHub is connected to the computer via USB.
USING THE WARD’S DATAHUB = Select key = On/Off and Escape key = Scroll key
To collect measurements with the Ward’s DataHub, it must first be configured as follows:
8. Press the On/Off/Esc key to return to the setup menu.
9. Press the Scroll key to highlight the Number of Samples and then press the Select Key.
then
10. Press the Scroll key until “Manual” is highlighted,
then press the Select key.
then
11. Press the On/Off/Esc key three times to return to the main operating screen. x 3
12. Press the Select key to start measuring. (You are collecting data when there is an icon of a Runner in the upper left hand corner of the screen.)
13. Once you have finished measuring, stop the Ward’s DataHub by pressing the Select key, followed by the Scroll key.
then
1. Turn on the Ward’s DataHub by pressing the On/Off/Esc key.
2. Go to setup by using the Scroll key;
then select Setup by pressing the Select key.
then
3. Select the Set Sensors option by pressing the Select key.
4. If any sensor(s) appear on the screen, press the key representing that sensor to deactivate it. Once you have a blank window, press the Conductivity Sensor key 3 times. x 3
5. Press the On/Off/Esc key once to return to the setup menu.
6. Press the Scroll key to highlight the Sampling Rate and then press the Select Key
then
7. Press the Scroll key until “Manual” is highlighted,
then press the Select key.
then

For technical assistance, call WARD’S at 1-800-962-2660
S�Student Guide – Liquid Conductivity
© 2012 WARD’S Science. v.11/12All Rights Reserved
ACTIVITY
1. Turn on the Ward’s DataHub
2. Set the software to display a bar graph.
3. Put 500 mL of distilled water in a beaker and measure its conductivity (Sample 1). Click on .
4. Mix 0.05 g of NaCl (Sample 2) until it dissolves completely using the stir bar and measure the conductivity.
5. Repeat the previous step, measuring the saline water and adding 0.05 g of salt each time. The five samples are shown in the following table.
Sample NaCl (g) Concentration (M)1 0.00 0.00002 0.05 0.00173 0.10 0.00344 0.15 0.00525 0.20 0.0069
Note: The molar concentration is equivalent to (Mol/L)
6. Once you have finished, stop the Ward’s DataHub.

For technical assistance, call WARD’S at 1-800-962-2660
S�Student Guide – Liquid Conductivity
© 2012 WARD’S Science. v.11/12All Rights Reserved
RESULTS AND ANALYSIS
1. Use the Annotation function to annotate the Bar Graph.
2. Export the data to Excel clicking on . Save the data on your computer.
3. Paste the concentration values from the previous table. Organize the data from the second sample to the last and calculate the molar concentration values in each case. Data should be organized as shown in the following table.
4. Calculate the average molar conductivity from the four obtained values and interpret its meaning based on the units.
5. Create a line graph of conductivity as a function of concentration. To do this, first create a scatter plot and add a regressing line to the graph by right-clicking on the points and selecting “Add Trendline”. Select the linear regression type.
• Was the hypothesis proven? Explain how.
________________________________________________________________________
________________________________________________________________________
________________________________________________________________________
• How did conductivity change with increasing salt concentration in the solution? ________________________________________________________________________
________________________________________________________________________
________________________________________________________________________
• What was the conductivity value of pure distilled water. Did you expect that value?
________________________________________________________________________
________________________________________________________________________
________________________________________________________________________
• What are the Λ units of measurement?
________________________________________________________________________
________________________________________________________________________
________________________________________________________________________

For technical assistance, call WARD’S at 1-800-962-2660
S�Student Guide – Liquid Conductivity
© 2012 WARD’S Science. v.11/12All Rights Reserved
CONCLUSIONS AND ASSESSMENTS
1. Why is saline solution conductive? Argue your answer in terms of the experiment.
________________________________________________________________________________________________________________________________________________________________________________________________________________________________________________________________________________________________________________________________
2. Why is conductivity made higher by increasing the amount of NaCl in the solution?
________________________________________________________________________________________________________________________________________________________________________________________________________________________________________________________________________________________________________________________________
3. How would you interpret molar conductivity? Explain your answer in terms of the experiment.
________________________________________________________________________________________________________________________________________________________________________________________________________________________________________________________________________________________________________________________________