THERMAL CONDUCTIVITY OF HANDSHEETS, PAPERS ...
22
THERMAL CONDUCTIVITY OF HANDSHEETS, PAPERS AND MODEL COATING LAYERS David Guérin, 1 Veronique Morin, 1 Didier Chaussy 2 and Jean-Louis Auriault 3 1 CTP, Centre Technique du Papier, BP 51, F-38044 Grenoble cedex 9, France 2 EFPG, Ecole Francaise de Papeterie et des Industries Graphiques, BP 65, F-38402 Saint Martin d’Heres, France 3 Université Joseph Fourier, Laboratoire Sols, Solides, Structures, Domaine universitaire, BP 53, F-38041 Grenoble Cedex 9, France ABSTRACT Thermal conductivity of paper is a property of importance in the understanding of conductive heat transfer in the pulp and paper industry. For example, heat transfer between a paper web and a heated roll in a nip during calendering. Besides, the trends in the calendering area are to replace machine calenders by soft calen- ders and to replace cotton filled rolls by polymeric rolls in the supercalenders. As a result, temperatures of heated rolls in calen- ders are increasing constantly. There is a need for measuring thermal conductivity of paper. Some measurement methods and some values of thermal conductivity are available in the literature. But measurement methods are often reserved to specialists and values of conductivity show great variations. This drove us to develop a rapid method to measure the thermal conductivity of semi-insulated films. Our objective was to be able to measure the thermal conductivity of papers, of polymers and of model coat- ing layers–with simplicity and rapidity, if necessary at the expense of the accuracy. Indeed heat transfer calculations often used a lot 12th Fundamental Research Symposium, Oxford, September 2001 927 Preferred citation: D. Guérin, V. Morin, D. Chaussy and J-L. Auriault. Thermal Conductivity of Handsheets, Papers and Model Coating Layers. In The science of papermaking, Trans. of the XIIth Fund. Res. Symp. Oxford, 2001, (C.F. Baker, ed.), pp 927–945, FRC, Manchester, 2018. DOI: 10.15376/frc.2001.2.927.
-
Upload
khangminh22 -
Category
Documents
-
view
1 -
download
0
Transcript of THERMAL CONDUCTIVITY OF HANDSHEETS, PAPERS ...

THERMAL CONDUCTIVITY OFHANDSHEETS, PAPERS ANDMODEL COATING LAYERS
David Guérin,1 Veronique Morin,1 Didier Chaussy2
and Jean-Louis Auriault3
1CTP, Centre Technique du Papier, BP 51, F-38044 Grenoble cedex 9, France2EFPG, Ecole Francaise de Papeterie et des Industries Graphiques, BP 65,
F-38402 Saint Martin d’Heres, France3 Université Joseph Fourier, Laboratoire Sols, Solides, Structures, Domaine
universitaire, BP 53, F-38041 Grenoble Cedex 9, France
ABSTRACT
Thermal conductivity of paper is a property of importance in theunderstanding of conductive heat transfer in the pulp and paperindustry. For example, heat transfer between a paper web and aheated roll in a nip during calendering. Besides, the trends in thecalendering area are to replace machine calenders by soft calen-ders and to replace cotton filled rolls by polymeric rolls in thesupercalenders. As a result, temperatures of heated rolls in calen-ders are increasing constantly. There is a need for measuringthermal conductivity of paper. Some measurement methods andsome values of thermal conductivity are available in the literature.But measurement methods are often reserved to specialists andvalues of conductivity show great variations. This drove us todevelop a rapid method to measure the thermal conductivity ofsemi-insulated films. Our objective was to be able to measure thethermal conductivity of papers, of polymers and of model coat-ing layers–with simplicity and rapidity, if necessary at the expenseof the accuracy. Indeed heat transfer calculations often used a lot
12th Fundamental Research Symposium, Oxford, September 2001 927
Preferred citation: D. Guérin, V. Morin, D. Chaussy and J-L. Auriault. Thermal Conductivity of Handsheets, Papers and Model Coating Layers. In The science of papermaking, Trans. of the XIIth Fund. Res. Symp. Oxford, 2001, (C.F. Baker, ed.), pp 927–945, FRC, Manchester, 2018. DOI: 10.15376/frc.2001.2.927.

of restrictive hypotheses and a measurement of the thermal con-ductivity with an accuracy of less than 10% is quite sufficient.
MEASUREMENT DEVICE
Introduction to the device
The measurement device was conceived by the CSTB (Centre Scientifique etTechnique du Batiment) based on a paper of Lee [1] and was developed bythe CTP (Centre Technique du Papier). The measurement principle is quitesimple: a sample, laid on a hot plate, is maintained to a constant temperature(T1). A mass is suddenly put in contact with the sample. The initial tempera-ture of the mass (T0) is lower than T1. The evolution of the temperature of themass during time depends on the thermal conductivity of the sample.
Samples are a pile of 19 mm in diameter disks, whose global thickness mustbe between 100 μm and 800 μm. Thermal conductivity of samples must be
Figure 1 Diagram of the device.
928 Session 5: Sensors and Measurement
D. Guerin, V. Morin, D. Chaussy and J-L. Auriault

lower than 1.5 W/m.K for a valid measurement. The thermal mass is appliedto samples under a pressure of about 100 kPa.
The temperature of the heated plate is about 40 45°C and the initial tem-perature of the mass is about 5°C lower. These temperatures are chosen toavoid vaporisation of water from paper samples and to avoid creating anexcessive humidity gradient in the thickness direction of the paper sample.
The main limits of this device are:
– It is not possible to make the temperature vary on a large range of values.– It is not possible to make pressure variations.
Theoretical principle, data treatment
The measuring cell was modelled from a thermal point of view. From thistheoretical study, the following conclusions can be drawn:
– The temperature curve of the thermal mass follows a first order exponen-tial law.
– There are contact thermal resistances between the heated plate and thesample, between the sample and the thermal mass, and between the sampledisks. The first two cannot be dissociated.
– The convective heat losses from the lateral surface of the sample can beneglected.
– The convective heat losses from the lateral and top surfaces of the thermalmass have to be taken into account. These losses can be expressed in termsof a single convective resistance given by a Biot number.
– The following equation describes the evolution of the temperature of thenon heating mass during the measurement:
T(t) = T0 +T1 − T0
1 + Bi· �1 − exp �−
(1 + Bi) · t
τ �� (1)
Where T(t) is the non heating mass temperature versus time tT0 is the initial temperature of the thermal massT1 is the temperature of the heated plateBi is the Biot number representing the convective heat losses fromthe thermal mass� is the time constant of the exponential law
The theoretical curve given by Equation 1 fits quite well with the collecteddata. It is therefore possible to evaluate the time constant and the Biot num-ber of our system for each measurement. Besides, the total thermal resistance
12th Fundamental Research Symposium, Oxford, September 2001 929
Thermal Conductivity of Handsheets, Papers and Model Coating Layers

of the sample Rth (including contact thermal resistances) depends on the timeconstant of the system by the following equation:
Rth =S ·τ
C(2)
Where S is the contact surface between the non heating mass and thesampleC is the heat capacity (in J/°C) of the thermal mass� is the time response of the system
For a n sample disk stacking, this thermal resistance can be divided intothree parts. The first one is due to the thermal resistance of the sample (itcorresponds to a true or an intrinsic conductivity), the second part is due tothe thermal resistance of contacts between the sample disks and the thirdpart is due to the contact resistance between the stack and the metallic partsof the device (i.e. between the samples and the heating plate and the samplesand the thermal mass):
Rth = Rsample + (n − 1) . Rcontact sample + Rcontact (3)
Figure 2 Temperature of the thermal mass versus time. Comparison between thecollected data and the theoretical curve.
930 Session 5: Sensors and Measurement
D. Guerin, V. Morin, D. Chaussy and J-L. Auriault

To evaluate the importance of the contact resistance between two sampledisks, we have to compare the thermal resistance of a several sheet stack withthe thermal resistance of a single sheet sample having the same thickness.
Thus handsheets were made from a blend of pulp (75% of softwood sul-phite pulp and 25% of eucalyptus pulp).
The first series of sample is made up of six handsheets with a varyingthickness (165, 295, 414, 545, 666, 798 μm), the second series is made up ofsix handsheets whose thickness are comprised between 130 μm and 165 μm.The stacking of the second series handsheets leads to stack of the followingthickness: 165, 304, 423, 547, 672 and 801 μm.
The measurements of thickness and thermal conductivity were done undernormalised conditioning (23°C and 50% HR).
The following figure exhibits the thermal resistance of the stack versus thethickness of the stack for the two series described formerly.
The slight difference observed between the two series on the Figure 3 showsthat the contact resistance between the sample disks can be disregarded.Thus, Equation 3 becomes Equation 4:
Rth = Rsample + Rcontact (4)
Figure 3 Thermal resistance of handsheets versus thickness of the pile of samples.
12th Fundamental Research Symposium, Oxford, September 2001 931
Thermal Conductivity of Handsheets, Papers and Model Coating Layers

Rsample is the true thermal resistance of the sample.Rcontact is the contact resistance between the sample and the metallic parts
of the measuring device.Theoretically Rsample is a linear function of the thickness of the sample and
Rcontact is independent of the thickness of the sample and is the intercept ofthe fitted straight line drawn on Figure 3. The inverse of the slope of thisfitted straight line is the true thermal conductivity of the material. Thismethod is used afterwards to calculate the thermal conductivity. To sum up,to measure the thermal conductivity of thin semi-insulated films, a four stepmethod is used:
– Firstly, we make a pile with several layers of the material to be measured.– Secondly, for each thickness of the pile, we calculate a time of response
(and thus a thermal resistance) of our system from the measurements oftemperatures;
– Thirdly, we fit a straight line between the thermal resistances and the thick-ness of the piles;
– Finally, we calculate the thermal contact resistance from the intercept ofthis straight line with the y-axis and we calculate the intrinsic thermalconductivity of the material from the slope of this regression straight line.
Validation of the device, accuracy of the measurement
To validate the measuring device, we made some measurements on polymericmaterials: polyvinyl chloride, polyethylene, polypropylene and mylar. Then,we compared our values with those found in the literature and with valuesmeasured by a flash diffusivity method.
We can note that the tested polymers are commercial and we don’t knowthe nature and the amount of fillers that they could contain. The values ofconductivity of these materials are given in Table (1).
Table 1 Thermal conductivity (W/m.K) measured and given by the literature forvarious polymers.
PolyvinylChloride
Polyethylene Polypropylene Mylar
CTP Measurements 0.18 0.47 0.18 0.21Literature 0.16(2)–0.21(3) 0.42–0.52(3) 0.12–0.20(3) 0.14–0.22(1)
Measurements byflash diffusivity
0.16
932 Session 5: Sensors and Measurement
D. Guerin, V. Morin, D. Chaussy and J-L. Auriault

Table 1 shows that our values are at the upper end of the range given bythe literature. However the samples are not the same. Furthermore in theliterature the values often included a contact resistance, which lowersthe conductivity value. Thanks our device, we can obtain separately a truethermal conductivity and a contact thermal resistance. Repeatability andreproducibility tests, carried out on paper handsheets and polymer films,showed an accuracy of about 0.01 W/m.K.
MODELLING OF THERMAL CONDUCTIVITY OF POROUSMATERIALS
Considering a porous material, it is sometimes interesting to be able to calcu-late the thermal conductivity of the material from the thermal conductivityof the solid phase, from the thermal conductivity of the gaseous phase andfrom structural parameters.
The simplest modelling, is a plate-like modelling which requires only thethermal conductivity of the different phases and their proportions by volume.Plates represent each phase.
Thus, there are three cases:Either the plates are parallel to the direction of the heat flow Figure 4,
parallel model), or the plates are orthogonal to the direction of the heat flowFigure 4, series model), or the two situations are mixed Figure 4, hybridmodel).
Figure 4 Three simple models for porous materials.
12th Fundamental Research Symposium, Oxford, September 2001 933
Thermal Conductivity of Handsheets, Papers and Model Coating Layers

If KS is the thermal conductivity of the solid phase,KG is the thermal conductivity of the gaseous phase,γ is the fraction in volume of the gaseous phase,
then, the thermal conductivity (KI) of the material arranged in a parallelmodel structure is:
KI = (1 − γ ) KS + γ KG (5)
and the thermal conductivity (KII) of the material arranged in a series modelstructure is:
KII =1
(1 − γ)
KS
+γ
KG
(6)
If the contribution (fraction in volume) of the parallel model to the hybridmodel is a, then the contribution of the series model structure is 1-a, then thethermal conductivity (KIII) of the material arranged in this hybrid modelstructure is:
KIII =1
a
KI
+(1 − a)
KII
(7)
From a physical point of view, the parallel model means that there is acontinuous way in each phase for the heat to be conducted from one side ofthe material to the other.
On the contrary, the series model structure means that there is no possibil-ity for the heat to go across the material without changing phase. The hybridmodel is a compromise between these two situations.
THERMAL CONDUCTIVITY OF SOME PULPS AND OF A BLENDOF PULP
Handsheets of three different pulps and of a blend of these pulps were made.We measured their basis weight, their thickness and their thermal conductiv-ity. We also calculate their bulk and their porosity. The results are given inTable 2.
934 Session 5: Sensors and Measurement
D. Guerin, V. Morin, D. Chaussy and J-L. Auriault
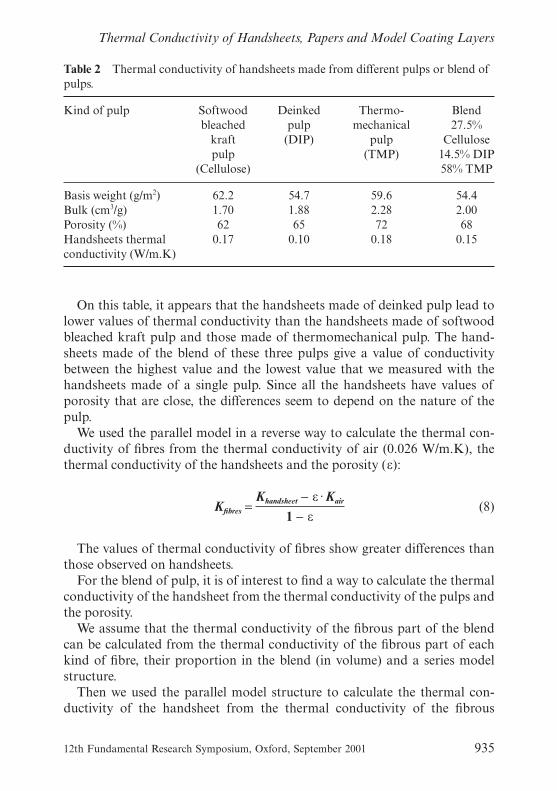
On this table, it appears that the handsheets made of deinked pulp lead tolower values of thermal conductivity than the handsheets made of softwoodbleached kraft pulp and those made of thermomechanical pulp. The hand-sheets made of the blend of these three pulps give a value of conductivitybetween the highest value and the lowest value that we measured with thehandsheets made of a single pulp. Since all the handsheets have values ofporosity that are close, the differences seem to depend on the nature of thepulp.
We used the parallel model in a reverse way to calculate the thermal con-ductivity of fibres from the thermal conductivity of air (0.026 W/m.K), thethermal conductivity of the handsheets and the porosity (ε):
Kfibres =Khandsheet − ε ·Kair
1 − ε(8)
The values of thermal conductivity of fibres show greater differences thanthose observed on handsheets.
For the blend of pulp, it is of interest to find a way to calculate the thermalconductivity of the handsheet from the thermal conductivity of the pulps andthe porosity.
We assume that the thermal conductivity of the fibrous part of the blendcan be calculated from the thermal conductivity of the fibrous part of eachkind of fibre, their proportion in the blend (in volume) and a series modelstructure.
Then we used the parallel model structure to calculate the thermal con-ductivity of the handsheet from the thermal conductivity of the fibrous
Table 2 Thermal conductivity of handsheets made from different pulps or blend ofpulps.
Kind of pulp Softwoodbleached
kraftpulp
(Cellulose)
Deinkedpulp
(DIP)
Thermo-mechanical
pulp(TMP)
Blend27.5%
Cellulose14.5% DIP58% TMP
Basis weight (g/m2) 62.2 54.7 59.6 54.4Bulk (cm3/g) 1.70 1.88 2.28 2.00Porosity (%) 62 65 72 68Handsheets thermalconductivity (W/m.K)
0.17 0.10 0.18 0.15
12th Fundamental Research Symposium, Oxford, September 2001 935
Thermal Conductivity of Handsheets, Papers and Model Coating Layers

phase, the thermal conductivity of air and the porosity. This leads to thefollowing Equation:
Khandsheet = ε ·Kair +(1 − ε)
χTMP
KTMP
+χDIP
KDIP
+χCellulose
KCellulose
(9)
Where Khandsheet Thermal conductivity of the handsheet made from theblend of TMP, DIP and cellulose,
Kair Thermal conductivity of air (0.026 W/m.K),KTMP TMP fibre calculated thermal conductivity (0.57 W/m.K),KDIP DIP fibre calculated thermal conductivity (0.24
W/m.K),KCellulose Cellulose fibre calculated thermal conductivity (0.40
W/m.K),
Figure 5 A series model structure applied to the fibrous phase of a handsheet madeof a blend of pulps.
Table 3 Recalculated thermal conducivity of fibres.
Kind of pulp Softwoodbleached
kraft pulp(Cellulose)
Deinkedpulp
(DIP)
Thermo-mechanical
pulp(TMP)
Blend27.5%
Cellulose14.5% DIP58% TMP
Recalculated fibrethermal conductivity(W/m.K)
0.40 0.24 0.57 0.42
936 Session 5: Sensors and Measurement
D. Guerin, V. Morin, D. Chaussy and J-L. Auriault

χTMP Fraction in volume of TMP in the blend (58%),χDIP Fraction in volume of DIP in the blend (14.5%),χCellulose Fraction in volume of cellulose in the blend (27.5%),ε Handsheet porosity (68%).
If we compare the calculated value with the measured one, the difference isabout 0.002 W/m.K. So the models used seem to be well adapted. Neverthe-less, some additional work is in progress to carry out measurements of ther-mal conductivity on handsheets made of different blends of pulps in variousproportions.
THERMAL CONDUCTIVITY OF MODEL COATING LAYERS
To begin to understand heat transfer by conduction inside coated paper, it isof interest to study heat transfer through a coating layer. Indeed, when aconductive heat transfer occurs between a heating element and a coatedpaper, the heating element is first in contact with the coating layer.
Model coating layers made of talcum and lattice
In this study, we chose to study one coating pigment (talcum) and one kind oflattice (styrene butadiene). Coating colours were prepared at a solid contentof 57 ± 1%. Their pH value was adjusted with soda to 8.8 ± 0.2. Coatingcolours were then degassed by flowing through a mesh.
One styrene-butadiene lattice was mixed, in variable amount, with fourtalcums, whose properties are given in Table 4.
We selected the talcums to obtain different mineral compositions and dif-ferent particle sizes. The proportions of pigment and lattice are the followingones:
100 dry parts of pigment and 5, 10, 15, 20, 25, 30 and 50 dry parts oflattice.
Table 4 Properties of the four selected talcums.
Talcum 1 Talcum 2 Talcum 3 Talcum 4
D50 (μm) 3.2 3.3 1.7 2.2Composition 85% talcum
13% chlorite2% dolomite
54% talcum44% chlorite2% dolomite
45% talcum54% chlorite1% dolomite
95–96% talcum4–5%
magnesite
12th Fundamental Research Symposium, Oxford, September 2001 937
Thermal Conductivity of Handsheets, Papers and Model Coating Layers

Coating colours were metered on aluminium sheets, then dried. After that,the aluminium sheets were peeled off and we obtained what we called modelcoating layers.
We were unable to study pigment powders without lattice, because it wasnot possible to make films.
We measured the density of the model coating layers and we calculatedtheir porosity (see Figure 6). We also measured their thermal conductivity –Figure 7.
On the Figure 6, we observe that the porosity of the model coating layerdecreases sharply for lattice contents comprised between, 5 and 25. Then theporosity remains stable. Such an evolution has already been observed andexplained by Lepoutre (4)
For the low lattice contents (inferior to 25 parts), the lattice fills in the voidof the model coating layer as we increase its proportion. For higher latticecontents, normally, we should not have air anymore and when we add lattice,we should replace in proportion pigment by lattice. We notice that some aircontent is remaining in our model coating layers. Some microscopic observa-tions of cross sections of the model coating layers showed that there were stillair bubbles in the model coating layer despite our degassing. So we attributethe remaining porosity to air bubbles and not to a residual porosity due to thearrangement of the pigment lattice network.
Figure 6 Porosity of model coating layers versus lattice content.
938 Session 5: Sensors and Measurement
D. Guerin, V. Morin, D. Chaussy and J-L. Auriault

We measured the thermal conductivity of model coating layers (Figure 7).The trends showed on Figure 7 can be explained by variations in com-
position and density. First of all, the thermal conductivity of model coatinglayers is two to three times higher than the thermal conductivity of hand-sheets. There are some differences between the curves, but it cannot be relatedto variation of the mineral composition of the pigments or to their particlesizes. Nevertheless, the four curves show the same trend: Between 5 and about25 parts of lattice, the thermal conductivity of the model coating layersincreases, then it decreases slightly.
This trend can be explained by the evolution of the composition of themodel coating layer: In the first part of the curves, we observe coating layersmade of pigment, lattice and air. As we increase the lattice content, wereplace air, which is insulating, by lattice. So we filled in the voids in thepigment matrix by lattice. It is then quite normal that the thermal conductiv-ity of model coating layers increases. For lattice content over 25 parts, the aircontent is stable and is due to air bubbles. So, as we increase the latticecontent, we substitute some pigment in the matrix by lattice, which is lessconductive. So, the thermal conductivity of the model coating layersdecrease.
The constitutive models used previously with handsheets failed with
Figure 7 Thermal conductivity of model coating layers versus lattice content.
12th Fundamental Research Symposium, Oxford, September 2001 939
Thermal Conductivity of Handsheets, Papers and Model Coating Layers

coating layers. It was not possible to calculate the thermal conductivity of amodel coating layer from the values of conductivity of lattice and pigmentand from the value of porosity.
Comparison between talcum, clay and calcium carbonate
In this study, we compared the thermal conductivity of model coating layersmade of talcum, clay and calcium carbonate with the same lattice. The latticecontent was in the usual range of the papermaking field (5, 10, 15, 20 and 25parts in dry content for 100 parts of pigment). The clay was an English clayand the calcium carbonate was a ground calcium carbonate. We measured thethermal conductivity of these model coating layers (Figure 8).
The thermal conductivity of the model coating layers made from threedifferent pigments increases with the lattice content (see Figure 8). The modelcoating layers made with clay and talcum have the same values of thermalconductivity, whereas the calcium carbonate leads to lower values. Theseresults are very interesting, because, as these three pigments have almost thesame values of density and heat capacity, it means that it is easier to heat (orto cool) a paper whose the coating layer contains talcum or clay than a paperwhose coating layer contains calcium carbonate.
Figure 8 Thermal conductivity of model coating layers versus lattice content.
940 Session 5: Sensors and Measurement
D. Guerin, V. Morin, D. Chaussy and J-L. Auriault

THERMAL CONDUCTIVITY OF AN UNCOATED BASE PAPER ANDA LWC PAPER AT DIFFERENT CALENDERING LEVELS
Measurements on the papers
We measured the thermal conductivity of handsheets and of model coatinglayers. In this part we wanted to compare the thermal conductivity of anuncoated paper with the thermal conductivity of a coated paper.
For this, we selected a LWC paper for rotogravure printing and its uncoatedbase paper. Then, we supercalendered these papers in an increasing numberof nips (varying between 1 and 9). The calender, we used for this trial, isdescribed on Figure 9.
The calendering conditions were:
– Speed, 700 m/min,– Temperature of the heated rolls 140°C,– Linear load 180 kN/m.
We measured the thermal conductivity of the uncoated paper and thethermal conductivity of the LWC paper at different levels of calendering –
Figure 9 Diagram of the CTP’s pilot supercalender.
12th Fundamental Research Symposium, Oxford, September 2001 941
Thermal Conductivity of Handsheets, Papers and Model Coating Layers

Figure 10. The fibrous composition of the uncoated base paper is very closeto the blend of pulp studied before. The coating colour is made with thelattice and the pigments studied previously (clay and talcum).
The uncoated base paper exhibited a lower thermal conductivity than theLWC paper, which is quite normal if we look at the results found on hand-sheets and on model coating layers.
Furthermore, the thermal conductivity of the LWC paper and theuncoated base paper show no variation when their thicknesses are reduced bycalendering. This result has already been found by Morikawa [5] but isopposed to the results found by Kartovaara [6] and Niskanen [7].
We can imagine that the heat follows a certain path in the paper, and thatthe variations of thermal conductivity with the density depend on the way thedensity is modified (either by beating or by calendering) and depends perhapsalso on the degradation that the fibres may experience during these treat-ments. Besides, the model structures we used to describe the thermal conduct-ivity of paper don’t take into account this path. It would be interesting tointroduce the concept of solid phase tortuosity to take into account the factthat the path the heat follows is longer than the paper thickness.
Figure 10 Thermal conductivity of a LWC paper and of its uncoated base paperversus calendering level.
942 Session 5: Sensors and Measurement
D. Guerin, V. Morin, D. Chaussy and J-L. Auriault

Modelling of the thermal conductivity of coated papers
If we consider that the paper can be regarded as a three layer material (seediagram on the Figure 11), then from a thermal point of view, we can con-sider that three thermal resistances are disposed in series. We also assume thatthe two coating layers have the same composition and the same thermalconductivity.
Then the thermal conductivity of the coated paper should be calculatedfrom the thermal conductivity of the uncoated base paper, the thermal con-ductivity of the coating layer, the thickness of the uncoated base paper andthe thickness of the coating layers:
Kcoated paper =Tcp
Tcl
Kcl
+Tbp
Kbp
(10)
Where Kcoated paper is the thermal conductivity of the coated paper(W/m.K),
Kcl is the thermal conductivity of the coating layers(W/m.K),
Kbp is the thermal conductivity of the base paper(W/m.K),
Tcp is the thickness of the coated paper (μm),Tcl is the total thickness of the coating layers (μm),Tbp is the thickness of the base paper (μm),
Figure 11 Diagram of a coated paper considered as a three-layer material.
12th Fundamental Research Symposium, Oxford, September 2001 943
Thermal Conductivity of Handsheets, Papers and Model Coating Layers

This calculation gives values of thermal conductivity for the coated paper,which are lower than the measured values. This result comes from the factthat we can’t estimate correctly the thickness of the coating layers. Indeed,some pigments and lattice penetrate in the base paper when the paper iscoated. Perhaps it would have been better to compare a single coated paperwith the same paper coated another time to evaluate the availability of themulti-layer modelling.
CONCLUSION AND PROSPECTS
A very simple cost effective device for measuring thermal conductivity hasbeen detailed. This device was validated with polymers and papers.
Thanks this device, we measured the thermal conductivity of handsheetsmade with different kind of pulps or blends of pulps. We used models toassess the thermal conductivity of the solid phase of papers; i.e. the thermalconductivity of the fibrous network. From this point, it seemed possible tocalculate the thermal conductivity of a handsheet made from a blend ofpulps knowing the porosity of the sheet, the fibrous composition and thethermal conductivity of each fibrous component. These assumptions have tobe verified with other pulps and blends of pulps.
We carried out model coating layers and we measured their thermal con-ductivity with various compositions and with different natures, shapes, sizes,etc. of pigments. The model used previously with handsheet failed to calcu-late the thermal conductivity of the model coating layer from the com-position and the porosity.
Thermal conductivity of a LWC paper and its uncoated base paper, calen-dered at different levels, showed only weak variations with thickness. To gofurther with the measurements, it would be interesting:
– to study the effect of the amount of fillers on the thermal conductivity ofpapers;
– to study a wider range of pulps and blends of pulps;– to propose a constitutive model to calculate the thermal conductivity of
model coating layers from the composition and the structure;– to continue the study of thermal conductivity of papers with density.
So we have some values of thermal conductivity of base paper and coatinglayers. This step was necessary to calculate the penetration of heat in a coatedpaper during calendering or xerographic printing.
944 Session 5: Sensors and Measurement
D. Guerin, V. Morin, D. Chaussy and J-L. Auriault

ACKNOWLEDGEMENTS
The authors would like to express their thanks to CSTB for the loan of themeasuring probe, to P. Lafaverges and G. Eymin Petot Tourtollet (CTP)for the development of the measuring device and to L. Lyannaz formeasurements.
We also like to express our thanks to Stora Enso Corbehem, LuzenacEurope, ECC International (Imerys now), Beloit Manhattan (Valmet now),and Rhodia (Latexia now) for their financial and technical support.
REFERENCES
1. Lee, H., “Rapid Measurement of Thermal Conductivity of Polymer Films”,Review of Scientific Instrumentation, 53 (6), Juin 1982, pp. 884–887
2. Laurent, M., Vuillermoz, P.L., “Conductivité thermique des solides”, Techniquesde l’ingénieur, Constantes physico-chimiques, K 420, 1993, pp. 1–30
3. Incropera, F.P., DeWitt, D.P., “Fundamentals of Heat and Mass Transfer”, 4thEdition, J. Wiley & Sons Inc., New York, NJ,, p. 886. (1996).
4. Lepoutre, P., “The Structure of Paper Coatings (an Update)”, TAPPI Press,Atlanta (GA), p. 56 (1989).
5. Morikawa, J., Hashimoto, T., “Thermal Diffusivity Measurement of Papers by anAC Joule Heating Method”, Polymer International, 45: pp. 207–210 (1998).
6. Kartovaara, I., Rajal, R., Luukkala, M., Sipi, K., “Conduction of Heat inPaper”, Papermaking Raw Material 1, Transaction of the 8th FundamentalResearch Symposium, Oxford, Septembre 1985, pp. 381–411
7. Niskanen, K., Simula, S., “Thermal Diffusivity of Paper”, Nordic Pulp and PaperResearch Journal, 14 (3) Mars 1999, pp. 236–242
12th Fundamental Research Symposium, Oxford, September 2001 945
Thermal Conductivity of Handsheets, Papers and Model Coating Layers

THERMAL CONDUCTIVITY OF HANDSHEETS,PAPERS AND MODEL COATING LAYERS
David Guérin1, Veronique Morin1, Didier Chaussy2 andJean-Louis Auriault3
1Centre Technique du Papier2Ecole Francaise de Papeterie et des Industries Graphiques
3Université Joseph Fourier
Editor’s note – In the text of the paper ‘lattice’ is used as the plural of latexand should be spelt ‘latice’
Dick Kerekes University of British Columbia
One of the factors that affects thermal conductivity of paper is moisturecontent it is very dependant on this. Applying a hot surface dries out thepaper, or at least causes some moisture redistribution. Some of the tech-niques you cited, including my own in 1979, and going right back to Kirk’smethod, and I think some of the later techniques, attempted to overcome thisby using transient-state methods which did not dry out the paper or affect itsmoisture content. In your method, I think you are using heating times of acouple of minutes (responding yes). Is drying a factor in you mind? Why didyou not include it, or is it not important?
David Guérin
The measurements were done in conditioning room at 23oC and 50% mois-ture and the temperature of the paper is about 40–45oC, so there is an equi-librium in moisture, but in the samples of paper that we used it was difficultto measure the moisture content. We made measurements under differentconditioning atmospheres. You can see the measurements concerning thebase paper, and the light weight coated paper. We used three differentatmospheres 30%, 50% and 70% relative humidity, so we didn’t measure the
12th Fundamental Research Symposium, Oxford, September 2001
Transcription of Discussion

moisture content of the paper, but we are sure that it varies according to thesedifferent atmospheres. You can see that in our range there was no variation ofthermal conductivity according to the moisture content of the paper. I reallythink that it is due to our temperature of measurement being under 50oC,there is no evaporation in the paper.
Murray Douglas McGill University
I wasn’t clear what pressure you used to make your measurement of thermalconductivity. Did you test various levels of pressure in your experimentalequipment to see that measured thermal conductivities were independent ofthat pressure?
David Guérin
We carried out some trials concerning pressure. The pressure on the sample isabout 100 kPa it is the same as in a classic μmeter thickness measurement,and we confirmed that there were no large variations of thickness of oursamples. We also had a small weight on our thermal mass to measure theinfluence of an additional pressure on the thermal conductivity and we see nodifferences. I think that adding pressure will change the thermal contactresistance in a significant manner, but won’t change the thermal conductivityof the paper. As you can see we have paper calendered at different levels andthere is no variation of thermal conductivity, but there will be a great vari-ation of thermal contact resistance of our paper.
Murray Douglas
Coming to your multi-nip predictions and measurements, for your predictedtemperatures in the multi-nip case, how did you measure the length of thenip?
David Guérin
The length of the nip was measured with prints, and we compared thesemeasurements with the Hertz-theory calculation. Of course it is a limitationof this modelling.
John Parker Consultant
With reference to Figure 3 in your paper two questions. Is the intercept a
Discussion
Session 5

function of the equipment, or is it a function of the material tested. That is, ifyou test different materials having very different conductivities and thereforegiving lines of different slope do they all have a common intercept whichwould demonstrate that this was a function of the equipment? The secondpoint I would like to make, is that I find it remarkable that you seem to findno contact resistance between separate sheets of paper. It is as if the rough-ness of a paper surface makes no contribution to contact resistance.
David Guérin
I will answer the second question first about the contact resistance. As soonas there is a contact between two materials, then there is a contact resistanceas you can see here (Figure 5) between the heating plate and the sample sheetand between the thermal mass. There is also contact resistance between thedifferent samples, and with our device we measure the total resistance and sowe can read out measurements using a stack of 1–6 sheets having the samethickness, or using one sheet having a varying thickness and the few differ-ences that you can observe between the yellow and the green squares meansthat there is no contact resistance between the samples. There is only a con-tact resistance between the heating element and the sample and that is whatwe measure and perhaps when you use a pile of papers it is sufficientlydeformable to have a rather good contact in terms of heat conductionbetween the different samples. With regard to the first question, the contactresistance differences will depend on the pressure, and on the nature of thethermal element, for example in the calender where you have a soft roll, thecontact resistance won’t be the same as the contact resistance with a steel roll.
Gary Baum Institute of Paper Science & Technology
Did you change the thermal mass or the pressure at all?
David Guérin
It was always the same pressure, but some authors have shown that there is nocontact resistance for pressures over 12 MPa.
Thermal Conductivity of Handsheets, Papers and Model Coating Layers
12th Fundamental Research Symposium, Oxford, September 2001