THERMAL CONDUCTIVITY OF SOLID HELIUM MIXTURES IN THE ...
123
THERMAL CONDUCTIVITY OF SOLID HELIUM MIXTURES IN THE PHASE SEPARATION REGION . by ARTHUR E. BURGESS .Sc., Royal Military College of Canada, 196 A THESIS SUBMITTED IN PARTIAL FULFILMENT OF THE REQUIREMENTS FOR THE DEGREE OF DOCTOR OF PHILOSOPHY in the Department of . . Physics We accept this thesis as conforming to the required standard THE UNIVERSITY OF BRITISH COLUMBIA November, 1971
-
Upload
khangminh22 -
Category
Documents
-
view
0 -
download
0
Transcript of THERMAL CONDUCTIVITY OF SOLID HELIUM MIXTURES IN THE ...
THERMAL CONDUCTIVITY OF SOLID HELIUM
MIXTURES IN THE PHASE SEPARATION REGION .
by
ARTHUR E. BURGESS
.Sc., Royal Military College of Canada, 196
A THESIS SUBMITTED IN PARTIAL FULFILMENT OF THE REQUIREMENTS FOR THE DEGREE OF
DOCTOR OF PHILOSOPHY
in the Department
of . .
Physics
We accept this thesis as conforming to the
required standard
THE UNIVERSITY OF BRITISH COLUMBIA
November, 1971
In present ing th is thes is in p a r t i a l f u l f i l m e n t of the requirements for
an advanced degree at the Un ive rs i t y of B r i t i s h Columbia, I agree that
the L ibrary sha l l make i t f r e e l y a v a i l a b l e for reference and Study.
I fu r ther agree that permission for extensive copying of th is thes is
for s c h o l a r l y purposes may be granted by the Head of my Department or
by his representat i ves . It is understood that copying or p u b l i c a t i o n
of th i s thesis for f i n a n c i a l gain sha l l not be allowed without my
wr i t ten permiss ion.
Department of
The Un ive rs i t y of B r i t i s h Columbia Vancouver 8, Canada
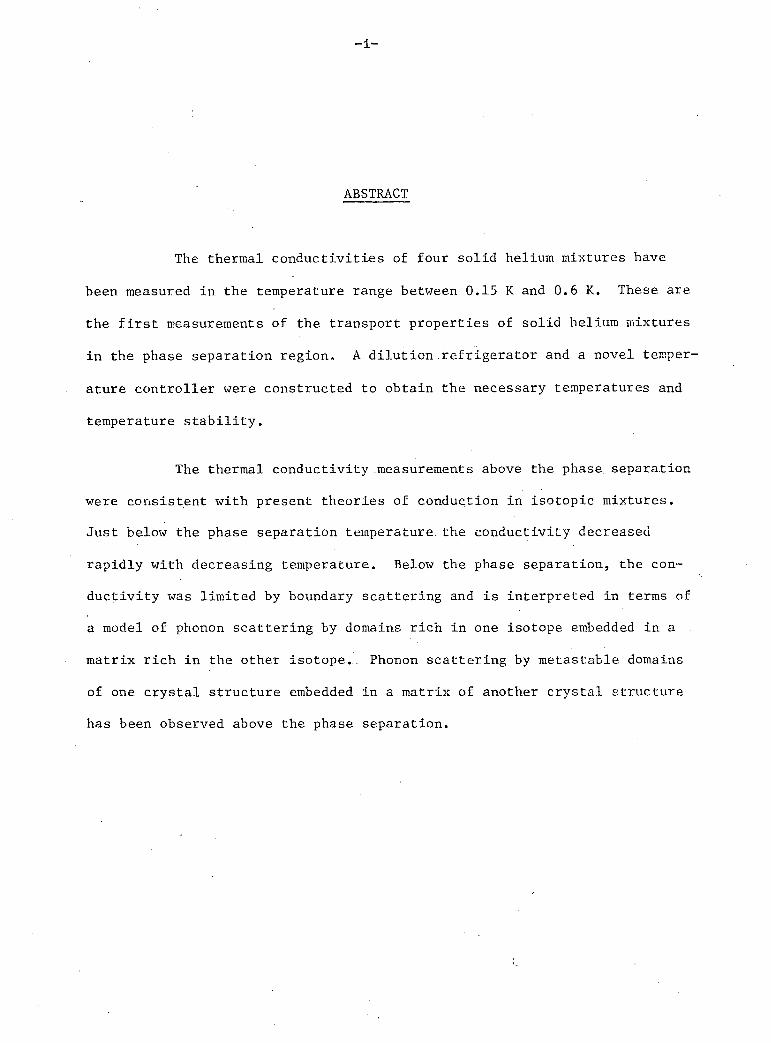
ABSTRACT
The thermal conductivities of four solid helium mixtures have
been measured in the temperature range between 0.15 K and 0.6 K. These are
the f i r s t measurements of the transport properties of solid helium mixtures
in the phase separation region. A dilution refrigerator and a novel temper
ature controller were constructed to obtain the necessary temperatures and
temperature s t a b i l i t y .
The thermal conductivity measurements above the phase separation
were consistent with present theories of conduction in isotopic mixtures.
Just below the phase separation temperature the conductivity decreased
rapidly with decreasing temperature. Below the phase separation, the con
ductivity was limited by boundary scattering and is interpreted in terms of
a model of phonon scattering by domains rich in one isotope embedded in a
matrix rich in the other isotope.. Phonon scattering by metastable domains
of one crystal structure embedded in a matrix of another crystal structure
has been observed above the phase separation.
- i i -
' TABLE OF CONTENTS Page
Abstract ±
Table of Contents i i
L i s t of Figures and Tables i i i
Dedication and Acknowledgements i v
Chapter
I: Introduction A. Solid Helium 1 B. Solid Helium Mixtures 4
II: Phase Separation • A. Thermodynamics of Regular Solutions 8 B. Thermodynamics of Solid Helium Mixtures 12 C. Kinetics of Phase Separation 16
III: Thermal Conductivity A. History 20 B. Theory 23 C. Previous Experimental Results in Solid Helium 30
IV: Apparatus and Experimental Procedures A. Dilution Refrigerator 33 B. Thermometry 37 C. Mixing Chamber and Temperature Controller 47 D. Sample Chamber 53 E. Crystal Growth 64 F. Data Reduction and Experimental Errors 66
V: Experimental Results 4
A. Stainless Steel and He 72 B. Phase Separation Temperature 73 C. General Results for One 10% He3 Crystal • 74 D. Above the Phase Separation 78 E. Below the Phase Separation 84 F. Time Dependent Effects 97 G. Conclusions 102
Appendix A. Tables of Experimental Data 104 B. Bibliography 114
- i i i -
FIGURES
Page 1. Liquid-solid phase diagrams of solid helium. 3
- 2. T-X phase diagram of solid helium mixtures at P % 33 atm. 6
3. Phase separation parameters for regular solution theory. 10
4. Specific heat of solid helium mixtures in the phase separation 1 3 region.
5. Schematic diagram of low temperature apparatus. 3 4
6. Tunnel diode oscillator thermometer and temperature controller c i r c u i t . 43.
7. Mixing chamber temperature controller c i r c u i t . 48
8. Sample chambers. 55
3 9. General results for 10% He (sample E). 75
10. Thermal conductivities above phase separation. 79
11. Comparison n ? results above phase separation with theory at 83 T/e'fc .03.
3 12. Conductivities below phase separation 90% He samples. 85
3 13. Conductivities below phase separation; 80% and 50%.He samples. 86
3 14. Conductivity below phase separation 10% He sample. 87
3
15. Time dependent effects in 50% He sample. 101
TABLES
1. Phase separation time constants. 17
2. Conductivity above phase separation. 81
3. Conductivity below phase separation. 93
4. Elapsed time below the phase separation for data in figure 15 100
(x 3 = .50).
- i v -
Dedicated
' to my wife
Carolyn
whose patience and understanding
were of paramount importance.
I would particularly like to thank my supervisor Dr. Michael Crooks
for suggesting this research project and for timely advice and encouragement
during the experiments. I would like to thank Dr. P.W. Matthews for suggest
ing the self inductance thermometer and other discussions. ' I would like to
thank Dr. D.L. Johnson for taking some of the data and lending equipment as
well as a sympathetic ear.
Mr. R. Weisbach and Mr. G. Brooks helped in the construction cf the
apparatus. Mr. J. Lees and Mr. E. Williams constructed the dewars and
glassware.
Miss Rose Chabluk typed the thesis in a very accurate and speedy
manner.
I would like to thank the National Research Council for a Bursary
and Studentships and the H.R. MacMillan Family for a Fellowship.
-1-
CHAPTER I
INTRODUCTION
In this introduction we w i l l f i r s t describe a few of the 3 \
properties of solid helium (pure He or He ) which set helium apart from
other solids. In the second part of this chapter we w i l l briefly
describe the solid isotopic mixtures of helium and state the reason for
doing the experiments described in this thesis. A. SOLID HELIUM
Helium was f i r s t l i q u i f i e d in.1908 by Kamerlingh Onnes. Early
attempts to s o l i d i f y helium by cooling the liquid at the saturated vapour
pressure were unsuccessful. In 1926 Keesom found that solid helium
exists only at pressures greater Limn 23 atmospheres. Helium Lch^vcs
in this unique manner because of i t s large zero point energy.
One usually considers a solid to be a collection of atoms which
osci l l a t e in their l a t t i c e sites like coupled harmonic oscillators. In
the quantum mechanical model a harmonic oscillator has quantized energy
levels with a minimum energy (the zero point. energy) of • -'ftco, where h
is Planck's constant. The frequency co is inversely proportional to the
square root of the atomic mass, giving helium a large zero point energy.
The van der Waals attraction between helium atoms is weak compared to
this zero point effect, therefore considerable external pressure is
necessary to sol i d i f y helium. Guyer (1969) gives the following descrip
tion of solid helium: Because of i t s large kinetic energy the helium
atom under low external pressure can do the work necessary to escape
-2-
between i t s nearest neighbours and become n o n - l o c a l i z e d . At a s u f f i c i e n t l y
l a r g e e x t e r n a l pressure the atom can no longer escape between i t s nearest
neighbours and remains l o c a l i z e d forming a s t a b l e s o l i d .
The l a r g e zero p o i n t energy leads to a l a r g e c o m p r e s s i b i l i t y .
The molar volume of the pure s o l i d s can be decreased by a f a c t o r of two
by r a i s i n g the press u r e from 25 atmospheres to 1500 atmospheres. The
Debye temperature 8 i s a l s o very pressure dependent and i n c r e a s e s by a
f a c t o r of f i v e d u r i n g the above pressure i n c r e a s e . The l a r g e compressi
b i l i t y thus a l l o w s one to study the p r o p e r t i e s of the s o l i d over a l a r g e
range of d e n s i t i e s and Debye temperatures.
3 4 The phase diagrams of s o l i d He and s o l i d He g i v i n g the l i q u i d -
.-.--1-.-? ~r~..J V r r ~ r > ~ 1 r*1 ^ c; ~ ^ n n l m A fVyr> *\ _"k/~»^\T r» o i - * * - - r o r ! P u K l P f ' h r r ^ f r a n Q i -* - ^ * - ~ a w - ' ~ — r \ : - i ' " ' "
t i o n l i n e s are shown i n f i g u r e 1. The phase diagram f o r the 50% mixture
i s a l s o shown f o r comparison. The hcp-bcc t r a n s i t i o n r e g i o n f o r the 50%
mixtures i s estimated by a s c a l i n g method which i s described i n Chapter V,
s e c t i o n D. The phase diagrams show the re g i o n s where the s o l i d s e x i s t and
show the minimum f r e e z i n g p r e s s u r e s .
S o l i d helium i s r e f e r r e d to as a quantum s o l i d because the
l a r g e zero p o i n t energy leads to a zero p o i n t motion of the atoms about
t h e i r e q u i l i b r i u m s i t e s which i s a l a r g e f r a c t i o n of the nearest neigh
bour d i s t a n c e . One might ask whether i t i s reasonable to speak of phonons
i n such a s o l i d . However, the neutron s c a t t e r i n g experiments of Min-4
k i e w i c z et a l . (1968) have shown t h a t hep He has a Debye-like phonon
spectrum so we w i l l t h e r e f o r e assume throughout t h i s work that the Debye
model can be used f o r s o l i d helium.
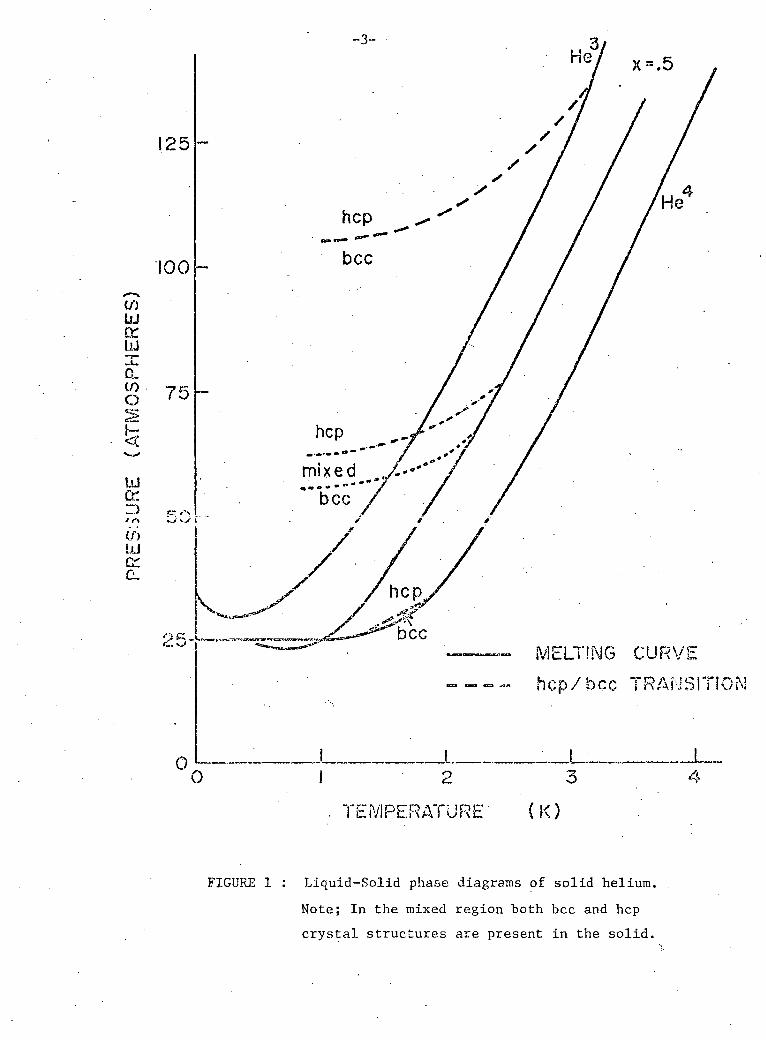
FIGURE 1 : Liquid-Solid phase diagrams of sol id helium.
Note; In the mixed region both bcc and hep
crystal structures are present in the s o l i d .
-4-
B. SOLID HELIUM MIXTURES
Any mixture which i s not i n an ordered s t a t e has a s s o c i a t e d w i t h r
t h i s " d i s o r d e r " an entropy of mixing. In a s t a t e of complete thermal
e q u i l i b r i u m at absolute zero, the atoms of each k i n d must occupy completely
ordered p o s i t i o n s . In most m a t e r i a l however, the changes i n c r y s t a l
s t r u c t u r e are so slow at low temperatures that d i s o r d e r i s " f r o z e n " i n and
a constant r e s i d u a l entropy remains. The l a r g e zero p o i n t energy and high
m o b i l i t y of atoms i n s o l i d helium mixtures permits a r e - o r d e r i n g of the
c r y s t a l when i t becomes e n e r g e t i c a l l y p r e f e r a b l e . 3 4
S o l i d He and s o l i d He are completely m i s c i b l e i n one another
above 0.38 K. The u s u a l method of d e s c r i b i n g a thermodynamic property
A (x,V,T) of a mixture i n terms of the p r o p e r t i e s of the pure substances
A^ (V,T) and A^ (V,T) f o r a molar c o n c e n t r a t i o n of He at a temperature T i s ; A (x 3,V,T) = x 3 A 3 (V.T) + (1 - x 3 ) A 4(V,T) + A ^ x ^ V . T ) ,
where A^,(x 3 ,V,T) i s the excess property. Above about 1.4 K the p r o p e r t i e s of He
mixtures along the m e l t i n g curve can be w e l l d escribed by l i n e a r i n t e r
p o l a t i o n because any A , i s s m a l l . At lower temperatures the f r e e z i n g curve
f o r mixtures drops below the f r e e z i n g curve f o r e i t h e r pure component f o r
those concentrations that have been measured ( x 3 = 1% to 85%). The hcp-bcc
t r a n s i t i o n i s a l s o c o n c e n t r a t i o n dependent. The estimated hcp-bcc
t r a n s i t i o n (Le P a i r et a l . , 1965) f o r 33 atmospheres i s shown i n f i g u r e 2.
No experimental data are a v a i l a b l e below 1 K f o r t h i s t r a n s i t i o n .
3
Below 0.38 K, and pressures up to at l e a s t 60 atmospheres, He
and He^ are no longer m i s c i b l e at a l l concentrations and phase s e p a r a t i o n
-5-
i n t o two phases takes place (Edwards et a l . , 1962; Zimmerman, 1965).
Each of the phases becomes i n c r e a s i n g l y r i c h i n one of the two isotopes
as the temperature i s decreased. The T - X diagram f o r s o l i d helium mix
tures at 33 atm. ( f i g u r e 2) showing the e q u i l i b r i u m concentrations of the
two phases i s very s i m i l a r to that of a r e g u l a r binary s o l u t i o n but
t h i s agreement i s c o i n c i d e n t a l . Volume e f f e c t s are ignored to a f i r s t
approximation i n r e g u l a r s o l u t i o n theory; whereas i n the case of s o l i d
helium mixtures, volume e f f e c t s are the dominant f a c t o r . A l a r g e d i f f e r e n c e
i n molar volumes of the two helium isotopes a r i s e s from a l a r g e d i f f e r e n c e
i n t h e i r zero p o i n t energies. The e f f e c t of the molar volume d i f f e r e n c e
w i l l be discussed l a t e r . F i g ure 2 i n c l u d e s a datum from t h i s work as w e l l
as data from work by Panczyk, S c r i b n e r , Gonanc, and Adams (Panczyk et a l . ,
1968; Adams et a l . , 1969) and Edwards, McWilliams, and Daunt (EMD) (Edwards
et a l . , 1962).
I t can be seen from the T - X diagram t h a t at pressures on the
order of 30 atm. one phase w i l l have an hep c r y s t a l s t r u c t u r e and the
other phase bec s t r u c t u r e below about 0.3 K.
The experiments described i n t h i s t h e s i s were undertaken to
determine the average s i z e s of the phase separated regions i n a s o l i d helium
mixture. We expected that phonons would be s c a t t e r e d at the boundaries 3 4 between He r i c h regions and He r i c h r e g i o n s . I f t h i s phonon s c a t t e r i n g
d i d take p l a c e , we expected to observe a change i n the temperature depen
dence of the thermal c o n d u c t i v i t y .
We w i l l d e s c r i b e the thermodynamics and k i n e t i c s of phase separa
t i o n i n Chapter I I . The theory of thermal c o n d u c t i v i t y and r e s u l t s of
previous c o n d u c t i v i t y measurements i n s o l i d helium w i l l be presented i n
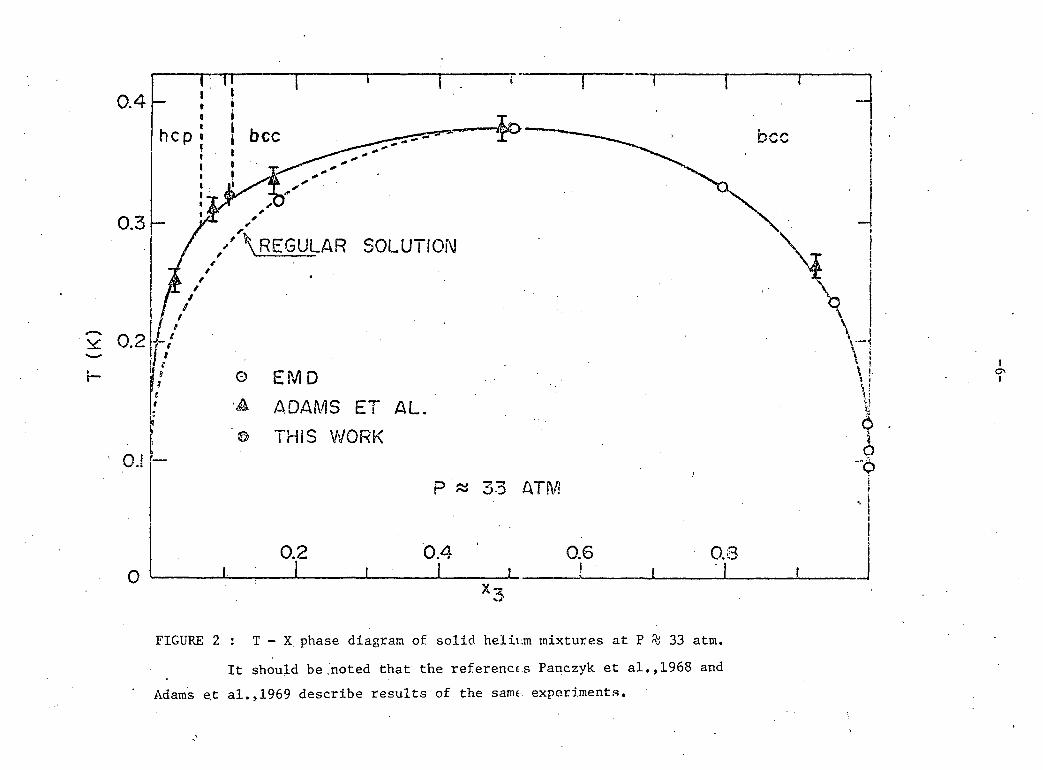
FIGURE 2 : T - X phase diagram of solid helium mixtures at P % 33 atm.
It should be .noted that the references Panczyk et al.,1968 and Adams et al.,1969 describe results of the same, experiments.
-7-
Chapter III . The experimental apparatus and procedures w i l l be described in
Chapter IV and the experimental results w i l l be discussed in Chapter V.
-8-
' CHAPTER I I
PHASE SEPARATION
A. THERMODYNAMICS OF REGULAR SOLUTIONS
A s o l i d composed of a mixture of two d i f f e r e n t types of atoms
d i f f e r s from a pure s o l i d i n the f o l l o w i n g manner (Guggenheim, 1952):
The i n t e r n a l energy U of the s o l i d must take i n t o account the
i n t e r a c t i o n energy of u n l i k e neighbouring atoms. I f we l e t x denote the
mole f r a c t i o n of component A; and l e t the s u b s c r i p t A i n d i c a t e component
A atoms and the s u b s c r i p t B i n d i c a t e component B atoms, then ( i f k i n e t i c energy can be neglected)
U = - | N [ x E ^ + (1 - x ) E B B + x ( l - x) AE]
where N = Avogadro's Number
and E..= the i n t e r a c t i o n energy between an atom of type i and i t s nearest
neighbours, a l l of type j .
A E = 2 EAB - EAA " EBB
I f AE = 0, the mixture i s considered to be an i d e a l s o l u t i o n and
no phase s e p a r a t i o n w i l l occur. The i n t e r n a l energy i s the same f o r a l l
c o n f i g u r a t i o n s of the atoms.
I f AE > 0, a l a t t i c e c o n t a i n i n g u n l i k e neighbouring p a i r s of
atoms i s not e n e r g e t i c a l l y favoured and the s e p a r a t i o n tends to c r e a t e
regions that are i n c r e a s i n g l y pure i n one type of atom as the temperature
decreases. There i s no long range order.
-9-
If AE < Oj a l a t t i c e containing unlike neighbouring pairs is
energetically favoured. Then, in a 50% mixture for example, an alternating
( A - B - A - B - A ) long range order would tend to exist at 0 K.
3 4
Solid helium mixtures separate into regions rich in He and He
respectively and AE/k = 1.5 K (Edwards et a l . , 1962).
For a regular solution AE is independent of concentration and
temperature. In addition, the excess volume V (x) is usually small and is E
neglected in the following description of a regular solution.
The excess Gibbs free energy per mole G (x,T) of the system (ignoring E
phonon energy and entropy which are negligibly small) i s :
GE(x,T) = U E + PVE - T S M * u E - x S M
The configuration entropy S^ i s : S = _ Nk [x ln x + (1 - x) l n ( l - x)]. M
The excess internal energy is U = x ( l - x)NAE/2 and the phase separation E
temperature for x = 0.5 is = AE/4k.
Figure 3 shows the value of G (x,T) for various temperatures.
It can be seen from the figure that at temperatures below T £ there
are two minima in the free energy curve at concentrations that we w i l l
c a l l x , and (the equilibrium concentrations). If a mixture of
concentration between x , and x^ (say x = .5) is cooled rapidly to
T = .8 T c i t is energetically favourable for i t to phase separate and
the most favoured concentration for the two regions are x , and x^.
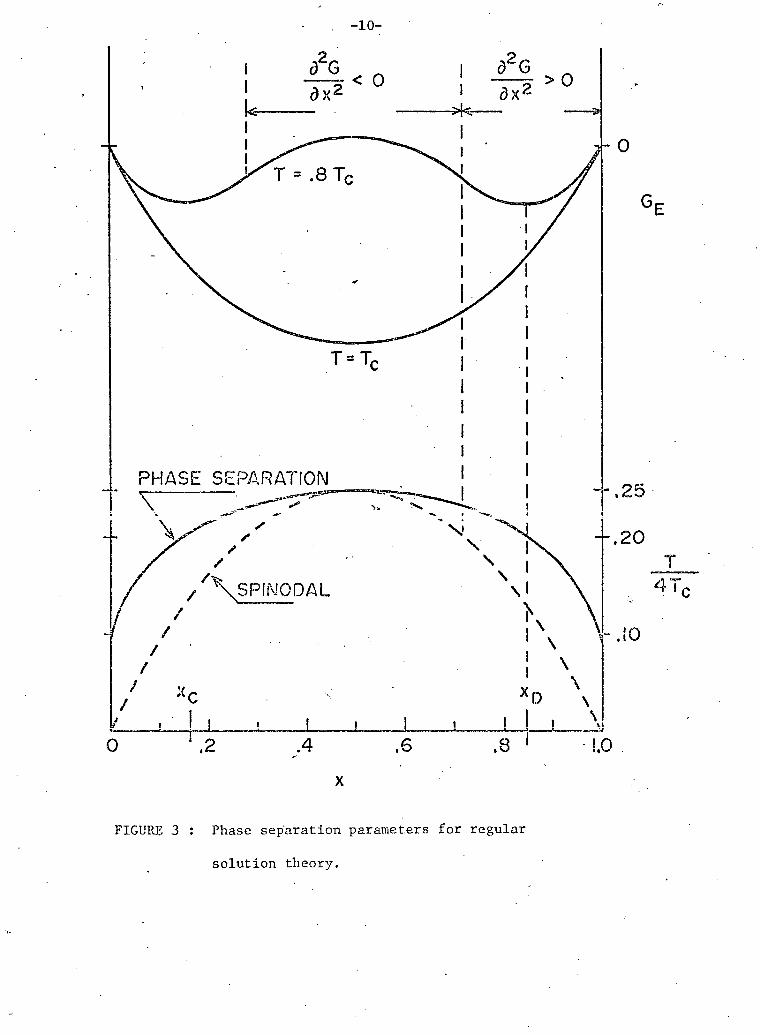
FIGURE 3 : Phase separation parameters for regular
solution theory.
- l i
l t should be noted for a complete description that lying
between the minima there are two inflexion points (spinodal points) where 2 2 2 2 8 G /9x = 0. Between these two points d G/dx is negative and diffusion E
w i l l take place up concentration gradients. A homogeneous mixture that is
cooled rapidly into this region w i l l i n i t i a l l y phase separate by "spinodal
decomposition" (Cahn, 1968). In the experiments described in this thesis
we have not been able to distinguish between i n i t i a l phase separation by
spinodal decomposition and by nucleation (described in section C of this
chapter).
and the locus of the spinodal points (spinodal line) are also shown in
figure 3.
The equation of the phase separation line is found by minimizing
G (x,T) and is
The locus of the equilibrium points (the phase separation line)
T 4T (1/2 -c x) ps
The equation of the spinodal curve is given by
T = 4T x ( l - x).
-12-
B. THERMODYNAMICS OF SOLID MIXTURES
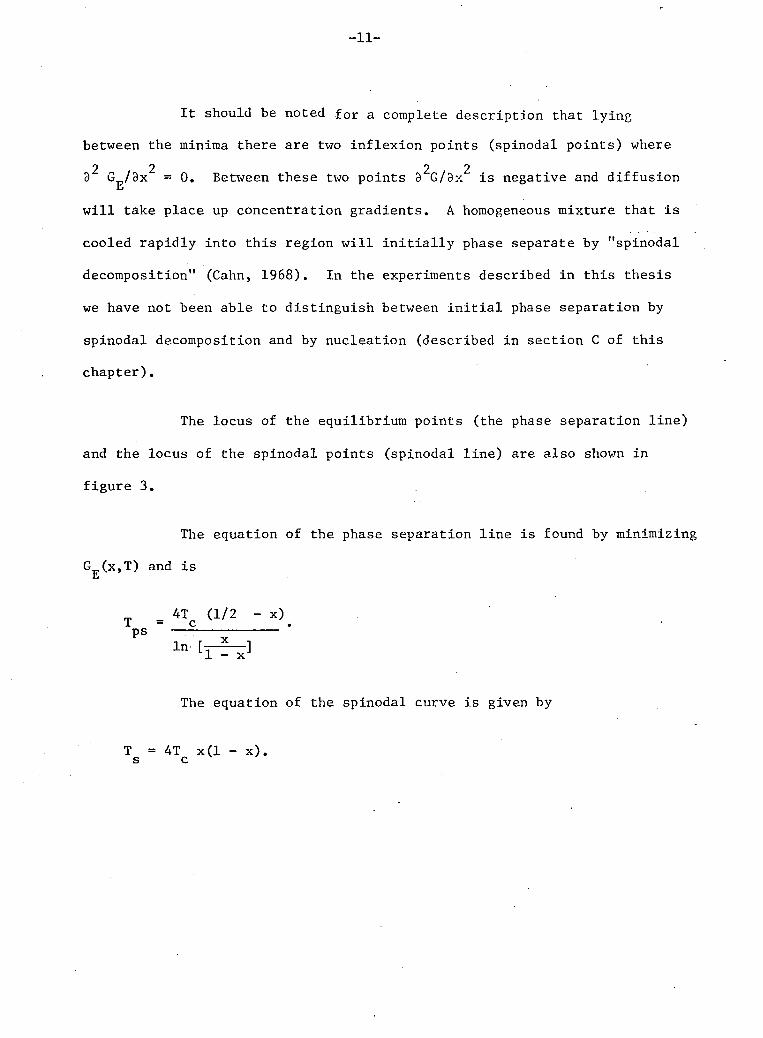
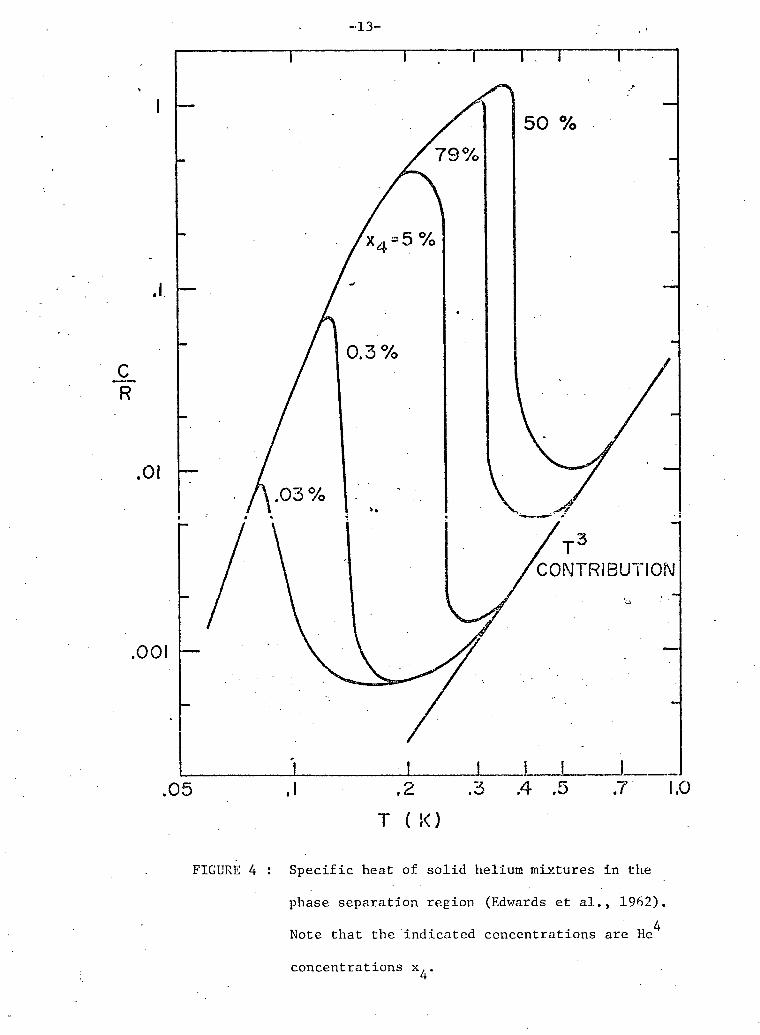
S p e c i f i c heat measurements of s o l i d He mixtures by.Edwards,
McWilliams & Daunt (1962), shown i n f i g u r e 4, i n d i c a t e d that a phase
s e p a r a t i o n occurred w i t h T^ = 0.38 K. The phase s e p a r a t i o n temperatures
T^, and s p e c i f i c heats C agreed w e l l w i t h the p r e d i c t i o n of r e g u l a r
s o l u t i o n theory w i t h the appropriate value of T . The envelope of the
s p e c i f i c heats below T p r e d i c t e d by t h i s theory i s ; ps 2
r - 'QL = ( 1 / 2 ~ X 3 ^ Nk C dT
t t x 3 ( l - x 3 ) 1 ]
where
t = kT/AE = T/4T . c
This good agreement w i t h r e g u l a r s o l u t i o n theory was r a t h e r
s u r p r i s i n g s i n c e the two regions would have d i f f e r e n t c r y s t a l s t r u c t u r e
at the pressures i n v o l v e d (30 to 40 atmospheres).
The microscopic theory of helium phase se p a r a t i o n was done by
M u l l i n (1968), who g e n e r a l i z e d the Nosanow (1966) theory of the pure
phases of s o l i d helium. M u l l i n found that the s o l i d helium s o l u t i o n
should be n e a r l y r e g u l a r , but f o r d i f f e r e n t reasons than the c l a s s i c a l
model.
Using a Hartree t r i a l wave f u n c t i o n made up of s i n g l e p a r t i c l e
wave f u n c t i o n s modified by a term to account f o r c o r r e l a t i o n s i n a
-13-
.05 .1 .2 .3 .4 .5 .7 1.0 T ( !<)
FIGURE 4 : S p e c i f i c heat of s o l i d helium mixtures i n the
phase s e p a r a t i o n r e g i o n (Edwards et a l . , 1962). 4
Note that the i n d i c a t e d concentrations are He
concentrations x..
-14-
v a r i a t i o n a l c a l c u l a t i o n , M u l l i n found that f o r helium mixtures
G E(x 3,T,P) x 3 ( l - x 3 ) [a(P) - x 3 b(P)] - TS M(x)
where a ^ 8.0 j/mole; b ^ 0.8 j/mole; at P = 36 atm.
The x 3 b ( P ) term causes an asymmetry i n the phase s e p a r a t i o n
curve. The c o e f f i c i e n t s a(P) and b(P) are c o n t r i b u t i o n s from s e v e r a l
e f f e c t s .
a(P) = c - d - e - f and b(P) = g - h
where f = -PV / x . ( l - x„) f o r excess volume V„, and e = AE(P)N/2. I f E J J • Li
t h
NE_ and are ground s t a t e energy and volume per mole of the i atoms
AE 3 = E 3 ( x 3 , P ) - E 3(1,P) % ( c ( l - x 3 ) - g x 3 ( l - x 3 ) ) / N
AE 4 = E 4 ( x 3 , P ) - E 4(0,P) % (-dx 3 - h x 32 ) / N
The only c o n t r i b u t i o n i n a r e g u l a r s o l u t i o n would be e s i n c e
one assumes V 3(0,P) = V 4(0,P) and AE 3 = AE 4 = 0. In the case of helium
mixtures, e i s very s m a l l . The important f e a t u r e of helium mixtures i s
that V 3(0,P) and V 4(0,P) are very d i f f e r e n t because of the d i f f e r e n t magni
tudes of the zero p o i n t energy. In a mixture, the volume each atom f i n d s
i t s e l f i n i s somewhat d i f f e r e n t from the volume i n a pure substance, so
E 3 and E 4 are c o n c e n t r a t i o n dependent. M u l l i n p r e d i c t e d the value T = 0.47 K and a V_ of the form r c E
3 PV„ = - f x _ ( l - x.) where f = 0.4 P cm /mole. E J J
-15-
Panczyk et a l . (1968) measured the change in pressure of solid
samples in constant volume chambers. The excess pressure determined by
this method can be related to the excess volume. The excess volume
results and the observed asymmetry in the phase separation curve were in
good agreement with Mullin's theory.
-16-
C. KINETICS OF PHASE SEPARATION
Measurements of properties in the phase separation region are
done after growing a crystal, annealing and then cooling below T ps
Depending on the pressure and concentration, the sample may have either
a bec or hep crystal structure or a mixture of both. When phase separa
tion takes place the two stable phases form in some domain structure.
We w i l l assume that domains rich in the dilute isotope form in a matrix
of the more abundant isotope. At sufficiently low temperatures an hep-bec
transition w i l l take place in either the domains or the matrix. Finally
to minimize the total surface energy of the domains, the system w i l l tend
to the condition of one domain. These three processes have very different
time constants.
The experiments of Edwards et a l . and Panczyk et a l . indicated
that time constants x of the order of tens to hundreds of seconds were
associated with the phase separation ordering process. The time
constants observed by Edwards et a l . were independent of temperature and
concentration, but increased with increasing pressure. Edwards et a l .
assumed that quantum mechanical tunnelling was the diffusion mechanism. 3
Using He spin diffusion data (Reich, 1963), they estimated a diffusion
distance of 10 microns; this was the size of the pores in the sintered
copper sponge that they used for a sample chamber.
Adams et a l . (1969) observed time constants that were dependent
on temperature, concentration and pressure as well as whether cooling or
warming was taking place. These data are l i s t e d in Table 1.
-17-
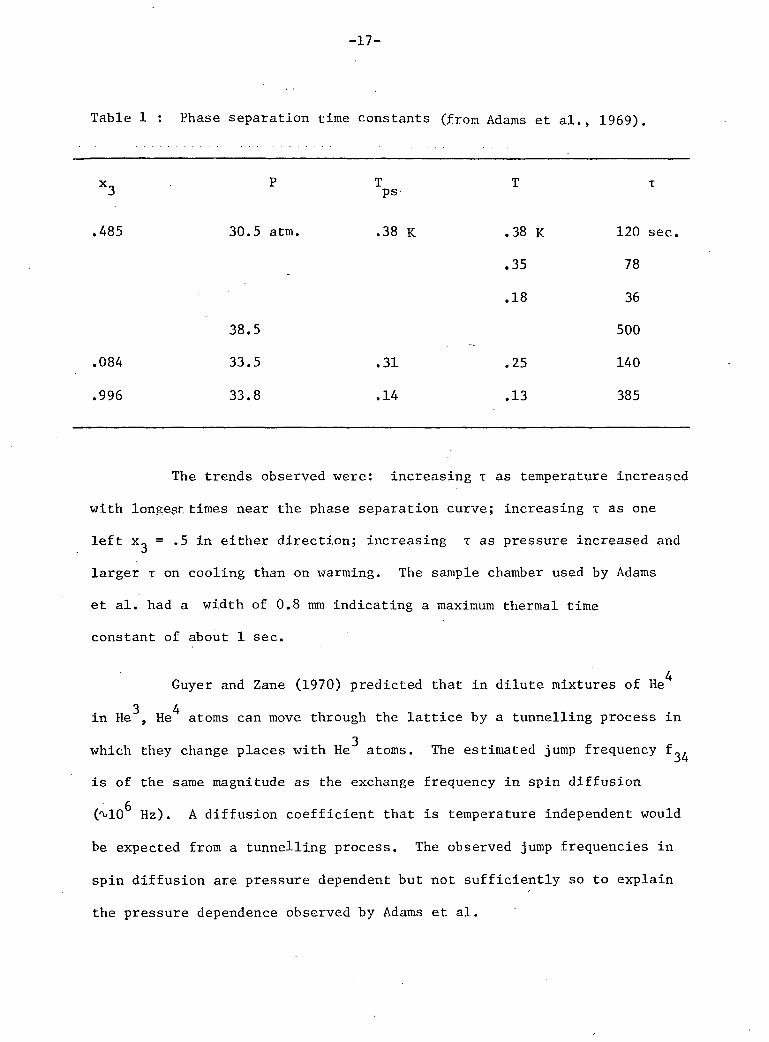
Table 1 : Phase separation time constants (from Adams et a l . , 1969).
x_ P T T T 3 PS
.485 30.5 atm. .38 K .38 K 120 sec.
.35 78
.18 36
38.5 500
.084 33.5 .31 .25 140
.996 33.8 .14 .13 385
The trends observed were: increasing x as temperature increased
with longest times near the phase separation curve; increasing x as one
l e f t = .5 in either direction; increasing x as pressure increased and
larger x on cooling than on warming. The sample chamber used by Adams
et a l . had a width of 0.8 mm indicating a maximum thermal time
constant of about 1 sec.
4 Guyer and Zane (1970) predicted that in dilute mixtures of He
3 4 in He , He atoms can move through the la t t i c e by a tunnelling process i n
3
which they change places with He atoms. The estimated jump frequency f ^
is of the same magnitude as the exchange frequency in spin diffusion
0 10 Hz). A diffusion coefficient that is temperature independent would
be expected from a tunnelling process. The observed jump frequencies in
spin diffusion are pressure dependent but not sufficiently so to explain
the pressure dependence observed by Adams et a l .
-18-
Greenberg et a l . (1971) measured the spin relaxation times 3 4
and of He impurities in solid He crystals. They deduced tunnelling
frequencies that had a much stronger pressure dependence than the spin exchange
frequency. They found f = 4 x 10^ sec for P = 25 atm. and 4 -1
f^^ = 2 x 10 sec at P = 42 atmospheres.
Adams et a l . found the time constant for the crystallographic
change was much longer than the time constant for phase separation. The
measurements were made rapidly enough that the decrease in pressure due to
the transition from bec to hep or the increase due to the hep - bec
transition was small compared to the pressure changes due to phase separa
tion.
The clustering process that takes place during phase separation
requires a net movement of matter in the crystal. The key aspect i s that,
on the average, atoms w i l l diffuse in such a way as to decrease the total
free energy of the solid. Three distinct processes are successively
involved (Fine, 1964). Stable nuclei w i l l form from fluctuations which
reach a c r i t i c a l size. The probability of such a c r i t i c a l fluctuation i s
exp(-AG /kT) where AG is the energy of formation of a c r i t i c a l nucleus, c c
Further growth w i l l lower the total free energy. The nuclei grow, at a
rate controlled by the diffusion of solute, u n t i l the concentration of the
solute in the matrix approaches i t s equilibrium value. Assuming spherical
domains, there w i l l then be a distribution of domain sizes with an average
radius Y • Since the surface free energy per unit volume of a domain
-19-
i s i n v e r s e l y p r o p o r t i o n a l to i t s r a d i u s , the l a r g e domains w i l l now
grow by the d i s s o l u t i o n of smaller g r a i n s . During t h i s t h i r d stage
(coalescence or coarsening) the average domain r a d i u s r as a f u n c t i o n of
time t f o r a d i f f u s i o n c o e f f i c i e n t D i s given by ( L i f s h i t z and Slezov, 1961):
r 3 - r 3 = 8DV x ot/9RT o m e
where a i s the su r f a c e f r e e energy per u n i t area, V i s the molar volume of m
the m a t r i x , x g i s the s u p e r s a t u r a t i o n of the m a t r i x at the s t a r t of
coarsening, and R i s the gas constant. We w i l l estimate a using the r e g u l a r
s o l u t i o n r e s u l t f o r a l i q u i d (Cahn and H i l l i a r d , 1958):
. * 1.7 . iO" 7 c i e - T ) / v 2 / 3 iiE2|££l 2 /3 m cm K
For T_ - T = 0.1 K and = 23 cm 3/mole, a & 2 x 10~ 9 J/cm 2.
We w i l l estimate r ( t ) f o r a s o l i d helium mixture u s i n g the approx-
imate parameters, D % 3 x 10 cm /sec and x^ % 0.01. Then, f o r r >> r Q
dr = 2 x 10 ^ / r 2 cm/sec. dt
— -4 'b
The time taken f o r coarsening to r = 10 cm i s t ^ 100 days. This i s only
an order of magnitude r e s u l t s i n c e the s e l e c t i o n of the value of x g was
a r b i t r a r y . In an i s o t r o p i c medium that cannot support shear the t o t a l
f r e e energy w i l l be a minimum f o r s p h e r i c a l domains. L i f s h i t z and Slezov
show that the s i z e d i s t r i b u t i o n of the domains, a f t e r coarsening has pro
ceeded f o r some time, w i l l be sha r p l y peaked at r w i t h a c u t - o f f r a d i u s
at 1.5 r .
-20-
CHAPTER III
THERMAL CONDUCTIVITY
A. HISTORY
Heat conductivity was f i r s t defined by Fourier (1822) whose
object was "to set forth the mathematical laws which heat obeys". Fourier
defined thermal conductivity by considering a homogeneous solid enclosed
between two para l l e l and i n f i n i t e planes whose temperatures v were held
at constant values. Then,
"If F i s the quantity of heat which, during a unit of time, passes across a unit of area of the surface taken on a section parallel to the base, F = - K dv/dx. We have taken this coefficient K, which enters into the equation, to be the measure of the specific conductivity of each substance; this number has very different values for different* bodies»"
Fourier's analysis described the conduction of heat given the
boundary conditions and the various coefficients. His work did not attempt
to explain the mechanism of conductivity.
y The earliest experiments were done with long rods which were
heated at one end and cooled by radiation. In the experiments of Ingen-Hausz
(1789) the rods were coated with a thin layer of wax and therefore the
temperature was known only at the heated end and at the point where the wax
melted. This experiment was suggested by Benjamin Franklin. Despretz
(1827) determined temperatures by placing thermometers in holes equally
spaced along the rod. Using this technique, Wiedemann and Franz (1854)
determined empirically that at a given temperature the ratio of the thermal
and e l e c t r i c a l conductivities is the same for a l l metals. Lorentz (1872)
-21-
determined that this rat io i s proportional to the absolute temperature.
Very elegant experiments on the conductivity of dielectr ics
were done by de Senarmont (1847). He cut thin slabs with para l le l sides
from single crystals , coated the surfaces with a thin layer of wax and
applied heat to one point. At equilibrium, the anisotropy of the
conductivity was indicated by the shape of the edge of the molten wax.
The shape was a c i r c l e for isotropic materials such as glass or cubic
crystals , independent of the direction of the cut. However, for other
crystals the shape was e l l i p t i c a l . By. cutting the slabs in various
crystal directions de Senarmont constructed the e l l i p s o i d a l isotherms for
a crystal heated at one internal point. It was found that these e l l i p -
showed that by assuming that heat was conserved the problem of conduction
in anisotropic bodies could be.reduced to the corresponding problem
concerning isotropic bodies.
Debye (1914) attempted to explain conduction in dielectr ics by
assuming a model of heat transfer by propagation of elast ic waves i n a
continuous medium. These waves would be scattered by density variations
in the sol id that are produced by the whole set of waves.
Pauli (1925) showed that the atomic nature of the solid must be
considered when the scattering centres moved with the same order of
velocity as the waves themselves. Peierls (1929) did the f i r s t rigorous
V -22-
calculation of mutual scattering of quantized la t t i ce vibrational waves
(phonons) and showed that the thermal conductivity of dielec t r ics
increases as exp (0/bT) with decreasing temperature. Peierls showed
that two types of phonon-phonon scattering processes (normal processes
and Umklapp or flop-over processes) could occur. The normal processes
do not change the direction of energy flow whereas the Umklapp processes
change the direction of energy flow to any one of several equivalent
crystallographic directions.
-23-
B. THEORY OF THERMAL CONDUCTIVITY
If one were able to construct a perfect, i n f i n i t e , dielectric
crystal whose interatomic potentials were harmonic, then phonons created
at the heat source would travel without scattering to the heat sink.
The conductivity K of real materials i s limited by the effects of various
phonon scattering processes.
If we consider a small imaginary volume in a solid, at equi
librium the number of phonons of frequency to is given by the equilibirum
Planck distribution N q = [exp (fito/kT)- 1] \ In the presence of a heat
current Q = -KVT, changes (-VVN) in N (the phonon population distribution
at time t) w i l l occur because of transport of phonons of group velocity v
through the walls of the volume, because of the temnp.rature gradient.
There w i l l also be population changes (8N/9t) due to phonon collisions c
with other phonons, impurities and various crystal imperfections. In the
steady state, the total time rate of change of the population must be
zero.
(3N/9t) + v" • VN = 0 c
This Boltzmann equation has not been rigorously solved.
(9N/St) c can be approximated by assuming that in the absence of a heat
current any deviation in the population from N^ damps out exponentially
with a relaxation time T. In the presence of a heat current, resistive
scattering processes tend to return the distribution to N q whereas normal
processes (which are not i n themselves resistive) lead to a displaced
Planck distribution N(£). In an isotropic medium 5 is a vector in the
direction of the heat current.
- 2 4 -
Callaway (1959) i n c l u d e d the e f f e c t of normal processes i n the
c a l c u l a t i o n by the approximation:
(m) = N ( T ) - N - N - N —o
where x i s the r e l a x a t i o n time f o r normal s c a t t e r i n g processes and x i s
the t o t a l r e l a x a t i o n time f o r the r e s i s t i v e s c a t t e r i n g processes. Callaway
c a l c u l a t e d the c o n d u c t i v i t y f o r an i s o t r o p i c Debye s o l i d ,
K = v 2
2 v-/
x c
1 - B x
N J C(k) k 2 dk
where — = — , B = - gT/nv 2 VT, X X X C N R
C(k) i s the phenen s p e c i f i c h<??t: ?r>r! k if? the ohotion wave irninher. The
constant g i s evaluated using the f a c t that the r a t e of change of the
t o t a l phonon momentum due to normal processes i s zero. The r e s u l t i n g
i n t e g r a l s can be evaluated approximately i f one r e s i s t i v e process i s
dominant. I f s e v e r a l r e s i s t i v e processes of n e a r l y equal importance are
present the i n t e g r a l s must be evaluated n u m e r i c a l l y . Some of the
s c a t t e r i n g processes are des c r i b e d below.
Normal S c a t t e r i n g
These are phonon-phonon s c a t t e r i n g processes that conserve
c r y s t a l momentum. At low temperatures we need only consider three-phonon
processes. Normal processes are not r e s i s t i v e ; however, they r e d i s t r i b u t e
energy throughout the phonon modes. I t can be seen i n Callaway's theory
-25-
that as normal processes become slower compared to defect scattering the
conductivity rises because the most strongly scattered phonon modes are
depleted of phonons.
Herring (1954) showed that elastic anisotropy has a drastic
effect on the c o l l i s i o n probabilities of phonon modes of very low frequency.
Well below the Debye temperature the relaxation for these processes was
calculated to be
where a depends on crystal symmetry and phonon polarization. At high
temperatures the relaxation rates become less temperature dependent. The
normal processes relaxation time i s rather d i f f i c u l t to determine experi
mentally. The best estimates are from conductivity results in che pnonon
Poiseuille flow region.
Umklapp Processes
These are three-phonon processes which do cause a thermal
resistance because they change the direction of energy flow. Peierls (1929)
showed that the Umklapp relaxation time is given by
1/T u = B u T n exp [6/ b T]
where b i s a constant (b 2).
This behaviour was verified experimentally by Berman et a l .
(1951). The exponential factor i s so strong that the choice of n is not
significant. At the temperature of the experiments described in this
thesis, Umklapp processes w i l l not be important.
-26-
Bouridary S c a t t e r i n g
At low enough temperatures i n pure c r y s t a l s the mean f r e e path X
becomes comparable to the dimensions of the c r y s t a l and the thermal
c o n d u c t i v i t y becomes dependent on the.sample s i z e . This e f f e c t was f i r s t
observed by de Haas and Biermasz (1938) and explained by Casimir (1938).
The r e l a x a t i o n time i s r e l a t e d to the c h a r a c t e r i s t i c dimension L and. the
sound v e l o c i t y v by the temperature and frequency independent expression
'1_ _ v = v. T b " L " A
P o i n t Defect S c a t t e r i n g
The s t r a i n f i e l d s r e s u l t i n g from p o i n t defects give a r e l a x a t i o n
time p r o p o r t i o n a l to co 4 . Carruthers (1961) suggests that i t i s not
c o r r e c t to consider t h i s to be e s s e n t i a l l y Pv.ayleigh s c a t t e r i n g because
the s t r a i n f i e l d s are not l o c a l i z e d .
We w i l l be concerned w i t h the case i n which the p o i n t defect i s
an i s o t o p e . Pomeranchuk (1942) f i r s t p ointed out that such a defect
would cause thermal r e s i s t a n c e . Klemens (1955) derived the f o l l o w i n g
r e s u l t assuming that the s c a t t e r i n g i s due to mass d i f f e r e n c e s o n l y .
1 = A co4 = VEx. (AM./M)2co4
K . 1 1 TM
th where x^ i s the mole f r a c t i o n of the i i s o t o p e , of atomic mass M^, M = Zx.M. and AM. = M. - M. . 1 1 i i l
-27-
For the case x^ << x^ Ziman (1956) obtained a limiting conduc
t i v i t y for mass defect scattering by a variational calculation. This
Ziman limit places a lower bound on the conductivity. The restriction
T\, < < : T., indicates that the result i s only valid for small defect N M J
3
concentrations. For helium mixtures with He concentration x^ using a
Debye model (units for V are cm /mole). K = 10" 7 6 2 ( 4 - x 0 ) 2 W/cm K. . z 3
V 1 / 3 x 3 ( l - x 3)
Berman et a l . (1959) extended the variational calculation to
cover the whole range of concentrations by including the effect of normal
processes on the thermal conductivity. In the region where only defect
and normal processes are impuj." LauL, Cue tiieo-al cuiid uC t i v i ty was found to -1/2
have a concentration dependence of approximately [x (1 - x)] instead of [x (1 - x) ] This is i n agreement with calculations using Callaway's
theory. The thermal conductivity for a Debye model of solid helium with 3
He concentration, x 3 in the intermediate concentration region is given by
(Berman, 1965 b) 2/3
K = 1.28 x 10~7 6^ ( 4 ~ X3* T~ 3 / 2 _W_ Y x 3 ( l - x3)-L/2 cmK
The Grlineisen constant y is used in the theory as an estimate
of the anharmonicity of the l a t t i c e and has been used as a single adjust
able parameter to f i t experimental data.
3 Klemens and Maradudin (1961) showed that when a He isotope is
4 placed in a l a t t i c e of He atoms the la t t i c e i s distorted outward by
-28-
several percent. Klemens (1967) extended- the. calculation to include the
change in the local bulk modulus due to the changed zero point energy.
The effect of this l a t t i c e distortion is to enhance the defect scattering.
The point defect relaxation time is then calculated to be
where V,M = average molar volume and atomic mass
AV,AM = differences for the solids of pure isotopes at the same
pressure
Y i s a parameter which depends on the elastic constants of the solid.
The theory for intermediate concentrations can be corrected for
the effect of l a t t i c e strain by reducing the calculated conductivity by 1 I?
the factor (A/A^) ' .
Kinetic Theory Approximation
In order to use Callaway's analysis profitably one must have a
reasonable estimate of the normal process relaxation time. Most authors
have treated this as an adjustable parameter to obtain the best f i t to
their data. The only direct estimate of x^ can be made from thermal
conductivity or second sound measurements in which Poiseuille flow is
present. Poiseuille flow has been observed in pure, single crystals of
solid helium i n the temperature region where the only resistive process
is boundary scattering and x < x . The phonons w i l l random walk to the
-29-
crystal boundaries before a resist ive scattering takes place. The
effective mean free path is larger than the crystal diameter and is
inversely proportional to x . (See Guyer and Krumhansl (1966)). The
Poiseuil le flow measurements have a l l been made at much higher pressures
than the work presented in this thesis, leaving us with the alternative
of estimating x^ by curve f i t t i n g . Our data do not give us suff ic ient
information to do such a curve f i t t i n g . In the region below the phase
separation the phonon scattering was observed to be frequency independent
so we w i l l analyze the data quali tat ively using the kinetic approximation:
K = CvA/3 = Cv 2 x /3 .
-30-
C. PREVIOUS EXPERIMENTAL RESULTS IN SOLID HELIUM
3 4 Pure He and He
The f i r s t e x tensive measurements of the thermal c o n d u c t i v i t y 4
of s o l i d He were done by Webb, W i l k i n s o n , and Wilks (1952). They found
that the phonon mean f r e e path v a r i e d e x p o n e n t i a l l y w i t h 1/T f o r samples
grown at pressures between 50 and 150 atmospheres. This was the Umklapp
s c a t t e r i n g behaviour p r e d i c t e d by P e i e r l s . Subsequent measurements by
Walker and Fairbank (1960 b) agreed w i t h the above. Bertman et a l . (1966 b)
extended the measurements to 0.5 K and found that i n the hep phase of
both s o l i d s the thermal c o n d u c t i v i t y showed a maximum. Above the maximum
the c o n d u c t i v i t y v a r i e d e x p o n e n t i a l l y w i t h 1/T over three orders of
magnitude. Below the maximum they -found the c o n d u c t i v i t y to be c h a r a c t e r -3
i s t i c of boundary s c a t t e r i n g w i t h a T dependence and a phonon mean f r e e
path comparable to the sample diameter. A l l the above measurements were
done on c r y s t a l s grown at constant volume using the blocked c a p i l l a r y
method.
Measurements by Mezhov-Deglin (1964) and Hogan et a l . (1969) on
c r y s t a l s grown at constant pressure showed an enhancement of the thermal
c o n d u c t i v i t y peak and T 7 dependence below the peak as would be expected
from P o i s e u i l l e flow of phonons (Guyer and Krumhansl, 1966). 3
Measurements on bec He have shown an anomalously low c o n d u c t i
v i t y above the maximum (Walker and Fairbank, 1960 b ) . Thomlinson (1969)
measured the c o n d u c t i v i t y between 0.1 K and the m e l t i n g temperature and

-31-
found that the r e s u l t s above the maximum could not be i n t e r p r e t e d i n terms
of exp (6/bT). P l o t s of l o g K as a f u n c t i o n of 1/T gave a n o n l i n e a r
r e s u l t that could not be normalized w i t h respect to 8. At temperatures 2.5
w e l l below the maximum Thomlinson observed a T ' temperature dependence 3.5
which i n c r e a s e d to T * j u s t below the peak (suggesting that P o i s e u i l l e 2 5
flow of phonons was p r e s e n t ) . The T " dependence was c o n s i s t e n t w i t h
anomalous s p e c i f i c heat r e s u l t s obtained by Sample and Swenson (1967) and
al s o by Pandorf and Edwards (1968). Greywall and Munarin (1970) i n f e r a
very low sound v e l o c i t y i n the (101) d i r e c t i o n from measurements on o r i e n t e d 3
s i n g l e c r y s t a l s at V = 21.6 cm /mole. A l l these measurements suggest an 3
anomaly i n the bcc He phonon spectrum.
Helium Mixtures 4
Walker and Fairbank (1960) found that the c o n d u c t i v i t y of He was 3
reduced by adding He . Callaway (1961) analyzed t h e i r experimental r e s u l t s
and found that he could o b t a i n good agreement w i t h h i s theory by assuming
that the p o i n t defect s c a t t e r i n g parameter was three times stronger than
the parameter due to mass d i f f e r e n c e s c a t t e r i n g only. Klemens and Maradudin 3
(1961) showed that a 1% - 2% l a t t i c e d i s t o r t i o n about the He l a t t i c e s i t e s
would account f o r the l a r g e s c a t t e r i n g parameter. Bertman et a l . (1966) measured the c o n d u c t i v i t y of e i g h t d i f f e r -
3 ent concentrations at molar volumes of 19.5 and 20.2 cm /mole. They analyzed t h e i r r e s u l t s using the Callaway theory and a normal process
3 2 r e l a x a t i o n time 1/T m = B T W w i t h a d i f f e r e n t value of B f o r each
-32-
concentration. B^ was used as an adjustable parameter i n f i t t i n g the data.
They concluded that the point defect scattering depended on concentration
more strongly than x ( l - x) .
Berman et a l . (1965) measured the conductivity of a number of
mixtures grown at constant volume from the same starting pressure. This
gave a similar value of B^ for the group of mixtures. They analyzed their
2 2 results using 1/T . t = B„ T OJ . B„, was held fixed for each starting N N N
pressure and was determined by f i t t i n g the data using Callaway's theory.
They found that the point defect scattering could be explained using both
mass difference and la t t i ce s train contributions. The magnitude of the
l a t t i c e strain effect was smaller than the theoretical value but i t s
pressure variation was as predicted. Subsequent measurements by Berman
et a l . (1968) extended the measurements to starting pressures of 17Q0
atmospheres. The la t t i ce distort ion results could be f i t ted by
A_ = 1 + Y fAV] 2 f i l l 2
Air L v j LAMJ
with a value of Y = 3.7 as compared to the theoretical value of Y % 16.
Conductivity measurements by Berman et a l . (1965) indicated
that point defect scattering effects in bec mixtures and hep mixtures are s imilar . Values of (A/A ) % 2 were necessary to account for strain f i e l d
K enhancement in bec mixtures.
-33-
CHAPTER IV
APPARATUS
A. DILUTION REFRIGERATOR
The temperatures r e q u i r e d f o r these experiments were obtained
us i n g a d i l u t i o n r e f r i g e r a t o r (Wheatley e t a l . , 1968) w i t h two s i n t e r e d
copper heat exchangers.
The c r y o s t a t c o n s i s t e d of a g l a s s l i q u i d n i t r o g e n dewar, a
10 cm. i . d . g l a s s l i q u i d helium dewar and a metal vacuum can tha t contained 3
a 90 cm 1 Kh e l i u m pot and the d i l u t i o n r e f r i g e r a t o r . Figure 5 i l l u s t r a t e s
the c r y o s t a t and the r e f r i g e r a t o r .
Room Temperature Parts
3
The r e f r i g e r a t o r used 4 l i t e r s of helium gas (about 20% He )
which was st o r e d i n two 20 l i t e r c o n t a i n e r s when the r e f r i g e r a t o r was not
i n use. Gas was r e c i r c u l a t e d using an Edwards 2M4A mercury d i f f u s i o n 3
pump and a Welch 1402KBG mechanical pump s p e c i a l l y sealed f o r use w i t h He . The gas mixture was cleaned by a l i q u i d n i t r o g e n cooled trap c o n t a i n i n g
3 about 100 cm of Linde molecular s i e v e .
To reduce mechanical v i b r a t i o n i n the c r y o s t a t , the plumbing was
i s o l a t e d from the c r y o s t a t by bellows tees and the mechanical pump was
f u r t h e r i s o l a t e d by another set of bellows tees. The plumbing p l a t f o r m
was b o l t e d to the cement l a b o r a t o r y f l o o r and a l s o weighted by 100 pounds
of sand. >
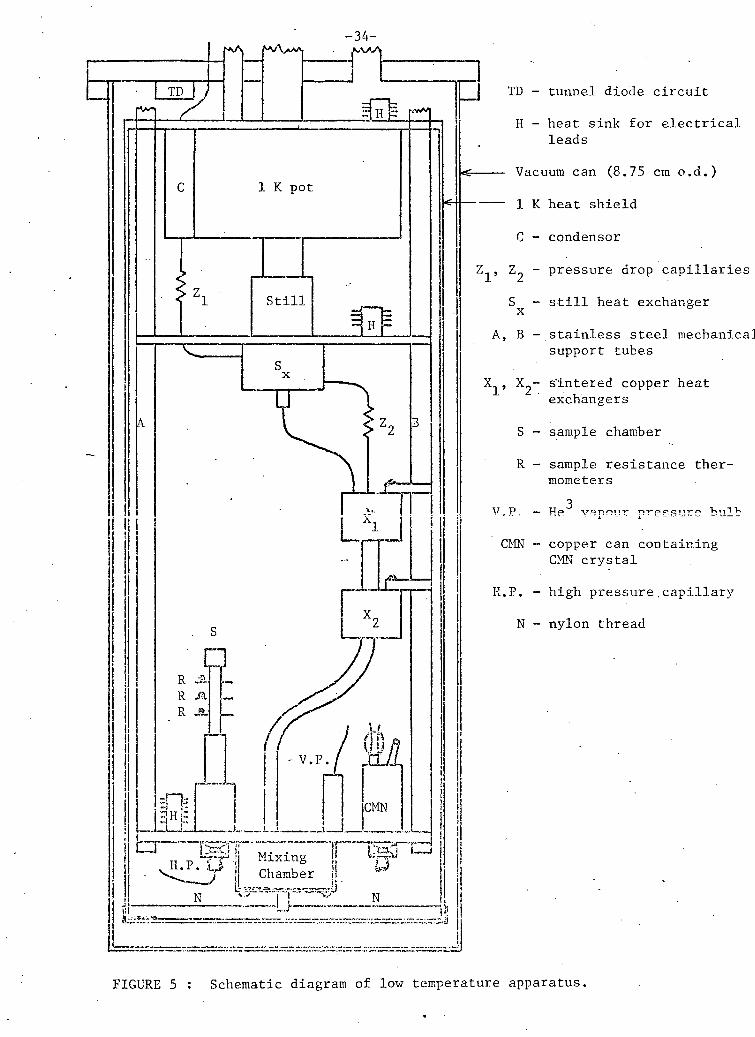
I TD - tunnel diode circuit H - heat sink for electrical
leads
Vacuum can (8.75 cm o.d.)
1 K heat shield
C - condensor
Z^, - pressure drop capillaries
S^ - s t i l l heat exchanger
A, B - stainless steel mechanical support tubes
X^, s'intered copper heat exchangers
S - sample chamber
R - sample resistance thermometers
P o v a T ^ n i i v r> t - c * 5^ 11 V ^ T T V . ... \ • T 7 ...... _-_ _ _. ._ _.
copper can containing CMN crystal
high pressure.capillary
nylon thread
FIGURE 5 : Schematic diagram of low temperature apparatus.
-35-
The cryostat was supported by a w e l l braced wooden stand which
was weighted with 200 pounds of sand.
Low Temperature Parts
3
The r e c i r c u l a t i n g He was cooled i n copper heat exchangers at
80 K and 4 K, then condensed i n a sin t e r e d copper condenser at 1 K. The
pressure i n the condenser was kept above 30 mm Hg by a flow l i m i t i n g
impedance between the condenser and the s t i l l heat exchanger. The
impedance consisted of a short length of .015 cm i . d . c a p i l l a r y containing
a t i g h t f i t t i n g constantan wire. The impedance was tested at room temper
ature and cut to the required length. The s t i l l heat exchanger consisted
of 2.9 metres of .080 cm o.d. s t a i n l e s s s t e e l c a p i l l a r y wound on a copper
spool that was bolted to the bottom of the s t i l l . A layer of copper wire
was wound between each layer of c a p i l l a r y and bonded with G.E. 7031 varnish.
Each s i n t e r e d copper heat exchanger was constructed by s i n t e r i n g
copper plugs i n t o two p a r a l l e l holes i n a s o l i d copper block. The i n t e r
connecting c a p i l l a r i e s were s o f t soldered to flanged end plugs that were
bolted to the copper blocks. Indium wire "0" rings provided a vacuum s e a l .
The upper h a l f of the copper mixing chamber was s i l v e r soldered
to a 0.19 cm thick copper p l a t e that served as an isothermal platform for
a t t a c h i n g experiments, thermometers and a heater. The lower h a l f was a
copper cup containing sintered copper. The two halves were flanged for an
indium "0" r i n g s e a l and bolted together.
-36-
The s t i l l was machined from a solid copper block and superfluid
film flow up the pumping line was suppressed by a .10 cm diameter electro-
polished o r i f i c e . The s t i l l had two indium "0" ring seals.
There were a total of twelve indium seals in the refrigerator.
The indium wire was li g h t l y greased before the seal was made. The only
leaks encountered took place at flanges that were slightly warped due to
silver soldering. Resurfacing the flanges solved the problem.
Mechanical support for the refrigerator was provided by three
equally spaced .635 cm o.d. stainless steel tubes soldered to the 1 K pot
and the s t i l l plate and bolted to the mixing chamber. Heat leak down these
mechanical supports limited the refrigerator to a lowest temperature of
Oft -i-.V <!*vma f" ! ? i i - ! . - . - . 1 *-.» ^ J ^ J - - ...f i i i. - „ . n J \ J *_ ^ j - ^ - • - j - i . x ^ ^ ^ w ^ j - w i i v- M ^ b * 4 ~ u_ ^ ^.I^LJ i w i o i _ u . _ L . i - t t u u b C i j j i_/Vv c i _- L / i .
0.5 mW were 8 yW at .12 K, 34 yW at 0.20 K, 70 yW at 0.30 K, and 186 yW
at 0.43 K.
-37-
B . THERMOMETRY
3 The primary thermometer was a He vapour pressure thermometer
with i t s bulb attached to the mixing chamber plate. The pressure was
measured on a butyl phthalate (C^g 0^) o i l manometer using a Cenco
cathetometer. The manometer readings were corrected for density changes
due to room temperature changes using the results of Johnson (1968). The 3
He temperatures were determined from the 1962 vapour pressure scale of Sydoriak and Sherman (1964). In a separate experiment the mixing chamber
4 plate was connected to the i K p o t by a copper rod and the 1 K pot He vapour pressure was determined by both a butyl phthalate and a mercury ~~ 4 4 manometer. The He temperatures were determined using the T^g He vapour
3 4
pressure scale (van Dijk et a l . , 1960). The He and He temperatures were
found to agree within a mil l i k e l v i n bet ween 1.1 K and 1.6 K. The primary thermometer below IK was a self inductance cerium
3
magnesium nitrate thermometer that was calibrated against the He temperature
between 0.5 K and 1.6 K. The secondary resistance thermometers were calibra
ted using the CMN thermometer.
The vali d i t y of the low temperature scale was checked by measuring
the thermal conductivity of the stainless steel sample chamber and also by 4
measuring the conductivity of solid He .
CMN Thermometry
The primary thermometer for the temperature region below 1 K was a
cerium magnesium nitrate (CMN) magnetic susceptibility thermometer. (See
Betts et a l . , 1964).
-38-
A cylinder (1 cm diameter, 2 cm long) was cut from a single
crystal and placed in the inductance c o i l of the parallel resonant c i r c u i t
of a tunnel diode oscillator. The resonant frequency (about 1.5 MHz) was
measured by a General Radio 1191 counter.
The inductance of the c o i l depends upon the magnetic susceptibility
of the material i t contains. If L q is the inductance of the empty c o i l ,
then the inductance of the c o i l f i l l e d to a fraction n of i t s volume with a
material, whose susceptibility is x = X"* ~ ix""» is given by
L = L Q ( 1 + 4TTTJX')«
The resonant frequency f of a f i l l e d c o i l is related to the frequency of the
1 = 1 (1 + 4TTT1X').
The susceptibility of a paramagnetic material is
X'= C . T + G
c
CMN was chosen because i t s Curie temperature 8^ is very small and
Curie's Law (x = C/T) can be assumed to well below the temperature range of
this experiment (see Daniels and Robinson, 1953). It also has a very small
specific heat permitting very short equilibrium times. Because of the
anisotropy of the susceptibility the cylinder was cut from the crystal so
that the trigonal axis was perpendicular to the axis of the cylinder.

- 3 9 -
I f 2TTf T t >> 1 and 2nfx << 1 where T t i s the s p i n l a t t i c e L s L r e l a x a t i o n time and t g i s the s p i n - s p i n r e l a x a t i o n time we can assume
( f o r s m a l l e x t e r n a l f i e l d s ) that y" = X where y i s the i s o t h e r m a l o o
s u s c e p t i b i l i t y . These requirements are met by CMN at a frequency of about
1 MHz. I f the departure of the frequency of the f i l l e d c o i l from the
frequency of the empty c o i l i s s m a l l then we can use the approximate r e s u l t
1/T = A ( l - f_) f o
where
A = 1/2-TnC w i t h a t y p i c a l value of A = 391.7 K - 1
C = Curie constant
n = f i l l i n g f a c t o r £ .5.
The second order terms t h a t have been neglected i n t r o d u c e an
e r r o r i n T of about 0.2% over the temperature range of the c a l i b r a t i o n .
The values of A and f were obtained by a l e a s t squares f i t to 3
c a l i b r a t i o n s of f against the He vapour pressure temperature T. The
standard d e v i a t i o n of the f i t t e d parameter A was t y p i c a l l y 0.1%. I t
should be noted that f i s a property of the o s c i l l a t o r and places s t r i n g e n t
requirements on i t s s t a b i l i t y . The l a r g e s t s h i f t i n f observed i n a run
was 50 Hz. The o s c i l l a t o r was t y p i c a l l y s t a b l e to 10 Hz over a pe r i o d of
s e v e r a l weeks corresponding to a s t a b i l i t y of 3 ml at 1 K and .03 mK at 0.1 K.
Changes i n f during a c a l i b r a t i o n of the r e s i s t a n c e thermometers (4 hours)
were n e g l i g i b l e .
-40-
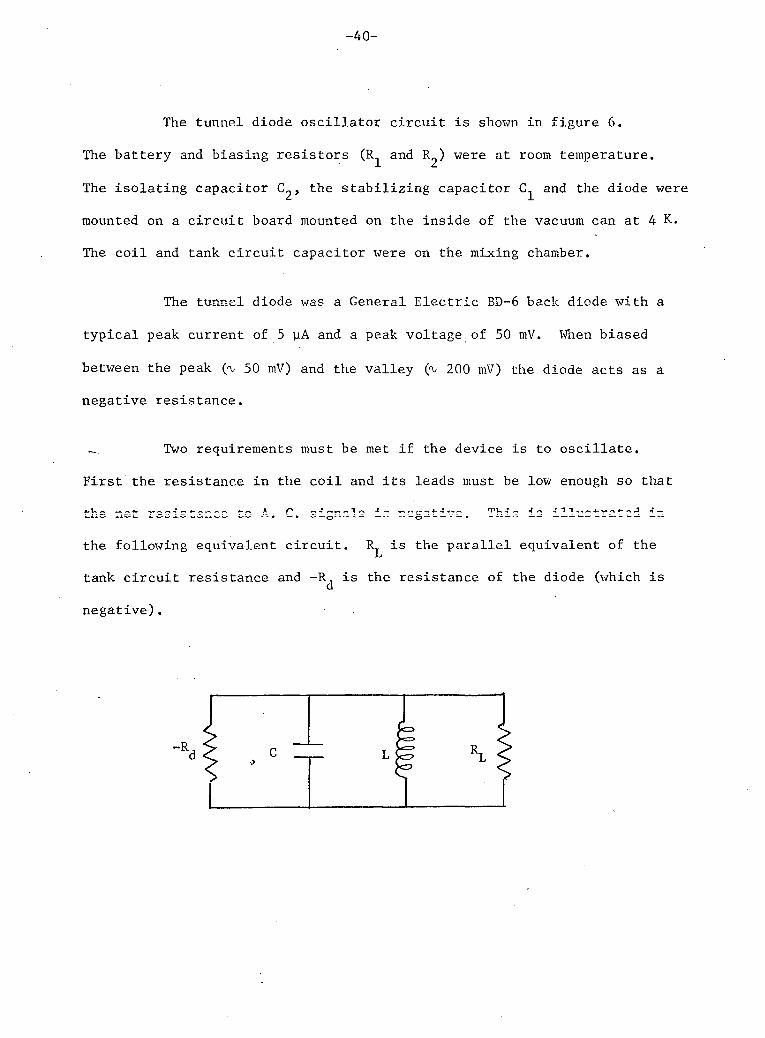
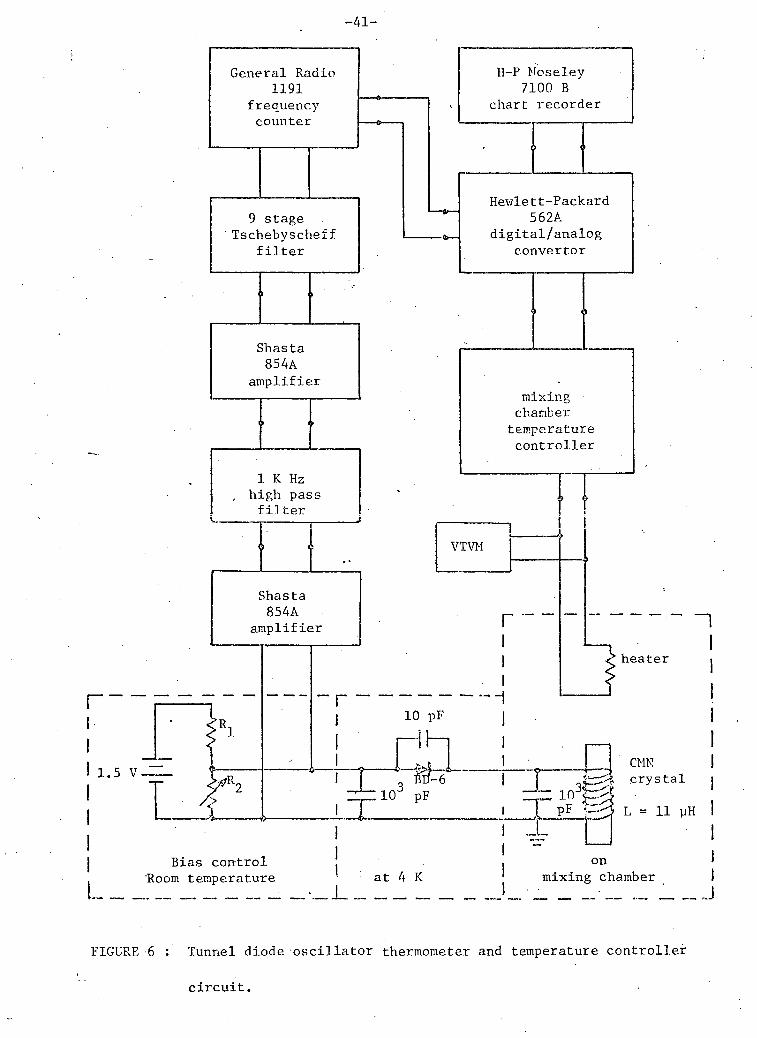
The tunnel diode o s c i l l a t o r c i r c u i t i s shown i n f i g u r e 6.
The b a t t e r y and b i a s i n g r e s i s t o r s (R^ and R^) were at room temperature.
The i s o l a t i n g c a p a c i t o r C^, the s t a b i l i z i n g c a p a c i t o r and the diode were
mounted on a c i r c u i t board mounted on the i n s i d e of the vacuum can at 4 K.
The c o i l and tank c i r c u i t c a p a c i t o r were on the mixing chamber.
The tunnel diode was a General E l e c t r i c BD-6 back diode w i t h a
t y p i c a l peak cu r r e n t of 5 uA and a peak v o l t a g e of 50 mV. When biased
between the peak (y 50 mV) and the v a l l e y 200 mV) the diode acts as a
negative r e s i s t a n c e .
Two requirements must be met i f the device i s to o s c i l l a t e .
F i r s t the r e s i s t a n c e i n the c o i l and i t s leads must be low enough so that 4-t-~ _ ~ J - - - t 4-„ * n 1 ^ ~ . TUA ~ ,•„ A T 1 ~ 4-~~ t-- J A— L - i i w A . ~~ ^ i . w ~ w i _ — . — ~ O ' • * " O " 1 - — . ' - - — . • ' — —
the f o l l o w i n g e q u i v a l e n t c i r c u i t . R i s the p a r a l l e l e q u i v a l e n t of the i-j
tank c i r c u i t r e s i s t a n c e and -R, i s the r e s i s t a n c e of the diode (which i s d
n e g a t i v e ) .
-41-
r
! 1.5 V
General Radio 1191
frequency counter
9 stage Tschebyscheff
f i l t e r
Shasta 854A
amplifier
•
1 K Hz , high pass
f i i t e r
<
Shasta 854A
amplifier
r
L
Bias control Room temperature
H-P Moseley 7100 B
chart recorder
Hewlett-Packard 5 62A
digital/analog convertor
mixing mixing chamber
temperature controller
VTVM
r "
10 pF
H h
103 pF
at A K
i
heater
CMK crystal
" ^ l o 3 ^ 1 P F L = 11 yH JL
on mixing chamber
J
FIGURE 6 : Tunnel diode osc i l la tor thermometer and temperature controller
c i r c u i t .
-42-
The second requirement f o r o s c i l l a t i o n places r e s t r i c t i o n s on the r e s i s t o r s
i n the b i a s i n g c i r c u i t . The source r e s i s t a n c e must be l e s s than the
absolute value of the negative diode r e s i s t a n c e to prevent s w i t c h i n g . For
d e t a i l s of d e s i g n , see Reybey (1962) or Boghosian et a l . (1966).
The f i r s t requirement se t s a lower l i m i t on the Q of the c o i l .
The c o i l c o n s i s t e d of 70 turns of #36 AWG w i r e wound on the CMN c y l i n d e r so
that i t s ends were e q u i d i s t a n t from the ends of the c y l i n d e r . The w i r e was
bonded w i t h GE 7031 v a r n i s h . The c y l i n d e r was placed i n a vacuum can i n
such a way that about .5 cm of the lower end of the c r y s t a l was i n a t i g h t
f i t t i n g h o l e i n the copper base that had been p r e v i o u s l y f i l l e d w i t h GE 7031
v a r n i s h . The i n s i d e of the s t a i n l e s s s t e e l w a l l s of the can were coated
w i t h s o f t s o l d e r . The superconducting s o l d e r reduced w a l l l o s s e s that
would degrade the Q of the c o i l . A brass end cap c o n t a i n i n g a two lea d
e l e c t r i c a l s e a l and a copper f i l l i n g c a p i l l a r y was s o f t soldered to the 4
s t a i n l e s s s t e e l tube. The can was f i l l e d w i t h one atmosphere of He gas
at room temperature, the f i l l i n g tube was pinched o f f and sealed w i t h s o f t
s o l d e r . The helium f i l m (about 5 microns t h i c k ) would h o p e f u l l y provide
good thermal contact at low temperatures. The tank c i r c u i t c a p a c i t o r was .
attached to the R.F. leads at the top of the can.
I t was found that the temperature i n d i c a t e d by the CMN thermometer
(which would be the s p i n temperature averaged over the volume of the c o i l )
was dependent on the s i g n a l amplitude V g of the o s c i l l a t o r (measured across
Cy)' Taking the mixing chamber temperature to be the CMN temperature
e x t r a p o l a t e d to V = 0,the d i f f e r e n c e between the CMN temperature and the
-43-
mixing chamber temperature was found to be
Because the Q of the c i r c u i t i s unknown i t i s not p o s s i b l e to
give an absolute value f o r the constant B. For R.F. heating one would 2
expect a heat i n p u t r a t e Q = - cox^'h^ (Casimir, 1940) where h Q i s the
peak to peak amplitude of the magnetic f i e l d of frequency co. AT could be
kept below 1 mK by s e t t i n g the b i a s very near the peak v o l t a g e . The s i g n a l
across was then about 0.2 mV.
In the i n i t i a l CMN thermometer that we constructed the tank
c i r c u i t c a p a c i t o r was mounted on the 4K p l a t f o r m w i t h the tunnel diode and
"as contact?'?, to tb? c o i l hv a superconductor — c^at-pA r ? p i 11 gry. I t was
found that R.F. h e a t i n g of the sample r e s i s t o r s took place because of the
l a r g e c u r r e n t i n the l e a d . P l a c i n g the c a p a c i t o r on the CMN c o i l can
reduce these c u r r e n t s by the f a c t o r Q and no measurable h e a t i n g of the
r e s i s t o r s occurred.
The CMN thermometer w i l l not give r e p r o d u c i b l e r e s u l t s i f
f a c t o r s other than temperature a f f e c t the measured resonant frequency. At
1 K a change of 1 mK causes a change of 3.7 Hz i n the resonant frequency.
The c i r c u i t had a s t a b i l i t y of 1 Hz over an hour i n t e r v a l (except f o r
o c c a s i o n a l noise pulses which w i l l be discussed i n the s e c t i o n on the
temperature c o n t r o l l e r ) and a long term s t a b i l i t y of 10 Hz over a p e r i o d of
weeks.
- 4 4 -
The resonant c i r c u i t was i s o l a t e d from the b i a s i n g c i r c u i t and
the frequency measuring c i r c u i t by the c a p a c i t o r C^. The s i g n a l across 4
(about 0.2 mV) was a m p l i f i e d by 10 by two Shasta 854A wide band a m p l i f i e r s .
The r e s u l t a n t s i g n a l was f i l t e r e d by a 9 stage h i g h pass Tschebyscheff
f i l t e r and the frequency was measured by a General Radio 1191 counter. The
f i l t e r ( H a n s e l l , 1969) had a cut o f f frequency of 1 MHz and an a t t e n u a t i o n
of 1,000 at 500 KHz.
Resistance Thermometry
Speer 470 carbon r e s i s t o r s were used as r e s i s t a n c e thermom
e t e r s i n these experiments. The r e s i s t a n c e s were measured by a 318 Hz
Wheatstone b r i d g e u s i n g a P r i n c e t o n JB-6 l o c k - i n a m p l i f i e r as a s i g n a l
source and d e t e c t o r . Using the two phase c a p a b i l i t y of the JB-6, the b r i d g e
was balanced r e s i s t i v e l y and r e a c t i v e l y during each measurement.
The output reference s i g n a l was reduced by a v o l t a g e d i v i d e r and
i s o l a t e d from the bri d g e by a Hammond 585 D transformer. This combination
reduced the reference v o l t a g e to a maximum of 13 mV across the b r i d g e . In
f a c t , the l a r g e s t reference v o l t a g e used was 2.5 mV. The e r r o r s i g n a l
passed through a T r i a d G 10 i s o l a t i o n transformer, was a m p l i f i e d by a f a c t o r 3
of 10 by a P r i n c e t o n CR4 a m p l i f i e r and was detected by the JB-6. General
Radio decade r e s i s t a n c e s and capacitances were used f o r b a l a n c i n g the b r i d g e .
The bridge noise l e v e l was reduced to a low l e v e l (0.1 uV peak to
peak r e f e r r e d to the inp u t of the CR4) by s h i e l d i n g i n such a way that the
ground w i r e of the bridge was connected to the s h i e l d at only one p o i n t and
the s h i e l d was grounded at only one p o i n t . The r e s i s t o r s were not grounded
to the c r y o s t a t . Severe he a t i n g of the r e s i s t o r s by t h e r m o e l e c t r i c e f f e c t s was
observed when one end of the r e s i s t o r had been grounded. This had a l s o
-45-
caused d r i f t s in the cal ibrat ion as the room temperature varied.
The R.F. noise heating of the resistors was reduced by placing
.022 uF polystyrene capacitors i n p a r a l l e l with the resis tors . These
capacitors were mounted on the mixing chamber plate. The use of these
large capacitors prevented us from doing AR measurements.
When resistance measurements were made, the reference voltage
was reduced u n t i l no self heating of the resistors was observed. At 0.2 K
this gave a power dissipation of 10 ^ watts. Under these condition, the 4
bridge resolution was about 1 part i n 2 x 10 .
A l l resistors except those on the sample chamber were greased into
snug holes d r i l l e d i n the element whose temperature was to be measured.
The sample resistors were prepared by grinding off about 1/3 of the
insulation down to the graphite core. A //38 AWG copper wire was soldered
to each p i g t a i l , coiled in a layer over the resistor body and bonded with
GE 7031 varnish. A third wire was coiled and bonded and i t s ends were
soft soldered to the element making thermal contact with the sample chamber.
The copper coi ls provided thermal contact, fixed stray capacitance and pro- .
vided shielding.
The sample resistors were calibrated i n the following manner. 4
The sample chamber was f i l l e d with sol id He to provide good thermal
contact between the resis tors . The temperature of the mixing chamber was
held constant u n t i l no resistance change was evident, then the resistances
and the CMN frequency were measured. The measured resistances were f i t t e d
- 4 6 -
to a polynomial by a l e a s t squares f i t (LQF) program.
1/2 + P R = A Cl - f_) = 1/ T
o where R =.resistance
f = CMN frequency
c a l i b r a t i o n constants of CMN thermometer
P^, P^* P^ = constants that give the best f i t to the c a l i b r a t i o n data.
About 30 c a l i b r a t i o n p o i n t s were taken between 0.1 K and 0.8 K
at equal i n t e r v a l s i n 1/T. Tables of R(T) were then c a l c u l a t e d f o r each
thermometer using the above f i t t e d polynomial. The computer program gave
the d i f f e r e n c e , f o r each c a l i b r a t i o n p o i n t , between the measured temperature
and the temperature c a l c u l a t e d using the above equation. Because of the
r e s t r i c t e d number of parameters the f i t t e d curve d i d not e x a c t l y f o l l o w the
measured R(T) curve, however the d i f f e r e n c e was u s u a l l y l e s s than 2 mK.
For a given measured temperature the c a l c u l a t e d temperatures of the sample
r e s i s t o r s u s u a l l y agreed to 0.1 mK. Measurements between the c a l i b r a t i o n
points- were c o r r e c t e d by l i n e a r i n t e r p o l a t i o n between the d i f f e r e n c e s which
v a r i e d s y s t e m a t i c a l l y over the c a l i b r a t i o n range w i t h a t y p i c a l change of
0.3 mK between c a l i b r a t i o n p o i n t s . During the longest run (5 weeks) the
c a l i b r a t i o n s changed by l e s s than 0.1 mK.
-47-
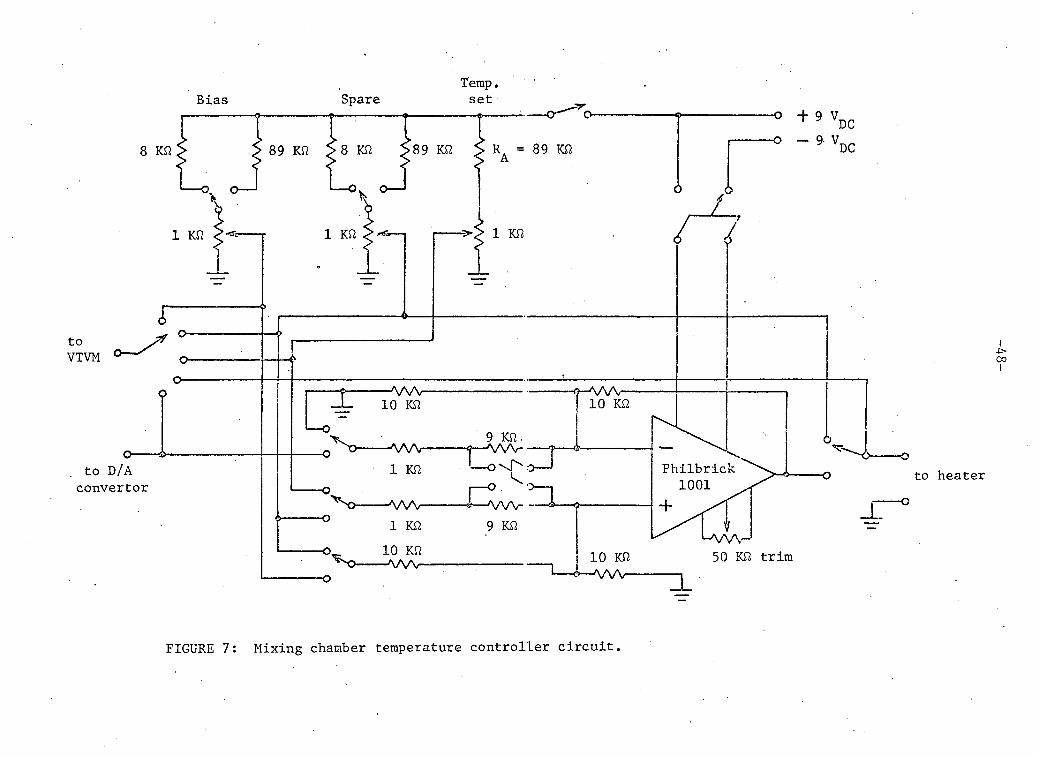
C. MIXING CHAMBER TEMPERATURE CONTROLLER
The large specific heat and low thermal conductivity of solid
helium mixtures below the phase separation temperature caused long thermal
time constants i n the conductivity sample. To do accurate conductivity
measurements we had to keep the mixing chamber temperature constant for
periods up to six hours. The refrigeration capacity of the dilution
refrigerator varies with temperature so we could control the temperature
by varying the power input to an el e c t r i c a l heater bolted to the mixing
chamber platform. We designed and constructed an analog device to provide
this control automatically.
The voltage analog of the mixing chamber temperature was compared
to the voltage analog of the desired temperature and the airrerence signal
was used to increase or decrease the power dissipated in the heater. The
ci r c u i t diagram of the controller is shown in figure 7.
The. resonant frequency of the CMN thermometer was measured by a
General Radio 1191 Frequency Counter. The binary coded decimal output of
the counter was converted to a DC voltage (0 to 100 mV) by a Hewlett-Packard
562A d i g i t a l to analog convertor. The output voltage of the convertor was
V = 100 A mV B
where A is a two or three digit number
B = 100 or 1000.
Bias Spare Temp. set
-o + 9 V T
to V T V M °
to D/A convertor
i co i
to heater
FIGURE 7: Mixing chamber temperature controller c i r c u i t .
-49-
We could select any three digits or the last two digits from
the counter display for conversion to a DC voltage. The maximum available
sensitivity was 1 mV/cycle. The 0.1 mV/cycle sensitivity was normally
used.
Three additional potentiometer controlled voltages were provided;
a temperature setting reference voltage (0 to 100 mV), a heater bias
voltage (two ranges, 100 mV and 1 V f u l l scale) and a spare (two ranges).
To maintain a desired temperature we set the empirically determined
voltage on the bias potentiometer and a voltage on the temperature reference
equal to the desired output voltage of the D/A convertor. The spare poten
tiometer was used for controlling the heater power manually or to replace
one of the other potentiometers while changing temperatures.
The above voltages were applied to the input resistors of the
Philbrick 1001 Operational Amplifier which was chosen for i t s low offset
d r i f t . If voltages and are applied to the inverting input through
resistors R/k^ and R/k^; and and are applied through R/k^ and R/k^ to
the non-inverting input then the output voltage V q i s
V = k. V. + k, V. - k. V. - k. V. o 4 4 3 3 2 2 1 1
i f k^ + k^ = k^ + k^.
The f i r s t input was grounded to satisfy the second equation. For
control at low temperatures a l l the input resistors had the same value. At
high temperatures increased gain was necessary tc compensate for the
decrease in thermometer sensitivity so the temperature and reference
-50-
temperature input r e s i s t a n c e s were reduced by a f a c t o r of 10.
The method of changing temperatures i s s t r a i g h t forward. To
reduce temperature one turns o f f the c o n t r o l l e r and allows the mixing
chamber to c o o l . The b i a s v o l t a g e i s adjusted to provide heater power
approximately equal to the r e f r i g e r a t i o n c a p a c i t y at the new temperature.
The c o n t r o l l e r i s turned on when the CMN frequency i s i n the d e s i r e d range
and the temperature becomes steady w i t h i n 2 minutes. To go to a higher
temperature one grounds input r e s i s t o r and increases the b i a s v o l t a g e .
When the d e s i r e d frequency range i s reached R^ i s switched back to the D/A
output. The c o n t r o l l e r reduces the time f o r going from one steady temper
ature to another by an order of magnitude compared to the time taken using
manual heater v o l t a g e c o n t r o l .
Below 0.4 K the temperature could be c o n t r o l l e d to ± 0.1 mK f o r
per i o d s of many hours. When the c o n t r o l l e r was d i s t u r b e d by a noise pulse
i t returned to steady s t a t e w i t h a time constant of about 1 second. This
corresponded to the sampling p e r i o d of the frequency counter. I f good
s t a b i l i t y was to be obtained, such noise pulses (which are due to e x t e r n a l
sources) had to be removed from the s i g n a l to the counter. Normal s h i e l d i n g
and grounding p r a c t i c e s were f o l l o w e d , w i t h i n the c o n s t r a i n t s of the
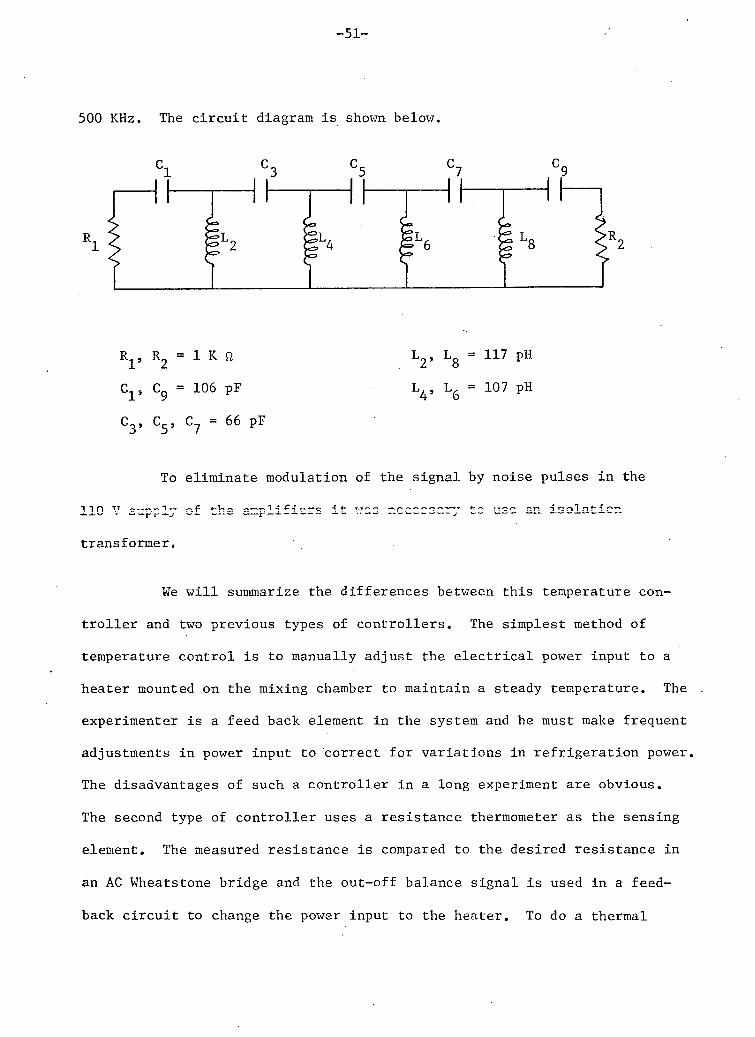
equipment a v a i l a b l e . Most noise pulses were found to have F o u r i e r
components up to about 500 KHz so i t was necessary to construct a f i l t e r
w i t h a very sharp r o l l o f f i f 1 MHz s i g n a l s were to pass unattenuated. A
nine stage Tschebyscheff f i l t e r ( H a n s e l l 1969), was s e l e c t e d as the best
cho i c e . I t had a c u t - o f f frequency of 1 MHz and an a t t e n u a t i o n of 1000 at
-51-
500 KHz. The cir c u i t diagram is shown below.
R , R = 1 K
C 1 S C 9 = 106 pF
C 3, C 5, C ? = 66 pF
To eliminate modulation of the signal by noise pulses in the
transformer.
We w i l l summarize the differences between this temperature con
t r o l l e r and two previous types of controllers. The simplest method of
temperature control i s to manually adjust the electrical power input to a
heater mounted on the mixing chamber to maintain a steady temperature. The
experimenter is a feed back element in the system and he must make frequent
adjustments in power input to correct for variations in refrigeration power.
The disadvantages of such a controller in a long experiment are obvious.
The second type of controller uses a resistance thermometer as the sensing
element. The measured resistance is compared to the desired resistance in
an AC Wheatstone bridge and the out-off balance signal i s used in a feed
back c i r c u i t to change the power input to the heater. To do a thermal
L 2, L g = 117 pH
L 4, L 6 = 107 pH

- 5 2 -
c o n d u c t i v i t y experiment at these low temperatures with the above c o n t r o l l e r
one would need two AC resistance bridges i n add i t i o n to a magnetic s u s c e p t i
b i l i t y thermometer. The novelty of the method described i n t h i s thesis
l i e s i n the use of the magnetic thermometer as the temperature sensing
element. The main advantage i s the e l i m i n a t i o n of one AC resi s t a n c e bridge
which saves money and space.
-53-
D. SAMPLE CHAMBER
In order to do accurate and reasonably rapid thermal conductivity
measurements we needed to construct a sample chamber which met the
following requirements.
- a b i l i t y to withstand internal pressures of up to 100 atmospheres.
- low thermal conductivity in parallel with the sample.
- heat flow parallel to the sample axis only, in the v i c i n i t y of the
thermometers.
- a thermal time constant as short as possible.
- good thermal contact between the sample ends and the heater and the
heat sink.
- thermometer separation and.temperature gradients large enough to permit
temperature differences large compared to temperature resolution.
- a b i l i t y to measure sample pressure.
These requirements were not a l l compatible so a compromise was
necessary. Two sample chambers were constructed as shown in the figure
8. The second was constructed after the f i r s t one was accidentally
stressed beyond the tensile strength of the pressure c e l l . The sample
chambers consisted of two parts, a conductivity c e l l and a pressure c e l l .
These w i l l be discussed separately below.
Thermal Conductivity Cell
This c e l l consisted of a stainless steel tube (.318 cm o.d. x
.015 cm wall), an e l e c t r i c a l heater and several thermometer connections.
The most important requirements of this c e l l were low thermal conductivity
-54-
i n the c e l l walls and isotherms in the sol id sample which were plane and
perpendicular to the cylinder axis. The . f i rs t requirement was met by the
stainless steel tube. The largest correction for conduction in the walls
was 25% of the total conductivity.
The overall length of the conductivity c e l l , L, was restricted
by the thermal time constant, x, for temperature changes
2 A T % A T q exp (-t/x) x = 4 L PC
° IT K
where p = density of helium sample
C = specif ic heat of sample
K = thermal conductivity of sample.
At temperatures below the phase separation the specif ic heat is
very large. The resulting time constant i s as high as 30 minutes for
L = 2 cm. Since waiting times of 8 to 9 time constants were necessary to
establish "steady state" conditions a small value of L was desired.
The requirement for plane perpendicular isotherms meant that i n
the v i c i n i t y of the thermometers the c e l l wall and adjacent sol id helium
had to be at the same temperature. Near the heat sink and the heater, the
walls are at a higher temperature than the adjacent helium because of the
Kapitza resistance. This temperature difference 0 decreases exponentially,
as one goes away from the ends, with a characteristic length a.
6 = 6 exp (-x/a) where x = distance to end.
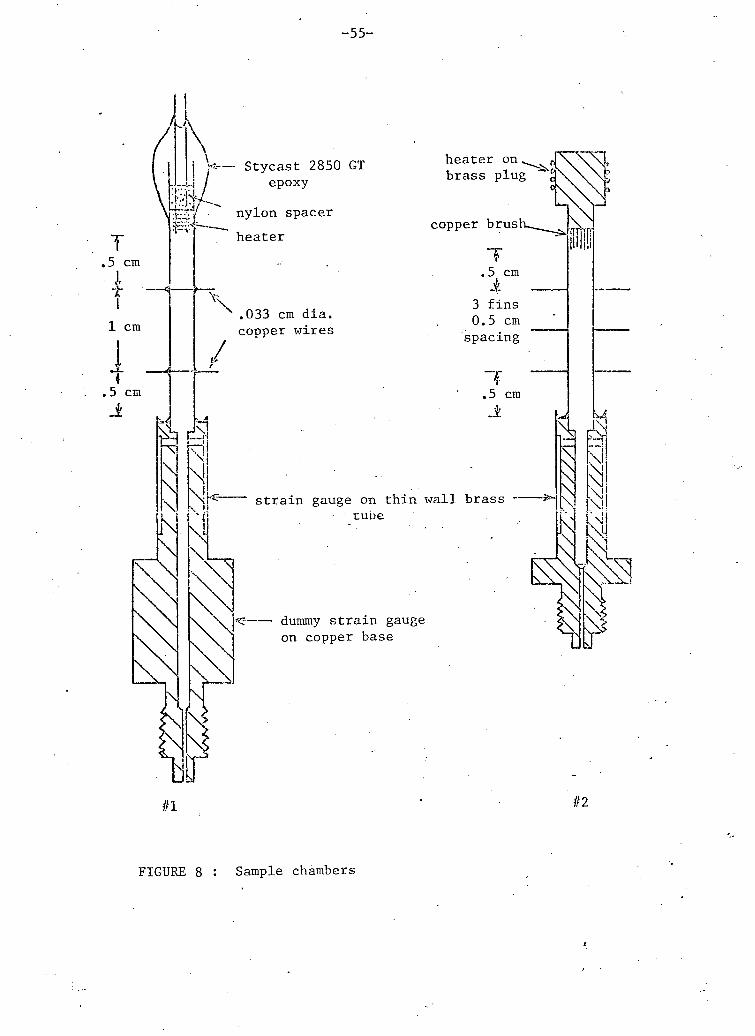
-55-
- Stycast 2850 GT epoxy
nylon spacer heater
.033 cm d i a . copper wires
\
heater on brass plug
copper brus
T . 5 cm
i 3 fins 0.5 cm
spacing
N
;,=. dummy strain gauge on copper base
K strain gauge on thin wall brass tube
l 1 •
Itr #1 #2
FIGURE 8 : Sample chambers
f
-56-
For the geometry and samples i n t h i s work a 4 1 mm. To minimize
6 i n the v i c i n i t y of the thermometers the. temperature d i f f e r e n c e at the
ends, 6 , should be s m a l l and the d i s t a n c e between the thermometers and o
the ends should be l a r g e . This d i s t a n c e was about 5 mm i n both sample
chambers. The geometry at the ends of the..conductivity c e l l prevented plane
isotherms i n those r e g i o n s . A c a l c u l a t i o n u s i n g a s u i t a b l e model i n d i c a t e d
that d i s t o r t i o n s due to the end geometry would. decrease as exp (-Trr/x)
where r i s the r a d i u s of the tube and x i s the d i s t a n c e from the end. E r r o r
due to t h i s e f f e c t would be n e g l i g i b l e at the thermometers.
The temperature d i f f e r e n c e at the ends was minimized by p r o v i d i n g
l a r g e contact areas between the sample and sample chamber. The K a p i t z a -3 A 2
boundary r e s i s t a n c e between s o l i d helium and copper i s % 80 T K cm /Watt
( P o l l a c k , 1969).
The f i r s t heater was placed i n s i d e the s t a i n l e s s s t e e l tube. I t
c o n s i s t e d of 320 cm of constantan w i r e (.005 cm d i a . ) b i f i l a r l y wound on two
s t a i n l e s s s t e e l wires that a l s o served as e l e c t r i c a l leads through the
pressure s e a l at the end of the s t a i n l e s s s t e e l . t u b e . The heater was non-2
i n d u c t i v e , had a r e s i s t a n c e of 230 ft, and a surface area of 0.5 cm . The
s t a i n l e s s s t e e l . w i r e s passed through holes d r i l l e d i n a nylon spacer that
was a t i g h t f i t to the i n s i d e of the tube. The end of the s t a i n l e s s s t e e l
tube was degreased, cleaned w i t h a h y d r o c h l o r i c - n i t r i c a c i d s o l u t i o n and
then sealed w i t h Stycast 2850 GT epoxy (Anderson, 1968). The S t y c a s t epoxy
i s loaded w i t h quartz to match the thermal c o n t r a c t i o n of copper. The s e a l
was i n i t i a l l y t e s t e d by r a p i d c y c l i n g between room temperature and 80 K w h i l e
-57-
pressurized to 50 atmospheres with helium gas. No leaks were detected by
a Veeco MS90 Mass spectrometer leak detector when the sample chamber was 4
f i l l e d with superfluid He at 25 atmospheres. Assuming the above value of
Kapitza resistance the temperature difference between the heater wire and
the sample would be 20 mK/yW at 0.2 K.
The second heater was constructed by s i lver soldering a brush of
several hundred bare copper wires.(.012 cm dia . ) into a hole d r i l l e d i n a
brass plug. To prevent solder from entering the part of the brush that
extended into the conductivity c e l l , the solder was fed into the opposite
end of the hole. The plug was then soft soldered into the end of the
stainless steel tube. A b i f i l a r heater (240 Q) of constantan wire (.005 cm
dia . ) was wound on the plug and bonded with GE 7031 varnish. Uncertainty
i n the position of the s i lver solder boundary l imits us to determining a
2
lower l i m i t (2 cm ) for the surface area of the brush and an upper l imit
(5 mK/yW) for the temperature difference between the heater and the sample
at 0.2 K.
The two thermometers on the f i r s t conductivity c e l l were attached
to two copper wires (.033 cm dia . ) that passed through two sets of holes
d r i l l e d 1 cm apart i n the stainless steel tube. The wires passed through
the centre of the tube and were perpendicular to the tube axis to within 2 ° .
The solder f i l l e t s at the holes were reduced by f i l i n g away excess solder.
The maximum temperature.difference between the wire and the sample due to
e l e c t r i c a l heating of the thermometers was estimated to be 30 yK at 0.2 K.
This arrangement was not satisfactory because of poor mechanical support for
-58-
the resistors . Severe vibrational heating resulted and i t was necessary
to construct a frame and grid of nylon threads to support the resis tors .
The second sample chamber had three brass fins (.025 cm thick)
s i l v e r soldered to the stainless steel tube with 5 mm separations. The
f i l l e t s were reduced to .040 cm wide by f i l i n g away the excess solder. The
third wire of each resistance thermometer was soft soldered to a f i n and
the resistor was bonded to the f i n by vacuum grease.
The lower end of the conductivity c e l l was soft soldered to the
copper base of the sample chamber. The e l e c t r i c a l leads from the heater
were. 4 cm long constantan wires (.01 cm dia . ) and the thermometer leads
were 4 cm long constantan (.005 cm d i a . ) . A l l leads were thermally anchored
to the copper base as well as at the lead heat sink on the mixing chamber
platform. The thermometer leads were also anchored to the f i n s .
Pressure C e l l
Thephase separation time constants observed.by Edwards et a l .
(1962) and Adams et a l . (1962) were pressure dependent. This indicated that
the domain size might be pressure dependent. The phase diagram of helium
mixtures i s not well enough known to permit accurate prediction of the sample
pressure from the freezing pressure. It was therefore desirable to measure
the pressure of the sol id sample.
A thin wall (.005 cm) brass sleeve (.635 cm o.d.) was soft soldered
to the base of the sample chamber. The annulus between the sleeve and the
base was connected to the central hole by six equally spaced radial holes of
-59-
0.1 cm diameter. A constantan f i l m , s t r a i n gauge.. (Budd, type C6-141 ~ 1000)
was glued to the brass -using Eastman 910 contact cement. The s t r a i n gauge
had a gauge f a c t o r , g = > of 2.1 and a nominal room temperature
r e s i s t a n c e of 1000 fi. An I d e n t i c a l gauge was glued to a copper surface i n
contact w i t h the mixing chamber. The d i f f e r e n c e between the two r e s i s t a n c e s
was measured by a Wheatstone br i d g e . The s t r a i n gauge s e n s i t i v i t y was
.05 ft/atm. p e r m i t t i n g a r e s o l u t i o n of .1 atmospheres. The gauge was c a l i
b rated against the e x t e r n a l Heise pressure gauge, when helium gas was
condensed i n t o the sample chamber i n p r e p a r a t i o n f o r c r y s t a l growing.
C o r r e c t i o n s were made f o r the.temperature dependence of AR, which changed
by .08 9, between 2.5 K and 0.1 K. The pressure measurements, however, were
not as accurate as the above r e s o l u t i o n would i n d i c a t e . The s t r a i n gauge on
the f i r s t ores sure c e l l fwhif-h had ? . 05 cm arm..1 us". Inst a f a c t o r of 5 i n
s e n s i t i v i t y between the 10th and 11th c y c l e from room temperature. The
pressures measured by t h i s gauge ( a l l samples reported except x^ = 0.1) are
t h e r e f o r e r e p o r t e d to ± 0.5 atm. The pressure c a l i b r a t i o n s f o r these samples
were done at 0.5 K immediately a f t e r the samples were melted by reducing the
e x t e r n a l pressure. The u n c e r t a i n t y i n the pressure of the samples i n the
second chamber were a l s o 0.5 atm. This pressure c e l l had a .02 cm annulus
and i t was found that pressure d i f f e r e n c e s of up to 8 atmospheres could
e x i s t between the pressure c e l l and the c o n d u c t i v i t y c e l l . The pressure
i n d i c a t e d by the s t r a i n gauge would drop on the f i r s t anneal a f t e r c r y s t a l
growth. The c r y s t a l was a l t e r n a t e l y cooled and annealed u n t i l the i n d i c a t e d
pressure became constant. The r e s u l t i n g m e l t i n g p o i n t s agreed w i t h the data
of Le P a i r et a l . (1965). I t i s r a t h e r s u r p r i s i n g t h a t such l a r g e inhomogen-
i t i e s can be maintained. Other authors have used a n n u l i of s i m i l a r
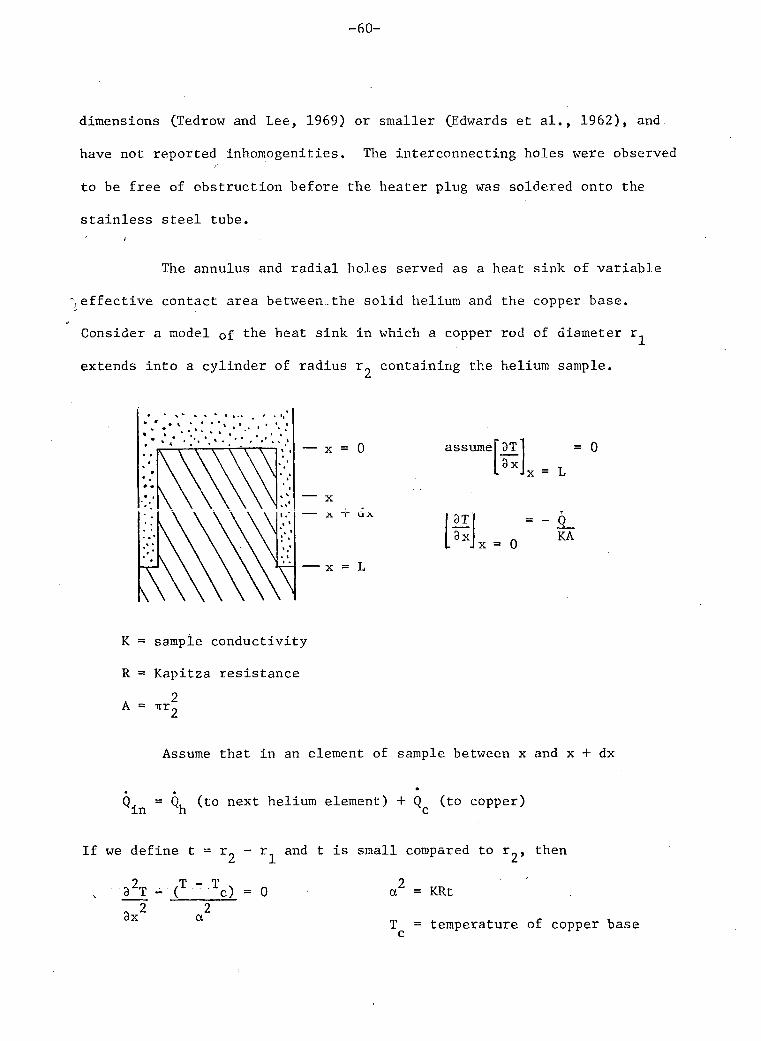
-60-
dimensions (Tedrow and Lee, 1969) or smaller (Edwards et a l . , 1962), and
have not reported inhomogenities. The interconnecting holes were observed
to be free of obstruction before the heater plug was soldered onto the
stainless steel tube.
The annulus and radial holes served as a heat sink of variable
^effective contact area between.the solid helium and the copper base.
Consider a model D f the heat sink in which a copper rod of diameter r^
extends into a cylinder of radius containing the helium sample.
assume 8T 8x
= 0 Jx = L
8T 8x x = 0
- 5 _ KA
K = sample conductivity
R = Kapitza resistance . 2 A = irr„
Assume that in an element of sample between x and x + dx
Q J = Q , (to next helium element) + Q (to copper) In h c
If we define t = ~ and t is small compared to x^, then
82T - ( T " Tc) 3x a
= 0 a = KRt
T c = temperature of copper base
-61-
3 -3
Since K a T and R a T approximately, then a is nearly constant
with respect to temperature. Then 9 = T - i s : • 1 - -
0 - Q a cosh L/g ( L) 2 rt K sinh L/g
If the temperature gradient in the sample i s to be 10 mK/cm then
6 (x = 0) % 3.5 mK independent of temperature for the f i r s t sample chamber.
Some care was required with the pressure c e l l because the calculated
collapsing pressure was 1.1 atmospheres and the calculated room temperature
bursting pressure was 50 atm.
The base of the sample chamber was threaded.and bolted to the
mixing chamber plate. A thin layer of Apieson "M" grease was used for thermal
Sample Heater Circuit
The heat dissipated i n the sample heater was determined by a four
lead measurement. The current was determined by measuring the voltage drop
across a General Radio 100 ft.. (± .025%) resis tor . The voltage across the
heater was measured by potential leads connected to the current carrying leads
at the mixing chamber. Half the power dissipated in the leads between the
mixing chamber and the heater (1.5% of the heater power) was assumed to go
to the heater. The leads were not grounded in the cryostat. No detectable
thermal EMF's were present. A l l voltages were measured by a Leeds and
Northrup 8662 potentiometer whose calibration had been checked against another
precision potentiometer.
-62-
The heater was shunted by a 0.1 yF polystyrene c a p a c i t o r mounted
on the mixing chamber p l a t f o r m .
Heater powers i n these experiments, on helium ranged from 10 7 watts
to 5 x 10 ^ watts. The background heat leak to the heater was determined by
measurements on the empty sample chamber and was found to vary between -9 -9
2 x 10 watts and 3 x 10 watts. The l a r g e s t u n c e r t a i n t y i n the heater power was t h e r e f o r e 1%.
Sample Gas Handling System
I t was necessary to prepare helium mixtures of known concentrations
and apply pressures up to 60 atmospheres to the mixture i n the sample
chamber.
3 A system w i t h two g l a s s t o e p l e r pumps of 400 cm volume, a s t a i n -
3
l e s s s t e e l t o e p l e r pump of 500 cm volume and ass o c i a t e d vacuum equipment
and storage f l a s k s was constructed (Walker and Fairbank, 1960). The volumes
and pressures i n the g l a s s t o e p l e r pumps could be determined to 0.1% of f u l l
s c a l e .
A f t e r the mixtures were prepared they were passed through a Linde
molecular s i e v e trap at 80 K to remove i m p u r i t i e s before being introduced
i n t o the s t e e l t o e p l e r pump. This was u s u a l l y done when the sample chamber
was below 2 K so that a minimal amount of gas was l e f t i n the g l a s s part of
the system.
The s t e e l t o e p l e r pump was connected to the sample chamber by a
c a p i l l a r y which passed through a l i q u i d n i t r o g e n trap before e n t e r i n g the
-63-
c r y o s t a t . The l a r g e bore c a p i l l a r y C.081 cm o.d. x .015 cm w a l l ) was
connected to a s m a l l bore c a p i l l a r y (.030 cm o.d. x .010 cm w a l l ) at 4 K.
This c a p i l l a r y was th e r m a l l y anchored to the I K pot, to the s t i l l , to each
heat exchanger and the mixing chamber before e n t e r i n g the bottom of the
sample chamber.
The s t e e l t o e p l e r pump was p r e s s u r i z e d by n i t r o g e n from a commer
c i a l h i g h pressure c y l i n d e r . The pressure on the n i t r o g e n s i d e of the pump
was measured to an accuracy of ± 0.1 atm. by a Heise Bourdon gauge. The
mercury l e v e l on the helium s i d e was determined by d e t e c t i n g the p o s i t i o n
of an i r o n b a l l f l o a t i n g on the mercury, using a magnetic s u s c e p t i b i l i t y
d e v i c e . This device (Vignos and Fairbank, 1966) permitted the mercury l e v e l
to be determined to w i t h i n 1 mm.
4 The He gas was obtained from the l a b o r a t o r y 25 l i t r e l i q u i d
3 4
helium dewars. The He gas (0.1% He ) was purchased from Monsanto Chemical
Cor p o r a t i o n .
-64-
E. -CRYSTAL'GROWTH
C r y s t a l s were grown by the blocked c a p i l l a r y method. The 1 K pot
and the s t i l l were kept s e v e r a l hundred m i l l i k e l v i n s warmer than the f r e e z i n g
temperature f o r the d e s i r e d sample pressure w h i l e the pressure on the sample
was being i n c r e a s e d . The temperature of the mixing chamber was hel d 50 to
100 mK above the f r e e z i n g pressure once the d e s i r e d pressure was reached,
and was kept constant u n t i l the upper sample.thermometer had cooled to w i t h i n
50 mK of the mixing chamber temperatures. The 1 K pot was then cooled
r a p i d l y causing a plug of s o l i d to form, b l o c k i n g the c a p i l l a r y .
The r e f r i g e r a t o r was s t a r t e d and the mixing chamber was cooled
r a p i d l y to w e l l below the me l t i n g temperature of the f i n a l mixture to f a c i l -
- — • — — A- — — j — — o - _. . i_, • -'
c r y s t a l s were then annealed by warming u n t i l the sample j u s t s t a r t e d to
melt. A sudden increase i n the sample pressure i n d i c a t e d the s t a r t of
m e l t i n g .
Rapid c r y s t a l growth was necessary to prevent c o n c e n t r a t i o n g r a d i
ents from forming i n the s o l i d i n the r e g i o n where the thermal c o n d u c t i v i t y
i s measured. Growth had to be r a p i d enough to prevent d i f f u s i v e r e d i s t r i b u
t i o n of the two isotopes i n the l i q u i d . In t h i s l i m i t there w i l l be
l a r g e c o n c e n t r a t i o n gradients near the ends of the sample chamber and a
c e n t r a l r e g i o n w i t h a s m a l l g r a d i e n t . We w i l l d e f i n e the end regions as
those regions where the co n c e n t r a t i o n x d i f f e r s from the
-65-
i n i t i a l average concentration x Q by more than 2.5%. The approximate
solution of a rather involyed expression (Pfann, 1966) gives the following
estimate of the length L of the end regions.
L = 4D/f
where f i s the freezing rate and D is the diffusion coefficient of the
liquid.
-5 2 Using the value D = 3 x 10 cm /sec (Garwin and Reich, 1959) and
_3
a typical freezing rate of 4 x 10 cm/sec, L = .03 cm. The concentration
can therefore be considered to be constant over the length of the conducti
vity c e l l .
The poly crystalline structure resulting from this ranld o.rowth can
then be corrected by annealing. In fact, no difference in conductivity
between annealed and unannealed samples was observed, except for a rather
special case which w i l l be discussed in the experimental results. The 10% He
samples in the second sample chamber were checked for concentration gradients
by comparing the conductivities of the two sections of the crystal in the
region above the phase separation. The results agreed within experimental
error (5%). It i s unlikely that the average concentration in the sample
chamber was different from the average gas concentration. The sample chamber
was f i l l e d rapidly through a capillary and the capillary was always blocked
in a time that was short compared to the time required for fractionation to
establish the equilibrium concentrations in the liquid and gas. Mass spec
trometry analysis of gas samples from three stages of a similar experiment
(Berman et a l . , 1965) showed no significant difference in the three samples.
-66-
F. DATA REDUCTION AND EXPERIMENTAL ERRORS
A thermal c o n d u c t i v i t y measurement was done by supplying a measured
e l e c t r i c a l power input Q to the sample heater and measuring the e l e c t r i c a l
r e s i s t a n c e of each Speer r e s i s t o r mounted on the sample chamber. The
measured r e s i s t a n c e s were then converted i n t o temperatures u s i n g the R(T)
t a b l e s c a l c u l a t e d from the c a l i b r a t i o n polynomial of that run and c o r r e c t e d
f o r the m i s f i t of the c a l i b r a t i o n curve by l i n e a r i n t e r p o l a t i o n between c a l i
b r a t i o n p o i n t s . The temperature d i f f e r e n c e AT between two r e s i s t a n c e
thermometers was determined by s u b t r a c t i o n .
The average thermal c o n d u c t i v i t y K at the average temperature T
between two thermometers was c a l c u l a t e d using the equation
• K = Q L
A AT
where L i s the measured di s t a n c e between the thermometers and A i s the cross
s e c t i o n a l area of the sample c a l c u l a t e d from the measured i n s i d e diameter of
the sample tube.
The above equation i s the steady s t a t e s o l u t i o n of the heat flow
equation
V 2T = _1 9T where K = K_ K 8 t pC
f o r the flow of heat i n a homogeneous i s o t r o p i c medium w i t h d e n s i t y p,
s p e c i f i c heat C and constant thermal c o n d u c t i v i t y which i s f r e e of
sources and s i n k s . I f the thermal c o n d u c t i v i t y i s temperature dependent the
-67-
solution to the above equation for the experimental conditions with K = BT n
and temperatures and at the thermometers is
Q -=' BA CT * + 1 - T . n + X ) . (ri + 1)L 1 1
If AT s - T 2 is small compared to T E 0^ + T )/2, then using a binomial
expansion we find that
Q = KAAT [" 1 + n (n - 1) Mj_V L L 24 \ T/
In this work AT/T *; 0.1 and n -S 3, so by ignoring the second order term, we
introduce a maximum error in the calculated average conductivity K of 0.25%.
Errors in the Conductivity
Tnjp o f f o m T i f - p / " f*n c ^ f T c f v the f^teP.flv - ? f a t p requirement of the abo-i7e
equation during each measurement by keeping the mixing chamber temperature
as constant as possible and waiting u n t i l the temperature difference between
the upper and lower resistance thermometers became "constant". The temper
ature difference was considered to be "constant" when the relative time rate
of change of AT was 0.1%/hour. In fact, i t was not possible to keep the
mixing temperature constant, but d r i f t s were always less than 0.1 mK/hr.
Errors in AT due to this d r i f t were determined experimentally to be
negligible. During measurements of time dependent effects i n the region
50 mK below the phase separation and in the region above T^g where metastable
crystallographic domains were observed we did not wait unt i l AT was "con
stant". Data taken under these conditions w i l l be clearly identified in the
discussion of results. The error due to temperature d r i f t s in data that is
not identified as time dependent w i l l always be less than 0.2%.
- 6 8 -
The relative accuracy of AT was limited by the relat ive accuracy
of the calculated resistor temperatures. The relative uncertainty i n T for
each resistor was 0.05 mK with a resulting uncertainty in AT of ± 0.1 mK.
AT was always larger than 10 mK except i n the temperature region just above
the phase separation where AT was always greater than 5 mK. Therefore, i n
general the relat ive error i n AT due to the method of calculation was less
than 1%. The resistance thermometers were calibrated after each cycle to
room temperature and the calibrations were frequently checked during each
run by measuring AT with the heatex* turned o f f . This also permitted a stat
i s t i c a l check on the error i n the calculated AT and the results agreed with
the above estimate of ± 0.1 mK. The error i n AT due to the Kapitza resistance
end effects i s estimated to be less than 0.1 mK in the worst case.
The power input to the heater was determined by measuring the
voltage drop across a resistor in series with the heater as well as the
voltage across the heater and the heater leads to the mixing chamber. The
—6 uncertainty in these measurements was 2 x 10 v o l t s . The largest relative
error in Q due to these measurements was 0.25%. This relative error was
-9
always less than the uncertainty in Q of 10 watts due to a time varying
background heat input. In the worst case the relat ive error due to this
uncertainty in the background was 1%.
The total relative error in K due to the combination of the above
errors i s 4.5% in the worst case, and 1.5% in the typical case. This
estimate i s substantiated by the scatter i n the data.
-69-
The sample and sample chamber walls proyide parallel paths for
heat flow. The maximum contribution of the walls was 25% of the total
conductivity. However, this contribution was less than 5% in a l l measure
ments except for three, data points of one sample.. The conductivity measure
ments were corrected for this effect with an uncertainty in the correction
of 5% and a typical uncertainty in K of less than 0.25%. The f i n and wire
separations on the two sample chambers were measured using a travelling
microscope and the resulting uncertainty in L was .05 mm. The lower limit
on the inside diameter of the sample chamber (nominally .287 cm) was
determined using a #33 d r i l l (.287 cm o.d.) and the uncertainty in the
diameter was estimated to be .025 mm. The error in L/A due to thermal con
traction between room temperature and 1 K (0.3%) w i l l be neglected. The
resulting absolute error in L/A is approximately 2.5% for conductivity
measurements using the outer thermometers. The absolute error in Q is the
same as the relative error. The total estimated absolute error in K is 10%
in the worst case and 5% in a typical case. The disagreement between the
two sets of stainless steel conductivity measurements in two temperature
ranges and their disagreement with the measurements of Seward et a l . (1969)
were within the above estimated errors in K.
Errors in the Temperature Scale
A
The absolute error in the temperature scale T of this work i s
mostly due to two approximations made i n obtaining the equation
^ = A (1 - f _ ) . T f
o
-70-
Curie's law has been found to hold f o r CMN down to a temperature of 6 mK
(Daniels and Robinson, 1953) so error.due to departure from Curie's law can
be neglected. An estimate of the demagnetization co r r e c t i o n A (which we
have neglected) i s given by A. =' (4TT - D) C, where C i s the Curie constant and 3
D i s the demagnetizing f a c t o r . For a c y l i n d e r with a length/diameter r a t i o
of 2 magnetized l o n g i t u d i n a l l y D = 2.3 (Brown, 1962) and A =1.9 C = 1.5 mK. ft
I f our temperature scale i s defined as T , then the absolute temperature
T = T + A. The error due to the approximation used i n c a l c u l a t i n g the ft
d e f i n i n g equation (see Chapter IV) i s e = T - T = 0.2/T mK. These two
corrections to T are p a r t i a l l y c a n c e l l i n g , leading to an uncertainty ft
(T - T) of less than 1% i n the absolute temperature. The error i n the
temperature scale due to the previously discussed heating e f f e c t was kept
below 0.5 mK during c a l i b r a t i o n by operating the tunnel diode at a very low
s i g n a l l e v e l . The absolute error i n T due to uncertainty i n the c a l i b r a t i o n
parameters of the CMN thermometer i s 0.2%, independent of temperature. The
t o t a l absolute er r o r i n the temperature scale i s le s s than 2% i n the worst
case (T = 100 mK) and i s p r o p o r t i o n a l l y l e s s at higher temperatures (0.5% at
.5 K). The temperature dependences of the conductivity measurements of the
s t a i n l e s s s t e e l tube and the s o l i d He sample place an upper l i m i t of 3% on
err o r i n T which i s consistent with the above estimate.
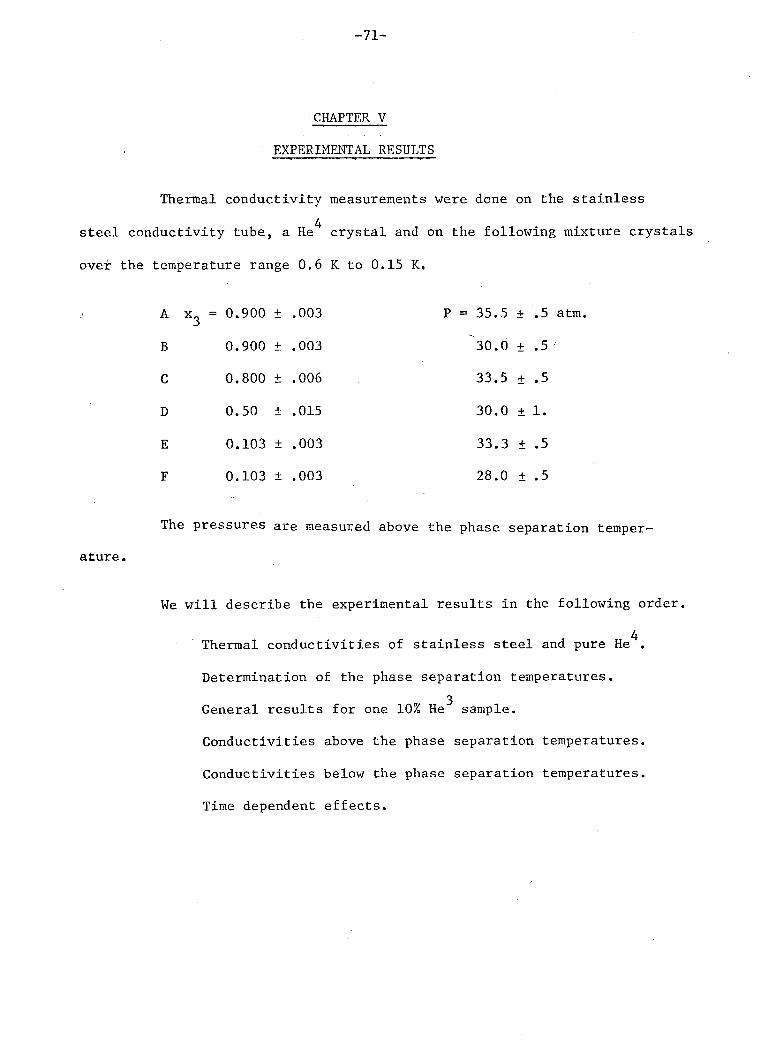
-71-
CHAPTER V
EXPERIMENTAL RESULTS
Thermal conductivity measurements were done on the stainless 4
steel conductivity tube, a He crystal and on the following mixture crystals
over the temperature range 0.6 K to 0.15 K.
A x 3 = 0.900 ± .003 P = 35.5 ± .5 atm.
B 0.900 ± .003 30.0 ± .5
C 0.800 ± .006 33.5 ± .5
D 0.50 ± .015 30.0 ± 1.
E 0.103 ± .003 33.3 ± .5
F 0.103 ± .003 28.0 ± .5
The pressures are measured above the phase separation temper
ature.
We w i l l describe the experimental results in the following order.
4 Thermal conductivities of stainless steel and pure He .
Determination of the phase separation temperatures. 3
General results for one 10% He sample.
Conductivities above the phase separation temperatures.
Conductivities below the phase separation temperatures.
Time dependent effects.
-72-
A. STAINLESS STEEL AND He
The thermal c o n d u c t i v i t y of the sample tube (304 s t a i n l e s s s t e e l )
was measured to determine the c o r r e c t i o n to the s o l i d mixture c o n d u c t i v i
t i e s , to determine the background heat flow along the tube and to check f o r
systematic e r r o r s at low heat i n p u t s . The r e s u l t s were given by
1 K to 2.5 K K = (5.7 ± .3) T x 10~ 4 W/cmK.
0.1 K to 0.4 K K = (6.0 ± .3) T x 10~ 4 W/cmK.
The s c a t t e r at low temperatures was due mainly to a background heat l e a k -9
(2 to 3 x 10 watts) which v a r i e d w i t h time. These measurements are i n
good agreement w i t h those of Seward et a l . (1969) who found ( i n the temper
a t u r e range 1 K - 7 K) K = (5.5 T + .018 T ) x 10 W/cmK.
4 The thermal c o n d u c t i v i t y of He (obtained from a l a b o r a t o r y l i q u i d
4
He storage dewar) at 36 atmospheres was measured to check f o r systematic
e r r o r s at high heat inputs and low values of AT. The r e s u l t s were given by
K = (3.2 ± .1) T 3 W/cmK.
I f the c o e f f i c i e n t (3.2) i s taken to be exact, the temperature dependence
exponent i s 3.0 ± .1. The c a l c u l a t e d phonon mean f r e e path was .071 cm,
which i s much smaller than the tube diameter (.29 cm). The e r r o r i n t h i s
measurement was mainly from the determination of AT. The c a l c u l a t i o n
procedure f o r l i m i t e d us to an u n c e r t a i n t y of ± 0.1 mK and a t y p i c a l AT
was 3 mK. The temperature dependence i s i n good agreement w i t h measurements
of Bertman et a l . (1966 b ) . P o l y c r y s t a l l i n e samples were d e l i b e r a t e l y
grown to give as low a c o n d u c t i v i t y as p o s s i b l e .
-73-
B. PHASE SEPARATION TEMPERATURE
The very long time constants for changes in conductivity made i t
d i f f i c u l t to do accurate determinations of the phase separation temperature
T . We therefore limited ourselves to a measurement in the region of low ps 3
He concentration where the results of Panczyk et a l . (1968) and Edwards
et a l . (1962) were not in complete agreement. . This datum, plotted in 3
figure 2, agreed with Panczyk's results within experimental error. The He concentration was 10.3 ± .3% and the phase separation temperature was
.320 ± .010 K. Panczyk's data w i l l be used to define T in this work. ps
A lower l imit for T could be determined in a short time (10 min.) ps
by rapidly lowering the mixing chamber temperature. The rate of temperature
change measured by the B c t m p x t res is to., s i . c c i c a o c < I obrupcly ct c particular
temperature. This temperature was reproducible for each crystal to a few
millidegrees and was 30 to 40 mK below T • It is probable that this temper
ature indicated the onset of rapid nucleation.
The determination of T for = 0.1 was done by measuring the
conductivity and the change in conductivity with time. The f i r s t measurements
were made 10 mK above T where the conductivity remained constant to 0.5% ps
over a period of 20 minutes. The average temperature was then reduced i n
5 mK steps u n t i l the conductivity was observed to change with time.
C. GENERAL RESULTS FOR ONE 10% He 'SAMPLE
A t y p i c a l r e s u l t f o r the thermal c o n d u c t i v i t y of a mixture i s 3
shown i n f i g u r e 9. This sample (E) was 10% He at P = 33,3 atmospheres, When
c r y s t a l growth was complete c o n d u c t i v i t y measurements were made between 0.6 K and
0.3 K (a -> b ) . T n e r e s u l t s i n t h i s temperature range i n d i c a t e t h a t the
thermal r e s i s t a n c e i s due to i s o t o p i c s c a t t e r i n g . -The datum at 1.0 K i s
from measurements by Berman et a l . (1965) on an 11% mixture. Berman's
sample had a f r e e z i n g pressure of 60 atmospheres whereas t h i s c r y s t a l began
f r e e z i n g at 54 atmospheres. The agreement between the two c o n d u c t i v i t y
r e s u l t s i s s a t i s f a c t o r y .
The v e r t i c a l l i n e at .31 K (b -»• c) shows the r e d u c t i o n i n c o n d u c t i v i t y 3
r h i o t o T>bg.«?*» P.p.oprstxor> and the bcc—hen t r a n s i t i o n i n the He r i c h component.
The mixing chamber temperature was adjusted o c c a s i o n a l l y to keep the average
temperature i n the c o n d u c t i v i t y c e l l at approximately .31 K. The time
constant a s s o c i a t e d w i t h the c o n d u c t i v i t y change was 70 minutes. This i s
much longer than e i t h e r the 10 minute thermal time constant of the sample chamber or the 140 second phase s e p a r a t i o n time constant (see Table 1), and i s taken as an i n d i c a t i o n of a t r a n s i t i o n to bcc s t r u c t u r e i n the phase
3
separated He r i c h component. The time constant f o r c o n d u c t i v i t y change was
longer c l o s e to the phase s e p a r a t i o n temperature. Using t h i s e f f e c t we were
able to vary the c o n d u c t i v i t y of the lower h a l f of the c r y s t a l more q u i c k l y
than the upper h a l f so that at the end of 5.5 hours the c o n d u c t i v i t y of the
two d i f f e r e d by a f a c t o r of 1.6.
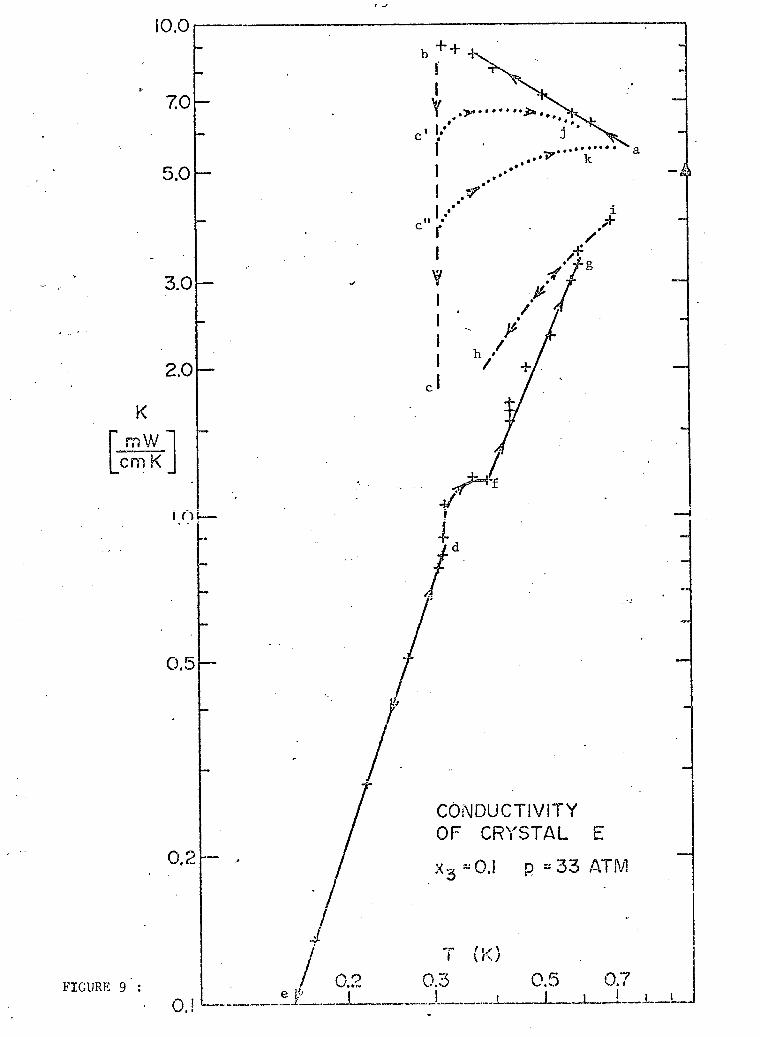
-76-
The data below .3 K (d -> e) can be fitted' using the empirical equation -2 3
K = 2.7 x 10 T W/cmK and are indicative of boundary scattering with a
constant mean free path. These data were obtained by cooling the annealled
crystal rapidly from above the phase separation to .25 K and then turning on
the sample heater. The conductivity at .27 K reached a minimum value after
2.5 hours and then slowly increased so that 5 hours later the conductivity
was 5% higher than the minimum value. At .22 K and .17 K the conductivities
became constant (to within 0.1%/hr.) after 6 and 4 hours respectively. The
measurements made going from d to e lay on the same line as measurements
from e to d. The sample was then warmed to .3 K and measurements
(d -> f) were made while passing through the phase separation from below.
We waited, for about 3 hours at each measurement and the conductivities K n p a f f f pnr.*-!i~ r~~*tt" *~r. t.-.T*? f V 1 . r > 0 1 °L/r>r».i"r* rl'iT"! T>rr r h - * 0 . r - - 1 ' T r * p . TV«p /->QT*H**r* t - v * t v VOP.a
rapidly with temperature between .31 K and .320 K to a value 15% higher than 3
the extrapolated T value for .32 K. A subsequent experiment on the same
crystal gave T = .320 ± .005 K on our temperature scale, ps
The data above .335 K with one exception involved waiting times
less than 30 min. which was long compared to the thermal time constant and'
short compared to the time constant for the crystallographic change. The three
measurements at .43 K were made over a period of 2.5 hours, the conductivity
increased by 10% during this time. The sample was again cooled after reaching
(g ->- h) 0.65 K. The resulting conductivities are indicated by the dot-dash
line. Measurements made while going to 0.7 K (h -> i) lay on the same line. 3
These data suggest that boundary scattering by domains remains after the He
and He^ have gone back into uniform solution. An extremely long time
-77-
constant f o r the bcc-hcp t r a n s i t i o n i s expected above T (see sec. F of t h i s ps
chapter) and we hypothesize bcc "ghosts" of the domains i n the hep matr i x above T . The reduced c o n d u c t i v i t y due to s c a t t e r i n g by these "ghosts"
ps
was observed f o r a l l the concentrations and. pressures used i n t h i s work
except x^= .5. Given the observed phase s e p a r a t i o n time constants (a
maximum of 10 minutes was observed by Adams et a l . ) i t i s u n l i k e l y that the
mixture i s s t i l l phase separated at these h i g h temperatures.
This hypothesis of s c a t t e r i n g by c r y s t a l l o g r a p h i c "ghosts of the
phase s e p a r a t i o n " was te s t e d by a subsequent experiment. The c r y s t a l was
annealed and i s o t o p i c s c a t t e r i n g behaviour was observed between 0.6 K and
0.32 K. The c r y s t a l was cooled to j u s t below the phase s e p a r a t i o n tempera
t u r e f o r a p e r i o d of time and then measurements were made between .32 K and
.6 K i n a time short compared to the c r y s t a l l o g r a p h i c r e l a x a t i o n time. By
va r y i n g the time below phase s e p a r a t i o n the boundary s c a t t e r i n g c o n t r i b u t i o n
to the thermal r e s i s t a n c e was v a r i e d over a wide range. The r e s u l t i n g
c o n d u c t i v i t i e s i n d i c a t e d that two s c a t t e r i n g mechanisms were i n v o l v e d ,
i s o t o p i c s c a t t e r i n g and boundary s c a t t e r i n g . The dotted l i n e s i n the
f i g u r e (c* *>• j , c" k) are smooth f i t s to these data.
D. ABOVE THE'PHASE SEPARATION
The results of thermal conductivity measurements above the phase
separation are shown i n figure 10. The approximate phase separation
temperature is indicated by the v e r t i c a l bar at the low temperature end of
each curve. The uncertainty in T is typical ly ± 10 mK. The results of
rapid (5 min.) measurements below T ^ g lay on extrapolations of the high
temperature curves. Smooth curves to indicate the l imit ing results below
T are shown for several samples. PS
The results w i l l be compared to the theory for point defect
scattering at intermediate concentrations. It w i l l be assumed that the
specif ic heat of mixtures is a l inear combination of the specific heats of
the two isotopical ly pure sol ids .a t the "sample pressure in the c rys ta l lo -
3 graphic phase of interest . The 0 of bcc He at a fixed molar volume is
3
nearly constant in this temperature range (Pandorf and Edwards, 1968) so T
behaviour for the specif ic heat w i l l be assumed. The ratio of 0 's for the
pure He solids which was observed at lower molar volumes w i l l be assumed
to hold at the higher molar volumes of this work. This ratio,63/6^ = a> is
equal to 1.23 for bcc and 1.17 for hep He solids (Edwards and Pandorf, 1966)
Then ( i / 0 m ) 3 = x 3 d / e 3 ) 3 + (1 - X 3 ) ( i / 8 4 ) 3 .
The samples with x 3 > 0.1 have a bcc crystal structure. The crystal
structure is uncertain i n the case of x 3 = .1 and P = 28 atm. The bec-mixed
l i q u i d t r i p l e point for x ^ = .1 is at approximately T f c = 1.85 K and Pfc = 36
atmospheres. There is no conclusive experimental data for the bcc-hcp
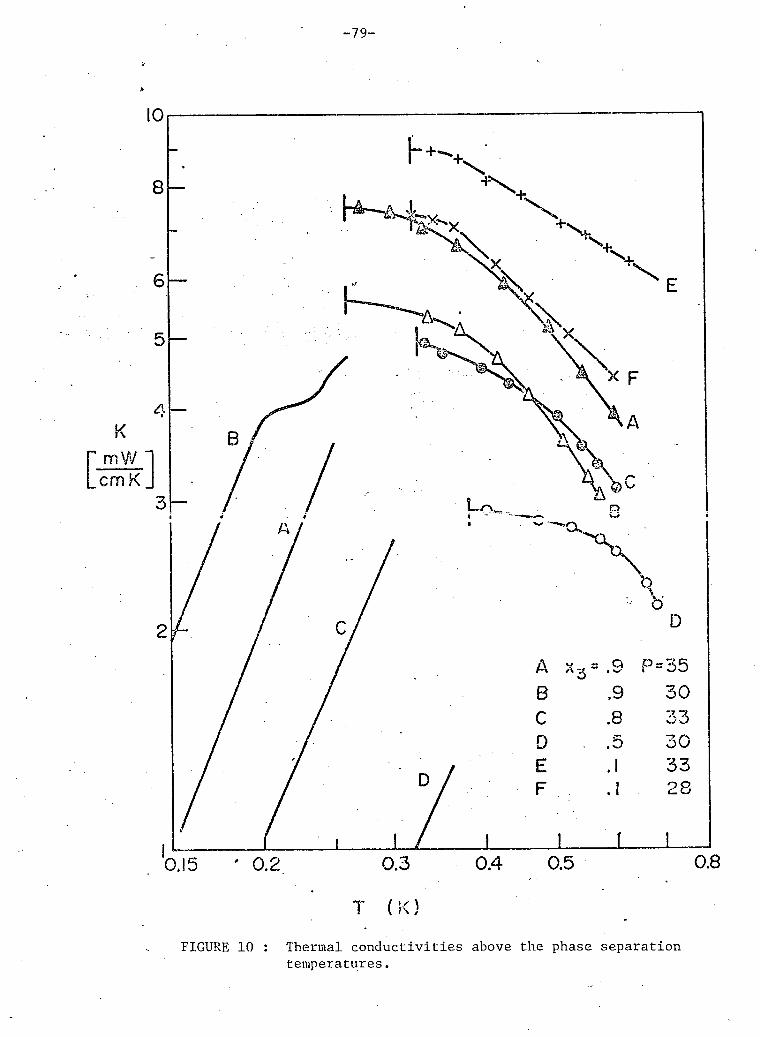
-80-
transition at lower temperatures at this concentration. We found that
the lower lines of the mixed bcc-hcp regions that were determined 3
by Vignos and Fairbank for several He concentrations lay on a common line,
within experimental error, when plotted on a reduced p - t diagram. The
reduced parameters were p = P/Pfc and t = T/T , where Pfc and Tfc are the
pressure and temperature for the bcc-mixed-liquid tr i p l e point at a given
concentration. For example; at t = 0.6, p = 0.83. This suggests that,
for x 3 = 0.1, at 1.1 K the mixture is mixed above and bcc below 30 atmospheres.
We conclude that the 10% crystal i s a mixture of hep and bcc at 33 atm. (see
also Miyoshi" et al„, 1970). We w i l l assume an bcc structure for the purpose
of calculation but the result w i l l be of l i t t l e significance.
The conductivities, calculated using the theory of isotopic
scattering at intermediate concentrations (see Chapter III), -7 1 -V? 1.28 x 10 ' 6 J (4 - x „ r / Z T T 7 .
1 ( A / V 1 / 2 Y Ix 3 (1 - x 3 ) ] 1 / 2 C m K
are shown in table 2. In the bcc phase, y = 2.2 (Sample and Swenson, 3
1967) , and in the hep phase at V = 20.9 cm /mole y = 2.9 (Jarvis et a l . , 1/2
1968) . The correction for l a t t i c e strain, (A/A ) is calculated using a
value of Y = 3.7. The calculated conductivity, K , i s compared to the
experimental conductivity, K , at T = 0.6 K (T/9 % .03).
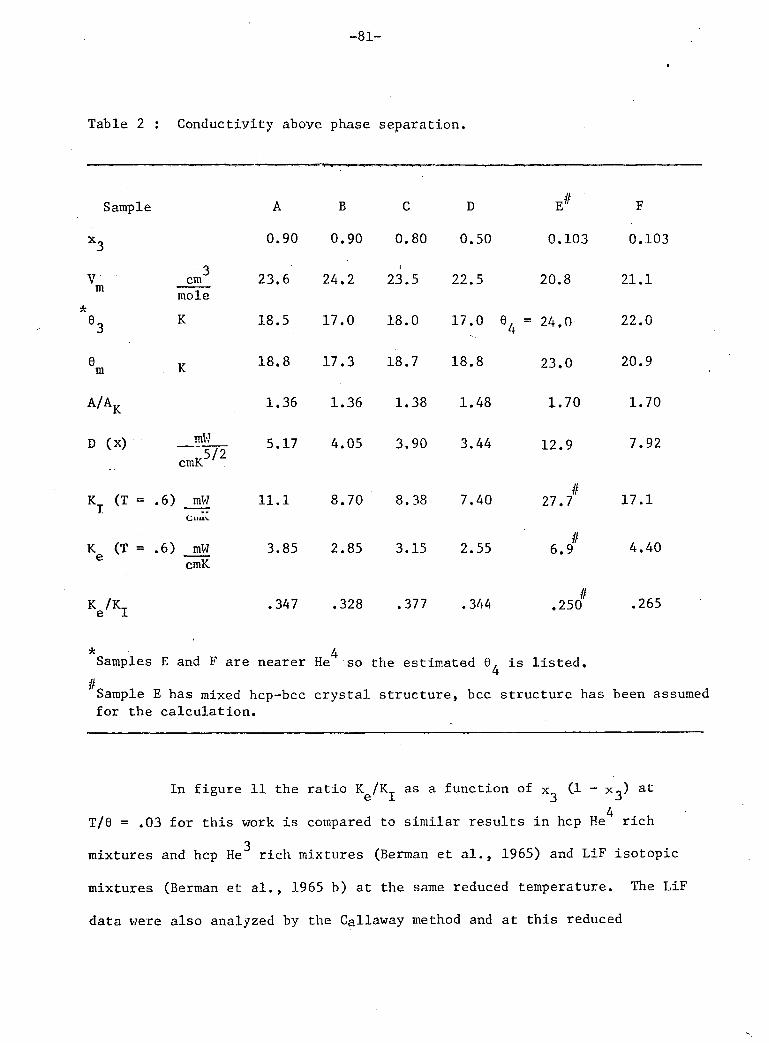
Table 2 : Conductivity above phase separation.
Sample A B C D E # F
x 3 0.90 0.90 0.80 0.50 0.103 0.103
V cm3 23.6 24.2 23.5 22.5 20.8 21.1 m
ft
e
mole G_ K 18.5 17.0 18.0 17.0 6, = 24.0 22.0 3 4
6 v 18.8 17.3 18.7 18.8 23.0 20.9
A/AK 1.36 1.36 1.38 1.48 1.70 1.70
D (x) — - | T - 5 - 1 7 4.05 3.90 3.44 12.9 7.92 cmK
KT <T = -6> JEJl 1 1 • 1 8 - 7 0 8 - 3 8 7 - A 0 27.1 17.1
K (T = .6) mW 3.85 2.85 3.15 2.55 6.9# 4.40 cmK
K /K_ .347 .328 .377 .344 .250# .265 e 1
* 4 Samples E and F are nearer He so the estimated 0. i s l i s t e d . 4 Sample E has mixed hcp-bcc crystal structure, bec structure has been assumed for the calculation.
In figure 11 the ratio ^/K^ as a function of x ^ (1 - x^) at 4
T/0 = .03 for this work is compared to similar results in hep He rich 3
mixtures and hep He rich mixtures (Berman et a l . , 1965) and LiF isotopic
mixtures (Berman et a l . , 1965 b) at the same reduced temperature. The LiF
data were also analyzed by the Callaway method and at this reduced
-82-
temperature about 10% of the thermal r e s i s t a n c e i n the i n t e r m e d i a t e
c o n c e n t r a t i o n samples was found to be due to boundary s c a t t e r i n g . The
r a t i o K^/Kj was reduced f o r the d i l u t e samples by r e l a t i v e i n c r e a s e i n
boundary and Umklapp s c a t t e r i n g . The disagreement between the L i F measure
ments and the theory was a t t r i b u t e d to the f a i l u r e of y as an estimate of
the e f f e c t of anharmonicity on the normal processes r e l a x a t i o n time. This
theory has been found t o overestimate the c o n d u c t i v i t y of a number of
d i f f e r e n t i s o t o p i c mixtures by a f a c t o r of order 2 (Berman et a l . , 1959).
We conclude t h a t , w i t h i n the l i m i t s imposed by the parameters; 9 m
Y and A/Aj,, these r e s u l t s f o r bcc helium mixtures are i n agreement w i t h
measurements on other s o l i d mixtures at the same reduced temperature.
The t h e o r y nredi'cts that i f i s o t o n i c s c a t t e r i n g i s the s o l e r e s i s
t i v e s c a t t e r i n g mechanism the r a t i o K /K should be temperature independent -3/2 • ' and one should observe K a T . The observed c o n d u c t i v i t i e s do not f o l l o w
t h i s simple r e l a t i o n s h i p , suggesting that other s c a t t e r i n g mechanisms are
present. Edwards et a l . , (1962) observed a " t a i l " on the s p e c i f i c heat -
measurements that extended to about 1.5 T and i n t e r p r e t e d t h i s as an ps
e f f e c t due to s h o r t range order. Such an e f f e c t would enhance the i s o t o p e 2
s c a t t e r i n g s i n c e a c l u s t e r of n s c a t t e r i n g s i t e s s c a t t e r s w i t h n times the
s t r e n g t h of n random s i t e s (Morse and Feshbach, 1953). There may a l s o be a
boundary s c a t t e r i n g c o n t r i b u t i o n . The mean f r e e path f o r boundary s c a t t e r
i n g i n a p o l y c r y s t a l l i n e sample i s approximately the average g r a i n s i z e . We
observed no s i g n i f i c a n t change i n the c o n d u c t i v i t y a f t e r annealing the
r a p i d l y grown samples which suggests that boundary s c a t t e r i n g i s not an
important c o n t r i b u t i o n .
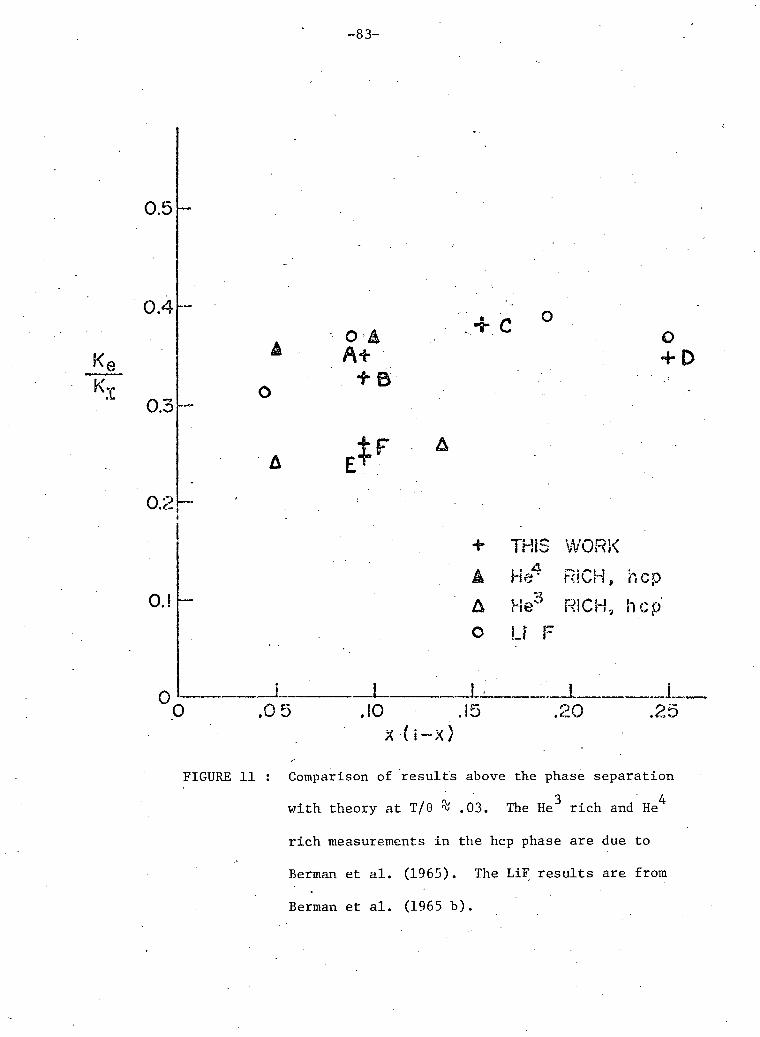
-83-
A
At + •f-B
A
+ THIS W O R K
k H e 4 R I C H , h e p
A H e 3 R I C H , h e p
O Lf F
. 0 . 0 5 . 1 0 . 1 5 . 2 0 . 2 5
' X-(i-x)
FIGURE 11 : Comparison of results above the phase separation
with tbeory at T/0 % .03. The He rich and He
rich measurements in the hep phase are due to
Berman et a l . (1965). The LiF results are from
Berman et a l . (1965 b).
-84-
E. BELOW THE PHASE SEPARATION
The measurements of the sample conductivities are shown in 3 figures 12, 13 and 14. These results (for a l l samples except 50% He ) were
time independent. The results forx^= .90, P =» 35.5 atm., were reproduced
to within 5% on three different crystals. Measurements in the 50 mK region
below T that were obtained-while cooling from above T were not conclusive ps ps because of the very long time constants.
The temperature dependences of the conductivity for the 10% and
90% samples are in good agreement with the temperature dependences of con
ductivity and specific heat measurements in the pure isotopes. The calcu
lated mean free paths are temperature independent.
The apparent temperature dependence of the mean free path in the
80% sample (A % 6.8 T - 0 * 2 microns) and the 50% sample (A % 2.8 T ~ 0 , 3 microns)
is similar to the effect seen in highly polycrystalline solids (Berman,
1952). Klemens (1958) has suggested that a grain boundary can act both as a
surface (A = est) and as a row of dislocations (A a T ^ ) . A combination of
these scattering processes w i l l then give an intermediate temperature
dependence.
Dilute Mixtures
The conductivities of the 10% and 90% mixtures were observed to
reach time independent limits (which we shall refer to as the limiting conduc
t i v i t i e s ) . The limiting conductivity of each sample could be described by the
empirical equation K = BT n. The conductivities of the dilute mixtures and
specific heats of the matrix solids had the same temperature dependence in d i
cating that the phonon mean free paths (A = 3K/Cv) were temperature independent.
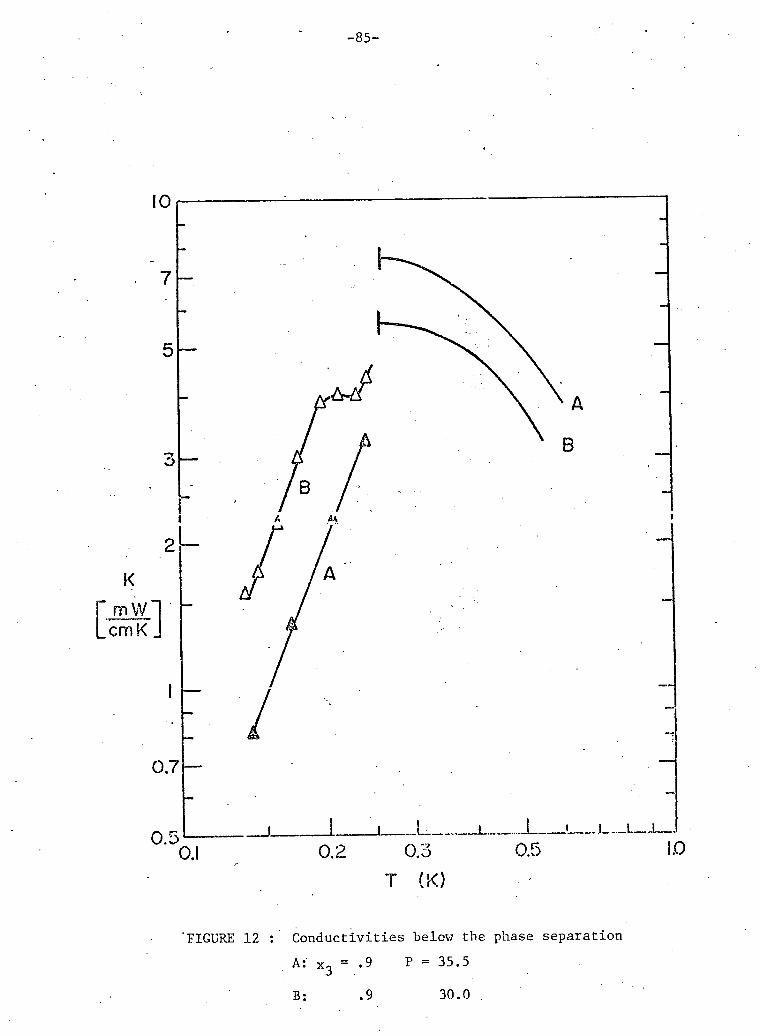
-85-
' FIGURE 12 Conductivities below the phase separation A: x 3 = .9 . P = 35.5
B: .9 30.0 .
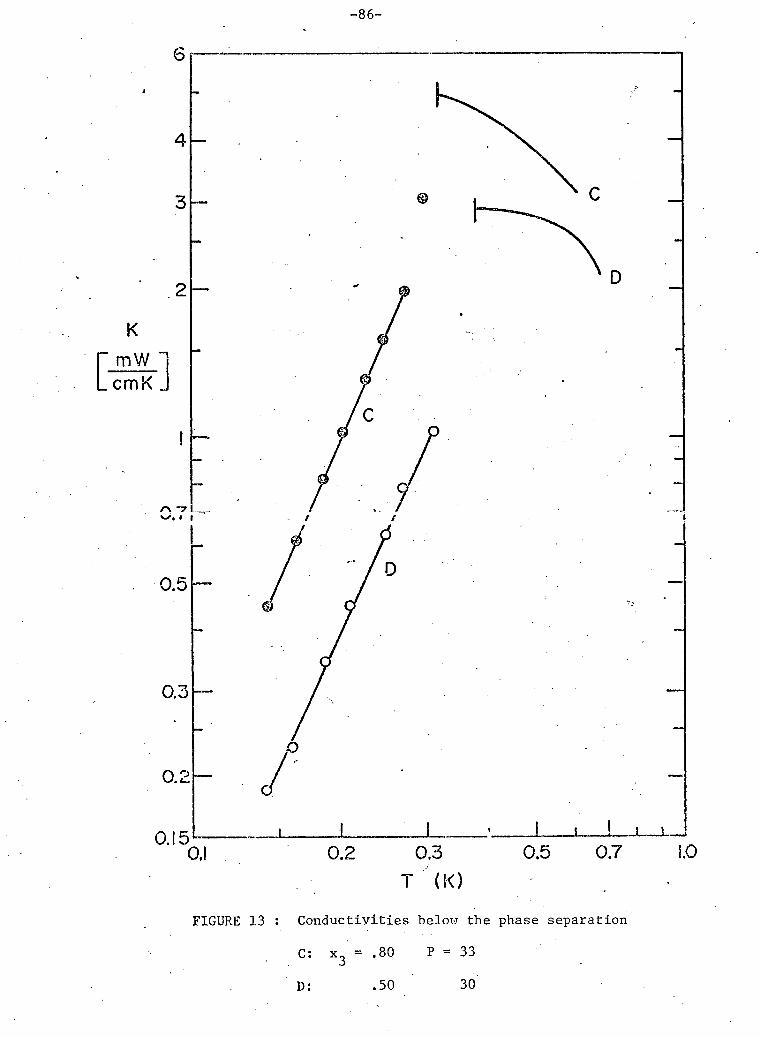
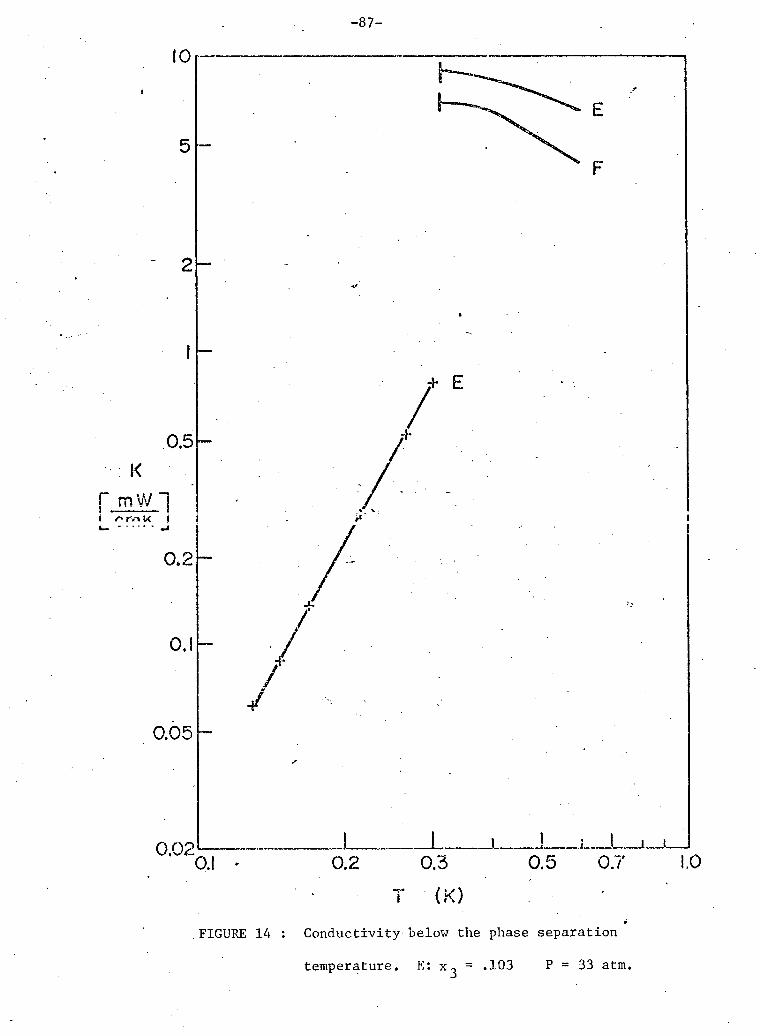
-87-
T (K) FIGURE 14 : Conductivity below the phase separation
temperature. E: x, = .103 P = 33 atm.
-88-
The limits could be reached most quickly when the average temperature of
the crystal was 30 to 50 mK below the phase separation, temperature. The .
limiting conductivity was reproduced for several 90% crystals at the same
pressure.
A complete theoretical model would .be extremely complex. We w i l l
analyze the results of the 10% and 90% mixtures using the following simple
model.
We assume that domains of the least abundant isotope are
distributed randomly in a matrix of the more abundant isotope. The existence
of domains is supported by evidence of a constant mean free path which is
indicative of scattering by surfaces. The temperature independence of the
mean free path suggests.that the domain dimensions are larger than the o
dominant phonon wave lengths ( 700 A at 0.15 K). These domains are assumed
to be spheres of constant size and composition. The composition of these
domains can be considered constant below 0.2 K since phase separation is 3
nearly complete at that temperature. At 0.2 K the equilibrium He concentra
tions of the phases are 97% and 1%. The limiting conductivity indicates
that the domain sizes became time independent.
The assumption of spherical shape is not easily j u s t i f i e d . The
equilibrium shape w i l l be that which minimizes the total free energy. Since
the molar volumes of the two phases are different there is a strain energy
per unit volume, a , which depends on the modulus of r i g i d i t y of the matrix
and the shape of the domain (see Burke, 1965). The value of a^, is largest
for a spherical domain and smallest for a disc shaped domain. The surface
-89-
free energy of a domain per -unit volume, cr^, w i l l be minimized for a spher
i c a l domain. A small modulus of r i g i d i t y favours spherical shape; however, 3
the anisotropy of bec He (Greywall and Munarin, 1970) suggests that
spherical domains are unlikely. The assumption w i l l be used since no better
estimate of shape is available.
In the region just below T^g the compositions of the two components
(domains and matrix) are temperature dependent. A complete theoretical cal
culation would have to include isotopic scattering within these components.
In addition, conservation of matter requires that the ratio of domain to
matrix volume change as the compositions change. This w i l l alter the domain
scattering cross section. The hep-bec transition region probably occurs
above 0.2 K and this also w i l l alter the domain scattering cross section.
In the limit of complete phase separation of a mixture of molar
concentration x of the least abundant isotope A; the domains w i l l
occupy a fraction, p, of the total volume of the solid. If the molar
volumes of the two components A and B at the sample pressure are and
respectively, then
p = x A VA/V where V - x A V A + xfi V B
We assume for dilute mixtures that the domains are small i n
comparison to the phonon mean free path. In the limit of dilute mixtures
we can use the model of plane wave scattering from n spheres of average
radius, a, per unit volume. The details of the nature of the domain walls
and phonon propagation inside the domains w i l l be accounted for by assuming
-90-
a scattering cross-section, a = sA where A is the geometric cross-section
and s i s a proportionality parameter. For. a hard sphere that does not
distort the matrix, s = 2. The mean free path for phonon scattering in this
model i s then A = 1/no" and the ratio a/s i s given by
a/s = "j;
The mean free path i s calculated from the experimental data (table 3) by
means of the kinetic theory of gases approximation, using the specific heat
and sound velocity of the matrix isotope, and the measured thermal conducti
vity. The mean free path i s then A = 3K/Cv and
9 K x A V A
hence a/ s = — — AC v V
C!once^t.ter! M i - V t ' 1 1 * 0 . ? ?
The thermal conductivities of the 80% and 50% mixtures did not have
the same temperature dependences as the associated specific heats. This
suggests a temperature dependent mean free path. In addition, the 50% mix
ture conductivity did not become time independent at a lower limiting value.
The conductivity rose with time and the value reached after 82 hours below
T cannot be considered to be an upper limit, ps
The model used in the dilute cases is unlikely to be valid
when the domain volume i s not a small proportion of the total volume. We
w i l l make no attempt to develop a r e a l i s t i c model for this situation but w i l l
define an average mean free path \. We w i l l use the kinetic theory approxi
mation with arithmetic averages of the specific heats and sound velocities of
the pure isotopes for the molar volumes that correspond to the sample pressure,
then X = 3K/Cv.
-91-
The mean free path, defined in this way should give an order of
magnitude estimate of the domain size. The average, domain size for 80% w i l l
be determined using X = 4a/3ps.. . The average domain size for 50% w i l l be
calculated using X = 2a/s.
Specific Heats and Sound Velocities of the Mixtures
Once phase separation has occurred the molar volumes of the two
separated phases are different from the average molar volume. Well below
T we can assume that each component i s one of the pure isotopes.
The two separated phases have different crystal structures, molar
volumes and Debye temperatures. We w i l l determine the molar volumes of the
pure isotopes at a given pressure from data of Edwards and Pandorf (1965,
1968) without correcting for the excess pressure due to phase separation and
the resultant change in molar volume (AV/V = 0.5%).
4 The specific heat of hep He has been found to exhibit Debye
4 behaviour below T/0 = .03. The Debye temperature of hep He for a given
molar volume w i l l be obtained from the data of Edwards and Pandorf (1965). 3
The specific heat of bec He does not exhibit Debye behaviour (Pandorf and
Edwards, 1968; Sample and Swenson, 1967). When i t is interpreted using a
temperature dependent 6, the resulting 0(T) reaches a maximum at T/0 = .02 3
and decreases at lower temperatures. The specific heat of bec He can be 2 5
expressed by the expirical equation C = AT to within experimental error.
We w i l l determine the value of A by f i t t i n g the above equation to the
specific heat data of Sample and Swenson (1967) at T = 0.4 K.
-92-
We w i l l assume that the velocity of sound i s constant and given
by the Debye model
2 -1/3 v = (k0/n) (6TT N/V) , where N i s Avogadro's number,
4 3 with 0 (T = 0) for He and 6 for bcc He . Sound velocity measurements by max
3 Greywall and Munarin (1970) in bcc He at one molar volume indicated a 8 smaller than 0 and were interpreted as 0 (T = 0). However Trickey and Adams max ,
(1970) suggest that the 8 determined in this way is the value for the measure
ment temperature (1.7 K). Since there are no measurements at low temperatures
we w i l l use the above assumptions.
Experimental Results
i'ne empirical expressions for the experiment-any decermiueti conduct i v i t y K and the values of the mean free path A and the ratio of domain radius
e
to scattering proportionality parameter a/s calculated using our model are
li s t e d in Table 3. The concentrations and pressures were determined experi
mentally. The methods of obtaining the molar volumes, specific heats and
sound velocities have been described in the preceding section. The results
for sample F (x^ = 0.103, P = 28 atm) are not included because a crystallo
graphic transformation, with a very long time constant, was taking place in
the matrix.
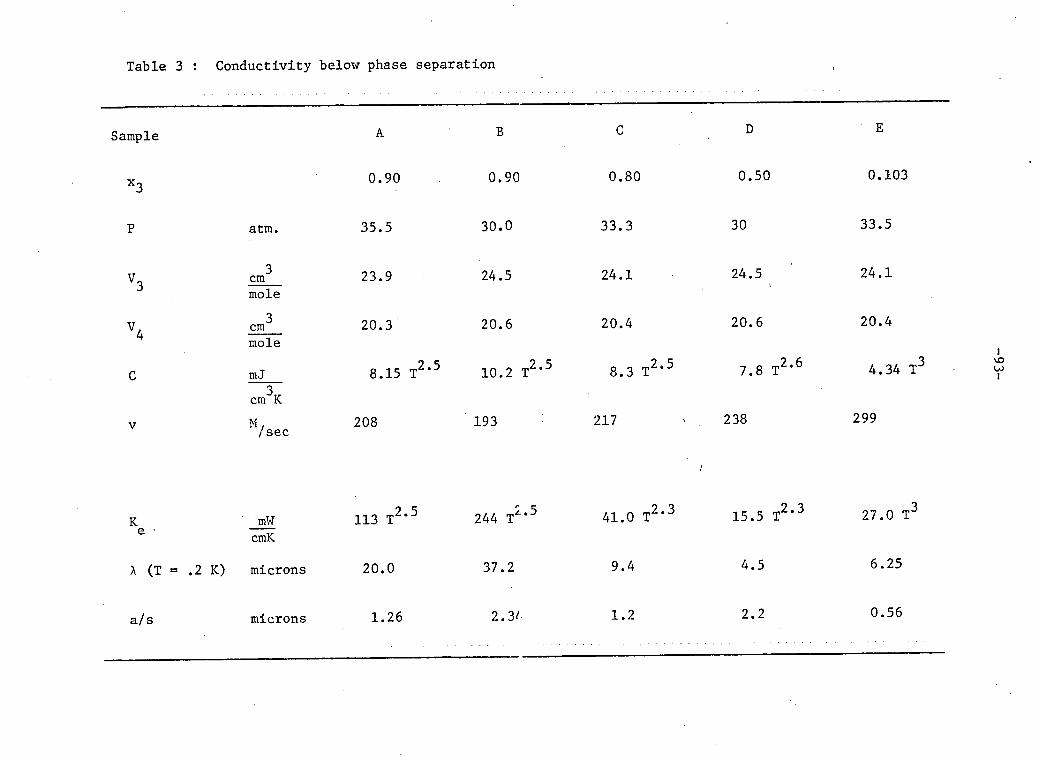
Table 3 : Conductivity below phase separation
Sample
X3
V
atm.
0.90 0.90 0.80 0.50 0.103
35.5 30.0 33.3 30 33.5
V 3 cm3 23.9 24.5 24.1 24.5 24.1 mole
V 4 cm3 20.3 20.6 20.4 20.6 20.4 mole
C mJ 8.15 T 2' 5 10.2 T 2 , 5 8.3 T 2 , 5 7.8 T 2 , 6 4.34 T 3
cm K M, 208 193 217 > 238 299 / sec
K J2W 113 T 2* 5 244 T 2* 5 41.0 T 2 , 3 15.5 T 2* 3 27.0 T 3
6 cmK
X (T = .2 K) microns 20.0 37.2 9.4 4.5 6.25
a/s microns 1.26 2.3' 1.2 2.2 0.56

- 9 4 -
Scattering by the Domains
The average radius of the spheres is not determined uniquely by
these experiments because the value of the scattering cross section
proportionality parameter is unknown. We w i l l estimate the average radius
by assuming a hexagonal array of domains in which each domain grows by
mutual diffusion of the two isotopes within a sphere of radius R surround
ing i t . The time constant x of such a growth process is approximately
(Crank, 1956)
x % r 2
I T 2 D
The mutual diffusion coefficient D w i l l be estimated using the tunnelling
atoms do a three dimensional random walk in steps of a Q (the nearest
neighbour distance) with a jump frequency £34' then the diffusion coefficient 2
is given by D % a f-./6. The average radius R of the spheres for a given o 34 x is then R - IT a ( x f . / 6 ) 1 / 2
o 34
4 4 For the 10% He sample we use the values x = 140 sec, f ^ = 7 x 10
sec and a = 3.7 x 10 ^ cm. o
Then R % 1.5 microns, the average separation between domain centres
is 2R % 3 microns, and the average radius of the domains i s a % R/2 % 0,75
microns. The value of the proportionality parameter is then s % 1*5. Given
the crudeness of the model, we only take the result as an indication that s
is of order unity.
-95-
The domains w i l l scatter phonons because strain f i e l d s w i l l exist
around them and also because the density and elast ic constants of the sample
w i l l change at their boundaries.
We w i l l estimate the second contribution s,, . = a /A .to the scatter-
ing proportionality parameter by assuming that i t i s equal to the reflect ion
coefficient that is associated with a plane boundary between two f luids of
different density and sound veloci ty . We w i l l use the solid helium sound
veloci t ies given by the Debye model. Below the crystal structures and
isotopic concentrations are different and s B % 0.2. When crystallographic
domains exist above T ^ g only the sound veloci t ies are s ignif icant ly d i f f e r
ent and s % 0.01. This large change in s (and therefore i n X and K) on
passing upward through T was not seen experimentally (see figure 9). ps
The strain f i e l d created when an oversized sphere of radius a i s
placed i n a spherical hole in an elast ic medium is given by (Carruthers,
1961)
V(r) = A r / r 2 r > a
= 0 r < a
where r i s a unit vector i n the radial direction and A is a constant which
measures the strength of the dis tor t ion . The probability of scattering of
phonons by such a f i e l d has not been calculated for the case in which the
phonon wavelengths are small compared to the radius of the sphere. We
w i l l describe the scattering cross-section in the following manner. We
assume that the scattering takes place on the surface of a sphere of radius
-96-
= a (1 + 6) where <S i s p r o p o r t i o n a l to the s t r e n g t h of the s t r a i n f i e l d .
The s c a t t e r i n g cross s e c t i o n of s t r a i n f i e l d i s then
0 = B-rra2 = BTra 2(l + <5)2
1
where B i s a p r o p o r t i o n a l i t y constant. The p r o p o r t i o n a l i t y parameter i s 2
then given by s g = B (1 + S) . I f 6 i s sm a l l compared to 1, then the s c a t t e r i n g cross s e c t i o n a w i l l not change s i g n i f i c a n t l y when the composi-
s
t i o n of the domains change and the phonon mean f r e e path above T w i l l then
be n e a r l y equal to X below T • This r e s u l t agrees w i t h the experimental
r e s u l t f o r x^ = 0.1 and suggests s t r a i n f i e l d s c a t t e r i n g i s stronger than
s c a t t e r i n g due to changes i n d e n s i t y and e l a s t i c constants.
The above r e s u l t s l e a d us to conclude that the s t r a i n f i e l d
s c a t t e r i n g at the domains i s so strong that the domains s c a t t e r i i i c e nard
spheres.
F. TIME DEPENDENT EFFECTS
A l a r g e amount of superheating..and...supercooling of the v a r i o u s -
c r y s t a l l o g r a p h i c phases was observed.. These, metastable e f f e c t s have been 3
observed i n the bcc-hcp t r a n s i t i o n measurements., i n . pure He .. S t r a t y and
Adams (1966) were able to supercool bec samples, which i n e q u i l i b r i u m would
enter the mixed phase r e g i o n at 1.7 K, to 0.33 K.
Because of the very long time constants of these phase changes, we
observed the unusual e f f e c t of i s o t o p i c s c a t t e r i n g combined w i t h v a r i a b l e
boundary s c a t t e r i n g .
The n u c l e a t i o n p r o b a b i l i t y of a c r y s t a l l o g r a p h i c phase which i s
thermodynamically favoured i s p r o p o r t i o n a l to exp(-AG^/KT) where the energy
b a r r i e r , AG^, i s i n v e r s e l y p r o p o r t i o n a l to the d i f f e r e n c e (AG^) between the
volume f r e e energy of the e x i s t i n g phase and the favoured phase.
The l a r g e amount of superheating i n the 10% samples can be explained
i n the f o l l o w i n g way. The bcc-hcp t r a n s i t i o n i n the uniform 10% mixture i s
i n the temperature and pressure region of t h i s work so AG^ i s s m a l l . When the 3
sample cools through the phase s e p a r a t i o n , domains o f . n e a r l y pure He form,
the value of AG^ f o r the domains inc r e a s e s c o n s i d e r a b l y , and the c r y s t a l l o
graphic phase change to bec s t r u c t u r e i n the domains and/or hep s t r u c t u r e i n
the m a t r i x takes place w i t h a r e l a t i v e l y short time constant. 3
When the phase separated c r y s t a l i s warmed above T^g the He and
He^ go back i n t o a uniform 10% s o l u t i o n r a p i d l y (Tf\.10 minutes). The bec
domains and the hep ma t r i x w i l l now have l i t t l e tendency to r e t u r n to the
-98-
equilibrium crystal structure because of the small value of A.G and a long
time constant is expected.
The inverse effect would be expected for the 90% samples. On 4
cooling, the He rich domains that form have concentrations.close to 10% and.
the small AG^ leads to a long time constant for crystallographic change in
the domains. When the sample is warmed above T the concentration of the ps
3
domains returns to 90% He and the large value of AG^ leads to a rapid
change in crystal structure. Both these effects were observed. For the 10% samples, the hcp-bcc
time constants were an hour or less on cooling through T but were longer ps
than an hour (calculated values of up to 7 hours) above T . The time con-ps
stants for the 90% samples were a l l longer than 30 minutes when the domains
were forming. The "ghosts" of the domains sample B were gone after 20 to
30 minutes at T = .35 K.
One of the supercooling effects was not understood. Sample A was
cooled below T many times. If the heater was turned on at .25 K the ps limiting conductivities were obtained. On three occasions the sample was
cooled to .2 K before the heater was turned on. Care was taken to ensure
that the experimental conditions were reproduced as closely as possible. On
two of these occasions the conductivity was 30% higher than the limiting
'value and constant within the resolution of the thermometers for 30 minutes. 2.15
Measurements at lower temperatures gave the result Ka T " . When the
sample was warmed to .25 K the conductivity went to the limiting value. On
the third occasion the sample was annealed and then cooled to .15 K before
the heater was turned on. The conductivity approached the limiting value
at .17 K with a time constant of about an hour.
- 9 9 -
The time dependent e f f e c t s i n the 50% sample were very d i f f e r e n t
from the ones discussed above. The r e s u l t s of the f i r s t experiment are
shown i n the f o l l o w i n g f i g u r e . The data are numbered and the time of each
measurement i s recorded on the page opposite, the graph. The sample was cooled 2
through T at t = 0. The c o n d u c t i v i t y was p r o p o r t i o n a l to T f o r the
f i r s t three measurements. In a second experiment the c r y s t a l was held at ml'T .3 K f o r 10 hours, the c o n d u c t i v i t y was .57 -~? a f t e r 4 hours and increased ' cmK
by 10% i n the next s i x hours. The r e s u l t s of these two experiments i n d i c a t e
that the domain s i z e doubles i n 50 ± 10.hours. We i n t e r p r e t t h i s as an
e f f e c t due to coarsening (see Chapter 2). The r e l a t i v e l y short time span of
the second experiment and the changing temperatures i n the f i r s t experiment
do not permit us to a c c u r a t e l y determine the time dependence of t h i s e f f e c t .
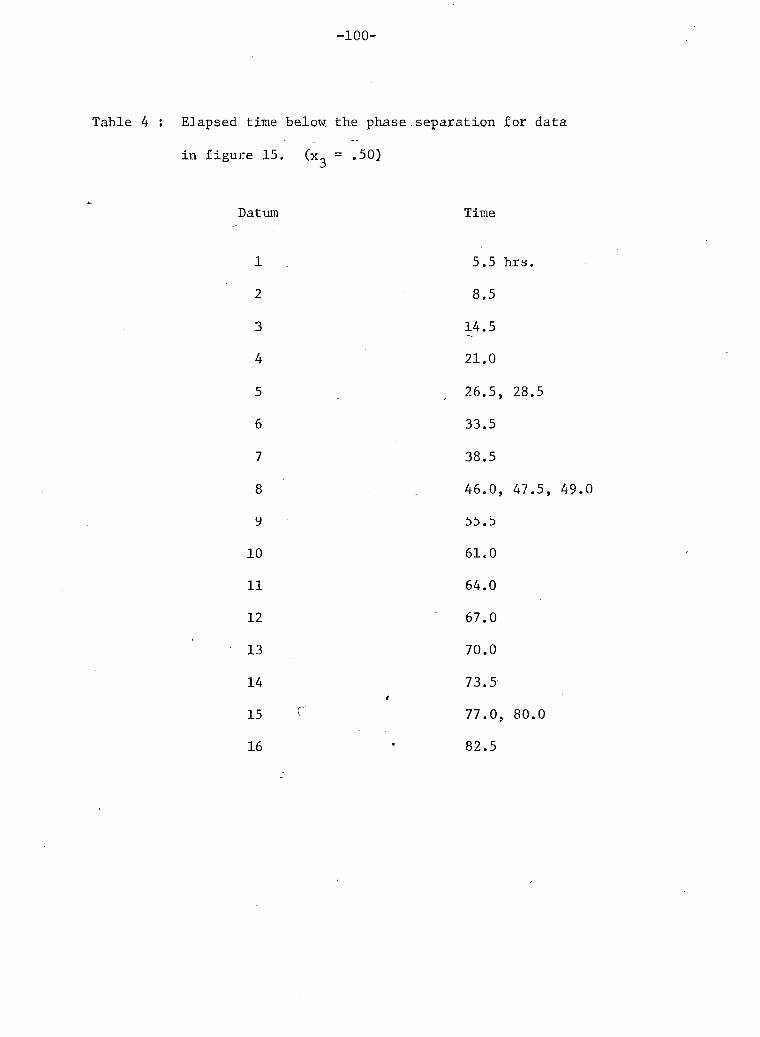
-100-
Table 4 : Elapsed time below the phase.separation for data
in figure 15. QK ~ .50)
Datum Time
1 5.5 hrs.
2 8.5
3 14.5
4 21.0
5 r 26.5, 28.5
6 33.5
7 38.5
8 46.0, 47.5, 49.0
9 55.5
10 61.0
11 64.0
12 " 6 7 . 0
13 70.0
14 73.5
15 r 77.0, 80.0
16 • 82.5
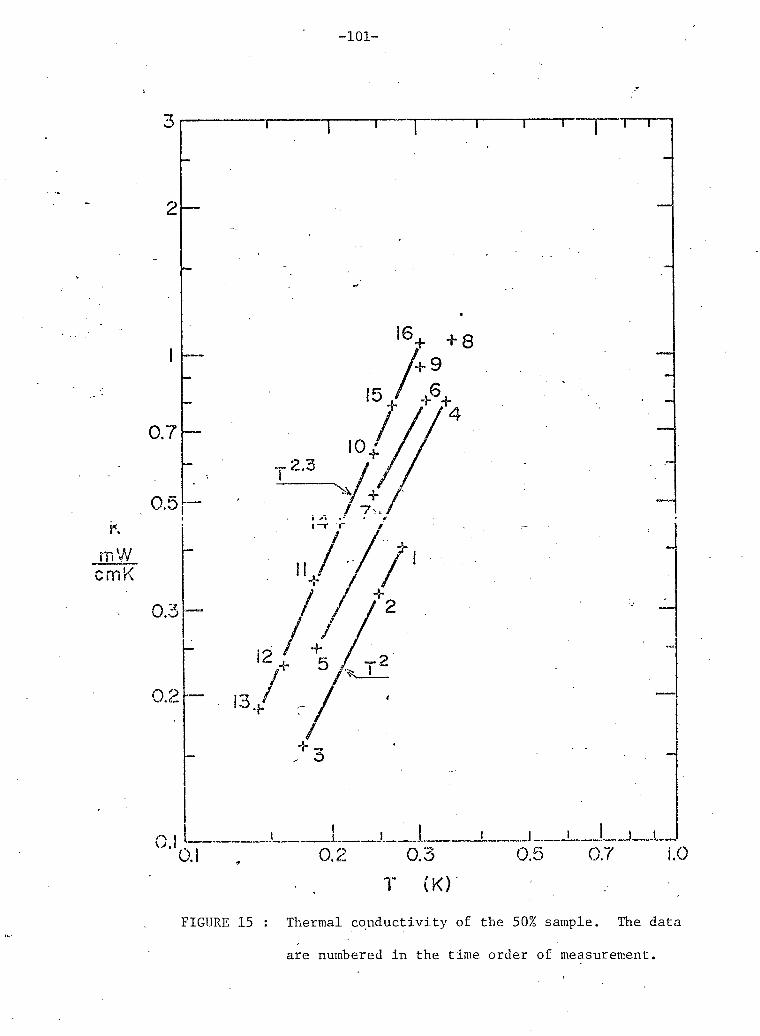
-101-
3 I 1 1 T i—r
2
0.7
0.5
! ) l A cmK
0.3
0.2
0.1
1 6 + +8
0. 03" " T (K)
as L
0.7 .0
FIGURE 15 : Thermal conductivity of the 50% sample. The data
are numbered in the time order of measurement.
-102-
G. CONCLUSIONS
The thermal c o n d u c t i v i t y measurements of s o l i d helium mixtures described
i n t h i s t h e s i s are the f i r s t such measurements done below 0.5 K. The meas
urements above 0.5 K (Bertman et al.,1966 and Berman et al.,1965;1968) were
done to t e s t t h e o r i e s of i s o t o p i c s c a t t e r i n g . Our measurements were a l s o the
f i r s t measurements of t r a n s p o r t p r o p e r t i e s of phase separated s o l i d helium
mixtures. The two previous measurements were measurements of s p e c i f i c heat
(Edwards et al.,1962) and excess pressure at constant volume (Panzcyk et a l . ,
1968). We know of no other thermal c o n d u c t i v i t y measurements done on hetero
geneous s o l i d s i n the low temperature r e g i o n where only phonon s c a t t e r i n g at
the boundaries betx^een the two components i s important.
The thermal c o n d u c t i v i t y measurements above the phase se p a r a t i o n
temperature i n d i c a t e t h a t the l a t t i c e s t r a i n enhancement of i s o t o p i c
s c a t t e r i n g i n bcc s o l i d helium mixtures i s s i m i l a r to the enhancement i n
hep s o l i d helium mixtures.
The thermal c o n d u c t i v i t y of o r i g i n a l l y homogeneous mixtures decreases
a b r u p t l y at the phase s e p a r a t i o n temperature. For d i l u t e mixtures below
T , the phonon mean f r e e path i s constant. The phonons are s c a t t e r e d by ps'
surfaces whose s p a t i a l dimensions are l a r g e compared to the dominant phonon
wave l e n g t h s . Our model suggests domains w i t h t y p i c a l dimensions of one
micron. There i s no l a r g e change i n mean f r e e path when phase separated
mixtures remix l e a v i n g c r y s t a l l o g r a p h i c domains. This i n d i c a t e s that the
s c a t t e r i n g cross s e c t i o n s of domains are not s t r o n g l y dependent on the
d e n s i t i e s and e l a s t i c constants of the domains.
3 The temperature dependences of the c o n d u c t i v i t i e s below T^g (T
A 2 5 3 f o r a He r i c h m a t r i x and T * f o r a He r i c h m a trix) agree w i t h previous
measurements on the pure s o l i d s . ,'
-103-
The measured phase separation for the sample with = .103 and
P = 33.5 atmospheres agrees with the measurements of Panczyk et a l . (1968)
with i n experimental e r r o r .
Suggestions f o r Further Research
Thermal c o n d u c t i v i t y measurements are not well suited f o r precise
determination of the nature of the phase separated domains because both
l o n g i t u d i n a l and transverse phonons of a range of frequencies are present,
and a theory of s c a t t e r i n g of phonons by large scale s t r a i n f i e l d s i s not
a v a i l a b l e . A more s u i t a b l e method would be the measurement of the a t t e n
u a t i o n of sound. D e t a i l e d theories of attenuation i n the Raleigh l i m i t are
a v a i l a b l e and measurements could be made with f i x e d frequencies and p o l a r -
i nations.
The a b i l i t y to vary the properties of the domains by melting the 3
He r i c h domains or warming the phase separated mixture above T would
permit the t e s t i n g of theories of s t r a i n f i e l d s c a t t e r i n g .
One would expect the f o l l o w i n g r e s u l t f o r thermal c o n d u c t i v i t y
measurements at lower temperatures. As the temperature i s reduced the
mean free path w i l l become temperature dependent. When the dominant phonon -2
wavelength i s about 1 micron (T ^ 5 mK) one would expect X a T . Below • -A
1 mK X w i l l increase as T u n t i l X equals the diameter of the sample. The
mean free path w i l l then become constant. The thermal c o n d u c t i v i t y w i l l
reach a minimum at a temperature on the order of 1 mK, then increase to a
maximum and f i n a l l y decrease with a constant mean free path.
-104-
' APPENDIX
A. ' TABLES'OF EXPERIMENTAL DATA
The data i n this appendix are l i s t e d in the time sequence of the
measurements. The elapsed time associated with each measurement is given.
The elapsed time is measured from the end of the f i r s t anneal.
Some measurements were taken while AT was not "constant". These
measurements are indicated by an asterisk. In most of these cases the con
ductivity was slowly changing because a crystallographic phase transforma
tion was taking place.
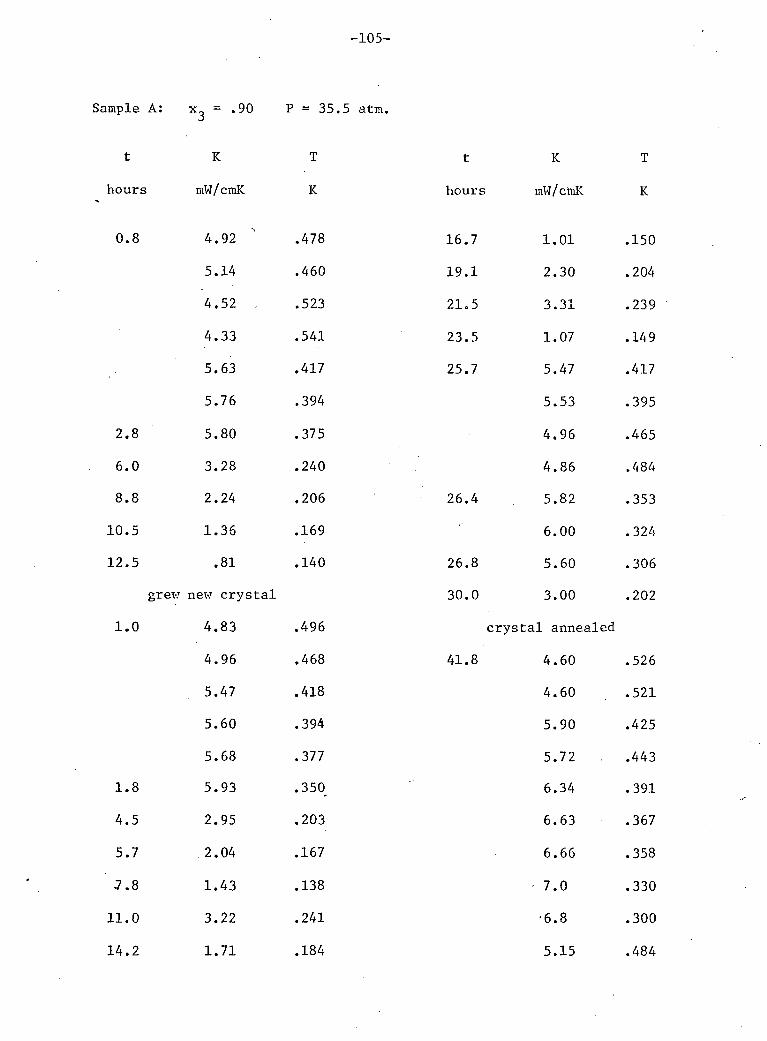
-105-
Sample A: x 3 = .90 P = 35.5 atm.
t
hours
0.8
K
mW/cmK
4.92
5.14
4.52 .
4.33
5.63
5.76
2.8 5.80
6.0 3.28
8.8 2.24
10.5 1.36
12.5 .81
grew new crystal
1.0 4.83
4.96
5.47
5.60
5.68
1.8 5.93
4.5 2.95
5.7 .2.04
7.8 1.43
11.0 3.22
14.2 1.71
T
K
.478
.460
.523
.541
.417
.394
.375
.240
.206
.169
.140
.496
.468
.418
.394
.377
.350
.203
.167
.138
.241
.184
t
hours
K
mW/cmK
16.7 1.01
19.1 2.30
21.5 3.31
23.5 1.07
25.7 5.47
5.53
4.96
4.86
26.4 5.82
6.00
26.8 5.60
30.0 3.00
crystal annealed
41.8 4.60
4.60
5.90
5.72
6.34
6.63
6.66
- 7.0
•6.8
5.15
T
K
.150
.204
.239
.149
.417
.395
.465
.484
.353
.324
.306
.202
.526
. 5 2 1
.425
.443
.391
.367
.358
.330
.300
.484

-106-
t K T
hours mW/cmK K
5.34 .465
5.14 - .486
4.94 .504
44.0 4.50 .537
45.7 2.54 * .207
46.0 2.50 * .206
46.3 2.46 * .206
46.7 2.43 * .206
49.5 2.19 .208
52.3 1.32 .172
52.8 5.05 .483
5.05 .464
5.94 .414
6.40 .369
53.9 7.05 .341
annealed for 6 hours
66.5 6.06 .414.
6.26 .392
7.04 .347
6.48 .372
6.93 .345
7.2 .332
7.5 .307
7.6 .298
7.4 * .294
t K T
hours mW/cmK K
7.5 * .290
68.5 7.5 * .285
71.4 1.68 .170
75.0 1.52 * .170
77.9 1.43 * .170
78.9 3.87 .599
4.02 .585
4.78 .516
4.48 .534
4.21 .562
7.30 .317
7.30 * .299
7.7 * .293
7.5 * .290
7.3 * .305
7.7 .278
7.5 * .269
7.4 * .275
7.4 * .264
7.7 * .257
7.7 * .265
7.5 * .281
82.5 7.7 * .266
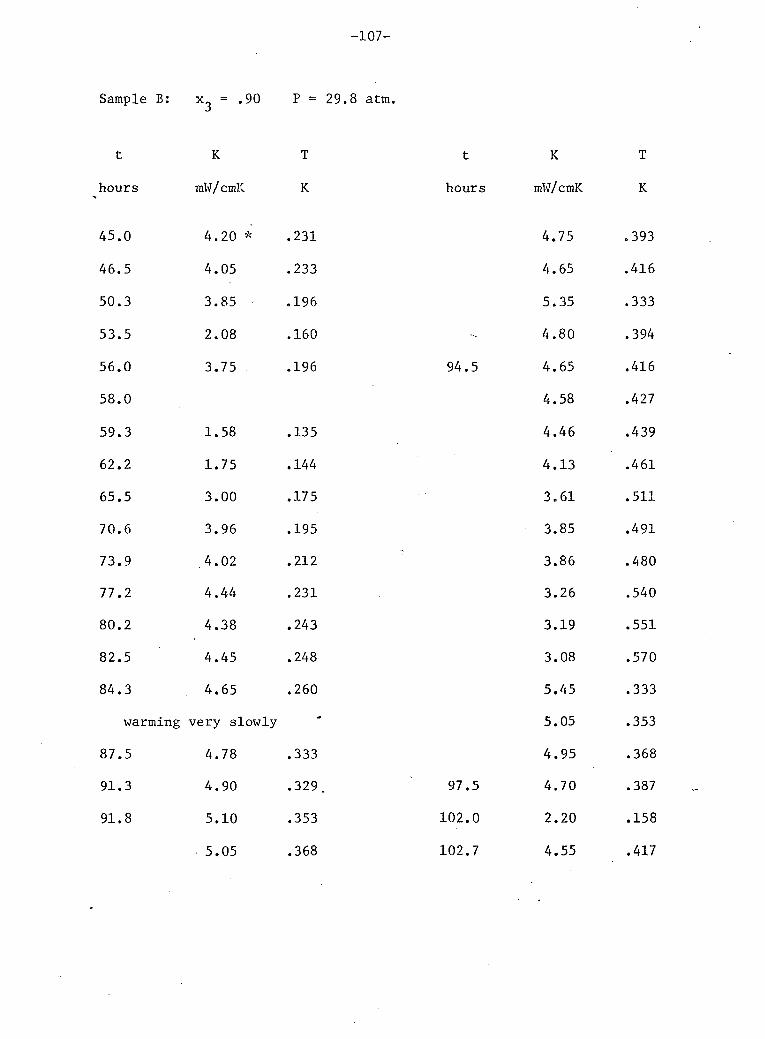
-107-
Sample B: x 3 = .90 P = 29.8 atm.
t K T t K T
hours mW/cmK K hours mW/cmK K
45.0 4.20 * .231 4.75 .393
46.5 4.05 .233 4.65 .416
50.3 3.85 .196 5.35 .333
53.5 2.08 .160 - 4.80 .394
56.0 3.75 .196 94.5 4.65 .416
58.0 4.58 .427
59.3 1.58 .135 4.46 .439
62.2 1.75 .144 4.13 .461
65.5 3.00 .175 3.61 .511
70.6 3.96 .195 3.85 .491
73.9 4.02 .212 ' 3.86 .480
77.2 4.44 .231 3.26 .540
80.2 4.38 .243 3.19 .551
82.5 4.45 .248 3.08 .570
84.3 4.65 .260 5.45 .333
warming very slowly ' 5.05 .353
87.5 4.78 .333 4.95 .368
91.3 4.90 .329. 97.5 4.70 .387
91.8 5.10 .353 102.0 2.20 .158
• 5.05 .368 102.7 4.55 .417
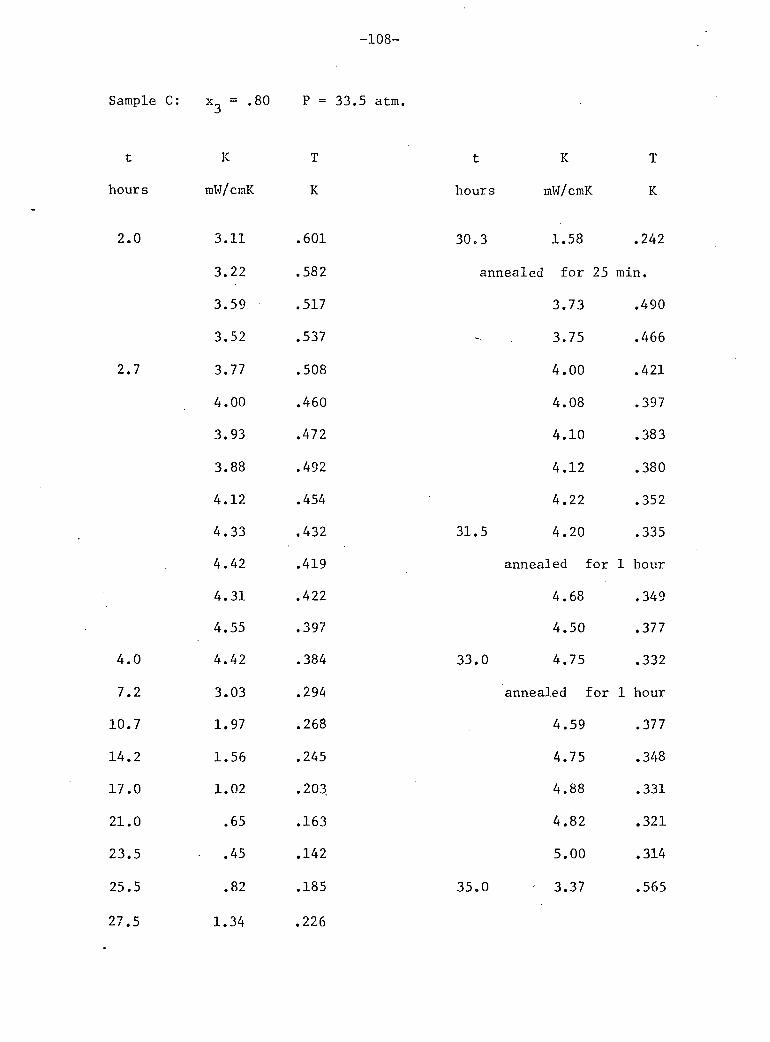
-108-
Sample C: x 3 = .80 P =
t K T
hours mW/cmK K
2.0 3.11 .601
3.22 .582
3.59 .517
3.52 .537
2.7 3.77 .508
4.00 .460
3.93 .472
3.88 .492
4.12 .454
4.33 .432
4.42 .419
4.31 .422
4.55 .397
4.0 4.42 .384
7.2 3.03 .294
10.7 1.97 .268
14.2 1.56 .245
17.0 1.02 .203
21.0 .65 .163
23.5 .45 .142
25.5 .82 .185
27.5 1.34 .226
t K T
hours mW/cmK K
30.3 1.58 .242
annealed for 25 min.
3.73 .490
3.75 .466
4.00 .421
4.08 .397
4.10 .383
4.12 .380
4.22 .352
31.5 4.20 .335
annealed for 1 hour
4.68 .349
4.50 .377
33.0 4.75 .332
annealed for 1 hour
4.59 .377
4.75 .348
4.88 .331
4.82 .321
5.00 .314
35.0 3.37 .565
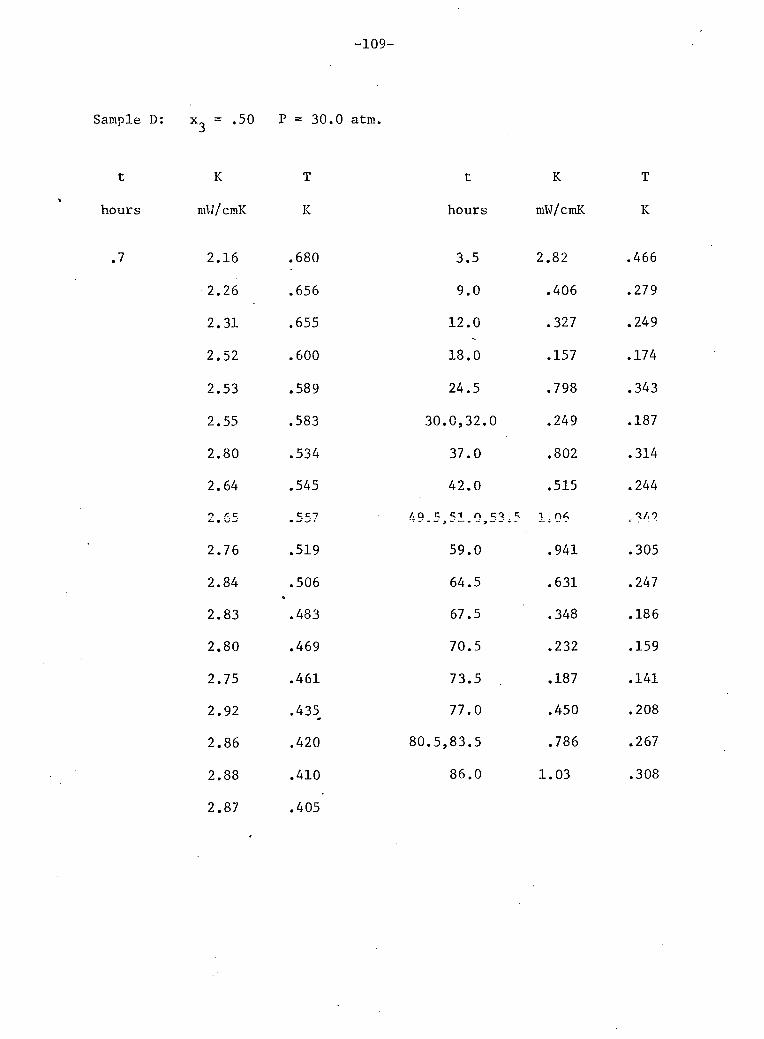
-109-
Sample D: x 3 = .50 P = 30.0 atm.
t
hours
K
mU/cmK
2.16
2.26
2.31
2.52
2.53
2.55
2.80
2.64 O K C ^ - • "O —«"
2.76
2.84
2.83
2.80
2.75
2.92
2.86
2.88
2.87
T
K
.680
.656
.655
.600
.589
.583
.534
.545
.519
.506
.483
.469
.461
.435
.420
.410
.405
t
hours
3.5
9.0
12.0
18.0
24.5
30.0,32.0
37.0
42.0
59.0
64.5
67.5
70.5
73.5
77.0
80.5,83.5
86.0
K
mW/cmK
2.82
.406
.327
.157
.798
.249
.802
.515
A O s S i 0 S.? ^ 1 O A
.941
.631
.348
.232
.187
.450
.786
1.03
T
K
.466
.279
.249
.174
.343
.187
.314
.244
.305
.247
.186
.159
.141
.208
.267
.308
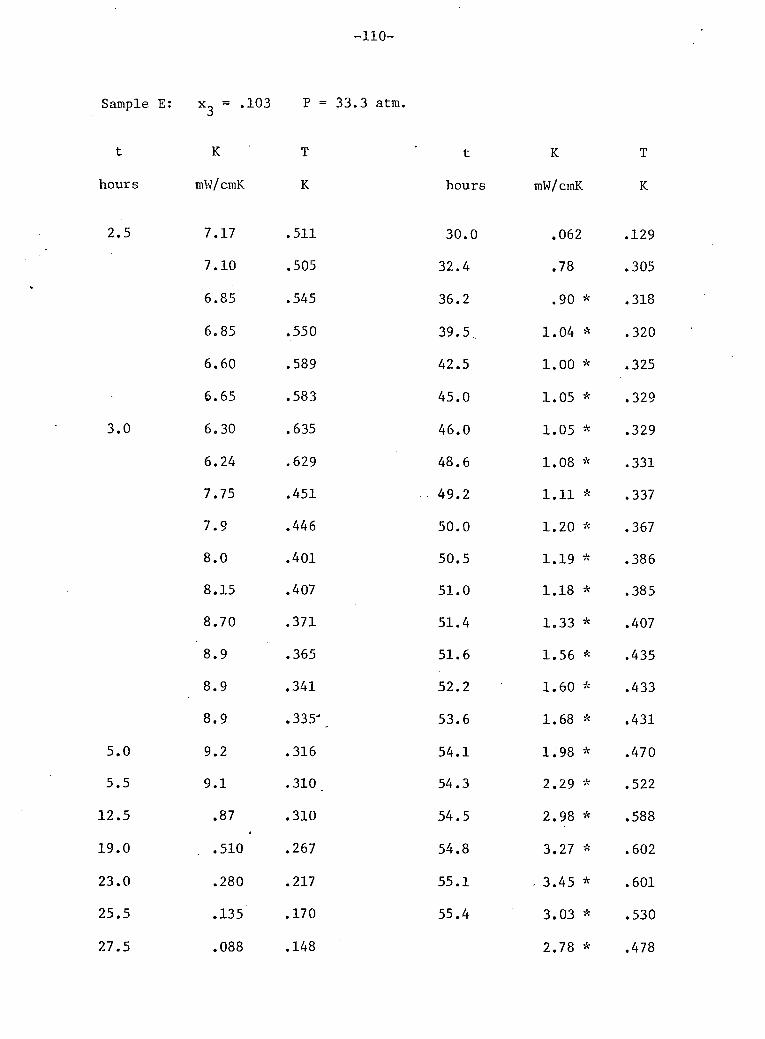
-110-
Sample E: x 3 = .103 P = 33.3
t K T
hours mW/cmK K
2.5 7.17 .511
7.10 .505
6.85 .545
6.85 .550
6.60 .589
• 6.65 .583
3.0 6.30 .635
6.24 .629
7.75 .451
7.9 .446
8.0 .401
8.15 .407
8.70 .371
8.9 .365
8.9 .341
8.9 .335'
5.0 9.2 .316
5.5 9.1 .310
12.5 .87 .310
19.0 .510 .267
23.0 .280 .217
25.5 .135 .170
27.5 .088 .148
t K T
hours mW/cmK K
30.0 .062 .129
32.4 .78 .305
36.2 .90 * .318
39.5. 1.04 * .320
42.5 1.00 * .325
45.0 1.05 * .329
46.0 1.05 * .329
48.6 1.08 * .331
49.2 1.11 * .337
50.0 1.20 * .367
50.5 1.19 * .386
51.0 1.18 * .385
51.4 1.33 * .407
51.6 1.56 * .435
52.2 1.60 * .433
53.6 1.68 * .431
54.1 1.98 * .470
54.3 2.29 * .522
54.5 2.98 * .588
54.8 3.27 * .602
55.1 . 3.45 * .601
55.4 3.03 * .530
2.78 * .478
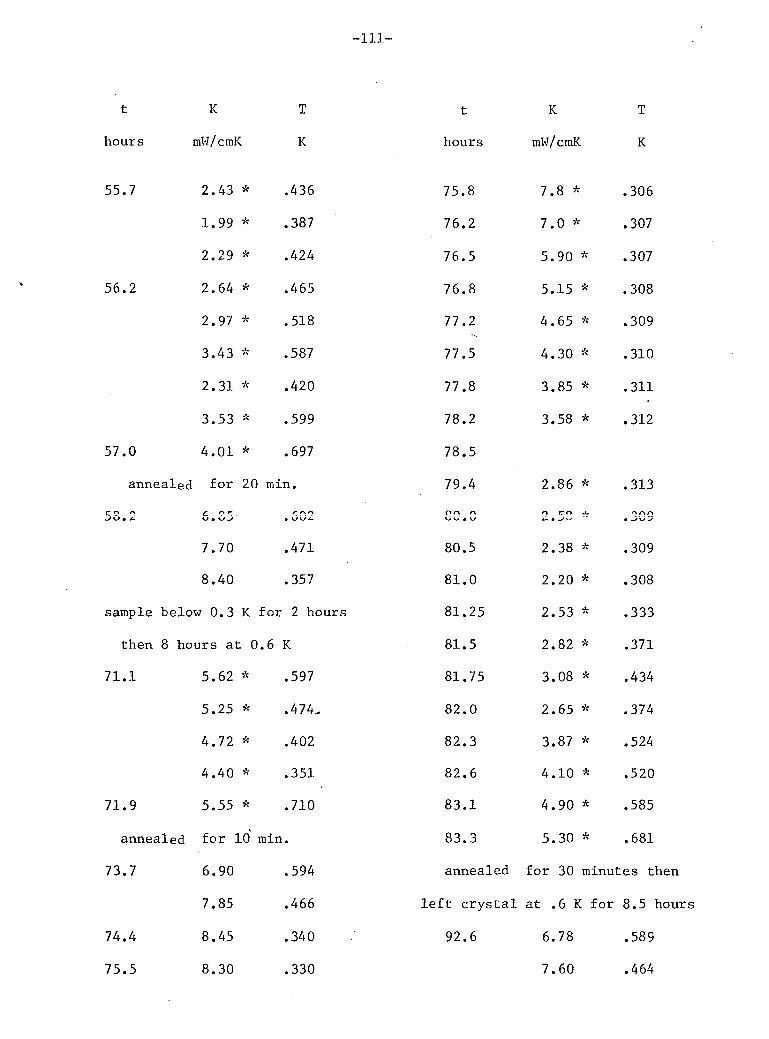
-111-
t
hours
55.7
56.2
57.0
K
mW/cmK
2.43 *
1.99 *
2.29 *
2.64 *
2.97 *
3.43 *
2.31 *
3.53 *
4.01 *
T
K
.436
.387
.424
.465
.518
.587
.420
.599
.697
annealed for 20 min.
7.70 .471
8.40 .357
sample below 0.3 K for 2 hours
then 8 hours at 0.6 K
71.1 5.62 * .597
5.25 * .474.
4.72 * .402
4.40 * .351
71.9 5.55 * .710
annealed for 10 min.
73.7 6.90 .594
7.85 .466
74.4 8.45 .340
75.5 8.30 .330
t
hours
75.8
76.2
76.5
76.8
77.2
77.5
77.8
78.2
78.5
79.4 O r\ r\
80.5
81.0
81.25
81.5
81.75
82.0
82.3
82.6
83.1
83.3
annealed
l e f t crystal
92.6
K
mW/cmK
7.8 *
7.0 *
5.90 *
5.15 *
4.65 *
4.30 *
3.85 *
3.58 *
2.86 *
2.38 *
2.20 *
2.53 *
2.82 *
3.08 *
2.65 *
3.87 *
4.10 *
4.90 *
5.30 *
T
K
.306
.307
.307
.308
.309
.310
.311
.312
.313
• Jw >
.309
.308
.333
.371
.434
.374
.524
.520
.585
.681
for 30 minutes then
at .6 K for 8.5 hours
6.78 .589
7.60 .464
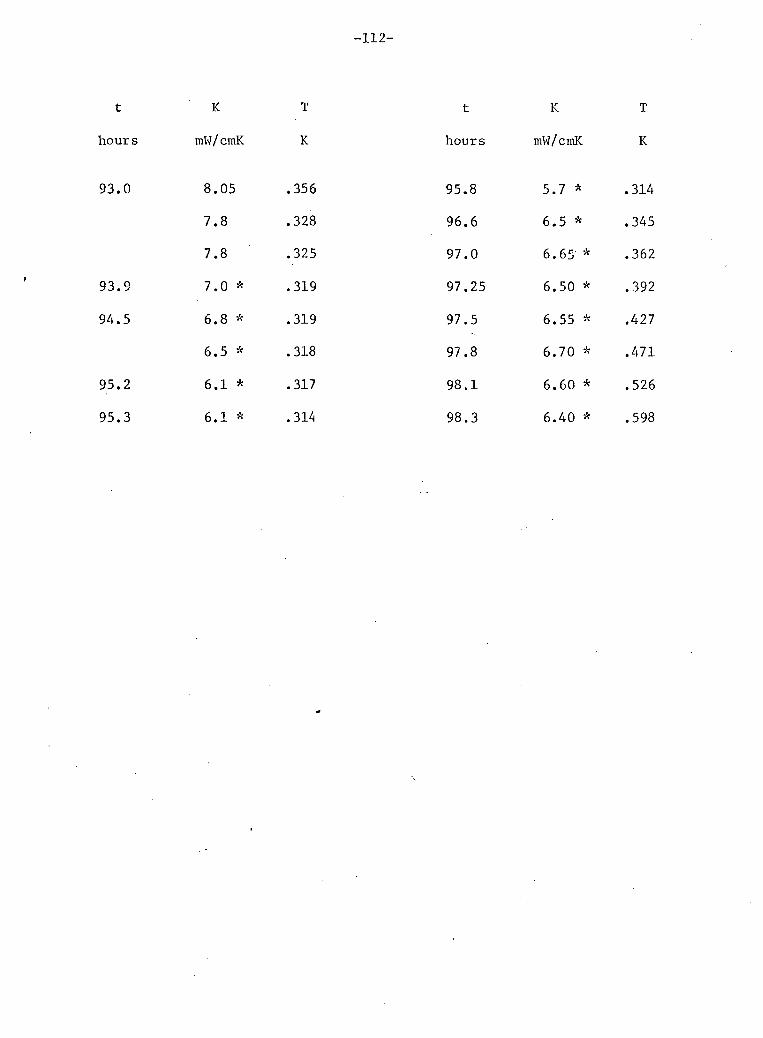
-112-
t K T
hours mW/cmK K
93.0 8.05 .356
7.8 .328
7.8 .325
93.9 7.0 * .319
94.5 6.8 * .319
6.5 * .318
95.2 6.1 * .317
95.3 6.1 * .314
t K T
hours mW/cmK K
95.8 5.7 * .314
96.6 6.5 * .345
97.0 6.65 * .362
97.25 6.50 * .392
97.5 6.55 * .427
97.8 6.70 * .471
98.1 6.60 * .526
98.3 6.40 * .598
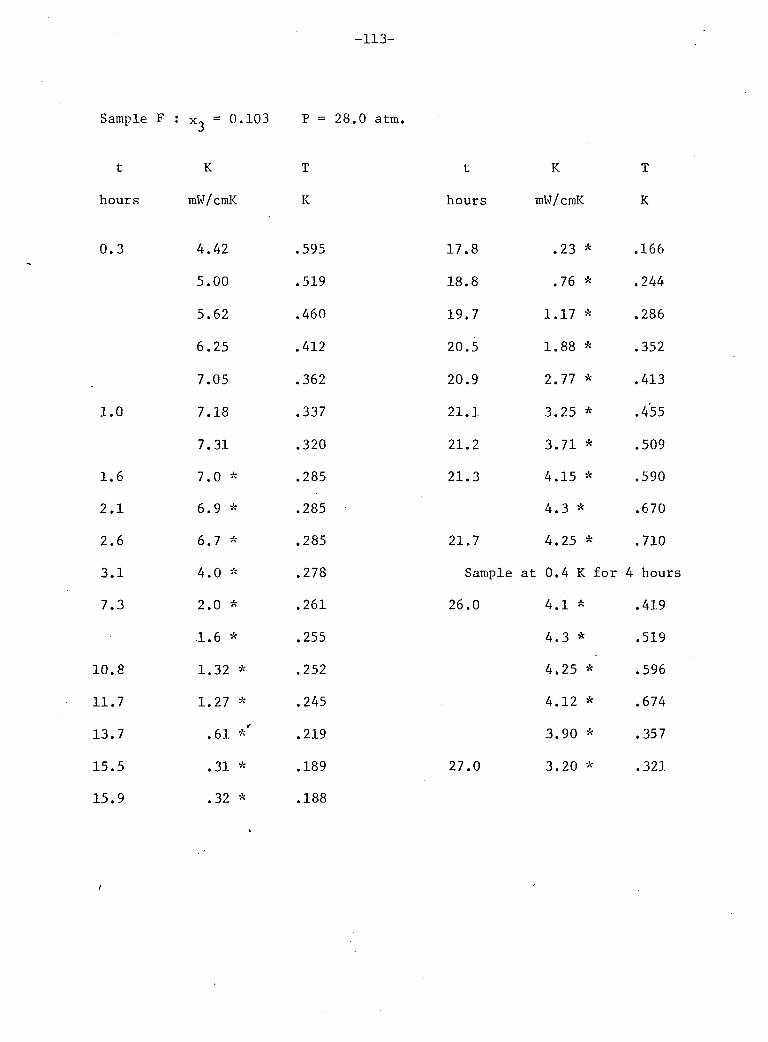
-113-
Sample F : : x 3 = 0.103 P = 28.0 atm.
t K T t K T
hours mW/cmK K hours mW/cmK K
0.3 4.42 .595 17.8 .23 * .166
5.00 .519 18.8 .76 * .244
5.62 .460 19.7 1.17 * .286
6.25 .412 20.5 1.88 * .352
7.05 .362 20.9 2.77 * .413
1.0 7.18 .337 21.1 3.25 * .455
7.31 .320 21.2 3.71 * .509
1.6 7.0 * .285 21.3 4.15 * .590
2.1 6.9 * .285 4.3 * .670
2.6 6.7 * .285 21.7 4.25 * .710
3.1 4.0 * .278 Sample at 0.4 K f o r 4 houi
7.3 2.0 * .261 26.0 4.1 * .419
1.6 * .255 4.3 * .519
10.8 1.32 * .252 4.25 * .596
11.7 1.27 * .245 4.12 * .674
13.7 .61 *' .219 3.90 * .357
15.5 .31 * .189 27.0 3.20 * .321
15.9 .32 * .188
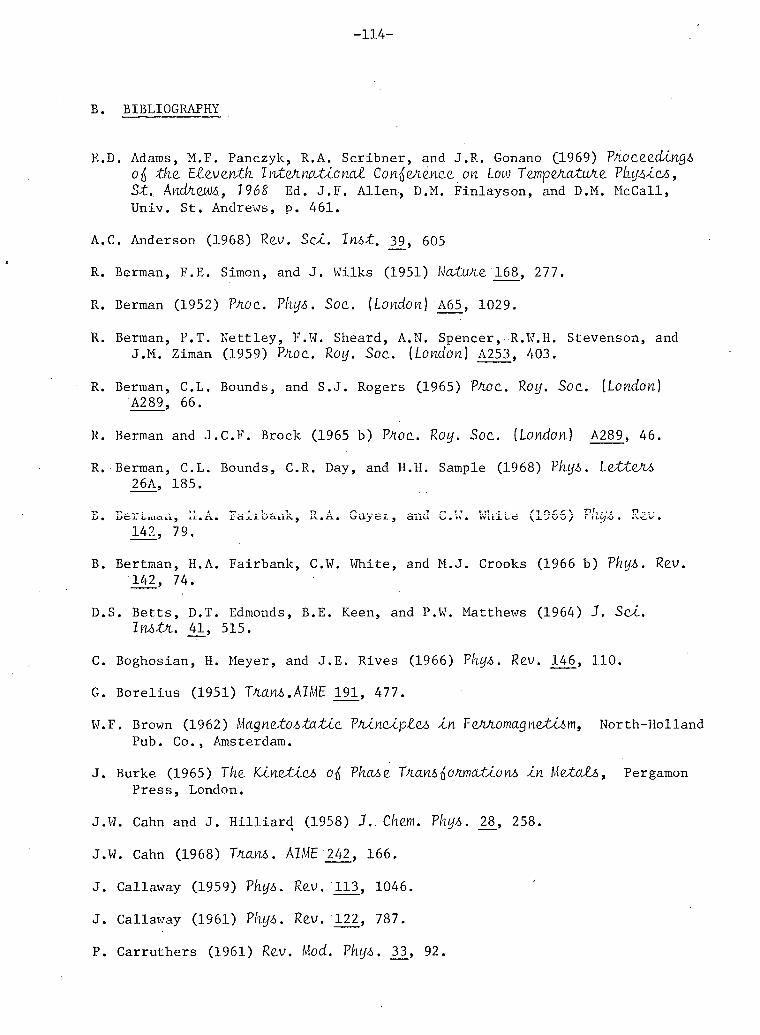
-114-
B. BIBLIOGRAPHY
E.D. Adams, M.F. Panczyk, R.A. S c r i b n e r , and J.R. Gonano Q-969) PltOCde.dln.g6 o$ tkz EZzvzntk JiiteAiicutlGnat Confiznzncz on Low Tzmp&iatuAz Pkyi>ic6, St. AndAZUS, 1968 Ed. J.F. A l l e n , D.M. F i n l a y s o n , and D.M. M c C a l l , Univ. St. Andrews, p. 461.
A.C. Anderson (1968) Rzv. Sci. InAt, 39., 605
R. Berman, F.E. Simon, and J . Wilks (1951) UatuJiZ 168, 277.
R. Berman (1952) PKOC. P\xy&. Soc. [London] A65, 1029.
R. Berman, P.T. N e t t l e y , F.W. Sheard, A.N. Spencer, R.W.H. Stevenson, and J.M. Ziman (1959) PftOC. Roy. Soc. [London] A253, 403.
R. Berman, C.L. Bounds, and S.J. Rogers (1965) ?fWC RoiJ. Soc. [London] A289, 66.
R. Berman and J.C.F. Brock (1965 b) PKOC. Roy. Soc. [London] A289, 46.
R. Berman, C.L. Bounds, C.R. Day, and H.H. Sample (1968) ?kyi>. LzttzU 26A, 185.
ij • i J o i . i _ i u o . i i j i - i - . r i . i d x i Dci.LJ.rxy i v * r i . • VJ l i y ci I. 9 d l i C i v_» • W . VViLj-L-ci v. _i_ V O ij / r\.<c/v •
142, 79.
B. Bertman, H.A. Fairbank, CW. White, and M.J. Crooks (1966 b) PkyS. Rzv. 142, 74.
D.S. B e t t s , D.T. Edmonds, B.E. Keen, and P.W. Matthews (1964) J . Sci. InA&l. 41, 515.
C. Boghosian, H. Meyer, and J.E. Rives (1966) Vkyi>. Rzv. 146, 110.
G. B o r e l i u s (1951) 7Vz.aR4.AIME 191, 477.
W.F. Brown (1962) hia.gnzto4ta.tZc VnA.nci.plzi> in FzhAoma.gnztZi>m, North-Holland Pub. Co., Amsterdam.
J . Burke (1965) Tkz Kinztici> 0^ VkaAZ TJumi&OJwationA in Mztaii,, Pergamon Pre s s , London.
J.W. Cahn and J . H i l l i a r d (1958) J.. Ckzm. Pkys. 28, 258.
J.W. Cahn (1968) Tlani*. AIME 242, 166.
J . Callaway (1959) Pkyb . Rzv. 113, 1046.
J . Callaway (1961) Pkyb. Rzv. 122, 787.
P. Carruthers (1961) Rzv. Mod. Pkyb. 33, 92.
- 1 1 5 -
H.B.G. Casimir ( 1 9 3 8 ) Pkysica. _5, 4 9 5 .
H.B.G. Casimir ( 1 9 4 0 ) Magnetism and Very Low TmperatuAeS, Cambridge Univ. Press.
J.M. D a n i e l s and F.N.H. Robinson ( 1 9 5 3 ) Phil. Mag. 44_, 6 3 0 .
P. Debye ( 1 9 1 4 ) Wol^skelvi-Ver&iage za Gottlngen, Lelpzlng.
W.J. de Haas and T. Biermasz ( 1 9 3 8 ) Physlca _5, 3 2 0 .
H. de Senarmont ( 1 8 4 7 ) . Ann. ClvLm. PhiJS. 3 E 2 1 , _ 2 2 , 2 3 .
C. Despretz ( 1 8 2 7 ) Ann. Clvun. ?hy4>. 36_, 4 2 2 .
D. O. Edwards, A.S. McWilliams, and J.G. Daunt ( 1 9 6 2 ) PhyS. Rev. Letters 9, 1 9 5 .
D.O. Edwards and R.C. Pandorf ( 1 9 6 5 ) Phys. Rev. 1 4 0 , A 8 1 6 .
D.O. Edwards and R.C. Pandorf ( 1 9 6 6 ) Phys. Rev. 1 4 4 , 1 4 3 .
N.G. Einspruch, E.J. W i t t e r h o l t , and R. T r u e l l ( 1 9 6 0 ) J . App. PhyS. 3 1 , 8 0 6 .
M. F i n e ( 1 9 6 4 ) Introduction to Phase. Transitions in Condensed Systems, MacMillan Co., New York.
J . F o u r i e r ( 1 8 2 2 ) Thecrie analytlque de la. chaleuA, E n g l i s h t r a n s l a t i o n : Cambridge Univ. Press 1 8 7 8 .
R.L. Garwin and H.A. Reich ( 1 9 5 9 ) Phys. Rev. 1 1 5 , 1 4 7 8 .
A.S. Greenberg, W.C. Thomlinson, and R.C. Richardson ( 1 9 7 1 ) Phys. Rev. Letters 2 7 , 1 7 9 . E r r a t a Phys. Rev. Letters 27_, 7 0 0 .
D. S. Greywall and J.A. Munarin ( 1 9 7 0 ) Phys. Rev. Letters 2 4 , 1 2 8 2 , erratum
( 1 9 7 0 ) Phys. Rev. Letters 2 5 , 2 6 1 .
E. A. Guggenheim ( 1 9 5 2 ) llixtWieS, Oxford Univ. Press, London.
R.A. Guyer and J.A. Krumhansl ( 1 9 6 6 ) Phys. Rev. 1 4 8 , 7 7 8 .
R.A. Guyer ( 1 9 6 9 ) Solid State PhysicS 2 3 , Ed. F. S e i t z and D. T u r n b u l l , Academic Pr e s s , New York.
R.A. Guyer and L . I . Zane ( 1 9 7 0 ) PhyS. Rev. Letters 2 4 , 6 6 0 .
G.E. H a n s e l l ( 1 9 6 9 ) Tiller Design and Evaluation, Van Nostrand Reinhold Co., New York.
C. H e r r i n g ( 1 9 5 4 ) Phys. Rev. 9 5 , 9 5 4 .
-116-
0. Heybey (1962) M.Sc. Thcblb, C o r n e l l Univ.
M. K i l l e r t (1956) Sc.V. Thcblb, M.I.T.
E.M. Hogan, R.A. Guyer, and H.A. Fairbank.(1969) Phyb. Rev. 185, 356.
J . Ingen-Hausz (1789) JouAn. dd Phyb. 34, 68.
J. J a r v i s , D. Ranrni, and H. Meyer C1968) Phyb. Rev. 170, 320.
D.L. Johnson (1968) Rev. Sex . InbtA. 39, 399.
P.G. Klemens (1955) Ph.oc. Phyb. Soc. (London] A68, 1113.
P.G. Klemens (1958) Solid State Phytic* 7_» 1, Ed. S e i t z and T u r n b u l l , Academic Press, New York.
P.G. Klemens and A.A. Maradudin (1961) Phyb. Rev. 123, 804.
P.G. Klemens (1967) Phyb. Rev. 169, 229.
C. Le P a i r , K.W. Taconis, R. De Bruyn Ouboter, P. Das and E. De Jong (1965) Pkyblca 31, 764.
T •»«• T - r, - i T T T T / i n r r n N O ^. .4 T)f, .,, iTZTTi • o c O *> **
1. M. L i f s h i t z and V.V. Slezov (1961) J . Pkyb. Chem. Solldb 19, 35.
H.A. Lorentz (1872) Pogg. Ann. 147, 429.
L.P. Mezhov-Deglin (1964) Sov. Phyb. JETP 19, 1297.
V.J. M i n k i e w i c z , T.A. Ki t c h e n s , F.P. L i p s c h u l t z , R. Nathans, and G. Shirane (1968) Phyi>. Rev. 174, 267.
D. S. M i y o s h i , R.M. C o t t s , A.S. Greenberg, and R.C. Richardson (1970) Pkyb. Rev. A2, 870.
P.M. Morse'and H. Feshbach (1953) Mdthodb 0^ ThdOhdtlcat Phyblcb, McGraw-H i l l Book Co., New York.
W.J. M u l l i n (1968) Pkyb. Rev. LcttdKb 20, 254.
L.H. Nosanow (1966) Phyb. Rev. 146, 120.
M.F. Panczyk, R.A. S c r i b n e r , J.R. Gonano, and E.D.. Adams (1968) Phyb. Rev. LdttQAb 21,' 594.
R.C. Pandorf, E.M. I f f t , and D.O. Edwards (1967) Phyb. Rev. 163, 175.
R.C. Pandorf and D.O. Edwards (1968) Phyb. Rev. 169, 222.
Y.H. Pao and C C . Mow (1963) J . App. Phyb. 34, 493.
-117-
W. Pauli (1925) VeAh d. deuts phys. Ges. _6, 10.
R. Peierls (1929) Ann. Physlk 3, 1055.
W.G. Pfann (1966) lone. Wetting,John Wiley and Sons, New York.
G. L. Pollack (1969) Rev. Mod. Phys.41, 64.
I. Pomeranchuk (1942) J . P f u # . USSR 5_, 237.
T. Preston (1929) Theory 0|J Heat, MacMillan and Co. , London.
H. A. Reich (1963) Phys. Rev. 129, 630.
M.N. Saha and E.N. Srirastara (1958) A Treatise on Heat, The Indian Press (Publications) Private L t d . , Calcutta.
H.H. Sample and C.A. Swenson (1966) Phys. Rev. 158, 188.
W. Seward, D. Lazarus, and S.C.. Fain (1969) Phys. Rev. 178, 345.
G.G. Stokes (1851) Cambridge and Dublin Math. Journ.6_t 215.
G.C. Straty and E.D. Adams (1966) Phys. Rev. 150, 123.
G. C. Straty and E.D. Adams (1969) Phys. Rev. 187, 321.
S.G. Sydoriak and R.H. Sherman (1964) J . Rei. Natl. But. Std. (U.S.) - A Phys. and Chem. 68A, 547.
P.M. Tedrow and D.M. Lee (1969) Phys. Rev. 181, 399.
w.c. Thomlinson (1969) Phys. Rev. Letters 23, 1330.
S.B. Trickey and E.D. Adams (1970) Phys. Letters 33A, 483.
H. van Dijk , M. Durieux, J .R. Clement, and J .K. Logan (1960) J . Re6. Natl.
Bur. Std. (U.S.) - A Phys. and Chem. 64A, 1.
J . H . Vignos and H.A. Fairbank (1966) Phys. Rev. 147, 185.
E . J . Walker and H.A. Fairbank (1960) Phys. Rev. 118, 913. E. J . Walker and H.A. Fairbank (I960 b) Phys. Rev. Letters 5, 139. F. J . Webb, K.R. Wilkinson, and J . Wilks (1952) P^OC. Roy. 3bc. [London]
A214, 546.
J . C . Wheatley, O.E. Vilches, and W.R. Abel (1968) Physics 4_, 1.
G. Wiedemann and R. Franz (1854) Ann. de Clvanle 41, 107.
J . Ziman (1956) Can. J. Phys. 34. 1256.
G.o. Zimmerman (1965) Proceedings oft the IXthLow Tmperature Physics LT9 , Ed. J.G. Daunt, D.O. Edwards, and M. Yaqub, Plennum Press* New York.