Long lasting instabilities in granular mixtures
10
arXiv:cond-mat/0303335v1 [cond-mat.soft] 18 Mar 2003 Long lasting instabilities in granular mixtures H.Caps, R.Michel, N.Lecocq and N.Vandewalle GRASP, Institut de Physique B5, University of Li` ege, B-4000 Li` ege, Belgium. Abstract We have performed experiments of axial segregation in the Oyama’s drum. We have tested binary granular mixtures during very long times. The segregation patterns have been captured by a CCD camera and spatio-temporal graphs are created. We report the occurence of instabilities which can last several hours! We stress that those instabilities originate from the competition between axial and radial segregations. We put into evidence the occurence of giant fluctuations in the fraction of grain species along the surface during the unstable periods. Key words: Granular flow: mixing, segregation and stratification, Porous materials; granular materials PACS: 45.70.Mg, 81.05.Rm 1 Introduction The most spectacular phenomenon associated with granular matter is cer- tainly the phase segregation that one observes when a granular mixture is shaked, poured or rotated [1]. Respectively, stripe [2], axial [3] and radial [4,5] segregation patterns have been reported. Recent experiments [6] and theoreti- cal models [7] have been extensively performed in the particular case of stripe segregation. However, the least studied type of segregation is the case of the axial segrega- tion in the so-called Oyama’s drum [3,8]. The experiment consists in rotating a tube which is half filled with a sand mixture. The mixture is composed by 2 granular species differing in size and having different angles of repose. Due to the rotation, avalanches occur in the tube. Bands of the different granular species appear after a few minutes. A sketch and a picture of the axial seg- regation are illustrated in Figure 1. It has been reported [3] that the bands merge and only three stripes remain after very long times. One should also re- mark that Magnetic Resonance Imaging (MRI) experiments have shown that Preprint submitted to Physica A Received: 7 March 2003 / Revised version: date
-
Upload
independent -
Category
Documents
-
view
3 -
download
0
Transcript of Long lasting instabilities in granular mixtures
arX
iv:c
ond-
mat
/030
3335
v1 [
cond
-mat
.sof
t] 1
8 M
ar 2
003
Long lasting instabilities in granular mixtures
H.Caps, R.Michel, N.Lecocq and N.Vandewalle
GRASP, Institut de Physique B5, University of Liege, B-4000 Liege, Belgium.
Abstract
We have performed experiments of axial segregation in the Oyama’s drum. We havetested binary granular mixtures during very long times. The segregation patternshave been captured by a CCD camera and spatio-temporal graphs are created.We report the occurence of instabilities which can last several hours! We stressthat those instabilities originate from the competition between axial and radialsegregations. We put into evidence the occurence of giant fluctuations in the fractionof grain species along the surface during the unstable periods.
Key words: Granular flow: mixing, segregation and stratification, Porousmaterials; granular materialsPACS: 45.70.Mg, 81.05.Rm
1 Introduction
The most spectacular phenomenon associated with granular matter is cer-tainly the phase segregation that one observes when a granular mixture isshaked, poured or rotated [1]. Respectively, stripe [2], axial [3] and radial [4,5]segregation patterns have been reported. Recent experiments [6] and theoreti-cal models [7] have been extensively performed in the particular case of stripesegregation.
However, the least studied type of segregation is the case of the axial segrega-tion in the so-called Oyama’s drum [3,8]. The experiment consists in rotatinga tube which is half filled with a sand mixture. The mixture is composed by2 granular species differing in size and having different angles of repose. Dueto the rotation, avalanches occur in the tube. Bands of the different granularspecies appear after a few minutes. A sketch and a picture of the axial seg-regation are illustrated in Figure 1. It has been reported [3] that the bandsmerge and only three stripes remain after very long times. One should also re-mark that Magnetic Resonance Imaging (MRI) experiments have shown that
Preprint submitted to Physica A Received: 7 March 2003 / Revised version: date

X
Fig. 1. (top) Typical view of an axial segregation pattern. Dark grains are smallerthan white grains. The picture emphasizes that bands are characterized by differentslopes. (bottom) Sketch of the segregation pattern. The slope difference ∆θ betweenadjacent bands leads to a segregation flux φs in the Savage’s model.
a radial segregation is also present in the center of the tube [9]. Small grainsbeing located in the center of the tube.
On the theoretical side, it has been proposed [10] that the axial segregation issimilar to a spinodal decomposition. A simple and elegant model for diffusionof the different sand species along the tube axis has also been proposed bySavage [11]. This model considers the difference ∆θ of dynamical angles forboth species as a relevant parameter. If ρ(x, t) is the density of one speciesalong the tube axis x, the different slopes involve a segregation flux
φs = β∂ρ
∂x(1)
for that species. The positive coefficient β is a function of the slope difference∆θ and the rotation speed ω of the tube. In addition, a Fickian diffusion
φd = −D∂ρ
∂x(2)
is taken into account. The diffusion coefficient D is a function of the rotationspeed ω. Summing both fluxes and taking into account the continuity equationfor φs + φd, one [11] obtains the classical diffusion equation
∂ρ
∂t= De
∂2ρ
∂x2(3)
with an effective diffusion constant De = D − β which could be negative fordefined ∆θ and ω values. A negative coefficient explains the formation of bandsbecause any inhomogeneity in ρ is then amplified towards full segregation. The
2

Savage’s model is a first step in the understanding of the phenomenon. Themost elaborated model remains the one proposed by Zik and coworkers [10].In the Zik’s model, β scales as β ∼ ρ(1 − ρ) and the occurence of bands isattributed to a spinodal decomposition instead of a simple diffusion. Morerecently, molecular dynamics simulations have also been performed [12] inorder to study the effect of friction. Axial segregation can be simulated withthousand of virtual grains.
We have performed new experiments in the Oyama’s drum. We have pro-duced axial segregation patterns and studied the phenomenon during severalhours/days. In some experiments, we have obtained spectacular patterns thatwe call instabilities. The present paper deals with such unusual patterns. Theyare discussed in the light of previous theoretical arguments and earlier exper-iments. Mechanisms for instabilities appearance are proposed.
2 Experiments
Our experimental setup is the following. A glass tube (diameter 40 mm, length300 mm) is half filled with a binary sand mixture. The tube is rotated at aconstant angular frequency ω which can be controlled. The rotation speed canrange from 20 rotations per minute (rpm) to 40 rpm. The tube in rotation isperfectly horizontal. Two different sands have been selected for our study. Foreach type of sand, the granulometry has been selected by sifting. White grainshave a mean diameter around d = 0.32 mm. Black grains have a mean diameteraround d = 0.22 mm. The angle of repose for dark grains is θ = 28o
± 1o. Theangle of repose for the white grains is θ = 33o
± 1o. Repose angles of differentspecies have been measured by averaging the slope of a stable pile of theconsidered species along its surface. A CCD camera captures the pattern alongthe tube axis every minute. A computer collects the successive pictures. Eachpicture of the glass tube is rescaled into a line of pixels. This line representsthe average density of the sand species along the x axis. The successive linesof pixels are numerically glued together in order to form a space-time diagramof the evolving segregation pattern.
Figure 2 presents a typical spatio-temporal graph built with 3840 images ofthe pattern, for a total period of 64 hours. In the picture, time goes down. Thesegregation pattern emerges within a few minutes. After a long time (severalhours), the bands begin to merge. The merging of adjacent bands is rare.However, such an event is a rapid process (typically less than one minute)since the end part of a vanishing band is always abrupt. See three vanishingbands in the top of Figure 2. The number N of bands seems to decreaseexponentially with time. Figure 3 emphasizes such a decay for the particular
3
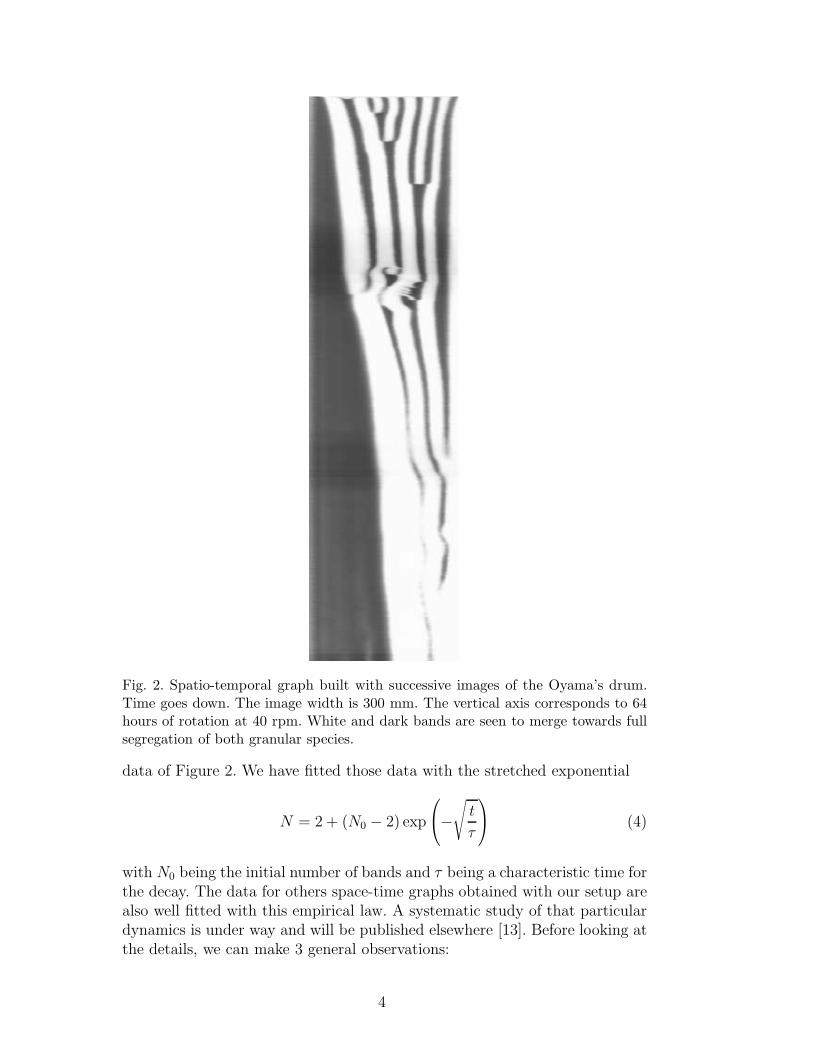
Fig. 2. Spatio-temporal graph built with successive images of the Oyama’s drum.Time goes down. The image width is 300 mm. The vertical axis corresponds to 64hours of rotation at 40 rpm. White and dark bands are seen to merge towards fullsegregation of both granular species.
data of Figure 2. We have fitted those data with the stretched exponential
N = 2 + (N0 − 2) exp
−
√
t
τ
(4)
with N0 being the initial number of bands and τ being a characteristic time forthe decay. The data for others space-time graphs obtained with our setup arealso well fitted with this empirical law. A systematic study of that particulardynamics is under way and will be published elsewhere [13]. Before looking atthe details, we can make 3 general observations:
4

0 20 40 600
10
20
t (h)
N
Fig. 3. Decay of the number N of bands as a function of time t for the pattern ofFigure 2. The curve is a fit using the empirical law of Eq.(4) with N0 = 20 andτ = 17h.
(1) The segregation begins first at the extremities of the tube and then nu-cleates randomly in the tube. The spreading pattern formation is emphasizedin Figure 4. The presence of tube ends (walls) affects locally the friction andinduces the formation of bands at the extremities. We have noticed that atlow rotation speeds (≈ 10 rpm), bands appear only at the extremities whilethe middle part of the tube is still mixed, even for very long times.
(2) The topography of the granular surface is deeply affected by the segregationpattern. A close look at the surface reveals different slopes for the differentsand species (see the top picture of Figure 1). Those slopes correspond to thedynamical angles of the species, which are 2o larger than the repose angles.This is the main ingredient of both Savage [11] and Zik [10] models.
(3) For very long times, the pattern tends to a complete segregation of bothgranular species. Only two bands are observed. This complete segregation isclearly observed at the end of Figure 2. One should remark that Frette andStavans [14] did not always obtain a complete segregation pattern even afterhaving performed very long experiences (but at a lower speed than in ourcases).
In the great majority of our experiments, the successive merging of bands to-wards a full segregation of both granular species have been observed. However,looking at the details of Figure 2, one observes a turbulent-like pattern at theinterface between white and dark bands. This particular event occured after18 hours of rotation. The turbulent pattern is emphasized in Figure 5. Theduration of that event lasted about 5 hours. The instability of white/dark in-
5

Fig. 4. Pattern formation in the same conditions as Figure 2. Time goes down. Thevertical axis corresponds to 30 minutes. For emphasizing the formation of bands, apicture has been taken every 10 seconds. The bands appear first at the extremities.
Fig. 5. Blowup of the center part of Figure 2 emphasizing a ‘turbulent’ event. Timegoes down. The vertical axis correponds to a total of 10 hours. A thin dark band isseen to nucleate and to perturb neighboring bands.
terfaces began when a new dark band nucleated in the middle part of a whiteband. This nucleation process involved the development of secondary bandsin the neighborhood. Extremely slow undulations of the borders are also seenin the bottom of Figure 2, a long time after the ‘turbulent’ event emphasizedin Figure 5.
The occurrence of such behavior is still mysterious. We did not discover theprecise conditions on which they appear and disappear. However, it shouldbe remarked that the occurence of such patterns is not an artefact. Indeed,they appeared in different experiments under various conditions, i.e. at variousrotation speeds. Moreover, initial mixtures were premixed as homogeneouslyas possible.
Figures 6 and 7 present additional patterns that we have also obtained. Inthose examples, the instability does not affect the total number of bands alongthe tube axis. In Figure 5, one observes undulations of the borders of whitebands. In fact, thin dark bands nucleate periodically in the center of whitebands before being expelled. In Figure 6, the situation is slightly different:
6

Fig. 6. Two typical spatio-temporal graphs of long lasting instabilities in a tuberotating at 26 rpm. Time goes down. The vertical axis corresponds to a total of 5h.Each image width is 50 mm.
Fig. 7. Spatio-temporal graph of an other type of instability. Time goes down. Thevertical axis corresponds to a total of 3h, with a rotation speed of 38 rpm. Theimage width is 50 mm.
two small bands are seen to detach from a white band and to travel from thatband towards the next one.
Some instabilities are provoked by the nucleation of thin dark bands (seeFigures 5 and 6). Others appear at the border of apparently stable whitebands (see Figure 7). We will discuss the occurence of that phenomena in the
7

next section.
3 Discussion
It should be noted that an earlier experimental work [15,16] put into evidencesome travelling waves in the tube. This behavior was present for higher fillingfraction of the tube (> 55%) than in our experiments. Such travelling waveswere associated with the early stages of the segregation (about 20 minutes),when inhomogeneities of the initial mixture provoke the nucleation and themotion of bands. Herein, the instabilities are seen to occur after very longtimes and last several hours. The nature of the instabilities could be quitedifferent from those reported in [15,16].
As mentionned at the beginning of this paper, MRI experiments [9] have putinto evidence that radial segregation is always present. Small grains (the darkspecies herein) tend to segregate in the bulk. This implies that in our experi-ments, the white bands may have a dark core. We assist thus at the competi-tion between axial and radial segregation in that regions. Any fluctuation ofthe radial pattern may provoke the nucleation of a thin dark band. Thereafter,this thin band travels slowly towards one border to be expelled. This couplingbetween surface and volume compositions could explain the instabilities.
Surface and bulk processes are characterized by different time scales. Axialsegregation has a larger characteristic time scale than radial segregation. Thisrate difference could also explain why our instabilities last several hours: thephenomenon comes from bulk fluctuations. MRI experiments could corrobo-rate those mechanisms.
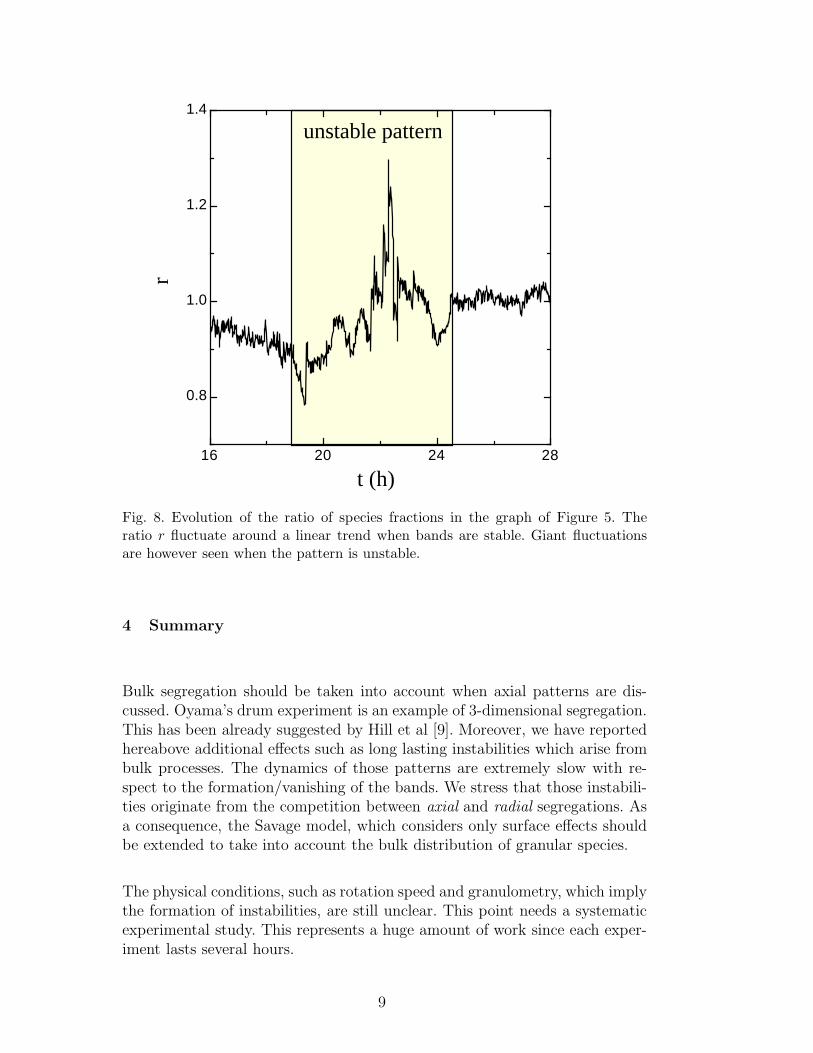
Consider the fraction of dark species x observed along the tube, measured byimage analysis. Figure 8 presents the time evolution of the ratio
r =x
1 − x(5)
in the long experiment of Figure 5. The ratio r emphasizes the surface ‘equi-librium’ between both species along the tube. During the whole process, theratio fluctuates around a linear trend close to r = 1. However, during a periodof instability, we observe giant fluctuations of r up to 20%. This means thatthe compositions of both bulk and surface deviate strongly from equilibriumcomposition.
8
16 20 24 28
0.8
1.0
1.2
1.4
t (h)
runstable pattern
Fig. 8. Evolution of the ratio of species fractions in the graph of Figure 5. Theratio r fluctuate around a linear trend when bands are stable. Giant fluctuationsare however seen when the pattern is unstable.
4 Summary
Bulk segregation should be taken into account when axial patterns are dis-cussed. Oyama’s drum experiment is an example of 3-dimensional segregation.This has been already suggested by Hill et al [9]. Moreover, we have reportedhereabove additional effects such as long lasting instabilities which arise frombulk processes. The dynamics of those patterns are extremely slow with re-spect to the formation/vanishing of the bands. We stress that those instabili-ties originate from the competition between axial and radial segregations. Asa consequence, the Savage model, which considers only surface effects shouldbe extended to take into account the bulk distribution of granular species.
The physical conditions, such as rotation speed and granulometry, which implythe formation of instabilities, are still unclear. This point needs a systematicexperimental study. This represents a huge amount of work since each exper-iment lasts several hours.
9
Acknowledgements
HC is financially supported by the FRIA (Brussels, Belgium). This work isalso suppported through the ARC contract n◦02/07-293. The authors wouldalso like to thank M. Ausloos for fruitful discussions.
References
[1] G.Ristow, Pattern Formation in Granular Materials, (Springer, Berlin, 2000)
[2] H.A.Makse, S.Havlin, P.R.King and H.E.Stanley, Nature 386, (1997) 379
[3] K.M.Hill and J.Kakalios, Phys. Rev. E 49, (1994) R3610; ibid. 52, (1995) 4393
[4] E.Clement, J.Rajchenbach and J.Duran, Europhys. Lett. 30, (1995) 7
[5] F.Cantelaube and D.Bideau, Europhys. Lett. 30, (1995) 133
[6] N.Lecocq and N.Vandewalle, Phys. Rev. E 62, (2000) 8241
[7] T.Boutreux, Euro. Phys. J. B 6, (1998) 419
[8] Y.Oyama, Bull. Inst. Phys. Chem. Res. Rep. (Tokyo) 18, (1939) 6001
[9] K.M.Hill, A.Caprihan and J.Kakalios, Phys. Rev. Lett. 78, (1997) 50
[10] O.Zik, D.Levine, G.Lipson, S.Shtrikman, J.Stavans, Phys. Rev. Lett. 73, (1994)644
[11] S.B.Savage, in Disorder and Granular Media, D.Bideau and A.Hansen eds.,(North Holland, Amsterdam, 1993) p.255
[12] D.C.Rapaport, (2002) cond-mat/0202499
[13] R.Michel, in preparation (2003)
[14] V.Frette and J.Stavans, Phys. Rev. E 56, (1994) 6981
[15] K.Choo, T.C.A.Molteno and S.W.Morris, Phys. Rev. Lett. 79, (1997) 2975
[16] K.Choo, M.W.Baker, T.C.A.Molteno and S.W.Morris, Phys. Rev. E 58, (1998)6115
10