Permanent Deformation Behaviour of Unbound Granular ...
189
Permanent Deformation Behaviour of Unbound Granular Materials in Pavement Constructions Plastisches Verformungsverhalten von Tragschichten ohne Bindemittel in Straßenbefestigungen Von der Fakultät Bauingenieurwesen der Technischen Universität Dresden zur Erlangung der Würde eines Doktor-Ingenieurs (Dr.-Ing.) genehmigte Dissertation vorgelegt von Dipl.-Ing. Sabine Werkmeister geb. am 9. April 1971 in Bad Salzungen Gutachter: Prof. Dr.-Ing. Frohmut Wellner Prof. dr. ir. Andre Molenaar Prof. Dr.-Ing. Johann Litzka Tag der Verteidigung: 7. April 2003
-
Upload
khangminh22 -
Category
Documents
-
view
0 -
download
0
Transcript of Permanent Deformation Behaviour of Unbound Granular ...

Permanent Deformation Behaviour of
Unbound Granular Materials in Pavement
Constructions
Plastisches Verformungsverhalten von Tragschichten
ohne Bindemittel in Straßenbefestigungen
Von der Fakultät Bauingenieurwesen
der Technischen Universität Dresden
zur Erlangung der Würde eines
Doktor-Ingenieurs (Dr.-Ing.)
genehmigte
Dissertation
vorgelegt von Dipl.-Ing. Sabine Werkmeister
geb. am 9. April 1971 in Bad Salzungen
Gutachter: Prof. Dr.-Ing. Frohmut Wellner
Prof. dr. ir. Andre Molenaar
Prof. Dr.-Ing. Johann Litzka
Tag der Verteidigung: 7. April 2003

Abstract
I
ABSTRACT This dissertation presents the results of research performed into the characterization of the
permanent deformation behaviour of coarse-grained aggregates typically used in Unbound
Granular Layers (UGL) of pavements.
The results of a large number of Repeated Load Triaxial (RLT) tests performed in the Labora-
tory of the Centre for Pavement Engineering at the University of Nottingham form the back-
ground material for this work. The major objectives of this PhD research work were to recog-
nize the influence of several variables that significantly influence the permanent deformation
behaviour and to develop a suitable model for the description and calculation of permanent
deformations in Unbound Granular Materials (UGM) when used in pavement constructions.
An empirical permanent deformation design model was formulated. This UGM model will be
implemented in Finite Element (FE) calculations to form part of an analytical pavement de-
sign method, which is currently under development at the Chair of Pavement Engineering at
Dresden University of Technology.
In addition the thesis describes the current understanding of the shakedown concept. The de-
velopment of the resulting permanent deformation, which accumulates with the repeated load-
ing is described and compared with the types of responses usually predicted by the shake-
down approach. It was shown that the existing shakedown approach could describe some, but
not all, of the observed responses. Thus, a modified set of responses was defined in shake-
down terms and some explanations of the differences from the conventional approach are
given. It was concluded that the method of description could give a powerful material assess-
ment (ranking) and pavement design tool for the analysis of unbound pavement bases. This
design approach is described in detail and utilizes test results from the RLT apparatus to es-
tablish the risk level of permanent deformations in the UGL in pavement constructions.
From the test data, a serviceability limit line (plastic shakedown limit) stress boundary for the
UGL was defined, where below the line stable behaviour for different materials and moisture
contents is expected. The serviceability limit line was applied in a FE program FENLAP to
predict whether or not stable behaviour occurs in the UGL. To calculate the stress in the UGL,
a non-linear elastic model (elastic DRESDEN-Model), which is described in the thesis, was
implemented into the FE program. The effects of changing the moisture content during the
spring-thawing period and of changing the asphalt temperature on pavement structural re-

Abstract
II
sponse were investigated. Furthermore, the influence of increasing axle loads and of using
different UGM types (Sandy Gravel and Granodiorite-material) as granular base materials on
pavement structural response was also investigated.
Additionally, permanent deformation calculations for the UGL were performed taking the
stress history into consideration. The results clearly demonstrate that, for pavement construc-
tions with thick asphalt layers, the risk of rutting in the granular base is minimal, even at a
high number of load repetitions. The study showed that the proposed design approach is a
very simple convenient method to assess the risk of rutting in the UGL. If the stresses in the
UGL are within the stable range (A), an exact determination of the permanent deformation of
the UGL is not necessary to ensure satisfactory long-term performance of the UGL.

Kurzfassung
III
KURZFASSUNG Ziel der vorliegenden Arbeit war die Erweiterung der Kenntnisse über das plastische Verfor-
mungsverhalten von Tragschichten ohne Bindemittel (ToB) in Straßenbefestigungen.
Grundlage der Untersuchungen bildeten dynamische Triaxialversuche an Gesteinskörnungen,
die im Labor des Centre of Pavement Engineering der Universität Nottingham durchgeführt
werden konnten. Entsprechend der Zielstellung wurde ein bestehendes Stoffmodell zur ma-
thematischen Beschreibung des plastischen Verformungsverhalten der ToB erweitert. Das
entwickelte Stoffmodell bildet eine der Grundlagen für ein analytisches Bemessungsverfahren
für Straßenbefestigungen, das derzeit an der Professur für Straßenbau der TU Dresden erar-
beitet wird.
Im weiteren Verlauf der Arbeit wird der ursprüngliche Shakedown Ansatz erläutert. Die Ent-
wicklung der akkumulierten plastischen Dehnungen mit zunehmender Lastwechselzahl wurde
in Abhängigkeit des Beanspruchungszustandes charakterisiert und mit den Verhaltensberei-
chen des Shakedown Ansatzes verglichen. Das Verformungsverhalten von Gesteinskörnun-
gen kann somit in unterschiedliche Verformungsbereiche (A, B und C) eingeteilt werden,
wobei sich im Bereich A ein „Shakedown Zustand“ (Gleichgewichtszustand) einstellt. Nach
Beendigung der Nachverdichtungsphase wird kein erheblicher Zuwachs an plastischen Ver-
formungen mehr auftreten und das Material wird sich nahezu „elastisch“ verhalten. Die Be-
reiche B und C können durch ein zunehmendes Versagen bei hohen bzw. schon bei niedrigen
Lastwechselzahlen charakterisiert werden. Mit Hilfe dieses modifizierten Shakedown Ansat-
zes ist die Existenz eines kritischen Spannungsverhältnisses zwischen stabilen Bedingungen
und einem zunehmenden Versagen der Straßenkonstruktion erklärbar und liefert somit ein
Bemessungskriterium für die ToB in Straßenbefestigungen. Durch die Bemessung sollte die
Beanspruchung in den ToB vorläufig auf ein Maß beschränkt werden, das sich im Bereich A
(elastisches Shakedown Verhalten) befindet. Plastische Verformungen in schädlicher Größe
sind in den ToB dadurch weitestgehend auszuschließen.
In Auswertung der Triaxialversuche an verschiedenen Gesteinskorngemischen konnte ein
Verfahren zur Ermittlung der spannungsabhängigen Shakedown Grenzen zwischen den Be-
reichen A, B und C entwickelt werden. Um eine Vorstellung über realistische Spannungszu-
stände in Straßenoberbauten zu erhalten, wurden mit dem FE Programm FENLAP Beanspru-
chungsberechnungen auf Grundlage der Annahme nicht-linearer Elastizität für die ToB (elas-

Kurzfassung
IV
tisches DRESDNER-Modell) für verschiedene flexible Befestigungen durchgeführt und die
Spannungen an verschiedenen Positionen des Systems in der Lastachse berechnet. Die so er-
mittelten Spannungen wurden mit den Grenzspannungen (Shakedown Grenzen) verglichen,
um Aussagen zu bekommen, ob die im Straßenkörper in den ToB vorhandenen Spannungen
dem Bereich A (elastisches Shakedown Verhalten) zugeordnet werden können. Mit Hilfe die-
ser Untersuchungen kann das Risiko der Entstehung von plastischen Verformungen in den
ToB auf einfache Art und Weise abgeschätzt werden. Weiterhin wurde gezeigt, dass anhand
der Shakedown Grenzen im Zusammenhang mit Beanspruchungsberechnungen verschiedene
Gesteinskorngemische (Kiessand und Granodiorit) auf ihre Eignung als Tragschichtmaterial
bezüglich des Widerstandes gegen plastische Verformungen eingeschätzt werden können. Mit
Hilfe der dargestellten Zusammenhänge war es außerdem möglich, den Einfluss einer Achs-
lasterhöhung und jahreszeitlicher Schwankungen des Wassergehaltes in den ToB auf das
Spannungs-Verformungsverhalten der Befestigung zu untersuchen.
Abschließend wurden Berechnungen zur Ermittlung der plastischen Verformungen unter Be-
rücksichtigung der Spannungsgeschichte der ToB durchgeführt. Die Ergebnisse zeigen deut-
lich, dass in Straßenbefestigungen mit einem sehr dicken Asphaltpaket auch nach hoher
Lastwechselzahl in den ToB nur sehr geringe plastische Verformungen entstehen. Die Unter-
suchungen belegen weiterhin, dass das entwickelte Bemessungskriterium eine praktikable
Methode zur Abschätzung des Risikos der plastischen Verformungen in den ToB darstellt,
wobei eine genaue Ermittlung der plastischen Verformungen in Abhängigkeit von der Last-
wechselzahl nur erforderlich ist, sofern der Beanspruchungszustand in den ToB außerhalb des
stabilen Bereiches (A) liegt.

Acknowledgements
V
ACKNOWLEGEMENTS
This thesis is part of a research project focused on the permanent deformation behaviour of
UGMs used in pavement constructions. The research in this subject has been ongoing at the
Chair of Pavement Engineering at Dresden University of Technology since 1999. Several
individuals and organisations have significantly contributed to the work during this project.
Even though it is not possible to name all of them here, the contributions of the following
individuals should be pointed out.
The most influential persons that have positively supported the completion of this doctoral
thesis have been my main PhD supervisor, Professor F. Wellner, at Dresden University of
Technology and the preliminary assessors Professor J. Litzka at Vienna University of Tech-
nology and Professor A.A.A. Molenaar at Delft University of Technology. I wish to express
my deepest gratitude to all of them for their generous efforts, valuable advice and comments.
I wish to thank Mr. Andrew R. Dawson for the opportunity to use the large-scale triaxial
equipment at the University of Nottingham and for the useful advice and comments during
my work. I would also like to thank the staff at the Laboratory of the Centre for Pavement
Engineering, in particular Laboratory Engineer Mr. Ian Richardson. Without his superior abil-
ity to solve electrical and mechanical problems the experimental work would have never been
completed.
Mr. Philipp Eidener, Mr. Michael Ullrich-Leinau and Mr. Martin Donath I want to thank for
their assistance in performing the laboratory experiments at Nottingham as part of work on
their diploma thesis. Mr. Ralf Numrich and Mr. Alexander Kiehne I would like to thank for
the excellent collaborative work. Mrs. Hella Schmid and Mr. Daniel Ascher I want to thank
for assistance in drafting the figures.
To Dr. Salah Zoorob of Nottingham University, I owe a warm thank you for his efforts in
transcribing/ reviewing my thesis.
Finally, I am deeply indebted to my parents for their continuous support and encouragement.
Dresden, February 2003
Sabine Werkmeister
Notations and Abbreviations
VI
NOTATIONS AND ABBREVIATIONS
Greek lower case letters
α material constant (Equation 5.1)
β material constant (Equation 5.1)
ε strain
εel resilient strain (Equation 8.7) ∗pe axial permanent strain with strain at N = 100 (Equation 2.4)
εp permanent strain (Equation 8.7)
εp1 permanent vertical strain
εp1 n permanent vertical strain at n load cycles
∑n
ip
1
ε accumulated permanent strain in element i (Equation 8.8)
∑−1
1
nipε accumulated permanent strain in element i (Equation 8.9)
ip 1,ε permanent strain at stress state 1 in element i (Equations 8.8 – 8.9)
εr horizontal strain
εz vertical strain
φ angle of internal friction
µ Poisson ratio
σ stress
σ1,2,3 principal stresses
σ 1,f major principal failure stress
σ 3,f minor principal failure stress
σc confining pressure
σd deviatoric stress
σ 1 max peak axial stress, (σd + σc)
σr horizontal stress
σz vertical stress
τxz, yx,zy shear stress

Notations and Abbreviations
VII
Latin upper case letters
A model parameter (Equations 2.4, 6.1, 8.2)
A parameter (Equations 2.5 and 2.8)
B model parameter (Equations 2.4, 2.8, 6.1)
B constant term of Poisson’s ratio (Equation 8.2)
C model parameter (Equations 2.8 and 8.1)
D constant term of modulus of elasticity (Equation 8.1)
model parameter (Equation 2.8)
∞E glass-modulus (Equation 8.4 and 8.5)
N n number of load cycles for the stress state n (Equations 8.8 – 8.10)
N n,B number of load cycles for the stress state n at the beginning
(Equations 8.8 – 8.10)
N n,E number of load cycles for the stress state n at the end (Equations 8.8 – 8.10)
PD vertical permanent deformation (Equations 2.5 – 2.7)
Q model parameter (Equations 2.5 and 8.1)
Q1 model parameter (Equation 8.1)
Q2 constant (Equation 8.1)
R model parameter (Equations 8.2 and 8.4)
Vg void content in the asphalt mixture (Equation 8.6)
Vb binder volume in the asphalt mixture (Equation 8.6)
Va volume of the mineral aggregate in the asphalt mixture (Equation 8.5)
W deformation work (Equation 2.1)

Notations and Abbreviations
VIII
Latin lower case letters
a parameter (Equation 2.3, 2.6, 2.7, 8.3 and 8.7)
constant (Equation 2.2)
a1 – a2 model parameter (Equations 2.9, 6.2 and 6.4)
a3 – a4 model parameter (Equations 6.2 and 6.4)
b parameter (Equations 2.3, 2.5 - 2.7 and 8.3)
constants (Equations 2.2 and 8.7)
b1 – b2 model parameter (Equations 2.9, 6.3 and 6.4)
b3 – b4 model parameter (Equations 6.3 and 6.4)
c parameter (Equations 2.7 and 8.3)
cohesion
c1-c2 model parameter (Equation 2.9)
d parameter (Equations 2.5 and 8.3)
d1-d2 model parameter (Equation 2.9)
i element number
m parameter (Equations 2.6 and 2.7)
n number of stress states (Equations 8.8 – 8.10)
p contact stress
wopt optimal water content
y asphalt temperature (Equation 8.3)
z depth (Equation 8.3)

Notations and Abbreviations
IX
Abbreviations AASHO American Association of State Highway Officials
AASHTO American Association of State Highway and Transportation Officials
AC Asphalt Concrete
ALF Accelerated Loading Facility
ATS Automated Testing System
CBR California Bearing Ratio
CCP Constant Confining Pressure
D Diabase-material
layer thickness
DEM Distinct Element Method
DFG Central Public Funding Organization for Academic Research in Germany (In
German: Deutsche Forschungsgemeinschaft)
DOC Degree of Compaction
E Modulus of Elasticity
FE Finite Element
FGSV German national Research Association (In German: Forschungsgesellschaft für
Straßen- und Verkehrswesen)
FWD Falling Weight Deflectometer
G Granodiorite-material
HVS Heavy Vehicle Simulator
K Sandy Gravel
M middle of the allowable gradings within the German specification
MS Multi Stage
LVDT Linear Variable Differential Transformer
N number of load cycles
O the coarsest allowable grading within the German specification
PD Permanent Deformation
RLT Repeated Load Triaxial
RStO Empirical German pavement design guideline ( In German: Richtlinien für die
Standardisierung des Oberbaues von Verkehrsflächen)
SMA Stone Mastic Asphalt
SS Single Stage
ST Static Triaxial

Notations and Abbreviations
X
U the finest allowable grading within the German specification
UGL Unbound Granular Layer
UGM Unbound Granular Material
VCP Variable Confining Pressure

List of Contents
XI
LIST OF CONTENTS ABSTRACT I KURZFASSUNG III ACKOWLEDGEMENTS V NOTATIONS AND ABBREVIATIONS VI CONTENTS XI
1 INTRODUCTION 1-1
1.1 Background of the Research 1-1 1.2 Objectives and Scope of the Research 1-2
2 LITERATURE REVIEW 2-1
2.1 Introduction 2-1
2.2 Deformation Behaviour of Unbound Granular Materials 2-1
2.2.1 Stresses in Unbound Granular Layers 2-1
2.2.2 Deformation Characteristics of Unbound Granular Materials 2-3
2.3 Factors affecting Permanent Strain Response 2-7
2.3.1 Introduction 2-7
2.3.2 Number of Load Cycles 2-7
2.3.3 Moisture Content 2-9
2.3.4 Stress History 2-11
2.3.5 Density 2-12
2.3.6 Grading 2-12
2.3.7 Physical Properties of Aggregate Particles 2-14
2.3.8 Stress Level 2-15
2.4 The Shakedown Concept and Pavement Design 2-16
2.4.1 Introduction 2-16
2.4.2 Modelling Permanent Strain with Respect to Number of Load Cycles 2-19
2.4.3 Modelling Permanent Strain using Shakedown Approach 2-20
2.4.4 Conclusions 2-25
List of Contents
XII
3 TRIAXIAL TESTS 3-1
3.1 Introduction 3-1
3.2 Materials used in this Investigation 3-2
3.3 Testing Equipment 3-6
3.3.1 Sample Preparation 3-6
3.3.2 Repeated Load Triaxial Apparatus 3-8
3.3.3 Principle of Measurement 3-10
4 TEST RESULTS 4-1
4.1 Introduction 4-1
4.2 Permanent Deformation Behaviour 4-1
4.2.1 Range A – Plastic Shakedown Range 4-2
4.2.2 Range C – Incremental Collapse 4-4
4.2.3 Range B – Intermediate Response – Plastic Creep 4-7
4.3 Resilient Deformation Behaviour 4-8
4.4 Static Triaxial Tests 4-10
4.5 Deformation Behaviour Model of Unbound Granular Materials 4-11
5 SHAKEDOWN LIMIT CALCULATION 5-1
5.1 Introduction 5-1
5.2 Limit Ranges for the Deformation Behaviour of Unbound Granular
Materials 5-1
5.3 Criteria for Shakedown Ranges 5-4 5.3.1 Criteria Range A-B 5-5
5.3.2 Criteria Range B-C 5-6
5.4 Conclusions 5-7
6 MODELING PERMANENT DEFORMATION BEHAVIOUR 6-1
6.1 Introduction 6-1
6.2 Micromechanical Processes 6-1
6.2.1 Micromechanical Processes in Range A 6-1
6.2.2 Micromechanical Processes in Range B 6-3
6.2.3 Micromechanical Processes in Range C 6-6
6.3 Plastic DRESDEN-Model 6-9

List of Contents
XIII
7 PARAMETERS INFLUENCING DEFORMATION BEHAVIOR 7-1
7.1 Introduction 7-1
7.2 Effect of the Grading on the Permanent Deformation Behaviour 7-1
7.3 Effect of the Physical Properties of Aggregate Particles on Permanent
Deformation Behaviour 7-5
7.4 Conclusions 7-10
8 PAVEMENT PERFORMANCE 8-1
8.1 Introduction 8-1
8.2 The Resilient Calculation 8-2
8.2.1 Finite Element Program 8-2
8.2.2 Constructions selected for Investigation 8-3
8.2.3 Implementing the Material Behaviour 8-4
8.2.4 Results of the Resilient Calculation 8-13
8.3 Calculation of the Permanent Strains 8-18
8.4 Design Chart 8-24
9 CONCLUSIONS 9-1
9.1 Introduction 9-1
9.2 Literature Review 9-2
9.3 Laboratory Experiments 9-3
9.4 Design Chart and Pavement Performance 9-5
10 RECOMMENDATIONS FOR FURTHER RESEARCH 10-1
LIST OF TABLES XIV
LIST OF FIGURES XV
REFERENCES XIX
APPENDICES
Appendix A Test Programme
Appendix B Test Results
Appendix C Modelling

List of Tables
XIV
LIST OF TABLES
Table 3-1. DOC and moisture contents of the materials used in this investigation 3-6
Table 5-1. Plastic shakedown and plastic creep-limits 5-3
Table 6-1. Model-coefficients as found for Equations 6.2 and 6.3 for Phase II 6-11
Table 6-2. Model-coefficients as found for Equations 6.4 and 6.5 for Phase II 6-13
Table 8-1. Constructions investigated, RStO 01 8-3
Table 8-2. Parameters for the elastic DRESDEN-Model, Range A 8-8
Table 8-3. Determination of the modulus of elasticity for the different asphalt layers 8-12
Table 8-4. Data used for calculating the different stress states 8-22

List of Figures
XV
LIST OF FIGURES
Figure 1-1. Critical strains and stress in a three layer system considered for routine
design of road pavements, TRRL method [POW 84] 1-3
Figure 1-2. RLT equipment at the laboratory of the Centre for Pavement Engineering
at the University of Nottingham 1-5
Figure 2-1. Stress components acting on an element [LEK 97] 2-1
Figure 2-2. Stresses beneath a rolling wheel load [SHW 80] 2-2
Figure 2-3. Stress-strain behaviour of UGMs 2-3
Figure 2-4. Hysteresis loop for viscous-elastic permanent behaviour 2-4
Figure 2-5. Stress-strain behaviour of unbound Slate Waste under dynamic load 2-5
Figure 2-6. Dependence between the contact force F and displacement d between
two particles [KOL 97] 2-6
Figure 2-7. An example of the effect of the number of load repetitions on the
permanent axial strain of a RLT test specimen [KOL 98] 2-8
Figure 2-8. Influence of drainage on permanent deformation development [DAW 90] 2-10
Figure 2-9. Effect of stress history on permanent strain [BRO 75] 2-11
Figure 2-10. Effect of density on permanent strain [BAR 72] 2-12
Figure 2-11. Effect of grain size distribution on the aggregate’s susceptibility to
permanent deformations [BEL 97] 2-13
Figure 2-12. Influence of stress ratio on permanent strain in a Granite Gneiss [BAR 72] 2-16
Figure 2-13. Elastic/permanent behaviour under repeated cyclic pressure and
tensile load [JON 86] 2-18
Figure 2-14. Permanent deformation behaviour at low stress level (stable conditions) 2-21
Figure 2-15. Permanent deformation behaviour at high stress level (unstable conditions) 2-22
Figure 2-16. S-N design models for the clinker ash at 69 % relative density
and 75 % saturation for different plastic strains [THE 00] 2-24
Figure 3-1. Gradings of the materials used in this investigation 3-4
Figure 3-2. Normal Proctor test results of the materials used in this investigation
according DIN 18127–P 150 Y 3-4
Figure 3-3. Coarse fraction samples and surface details of materials used in this
investigation 3-5
Figure 3-4. Split mould 3-7
Figure 3-5. Sample preparation [BOY 76] 3-7
Figure 3-6. RLT apparatus at the University of Nottingham [WER 01] 3-8

List of Figures
XVI
Figure 3-7. Triaxial specimen under vacuum with the measurement equipment 3-9
Figure 3-8. Stress paths 3-9
Figure 3-9. Phases of a load cycle 3-10
Figure 3-10. Components of strain 3-10
Figure 3-11. Measured deformations 3-11
Figure 4-1. Vertical permanent strains versus number of load cycles 4-1
Figure 4-2. Vertical permanent strain rate versus vertical permanent strains 4-2
Figure 4-3. Vertical permanent strain versus number of load cycles – Range A 4-3
Figure 4-4. Vertical permanent strain rate versus number of load cycles Range A 4-4
Figure 4-5. Vertical resilient and permanent strains versus number of load cycles
Range C 4-5
Figure 4-6. Vertical resilient and permanent strains versus number of load cycles
Range C 4-5
Figure 4-7. Vertical permanent strain rate versus number of load cycles, Range C 4-6
Figure 4-8. Vertical permanent and resilient strains versus number of load cycles
Range B 4-7
Figure 4-9. Vertical permanent strain rate versus number of load cycles, Range B 4-8
Figure 4-10. Vertical resilient strains versus number of load cycles 4-9
Figure 4-11. Vertical resilient strains versus stress ratio, Granodiorite 4-10
Figure 4-12. Results of ST tests, Granodiorite 4-11
Figure 4-13. Behaviour of UGMs under repeated cyclic load 4-12
Figure 5-1. Plastic Shakedown-Limit Range for a Granodiorite 5-1
Figure 5-2. Exact plastic shakedown and plastic creep-limits for the Granodiorite 5-3
Figure 5-3. Example for Multi-Stage test procedure 5-4
Figure 5-4. Vertical permanent strain-rate versus confining pressure for the tested
materials - Range A 5-5
Figure 5-5. Vertical permanent strain-rate versus confining pressure for the tested
materials - Range B 5-6
Figure 5-6. Vertical permanent strain-rate versus confining pressure for the tested
materials - Range C 5-7
Figure 6-1. Vertical permanent strain versus number of load cycles, σD = 210 kPa,
σC = 210 kPa, Range A 6-2
Figure 6-2. Hysteresis loops σD = 210 kPa, σC = 210 kPa, Range A 6-3
Figure 6-3. Variation in grading M before and after testing, Granodiorite 6-4

List of Figures
XVII
Figure 6-4. Vertical permanent strain versus number of load cycles, σD = 280 kPa,
σC = 140 kPa, Range B 6-4
Figure 6-5. Hysteresis loops, σD = 280 kPa , σC = 140 kPa - Range B 6-5
Figure 6-6. Vertical permanent strain versus number of load cycles, σD = 840 kPa,
σC = 210 kPa, Range C 6-7
Figure 6-7. Hysteresis loops, σD = 840 kPa , σC = 210 kPa, decreasing resilient
strains - Range C 6-8
Figure 6-8. Hysteresis loops, σD = 840 kPa , σC = 70 kPa, increasing resilient
Strains - Range C 6-9
Figure 6-9. Vertical permanent strain versus N (data and model) Range A 6-12
Figure 6-10. Vertical permanent strain versus N (data and model) Range B 6-13
Figure 6-11. Vertical permanent strain versus N (data and model) Range B 6-14
Figure 7-1. Vertical permanent strains versus number of load cycles, Diabase
grading M and O 7-2
Figure 7-2. Vertical resilient strains versus stress ratio, Diabase - grading M and O 7-2
Figure 7-3. Vertical permanent strains at 80,000 cycles versus stress ratio,
Sandy Gravel - grading M and U 7-3
Figure 7-4. Vertical resilient strains versus stress ratio, Sandy Gravel –
grading M and U 7-4
Figure 7-5. Peak axial stress versus stress ratio – plastic shakedown limits,
Sandy Gravel - grading M and U 7-4
Figure 7-6. Vertical permanent strains at 80,000 cycles versus stress ratio,
Granodiorite, Sandy Gravel, Diabase - 7-5
Figure 7-7. Peak axial stress versus stress ratio – plastic shakedown limits,
Granodiorite, Sandy Gravel, Diabase, grading M 7-6
Figure 7-8. Vertical resilient strains versus stress ratio, Granodiorite,
Sandy Gravel, Diabase 7-6
Figure 7-9. Vertical permanent strain versus number of load cycles for different
materials at the same stress level, Diabase, Granodiorite - grading M 7-8
Figure 7-10. Vertical permanent strain versus number of load cycles for different
materials at the same stress level 7-10
Figure 8-1 Geometry of the axial symmetric model for the subgrade [NUM 03] 8-4
Figure 8-2. Comparison of measured and calculated surface deflections [GLE 96] 8-6
List of Figures
XVIII
Figure 8-3. Vertical resilient strain versus confining pressure at different moisture
contents [NUM 03] 8-7
Figure 8-4. Geometry of the axial symmetric model for the UGL [NUM 03] 8-9
Figure 8-5. Averaged frequencies of the asphalt surface temperatures in Germany
during one year [JAN 85] 8-10
Figure 8-6. Temperature regime within the asphalt layer [NUM 03] 8-11
Figure 8-7. Geometry of the axial symmetric model for the asphalt layer [NUM 03] 8-13
Figure 8-8. Calculated vertical stresses in the pavement at surface temperatures of
-12.5 and 47.5 °C (asphalt cover 340 mm) 8-14
Figure 8-9. Calculated vertical stresses in the pavement at surface temperatures of
-12.5 °C and 47.5 °C (asphalt cover 220 mm) 8-15
Figure 8-10. Calculated horizontal stresses in the pavement at surface temperatures of
-12.5 and 47.5 °C (asphalt cover 340 mm) 8-16
Figure 8-11. Calculated horizontal stresses in the pavement at surface temperatures of
-12.5 and 47.5 °C (asphalt cover 220 mm) 8-17
Figure 8-12. Calculated vertical stiffness in the pavement at surface temperature of
-12.5 and 47.5 °C (asphalt cover 340 mm) 8-18
Figure 8-13. Influence of the stress history on the permanent deformation behaviour 8-20
Figure 8-14. Consideration of stress history on modelling permanent deformation
behaviour 8-20
Figure 8-15. Progress of the permanent vertical strains in the UGL for 340 mm asphalt
pavement during the service life of the road 8-22
Figure 8-16. Nodes and elements 8-23
Figure 8-17. Permanent deformation at the surface of an UGL as function of N
(11.5 t axle load), asphalt cover thickness 340 mm 8-24
Figure 8-18. Design chart 8-25
Figure 8-19. Existing stresses in the UGL for different asphalt surface temperatures
in the load axis, 340 mm asphalt pavement [NUM 03] 8-26
Figure 8-20. Existing stresses on the surface of the UGL in the load axis at 4 and 5 %
moisture content for different asphalt layer thicknesses 8-27
Figure 8-21. Existing stresses on the surface of the UGL in the load axis at different
axle loads 8-28
Figure 8-22. Existing stresses on the surface of the UGL in the load axis for
Sandy Gravel and Granodiorite asphalt cover thickness 340 mm 8-29

Introduction
1-1
1 INTRODUCTION
1.1 Background of the Research
Pavement design is the process of determining the most economical combination of layer
thicknesses and material types to enable a pavement construction (flexible, rigid or composite)
to carry the design traffic loadings, to sustain climatic conditions and to take into account the
properties of the natural subgrade. All pavement design methods seek to control or limit the
loss of serviceability of the pavement construction resulting from traffic loading and
environmental related deterioration. In this sense, therefore, pavement design is similar to the
design of any engineering structure. The structure is hence designed to dissipate the energy
from the applied traffic loading in such a way, that stresses and/or strains developed in any
layer do not exceed permissible limits.
There are two basic approaches to pavement design. Pavements have traditionally been
designed using empirical design methods, i.e. the material types and layer thicknesses of the
different structural layers have been selected in accordance with very inflexible predetermined
design criteria. A typical feature of many empirical design methods is that they have been
progressively calibrated over many years by means of either systematic road tests or
observations made from actual road structures as well as back calculations. As a result, the
design and construction of the pavements has traditionally been directed towards more or less
standardized cross sections and road construction materials. As an example, German roads are
usually constructed using very thick asphalt layers. The German empirical design method
“RStO 01” relies heavily on interpretation of the plate bearing test results. Many other
countries use CBR based design methods, e.g. the AASHTO design guide [AASHTO 86]. The
CBR method originated in the USA but it has subsequently been used in many other countries.
The AASHTO design methodology is based on the AASHO road test performed in the USA
during the late 1950’s and early 1960’s.
During the last few years, and as a consequence of the drive towards economic utilization of
non-renewable natural resources and recycling existing road materials, the development of
new, more innovative types of road construction has become essential. Unfortunately, current
empirical pavement design methods are in most cases insufficient for the analysis and design
of new structural solutions. Nonetheless, there are increasing worldwide efforts towards

Introduction
1-2
developing analytical approaches to solve this problem. The analytical or mechanistic design
method aims to model the behaviour of a pavement based on the basic mechanical and
physical properties of the structural materials. The key idea is to evaluate the stresses and
strains under real traffic loads at critical points in the structure based on the analysis of the
stress-strain conditions of the whole pavement taking into consideration the climatic
conditions. Based on the critical values of stresses and strains, the service life of the pavement
can thus be estimated.
Typical examples of analytical design methods of pavement constructions include the Shell
design method [SHE 94], a South African design method [FRE 82] and the method developed
at the University of Nottingham [BRO 85].
1.2 Objectives and Scope of the Research
A pre-requisite for any successful analytical design methodology is the acquisition of reliable
measurements from representative experimental investigations followed by appropriate
mathematical characterization of the deformation behaviour of bound and unbound layers in
the pavement construction. As far as the resilient behaviour of the pavement is concerned
there is a wide range of material models, computation tools and design procedures available.
The situation regarding the behaviour of pavements with respect to the accumulation of
permanent deformation under repeated traffic loading is much less well developed. The
research work detailed in the following chapters was aimed specifically at providing a
contribution towards this area. In particular this investigation was focused on the permanent
deformation behaviour of Unbound Granular Materials (UGMs).
UGMs have mechanical properties that are stress-dependent and are very sensitive to climatic
and environmental conditions. The research work presented in the following chapters
discusses the stress-dependent permanent deformation behaviour of UGMs that are typically
used in the unbound pavement layers. The main objectives of the work were to recognize the
influence of several variables that significantly influence the permanent deformation
behaviour and to find a suitable model for the description and calculation of permanent
behaviour of UGMs. The outcomes from this research work will be utilized in the Finite
Element (FE) calculations of the UGL, which forms part of a FE pavement design model that

Introduction
1-3
is currently under development at the Chair of Pavement Engineering, Dresden University of
Technology.
The design criteria applied in current (analytical) design methods are intended to guard against
excessive permanent deformation originating within the subgrade (rutting) and cracks
initiating at the underside of the bound layers (fatigue). These criteria are usually expressed as
a relationship between load induced resilient stresses or strains and the permissible number of
load applications expressed in terms of standard units of equivalent applied traffic axles
(Figure 1-1). The criterion for the subgrade is normally observed by applying a permissible
limiting value for the compressive vertical strain at the top of the subgrade that has been
derived from analysis of data originating from the AASHO road test.
Figure 1-1. Critical strains and stress in a three layer system considered for routine design of road pavements,
TRRL method [POW 84]
These methods assume that rutting/permanent deformations occur only in the subgrade. The
thickness of the Unbound Granular Layer (UGL) is determined from the subgrade condition
(CBR and/or resilient modulus) and the design traffic. No practicable design criterion is
known for the UGLs. By adhering to UGMs specification requirements, it is assumed that no
Subgrade
Unbound granular layers
Bituminous layers
Moving wheel load
Fatigue crack
εr Horizontal tensile strain
Vertical compressive stress
and strain
σz εz
Material specification

Introduction
1-4
rutting will occur in the UGL. These specifications for UGMs typically include criteria for
durability, cleanliness, particle shape and grading, none of which is a direct measure of
resistance against rutting/permanent deformation caused by repeated loading.
The Repeated Load Triaxial (RLT) test has the ability to simulate dynamic pavement loading
on UGMs as happening in pavement constructions. These tests show a wide range of UGM
performance even though all the materials comply with the same specification [THO 89].
British accelerated pavement tests done by LITTLE [LIT 93] show the same results and
indicate that, depending on the pavement structure, 30 % to 70 % of surface rutting is
attributed to the UGLs. However, these effects could not be observed on pavements designed
according to the German pavement design guideline [RStO 01], because of the low stresses
within the UGLs beneath thick asphalt layers. The current specification for UGMs (e.g.
grading, durability) is not suitable to determine the deformation performance of these
materials. Thus, new analytical pavement design methods should incorporate repeated load
deformation performance of the UGL. One practical goal of this investigation was to develop
an approach to overcome the current limitations in design practice and to develop a simple
design chart that can assist a pavement engineer in evaluating the risk of rutting within an
UGL.
The results of the RLT tests performed at the University of Nottingham’s Centre for Pavement
Engineering during the period from 1999 to 2002 constitute the most important background
material for this work (Figure 1-2).

Introduction
1-5
Figure 1-2. RLT equipment at the laboratory of the Centre for Pavement Engineering at the University
of Nottingham
The test series have mainly been commissioned by the DFG, Central Public Funding
Organization for Academic Research in Germany (Deutsche Forschungsgemeinschaft), the
DAAD, German Academic Exchange Service (Deutscher Akademischer Austauschdienst) and
ARC, the British Council. In parallel with this research work, the resilient deformation
behaviour of UGMs was also investigated at the Chair of Pavement Engineering at Dresden
University of Technology by NUMRICH [NUM 03].
Literature Review
2-1
2 LITERATURE REVIEW
2.1 Introduction
A literature survey was carried out regarding the permanent deformation behaviour of UGMs.
The literature study was focused on the various factors affecting permanent deformation
behaviour and modelling techniques. The first part of this chapter describes the deformation
behaviour of UGMs. This is followed by an introduction to the application of the shakedown
concept to pavement design. An overview is also presented on available models to predict
permanent deformation of UGMs. Finally, a conceptual discussion is presented on the
requirements of an improved UGM model.
2.2 Deformation Behaviour of Unbound Granular Materials
2.2.1 Stresses in Unbound Granular Layers
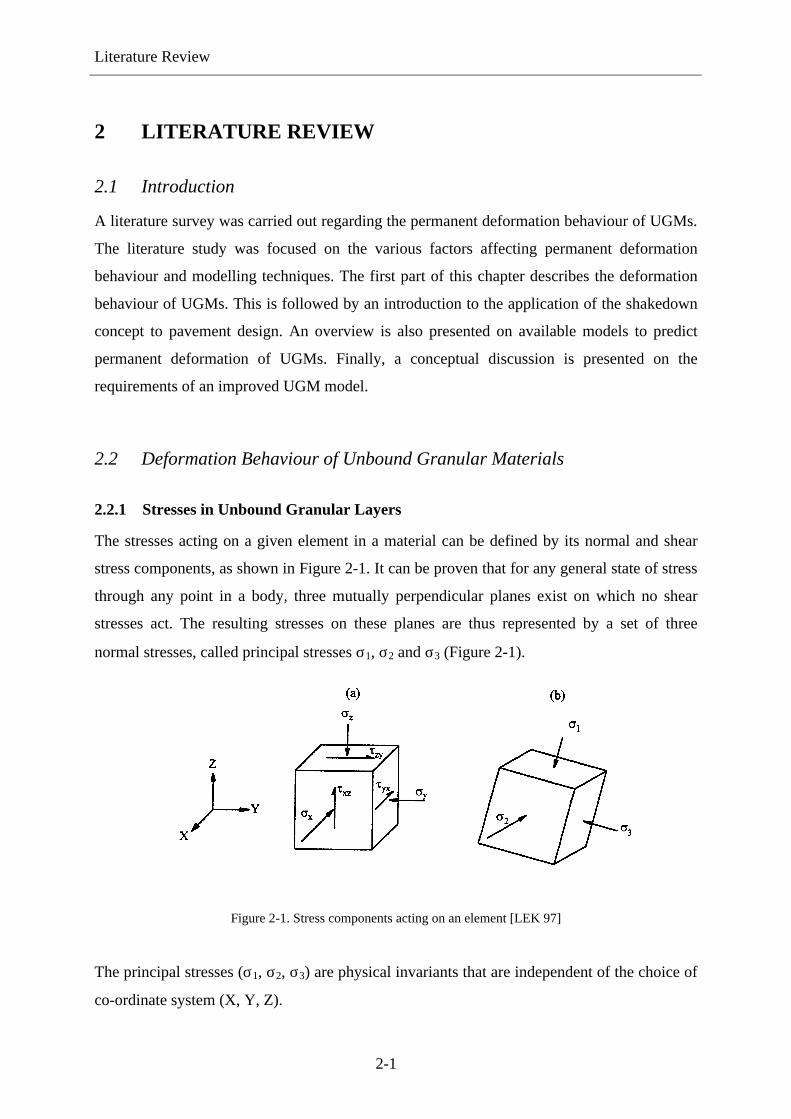
The stresses acting on a given element in a material can be defined by its normal and shear
stress components, as shown in Figure 2-1. It can be proven that for any general state of stress
through any point in a body, three mutually perpendicular planes exist on which no shear
stresses act. The resulting stresses on these planes are thus represented by a set of three
normal stresses, called principal stresses σ1, σ2 and σ3 (Figure 2-1).
Figure 2-1. Stress components acting on an element [LEK 97]
The principal stresses (σ1, σ2, σ3) are physical invariants that are independent of the choice of
co-ordinate system (X, Y, Z).

Literature Review
2-2
The pavement in the field is usually loaded by moving wheel loads, which at any time impose
varying magnitudes of vertical, horizontal, and shear stresses in the UGL. As a result of this,
rotation of the principal stress occurs. Figure 2-2 shows that the principal stresses act
vertically and horizontally only when the shear stresses are zero, i.e. directly beneath the
centre of the wheel load.
Figure 2-2. Stresses beneath a rolling wheel load [SHW 80]
For laboratory testing, the RLT apparatus is the type most commonly used for UGM
characterization. Combinations of the vertical and horizontal stresses can be reproduced in a
RLT test. This type of loading, however, does not provide for the shear reversal or the change

Literature Review
2-3
in the direction of principal stresses (change in the direction of principal stresses can be
simulated only by some new RLT equipments). The stresses applied in a RLT test are
equivalent to the in-situ principal stresses directly beneath the centre line of the wheel load. If
the in situ stress condition below the centre of a single wheel load is considered, then
σ1 = σz = vertical stress, and σ2 = σ3 = σr = horizontal stress [LEK 97].
2.2.2 Deformation Characteristics of Unbound Granular Materials
The deformation resistance of an UGM depends on the applied stresses. The behaviour shown
in Figure 2-3 is typical for UGMs, as the stress increases, the material’s resistance to further
deformation diminishes.
Figure 2-3. Stress-strain behaviour of UGMs
At low levels of stress, the stiffness of the material increases with rising magnitudes of load
(strain hardening). The compacted UGM becomes even more closely packed and harder to
move, as its components (particles) are forced into new interlocked positions. As the stress
increases further (near to failure) the stiffness of the material decreases (strain softening).
Eventually the material achieves failure. UGM are different from soils in their physical
characteristics and also in their response to applied cyclic load. An UGM is an assembly of a
large number of individual particles with different shapes and sizes. These materials carry
only a very small amount of tensile stress [WEN 88].
Strain ε
Stre
ss σ
Strain softening Strain hardening

Literature Review
2-4
UGLs in a pavement are subjected to a large number of load cycles during the service life.
These layers exhibit a combination of resilient strains, which are recovered after each load
cycle, and permanent strains, which accumulate with every load cycle. Even at small stresses,
resilient and permanent strains can arise. The stress-strain relationship for UGM is given by a
non-linear curve, which is not retraced on the removal of stresses but forms a hysteresis loop.
Evaluation of a particular hysteresis loop will produce the values for the permanent and
resilient strains per load cycle. Figure 2-4 gives a general idea of a single hysteresis loop.
Stress
Strain
permanentstrain
resilient strain
Figure 2-4. Hysteresis loop for viscous-elastic permanent behaviour
The area of the hysteresis loop corresponds to the deformation work per volume element.
∫= εσ d W [2.1]
where:
σ [N/mm2] stress
ε [-] strain [SCH 97].
The greatest part of this work is transformed into heat energy. It partly comes to a change of
the material properties, which finally leads to damage. Only a small part of this work will be
accumulated.
A typical example (RLT test result) of the behaviour of UGMs under dynamic loading is
shown in Figure 2-5. By comparing the hysteresis loops in Figure 2-4 and Figure 2-5, the
loops in Figure 2-5 are much more narrow in the bottom part, but they must still be open (as
the permanent strain per load cycle is not zero) because there is a gap between the loops of the
cycles for 20,000 and 80,000 load repetitions. This indicates a small amount of permanent
strain at every load cycle.

Literature Review
2-5
0
100
200
300
400
500
0 500 1000 1500 2000 2500
Axial Strain [µε]
Deviatoric Stress [kPa] Unbound Slate Waste
Confining Stress
= 100 kPa
N= 1 - 3
80 000
20 000 1000
100
Figure 2-5. Stress-strain behaviour of unbound Slate Waste under dynamic load
Despite years of research, the deformation mechanisms of UGMs are not yet fully understood.
The non-linearity of the stress-strain relationship is affected by the structure of the grain
assembly (Hertz contact theory [HER 82]). The deformation of UGMs under dynamic loading
is the result of different mechanisms [THO 89]. The resilient deformation is mainly caused by
the deformations of the individual grains. In a stress-less state, the grains touch punctual
(number 0 in Figure 2-6). When the force F, transmitted by the inter-particle contacts, is
increased, the size of the inter-particle contact areas must increase due to the compression of
those contacts - the resistance of the centres of individual aggregate particles approaching
each other is also increasing. As illustrated in Figure 2-6 the displacement ∆δ between the
particles (resilient deformation of the particles) decreases with the increase of the contact
force ∆F.

Literature Review
2-6
Figure 2-6. Dependence between the contact force F and displacement δ between two particles [KOL 97]
However, at high stress levels additional effects will probably affect the non-linear resilient
deformation behaviour [NIE 02]. In a densely compacted granular material the particles are
packed closely together leaving relatively small pores between the grains. Shear strain forces
the particles to climb on each other and the volume increases. If the expansion is restricted the
dilataion will result in increased stiffness [HOF 99, NIE 02].
Permanent deformation is mainly caused by a mechanism of re-orientation. The re-orientation
mechanism is characterized by rotation and sliding of the individual particles. The resistance
to particle sliding and rotation is dependent on the inter particle friction. Grain
breakage/crushing occurs if the contact stresses between the grains exceeds the strength of the
grains and is governed by grain size, magnitude of applied stresses, mineralogy and strength
of the individual particles [LEK 97]. Grain abrasion is defined as the spalling of small
particles from the grain surfaces and this occurs even at low stress levels [ARS 00]. Spalling
occurs at the contact points between the grains once the local strength of the grains has been
exceeded. Loading of the grains during the laying and compaction process is much more
severe than under traffic loading [TOU 98]. For this reason grain fragmentation is of minor
importance during the service conditions of the pavement [TOU 98].

Literature Review
2-7
THOM and BROWN [THO 89] used RLT tests to assess elastic stiffness, shear strength and
susceptibility to permanent deformation. They recognized that elastic stiffness correlates
among other things with the frictional resistance at particle contact points, which is dependent
on the microscopic properties. The shear strength and the resistance against permanent
deformation were found to be a function of visible roughness. The ranking of resistance
against permanent deformation showed some similarity to those for shear strength, however
notable differences were recognized. The reason was argued to be that the shear strength is
influenced by the overall particle shape as well as roughness. It was also argued that the
loading, (whether dynamic or static) and the stress levels between the individual grains must
be different. This was reflected by the fact that a direct dependency between the shear
strength and the resistance against permanent deformation was not observed. For this reason
different micromechanical processes must be in play. However, to confirm these results
further investigations are necessary.
2.3 Factors affecting UGM-Permanent Strain Response
2.3.1 Introduction
One of the main aspects of the design philosophy for flexible pavements is the limitation of
ruts in the pavement structure. Measuring rut development is relatively simple, but the
prediction of rut development is extremely complex. The problem cannot be solved solely by
accurate characterization of the pavement layers (e.g. asphalt layers, UGLs, subgrade); an
assessment of the impact of environmental conditions and calculations of the appropriate
stress distribution during the entire life of the pavement are also required. Although the
largest amount of permanent deformation (for common German pavements) result from the
asphalt layers, this chapter deals with the different factors influencing the permanent
deformation behaviour of UGMs. A number of summaries of the factors that influence the
permanent deformation behaviour of UGMs can be found in the literature and one of the most
recent reviews was presented by LEKARP [LEK 97]. Some of the most important factors are
described below.
2.3.2 Number of Load Cycles
The number of load repetitions does not only affect the permanent strain response - it always
has to be considered as a combination of the number of load repetitions and the stress

Literature Review
2-8
condition. If the intensity of the applied loading is not too high, the accumulation of
permanent deformations on a certain stress path is normally assumed to stabilise as the
number of load repetitions increases. The curve representing the accumulated permanent
deformation approaches asymptotically a limiting value, i.e. the permanent deformation rate
per load cycle tends towards zero. Increasing stress ratios lead to a progressive rise of the
accumulating permanent deformations. The number of load repetitions required while
investigating the permanent deformation behaviour in RLT tests is of great importance from a
practical point of view (time required for completing the tests and hence overall experimental
costs). For instance 80,000 load cycles are set by the prEN-Standard [prEN 13286-7].
Sometimes this number of load repetitions is not adequate. KOLISOJA [KOL 98] found that
specimens can apparently stabilize after 80,000 load cycles (degressive curve linearity).
However, with additional load cycles, a progressive linearity in the shape of the strain plot
can be observed following further development of permanent deformations (Figure 2-7).
Figure 2-7. An example of the effect of the number of load repetitions on the permanent axial strain of a RLT test specimen [KOL 98]
MORGAN [MOR 66] studied the behaviour of two types of sand under a repeated vertical
load at both constant and varying confining pressures using a RLT apparatus. MORGAN

Literature Review
2-9
applied up to 2 million load cycles and recognized that even towards the end of the tests the
permanent deformations still increased.
BARKSDALE [BAR 72] investigated the behaviour of UGMs using RLT tests at constant
confining pressure and dynamic deviator stress. After applying 100,000 load cycles he
reasoned that permanent axial deformations rise linearly with the logarithm of the number of
load cycles. Furthermore BARKSDALE found out that the increase in permanent
deformations under very small deviator stresses slowed down for growing numbers of load
repetitions. By exceeding a certain level of deviator stress the permanent deformation
development increased with a growing number of load cycles. BARKSDALE’s test results
showed a possible sudden rise of the increment of permanent deformations after a relatively
high number of load repetitions.
2.3.3 Moisture Content
In practice there is always water within an UGL. The water film on the surface of the grains
influences the shear resistance. The occurrence of a moderate amount of moisture benefits the
strength and the stress and strain behaviour of UGMs. Having achieved total saturation,
repeated load applications may lead to the development of positive pore water pressure with
any further increases in the water content. Excessive pore water pressure reduces the effective
stress, resulting in diminishing permanent deformation resistance of the material. Thus a high
water content within an UGL causes a reduction in stiffness and hence deformation resistance
of the layer. Figure 2-8 shows RLT test results whereby both samples started at the same
moisture content but one was allowed to drain, like in a real UGL in pavements, (so it became
dryer) while the other one stayed at the same moisture content and experienced a much larger
amount of permanent deformation.
Literature Review
2-10
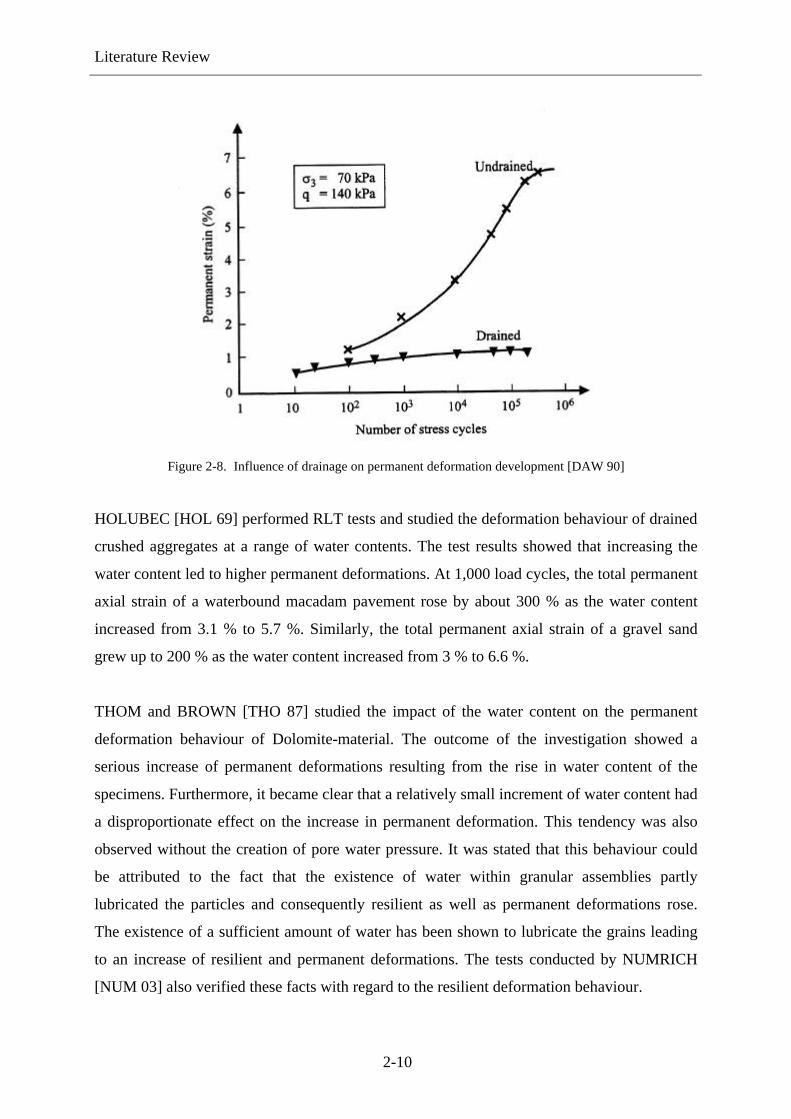
Figure 2-8. Influence of drainage on permanent deformation development [DAW 90]
HOLUBEC [HOL 69] performed RLT tests and studied the deformation behaviour of drained
crushed aggregates at a range of water contents. The test results showed that increasing the
water content led to higher permanent deformations. At 1,000 load cycles, the total permanent
axial strain of a waterbound macadam pavement rose by about 300 % as the water content
increased from 3.1 % to 5.7 %. Similarly, the total permanent axial strain of a gravel sand
grew up to 200 % as the water content increased from 3 % to 6.6 %.
THOM and BROWN [THO 87] studied the impact of the water content on the permanent
deformation behaviour of Dolomite-material. The outcome of the investigation showed a
serious increase of permanent deformations resulting from the rise in water content of the
specimens. Furthermore, it became clear that a relatively small increment of water content had
a disproportionate effect on the increase in permanent deformation. This tendency was also
observed without the creation of pore water pressure. It was stated that this behaviour could
be attributed to the fact that the existence of water within granular assemblies partly
lubricated the particles and consequently resilient as well as permanent deformations rose.
The existence of a sufficient amount of water has been shown to lubricate the grains leading
to an increase of resilient and permanent deformations. The tests conducted by NUMRICH
[NUM 03] also verified these facts with regard to the resilient deformation behaviour.

Literature Review
2-11
Generally other investigators [DAW 90, LAS 71, BAR 72] who studied the effect of the water
content on the permanent deformation behaviour of UGMs have drawn the same conclusions
as mentioned above. The growing susceptibility of granular assemblies to deformation with
increasing water content was also observed in field tests (in-situ) [MAR 82].
2.3.4 Stress History
The permanent deformation behaviour of UGMs is directly linked to stress history. If these
materials are initially exposed to low loads, then this stress history diminishes the effect of
any subsequent higher loads. Smaller permanent strains also occur if the initially applied
loads are higher than the subsequent loads [BAR 91].
BROWN and HYDE [BRO 75] studied the impact of stress history on the permanent
deformation behaviour of granular assemblies. Figure 2-9 clearly shows the dependency of
permanent deformation behaviour on stress history. Permanent strain resulting from a
successive increase in the stress level is considerably smaller than the strain that occurs when
the highest stress is applied as a single pulse (Figure 2-9).
Figure 2-9. Effect of stress history on permanent strain [BRO 75]
Even though the effect of stress history on permanent deformation behaviour has been
recognized, very limited research appears to have been carried out to study this effect. In
current laboratory permanent deformation tests, the effect of stress history is normally
eliminated by using a new specimen for each stress path applied.
(σ1 – σ3) kPa Type of loading
50-250 Incremental
50-350 Incremental
50-450 Incremental
50-550 Incremental
50-650 Incremental
50-650 Single Stage

Literature Review
2-12
2.3.5 Density
The density of the grain skeleton is one of the most important factors influencing the
development of permanent deformations [BAR 72, HOL 69, ALL 73, NIE 02]. Resistance to
permanent deformations under repetitive loading can be highly improved by an increased
density (particularly so for crushed grains). Therefore the same stress path leads to smaller
permanent strains for a specimen with a high density than one with a low density.
BARKSDALE [BAR 72] studied the effect of density on the deformation behaviour of
granular assemblies using RLT tests with repeated vertical loads and constant confining
pressure. He observed an increase of permanent axial strain of about 185 % when the material
was compacted at 95 % instead of 100 % of maximum compactive density (normal Proctor
density) (Figure 2-10). Similar results were obtained by MAREK [MAR 77].
Figure 2-10. Effect of density on permanent strain [BAR 72]
Increasing the density guarantees a decrease in permanent strains for crushed aggregates in
particular [HOL 69]. For rounded aggregates, however, this decrease in strain with increasing
density is not considered to be significant, as these aggregates are initially at higher
compacted density than angular aggregates for the same compactive effort.
2.3.6 Grading
If the grading is changed in such a way that relative density increases, then resistance to
permanent deformation will rise. Significantly higher permanent strains may be expected for

Literature Review
2-13
aggregates containing extremely high fines content (e.g. d < 0.074 mm > 15 %) or at a low
content of fines [KOL 98]. Similar results were found by BELT [BEL 97] (Figure 2-11).
Figure 2-11. Effect of grain size distribution on the aggregate’s susceptibility to permanent deformations [BEL 97]
THOM and BROWN [THO 98] studied the behaviour of crushed Limestone-material at
different gradings and also arrived at the conclusion that the resistance to permanent
deformations decreased with increasing fines content. This could be explained by the
assumption that the entire fines fraction do not necessarily fit into the pore spaces between the
large particles. Therefore a skeleton of larger particles in full contact does not exist. As a
result the resistance against permanent deformation and stiffness decreases.
P = (d/D)n
P = percentage finer than sieve size d d = sieve size D = maximum particle size n = real positive number less than one

Literature Review
2-14
VAN NIEKERK [NIE 02] recognized that UGMs with a more balanced grading perform
better, than the more uniformly graded materials.
It is worth emphasising that the experimental observations on the effects of the gradings
presented above are mainly based on the results of test series performed with RLT equipment.
One major reason for that is the rotation of principal stress directions during real traffic
loading conditions. This has been shown to markedly affect the permanent deformation
behaviour of UGMs [BRO 69, CHA 90]. Therefore the UGMs having open-graded or more
balanced gradings do not necessarily behave as well in the real pavement structure as could be
expected using the RLT test [BEL 97]. Furthermore dilatant behaviour of UGMs will cause a
discrepancy of experimental observations using the RLT test and the behaviour in the real
pavement structure. Dilatant behaviour allows heavily stressed elements to build up a
increasing confinement and thus reduce permanent deformation. VAN NIEKERK recognised
that finer gradings will show less resilient dilatant behaviour (particles can resiliently
rearrange under loading) than a coarse skeleton structure (particles will resiliently wedge
(sideways) under loading) [NIE 02].
2.3.7 Physical Properties of Aggregate Particles
The physical properties of aggregate particles, like grain shape and particle surface roughness
depict one of the least observed parameters affecting permanent deformation behaviour.
Grain Shape
A significant factor influencing the grain shape of coarse-grained aggregates is the
mineralogical composition of the aggregate particles. The crushing technique used to produce
the aggregates affects the grain shape of the crushed materials. With respect to grain shape,
two general groups can be formed; the first group is composed of natural sands and gravels
and the second group is composed of crushed materials. In the first group, particle contact is
between two smooth surfaces, whilst in the second group (i.e. crushed aggregates) the particle
edges can be very sharp. This difference between the natural aggregate having rounded grains
and crushed aggregate having sharp-edged grains is of most significance in long term and
permanent deformation behaviour (Section 2.2.2). The crushed material is likely to have more
grain abrasion than the natural aggregate, especially at high stresses.
Literature Review
2-15
Surface Roughness of the Particles
Many investigations have addressed the effect of macro and micro roughness of the particles
on the deformation behaviour [THO 89, CHE 94, KOL 97]. The surface friction angle can be
measured using a sliding type test performed by pulling a representative specimen of
aggregate loaded on a rough test surface [CHE 94]. The surface friction at the contact points
of particles can be assumed to affect the resilient deformation behaviour, especially when the
external load reaches the value, which makes the particles slide (Section 2.2.2). It should be
mentioned that the surface friction angle using the friction test as proposed by CHEUNG
[CHE 94] does not necessarily correlate with the visual assessment of the surface roughness.
However, the macro level surface roughness (visible roughness of the individual particles
based on the number of protrusions in the surface) probably correlates better with the ability
of the material to resist permanent deformations [THO 89].
2.3.8 Stress Level
The magnitude of permanent deformations developed strongly depends on the stress level and
increases with rising deviator stress and decreasing confining stress.
MORGAN [MOR 66] studied the behaviour of sand under repeated loading with an
increasing number of load cycles and observed the impact of deviator stress and confining
stress on the cumulative permanent deformations. A direct dependency between the sum of
permanent strains, number of load cycles applied and deviator stress was found at a particular
level of confining stress. By maintaining the deviator stress at a steady level, MORGAN
ascertained that the permanent axial strains were inversely proportional to confining stress
level.
BARKSDALE [BAR 72] conducted numerous RLT tests on UGMs at constant confining
pressures and up to 100,000 load cycles. He drew the conclusion that permanent deformations
were highly dependent on the applied load and increased when confining pressure decreased
and deviator stress rose (Figure 2-12).

Literature Review
2-16
Figure 2-12. Influence of stress ratio on permanent strain in a Granite Gneiss-material [BAR 72]
PAPPIN [PAP 79] studied a limestone of good grading with RLT tests. He recognised the
permanent strains to be a function of the length of the stress path and the stress ratio (deviator
stress/ confining stress). The resistance to permanent deformation decreased when the applied
stress approached the failure curve, i.e. the accumulated permanent strains increased at rising
deviator stress.
2.4 The Shakedown Concept and Pavement Design
2.4.1 Introduction
A key objective of pavement design is, that the pavement - especially the UGL - must be able
to resist permanent deformation beyond a certain, tolerable, level. Essentially, only resilient
deformations are permitted in the pavement. Because the permanent deformation of UGL (and
other layers) leads to irreversible deformations at the pavement surface, in practice, a
pavement construction should be designed in such a way that no, or only small amounts of
permanent deformations can accumulate in each layer.
Several researchers [DAW 99, SHA 84, PAU 98, THE 00] have observed two aspects of
material response to loading (i.e. magnitude and number of applications). They have
implicitly (if not explicitly) derived their observations from assessments performed at low
levels of stress (deviatoric stress σD/ confining stress σc). Once the asymptotic deformation

Literature Review
2-17
has been reached, further strains in the aggregate will be entirely resilient. However, at higher
levels of additional stress ratio, this type of behaviour is not observed [LEK 98] and instead,
permanent deformation does not stabilise and may eventually lead to a failure condition.
For design purposes, this implies that the maximum load level, which is associated with a
resilient response, must be determined and subsequently not exceeded, if uncontrolled
permanent deformations are to be prevented. This has raised the possibility of the existence
of a critical stress level between stable and unstable conditions in a pavement. According to
the “shakedown” concept, this is termed the “shakedown limit”.
The shakedown concept has been used to describe the behaviour of conventional engineering
structures under repeated cyclic loading. It was originally developed to analyse the behaviour
of pressure vessels to cyclic thermal loading. Later it was applied to analyse the behaviour of
metal surfaces under repeated rolling or sliding loads [JON 86]. For more details of this
concept as applied to pavements the reader is referred to [COL 93] and [SHA 84]. In
summary, the concept maintains that there are four categories of material response under
repeated loading (as illustrated in Figure 2-13):
0. purely elastic, where the applied repeated stress is sufficiently small that no element of
the material achieves any yield condition. From the first stress/strain application, all
deformations are fully recovered and the response is purely elastic.
1. elastic shakedown, where the applied repeated stress is slightly less than that required to
produce plastic shakedown. The material response is plastic for a finite number of
stress/strain applications. However the ultimate response is purely elastic. The material is
said to have “shaken down” and the maximum stress level at which this condition is
achievable is termed the “elastic shakedown limit”.
2. plastic shakedown, where the applied repeated stress is slightly less than that required to
produce collapse after the incremental accumulation of permanent strain. The material
achieves a long-term steady state response, i.e. no further accumulation of permanent
strain and each response is hysteretic. This implies that the material absorbs a finite
amount of energy during each stress/ strain application. Once a purely resilient response
has been obtained the material is said, once again, to have “shaken down” and the
maximum stress level at which this condition is achievable is termed the “permanent
shakedown limit”
Literature Review
2-18
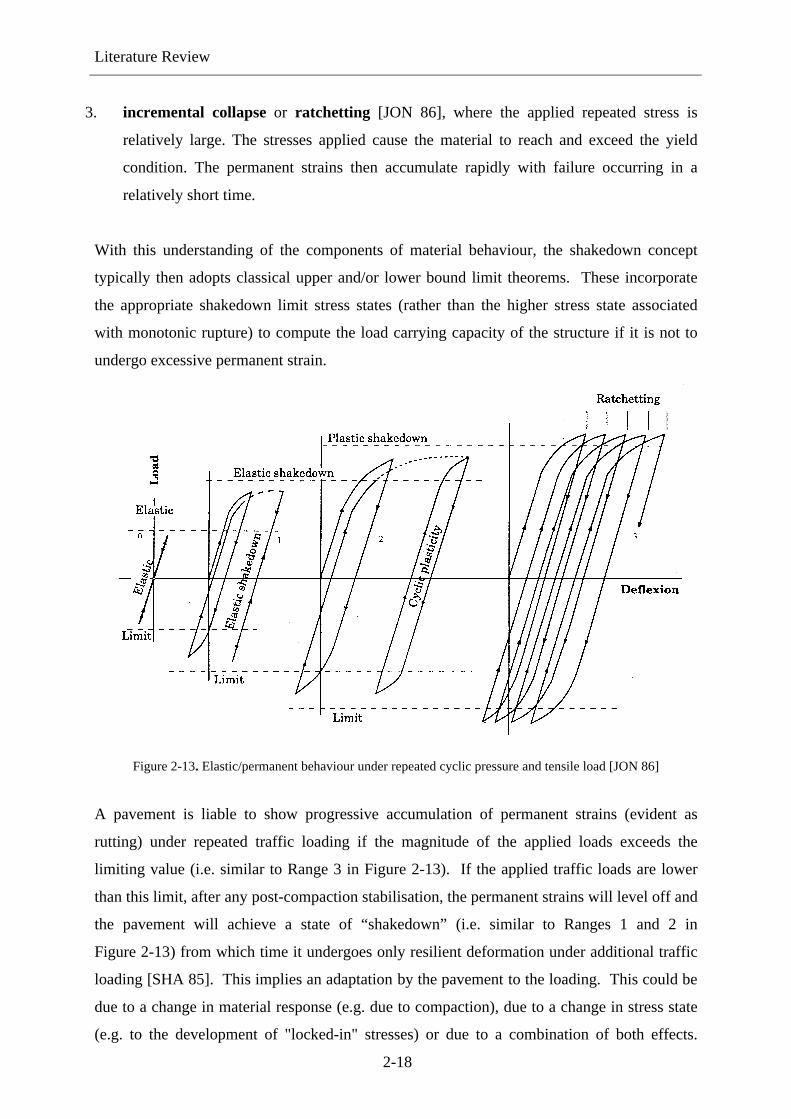
3. incremental collapse or ratchetting [JON 86], where the applied repeated stress is
relatively large. The stresses applied cause the material to reach and exceed the yield
condition. The permanent strains then accumulate rapidly with failure occurring in a
relatively short time.
With this understanding of the components of material behaviour, the shakedown concept
typically then adopts classical upper and/or lower bound limit theorems. These incorporate
the appropriate shakedown limit stress states (rather than the higher stress state associated
with monotonic rupture) to compute the load carrying capacity of the structure if it is not to
undergo excessive permanent strain.
Figure 2-13. Elastic/permanent behaviour under repeated cyclic pressure and tensile load [JON 86]
A pavement is liable to show progressive accumulation of permanent strains (evident as
rutting) under repeated traffic loading if the magnitude of the applied loads exceeds the
limiting value (i.e. similar to Range 3 in Figure 2-13). If the applied traffic loads are lower
than this limit, after any post-compaction stabilisation, the permanent strains will level off and
the pavement will achieve a state of “shakedown” (i.e. similar to Ranges 1 and 2 in
Figure 2-13) from which time it undergoes only resilient deformation under additional traffic
loading [SHA 85]. This implies an adaptation by the pavement to the loading. This could be
due to a change in material response (e.g. due to compaction), due to a change in stress state
(e.g. to the development of "locked-in" stresses) or due to a combination of both effects.

Literature Review
2-19
However, the ideal behaviour illustrated in Figure 2-13 does not relate in a straight-forward
manner to that observed in laboratory testing, as will be seen in the following chapters.
Multilayer systems such as pavements are exposed to repeated traffic loads of various
magnitudes and number of load cycles. For performance prediction, it is of great importance
to know whether a given pavement will experience progressive accumulation of permanent
deformation leading to state of incremental collapse or if the increase in permanent
deformation will cease, resulting in a stable response (shakedown state).
2.4.2 Modelling Permanent Strain with respect to Number of Load Cycles
In modelling the long-term behaviour of pavements, it is essential for the analysis to take into
account the gradual accumulation of permanent strain with the number of load cycles and the
important role played by stresses. Hence the main objective of research into long term
behaviour should be to establish a constitutive model which predicts the amount of permanent
strain at any number of cycles at a given stress level.
The available models of the permanent deformation behaviour of UGM are much less
developed than those of the resilient deformation behaviour. In the past the permanent
deformation of aggregates for pavement applications has been modelled in a variety of ways.
Some of these are logarithmic with respect to number of loading cycles [e.g. BAR 72,
SWE 90] whilst others are hyperbolic, tending towards an asymptotic value of deformation
with increasing numbers of load cycles [e.g. WOL 94, PAU 96]. In a recent review of
permanent behaviour, LEKARP et al [LEK 00] referred to many different models. Some of
these models will now be presented.
An example of the first type is that due to BARKSDALE et al [BAR 72]. According to his
approach the permanent axial strain of a RLT test specimen is supposed to accumulate in
linear relation to the logarithms of number of the load cycles as follows (Equation 2.2):
)log(1 Nbap ⋅+=ε [2.2]
where:
εp1 [10-4] axial permanent strain
a, b [-] constants for a given level of deviator stress and confining pressure
N [-] number of load cycles.

Literature Review
2-20
The long-term deformation behaviour of UGMs was also investigated by SWEERE [SWE 90]
in a series of RLT tests. SWEERE suggested, that for a large number of load cycles an
approach should be employed as follows:
b1p Na ⋅=ε [2.3]
where:
εp1 [10-4] axial permanent strain
a, b [-] regression parameters
N [-] number of load cycles.
An example of the hyperbolic type is that proposed by PAUTE [PAU 96].
−=
−∗
B
p 100N
1Ae [2.4]
where: ∗pe [-] axial permanent strain with strain at N = 100 number of load cycles
treated as zero
A, B [-] model constants
N [-] number of load cycles.
In Equation 2.4, parameter A sets an ultimate strain level, while the second part of the
equation generates a multiplier of A which increases as the level of repeatedly applied stress
gets closer to the monotonic failure stress condition.
2.4.3 Modelling Permanent Strain using Shakedown Approach
To implement the RLT measured permanent strain development in the computation of
permanent strain development in a pavement structure, the permanent strain in the material
under consideration has to be known as a function of both the number of load cycles and the
stresses in the materials. Furthermore the shakedown approach should be considered.
The possible use of the shakedown concept in pavement design was first introduced by
SHARP [SHP 83] and SHARP and BOOKER [SHA 84]. The application of the shakedown

Literature Review
2-21
concept was justified by SHARP & BOOKER using results from the AASHO-Road-Tests
[KEN 62] where in some cases, the distress was reported to stabilise after a finite number of
load cycles. More recently, parallel studies have been made into obtaining upper-bound
[COL 98] and lower-bound [YU 98] solutions for the shakedown load capacity of simple
pavement structures.
As already mentioned in Section 2.4.1, at low stress levels the mechanism of permanent
deformation has an initial post compaction or bedding-in phase, during which the rate of
deformation is relatively high but this soon reduces with increasing number of load cycles.
This stable condition may be maintained for a substantial period if the conditions do not
change (Figure 2-14).
Number of load cycles
Per
man
ent s
trai
n
Strain limit
Figure 2-14. Permanent deformation behaviour at low stress level (stable conditions)
At even higher stresses, strain may increase rapidly resulting in an eventual failure
(Figure 2-15).

Literature Review
2-22
Number of load cycles
Perm
anen
t st
rain
Figure 2-15. Permanent deformation behaviour at high stress level (unstable conditions)
MAREE [MAR 82], as reported by WOLFF [WOL 92] studied the behaviour of gravel and
crushed stone and reported that under constant confining stress the specimens stabilized
below a certain threshold of repeated deviator stress. MAREE developed a design procedure,
based on a failure model, whereby the maximum applied stress in UGL is kept below the
maximum safe repeated deviator stress [LEK 00]. This design procedure was criticized by
WOLFF [WOL 92], who argued that it is too simplistic and does not take into account the
non-linear behaviour of UGMs.
LEKARP and DAWSON [LEK 98] suggested that the shakedown approach might also be
employed in explaining the permanent deformation behaviour of UGM. By carrying out RLT
tests on different UGMs, they defined a relationship between the accumulated permanent
strain after a defined number of load cycles, the stress path length and the maximum shear-
normal stress ratio. Comparison of measured and model predicted values showed close
similarities to the shakedown concept. In conclusion, they pointed out that more research is
required to determine this shakedown limit.
However, for FE calculations of UGL as part of a FE based pavement design, the prerequisite
is a stress and load cycles dependent model for the permanent deformation behaviour of
UGM. There are some stress dependent models available [BAR 72, LAS 71, PAP 79] but
there are two models (THEYSE-Model and HUURMAN-Model), which use the shakedown
approach (in particular modelling the stable and unstable permanent deformation behaviour)
Literature Review
2-23
to model the permanent deformation behaviour of UGM as a function of the number of load
cycles.
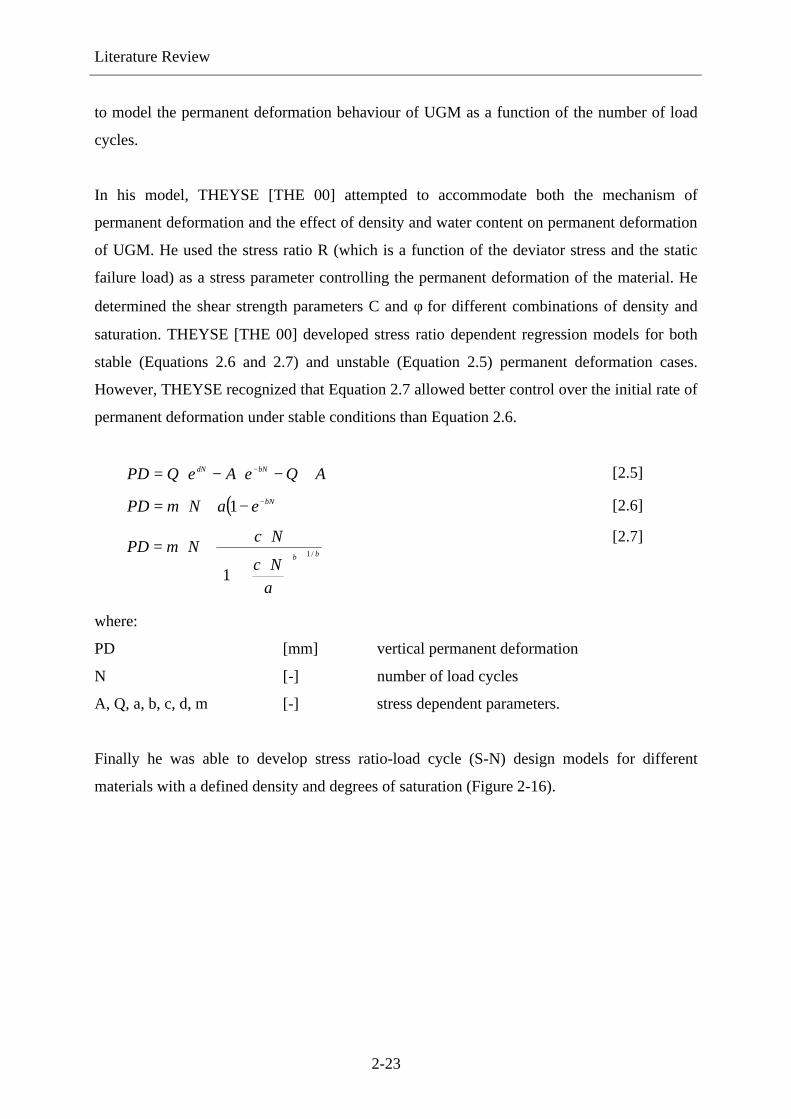
In his model, THEYSE [THE 00] attempted to accommodate both the mechanism of
permanent deformation and the effect of density and water content on permanent deformation
of UGM. He used the stress ratio R (which is a function of the deviator stress and the static
failure load) as a stress parameter controlling the permanent deformation of the material. He
determined the shear strength parameters C and φ for different combinations of density and
saturation. THEYSE [THE 00] developed stress ratio dependent regression models for both
stable (Equations 2.6 and 2.7) and unstable (Equation 2.5) permanent deformation cases.
However, THEYSE recognized that Equation 2.7 allowed better control over the initial rate of
permanent deformation under stable conditions than Equation 2.6.
AQeAeQPD bNdN +−⋅−⋅= − [2.5]
( )bNeaNmPD −−+⋅= 1 [2.6]
bb
aNc
NcNmPD /1
1
⋅
+
⋅+⋅=
[2.7]
where:
PD [mm] vertical permanent deformation
N [-] number of load cycles
A, Q, a, b, c, d, m [-] stress dependent parameters.
Finally he was able to develop stress ratio-load cycle (S-N) design models for different
materials with a defined density and degrees of saturation (Figure 2-16).

Literature Review
2-24
Stress Ratio
Figure 2-16. S-N design models for the clinker ash at 69 % relative density and 75 % saturation for different plastic strains [THE 00]
Similar to what SWEERE [SWE 90] found for his laboratory test results, the log-log approach
was also used by HUURMAN [HUR 97] to describe the permanent strain development (axial
and radial) in UGL in pavements under traffic (Equation 2.8). HUURMAN used a RLT
apparatus to determine the permanent deformation behaviour of different sands.
( )
−+
⋅= 11000
AN 1000N
DB
p eCN
ε [2.8]
where:
εp [%] permanent strain
e [-] base of the natural logarithm (= 2.17828….)
N [-] number of load cycles.
The first term of the model describes a linear increase of permanent strain with N on a log (εp)
- log (N) scales. The parameter A gives the εp at 1,000 load cycles and B gives the subsequent
slope of εp with rising number of load cycles. In the case of a stable behaviour the model
parameters C and D are equal to zero. It is clear, that the unstable behaviour at high stress
levels can not be described by the first term alone, because an exponential rather than linear
increase of εp with N on the same log (εp) - log (N) scales is observed. For this reason a

Literature Review
2-25
second term was added. This term is able to describe, through the values of the parameters (C
and D) at which value of N and at which value of major principal stress σ1/ major principal
failure stress σ1,f the incremental collapse will take place. The parameters A, B, C and D are
of course stress dependent. Equations 2.9 a-d are used to describe the model parameters as a
function of the σ1/ σ1,f - ratio. From RLT test results on several materials, VAN NIEKERK
[NIE 02] found that this model provides a good description of the measured permanent
strains.
2
f1,
11 s
saA
a
= ;
2b
f1,
11 s
sbB
= [2.9] a-d
2c
f1,
11 s
scC
= ;
2d
f1,
11 s
sdD
=
where:
a1, c1 [%] model parameters
a2, b1, b2, c2, d1, d2 [-] model parameters
N [-] number of load cycles
σ 1 [kPa] major principal stress
σ 1,f [kPa] major principal failure stress according
Equation 2.10
( )( )sinf1
cosfc2ssinf1s f3,
f1, −
⋅⋅+⋅+= [2.10]
where:
σ 3,f [kPa] minor principal failure stress
φ [°] angle of internal friction
c [kPa] cohesion
The magnitude of stress to which an UGM is subjected in relation to its maximum failure
stress, has been found to greatly influence its response to permanent strains.
2.4.4 Conclusions
As already described, HUURMAN, THEYSE and several other researchers in the past have
attempted to correlate repeated and static failure load test results. This approaches has
received mixed support, because the deformation behaviour of UGM is regarded as very

Literature Review
2-26
complex and the repeated and static load tests do not necessarily induce the same structural
response (Section 2.2.2). For this reason it is convenient to develop an empirical model that is
dependent on the number of load cycles and the stresses σ1 and σ3. However, the
HUURMAN–Model described earlier should form the basis for further investigations on the
permanent deformation behaviour of UGMs. This model uses one simple equation with few
parameters only to describe the permanent deformation behaviour in the stable range as well
as in the unstable range.

Repeated Load Triaxial Tests
3-1
3 REPEATED LOAD TRIAXIAL TESTS
3.1 Introduction
In order to study the behaviour of pavement materials, it is necessary to create testing
conditions as close as possible to those occurring in the pavement. Several simple in-situ
testing devices (e.g. static or dynamic loading tests) have been developed. California Bearing
Ratio tests (CBR) or plate bearing tests (current German test method) are currently being used
to predict the material behaviour of UGMs under static loading conditions (Chapter 1). Tests
such as Falling Weight Deflectometer (FWD) or dynamic plate bearing tests employ dynamic
loads which are closer to the actual traffic loading. The most realistic approach is the
application of a load to the pavement through a rolling wheel. This would provide the
optimum simulation of real traffic loads, using an accelerated time scale. The full-scale
pavement test facilities (accelerated loading tests) are divided into two different categories,
according to their design principles
• stationary facilities, e.g. circular and linear test tracks on test sections
• mobile facilities, e.g. Heavy Vehicle Simulator (HVS) or similar equipments on test
roads.
Two different machines that have been built with the purpose of applying accelerated wheel
loads on pavement sections of any type are briefly listed below. Normally such tests are
carried out on roads carrying conventional vehicular traffic. One of the two mobile linear
tracks is the Heavy Vehicle Simulator (HVS) developed at the end of the 1960s in the
Republic of South Africa and the other is the Accelerated Loading Facility (ALF) in use in
Australia since early 1984. Due to costs, full-scale testing can be carried out only on a very
limited number of combinations of pavement materials, subgrade materials, layer thicknesses,
climatic and loading conditions. In-service pavements experience a much wider spectrum of
these variables than is possible to impose in full-scale testing.
Even the most complete road test ever carried out, the AASHO road test, covered only one
subgrade type and one climatic condition. Furthermore for in-situ testing it is extremely
difficult to isolate and study the influence of different factors affecting material behaviour. It
can be concluded, it is desirable to study the fundamental material behaviour by simulating
field conditions using a laboratory test.

Repeated Load Triaxial Tests
3-2
As already mentioned in Section 2.2.1, the RLT test can simulate dynamic pavement loading
on UGMs when used as UGLs in pavement construction. It is possible to study the stress-
strain behaviour of UGMs under different conditions such as grading, density and moisture
content.
There are two test methodologies for conducting RLT tests, the constant confining pressure
test (CCP) and the variable confining pressure test (VCP). The main objective is to determine
the deformation behaviour of UGM under conditions that simulate the physical conditions and
stress states of these materials in the layers beneath the surface layer of a pavement subjected
to moving loads. This type of loading cannot be ideally simulated in the laboratory by CCP
type RLT tests, which have been commonly used in Europe since the 1970s. In CCP tests, it is
only possible to apply one constant stress path. The VCP type RLT test, offers the capability
to apply a wide combination of stress paths by pulsing both the confining pressure and the
vertical deviator stress. Such stress path loading tests better simulate actual field conditions,
since in a pavement structure the confining stresses acting on the UGM are cyclic in nature.
However, the VCP type RLT test (specimen size 150 x 300 mm) is a practicable testing
method for UGMs, which has been used in pavement layers, for nearly 3 years. Starting earlier
with the research, the studies had to be conducted using the CCP type RLT test at the
University of Nottingham.
3.2 Materials used in this Investigation
The objective of the laboratory test programme was to characterize the deformation behaviour
of UGM and to assess the suitability of existing mathematical models, with greater emphasis
on the so-called HUURMAN-Model [HUR 97]. A Sandy Gravel, a Diabase-material and a
Granodiorite-material were tested (Figure 3-3). The Sandy Gravel was taken from the
Ottendorf gravel pit. The Diabase-material and the Granodiorite-material examined were
taken from two different Saxon quarries located close to Dresden (Diabase - Friedrichswalde
quarry, Granodiorite – Pließkowitz quarry). The crushing technique used to produce the
Granodiorite-material and the Diabase-material is listed in Appendix A. The materials were
tested with two different gradings each, the Granodiorite-material only with one grading,
referred to as grading M (Figure 3-1 and Table 3-1). Gradings O and U are the upper and

Repeated Load Triaxial Tests
3-3
lower limits of the German specifications for UGMs [ZTVT-StB 95] as used in pavement
constructions.
The materials were sieved in the laboratory in the following 10 fractions: 0-0.125 mm,
0.125-0.25 mm, 0.25-0.71 mm, 0.71-2 mm, 2-5 mm, 5-8 mm, 8-11.2 mm, 11.2-16 mm,
16-22.4 mm, 22.4-31.5 mm.
The Proctor test is the reference test for density for basecourse materials. The Proctor test
yields the reference densities and moisture contents to which materials are to be compacted.
Normal Proctor tests were performed on all the materials used in this investigation to obtain
the densities to which the materials should be compacted in the RLT test. The Proctor tests
were conducted following DIN 18 127 – P 150 Y [DIN 18 127]. Specimens were compacted
in 3 layers, each receiving 22 blows of a 4.5 kg weight dropped over a height of 450 mm. A
test cylinder with a diameter of 150 mm and a height of 125 mm was used. By examining the
Proctor densities given in Figure 3-2 it can be observed that:
• Diabase-material with the grading M and O have very similar densities and moisture
contents. However, the finer upper limit (grading O) achieves the highest density.
• The Sandy Gravel and the Granodiorite-material achieves lower densities compared to
Diabase-material (grading M).
• The Sandy Gravel with the higher content of fines (grading M) achieves a higher density
than the Sandy Gravel with the lower content of fines (grading U).
• The Granodiorite-material with the grading M achieves an intermediate density, which is
similar to the Sandy Gravel with the same grading.

Repeated Load Triaxial Tests
3-4
Figure 3-1. Gradings of the materials used in this investigation
Figure 3-2. Normal Proctor test results of the materials used in this investigation according DIN 18127–P 150Y

Repeated Load Triaxial Tests
3-5
Sandy Gravel Detail surface (40-times magnified)
Diabase-material Detail surface (40-times magnified)
Granodiorite-material Detail Surface (40-times magnified) Figure 3-3. Coarse fraction samples and surface details of materials used in this investigation
Table 3-1 provides further details on the material test parameters. Investigations on the
resilient deformation behaviour of the same materials were carried out by NUMRICH
[NUM 03]. All the samples were prepared at one target degree of compaction

Repeated Load Triaxial Tests
3-6
(DOC = 100 %). The same material samples were used for testing at maximum ten times
(tests).
Table 3-1. DOC and moisture contents of the materials used in this investigation (RLT tests)
material grading DOC dry density
moisture content
saturation
[%] [g/cm3] [w.- %] [vol. %]
Granodiorite M 100 2.27 4.0 55
Sandy Gravel M 100 2.25 3.4 53
Diabase M 100 2.40 4.0 51
Sandy Gravel U 100 2.18 2.1 27
Diabase O 100 2.41 4.1 54
3.3 Testing Equipment
3.3.1 Sample Preparation
Specimens were prepared in a split mould (Figure 3-4), which holds a latex membrane firmly
pressed against its interior walls. Four studs were fixed to the membrane. These were later
employed to hold the instrumentation. The aggregate was placed in the membrane-lined
mould in 5 or more layers and compacted using a vibrating hammer with a tamping foot
attachment that had a diameter equal to the internal diameter of the compaction mould
(Figure 3-5). The surface of each layer was mechanically roughend before adding the next
layer on top; in this way a good layer interlook and a homogeneous sample was obtained. The
problem that arose during the compaction process was to carefully locate and maintain the
correct positions of the studs within the sample. To enable removal of the mould with
minimal disturbance to the sample, a partial vacuum was applied to the membrane
surrounding the compacted sample. This kept the membrane in tension and tightly held the
granular specimen intact. A second membrane was then placed over the specimen in order to
seal the specimen from any leaks that may have developed in the first membrane caused by
the compaction process. The instrumentation was then fixed through the two membranes to
the studs and the completed specimen was placed within the test cell. The partial vacuum was
then replaced by the triaxial confining pressure and the specimen was thus ready for testing.

Repeated Load Triaxial Tests
3-7
Figure 3-4. Split mould
Figure 3-5. Sample preparation [BOY 76]

Repeated Load Triaxial Tests
3-8
3.3.2 Repeated Load Triaxial Apparatus
The RLT apparatus used in this research work was developed at the University of Nottingham.
The principal components of the RLT apparatus are illustrated in Figure 3-6. The axial load is
capable of applying a vertical stress up to 1,200 kPa on samples of 150 mm diameter and 300
mm height. As the test proceeds, the sample undergoes both vertical and radial deformations.
In order to minimise the end effects (friction between the particles and the end-platens) two
LVDTs were used to measure axial deformations at 1/4 and 3/4 of the sample height.
In there investigations only the vertical deformations where measured, because the system to
measure the radial deformations was found not to be reliable. Furthermore fixing the hoops
was occasionally found to disturb the studs.
Cell pressure sensor
LVDTs
Hoops
Sample
Load priston Cell pressure valve
Membranes Load Cell
Studs
Figure 3-6: RLT apparatus at the University of Nottingham [WER 01]

Repeated Load Triaxial Tests
3-9
Figure 3-7: Triaxial specimen under vacuum with the measurement equipment
For the RLT tests the constant confining pressure (applied via pneumatic pressure) was set at
levels of 70, 140, 210 and 280 kPa. After the confining pressure had been reached, additional
dynamic (frequency = 5 Hz) vertical stress (deviator stress) pulses were applied. The RLT
tests were carried out with axial stress pulses having stress ratios (σD/σc) from 0,5 to 11.
Figure 3-8 shows the test stress paths for the RLT testing.
Figure 3-8. Stress paths
Ver
tical
str
ess
σ 1m
ax=
σ D+
σ c
Confining pressure σc
Hydrostatic stress σ1max= σc
Deviatoric stress σD
σ1max = σD + σc
σc

Repeated Load Triaxial Tests
3-10
Half sine load pulses were applied to the test specimens, with each load cycle consisting of a
50 % loading phase followed by a 50 % neutral phase (Figure 3-9). To define the peaks
exactly, 80 reading points were measured (64 reading points during the loading phase and 16
reading points during the neutral phase), as shown in.
Figure 3-9. Phases of a load cycle
As mentioned in Chapter 2, several researchers have argued that there is a relationship
between permanent strain under repeated loading and the static shear strength of the material.
The parameters of several earlier models were dependent on the static shear strength. For this
reason, static failure tests were also performed at the same levels of confining pressure as in
the RLT test. The constant loading rate during the static tests was 5 kPa/s.
3.3.3 Principle of Measurement
The total strains consisted of three parts:
• hydrostatic strains (permanent)
• resilient strains
• permanent strains (Figure 3-10).
Figure 3-10: Components of strain
The permanent hydrostatic strain part was not considered, because the magnitudes of these
load phase
neutral phase
load cycle
permanent hydrostatic strain
stra
in
time
permanent strain
resilient strain

Repeated Load Triaxial Tests
3-11
strains were too low for an accurate measurement.
A computer with the control software ATS (Automated Testing System) was used to register
the test measurements (vertical deformations) and other test parameters such as number of
load cycles, time, confining pressure and deviatoric stress. As already reported by GLEITZ
[GLE 96], analysis of the test results was not carried out by the ATS software. This software
takes the peaks of the deformation line as the basis of the test results. The analysis method
adopted in this investigation was developed by KIEHNE [KIE 01] that takes the average value
over the five maximum and minimum values of deformations (Figure 3-11).
0,38
0,39
0,4
0,41
0,42
0,43
0,44
0,45
0,46
0,47
0,48
79 79,1 79,2 79,3 79,4 79,5Time [s]
ATS
-ana
lysi
s
char
acte
ristic
val
ue
Ver
ticca
l def
orm
atio
n [m
m]
Figure 3-11: Measured deformations

Test Results
4-1
4 TEST RESULTS
4.1 Introduction
The test programme was planned with the primary aim of characterising the development of
cumulative permanent strain with number of load applications and its variation with stresses.
It was decided to follow as far as possible the test programme recommended by
prEN 13 286-7 [prEN 13 286-7]. The details of the test programme are listed in Appendix A.
Each RLT test consisted of the application of a single stress path to one specimen. The tests
were executed with a target number of load cycles ranging from 80,000 to 2,000,000 cycles. In
the following chapters, the RLT test results obtained from the Granodiorite-material samples
will be presented. Finally, a deformation behaviour model will also be introduced.
4.2 Permanent Deformation Behaviour
Figure 4-1 shows permanent deformation results at a constant confining pressure of 140 kPa
for a range of deviator stress levels. It can be clearly seen that with increasing deviator stress
levels the magnitude of accumulated permanent strains also increase. Even at small stress
levels all tests experienced some permanent strain. At high stress levels test specimens have
achieved failure. Further test results are listed in Appendix B.
Figure 4-1. Vertical permanent strains versus number of load cycles, log-log scale
(Key G = Granodiorite, σc _σD (both in kPa))

Test Results
4-2
DAWSON et. al. [DAW 99, WER 01, WER 02-01, WER 02-02] reported a new method of
presenting permanent deformation results. They suggested plotting the permanent vertical
strain rate (per cycle of loading) versus the permanent vertical cumulative strain. Figure 4-2
shows the data for a Granodiorite-material plotted in this manner. Three types of permanent
strain accumulation were observed (labelled A, B and C in Figure 4-2), which are easily
identified by their shapes/ slopes. All tests experienced some permanent strain, thus none of
the results showed behaviour in Range 0, i.e. “purely elastic” behaviour as suggested earlier in
Figure 2-13. Probably, this type of response does not occur in UGLs in pavements. In
pavements, evidence of the non-existence of a purely elastic behaviour is abundantly available
in the form of post-compaction permanent strain.
Figure 4-2. Vertical permanent strain rate versus vertical permanent strains, log scale (Key G = Granodiorite, σc _σD (both in kPa))
4.2.1 Range A – Plastic Shakedown Range
The line in Figure 4-3 shows the development of permanent strain versus number of load
cycles for a typical Range A material behaviour. Here the response is plastic for a finite
number of load applications, but after completion of the post-compaction period the response
becomes entirely resilient and no further permanent strain occurs (Figure 4-4).

Test Results
4-3
Figure 4-3. Vertical permanent strain versus number of load cycles – Range A
Granodiorite, σD = 140 kPa, σc =140 kPa
In Figure 4-2 this behaviour plots as a convex-downwards line (labelled ‘A’) because the
permanent strain rate progressively decreases (see also Figure 4-4), effectively halting any
further accumulation of strain and leading to an asymptotic final (vertical) permanent strain
value. For this range, Figure 4-2 shows that the level of accumulated strain depends on the
load level (deviator stress). Detailed inspection of the individual test results shows that the
number of cycles required, before plastic strain ceases, increases with an increase of load
level.

Test Results
4-4
Figure 4-4. Vertical permanent strain rate versus number of load cycles, log scale – Range A
Granodiorite σD = 70 kPa, σc = 140 kPa
The materials in an UGL under such stress conditions as part of a pavement would come to a
stable equilibrium behaviour in response to the loading [SHA 84, COL 93], i.e. the material
‘shakes-down’. Range A behaviour is therefore permitted in the pavement provided the total
accumulated strain is sufficiently small.
4.2.2 Range C – Incremental Collapse
Lines like those shown in Figure 4-5 (decreasing resilient strains) and Figure 4-6 (increasing
resilient strains) indicate continuing incremental permanent deformation with each additional
stress cycle. Thus, in both cases, the response is always plastic and each stress application
results in a progressive increment in the magnitude of permanent strain. The initial behaviour
as shown in Figure 4-6 is probably the same as that shown in Figure 4-5, but compressed into
a fewer number of stress applications as a consequence of the much higher cyclic stress level
applied.

Test Results
4-5
Figure 4-5. Vertical resilient and permanent strains versus number of load cycles - Range C
Granodiorite, σD = 840 kPa, σc = 210 kPa
Figure 4-6. Vertical resilient and permanent strains versus number of load cycles - Range C
Granodiorite, σD = 840 kPa, σc = 140 kPa

Test Results
4-6
It was observed that:
• The permanent strain rate depends on the load level applied (Figure 4-2).
• The strain rate decreases very slowly in Ranges A and B, or not at all.
• If the applied load level approaches the (assumed) monotonic failure load, there is only a
small decrease in incremental strain rate during the first few load cycles (Figure 4-2).
• The beginning of the failure process can be recognized by an increasing rate of permanent
strain development following a period of decreasing strain-rate (Figure 4-7) after which
strain-rate levels remain high (Range C). There is no cessation of strain accumulation.
Figure 4-7. Vertical permanent strain rate versus number of load cycles, log scale – Range C
Granodiorite, σD = 840 kPa, σc = 140 kPa
Range C behaviour in an UGL of a pavement would result in failure of the pavement by shear
deformation in the UGL and/or probably by overstressing the bound layers. This would
manifest in the form of rutting and/or cracking at the pavement surface. In a well-designed
pavement, UGMs should not be allowed to experience Range C behaviour. It is also possible
that Range C behaviour will only appear locally in the UGL. If so, no deformation in the UGL
will propagate to the pavement surface, because the bound layers will bridge these zones
whilst they remain less than a certain size. Further investigations are necessary before this
approach can be included into an analytical design process.
4.2.3 Range B – Intermediate Response – Plastic Creep

Test Results
4-7
Lines like those in Range B in Figure 4-2 show an intermediate response. Following an initial
period of high levels of permanent strain rate during the first load cycles, the strain rate
decreases to a low, nearly constant level. The number of load cycles required before reaching
this constant level of strain rate depends on the material and the load level. This number of
load cycles may mark the end of post-compaction. Because of the almost constant level of
strain rate, a near-linear rise of permanent strain is observed for tests with 100,000 load cycles
(Figure 4-1). A test carried up to 850,000 load cycles showed that a further increase of
permanent deformation continues to occur beyond 100,000 cycles with a growing number of
load cycles (Figure 4-8). In Figure 4-9 a slow increase of the permanent strain rate occurred
after about 380,000 load cycles. At 850,000 load cycles the sample approaches, like tests in
Range C, an incremental collapse.
Figure 4-8. Vertical permanent and resilient strains versus number of load cycles – Range B
Granodiorite, σD = 280 kPa, σc = 140 kPa
KOLISOJA [KOL 98] conducted RLT tests on a crushed rock and found similar results. He
observed that although the behaviour of an aggregate during the first 100,000 cycles looks like
stabilising, it can progress to failure if cycling at the same load level is continued long enough
(Figure 2-7).

Test Results
4-8
Figure 4-9. Vertical permanent strain rate versus number of load cycles, log scale – Range B
Granodiorite, σD = 280kPa, σc = 140kPa
4.3 Resilient Deformation Behaviour
It can be observed (Figure 4-10) that both Range A and B specimens exhibit a constant level
of resilient strain during RLT tests and that the level of resilient strain depends on the stress
level. If the material comes to an incremental collapse, as in Range B, the resilient strains will
slowly increase (Figure 4-8).
On the other hand, a significant decrease in resilient deformation is initially observed with an
increasing number of stress cycles in Range C. If the cyclic stress level exceeds the static
failure line, following the initial decrease in resilient deformation, an increase of resilient
deformation with further increasing number of stress cycles will occur (Figure 4-6).

Test Results
4-9
Figure 4-10. Vertical resilient strains versus number of load cycles (Key G = Granodiorite, σc _σD (both in kPa))
Although Figure 4-2 shows a fairly clear distinction between Range B and Range C
behaviour, this is not always the case. When the distinction between the ranges is not clear,
plotting the resilient stain response against the number of cycles, as in Figure 4-10, allows the
responses to be separated.
Differences in resilient deformation behaviour can be found in Ranges A and B. By re-plotting
the Range A and B data from Figure 4-10 in the form of average vertical resilient strains vs.
stress ratio, Figure 4-11 is obtained. Within Range A, the resilient deformations increase at a
diminishing rate with rising stress ratios, i.e. a stiffening non-linear response to deviator
stress. With a further increase in stress ratio, a rapid increase in resilient deformation is
observed on the transition towards Range B. Upon entering Range B, the rate of increase of
resilient deformations slows down once again. Because of this, a two stage resilient response
is observed. Figure 4-11 indicating that the deformation behaviour in Range A and B are
different in type. The transition from Range A to B occurs at nearly the same level of resilient
deformations for all the aggregate types investigated. The observed boundaries between Range
A and B (Figure 4-11) are similar to the ones obtained from the permanent deformation
behaviour (for example Figure 4-2). However further test are required to support this
observations.

Test Results
4-10
Figure 4-11. Vertical resilient strains versus stress ratio, Granodiorite
4.4 Static Triaxial Tests
The strength of an UGM depends primarily on the confining pressure σc applied on the
material. Static Triaxial (ST) tests were performed on the Granodiorite-material at three
different confining pressures σc. The results of the ST tests were plotted on a τ - σ diagram
and the results are shown in Figure 4-12.
To obtain the parameters for the models that are required for determining the shakedown
limits, and to minimise the number of RLT tests, it would seem possible to conduct failure
tests at different confining pressures and RLT tests at different deviatoric stresses at the same
confining pressure. Thus the testing effort would be minimized, since the execution of RLT
tests requires a high time expenditure (e.g. a RLT test with 300,000 load cycles at a frequency
of 5 Hz requires 16,6 hours). On a Sandy Gravel (rounded grains) this approach is workable,
because a static failure line can be determined [WER 03-1]. HUURMAN [HUR 97] obtained
suitable ST test results on different sands. On the other hand for the ST tests on crushed
materials (Granodiorite-material) it was not possible to define failure so readily.

Test Results
4-11
0
100
200
300
400
500
600
700
0 100 200 300 400 500 600 700 800 900 1000
Principle stress [kPa]
Figure 4-12. Results of ST tests, Granodiorite
4.5 Deformation Behaviour Model of Unbound Granular Materials
By considering the observed behaviours described earlier, it can be seen that Figure 2-13 is
not a good representation of the behaviour of UGMs. Instead, Figure 4-13 is introduced as a
summary of the observed response types. The response can be divided into three ranges:
A Plastic Shakedown
B Plastic Creep
C Incremental Collapse.
Observations of the resilient response at the end of testing within Range A reveal a small
hysteresis loop, i.e. a purely elastic behaviour does not occur. Range C behaviour seems
equivalent to the Range 3 behaviour in Figure 2-13, and such a response was clearly replicated
during RLT tests.

Test Results
4-12
Lo
ad
Plastic Shakedown
Plastic Shakedown-Limit
Plastic Creep-Limit
Incremental collapse Plastic creep Strain
Increasing strain rate at a low number of load cycles
Decreasing strain rate
Decreasing strain rate
Increasing strain rate at a high number of load cycles
Figure 4-13. Behaviour of UGMs under repeated cyclic load
Range B is the intermediate behaviour, which was observed over a range of stress states.
Initially the behaviour is similar to Range A behaviour but a small residual incremental
permanent strain is observed, yet without stiffening (without strain hardening). It should be
noticed that the original shakedown explanation (Figure 2-13) assumes that the material is
loaded equally in tension and in compression during each cycle. Clearly, the no-tension ability
of a UGM precludes this. Thus the recovery part of the hysteresis loop does not take place at
the tension stress level but instead, under a very low compression.
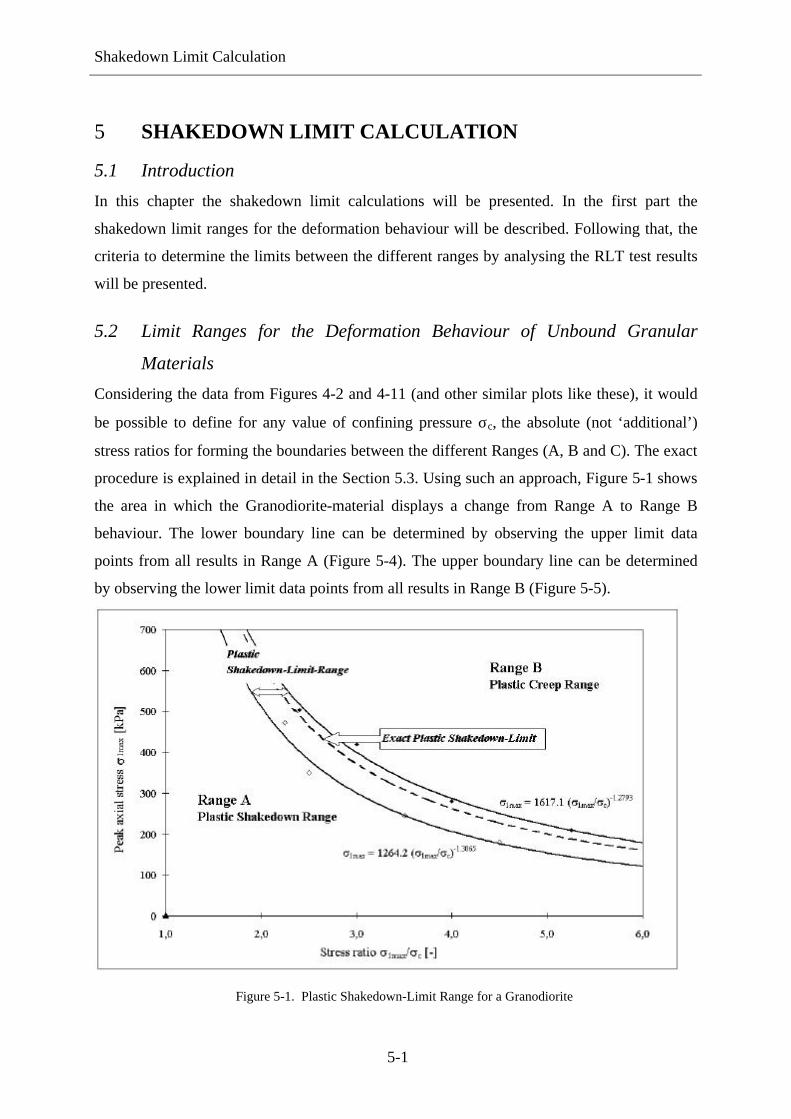
Shakedown Limit Calculation
5-1
5 SHAKEDOWN LIMIT CALCULATION
5.1 Introduction
In this chapter the shakedown limit calculations will be presented. In the first part the
shakedown limit ranges for the deformation behaviour will be described. Following that, the
criteria to determine the limits between the different ranges by analysing the RLT test results
will be presented.
5.2 Limit Ranges for the Deformation Behaviour of Unbound Granular
Materials
Considering the data from Figures 4-2 and 4-11 (and other similar plots like these), it would
be possible to define for any value of confining pressure σc, the absolute (not ‘additional’)
stress ratios for forming the boundaries between the different Ranges (A, B and C). The exact
procedure is explained in detail in the Section 5.3. Using such an approach, Figure 5-1 shows
the area in which the Granodiorite-material displays a change from Range A to Range B
behaviour. The lower boundary line can be determined by observing the upper limit data
points from all results in Range A (Figure 5-4). The upper boundary line can be determined
by observing the lower limit data points from all results in Range B (Figure 5-5).
Figure 5-1. Plastic Shakedown-Limit Range for a Granodiorite

Shakedown Limit Calculation
5-2
In fact the difficulty remains in calculating the exact shakedown load (plastic shakedown limit
line as in Figure 5-1). Therefore it was decided, to take the average value between the upper
and lower boundaries. A relationship to define the limits of the range boundaries is proposed
as follows:
ß
max1max1 s
sas
⋅=
c [5.1]
where:
σ 1 max [kPa] peak axial stress = (σD + σc)
σc [kPa] confining pressure
α [kPa] material constant
β [−] material constant.
Analysis of the results from many permanent deformation RLT tests revealed an exponential
relationship (Equation 5.1) between the applied stresses (σ1max/σc) and the boundaries of the
various deformation responses (i.e. between Ranges A, B and C). Using Equation 5.1 it is
possible to deduce the shakedown limit even at small stress ratios (Figure 5-2). At low levels
of confining pressure the material requires a high stress ratio for it to change from Range A to
B. With increasing confining pressure the stress ratio defining the boundary between Ranges
A and B decreases. This means that as the magnitude of confining pressure increases, the
deviatoric stress has a disproportionately larger influence on the vertical deformation
compared to the confining pressure.

Shakedown Limit Calculation
5-3
Figure 5-2. Exact plastic shakedown and plastic creep-limits for the Granodiorite
The parameters α and β are likely to depend on several factors including the grading, particle
shape, particle surface, DOC and the moisture content of the UGMs. Further research is
required to define these factors more precisely but for conservative calculations, the lower
boundaries for the ranges should be used (Figure 5-1). For the materials investigated, the
following limits were determined (Table 5-1).
Table 5-1. Plastic shakedown and plastic creep-limits
material plastic shakedown-limit plastic creep-limit
Granodiorite, grading M σ1max = 1421.2 (σ1max/σc) −1.217 σ1max = (2291.9 σ1max/σc )−0.8071
Sandy Gravel, grading M σ1max = 7120.2 (σ1max /σc)−2.7671 -
Sandy Gravel, grading U σ1max = 6373.2 (σ1max /σc)−2.5786 -
Diabase, grading O σ1max = 1509.1(σ1max /σc)−1.2405 -
Diabase, grading M σ1max = 1509.1(σ1max /σc )−1.2405 σ1max = (1939.9 σ1max/σc )−0.7747
To minimise the number of RLT tests required to define the shakedown limits, it would seem
possible to carry out Multi Stage (MS) tests at different confining pressures. Thus the testing
effort would be minimized, since as mentioned earlier the execution of RLT tests is very time
consuming. The MS procedure (CCP) works in applying different stress paths, with constant
confining pressure, on the same specimen. The test will usually start by applying 10,000 load

Shakedown Limit Calculation
5-4
cycles at the selected confining stress and the lowest deviatoric stress. Then, the cyclic loads
are applied with 10,000 cycles at selected higher stress levels until the sample fails
(Figure 5-3) .
Figure 5-3. Example for Multi-Stage test procedure
5.3 Criteria for Shakedown Ranges
To assign single tests results to the Ranges A, B or C it is necessary to define the limit criteria.
These criteria should be applicable to all RLT test results of different UGMs. As a practical
method of defining the range boundaries (which define the stress conditions at which the type
of permanent strain response changes) and hence, the material parameters for Equation 5.1,
RLT tests were performed on a series of specimens at increasing σ1max/σc ratios. An approach
was required which also worked with tests requiring 10,000 load cycles. This number of load
cycles has been fixed for MS testing in the prEN 13286-7 [prEN 13286-7]. Three types of
permanent strain accumulation were observed (see Chapter 4), which could be identified
easily by their shapes especially during the first few thousand load cycles. In addition the
permanent strain rate development of all RLT test results was analysed (e.g. Figure 4-2). All
the RLT test results were assigned to the Ranges A, B and C by the visual inspection of their
shapes/ slopes (see Figure 4-2). The determination shakedown range limits, which were
calculated, based on these observations are described in the following sections.
Number of load cycles
Perm
anen
t str
ain
σ1/σc=2
σ1/σc=3
σ1/σc=4
σ1/σc=5
σc= constant
10,000 30,000 20,000

Shakedown Limit Calculation
5-5
5.3.1 Criteria Range A-B
As mentioned earlier, Figure 5-1 shows the area in which the Granodiorite-material displayed
a change from Range A to Range B behaviour, with the upper and the lower boundaries being
derived from plastic data (such as in Figure 5-4 and Figure 5-5). Especially during the first
5,000 load cycles, different permanent strain rates in the Ranges A, B and C were to observe.
The following approach to define the limiting line between Ranges A and B was adopted for
the tested materials.
When the vertical permanent strain accumulated from 3,000 to 5,000 load applications was
equal to 0.045 * 10-3 strains, the Range A-B boundary (the “plastic shakedown limit”) was
defined (Figure 5-4 and Figure 5-5):
Range A εp1 5,000 – εp
13,000 < 0.045 * 10-3 [5.2]
Range B εp1 5,000 – εp
13,000 > 0.045 * 10-3 [5.3]
where:
εp1 5,000 [10-3] accumulated vertical permanent strains at 5,000 load cycles
εp1 3,000 [10-3] accumulated vertical permanent strains at 3,000 load cycles.
Figure 5-4. Vertical permanent strain-rate versus confining pressure for the tested materials - Range A

Shakedown Limit Calculation
5-6
Figure 5-5. Vertical permanent strain-rate versus confining pressure for the tested materials - Range B
5.3.2 Criteria Range B-C
When the vertical permanent strain accumulated from 3,000 to 5,000 load applications was
equal to 0.4 * 10-3 strain (Figure 5-5 and Figure 5-6), the Range B-C boundary (the “plastic
creep limit”) was defined:
Range B εp1 5,000 – εp
13,000 < 0.4 * 10-3 [5.4]
Range C εp1 5,000 – εp
13,000 > 0.4 * 10-3 [5.5]
where:
εp1 5,000 [10-3] accumulated vertical permanent strains at 5,000 load cycles
εp1 3,000 [10-3] accumulated vertical permanent strains at 3,000 load cycles.

Shakedown Limit Calculation
5-7
Figure 5-6. Vertical permanent strain-rate versus confining pressure for the tested materials - Range C
The Ranges B and C can be also identified by observing the development of resilient strains
during the first 10,000 load cycles, e.g. Figure 4-10. If the resilient strains are nearly constant
during the first 10,000 load cycles, than the material at this stress state will behave according
to Range A or B behaviour. If the resilient strains are not constant/stable with increasing load
cycles, then the material will behave corresponding to Range C (see Section 4.3). By adopting
these criteria (Equation’s 5.2 to 5.5), it is possible to assign single test results to the Ranges A,
B or C.
5.4 Conclusions
Analytically it is possible to estimate peak stresses in an UGL caused by vehicular loading. If
the shakedown limit approach is sustainable, then the method of defining the limit, together
with a pavement analysis, can provide a means of designing pavements such that the peak
stresses induced never exceed the value that would generate unstable behaviour. Thus a
criterion to prevent excessive rutting within UGL could be feasible (see Chapter 8).
As there is an associated change in resilient behaviour for materials operating in the various
ranges, it is recommended that the observed distinctive materials response in Ranges A, B and

Shakedown Limit Calculation
5-8
C should form the basis for modelling permanent and resilient deformation behaviour. Thus
material laws have to be developed for each separate range (see Chapter 6).
If the plastic shakedown limits of different materials were to become available, then ranking
or comparison of different materials becomes possible by comparing the shakedown limit
curves for the different materials whilst taking into consideration the prevalent climatic
conditions (e.g. moisture content of the UGL) and the elastic properties of the materials.
Using this method it is possible to compare and assess the suitability of different materials
used in UGLs in pavement constructions (see Chapter 7 and 8). On the basis of this research,
an approach has been proposed and included in the Informative Annex of prEN 13286-7
[prEN 13286-7] for ranking materials.
Figure 5-6. Ranking of materials
Stress ratio σ1 max/σc
Peak
axi
al s
tres
s σ
1max
Range B
Range A
Plastic Shakedown Limit
material Y
Plastic Shakedown Limit
material X
Modelling Permanent Deformation Behaviour
6-1
6 MODELLING PERMANENT DEFORMATION BEHAVIOUR
6.1 Introduction
This chapter describes the modelling of the permanent deformation behaviour. There are two
different methods to model the deformation behaviour
• macromechanical method
• micromechanical method.
The micromechanical method describes the deformation behaviour including aspects like
friction between the grains, particle shape, density, grain abrasion, grain crushing, etc. Using
the Distinct-Element-Method (DEM) originally developed by CUNDALL [CUN 96] it is
possible to model materials that consist of individual grains or particles where the grains roll
or slide on other grains. The DEM works in small increments of time, where by in each time
increment the displacements of each grain are calculated. However, the modelling of
pavement constructions with the DEM for a large number of load repetitions is not possible
because of the prohibitively large computing capacity required. Furthermore micromechanical
characteristics and processes are not yet fully understood.
For macromechanical modelling there are different methods available. One method is to
develop the macromechanical model in combination with the characterization of the
micromechanical processes in the grain assembly. The other way is to define the model in a
purely empirical manner. The deformation behaviour in the “black box” can only be predicted
with sufficient accuracy if the fundamental mechanical interrelations of the deformation
behaviour are known. For this reason, it becomes inevitable that the deformation behaviour of
the granular material is described in combination with the micromechanical processes.
6.2 Micromechanical Processes
When considering the micromechanical behaviour, it is necessary to describe the deformation
behaviour for each range separately because different deformation processes arise. In the
following paragraphs the micromechanical processes in each range will be described.
6.2.1 Micromechanical Processes in Range A
At low levels of stress (i.e. Range A macro behaviour) the initial post-compaction (Phase I -
volumetric response – increase of density) and permanent strain are most probably due to

Modelling Permanent Deformation Behaviour
6-2
limited particle re-orientation and breakage. There may be a little inter-particle attrition but
this is expected to be insignificant. During the post-compaction period the curve describes a
significant increase of εp on a log (εp) vs. log (N) plot (Figure 6-1).
Figure 6-1. Vertical permanent strain versus number of load cycles, σD = 210 kPa, σc = 210 kPa, Range A
With additional load cycles (Phase II) the magnitude of permanent deformations are reduced
owing to the fact that the grain assembly has already been rearranged during the first load
cycles. Once the point of nearly pure resilience has been reached, the cyclic strain behaviour
must be due only to the deformation of the single grains and to very limited recoverable
particle rotations. During Phase II the curve describes a linear increase of εp on a log (εp)
versus log (N) plot (Figure 6-1). However, a small amount of particle rearrangement (small
amount of plastic strains) still takes place but at a progressively slower rate as the number of
load cycles increases. During this phase no important changes in the deformation behaviour
can be observed. In fact no significant changes to the hysteresis loops have been recognized
during this phase. Towards the end of the tests, the hysteresis loops are open which means
that energy still dissipates. With increasing stresses the hysteresis loops become more
stretched.
The shape of the hysteresis loop at 270,000 load cycles can be obtained by investigating the
sphere-theory of HERTZ (compare Figure 2-6 and Figure 6-2).

Modelling Permanent Deformation Behaviour
6-3
0
50
100
150
200
250
0 0.1 0.2 0.3 0.4 0.5 0.6 0.7 0.8 0.9 1 1.1 1.2 1.3
Vertical strain [10 -3 ]
N = 5 30 270,000 1,000
Figure 6-2. Hysteresis loops σD = 210 kPa, σc = 210 kPa, Range A
Grain abrasion will always take place independent of the stress level. The surface texture of
particles is altered in this process. Therefore, these repeated applications of stress must, in
essence, be non-damaging. The system thus achieves a stable arrangement.
6.2.2 Micromechanical Processes in Range B
At greater imposed stress levels (i.e. Range B macro behaviour) similar micro-scale behaviour
is proposed. However, the constant rate of accumulation of plastic strain as experienced in
Range A but with wider resilient hysteresis loops (indicating greater energy loss per cycle of
loading - Figure 6-5) suggests that after post-compaction rearrangement (Phase I –
Figure 6-4) any initial particle breakage, inter-particle slip and continued frictional energy
loss is now associated with ongoing damage. Given the slow rate of plastic strain
accumulation which is observed during Phase II and hence the slow rate of damage that is
inferred, it seems probable that this damage is more likely due to particle contact attrition
rather than particle breakage. To prove this fact, the grading before and after testing was
determined. Figure 6-3 shows clearly the increase of the fines content after compaction and
testing. Little grain crushing could be observed as well (Figure 6-3), probably as a result of
the grain crushing during compaction (visible observations during compaction process).

Modelling Permanent Deformation Behaviour
6-4
However, an exact distinction of fines produced (amount of fines) as a result of compaction or
testing was not possible.
Figure 6-3. Variation in grading M before and after testing, Granodiorite
Figure 6-4. Vertical permanent strain versus number of load cycles, σD = 280 kPa, σc = 140 kPa, Range B

Modelling Permanent Deformation Behaviour
6-5
Particle breakage is probably of minor importance. The resilient strain behaviour must be due
to deformation of the single grains, recoverable particle rotations and additional recoverable
slip between particles.
Once a constant level of resilient strain is reached in Ranges A and B (Figure 4-10), a small
permanent deformation rate can be observed (Figure 4-2). The ongoing, low-level and
constant rate of damage would be expected to be linked with a constant resilient behaviour
only if the condition of the particle contacts at the end of a cycle is the same as it was at the
beginning. For this to be the case it is necessary to postulate that the small amount of damage
debris being generated during each cycle must be taken out of active participation in the
overall material response as they become displaced and migrate towards layer voids within
the coarser aggregate skeleton. If this is the case, a constant volume (or even slightly
compressive) plastic strain response might be anticipated under such circumstances.
The above explanations can also help to provide an illustration for the change of stiffness with
stress as seen in Figure 4-10. During Range A behaviour and during Range B behaviour an
increasing stiffness can be observed with increasing stress. This can be conveniently
explained in terms of the contact theory of Hertz [HER 82] (see Section 2.2.2). Therefore the
displacement between the particles does not increase as fast as the externally applied stresses
and a convex stress strain curve results as seen in Figure 4-11 within Range A and within
Range B.
0
100
200
300
0 0,2 0,4 0,6 0,8 1Standardize vertical deformation [10-3]
N = 600,000
N = 850,000
Confining stress = 140 kPa
N = 300,000
Figure 6-5.Hysteresis loops, σD = 280 kPa , σc = 140 kPa - Range B
Modelling Permanent Deformation Behaviour
6-6
Taking the above micromechanical explanation concerning the difference between Range A
and Range B behaviours it will be evident that the response to each cycle of loading in Range
B must include the effects of recoverable particle rotations and of additional recoverable slip
between particles - an effect not experienced in Range A. Thus we expect to see some
discontinuity in the stiffness-stress curve on transition from Range A level stresses to Range
B level stresses. This behaviour is indeed seen in Figure 4-11. Once within Range B we
would expect to, and do see the Hertzian stiffening response once again.
In the case of Range B response, as shown in Figure 6-4, it is clear that after many phase II
cycles, during which the plastic strain-rate remained small, the plastic strain rate begins to
increase again (Phase III). Therefore it seems likely that the grain attrition contribute to
collapse. According to this understanding, the resistance to friction between the grains, and
also the angle of internal friction, are decreasing. This may readily be explained in terms of
the generated attrition fines having filled the available pore space are thus beginning to
remain in the regions of particle contacts, thereby causing a deterioration of the contact
properties. Dilatation which occur at high stresses [NIE 02] probably affect the collapse.
HOFF [HOF 99] observed during RLT test that depending on the applied stress level the
sample will increase more or less in volume during testing after a certain number of load
cycles. This volume increase is assumed to be mainly related to the shear induced dilatancy.
However, volume change could not measured at the Nottingham equipment. To prove this
hypothesis, volume measurements during the testing are required (see also Chapter 8).
6.2.3 Micromechanical Processes in Range C
At even higher externally imposed stress levels a different mechanism must be in play. The
plastic strain rate never drops to a low level. Once again, during the first load cycles (post-
compaction period), primary creep occurs (Phase I - volumetric response). In analogy to
Range B, we can also recognize Phase II, but for a smaller number of load cycles. Phase II is
followed by Phase III – tertiary creep (Figure 6-6).

Modelling Permanent Deformation Behaviour
6-7
Figure 6-6. Vertical permanent strain versus number of load cycles, σD = 840 kPa, σc = 210 kPa, Range C
The hysteresis loops are always large, indicating significant energy loss per cycle. Thus a
greater degree of damage must occur almost from the outset of repeated load application as
has been evident under Range A and B behaviours. Particle re-orientation and slip between
particles would provide such an explanation.
In Range C it is probable that both grain abrasion and particle crushing occur. Particle
crushing occurs if the applied load exceeds the strength of the grains. This particle crushing
would then allow a relatively large-scale particle re-orientation resulting in a non-stable
aggregate skeleton so that the observed large plastic strain rates become credible. It is likely
that the permanent deformation behaviour in Range C depends on the visible roughness of
particles and probably on the grain strength, while the resilient deformation principally
depends on the number of grain contacts and frictional resistance at the particle contact
points.
In Range C there are two different resilient processes (decreasing and increasing resilient
strains) to explain, depending on the applied stress level. The dissimilar shapes of the
hysteresis loops indicate that different mircromechanical processes must be in play
(Figure 6-7 and Figure 6-8).

Modelling Permanent Deformation Behaviour
6-8
If rearrangement of the grains (grains begin to slide, when the tangential component of the
contact force induced by the stresses applied to the particle system exceeds the maximum
value of the frictional force at the contact point [KOL 97]) has allowed a denser structure to
develop (e.g. Figure 6-7), the number of grain contacts will increase. This helps to explain
why, with respect to resilient strains, which are decreasing, this behaviour can be associated
with a stiffening response. Incremental collapse will follow caused probably again like in
Range B by dilatation.
Figure 6-7.Hysteresis loops, σD = 840 kPa , σc = 210 kPa, decreasing resilient strains - Range C
If the resilient strains are increasing from the beginning, rapid plastic collapse is occurring
(e.g. Figure 6-8). In this extreme case the grain skeleton cannot be stabilised with respect to
the external loading at all. As a result, the grain skeleton of the system fails (caused by
dilation) resulting in an unlimited strain increase – loss of strength.

Modelling Permanent Deformation Behaviour
6-9
Figure 6-8. Hysteresis loops, σD = 840 kPa , σc = 70 kPa, increasing resilient strains - Range C
6.3 Plastic DRESDEN-Model
The DRESDEN-Model for UGMs consists of two parts – the elastic part and the plastic part.
The elastic part of the model, which is described in some detail in Section 8.2.3, was
developed mainly by WELLNER [WEL 94], GLEITZ [GLE 96] and NUMRICH [NUM 03]
at Dresden University of Technology. The plastic part of this model was developed within
this research.
In Section 2.4.2 various models to describe the permanent deformation behaviour were
introduced, but since none of the previous models did obviously fit the experimental results, a
conceptual plastic model based on the HUURMAN-Model has been developed. By examining
the micromechanical processes it could be observed that in general, three different phases of
deformation behaviour exist, which have to be described mathematically:
Phase I - post-compaction in the Ranges A, B and C,
Phase II - stable behaviour in the Ranges A, B and C,
Phase III - collapse in the Ranges B and C.
The HUURMAN-Model allows the description of Phases II and III of the permanent
deformation process. On the other hand Phase I – the post compaction period could not be

Modelling Permanent Deformation Behaviour
6-10
described accurately. However, this will not be important, because the post compaction period
in a pavement construction will only occur once. In a simplified way, the permanent
deformation behaviour can be described from the beginning as a linear increase of εp on a (εp)
vs. log (N) scale. Based on the HUURMAN-Model, the following relationship will be used to
describe the permanent deformation behaviour in Phase II:
( )B
pN
⋅=1000
ANε Phase II [6.1]
where:
εp [10-3] permanent strain
A, B [-] model parameters
N [-] number of load cycles
To implement the RLT measured permanent strain development in the computation of
permanent strain in a pavement structure, the permanent strains in the materials have to be
determined as a function of the applied stresses and the number of load cycles.
However, the determination of the parameters A, B, C and D for the model proposed by
HUURMAN depend on σ1 = major principal stress and σ1,f = major principal stress at failure.
In this investigation it was found from ST tests that σ1,f could not be obtained for the crushed
UGMs, as already explained in Section 4.4.
In this research a new approach has been proposed to determine the parameters A and B as a
function of the principal stresses σ1 and σ3 for the Range A (Equations 6.2 and 6.3) and for
the Range B (Equations 6.4 and 6.5):

Modelling Permanent Deformation Behaviour
6-11
133211 )()a( 432 σσσσ aa aeA ⋅+⋅= ⋅ [6.2]
)()b( 4323311bb beB σσσ ⋅+⋅= ⋅ [6.3]
3
133
2
3
131 )()a( 42
σσ
σσσ
σ aa aA ⋅+
⋅= [6.4]
)()b( 4233
3
131
bb bB σσσ
σ ⋅+
⋅= [6.5]
where:
σ3 [kPa] minor principal stress (absolute value)
σ1 [kPa] major principal stress (absolute value)
a2, a3, b2, b3 model parameters
a1, a4, b1, b4 model parameters.
The parameters found for the Granodiorite-material are given Table 6-1 and for the other
material types are given in Appendix C. In Figure 6-9 the results obtained for the
Granodiorite-material are shown. Similar plots obtained for other confining pressures and
base course materials can be found in Appendix C.
Table 6-1. Model-coefficients as found for Equations 6.2 and 6.3 for Phase II Granodiorite, grading M, 4 % moisture content, DOC=100 %, Range A
Parameter Range A
a1 [-] 0.00001
a2 [kPa-1] -0.0097
a3 [kPa-1] 0.00001
a4 [-] 0.4134
b1 [-] 0.0009
b2 [kPa-1] -0.0107
b3 [kPa-1] 0.0067
b4 [-] 0.5579

Modelling Permanent Deformation Behaviour
6-12
Figure 6-9. Vertical permanent strain versus N (data and model) Range A,
(Key G = Granodiorite, σc _σD (both in kPa))
As already discussed, the behaviour observed for the higher stress level (in Phase III as shown
in Figure 6-10) cannot be described by means of Equation 6.1. Therefore a second term was
added to Equation 6.1. The equation that was finally selected was Equation 2.8 as suggested
by HUURMAN. This equation is also commonly used to describe creep curves measured on
asphalt mixes, for instance by FRANCKEN [FRA 77].
( )
−+
⋅= 11000
AN 1000N
DB
p eCN
ε [2.8]
where:
εp [%] permanent strain
e [-] base of the natural logarithm (= 2.17828….)
N [-] number of load cycles.
The model parameters C and D are again stress dependent. By analysing the test results it was
not possible to determine the parameters C and D for Range B because there were not enough
test data available for recognizing the collapse. In this research, the parameters A and B for
Range B were also determined (Table 6-2).

Modelling Permanent Deformation Behaviour
6-13
Table 6-2. Model-coefficients as found for Equations 6.4 and 6.5 for Phase II Granodiorite, grading M, 4% moisture content, DOC=100 %, Range B
Parameter Range B
a1 [kPa-1] 0.0002
a2 [-] 1.4514
a3 [kPa-1] -0.0004
a4 [-] 1.4407
b1 [kPa-1] 0.0102
b2 [-] 0.1995
b3 [kPa-1] 0.004
b4 [-] 0.6844
The parameters C and D can be determined for the two tests but not in a stress dependent way
(Figure 6-11).
Figure 6-10. Vertical permanent strain versus N (data and model) Range B,
(Key G = Granodiorite, σc _σD (both in kPa))

Modelling Permanent Deformation Behaviour
6-14
Figure 6-11. Vertical permanent strain versus N (data and model) Range B,
(Key G = Granodiorite, σc _σD (both in kPa))
Finally it was realised that it is possible to model the permanent deformation behaviour of
UGMs in a stress dependent way. However, it is necessary to model each behaviour range
separately, and to examine the micromechanical processes.
Further research should be focused on modelling the resilient and permanent deformation
behaviour of Range B. Tests with a high number of load cycles are necessary to locate the
point of incremental collapse. Furthermore, the radial permanent deformation behaviour has
to be modelled. It is probable that the same equations (as for the vertical permanent
deformation behaviour) can be used, but different parameters need to be determined.

Parameters influencing Deformation Behaviour
7-1
7 PARAMETERS INFLUENCING DEFORMATION BEHAVIOUR
7.1 Introduction
This chapter presents the results of RLT testing performed to investigate the factors
influencing the mechanical behaviour of UGMs. From the literature review in Chapter 2,
various factors were identified which were expected to influence the behaviour of UGMs. In
this research the influence of the grading and of the physical properties of the aggregate
particles on the permanent deformation behaviour were investigated. In the tests performed on
UGMs within this research project these two influence factors were systematically varied in
order to demonstrate their importance. Compared with other investigations, e.g. [THO 89], the
permanent deformation behaviour was studied at a range of stress conditions.
In the following Section 7.2 all the results and interpretation of the RLT tests on two different
UGMs with different gradings are presented. In Section 7.3 the results and interpretation of
further RLT tests to investigate the effect of the physical properties of the aggregate particles
(grain shape and surface roughness of particles) on the permanent deformation behaviour are
presented.
7.2 Effect of Grading on the Permanent Deformation Behaviour
The effect of aggregate grading on the εp-behaviour was demonstrated from permanent
deformation tests performed on gradings O and M for the Diabase-material and on grading U
and M for the Sandy Gravel (see Figure 3-1).
Diabase-material
Due to the time-consuming nature of testing the permanent deformation behaviour, RLT tests
where conducted at 3 different stress levels for the Diabase-material with the gradings O and
M at the same degree of compaction and at nearly the same degree of saturation (see
Section 3.2). Figure 7-1 and Figure 7-2 show that there were no significant differences in
either the permanent or the resilient deformation behaviours between the different gradings.
Furthermore it was recognized that the shape of the curves (when plotted on a log (εp) vs.
log (N) scale) were very similar, as shown in Figure 7-1.

Parameters influencing Deformation Behaviour
7-2
Figure 7-1. Vertical permanent strains versus number of load cycles, Diabase - grading M and O
(Key D = Diabase, σc _σD (both in kPa))
Figure 7-2. Vertical resilient strains versus stress ratio, Diabase - grading M and O

Parameters influencing Deformation Behaviour
7-3
Sandy Gravel
Almost the same relationship as obtained from the Diabase-material was also found for the
Sandy Gravel. Once again the permanent and the resilient deformation behaviour with two
different gradings were almost the same (see Figure 7-3 and Figure 7-4). Slightly higher
resistance to permanent deformation and for this reason a higher plastic shakedown limit of
the Sandy Gravel with the U grading could be explained by the smaller amount of moisture
(i.e. a smaller degree of saturation) when compared to the tests with M grading (see Table 3-1
and Figure 7-5).
Figure 7-3. Vertical permanent strains at 80,000 cycles versus stress ratio, Sandy Gravel - grading M and U
It should be considered, that increasing the fines fraction increases the optimum water content
of the material, decreases the permeability of the material and as a result may efficiently
advance the development of excessive pore water pressure in the pore spaces of the loaded
aggregates [KOL 98]. By testing UGMs with gradations that follow the upper, middle and
lower German Specification [ZTVT-StB 95], it was confidently concluded that the grading
(within the limits tested) does not effect the deformation behaviour of UGMs significantly.
Gradings closer to the lower limit should be ideally selected, to guarantee good water
permeability and to avoid high moisture contents within the UGL in a pavement construction.

Parameters influencing Deformation Behaviour
7-4
Figure 7-4. Vertical resilient strains versus stress ratio, Sandy Gravel - grading M and U
Figure 7-5. Peak axial stress versus stress ratio – plastic shakedown limits, Sandy Gravel - grading M and U

Parameters influencing Deformation Behaviour
7-5
7.3 Effect of the Physical Properties of Aggregate Particles
As already described in Section 2.3.7 the grain shape and the surface roughness will
significantly influence the permanent deformation behaviour. Figure 3-3 shows the surface
properties of the materials investigated (Sandy Gravel smooth surface and Diabase-material/
Granodiorite-material rough surface). Figure 7-6, Figure 7-7 and Figure 7-8 demonstrate these
effects on the deformation behaviour.
Figure 7-6. Vertical permanent strains at 80,000 cycles versus stress ratio Granodiorite, Sandy Gravel, Diabase -
grading M

Parameters influencing Deformation Behaviour
7-6
Figure 7-7. Peak axial stress versus stress ratio – plastic shakedown limits, Granodiorite, Sandy Gravel, Diabase,
grading M
Figure 7-8. Vertical resilient strains versus stress ratio, Granodiorite, Sandy Gravel, Diabase –
grading M

Parameters influencing Deformation Behaviour
7-7
Crushed Materials – Granodiorite-material and Diabase-material
No significant difference between the accumulated permanent strains after 80,000 load cycles
of the Granodiorite-material and the Diabase-material can be recognized (Figure 7-6 and
Figure 7-9). Furthermore, similar stress dependent shakedown limits were observed
(Figure 7-7). However, the shapes of the εp-N curves of either crushed materials were
different. The Granodiorite-material εp-curve was linear on a log (εp) vs. log (N) scale, where
as the Diabase-material εp-curve was more convex especially during the post compaction
period (Figure 7-9). Looking at the resilient deformation behaviour, the Diabase-material will
have a higher stiffness than the Granodiorite-material - Figure 7-8.
The direct effect of each individual crushed material property investigated is likely to be so
small, that separating them from the effects of other more important factors is probably
difficult. This is particularly so, since no significant difference in the εp-behaviour between the
two crushed material types when tested at a high number of load cycles was observed. The
similar surface roughness and grain shape (crushed materials) of the Granodiorite-material and
Diabase-material are not likely to have a significant effect on the permanent deformation
behaviour or on the stress dependent plastic shakedown limit.
Differences in the frictional resistance at the particle contact points and of the dry density
values (number of grain contacts) will probably explain the difference in the resilient
deformation behaviour of the Granodiorite-material (2.25 g/cm3) and the Diabase-material
(2.4 g/cm3). The frictional resistance at the particle contacts was not investigated. An increase
in the density of the coarse grained materials, in this case the Diabase-material, clearly
increases the elastic stiffness of the materials. At particle level, a logical explanation can be
that the number of particle contacts per individual particle increases with a more densely
packed particle system. This decreases the average contact force corresponding to an external
load and consequently the deformations at particle contacts (i.e. resilient deformations).

Parameters influencing Deformation Behaviour
7-8
Figure 7-9. Vertical permanent strain versus number of load cycles for different materials at the same stress level,
Diabase , Granodiorite - grading M (Key D = Diabase, G – Granodiorite σc _σD (both in kPa))
Crushed Materials/Natural Materials
The εp-behaviour of the Sandy Gravel is different from the behaviour of crushed materials. At
high stresses (high confining stress/ high peak axial stress) the permanent strains are lower
than those of the crushed materials and at low stresses the reverse is true (Figure 7-6,
Figure 7-7).
• Regarding the grain shape, two separate groups can be formed which will mainly
influence the permanent deformation behaviour. On one hand the natural gravel and sand
fractions (Sandy Gravel) and on the other hand the crushed materials (in this case:
Granodiorite-material and Diabase-material). These differences in the grain shape and the
visible roughness are the most important reasons, why the difference in permanent
deformation behaviour between the natural and the crushed materials were observed.
• At high load levels the stresses at the contact points can increase to such a high level that
particles can fracture or their edges can break down. In such a case the loaded particles
move with respect to each other and both particles and stresses rearrange until a new
equilibrium with the external load is achieved. The difference between natural material
Parameters influencing Deformation Behaviour
7-9
having rounded grain shape and crushed material having sharp-edged grain shape is
highly significant in long term repeated loading/ permanent deformation behaviour. The
crushed material is likely to become more blunt/wear more than the natural material and
therefore more fines fractions will be produced and higher permanent deformations
(particle rearrangement) will occur. This could be an explanation for why the crushed
materials with sharp-edged grains have higher permanent deformations at high stress
levels.
• At low stress levels other physical properties of the particles must affect the observed
permanent deformation behaviour of the UGMs. The difference in permanent strain
behaviour of different aggregate types can be related to their visible surface
characteristics. Crushed grains are rougher as well as more angular and thus guarantee a
better particle interlock. This particle interlock causes an apparent cohesion ´c’´ which
can be argued to result in a higher shear strength and shear resistance. Due to their higher
visible surface roughness crushed materials undergo smaller permanent deformations than
materials with rounded particles with comparable densities and moisture contents at
relatively low stress levels. Similar results were also observed by THOM and BROWN
[THO 89].
• The elastic properties of the Diabase-material and the Sandy Gravel were nearly the same
(Figure 7-8). The same resilient deformation behaviour was also observed for these
materials by NUMRICH [NUM 03].
• The shape of the εp-N curves was similar for the Granodiorite-material and the Sandy
Gravel (Figure 7-10).

Parameters influencing Deformation Behaviour
7-10
Figure 7-10. Vertical permanent strain versus number of load cycles for different materials at the same stress
level (Key D = Diabase, G – Granodiorite, K – Sandy Gravel, σc _σD (both in kPa))
7.4 Conclusions
The influence of the grading and the effect of the physical properties of the aggregate particles
on the deformation behaviour were investigated. The following results were obtained:
• In comparison with other influencing factors (e.g. DOC, moisture content [NIE 02]) it
seems to be that the grading is of less importance for the resilient and permanent
deformation behaviour. A prerequisite for good performance is a relatively balanced
grading. In this investigation, the gradings were all within the limits of the German
Specification [ZTVT-StB 95] for UGMs in pavement constructions.
• At the same DOC (Sandy Gravel has a higher level of compaction than crushed materials
for the same compactive effort – 100% DOC) and approximately the same degree of
saturation the difference between the crushed materials investigated with respect to
permanent deformation behaviour was very small. But there was a difference between
crushed and natural UGMs with respect to permanent deformation behaviour. At low
stresses (low value of σD and σc) the Sandy Gravel had a lower permanent deformation
resistance than the crushed materials. At high stresses (high value of σD and σc) the
crushed materials had a lower permanent deformation resistance than the Sandy Gravel.

Parameters influencing Deformation Behaviour
7-11
• Furthermore it should take into consideration, that for Sandy Gravel, however, the
decrease in strain with increasing density is not considered to be significant, as these
aggregates are initially at higher compacted density than crushed materials for the same
compactive effort.

Pavement Performance
8-1
8 PAVEMENT PERFORMANCE
8.1 Introduction
In previous chapters the permanent deformation behaviour of the UGMs investigated in this
research was discussed. It was shown that the materials display a stress dependent behaviour.
The main goal of this research is primarily the calculation of permanent deformations in the
UGL in flexible pavement constructions. This requires a model in which both the stress
dependent resilient behaviour as well as the stress dependent permanent strain development
are considered.
This chapter presents the results of FE calculations performed on two different pavement
configurations, based on the stress dependent mechanical behaviour of a Granodiorite at two
different moisture contents. Furthermore the determination of the development of permanent
strains and deformations (rut depth calculations) in the UGL is discussed.
Section 8.2.1 describes the FE program used in this research work and in Section 8.2.2 two
examples of pavement constructions were selected from German Standard [RStO 01] for
further analysis. The characteristics of each pavement layer are discussed in some detail in
Section 8.2.3. Results of FE calculations are presented in Section 8.2.4, which will provide a
insight into the behaviour of two flexible pavement scenarios with a 220 mm and a 340 mm
asphalt cover.
In Section 8.3 the development of permanent strains throughout the substructure of a flexible
pavement is discussed taking into account the stress history.
Finally in Section 8.4, a design chart is presented to evaluate the performance of the UGL in
the pavements analysed earlier.

Pavement Performance
8-2
8.2 The Resilient Calculation
8.2.1 Finite Element Program
The following conditions were set for the FE programme:
• rotational symmetric calculations,
• the capacity to implement non-linear material models,
• limited tensile stress within the UGL,
• calculation of 30 layers as a minimum,
• the possibility of linear elastic calculations.
The FE program FENLAP, developed at the University of Nottingham by ALMEIDA in the
1980’s was used. It was decided to use an axial symmetric model with the capacity to
calculate as many layers as necessary. The program uses 8-node rectangular-elements, with
each node having two degrees of freedom and all element angles are at 90°. For each layer it is
also possible to define the dead weight.
According to the investigations done by WENZEL [WEN 88] the maximum allowable tensile
stress value in the UGL was set to 1 % of the external vertical applied load. In the model, any
values of tensile stresses within the UGL higher than 1 % were rearranged. In the program
FENLAP, a linear elastic HOOKE’s-Model for the asphalt layer and the subgrade, and for the
UGL the non-linear elastic DRESDEN-Model, which is described more detailed in
Section 8.2.3, were implemented. The asphalt layer and the subgrade behave of course non-
linear elastic, but no practicable models were accessible at this time.
For this research the radius of the model selected was 1.5 m. The dimension of the entire mesh
was 1.5 m x 1.5 m. In the r-direction the elements had the following dimensions 10 x 15 mm,
10 x 25 mm, 6 x 50 mm and 6 x 100 mm. In summary there were 44 horizontal elements and
21 vertical elements. The dimensions of the elements in the z-direction depended on the layer
thickness and will be described in the following sections.

Pavement Performance
8-3
8.2.2 Constructions selected for Investigation
Several pavement types as listed in the empirical German pavement design guideline
“RStO 01” [RStO 01] were investigated. For different constructions there are seven different
categories available, depending on the number of equivalent 10 t-axle load cycles. Two
different constructions according Table 8-1 (asphalt cover = 340 mm and 220 mm) were
investigated. The category SV (very heavy traffic) with an asphalt cover of 340 mm is
proposed in the German design Guideline for highways.
Table 8-1. Constructions investigated [RStO 01]
Category
asphalt layer on granular base
Equivalent 10 t-axle load cycles [mil.]
SV
> 32
III
> 0.8 – 3
asphalt surface course asphalt binder course asphalt base course granular base (UGL)
48
22
u 120
u 45
44
14
53
120
u 45
thickness [cm]; Ev2 minimum value [MN/m2] (static plate bearing test)
The following wheel loads were chosen assuming a circular contact area with a radius of
150 mm:
(a) 57.5 kN is the wheel load expected in a 115 kN axle, which is the upper legal limit for a
driven axle in Germany.
(b) 65 kN and 77.5 kN are the wheel loads of 130 kN and 155 kN axles, respectively.
These values in (b) were selected for a pavement having 340 mm asphalt cover to demonstrate
the effects of overloading.
The effect of climatic conditions, like variations in the asphalt temperatures during the year
and changes in the moisture content within the UGL were taken into account when calculating
the stresses within the pavement. It will be shown, that the stresses within the pavement
structure are influenced by the climatic conditions.

Pavement Performance
8-4
The characteristics of each pavement layer are very important and in the following sections
these characteristics are discussed in some detail.
8.2.3 Implementing the Material Behaviour
Subgrade
The subgrade was modelled as a linearly elastic material with an E-value of 45 N/mm2 and a
µ−value of 0.5 (suitable non linear - model was not available). This is considered acceptable,
as stresses in the subgrade are much more the result of dead weight stresses than of traffic
loading. The modulus chosen is representative of a subgrade of reasonable quality. The
subgrade in the model was assumed to have a thickness of 1.5 m. The basic geometry of the
model for the subgrade is presented in Figure 8-1.
Ele
men
t hei
ght
10 c
m
UGL
E,µ=f( ; ))σ σ1 3
(d=150 cm)(E,µ=const.)
5 c
m
Figure 8-1 Geometry of the axial symmetric model for the subgrade [NUM 03]

Pavement Performance
8-5
Unbound Granular Layer – non-linear elastic DRESDEN Model
Investigations on the non-linear elastic stress strain behaviour of UGMs have been carried out
at the Dresden University of Technology mainly by WELLNER [WEL 94], GLEITZ
[GLE 96] and NUMRICH [NUM 03] for the past 10 years. In this section only a short
overview on resilient modelling of UGMs is given.
When modified plate-bearings tests were carried out on UGLs by WELLNER [WEL 94] using
cyclic loading, surface heaving was observed at distances from 450 to 1200 mm away from
the centre of the load (see Figure 8-2). At all measured stress-levels the same behaviour was
observed. Linear elastic analysis could not predict this heaving behaviour and therefore RLT
tests on the same UGM as used in the plate-bearings tests were conducted to investigate the
non-linear elastic behaviour. Detailed analysis of the data from the RLT tests enabled a new
material law, the “elastic DRESDEN-Model” to be developed [WEL 94, GLE 96]. This non-
linear elastic model is expressed in terms of modulus of elasticity E and Poisson’s ratio µ as
follows:
( ) DCQE QQ +⋅⋅+= 2113 σσ [8.1]
BAR +⋅+⋅= 33
1 σσσ
µ [8.2]
(0 < µ < 0.5)
where:
σ3 [kPa] minor principal stress (absolute value);
σ1 [kPa] major principal stress (absolute value);
D [kPa] constant term of modulus of elasticity;
B [-] constant term of Poisson’s ratio
Q2 [-] constant
Q, C, Q1, R, A model parameters, determined from RLT tests.
The model includes a stress independent stiffness (as a consequence of the residual confining
stress in-situ) of 38 kPa for crushed materials and 30 kPa for sand and gravel (parameter D).
The residual stress has the effect of reducing the strains at small stress levels and could be
estimated by examining modified plate-bearing test results carried out by KLEMT [KLE 90].

Pavement Performance
8-6
The parameter D is mainly influenced by macroscopic parameters like the degree of
compaction of the UGMs, content of fines, shape of the grains and moisture content. The RLT
test results do not allow determination of the parameter D because the residual stress needs
some time to develop in a real pavement construction. According to the Herzian contact
theorie a value of 0.333 was determined for the parameter Q2. To obtain the model parameters
the RLT apparatus at Nottingham University was used [GLE 96].
GLEITZ [GLE 96] was checking the validity of the DRESDEN-Model. The surface
deflections induced by plate bearing tests was predicted using the FE-program FENLAP
(Figure 8-2). A comparison was carried out to assess the accuracy of other material laws (e.g.
MAYHEW, BOYCE and K-θ Model) by comparing the results of calculated deflections from
all the models against the measured values. Using the K-θ-Model the predicted deflection in
the load axis was smaller than measured, the shape of the deflection bowl is similar to the
measured one (except for the area of heaving). The calculation with the MAYHEW-Model
and the BOYCE-Model (isotropic) results in a prediction of the deflections under the load (the
material is described too weak) and the deflection bowl is not bended so strong. GLEITZ
asserted, that the best approximations were generated by the elastic DRESDEN-Model (see
Figure 8-2). The maximum deflection under the load agrees with the measured value. In
addition heaving away from the loading plate could be observed with the elastic
DRESDEN-Model.
Figure 8-2. Comparison of measured and calculated surface deflections [GLE 96]

Pavement Performance
8-7
In the research carried out by NUMRICH [NUM 03] the resilient deformation behaviour of a
Granodiorite was investigated at moisture contents of 4, 5, 6 and 7 %. Although the moisture
content increments appear to be small, RLT samples can be prepared with a very good
accuracy (± 0.3 % moisture content). During RLT tests at 7 % moisture content (= w opt),
water was observed draining out of the sample during the test, which indicated the possibility
of inhomogeneous conditions during testing. Therefore it was not possible to determine the
material parameters for input into the elastic DRESDEN-Model when using RLT data at
moisture contents of 6 % and 7 %. However, the RLT test results at moisture contents of
4 and 5 % were taken into account for modelling the deformation behaviour of the UGL.
Figure 8-3 clearly shows a high dependency of the resilient deformation behaviour, and hence
the model parameters (Table 8-2) on the moisture content. Increasing the water content
resulted in a significant reduction in stiffness, a result also observed by other investigations
[BAR 89, HIC 71, HEY 96, SMI 73, RAA 92, VUO 92, HAY 63].
Figure 8-3. Vertical resilient strain versus confining pressure at different moisture contents (σ1max/σc = 2)
[NUM 03]

Pavement Performance
8-8
Table 8-2. Parameter for the elastic DRESDEN-Model, Range A, Granodiorite - DOC = 100 % [NUM 03]
Parameter Moisture content
Elastic DRESDEN-Model 4 % 5 %
Q [kPa]1-Q2 5,386.1 10,772.2
C [kPa]1-Q1-Q2 2315.6 599.1
Q1 [-] 0.593 0.690
Q2 [-] 0.333 0.333
R [-] 0.017 0.037
A [kPa]-1 -0.0024 -0.0012
B [-] 0.352 0.320
It is a well known fact that during the spring-thawing period (in Germany typically 3 weeks
during the year) the UGL will have a higher moisture content. For the model, a 4 % moisture
condition was assumed at equilibrium moisture conditions, and 5 % was the assumed
moisture content during the spring-thawing period. The two different moisture contents were
associated to 13 different asphalt surface temperatures during the year (Figure 8-5). For the
time being the elastic DRESDEN-Model, which is based on the Herzian contact theory, is
valid for Range A behaviour only, because probably no dilation will occur in this behaviour
range (no collapse).
The geometry of the model for the UGL is shown in Figure 8-4. In the vertical axis the height
of each element is about 5 cm.

Pavement Performance
8-9
Ele
men
t hei
ght 5
cm
Asphalt layer(E=f (mix, temp.) ( =const.)µ
UGLD=f(category)(E,µ=f( ; ))σ σ1 3
Subgrade(D=150 cm)(E,µ=const.)
Figure 8-4. Geometry of the axial symmetric model for the UGL [NUM 03]
Asphalt layer
The response of an asphalt mixture under load depends on the level and frequency of loading
and on temperature. The stiffness of an asphalt mixture is a function of temperature and time
of loading (frequency). In general, asphalt materials display non-linear stress/strain behaviour
i.e. an increase in stiffness with increasing stress amplitude. However at low temperatures,
low load levels and high frequencies, asphalt mixtures are nearly linearly viscoelastic. On the
other hand, at high temperatures, slow loading rates and high loads the behaviour of the
materials tends to be non-linear elasto-viscoplastic.
As a first approximation the asphalt layers were treated as linearly elastic (µ = 0.35), even at
high temperatures. Some simplified assumptions where made to determine the moduli of
elasticity as a function of loading time (frequency), temperature and mix composition. For the
determination of the modulus of elasticity E a frequency of 10 Hz (0.1 s loading time,
equivalent to speed of 60 km/h) was selected as representative of a typical highly trafficked
pavement [FGSV 03].
The average climatic conditions for Germany were analysed by JANSEN [JAN 85] to
estimate the variations in asphalt surface temperatures during the year (Figure 8-5). The
distributions of the moisture content within the UGL are assumptions, because no data for
Germany were available.

Pavement Performance
8-10
0
5
10
15
20
25
-12.5 -7.5 -2.5 2.5 7.5 12.5 17.5 22.5 27.5 32.5 37.5 42.5 47.5
Temperature [°C]
Freq
uenc
y [%
]
frequencies during spring-thaw period 2.8 %
2.8 % 5 % UGL moisture content
4 % UGL moisture content
Figure 8-5. Averaged frequencies of the asphalt surface temperatures in Germany during one year [JAN 85]
The temperature gradient was determined for each of these temperatures by the method of
POHLMANN [POL 89] and HESS [HES 98]:
( ) bdzclnay ++⋅⋅= [8.3]
where:
y [°C] asphalt temperature at depth z
z [mm] depth beneath the asphalt surface
a, b, c, d [-] parameters.
Finally the variations of asphalt temperature with depth were calculated for twelve
temperature combinations (Figure 8-6).

Pavement Performance
8-11
Figure 8-6. Temperature regime within the asphalt layer [NUM 03]
To take into account the variation of asphalt mixture properties with composition the
approach suggested by FRANKEN and VERSTRAETEN [FRA 77] was applied on German
common mix compositions (Table 8-3):
∞⋅= ERE 1R0 ≤< [8.4]
VaeUE 0458.055.0410436.1 −∞ ⋅⋅⋅= [8.5]
b
g
V
VU = [8.6]
where:
E [N/mm2] modulus of elasticity
∞E [N/mm2] glass-modulus
R [-] parameter dependent on frequency, softening point ring and ball,
temperature, needle penetration - nomogram in [FRA 77]
Vg [Vol.-%] void content in the asphalt mixture
Vb [Vol.-%] binder volume in the asphalt mixture
Va [Vol.-%] volume of the mineral aggregate in the asphalt mixture.

Pavement Performance
8-12
Table 8-3. Determination of the modulus of elasticity for the different asphalt layers [NUM 03]
Category SV III asphalt surface course SMA 0/11 S AC 0/11
asphalt cement [-] PmB 45 70/100 needle penetration [1/10 mm] 35 70
softening point R&B [°C] 65 49 bulk density [g/cm3] 2,33 2,35
maximum density [g/cm3] 2,43 2,41 density asphalt cement [g/cm3] 1,02 1,02 asphalt cement content [M.-%] 6,8 6,6
asphalt binder course 0/16 S 0/16 asphalt cement [-] PmB 45 50/70
needle penetration [1/10 mm] 35 50 softening point R&B [°C] 65 56
bulk density [g/cm3] 2,35 2,38 maximum density [g/cm3] 2,51 2,5
density asphalt cement [g/cm3] 1,02 1,02 asphalt cement content [M.-%] 4,5 4,7
asphalt base course 0/22 CS 0/22 CS asphalt cement [-] 50/70 50/70
needle penetration [1/10 mm] 50 50 softening point R&B [°C] 56 56
bulk density [g/cm3] 2,38 2,38 maximum density [g/cm3] 2,55 2,55
density asphalt cement [g/cm3] 1,02 1,02 asphalt cement content [M.-%] 4,2 4,2
Each asphalt layer was separated in two centimetre thick sub-layers. This subdivision of the
layers allows the stiffness (modulus of elasticity E) of the asphalt sub-layers to be varied
incrementally based on the temperature gradient. Modulus of elasticity E values calculated
for the asphalt layers are listed in Appendix C, Table C-4 for selected temperatures.
The geometry of the model for the asphalt layer is shown in Figure 8-7. In the vertical axis the
height of each element is, as already described, about 2 cm. It was assumed that between the
asphalt layers there was complete layer adhesion.
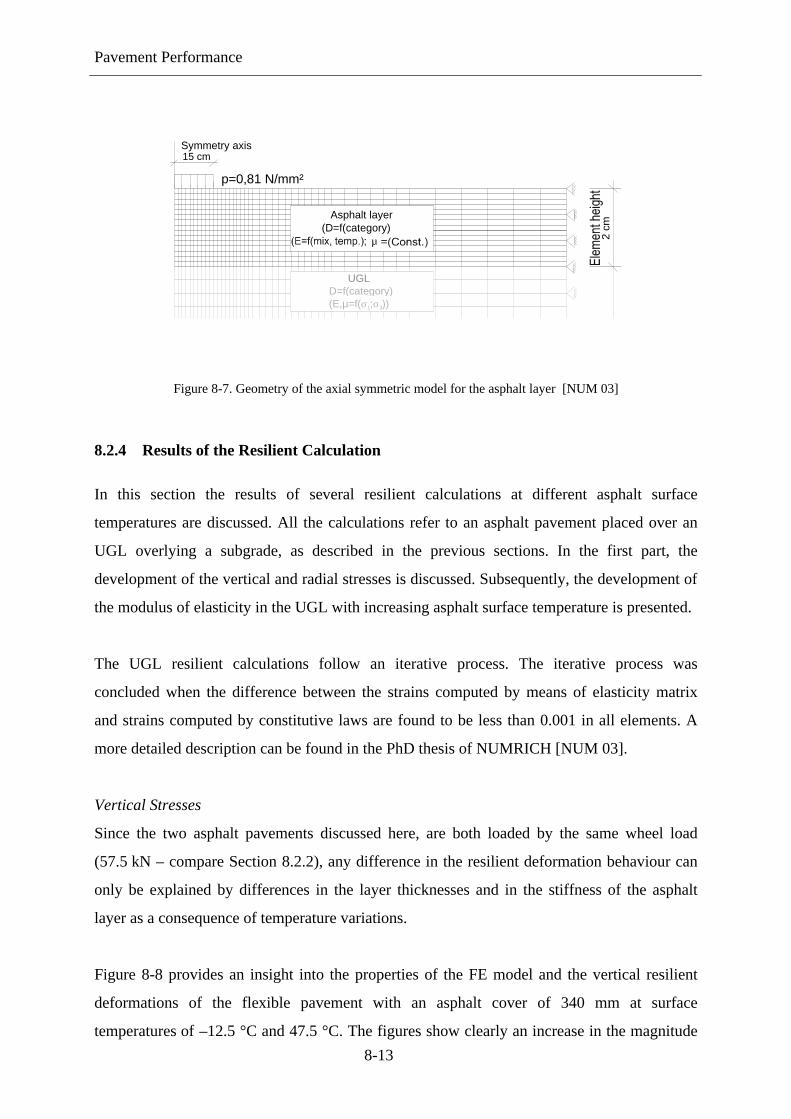
Pavement Performance
8-13
2 c
m
p=0,81 N/mm²
UGL
Asphalt layer(D=f(category)
µ
Symmetry axis15 cm
D=f(category)(E,µ=f( ; ))σ σ1 3
Figure 8-7. Geometry of the axial symmetric model for the asphalt layer [NUM 03]
8.2.4 Results of the Resilient Calculation
In this section the results of several resilient calculations at different asphalt surface
temperatures are discussed. All the calculations refer to an asphalt pavement placed over an
UGL overlying a subgrade, as described in the previous sections. In the first part, the
development of the vertical and radial stresses is discussed. Subsequently, the development of
the modulus of elasticity in the UGL with increasing asphalt surface temperature is presented.
The UGL resilient calculations follow an iterative process. The iterative process was
concluded when the difference between the strains computed by means of elasticity matrix
and strains computed by constitutive laws are found to be less than 0.001 in all elements. A
more detailed description can be found in the PhD thesis of NUMRICH [NUM 03].
Vertical Stresses
Since the two asphalt pavements discussed here, are both loaded by the same wheel load
(57.5 kN – compare Section 8.2.2), any difference in the resilient deformation behaviour can
only be explained by differences in the layer thicknesses and in the stiffness of the asphalt
layer as a consequence of temperature variations.
Figure 8-8 provides an insight into the properties of the FE model and the vertical resilient
deformations of the flexible pavement with an asphalt cover of 340 mm at surface
temperatures of –12.5 °C and 47.5 °C. The figures show clearly an increase in the magnitude

Pavement Performance
8-14
of stresses in the pavement at high temperatures. The high stresses which were observed near
to the boundary within the asphalt layer (left picture) are a consequence of the fixed boundary
conditions (refer to Figure 8-4 for the boundary conditions).
Figure 8-8. Calculated vertical stresses in the pavement at surface temperatures of -12.5 and 47.5 °C
(asphalt cover 340 mm)
For the pavement with a thinner asphalt cover of 220 mm, much higher stresses at surface
temperatures of –12.5 °C and especially of 47.5 °C were observed as shown in Figure 8-9.
< 0 Stress zz [kN/m2] >100
Asp
halt
UG
L
Subg
rade
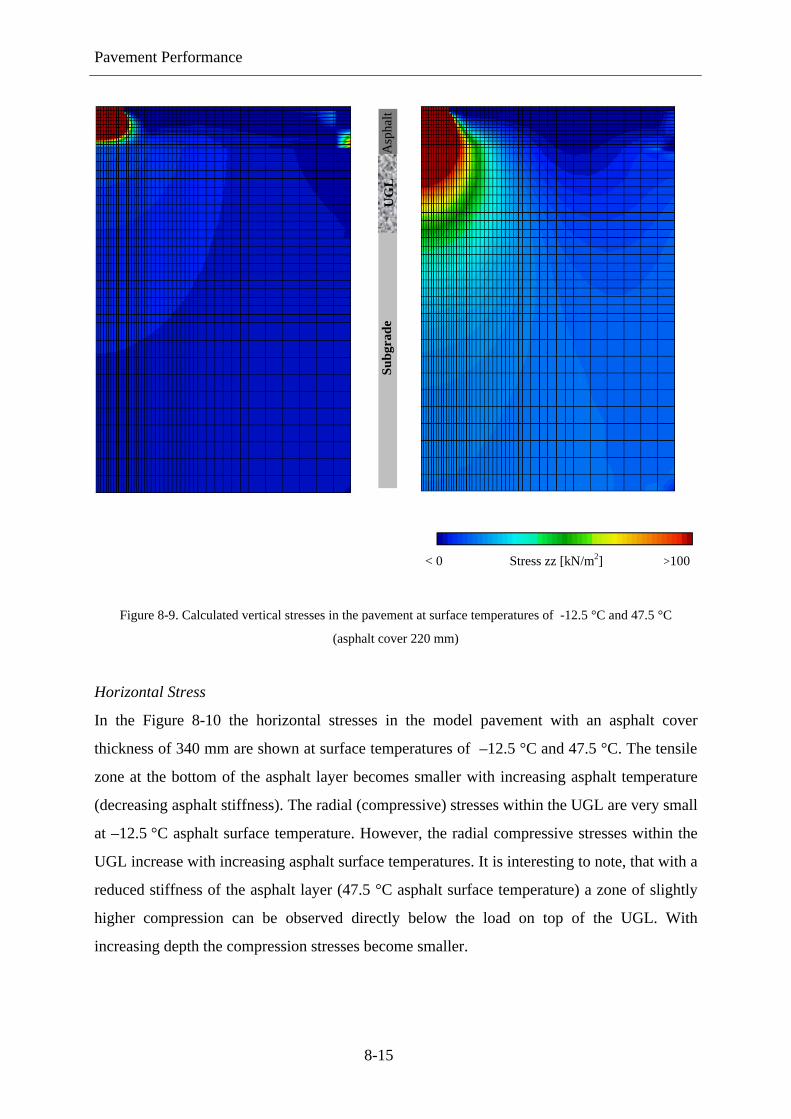
Pavement Performance
8-15
Figure 8-9. Calculated vertical stresses in the pavement at surface temperatures of -12.5 °C and 47.5 °C
(asphalt cover 220 mm)
Horizontal Stress
In the Figure 8-10 the horizontal stresses in the model pavement with an asphalt cover
thickness of 340 mm are shown at surface temperatures of –12.5 °C and 47.5 °C. The tensile
zone at the bottom of the asphalt layer becomes smaller with increasing asphalt temperature
(decreasing asphalt stiffness). The radial (compressive) stresses within the UGL are very small
at –12.5 °C asphalt surface temperature. However, the radial compressive stresses within the
UGL increase with increasing asphalt surface temperatures. It is interesting to note, that with a
reduced stiffness of the asphalt layer (47.5 °C asphalt surface temperature) a zone of slightly
higher compression can be observed directly below the load on top of the UGL. With
increasing depth the compression stresses become smaller.
< 0 Stress zz [kN/m2] >100
Subg
rade
U
GL
A
spha
lt

Pavement Performance
8-16
Asp
halt
UG
L
Subg
rade
Figure 8-10. Calculated horizontal stresses in the pavement at surface temperatures of -12.5 and 47.5 °C (asphalt
cover 340 mm)
On the other hand for the pavement with a thinner 220 mm asphalt cover, much higher radial
compressive stresses at 47.5 °C asphalt surface temperature were observed (Figure 8-11).
< -25 Stress rr [kN/m2] > +25

Pavement Performance
8-17
Asp
halt
Asp
halt
Figure 8-11. Calculated horizontal stresses in the pavement at surface temperatures of -12.5 and 47.5 °C (asphalt
cover 220 mm)
Stiffness
Depending on the stiffness of the various layers the stresses will result in strains that cause
deflections. The stiffness throughout the UGL is presented in Figure 8-12 for an asphalt
pavement with a 340 mm asphalt cover thickness with asphalt surface temperatures of
–12.5 °C and 47.5 °C. The plots show that at low surface temperatures (left picture), the
stiffness has a layered distribution (with a high stiffness asphalt layer, the asphalt behaves like
a plate). As a result of the overburden pressure, the stiffness within the UGL increases with
increasing depth.
However, at an asphalt surface temperature of 47.5 °C (right picture) the stiffness of the
asphalt layers decrease (see Table C-4) and the stiffness of the UGL is increased. The largest
stiffness in the UGL develops underneath the load in the upper part of the layer. At a small
horizontal distance from the load centre, the stiffness of the UGL decreases with the depth. At
Subg
rade
U
GL
< -25 Stress rr [kN/m2] > +25

Pavement Performance
8-18
Asp
halt
Asp
halt
larger horizontal distances from the load centre, the lower part of the UGL has higher stiffness
than the upper part.
Figure 8-12. Calculated vertical stiffness in the pavement at surface temperature of -12.5 and 47.5 °C
(asphalt cover 340 mm)
8.3 Calculation of the Permanent Strains
In this section the computations for the development of permanent vertical strains are
described. In the first part, the method used to determine the permanent strain development in
the subgrade is introduced. In the second part, the assumptions used to take into account the
effects of stress history on the UGL were explained. Finally some computation results are
presented and discussed.
Subgrade
Up till this point only the development of permanent strains in the UGL has been discussed.
Of course the deformation of the subgrade has also be considered in order to arrive at a
realistic deformation level at the UGL surface. The permanent deformation of the subgrade is
calculated using the approach suggested by VERVEKA [VER 79]:
Subg
rade
U
GL
45 E-Modul zz [N/mm2] > 80
Pavement Performance
8-19
))log(( Nbaelp +⋅= εε [8.7]
where:
εp [-] permanent strain
εel [-] resilient strain
a = -1.3 to 1.3 [-] parameter
b = 0.7 [-] constant
N [-] number of load cycles.
VERVEKA found that the parameter ‘a’ varies from –1.3 to 1.3 depending on the stiffness of
the subgrade. In this investigation an ‘a’ value of zero was chosen, so that at a value of
N = 0 load cycles the permanent deformation is also equal to zero. Permanent strains can thus
be easily determined by considering the calculated resilient strains for this subgrade.
Unbound Granular Layer
The climatic conditions and the effect of stress history must also be taken into account when
calculating the accumulated permanent strains Σεp1 in the UGL. To obtain information on the
effect of stress history, MS tests were conducted and compared with current permanent Single
Stage (SS) tests. Figure 8-13 shows that the permanent strain rate depends on the accumulated
permanent strains Σεp1. In Figure 8-13 at the highest stress levels a difference between the MS
and SS test results is observed. In agreement with what BROWN and HYDE found in their
study [BRO 75] (see Section 2.3.4), the permanent strain-rate per load cycle resulting from a
successive increase in the stress level are considerably smaller than the strain that occurs when
the highest stress is applied as a single pulse. At 10.000 load cycles the accumulated
permanent strains from MS test are smaller than the accumulated permanent strains from
SS test.

Pavement Performance
8-20
Figure 8-13. Influence of the stress history on the permanent deformation behaviour
(Key G = Granodiorite, σc _σD (both in kPa) MSt – MS tests)
In fact, the post compaction period at each stress level should not be considered during
calculation of the accumulated permanent strains Σεp. The calculation starts with the first
stress level at zero strains. The next step is to determine the permanent strains εp at the next
stress level after consideration of the accumulated permanent strains from the previous stress
level εp (Figure 8-14).
Figure 8-14. Consideration of stress history on modelling permanent deformation behaviour
Number of load cycles
Perm
anen
t str
ain
N1
N2
εp1
εp2
Σ εp
N2, B N2, E

Pavement Performance
8-21
( ) ( ) ( )EnBni
npEBip
ip
nip NNNNN ,,n 3n 1,22,232 ,12,11 ,31 ,11,
1
..... σσεσσεσσεε ++=∑ [8.8]
)( ,3 ,1
1
1nn
nipnB fN σσε∑
−
= [8.9]
nBnnE NNN += , [8.10]
where:
∑n
ip
1
ε (N) [10-3] accumulated permanent strain in element i as a function of N
∑−1
1
nipε [10-3] accumulated permanent strain in element i from stress state 1
to stress state n-1
( )11 ,3,1 ,11, , Nip σσε [10-3] permanent strain at the stress state 1 in element i as a function of
σ1,1, σ3, 1 and N1 [-]
N1 [-] number of load cycles for the stress state 1
N n,B [-] number of load cycles for the stress state n at the beginning
N n,E [-] number of load cycles for the stress state n at the end
n [-] number of stress states
The different stress states result e.g. from variations in climatic conditions and loading. In this
research different stress states were taken into account caused by variations in asphalt surface
temperature (see previous chapters). However, variations in moisture content within the UGL
during the year could not be considered on permanent deformation calculations since plastic
model parameters were available only for Granodiorite-material at 4 % moisture content. In
total 13 different stress conditions as shown in Table 8-4 were determined. Assuming a
constant flow of standard axles with time, using the temperature frequency distribution chart
(Figure 8-5) it was possible to calculate the number of load applications for each of the
13 different stress states. On the basis of the principal stresses σ1 and σ3 obtained from
“elastic calculations”, the permanent strains/deformations based on the εp-model (see Chapter
6) were thus calculated year by year.
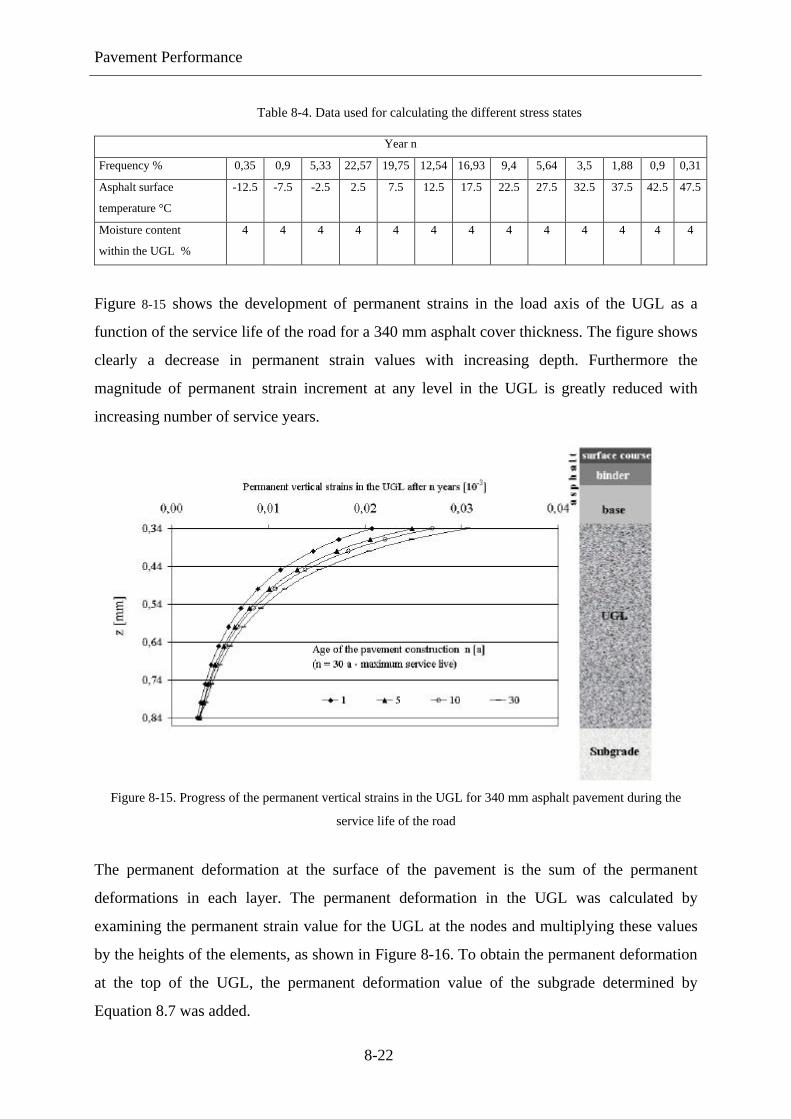
Pavement Performance
8-22
Table 8-4. Data used for calculating the different stress states
Year n
Frequency % 0,35 0,9 5,33 22,57 19,75 12,54 16,93 9,4 5,64 3,5 1,88 0,9 0,31
Asphalt surface
temperature °C
-12.5 -7.5 -2.5 2.5 7.5 12.5 17.5 22.5 27.5 32.5 37.5 42.5 47.5
Moisture content
within the UGL %
4 4 4 4 4 4 4 4 4 4 4 4 4
Figure 8-15 shows the development of permanent strains in the load axis of the UGL as a
function of the service life of the road for a 340 mm asphalt cover thickness. The figure shows
clearly a decrease in permanent strain values with increasing depth. Furthermore the
magnitude of permanent strain increment at any level in the UGL is greatly reduced with
increasing number of service years.
Figure 8-15. Progress of the permanent vertical strains in the UGL for 340 mm asphalt pavement during the
service life of the road
The permanent deformation at the surface of the pavement is the sum of the permanent
deformations in each layer. The permanent deformation in the UGL was calculated by
examining the permanent strain value for the UGL at the nodes and multiplying these values
by the heights of the elements, as shown in Figure 8-16. To obtain the permanent deformation
at the top of the UGL, the permanent deformation value of the subgrade determined by
Equation 8.7 was added.
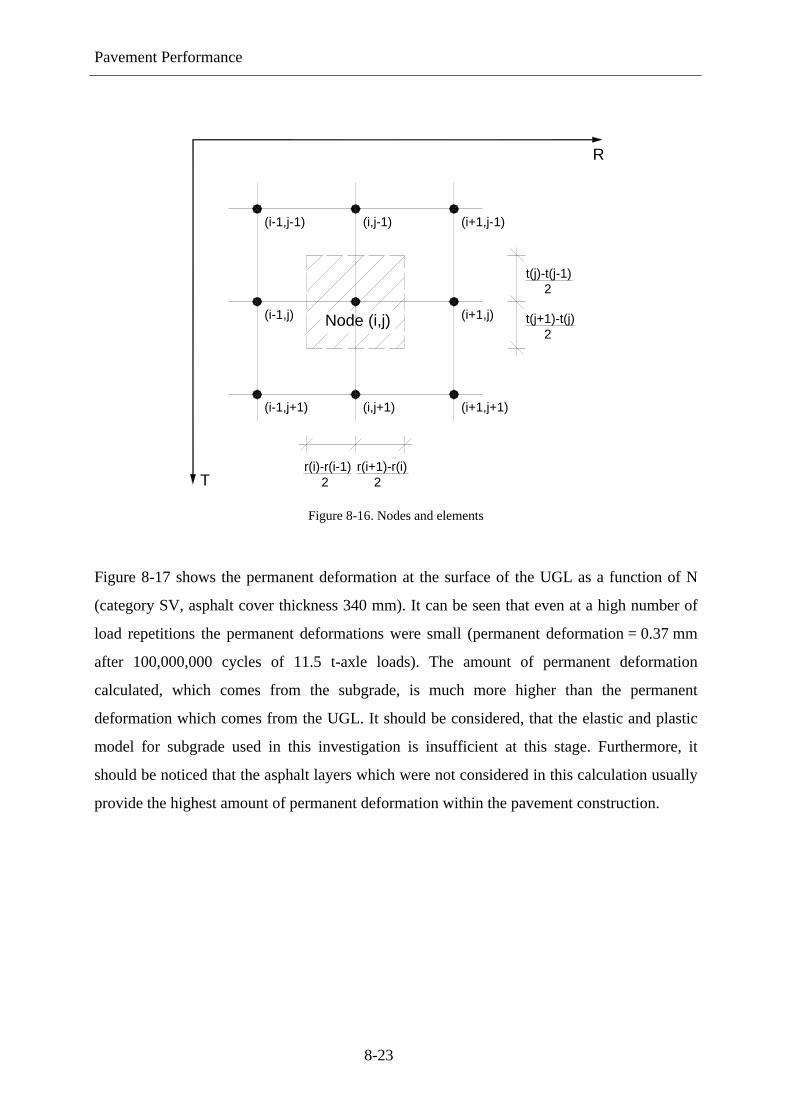
Pavement Performance
8-23
R
T
Node (i,j)
(i-1,j-1)
(i-1,j)
(i-1,j+1) (i,j+1)
(i,j-1) (i+1,j-1)
(i+1,j)
(i+1,j+1)
t(j)-t(j-1) 2
t(j+1)-t(j) 2
r(i)-r(i-1) 2
r(i+1)-r(i) 2
Figure 8-16. Nodes and elements
Figure 8-17 shows the permanent deformation at the surface of the UGL as a function of N
(category SV, asphalt cover thickness 340 mm). It can be seen that even at a high number of
load repetitions the permanent deformations were small (permanent deformation = 0.37 mm
after 100,000,000 cycles of 11.5 t-axle loads). The amount of permanent deformation
calculated, which comes from the subgrade, is much more higher than the permanent
deformation which comes from the UGL. It should be considered, that the elastic and plastic
model for subgrade used in this investigation is insufficient at this stage. Furthermore, it
should be noticed that the asphalt layers which were not considered in this calculation usually
provide the highest amount of permanent deformation within the pavement construction.
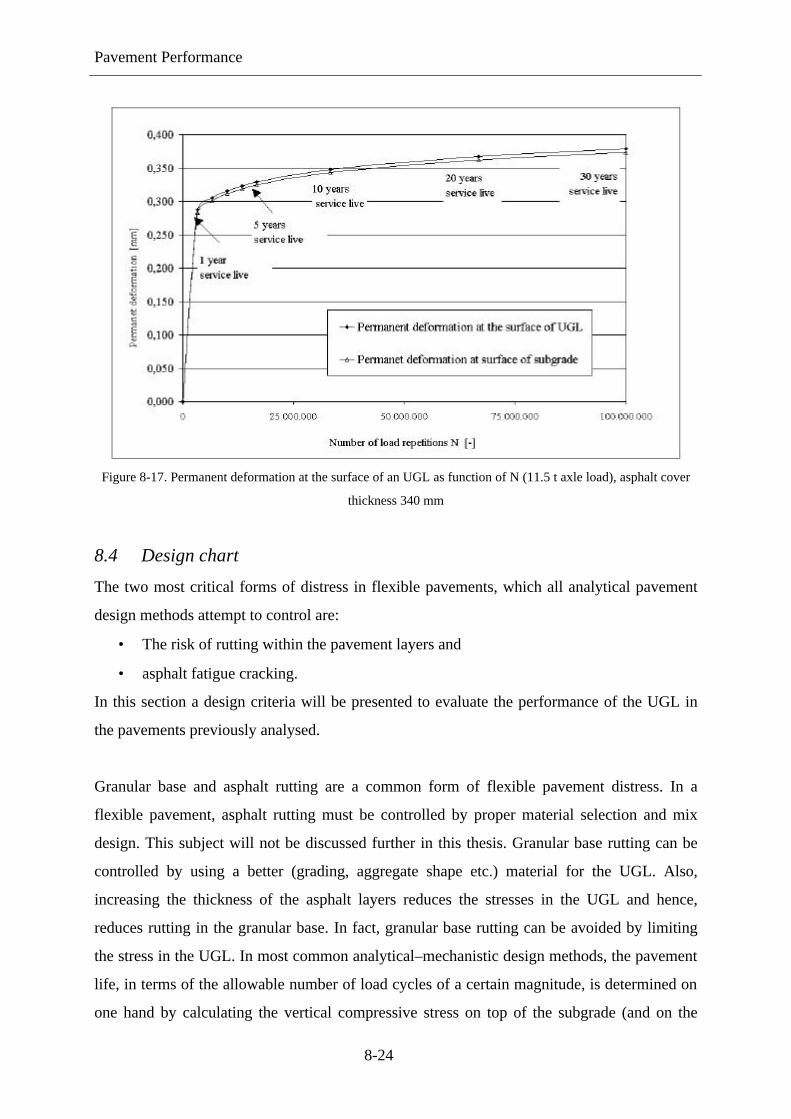
Pavement Performance
8-24
Figure 8-17. Permanent deformation at the surface of an UGL as function of N (11.5 t axle load), asphalt cover
thickness 340 mm
8.4 Design chart
The two most critical forms of distress in flexible pavements, which all analytical pavement
design methods attempt to control are:
• The risk of rutting within the pavement layers and
• asphalt fatigue cracking.
In this section a design criteria will be presented to evaluate the performance of the UGL in
the pavements previously analysed.
Granular base and asphalt rutting are a common form of flexible pavement distress. In a
flexible pavement, asphalt rutting must be controlled by proper material selection and mix
design. This subject will not be discussed further in this thesis. Granular base rutting can be
controlled by using a better (grading, aggregate shape etc.) material for the UGL. Also,
increasing the thickness of the asphalt layers reduces the stresses in the UGL and hence,
reduces rutting in the granular base. In fact, granular base rutting can be avoided by limiting
the stress in the UGL. In most common analytical–mechanistic design methods, the pavement
life, in terms of the allowable number of load cycles of a certain magnitude, is determined on
one hand by calculating the vertical compressive stress on top of the subgrade (and on the
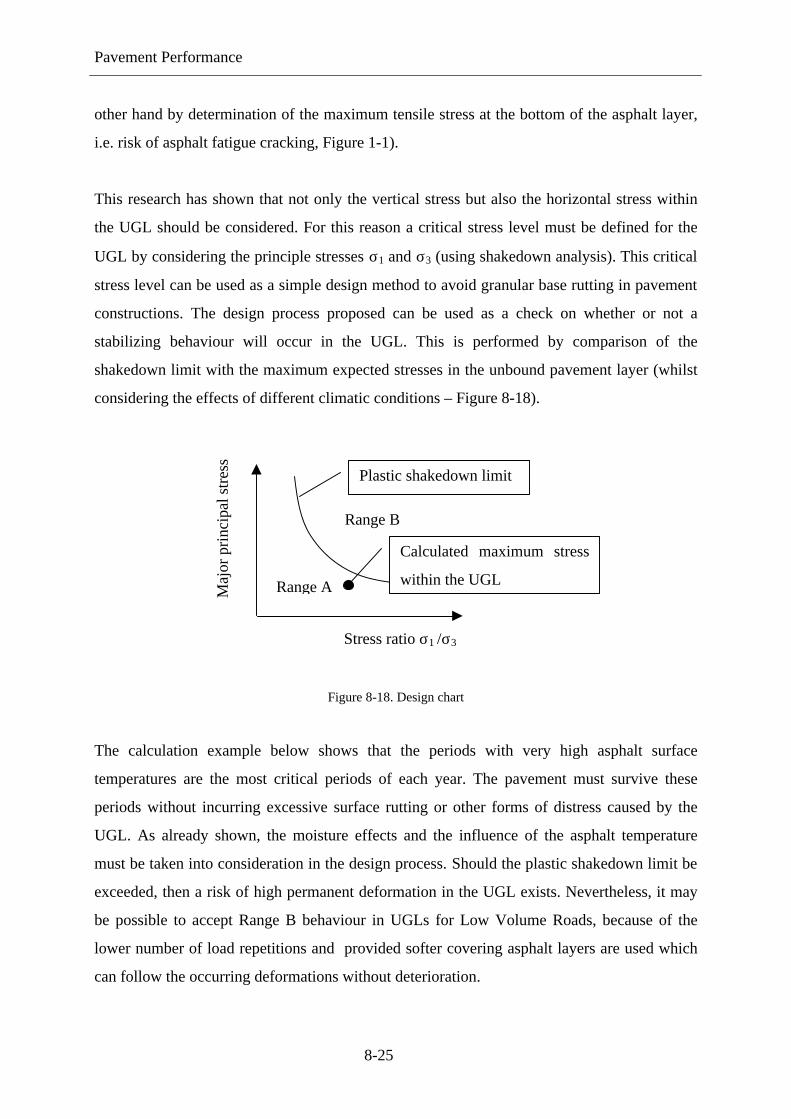
Pavement Performance
8-25
other hand by determination of the maximum tensile stress at the bottom of the asphalt layer,
i.e. risk of asphalt fatigue cracking, Figure 1-1).
This research has shown that not only the vertical stress but also the horizontal stress within
the UGL should be considered. For this reason a critical stress level must be defined for the
UGL by considering the principle stresses σ1 and σ3 (using shakedown analysis). This critical
stress level can be used as a simple design method to avoid granular base rutting in pavement
constructions. The design process proposed can be used as a check on whether or not a
stabilizing behaviour will occur in the UGL. This is performed by comparison of the
shakedown limit with the maximum expected stresses in the unbound pavement layer (whilst
considering the effects of different climatic conditions – Figure 8-18).
Figure 8-18. Design chart
The calculation example below shows that the periods with very high asphalt surface
temperatures are the most critical periods of each year. The pavement must survive these
periods without incurring excessive surface rutting or other forms of distress caused by the
UGL. As already shown, the moisture effects and the influence of the asphalt temperature
must be taken into consideration in the design process. Should the plastic shakedown limit be
exceeded, then a risk of high permanent deformation in the UGL exists. Nevertheless, it may
be possible to accept Range B behaviour in UGLs for Low Volume Roads, because of the
lower number of load repetitions and provided softer covering asphalt layers are used which
can follow the occurring deformations without deterioration.
Stress ratio σ1 /σ3
Maj
or p
rinc
ipal
str
ess
Range B
Range A
Plastic shakedown limit
Calculated maximum stress
within the UGL

Pavement Performance
8-26
The principal stresses σ1 and σ3 were calculated using the vertical and horizontal stress at the
top of the UGL at different climatic conditions (different temperatures and moisture contents
according to Figure 8-5). The existing stresses, calculated by the FE-program were used as
input for the shakedown analysis (Figure 8-19) to predict the risk of rutting within the UGL.
Figure 8-19. Existing stresses in the UGL for different asphalt surface temperatures in the load axis, 340 mm
asphalt pavement [NUM 03]
Figure 8-20 shows a comparison of the existing stress ratios and the plastic shakedown limits
of a Granodiorite. The stresses developed in the UGL at different pavement surface
temperatures were highly dependent on the stiffness of the asphalt layer. As the illustration
reveals, the stress ratios calculated by FENLAP [ALM 91] for the pavements with 220 mm
asphalt cover were found to be nearly all within Range A – i.e. stabilized behaviour (except
for the stress at an asphalt surface temperature of 47.5 °C which was above the plastic
shakedown limit). Thus there is no danger of large permanent deformations in the UGL. Even
though the plastic shakedown limit for the 5 % moisture is significantly lower than the limit
for 4 %, the increase in stress was insignificant at higher moisture content although in this
example only a few data points were available. This is mainly because the asphalt surface
temperatures during spring-thawing period were very low. If the situation arises where a
combination of high surface temperatures and high moisture contents (e.g. in case of high
water table) exists, then the risk of rutting within the UGL would be much higher.
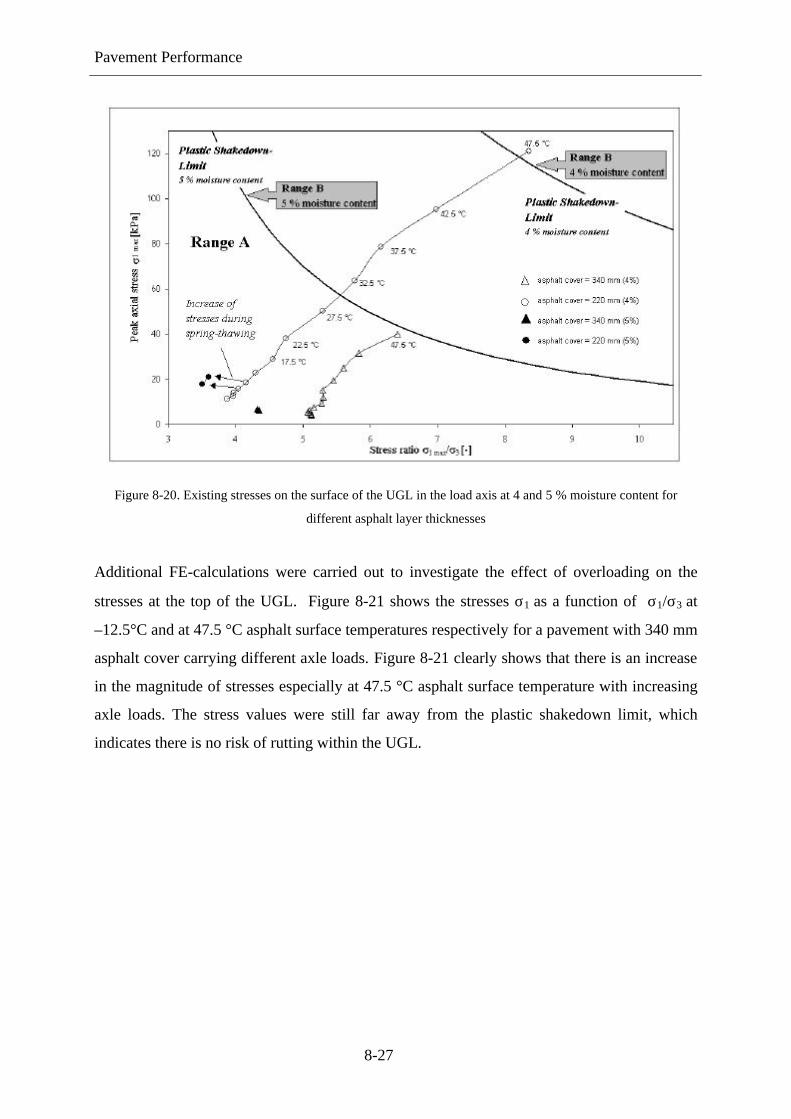
Pavement Performance
8-27
Figure 8-20. Existing stresses on the surface of the UGL in the load axis at 4 and 5 % moisture content for
different asphalt layer thicknesses
Additional FE-calculations were carried out to investigate the effect of overloading on the
stresses at the top of the UGL. Figure 8-21 shows the stresses σ1 as a function of σ1/σ3 at
–12.5°C and at 47.5 °C asphalt surface temperatures respectively for a pavement with 340 mm
asphalt cover carrying different axle loads. Figure 8-21 clearly shows that there is an increase
in the magnitude of stresses especially at 47.5 °C asphalt surface temperature with increasing
axle loads. The stress values were still far away from the plastic shakedown limit, which
indicates there is no risk of rutting within the UGL.

Pavement Performance
8-28
Figure 8-21. Existing stresses on the surface of the UGL in the load axis at different axle loads,
asphalt cover thickness 340 mm
FE-calculations were performed on two UGLs each having a different aggregate type (i.e.
Sandy Gravel and Granodiorite) but with the same grading M, the same DOC and
approximately the same moisture content. The elastic parameters used in the FE calculations
for the Granodiorite are listed in Table 8-2 and for the Sandy Gravel are listed in Appendix C,
Table C-3. Due to the different resilient properties of the Sandy Gravel and the Granodiorite,
the calculated stresses on top of the UGL were also different (Figure 8-22). However, when
considering the different plastic shakedown limits of the Sandy Gravel and the Granodiorite,
there is probably the same risk of rutting within an UGL of either material type.

Pavement Performance
8-29
Figure 8-22. Existing stresses on the surface of the UGL in the load axis for Sandy Gravel and Granodiorite
asphalt cover thickness 340 mm
Finally it can be concluded that, if the prevalent stresses are within the Range A there is no
risk of high permanent deformations or rutting within the UGL and permanent deformation
calculations are not necessary. If the stresses are within the Range B – there is a risk of rutting
at a high number of load cycles. In such a case, permanent deformation calculations must be
performed. Range C should not appear in a well-designed pavement.
A major limitation of the resilient FENLAP calculations is that Poisson’s ratio are modelled
stress dependently but are limited to µ < 0.5. VAN NIEKERK observed from the resilient
triaxial testing µ values well in excess of 0.5 (resilient dilatancy) at higher deviatoric stress
ratios. Dilatant behaviour allows heavily stressed elements to build up increasing confinement
and thus reduces permanent deformation [NIE 02]. Probably in Range A no dilatnacy will
occur because of the low load level, but in Range B and C this effect should be considered on
modelling the resilient and permanent deformation behaviour of UGMs.
It is possible that plastic behaviour will appear only locally in an UGL. Even so, no
deformation in the UGL should occur, because provided the plastic zones are less than a
certain size, the bound layers will bridge these zones. However, insufficient experience is

Pavement Performance
8-30
currently available to confirm the reliability of this methodology linking stress range
boundaries as defined by RLT tests and in-situ performance. For this reason, users should
confirm predictions made using the above approach by experimenting with alternative means
of verification (e.g. from experience or from monitoring performance of experimental roads).
The main strength of the chart supposed is that the effects of climatic conditions (e.g.
moisture condition within the UGL), loading variables and material quality on the
deformation behaviour of UGLs can be assessed.

Conclusions
9-1
9 CONCLUSIONS
9.1 Introduction
The design of pavements is in essence a process intended to find the most economical
combination of layer thicknesses and material types, taking into account the properties of the
natural subgrade, the traffic to be carried during the service life of the road and the climatic
conditions.
In many countries traditional design methods are more or less empirical but there exists,
worldwide, an increasing desire to develop analytical design approaches. A pre-requisite of
any successful analytical method is the availability of reliable experimental measurements and
an appropriate mathematical characterization of the permanent deformation behaviour of
different pavement materials which also includes Unbound Granular Materials (UGMs). As
far as the resilient behaviour of the pavement is concerned there is a wide range of material
models, computation tools and design procedures available. The situation regarding the
behaviour of the UGL within the whole pavement structure with respect to the accumulation
of permanent deformations under repeated traffic loading is much less well developed and it
is this area to which this PhD thesis contributes.
The most important objectives of this work were the formulation of an appropriate
mathematical model supported by data from experimental investigations into the permanent
deformation behaviour of UGMs when used in Unbound Granular Layers (UGLs) in
pavement constructions. Available models for the permanent deformation behaviour were
investigated to assess their suitability and as a result, an improved model was developed. To
generate data for the model, the permanent strain behaviour of UGMs has been investigated
using the Repeated Load Triaxial (RLT) test. Part of the research’s goal was to determine the
critical stress condition that defines the boundary between stable (non-rutting) and unstable
(rutting) conditions in an UGL that forms a part of a pavement. This research work will form
a vital component for input into a FE-program to model the entire pavement behaviour as a
part of an analytical pavement design methodology, which is currently under development at
the Chair of Pavement Engineering at Dresden University of Technology.

Conclusions
9-2
The background to this work originates from investigations into the non-linear elastic stress-
strain-behaviour of UGMs that have been carried out for the past 10 years at Dresden
University of Technology.
9.2 Literature Review
The aim of the literature review was to establish the extent of the current understanding of the
permanent deformation behaviour of UGMs. The review was focused on collecting findings
regarding different factors affecting the permanent deformation behaviour of UGMs and the
available modelling techniques.
The permanent deformation behaviour of UGMs subjected to dynamic loading is mainly
affected by the following factors:
• number of load cycles
• moisture content
• stress history
• density
• grading
• physical properties of aggregate particles
• stress level.
In the past, the permanent deformation of aggregates for pavement applications has been
modelled in a variety of ways. Some of the models are logarithmic with respect to number of
loading cycles whilst others are hyperbolic, tending towards an asymptotic value of
deformation with increasing number of load applications. To implement the laboratory
measured permanent strain development in the computation of permanent strain development
in a pavement structure, the permanent strain in the materials has to be known as a function of
both the number of load cycles and the in-situ stresses in the materials.
In recent years, the use of the shakedown concept has been suggested for the prediction of
long term performance of pavement structures. The essence of a shakedown analysis is to
determine the critical shakedown load for a given combination of pavement layer thicknesses,
material types and environmental conditions. Pavements operating above the critical
shakedown load are predicted to exhibit increased accumulation of permanent strains under

Conclusions
9-3
long term repeated loading conditions that eventually lead to incremental collapse (e.g.
rutting). Those pavements operating at load levels below this critical shakedown load may
exhibit some distress, but should settle down and reach an equilibrium state in which no
further mechanical deterioration occurs. This accepted understanding of the shakedown
concept was described in detail in the literature review. The following main conclusion can be
drawn from the literature review:
• The accuracy and reliability of modelling the permanent deformation behaviour of UGMs
in a pavement scenario would be greatly improved by adopting the shakedown concept.
9.3 Laboratory Experiments
The results of a large number of RLT tests performed in the Laboratory of the Centre for
Pavement Engineering at the University of Nottingham form the background material and the
basis of this investigation. Using RLT test results, the permanent deformation behaviour of a
Granodiorite, a Diabase and a Sandy Gravel were studied in some detail. Based on an analysis
of laboratory test results, the following conclusions can be drawn:
• It has been shown that the shakedown approach can be used to characterize the
deformation behaviour of UGM in pavement constructions. The application of the
shakedown concept to UGM as used in pavement constructions is feasible, although
modifications have to be made to allow for the particular response of individual UGM
types to repeated loading.
• Behaviour can be categorized into 3 possible Ranges A, B or C. If the UGLs behave in a
manner corresponding to Range A, the pavement will “shake down”. After post-
compaction deformations, no further permanent strains develop and the material
subsequently responds elastically. Thus Range A is permitted in a pavement, provided that
the accumulated strain before the development of fully resilient behaviour is sufficiently
small. The material in Range B does not “shake down”, instead it will achieve failure at a
very high number of load repetitions. In such a case the resilient strains are no longer
constant and will increase slowly with increasing number of load cycles (decrease of
stiffness). Range C behaviour, i.e. incremental collapse or failure, should not be allowed
to occur in a well designed pavement.
• Analysis of the results from many permanent deformation RLT tests revealed an
exponential relationship (Equation 5.1) between the applied stresses (σ1max, σc) and the

Conclusions
9-4
boundaries (shakedown limits) of the various deformation responses (i.e. between Ranges
A, B and C). A practical method of defining the range boundaries has been proposed as
follows:
β
σσ
ασ
⋅=
3
max1max1 [5.1]
where:
σ1max [kPa] peak axial stress
σc [kPa] confining pressure
α [kPa] material parameter
β [-] material parameter.
Naturally, the shakedown limits of UGLs are strongly dependent on the material properties
and on seasonal effects.
• Shakedown limit calculations can be used to predict whether or not stable behaviour occurs
in the UGL of a pavement construction. The shakedown analysis of RLT test results can be
used for ranking materials as a performance specification method to determine the
resistance against rutting of UGMs.
• As there is an associated change in the resilient behaviour for materials operating in the
various ranges, it is recommended that the observed response Ranges A, B and C should
form the basis for modelling permanent and resilient deformation behaviour. Thus material
laws have to be developed for each separate range. An empirical approach was formulated
to characterize the permanent deformation behaviour in a stress dependent way in the
Ranges A, B and C.
• The permanent deformation response is affected by several factors. In this research the
influence of the grading and aggregate type on the permanent deformation behaviour was
investigated. The RLT test results showed different permanent deformation behaviour and
also various shakedown limits for natural and crushed aggregates at the same grading. It
was concluded that if the aggregate grading is within the German specification limits for
UGMs [ZTVT-StB 95], the precise gradation line will not significantly influence the
permanent deformation behaviour.

Conclusions
9-5
9.4 Design Chart and Pavement Performance
A new simple design approach was described that utilizes test results from the RLT apparatus
to establish the risk level of permanent deformations in the UGL in pavement constructions.
From this data a serviceability limit line (plastic shakedown limit) stress boundary for the
UGMs was defined for different moisture contents and aggregate types. Below this line the
materials will have stable behaviour. Using the serviceability limit line, a FE program
FENLAP was used to predict whether or not stable behaviour occurs in the UGMs. To
calculate the stress in the UGL, a non-linear elastic model (elastic DRESDEN-Model), which
was described in the thesis, was already implemented into the FE program.
Two different examples of flexible pavement constructions (340 mm and 220 mm asphalt
layer thicknesses) were assessed using FENLAP and the serviceability limit lines taking into
consideration the moisture effect (increase of moisture content in the UGLs during the spring-
thawing period) and the influence of the asphalt temperature. The spring–thawing period
during which the moisture content in the UGLs is high, is often the most critical period each
year which the pavement must survive without incurring excessive surface rutting or other
forms of distress. The moisture content will strongly influence the resilient and permanent
properties and consequently the shakedown limits of the UGMs. Therefore the stresses at a
defined moisture content must be compared with the shakedown limits at this moisture
content. The stress distribution calculated by FENLAP for the two examples showed that
almost all the stresses were below the critical stress level, i.e. no risk of rutting in the UGL. It
was also evident that a 220 mm asphalt pavement provides little margin against rutting failure
at high asphalt surface temperatures under heavily trafficked roads.
Furthermore, the influence of increasing the axle loads and of using different UGM types as
granular base layer (Sandy Gravel and Granodiorite) on the pavement structural response
were investigated. The FE calculations for three different loading conditions (11.5 t, 13 t and
15.5 t axle loads) on a pavement with a 340 mm thick asphalt layer showed a significant
increase of the stresses within the UGL but only at high asphalt temperatures. Nonetheless,
the maximal stresses within the UGL were still within the Range A, i.e. there was no risk of
rutting in the UGL. Due to the different resilient properties of the Sandy Gravel and the
Granodiorite, the calculated stresses on top of the UGL were also different. However, when
considering the different plastic shakedown limits of the Sandy Gravel and the Granodiorite,
there is obviously the same risk of rutting within the UGL for both material types.
Conclusions
9-6
Additional, permanent deformation calculations were performed on the UGL taking into
consideration the stress history. The results clearly demonstrate that, for pavement
constructions with thick asphalt layers, there is no risk of rutting in the granular base, even at
high number of load repetitions.
The study showed that the proposed design approach is a very satisfactory simple method to
assess the risk against rutting in an UGL. If the stresses in the UGL are within the stable range
(A), an exact determination of the permanent deformation of the UGL is not necessary to
ensure satisfactory long term performance of the UGL.
Recommendations for further Research
10-1
10 RECOMMENDATIONS FOR FURTHER RESEARCH
In this research it was only possible to conduct detailed investigations into the permanent
deformation behaviour of selected materials and design examples. In order to carry forward
this research work, the following points must be addressed in any future investigations:
1. A suitable model for the mathematical description of the permanent deformation
behaviour in the Range A was introduced. In the Unbound Granular Layer (UGL) of Low
Volume Roads much higher stresses will occur probably in the Range B as the thickness
of the asphalt layers are much smaller compared to highly trafficked roads. For
constructions with thin asphalt pavements there is a risk of rutting at high number of load
repetitions. In this case, estimating the amount of permanent deformation is necessary to
determine the number of load applications that the pavement can withstand without
incurring excessive surface rutting. A prerequisite is the development of elastic and
plastic models to describe the deformation behaviour of Unbound Granular Materials
(UGMs) in the Range B. It seems, that the material in the Range B does not “shake
down”, rather it will achieve a failure at a very high number of load repetitions during
Repeated Load Triaxial (RLT) testing, probably caused by dilatancy. The positive effect
of dilatant behaviour at high stress levels (dialatancy (µ > 0.5) allows materials to build
up higher confinement) should take into consideration on modelling Range B and C
behaviour. Further tests may be necessary to investigate this dilatant behaviour.
2. Based on the RLT tests, the stress dependent shakedown limits (critical shakedown load)
could only be determined for selected materials in this investigation. Further research
should be concentrated on the influence of parameters such as DOC and moisture content
as these factors appear to have an influence on the modes of plastic strain observed.
Subsequently, the determination of the range boundary parameters as a function of the
values of DOC, aggregate type, moisture content etc. should be investigated. The
suitability of new materials such as recycled materials should be assessed using the
shakedown limit calculations and possibly ranked against more conventional UGMs.
3. To minimise the number of RLT tests required to define the shakedown limits, it would
seem possible to carry out Multi Stage (MS) tests at different confining pressures. Thus
the testing effort would be minimized, since as mentioned earlier the execution of RLT
Recommendations for further Research
10-2
tests is very time consuming. A practicable methodology to define the shakedown limits
with MS RLT test results should be developed.
4. Insufficient experience is currently available to confirm the reliability of this proposed
linkage between range boundaries defined via the RLT test and in-situ performance. For
this reason, further investigations on this specific topic are necessary to confirm
predictions made by the approach introduced in this investigation by relying on
alternative means, e.g. test tracks.
5. The deformation properties of the asphalt bound layers were obtained from a relationship
developed by FRANCKEN and VERSTRATEN that relates the modulus of asphalt
(assumed to be stress independent) to asphalt mix composition, temperature and time of
loading. For further investigations, the asphalt layers should be modelled using non-linear
visco-elastic and non-linear visco-plastic models taking into account the shakedown
approach.
6. With such models that can describe the complex deformation behaviour of the bound and
unbound layers in the pavement construction, it is possible to conduct FE-calculations for
the design of pavement constructions including the predictions of fatigue and rutting
behaviour.

References
XIX
REFERENCES [ALL 73] Allen J, The Effect of Non-Constant Lateral Pressures of the
Resilient Response of Granular Materials. PhD Thesis, Univer-sity of Illinois, Urbana 1973.
[ALM 91] Almeida J R, Öser M, Numrich R, Program FENLAP users
guide. Report No. PR 91010, Department of Civil Engineering, University of Nottingham1991, Dresden University of Technol-ogy, 2002.
[ARS 00] Arslan U et al., Verhalten von Sand im zyklischen Triaxialver-
such, Böden unter fast zyklischer Belastung (Behaviour of sand under cyclic load - in German). Schriftenreihe des Institutes für Grundbau und Bodenmechanik der Ruhr-Universität Bochum Heft 32, Bochum 2000.
[AASHTO 86] AASHTO guide for the design of pavement structures. American
Association of State Highways and Transportation Officials, Washington D.C., 1986.
[BAR 72] Barksdale R D, Laboratory Evaluation of Rutting in Base
Course Materials. Proceeding of 3rd International Conference on the Structural Design of Asphalt Pavements, London, pp 161-174, 1972.
[BAR 89] Barksdale R D, Itani S Y, Influence of aggregate shape on base
behaviour. Transportation Research Record 1227, Transporta-tion Research Board, Washington, D.C., pp 173–182, 1989.
[BAR 91] Barksdale R D, The Aggregate Handbook, National Stone Asso-
ciation, Washington D.C., 1991. [BEL 97] Belt J, Ryynänen T, Ehrola E, Mechanical properties of un-
bound base course. Proceedings of the 8th International Confer-ence on Asphalt Pavements, Seattle , Vol. 1 pp 771-781, 1997.
[BOY 76] Boyce J R, The Behaviour of a Granular Material Under re-
peated loading. PhD Thesis, Department of Civil Engineering, University of Nottingham, 1976.
[BRO 75] Brown S F, Hyde A F L, Significance of Cyclic Confining Stress
in Repeated Load Triaxiale Testing of Granular Material, Transportation Research Record 537, Transportation Research Board, Washington, D.C., pp 49-58, 1975.
[BRO 85] Brown S F, Brunton J M, Stock A F, The analytical design of
bituminous pavements. Proceedings of the Institution of Civil Engineers Vol. 79, Part 2, pp 1-31, 1985.

References
XX
[CHA 90] Chan F W K, Permanent Deformation Resistance of Granular Layers in Pavements. PhD Thesis, Department of Civil Engi-neering, University of Nottingham, 1990.
[CHE 94] Cheung L W, Laboratory assessment for pavement foundation
materials. PhD Thesis, Department of Civil Engineering, Uni-versity of Nottingham, 1994.
[COL 93] Collins I F, Wang A P, Saunders L R, Shakedown-Theory and
the Design of Unbound Pavements. Australian Road Research Board, Road and Transport Research, Vol. 2, No. 4, pp. 28-37, 1993.
[COL 98] Collins I F, Boulbibane M, The application of shakedown theory
to pavement design. Metals and Materials, Vol. 4, No. 4, pp 832-837, 1998.
[CUN 96] Cundall P, Konietzky H, Potyondy O, PFC - Ein neues
Werkzeug für numerische Modellierungen (PFC - a new model for numeric modelling - in German). Bautechnik 73(8), pp 492-498, 1996.
[DAW 90] Dawson A R, Introduction to soils and granular materials, Lec-
ture notes from Residential Course, Bituminous Pavements - materials, design and evaluation, Department of Civil Engineer-ing, University of Nottingham, 1990.
[DAW 99] Dawson A R, Wellner F, Plastic Behaviour of Granular Materi-
als. Final Report ARC Project 933, Department of Civil Engineering, University of Nottingham, Reference PRG990, 1999.
[DIN 18 127] Proctor test (Proctorversuch - in German). Deutsches Institut für Normung e.V., Berlin 1993.
[FGSV 03] Arbeitspapier über die mechanischen Eigenschaften von Asphalt
(Mechanical properties of asphalt - in German). Forschungsge-sellschaft für Straßen- und Verkehrswesen, Köln, estimated completion date 2003.
[FÖR 96] Förster W, Mechanische Eigenschaften von Lockergesteinen
(Mechanical properties of unbound granular materials – in Ger-man) Teubner Studienbücher Bauwesen, 1996.
[FRA 77] Francken L, Verstraten, Permanent Deformation Law of Bitumi-
nous Road Mixes in Repeated Triaxial Compression. Proceed-ings of 4th Conference Structural Design of Asphalt Pavements, Ann Habour, 1977.

References
XXI
[FRE 82] Freeme C R, Maree J H, Vilojen A W, Mechanistic design for asphalt pavements and verification using the Heavy Vehicle Simulator. Proceedings of 5th Conference Structural Design of Asphalt Pavements, pp156-173, Delft 1982.
[GLE 96] Gleitz T, Beitrag zur rechnerischen Erfassung des nichtlinearen
Spannungs-Verformungsverhaltens ungebundener Tragschicht-materialien in flexiblen Straßenkonstruktionen (Non-linear de-formation behaviour of unbound granular layers in pavement constructions – in German). PhD Thesis, Dresden University of Technology, 1996.
[HAY 1963] Haynes J H, Yoder E J, Effects of Repeated Loading on Gravel
and Crushed Stone Base Course Materials Used in the AASHO Road Test. Highway Research Record, No. 39, 1963.
[HER 82] Hertz H, Journal für reine und angewandte Mathematik (Jour-
nal for abstract and applied mathematics - in German), Band 92 pp 156, 1882.
[HES 98] Hess R, Calibration of models for preservation of road con-
structions (in German), Diploma Thesis, University of Han-nover, 1998.
[HEY 96] Heydinger A G, Xie, Q L, Randolph B W, Gupta J D, Analysis
of resilient modulus of dense and open-graded aggregates. Transportation Research Record 1547, Transportation Research Board, Washington, D.C., pp 1–6, 1996.
[HIC 71] Hicks G R, Monismith C L, Factors influencing the resilient
response of granular materials. Highway Research Record, No. 345, pp 15-31, 1971.
[HOL 69] Holubec, Cyclic Creep of Granular materials, Department of
Highways, Ontario, Report No. RR147, 1969. [HOF 99] Hoff I, Nordal S, Nordal R S, Constitutive model for unbound
granular materials based on hyperelasticity. Proceedings of an International Workshop on Modelling and advanced Testing for Unbound Granular Materials, Lisbon, Balkema 1999, pp. 187-196.
[HUR 97] Huurman M, Permanent deformation in concrete block pave-
ments, PhD Thesis, Delft University of Technology, pp 119 – 125, 1997.
[HYD 74] Hyde A F L, Repeated Load triaxial Testing of Soils, PhD The-
sis, Department of Civil Engineering, University of Nottingham, 1974.
References
XXII
[JAN 85] Janssen D, Effect of heavy axle loads on rutting of flexible pave-
ment constructions ( in German). In Mitteilungen aus dem Insti-tut für Verkehrswirtschaft), University of Hannover, Vol. 3, 1985.
[JOH 86] Johnson, Plastic Flow, residual stresses and SHAKEDOWN in
rolling contact. Proceedings of the 2nd International Conference on Contact Mechanics and Wear of Rail/Wheel Systems, Uni-versity of Rhode Island, Waterloo Ontario, 1986.
[KEN 62] Kent M F, AASHO road test vehicle operating costs related to
gross weight, Highway Research Board, Special Report 73, pp 149 –65, 1962.
[KIE 01] Kiehne A, Program for analysis of triaxial test results (Pro-gramm zur Auswertung der Triaxialversuche), Dresden Univer-sity of Technology, 2001.
[KLE 90] Klemt R, The influence of the friction on the deformation behav-
iour of granular base materials (in German), Diploma Thesis 494, Dresden University of Technology,1990.
[KOL 97] Kolisoja P, Resilient Deformation Characteristics of Granular Materials. PhD Thesis, Tampere University of Technology, 1997.
[KOL 98] Kolisoja P, Large scale dynamic triaxial tests III. Tampere Uni-
versity of Technology, 1998. [LAS 71] Lashine A K, Dynamic Properties of Soils. Report No. 2, Sub-
mitted to Koninklijke/Shell Laboratories, Department of Civil Engineering, University of Nottingham, 1971.
[LEK 97] Lekarp F, Permanent deformation behaviour of unbound granu-
lar materials; Licentiate Thesis, Kungl Tekniska Högskolan, 1997.
[LEK 00] Lekarp F, Isacsson U and Dawson A R, State of the Art. II: Per-
manent strain response of unbound aggregates, American Soc. Civil Eng’rs J'n'l. Transp. Eng., Vol. 126, No.1, pp 76-84, 2000.
[LEK 98] Lekarp F, Dawson A R, Some Influences on the Permanent De-
formation Behaviour of Unbound Ggranular Materials. US Transportation Research Board, TRB RE 960372, 1998.
[LIT 93] Little P H, The design of unsurfaced roads using geosynthetics.
Department of Civil Engineering, University of Nottingham, 1993.

References
XXIII
[MAR 82] Maree J H, Freeme C R, Van Zyl N J, Savage P F, The perma-nent deformation of pavements with untreated crushed stone bases and measured in Heavy Vehicle Simulator tests. Proceed-ings 10th Australian Research Board Conference Part 2, pp 16-28, 1982.
[MAR 77] Marek C R, Compaction of Graded Aggregate Bases and Sub-
bases. Proceedings, The American Society of Civil Engineers, Vol. 103, pp103-113, 1977.
[MOR 66] Morgan J R, The Response of Granular Materials to Repeated
Loading. Proceedings, 3rd Australian Road Board Conference, Sydney, pp 1178-1192, 1966.
[NIE 00] Van Niekerk A A, Van Scheers J, Muraya P, Kisimbi A, The
Effect of Compaction on the Mechanical Behaviour of Mix Granulate Base Course Materials and on Pavement Perform-ance, UNBAR 5, Nottingham, pp125-136, 2000.
[NIE 02] Van Niekerk A A, Mechanical behavior and performance of
granular bases and sub-bases in pavements. PhD Thesis, Delft University of Technology, Delft, 2002.
[NUM 03] Numrich R, Untersuchung zum nichtlinear-elastischen Span-
nungs-Verformungsverhalten von Tragschichten ohne Bindemit-tel (Non-linear-resilient deformation behaviour of unbound granular materials - in German). PhD Thesis, Dresden Univer-sity of Technology , 2003. (not published)
[PAP 79] Pappin J W, Characteristics of a Granular Material for Pave-
ment Analysis. PhD Thesis, Department of Civil Engineering, University of Nottingham, 1979.
[PAU 96] Paute J L, Hornych P and Benaben J P, Repeated load triaxial
testing of granular materials in the French Network of Labora-tories des Ponts et Chaussées. Flexible Pavements, Edited by A G Correia, (Proceedings, European Symposium on Flexible Pavements, Euroflex, 1983) Balkema, Rotterdam, pp 53-64, 1996.
[prEN 13286-7] Unbound and Hydraulically Bound Mixtures for Roads – Test
Methods, Part 7: Cyclic load triaxial test for Unbound Mixtures. Draft of European Standard Submitted to CEN Members prEN 13286-7, Brussels, 2002.
[POL 89] Pohlmann, Simmulation von Temperaturverteilungen und ther-
misch induzierten Zugspannungen in Asphaltstraßen (Simula-tionof temperature regime and of thermal induced tensile stresses in flexible pavements – in German), Schriftenreihe Insti-tut für Straßenwesen Braunschweig, Heft 9, 1989.

References
XXIV
[POW 84] Powell M J, Potter J F, Mathew h c, Nunn T, The structural de-sign of bituminous roads. Laboratory report 1132. Crowthorne, Transport and Research Laboratory, 1984.
[RAA 92] Raad L, Minassian G, Gartin S, Characterization of saturated
granular bases under repeated loads. Transportation Research Record 1369, Transportation Research Board, Washington, D.C., pp 73–82, 1992.
[RSTO 01] Richtlinie für die Standardisierung des Oberbaues von
Verkehrsflächen (Empirical German pavement design guideline – in German). Forschungsgesellschaft für Straßen- und Verke-hrswesen, Köln, 2001.
[SCH 97] Schott G, Schaper M, Worch, H, Werkstoffermüdung - Er-
müdungsfestigkeit (Material fatigue behaviour - fatigue strength- in German), Verlag für Grundstoffindustrie, Stuttgart, pp.88-89, 1997.
[SMI 73] Smith W S, Nair K, Development of procedures for characteri-
zation of untreated granular base coarse and asphalt-treated base course materials. Rep. No. FHWA-RD-74-61, Federal Highway Ad-ministration, Washington, D.C., 1973.
[SHA 83] Sharp R W, Shakedown-Analyses and the design of pavement
under moving surface load. PhD Thesis, University of Sydney, 1983.
[SHA 85] Sharp R W, Pavement Design Based on Shakedown Analysis.
Transportation Research Record 1022, Transportation Research Board, Washington, D.C., pp. 99-107, 1985.
[SHA 84] Sharp R W, Booker J R, Shakedown of Pavements under Mov-
ing Surface Loads, ASCE Journal of Transportation Engineer-ing, Vol. 110, No. 1, pp 1-14, 1984.
[SHW 80] Shaw P S, Stress-Strain Relationships for Granular Materials
under Repeated Loading. PhD Thesis, Department of Civil En-gineering , University of Nottingham,1980.
[SWE 90] Sweere G T H, Unbound granular bases for roads. PhD Thesis,
Delft University of Technology, 1990. [SHE 94] SHELL SPDM-PC User manual. Shell pavement design method
for use in a personal computer. Version 1994, Release 2,0, 1994. [THE 00] Theyse H L, The Development of Mechanistic-Empirical Per-
manent Deformation Design Models for Unbound Pavement Materials from Laboratory and Accelerated Pavement Test Data. UNBAR 5, pp 285-293, 2000.

References
XXV
[THO 87] Thom N H, Brown S F, Effect of Moisture on the Structural Per-formance of a Crushed-Limestone Road Base. Transportation Research Record 1121, Transportation Research Board, Wash-ington, D.C., pp 50-56, 1987.
[THO 88] Thom N H, Brown S F, The Effect of Grading and Density on
the Mechanical Properties of a Crushed Dolomitic Limestone, Proceedings, 14th Australian Road Research Board Conference, Materials and Testing, pp 94–10, 1988.
[THO 89] Thom N H, Brown S F, The mechanical properties of unbound
aggregates from various sources. UNBAR 3, Nottingham, pp 130-142,1989.
[TOU 98] Toussaint A, Gebrauchsverhalten von Tragschichten ohne Bin-
demittel in Abhängigkeit von den Mineralstoffeigenschaften (Be-haviour of unbound granular layers in dependence on the mineral properties – in German). Dresden University of Tech-nology, Vol. 3, 1998.
[VER 79] Verveka V, Raming Van de Spoordiepte Bij W gen met een Bi-
tumineuze Verharding. De Wegentechniek, Vol. XXIV, No. 3, pp 25-45, 1979.
[VUO 92] Vuong B, Influence of density and moisture content on dynamic
stress-strain behaviour of a low plasticity crushed rock. Rd. and Transp. Res., 1(2), pp 88–100, 1992,.
[WEL 94] Wellner F, Grundlagen zur Bemessung flexibler Straßenbefesti-
gungen mit Tragschichten ohne Bindemittel, (Basics elements for design of flexible pavements with granular materials – in German). Professorial Dissertation, Dresden University of Technology, 1994.
[WEL 00] Wellner F, Werkmeister S, Beitrag zur Untersuchung des Ver-
formungsverhaltens ungebundener Gesteinskörnungen mit Hilfe der SHAKEDOWN-Theorie (Deformation behaviour of Un-bound granular materials – in German), Straße und Autobahn 6/2000, pp 369 – 375, 2000.
[WEN 88] Wenzel J, Die Erfassung des Tragverhaltens ungebundener
Schichten in Straßenkonstruktionen (Bearing Capacity of un-bound granular layers in pavements – in German), Wissen-schaftliche Zeitschrift der Hochschule für Architektur und Bau-wesen Weimar, Reihe B, Heft 5, 1988.
[WER 01] Werkmeister S, Dawson A R, Wellner F, Permanent deforma-
tion behaviour of unbound granular materials and the shake-down-theory. Transportation Research Record No. 1757, Trans-portation Research Board, Washington, D.C., pp 75-81, 2001.

References
XXVI
[WER 02-1] Werkmeister S, Numrich R & Wellner, F, The Development of a Permanent Deformation Design Model for Unbound Granular Materials with the Shakedown-Concept, Bearing Capacity of Roads, Railways and Airfields: Proceedings of the 6th interna-tional symposium on the Bearing Capacity of Roads and Air-fields (BCRA), Lisbon (P), 24.-26. June 2002, Balkema (Rot-terdam) pp. 1081-1098, 2002.
[WER 02-2] Werkmeister S, Dawson A R, Wellner Modelling of Unbound
Granular Layers in Pavement Constructions, CD of the 9th In-ternational Conference on Asphalt Pavements (ISAP), Copenha-gen (DK), August 17-22 2002, Paper No. 1:66.
[WER 03-1] Werkmeister S, Dawson A R, Wellner F, Permanent deforma-
tion behavior of granular materials and the shakedown concept. Int. Journal Road Materials & Pavement Design (in press for 2003).
[WER 03-2] Werkmeister S, Dawson A R, Wellner F, Design of granular
pavement layers considering climatic conditions, Transportation Research Board Meeting, Washington, D.C., paper 03-2645, 2003.
[WOL 94] Wolff H and Visser A T, Incorporating elasto-plasticity in
granular layer pavement design. Proceedings, Instn. Civil Engi-neers Transportation Journal, No. 105, pp 259-272, 1994.
[YU 98] Yu H S, Hossain M Z, Lower bound shakedown analysis of lay-
ered pavements using discontinuous stress fields. Computer Methods in Applied Mechanics and Engineering, Vol. 167, pp 209-222, 1998.
[ZTVT-StB 95] Zusätzliche Technische Vertragsbedingungen und Richtlinien
für Tragschichten im Straßenbau (Specification for UGM used in Pavement Constructions - in German). Bundesministerium für Verkehr, Bonn, 1995.

A 1
APPENDIX A TEST PROGRAMME Table A - 1 Dynamic triaxial tests - test parameter - Granodiorite- grading M A - 2 Static failure tests - test parameter - Granodiorite- grading M A - 3 Dynamic triaxial tests - test parameter - Diabase - grading M A - 4 Dynamic triaxial tests - test parameter - Sandy Gravel- grading M A - 5 Dynamic triaxial tests - test parameter - Sandy Gravel- grading U A - 6 Dynamic triaxial tests - test parameter - Diabase - grading O A – 7 Crushing technique

A 2
Table A-1. Dynamic triaxial tests - test parameter - Granodiorite
Granodiorite
Grading M Dynamic Triaxial Tests
Nottingham ρd.target = 2.26 g/cm³ DOC = 100 %
w target = 4 %
σc σD σ1max σ1max/σc Number of load cycles
Shakedown Range εp
1 80,000 w
ρd
[kPa] [kPa] [kPa] [-] [-] [-] [0/00] [0/0]
[g/cm³]
40 40 80 2 80,000 A 0.226 3.73 2.28 40 80 120 3 300,000 A 0.27 3.69 2.25 40 120 160 4 280,000 A 0.52 3.61 2.25 40 160 200 5 50,000 A - 4 2.26 40 200 240 6 280,000 B 4.14 3.66 2.27 40 360 400 10 5,000 C - 4 2.26
70 35 105 1.5 100.000 A 0.475 4 2.26 70 70 140 2 280.000 A 0.258 3.68 2.25 70 105 175 2.5 280.000 A 0.374 3.68 2.25 70 140 210 3 80.000 A 0.739 3.73 2.25 70 175 245 3.5 1.000.000 A 0.908 3.69 2.25 70 210 280 4 250.000 A 0.97 4 2.26 70 245 315 4.5 280.000 A/B 1.45 3.61 2.25 70 280 350 5 100.000 B 2.08 4 2.26 70 315 385 5.5 280.000 B 2.28 3.77 2.25 70 350 420 6 100.000 B 3.906 4 2.26 70 420 490 7 100.000 C 20.21 4 2.26 70 490 560 8 100.000 C 16.29 4 2.26 70 560 630 9 100.000 C 57.85 4 2.26 70 700 770 11 20.000* C - 4 2.26 70 770 840 12 44* C - 4 2.26
140 70 210 1.5 100,000 A 0.32 4 2.26 140 140 280 2 300,000 A 0.41 3.72 2.26 140 210 350 2.5 300,000 A 0.87 3.89 2.25 140 280 420 3 855,000 B 1.89 3.26 2.25 140 350 490 3.5 1,000,000 B 2.97 3.77 2.25 140 420 560 4 100,000 B 4.17 3.8 2.25 140 560 700 5 100,000 C 24.73 3.8 2.25 140 700 840 6 60,000* C - 3.8 2.25 140 840 980 7 167* C - 3.8 2.25
210 105 315 1.5 100,000 A 0.45 3.8 2.25 210 157 367 1.75 1,00,000 A 0.39 3.78 2.26 210 210 420 2 270,000 A 0.69 3.72 2.25 210 262 472 2.25 1,000,000 B 0.72 3.68 2.25 210 315 525 2.5 80,000 B 2.09 - 2.25 210 367 577 2.75 270,000 B 1.54 3.72 2.25 210 420 630 3 80,000 B 2.63 3.77 2.25 210 630 840 4 20,000* C - 3.8 2.25 210 840 1050 5 28,000* C - 3.8 2.25
Multi-stage tests (after single stage test σ1max = 315 kPa, σc = 210 kPa) 210 210 420 2 10,000 A - 3.8 2.25 210 420 630 3 10,000 B - 3.8 2.25 210 630 840 4 10,000 C - 3.8 2.25
*Test Stop - because the deformations are to high
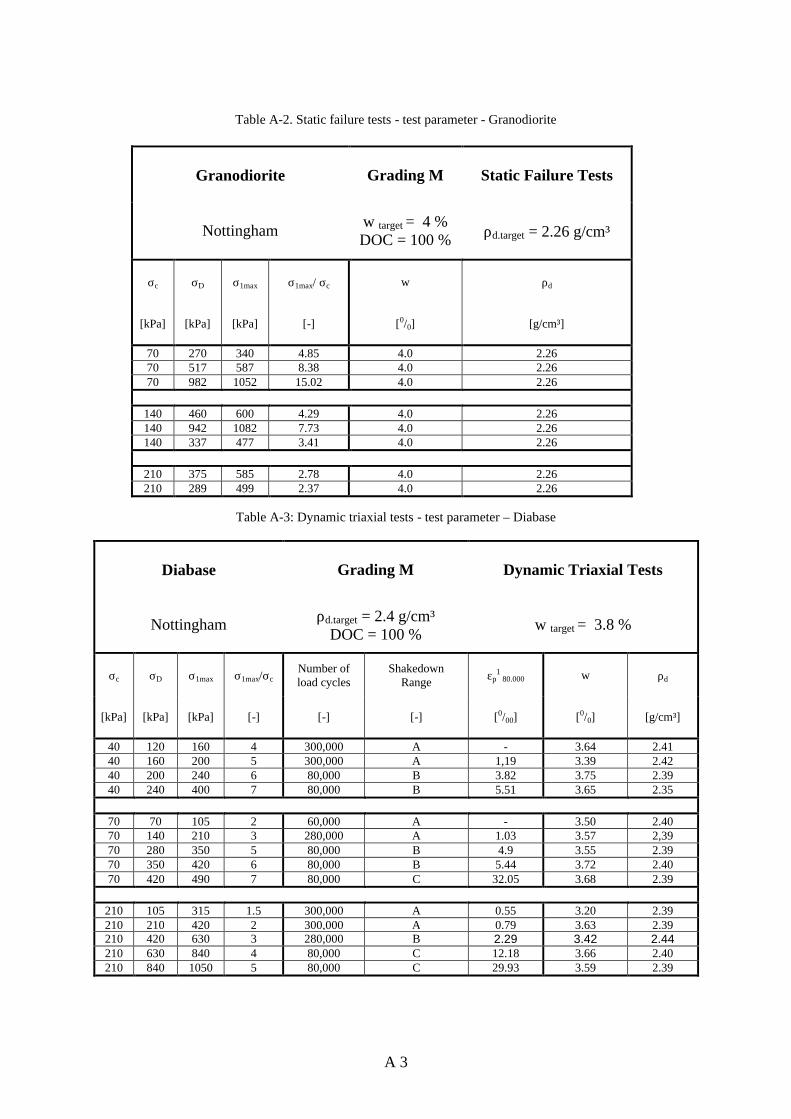
A 3
Table A-2. Static failure tests - test parameter - Granodiorite
Granodiorite
Grading M Static Failure Tests
Nottingham w target = 4 % DOC = 100 %
ρd.target = 2.26 g/cm³
σc σD σ1max σ1max/ σc w
ρd
[kPa] [kPa] [kPa] [-] [0/0]
[g/cm³]
70 270 340 4.85 4.0 2.26 70 517 587 8.38 4.0 2.26 70 982 1052 15.02 4.0 2.26
140 460 600 4.29 4.0 2.26 140 942 1082 7.73 4.0 2.26 140 337 477 3.41 4.0 2.26
210 375 585 2.78 4.0 2.26 210 289 499 2.37 4.0 2.26
Table A-3: Dynamic triaxial tests - test parameter – Diabase
Diabase
Grading M Dynamic Triaxial Tests
Nottingham ρd.target = 2.4 g/cm³ DOC = 100 %
w target = 3.8 %
σc σD σ1max σ1max/σc Number of load cycles
Shakedown Range εp
1 80.000 w
ρd
[kPa] [kPa] [kPa] [-] [-] [-] [0/00] [0/0]
[g/cm³]
40 120 160 4 300,000 A - 3.64 2.41 40 160 200 5 300,000 A 1,19 3.39 2.42 40 200 240 6 80,000 B 3.82 3.75 2.39 40 240 400 7 80,000 B 5.51 3.65 2.35
70 70 105 2 60,000 A - 3.50 2.40 70 140 210 3 280,000 A 1.03 3.57 2,39 70 280 350 5 80,000 B 4.9 3.55 2.39 70 350 420 6 80,000 B 5.44 3.72 2.40 70 420 490 7 80,000 C 32.05 3.68 2.39
210 105 315 1.5 300,000 A 0.55 3.20 2.39 210 210 420 2 300,000 A 0.79 3.63 2.39 210 420 630 3 280,000 B 2.29 3.42 2.44 210 630 840 4 80,000 C 12.18 3.66 2.40 210 840 1050 5 80,000 C 29.93 3.59 2.39

A 4
Table A-4. Dynamic triaxial tests - test parameter – Sandy Gravel
Sandy Gravel
Grading M Dynamic Triaxial Tests
Nottingham ρd.target = 2.25 g/cm³ DOC = 100 %
w target = 3.4 %
σc σD σ1max σ1max/σc Number of load cycles
Shakedown Range εp
1 80.000 w
ρd
[kPa] [kPa] [kPa] [-] [-] [-] [0/00] [0/0]
[g/cm³]
40 40 80 2 270,000 A 0.29 3.34 2.26 40 80 120 3 80,000 A 0.7 3.32 2.24 40 120 160 4 270,000 B 2.255 3.36 2.24 40 160 200 5 80,000 C 9.45 3.27 2.25
70 70 140 2 300,000 A 0.2622 3.47 2.25 70 105 175 2.5 80,000 A 0.45 3.4 2.24 70 140 210 3 260,000 A 0,84 3.32 2.25 70 210 280 4 80,000 B 1.4798 3.75 2.24 70 280 350 5 80,000 B 4.498 3.4 2.24 70 350 420 6 30,000* C - 3.8 2.24
140 140 280 2 1,000,000 A 0.3363 2.9 2.25 140 210 350 2.5 300,000 A 0.62 3.4 2.24 140 280 420 3 270,000 B 1.3 3.17 2.25 140 420 560 4 50,000 B - 2.96 2.25 140 560 700 5 3,000* C - 3.4 2.24
210 105 315 1.5 300,000 A 0.34 3.75 2.24 210 210 420 2 300,000 A 0.52 3.19 2.25 210 315 525 2.5 80,000 A/B 0.7502 3.04 2.25 210 420 630 3 2,000,000 B 1.1113 2.89 2.25

A 5
Table A-5. Dynamic triaxial tests - test parameter – Sandy Gravel
Sandy Gravel
Grading U Dynamic Triaxial Tests
Nottingham ρd.target = 2.175 g/cm³ DOC = 100 %
w target = 2.1 %
σc σD σ1max σ1max/σc Number of load cycles
Shakedown Range εp
1 80,000 w
ρd
[kPa] [kPa] [kPa] [-] [-] [-] [0/00] [0/0]
[g/cm³]
40 40 80 2 50,000 A - 1,87 2.17 40 80 120 3 300,000 A 0.50 1.95 2.17 40 120 160 4 80,000 A 0.771 1.87 2.17 40 160 200 5 80,000 B 1.34 1.91 2.17 40 200 240 6 80,000 C 5.422 1.95 2.17
70 140 210 3 300,000 A 0.39 1.78 2.17 70 210 280 4 80,000 B 1.08 1.91 2.17 70 280 350 5 80,000 B 3.52 1.86 2.18
140 140 280 2 300,000 A 0.54 1.86 2.18
210 105 315 1.5 1,000,000 A 0.15 1.74 2.17 210 210 420 2 270,000 A 0.3 1.90 2.18 210 420 630 3 80,000 B 1.29 1.91 2.17 210 525 735 3.5 80,000 C 5.68 1.91 2.17
Table A-6. Dynamic triaxial tests - test parameter - Diabase
Diabase
Grading O Dynamic Triaxial Tests
Nottingham ρd.target = 2.5 g/cm³ DOC = 100 %
w target = 4.1%
σc σD σ1max σ1max/ σc Number of load cycles
Shakedown Range εp
1 80,000 w
ρd
[kPa] [kPa] [kPa] [-] [-] [-] [0/00] [0/0]
[g/cm³]
70 140 210 3 80,000 A 1.11 3.57 2.39 70 350 420 6 80,000 B 5.51 3.72 2.40
210 105 315 1.5 250,000 A 0.47 3.20 2.39

A 6
Table A-6. Cushing technique
Material Diabase-material Granodiorite-material
Quarry Friedrichswalde Pließkowitz
Crusher jaw crusher jaw crusher (primary crusher) cone crusher jaw crusher horizontal hammer mill cone crusher
cone crusher horizontal hammer mill

B 1
APPENDIX B TEST RESULTS Figure B-1 Vertical permanent strains versus number of load cycles, Granodiorite, σc = 40 kPa, M B-2 Vertical resilient strains versus number of load cycles, Granodiorite, σc = 40 kPa, M B-3 Vertical permanent strain rate versus permanent strains, Granodiorite, σc = 40 kPa, M B-4 Vertical permanent strains versus number of load cycles, Granodiorite, σc = 70 kPa, M B-5 Vertical resilient strains versus number of load cycles, Granodiorite, σc = 70 kPa, M B-6 Vertical permanent strain rate versus permanent strains, Granodiorite, σc = 70 kPa, M B-7 Vertical permanent strains versus number of load cycles, Granodiorite, σc = 210 kPa, M B-8 Vertical resilient strains versus number of load cycles, Granodiorite, σc = 210 kPa, M B-9 Vertical permanent strain rate versus permanent strains, Granodiorite, σc = 210 kPa, M B-10 Vertical permanent strains versus number of load cycles, Diabase, σc = 40 kPa, M B-11 Vertical resilient strains versus number of load cycles, Diabase, σc = 40 kPa, M B-12 Vertical permanent strain rate versus permanent strains, Diabase, σc = 40 kPa, M B-13 Vertical permanent strains versus number of load cycles, Diabase, σc = 70 kPa, M B-14 Vertical resilient strains versus number of load cycles, Diabase, σc = 70 kPa, M B-15 Vertical permanent strain rate versus permanent strains, Diabase, σc = 70 kPa, M B-16 Vertical permanent strains versus number of load cycles, Diabase, σ3 = 210 kPa, M B-17 Vertical resilient strains versus number of load cycles, Diabase, σc = 210 kPa, M B-18 Vertical permanent strain rate versus permanent strains, Diabase, σc = 210 kPa, M B-19. Vertical resilient strains versus stress ratio, Diabase, grading M B-20 Vertical permanent strains versus number of load cycles, Sandy Gravel, σc = 40 kPa, M B-21 Vertical resilient strains versus number of load cycles, Sandy Gravel, σc = 40 kPa, M
B 2
B-22 Vertical permanent strain rate versus permanent strains, Sandy Gravel, σc = 40 kPa, M B-23 Vertical permanent strains versus number of load cycles, Sandy Gravel, σc = 70 kPa, M B-24 Vertical resilient strains versus number of load cycles, Sandy Gravel, σc = 70 kPa, M B-25 Vertical permanent strain rate versus permanent strains, Sandy Gravel, σc = 70 kPa, M B-26 Vertical permanent strains versus number of load cycles, Sandy Gravel, σc = 140 kPa,M B-27 Vertical resilient strains versus number of load cycles, Sandy Gravel, σc = 140 kPa, M B-28 Vertical permanent strain rate versus permanent strains, Sandy Gravel, σc = 140 kPa, M B-29 Vertical permanent strains versus number of load cycles, Sandy Gravel, σc = 210 kPa,M B-30 Vertical resilient strains versus number of load cycles, Sandy Gravel, σc = 210 kPa, M B-31 Vertical permanent strain rate versus permanent strains, Sandy Gravel, σc = 210 kPa, M B-32 Vertical permanent strains versus number of load cycles, Sandy Gravel, σc = 40 kPa, U B-33 Vertical permanent strains versus number of load cycles, Sandy Gravel, σc = 70 kPa, U B-34 Vertical permanent strains versus number of load cycles, Sandy Gravel, σc = 210 kPa, U

B 3
Figure B-1. Vertical permanent strains versus number of load cycles (Key G = Granodiorite, σc _σD (both in kPa)
Figure B-2. Vertical resilient strains versus number of load cycles (Key G = Granodiorite, σc _σD (both in kPa))

B 4
Figure B-3. Vertical permanent strain rate versus permanent strains (Key G = Granodiorite, σc _σD (both in kPa))
Figure B-4. Vertical permanent strains versus number of load cycles (Key G = Granodiorite, σc _σD (both in kPa))

B 5
Figure B-5. Vertical resilient strains versus number of load cycles (Key G = Granodiorite, σc _σD (both in kPa))
Figure B-6. Vertical permanent strain rate versus vrtical permanent strains (Key G = Granodiorite, σc_σD (both in kPa))
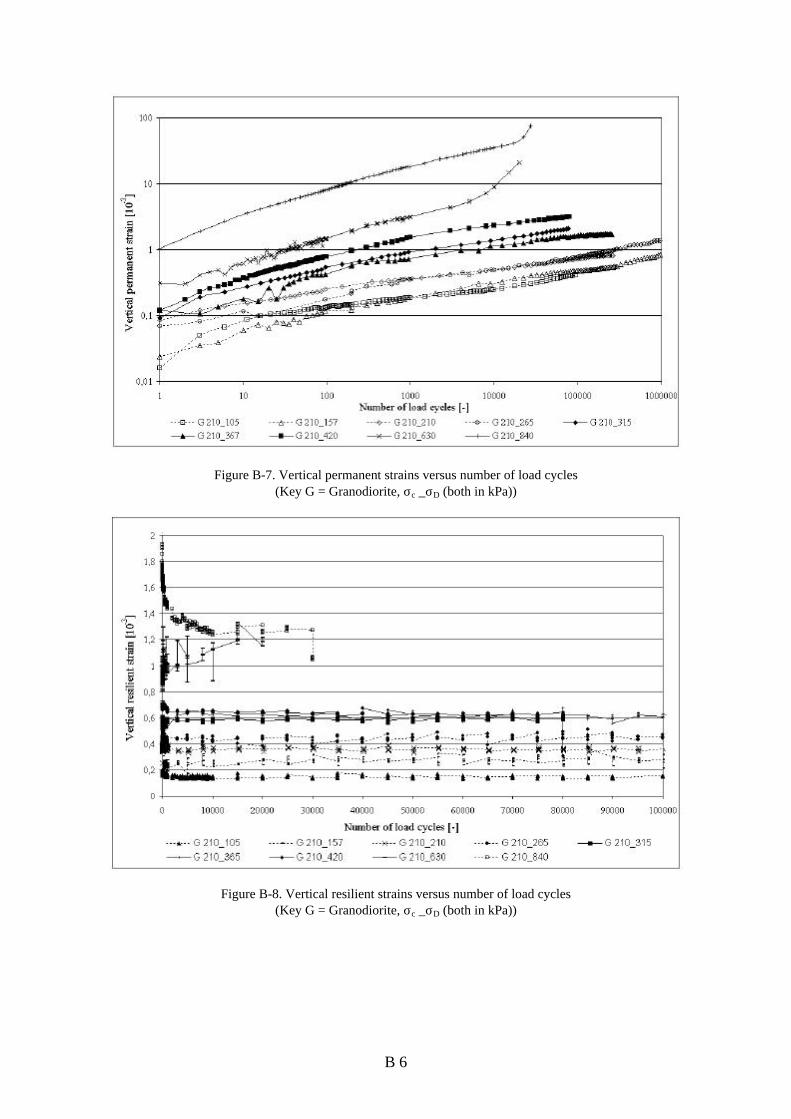
B 6
Figure B-7. Vertical permanent strains versus number of load cycles (Key G = Granodiorite, σc _σD (both in kPa))
Figure B-8. Vertical resilient strains versus number of load cycles (Key G = Granodiorite, σc _σD (both in kPa))
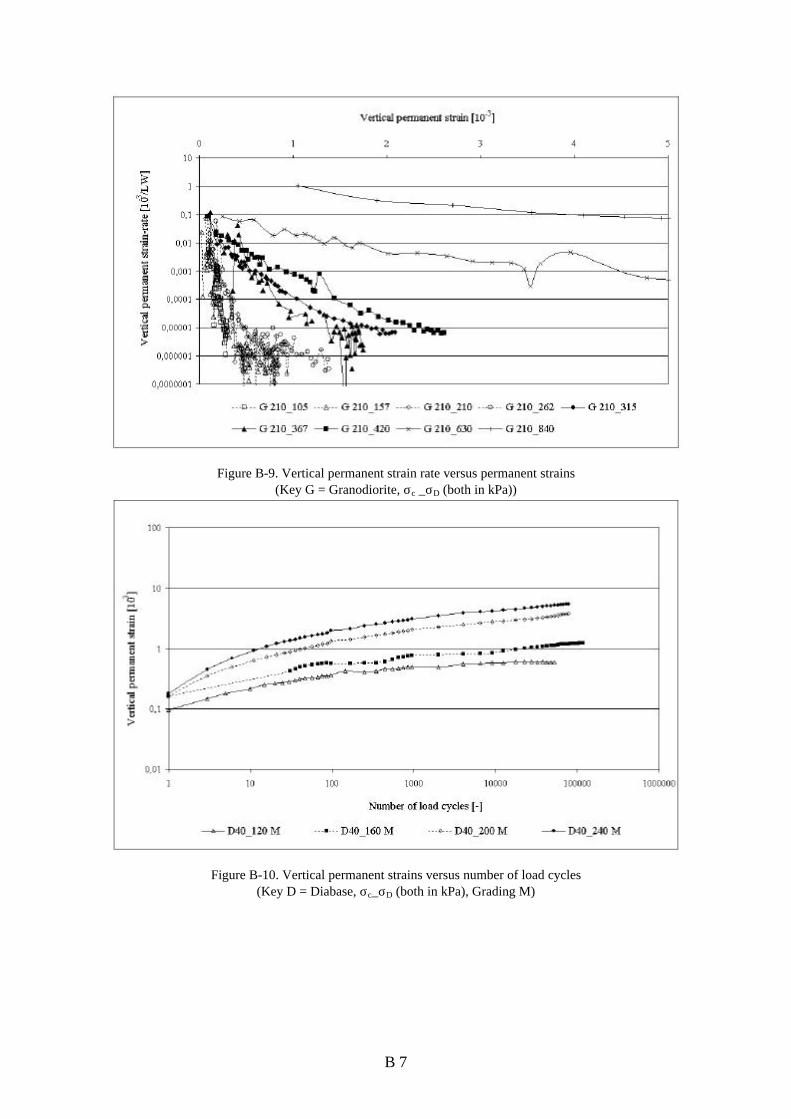
B 7
Figure B-9. Vertical permanent strain rate versus permanent strains (Key G = Granodiorite, σc _σD (both in kPa))
Figure B-10. Vertical permanent strains versus number of load cycles (Key D = Diabase, σc_σD (both in kPa), Grading M)

B 8
Figure B-11. Vertical resilient strains versus number of load cycles (Key D = Diabase, σc_σD (both in kPa), grading M)
Figure B-12. Vertical permanent strain rate versus vertical permanent strains (Key D = Diabase, σc_σD (both in kPa, grading M))

B 9
Figure B-13. Vertical permanent strains versus number of load cycles (Key D = Diabase, σc_σD (both in kPa), grading M)
Figure B-14. Vertical resilient strains versus number of load cycles (Key D = Diabase, σc_σD (both in kPa), grading M)

B 10
Figure B-15. Vertical permanent strain rate versus vertical permanent strains (Key D = Diabase, σc_σD (both in kPa, grading M))
Figure B-16. Vertical permanent strains versus number of load cycles (Key D = Diabase, σc_σD (both in kPa), grading M)

B 11
Figure B-17. Vertical resilient strains versus number of load cycles (Key D = Diabase, σc_σD (both in kPa), grading M)
Figure B-18. Vertical permanent strain rate versus vertical permanent strain (Key D = Diabase, σc_σD (both in kPa, grading M))

B 12
Figure B-19. Vertical resilient strains versus stress ratio, Diabase, grading M
Figure B-20. Vertical permanent strains versus number of load cycles (Key D = Sandy Gravel, σc_σD (both in kPa), grading M)

B 13
Figure B-21. Vertical resilient strains versus number of load cycles (Key D = Sandy Gravel, σc_σD (both in kPa), grading M)
Figure B-22. Vertical permanent strain-rate versus vertical permanent strains (Key D = Sandy Gravel, σc _σD (both in kPa, grading M))
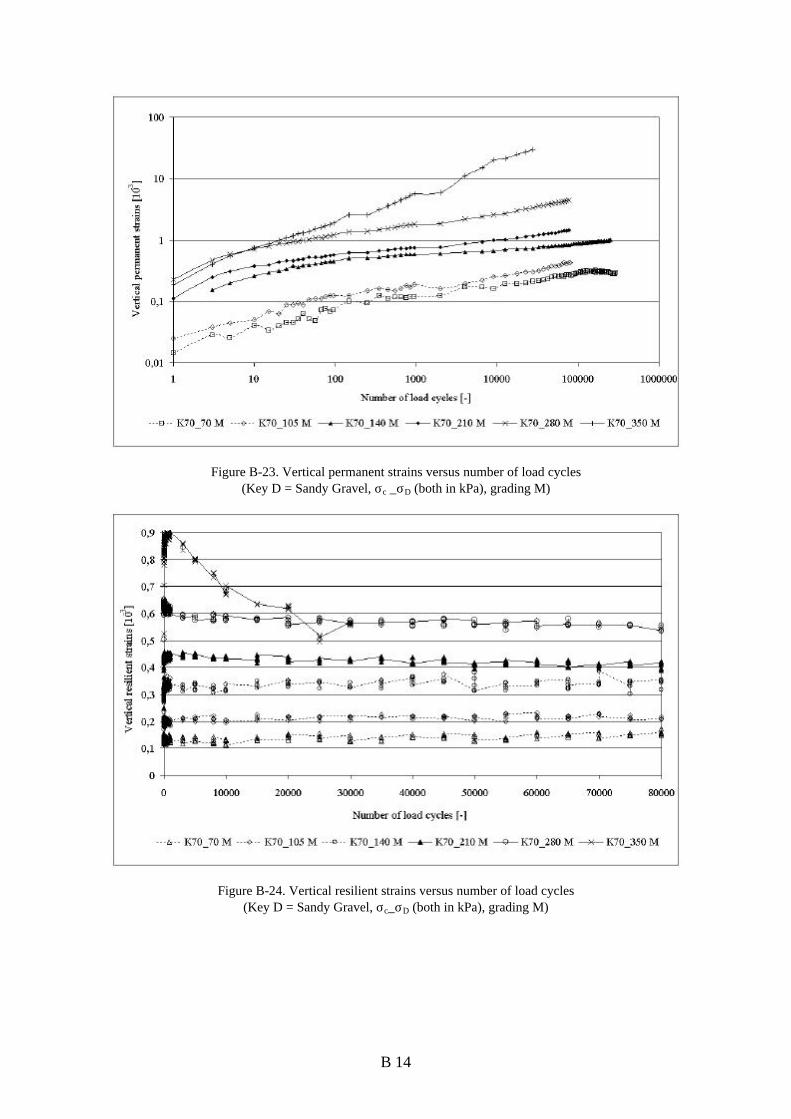
B 14
Figure B-23. Vertical permanent strains versus number of load cycles (Key D = Sandy Gravel, σc _σD (both in kPa), grading M)
Figure B-24. Vertical resilient strains versus number of load cycles (Key D = Sandy Gravel, σc_σD (both in kPa), grading M)

B 15
Figure B-25. Vertical permanent strain-rate versus vertical permanent strains (Key D = Sandy Gravel, σc_σD (both in kPa, grading M))
Figure B-26. Vertical permanent strains versus number of load cycles (Key D = Sandy Gravel, σc_σD (both in kPa), grading M)

B 16
Figure B-27. Vertical resilient strains versus number of load cycles (Key D = Sandy Gravel, σc_σD (both in kPa), grading M)
Figure B-28. Vertical permanent strain-rate versus vertical permanent strains (Key D = Sandy Gravel, σc_σD (both in kPa, grading M))

B 17
Figure B-29. Vertical permanent strains versus number of load cycles
(Key D = Sandy Gravel, σc_σD (both in kPa), grading M)
Figure B-30. Vertical resilient strains versus number of load cycles (Key D = Sandy Gravel, σc_σD (both in kPa), grading M)

B 18
Figure B-31. Vertical permanent strain-rate versus vertical permanent strains (Key D = Sandy Gravel, σc_σD (both in kPa, grading M))
Figure B-32. Vertical permanent strains versus number of load cycles (Key K = Sandy Gravel, σc_σD (both in kPa), grading U)

B 19
Figure B-33. Vertical permanent strains versus number of load cycles (Key K = Sandy Gravel, σc_σD (both in kPa), gading U)
Figure B-34. Vertical permanent strains versus number of load cycles (Key K = Sandy Gravel, σc_σD (both in kPa), gading U)

C 1
APPENDIX C MODELLING Figure C-1 Vertical permanent strains versus number of load cycles, data and model,
Granodiorite, σc = 40 kPa, Range A C-2 Vertical permanent strains versus number of load cycles, data and model,
Granodiorite, σc = 70 kPa, Range A C-3 Vertical permanent strains versus number of load cycles, data and model
Granodiorite, σc = 210 kPa, Range A C-4 Vertical permanent strains versus number of load cycles, data and model,
Granodiorite, σc = 40 kPa, Range B C-5 Vertical permanent strains versus number of load cycles, data and model,
Granodiorite, σc = 70 kPa, Range B C-6 Vertical permanent strains versus number of load cycles, data and model
Granodiorite, σc = 210 kPa, Range B C-7 Vertical permanent strains versus number of load cycles, data and model, Diabase, σc = 40 kPa, Range A C-8 Vertical permanent strains versus number of load cycles, data and model, Diabase, σc = 70 kPa, Range A C-9 Vertical permanent strains versus number of load cycles, data and model, Diabase, σc = 210 kPa, Range A C-10 Vertical permanent strains versus number of load cycles, data and model, Sandy Gravel, σc = 40 kPa, Range A C-11 Vertical permanent strains versus number of load cycles, data and model, Sandy Gravel, σc = 70 kPa, Range A C-12 Vertical permanent strains versus number of load cycles, data and model, Sandy Gravel, σc = 140 kPa, Range A C-13 Vertical permanent strains versus number of load cycles, data and model, Sandy Gravel, σc = 210 kPa, Range A

C 2
Table C-1 Plastic model-coefficients as found for Sandy Gravel, grading M, Range A C-2 Plastic model-coefficients as found for Diabase, grading M, Range A C-3 Elastic model-coefficients as found for Sandy Gravel, grading M, Range A C-4 E values for the asphalt layers at selected temperatures

C 3
Figure C-1. Vertical permanent strains versus number of load cycles, data and model, grading M (Key G = Granodiorite, σc_σD (both in kPa))
Figure C-2. Vertical permanent strains versus number of load cycles, data and model, grading M (Key G = Granodiorite, σc _σD (both in kPa))

C 4
Figure C-3. Vertical permanent strains versus number of load cycles, data and model, grading M (Key G = Granodiorite, σc_σD (both in kPa))
Figure C-4. Vertical permanent strains versus number of load cycles, data and model, grading M (Key G = Granodiorite, σc_σD (both in kPa))

C 5
Figure C-5. Vertical permanent strains versus number of load cycles, data and model, grading M (Key G = Granodiorite, σc _σD (both in kPa))
Figure C-6. Vertical permanent strains versus number of load cycles, data and model, grading M (Key G = Granodiorite, σc _σD (both in kPa))

C 6
Figure C-7. Vertical permanent strains versus number of load cycles, data and model, grading M (Key D = Diabase, σc _σD (both in kPa))
Figure C-8. Vertical permanent strains versus number of load cycles, data and model, grading M
(Key D = Diabase, σc _σD (both in kPa))

C 7
Figure C-9. Vertical permanent strains versus number of load cycles, data and model, grading M (Key D = Diabase, σc _σD (both in kPa))
Figure C-10. Vertical permanent strains versus number of load cycles, data and model, grading M (Key K = Sandy Gravel, σc _σD (both in kPa))

C 8
Figure C-11. Vertical permanent strains versus number of load cycles, data and model, grading M (Key K = Sandy Gravel, σc _σD (both in kPa
Figure C-12. Vertical permanent strains versus number of load cycles, data and model, grading M
(Key K = Sandy Gravel, σc _σD (both in kPa))

C 9
Figure C-13. Vertical permanent strains versus number of load cycles, data and model, grading M (Key K = Sandy Gravel, σc _σD (both in kPa))

C 10
Table C-1. Plastic model-coefficients as found for the Equations 6.3 and 6.4 for the Phase II Sandy Gravel, grading M, DOC = 100 %, Range A
Parameter Moisture content
Plastic DRESDEN-Model 3.4 %
a1 [-] 0.00004 a2 [kPa-1] -0.0247 a3 [kPa-1] 0.00005 a4 [-] 0.4257 b1 [-] 0.0009 b2 [kPa-1] -0.0107 b3 [kPa-1] 0.0067 b4 [-] 0.5579
Table C-2.Plastic model-coefficients as found for the Equations 6.3 and 6.4 for the Phase II Diabase, grading M, DOC=100 %, Range A
Parameter Moisture content
Plastic DRESDEN-Model 4 %
a1 [-] 0.00003 a2 [kPa-1] -0.0129 a3 [kPa-1] 0.0003 a4 [-] 0.0584 b1 [-] 0.0009 b2 [kPa-1] -0.0107 b3 [kPa-1] 0.0067 b4 [-] 0.5579
Table C-3. Elastic model-coefficients for the Sandy Gravel grading M, DOC = 100 %, Range A [NUM 03]
Parameter Moisture content
Elastic DRESDEN-Model 3.5 %
Q [kPa]1-Q2 16,158.3 C [kPa]1-Q1-Q2 3862.0 Q1 [-] 0.561 Q2 [-] 0.33 R [-] 0.015 A [kPa]-1 -0.0018 B [-] 0.285
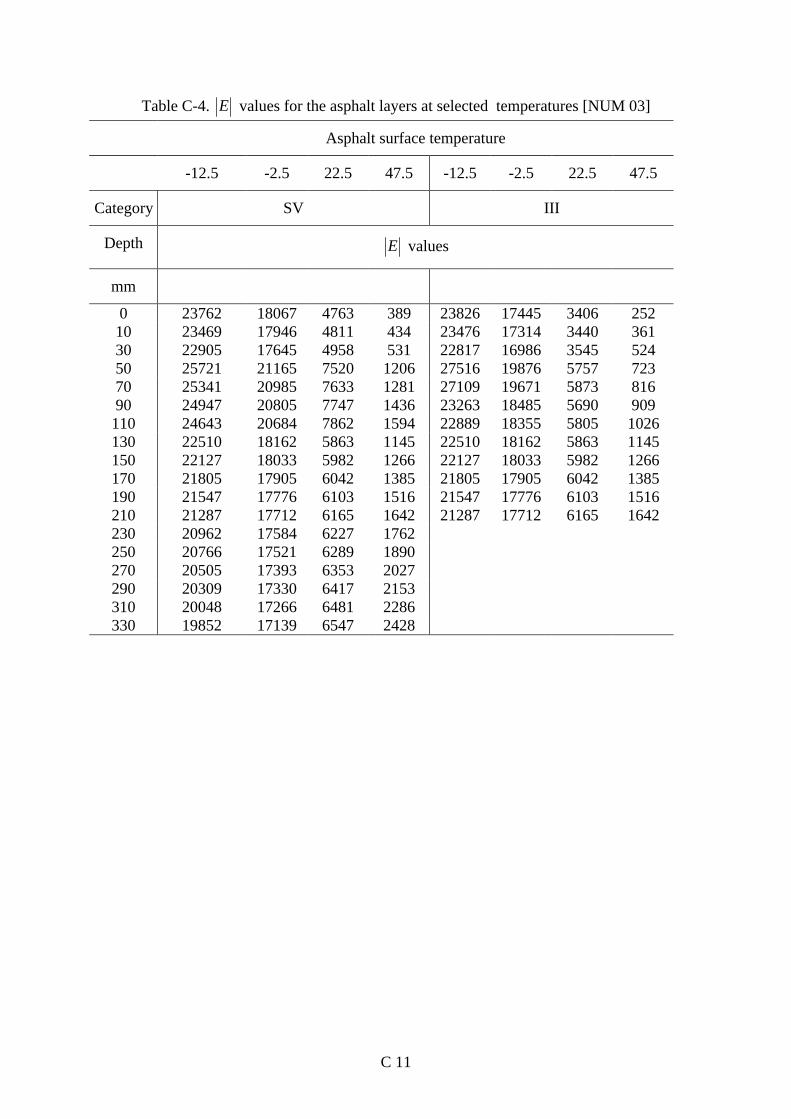
C 11
Table C-4. E values for the asphalt layers at selected temperatures [NUM 03]
Asphalt surface temperature
-12.5 -2.5 22.5 47.5 -12.5 -2.5 22.5 47.5
Category SV III
Depth E values
mm
0 23762 18067 4763 389 23826 17445 3406 252 10 23469 17946 4811 434 23476 17314 3440 361 30 22905 17645 4958 531 22817 16986 3545 524 50 25721 21165 7520 1206 27516 19876 5757 723 70 25341 20985 7633 1281 27109 19671 5873 816 90 24947 20805 7747 1436 23263 18485 5690 909 110 24643 20684 7862 1594 22889 18355 5805 1026 130 22510 18162 5863 1145 22510 18162 5863 1145 150 22127 18033 5982 1266 22127 18033 5982 1266 170 21805 17905 6042 1385 21805 17905 6042 1385 190 21547 17776 6103 1516 21547 17776 6103 1516 210 21287 17712 6165 1642 21287 17712 6165 1642 230 20962 17584 6227 1762 250 20766 17521 6289 1890 270 20505 17393 6353 2027 290 20309 17330 6417 2153 310 20048 17266 6481 2286 330 19852 17139 6547 2428