
Hydrogeological/geophysical Investigations
55
HYDROGEOLOGICAL SURVEY REPORT SUKUTAN/MATHIRA-2 LAIKIPIA DISTRICT September, 2012 Signed…………………………………………………… date……………………………………… Surveyed and compiled by:- Joseph K. Nzomo, MSc, MGSK (R. Geol. ) (Registered Hydrogeologist; Licence No. WD/WRP/210 ) FOR:- P.O. Box 877-00521 NAIROBI e-mail: [email protected] Tel: 0716-220801, 0787-714129 …………………………………………………………………………………………..…………………………………………… Hydrogeological Survey for Sukuta/Mathira_2 September, 2012 1 Client: Engineers Without Borders USA, Orange County Professionals (EWB-USA OC)
-
Upload
independent -
Category
Documents
-
view
4 -
download
0
Transcript of Hydrogeological/geophysical Investigations

HYDROGEOLOGICAL SURVEY REPORT
SUKUTAN/MATHIRA-2
LAIKIPIA DISTRICT
September, 2012
Signed……………………………………………………date………………………………………
Surveyed and compiled by:-
Joseph K. Nzomo, MSc, MGSK (R. Geol. )(Registered Hydrogeologist; Licence No. WD/WRP/210 )
FOR:-
P.O. Box 877-00521NAIROBIe-mail: [email protected]: 0716-220801, 0787-714129
…………………………………………………………………………………………..……………………………………………Hydrogeological Survey for Sukuta/Mathira_2 September, 2012 1
Client:
Engineers Without Borders USA, Orange County Professionals
(EWB-USA OC)

EXECUTIVE SUMMARY
Introduction
Geo-Xplore Consult was commissioned by Engineers Without Borders USA, Orange County Professionals (EWB-USA OC) to carry out hydrogeological/geophysical site investigations to identify suitable sites for construction of productive wells within Sukutan/Mathira-2 area in Laikipia District. The development of the proposed boreholes is part of EWB-USA OC which resulted from health assessments completed in 2009 and 2010 in conjunction with University of California–Irvine Chapter (EWB-USA UCI). These assessments determined that most of the communities in the district have no guaranteed access to potable water. In the process Mathira-2/Sukutan community was prioritized to benefit from EWB-USA OC first Water project.
This report contains details and results of hydrogeological, hydrological and geophysical survey carried out between 17th and 21st September 2012. The report describes the objectives of the hydrogeological/geophysical survey, the overview of the project area, methodology and expected outputs.
Project Objectives
The overall project objective of this project is to improve the access to clean, safe and reliable water to Mathira-2/Sukutan community who largely depend on surface water sources which are unsanitary and seasonal.
The project objectives are:-
Perform a desktop study of historical and current regional geology and hydrogeology.
Perform a hydrogeological survey at the locations listed above using Electrical Resistivity Tomography (ERT) technology, in accordance with the Water Resources Management Authority(WRMA) standards.
Identify at least three (3) specific locations and determine the depth ranges of subsurface water bearing zone(s).
Submit a report summarizing the findings.
Project Area
Sukutan/Mathira-2 area is located in Laikipia District 60km from Nanyuki at the northern tip of Segera Ranch. It is accessed through Nanyuki-Rumuruti dry weather road via Segera Ranch. Administratively the area is located in Sukutan Village, Sukutan Sub-Location, Mutara Location, Rumuruti Division in Laikipia District. EWB-USA OC is a volunteer organization that has been working in Laikipia District since 2008. By …………………………………………………………………………………………..……………………………………………Hydrogeological Survey for Sukuta/Mathira_2 September, 2012 2

2010, the organization had completed a footbridge across Ewaso Nyiro in Endana. In 2011, the Laikipia Water program team prioritized, Sukutan/Mathira-2 community as one of the most deserving beneficiary of the first water project by EWB-USA OC.
Geology
The regional geology of the area comprises of Precambrian Mozambiquian complex overlain by Cenozoic volcanics. The volcanic pile to the west of the area is related to the formation of the Great Rift Valley and features volcanic complexes ranging in age from Miocene to Recent lava flows and pyroclastics. The eastern shoulder of the Rift Valley above the Laikipian Escarpment extends into a broad expanse of the Miocene ‘flood’ phonolites which forms the Laikipian Plateau. To the south east of the area are also Pliocene lavas, the Laikipian Formation and sedimentary sequence of galciofluvial origin comprising the Nanyuki Formation. The latter have been derived from Mt Kenya Massif to the south-east. Minor Quaternary sediments and superficial deposits cover the area.
Hydrology
The investigated area lies on Ewaso Ng’iro Drainage Basin. All drainage channels are sub-ordinate to Ewaso Ng’iro and Ewaso Narok River systems. The flow direction is generally to North with an abrupt change in direction eastwards into Lorian swamp which marks the end of its flood flow. The surveyed area is located on the upper Ewaso Ng’iro north basin, located to the north and west of Mt. Kenya. The basin extends between longitudes 36◦30E and 37◦45E and latitudes 0◦15N and 1◦00N. The total basin area is 15,200 km2 varying in altitude from 800 to 5200m a.s.l. Rainfall varies between 350mm on the arid lowlands to over 1500mm on the upper mountain slopes. Mt Kenya and the Aberdares contribute to perennial flows within the Ewaso Nyiro Drainage Basin.
Hydrogeology
Aquifers in the surveyed area regionally occur in three settings:- (1) Old land surfaces marked by weathered zones and paleosols between Basement rocks and volcanic lavas. These thin stratiform bodies give rise to springs (2) Fractured and /or weathered Basement rocks (3) Intervolcanic surfaces which represent episodic eruption with intervening periods of erosion and sediment deposition. Water moves along these surfaces from remote recharge areas and may also manifest as springs.
Aquifer recharge if deduced to occur through regional replenishment and direct infiltration of precipitation.
…………………………………………………………………………………………..……………………………………………Hydrogeological Survey for Sukuta/Mathira_2 September, 2012 3

Yields of boreholes from Rumuruti Plateau phonolites somewhat falls towards the east but studies have indicated that there is considerable ground water potential with no depletion envisaged in the near future.
Water Quality
Groundwater from Laikipian plateau is slightly saline possibly due to aridity and high evapotranspiration rates. Fluoride content is also inordinately high in this area exceeding WHO limits.
Geophysical/Hydrogeological investigations
Geophysical/Hydrogeological investigations were carried out between 17th
and 21st September 2012. The geophysical survey involved mainly two methods:
• Resistivity 2D profiling using Schlumberger array, to map out subsurface geological structures conducive to formation and transmission groundwater. These will be flagged as anomalous zones. For the purpose of constructing ERT sections, the traverse lines were be repeated at progressively increasing depth with the AB/2 maximum of 60m in steps of 10m with a station interval of 10m. The profiling data was processed with RES2DINV 2-D modeling program to come up with true resistivity 2-D subsurface model. This way the 2D sections would show anomalous zones including their areal extend, disposition and depth.
• Vertical Electrical Soundings (VES) to get quantitative information on the vertical resistivity layering at anomalous zones along the 2D profile sections and other points of hydrogeological interest. The Schlumberger measuring array was applied. The current electrode spacing was expanded accordingly depending upon anticipated water levels with AB/2 not exceeding 400m. Three VES’s per proposed site. A resistivity section using software IPI2win (2008) was constructed on the three VES points consisting of two parts:- a pseudo-section and inverted section, the latter depicting the true resistivities. This will formed the basis of final recommendations with respect to the maximum drilling depth.
• For calibration purposes, resistivity control soundings and profiles were carried out at nearby existing productive well sites. A number of traverse lines for the execution of the geophysical surveys were marked . Geophysical data was qualitatively interpreted initially in the field and subsequently by means of above modeling softwares (quantitative). A permanent marker was left at the selected well sites in addition to a sketch map to be included in the final report and recording of the GPS coordinates.
…………………………………………………………………………………………..……………………………………………Hydrogeological Survey for Sukuta/Mathira_2 September, 2012 4

Recommendations were given on the most suitable site for the drilling, the required depth, expected water quality, design and installation details, and other relevant aspects. Based on the available hydrogeological and geophysical data, an assessment of the anticipated chances of success shall be made.
All electrical measurements were taken with deep probe resistivity meter model No. SSR-MP-AT signal stacking system.
Conclusions and recommendations
Based on geological/ hydrogeological considerations for the project area, low-medium groundwater potential is inferred. The geological profile in the investigated area variously consists of Top soils (Quarternary), Phonolite lava sheets (Tertiary), Weathered and/or fractured Basement (Precambrian) and Fresh Basement (Precambrian). Best yielding boreholes are those that encounter old land surfaces, fractured and/or weathered Basement rocks with sufficient recharge channels. It is noted that groundwater potential on Laikipian plateau declines eastwards subsequent to the thinning out of the volcanic lava sheet. Based on the foregoing considerations, drilling is recommended as hereunder:-
Area of Interest
Recommended Point
Coordinates(0 Decimal min)
Elevation(m) amsl
Minimum Recommended Depth (m)
Maximum Recommended Depth (m)
(1) Sukutan Spring
VES-3 00, 24.651’N360
45.571’E1744 100 150
(2) Lesashore Spring
VES-2 00, 24.105’N360
46.710’E1749 80 150
(3) Lolimigagagani Spring
VES-1 00, 22.889’N360
46.285’E1773 100 150
(4) Lemusinga Well
VES-1 00, 23.296’N360
47.069’E1741 80 130
The anticipated yield of each these boreholes will be about 6m3/hr.
Recommendations for Drilling
…………………………………………………………………………………………..……………………………………………Hydrogeological Survey for Sukuta/Mathira_2 September, 2012 5

Drilling should first be done using a 10” diameter drill-bit to a depth of 10 m bgl and then continued to the final depth with an 8” diameter drill-bit.
The top 10 m should be sealed off with bentonite and cement grout to prevent surface water from contaminating the groundwater.
The borehole should be installed with 6" diameter Steel casings and screens with slots of 1mm.
The recommended depths are a maximum, but should all available aquifers be penetrated before attaining the maximum depth, drilling should be halted. This should be done under the supervision of a competent hydrogeologist/engineer. Borehole drilling, development and construction should be done in strict adherence to highest groundwater standards as per provisions of the Ministry of Water and Irrigation under the Water Act 2002 and Water Resources Management Authority Rules and Regulations. Plain casings, screens and proper gravel pack should be correctly inserted. End cap should be put in place to prevent ingress of silt and subsequent damage to submersible pumps. Test pumping and water quality analysis should be carried out after borehole construction and development. Ultimately the works should be documented in the Borehole Completion Records as required by the Ministry of Water and Irrigation.
Monitoring
Regular monitoring should be instituted and maintained in the borehole in order to keep track of groundwater levels. A monitoring tube should be installed in the borehole to be able to monitor the water level.
Drilling Permits
Before drilling commences, a drilling permit must be obtained from the Water Resources Management Authority (WARMA) under the Ministry of Water and Irrigation.
Borehole Construction
Recommendations are given for borehole construction and completion methods. The importance of correct and comprehensive techniques in this particular aspect cannot be over-emphasized. It determines the water quality and longevity of the borehole.
…………………………………………………………………………………………..……………………………………………Hydrogeological Survey for Sukuta/Mathira_2 September, 2012 6

TABLE OF CONTENTS Page
Executive Summary 2List of Figures 8List of Figures 8List of Abbreviations 9Glossary of Terms 10
1. INTRODUCTION1.1 Background 111.2 Reporting Requirements 11
2. BACKGROUND INFORMATION2.1 Location 132.2 Physiography 142.3 Drainage 152.4 Climate, Vegetation, Soil Cover 16
2.5 Existing Water supplies and Water Demand 173. GEOLOGY
3.1 Regional Geology 183.2 Local Geology 19
4. HYDROGEOLOGY4.1 Groundwater Occurrence 20
4.2 Local hydrogeology 20 4.3 Aquifer Characteristics 21
4.3.1 Hydraulic Parameters 21 4.3.2 Borehole Specific Capacities 23 4.3.3 Groundwater Flux/Recharge 23 4.3.4 Analysis of Borehole Data 245. GROUNDWATER QUALITY 5.1 Bacteriological Quality 25 5.2 Chemical and Physical Quality 266. IMPACT OF PROPOSED ACTIVITY 277. GEOPHYSICS
…………………………………………………………………………………………..……………………………………………Hydrogeological Survey for Sukuta/Mathira_2 September, 2012 7

7.1 Basic Principles of Galvanic Resistivity Method 28 7.2 2D Electrical Image Surveying 29 7.3 Field Work 30 7.3.1 Sukutan Spring 31 7.3.2 Leshashore Spring 33 7.3.3 Lolimigagani Spring 35 7.3.4 Lemusinga Well 378. CONCLUSIONS AND RECOMMENDATIONS 8.1 Conclusions 39 8.2 Recommendations 40REFERENCES APPENDICES
List of Figures
Fig-1 Topographic Map Extract (1: 50,000) showing the approximate Location of the investigated site
13
Fig-2 The main physiographic features of the area 14Fig-3 Ewaso Ng’iro/Narok and Ol Keju Losera drainage systems 16Fig-4 Leshashore spring 18Fig-5 Geolology of The Investigated Site. 19
List of Tables
Table-1
Aquifer Parameters 22
Table-2
Borehole Data Near the Proposed Site 24
Table-3
Bacterial Guideline Values for Drinking Water 26
Table-4
Chemical and Physical Guideline Values for Drinking Water 26
Table -5
Interpretation of Vertical Electric Soundings 39
…………………………………………………………………………………………..……………………………………………Hydrogeological Survey for Sukuta/Mathira_2 September, 2012 8
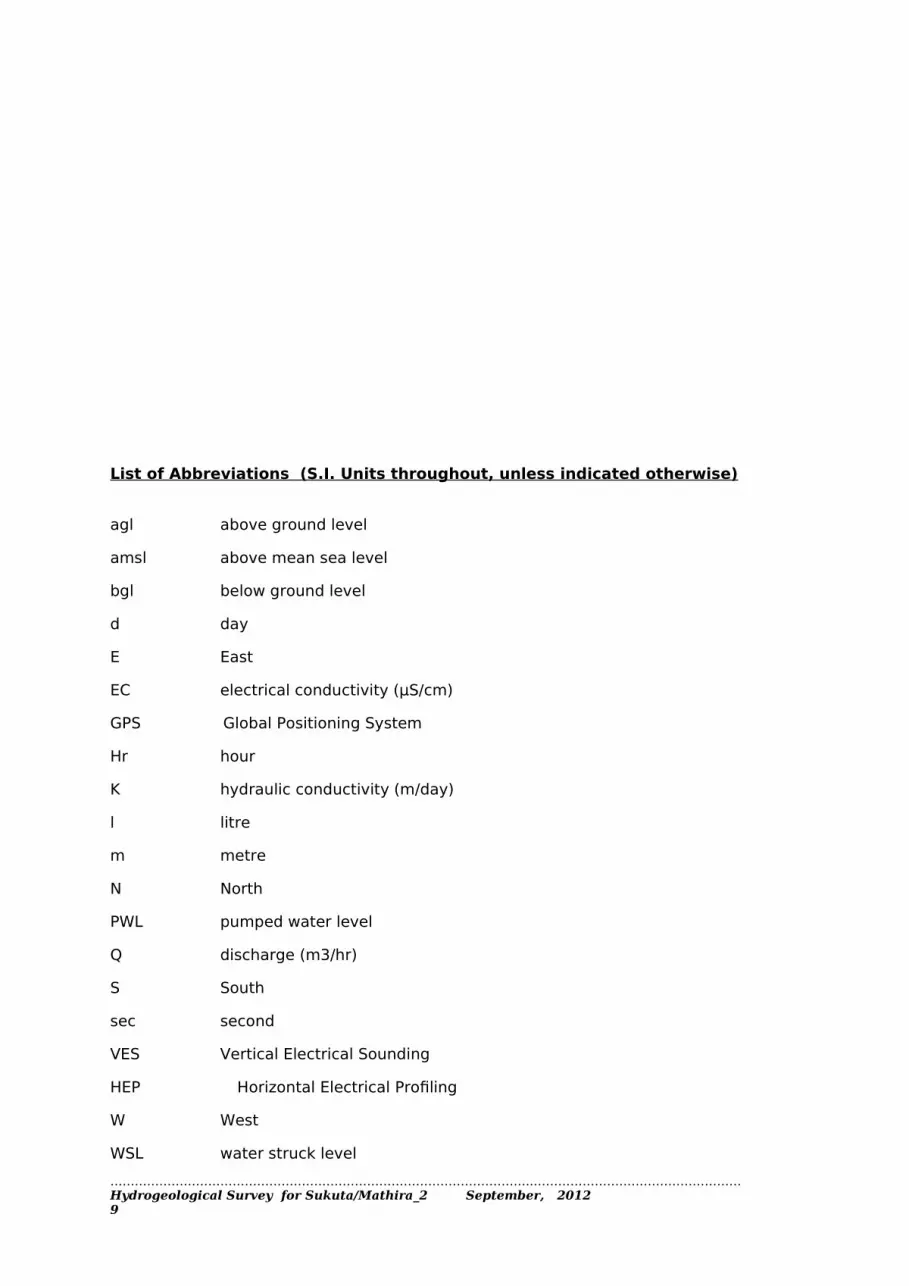
List of Abbreviations (S.I. Units throughout, unless indicated otherwise)
agl above ground level
amsl above mean sea level
bgl below ground level
d day
E East
EC electrical conductivity (µS/cm)
GPS Global Positioning System
Hr hour
K hydraulic conductivity (m/day)
l litre
m metre
N North
PWL pumped water level
Q discharge (m3/hr)
S South
sec second
VES Vertical Electrical Sounding
HEP Horizontal Electrical Profiling
W West
WSL water struck level…………………………………………………………………………………………..……………………………………………Hydrogeological Survey for Sukuta/Mathira_2 September, 2012 9

µS/cm Micro-Siemens Per Centimeter: Unit For Electrical conductivity0C degrees Celsius: Unit for temperature
Ωm Ohm-m: Unit for apparent resistivity
ρa Apparent resistivity
“ Inch
Glossary of Terms
Alluvium General term for detrital material deposited by flowing waterAquifer A geological formation or structure, which stores and transmits water and
which is able to supply water to wells, boreholes or springs.Conductivity Transmissivity per unit length (m/day).Confined aquifer A formation in which the groundwater is isolated from the atmosphere by
impermeable geologic formations. Confined water is generally at greater pressure than atmospheric, and will therefore rise above the struck level in a borehole.
Denudation Surface erosion.Evapotranspiration
Loss of water from a land area through transpiration from plants and evaporation from the surface
Fault A larger fracture surface along which appreciable displacement has taken place.
Fluvial General term for detrital material deposited within a river environment and usually graded.
Granitization The process by which solid rocks are converted into rocks of granitic character without melting into a magmatic stage.
Gneiss Irregularly banded rock, with predominant quartz and feldspar over micaceous minerals. A product of regional metamorphism, especially of the higher grade.
Gradient The rate of change in total head per unit of distance, which causes flow in the direction of the lowest head.
Heterogeneous Not uniform in structure or composition throughout.Hydraulic head Energy contained in a water mass, produced by elevation, pressure of
velocity.Hydrogeological Those factors that deal with subsurface waters and related geological
aspects of surface waters.Infiltration Process of water entering the soil through the ground surfaceJoint Fractures along which no significant displacement has taken placeMigmatite Rocks in which the granitic component (granite, aplite, pegmatite etc) is
intimately mixed with a metamorphic component (schist or gneiss).Percolation Process of water seeping through the unsaturated zone, generally from a
surface source to the saturated zone.Perched aquifer Unconfined groundwater separated from an underlying main aquifer by an
unsaturated zone. Downward percolation hindered by an impermeable layer.
Permeability The capacity of a porous medium for transmitting fluid.Piezzometric level An imaginary water table, representing the total head in a confined aquifer,
and is defined by the level to which water would rise in a well.Porosity the portion of bulk volume in a rock or sediment that is occupied by
openings, whether isolated or connected.Pumping test A test that is conducted to determine aquifer and/or well characteristics.…………………………………………………………………………………………..……………………………………………Hydrogeological Survey for Sukuta/Mathira_2 September, 2012 10

Recharge General term applied to the passage of water from surface or subsurface sources (e.g. rivers, rainfall, lateral groundwater flow) to the aquifer zones.
Regolith General term for the layer of weathered, fragmented and unconsolidated rock material that overlies the fresh bedrock.
Specific capacity The rate of discharge from a well per unit drawdown.Static water level The level of water in a well that is not being affected by pumping. (Also
known as “rest water level”)Transmissivity A measure for the capacity of an aquifer to conduct water through its
saturated thickness (m2/day).Unconfined Referring to an aquifer situation whereby the water table is exposed to the
atmosphere through openings in the overlying materials (as opposed to>confined conditions).
1. INTRODUCTION
1.1 Background
Geo-Xplore Consult consultants were commissioned by Engineers Without Borders USA Orange County Professionals (EWB-USA OC) volunteer organization to carry out borehole site investigations at in Sukutan/Mathira 2 area in Laikipia District The fieldwork was carried out between 17th and 21st September 2012.
The Client requires detailed information on prospects of drilling production boreholes to supply water for domestic use by Sukutan Village community.
The objective of the present study is to assess the availability of groundwater, to recommend a borehole drilling site and comment on aspects of depth to potential aquifers, aquifer availability and type, possible yields and water quality. For this purpose all available hydrogeological information of the area has been analyzed, and a geophysical/hydrogeological survey done.
The investigations involved hydrogeological, geophysical field investigations and a detailed desk study in which the available relevant geological and hydrogeological data were collected, analyzed, collated and evaluated within the context of the Client's requirements. The data sources consulted were mainly in four categories:
(i) Published Master Plans.(ii) Geological and Hydrogeological Reports and Maps.(iii) Ministry of Water and Irrigation Borehole Completion
records.
…………………………………………………………………………………………..……………………………………………Hydrogeological Survey for Sukuta/Mathira_2 September, 2012 11

(iv) Technical reports of the area by various organizations and consultants
. 1.2 Reporting Requirements
The format of writing the Hydrogeological Investigations Report, is set out in the Second Schedule of the Water Resources Management Rules, 2007. Such a report must consider the following (verbatim): -
1. Name and details of applicant2. Location and description of proposed Activity3. Details of climate4. Details of geology and hydrogeology5. Details of neighbouring boreholes, including location, distance
from proposed borehole or boreholes, number and construction details, age, current status and use, current abstraction and use.
6. Description and details (including raw and processed data) of prospecting methods adopted, e.g. remote sensing, geophysics, geological and or hydrogeological cross sections. Hydrogeological characteristics and analysis, to include but not necessarily be limited to, the following:
a. Aquifer transmissivity b. Borehole specific capacities c. Storage coefficient and or specific yield d. Hydraulic conductivity e. Groundwater flux f. Estimated mean annual recharge, and sensitivity to
external factors7. Assessment of water quality and potential infringement of
National standards8. Assessment of availability of groundwater9. Analysis of the reserve10. Impact of proposed activity on aquifer, water quality,
other abstractors, including likelihood of coalescing cones of depression and implications for other groundwater users in any potentially impacted areas
11. Recommendations for borehole development, to include but not limited to, the following:
a. Locations of recommended borehole(s) expressed as a coordinate(s) and indicated on a sketch map
b. Recommendations regarding borehole or well density and minimum spacing in the project area
c. Recommended depth and maximum diameterd. Recommended construction characteristics, e.g.
wire-wound screen, grouting depthe. Anticipated yield
12. Any other relevant information (e.g. need to monitor neighbouring boreholes during tests).
…………………………………………………………………………………………..……………………………………………Hydrogeological Survey for Sukuta/Mathira_2 September, 2012 12

This report is written so as to cover each of the above, insofar as data limitations allow. The report also includes maps, diagrams, tables and appendices as appropriate.
2. BACKGROUND INFORMATION
2.1 Location
Sukutan/Mathira-2 area is located in Laikipia District about 60km north-west of Nanyuki town. It is accessed via Nanyuki-Rumuruti road through Segera Ranch. Other alternative routes exist through Impala Ranch or Kinamba from Nyahururu. The current state of the roads makes access impossible by a drilling machine during the rainy season. Administratively the investigated area is located in Sukutan Village, Sukutan Sub-Location, Mutara Location, Rumuruti Division in Laikipia District. The area is covered by Degree Sheet No. 106/8 (1:50,000). The investigated zone is bounded by Parallels:- 0.230 N , 0.250N and Meridians:- 36.750E, 37.790E. Fig-1 shows the approximate locations of the recommended points.
Fig-1; Topographic Map Extract (1: 50,000) showing the approximate Locations of the surveyed areas
…………………………………………………………………………………………..……………………………………………Hydrogeological Survey for Sukuta/Mathira_2 September, 2012 13

2.2 Physiography
The general area is divided into three main physiographic features:-
(1)The Gregory Rift Valley to the West which incorporates lake basins of Bogoria and Baringo.
(2)The Laikipian Plateau corresponding to with a broad outcrop of Miocene phonolites extrusives bounded to the west by a series of fault scarps overlooking the rift.
(3)The uplands to the east comprising of Basement rocks. These are more rugged but somewhat lower than the Laikipian plateau and are drained by the middle Ewaso Ngiro River system. The Loroki –Karisia Hills ridge to the north is drained by upper Seiya .
The investigated area lies on Laikipian Plateau. This is a monotonous surface founded on Miocene ‘flood’ phonolites and sloping consistently at
…………………………………………………………………………………………..……………………………………………Hydrogeological Survey for Sukuta/Mathira_2 September, 2012 14
Sukutan Spring
Lemusinga Well
Lesashore Spring
Lolimigagani Spring

about 2-40 for more than 50km to the east. The Laikipian escarpment forms western boundary of the surface.
Fig-2:- The main physiographic features of the area.
2.3 Drainage
West of Laikipian Plateau, rivers drain inland, to the Rift Valley. To the east, the Ewaso Narok –Ewaso Ng’iro system drains towards the Indian Ocean as does the Ol Keju Losera-Seiya river via the Milgis.
The study area is located on the Upper Ewaso Ng’iro drainage basin located to the north and west of Mt. Kenya. The basin extends between longitudes 36◦30E and 37◦45E and latitudes 0◦15N and 1◦00N (Fig. 1). The total basin area is 15,200 km2 varying in altitude from 800 to 5200m a.s.l. The basin can be divided into three sub-systems; the Ewaso Narok catchment (3380 km2), the Ewaso Ng’iro—Mt. Kenya catchment (4640 km2) and the Ewaso Ng’iro lower basin sub-system (7180 km2). The Ewaso Narok and the Ewaso Ng’iro—Mt. Kenya catchments are drained by perennial rivers which are controlled by forest, moorland and glacial hydrology as well as water abstractions. The lower Ewaso Ng’iro sub-catchment is characterized by runoff from ephemeral catchments, …………………………………………………………………………………………..……………………………………………Hydrogeological Survey for Sukuta/Mathira_2 September, 2012 15
Explanation:
1a-The Central Volcanoes
1b-Faulted volcanic escarpments
1c- Volcanic plateau
1d-Alluviated and lacustrine areas
2a-Laikipian Plateau
2b-swampy Basins
Surveyed Area

perennial flow from upstream highland sub-system, and spring flows close to the basin outlet. The Ewaso Ng’iro river is heavily dependent on the flow from Mt. Kenya during the dry periods while the lowland plains contribute significant proportions of the total flow during the wet periods which is attributable to the high surface runoff at the onset of rains. Fig-3 shows the Ewaso Ng’iro/Narok and Ol Keju Losera drainage systems.
The survey area lies on Ewaso Narok catchment sub-system on Laikipia plateau. This lies in the middle ground between the western highlands and eastern lowlands. Its elevation is between 1645 and 1737m amsl.
Fig-3 Ewaso Ng’iro/Narok and Ol Keju Losera drainage systems. ( After Hackman B.D. 1988)
…………………………………………………………………………………………..……………………………………………Hydrogeological Survey for Sukuta/Mathira_2 September, 2012 16

2.4 Climate, Vegetation Cover, Soil Cover
Generally the climate is highly variable and modified by the presence of Mt Kenya and the western highlands. Depending upon location within the basin, the seasonal rainfall distribution pattern can be bimodal, unimodal or trimodal. In the drier areas, rainfall is episodic and interspersed by lengthy periods of drought.
Tropical humid climate exists from 1,800m amsl to about 3,300m amsl with dense montane forest with rainfall in excess of 1000mm p.a. Semi-arid climate with an average annual rainfall of 300mm is found on the foreland plateau which extends northwards. This follows a bimodal pattern of long rains between March and May, and short rains between October …………………………………………………………………………………………..……………………………………………Hydrogeological Survey for Sukuta/Mathira_2 September, 2012 17
Surveyed Area

and December. Potential evapo-transpiration ranges from <1000mm at higher altitudes to >2500mm on lower altitudes. The Ewaso Nyiro Basin hence has water surplus highland area and an adjoining water deficit lowland.
Potential evapotranspiration on the other hand ranges from less than 1000mm at higher altitudes to over 2500mm at the lower altitudes. The basin thus represents a water-surplus highland area adjacent to a water-deficit lowland.
Overgrazing and low precipitation have led to depletion of vegetation cover over much of the area exposing the area to rapid erosion of soils and sub-soils. Most of vegetation in confined to alluvial plains along river courses and highlands and comprises of moderately dense acacia river-line forests.
The dominant soil types include the shallow and poorly developed soils on the steep mountain slopes, the well-developed soils on the plateau and gentle slopes and the poorly drained soils in the bottomlands and river valleys. The soil cover is generally shallow and variable. Dark pebbly/ sandy soils derived from the sub-surface phonolitic rocks cover the well-drained areas while the poorly drained areas are covered by low permeability black cotton soils. Sukutan/ Mathira-2 area lies on well drained soils. With respect to groundwater, the area is a groundwater surplus area as exemplified by the presence of springs and wetlands.
2.5 Existing Water Supplies and Water Demand
Sukutan/Mathira-2 area is not covered by the local water services provider (Ministry of Water and Irrigation-Northern Water services Board). Water sources in the area comprise mainly of dams and springs. These water points are not protected and are open to fecal contamination from surface run-off and wild animals’ droppings hence pose a huge health risk to the community. River waters were also noted to have high turbidity levels making washing difficult. The sources within the study area are Sukutan, Lesashore and Lilimogagani springs , Lemusinga well and Mutara dam. There are private boreholes concentrated within private ranches of Segera and Impala to the south of the area. These boreholes are not accessible to Sukutan/Mathira-2 community. Additionally surface water sources serve as water holes for wild animals putting the villagers at risk. This underscores the need for alternative sources of potable water. Boreholes form the best viable alternative to address this challenge.
…………………………………………………………………………………………..……………………………………………Hydrogeological Survey for Sukuta/Mathira_2 September, 2012 18
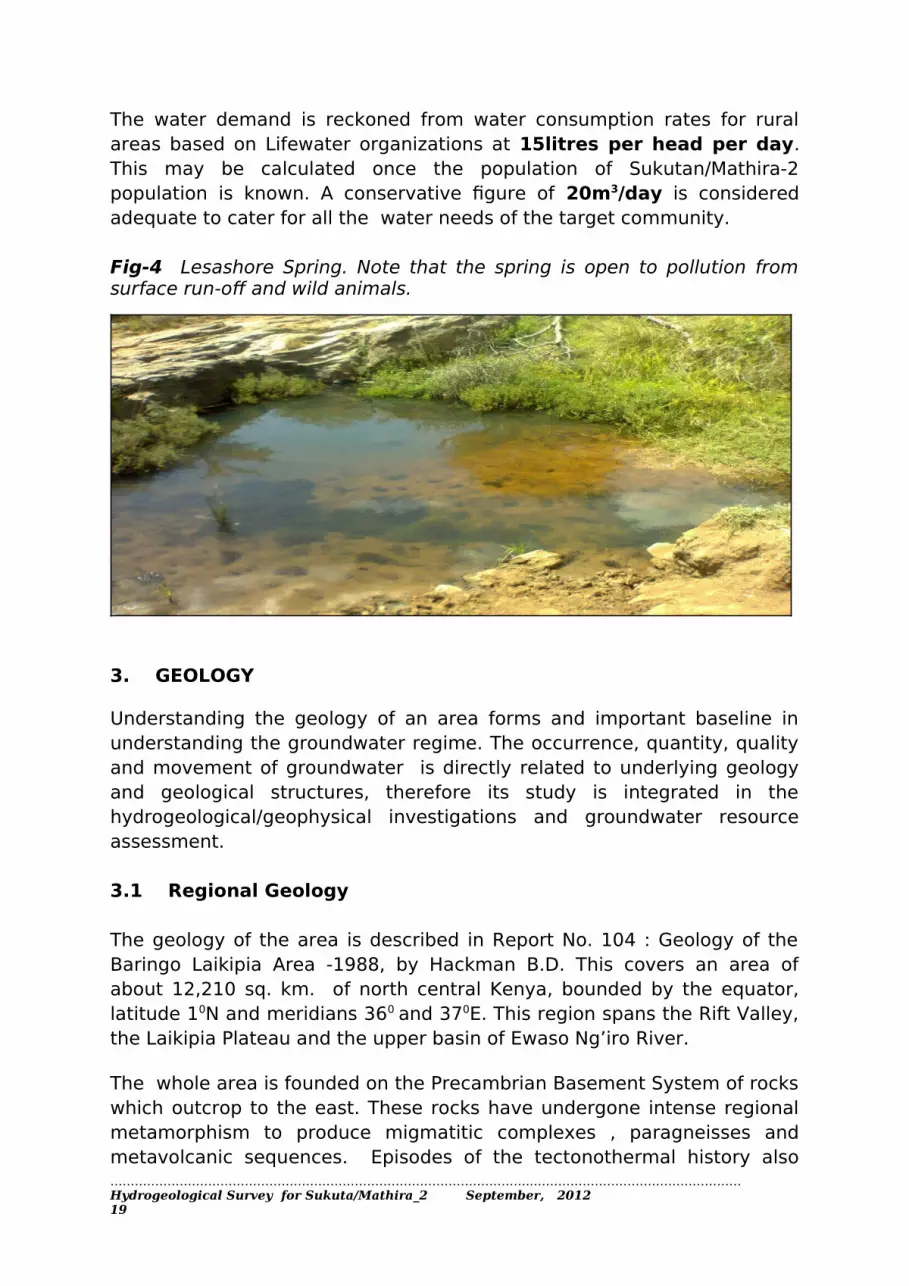
The water demand is reckoned from water consumption rates for rural areas based on Lifewater organizations at 15litres per head per day. This may be calculated once the population of Sukutan/Mathira-2 population is known. A conservative figure of 20m3/day is considered adequate to cater for all the water needs of the target community.
Fig-4 Lesashore Spring. Note that the spring is open to pollution from surface run-off and wild animals.
3. GEOLOGY
Understanding the geology of an area forms and important baseline in understanding the groundwater regime. The occurrence, quantity, quality and movement of groundwater is directly related to underlying geology and geological structures, therefore its study is integrated in the hydrogeological/geophysical investigations and groundwater resource assessment.
3.1 Regional Geology
The geology of the area is described in Report No. 104 : Geology of the Baringo Laikipia Area -1988, by Hackman B.D. This covers an area of about 12,210 sq. km. of north central Kenya, bounded by the equator, latitude 10N and meridians 360 and 370E. This region spans the Rift Valley, the Laikipia Plateau and the upper basin of Ewaso Ng’iro River.
The whole area is founded on the Precambrian Basement System of rocks which outcrop to the east. These rocks have undergone intense regional metamorphism to produce migmatitic complexes , paragneisses and metavolcanic sequences. Episodes of the tectonothermal history also …………………………………………………………………………………………..……………………………………………Hydrogeological Survey for Sukuta/Mathira_2 September, 2012 19

featured emplacement of ultramafic, mafic migmatitic and felsic intrusives. Above the Basement complex are Miocene to Recent volcanic outpouring overlain by subordinate sediments. The volcanic extrusives range from alkali-basalts to trachytes with copious Miocene phonolites forming the Laikipia Plateau on the extensive rift shoulder. Generally the area has good ground and surface water resources.
3.2 Local Geology
The local geology of the investigated area consists of the Rumuruti Group of the Miocene plateau phonolites. This group comprises of the Upper, middle and lower Uaso Narok phonolites. The study area is underlain by Middle Rumuruti Phonolites which are deduced to overly the Lower phonolitic group. The whole system overlies subvolcanic clastic sediments and paleosols (Old Land Surface-OLS) known as the Kirumun formation which grade to massive Basement system. It is important to note that this OLS forms the major aquifer and is an important target in any hydrogeological/geophysical survey in this area. Fig-4 is a geological map extract of the project area.
Fig-5: Geology of the Investigated Site.
…………………………………………………………………………………………..……………………………………………Hydrogeological Survey for Sukuta/Mathira_2 September, 2012 20
Key:-Tmvp- Rumuruti Group Phonolites Qr-Various superficial depositsMg- Basement gneissesmm- Migmatitic complexes
Sukutan Spring
Lemusinga Well
Lesashore Spring
Lolimigagani Spring

4. HYDROGEOLOGY
4.1 Groundwater Occurrence
Groundwater in the area occurs in three hydrogeological environments:-
(i) The old land surface between phonolites lava sheet and the Basement rocks. The aquifer comprises of volcanic clastic material, paleosols and weathered Basements. Where fractures exist within the Basement under the volcanics, considerable groundwater amounts may be encountered. This forms the major aquifer which is deduced to be regionally recharged from highlands east of the Rift Valley where rainfall is considerably higher than in the lowland plateau and groundwater percolates into porous sections of the volcanic masses.
(ii) Intervolcanic surfaces which represent episodic eruption with intervening periods of erosion and sediment deposition. Water moves along these surfaces from remote recharge areas and may manifest as springs.
(iii) Weathered and/or fractured Basement rocks will form minor aquifers where recharge is mainly percolation through the weathered/fracture zones. Under hydraulic gradient the water then flows over the fresh basement and accumulates in pre-existing hollows, valleys and fracture zones. Natural channels and pre-existing geo-synclinal basins are favourable for ground water storage.
4.2 Local Hydrogeology
Within the four surveyed areas, groundwater has been deduced to occur in the three hydrogeological environments. The principle aquifers are formed by old land surfaces (OLS’s ) forming thin stratiform bodies sandwiched between lavas which have locally given rise to springs such as Sukutan, Lolimigagani and Lemusinga. Other springs seep from the Basement phonolites interface as noted at Lesashore Well. These waters form an important recharge for Mutara River. Boreholes that intercept these aquiferous zones will definitely produce good quality water and will have negligible adverse impact on Mutara River recharge regime.N-S trending joint swarms were noted at Lesashore spring and that act as important conduits for recharge water in Basement areas. Where the Basement rock is sufficiently weathered and fractured, high yielding boreholes may be realized with careful siting. Leshashore spring was deduced to result from a fractured felsic dike trending N-S which is connected to recharge waters from the volcanic zones on either side.
…………………………………………………………………………………………..……………………………………………Hydrogeological Survey for Sukuta/Mathira_2 September, 2012 21

Yields from Rumuruti phonolites somewhat falls towards the east but studies have indicated that there is considerable ground water potential with no depletion envisaged in the near future.
4.3 Aquifer Characteristics
4.3.1 Hydraulic Parameters
Transmissibility T of a confined aquifer can be calculated from the well-known equilibrium Thiem equation which can be written as:-
T=(Q/2πs)log (re/rw)
Where, T = Transmissivity s = Maximum well drawdown
re = Radius of influence Q = Pumping rate
rw = Well radiusπ ≈3.14
In the Thiem equation, the ratio re/rw cannot be determined accurately unless there is an extensive network of observation wells during the pumping test. For the well test data from MoWI, aquifer transmissibility is approximated from empirical relationships attributed to Logan et. al. and recovery portion of borehole test data:-
T = 1.22 Q/s
Logan approximation given above only applies to confined aquifer conditions. Similar approximations have been derived elsewhere. For example, Hunting Technical Services and Sir M. MacDonald & Partners obtained the relationship for well tests on alluvial aquifers in the Indus valley of Pakistan.
T = 1.32 Q/s
Logan derived the following approximation for the unconfined case:
…………………………………………………………………………………………..……………………………………………Hydrogeological Survey for Sukuta/Mathira_2 September, 2012 22

T = 2.43 Qb/(s(2b-s))
where b = aquifer thickness. Logan method can give a reasonable first estimate of transmissivity - provided that near-equilibrium conditions are achieved when the maximum drawdown is measured.
Data available from Ministry of Water and Irrigation is based on step-drawdown pumping tests and recovery measurements for the drilled boreholes. The constant discharge test necessary for determination of aquifer hydraulic characteristics has not been done.(Groundwater Master Plan-1992). Aquifer parameters presented here are estimated from the recovery test portion of the data and by using Logan’s method. Assuming uniformity in hydrogeological conditions, the reckoned values are regarded as general and should be viewed as guideline only. Data available from Ministry of Water and Irrigation is based on step-drawdown pumping tests and recovery measurements for the drilled boreholes. The constant discharge test necessary for determination of aquifer hydraulic characteristics has been done.(Groundwater Master Plan-1992). Aquifer parameters presented here are estimated from the recovery test portion of the data.The table below summarizes the boreholes parameters for the area assuming uniform hydrogeological conditions in volcanic rocks. The data is based on a sample of 6932No boreholes drilled in volcanic hydrogeological environment. (Groundwater Master Plan-1992, Table C-3.10). This includes the Sukutan/Mathira-2 area.
Table-1: Aquifer Parameters
Sample Population of boreholes
Parameter Average Measured Value
Standard Deviation
1832 Drawdown-M 37.05 ±34.1
823 Recovery Time(Hrs) 6.31 ±8.77
403 Storage Coefficient 0.03 ±0.07
3448 Yield-m3/hr 7.44 ±6.47
426 Transmissivitym2/day
0.02 ±2.88
6932 Depth 124.7m ±63.5
…………………………………………………………………………………………..……………………………………………Hydrogeological Survey for Sukuta/Mathira_2 September, 2012 23

-ditto- Water Struck Level 94m ±58.4
The average transmissivity of 28.8m2/day is able to sustain a motorised pumping system. As a rough guide, a transmissivity value of <1m2/day will not be likely to sustain a hand-pump. Values >1 will sustain a hand-pump.
4.3.2 Borehole Specific Capacities
Kenya is simplified to consist of three major rock types: Basement, Volcanics and Sedimentary rocks. Ground water occurs in those rock types alone or in various combinations as hereunder:-
(i) Volcanics (V)(ii) Basements (B)(iii) Sediments (S)(iv) (V) over (B)(v) (S) over (B)(vi) (S) over (V)(vii) (V) over (S)
The investigated site falls under category (iv) of volcanics overlying Basements. The average specific capacity has been estimated to be 0.29 m2/hr (Groundwater Master Plan-1992, pp C-13). This converts to approximately 7m2/day. This is a moderately high value than can sustain a water demand of 20m3/day without adversely affecting the local aquifer regime.
4.3.3 Groundwater Flux/Recharge
Groundwater recharge or deep drainage or deep percolation is a hydrologic process where water moves downward from surface water to groundwater. This process usually occurs in the vadose zone below plant roots and is often expressed as a flux to the water table surface. Recharge occurs both naturally (through the water cycle) and anthropologically (i.e., "artificial groundwater recharge"), where rainwater and/ or reclaimed water is routed to the subsurface.
Accurate estimation of groundwater recharge is extremely important for proper management of groundwater systems. Many different approaches exist for estimating recharge. The water-table fluctuation method may be the most widely used technique for estimating recharge; it requires knowledge of specific yield and changes in water levels over time. Advantages of this approach include its simplicity and insensitivity to the mechanism by which water moves through the unsaturated zone. Uncertainty in estimates generated by this method relate to the limited …………………………………………………………………………………………..……………………………………………Hydrogeological Survey for Sukuta/Mathira_2 September, 2012 24

accuracy with which specific yield can be determined and to the extent to which assumptions inherent in the method are valid. Other methods use water levels mostly based on the Darcy equation (Hydrology Journal (2002) 10:91-109).
Water table changes over time have not been recorded for boreholes in Kenya. Hence determination of groundwater flux is rather intractable. However an empirical estimate of flux can be calculated by assuming that 10% of annual rainfall replenishes the groundwater reserves. In the study area including the catchments, the average rainfall is 800mm per annum, therefore 10% of this precipitation is available as recharge. This assumption is subject to large variation due to complex interplay of hydrogeological factors in this environment.
4.3.4 Analysis Of Borehole Data
Borehole data is analyzed for the purpose of carrying out correlative studies and predicting the yields and depth(s) to aquiferous zone(s). This is based on the assumption that hydrogeological conditions are fairly uniform for the general area.
Borehole data from neighbouring boreholes was obtained from Ministry of Water and Irrigation Headquarters database and is summarized on the table below:-
Table 2: Borehole data near the proposed borehole
C No.
Name of owner
Depth
(m)
WSL
(m)
WRL
(m)
Yield
m3/hr
Pumping Water Level (m)
P141 ……….. 67.1 62.2 14.0 11.4 ….
P171 Comm. of L.G. lands
59.4 Dry … ….. …..
P172 ‘’ 87.5 50.3 44.2 4.2 …
P175 ‘’ 65.8 39 32 3 ….
C1819
H.M. Collison 179.8 173.7 75.6 4 …
C3563
L. Napier 68.4 67-68 33.2 9.1 ….
…………………………………………………………………………………………..……………………………………………Hydrogeological Survey for Sukuta/Mathira_2 September, 2012 25

C1702
H.E. Blackbeard
52.4 Dry …. …. ….
C2562
Ol Peseta 213 146-204
44,61 13.6 ….
C1703
A.C. Rondall 172.2 169.8 59.4 7.7 …
C2898
‘’ 181.7 38.4 36.9 0.8 ..
C1892
Segera ranch 122 34-104 30.1 1.2 106
NB: there are no boreholes within 1km of the surveyed sites
Borehole data analysis is indicative of moderate groundwater potential. The aquiferous zones are mainly formed from old land surfaces, intervolcanic flow interfaces and fractured Basements. From the borehole yields it may be inferred the development of these zones is highly variable leading to different borehole yields. The anticipated yields of the proposed boreholes is estimated at 6m3/hr.
5. GROUND WATER QUALITY
Water quality is expected to be good for domestic use, however it may be slightly saline due to aridity and high evapo-transpiration rates. High fluoride contents for boreholes has been reported for this area hence water quality analysis must be carried out to determine the Fluoride concentrations. The water quality guideline values for water are those published by WHO. In the case of rural and community water supply, the WHO guideline values have to be often considered as long-term. The following water quality parameters should be used to measure and assess the quality of water intended for water supply:(1)Bacteriological aspects
(2)Chemical and physical aspects:-…………………………………………………………………………………………..……………………………………………Hydrogeological Survey for Sukuta/Mathira_2 September, 2012 26
Turbidity Colour Taste & odour Electrical conductivity Fluoride Iron
The basic requirements of drinking water should be:-(1)Free from pathogens(2)Containing no compounds with an adverse acute or long term effect
on human health.(3)Fairly clear ( low turbidity or little colour)(4)Non-corrosive and non-staining.
5.1 Bacteriological Quality
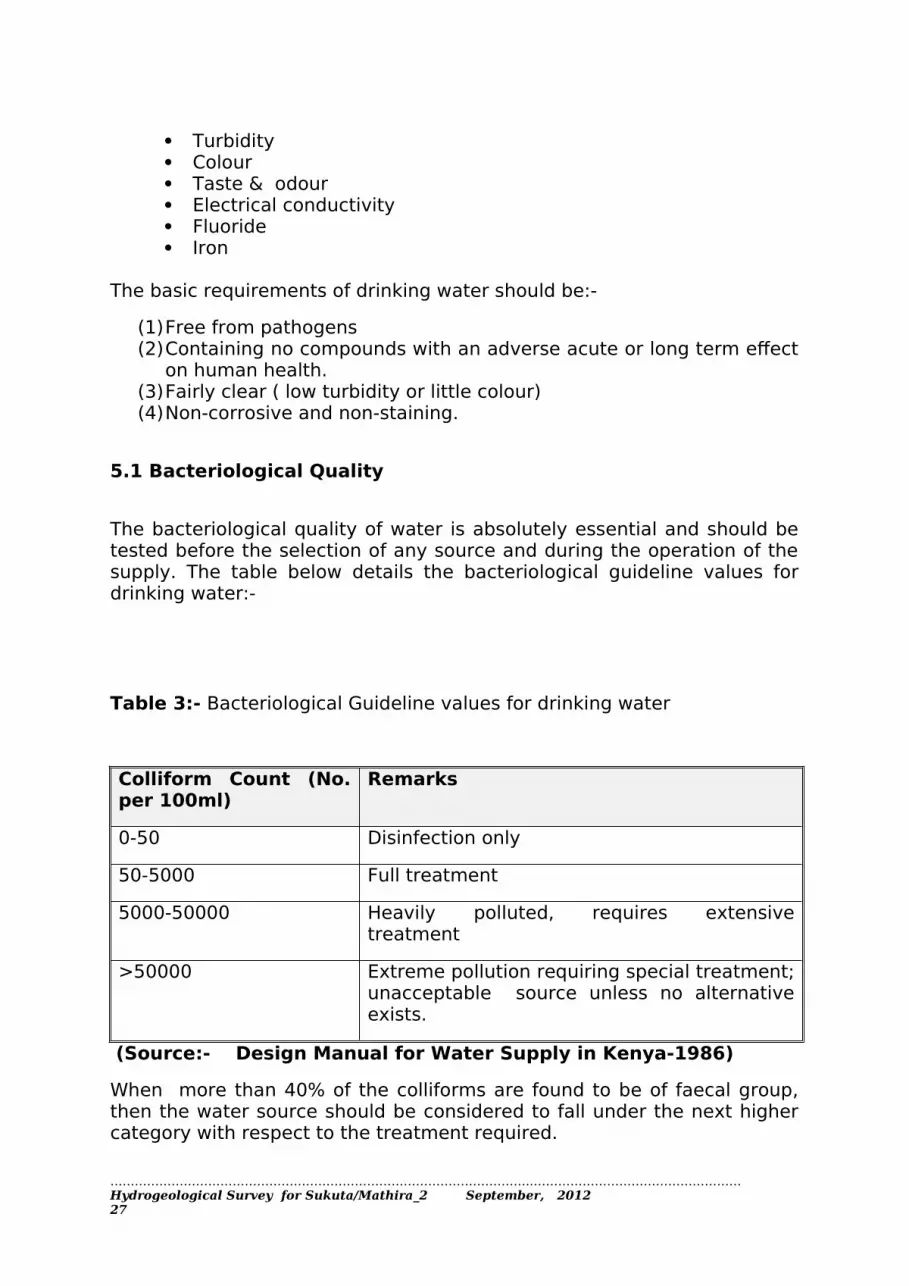
The bacteriological quality of water is absolutely essential and should be tested before the selection of any source and during the operation of the supply. The table below details the bacteriological guideline values for drinking water:-
Table 3:- Bacteriological Guideline values for drinking water
Colliform Count (No. per 100ml)
Remarks
0-50 Disinfection only50-5000 Full treatment5000-50000 Heavily polluted, requires extensive
treatment>50000 Extreme pollution requiring special treatment;
unacceptable source unless no alternative exists.
(Source:- Design Manual for Water Supply in Kenya-1986)
When more than 40% of the colliforms are found to be of faecal group, then the water source should be considered to fall under the next higher category with respect to the treatment required.
…………………………………………………………………………………………..……………………………………………Hydrogeological Survey for Sukuta/Mathira_2 September, 2012 27

5.2 Chemical and Physical Quality.
The table below summarizes some pertinent chemical and physical guidelines values for drinking water:Table 4: chemical and physical guidelines for drinking water
Inorganic Constituents
Organic Constituents Desirable Aesthetic quality
Parameter
ppm Parameter ppm Parameter ppm
Arsenic 0.05 Aldrin & diedrin 0.03 Al 0.2Cd 0.005 Benzene 10 Cl 250Cr 0.050 Benzo-a-pyrine 0.01 Color 15(TCU)Cyanide 0.1 Carbon
tetrachloride3 Cu 1
F 1.5 Chlordane 0.3 Fe 0.3F(Kenya) 3 Chlorobenzene 0.1-3 Mn 0.1Pb 0.05 Chlorophenols 0.1 pH 6.5-8.5Hg 0.001 Chloroforms 30 TDS 1000-
1500Se 0.01 2,4 D 100 Turbidity 5-NO3 10 DDT 1 Zn 15
1,2,Dichloroethane
10 Hardness (As CaCo3)
200
1,2 Dichloroethylene
0.3 Taste & odour
500
Heptachlor & heptachlor Epoxide
0.1 HS Inoffensive
Hexachlorobenzene
0.01
Lindane 3Methoxychlor 30
…………………………………………………………………………………………..……………………………………………Hydrogeological Survey for Sukuta/Mathira_2 September, 2012 28

Pentachlorophenol
10
Tetrachloroethylene
10
2,4,6 Tirchlorophenol
10
(Source:- Design Manual for Water Supply in Kenya-1986)
Groundwater quality for the area is classified as generally good. After resource development however, water quality analysis is mandatory to ascertain the level of the above parameters and appropriate advice given.
6 . IMPACT OF THE PROPOSED ACTIVITY
The most important impact of the proposed activity once completed will be its effect on the groundwater regime of the locality once water abstraction is commenced. The Mt Kenya-Laikipia Plateau-Aberdare catchment area is quite large with recharge rates at many orders of magnitude than the current abstraction rates of the existing boreholes. Bristow and Temperley-1964, carried out a general survey of the hydrology of central laikipia area and concluded that ‘many times the present number of boreholes could be drilled before depletion would set in’. Therefore borehole interference is expected to be minimal resulting from construction of Sukutan/mathira-2 borehole.Borehole construction works should be also guided by best practices in site management as laid down in the FIDIC to ensure environmental preservation. Drilling tailings, foam or any chemicals used should be properly disposed to avoid contamination of both ground and surface water sources. This can be achieved through supervision by a competent hydrogeologist/engineer.
7. GEOPHYSICS
7.1 Basic Principles of Galvanic Resistivity method
The electrical properties of the upper parts of the earth’s crust depend upon the rock type, porosity, pore-space saturation and interconnectivity, and the level of salinity of the pore water. Saturated rocks have lower resistivity than dry or unsaturated rocks. Both higher porosities and salinity of saturated rocks mean higher conductivities respectively. The presence of clays and conductive minerals can also increase the conductivity of the rocks.
…………………………………………………………………………………………..……………………………………………Hydrogeological Survey for Sukuta/Mathira_2 September, 2012 29

The resistivity of earth materials can be studied by measuring the electrical potential distribution produced at the earths surface by injection of low frequency electric current. Two fundamental considerations are the basis of the theory behind galvanic resistivity methods viz:-(1) Ohm’s law : E = ρi
Where: E = Potential gradient (Volts per meter) i = Current density (Am-2) ρ = Resistivity of the earth medium(Ω-m)
(2) The divergence condition for the current flux into the ground:
Δ x i = 0 It follows from above that the potential function V for a single point source at a distance of r meters on the earth’s surface is given by:
(i) Vr = ρ I/2Πr (Volts)
In hydro geological field surveys using galvanic Resistivity methods the quantities measured are current I, flowing between two electrodes A & B and potential difference ΔV between two measuring points M & N. The following relationship applies to various electrodes configurations.
(ii) ρ = K x ΔV/IAB (Ω-m)
Where K is defined as the geometrical factor derived from electrode configuration adopted. The most common field arrays are the Schlumberger and Wenner configurations.Data obtained is normally subjected to modelling analysis using a digital computer. This is combined with data from existing boreholes to come up with a more realistic interpretation and recommendations.
7.2 2-D Electrical Imaging Surveys
The greatest limitation of 1D resistivity sounding method is that it does not take into account horizontal changes in the subsurface resistivity. A more accurate model of the subsurface is a two-dimensional (2-D) model where the resistivity changes in the vertical direction, as well as in the …………………………………………………………………………………………..……………………………………………Hydrogeological Survey for Sukuta/Mathira_2 September, 2012 30
horizontal direction along the survey line. In this case, it is assumed that resistivity does not change in the direction that is perpendicular to the survey line. In many situations, particularly for surveys over elongated geological bodies, this is a reasonable assumption. In theory, a 3-D resistivity survey and interpretation model should be even more accurate. However, at the present time, 2-D surveys are the most practical economic compromise between obtaining very accurate results and keeping the survey costs down. Interpretation of the data has been done using RES2DINV program. The program uses an iterative method whereby starting from an initial model, the program tries to find an improved model whose calculated apparent resistivity values are closer to the measured values. One well known iterative inversion method is the smoothness constrained method (deGroot-Hedlin and Constable, 1990) that has the following mathematical form:- (JTJ + uF)d = JTg - uFr (C.1)where F = a smoothing matrix
J = the Jacobian matrix of partial derivativesr = a vector containing the logarithm of the model
resistivity valuesu = the damping factord = model perturbation vectorg = the discrepancy vector
The discrepancy vector, g, contains the difference between the calculated and measured apparent resistivity values. The magnitude of this vector is frequently given as a RMS (root-mean-squared) value. This is the quantity that the inversion method seeks to reduce in an attempt to find a better model after each iteration. The model perturbation vector, d, is the change in the model resistivity values calculated using the above equation which normally results in an “improved” model. The above equation tries to minimize a combination of two quantities, the difference between the calculated and measured apparent resistivity values as well as the roughness (i.e. the reciprocal of the model smoothness) of the model resistivity values. The damping factor, u, controls the weight given to the model smoothness in the inversion process. The larger the damping factor, the smoother will be the model but the apparent resistivity RMS error will probably be larger.In the present survey 28 electrodes were employed with a separation of 10m using the Schlumberger array with a total spread of 280m. No roll-on was implemented due to terrain limitations. A total of 169 readings were taken per section.
7.3 Fieldwork
The field work was carried from 17th-21st September 2012. The exercise was undertaken with the aim of carrying out an on-site examination and …………………………………………………………………………………………..……………………………………………Hydrogeological Survey for Sukuta/Mathira_2 September, 2012 31

conducting geophysical investigations to determine geological layout and consequently the optimum depth of drilling to reach the potential water bearing formation where applicable. Deep probe resistivity model No. SSR-MP-AT was used for the survey. For each site one 2D section was generated and the anomalous zones noted. Three vertical electric soundings were executed so as to intersect the anomalous zones. This way it was possible to estimate the depth of aquiferous zones.
The Schlumberger array was adopted for vertical probing. AB/2 was varied from 1.6m to a depth where the data would define a slope of 450
indicating fresh Basement or not more than 320m. Kinks in the graph indicative of possible fracturing/deep weathering were noted for further interpretation.
7.3.1 Sukutan Spring
(a) 2D Section
The 2D section was executed in north-south azimuth. The layout was designed to perpendicularly intersect Sukutan spring.
…………………………………………………………………………………………..……………………………………………Hydrogeological Survey for Sukuta/Mathira_2 September, 2012 32

Start elevation End Elevation Geology
00 24.445’N360 45.462’E
1736m amsl
00 24.652’N360 45.573’E
1736m amsl Phonolites overlying Basements at depth
Interpretation
The high resistivity layer represents impermeable fresh phonolites The upper low resistivity layer represents the Sukutan Spring moist
top soil mantle. The bottom apex of the section represents the contact zone
between phonolites and the Basements and is deduced to be the principle aquifer which can be described as confined.
Deep 1D soundings were executed on approximate positions shown.
(b) 2D Geo-Electric Model (IPI2win)
Ves-1 ves-2 ves-3
…………………………………………………………………………………………..……………………………………………Hydrogeological Survey for Sukuta/Mathira_2 September, 2012 33
VES-3 VES-2 VES-1

Interpretation:
The vertical soundings clearly delineate the OLS aquiferous horizon which has an horizontal disposition. Drilling on any of the three VESs will encounter this aquifer but VES-3 is the best since it penetrates upper intervolcanic OLSs which would increase the net yield.
7.3.2 Leshashore Spring
(a) 2D Section
…………………………………………………………………………………………..……………………………………………Hydrogeological Survey for Sukuta/Mathira_2 September, 2012 34

Start elevation End Elevation Geology
00 24.050’N360 46.644’E
1756m amsl
00 24.145’N360
46.7537E
1744m amsl Basements with quarzo-felspathic dike
Interpretation
The low resistivity zone on the left coincides with a quarzo-feldpathic dike that strikes N-S and dips to the west which is apparent from the section. The low resistivity zone on the right could represent a fracture/weathering in the granitoid gneiss which underlies the site
The bottom apex of the section represents fresh Basements. Deep 1D soundings were executed on approximate positions
shown. VES-2 and 3 were designed to intercept the dipping dike at progressively increasing depth. VES-1 was executed to investigate the anomalous zone on the right.
(b) 2D Geo-Electric Model (IPI2win)
VES-1 VES-2 VES-3
…………………………………………………………………………………………..……………………………………………Hydrogeological Survey for Sukuta/Mathira_2 September, 2012 35
VES-3 VES-2 VES-1
Inferred pegmatite Dyke Inferred fracture
WEST EAST
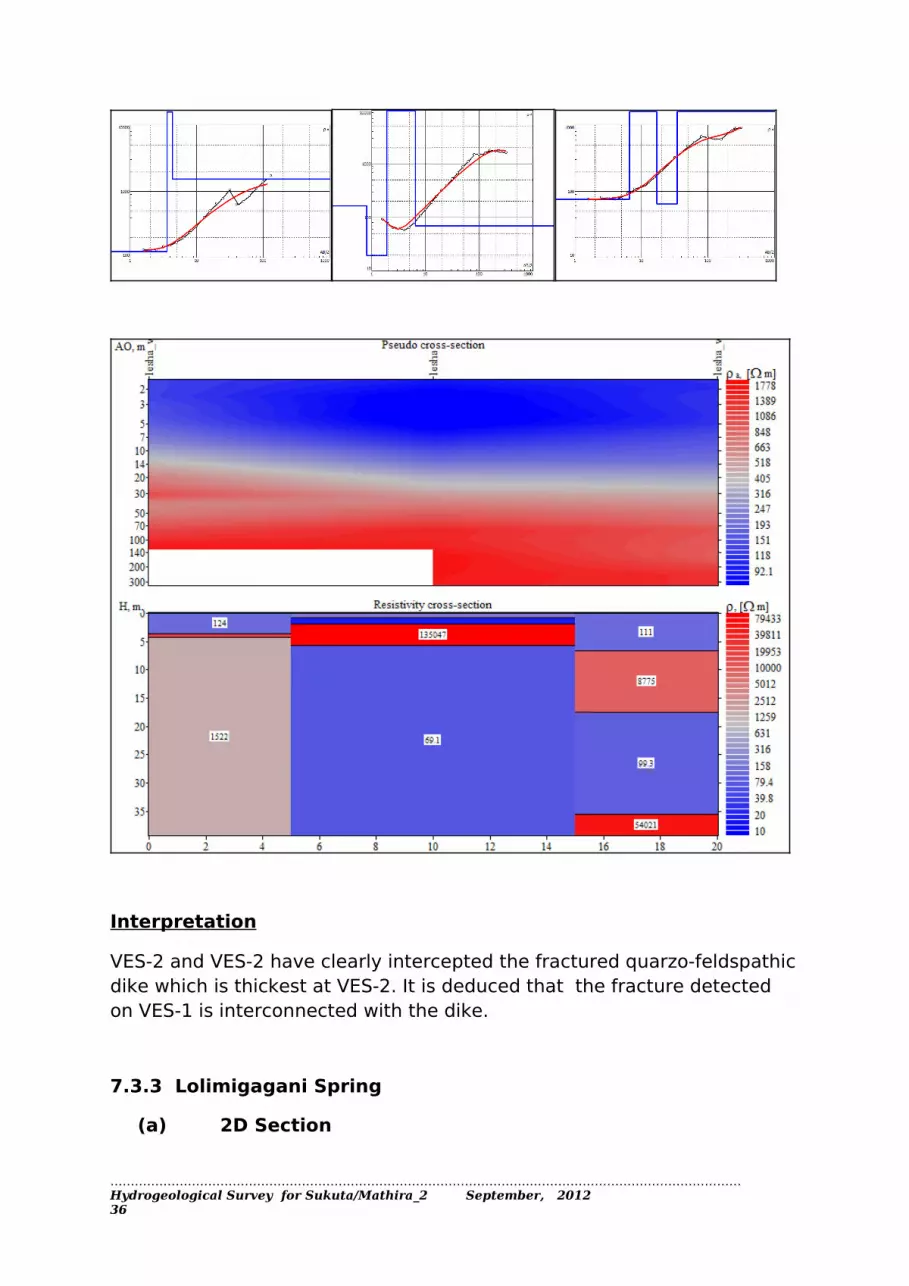
Interpretation
VES-2 and VES-2 have clearly intercepted the fractured quarzo-feldspathic dike which is thickest at VES-2. It is deduced that the fracture detected on VES-1 is interconnected with the dike.
7.3.3 Lolimigagani Spring
(a) 2D Section
…………………………………………………………………………………………..……………………………………………Hydrogeological Survey for Sukuta/Mathira_2 September, 2012 36

Start elevation End Elevation Geology
00 22.877’N360 46.289’E
1761m amsl
00 23.025’N360 46.280’E
162m amsl Phonolites overlying Basements at depth
Interpretation
The section shows a complex interrelationship of volcanic sheets with a clear break on the left side. The low resistivity top layer is deduced to represent the flow into Lolimigagani spring. The OLS aquifer is deeper on the right portion of the section this area but shallower at VES-1.
(b) 2D Geo-Electric Model (IPI2win)
VES-1 VES-2 VES-3
…………………………………………………………………………………………..……………………………………………Hydrogeological Survey for Sukuta/Mathira_2 September, 2012 37
VES-1 VES-2 VES-3

Interpretation
The vertical electric soundings confirm the observations made on the 2D section
7.3.4 Lemusinga Well
Start elevation End Elevation Geology
…………………………………………………………………………………………..……………………………………………Hydrogeological Survey for Sukuta/Mathira_2 September, 2012 38

00 23.199’N360 47.020’E
1748m amsl
00 23.332’N360 47.091’E
1746m amsl Old land surface on Mutara river cut at the contact of phonolites and Basement rocks
(a) 2D Section
Interpretation
An anomalous zone deduced to represent deep weathering and fracturing occurs on the left side of the section. VES-1 was executed to intersect this zone. VES-2 and 3 were done for correlation purposes. The Basement rocks are shallower on the right side of the section.
(b) 2D Geo-Electric Model (IPI2win)
VES-2 VES-2 VES-3
…………………………………………………………………………………………..……………………………………………Hydrogeological Survey for Sukuta/Mathira_2 September, 2012 39
VES-1 VES-2 VES-3

Interpretation
Weathering and/or fracturing is more pronounced and deeper at VES-1. At VES-2 & 3, the Basement rock rapidly becomes massive with depth. VES-1 has the best prospects for this site.
Table-5:- Interpretation of Vertical Electric Soundings
Site Name Recommended VES No.
Depth (m)
True Resistivity (Ohm-m)
Inferred Geological formation
Groundwater Prospects
Sukutan 3 3.6 39.2 Top stony soils Dry…………………………………………………………………………………………..……………………………………………Hydrogeological Survey for Sukuta/Mathira_2 September, 2012 40
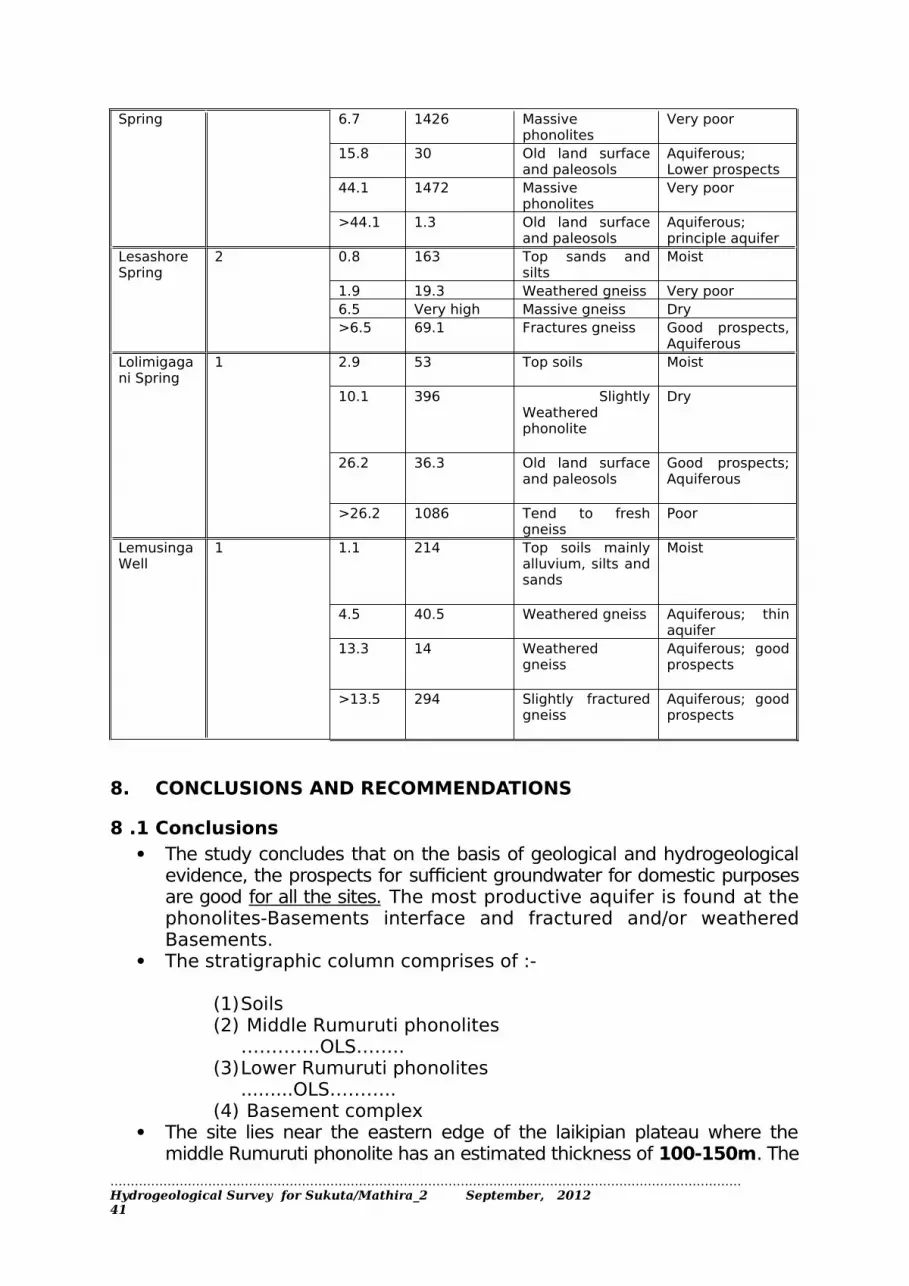
Spring 6.7 1426 Massive phonolites
Very poor
15.8 30 Old land surface and paleosols
Aquiferous; Lower prospects
44.1 1472 Massive phonolites
Very poor
>44.1 1.3 Old land surface and paleosols
Aquiferous; principle aquifer
Lesashore Spring
2 0.8 163 Top sands and silts
Moist
1.9 19.3 Weathered gneiss Very poor6.5 Very high Massive gneiss Dry>6.5 69.1 Fractures gneiss Good prospects,
AquiferousLolimigagani Spring
1 2.9 53 Top soils Moist
10.1 396 Slightly Weathered phonolite
Dry
26.2 36.3 Old land surface and paleosols
Good prospects; Aquiferous
>26.2 1086 Tend to fresh gneiss
Poor
Lemusinga Well
1 1.1 214 Top soils mainly alluvium, silts and sands
Moist
4.5 40.5 Weathered gneiss Aquiferous; thin aquifer
13.3 14 Weathered gneiss
Aquiferous; good prospects
>13.5 294 Slightly fractured gneiss
Aquiferous; good prospects
8. CONCLUSIONS AND RECOMMENDATIONS
8 .1 Conclusions The study concludes that on the basis of geological and hydrogeological
evidence, the prospects for sufficient groundwater for domestic purposes are good for all the sites. The most productive aquifer is found at the phonolites-Basements interface and fractured and/or weathered Basements.
The stratigraphic column comprises of :-
(1)Soils(2) Middle Rumuruti phonolites
………….OLS……..(3)Lower Rumuruti phonolites
.........OLS………..(4) Basement complex
The site lies near the eastern edge of the laikipian plateau where the middle Rumuruti phonolite has an estimated thickness of 100-150m. The
…………………………………………………………………………………………..……………………………………………Hydrogeological Survey for Sukuta/Mathira_2 September, 2012 41

Lower Rumuruti has an estimated thickness range of 15-180m ( Carney, 1972).
The cumulative thickness of the volcanic pile is in the range:- 115-330m. It follows that intervolcanic aquifer lies between 100-150m bgl or
thereabout, whereas the major aquifer at the OLS will be in the range 115- >300m bgl.
The aquifers in the study area are adequately replenished at several orders larger than the anticipated abstraction, thereby ensuring a reliable long-term water supply.
There are no boreholes within 1km of the surveyed points. Groundwater quality in the area is good for human consumption but may
be slightly hard due to low precipitation and high evapo-transpiration rates.
8.2 Recommendations
The recommended depths are a compromise between the actual observed thicknesses of the lithologic unit and geo-electric models. It should also be noted that intervolcanic contacts are gradational and so are the OLS’s. Shallow aquifers are available within the volcanic units capable of satisfying the envisaged demand.
In view of the above it is recommended that boreholes be drilled to depths recommended as summarized on the table below:-
Area of Interest
Recommended Point
Coordinates(0 Decimal min)
Elevation(m) amsl
Minimum Recommended Depth (m)
Maximum Recommended Depth (m)
1) Sukutan Spring
VES-3 00, 24.521’N360
45.490’E1735 100 150
2) Lesashore Spring
VES-2 00, 24.105’N360
46.710’E1749 80 150
3) Lolimigagagani Spring
VES-1 00, 22.889’N360
46.285’E1773 100 150
4) Lemusinga Well
VES-1 00, 23.296’N360
47.069’E1741 80 130
The borehole must be installed with a Water Meter and an Airline/piezometer to monitor groundwater abstraction and to facilitate regular measurements of the static water level in the borehole.
…………………………………………………………………………………………..……………………………………………Hydrogeological Survey for Sukuta/Mathira_2 September, 2012 42

Upon drilling completion, a 2-litre water sample from the borehole should be collected for reference to the WRMA Testing Laboratory, or any other competent Water Testing Authority for a full physical, chemical and bacteriological analysis before the water is put to any use.
A copy of the analysis report must be sent to the WRMA – Regional Office for record.
A drilling permit has to be acquired from WRMA Regional Office within the Rift Valley Drainage Basin
The recommended points are pegged and known to Mr. John (0704344772) a community worker with Zeitz Foundation. In Appendix 1, additional recommendations on the construction and completion of a borehole are given.
The recommended depth is a maximum, but should all available aquifers be penetrated before attaining the maximum depth, drilling should be halted. This should be done under the supervision of a competent hydrogeologist/engineer.
…………………………………………………………………………………………..……………………………………………Hydrogeological Survey for Sukuta/Mathira_2 September, 2012 43

REFERENCES
A.M. MACDONALD, J. DAVIES AND B.E.O. DOCHARTAIGH, 2002
Simple Methods for Asssessing Groundwater Resources in Low permeability Areas of Africa; British Geological Survey.
B.D. Hackman, 1988.
Geology of Baringo-Laikipia area, Ministry of Environment and Natural Resources, Mines and Geology Department.
Carney J.N. ,1972
The geology of the area to east of L. Baringo, Rift Valley Province, Kenya, PhD, thesis, University of London (Unpublished)
ENGELENC, M. 1978.
Methode d’etude et de lecherche de l’eau souterraine des roches cristallaines de l’Afrique de l’ouest. Bulletin du comite inter-africain d’etudes hydrauliques (CIEH) serie hydrogeology, pp.318
E.P. WRIGHT, 1992
The Hydrogeology of Crystalline Basement Aquifers in Africa; Geological Society, London Special Publications.
GREENBAUM, D. 1985.
Review of remote sensing applications to groundwater exploration in basement and rigolith. British Geological Survey, Nottingham, UK, pp. 36.
MAC FARLANE , M.J. 1985.
The weathering profile above crystalline basement rocks under tropical weathering conditions and in the context of hydrogeology. Department of Microbiology , Reading University, UK, pp. 152.
M.H. Loke, 2000
Electrical image surveying for environmental and engineering studies
MINISTRY OF WATER & IRRIGATION, JAICA, 1992
The Study on The National Groundwater Master Plan, Sectoral Report (C) Groundwater Resources.
MINISTRY OF WATER & IRRIGATION, JAICA, 1986
Design Manual for Water Supply in Kenya
SNOW, D.T. 1968.
Hydraulic character of Fractured Metamorphic Rocks of Front Range (Colorado) and Implications to the Rocky Mountain Arsenal Well. Quart. Color. Sch. Of Mines. Vol. 63 (1) , pp 167-199
UNESCO, 1984.
…………………………………………………………………………………………..……………………………………………Hydrogeological Survey for Sukuta/Mathira_2 September, 2012 44

Groundwater in Hard Rocks, Unesco, Technical Document of the International Hydrological Programme, pp. 228.
Appendix 1 : Drilling
Drilling Technique
Drilling should be carried out with an appropriate tool preferably a rotary drilling machine.
Geological rock samples should be collected at 2 metre intervals. Struck and rest water levels and if possible, estimates of the yield of individual aquifers encountered, should also be noted.
Well Design
The design of the well should ensure that screens are placed against the optimum aquifer zones. An experienced hydrogeologist should make the final design.
Casing and Screens
The well should be cased and screened with good quality material. Owing to the depth of the borehole, it is recommended to use steel casings and screens of high open surface area.
We strongly advise against the use of torch-cut steel well casing as screen. In general, its use will reduce well efficiency (which leads to lower yield), increase pumping costs through greater drawdown, increase maintenance costs, and eventually reduction of the potential effective life of the well.
Gravel Pack
The use of a gravel pack is recommended within the aquifer zone, because the aquifer could contain sands or silts which are finer than the screen slot size. An 8" diameter borehole screened at 6" will leave an annular space of approximately 1", which should be sufficient. Should the slot size chosen be too large, the well will pump sand, thus damaging the pumping plant, and leading to gradual `siltation' of the well. The slot size should be in the order of 1.5 mm. The grain size of the gravel pack should be an average 2 - 4 mm.
…………………………………………………………………………………………..……………………………………………Hydrogeological Survey for Sukuta/Mathira_2 September, 2012 45

Well Construction
Once the design has been agreed, construction can proceed. In installing screen and casing, centralizers at 6 metre intervals should be used to ensure centrality within the borehole. This is particularly important for correct insertion of artificial gravel pack all around the screen. After installation, gravel packed sections should be sealed off top and bottom with clay (2 m).
The remaining annular space should be backfilled with an inert material, and the top five metres grouted with cement to ensure that no surface water at the wellhead can enter the well bore and cause contamination.
Well Development
Once screen, pack, seals and backfill have been installed, the well should be developed. Development aims at repairing the damage done to the aquifer during the course of drilling by removing clays and other additives from the borehole walls. Secondly, it alters the physical characteristics of the aquifer around the screen and removes fine particles.
We do not advocate the use of over pumping as a means of development since it only increases permeability in zones, which are already permeable. Instead, we would recommend the use of air or water jetting, or the use of the mechanical plunger, which physically agitates the gravel pack and adjacent aquifer material. This is an extremely efficient method of developing and cleaning wells.
Well development is an expensive element in the completion of a well, but is usually justified in longer well-life, greater efficiencies, lower operational and maintenance costs and a more constant yield. Within this frame the pump should be installed at least 2 m above the screen, certainly not at the same depth as the screen.
Well Testing
After development and preliminary tests, a long-duration well test should be carried out. Well tests have to be carried out on all newly completed wells, because apart from giving an indication of the quality of drilling, design and development, it also yields information on aquifer parameters, which are vital to the hydrogeologist.
A well test consists of pumping a well from a measured start level (Water Rest Level -(WRL) at a known or measured yield, and simultaneously recording the discharge rate and the resulting drawdown as a function of time. Once a dynamic water level (DWL) is
…………………………………………………………………………………………..……………………………………………Hydrogeological Survey for Sukuta/Mathira_2 September, 2012 46

reached, the rate of inflow to the well equals the rate of pumping. Usually the rate of pumping is increased stepwise during the test each time equilibrium has been reached (Step Drawdown Test). Towards the end of the test a water sample of 2 liters should be collected for chemical analysis.
The duration of the test should be 24 hours, followed by a recovery test for a further 24 hours, or alternatively until the initial WRL has been reached (during which the rate of recovery to WRL is recorded). The results of the test will enable a hydrogeologist to calculate the optimum pumping rate, the pump installation depth, and the drawdown for a given discharge rate.
Schematic Design for Borehole Completion
…………………………………………………………………………………………..……………………………………………Hydrogeological Survey for Sukuta/Mathira_2 September, 2012 47

Appendix-2: Field Data
(Vertical electric sounding data for recommended sites)
…………………………………………………………………………………………..……………………………………………Hydrogeological Survey for Sukuta/Mathira_2 September, 2012 48
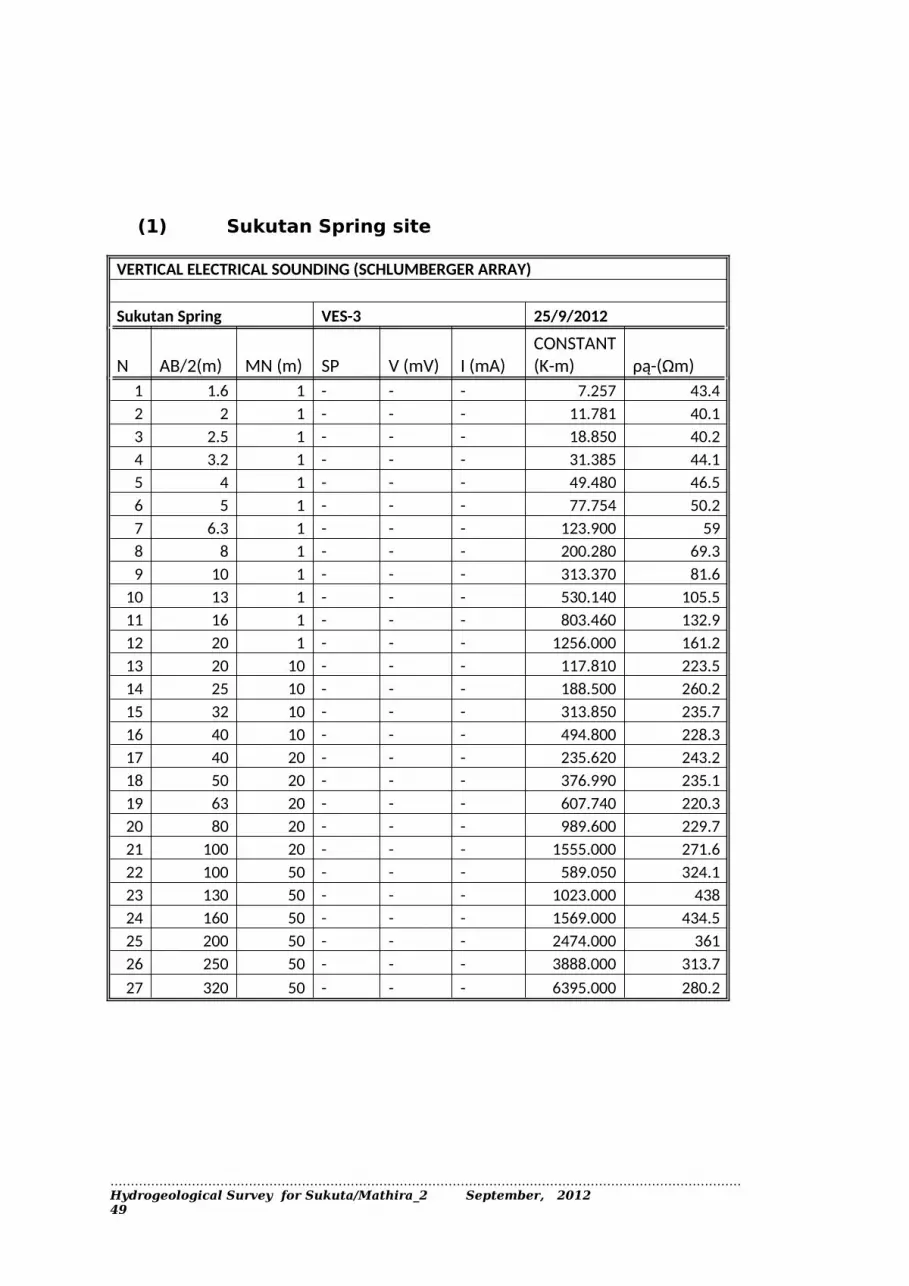
(1) Sukutan Spring site
VERTICAL ELECTRICAL SOUNDING (SCHLUMBERGER ARRAY) Sukutan Spring VES-3 25/9/2012
N AB/2(m) MN (m) SP V (mV) I (mA)CONSTANT (K-m) ρą-(Ωm)
1 1.6 1 - - - 7.257 43.42 2 1 - - - 11.781 40.13 2.5 1 - - - 18.850 40.24 3.2 1 - - - 31.385 44.15 4 1 - - - 49.480 46.56 5 1 - - - 77.754 50.27 6.3 1 - - - 123.900 598 8 1 - - - 200.280 69.39 10 1 - - - 313.370 81.6
10 13 1 - - - 530.140 105.511 16 1 - - - 803.460 132.912 20 1 - - - 1256.000 161.213 20 10 - - - 117.810 223.514 25 10 - - - 188.500 260.215 32 10 - - - 313.850 235.716 40 10 - - - 494.800 228.317 40 20 - - - 235.620 243.218 50 20 - - - 376.990 235.119 63 20 - - - 607.740 220.320 80 20 - - - 989.600 229.721 100 20 - - - 1555.000 271.622 100 50 - - - 589.050 324.123 130 50 - - - 1023.000 43824 160 50 - - - 1569.000 434.525 200 50 - - - 2474.000 36126 250 50 - - - 3888.000 313.727 320 50 - - - 6395.000 280.2
…………………………………………………………………………………………..……………………………………………Hydrogeological Survey for Sukuta/Mathira_2 September, 2012 49

VERTICAL ELECTRICAL SOUNDING (SCHLUMBERGER ARRAY) Lesashore Spring VES-2 19/9/2012
N AB/2(m) MN (m) SP V (mV) I (mA)CONSTANT (K-m) ρą-(Ωm)
1 1.6 1 - - - 7.257 69.12 2 1 - - - 11.781 57.73 2.5 1 - - - 18.850 48.14 3.2 1 - - - 31.385 45.95 4 1 - - - 49.480 43.26 5 1 - - - 77.754 47.77 6.3 1 - - - 123.900 60.68 8 1 - - - 200.280 809 10 1 - - - 313.370 105.5
10 13 1 - - - 530.140 139.511 16 1 - - - 803.460 182.912 20 1 - - - 1256.000 239.513 20 10 - - - 117.810 293.414 25 10 - - - 188.500 361.815 32 10 - - - 313.850 477.516 40 10 - - - 494.800 618.917 40 20 - - - 235.620 573.218 50 20 - - - 376.990 743.219 63 20 - - - 607.740 940.420 80 20 - - - 989.600 1264.721 100 20 - - - 1555.000 1230.922 100 50 - - - 589.050 1454.123 130 50 - - - 1023.000 157924 160 50 - - - 1569.000 179725 200 50 - - - 2474.000 173326 250 50 - - - 3888.000 ..27 320 50 - - - 6395.000 …
VERTICAL ELECTRICAL SOUNDING (SCHLUMBERGER ARRAY)…………………………………………………………………………………………..……………………………………………Hydrogeological Survey for Sukuta/Mathira_2 September, 2012 50
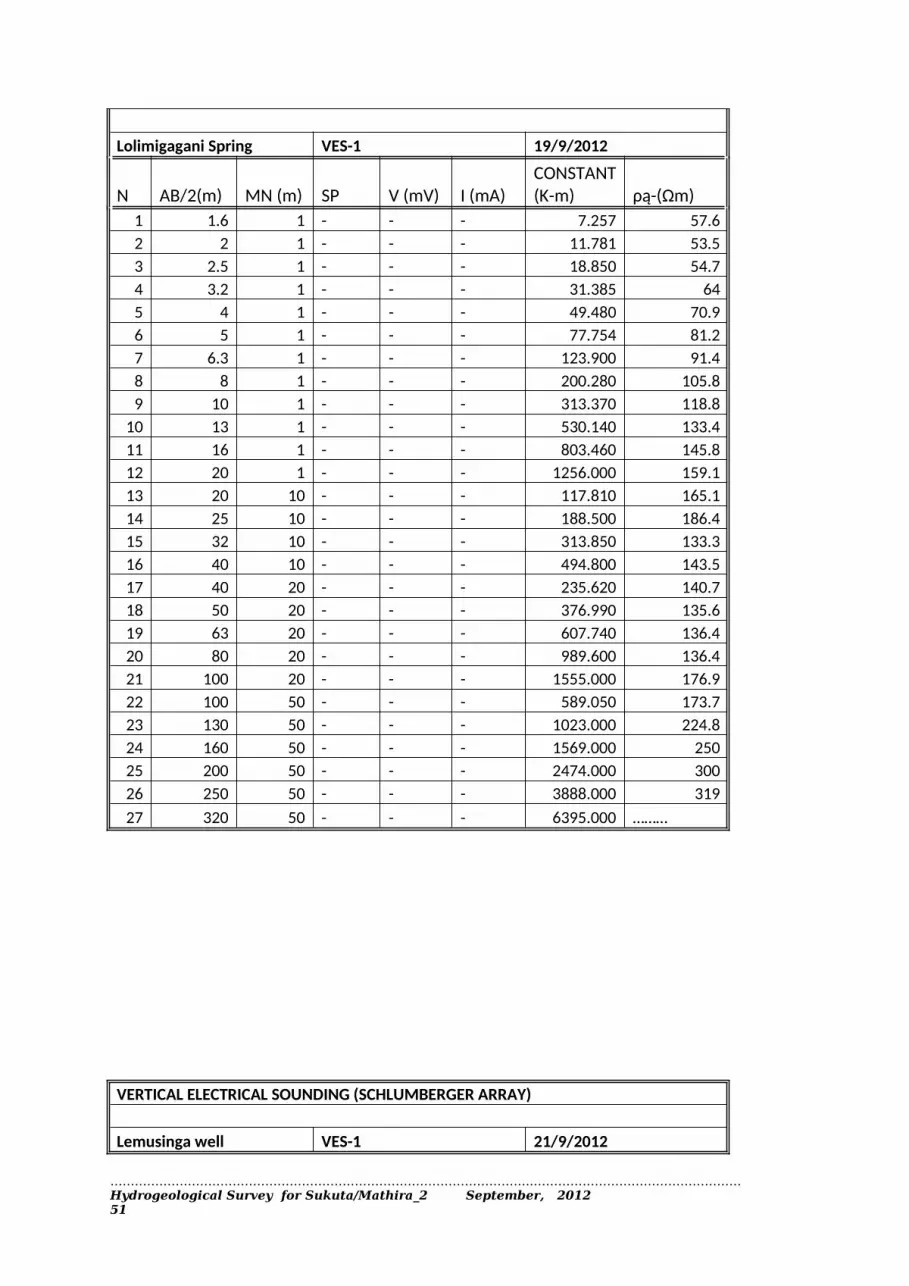
Lolimigagani Spring VES-1 19/9/2012
N AB/2(m) MN (m) SP V (mV) I (mA)CONSTANT (K-m) ρą-(Ωm)
1 1.6 1 - - - 7.257 57.62 2 1 - - - 11.781 53.53 2.5 1 - - - 18.850 54.74 3.2 1 - - - 31.385 645 4 1 - - - 49.480 70.96 5 1 - - - 77.754 81.27 6.3 1 - - - 123.900 91.48 8 1 - - - 200.280 105.89 10 1 - - - 313.370 118.8
10 13 1 - - - 530.140 133.411 16 1 - - - 803.460 145.812 20 1 - - - 1256.000 159.113 20 10 - - - 117.810 165.114 25 10 - - - 188.500 186.415 32 10 - - - 313.850 133.316 40 10 - - - 494.800 143.517 40 20 - - - 235.620 140.718 50 20 - - - 376.990 135.619 63 20 - - - 607.740 136.420 80 20 - - - 989.600 136.421 100 20 - - - 1555.000 176.922 100 50 - - - 589.050 173.723 130 50 - - - 1023.000 224.824 160 50 - - - 1569.000 25025 200 50 - - - 2474.000 30026 250 50 - - - 3888.000 31927 320 50 - - - 6395.000 ………
VERTICAL ELECTRICAL SOUNDING (SCHLUMBERGER ARRAY) Lemusinga well VES-1 21/9/2012
…………………………………………………………………………………………..……………………………………………Hydrogeological Survey for Sukuta/Mathira_2 September, 2012 51

N AB/2(m) MN (m) SP V (mV) I (mA)CONSTANT (K-m) ρą-(Ωm)
1 1.6 1 - - - 7.257 1652 2 1 - - - 11.781 117.73 2.5 1 - - - 18.850 97.54 3.2 1 - - - 31.385 81.85 4 1 - - - 49.480 61.16 5 1 - - - 77.754 447 6.3 1 - - - 123.900 34.98 8 1 - - - 200.280 32.39 10 1 - - - 313.370 25.5
10 13 1 - - - 530.140 24.911 16 1 - - - 803.460 25.512 20 1 - - - 1256.000 26.613 20 10 - - - 117.810 27.714 25 10 - - - 188.500 30.715 32 10 - - - 313.850 40.616 40 10 - - - 494.800 54.217 40 20 - - - 235.620 49.818 50 20 - - - 376.990 58.919 63 20 - - - 607.740 68.620 80 20 - - - 989.600 69.821 100 20 - - - 1555.000 89.822 100 50 - - - 589.050 99.823 130 50 - - - 1023.000 144.124 160 50 - - - 1569.000 …25 200 50 - - - 2474.000 …26 250 50 - - - 3888.000 ..27 320 50 - - - 6395.000 …
PLATES
Sukutan_ves_3
…………………………………………………………………………………………..……………………………………………Hydrogeological Survey for Sukuta/Mathira_2 September, 2012 52

Leshashore_ves_2
…………………………………………………………………………………………..……………………………………………Hydrogeological Survey for Sukuta/Mathira_2 September, 2012 53

Lolimigagani_ves_1
Lemusinga Well_ves_1
…………………………………………………………………………………………..……………………………………………Hydrogeological Survey for Sukuta/Mathira_2 September, 2012 54

…………………………………………………………………………………………..……………………………………………Hydrogeological Survey for Sukuta/Mathira_2 September, 2012 55