hydrogeological investigation 603-643, 645-699 kingston road ...
113
HYDROGEOLOGICAL INVESTIGATION 603-643, 645-699 KINGSTON ROAD PICKERING, ON L1V 3N7 REPORT NO.: 4986-19-HD REPORT DATE: April 20, 2020 REVISION NO.: 02 PREPARED FOR: DIRECTOR INDUSTRIAL HOLDINGS LIMITED 3700 STEELES AVENUE WEST, SUITE 800 VAUGHAN, ONTARIO L4L 8M9 110 KONRAD CRESCENT, UNIT 16, MARKHAM, ONTARIO L3R 9X2 TEL.: 905-940-8509 FAX: 905-940-8192
-
Upload
khangminh22 -
Category
Documents
-
view
0 -
download
0
Transcript of hydrogeological investigation 603-643, 645-699 kingston road ...

HYDROGEOLOGICAL INVESTIGATION
603-643, 645-699 KINGSTON ROAD
PICKERING, ON
L1V 3N7
REPORT NO.: 4986-19-HD REPORT DATE: April 20, 2020 REVISION NO.: 02
PREPARED FOR:
DIRECTOR INDUSTRIAL HOLDINGS LIMITED
3700 STEELES AVENUE WEST, SUITE 800
VAUGHAN, ONTARIO
L4L 8M9
110 KONRAD CRESCENT, UNIT 16, MARKHAM, ONTARIO L3R 9X2
TEL.: 905-940-8509 FAX: 905-940-8192

Toronto Inspection Ltd.
4986-19-HD Hydrogeological Investigation – R02 603-643, 645-699 Kingston Road, Pickering, ON
Page i of vi
Executive Summary
Toronto Inspection Ltd. (TIL) was retained by Director Industrial Holdings Limited (the Client) to conduct a hydrogeological investigation for the proposed development property encompassing the municipal addresses of 603-643 and 645-699 Kingston Road in Pickering, ON (the Site). It is our understanding that the Client is proposing a mixed-use residential/commercial development for the Site consisting of six (6) high-rise towers, (2) mid-rise towers, and four (4) blocks of 4-storey stacked, back- to-back townhouses. It is also understood that the Site will include four (4) underground parking facilities. Each building complex will have two (2) levels of underground parking, with the exception of Podium 1, which will have one (1) level of underground parking. Since the project is currently at a planning stage for the development, each parking level was assumed to be 3 m high. This Hydrogeological Report provides estimates for the short-term (construction) and long- term dewatering rates for the parking facilities only as a Site Servicing Plan was not available for review. Therefore, the requirements for groundwater control during the construction of services at the Site will need to be evaluated prior to construction and the submission of applications for dewatering and/or discharge permits, as the case may be. Further, at that stage in the design process, it is anticipated that finalized building elevations and a Site Grading Plan will be available for review to refine all groundwater control requirements on the project.
The Site is located within the Petticoat Creek watershed, under the jurisdiction of the Toronto and Region Conservation Authority (TRCA); however, it is not located within TRCA regulated areas. Furthermore, no environmental features were identified within or slightly beyond the Site boundary. The Site is located within the Toronto and Region Source Protection Area (TRSPA) within the CTC Source Protection Region; however, it is not shown to be subject to the policies of the CTC Source Protection Plan (SPP).
The local scale geological and hydrogeological characteristics of the Site were assessed using the observations from sixteen (16) boreholes that were drilled by TIL in February and March of 2019. The boreholes investigated to depths ranging from 4.87 m below ground surface (bgs) to 20.88 mbgs. The findings from the field investigation showed that the subsurface geology at the Site consists mainly of a layer of fill underlain by a laterally extensive sandy silt unit to the terminal depths of the investigation. However, an isolated sand and gravel deposit was identified at one point of investigation along the southern Site boundary with a thickness of 12.9 m, and smaller sand units were observed in surrounding boreholes as well.
Of the 16 boreholes, nine (9) were instrumented as monitoring wells to be used as part of this investigation. Additionally, three (3) monitoring wells were installed to improve the understanding of the groundwater system at the Site. All monitoring wells were installed with 51 mm riser pipe and 10-slot, 10-foot screens. Monitoring wells were used to measure static water levels, to perform in-situ hydraulic conductivity tests, and to collect representative groundwater quality samples. Once it is determined that monitoring wells are no longer required, they should be decommissioned by a licensed well contractor according to the provisions of Regulation 903 (Reg. 903).
Groundwater elevations for the water table at the Site were recorded as part of a long-term monitoring program in the period of March to June of 2019. The groundwater elevations over this time ranged from a low of 96.53 masl (8.89 mbgs) in the northeast corner of the Site in late March, to a high of 103.57 masl (1.4 mbgs) in the southwest corner of the Site in late March. The variability in groundwater elevations over the long-term monitoring period was on average, approximately

Toronto Inspection Ltd.
4986-19-HD Hydrogeological Investigation – R02 603-643, 645-699 Kingston Road, Pickering, ON
Page ii of vi
0.39 m across the Site excluding wells that demonstrated uncharacteristic variability, which were located in the northeast corner of the Site. It is expected that there will be some seasonal variability in groundwater elevations resulting from periods of regional groundwater recharge and more frequent storm events. Groundwater levels are typically highest in the Spring and lowest in the Fall to early Winter.
In-situ hydraulic conductivity testing in the form of single well response testing was undertaken within the sandy silt at select monitoring wells in March of 2019. The estimated hydraulic conductivity for the sandy silt ranged between 1.6 x 10⁻⁸ m/s and 1.8 x 10⁻⁷ m/s, with a geometric mean of 6.0 x 10⁻⁸ m/s. The results of grain-size analysis from samples collected with the sand and gravel deposit suggest a relatively conductive material with a hydraulic conductivity on the order of 10-6 m/s. Overall, the estimates of hydraulic conductivity for subsurface materials are within the literature range of hydraulic conductivity for those materials.
A non-filtered groundwater quality sample was collected on March 12, 2019, and analyzed for the Regional Municipality of Durham Sewer Use By-Law No. 55-2013 (By-Law 55-2013). With the exception of Total Suspended Solids (TSS), all parameters were found to be within acceptable limits of the Table 2 – Limits for Storm Sewer Discharge. Additionally, all parameters, including TSS, were found to meet the limits of the Table 1 – Limits for Sanitary Sewer Discharge.
An analysis of potential short-term and long-term dewatering rates was undertaken for each development block on-Site. Based on the current conceptual hydrogeological model for the Site and the anticipated depths of the foundations for all underground structures, the estimated total dewatering rates for each block were calculated to be:
Block
Short-Term
Long-Term (L/day) Groundwater
(L/day) Stormwater
(L/day) Total
(L/day)
Podium 1 28,771 59,500 88,271 9,590
Podium 4 569,298 43,050 612,348 189,766
Block 1, Block 2, Tower 4 27,408 90,000 117,408 9,136
Block 3, Block 4, Tower 5, Tower 8 43,416 140,300 183,716 14,472
Total 668,893 332,850 1,001,743 222,964
The anticipated total dewatering rate for the development, assuming dewatering will be required simultaneously for all development blocks, is approximately 1,001,743 L/day. Since the cumulative dewatering rate in this scenario is greater than 400,000 L/day, it will be necessary to obtain a Category 3 Permit to Take Water (PTTW) from the Ministry of the Environment, Conservation, and Parks (MECP) to facilitate construction dewatering. Since the dewatering rates between all blocks are variable, consideration of the approach to construction phasing in the context of potential dewatering permitting requirements is warranted to determine the maximum dewatering rate that should be requested in the PTTW application. Since the estimated dewatering rate for Podium 4 exceeds 400,000 L/day, the amalgamated rate requested in the PTTW application should consider the dewatering rate from Podium 4 as the minimum and that any additional dewatering requirements for other blocks be added to calculate the total permitting rate.

Toronto Inspection Ltd.
4986-19-HD Hydrogeological Investigation – R02 603-643, 645-699 Kingston Road, Pickering, ON
Page iii of vi
Construction dewatering activities remove groundwater from the soil and can increase the effective stress of those soils whose pore spaces were once occupied by water. The increase in effective stress can lead to differential soil settlement and damage local infrastructure at the surface. The potential risks associated with dewatering settlement should be reviewed by a geotechnical engineer prior to construction such that any necessary controls for stabilization can be implemented.
For the post-construction phase, the foundations for all buildings are anticipated to extend below the water table. As a result, it will be necessary for each foundation to either control groundwater using a foundation drainage network or by waterproofing those foundations. If a Private Water Drainage System (PWDS) is proposed to collect and discharge groundwater over the long-term, the cumulative dewatering rate for the Site will likely be 1/3rd the rates calculated for short-term groundwater dewatering, equating to approximately 222,964 L/day. Since the estimated long-term dewatering rates are cumulatively greater than 50,000 L/day, a PTTW from the MECP will be required if long-term takings are proposed.
If excess groundwater/stormwater encountered during construction or collected in a dedicated PWDS over the long-term is proposed to be discharged to a municipal sewer, approval from Durham Region will be required. All private water discharge to a municipal sewer must satisfy the relevant water quality criteria of By-Law 55-2013 for that sewer. Consultation with Durham Region is recommended to determine the requirements for a discharge approval during construction as well as permanent sewer connections and discharge agreements for groundwater over the long- term.
Separate applications for PTTWs will be needed to satisfy both the short-term and the long-term permitting requirements on the project. The PTTW application will require preparation of a hydrogeological report to support the application that includes the dewatering rate required, identification of potential unacceptable impacts of the water taking, monitoring requirements, and a contingency plan to mitigate unacceptable impacts in the event they were to occur. It is recommended that a minimum of six (6) months lead time be provided for the MECP PTTW application review and approval process if PTTWs will be pursued.
A search of the MECP Water Well Information System (WWIS) for well records within a 1 km radius of the Site returned 73 records and no active PTTWs. The primary well usage within the search radius is for monitoring/observation/test well (36%) purposes. Considering that the Site and surrounding area have municipal servicing and there are no sensitive ecological receptors near the Site, short-term and long-term impacts to the groundwater system, other groundwater users, and the surface water system are not expected. However, it is recommended to implement a Spill Prevention and Response Plan as well as an Erosion and Sediment Control (ESC) Plan during construction to limit potential impacts to the groundwater system and the off-Site release of sediment. Considering the size of the Site, a Salt Management Plan is recommended over the long-term.

Toronto Inspection Ltd.
4986-19-HD Hydrogeological Investigation – R02 603-643, 645-699 Kingston Road, Pickering, ON
Page iv of vi
Table of Contents
1 Introduction ...................................................................................................................... 1
1.1 Project Background .................................................................................................. 1
1.2 Site Description ........................................................................................................ 1
1.3 Objectives of the Hydrogeological Investigation ........................................................ 1
1.4 Scope of Work .......................................................................................................... 2 1.4.1 Conceptual Understanding .......................................................................................... 2 1.4.2 Field Investigation ....................................................................................................... 2 1.4.3 Data Analysis .............................................................................................................. 2
2 Relevant Regulations and Policies ................................................................................. 3
3 Regional Geological and Hydrogeological Understanding ........................................... 5
3.1 Topography and Drainage ........................................................................................ 5
3.2 Physiography ............................................................................................................ 5
3.3 Regional Geology and Hydrogeology ....................................................................... 5 3.3.1 Regional Groundwater Flow ........................................................................................ 6
4 Local Geology and Hydrogeology .................................................................................. 7
4.1 Overburden .............................................................................................................. 7
4.2 Quaternary Geology ................................................................................................. 7
4.3 Bedrock Geology ...................................................................................................... 7
4.4 Groundwater Conditions ........................................................................................... 7 4.4.1 On-Site Monitoring Well Network ................................................................................ 7 4.4.2 Groundwater Levels .................................................................................................... 8 4.4.3 Hydraulic Conductivity ............................................................................................... 10 4.4.4 Groundwater Flow ..................................................................................................... 11 4.4.5 Groundwater Quality ................................................................................................. 11
5 Calculation of Dewatering Rates and Estimation of Zone of Influence ...................... 14
5.1 Aquifer Characteristics............................................................................................ 14
5.2 Required Drawdown ............................................................................................... 14
5.3 Radius of Influence ................................................................................................. 15 5.3.1 Unconfined Aquifers .................................................................................................. 15
5.4 Dewatering Rate Calculations ................................................................................. 16
5.5 Options for Dewatering Discharge and Permitting .................................................. 18 5.5.1 Dewatering Permit Requirements ............................................................................. 18 5.5.2 Disposal Options for Discharge Water ...................................................................... 18
6 Potential Receptors ....................................................................................................... 20
6.1 MECP Water Well Record Search .......................................................................... 20
6.2 Permitted Water Users ........................................................................................... 20
6.3 Ecological Receptors .............................................................................................. 20
7 Potential Impacts and Proposed Mitigation ................................................................. 21
7.1 Identification and Mitigation of Short-Term Impacts ................................................ 21 7.1.1 Potential Short-Term Impacts to the Groundwater System ...................................... 21 7.1.2 Potential Short-Term Impacts to the Surface Water System .................................... 21

Toronto Inspection Ltd.
4986-19-HD Hydrogeological Investigation – R02 603-643, 645-699 Kingston Road, Pickering, ON
Page v of vi
7.1.3 Potential Short-Term Impacts to Other Groundwater Users ..................................... 21 7.1.4 Potential Short-Term Impacts to Land Stability ......................................................... 21 7.1.5 Mitigation of Short-Term Impacts .............................................................................. 21
7.2 Identification and Mitigation of Long-Term Impacts ................................................. 21 7.2.1 Potential Long-Term Impacts to the Groundwater System ....................................... 21 7.2.2 Potential Long-Term Impacts to the Surface Water System ..................................... 22
7.2.3 Potential Long-Term Impacts to Other Groundwater Users ...................................... 22 7.2.4 Mitigation of Long-Term Impacts ............................................................................... 22
8 Summary ........................................................................................................................ 23
9 References ..................................................................................................................... 25
10 General Statement of Limitations ................................................................................. 26

Toronto Inspection Ltd.
4986-19-HD Hydrogeological Investigation – R02 603-643, 645-699 Kingston Road, Pickering, ON
Page vi of vi
LIST OF TABLES
Table 4-1 Summary of Monitoring Well Details..................................................................... 8 Table 4-2 Water Level Depths – mbgs ................................................................................. 9 Table 4-3 Water Level Measurements – masl ...................................................................... 9 Table 4-4 Summary of Hydraulic Conductivity Tests .......................................................... 10 Table 4-5 Groundwater Quality Results ............................................................................. 11 Table 5-1 Summary of Dewatering Requirements .............................................................. 15 Table 5-2 ROI Estimate ..................................................................................................... 15 Table 5-3 Dewatering Rate Summary ................................................................................ 17 Table 6-1 MECP Well Records within 1 km Radius ............................................................ 20
LIST OF FIGURES
Figure 1 Site Location
Figure 2 Topography
Figure 3 Physiography
Figure 4 Regional Cross Section
Figure 5 Quaternary Geology
Figure 6 Bedrock Geology
Figure 7 Borehole/Monitoring Well Locations
Figure 8 Local Cross-Section A-A’
Figure 9 Long-term Water Level Monitoring Hydrograph
Figure 10 MECP Well Records & Permit to Take Water
APPENDICES
Appendix A Conceptual Site Plan
Appendix B Borehole Logs
Appendix C Hydraulic Conductivity Analysis
Appendix D Laboratory Certificate of Analysis
Appendix E Dewatering Analysis
Appendix F MECP Water Well Records

Toronto Inspection Ltd.
4986-19-HD Hydrogeological Investigation – R02 603-643, 645-699 Kingston Road, Pickering, ON
Page 1 of 26
1 Introduction
1.1 Project Background
Toronto Inspection Ltd. (TIL) was retained by Director Industrial Holdings Limited (the Client) to conduct a hydrogeological investigation for the proposed development property encompassing the municipal addresses of 603-643 and 645-699 Kingston Road in Pickering, ON (the Site). It is our understanding that the Client is proposing a mixed-use residential/commercial development for the Site consisting of six (6) high-rise towers, (2) mid-rise towers, and four (4) blocks of 4-storey stacked, back- to-back townhouses. It is also understood that the Site will include four (4) underground parking facilities. Each building complex will have two (2) levels of underground parking, with the exception of Podium 1, which will have one (1) level of underground parking. Since the project is currently at a planning stage for the development, each parking level was assumed to be 3 m high.
This Hydrogeological Report provides estimates for the short-term (construction) and long-term dewatering rates for the parking facilities only as a Site Servicing Plan was not available for review. Therefore, the requirements for groundwater control during the construction of services at the Site will need to be evaluated prior to construction and the submission of applications for dewatering and/or discharge permits, as the case may be. Further, at that stage in the design process, it is anticipated that finalized building elevations and a Site Grading Plan will be available for review in order to refine all groundwater control requirements for the development.
The location of the Site is shown in Figure 1. A Site Plan and Architectural Drawings for the proposed development are provided in Appendix A.
1.2 Site Description
The Site is located on the southwest corner of the intersection between Whites Road and Kingston Road and is approximately rectangular in shape and 4.85 hectares (ha) in area. The Site was most recently used for commercial purposes and is occupied by three (3) commercial buildings including a strip mall having several occupants. The area immediately surrounding the Site is primarily occupied for residential, commercial, and transportation uses. The Site is bounded by Kingston Road to the north, Whites Road to the east, the Highway 401 corridor to the south, and an automobile dealership to the west.
1.3 Objectives of the Hydrogeological Investigation
The report herein identifies regulations which may be relevant to the development of the Site from a groundwater and environmental perspective and develops a conceptual understanding of the Site setting by characterizing the existing geological and hydrogeological conditions at the Site; including groundwater elevations, groundwater flow direction, and hydraulic properties of soils. Based on the conceptual understanding of the Site and proposed development, an evaluation is made of potential dewatering requirements for the during-construction phase and long-term operation of the Site.

Toronto Inspection Ltd.
4986-19-HD Hydrogeological Investigation – R02 603-643, 645-699 Kingston Road, Pickering, ON
Page 2 of 26
1.4 Scope of Work
1.4.1 Conceptual Understanding
A conceptual understanding of the regional and local geological and hydrogeological system was developed through the review of existing reports and available geological information. This included:
• Mapping and reports by Toronto and Region Conservation Authority (TRCA); • Geological and Hydrogeological Information from Ontario Geological Survey (OGS);
• Geological and Hydrogeological Information from Ontario Ministry of Natural Resources and Forestry (MNRF); and
• Ministry of the Environment, Conservation, and Parks (MECP) Well Records Database • Toronto Inspection Ltd. Preliminary Geotechnical Report – 603 to 699 Kingston Road,
Pickering, Ontario
1.4.2 Field Investigation
The local scale geological and hydrogeological conditions at the Site were characterized using the observations from sixteen (16) boreholes drilled by TIL in February and March of 2019. The boreholes ranged in depth from 4.87 meters below ground surface (mbgs) to 20.88 mbgs.
Of the 16 boreholes, nine (9) were instrumented as monitoring wells to be used in this investigation. Additionally, three (3) extra monitoring wells were installed to improve the understanding of the underlying hydrogeology of the Site. All monitoring wells were installed with 51 mm riser pipe and 10-slot, 10-foot screens. Monitoring wells were used to measure static groundwater levels, to conduct in-situ hydraulic conductivity testing, and to collect representative groundwater quality samples. Monitoring wells were installed according to the relevant provisions of Regulation 903 (Reg. 903) by a specialized drilling contractor under the supervision of TIL field staff. Once it is determined that the monitoring wells installed within the Site are no longer required, they should be decommissioned by a licensed well contractor as per Reg. 903.
1.4.3 Data Analysis
The data analysis component of this study will include the following items:
• Determination of soil stratigraphy and hydrostratigraphy; • Determination of groundwater elevations and seasonal variability; • Determination of the hydraulic conductivity of screened soils; • Evaluation of potential dewatering requirements; • Identification of groundwater usage in the area and surrounding sensitive receptors; and
• Options for short-term and long-term mitigation of potential impacts to natural features, sensitive receptors, and vulnerable areas.

Toronto Inspection Ltd.
4986-19-HD Hydrogeological Investigation – R02 603-643, 645-699 Kingston Road, Pickering, ON
Page 3 of 26
2 Relevant Regulations and Policies
Environmental regulations and policies which may be relevant to the development of the Site and this hydrogeological investigation are listed below and discussed briefly:
• Regional Municipality of Durham Official Plan (2017) • Regional Municipality of Durham Sewer Use By-Law No. 55-2013
• Toronto and Region Conservation Authority (TRCA) Policies and Regulations (O.Reg. 166/06);
• Permit to Take Water, Section 34 of the Ontario Water Resource Act (1990); and
• The Clean Water Act (2006).
Region Municipality of Durham Official Plan
The Regional Municipality of Durham (Durham Region) Official Plan identifies development and land-use objectives for Durham Region. Based on a review of Official Plan maps, the Site is located within “Living Areas”. The Site is outside of the Durham Region’s designated “Greenlands System”.
City of Pickering Official Plan
The City of Pickering (City) Official Plan identifies development and land-use objectives within the City and uses Durham Region’s Official Plan as an overall framework. Based on a review of the City’s Official Plan, the Site is located along the “Kingston Road Corridor” and is therefore subject to the urban design objectives and land development guidelines of the “Kingston Road Corridor Land Development Guidelines”. The Kingston Road Land Development Guidelines should be reviewed during the preparation of land development proposals for the Site.
Regional Municipality of Durham Sewer Use By-Law No. 55-2013
Durham Region’s sewer use by-law controls discharges to their sanitary and storm sewers including the establishment of sewer discharge criteria. If any private water on the Site will require discharge to the sewer system during or following construction, written approval from Durham Region will be required as authorization and mutual agreement to the terms and limitations of the discharge.
TRCA Policies and Regulations (O.Reg. 166/06)
Under Section 28 of the Conservation Authorities Act, the local conservation authorities are mandated to protect the health and integrity of the regional greenspace system and to maintain or improve the hydrological and ecological functions performed by valley and stream corridors. The TRCA, through its regulatory mandate, is responsible for issuing permits under Ontario Regulation (O.Reg.) 166/06, Development, Interference with Wetlands and Alterations to Shorelines and Watercourses for development proposals or site alteration works within regulated areas.
A preliminary review indicates that the Site is not within a TRCA regulated area. As such, a permit under O.Reg. 166/06 is not required for the proposed development.
Permit to Take Water
A PTTW under Section 34 of the Ontario Water Resource Act (OWRA) is required from the MECP for any water taking that is greater than 50,000 L/day. For water takings related to construction site dewatering, water takings of more than 50,000 L/day but less than 400,000 L/day may be

Toronto Inspection Ltd.
4986-19-HD Hydrogeological Investigation – R02 603-643, 645-699 Kingston Road, Pickering, ON
Page 4 of 26
registered on the Environmental Activity and Sector Registry (EASR), while water takings of more than 400,000 L/day will require a PTTW issued by the MECP.
The Clean Water Act, 2006
The MECP mandates the protection of existing and future sources of drinking water under the CWA. Initiatives undertaken under the CWA include the delineation vulnerable areas including: Wellhead Protection Areas (WHPAs); Significant Groundwater Recharge Areas (SGRAs); Intake Protection Zones (IPZs); and Highly Vulnerable Aquifer areas (HVAs). Other initiatives include the assessment of drinking water quantity threats (WHPA Q1 & Q2 and IPZ-Q) within Source Protection Regions. Source Protection Plans are developed under the CWA which include the restriction and prohibition of certain types of activities and land uses within WHPAs.
Based on a review of the MECP Source Water Protection Information Atlas, the Site falls within the Toronto and Region Source Protection Area (TRSPA) within the CTC Source Protection Region. Upon review of CTC Source Protection Plan mapping, the Site is not shown to be located within the boundary of areas affected by its policies.

Toronto Inspection Ltd.
4986-19-HD Hydrogeological Investigation – R02 603-643, 645-699 Kingston Road, Pickering, ON
Page 5 of 26
3 Regional Geological and Hydrogeological Understanding
3.1 Topography and Drainage
The Site is located at the eastern extent of the Petticoat Creek watershed which is under the jurisdiction of the TRCA. This watershed is approximately 49 km in length and drains an approximate area of 27 km2. The headwaters of the Petticoat Creek watershed originate south of the Oak Ridges Moraine and empty to Lake Ontario from the mouth of Petticoat Creek in the Petticoat Creek Conservation Area, which is west of the Site. The nearest water feature to the Site is the Petticoat Creek at approximately 800 m to the southwest. The Petticoat Creek watershed is highly urbanized in its southern reaches where the Site is located.
The regional topography slopes southward towards Lake Ontario. As the Site is currently developed, the local Site topography is relatively flat. There is slight grading from the outer boundaries of the Site towards the inside and to the south. The average ground elevation measured across the Site is approximately 105 meters above sea level (masl).
A topographic map of the Site and the surrounding area is presented in Figure 2.
3.2 Physiography
The Site is situated within the Iroquois Plain physiographic region. The Iroquois Plain is the low land that borders Lake Ontario and which was inundated by the historic Iroquois Lake in the late Pleistocene following the last glacial retreat. Iroquois Lake was a proglacial lake that existed 13,000 years ago and was a body of water slightly larger than present-day Lake Ontario. The Iroquois Plain stretches from the Niagara River to the Trent River, a distance of 300 km. Shoreline cliffs, sand bars, and beaches extend about 3 km inland and mark the inland extent of Iroquois Lake. Typically, the Iroquois Plan is characterized by layers of fine silty sand that were characteristic of the former lake bed and shoreline beaches of Iroquois Lake (Chapman and Putnam, 1984).
A physiographic map of the Site and the surrounding area is presented in Figure 3.
3.3 Regional Geology and Hydrogeology
The current understanding of the geological and hydrogeological environment was based on scientific work conducted by and information available from York, Peel, Durham, Toronto and The Conservation Authorities Moraine Coalition (YPDT-CAMC).
Based on regional hydrogeological mapping presented by YPDT-CAMC, the following units overlie the bedrock (from youngest to oldest):
A. Recent Deposits
B. Halton Till (Aquitard) C. Oak Ridges Moraine (Aquifer) D. Newmarket Till (Aquitard) E. Thorncliffe Formation (Aquifer) F. Sunnybrook Drift (Aquitard) G. Scarborough Formation (Aquifer)
The following provides a description of the underlying hydrostratigraphic units in the area and their relevance to the Site based on the conceptual understanding of regional hydrostratigraphy offered by review of YPDT-CAMC mapping:

Toronto Inspection Ltd.
4986-19-HD Hydrogeological Investigation – R02 603-643, 645-699 Kingston Road, Pickering, ON
Page 6 of 26
• Recent Deposits – The uppermost surficial geologic unit consists of glaciolacustrine deposits consisting of mainly silt and silty clay materials.
• Halton Till – The Halton Till was deposited approximately 13,000 years before present (B.P.) during the last glacial advance in the area. Based on the hydrostratigraphic cross- section presented by the YPDT-CAMC, the Halton Till is not present in the area.
• Oak Ridges Moraine – The Oak Ridges Moraine (ORM) was deposited approximately 12,000 to 13,000 years B.P. Regionally, the ORM is approximately 160 km long and 5 to 20 km wide. Based on the hydrostratigraphic cross-section presented by the YPDT- CAMC, the ORM is not present in the area.
• Newmarket Till – The Newmarket Till was deposited by the Laurentide ice sheet approximately 18,000 to 20,000 years B.P. It consists of mainly sandy silt to silty sand. The Newmarket Till can reach up to 60 m in thickness. Based on the hydrostratigraphic cross-section presented by the YPDT-CAMC, the Newmarket Till is present in the area.
• Thorncliffe Formation – The Thorncliffe Formation was deposited approximately 45,000 years B.P. and consists of glaciofluvial deposits containing silt, sand, and clay. Regionally, it acts as an aquifer with variable grain size and thickness. Based on the hydrostratigraphic cross-section by the YPDT-CAMC, the Thorncliffe Formation is present in the area.
• Sunnybrook Drift – The Sunnybrook Drift was deposited approximately 45,000 years B.P. It is interpreted to be a silt and clay formation with a thickness of 10 m to 20 m regionally. Based on the hydrostratigraphic cross-section presented by the YPDT- CAMC, the Sunnybrook Drift may be present as a thin layer in the area separating the overlying Thorncliffe aquitard from the underlying Scarborough aquifer.
• Scarborough Formation – The Scarborough Formation was deposited during the Wisconsin glaciation approximately 70,000 years to 90,000 years B.P. It is interpreted as a fluvial-deltaic system consisting of sand, silt, and clay deposits. Based on the geologic cross-section presented by the YPDT-CAMC, the Scarborough Formation is present in the area.
• Bedrock – Underlying the overburden will be bedrock of the Georgian Bay Formation, Blue Mountain Formation, Billings Formation, Collingwood Member, and the Eastview Member. These rocks are approximately 438 to 505 million years in age from the Upper Ordovician period. The main materials of these rocks are shale and limestone.
3.3.1 Regional Groundwater Flow
At a regional scale, groundwater flows from the topographic highs associated with the Oak Ridges Moraine, north of the Site, to the topographic lows associated with Lake Ontario to the south.

Toronto Inspection Ltd.
4986-19-HD Hydrogeological Investigation – R02 603-643, 645-699 Kingston Road, Pickering, ON
Page 7 of 26
4 Local Geology and Hydrogeology
The current understanding of the local geological and hydrogeological conditions at the Site is based on the observations from the geotechnical investigation conducted by TIL and the studies undertaken as part of this hydrogeological investigation.
4.1 Overburden
A total of 16 boreholes were drilled across the Site to depths ranging from 4.87 mbgs to 20.88 mbgs in February and March of 2019. In summary, the soil characterizations in the borehole logs indicate the overburden at the Site consists of a layer of fill underlain predominantly by a thick and laterally extensive deposit of sandy silt. Additionally, an isolated sand and gravel deposit with a thickness of approximately 12.9 m was encountered at BH-10. Sand units of limited thickness were observed interrupting the sandy silt at various locations surrounding BH-10. A detailed description of soil stratigraphy is provided in the borehole logs from TIL’s geotechnical investigation, which are provided in Appendix B.
Mapping from the OGS, accessed through OGSEarth (2010), indicates that the regional surficial geology across the Site is composed of fine-textured, glaciolacustrine deposits of silt and clay with sand and gravel. This description is consistent with observations made on the Site.
4.2 Quaternary Geology
Mapping from the OGS, accessed through OGSEarth (2000), indicates that the regional quaternary geology across the Site is composed of undifferentiated, predominantly sandy silt to silt textured tills. This description is consistent with observations made at the Site.
The quaternary geology of the Site and the surrounding area is presented in Figure 5.
4.3 Bedrock Geology
Bedrock was not encountered at the maximum terminal depth (20.88 mbgs) of the borehole investigation for this study. In an attempt to determine the true depth of bedrock in the area, a search was conducted for borehole records and well records from the surrounding area which extended beyond the depth of investigation for this study. The results were inconclusive in that only one (1) record identified the potential for bedrock at a depth of approximately 29.6 mbgs (Well ID 4601908). Mapping from the OGS, accessed through OGS Earth, indicates that shale bedrock of the Georgian Bay Formation underlies the overburden soils in this area. The top of bedrock elevation is expected to be at approximately 50 masl based on the regional hydrostratigraphic cross-section presented by the YPDT-CAMC.
The bedrock geology of the Site and the surrounding area is presented in Figure 6.
4.4 Groundwater Conditions
4.4.1 On-Site Monitoring Well Network
A monitoring network consisting of 12 monitoring wells was established spanning the entirety of the Site and all wells were completed within the sandy silt unit. Monitoring well locations are illustrated together with static groundwater elevations from a monitoring event on May 7, 2019, in plan view in Figure 7 and in a northeast-southwest oriented geological cross-section in Figure 8.

Toronto Inspection Ltd.
4986-19-HD Hydrogeological Investigation – R02 603-643, 645-699 Kingston Road, Pickering, ON
Page 8 of 26
All monitoring wells were drilled with solid stem augers with the exception of BH-7 which was drilled using hollow stem augers. A summary of the monitoring well construction details is provided in Table 4-1 below.
Table 4-1 Summary of Monitoring Well Details
Well ID
Ground Elevation
(masl)
Depth to bottom of well (mbgs)
Well
Diameter
(m)
Screen
Length
(m)
Screened Unit
BH-1 105.35 9.20 0.051 3.048 Sandy Silt
BH-5 104.76 9.20 0.051 3.048 Sandy Silt
BH-6 S
(MW-6) 104.97 4.60 0.051 3.048 Fill/ Sandy Silt
BH-6 D 104.97 9.20 0.051 3.048 Sandy Silt
BH-7 105.73 19.80 0.051 3.048 Sandy Silt
BH-9 104.89 9.20 0.051 3.048 Sandy Silt
BH-12
(MW-12) 105.01 5.18 0.051 3.048 Sandy Silt
BH-13 105.01 6.10 0.051 3.048 Sandy Silt
BH-14 105.32 4.60 0.051 3.048 Sandy Silt
BH-15S
(MW-15) 105.42 6.10 0.051 3.048 Sandy Silt
BH-15 D 105.42 9.20 0.051 3.048 Sandy Silt
BH-16 105.00 19.80 0.051 3.048 Sandy Silt
4.4.2 Groundwater Levels
Static groundwater elevations were recorded in a long-term monitoring program spanning the period of March to June of 2019; manual measurements were taken approximately once every two weeks. Additionally, manual measurements were supplemented with continuous hourly recordings at two monitoring locations, BH-5 and BH-7, using pre-programmed dataloggers. The records from the monitoring program are presented in Table 4-2 in meters below ground surface and in Table 4-3 in meters above sea level. Groundwater depths are presented relative to the existing ground surface. A long-term water level monitoring hydrograph is presented in Figure 9 to illustrate the spatial and seasonal variability of groundwater levels around the Site.
Groundwater elevations within the long-term monitoring period ranged in elevation from a low of 96.53 masl (8.89 mbgs) at BH-15S (MW-15) in northeast corner of the Site in late March, to a high of 103.57 masl (1.4 mbgs) at BH-6S (MW-6) in the southwest corner of the Site in late March. The variability in water levels over the long-term monitoring period was on average, approximately 0.39 m across the Site excluding wells that demonstrated uncharacteristic variability, which were located in the northeast corner of the Site. The range in groundwater elevations at each well over the monitoring period is presented in Table 4-2 and in Table 4-3.
The shallow groundwater table will fluctuate with the change of seasons in response to periods of groundwater recharge resulting from frequent storm events and periods of snowmelt. In this regard, water levels at the Site are anticipated to be lowest in the Winter and highest in the Spring, while the Summer and Fall will have water levels that are intermediary between those extremes.

Toronto Inspection Ltd.
4986-19-HD Hydrogeological Investigation – R02 603-643, 645-699 Kingston Road, Pickering, ON
Page 9 of 26
With that in mind, and based on the long-term monitoring results, the high groundwater table conditions for the Site are anticipated to occur in the month of May.
Table 4-2 Water Level Depths – mbgs
ID 15-Mar-19 29-Mar-19 24-Apr-19 07-May-19 15-May-19 31-May-19 06-Jun-19 Variability
(m)
BH-1 3.11 NM 3.15 NM 3.11 2.79 2.78 0.37
BH-5 3.97 3.59 3.50 3.52 3.97 3.55 3.50 0.47
BH-6 S (MW-6)
2.09 1.40 1.41 1.51 2.09 1.64 1.79 0.69
BH-6D NM 3.01 2.86 2.86 NM 2.90 2.92 0.15
BH-7 4 3.92 3.78 3.67 4.00 3.78 3.75 0.25
BH-9 3.12 3.06 3.10 3.06 3.12 2.99 2.97 0.15
BH-12 (MW-12)
NM 4.15 4.07 4.03 NM 3.78 3.72 0.43
BH-13 2.67 2.30 2.18 2.24 2.67 2.20 2.20 0.49
BH-14 4.52 4.54 4.29 4.10 4.52 4.00 4.00 0.54
BH-15S (MW-15)
dry 8.89 8.62 8.43 dry 3.17 2.92 2.56
BH-15 D dry dry 5.48 4.71 dry 8.05 7.94 0.95
BH-16 NM 8.25 4.38 4.42 NM 4.28 4.24 4.01
Notes: 1. NM denotes not monitored due to obstruction. 2. Water depths relative to existing ground surface.
Table 4-3 Water Level Measurements – masl
ID 15-Mar-19 29-Mar-19 24-Apr-19 07-May-19 15-May-19 31-May-19 06-Jun-19 Variability
(m)
BH-1 102.24 NM 102.20 NM 102.24 102.56 102.57 0.37
BH-5 100.79 101.17 101.26 101.24 100.79 101.21 101.26 0.47
BH-6S (MW-6)
102.88 103.57 103.56 103.46 102.88 103.33 103.18 0.69
BH-6D NM 101.96 102.11 102.11 NM 102.07 102.05 0.15
BH-7 101.73 101.81 101.95 102.06 101.73 101.95 101.98 0.25
BH-9 101.77 101.83 101.79 101.83 101.77 101.90 101.92 0.15
BH-12 (MW-12)
NM 100.86 100.94 100.98 NM 101.23 101.29 0.43
BH-13 102.22 102.59 102.71 102.65 102.22 102.69 102.69 0.49
BH-14 100.80 100.78 101.03 101.22 100.80 101.32 101.32 0.54
BH-15S (MW-15)
dry 96.53 96.80 96.99 dry 102.25 102.50 2.56
BH-15 D dry dry 99.94 100.71 dry 97.37 97.48 0.95
BH-16 NM 96.75 100.62 100.58 NM 100.72 100.76 4.01
Notes: 1. NM denotes not monitored due to obstruction.

Toronto Inspection Ltd.
4986-19-HD Hydrogeological Investigation – R02 603-643, 645-699 Kingston Road, Pickering, ON
Page 10 of 26
4.4.3 Hydraulic Conductivity
Single well hydraulic response testing in the form of rising-head tests was conducted in March of 2019 at select monitoring wells to measure the in-situ hydraulic conductivity (K) of the screened overburden materials. Prior to testing, each well was developed in order to mitigate potential influences from impacts to the native, near-well materials disturbed by drilling.
During the rising head test, a pseudo-instantaneous drop in the water level was achieved by extracting water from the well using a manual inertial pump. The water level recovery was measured by a datalogger taking readings at pre-programmed intervals and left in place to record recovery. For the purposes of the test, recovery was considered to be complete at or above approximately 85% of the pre-test water column.
The hydraulic conductivity was estimated using the Hvorslev (1951) method with the recovery data recorded by the dataloggers. Where available, hydraulic conductivity was also calculated using data from grainsize analyses using the Hazen (1911) method. The corresponding analyses are presented in Appendix C.
A summary of hydraulic conductivities obtained from the rising head tests and grainsize analyses is presented in Table 4-4.
Table 4-4 Summary of Hydraulic Conductivity Tests
Well ID
Screen Interval (masl) /
Sample Depth (masl)
Material Tested
Hvorslev Method K (m/s)
Hazen Method K (m/s)
BH-1 96.15 – 99.20
Sandy Silt
5.5 x 10⁻⁸
-
96.25 1.4 x 10⁻⁷
BH-5 96.15 – 99.20 Sandy Silt 8.7 x 10⁻⁸ – 1.0 x 10⁻⁷ -
BH-6 S /(MW-6) 100.85 – 103.90 Sandy Silt 2.7 x 10⁻⁸ – 7.3 x 10⁻⁸ -
BH-7 85.55 – 88.60 Sandy Silt 1.8 x 10⁻⁷ -
BH-9 96.15 – 99.20 Sandy Silt 1.0 x 10⁻⁷ – 1.4 x 10⁻⁷ -
BH-10 96.88 Sand and Gravel - 7.7 x 10⁻⁵
BH-13 99.25 – 102.30 Sandy Silt 2.3 x 10⁻⁸ – 3.6 x 10⁻⁸ -
BH-16 85.55 – 88.60 Sandy Silt 1.6 x 10⁻⁸ -
Notes: 1. – indicates not applicable
The hydraulic conductivity of the sandy silt ranged between 1.6 x 10⁻⁸ m/s and 1.8 x 10⁻⁷ m/s with a geometric mean of 6.0 x 10⁻⁸ m/s. The range in reported in-situ hydraulic conductivity values falls within the literature range for sandy silt materials. The observed variability in values reported is expected to be a result of the heterogeneous and anisotropic nature of the materials tested.
The sand and gravel deposit, with an estimated hydraulic conductivity of 7.7 x 10⁻⁵ m/s from grainsize analysis, represents the most conductive unit at the Site. It should be noted that measures of hydraulic conductivity obtained using the Hazen (1911) method are determined using a grab sample and are therefore considered representative only of the micro-scale area where the sample was collected. As a result, the estimated hydraulic conductivity may not be representative of the larger unit itself on a macro scale and typically provides overly conservative

Toronto Inspection Ltd.
4986-19-HD Hydrogeological Investigation – R02 603-643, 645-699 Kingston Road, Pickering, ON
Page 11 of 26
estimates of hydraulic conductivity. For the purposes of the investigation, the sand and gravel unit is estimated to have a hydraulic conductivity equivalent to 5 x 10⁻⁶ m/s.
4.4.4 Groundwater Flow
Based on the groundwater elevations and trends observed over the long-term monitoring period, the local groundwater flow direction in the shallow water table system is a subdued reflection of the local topographic relief in that the groundwater flows towards the inside of the Site from the perimeter and to the south towards Lake Ontario.
4.4.5 Groundwater Quality
Unfiltered groundwater samples were collected from BH-7 on March 12, 2019. The collected samples were sent to SGS Environmental Services in Lakefield, ON. The samples were analyzed for the parameters and corresponding sewer discharge criteria of the Regional Municipality of Durham Sewer Use By-Law No. 55-2013 (By-Law 55-2013).
Based on the laboratory analytical results, the results for all parameters, with the exception of Total Suspended Solids (TSS), were within the criteria outlined in Table 2 – Limits for Storm Sewer Discharge of By-Law 55-2013. Additionally, all parameters, including TSS, were found to have met the criteria for Table 1 – Limits for Sanitary Sewer Discharge of By-Law 55-2013. Use of the municipal sewers for disposal of groundwater is contingent on approval from Durham Region and the quality of the discharge relative to the criteria of the receiving sewer, among others, is satisfied.
The laboratory analytical results and Certificate of Analysis are included in Appendix D and a tabulated summary is provided in Table 4-5 below.
Table 4-5 Groundwater Quality Results
Analysis
Units
Durham
Sanitary
By-law Limit
Durham Storm
By-law Limit
RL
BH-7
General Chemistry
Total BOD mg/L 300 15 2 < 4
Total Kjeldahl Nitrogen (TKN) mg/L 100 - 0.5 0.6
pH pH 6.0-11.5 6.0-9.5 0.05 8.15
Phenols-4AAP mg/L 1 0.008 0.002 < 0.002
Total Suspended Solids (TSS) mg/L 350 15 2 48
Total Phosphorus (P) mg/L 10 0.4 0.003 0.055
Sulphate mg/L 1500 - 2 15
Oil and Grease
Total Animal / Vegetable Oil and Grease
mg/L 150 - 4 < 4
Total Oil & Grease Mineral / Synthetic
mg/L 15 - 4 < 4
Nonylphenol and Ethoxylates
Nonylphenol Ethoxylate (Total) mg/L 0.2 0.01 0.01 < 0.01
Nonylphenol (Total) mg/L 0.02 0.001 0.001 < 0.001
Metals and Inorganics

Toronto Inspection Ltd.
Table 4-5 Groundwater Quality Results
4986-19-HD Hydrogeological Investigation – R02 603-643, 645-699 Kingston Road, Pickering, ON
Page 12 of 26
Analysis
Units
Durham
Sanitary
By-law Limit
Durham Storm
By-law Limit
RL
BH-7
Total Aluminum (Al) mg/L 50 - 0.001 0.335
Total Antimony (Sb) mg/L 5 - 0.0009 < 0.0009
Total Arsenic (As) mg/L 1 0.02 0.0002 0.00021
Total Cadmium (Cd) mg/L 0.7 0.008 0.000003 0.00001
Total Chromium (Cr) mg/L 2 0.08 0.00008 0.00209
Total Cobalt (Co) mg/L 5 - 0.000004 0.000312
Total Copper (Cu) mg/L 3 0.05 0.0002 0.0061
Total Cyanide (CN) mg/L 2 0.02 0.01 < 0.01
Total Fluoride (F-) mg/L 10 - 0.06 0.39
Total Lead (Pb) mg/L 1 0.12 0.00001 0.00056
Total Manganese (Mn) mg/L 5 0.15 0.00001 0.0391
Total Mercury (Hg) mg/L 0.01 0.0004 0.00001 < 0.00001
Total Molybdenum (Mo) mg/L 5 - 0.00004 0.0261
Total Nickel (Ni) mg/L 2 0.08 0.0001 0.0009
Total Selenium (Se) mg/L 1 0.02 0.00004 0.00005
Total Silver (Ag) mg/L 5 0.12 0.00005 < 0.00005
Total Tin (Sn) mg/L 5 - 0.00006 0.00056
Total Titanium (Ti) mg/L 5 - 0.00005 0.0121
Total Zinc (Zn) mg/L 2 0.04 0.002 0.003
Semivolatile Organics
Di-N-butyl phthalate mg/L 0.08 0.015 0.002 < 0.002
Bis(2-ethylhexyl)phthalate mg/L 0.012 0.0088 0.002 < 0.002
Volatile Organics
Chloroform mg/L 0.04 0.002 0.0005 < 0.0005
1,2-Dichlorobenzene mg/L 0.05 0.0056 0.0005 < 0.0005
1,4-Dichlorobenzene mg/L 0.08 0.0068 0.0005 < 0.0005
cis-1,2-Dichloroethylene mg/L 4 0.0056 0.0005 < 0.0005
trans-1,3-Dichloropropene mg/L 0.14 0.0056 0.0005 < 0.0005
Methylene Chloride mg/L 2 0.0052 0.0005 < 0.0005
1,1,2,2-Tetrachloroethane mg/L 1.4 0.017 0.0005 < 0.0005
Tetrachloroethylene mg/L 1 0.0044 0.0005 < 0.0005
Trichloroethylene mg/L 0.4 0.0076 0.0005 < 0.0005
Methyl Ethyl Ketone mg/L 8 - 0.02 0.18
Styrene mg/L 0.2 - 0.0005 < 0.0005
Volatile Organics - BTEX
Benzene mg/L 0.01 0.002 0.0005 < 0.0005
Ethylbenzene mg/L 0.16 0.002 0.0005 < 0.0005
Toluene mg/L 0.016 0.002 0.0005 < 0.0005

Toronto Inspection Ltd.
Table 4-5 Groundwater Quality Results
4986-19-HD Hydrogeological Investigation – R02 603-643, 645-699 Kingston Road, Pickering, ON
Page 13 of 26
Analysis
Units
Durham
Sanitary
By-law Limit
Durham Storm
By-law Limit
RL
BH-7
Total Xylenes mg/L 1.4 0.0044 0.0005 < 0.0005
PCBs
Total PCB mg/L 0.001 0.0004 0.0001 < 0.0001
Microbiological
Escherichia coli (E.Coli) CFU/100mL - 200 - < 2
Notes: Highlighted cells indicate an exceedance of Table 2 criteria.

Toronto Inspection Ltd.
4986-19-HD Hydrogeological Investigation – R02 603-643, 645-699 Kingston Road, Pickering, ON
Page 14 of 26
5 Calculation of Dewatering Rates and Estimation of Zone of Influence
Dewatering rates were estimated based on TIL’s interpretation of the hydrogeological conditions of the Site and the proposed development details outlined in the Site Plan which is included in Appendix A. At the time of preparation of this report, the proposed top-of-slab elevations for the underground parking levels in each parking facility were not known. For the purposes of the dewatering assessment, each 1-storey underground parking facility was assumed to have a top- of-slab depth of 3 mbgs. Similarly, each 2-storey underground parking facility was assumed to have a top-of-slab depth of 6 mbgs. If these assumptions are proven to be inaccurate, TIL should be contacted to re-evaluate the dewatering requirements for the proposed parking facilities in conjunction with potential groundwater control requirements for Site services prior to the submission of applications for dewatering and/or discharge permits, as the case may be.
Estimates are based on groundwater elevations observed during monitoring events and the hydraulic properties of the soils determined by in-situ hydraulic conductivity tests and grainsize analyses. This section does not provide a design of dewatering operations, instead, it provides an estimate of the expected dewatering rate required to obtain the desired drawdown. The most effective dewatering measures for the prevalent ground conditions and the design of the dewatering operations are the sole responsibility of the dewatering contractor on-Site.
5.1 Aquifer Characteristics
The underlying geology of the Site was determined to consist primarily of sandy silt with intermittent layers of sand. However, a significant sand and gravel deposit with an approximate thickness of 12.9 m was encountered at BH-10. This deposit should be expected to contribute increased flows in comparison to the poorly graded tills which have higher proportions of fine- grained material. However, as it is anticipated that this unit is not laterally extensive, it is expected to drain relatively quickly in comparison to the sandy silt materials.
Groundwater elevations within the overburden over the long-term monitoring program were observed to range between a low of 96.53 masl (8.89 mbgs) and a high of 103.57 masl (1.4 mbgs). Considering the distribution of proposed parking facilities at the Site, the groundwater elevation considered in the dewatering analysis of each facility corresponds to the groundwater level from the nearest monitoring well to the location of that facility.
Based on the estimates of hydraulic conductivity and anticipated depth of excavation required for each parking facility, the hydraulic conductivity of the sandy silt considered in the estimation of dewatering rates for facilities in this material was 6.0 x 10⁻⁸ m/s. Similarly, the dewatering rates for parking facilities that are anticipated to contact the sand and gravel unit were estimated using a hydraulic conductivity of 5.0 x 10⁻⁶ m/s.
5.2 Required Drawdown
Dewatering will be required to draw the water level down to below the depth of excavation required for the parking and building foundations or in the case of relatively impermeable material, to control groundwater seepage in the excavation. An additional 1 m of water will be added as a factor of safety since it is expected that the water levels may fluctuate seasonally.
For the purposes of the dewatering calculations, the rate of dewatering was calculated separately for each individual parking facility assuming each building would be constructed in a staged approach. If the underground levels will be constructed concurrently, there could be a reduction

Toronto Inspection Ltd.
4986-19-HD Hydrogeological Investigation – R02 603-643, 645-699 Kingston Road, Pickering, ON
Page 15 of 26
𝑆
in the dewatering rates as a whole according to the principle of superposition of drawdowns between dewatering systems where their respective areas of influence overlap.
The dewatering requirements for the Site are summarized in Table 5-1 below.
Table 5-1 Summary of Dewatering Requirements
Parking Facility
Ground Surface (masl)
Depth of Excavation
(mbgs/masl)
Width of Excavation
(m)
Length of Excavation
(m)
Water Level
Elevation (masl)
Maximum Required Drawdown
(m)
Drawdown Water Level (masl)
Podium 1 105.20 4 / 101.20 35 170 103.57 3.38 100.20
Podium 4 104.85 7 / 97.85 36 123 101.50 4.66 96.85
Block 1, Block 2, Tower 4
105.25 7 / 98.25 60 150 102.00 4.75 97.25
Block 3, Block 4, Tower 5,
Tower 8
104.76
7 / 97.76
60
230
101.88
5.12
96.76
5.3 Radius of Influence
5.3.1 Unconfined Aquifers
An estimate of the Radius of Influence (ROI) for dewatering excavations in unconfined aquifers can be calculated using the following equation (Bear, 1979):
𝐻𝐾 𝑅01 = 2.45√ 𝑡
𝑦
where,
R01 = Radius of Influence, beyond which there is negligible drawdown (m) H = Distance from initial static water level to assumed bottom of saturated
aquifer contributing flows (m) Sy = Specific Yield of the aquifer formation (based on Johnson (1967)) t = Time, in seconds, required to draw the static groundwater level to the
desired level (assumed to be equivalent to 14 days) K = Hydraulic Conductivity of aquifer formation (m/s)
A summary of the ROI of dewatering estimated for each parking facility is presented in Table 5-2 below.
Table 5-2 ROI Estimate
Parking Facility H
(m)
Sy
[-]
K
(m/s)
t
(s)
R01
(m)
Podium 1 12 0.20 6.0 x 10⁻⁸ 1,209,600 6
Podium 4 14 0.25 5.0 x 10⁻⁶ 1,209,600 45
Block 1, Block 2, Tower 4 9 0.20 6.0 x 10⁻⁸ 1,209,600 5
Block 3, Block 4, Tower 5, Tower 8 9 0.20 6.0 x 10⁻⁸ 1,209,600 5

Toronto Inspection Ltd.
4986-19-HD Hydrogeological Investigation – R02 603-643, 645-699 Kingston Road, Pickering, ON
Page 16 of 26
5.4 Dewatering Rate Calculations
Dewatering calculations are based on equations of radial and planar flow where the system can be approximated as a well with equivalent radius. The dewatering equations referenced in the completion of this analysis are provided in Construction Dewatering and Groundwater Control: New Methods and Applications – Third Edition. New York, New York: John Wiley & Sons (Powers et. al., 2007).
The analytical assessment assumes steady-state flow into an open excavation; however, it should be recognized that a transient condition will exist at the start of dewatering and that during this time, flows can be expected to be higher but will dissipate over time to steady-state conditions as aquifer storage is depleted. The equations of radial flow have the following assumptions:
Ideal aquifer conditions (homogeneous, isotropic, uniform thickness, and has infinite areal extent);
Fully penetrating pumping well; Only horizontal flow to the pumping well; and
Constant pumping rate with the flow to the pumping well corresponding to steady-state conditions.
The following equation was used for square excavations and is based on unconfined aquifer conditions (Powers et. al., 2007):
𝑄 =
𝜋𝐾(𝐻2 − ℎ2)
ln( 𝑅02/𝑟𝑠)
In order to estimate dewatering rates for the excavations required for the construction of the underground parking garages for Podium 1, for Podium 4, and for Block 3, Block 4, Tower 5, and Tower 8, flow should be assumed to occur radially at both ends as well as planar along both sides. The following equation was used for rectangular excavations and is based on unconfined aquifer conditions (Powers et. al., 2007):
where,
𝑄 =
𝜋𝐾(𝐻2 − ℎ2)
ln( 𝑅02/𝑟𝑠)
𝑥𝐾(𝐻2 − ℎ2) + 2 [ ]
2𝐿
Q = Anticipated pumping rate (m3/day) K = Hydraulic conductivity (m/day) H = Distance from the static water level to the bottom of the saturated aquifer (m) H = Depth of water in the well while pumping (m) R02 = Radius of Influence (m) from excavation, beyond which there is negligible
drawdown. Equivalent to the sum of R01 and rs. (m) rs = Equivalent well radius determined by equivalent perimeter approximation of a
rectangular excavation (m) x = Length of excavation (m) L = Distance from a line source to the long side of the excavation,
equivalent to R02 (m)

Toronto Inspection Ltd.
4986-19-HD Hydrogeological Investigation – R02 603-643, 645-699 Kingston Road, Pickering, ON
Page 17 of 26
Allowance for Precipitation
While the excavation remains open it is anticipated that it will be necessary to dewater incident stormwater from direct precipitation over the Site. Accounting for rainfall is considered to provide an estimate of the worst-case dewatering scenario for applying for dewatering discharge permits and approvals. To account for additional dewatering volumes from precipitation, a design storm with a 24-hour depth of accumulation of 10 mm was considered, which represents the 80th percentile of all rainfall volumes recorded at the Oshawa Climate Station (ID 6155875) in 2019.
A summary of the dewatering rates estimated for each parking facility is presented in Table 5-3 below.
Table 5-3 Dewatering Rate Summary
Parking
Facility
H
h
K
rs
Radius of
Influence R01 + rs
Short-Term Pumping Rate
Q
Long-Term
Pumping Rate
Q
m m m/day m m m3/day L/day L/s L/day
Podium 1
(Tower 1
Tower 2
Tower 3)
12 9 5.2 x 10⁻³ 66 72 28.771 28,771 0.33 9,590
Precipitation 59.500 59,500 0.69 -
Sub-Total 88.271 88,271 1.02 9,590
Podium 4
(Tower 6
Tower 7)
14 9 4.3 x 10⁻¹ 51 96 569.298 569,298 6.59 189,766
Precipitation 43.050 43,050 0.50 -
Sub-Total 612.348 612,348 7.09 189,766
Block 1
Block 2
Tower 4
9 4 5.2 x 10⁻³ 67 72 27.408 27,408 0.32 9,136
Precipitation 90.000 90,000 1.04 -
Sub-Total 117.408 117,408 1.36 9,136
Block 3
Block 4
Tower 5
Tower 8
9 4 5.2 x 10⁻³ 64 69 43.416 43,416 0.50 14,472
Precipitation 140.300 140,300 1.62 -
Sub-Total 183.716 183,716 2.13 14,472
Summary 1,001.743 1,001,743 11.59 222,964
** Pumping rates include a factor of safety of 2.
To account for uncertainties and the natural variability in the range of hydraulic conductivity that can be encountered during dewatering, the calculated groundwater pumping rates were multiplied by a factor of safety of 2. Incorporating the factor of safety in the dewatering calculations also provides flexibility to the dewatering contractor in meeting project schedules and helps to account for the initial pumping period under transient conditions when dewatering volumes are expected to be higher as groundwater storage is depleted. Following the initial transient period, dewatering rates are expected to stabilize. The complete dewatering analysis can be found in Appendix E.
As was mentioned previously, this dewatering analysis has been prepared for permitting requirements only. As such, the dewatering rates are not meant to be solely relied upon in the determination of the approach used in the design of the dewatering system. The dewatering contractor is ultimately responsible for ensuring project timelines with respect to dewatering are met and that the open excavations are safe from a groundwater seepage perspective.

Toronto Inspection Ltd.
4986-19-HD Hydrogeological Investigation – R02 603-643, 645-699 Kingston Road, Pickering, ON
Page 18 of 26
5.5 Options for Dewatering Discharge and Permitting
5.5.1 Dewatering Permit Requirements
The estimated maximum cumulative groundwater dewatering rate required during construction to achieve the desired conditions within the excavations is 668,893 L/day. Additionally, it is recommended to account for incident precipitation when applying for potential dewatering and discharge approvals to ensure there is contingency available for maintaining a dry excavation during periods of rain. An accumulation of 10 mm over 24 hours within each excavation was considered in this investigation, which requires accounting for an additional 332,850 L/day above the estimated groundwater dewatering rates.
Considering both groundwater and stormwater control requirements, the cumulative rate of dewatering is then 1,001,743 L/day. Since this rate is greater than 400,000 L/day and may include combinations of groundwater and stormwater, a PTTW issued by the MECP will be required to facilitate construction dewatering if all excavations are to be opened at once. Since the dewatering rates between all blocks are variable, consideration of the approach to construction phasing in the context of potential dewatering permitting requirements is warranted to determine the maximum dewatering rate that should be requested in the PTTW application. Since the estimated dewatering rate for Podium 4 exceeds 400,000 L/day, the amalgamated rate requested in the PTTW application should consider the dewatering rate from Podium 4 as the minimum and that any additional dewatering requirements for other blocks be added to calculate the total permitting rate if they will be completed concurrently.
Since the foundations for all parking facilities will extend below the water table, it is anticipated that a method of groundwater control will be required over the long-term to manage hydrostatic pressure and groundwater seepage around the foundation floor and walls. If foundation drains and sumps are proposed for long-term groundwater control, the estimated rate of dewatering will be approximately 1/3rd the maximum cumulative rate of short-term groundwater dewatering, or approximately 222,964 L/day. Since the estimated rate of groundwater dewatering in the long- term is greater than 50,000 L/day, a Category 3 PTTW issued by the MECP will be required if long-term groundwater takings are proposed. It will be necessary to demonstrate in the permit application that no unacceptable impacts over the long-term are expected.
Separate applications for PTTWs will be needed to satisfy both the short-term and the long-term permitting requirements on the project. In each case, the PTTW application will require preparation of a hydrogeological report to support the application that includes the permitting rate required, identification of potential unacceptable impacts of the water taking, monitoring requirements, and a contingency plan to mitigate unacceptable impacts in the event they were to occur. It is recommended that a minimum of six (6) months lead time be provided for the MECP PTTW application review and approval process if PTTWs for construction dewatering and long- term operation of the Site will be pursued.
5.5.2 Disposal Options for Discharge Water
At this time, the groundwater quality, as it relates to By-Law 55-2013, does not meet the
discharge criteria in the Table 2 – Limits for Storm Sewer Discharge; however, it does meet the
Table 1 – Limits for Sanitary Sewer Discharge. With approval from Durham Region, excess
groundwater can be directed to the municipal sanitary sewers without requiring additional
treatment. Disposal options for excess groundwater should be considered prior to construction
as a discharge agreement will be required from Durham Region to authorize the discharge of

Toronto Inspection Ltd.
4986-19-HD Hydrogeological Investigation – R02 603-643, 645-699 Kingston Road, Pickering, ON
Page 19 of 26
dewatering effluent to municipal sewers. Consultation with Durham Region is recommended to
determine the requirements for dewatering discharge agreements on this project.
If dewatering discharge during construction is directed to a Durham Region municipal sewer, By- Law 55-2013 provides that dewatering operations must comply with the Construction Specifications for Control of Water from Dewatering Operations, OPSS 518, November 2006. If disposal to a Durham Region municipal sewer is proposed during construction, the treatment of dewatering discharge is the responsibility of the dewatering contractor on-Site. It is incumbent upon them to ensure that the dewatering discharge effluent meets the discharge criteria in By- Law 55-2013 for the receiving sewer and is in accordance with any and all terms and/or conditions of their discharge approval.
If a Private Water Drainage System (PWDS) is required for managing groundwater seepage over the long-term, approval for the connection to municipal sewers will be required from Durham Region. Alternatively, waterproofing of the foundation can be undertaken as an alternative to a PWDS. The option of waterproofing versus installing a PWDS and connecting to a municipal sewer should be considered prior to construction as approval for the connection from Durham Region will be required and may include separate agreements for each building complex. Further consultation with Durham Region is recommended if the discharge of groundwater to a municipal sewer is proposed over the long-term.

Toronto Inspection Ltd.
4986-19-HD Hydrogeological Investigation – R02 603-643, 645-699 Kingston Road, Pickering, ON
Page 20 of 26
6 Potential Receptors
As part of this program, potential groundwater receptors including domestic or permitted water supplies were identified. Additionally, the surrounding area was evaluated for potential ecological receptors to construction and dewatering.
An understanding of typical groundwater usage in the area was obtained by:
Querying MECP water well records within a 1 km radius of the Site;
Identifying permitted water takers within a 1 km radius of the Site.
6.1 MECP Water Well Record Search
A search of the MECP well records database was conducted within a 1 km radius of the study area. The search results showed a total of 73 drilled or dug wells within the search area. Water well usage details are summarized in Table 6-1. Appendix F provides the list of MECP well records returned by the search.
Table 6-1 MECP Well Records within 1 km Radius
Primary Well Use
Number of Wells within 1 km Buffer
of Study Area
Percentage of Total
Dewatering - Commercial 3 4%
Water Supply - Domestic 14 19%
Test/Observation/Monitoring Well 26 36%
Abandoned/Unknown 30 41%
Total 73
The primary well usage in this area (other than for abandoned/unknown) is for test/ observation/ monitoring well purposes (36%). Of the well records queried, 14 (19%) were shown to be used for domestic water supply. A review of these records shows that they were filed in the 1950s to 1970s. As the area surrounding the Site is developed and there no rural dwellings, in addition to the availability of municipal water, it is expected that the domestic water supplies are no longer in use. The locations of MECP well records within the 1 km search radius are shown in Figure 11.
6.2 Permitted Water Users
A search was conducted to identify the permitted groundwater users within 1 km of the study area. No active PTTWs were identified within the 1 km boundary as illustrated in Figure 11.
6.3 Ecological Receptors
Based on a review of MNRF’s Natural Heritage Areas mapping portal, the Site is not located within 500 m of Provincially Significant Wetlands, woodlots, and major watercourses. Furthermore, the Site is not located within an Area of Natural Scientific Interest (ANSI).
Considering the anticipated radius of influence for dewatering activities on-Site and degree of urbanization in the area, there are no anticipated ecological receptors to construction or dewatering activities at the Site that cannot be managed by proper implementation of barrier controls to restrict off-Site releases of construction debris and/or sediment.

Toronto Inspection Ltd.
4986-19-HD Hydrogeological Investigation – R02 603-643, 645-699 Kingston Road, Pickering, ON
Page 21 of 26
7 Potential Impacts and Proposed Mitigation
7.1 Identification and Mitigation of Short-Term Impacts
7.1.1 Potential Short-Term Impacts to the Groundwater System
Dewatering activities may cause the local water level to drop temporarily. The Site is not located within a WHPA, an SGRA, or an HVA area. As such, short-term impacts to the groundwater system will be limited to the temporary drawdown resulting from construction dewatering. Following construction dewatering, the water table is expected to recover to pre-construction conditions.
7.1.2 Potential Short-Term Impacts to the Surface Water System
Dewatering can result in a decline in the groundwater level in shallow unconfined aquifers and change how the groundwater and surface water systems interact. There are no surface water features within the anticipated ROI of dewatering and as such, dewatering activities are unlikely to have an impact on surrounding surface water features.
7.1.3 Potential Short-Term Impacts to Other Groundwater Users
Dewatering can result in a decline in the groundwater level in shallow unconfined aquifers, reducing the available groundwater for nearby groundwater takers. Based on the results of the water well records and PTTWs review, there are no active groundwater takers within the anticipated ROI of dewatering or the 1 km search radius for these receptors. Considering the availability of municipal servicing in the area, no short-term impacts to other groundwater users are anticipated.
7.1.4 Potential Short-Term Impacts to Land Stability
Dewatering activities remove groundwater from the soil thereby increasing the effective stress of those soils whose porespaces were once occupied by water. The increase in effective stress can naturally lead to settlement in subsurface materials which can manifest at the ground surface as and damage local infrastructure. Ground settlement related to construction dewatering should be reviewed by a geotechnical engineer prior to construction to evaluate and mitigate potential risks.
7.1.5 Mitigation of Short-Term Impacts
There are no sensitive receivers identified within the anticipated ROI for dewatering. Therefore, impacts to the groundwater system and other groundwater users are not expected and mitigative measures will therefore not be required except where mandated by dewatering permits or approvals.
A Spill Prevention and Response Plan, as well as an Erosion and Sediment Control (ESC) Plan, should be implemented during construction to limit the possibility of downward percolation of spilled contaminants to the groundwater table or to off-Site receptors during construction.
7.2 Identification and Mitigation of Long-Term Impacts
7.2.1 Potential Long-Term Impacts to the Groundwater System
The Site is not located within a WHPA, an SGRA, or an HVA. As such, unacceptable impacts to the groundwater system over the long-term are not expected.

Toronto Inspection Ltd.
4986-19-HD Hydrogeological Investigation – R02 603-643, 645-699 Kingston Road, Pickering, ON
Page 22 of 26
When there exists a possibility that groundwater may be diverted and follow the path of new
utilities or services, groundwater barriers may be used to prevent groundwater migration within
utility or service networks. Should the groundwater and soil conditions require the need for clay
seals, it should be discussed on a specific pipe location basis with the engineer responsible for
the design. For details and additional design information, see OPSD 802.095 and OPSS 1205.
7.2.2 Potential Long-Term Impacts to the Surface Water System
The Site is not located within an IPZ nor near to any water bodies or watercourses and therefore no unacceptable long-term impacts to the surface water system are expected.
7.2.3 Potential Long-Term Impacts to Other Groundwater Users
Long-term dewatering can result in a decline in the groundwater level in shallow unconfined aquifers, reducing the available groundwater for nearby groundwater takers. However, based on the results of the water well records and PTTWs review, there are no active groundwater takers within 1 km of the Site. As a result, no long-term impacts to other groundwater users are expected.
7.2.4 Mitigation of Long-Term Impacts
Long-term impacts to the groundwater system, surface water system, and other groundwater users are not expected and therefore no mitigative measures are considered necessary at this time. Considering the size of the Site, a Salt Management Plan is recommended over the long- term.

Toronto Inspection Ltd.
4986-19-HD Hydrogeological Investigation – R02 603-643, 645-699 Kingston Road, Pickering, ON
Page 23 of 26
8 Summary
A summary of the hydrogeological investigation is provided below:
• The Site is located within the Toronto and Region Source Protection Area and CTC Source Protection Region. A review of the CTC Source Protection Plan policy boundaries indicates that no specific CTC Source Water Protection Plan policies will apply to the development of the Site.
• The Site is located within the Petticoat Creek Watershed under the jurisdiction of the TRCA and it is not located within TRCA regulated areas. The nearest surface water feature to the Site is the Petticoat Creek at approximately 800 m to the southwest.
• The Site slopes to the south with an approximate average flat surface elevation of 105.19 masl.
• The Site is situated in the Iroquois Plain physiographic region.
• The subsurface geology consists mainly of fill underlain by a layer of sandy silt to a known depth of 22.88 mbgs. Intermixed within the sandy silt unit are thin units of sand, with a sand and gravel deposit approximately 12.9 m thick observed along the south- central area of the Site’s southern development boundary.
• Groundwater level elevations have been measured during the period of March to June of 2019. The groundwater levels over this time ranged in elevation from a low of 96.53 masl (8.89 mbgs) in the northeast corner of the Site in late March, to a high of 103.57 masl (1.4 mbgs) in the southwest corner of the Site in late March. It is expected that there will be some seasonal variability in groundwater levels resulting from periods of regional groundwater recharge and more frequent storm events. Groundwater levels are typically highest in the Spring and lowest in the Fall to early Winter. Based on the monitoring results, high water table conditions for the Site are anticipated to take place in the month of May.
• In-situ rising head tests were conducted in the sandy silt material at select monitoring wells in March of 2019 to determine in-situ hydraulic conductivities across the Site. The hydraulic conductivity of the sandy silt is estimated to range between 1.6 x 10⁻⁸ m/s and 1.8 x 10⁻⁷ m/s. The hydraulic conductivity of the sand and gravel unit is assumed to be 5 x 10⁻⁶ m/s. The range in reported in-situ hydraulic conductivity values falls within the literature ranges of the materials tested.
• A non-filtered groundwater quality sample was collected from BH-7 and analyzed for sewer discharge criteria in By-Law 55-2013. All parameters, with the exception of TSS, were found to be within the discharge criteria of the Table 2 – Limits for Storm Sewer Discharge of By-Law 55-2013. Additionally, all parameters, including TSS, were found to meet the Table 1 – Limits for Sanitary Sewer Discharge of By-Law 55-2013.
• Dewatering needs were assessed for each parking facility assuming the excavations required for each would be completed simultaneously. In this scenario, the maximum cumulative dewatering rate required to achieve the desired conditions within all excavations is approximately 1,001,743 L/day, which considers dewatering rates for groundwater and a stormwater accumulation of 10 mm. As the cumulative dewatering rate is greater than 400,000 L/day, a PTTW issued by the MECP will be required to facilitate dewatering activities during construction. Since the dewatering rates between all blocks are variable, consideration of the construction phasing approach in the context

Toronto Inspection Ltd.
4986-19-HD Hydrogeological Investigation – R02 603-643, 645-699 Kingston Road, Pickering, ON
Page 24 of 26
of potential dewatering permitting requirements is warranted to determine the maximum dewatering rate that should be requested in the PTTW application.
• Dewatering activities remove groundwater from the soil thereby increasing the effective stress which could lead to soil settlement. The potential risks associated with dewatering settlement should be reviewed by a geotechnical engineer prior to construction.
• As the foundations for all parking facilities will extend below the seasonal high groundwater table, it is anticipated that a method of long-term groundwater control will be required. If a PWDS system is proposed to collect and discharge groundwater, the maximum cumulative dewatering rate will likely be 1/3rd the rates calculated for the short- term, equating to approximately 222,964 L/day. Since the anticipated rate of dewatering in the long-term is greater than 50,000 L/day, a PTTW issued by the MECP will be required if water takings are proposed in the long-term.
• If excess groundwater/stormwater encountered during construction or collected in a dedicated foundation drainage system over the long-term is proposed to be discharged to a municipal sewer, approval from Durham Region will be required. Consultation with Durham Region is recommended to determine the requirements for the discharge approvals during construction and permanent sewer connections for groundwater discharge over the long-term.
• A search of the MECP well records for a 1 km radius of the Site returned 73 records and no active PTTWs. The primary well usage in the area was for test/observation/monitoring well purposes (36%).
• There are no anticipated short-term or long-term impacts to the groundwater system, other groundwater users, the surface water system or ecological receptors resulting from dewatering or construction activities. However, it is recommended to implement a Spill Prevention and Response Plan as well as an ESC Plan during construction to limit potential impacts to the groundwater system and the off-Site release of sediment. Considering the size of the Site, a Salt Management Plan is recommended over the long-term.

Toronto Inspection Ltd.
4986-19-HD Hydrogeological Investigation – R02 603-643, 645-699 Kingston Road, Pickering, ON
Page 25 of 26
9 References
Bear, J..1979. Hydraulics of Groundwater, McGraw-Hill, New York, New York.
Chapman, L.J. and Putnam, D.F. 1984. The Physiography of Southern Ontario, Third Edition. Ontario Geological Survey, Ontario Ministry of Natural Resources.
Graziani & Corazza Architect. March 16, 2020. Conceptual Plans for Whites Road & Hwy 401
Graziani & Corazza Architect. April 6, 2020. Site Plan for Whites Road & Hwy 401 Ministry of
the Environment, Conservation, and Parks (MECP). 2019. Permit to Take Water Database. January 1, 1960 to December 31, 2017.
Ministry of the Environment, Conservation, and Parks (MECP). 2019. Source Protection Information Atlas
Ministry of the Environment, Conservation, and Parks (MECP). 2019. Water Well Information System. 1889 to September 30, 2017. Last Updated March 7, 2019
Ontario Geological Survey (OGS). 2010. (OGS, 2010). Surficial geology of Southern Ontario; Ontario Geological Survey. 1:50,000 Scale.
Powers, J.P; A.B. Corwin; P.C. Schmall; W.E. Kaeck. (2007). Construction Dewatering and Groundwater Control: New Methods and Applications – Third Edition. New York, New York: John Wiley & Sons
Toronto Inspection Ltd. (April 2019). Preliminary Geotechnical Investigation – 603 to 609 Kingston Road, Pickering, Ontario
Toronto and Region Conservation Authority. (August 2012). Petticoat Creek Watershed Action Plan
York, Peel, Durham, Toronto and The Conservation Authorities Moraine Coalition (YPDT-CAMC). 2006. Groundwater Modelling of the Oak Ridges Moraine Area. CAMC-YPDT Technical Report # 01-06. Prepared by Earthfx Inc.


Toronto Inspection Ltd.
FIGURES
Hydrogeological Investigation – R02 603-643, 645-699 Kingston Road, Pickering, ON

REFERENCE
Service Layer Credits: Source: ESRI, DigitalGlobe, GeoEye, and Earthstar Geographics.
Produced under license from the Ontario Ministry of Natural Resources. Copyright (c) Queens Printer 2017.
Legend
Highway Railway
Arterial Road Watercourse
Local Road Wooded Area 0 50 100 200 300 400
Site Location m
1:10,000
²
Site
Lake Ontario
TITLE:
Site Location
LOCATION:
603-643, 645-699 Kingston Road, Pickering, Ontario
PROJECT NO.
4986-19-HD DATE:
March 2020 FIGURE NO.
1

REFERENCE
Service Layer Credits: Source: ESRI, DigitalGlobe, GeoEye, Earthstar Geographics, CNES/Airbus DS, USDA, USGS, AeroGRID, IGN, and the GIS User Community.
Produced under license from the Ontario Ministry of Natural Resources. Copyright (c) Queens Printer 2017.
Legend
5m Contour Railway
Highway Watercourse
Arterial Road Wooded Area
Local Road Site Location 0 50 100 200 300 400
m
1:10,000
²
Site
TITLE:
Topography
LOCATION:
603-643, 645-699 Kingston Road, Pickering, Ontario
PROJECT NO.
4986-19-HD DATE:
March 2020 FIGURE NO.
2

REFERENCE
Service Layer Credits: Source: Chapman, L.J. and Putnam, D.F. 2007. Physiography of Southern Ontario; Ontario Geological Survey, Miscellaneous Release--Data 228.
Produced for the District of Muskoka under license from the Ontario Ministry of Natural Resources. Copyright (c) Queens Printer 2017.
Legend
Railway Site Location
Highway Physiography
Arterial Road Iroquois Plain 0 50 100 200 300 400
Local Road m
1:10,000
²
Site
Lake Ontario
TITLE:
Physiography
LOCATION:
603-643, 645-699 Kingston Road, Pickering, Ontario
PROJECT NO.
4986-19-HD DATE:
March 2020 FIGURE NO.
3

LEGEND
TITLE:
Regional Hydrostratigraphic Cross-Section
REFERENCE:
Petticoat Creek Watershed Action Plan, TRCA, August 2012. LOCATION:
603-643, 645-699 Kingston Road, Pickering, Ontario
PROJECT NO.:
4986-19-HD
DATE:
March 2020
FIGURE NO.:
4

Legend
Railway Site Location
Highway Quaternary Geology
Arterial Road Glaciolacustrine deposits
Local Road Till 0 50 100 200 300 400
m
1:10,000
²
Site
Lake Ontario
TITLE:
Quaternary Geology
LOCATION:
603-643, 645-699 Kingston Road, Pickering, Ontario
PROJECT NO.
4986-19-HD DATE:
March 2020 FIGURE NO.
5
REFERENCE
Service Layer Credits: Source: Ontario Geological Survey, Ministry of Northern Development and Mines, and Northeast Science and Information Section, Ministry of Natural Resources 2005. Digital Northern Ontario Engineering Geology
Terrain Study (NOEGTS); Ontario Geological Survey, Miscellaneous Release--Data 160. Produced for the District of Muskoka under license from the Ontario Ministry of Natural Resources. Copyright (c) Queens Printer 2017.

REFERENCE
Service Layer Credits: Source: Ontario Geological Survey 2011. 1:250 000 scale bedrock geology of Ontario; Ontario Geological Survey, Miscellaneous Release---Data 126-Revision 1.
Produced for the District of Muskoka under license from the Ontario Ministry of Natural Resources. Copyright (c) Queens Printer 2017.
Legend
Railway Site Location
Highway Bedrock Geology
Arterial Road Georgian bay Fm.; Blue Mountain Fm.; Billings Fm.; Collingwood 0 50 100 200 300 400
Local Road Mb.; Eastview Mb. m
1:10,000
²
Site
Lake Ontario
TITLE:
Bedrock Geology
LOCATION:
603-643, 645-699 Kingston Road, Pickering, Ontario
PROJECT NO.
4986-19-HD DATE:
March 2020 FIGURE NO.
6

REFERENCE
Service Layer Credits: Source: ESRI, DigitalGlobe, GeoEye, Earthstar Geographics, CNES/Airbus DS, USDA, USGS, AeroGRID, IGN, and the GIS User Community.
Produced for the District of Muskoka under license from the Ontario Ministry of Natural Resources. Copyright (c) Queens Printer 2017.
A
BH-15s 100.71
BH-15 96.99
BH-14 BH-12 101.22 100.98
BH-16 100.58
BH-5 101.24
BH-11
BH-4
BH-3
BH-10
BH-9 101.83
BH-2
BH-1 BH-8 NA
BH-7 102.06
BH-13 102.65
BH-6 102.11
BH-6s 103.46
Legend
A! Borehole Location Highway
Monitoring Well Location Arterial Road
Cross-Section A-A' Local Road
1XX.XX Water Level (May 7, 2019) Site Location 0 12.5 25 50 75 100
m
1:3,000
²
Site
Lake Ontario
TITLE:
Borehole and Monitoring Well Locations
LOCATION:
603-643, 645-699 Kingston Road, Pickering, Ontario
PROJECT NO.
4986-19-HD DATE:
March 2020 FIGURE NO.
7

115
A
115
A'
110 110
BH-6S BH-6D
BH-7
BH-9
BH-10
BH-11
BH-16
BH-15S
BH-15D
105
100
95
90
85
103.46 masl
102.11 masl
102.06 masl
101.83 masl
100.58 masl
100.76 masl
96.99 masl
105
100
95
90
85
80 80
Section Distance (m)
LEGEND
TITLE:
Local Geological Cross-Section A - A'
Simplified Stratigraphy Water Level Inferred Geological
Asphalt/Granular Base (May 07, 2019) Boundary
Fill Drawing Notes
Sandy Silt Till Monitoring Well All locations are approximate
Silty Sand Screen Vertical Exaggeration: 10x
Sand Drawn By: I.G. 05/28/2019
Sand and Gravel Inferred Reviewed By: T.L. 05/28/2019
Water Table * For detailed description, see borehole records
LOCATION:
603-643, 645-699 Kingston Road,
Pickering, Ontario
PROJECT NO.:
4986-19-HD
DATE:
March 2020
FIGURE NO.:
8
49
0
47
5
45
0
43
5
42
0
40
5
39
0
37
5
36
0
34
5
33
0
31
5
30
0
28
5
27
0
25
5
24
0
22
5
21
0
19
5
18
0
16
5
15
0
13
5
12
0
10
5
90
75
60
45
30
15
0
Ele
vatio
n (
masl)
Ele
vatio
n (
masl)

LEGEND
TITLE:
Long-term Water Level
Monitoring Hydrograph
LOCATION:
603-643, 645-699 Kingston Road,
Pickering, Ontario
PROJECT NO.:
4986-19-HD
DATE:
March 2020
FIGURE NO.:
9

Legend
MECP Water Well Railway Site Location
Permit to Take Water Watercourse
Highway 500m Buffer of Site Location
Arterial Road Wooded Area 0 50 100 200 300 400
Local Road m 1:10,000
²
Site
Lake Ontario
TITLE:
MECP Water Wells and Permits to Take Water
LOCATION:
603-643, 645-699 Kingston Road, Pickering, Ontario
PROJECT NO.
4986-19-HD DATE:
March 2019 FIGURE NO.
11
REFERENCE
Service Layer Credits: Source: ESRI, DigitalGlobe, GeoEye, and Earthstar Geographics.
Produced for the District of Muskoka under license from the Ontario Ministry of Natural Resources. Copyright (c) Queens Printer 2017.

Toronto Inspection Ltd.
APPENDIX A
Conceptual Site Plan
Hydrogeological Investigation – R02 603-643, 645-699 Kingston Road, Pickering, ON


Toronto Inspection Ltd.
APPENDIX B
Borehole Logs
Hydrogeological Investigation – R02 603-643, 645-699 Kingston Road, Pickering, ON

Log of Borehole BH-1 Project No. 4986-19-GC
Dwg No. 2
Sheet No. 1 of 1 Geotechnical investigation Project:
Location: 603-699 Kingston Road, Pickering, Ontario
Headspace Reading (ppm)
Natural Moisture
Plastic and Liquid Limit
Unconfined Compression
% Strain at Failure
Penetrometer
Date Drilled: 2/11/19
Drill Type: Truck Mount Drill Rig
Auger Sample
SPT (N) Value
Dynamic Cone Test
Shelby Tube
Field Vane Test Geodetic Datum: S
NOTE: THE BOREHOLE DATA NEEDS INTERPRETATION ASSISTANCE BY TORONTO INSPECTION LTD. BEFORE USE BY OTHERS
Toronto Inspection Ltd.
Time Water Level (m)
Depth to Cave (m)
March 7, 2019
March 11, 2019
March 26, 2019
3.11m
7.31m
Blocked
Shear Strength kPa 100 200
ASPHALT PAVEMENT - 115mm asphalt over granular bases. FILL - dark brown to brown clayey silt to sandy silt, - some gravel, some organics to 1.5m, - some sand & gravel at 1.5m to 1.9m, - very moist, wet at 1.5m. SANDY SILT TILL - very dense, grey, - some gravel, - some silty sand, - some clayey silt, - moist to very moist.
38
5
8
62
86
50/100mm
88
50/115mm
55
55
87
54
68
64
50/90mm
88/265mm
END OF BOREHOLE NOTE: Upon completion of the drilling: - water level at 1.8m, - cave-in at 13.4m.
Natural Moisture Content % Atterberg Limits (% Dry Weight)
10 20 30
Natural Unit
Weight kN/m3
Headspace Reading (ppm)
100 200 300
N Value
20 40 60 80
D E P T H
0
1
2
3
4
5
6
7
8
9
10
11
12
13
14
15
16
17
18
19
20 85.12
98.04
102.91
ELEV.
m
105.35
105.01
Soil Description
Ground Surface
S Y M B O L
G W L
LG
BE
3 4
98
6-1
9-G
C.G
PJ 4
/16
/19

Log of Borehole BH-2 Project No. 4986-19-GC
Dwg No. 3
Sheet No. 1 of 1 Geotechnical investigation Project:
Location: 603-699 Kingston Road, Pickering, Ontario
Headspace Reading (ppm)
Natural Moisture
Plastic and Liquid Limit
Unconfined Compression
% Strain at Failure
Penetrometer
Date Drilled: 2/8/19
Drill Type: Truck Mount Drill Rig
Auger Sample
SPT (N) Value
Dynamic Cone Test
Shelby Tube
Field Vane Test Geodetic Datum: S
NOTE: THE BOREHOLE DATA NEEDS INTERPRETATION ASSISTANCE BY TORONTO INSPECTION LTD. BEFORE USE BY OTHERS
Toronto Inspection Ltd.
Time Water Level (m)
Depth to Cave (m)
ASPHALT PAVEMENT - 100mm asphalt over granular bases. FILL - brown sandy silt, - some gravel, some clayey silt, - moist. SANDY SILT TILL - compact to very dense, - brown, grey below 2.3m, - some gravel, - some silty sand, - some clayey silt, - layers of sand at 1.5m, and below18m, - occasional thin layers fo clayey silt, - moist to wet.
END OF BOREHOLE NOTE: Upon completion of the drilling: - water level at 7.9m, - cave-in at 13.5m.
52
45
27
25
10
24
17
38
28
45
95
50
50/75mm
50/75mm
50/100mm
200 100 kPa Shear Strength
15
Natural Moisture Content % Atterberg Limits (% Dry Weight)
10 20 30
Natural Unit
Weight kN/m3
Headspace Reading (ppm)
100 200 300
N Value
20 40 60 80
D E P T H
0
1
2
3
4
5
6
7
8
9
10
11
12
13
14
15
16
17
18
19
20 85.28
97.65
ELEV.
m
105.55
105.24
105.17
Soil Description
Ground Surface
S Y M B O L
G W L
LG
BE
3 4
98
6-1
9-G
C.G
PJ 4
/16
/19

Log of Borehole BH-3 Project No. 4986-19-GC
Dwg No. 4
Sheet No. 1 of 1 Geotechnical investigation Project:
Location: 603-699 Kingston Road, Pickering, Ontario
Headspace Reading (ppm)
Natural Moisture
Plastic and Liquid Limit
Unconfined Compression
% Strain at Failure
Penetrometer
Date Drilled: 2/12/19
Drill Type: Truck Mount Drill Rig
Auger Sample
SPT (N) Value
Dynamic Cone Test
Shelby Tube
Field Vane Test Geodetic Datum: S
NOTE: THE BOREHOLE DATA NEEDS INTERPRETATION ASSISTANCE BY TORONTO INSPECTION LTD. BEFORE USE BY OTHERS
Toronto Inspection Ltd.
Time Water Level (m)
Depth to Cave (m)
Shear Strength
31 100
kPa 200
ASPHALT PAVEMENT - 50mm asphalt over granular bases. FILL - brown sandy silt to clayey silt, - some gravel, - very moist. SANDY SILT TILL - dense to very dense, - brown, grey below 3.0m, - some gravel, - some silty sand, - some clayey silt, - a layer of silty sand at 2.3m and 13.5m, - moist to wet.
41
50/125mm
50/100mm
45
50/125mm
50/75mm
89
74
80
60
30
50/150mm
50/125mm
SAND AND GRAVEL - very dense, grey, - a thin layer of fine sand at 18.6m, - wet.
85/250mm
50/100mm
END OF BOREHOLE NOTE: Upon completion of the drilling: - water level at 7.4m, - cave-in at 17.7m.
Natural Moisture Content % Atterberg Limits (% Dry Weight)
10 20 30
Natural Unit
Weight kN/m3
Headspace Reading (ppm)
100 200 300
N Value
20 40 60 80
D E P T H
0
1
2
3
4
5
6
7
8
9
10
11
12
13
14
15
16
17
18
19
20 85.36
87.44
98.02
ELEV.
m
105.42
105.14
105.02
Soil Description
Ground Surface
S Y M B O L
G W L
LG
BE
3 4
98
6-1
9-G
C.G
PJ 4
/16
/19

Log of Borehole BH-4 Project No. 4986-19-GC
Dwg No. 5
Sheet No. 1 of 1 Geotechnical investigation Project:
Location: 603-699 Kingston Road, Pickering, Ontario
Headspace Reading (ppm)
Natural Moisture
Plastic and Liquid Limit
Unconfined Compression
% Strain at Failure
Penetrometer
Date Drilled: 2/15/19
Drill Type: Truck Mount Drill Rig
Auger Sample
SPT (N) Value
Dynamic Cone Test
Shelby Tube
Field Vane Test Geodetic Datum: S
NOTE: THE BOREHOLE DATA NEEDS INTERPRETATION ASSISTANCE BY TORONTO INSPECTION LTD. BEFORE USE BY OTHERS
Toronto Inspection Ltd.
Time Water Level (m)
Depth to Cave (m)
Shear Strength kPa 100 200
ASPHALT PAVEMENT - 100mm asphalt over granular bases. FILL - dark brown sandy silt, - some gravel, some clayey silt, - some organics, - moist. SANDY SILT TILL - very dense, - brown, grey below 3.0m, - some gravel, - some clayey silt, - moist.
23
69
50/100mm
50/140mm
50/75mm
50/75mm
50/75mm
50/100mm
SAND - very dense, grey, - medium grained, - some gravel, - some silty sand to sandy silt at 10.8m, - very moist to wet. SANDY SILT TILL - very dense, grey, - some gravel, - trace clayey silt, - moist. SAND - very dense, grey, - fine to coarse grained, - some gravel, - some silty sand, - thin layers of sandy silt at 15.3m, 18.3m, 19.8m, - wet, moist to very moist pockets.
51
88
61
82/250mm
54
50/115mm
91/250
50/140mm
END OF BOREHOLE NOTE: Upon completion of the drilling: - water level at 5.2m, - cave-in at 8.0m.
mm
Natural Moisture Content % Atterberg Limits (% Dry Weight)
10 20 30
Natural Unit
Weight kN/m3
Headspace Reading (ppm)
100 200 300
N Value
20 40 60 80
D E P T H
0
1
2
3
4
5
6
7
8
9
10
11
12
13
14
15
16
17
18
19
85.82
94.87
93.58
96.93
100.57
ELEV.
m
105.77
105.41
104.85
Soil Description
Ground Surface
S Y M B O L
G W L
LG
BE
3 4
98
6-1
9-G
C.G
PJ 4
/16
/19

Log of Borehole BH-5 Project No. 4986-19-GC
Dwg No. 6
Sheet No. 1 of 1 Geotechnical investigation Project:
Location: 603-699 Kingston Road, Pickering, Ontario
Headspace Reading (ppm)
Natural Moisture
Plastic and Liquid Limit
Unconfined Compression
% Strain at Failure
Penetrometer
Date Drilled: 2/13/19
Drill Type: Truck Mount Drill Rig
Auger Sample
SPT (N) Value
Dynamic Cone Test
Shelby Tube
Field Vane Test Geodetic Datum: S
NOTE: THE BOREHOLE DATA NEEDS INTERPRETATION ASSISTANCE BY TORONTO INSPECTION LTD. BEFORE USE BY OTHERS
Toronto Inspection Ltd.
Time Water Level (m)
Depth to Cave (m)
March 7, 2019
March 11, 2019
March 26, 2019
3.62m
4.37m
3.59m
ASPHALT PAVEMENT - 100mm asphalt over granular bases. FILL - dark brown to brown sandy silt, - minor topsoil, some gravel, - moist. SANDY SILT TILL - compact to very dense, - brown, grey below 4.5m, - some gravel, - some silty sand, - some clayey silt, - moist to very moist.
SAND - very dense, grey, - fine to medium grained, - trace to some gravel, - occasional layers of silty sand / sandy silt or clayey silt, - very moist to wet.
END OF BOREHOLE NOTE: Upon completion of the drilling: - water level at 6.7m, - cave-in at 8.5m.
0mm
46
50/125mm
50/100mm
100/25
50/140mm
50/100mm
50/50mm
50/125mm
89/290mm
50/125mm
50/100mm
49
50/140mm
50/100mm
22
200 kPa
10500/50mm Shear Strength
Natural Moisture Content % Atterberg Limits (% Dry Weight)
10 20 30
Natural Unit
Weight kN/m3
Headspace Reading (ppm)
100 200 300
N Value
20 40 60 80
D E P T H
0
1
2
3
4
5
6
7
8
9
10
11
12
13
14
15
16
17
18
19
20 84.49
88.30
101.17
ELEV.
m
104.76
104.35
103.85
Soil Description
Ground Surface
S Y M B O L
G W L
LG
BE
3 4
98
6-1
9-G
C.G
PJ 4
/16
/19

Log of Borehole MW-6 Project No. 4986-19-GC
Dwg No. 18
Sheet No. 1 of 1 Geotechnical investigation Project:
Location: 603-699 Kingston Road, Pickering, Ontario
Headspace Reading (ppm)
Natural Moisture
Plastic and Liquid Limit
Unconfined Compression
% Strain at Failure
Penetrometer
Date Drilled: 2/4/19
Drill Type: Truck Mount Drill Rig
Auger Sample
SPT (N) Value
Dynamic Cone Test
Shelby Tube
Field Vane Test Geodetic Datum: S
NOTE: THE BOREHOLE DATA NEEDS INTERPRETATION ASSISTANCE BY TORONTO INSPECTION LTD. BEFORE USE BY OTHERS
Toronto Inspection Ltd.
Time Water Level (m)
Depth to Cave (m)
March 7, 2019
March 11, 2019
March 26, 2019
2.08m
2.07m
1.40m
NO SAMPLING
END OF BOREHOLE NOTE: Upon completion of the drilling: - no free water.
100 200 kPa Shear Strength
Natural Moisture Content % Atterberg Limits (% Dry Weight)
10 20 30
Natural Unit
Weight kN/m3
Headspace Reading (ppm)
100 200 300
N Value
20 40 60 80
D E P T H
0
1
2
3
4
100.40
103.57
ELEV.
m
104.97
Soil Description
Ground Surface
S Y M B O L
G W L
LG
BE
3 4
98
6-1
9-G
C.G
PJ 4
/16
/19

Log of Borehole BH-6 Project No. 4986-19-GC
Dwg No. 7
Sheet No. 1 of 1 Geotechnical investigation Project:
Location: 603-699 Kingston Road, Pickering, Ontario
Headspace Reading (ppm)
Natural Moisture
Plastic and Liquid Limit
Unconfined Compression
% Strain at Failure
Penetrometer
Date Drilled: 2/4/19
Drill Type: Truck Mount Drill Rig
Auger Sample
SPT (N) Value
Dynamic Cone Test
Shelby Tube
Field Vane Test Geodetic Datum: S
NOTE: THE BOREHOLE DATA NEEDS INTERPRETATION ASSISTANCE BY TORONTO INSPECTION LTD. BEFORE USE BY OTHERS
Toronto Inspection Ltd.
Time Water Level (m)
Depth to Cave (m)
March 26, 2019 3.01m
ASPHALT PAVEMENT - 90mm asphalt over granular bases. FILL - dark brwon to brown sandy silt to clayey silt, - some organics, wood pieces at 0.8m, - trace gravel, - very moist. SANDY SILT TILL - compact to very dense, - brown, grey below 7.8m, - some gravel, - some sandy silt, - some clayey silt, - a layer of slity sand at 18m, - occasional thin layers fo clayey silt, - moist to very moist, wet pockets.
/125mm
/100mm
49
/125mm
86/275mm
/140mm
/100mm
/125mm
/125mm
50/75mm
END OF BOREHOLE NOTE: Upon completion of the drilling: - water level at 7.0m, - cave-in at 9.7m.
50
50
50
50
50
40
50
50
28
21
5
8
155000/125mm 200 kPa Shear Strength
Natural Moisture Content % Atterberg Limits (% Dry Weight)
10 20 30
Natural Unit
Weight kN/m3
Headspace Reading (ppm)
100 200 300
N Value
20 40 60 80
D E P T H
0
1
2
3
4
5
6
7
8
9
10
11
12
13
14
15
16
17
18
19
20 84.93
103.14
101.96
ELEV.
m
104.97
104.73
Soil Description
Ground Surface
S Y M B O L
G W L
LG
BE
3 4
98
6-1
9-G
C.G
PJ 4
/16
/19

Log of Borehole BH-7 Project No. 4986-19-GC
Dwg No. 8
Sheet No. 1 of 1 Geotechnical investigation Project:
Location: 603-699 Kingston Road, Pickering, Ontario
Headspace Reading (ppm)
Natural Moisture
Plastic and Liquid Limit
Unconfined Compression
% Strain at Failure
Penetrometer
Date Drilled: 2/5/19
Drill Type: Truck Mount Drill Rig
Auger Sample
SPT (N) Value
Dynamic Cone Test
Shelby Tube
Field Vane Test Geodetic Datum: S
NOTE: THE BOREHOLE DATA NEEDS INTERPRETATION ASSISTANCE BY TORONTO INSPECTION LTD. BEFORE USE BY OTHERS
Toronto Inspection Ltd.
Time Water Level (m)
Depth to Cave (m)
March 7, 2019
March 11, 2019
March 26, 2019
3.98m
4.00m
3.92m
G W L
S Y M B O L
ASPHALT PAVEMENT - 100mm asphalt over granular bases. FILL - brown clayey silt to sandy silt, - minor topsoil / organics, - some gravel, - moist. SANDY SILT TILL - compact to very dense, - brown, grey below 4.5m, - some gravel, - some clayey silt, - moist.
SILTY SAND - compact to dense, grey, - fine to medium grained, - some gravel, - some sandy silt, - wet.
SANDY SILT TILL - very dense, grey, - some gravel, - silty sand till at 16.5m, - fine to medium sand at 18.3m to 18.7m, - wet to very moist.
END OF BOREHOLE NOTE: Upon completion of the drilling: - water level at 12m.
50/75mm
69
50/75mm
49
22
61
62
53
63
50/100mm
50/150mm
50/50mm
86/250mm
60
32
200 100 kPa Shear Strength
23
Natural Moisture Content % Atterberg Limits (% Dry Weight)
10 20 30
Natural Unit
Weight kN/m3
Headspace Reading (ppm)
100 200 300
N Value
20 40 60 80
D E P T H
0
1
2
3
4
5
6
7
8
9
10
11
12
13
14
15
16
17
18
19
85.84
89.27
92.32
101.81
ELEV.
m
105.73
105.48
105.35
Soil Description
Ground Surface
LG
BE
3 4
98
6-1
9-G
C.G
PJ 4
/16
/19

Log of Borehole BH-8 Project No. 4986-19-GC
Dwg No. 9
Sheet No. 1 of 1 Geotechnical investigation Project:
Location: 603-699 Kingston Road, Pickering, Ontario
Headspace Reading (ppm)
Natural Moisture
Plastic and Liquid Limit
Unconfined Compression
% Strain at Failure
Penetrometer
Date Drilled: 2/7/19
Drill Type: Truck Mount Drill Rig
Auger Sample
SPT (N) Value
Dynamic Cone Test
Shelby Tube
Field Vane Test Geodetic Datum: S
NOTE: THE BOREHOLE DATA NEEDS INTERPRETATION ASSISTANCE BY TORONTO INSPECTION LTD. BEFORE USE BY OTHERS
Toronto Inspection Ltd.
Time Water Level (m)
Depth to Cave (m)
ASPHALT PAVEMENT - 100mm asphalt over granular bases. FILL - brown sandy silt, - some gravel, some clayey silt, - moist. SANDY SILT TILL - dense to very dense, - brown, grey below 2.3m, - some gravel, - some clayey silt, - a thin layer of sand at 7.8m, - moist.
SAND - very dense, grey, - fine to medium grained, - some silty sand, - wet. SANDY SILT TILL - very dense, grey, - some gravel, - some clayey silt, - moist.
END OF BOREHOLE NOTE: Upon completion of the drilling: - cave-in at 7.8m.
50/100mm
50/115mm
50/50mm
50/140mm
81/290mm
54
77
80/275mm
81
72
50/115mm
66
46
56
58
200 kPa
1550000/100mm Shear Strength
Natural Moisture Content % Atterberg Limits (% Dry Weight)
10 20 30
Natural Unit
Weight kN/m3
Headspace Reading (ppm)
100 200 300
N Value
20 40 60 80
D E P T H
0
1
2
3
4
5
6
7
8
9
10
11
12
13
14
15
16
17
18
19
20 85.12
90.25
91.78
ELEV.
m
105.19
104.83
104.78
Soil Description
Ground Surface
S Y M B O L
G W L
LG
BE
3 4
98
6-1
9-G
C.G
PJ 4
/16
/19

Log of Borehole BH-9 Project No. 4986-19-GC
Dwg No. 10
Sheet No. 1 of 1 Geotechnical investigation Project:
Location: 603-699 Kingston Road, Pickering, Ontario
Headspace Reading (ppm)
Natural Moisture
Plastic and Liquid Limit
Unconfined Compression
% Strain at Failure
Penetrometer
Date Drilled: 2/8/19
Drill Type: Truck Mount Drill Rig
Auger Sample
SPT (N) Value
Dynamic Cone Test
Shelby Tube
Field Vane Test Geodetic Datum: S
NOTE: THE BOREHOLE DATA NEEDS INTERPRETATION ASSISTANCE BY TORONTO INSPECTION LTD. BEFORE USE BY OTHERS
Toronto Inspection Ltd.
Time Water Level (m)
Depth to Cave (m)
March 7, 2019
March 11, 2019
March 26, 2019
2.98m
3.05m
3.06m
Shear Strength kPa 100 200
ASPHALT PAVEMENT - 75mm asphalt over granular bases. FILL - dark brown to brown sandy silt, - some gravel, some clayey silt, - minor organics, - moist. SANDY SILT TILL - dense to very dense, - brown, grey below 3.0m, - some gravel, - some clayey silt, - some silty sand at 1.8m, - moist.
65
47
83/250mm
50/125mm
90/225mm
50/50mm
50/115mm
80/225mm
86/275mm
50/100mm
50/125mm
50/140mm
SAND - very dense, grey, - fine to medium grained, - some silt, - wet. SANDY SILT TILL - very dense, grey, - some gravel, - some clayey silt, - a layer of silt at 16.8m, - moist.
90/250mm
89/275mm
90/275mm
95/250mm
END OF BOREHOLE NOTE: Upon completion of the drilling: - water level at 5.4m, - cave-in at 13.6m.
Natural Moisture Content % Atterberg Limits (% Dry Weight)
10 20 30
Natural Unit
Weight kN/m3
Headspace Reading (ppm)
100 200 300
N Value
20 40 60 80
D E P T H
0
1
2
3
4
5
6
7
8
9
10
11
12
13
14
15
16
17
18
19
20 84.67
88.13
89.96
101.83
ELEV.
m
104.89
104.53
103.98
Soil Description
Ground Surface
S Y M B O L
G W L
LG
BE
3 4
98
6-1
9-G
C.G
PJ 4
/16
/19

Log of Borehole BH-10 Project No. 4986-19-GC
Dwg No. 11
Sheet No. 1 of 1 Geotechnical investigation Project:
Location: 603-699 Kingston Road, Pickering, Ontario
Headspace Reading (ppm)
Natural Moisture
Plastic and Liquid Limit
Unconfined Compression
% Strain at Failure
Penetrometer
Date Drilled: 3/19/19
Drill Type: Truck Mount Drill Rig
Auger Sample
SPT (N) Value
Dynamic Cone Test
Shelby Tube
Field Vane Test Geodetic Datum: S
NOTE: THE BOREHOLE DATA NEEDS INTERPRETATION ASSISTANCE BY TORONTO INSPECTION LTD. BEFORE USE BY OTHERS
Toronto Inspection Ltd.
Time Water Level (m)
Depth to Cave (m)
Shear Strength kPa 100 200
ASPHALT PAVEMENT - 175mm asphalt over granular bases. FILL - brown sandy silt, - some gravel, some clayey silt, - pockets of organics, - moist to very moist. SANDY SILT TILL - dense to very dense, - brown, grey below 3.0m, - some gravel, some to trace clayey silt, - some silty sand below 3.0m, - moist to very moist.
16
10
39/75mm
50/50mm
50/125mm
50/75mm
50/75mm
SAND AND GRAVEL - very dense, compact at 13.3m, - river sand, river gravel, - medium to coarsed grained sand, - some fine to medium grained sand, - occasional silty sand, - silty sand to sandy silt below 18.3m, - wet.
79
50/75mm
73
50/125mm
50/75mm
62
64
27
77/250mm
END OF BOREHOLE NOTE: Upon completion of the drilling: - water level at 6.1m, - cave-in at 12.2m.
Natural Moisture Content % Atterberg Limits (% Dry Weight)
10 20 30
Natural Unit
Weight kN/m3
Headspace Reading (ppm)
100 200 300
N Value
20 40 60 80
D E P T H
0
1
2
3
4
5
6
7
8
9
10
11
12
13
14
15
16
17
18
19
20 84.56
98.68
97.46
ELEV.
m
104.78
104.32
103.10
Soil Description
Ground Surface
S Y M B O L
G W L
LG
BE
3 4
98
6-1
9-G
C.G
PJ 4
/16
/19

Log of Borehole BH-11 Project No. 4986-19-GC
Dwg No. 12
Sheet No. 1 of 1 Geotechnical investigation Project:
Location: 603-699 Kingston Road, Pickering, Ontario
Headspace Reading (ppm)
Natural Moisture
Plastic and Liquid Limit
Unconfined Compression
% Strain at Failure
Penetrometer
Date Drilled: 2/14/19
Drill Type: Truck Mount Drill Rig
Auger Sample
SPT (N) Value
Dynamic Cone Test
Shelby Tube
Field Vane Test Geodetic Datum: S
NOTE: THE BOREHOLE DATA NEEDS INTERPRETATION ASSISTANCE BY TORONTO INSPECTION LTD. BEFORE USE BY OTHERS
Toronto Inspection Ltd.
Time Water Level (m)
Depth to Cave (m)
Shear Strength
31 100
kPa 200
ASPHALT PAVEMENT - 100mm asphalt over granular bases. FILL - dark brown to brown sandy silt, - some organics, - trace gravel, trace clayey silt, - moist. SANDY SILT TILL - compact to very dense, - brown, grey below 2.3m, - some gravel, - some clayey silt, - moist.
16
48
55
99/275mm
50/125mm
SAND - very dense, grey, - medium grained, - some gravel, - very moist to wet.
57
64
94/275mm
SANDY SILT TILL - very dense, grey, - some gravel, - some clayey silt, - moist.
50/125mm
96/225mm
SAND - very dense, grey, - fine to coarse grained, - some silt, - some gravel, - river sand with gravel at 16.8m, - very moist to wet.
50/100mm
50/90mm
50/115mm
SANDY SILT TILL - very dense, gery, - some gravel, some clayey silt, - some silty sand at 18.3m, - very wet to moist.
50/90mm
50/100mm
END OF BOREHOLE NOTE: Upon completion of the drilling: - water level at 4.1m, - cave-in at 7.0m.
Natural Moisture Content % Atterberg Limits (% Dry Weight)
10 20 30
Natural Unit
Weight kN/m3
Headspace Reading (ppm)
100 200 300
N Value
20 40 60 80
D E P T H
0
1
2
3
4
5
6
7
8
9
10
11
12
13
14
15
16
17
18
19
20 84.84
86.93
91.50
94.55
99.12
100.81
ELEV.
m
104.91
104.48
103.84
Soil Description
Ground Surface
S Y M B O L
G W L
LG
BE
3 4
98
6-1
9-G
C.G
PJ 4
/16
/19

Log of Borehole BH-12 Project No. 4986-19-GC
Dwg No. 13
Sheet No. 1 of 1 Geotechnical investigation Project:
Location: 603-699 Kingston Road, Pickering, Ontario
Headspace Reading (ppm)
Natural Moisture
Plastic and Liquid Limit
Unconfined Compression
% Strain at Failure
Penetrometer
Date Drilled: 2/20/19
Drill Type: Truck Mount Drill Rig
Auger Sample
SPT (N) Value
Dynamic Cone Test
Shelby Tube
Field Vane Test Geodetic Datum: S
NOTE: THE BOREHOLE DATA NEEDS INTERPRETATION ASSISTANCE BY TORONTO INSPECTION LTD. BEFORE USE BY OTHERS
Toronto Inspection Ltd.
Time Water Level (m)
Depth to Cave (m)
ASPHALT PAVEMENT - 75mm asphalt over granular bases. FILL - brown sandy silt, - some gravel, some silty sand, - moist. SANDY SILT TILL - very dense, - brown, grey below 6.0m, - layers of silty sand, - some gravel, - moist.
SAND - very dense, grey, - medium to coarse grained, - some gravel, - wet. SANDY SILT TILL (Auger sample) - grey, some gravel, - some silty sand, trace clayey silt, - very moist. END OF BOREHOLE NOTE: Upon completion of the drilling: - water level at 4.3m, - cave-in at 5.2m.
50/125mm
50/115mm
50/100mm
50/75mm
88/250mm
200 kPa
155000/125mm Shear Strength
Natural Moisture Content % Atterberg Limits (% Dry Weight)
10 20 30
Natural Unit
Weight kN/m3
Headspace Reading (ppm)
100 200 300
N Value
20 40 60 80
D E P T H
0
1
2
3
4
5
6
7 97.69
97.08
99.22
100.71
ELEV.
m
105.01
104.63
104.40
Soil Description
Ground Surface
S Y M B O L
G W L
LG
BE
3 4
98
6-1
9-G
C.G
PJ 4
/16
/19

Log of Borehole MW-12 Dwg No. 19
Project No. 4986-19-GC
Geotechnical investigation Sheet No. 1 of 1 Project:
Location: 603-699 Kingston Road, Pickering, Ontario
Headspace Reading (ppm)
Natural Moisture
Plastic and Liquid Limit
Unconfined Compression
% Strain at Failure
Penetrometer
Date Drilled: 3/20/19
Drill Type: Truck Mount Drill Rig
Auger Sample
SPT (N) Value
Dynamic Cone Test
Shelby Tube
Field Vane Test Geodetic Datum: S
NOTE: THE BOREHOLE DATA NEEDS INTERPRETATION ASSISTANCE BY TORONTO INSPECTION LTD. BEFORE USE BY OTHERS
Toronto Inspection Ltd.
Time Water Level (m)
Depth to Cave (m)
March 25, 2019
March 26, 2019
4.16m
4.15m
NO SAMPLING
SAND - very dense, grey, - medium to coarse grained, - some gravel, - wet. END OF BOREHOLE NOTE: Upon completion of the drilling: - water level at 4.0m.
51
100 200 kPa Shear Strength
Natural Moisture Content % Atterberg Limits (% Dry Weight)
10 20 30
Natural Unit
Weight kN/m3
Headspace Reading (ppm)
100 200 300
N Value
20 40 60 80
D E P T H
0
1
2
3
4
5
101.01
100.44
99.83
ELEV.
m
105.01
Soil Description
Ground Surface
S Y M B O L
G W L
LG
BE
3 4
98
6-1
9-G
C.G
PJ 4
/16
/19

Log of Borehole BH-13 Project No. 4986-19-GC
Dwg No. 14
Sheet No. 1 of 1 Geotechnical investigation Project:
Location: 603-699 Kingston Road, Pickering, Ontario
Headspace Reading (ppm)
Natural Moisture
Plastic and Liquid Limit
Unconfined Compression
% Strain at Failure
Penetrometer
Date Drilled: 2/4/19
Drill Type: Truck Mount Drill Rig
Auger Sample
SPT (N) Value
Dynamic Cone Test
Shelby Tube
Field Vane Test Geodetic Datum: S
NOTE: THE BOREHOLE DATA NEEDS INTERPRETATION ASSISTANCE BY TORONTO INSPECTION LTD. BEFORE USE BY OTHERS
Toronto Inspection Ltd.
Time Water Level (m)
Depth to Cave (m)
March 7, 2019
March 11, 2019
March 26, 2019
2.58m
2.53m
2.30m
G W L
S Y M B O L
N Value Headspace Reading (ppm)
Soil Description
Ground Surface ASPHALT PAVEMENT - 100mm asphalt over granular bases. FILL - brown sandy silt, - some gravel, some clayey silt, - very minor topsoil, - moist. SANDY SILT TILL - compact to very dense, - brown, grey below 4.5m, - some gravel, - some clayey silt, - some silty sand, - moist.
ELEV.
m
105.01
104.65
104.10
D E P T H
0
100 200 300
20
Shear Strength
40 60 80 Natural Moisture Content % Atterberg Limits (% Dry Weight)
155000/125mm kPa
200 10 20 30
Natural Unit
Weight kN/m3
18 1
30
102.71 2
86/275mm
3 50/125mm
4
88
5
50/125mm 98.63
6
END OF BOREHOLE NOTE: Upon completion of the drilling: - water level at 5.5m, - cave-in at 5.5m.
LG
BE
3 4
98
6-1
9-G
C.G
PJ 4
/16
/19

Log of Borehole BH-14 Project No. 4986-19-GC
Dwg No. 15
Sheet No. 1 of 1 Geotechnical investigation Project:
Location: 603-699 Kingston Road, Pickering, Ontario
Headspace Reading (ppm)
Natural Moisture
Plastic and Liquid Limit
Unconfined Compression
% Strain at Failure
Penetrometer
Date Drilled: 2/19/19
Drill Type: Truck Mount Drill Rig
Auger Sample
SPT (N) Value
Dynamic Cone Test
Shelby Tube
Field Vane Test Geodetic Datum: S
NOTE: THE BOREHOLE DATA NEEDS INTERPRETATION ASSISTANCE BY TORONTO INSPECTION LTD. BEFORE USE BY OTHERS
Toronto Inspection Ltd.
Time Water Level (m)
Depth to Cave (m)
March 7, 2019
March 11, 2019
March 26, 2019
4.31m
4.59m
4.54m
ASPHALT PAVEMENT - 75mm asphalt over granular bases. FILL - brown sandy silt to clayey silt, - some gravel, - moist. SANDY SILT TILL - dense to very dense, - brown, grey below 2.3m, - some gravel, - some clayey silt, - moist.
END OF BOREHOLE NOTE: Upon completion of the drilling: - no free water.
50/75mm
50/115mm
50/75mm
50/75mm
88/250mm
42
200 kPa
10500/75mm Shear Strength
Natural Moisture Content % Atterberg Limits (% Dry Weight)
10 20 30
Natural Unit
Weight kN/m3
Headspace Reading (ppm)
100 200 300
N Value
20 40 60 80
D E P T H
0
1
2
3
4
5
6 99.15
100.78
ELEV.
m
105.32
104.96
104.71
Soil Description
Ground Surface
S Y M B O L
G W L
LG
BE
3 4
98
6-1
9-G
C.G
PJ 4
/16
/19

Log of Borehole MW-15 Dwg No. 20
Project No. 4986-19-GC
Geotechnical investigation Sheet No. 1 of 1 Project:
Location: 603-699 Kingston Road, Pickering, Ontario
Headspace Reading (ppm)
Natural Moisture
Plastic and Liquid Limit
Unconfined Compression
% Strain at Failure
Penetrometer
Date Drilled: 3/20/19
Drill Type: Truck Mount Drill Rig
Auger Sample
SPT (N) Value
Dynamic Cone Test
Shelby Tube
Field Vane Test Geodetic Datum: S
NOTE: THE BOREHOLE DATA NEEDS INTERPRETATION ASSISTANCE BY TORONTO INSPECTION LTD. BEFORE USE BY OTHERS
Toronto Inspection Ltd.
Time Water Level (m)
Depth to Cave (m)
March 25, 2019
March 26, 2019
Dry
Dry
NO SAMPLING
END OF BOREHOLE NOTE: Upon completion of the drilling: - cave-in at 5.8m.
100 200 kPa Shear Strength
Natural Moisture Content % Atterberg Limits (% Dry Weight)
10 20 30
Natural Unit
Weight kN/m3
Headspace Reading (ppm)
100 200 300
N Value
20 40 60 80
D E P T H
0
1
2
3
4
5
6 99.33
ELEV.
m
105.42
Soil Description
Ground Surface
S Y M B O L
G W L
LG
BE
3 4
98
6-1
9-G
C.G
PJ 4
/16
/19

Log of Borehole BH-15 Project No. 4986-19-GC
Dwg No. 16
Sheet No. 1 of 1 Geotechnical investigation Project:
Location: 603-699 Kingston Road, Pickering, Ontario
Headspace Reading (ppm)
Natural Moisture
Plastic and Liquid Limit
Unconfined Compression
% Strain at Failure
Penetrometer
Date Drilled: 2/20/19
Drill Type: Truck Mount Drill Rig
Auger Sample
SPT (N) Value
Dynamic Cone Test
Shelby Tube
Field Vane Test Geodetic Datum: S
NOTE: THE BOREHOLE DATA NEEDS INTERPRETATION ASSISTANCE BY TORONTO INSPECTION LTD. BEFORE USE BY OTHERS
Toronto Inspection Ltd.
Time Water Level (m)
Depth to Cave (m)
March 7, 2019
March 11, 2019
March 25, 2019
March 26, 2019
Dry
Dry
8.48m
8.89m
ASPHALT PAVEMENT - 90mm asphalt over granular bases. FILL - brown sandy silt, - some gravel, some silty sand, - trace clayey silt, - moist. SANDY SILT TILL - very dense, grey, - some gravel, - some silty sand, - trace clayey silt, - moist.
END OF BOREHOLE NOTE: Upon completion of the drilling: - no free water.
50/0mm
50/75mm
50/125mm
50/115mm
50/100mm
50/125mm
67
52
200 kPa
10500/50mm Shear Strength
Natural Moisture Content % Atterberg Limits (% Dry Weight)
10 20 30
Natural Unit
Weight kN/m3
Headspace Reading (ppm)
100 200 300
N Value
20 40 60 80
D E P T H
0
1
2
3
4
5
6
7
8
9 96.2986.53
ELEV.
m
105.42
105.08
104.81
Soil Description
Ground Surface
S Y M B O L
G W L
LG
BE
3 4
98
6-1
9-G
C.G
PJ 4
/16
/19

Log of Borehole BH-16 Project No. 4986-19-GC
Dwg No. 17
Sheet No. 1 of 1 Geotechnical investigation Project:
Location: 603-699 Kingston Road, Pickering, Ontario
Headspace Reading (ppm)
Natural Moisture
Plastic and Liquid Limit
Unconfined Compression
% Strain at Failure
Penetrometer
Date Drilled: 3/21/19
Drill Type: Truck Mount Drill Rig
Auger Sample
SPT (N) Value
Dynamic Cone Test
Shelby Tube
Field Vane Test Geodetic Datum: S
NOTE: THE BOREHOLE DATA NEEDS INTERPRETATION ASSISTANCE BY TORONTO INSPECTION LTD. BEFORE USE BY OTHERS
Toronto Inspection Ltd.
Time Water Level (m)
Depth to Cave (m)
March 25, 2019
March 26, 2019
6.95m
8.25m
G W L
S Y M B O L
ASPHALT PAVEMENT - 100mm asphalt over granular bases. FILL - brown silty sand, - some gravel, - moist. SANDY SILT TILL - compact to very dense, - brown, grey below 1.8m, - some gravel, - some clayey silt, - seam of fine sand, - some silty sand at 6.0m & 7.5m, - some clayey silt layers below 12.2m, - moist, very moist pockets.
24
21
50/75mm
50/125mm
50/125mm
100/250mm
50/125mm
50/100mm
50/75mm
100/250mm
100/250mm
93
100/275mm
100/250mm
100/225mm
END OF BOREHOLE NOTE: Upon completion of the drilling: - no free water.
200 100 kPa Shear Strength
22
Natural Moisture Content % Atterberg Limits (% Dry Weight)
10 20 30
Natural Unit
Weight kN/m3
Headspace Reading (ppm)
100 200 300
N Value
20 40 60 80
D E P T H
0
1
2
3
4
5
6
7
8
9
10
11
12
13
14
15
16
17
18
19
20 84.81
96.75
ELEV.
m
105.00
104.60
104.39
Soil Description
Ground Surface
LG
BE
3 4
98
6-1
9-G
C.G
PJ 4
/16
/19

Toronto Inspection Ltd.
APPENDIX C
Hydraulic Conductivity Analysis
Hydrogeological Investigation – R02 603-643, 645-699 Kingston Road, Pickering, ON
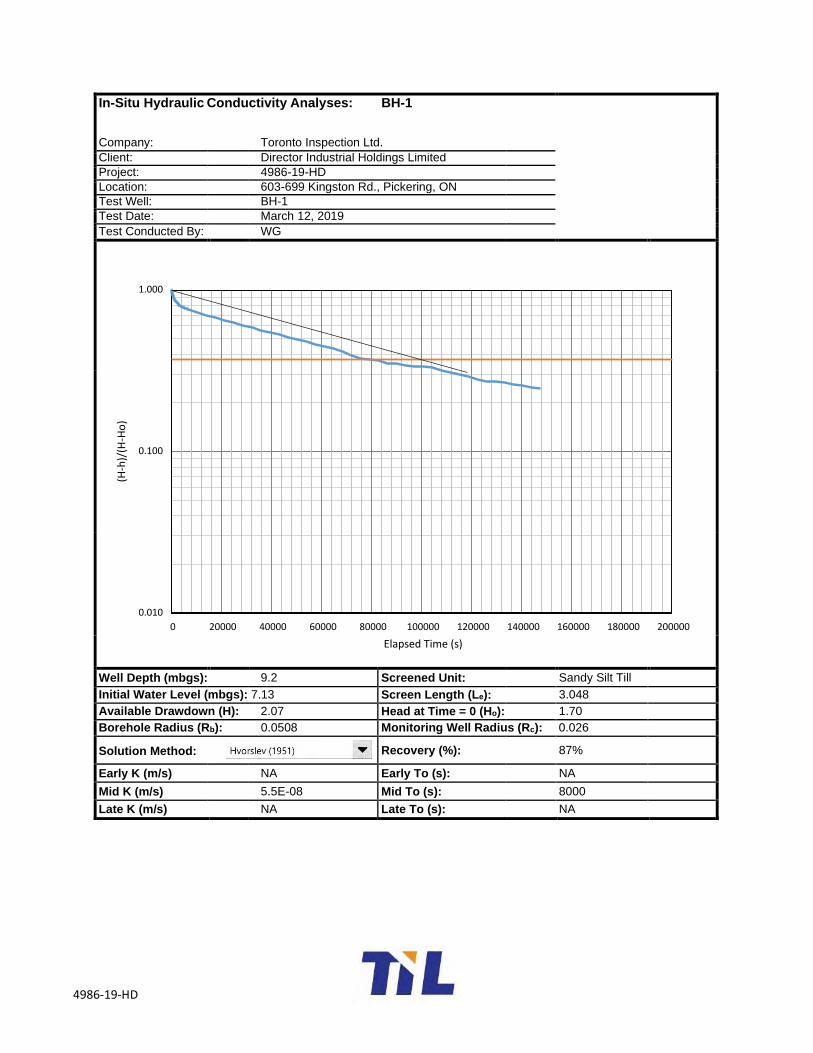
4986-19-HD
(H-h
)/(H
-Ho
)
In-Situ Hydraulic Conductivity Analyses: BH-1
Company: Toronto Inspection Ltd.
Client: Director Industrial Holdings Limited
Project: 4986-19-HD
Location: 603-699 Kingston Rd., Pickering, ON
Test Well: BH-1
Test Date: March 12, 2019
Test Conducted By: WG
1.000
0.100
0.010
0 20000 40000 60000 80000 100000 120000 140000 160000 180000 200000
Elapsed Time (s)
Well Depth (mbgs): 9.2 Screened Unit: Sandy Silt Till
Initial Water Level (mbgs): 7.13 Screen Length (Le): 3.048
Available Drawdown (H): 2.07 Head at Time = 0 (Ho): 1.70
Borehole Radius (Rb): 0.0508 Monitoring Well Radius (Rc): 0.026
Solution Method: Recovery (%):
87%
Early K (m/s) NA Early To (s): NA
Mid K (m/s) 5.5E-08 Mid To (s): 8000
Late K (m/s) NA Late To (s): NA

4986-19-HD
Hydraulic Conductivity Grainsize Analyses: BH-1
Company: Toronto Inspection Ltd.
Appendix C
Client: Director Industrial Holdings Limited
Project: 4986-19-HD
Location: 603-699 Kingston Rd., Pickering, ON
Test Well: BH-1
Test Date: March 27, 2019
Test Conducted By: TIL
Legend:
BH-1
Sampled Unit: Sandy Silt Till Sampled Depth (mbgs): 9.1
% Gravel 6.7 D100: 13.200
% Sand 41.0 D60 0.1600
% Silt 39.1 D30: 0.0220
% Clay 13.1 D10: 0.0037
K (m/s) 1.4E-07 Temperature (°C): 7

4986-19-HD
(H-h
)/(H
-Ho
)
In-Situ Hydraulic Conductivity Analyses: BH-5
Company: Toronto Inspection Ltd.
Appendix C
Client: Director Industrial Holdings Limited
Project: 4986-19-HD
Location: 603-699 Kingston Rd., Pickering, ON
Test Well: BH-5
Test Date: March 8, 2019
Test Conducted By: WG
1.000
0.100
0.010
0 2000 4000 6000 8000 10000 12000 14000
Elapsed Time (s)
Well Depth: 9.20 Screened Unit: Sandy Silt Till
Initial Water Level: 3.97 Screen Length (Le): 3.048
Available Drawdown (H): 5.23 Head at Time = 0 (Ho): 5.61
Borehole Radius (Rb): 0.0508 Monitoring Well Radius (Rc): 0.026
Solution Method: Recovery (%): 93%
Early K (m/s) 1.0E-07 Early To (s): 4200
Mid K (m/s) 8.7E-08 Mid To (s): 5000
Late K (m/s) NA Late To (s): NA

4986-19-HD
(H-h
)/(H
-Ho
)
In-Situ Hydraulic Conductivity Analyses: MW-6
Company: Toronto Inspection Ltd.
Appendix C
Client: Director Industrial Holdings Limited
Project: 4986-19-HD
Location: 603-699 Kingston Rd., Pickering, ON
Test Well: MW-6
Test Date: March 8, 2019
Test Conducted By: WG
1.000
0.100
0.010
0 5000 10000 15000 20000 25000 30000 35000 40000 45000 50000
Elapsed Time (s)
Well Depth: 4.60 Screened Unit: Sandy Silt Till
Initial Water Level: 2.07 Screen Length (Le): 3.048
Available Drawdown (H): 2.53 Head at Time = 0 (Ho): 1.95
Borehole Radius (Rb): 0.0508 Monitoring Well Radius (Rc): 0.026
Solution Method: Recovery (%):
100%
Early K (m/s) 2.7E-08 Early To (s): 16000
Mid K (m/s) 7.3E-08 Mid To (s): 6000
Late K (m/s) NA Late To (s): NA

4986-19-HD
(H-h
)/(H
-Ho
)
In-Situ Hydraulic Conductivity Analyses: BH-7
Company: Toronto Inspection Ltd.
Appendix C
Client: Director Industrial Holdings Limited
Project: 4986-19-HD
Location: 603-699 Kingston Rd., Pickering, ON
Test Well: BH-7
Test Date: March 8, 2019
Test Conducted By: WG
1.000
0.100
0.010
0 1000 2000 3000 4000 5000 6000 7000
Elapsed Time (s)
Well Depth: 19.80 Screened Unit: Sandy Silt Till
Initial Water Level: 4.00 Screen Length (Le): 3.048
Available Drawdown (H): 15.80 Head at Time = 0 (Ho): 15.69
Borehole Radius (Rb): 0.0795 Monitoring Well Radius (Rc): 0.026
Solution Method: Recovery (%):
100%
Early K (m/s) NA Early To (s): NA
Mid K (m/s) 1.8E-07 Mid To (s): 2200
Late K (m/s) NA Late To (s): NA

4986-19-HD
(H-h
)/(H
-Ho
)
In-Situ Hydraulic Conductivity Analyses: BH-9
Company: Toronto Inspection Ltd.
Appendix C
Client: Director Industrial Holdings Limited
Project: 4986-19-HD
Location: 603-699 Kingston Rd., Pickering, ON
Test Well: BH-9
Test Date: March 8, 2019
Test Conducted By: WG
1.000
0.100
0.010
0 1000 2000 3000 4000 5000 6000 7000 8000
Elapsed Time (s)
Well Depth: 9.20 Screened Unit: Sandy Silt Till
Initial Water Level: 3.05 Screen Length (Le): 3.048
Available Drawdown (H): 6.15 Head at Time = 0 (Ho): 4.56
Borehole Radius (Rb): 0.0508 Monitoring Well Radius (Rc): 0.026
Solution Method: Recovery (%): 100%
Early K (m/s) NA Early To (s): NA
Mid K (m/s) 1.4E-07 Mid To (s): 3200
Late K (m/s) 1.0E-07 Late To (s): 4200

4986-19-HD
In-Situ Hydraulic Conductivity Analyses: BH-10
Company: Toronto Inspection Ltd.
Appendix C
Client: Director Industrial Holdings Limited
Project: 4986-19-HD
Location: 603-699 Kingston Rd., Pickering, ON
Test Well: BH-10
Test Date: March 27, 2019
Test Conducted By: TIL
Legend:
BH-10
Sampled Unit: Sand and Gravel Sampled Depth (mbgs): 7.9
% Gravel 35.0 D100: 26.5000
% Sand 56.7 D60 2.4500
% Silt 8.4
D30: 0.2040
% Clay D10: 0.086
K (m/s) 7.7E-05 Temperature (°C): 7

4986-19-HD
(H-h
)/(H
-Ho
)
In-Situ Hydraulic Conductivity Analyses: BH-13
Company: Toronto Inspection Ltd.
Appendix C
Client: Director Industrial Holdings Limited
Project: 4986-19-HD
Location: 603-699 Kingston Rd., Pickering, ON
Test Well: BH-13
Test Date: March 8, 2019
Test Conducted By: WG
1.000
0.100
0.010
0 5000 10000 15000 20000 25000 30000 35000 40000 45000 50000
Elapsed Time (s)
Well Depth: 6.10 Screened Unit: Sandy Silt Till
Initial Water Level: 2.53 Screen Length (Le): 3.048
Available Drawdown (H): 3.57 Head at Time = 0 (Ho): 3.16
Borehole Radius (Rb): 0.0508 Monitoring Well Radius (Rc): 0.026
Solution Method: Recovery (%):
100%
Early K (m/s) 3.6E-08 Early To (s): 12000
Mid K (m/s) 2.3E-08 Mid To (s): 19000
Late K (m/s) NA Late To (s): NA

4986-19-HD
(H-h
)/(H
-Ho
)
In-Situ Hydraulic Conductivity Analyses: BH-16
Company: Toronto Inspection Ltd.
Appendix C
Client: Director Industrial Holdings Limited
Project: 4986-19-HD
Location: 603-699 Kingston Rd., Pickering, ON
Test Well: BH-16
Test Date: April 4, 2019
Test Conducted By: WG
1.000
0.100
0.010
0 10000 20000 30000 40000 50000 60000 70000 80000
Elapsed Time (s)
Well Depth: 19.80 Screened Unit: Sandy Silt Till
Initial Water Level: 5.13 Screen Length (Le): 3.048
Available Drawdown (H): 14.67 Head at Time = 0 (Ho): 13.70
Borehole Radius (Rb): 0.0762 Monitoring Well Radius (Rc): 0.026
Solution Method: Recovery (%): 93%
Early K (m/s) NA Early To (s): NA
Mid K (m/s) 1.6E-08 Mid To (s): 24000
Late K (m/s) NA Late To (s): NA

Toronto Inspection Ltd.
APPENDIX D
Laboratory Certificate of Analysis
Hydrogeological Investigation – R02 603-643, 645-699 Kingston Road, Pickering, ON

FINAL REPORT
CA14255-MAR19 R1
4986
Prepared for
Toronto Inspection Ltd.
TE-GL-ENVLAB-IT-011v1.5.2

FINAL REPORT CA14255-MAR19 R1
First Page
CLIENT DETAILS LABORATORY DETAILS
COMMENTS
SIGNATORIES
Brad Moore Hon. B.Sc
SGS Canada Inc. 185 Concession St., Lakefield ON, K0L 2H0 t 705-652-2000 f 705-652-6365 www.sgs.com
1 / 22 Member of the SGS Group (SGS SA)
RL - SGS Reporting Limit
Nonylphenol Ethoxylates is the sum of nonylphenol monoethoxylate and nonylphenol diethoxylate.
Total PAH is the sum of anthracene, benzo(a)pyrene, benzo(a)anthracene, benzo(e)pyrene, benzo(b,j)fluoranthene, benzo(k)fluoranthene, benzo(g,h,i)perylene,
chrysene, dibenzo(a,h)anthracene, dibenzo(a,i)pyrene, dibenzo(a,j)acridine, 7H-dibenzo(c,g)carbazole, fluoranthene, indeno(1,2,3-c,d)pyrene, perylene, phenanthrene
and pyrene..
Temperature of Sample upon Receipt: 5 degrees C
Cooling Agent Present:Yes
Custody Seal Present:No
Chain of Custody Number:007072
Client Toronto Inspection Ltd.
Address
Project Specialist
Laboratory
Address
Brad Moore Hon. B.Sc
SGS Canada Inc.
185 Concession St., Lakefield ON, K0L 2H0
Contact
Telephone
Facsimile
Project
Order Number
Samples
110 Konrad Crescent, Unit 16
Markham, ON
L3R 9X2, Canada
Tabitha Lee
416-996-3214
905 940 8192
[email protected]; [email protected]
4986
Telephone
Facsimile
SGS Reference
Received
Approved
Report Number
Date Reported
705-652-2000
705-652-6365
Ground Water (2)
CA14255-MAR19
03/11/2019
03/18/2019
CA14255-MAR19 R1
03/18/2019

FINAL REPORT CA14255-MAR19 R1
TABLE OF CONTENTS
First Page. ...................................................................................................................................................................................................... 1
Index. ............................................................................................................................................................................................................. 2
Results. ...................................................................................................................................................................................................... 3-8
Exceedance Summary. .................................................................................................................................................................................. 9
QC Summary. .........................................................................................................................................................................................10-19
Legend. ........................................................................................................................................................................................................ 20
Annexes. .................................................................................................................................................................................................21-22
20190318
2 / 22

FINAL REPORT CA14255-MAR19 R1
Client: Toronto Inspection Ltd.
Project: 4986
Project Manager: Tabitha Lee
Samplers: Will Guo
3 / 22
PACKAGE: SANSEW - General Chemistry (WATER)
L1 = SANSEW / WATER / - - Durham Table 1 - Sanitary Sewer Discharge - BL_43_2004
L2 = SANSEW / WATER / - - Durham Table 2 - Storm Sewer Discharge - BL_43_2004
Sample Number 8
Sample Name 19MW-7
Sample Matrix Ground Water
Sample Date 08/03/2019
Parameter
General Chemistry
Units RL L1 L2 Result
PACKAGE: SANSEW - Metals and Inorganics
(WATER)
L1 = SANSEW / WATER / - - Durham Table 1 - Sanitary Sewer Discharge - BL_43_2004
L2 = SANSEW / WATER / - - Durham Table 2 - Storm Sewer Discharge - BL_43_2004
Sample Number 8
Sample Name 19MW-7
Sample Matrix Ground Water
Sample Date 08/03/2019
Parameter
Metals and Inorganics
Units RL L1 L2 Result
Sulphate mg/L 2 1500 15
Cyanide (total) mg/L 0.01 2 0.02 < 0.01
Fluoride mg/L 0.06 10 0.39
Aluminum (total) mg/L 0.001 50 0.335
Antimony (total) mg/L 0.0009 5 < 0.0009
Arsenic (total) mg/L 0.0002 1 0.02 0.0021
Cadmium (total) mg/L 0.00000
3
0.7 0.008 0.000010
Chromium (total) mg/L 0.00008 2 0.08 0.00209
Cobalt (total) mg/L 0.00000
4
5 0.000312
Copper (total) mg/L 0.0002 3 0.05 0.0061
Lead (total) mg/L 0.00001 1 0.12 0.00056
Biochemical Oxygen Demand (BOD5) mg/L 2 300 15 < 4↑
Total Suspended Solids mg/L 2 350 15
46
Total Kjeldahl Nitrogen as N mg/L 0.5 100 1 0.6

FINAL REPORT CA14255-MAR19 R1
Client: Toronto Inspection Ltd.
Project: 4986
Project Manager: Tabitha Lee
Samplers: Will Guo
4 / 22
PACKAGE: SANSEW - Metals and Inorganics
(WATER)
L1 = SANSEW / WATER / - - Durham Table 1 - Sanitary Sewer Discharge - BL_43_2004
L2 = SANSEW / WATER / - - Durham Table 2 - Storm Sewer Discharge - BL_43_2004
Sample Number 8
Sample Name 19MW-7
Sample Matrix Ground Water
Sample Date 08/03/2019
Parameter
Metals and Inorganics (continued)
Units RL L1 L2 Result
Manganese (total) mg/L 0.00001 5 0.15 0.0391
Molybdenum (total) mg/L 0.00004 5 0.0261
Nickel (total) mg/L 0.0001 2 0.08 0.0009
Phosphorus (total) mg/L 0.003 10 0.4 0.055
Selenium (total) mg/L 0.00004 1 0.02 0.00005
Silver (total) mg/L 0.00005 5 0.12 < 0.00005
Tin (total) mg/L 0.00006 5 0.00056
Titanium (total) mg/L 0.00005 5 0.0121
Zinc (total) mg/L 0.002 2 0.04 0.003

FINAL REPORT CA14255-MAR19 R1
Client: Toronto Inspection Ltd.
Project: 4986
Project Manager: Tabitha Lee
Samplers: Will Guo
5 / 22
PACKAGE: SANSEW - Microbiology (WATER)
L1 = SANSEW / WATER / - - Durham Table 1 - Sanitary Sewer Discharge - BL_43_2004
L2 = SANSEW / WATER / - - Durham Table 2 - Storm Sewer Discharge - BL_43_2004
Sample Number 9
Sample Name 19MW-7 Bacti
Sample Matrix Ground Water
Sample Date 12/03/2019
Parameter
Microbiology
Units RL L1 L2 Result
PACKAGE: SANSEW - Nonylphenol and Ethoxylates
(WATER)
L1 = SANSEW / WATER / - - Durham Table 1 - Sanitary Sewer Discharge - BL_43_2004
L2 = SANSEW / WATER / - - Durham Table 2 - Storm Sewer Discharge - BL_43_2004
Sample Number 8
Sample Name 19MW-7
Sample Matrix Ground Water
Sample Date 08/03/2019
Parameter
Nonylphenol and Ethoxylates
Units RL L1 L2 Result
PACKAGE: SANSEW - Oil and Grease (WATER)
L1 = SANSEW / WATER / - - Durham Table 1 - Sanitary Sewer Discharge - BL_43_2004
L2 = SANSEW / WATER / - - Durham Table 2 - Storm Sewer Discharge - BL_43_2004
Sample Number 8
Sample Name 19MW-7
Sample Matrix Ground Water
Sample Date 08/03/2019
Parameter
Oil and Grease
Units RL L1 L2 Result
Oil & Grease (total) mg/L 2
< 2
Oil & Grease (animal/vegetable) mg/L 4 150 < 4
Oil & Grease (mineral/synthetic) mg/L 4 15 < 4
E. Coli cfu/100mL - 200 < 2↑
Nonylphenol mg/L 0.001 0.02 < 0.001
Nonylphenol Ethoxylates mg/L 0.01 0.2 < 0.01
Nonylphenol diethoxylate mg/L 0.01
< 0.01
Nonylphenol monoethoxylate mg/L 0.01
< 0.01

FINAL REPORT CA14255-MAR19 R1
Client: Toronto Inspection Ltd.
Project: 4986
Project Manager: Tabitha Lee
Samplers: Will Guo
6 / 22
PACKAGE: SANSEW - Other (ORP) (WATER)
L1 = SANSEW / WATER / - - Durham Table 1 - Sanitary Sewer Discharge - BL_43_2004
L2 = SANSEW / WATER / - - Durham Table 2 - Storm Sewer Discharge - BL_43_2004
Sample Number 8
Sample Name 19MW-7
Sample Matrix Ground Water
Sample Date 08/03/2019
Parameter
Other (ORP)
Units RL L1 L2 Result
PACKAGE: SANSEW - PCBs (WATER)
L1 = SANSEW / WATER / - - Durham Table 1 - Sanitary Sewer Discharge - BL_43_2004
L2 = SANSEW / WATER / - - Durham Table 2 - Storm Sewer Discharge - BL_43_2004
Sample Number 8
Sample Name 19MW-7
Sample Matrix Ground Water
Sample Date 08/03/2019
Parameter
PCBs
Units RL L1 L2 Result
PACKAGE: SANSEW - Phenols (WATER)
L1 = SANSEW / WATER / - - Durham Table 1 - Sanitary Sewer Discharge - BL_43_2004
L2 = SANSEW / WATER / - - Durham Table 2 - Storm Sewer Discharge - BL_43_2004
Sample Number 8
Sample Name 19MW-7
Sample Matrix Ground Water
Sample Date 08/03/2019
Parameter
Phenols
Units RL L1 L2 Result
4AAP-Phenolics mg/L 0.002 1 0.008 < 0.002
PACKAGE: SANSEW - SVOCs (WATER) Sample Number 8
Sample Name 19MW-7
L1 = SANSEW / WATER / - - Durham Table 1 - Sanitary Sewer Discharge - BL_43_2004
L2 = SANSEW / WATER / - - Durham Table 2 - Storm Sewer Discharge - BL_43_2004
Sample Matrix
Sample Date
Ground Water
08/03/2019
Parameter Units RL L1 L2 Result
pH no unit 0.05 10.5 9 8.15
Mercury (total) mg/L 0.00001 0.01 0.004 < 0.00001
Polychlorinated Biphenyls (PCBs) - Total mg/L 0.0001 0.001 0.0004 < 0.0001
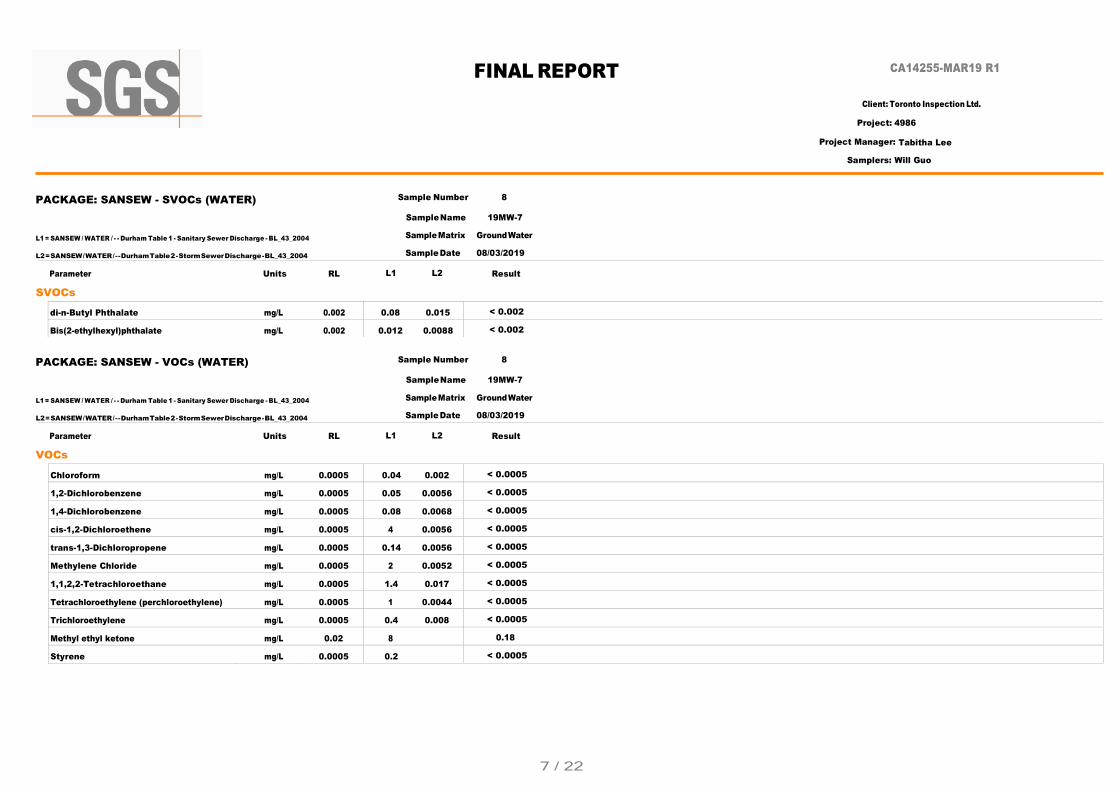
FINAL REPORT CA14255-MAR19 R1
Client: Toronto Inspection Ltd.
Project: 4986
Project Manager: Tabitha Lee
Samplers: Will Guo
7 / 22
PACKAGE: SANSEW - SVOCs (WATER)
L1 = SANSEW / WATER / - - Durham Table 1 - Sanitary Sewer Discharge - BL_43_2004
L2 = SANSEW / WATER / - - Durham Table 2 - Storm Sewer Discharge - BL_43_2004
Sample Number 8
Sample Name 19MW-7
Sample Matrix Ground Water
Sample Date 08/03/2019
Parameter
SVOCs
Units RL L1 L2 Result
PACKAGE: SANSEW - VOCs (WATER)
L1 = SANSEW / WATER / - - Durham Table 1 - Sanitary Sewer Discharge - BL_43_2004
L2 = SANSEW / WATER / - - Durham Table 2 - Storm Sewer Discharge - BL_43_2004
Sample Number 8
Sample Name 19MW-7
Sample Matrix Ground Water
Sample Date 08/03/2019
Parameter
VOCs
Units RL L1 L2 Result
Chloroform mg/L 0.0005 0.04 0.002 < 0.0005
1,2-Dichlorobenzene mg/L 0.0005 0.05 0.0056 < 0.0005
1,4-Dichlorobenzene mg/L 0.0005 0.08 0.0068 < 0.0005
cis-1,2-Dichloroethene mg/L 0.0005 4 0.0056 < 0.0005
trans-1,3-Dichloropropene mg/L 0.0005 0.14 0.0056 < 0.0005
Methylene Chloride mg/L 0.0005 2 0.0052 < 0.0005
1,1,2,2-Tetrachloroethane mg/L 0.0005 1.4 0.017 < 0.0005
Tetrachloroethylene (perchloroethylene) mg/L 0.0005 1 0.0044 < 0.0005
Trichloroethylene mg/L 0.0005 0.4 0.008 < 0.0005
Methyl ethyl ketone mg/L 0.02 8 0.18
Styrene mg/L 0.0005 0.2 < 0.0005
di-n-Butyl Phthalate mg/L 0.002 0.08 0.015 < 0.002
Bis(2-ethylhexyl)phthalate mg/L 0.002 0.012 0.0088 < 0.002

FINAL REPORT CA14255-MAR19 R1
Client: Toronto Inspection Ltd.
Project: 4986
Project Manager: Tabitha Lee
Samplers: Will Guo
8 / 22
PACKAGE: SANSEW - VOCs - BTEX (WATER)
L1 = SANSEW / WATER / - - Durham Table 1 - Sanitary Sewer Discharge - BL_43_2004
L2 = SANSEW / WATER / - - Durham Table 2 - Storm Sewer Discharge - BL_43_2004
Sample Number 8
Sample Name 19MW-7
Sample Matrix Ground Water
Sample Date 08/03/2019
Parameter
VOCs - BTEX
Units RL L1 L2 Result
Benzene mg/L 0.0005 0.01 0.002 < 0.0005
Ethylbenzene mg/L 0.0005 0.16 0.002 < 0.0005
Toluene mg/L 0.0005 0.27 0.002 < 0.0005
Xylene (total) mg/L 0.0005 1.4 0.0044 < 0.0005
m-p-xylene mg/L 0.0005
< 0.0005
o-xylene mg/L 0.0005
< 0.0005

9 / 22 20190318
EXCEEDANCE SUMMARY
FINAL REPORT CA14255-MAR19 R1
19MW-7
15
Parameter Method Units Result
SANSEW / WATER SANSEW / WATER
/ - - Durham Table / - - Durham Table
1 - Sanitary Sewer 2 - Storm Sewer
Discharge - Discharge -
BL_43_2004 BL_43_2004
L1 L2
Total Suspended Solids SM 2540D mg/L 46

FINAL REPORT CA14255-MAR19 R1
QC SUMMARY
10 / 22 20190318
Anions by discrete analyzer
Method: US EPA 375.4 | Internal ref.: ME-CA-[ENV]EWL-LAK-AN-026
Parameter QC batch
Reference
Units RL Method
Blank
Duplicate LCS/Spike Blank Matrix Spike / Ref.
RPD
AC
(%)
Spike
Recovery
(%)
Recovery Limits
(%)
Spike
Recovery
(%)
Recovery Limits
(%)
Low High Low High
Biochemical Oxygen Demand
Method: SM 5210 | Internal ref.: ME-CA-[ENV]EWL-LAK-AN-007
Parameter QC batch
Reference
Units RL Method
Blank
Duplicate LCS/Spike Blank Matrix Spike / Ref.
RPD
AC
(%)
Spike
Recovery
(%)
Recovery Limits
(%)
Spike
Recovery
(%)
Recovery Limits
(%)
Low High Low High
Cyanide by SFA
Method: SM 4500 | Internal ref.: ME-CA-[ENV]SFA-LAK-AN-005
Parameter QC batch
Reference
Units RL Method
Blank
Duplicate LCS/Spike Blank Matrix Spike / Ref.
RPD
AC
(%)
Spike
Recovery
(%)
Recovery Limits
(%)
Spike
Recovery
(%)
Recovery Limits
(%)
Low High Low High
Cyanide (total) SKA0081-MAR19 mg/L 0.01 <0.01 ND 10 93 90 110 90 75 125
Biochemical Oxygen Demand (BOD5) BOD0020-MAR19 mg/L 2 < 2 2 30 89 70 130 NV 70 130
Sulphate DIO0206-MAR19 mg/L 2 <2 9 20 103 80 120 96 75 125

FINAL REPORT CA14255-MAR19 R1
QC SUMMARY
11 / 22 20190318
Fluoride by Specific Ion Electrode
Method: SM 4500 | Internal ref.: ME-CA-[ENV]EWL-LAK-AN-014
Parameter QC batch
Reference
Units RL Method
Blank
Duplicate LCS/Spike Blank Matrix Spike / Ref.
RPD
AC
(%)
Spike
Recovery
(%)
Recovery Limits
(%)
Spike
Recovery
(%)
Recovery Limits
(%)
Low High Low High
Mercury by CVAAS
Method: EPA 7471A/SM 3112B | Internal ref.: ME-CA-[ENV]SPE-LAK-AN-004
Parameter QC batch
Reference
Units RL Method
Blank
Duplicate LCS/Spike Blank Matrix Spike / Ref.
RPD
AC
(%)
Spike
Recovery
(%)
Recovery Limits
(%)
Spike
Recovery
(%)
Recovery Limits
(%)
Low High Low High
Mercury (total) EHG0009-MAR19 mg/L 0.00001 < 0.00001 4 20 103 80 120 90 70 130
Fluoride EWL0175-MAR19 mg/L 0.06 <0.06 NV 10 102 90 110 100 75 125

FINAL REPORT CA14255-MAR19 R1
QC SUMMARY
12 / 22 20190318
Metals in aqueous samples - ICP-MS
Method: SM 3030/EPA 200.8 | Internal ref.: ME-CA-[ENV]SPE-LAK-AN-006
Parameter QC batch
Reference
Units RL Method
Blank
Duplicate LCS/Spike Blank Matrix Spike / Ref.
RPD
AC
(%)
Spike
Recovery
(%)
Recovery Limits
(%)
Spike
Recovery
(%)
Recovery Limits
(%)
Low High Low High
Silver (total) EMS0055-MAR19 mg/L 0.00005 <0.00005 ND 20 95 90 110 79 70 130
Aluminum (total) EMS0055-MAR19 mg/L 0.001 <0.001 ND 20 107 90 110 NV 70 130
Arsenic (total) EMS0055-MAR19 mg/L 0.0002 <0.0002 2 20 97 90 110 NV 70 130
Cadmium (total) EMS0055-MAR19 mg/L 0.000003 <0.000003 ND 20 96 90 110 78 70 130
Cobalt (total) EMS0055-MAR19 mg/L 0.000004 <0.000004 ND 20 99 90 110 NV 70 130
Chromium (total) EMS0055-MAR19 mg/L 0.00008 <0.00008 1 20 100 90 110 105 70 130
Copper (total) EMS0055-MAR19 mg/L 0.0002 <0.0002 4 20 99 90 110 NV 70 130
Manganese (total) EMS0055-MAR19 mg/L 0.00001 <0.00001 ND 20 103 90 110 NV 70 130
Molybdenum (total) EMS0055-MAR19 mg/L 0.00004 <0.00004 0 20 99 90 110 98 70 130
Nickel (total) EMS0055-MAR19 mg/L 0.0001 <0.0001 2 20 99 90 110 NV 70 130
Lead (total) EMS0055-MAR19 mg/L 0.00001 <0.00001 ND 20 94 90 110 102 70 130
Antimony (total) EMS0055-MAR19 mg/L 0.0009 <0.0009 ND 20 101 90 110 107 70 130
Selenium (total) EMS0055-MAR19 mg/L 0.00004 <0.00004 ND 20 98 90 110 106 70 130
Tin (total) EMS0055-MAR19 mg/L 0.00006 < 0.0006 ND 20 94 90 110 NV 70 130
Titanium (total) EMS0055-MAR19 mg/L 0.00005 <0.00005 ND 20 96 90 110 NV 70 130
Zinc (total) EMS0055-MAR19 mg/L 0.002 <0.002 ND 20 100 90 110 NV 70 130

FINAL REPORT CA14255-MAR19 R1
QC SUMMARY
13 / 22 20190318
Metals in aqueous samples - ICP-OES
Method: SM 3030/EPA 200.8 | Internal ref.: ME-CA-[ENV]SPE-LAK-AN-003
Parameter QC batch
Reference
Units RL Method
Blank
Duplicate LCS/Spike Blank Matrix Spike / Ref.
RPD
AC
(%)
Spike
Recovery
(%)
Recovery Limits
(%)
Spike
Recovery
(%)
Recovery Limits
(%)
Low High Low High
Microbiology
Method: SM 9222D | Internal ref.: ME-CA-[ENV]MIC-LAK-AN-006
Parameter QC batch
Reference
Units RL Method
Blank
Duplicate LCS/Spike Blank Matrix Spike / Ref.
RPD
AC
(%)
Spike
Recovery
(%)
Recovery Limits
(%)
Spike
Recovery
(%)
Recovery Limits
(%)
Low High Low High
E. Coli BAC9170-MAR19 cfu/100mL - ACCEPTED ACCEPTE
D
Phosphorus (total) EMS0055-MAR19 mg/L 0.003 <0.003 ND 20 95 90 110 NV 70 130

FINAL REPORT CA14255-MAR19 R1
QC SUMMARY
14 / 22 20190318
Nonylphenol and Ethoxylates
Method: ASTM D7065-06 | Internal ref.: ME-CA-[ENV]GC-LAK-AN-015
Parameter QC batch
Reference
Units RL Method
Blank
Duplicate LCS/Spike Blank Matrix Spike / Ref.
RPD
AC
(%)
Spike
Recovery
(%)
Recovery Limits
(%)
Spike
Recovery
(%)
Recovery Limits
(%)
Low High Low High
Nonylphenol diethoxylate GCM0186-MAR19 mg/L 0.01 < 0.01 77 55 120
Nonylphenol Ethoxylates GCM0186-MAR19 mg/L 0.01 < 0.01
Nonylphenol monoethoxylate GCM0186-MAR19 mg/L 0.01 < 0.01 86 55 120
Nonylphenol GCM0186-MAR19 mg/L 0.001 < 0.001 83 55 120
Oil & Grease
Method: MOE E3401 | Internal ref.: ME-CA-[ENV]GC-LAK-AN-019
Parameter QC batch
Reference
Units RL Method
Blank
Duplicate LCS/Spike Blank Matrix Spike / Ref.
RPD
AC
(%)
Spike
Recovery
(%)
Recovery Limits
(%)
Spike
Recovery
(%)
Recovery Limits
(%)
Low High Low High
Oil & Grease (total) GCM0185-MAR19 mg/L 2 <2 107 75 125

FINAL REPORT CA14255-MAR19 R1
QC SUMMARY
15 / 22 20190318
Oil & Grease-AV/MS
Method: MOE E3401/SM 5520F | Internal ref.: ME-CA-[ENV]GC-LAK-AN-019
Parameter QC batch
Reference
Units RL Method
Blank
Duplicate LCS/Spike Blank Matrix Spike / Ref.
RPD
AC
(%)
Spike
Recovery
(%)
Recovery Limits
(%)
Spike
Recovery
(%)
Recovery Limits
(%)
Low High Low High
Oil & Grease (animal/vegetable) GCM0185-MAR19 mg/L 4 < 4 NA 70 130
Oil & Grease (mineral/synthetic) GCM0185-MAR19 mg/L 4 < 4 NA 70 130
pH
Method: SM 4500 | Internal ref.: ME-CA-[ENV]EWL-LAK-AN-006
Parameter QC batch
Reference
Units RL Method
Blank
Duplicate LCS/Spike Blank Matrix Spike / Ref.
RPD
AC
(%)
Spike
Recovery
(%)
Recovery Limits
(%)
Spike
Recovery
(%)
Recovery Limits
(%)
Low High Low High
Phenols by SFA
Method: SM 5530B-D | Internal ref.: ME-CA-[ENV]SFA-LAK-AN-006
Parameter QC batch
Reference
Units RL Method
Blank
Duplicate LCS/Spike Blank Matrix Spike / Ref.
RPD
AC
(%)
Spike
Recovery
(%)
Recovery Limits
(%)
Spike
Recovery
(%)
Recovery Limits
(%)
Low High Low High
4AAP-Phenolics SKA0078-MAR19 mg/L 0.002 <0.002 ND 10 104 90 110 102 75 125
pH EWL0177-MAR19 no unit 0.05 NA 0 101 NA

FINAL REPORT CA14255-MAR19 R1
QC SUMMARY
16 / 22 20190318
Polychlorinated Biphenyls
Method: MOE E3400/EPA 8082A | Internal ref.: ME-CA-[ENV]GC-LAK-AN-001
Parameter QC batch
Reference
Units RL Method
Blank
Duplicate LCS/Spike Blank Matrix Spike / Ref.
RPD
AC
(%)
Spike
Recovery
(%)
Recovery Limits
(%)
Spike
Recovery
(%)
Recovery Limits
(%)
Low High Low High
Semi-Volatile Organics
Method: EPA 3510C/8270D | Internal ref.: ME-CA-[ENV]GC-LAK-AN-005
Parameter QC batch
Reference
Units RL Method
Blank
Duplicate LCS/Spike Blank Matrix Spike / Ref.
RPD
AC
(%)
Spike
Recovery
(%)
Recovery Limits
(%)
Spike
Recovery
(%)
Recovery Limits
(%)
Low High Low High
Bis(2-ethylhexyl)phthalate GCM0145-MAR19 mg/L 0.002 < 0.002 NSS 30 106 50 140 NSS 50 140
di-n-Butyl Phthalate GCM0145-MAR19 mg/L 0.002 < 0.002 NSS 30 103 50 140 NSS 50 140
Polychlorinated Biphenyls (PCBs) -
Total
GCM0155-MAR19 mg/L 0.0001 <0.0001 ND 30 107 60 140 94 60 140

FINAL REPORT CA14255-MAR19 R1
QC SUMMARY
17 / 22 20190318
Suspended Solids
Method: SM 2540D | Internal ref.: ME-CA-[ENV]EWL-LAK-AN-004
Parameter QC batch
Reference
Units RL Method
Blank
Duplicate LCS/Spike Blank Matrix Spike / Ref.
RPD
AC
(%)
Spike
Recovery
(%)
Recovery Limits
(%)
Spike
Recovery
(%)
Recovery Limits
(%)
Low High Low High
Total Nitrogen
Method: SM 4500-N C/4500-NO3- F | Internal ref.: ME-CA-[ENV]SFA-LAK-AN-002
Parameter QC batch
Reference
Units RL Method
Blank
Duplicate LCS/Spike Blank Matrix Spike / Ref.
RPD
AC
(%)
Spike
Recovery
(%)
Recovery Limits
(%)
Spike
Recovery
(%)
Recovery Limits
(%)
Low High Low High
Total Kjeldahl Nitrogen SKA0085-MAR19 as N mg/L 0.5 <0.5 9 10 99 90 110 98 75 125
Total Suspended Solids EWL0172-MAR19 mg/L 2 < 2 0 10 NV 90 110 NA

FINAL REPORT CA14255-MAR19 R1
QC SUMMARY
18 / 22 20190318
Volatile Organics
Method: EPA 5030B/8260C | Internal ref.: ME-CA-[ENV]GC-LAK-AN-004
Parameter QC batch
Reference
Units RL Method
Blank
Duplicate LCS/Spike Blank Matrix Spike / Ref.
RPD
AC
(%)
Spike
Recovery
(%)
Recovery Limits
(%)
Spike
Recovery
(%)
Recovery Limits
(%)
Low High Low High
1,1,2,2-Tetrachloroethane GCM0146-MAR19 mg/L 0.0005 <0.0005 ND 30 99 60 130 98 50 140
1,2-Dichlorobenzene GCM0146-MAR19 mg/L 0.0005 <0.0005 ND 30 98 60 130 98 50 140
1,4-Dichlorobenzene GCM0146-MAR19 mg/L 0.0005 <0.0005 ND 30 97 60 130 97 50 140
Benzene GCM0146-MAR19 mg/L 0.0005 <0.0005 ND 30 97 60 130 101 50 140
Chloroform GCM0146-MAR19 mg/L 0.0005 <0.0005 ND 30 98 60 130 99 50 140
cis-1,2-Dichloroethene GCM0146-MAR19 mg/L 0.0005 <0.0005 ND 30 96 60 130 100 50 140
Ethylbenzene GCM0146-MAR19 mg/L 0.0005 <0.0005 ND 30 100 60 130 100 50 140
m-p-xylene GCM0146-MAR19 mg/L 0.0005 <0.0005 ND 30 101 60 130 102 50 140
Methyl ethyl ketone GCM0146-MAR19 mg/L 0.02 <0.02 ND 30 101 50 140 99 50 140
Methylene Chloride GCM0146-MAR19 mg/L 0.0005 <0.0005 ND 30 96 60 130 98 50 140
o-xylene GCM0146-MAR19 mg/L 0.0005 <0.0005 ND 30 100 60 130 100 50 140
Styrene GCM0146-MAR19 mg/L 0.0005 <0.0005 ND 30 101 60 130 101 50 140
Tetrachloroethylene GCM0146-MAR19 mg/L 0.0005 <0.0005 ND 30 95 60 130 96 50 140
(perchloroethylene)
Toluene
GCM0146-MAR19
mg/L
0.0005
<0.0005
ND
30
98
60
130
98
50
140
trans-1,3-Dichloropropene GCM0146-MAR19 mg/L 0.0005 <0.0005 ND 30 99 60 130 95 50 140
Trichloroethylene GCM0146-MAR19 mg/L 0.0005 <0.0005 ND 30 96 60 130 96 50 140

FINAL REPORT CA14255-MAR19 R1
QC SUMMARY
19 / 22 20190318
Method Blank: a blank matrix that is carried through the entire analytical procedure. Used to assess laboratory contamination.
Duplicate: Paired analysis of a separate portion of the same sample that is carried through the entire analytical procedure. Used to evaluate measurement precision.
LCS/Spike Blank: Laboratory control sample or spike blank refer to a blank matrix to which a known amount of analyte has been added. Used to evaluate analyte recovery and laboratory accuracy without sample matrix effects.
Matrix Spike: A sample to which a known amount of the analyte of interest has been added. Used to evaluate laboratory accuracy with sample matrix effects.
Reference Material: a material or substance matrix matched to the samples that contains a known amount of the analyte of interest. A reference material may be used in place of a matrix spike.
RL: Reporting limit
RPD: Relative percent difference
AC: Acceptance criteria
Multielement Scan Qualifier: as the number of analytes in a scan increases, so does the chance of a limit exceedance by random chance as opposed to a real method problem. Thus, in multielement scans, for the LCS and matrix spike, up to 10% of the
analytes may exceed the quoted limits by up to 10% absolute and the spike is considered acceptable.
Duplicate Qualifier: for duplicates as the measured result approaches the RL, the uncertainty associated with the value increases dramatically, thus duplicate acceptance limits apply only where the average of the two duplicates is greater than five times the RL.
Matrix Spike Qualifier: for matrix spikes, as the concentration of the native analyte increases, the uncertainty of the matrix spike recovery increases. Thus, the matrix spike acceptance limits apply only when the concentration of the matrix spike is greater than or
equal to the concentration of the native analyte.

20 / 22 20190318
NSS Insufficient sample for analysis.
RL Reporting Limit.
↑ Reporting limit raised.
↓ Reporting limit lowered.
NA The sample was not analysed for this analyte
ND Non Detect
LEGEND
FINAL REPORT CA14255-MAR19 R1
FOOTNOTES
Samples analysed as received. Solid samples expressed on a dry weight basis. “Temperature Upon Receipt” is representative of the whole shipment and may not reflect the
temperature of individual samples.
Analysis conducted on samples submitted pursuant to or as part of Reg. 153/04, are in accordance to the Protocol for Analytical Methods Used in the Assessment of Properties
under Part XV.1 of the Environmental Protection Act” published by the Ministry and dated March 9, 2004 as amended.
SGS provides criteria information (such as regulatory or guideline limits and summary of limit exceedances) as a service. Every attempt is made to ensure the criteria information
in this report is accurate and current, however, it is not guaranteed. Comparison to the most current criteria is the responsibility of the client and SGS assumes no responsibility for
the accuracy of the criteria levels indicated. This document is issued, on the Client's behalf, by the Company under its General Conditions of Service available on request and
accessible at http://www.sgs.com/terms_and_conditions.htm. The Client's attention is drawn to the limitation of liability, indemnification and jurisdiction issues defined therein. Any
other holder of this document is advised that information contained hereon reflects the Company's findings at the time of its intervention only and within the limits of Client's
instructions, if any. The Company's sole responsibility is to its Client and this document does not exonerate parties to a transaction from exercising all their rights and obligations
under the transaction documents.
This report must not be reproduced, except in full. This report supersedes all previous versions.
-- End of Analytical Report --

21 / 22

22 / 22

Toronto Inspection Ltd.
APPENDIX E
Dewatering Analysis
Hydrogeological Investigation – R02 603-643, 645-699 Kingston Road, Pickering, ON

Dewatering Calculations at: 603-643, 645 and 699 Kingston Road, Pickering, ON - Podium 1
Equivalent Well Radius (Equivalent Perimeter Approximation of Rectangular Excavation):
𝑎 + 𝑏 𝑟𝑠 =
𝜋
4986-19-HD
Add dewatering plan
𝑄 = ln( 𝑅 /𝑟 )
+ 2 2𝐿
𝜋𝐾(𝐻2 − ℎ2) 𝑥𝐾(𝐻2 − ℎ2)
02 𝑠
Where:
r s = Equivalent well radius (m)
a = Length of excavation (m)
b = Width of excavation (m)
Radius of Influence Formula (Bear, 1979):
Where:
R 01 = Radius of Influence (m), beyond which there is negligible drawdown
H = Distance from initial static water level to bottom of saturated aquifer (m)
K = Hydraulic conductivity (m/s)
S y = Specific yield of the aquifer formation [-]
t = Time (s) required to draw the static groundwater level to the desired level (assumed to be equivalent to 14 days)
Dewatering Rate Formula for a Rectangular Excavation in Unconfined Aquifer (Powers et al., 2007):
Where:
Q = Anticipated pumping rate (m3/day)
K = Hydraulic Conductivity (m/day)
H = Distance from initial static water level to bottom of the saturated aquifer (m)
h = Depth of water in the well while pumping (m)
R 02 = Radius of Influence (m) from excavation, beyond which there is negligible drawdown. Equivalent to R01 plus rs.
r s = Equivalent well radius (m)
x = Trench Length (m)
L = Distance from a line source to the trench, equivalent to R02 (m)
Incident Precipitation
Design Event = 10 mm in 24-hours
Area = 5,950 m2
Volume = 59.500 m3/day
59,500 L/day
* 10 mm/24-hr = 80th Percentile Accumulation
Summary Simplified Dewatering Schematic (not to scale)
Summary
Short-Term Pumping Rate Q
Long-Term
Pumping Rate
Q
m3/day L/day L/s L/day
Groundwater 28.771 28,771 0.33 9,590
Precipitation 59.500 59,500 0.69 -
Total 88.271 88,271 1.02 9,590
Notes:
1. Considering a groundwater factor of safety of: 2
2. Long-term pumping rate approximately 1/3rd short-term rate.
(Johnson, 1967)
Dewatering Layout
R = 2.45 t 𝐻𝐾
01 𝑆 𝑦
Parameter Value Units
rs 66 m
a 170 m
b 35 m
Parameter Value Units
R01 6 m
H 12 m
K 6.0E-08 m/s
Sy 0.20 [-]
t 1,209,600 s
Parameter Value Units
Q 14.386 m3/day
0.167 L/s
K 5.2E-03 m/day
H 12 m
h 9 m
R01 + rs 72 m
rs 66 m
x 170 m
L 72 m

Dewatering Calculations at: 603-643, 645 and 699 Kingston Road, Pickering, ON - Podium 4
Equivalent Well Radius (Equivalent Perimeter Approximation of Rectangular Excavation):
𝑎 + 𝑏 𝑟𝑠 =
𝜋
4986-19-HD
Add dewatering plan
𝑄 = ln( 𝑅 /𝑟 )
+ 2 2𝐿
𝜋𝐾(𝐻2 − ℎ2) 𝑥𝐾(𝐻2 − ℎ2)
02 𝑠
Where:
r s = Equivalent well radius (m)
a = Length of excavation (m)
b = Width of excavation (m)
Radius of Influence Formula (Bear, 1979):
Where:
R 01 = Radius of Influence (m), beyond which there is negligible drawdown
H = Distance from initial static water level to bottom of saturated aquifer (m)
K = Hydraulic conductivity (m/s)
S y = Specific yield of the aquifer formation [-]
t = Time (s) required to draw the static groundwater level to the desired level (assumed to be equivalent to 14 days)
Dewatering Rate Formula for a Rectangular Excavation in Unconfined Aquifer (Powers et al., 2007):
Where:
Q = Anticipated pumping rate (m3/day)
K = Hydraulic Conductivity (m/day)
H = Distance from initial static water level to bottom of the saturated aquifer (m)
h = Depth of water in the well while pumping (m)
R 02 = Radius of Influence (m) from excavation, beyond which there is negligible drawdown. Equivalent to R01 plus rs.
r s = Equivalent well radius (m)
x = Trench Length (m)
L = Distance from a line source to the trench, equivalent to R02 (m)
Incident Precipitation
Design Event = 10 mm in 24-hours
Area = 4,305 m2
Volume = 43.050 m3/day
43,050 L/day
* 10 mm/24-hr = 80th Percentile Accumulation
Summary Simplified Dewatering Schematic (not to scale)
Summary
Short-Term Pumping Rate Q
Long-Term
Pumping Rate
Q
m3/day L/day L/s L/day
Groundwater 569.298 569,298 6.59 189,766
Precipitation 43.050 43,050 0.50 -
Total 612.348 612,348 7.09 189,766
Notes:
1. Considering a groundwater factor of safety of: 2
2. Long-term pumping rate approximately 1/3rd short-term rate.
(Johnson, 1967)
Dewatering Layout
R = 2.45 t 𝐻𝐾
01 𝑆 𝑦
Parameter Value Units
rs 51 m
a 123 m
b 35 m
Parameter Value Units
R01 45 m
H 14 m
K 5.0E-06 m/s
Sy 0.25 [-]
t 1,209,600 s
Parameter Value Units
Q 284.649 m3/day
3.295 L/s
K 4.3E-01 m/day
H 14 m
h 9 m
R01 + rs 96 m
rs 51 m
x 123 m
L 96 m

Dewatering Calculations at: 603-643, 645 and 699 Kingston Road, Pickering, ON - Block 1, Block 2, Tower 4
Equivalent Well Radius (Equivalent Perimeter Approximation of Rectangular Excavation):
𝑎 + 𝑏 𝑟𝑠 =
𝜋
4986-19-HD
Add dewatering plan
𝜋𝐾(𝐻2 − ℎ2) 𝑄 =
ln(𝑅02/𝑟𝑠)
Where:
r s = Equivalent well radius (m)
a = Length of excavation (m)
b = Width of excavation (m)
Radius of Influence Formula (Bear, 1979):
Where:
R 01 = Radius of Influence (m), beyond which there is negligible drawdown
H = Distance from initial static water level to bottom of saturated aquifer (m)
K = Hydraulic conductivity (m/s)
S y = Specific yield of the aquifer formation [-]
t = Time (s) required to draw the static groundwater level to the desired level (assumed to be equivalent to 14 days)
Dewatering Rate Formula for an Excavation in Unconfined Aquifer (Powers et al., 2007):
Where:
Q = Anticipated pumping rate (m3/day)
K = Hydraulic Conductivity (m/day)
H = Distance from initial static water level to bottom of the saturated aquifer (m)
h = Depth of water in the well while pumping (m)
R 02 = Radius of Influence (m) from excavation, beyond which there is negligible drawdown. Equivalent to R01 plus rs.
r s = Equivalent well radius (m)
Incident Precipitation
Design Event = 10 mm in 24-hours
Area = 9,000 m2
Volume = 90.000 m3/day
90,000 L/day
* 10 mm/24-hr = 80th Percentile Accumulation
Summary Simplified Dewatering Schematic
Summary
Short-Term Pumping Rate Q
Long-Term
Pumping Rate
Q
m3/day L/day L/s L/day
Groundwater 27.408 27,408 0.32 9,136
Precipitation 90.000 90,000 1.04 -
Total 117.408 117,408 1.36 9,136
Notes:
1. Considering a groundwater factor of safety of: 2
2. Long-term pumping rate approximately 1/3rd short-term rate.
(Johnson, 1967)
Dewatering Layout
R = 2.45 t 𝐻𝐾
01 𝑆 𝑦
Parameter Value Units
rs 67 m
a 150 m
b 60 m
Parameter Value Units
R01 5 m
H 9 m
K 6.0E-08 m/s
Sy 0.20 [-]
t 1,209,600 s
Parameter Value Units
Q 13.704 m3/day
0.159 L/s
K 5.2E-03 m/day
H 9 m
h 4 m
R01 + rs 72 m
rs 67 m

Dewatering Calculations at: 603-643, 645 and 699 Kingston Road, Pickering, ON - Block 3, Block 4, Tower 5, and Tower 8
Equivalent Well Radius (Equivalent Perimeter Approximation of Rectangular Excavation):
𝑎 + 𝑏 𝑟𝑠 =
𝜋
4986-19-HD
Add dewatering plan
𝑄 = ln( 𝑅 /𝑟 )
+ 2 2𝐿
𝜋𝐾(𝐻2 − ℎ2) 𝑥𝐾(𝐻2 − ℎ2)
02 𝑠
Where:
r s = Equivalent well radius (m)
a = Length of excavation (m)
b = Width of excavation (m)
Radius of Influence Formula (Bear, 1979):
Where:
R 01 = Radius of Influence (m), beyond which there is negligible drawdown
H = Distance from initial static water level to bottom of saturated aquifer (m)
K = Hydraulic conductivity (m/s)
S y = Specific yield of the aquifer formation [-]
t = Time (s) required to draw the static groundwater level to the desired level (assumed to be equivalent to 14 days)
Dewatering Rate Formula for a Rectangular Excavation in Unconfined Aquifer (Powers et al., 2007):
Where:
Q = Anticipated pumping rate (m3/day)
K = Hydraulic Conductivity (m/day)
H = Distance from initial static water level to bottom of the saturated aquifer (m)
h = Depth of water in the well while pumping (m)
R 02 = Radius of Influence (m) from excavation, beyond which there is negligible drawdown. Equivalent to R01 plus rs.
r s = Equivalent well radius (m)
x = Trench Length (m)
L = Distance from a line source to the trench, equivalent to R02 (m)
Incident Precipitation
Design Event = 10 mm in 24-hours
Area = 14,030 m2
Volume = 140.300 m3/day
140,300 L/day
* 10 mm/24-hr = 80th Percentile Accumulation
Summary Simplified Dewatering Schematic (not to scale)
Summary
Short-Term Pumping Rate Q
Long-Term
Pumping Rate
Q
m3/day L/day L/s L/day
Groundwater 43.416 43,416 0.50 14,472
Precipitation 140.300 140,300 1.62 -
Total 183.716 183,716 2.13 14,472
Notes:
1. Considering a groundwater factor of safety of: 2
2. Long-term pumping rate approximately 1/3rd short-term rate.
(Johnson, 1967)
Dewatering Layout
R = 2.45 t 𝐻𝐾
01 𝑆 𝑦
Parameter Value Units
rs 93 m
a 230 m
b 61 m
Parameter Value Units
R01 5 m
H 9 m
K 6.0E-08 m/s
Sy 0.20 [-]
t 1,209,600 s
Parameter Value Units
Q 21.708 m3/day
0.251 L/s
K 5.2E-03 m/day
H 9 m
h 4 m
R01 + rs 98 m
rs 93 m
x 230 m
L 98 m

Toronto Inspection Ltd.
APPENDIX F
MECP Water Well Records
Hydrogeological Investigation – R02 603-643, 645-699 Kingston Road, Pickering, ON

Page 1 of 6
TOWNSHIP CON LOT UTM DATE CNTR CASING DIA WATER PUMP TEST WELL USE SCREEN WELL FORMATION
PICKERING TOWN 17 650678 2011-04 7241 2 MT 0008 5 7162828 BRWN FILL 0004 GREY SILT TILL WBRG 0008 GREY SILT DNSE
4852481 W (Z132057) 0013
A111513
PICKERING TOWN 17 651536 2012-05 7241 2.04 MT 0010 10 7183708 BRWN LOAM ----- LOOS 0001 BRWN SILT CLAY DNSE 0010 GREY
4852845 W (Z150892) SILT CLAY DNSE 0020
A131170
PICKERING TOWN 17 650674 2011-07 7241 MT 7168012
4852462 W (Z136726)
A111514 A
PICKERING TOWN 17 650665 2011-07 7241 MT 7168011
4852459 W (Z136725)
A111513 A
PICKERING TOWN 17 650664 2011-07 7241 MT 7168010
4852473 W (Z136724)
A111512 A
PICKERING TOWN 17 650945 2011-07 7241 2 0005 10 7166731 BLCK 0000 BRWN SAND GRVL LOOS 0001 BRWN SILT SAND
4852828 W (Z134953) LOOS 0012 GREY SILT SAND LOOS 0015
A120954
PICKERING TOWN 17 650935 2011-07 7241 2 MT 0010 10 7166730 BLCK 0000 BRWN SAND GRVL LOOS 0001 BRWN SILT SAND
4852797 W (Z134954) LOOS 0012 GREY SILT SAND LOOS 0020
A120953
PICKERING TOWN 17 650955 2011-07 7241 2 MT 0008 10 7166729 BLCK 0000 BRWN SAND GRVL LOOS 0001 BRWN SILT SAND
4852775 W (Z134952) LOOS 0010 GREY SILT SAND LOOS 0018
A120952
PICKERING TOWN 17 651656 2012-05 7241 2.04 MT 0010 10 7183709 BRWN LOAM ----- LOOS 0001 BRWN SILT SAND DNSE 0010 GREY
4852833 W (Z150891) SILT SAND DNSE 0020
A131171
PICKERING TOWN 17 650685 2011-04 7241 2 MT 0008 5 7162829 BRWN FILL 0004 GREY SILT TILL WBRG 0008 GREY SILT DNSE
4852485 W (Z132056) 0013
A111514
PICKERING TOWN 17 650986 2007-04 7215 0.79 7044062
4852936 W (Z70361)
A041768
PICKERING TOWN 17 650683 2011-04 7241 2 MT 0008 5 7162827 BRWN FILL 0004 GREY SILT TILL WBRG 0008 GREY SILT DNSE
4852494 W (Z132058) 0013
A111512
PICKERING TOWN 17 651565 2009-05 6607 2.00 MO 7125150 BRWN SILT SAND PCKD 0002 BRWN SILT TILL HARD 0007 GREY
4853343 W (M05150) SILT TILL HARD 0013 A082740
Water Well Records May 28, 2019
3:06:26 PM

TOWNSHIP CON LOT UTM DATE CNTR CASING DIA WATER PUMP TEST WELL USE SCREEN WELL FORMATION
Page 2 of 6
PICKERING TOWN 17 651543 2009-03 7241 1.5 MT 0008 10 7122456 BRWN 0001 BRWN SILT CLAY DNSE 0014 GREY SILT CLAY DNSE
4853487 W (Z93173) 0018
A081890
PICKERING TOWN 17 650971 2007-04 7215 0.79 7044063
4852926 W (Z70360)
A055063
PICKERING TOWN 17 651443 2017-01 7383 2 MO 0010 10 7288920 SNDY TILL 0020
4853606 W (Z257467)
A211867
PICKERING TOWN 17 651869 2007-02 6607 2.00 NU 0005 15 7041862 BRWN SAND GRVL 0020
4852506 W (Z64678)
A049110
PICKERING TOWN 17 650854 2006-07 6032 1.97 NU 0005 10 1918446 BRWN SAND GRVL 0006 GREY CLAY SLTY GRVL 0010 GREY TILL
4852808 W (Z05119) 0015
A005430
PICKERING TOWN 17 650967 2011-07 7241 2 MT 0010 10 7166728 BLCK 0000 BRWN SAND GRVL LOOS 0001 BRWN SILT SAND
4852770 W (Z136822) LOOS 0012 GREY SILT SAND LOOS 0020
A120951
PICKERING TOWN 17 651544 2015-11 7241 2 MT 0005 10 7253328 BRWN FILL GRVL LOOS 0005 BRWN SILT SAND DNSE 0010 GREY
4852840 W (Z219332) SILT SAND DNSE 0015
A180381
PICKERING TOWN 17 651854 2016-11 7230 7283297
4853712 W (C36623)
A217100 P
PICKERING TOWN 17 652010 2015-11 7247 2 MT 0030 10 7265423 BRWN SAND CLAY LOOS 0007 BRWN SILT CLAY DNSE 0013 GREY
4853977 W (Z226651) SAND CLAY DNSE 0026 GREY CLAY FSND HARD 0042
A179566
PICKERING TOWN 17 652384 2016-04 7147 7263265
4854148 W (C32467)
A198593 P
PICKERING TOWN 17 651509 2016-01 6032 1.79 MO 0015 10 7262371 BRWN FILL LOOS 0003 BRWN SILT SAND 0025
4853534 W (Z183676)
A194335
PICKERING TOWN 17 652383 2016-03 4102 7260538
4852829 W (Z213890) A
PICKERING TOWN 17 651531 2012-10 7241 2 MO 0010 10 7190980 BRWN FILL 0005 BRWN TILL SILT HARD 0010 GREY TILL HARD
4853635 W (Z160697) 0020
A109671
PICKERING TOWN 17 651438 2017-01 7383 2 MO 0010 10 7288919 SNDY TILL 0020
4853616 W (Z257468)
A211866

TOWNSHIP CON LOT UTM DATE CNTR CASING DIA WATER PUMP TEST WELL USE SCREEN WELL FORMATION
Page 3 of 6
PICKERING TOWN 17 651494 2014-09 7241 2.04 MT 0015 10 7228398 BRWN FILL GRVL LOOS 0005 BRWN TILL SAND DNSE 0010 BRWN 4853615 W (Z195962) SAND SILT DNSE 0015 GREY SAND SAND DNSE 0020 GREY SAND A164767 TILL DNSE 0025
PICKERING TOWN 17 651478 2014-09 7241 2.04 MT 0015 10 7228397 BRWN FILL GRVL LOOS 0005 BRWN TILL SAND DNSE 0010 BRWN 4853604 W (Z195695) SAND SILT DNSE 0015 GREY SAND SAND DNSE 0020 GREY SAND A164762 TILL DNSE 0025
PICKERING TOWN 17 650854 2006-11 6032 NU 7041285 0015 4852808 W (Z46585)
A005430 A
PICKERING TOWN 17 651493 2012-10 7241 2 MO 0010 10 7190982 BRWN FILL 0005 BRWN TILL SILT HARD 0010 GREY TILL HARD 4853732 W (Z160699) 0020 A123787
PICKERING TOWN 17 651590 2012-10 7241 2 MO 0010 10 7190981 BRWN FILL 0001 BRWN TILL SILT HARD 0006 GREY TILL HARD 4853660 W (Z160698) 0020 A109687
PICKERING TOWN 17 651547 2015-11 7241 2 MT 0005 10 7253330 BRWN FILL GRVL LOOS 0005 BRWN SAND SILT DNSE 0010 GREY 4852865 W (Z219334) SILT SAND DNSE 0015 A156245
PICKERING TOWN 02 440 17 651361 4853532 W
2006-10 1413 5.5 10///: 1918489 (Z53348) A
PICKERING TOWN 028 17 651846 4853697 W
2005-08 6946 5 1917749 (Z10103) A
PICKERING TOWN CON 01 027
17 652055 4854073 W
1970-06 0001 48 FR 0042 6///: NU 4605199 () OBDN 0044
PICKERING TOWN CON 01 028
17 651488 4854071 W
1964-11 5420 5 4601228 () A PRDG 0047 GRVL CLAY STNS 0085 BRWN SHLE 0171
PICKERING TOWN CON 01 028
17 651465 4854175 W
1964-11 5420 5 4601229 () A CLAY STNS 0027 MSND CLAY 0030 GRVL CLAY STNS 0055 GRVL CLAY 0060 BLUE CLAY MSND 0083 BRWN SHLE 0087
PICKERING TOWN CON 01 028
17 651446 4854047 W
1964-11 5420 5 4601226 () A GRVL CLAY STNS 0069
PICKERING TOWN CON 01 028
17 651572 4853540 W
1994-11 5459 CO 1912210 (141557) A
GREY CLAY SAND STNS 0017 GREY SAND GRVL SILT 0037 GREY LMSN
PICKERING TOWN CON 01 028
17 651574 4853540 W
1994-11 5459 6 FR 0022 20/23/30/1:0 CO 0029 2 1912209 (141554)
GREY CLAY SAND STNS 0017 GREY SAND GRVL SILT 0022 BLCK CSND 0037 GREY LMSN 0037
PICKERING TOWN CON 01 028
17 651573 4853540 W
1994-11 5459 6 FR 0022 12/16/30/1:0 CO 0025 3 1912207 (141552)
GREY CLAY SAND STNS 0017 GREY SAND GRVL SILT 0022 BLCK SAND LOOS 0037 GREY LMSN 0037
PICKERING TOWN CON 01 028
17 651571 4853540 W
1994-11 5459 6 FR 0021 12/15/30/1:0 CO 0026 12 1912208 (141555)
GREY CLAY SAND 0018 GREY SAND STNS SILT 0021 BLCK SAND LOOS 0038 GREY LMSN
PICKERING TOWN CON 01 029
17 651075 4853923 W
1974-11 2218 30 FR 0010 9/20/6/1:0 DO 4606113 () BLCK LOAM 0001 BLUE CLAY 0010 GRVL 0012 BLUE CLAY 0023

TOWNSHIP CON LOT UTM DATE CNTR CASING DIA WATER PUMP TEST WELL USE SCREEN WELL FORMATION
Page 4 of 6
PICKERING TOWN CON 01 030
17 650582 4853818 W
1958-09 2516 5 FR 0079 22/37/5/1:0 DO 0077 2 4601234 () CLAY 0079
PICKERING TOWN CON 01 030
17 650513 4854047 W
1964-02 5420 34 FR 0018 10///: DO 4601232 () LOAM 0001 BRWN CLAY STNS 0012 BLUE CLAY STNS 0029
PICKERING TOWN CON 01 031
17 650426 4854159 W
1995-05 5459 NU 1912418 (141601) A
PICKERING TOWN CON 01 031
17 650516 4853801 W
2009-12 1663 36 8///: NU 7140475 (Z94137) A
BRWN 0005 0006 BRWN 0014 0016
PICKERING TOWN RANGE 01 027
17 651778 4853826 W
2005-12 4102 1918302 (Z36198) A
PICKERING TOWN RANGE 03 027
17 652169 4853901 W
2006-09 6032 0.20 NU 0030 10 1918449 (Z46512) A005442
BRWN SAND SILT CLAY 0044
PICKERING TOWN RANGE 03 027
17 652376 4852785 W
1963-11 2610 30 FR 0034 29//0/24:0 DO 4601896 () BRWN CLAY 0017 GREY CLAY 0034 CSND 0037
PICKERING TOWN RANGE 03 028
17 651731 4853724 W
1963-05 5412 30 FR 0057 48///: DO 4601907 () BRWN CLAY 0008 BLUE CLAY STNS 0024 BLUE CLAY 0057 SHLE 0058
PICKERING TOWN RANGE 03 028
17 652094 4852775 W
1954-01 3421 4 FR 0093 63///: 4601906 () A BRWN CLAY BLDR 0023 BLDR STNS 0060 BLUE CLAY 0093 BLCK SHLE 0123
PICKERING TOWN RANGE 03 028
17 651718 4853927 W
1955-11 3512 6 FR 0063 30/51/1/: DO 4601905 () BLUE CLAY STNS 0062 BLCK SLTE 0100
PICKERING TOWN RANGE 03 028
17 651747 4853940 W
1958-10 2516 5 FR 0080 46/80/1/1:0 DO 4601904 () LOAM 0005 GREY CLAY 0070 BRWN SLTE 0080
PICKERING TOWN RANGE 03 029
17 651541 4852865 W
2015-11 7241 0.79 MT 0033 33 7253329 (Z219331) A181297
BRWN FILL GRVL LOOS 0007 BRWN SILT SAND DNSE 0033 GREY SILT SAND DNSE 0066
PICKERING TOWN RANGE 03 029
17 651495 4853563 W
1969-09 5420 34 FR 0018 14/14/10/2:0 DO 4604328 () LOAM 0001 BRWN CLAY STNS 0012 BLUE CLAY STNS 0018 GREY GRVL CSND 0027
PICKERING TOWN RANGE 03 030
17 650765 4853368 W
1962-07 2636 4 FR 0227 34/185/10/48:0 DO 0227 4 4601874 () YLLW CLAY STNS 0019 BLUE CLAY STNS 0227 GRVL 0231
PICKERING TOWN RANGE 03 030
17 650885 4853159 W
1952-02 4823 4 4601908 () A RED MSND CLAY STNS 0018 GREY CLAY GRVL 0055 HPAN 0078 GRVL SILT 0079 BLCK SHLE 0097
PICKERING TOWN RANGE 03 030
17 651174 4852255 W
1955-04 4222 6 FR 0035 FR 0048
20///: NU 4601909 () A FILL 0001 LOAM 0002 BRWN CLAY MSND 0009 GREY CLAY SILT STNS 0035 MSND GRVL 0038 GREY SILT MSND 0077
PICKERING TOWN RANGE 03 030
17 651172 4852305 W
1957-04 2610 30 FR 0042 35///: DO 4601910 () BRWN CLAY 0010 GREY CLAY 0035 QSND 0042
PICKERING TOWN RANGE 03 030
17 650815 4853513 W
1971-11 2214 4605056 () A LOAM 0001 BRWN CLAY STNS 0012 BLUE CLAY STNS 0030
PICKERING TOWN RANGE 03 031
17 650603 4853494 W
1966-02 5420 30 FR 0007 5///: DO 4601913 () LOAM 0001 YLLW CLAY 0005 CLAY GRVL 0010 BLUE CLAY 0017

TOWNSHIP CON LOT UTM DATE CNTR CASING DIA WATER PUMP TEST WELL USE SCREEN WELL FORMATION
Page 5 of 6
PICKERING TOWN RANGE 03 031
17 650771 4852580 L
2001-11 2214 1915420 (240016) A
PICKERING TOWN RANGE 03 031
17 650831 4852894 W
1966-08 5412 30 FR 0020 17//6/: DO 4601912 () LOAM 0001 BRWN CLAY 0010 GREY CLAY 0020 GRVL 0025
PICKERING TOWN RANGE 03 031
17 650591 4853144 W
1966-11 2610 30 FR 0010 10//1/: DO 4601914 () MSND 0022
PICKERING TOWN RANGE 03 031
17 650624 4852568 W
1964-06 2613 7 4601915 () A GREY CLAY 0133 GREY SHLE 0138 LMSN 0218
PICKERING TOWN RANGE 03 031
17 650915 4852783 W
1967-09 2306 6 FR 0102 90/95/3/2:30 DO 4601916 () PRDG 0040 CLAY 0100 GRVL 0102
PICKERING TOWN RANGE 03 031
17 650891 4852820 W
2015-07 7147 7245784 (C28817) P
PICKERING TOWN RANGE 03 031
17 650699 4852903 W
2014-07 4102 7227606 (Z154883) A
PICKERING TOWN RANGE 03 031
17 650683 4852905 W
2014-07 4102 7227605 (Z154882) A
PICKERING TOWN RANGE 03 031
17 650691 4852889 W
2014-07 4102 7227604 (Z154881) A
PICKERING TOWN RANGE 03 031
17 650683 4853245 W
1958-11 2516 5 4601911 () A PRDG 0025 GREY LMSN 0050

TOWNSHIP CON LOT UTM DATE CNTR CASING DIA WATER PUMP TEST WELL USE SCREEN WELL FORMATION
Page 6 of 6
Notes: UTM: UTM in Zone, Easting, Northing and Datum is NAD83; L: UTM estimated from Centroid of Lot; W: UTM not from Lot Centroid DATE CNTR: Date Work Completedand Well Contractor Licence Number CASING DIA: .Casing diameter in inches WATER: Unit of Depth in Fee. See Table 4 for Meaning of Code
PUMP TEST: Static Water Level in Feet / Water Level After Pumping in Feet / Pump Test Rate in GPM / Pump Test Duration in Hour : Minutes WELL USE: See Table 3 for Meaning of Code SCREEN: Screen Depth and Length in feet WELL: WEL ( AUDIT # ) Well Tag . A: Abandonment; P: Partial Data Entry Only FORMATION: See Table 1 and 2 for Meaning of Code
1. Core Material and Descriptive terms 2. Core Color 3. Well Use
Code Description Code Description Code Description Code Description Code Description Code Description Code Description Code Description WHIT WHITE DO Domestic OT Other
BLDR BOULDERS FCRD FRACTURED IRFM IRON FORMATION PORS POROUS SOFT SOFT
BSLT BASALT FGRD FINE-GRAINED LIMY LIMY PRDG PREVIOUSLY DUG SPST SOAPSTONE
CGRD COARSE-GRAINED FGVL FINE GRAVEL LMSN LIMESTONE PRDR PREV. DRILLED STKY STICKY
GREY GREY
BLUE BLUE
GREN GREEN
YLLW YELLOW
BRWN BROWN
RED RED
BLCK BLACK
BLGY BLUE-GREY
ST Livestock TH Test Hole
IR Irrigation DE Dewatering
IN Industrial MO Monitoring
CO Commercial MT Monitoring TestHole
MN Municipal
PS Public AC Cooling And A/C
NU Not Used
4. Water Detail
Code Description Code Description
FR Fresh GS Gas
SA Salty IR Iron
SU Sulphur
MN Mineral
UK Unknown
CGVL COARSE GRAVEL FILL FILL LOAM TOPSOIL QRTZ QUARTZITE STNS STONES
CHRT CHERT FLDS FELDSPAR LOOS LOOSE QSND QUICKSAND STNY STONEY
CLAY CLAY FLNT FLINT LTCL LIGHT-COLOURED QTZ QUARTZ THIK THICK
CLN CLEAN FOSS FOSILIFEROUS LYRD LAYERED ROCK ROCK THIN THIN
CLYY CLAYEY FSND FINE SAND MARL MARL SAND SAND TILL TILL
CMTD CEMENTED GNIS GNEISS MGRD MEDIUM-GRAINED SHLE SHALE UNKN UNKNOWN TYPE
CONG CONGLOMERATE GRNT GRANITE MGVL MEDIUM GRAVEL SHLY SHALY VERY VERY
CRYS CRYSTALLINE GRSN GREENSTONE MRBL MARBLE SHRP SHARP WBRG WATER-BEARING
CSND COARSE SAND GRVL GRAVEL MSND MEDIUM SAND SHST SCHIST WDFR WOOD FRAGMENTS
DKCL DARK-COLOURED GRWK GREYWACKE MUCK MUCK SILT SILT WTHD WEATHERED
DLMT DOLOMITE GVLY GRAVELLY OBDN OVERBURDEN SLTE SLATE
DNSE DENSE GYPS GYPSUM PCKD PACKED SLTY SILTY
DRTY DIRTY HARD HARD PEAT PEAT SNDS SANDSTONE
DRY DRY HPAN HARDPAN PGVL PEA GRAVEL SNDY SANDYOAPSTONE