Evaluation of the Nubian Sandstone aquifer using geophysical and hydrogeological tools in the East...
21
Evaluation of the Nubian Sandstone aquifer using geophysical and hydrogeological tools in the East of El-Dakhla Oasis, Western Desert , Egypt A.M. M. Al Temamy, M.S Barseem and S. U.Ghoubachi Desert Research Center. 1 Mathaf El Matariya St- P. O. B. 11753, Matariya, Cairo, Egypt. ABSTRACT Integrated geophysical (land magnetic and geoelectric) and hydrogeologic techniques were used with the main objective of evaluating the Nubian sandstone aquifer in East El-Dakhla depression. The area of study is characterized by available groundwater and soil resources. The Nubian Sandstone aquifer represents the main water-bearing formation in this area. The geophysical survey carried out in the present study involved four land magnetic profiles and ten Vertical Electrical Soundings, with the object of determining the depth of the basement rocks, the lithologic variations in the vertical and horizontal directions, the thickness of the water-bearing layers and detecting the subsurface geological structures and their impact on the groundwater occurrences. The hydrogeologic study included measuring the depth to water table of the available hand dug wells, carrying out constant and recovery pumping tests to determine the hydraulic parameters and collecting water samples to measure their salinities and to evaluate their uses in the different objectives. The interpretation results of the modeled land magnetic profiles were used for determining the depths to the basement surface and establishing the basement level maps. The depth to basement ranges from about 815 m in the south to more than 1500 m. in the middle and northern parts. This variation is due to the effect of structural faults. These faults have more or less E-W, NE-SW and NW-SE trends. The NW trend is the most dominant one. Moreover, the interpretation of the resistivity sounding led to the detection of four main geoelectric units, Unit “A” (dry wadi deposits of Quaternary), Unit “B” (equivalent to Taref Sandstone water- bearing), Unit “C” (Maghrabi Formation consists of claystone and shale) and Unit "D" (equivalent to Sabaya Sandstone water-bearing). Taref Sandstone aquifer is present under unconfined condition. It is divided into two layers, the first one consists of sand and clay intercalation, whereas the second layer consists of sandstone. Both of the resistivity and thickness of the two layers increase northward. The Sabaya Sandstone aquifer was detected in the southern soundings under confined conditions (below Maghrabi Formation) and its bottom surface is undetected with the used current electrode separation. The structural faults reduce the thickness of Taref Sandstone southward and cause Taref Sandstone to interface the Sabaya Sandstone on the other side of the fault. Therefore, the two aquifers are interconnected hydrogeologically. The Data of depths to water table of Taref Sandstone aquifer (vary from 14.7 m to 41.9 m) were used to deduce the water level contour map, that revealed the groundwater flow from the western to eastern directions. The interpretation data of constant and recovery test is revealed that, the transmissivity of Taref Sandstone from constant and recovery tests attains values of 1040 and 794 m 2 /day, respectively. The hydraulic conductivity of the same aquifer attains a value of 7.9 m/day. The determined effective porosity, based on the hydraulic conductivity attains a value of 24%. The measured salinity of the same wells tapping Taref Sandstone revealed that, the salinity decreases with time. This may be due to the recharging of Taref Sandstone from the Sabaya Sandstone of the lower salinity through the fault plains (this coincides well with the geoelectrical results). The measured up to date salinity ranges from 583 to 1035 ppm. The dominant cations and Anion are Na + and Cl - , respectively, so the chemical water type is sodium chloride. The analysis results of the groundwater of Taref Sandstone aquifer revealed that, it has high quality and can be used for the different sustainable development objectives. INTRODUCTION 1
Transcript of Evaluation of the Nubian Sandstone aquifer using geophysical and hydrogeological tools in the East...

Evaluation of the Nubian Sandstone aquifer using geophysical andhydrogeological tools in the East of El-Dakhla Oasis,
Western Desert , EgyptA.M. M. Al Temamy, M.S Barseem and S. U.Ghoubachi
Desert Research Center.1 Mathaf El Matariya St- P. O. B. 11753, Matariya, Cairo, Egypt.
ABSTRACT Integrated geophysical (land magnetic and geoelectric) and hydrogeologic techniques were used with
the main objective of evaluating the Nubian sandstone aquifer in East El-Dakhla depression. The area of study is characterized by available groundwater and soil resources. The Nubian Sandstone aquifer represents the main water-bearing formation in this area. The geophysical survey carried out in the present study involved four land magnetic profiles and ten Vertical Electrical Soundings, with the object of determining the depth of the basement rocks, the lithologic variations in the vertical and horizontal directions, the thickness of the water-bearing layers and detecting the subsurface geological structures and their impact on the groundwater occurrences. The hydrogeologic study included measuring the depth to water table of the available hand dug wells, carrying out constant and recovery pumping tests to determine the hydraulic parameters and collecting water samples to measure their salinities and to evaluate their uses in the different objectives.
The interpretation results of the modeled land magnetic profiles were used for determining the depths to the basement surface and establishing the basement level maps. The depth to basement ranges from about 815 m in the south to more than 1500 m. in the middle and northern parts. This variation is due to theeffect of structural faults. These faults have more or less E-W, NE-SW and NW-SE trends. The NW trend is the most dominant one. Moreover, the interpretation of the resistivity sounding led to the detection of four maingeoelectric units, Unit “A” (dry wadi deposits of Quaternary), Unit “B” (equivalent to Taref Sandstone water-bearing), Unit “C” (Maghrabi Formation consists of claystone and shale) and Unit "D" (equivalent to Sabaya Sandstone water-bearing). Taref Sandstone aquifer is present under unconfined condition. It is divided into two layers, the first one consists of sand and clay intercalation, whereas the second layer consists of sandstone. Both of the resistivity and thickness of the two layers increase northward. The Sabaya Sandstone aquifer was detected in the southern soundings under confined conditions (below Maghrabi Formation) and its bottom surface is undetected with the used current electrode separation. The structural faults reduce the thickness of Taref Sandstone southward and cause Taref Sandstone to interface the Sabaya Sandstone on the other side of the fault. Therefore, the two aquifers are interconnected hydrogeologically.
The Data of depths to water table of Taref Sandstone aquifer (vary from 14.7 m to 41.9 m) were used to deduce the water level contour map, that revealed the groundwater flow from the western to eastern directions. The interpretation data of constant and recovery test is revealed that, the transmissivity of Taref Sandstone from constant and recovery tests attains values of 1040 and 794 m2/day, respectively. The hydraulic conductivity of the same aquifer attains a value of 7.9 m/day. The determined effective porosity, based on the hydraulic conductivity attains a value of 24%. The measured salinity of the same wells tapping Taref Sandstone revealed that, the salinity decreases with time. This may be due to the recharging of Taref Sandstone from the Sabaya Sandstone of the lower salinity through the fault plains (this coincides well with the geoelectrical results). The measured up to date salinity ranges from 583 to 1035 ppm. The dominant cations and Anion are Na+ and Cl- , respectively, so the chemical water type is sodium chloride. The analysis results of the groundwater of Taref Sandstone aquifer revealed that, it has high quality and can be used for the different sustainable development objectives.
INTRODUCTION
1

The Western Desert constitutes about 68% of the surface area of Egypt. Dakhla depression is one of themain five oases in the Western Desert.Nubia Sandstone aquifer represents themain source of groundwater required for agricultural and touristic development in the Western desert. Therefore, geophysical studies in the form of geomagnetic and geoelectric surveys were carried out to give information concerning the thickness of the subsurface layers overlying the
basement rocks, the geological structures that contribute the groundwater occurrences, the lateral and vertical variations of layers and finally to define the best sites for drilling new wells.
The study area is located in thecentral part of the Western Desert of Egypt (Fig.1). It lies between latitudes 25◦ 23' &25◦ 30' N and longitudes 28◦ 20' & 28◦ 30' E. It covers an area of about 100 km2.
A l B leazih
A l akolah
Wad
i EL
B atek
h
T o E l K H arga
T o E l D akhla
25 24'
25 21' 25 24' 25 27'0 1 2 3 K m.
S cale1
1'P aved road
M E D IT E R R A N E A N S E A
R E D S E A
S I N A I
C airo
A ssiutQ ena
A swan
L akeN asser
S iwa Qatta
raD epressio
n
E l-B ahariya
E l-F arafra
E l-D akhla
E l-K h arga
W E S T E R N
D E S E R T
E A S T E R N D E S E R T
G ilf K ebir P lateau
25 00 30 00 35 00
2200
2600
3000
0 100 200 300k m
9 9 9
Fig.(1): Location map of the study area Physiographic setting of the study area
Several works had been carried out in the Dakhla depression. Such works were in the fields of geomorphology, geology and hydrogeology. Climatic conditions
The area of study is characterized by an extremely arid climatic condition (Ghoubachi, 2001). It has a very low annual intensity of rainfall (1.6 mm). The minimum temperature was recorded in January (4.4 ºC), whereas the highest temperature was recorded in June (40.2ºC). The evaporation has its minimum value in January (5.4 mm/day) and the maximum value during June (16.9 mm/day).Geomorphologic setting
Geomorphologically, the Dakhladepression had been attracted the
attention of many authors. Ball (1927)assumed that, the depression washollowed by the erosive action ofwind. Ibrahim (1957) described theorigin of this depression as atectonic action. The investigated areaexhibited three main geomorphologicunits ((Ghoubachi, 2001). These unitsare the high plateau, the depressionand the structural plain. The highplateau bounds the Dakhla depressionfrom the north, and includes theplateau surface and the escarpmentssubunits. The depression representscontrolled structurally anderosionally low topographic area. Thearea of the depression comprises thepiedmont plain, the low plateau, theresidual hills and the piedmont flatlandforms. The structural plainresults from the merging of the Dakhladepression gradually to the south into
2

an extensive elevated plain. Theorigin of this plain is either byweathering (Mitwally, 1953) or byerosion (Shata, 1953). This plaincomprises sand dune chains andisolated hills, which are affected bystructures (faults and fractures).Geologic Setting
In the Dahkla area, the exposedsedimentary rocks range in age fromLate Cretaceous to Quaternary(Fig.2).The Upper Jurassic–Campaniansequence is represented by sandstoneand clay, known by the Nubia Sandstone(Russegger, 1837).The Nubia Sandstoneoverlies directly the basement rocks.It is subdivided into different rockunits which can be described fromolder to younger as follows:-The Six Hills Formation overliesdirectly the basement rocks andunderlies Abu Ballas Formation. It iscomposed mainly of ferruginoussandstone with shale interbeds. It isassigned to Late Jurassic-Aptian age(Helal, 1965; Soliman, 1977; Klitzschand Nicol, 1984 and Dominik, 1987). Itreaches up to 500 m. in thickness inits type locality (Said, 1990),whereas the maximum penetratedthickness of this formation attains712 m.The Abu Ballas Formation overlies theSix Hills Formation and underliesSabaya Formation. It is composedmainly of shale interbeded withclaystone and ferruginous siltstone at
top. It is encountered in thesubsurface in all penetrated deepwells with a thickness varying from10m. to 45 m. It is assigned to Aptianage (Boettcher, 1982 and Schrank,1987).The Sabaya Formation lies between AbuBallas Formation at the bottom andMaghrabi Formation at the top. It iscomposed mainly of vari-colouredsandstone with shale interbeds. Itsthickness reaches 170 m. in its typelocality. It attains a thicknessranges between 205m and 344 m.(Ghoubachi, 2001).The Maghrabi Formation underlies theTaref Formation. It is composed ofshale and claystone interbedded withsandstone bands. It reaches up to 60m. in thickness at the surface,whereas its thickness ranges between 8and 79 m.in the subsurface.
The Taref Formation overlies theMaghrabi Formation. It is assigned toTuronian age (Said, 1990). It iscomposed of sandstone with shaleinterbeds. It reaches more than 100 min its type locality, but in thesubsurface, its thickness rangesbetween 65 m and 144m.Quaternary deposits
These deposits are ofcontinental origin and varying fromfresh deposits to eolian sediments.These deposits include sand dune,alluvial, playa and inland sabkhadeposits.
3

T o O w einat
2530'
2520'
29 30'29 15'29 00'
L egend
L ower-M iddle C retaceous
S abaya F ormation
M aghrabi F ormation
T aref F ormation
W adi deposits
S and sheet
Q uaternary
0 5 10 km
M ut F ormationU pper C retaceous (C ampanian)
Fig. (2): Geological map of the study area(after Hermina et al., 1961 andCONOCO, 1987)
Geologic structureThe geologic structure of the
Dakhla depression was studied by Shata(1953), who considered the Dakhla depression as a low area occurring between major structural highs. On theother hand, Hermina, et.al (1961) stated that, "the Dakhla depression isconsidered as a major syncline locatedon the north plunge of the Nubia huge upwarping". This depression is affected by folds and faults, which are oriented NE-SW direction.Hydrogeologic studies
The hydrogeology of the Dakhla depression was studied by many authors. Borelli and Karanjac (1968) divided the aquifers in the Dakhla depression into shallow and deep aquifers, with vertical leakage between them. Youssef and Hassan (1968) considered the Nubia Sandstone succession in the Dakhla area as one aquifer. Ezzat (1975) divided the Nubia Sandstone aquifer into four water-bearing zones, as detected in the deep wells and expected that, the Dakhla area represents a big discharging area after ten years of production. Ghoubachi (2001) divided the Nubia Sandstone succession into
three aquifers with confining layers in-between. These aquifers, from top to bottom, are Taref Sandstone aquifer, Sabaya Sandstone aquifer and Six Hills Sandstone aquifer. The recorded salinity of these aquifers decreases downwards and also revealed that, the wells tapping Taref Sandstone aquifer are present in confined and unconfined conditions. The later condition is only found in East El Dakhla area. The wells in EastEl Dakhla are shallow (30-33 m). The salinity of this aquifer ranges from 132 to 909 ppm. Shata (1962) and Thorweihe and Henil (1993) concluded that, the groundwater of the Nubia aquifer system is fossil water. On theother hand, Attia (1954) suggested that, the source of this water is derived from the rainfall on the high mountains of the Equatorial Africa, whereas Kamel (1993) suggested that, the source of recharge is from the out-crops at Enndi and Tibesti plateauin Chad. Field Work and Procedure
To achieve the main objectives of the present study, the following field works were carried out:-
4

A- Geophysical methods including a land magnetic survey and electrical resistivity soundings were applied. The total intensity of the earth’s magnetic field was measured along fourprofiles traversing the study area, two of them (1-1' and 2-2), in the NNW-SSE direction which are intersected by the other two profiles (3-3' and 4-4'), in the ENE-WSW direction (Fig. 3). The interval between each two successive stations was 100 m. Two units of proton magnetometers (Envimag) model, from Scintrex with a sensitivity of 1 gamma, were used for data acquisition.The lengths and directions of the measured profiles are given in table (1). A reasonable coverage for the study area was reached by a total of ten Vertical Electrical Soundings (VES). The sounding stations were
distributed, more or less in a grid pattern form (Fig. 3). The Schlumberger four-electrode configuration was applied in the present investigation. The current electrode separation (AB) starts from 2 m up to a max. value of 1400 m. Thedirect current resistivity meter (Terrameter SAS 300C) has been used inthis study. B- A constant and recovery pumping tests were carried out at a hand dug well tapping the Taref Sandstone aquifer to determine its hydraulic parameters. In the same time, the depth of water table was measured in the available hand dug wells in the study area and some water samples representing the Taref Sandstone were collected for measuring their salinities and determine their qualityfor different objectives.
1
2
34
5
6
78
9
10
A l B leazih
A l akolah
Wad
i EL
B atekh
T o E l K H arga
T o E l D akhla
25 24'
25 27'
29 21' 29 24' 29 27'0 1 2 3 K m.
S cale
1'
2
2'
3
3'
4
4'
L egan dV E S locationH and dug wellC ross sectionM agnitic profile
P aved road
A '
B
B '
C
I
IV
III
II
Fig.(3): Field work map (VES and magnetic)
Table (1): Direction and lengths of the measured magnetic profiles
ProfileNo.
Direction Length "Km"
1-1'2-2'3-3'4-4'
NNW-SSENNW-SSEENE-WSWENE-WSW
10107.86.9
5

Magnetic correction and interpretation1- Magnetic correctiona-Diurnal correction:
Prior to plotting or mapping themeasured magnetic data, the diurnal correction has been applied, where themagnetic intensity varies with time and cause distortion to the magnetosphere of the earth. The magnetometer readings at the base station are used to construct a curve showing the variations of magnetic intensity with time. This curve is used to correct the readings of the field data for diurnal variations at the times corresponding to those at the base station. The corrected data revealed that, the southern parts of the study area have high magnetic intensity comparable with the northernpart (Fig. 4). This may indicate that,the depths to the basement surface areshallower in the southern parts than those in the northern partsb- Reduced to the North Pole (RTP):
Prior to the magnetic interpretation the reduced to the north pole technique has been carried out for each profile. In the present study, the total intensity magnetic field of the magnetic profiles have been reduced to the north pole throughthe Geosoft Program (1994), where someparameters as inclination (35.94°), declination (2.46°), magnetic field strength (41047.3 nT) and height of the instrument sensor from the ground surface (1.7 m) are defined as input information to the program. 2-Magnetic Interpretation
The main target of the magnetic interpretation is the estimation of the depths to the basement surface. This was carried out due to the fact that, the basement rocks have much higher magnetic susceptibility than that of the overlying sediments. This
estimation will help in drawing a picture about the subsurface structures of the concerned area. The depths of the basement rocks have beendetermined by using modeling technique.- Magnetic Modeling :
Modeling process depends on the breaking up of the irregular shaped bodies into several smaller bodies of different sizes and regular shapes. This method can be made precisely by using sufficient large number of smallblocks. The computation becomes more tedious, as the number of blocks increases. In general, the modeling procedure assumes different polygons, which represent either the proposed structure along the modeled profile orthe basement rocks of different composition. The upper part of the model represents the observed and the calculated curves, while the lower part represents the depths along the profile. In the investigated area, thevalues of magnetic susceptibility at the different polygons are changed andreadjusted during the modeling process, according to the depths of the available data. The modeled cross-section is extrapolated at the two sides to control the edge effects. Themodeling is carried out by changing the depths and susceptibilities of thedifferent polygons, until a best fit is obtained between the observed and calculated curves.
To outline the structural framework of the area of interest, thefour measured magnetic profiles were modeled (Fig.3) after reducing the total intensity magnetic data to the north pole through Geosoft Program (Potential Field Modeling / GM –SYS Interactive Modeling). The penetrated depth (1140 m.) for a drilled well lies northwest of the study area (Tenida 18), that penetrates the Six Hills Formation, was taken into consideration. The infra structures
6

forbid conducting and connecting the land magnetic survey of this well withthe studied area. A complementary thickness from previous geological
studies was added to the penetrated depth of this well, when dealing with the initial modeling process in the northern part of the study area.
A l B leazih
A l akolah
Wad
i EL
B atekh
T o E l K H arga
T o E l D akhla
25 24'
25 27'
29 21' 29 24' 29 27'0 1 2 3 K m.
S cale
V E S locationH and dug well
L egand
40900
40930
40960
40990
41020
41050
41080
41110
41140
M agneticintensity
Fig. (4) Total intensity magnetic map of the study area
Interpretation of GeoelectricResistivity Sounding Data A-Qualitative interpretation
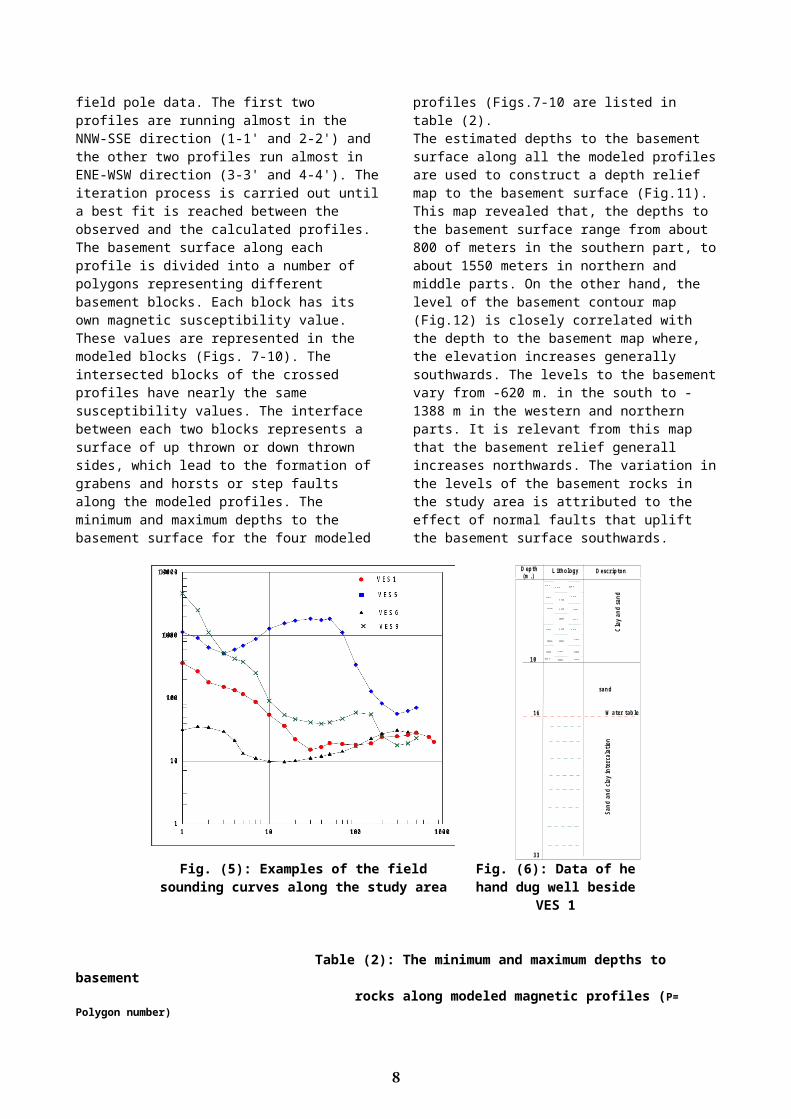
Qualitative interpretation includes a comparison between the relative changes in the apparent resistivity and thickness of the different layers. It gives informationabout the number of layers, their continuity in the area or in certain direction and reflects the degree of homogeneity or heterogeneity of the individual layers. The field curves ofthe Vertical Electrical Soundings are variable along the area of study. The resistivity values of the first and second cycles of the resistivity curves (Fig.5) are characterized by HK, KH and H types, which reflect the variation in the lithologic composition that varies between sand and clay along the area of study. All
the field curves end with either H or K types, which reflects high resistivity values, that related to sandstone or low resistivity value corresponding to clay.B-Quantitative interpretation
For the quantitative interpretation of the geoelectrical resistivity sounding data, the computer programs “RESIST” (Velpen, 1988) and “RESIX-PLUS” (Interpex, 1996) have been used. They are interactive, graphically oriented, andforward and inverse modeling programs for interpreting the resistivity curves in terms of a layered earth model. The initial model has been constructed in view of the lithologic succesion data of the existing hand dug well, that occurred beside VES 1 (Fig.6). These information reduce the ambiguity of interpretation, enhance the solution and reliability in more realistic models.
Results and discussionIn the following paragraphs, the
interpretation and results of both themagnetic and geoelectric resistivity data will be given:-A-Magnetic results:
To determine the depths of basement rocks and the basement tectonic framework of the studied area, four profiles were modeled (Fig.3). These profiles were taken from thereduced to the north total magnetic
7
field pole data. The first two profiles are running almost in the NNW-SSE direction (1-1' and 2-2') and the other two profiles run almost in ENE-WSW direction (3-3' and 4-4'). Theiteration process is carried out untila best fit is reached between the observed and the calculated profiles. The basement surface along each profile is divided into a number of polygons representing different basement blocks. Each block has its own magnetic susceptibility value. These values are represented in the modeled blocks (Figs. 7-10). The intersected blocks of the crossed profiles have nearly the same susceptibility values. The interface between each two blocks represents a surface of up thrown or down thrown sides, which lead to the formation of grabens and horsts or step faults along the modeled profiles. The minimum and maximum depths to the basement surface for the four modeled
profiles (Figs.7-10 are listed in table (2).The estimated depths to the basement surface along all the modeled profilesare used to construct a depth relief map to the basement surface (Fig.11). This map revealed that, the depths to the basement surface range from about 800 of meters in the southern part, toabout 1550 meters in northern and middle parts. On the other hand, the level of the basement contour map (Fig.12) is closely correlated with the depth to the basement map where, the elevation increases generally southwards. The levels to the basementvary from -620 m. in the south to -1388 m in the western and northern parts. It is relevant from this map that the basement relief generall increases northwards. The variation inthe levels of the basement rocks in the study area is attributed to the effect of normal faults that uplift the basement surface southwards.
W ater tab le
Clay
and sa
nd
san d
Sand
and cla
y int
erca
lation
10
16
33
D epth (m .)
L ithology
D escripton
Fig. (5): Examples of the fieldsounding curves along the study area
Fig. (6): Data of hehand dug well beside
VES 1
Table (2): The minimum and maximum depths to basement rocks along modeled magnetic profiles (P= Polygon number)
8

Profile
No.
Direction Length(k m.)
Minimum depth to Basement (m)
Maximum depth toBasement (m)
1-1'2-2'3-3'4-4'
NNW-SSENNW-SSEENE-WSWENE-WSW
10108.76.9
825 (P1)815 (P1)1040 (P1)860 (P1)
1435 (P6)1415 (P5)1550 (P3)1280 (P3)
40900
40950
41000
41050
41100
41150
= O bserved = C alcu lated
1 1'
Mag
netic
s (ga
mmas
)
4000 8000
Dept
h (mete
r)
D istance (m eter)
300
-100
-900
-2100
V E S 2V E S 6V E S 7
P 1 P 2 P 3 P 4 P 5 P 6S =0.0026 S= 0.002 S= 0.0018S =0.0022 S =0.0019 S= 0.0021
S ed. R o ck
Fig. (7): Modeled magnetic profile of cross–section 1-1'
40900
40950
41000
41050
41100
41150
= O b served = C alculated
2 2'
Mag
netic
s (ga
mmas
)
4000 8000
Dept
h (m
eter)
D istance (m eter)
300
-100
-900
-2100
V E S 10
P 1 P 2 P 3 P 4 P 5S =0.0025 S= 0.0018S= 0.002 S= 0.0022 S= 0.0019
S ed. rocks
Fig. (8): Modeled magnetic profile of cross–section 2-2'
40880
40920
40960
41000
41040
= O b served = C alcu lated
3 3'
Mag
netic
s (ga
mmas
)
4000 8000
Dept
h (m
eter)
D istan ce (m eter)
300
-100
-900
-2100
V E S 10V E S 6
S= 0.0018S=0.0023S= 0.0025 S = 0.00165 S= 0.0019P 1 P 2 P 3 P 4 P 5
S ed. rocks
9

Fig. (9): Modeled magnetic profile of cross–section 3-3
41000
41040
41080
41120
41160
= O bserved = C alculated
4 4'
Mag
netic
s (ga
mmas
)
4000
Dept
h (m
eter)
D istance (m eter)
300
-100
-900
-2100
V E S 9
P 3S = 0.0026 P 2P 1S= 0.002 S= 0.0018
S ed. rocks
Fig. (10): Modeled magnetic profile of cross–section 4-4'
B-Geoelectrical resistivity results:
The quantitative interpretation of the resistivity sounding measurements and the three constructedcross sections (Figs. 13-15.) along the area of study led to the detectionof four main geoelectric units (A, B, C and D). A description of each of these units is given as follows:Unit A This unit consists of a group ofthin layers. These layers have a
transverse resistivity value ranging between 12 Ohm-m at VES 6 and 4751 Ohm-m at VES 7. The low resistivity value corresponds to the clay depositsof the Quaternary alluvium, whereas the high resistivity value correspondsto dry sand sheets and sandstone. Thisunit represents the dry deposits, thatoverlie the water-bearing Taref Sandstone (unit B). The thickness of this unit varies from 2.7 m at VES 9 to 41.9 m at VES 4.
10

A l B leazih
A l akolah
Wad
i EL
B atekh
T o E l K H arga
T o E l D akhla
25 24'
25 27'
29 21' 29 24' 29 27'
L egandV E S locationH and du g well
0 1 2 3 K m.S cale
800
860
920
980
1040
1100
1160
1220
1280
1340
1400
1460
1520
D epth (m.)
Fig. (11) : Depth relief contour map to the basement surface
A l B leazih
A l akolah
Wad
i EL
B atekh
T o E l K H arga
T o E l D akhla
25 24'
25 27'
29 21' 29 24' 29 27'
L egan dV E S locationH and dug well
0 1 2 3 K m.S cale
-1400
-1240
-1080
-920
-760
-600
L evel (m.)
Fig. (12): Basement level contour map
Unit BThis unit is detected at all the
sounding stations, except at VES nos. 7, 8 and 9. It is differentiated into two geoelectric layers (B1 and B2) andequivalent to the Nubia Sandstone (Taref Formation). The geoelectric layer B1 consists of small sub-layers at some sounding stations. It has transverse resistivity values varying from 14 Ohm-m at VES 6 to 35 Ohm-m at VES 2. This layer ranges between water-bearing sandy clay to water-bearing sand. The variation in the resistivity value is related to the percentage of the intruded clay with sand and /or the variation in water salinity. The thickness of this geoelectric layer varies from 9.1 m atVES 10 to 58.8 m at VES 1. The geoelectric layer B2 has resistivity values that vary from 42 Ohm-m at VES 5 to 131 Ohm-m at VES 3. This layer corresponds to the water-bearing
sandstone. The anomalous high resistivity value of this layer corresponds to siliceous sandstone of low effective porosity. The thickness of this geoelectric layer ranges between 27.8 m at VES 10 and 42.5 m atVES 2. Unit C
This unit is differentiated intotwo geoelectric layers (C1 and C2) andequivalent to Maghrabi Formation. The upper layer "C1" generally has higher resistivity values comparable with thelower one "C2". The upper layer "C1" has resistivity values that vary from 20 Ohm-m at VES 1 to 155 Ohm-m at VES 7. This layer corresponds to interbeded sandstones and claystones. Its lower bottom is detected only at VES nos. 7, 8 and 9. Its thickness varies from 24.7 m at VES 9 to 36.2 m at VES 7. The lower layer "C2" is detected only at VES nos. 7, 8 and 9. It has resistivity values varying from
11

8 Ohm-m at VES 9 to 28 Ohm-m at VES 7.This layer corresponds to interbeded shales and claystones. Its thickness ranges between 20.8 m at VES 7 and 26.1 m at VES 9. Unit D
This unit is detected only at VES nos. 7, 8 and 9. Its lower surfaceis not reached with the used current electrode separation. It has resistivity values ranging between 53 Ohm –m at VES 7 and 137 Ohm-m at VES 8. This unit is equivalent to the water-bearing sandstone and some intruded clay, of Sabaya Formation.
Results of the sounding interpretations have been used to generate three geoelectrical cross-sections (Figs.15-17) traversing the investigated area in different directions, to study the spatial distribution of the different geoelectric layers. The geoelectric cross-section (A-A) is running in the W-E direction (Figs. 14). The other two profiles (B-B' and A'-C) are
running in the N-S direction (Figs 15 & 16). The main findings reached from these geoelectric cross-sections are given in the following:-The geoelectric layers (B1&B2) are not detected at VESies. 7, 8 and 9 (Figs. 15 and 16) due to the faults effects (F3 and F4), that uplifted thebasement surface at these locations. - The thickness of geoelectric unit "B" decreases southwards (cross sections B-B' and A'C) and is upliftedat the extreme south soundings, due tothe effect of structural faults.-The Geoelectric unit "D" was detectedonly at VES nos. 7, 8 and 9 and its bottom surface is not reached with theused current electrode separation.-It is expected that , the two water-bearing units (B and D), that equivalent to Taref Sandstone and Sabaya Sandstone are interconnected hydrogeologically, due to the effect of structural faults (cross-sections B-B' &A'C) .
Fig. (13): Geoelectrical cross–section A-A'
12

Fig. (14): Geoelectrical cross–section B-B'
Groundwater aquifers and their hydrogeologic characteristics
The geoelectric results revealedthat, two geoelectric units were detected as water-bearing formations along the study area. The first one isunit “B”, which is equivalent to TarefSandstone and represents the shalloweraquifer in the investigated area. The second unit is unit "D", which is equivalent to Sabaya Sandstone. The later unit is detected at the southernsoundings (VES nos.7, 8 and 9) at depths range from 35.5 m. at VES 9 to 60.9 m. at VES 7. This aquifer occurs under confined condition, where it overlain by confining bed (unit "C", that is equivalent to Maghrabi Formation). The lower bottom of this aquifer is not detected with the applied current electrode separation.
Special discussion for the first water-bearing layer will be given hereafter: The geoelectrical unit "B" (Taref Sandstone) is divided into two geoelectric layers without confining between them. The first one is existedunder unconfined condition and consists of sand and clay intercalations. Its resistivity valuesincrease northward from 14 ohm-m in the south to 35 Ohm- in the north (Fig.16). This increment in resistivity values reflects decrease of clay content with sand northwards. The thickness of this layer ranges from 10 m. to 58.8 m., with a general increase northward and decrease southward (Fig. 17) due to the effect of structural faults. The second layerconsists of sandstone. Its resistivityvalues increase northward from 40 ohm-m in the south to 131 Ohm-m
13

Fig. (15): Geoelectrical cross–section A'-C
in the north (Fig.18). This increment in resistivity values reflects decrease of the effective porosity of sandstone northwards. The thickness of this layer ranges from 27.8 m. in the south to 42.5 m. in thenorth (Fig.19). The depths to the water table of Taref Sandstone aquifervary from 14.7 m at VES 5 to 41.9 m atVES 4. The data of the available hand dug wells and those interpreted from the electrical soundings were used to construct a water level contour map (Fig. 20), that varies from 129.9 m. in the west to 138.1 m in the east. Therefore, the groundwater flows from the western to the eastern directions.
To determine the hydraulic parameters of the Taref Sandstone aquifer in East El-Dakhla depression apumping test was carried out on a productive well beside VES 1 during this work. This pumping test is
analyzed by using GWW program. The Cooper and Jacob (1946) and Theis (1935) are applied to analysis the constant and recovery pumping tests (Fig.21) respectively.
The determined transmissivity from the constant and recovery tests are 1040 and 794 m2/day, respectively.The present work depends on the recovery test, where the transmissivity from this method represents the aquifer. The hydraulic conductivity was determined by multiplying the transmissivity (794 m2/day) in the saturated thickness (100m) that attains 7.9 m/day. The calculated effective porosity of the Taref sandstone aquifer using Marotz equation (1968) that depends on the relation between effective porosity and hydraulic conductivity attains a value of 24 %.
14

A l B leazih
A l akolah
T o E l K H arga
T o E l D akhla
25 24'
25 27'
29 21' 29 24' 29 27'
0 1 2 3 K m.S cale
L egandV E S locationH and dug wellle
P aved road
14
17
20
23
26
29
32
35
1
2
34
5
6
78
9
10
R esistivity(O hm -m )
A l B leazih
A l akolah
T o E l K H arga
T o E l D akhla
25 24'
25 27'
29 21' 29 24' 29 27'
0 1 2 3 K m.S cale
L egandV E S locationH and dug wellle
P aved road
1 0
2 0
3 0
4 0
5 0
6 01
2
34
5
6
78
9
10
T hick ness (m )
Fig. (16): Iso-resistivity contour map of Fig. (17): Isopach contour map of layer "B1" of layer "B1"
A l B leazih
A l akolah
T o E l K H arga
T o E l D akhla
25 24'
25 27'
29 21' 29 24' 29 27'
0 1 2 3 K m.S cale
L egan dV E S locationH and dug wellle
P aved road
35
55
75
95
115
1351
2
34
5
6
78
9
10
R esistivity(O hm -m )
A l B leazih
A l akolah
T o E l K H arga
T o E l D akhla
25 24'
25 27'
29 21' 29 24' 29 27'
0 1 2 3 K m.S cale
L egandV E S locationH and dug wellle
P aved road
29.5
33.5
37.5
41.51
2
34
5
6
78
9
10
T hickn ess (m )
Fig. (18): Iso-resistivity contour map of Fig. (19): Isopach contour map of layer "B2" layer "B2"
A l B leazih
A l akolah
T o E l K H arga
T o E l D akhla
25 24'
25 27'
29 21' 29 24' 29 27'
0 1 2 3 K m.S cale
L egan dV E S location
H and dug wellle
P aved road
129.5
131.5
133.5
135.5
137.51
2
34
5
6
78
9
10
G roundwater flow direction
Fig.(20): water level contour map for Fig. (21): Recovery Test curve for Taref sandstne well no. 1 beside VES no.1
15

Structural impact on the groundwateroccurrence
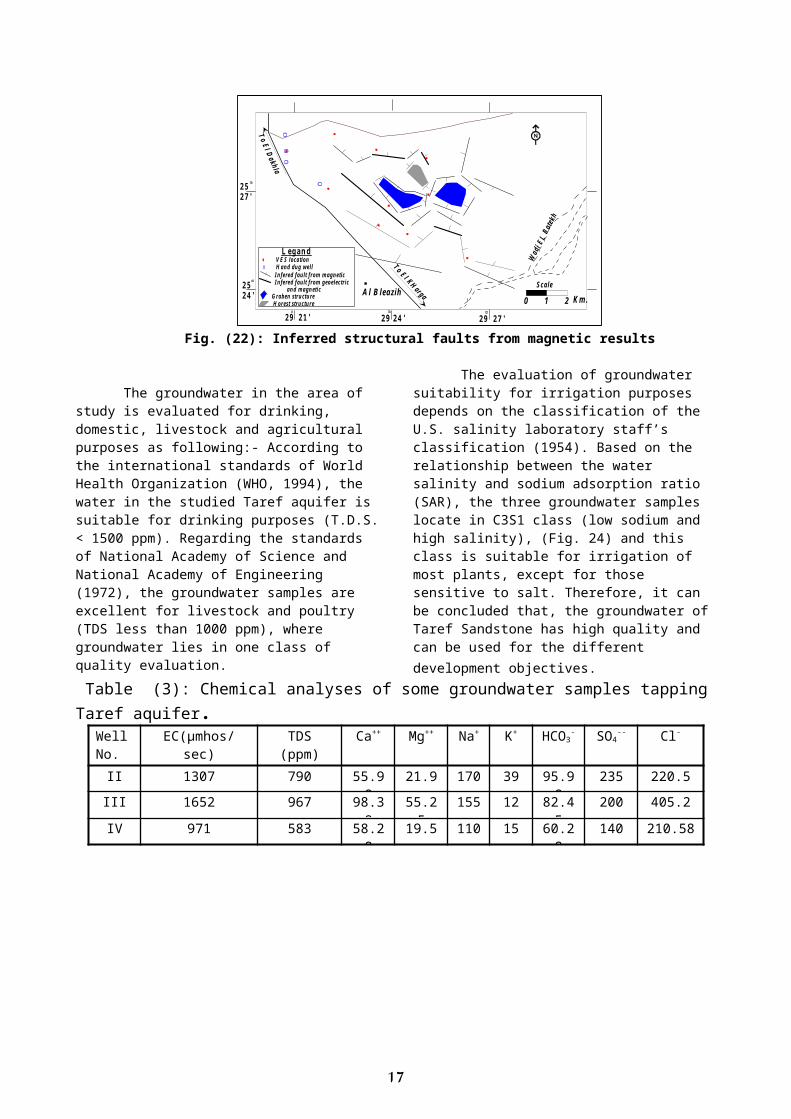
The results deduced from themagnetic interpretation (level map ofthe basement surface, Fig.12) and thegeoelectric cross-sections (Figs. 14and 15) are used to construct the mapof the dominant structural elementsaffecting the study area (Fig.22). The inferred faultsaffecting the basement surface alongthe study area are represented by agroup of normal faults having, moreor less E-W, NE-SW, NW-SE and N-Strends (Fig.22). The NW trend is themost dominant one. These faults varyin length from major to minor faults.The detected faults derived from thegeoelectric study (F1-F4) wereconfirmed well with those detectedfrom the magnetic study, and the
other faults were detected only fromthe magnetic results where themagnetic survey gives more structuraldetails compared with the geoelectricstudy. These faults affect thethickness of Taref Sandstone, as awater-bearing formation, where itsthickness decreases southward andcause the Sabaya Sandstone to occuragainst Taref Sandstone on the otherside of the faults and disappear atthe extreme south. This effect can beillustrated from some local grabensand a horst near the middle part ofthe study area. The major effect isrepresented by a group of step faultswith the down thrown side due north.Therefore; the thickness of thewater-bearing Nubian sandstoneincreases generally northward anddecreases southward.
The groundwater salinity andquality
In the present work, three groundwater samples were collected from hand dug wells, representing the unconfined Taref Sandstone aquifer. The groundwater salinities of these samples are 583, 790 and 1035 ppm (wells nos. IV, III and II, respectively Fig.3). The hydrochemicalcharacteristics of this groundwater have been determined through the chemical analyses of the samples representing this aquifer (Table 3). The ion concentrations, the sodium andchloride dominate the other ions in the majority of the groundwater
samples. The sequence of ion dominanceof both cations and anions in the water follows the order Na+>Ca>Mg++ andCl->SO4
--> HCO3-. So, the chemical water
type is sodium chloride. The groundwater salinity of the Taref aquifer shows a general decrease with time (Fig. 23). This is mainly attributed to the continuous recharge of Taref Sandstone from the underlyingSabaya aquifer of less groundwater salinity (Ghoubachi, 2001) through fault plains. This coincides well withthe hydrogeologic connection concludedfrom the constructed geoelectrical cross-sections.
16
A l B leazih
Wad
i EL
B atekh
T o E l K H arga
T o E l D akhla
25 24'
25 27'
29 21' 29 24' 29 27'
L egan dV E S locationH and dug well
0 1 2 K m.S cale
Infered fault from magneticInfered fault from geoelectric and magnetic
G raben stru ctu re H orest structure
Fig. (22): Inferred structural faults from magnetic results
The groundwater in the area of study is evaluated for drinking, domestic, livestock and agricultural purposes as following:- According to the international standards of World Health Organization (WHO, 1994), the water in the studied Taref aquifer is suitable for drinking purposes (T.D.S.< 1500 ppm). Regarding the standards of National Academy of Science and National Academy of Engineering (1972), the groundwater samples are excellent for livestock and poultry (TDS less than 1000 ppm), where groundwater lies in one class of quality evaluation.
The evaluation of groundwater suitability for irrigation purposes depends on the classification of the U.S. salinity laboratory staff’s classification (1954). Based on the relationship between the water salinity and sodium adsorption ratio (SAR), the three groundwater samples locate in C3S1 class (low sodium and high salinity), (Fig. 24) and this class is suitable for irrigation of most plants, except for those sensitive to salt. Therefore, it can be concluded that, the groundwater of Taref Sandstone has high quality and can be used for the different development objectives.
Table (3): Chemical analyses of some groundwater samples tappingTaref aquifer.
WellNo.
EC(µmhos/sec)
TDS(ppm)
Ca++ Mg++ Na+ K+ HCO3- SO4
-- Cl-
II 1307 790 55.98
21.9 170 39 95.98
235 220.5III 1652 967 98.3
855.25
155 12 82.45
200 405.2IV 971 583 58.2
819.5 110 15 60.2
8140 210.58
17

I I I I I I V
W e ll n o .
Fig. (23 ): Comparing the groundwater salinity with time for three well
Fig. (24): Classification of groundwater for irrigation ( U.S. Salinity Labortory Staff method, 1954)
SUMMARY AND CONCLUSIONSIntegrated geophysical (magnetic
and geoelectric) and hydrogeological studies were carried out in the area east of El Dakhla depression to evaluate the Nubian Sandstone aquifer in East El-Dakhla depression. The quantitative interpretation of the land magnetic measurements through thefour measured profiles revealed that, the depths to the basement are
variable in the study area. This variation in the basement depths is due to the role of subsurface structures affecting the study area. The dominant structural faults were determined from the constructed basement level contour map. The quantitative interpretation of the geoelectric resistivity sounding data led to the detection of four main geoelectrical units (A, B, C and D), which correspond to Quaternary
18

deposits, Taref Sandstone, Maghrabi Formation and Sabaya Sandstone. The geoelectric units (B and D), as a partof the Nubia Sandstone (Taref Sandstone and Sabaya Sandstone) represent the water-bearing rock unitsin the area East of El Dakhla depression. The linear structural elements have a role in the hydrogeological connection between thetwo water-bearing units in the investigated area. The groundwater flow of Taref Sandstone aquifer is from the west to the east. The hydraulic parameters of the Taref Sandstone aquifer in East El-Dakhla depression, in the form of transmissivity and hydraulic conductivity, were determined
According to the results of the present geophysical study, it could beconcluded that:1- The maximum depths to the basement rocks were recorded at the middle and northern parts (max. depth 1550 m.). On the other hand, the depths decreasesouthwards (min. depth 815 m.).2- The geological structures that affect the basement surface were represented by a group of step faults.Their downthrowns are generally towardthe northern and middle parts of the study area. This leads to increasing
the thickness of the Nubia Sandstone at these sites.3- The water-bearing rock units in thestudy area are represented by Taref Sandstone (geoelectric layers B1 and B2) and Sabaya Sandstone (unit D). These two aquifers are separated by the confining clay of Maghrabi Formation (unit C) in the northern part of the study area. 4-The groundwater salinity of Taref Sandstone decreases with time, due to the hydrogeologic connection between Taref Sandstone and the underlying aquifer of Sabaya Sandstone, as attributed to the effect of structuralfaults.5- The groundwater tapping Taref Sandstone is suitable for the different development objectives (drinking, livestock, poultry and irrigation).6- Generally, the northern part of thestudy area (VES 1 to VES 4) is the most suitable for drilling either handdug wells taping the Taref Sandstone or deep wells taping the Taref, Sabayaand the Six Hills Formations. On the other hand, the southern part of the study area is suitable for drilling wells tapping the Sabaya Sandstone andSix Hills Formation.
REFERENCESAttia, M. J. (1954): "Groundwater in Egypt" Bull. De l'Inst. Du Egypt 4, No. 1, 15 p. Ball, J. (1927): "Problems of the Libyan Desert" Geogr. J. London, 70p.Boettcher, R. (1982): "Die Abu Ballas Formation (Lingula shale) (Apt.?)der Nubischen Grupper Sudwest Agyptens. Eine Bechreibung der Formation under Besonderer Berucksichtinung der palaontologie" Berliner geowissenschaftliche Abhandlungen; A.Vol.39, 145 p.Borelli, M. and Karanjae, J. (1968):"Kharga and Dakhla Oases determination of hydrogeological and hydraulic
parameters " Report presented to Egyptian General Desert Development Organization by Industry project. Zaghreb, Yougoslavia, 50 p. CONOCO (1987): Geological map of Egypt. Scale 1:500,000Cooper, H. H. and Jacob, C. E. (1946):"A generalized graphical method for evaluating formation constants and summarizing well field history, Am. Geophys. Union Trans., Vol.27, PP. 526-534. Dominik, W. (1987): "Stratigraphie undSedimentologie (Geochemie, Schwermineral analyse) der Oberkreide von Baharyia und ihre correlation zum Dakhla- Becken
19

(Western Desert, Egypt):"Berliner geowissenschaftliche Abhandlungen; A, Vol. 62, 173p.Ezzat, M. A.(1975): "Groundwater series in the Arab Republic of Egypt Exploration of groundwater in El-Wadi El-Gedid project area: part III , General Desert Development Authority, Ministry of irrigation , Cairo, 149 p.Geosoft programs, 1994, Specialized geophysical processing and interpretation programs and mapping system Geosoft incorpoayed, 204 Ritchmond st. W. Toronto, Ontario, Canada.Ghoubachi, S. Y., (2001): "Hydrogeological characteristics of the Nubia sandstone aquifer system in Dakhla depression, Western Desert Egypt." M.Sc Thesis, Faculty of Science , Ain Shams Univ., p260 Helal, A. H. (1965): "Jurassic spores and pollen grains from the kharga Oasis, Western Desert, Egypt." N. Jb. Geol. Paleontol. Abh. 123: PP. 160-166Hermina, M. H, GHobrial, M. G. and Issawi, B. (1961): "The Geologyof Dakhla area" Ministry of Industry, Geol. Mineral Res. Dept.., 33p., Cairo. Ibrahim, M. M, (1957): "The effect of the static electrical charges on wind erosion and the origin of the depressions in the Libyan Desert " Abs. Proc. Geol. Soc., Egypt, Vol.2, PP. 23-24.Interprx Limited. 1996, RESIX- PLUS. Resistivity data interpretation software, v. 2.39., Golden, Colorado, USA.Kamel, H. A. (1993): "The effect of exploration project on the groundwaterof the Nubia sandstone aquifer in Eastgreat African Desert" E.G.S. Proc. Of 11 th . Ann.met, Cairo invited paper (in Arabic), 25 pKlitzsch, E. and Lejal-Nicol, A. (1984): "Flora and funa from strata inSouthern Egypt and Northern Sudan" Berliner geowissenschaftliche Abhandlungen; A, Vol. 50. PP. 47-79
Mitwally, N. (1953): "Physiographic features of Oases of the Libyan Desert" Bull. Inst. Desert d' Egypt, Vol.3, No. 2, Pp. 143-163National Academy of science and National Academy of Engineering (1972): "Water quality criteria "Protection Agency, Washington, D.C., 594 p. Russeger, J. (1837): " Kreide und Sandstein" Einfluss on Granit antfletzteren, Neues Jahrb. MineralogiABd., PP. 665-669.Said, R. 1962, The Geology of Egypt, Elsevier Publ. Co., Amesterdam, 377p.Said, R. (1990): "The geology of Egypt" Balkema, Rotterdam, 734p. Schrank, E. (1987): "Paleozoik and Mesozoic palynomorphs from NE-Africa (Egypt/ Sudan) Berliner geowissenschaftliche Abhandlungen, A, Vol. 75, PP. 249-310.Shata, A. (1953): "Newlight on the structural developments of the WesternDesert of Egypt" Bull. Inst. Desert, Cairo. Vol.3, No. 1, Pp. 101-107.Shata, A., Knetsch, G. and El Shazly, M.et al.(1962): "The geology origin and age of the groundwater supplies insome desert areas of U.A.R" Bull. Inst. Desert d'Egypt, Tome XII, No. 2,PP. 61-124. Soliman, H. A. (1977): "Foraminiferes et microfossiles vegetaux provenant du"Nubia Sandstone"de subsurface de l' Oase El Kharga desert de l' oust, Egypte, Rev. Micropaleontol, Vol.90, PP. 114-124.Theis, C. V. (1935):"The relation between the Lowering of the piezometric surface and the rate of duration of discharge of a well using groundwater storage, Trans. Am. Geoph.Union, Vol. 16, PP. 519-524U. S Salinity laboratory Staff (1954):"Diagnosis and improvement of saline and alkali soils " U. S. Dept.Agr., handbook No. 60, Washington, D.C., 160 p.Thorweihe, U. and Heinl, M. (1993): "Groundwater resources and Management
20

in SW Egypt" Catena Supplement, Biomineralization process of Iron and Manganese. Berliner geowissenschaftliche Abhandlungen, Vol. 26, PP. 99-121.World Health Organization(WHO); (1971): "International standards for drinking waters" Geneva World Health Organization, 70 p.Youssef, M. S. and Hassan, H. M. ( 1968): "Groundwater hydrochemical investigations in Dakhla Oasis area"
Special report on Gen. Des. Dev. Auth., Cairo, No. 2, 21 p. Van Der Velpen, B. P. A., 1988, “RESIST”, version 1.0, a package for the processing of the resistivity soundind data: M. Sc. Research Project, ITC, Deft, the Netherlands.
21