hydrogeological investigation 603-643, 645-699 kingston road ...

NAMIBIA
Department of Water Affairs DWA
Windhoek
FEDERAL REPUBLIC OF GERMANY Federal Institute for Geosciences
and Natural Resources BGR
Hannover
TECHNICAL COOPERATION
PROJECT NO.: 2001.2475.0
Investigation of Groundwater Resources and Airborne-Geophysical Investigation of Selected
Mineral Targets in Namibia
Volume IV.GW.2.1
Groundwater Investigations in the Eastern Caprivi Region
Main Hydrogeological Report
Windhoek & Hannover
April 2005

Technical Cooperation Project Investigation of Groundwater Resources and Airborne-Geophysical Investigation of Selected Mineral Targets in Namibia Groundwater Investigations in the Eastern Caprivi Region Main Hydrogeological Report
Page I
Volume IV.GW.2.1
Groundwater Investigations in the Eastern Caprivi Region
Main Hydrogeological Report
Authors: Dr. Armin Margane (BGR), Dr. Roland Baeumle (DWA), Dr.
Frieder Schildknecht (BGR), Annelise Wierenga (AGES) Commissioned by: Federal Ministry for Economic Cooperation and Development
(Bundesministerium für wirtschaftliche Zusammenarbeit und Entwicklung, BMZ)
Project: Investigation of Groundwater Resources and Airborne-Geophysical Investigation of Selected Mineral Targets in Namibia
BMZ-No.: 2001.2475.0 BGR-Archive No.: Date of issuance: April 2005 No. of pages: 148

Technical Cooperation Project Investigation of Groundwater Resources and Airborne-Geophysical Investigation of Selected Mineral Targets in Namibia Groundwater Investigations in the Eastern Caprivi Region Main Hydrogeological Report
Page II
Table of Contents FOREWORD .......................................................................................................................................... 1 1 SUMMARY........................................................................................................................................ 2 2 INTRODUCTION............................................................................................................................... 3 3 GENERAL CONDITIONS................................................................................................................. 8
3.1 CLIMATIC CONDITIONS................................................................................................................... 8 3.2 SOILS ........................................................................................................................................... 14 3.3 SOCIO-ECONOMIC CONDITIONS .................................................................................................. 16 3.4 HYDROLOGY................................................................................................................................. 17 3.5 GEOLOGICAL SETUP .................................................................................................................... 25 3.6 STRUCTURAL SETUP ................................................................................................................... 28
4 PREVIOUS INVESTIGATIONS...................................................................................................... 30 5 SUMMARY OF DRILLING RESULTS............................................................................................ 33 6 GROUNDWATER RESOURCES................................................................................................... 37
6.1 DESCRIPTION OF AQUIFER SYSTEM ............................................................................................ 37 6.1.1 Information from Water and Exploration Wells (Hydrogeological Database) ................... 37 6.1.2 Information from Geophysical Surveys .................................................................................. 39 6.1.3 Lateral and Vertical Extent of the Aquifer System ................................................................ 45
6.2 GROUNDWATER FLOW PATTERN ................................................................................................ 47 6.3 HYDRAULIC PARAMETERS ........................................................................................................... 51 6.4 HYDROCHEMICAL CHARACTERISTICS ......................................................................................... 55
6.4.1 Groundwater Quality ................................................................................................................. 57 6.4.2 Isotopic Composition................................................................................................................. 69
6.5 GROUNDWATER MONITORING ..................................................................................................... 75 6.6 GROUNDWATER EXPLOITATION POTENTIAL................................................................................ 75
7 WATER DEMAND .......................................................................................................................... 77 8 RECOMMENDATIONS AND CONCLUSIONS.............................................................................. 80 9 REFERENCES................................................................................................................................ 83 ANNEX 1: LITHOLOGICAL LOGS OF BOREHOLES DRILLED BY THE PROJECT ....................... 86 ANNEX 2: GROUNDWATER DATABASE .......................................................................................... 95 ANNEX 3: BOREHOLE LOCATION MAP ......................................................................................... 117 ANNEX 4: SPATIAL DISTRIBUTION OF LITHOLOGICAL UNITS................................................... 118 ANNEX 5: HYDROCHEMICAL DATA................................................................................................ 120 ANNEX 6: GUIDELINE VALUES OF THE NAMIBIAN DRINKING WATER GUIDELINE ................ 125 ANNEX 7: ISOTOPE DATA OF THE IAEA STUDY .......................................................................... 127 ANNEX 8: REPORT ON THE INTERPRETATION OF ENVIRONMENTAL ISOTOPE DATA ......... 128 ANNEX 9: TOPOGRAPHIC SURVEY OF DWA-BGR BOREHOLES ............................................... 147 ANNEX 10: LOCATIONS AND NAMES OF VILLAGES IN THE EASTERN CAPRIVI..................... 148

Technical Cooperation Project Investigation of Groundwater Resources and Airborne-Geophysical Investigation of Selected Mineral Targets in Namibia Groundwater Investigations in the Eastern Caprivi Region Main Hydrogeological Report
Page III
List of Figures Figure 1: General Topography in the Eastern Caprivi Region, Location of HEM
Survey Area (blue line), TEM soundings (grey-blue stars) and Drilling Sites (blue borehole symbols) ............................................................................................... 5
Figure 2: General Topography in the Eastern Caprivi Region, based on Wireframe Feature ................................................................................................................ 6
Figure 3: Landsat TM 7 Satellite Image of the Eastern Caprivi Region (Channels 7-4-1) with location of boreholes drilled by the project............................................... 7
Figure 4: Spatial Distribution of Precipitation in Namibia ............................................ 8 Figure 5: Annual Rainfall at Katima Mulilo (old station) .............................................. 9 Figure 6: Annual Rainfall at Katima Mulilo (new station) .......................................... 10 Figure 7: Average Monthly Rainfall at Katima Mulilo (old station)............................. 10 Figure 8: Average Monthly Rainfall at Katima Mulilo (new station)........................... 11 Figure 9: Annual Potential Evaporation at Katima Mulilo.......................................... 11 Figure 10: Monthly Potential Evaporation at Katima Mulilo ...................................... 12 Figure 11: Rainfall Minus Evaporation...................................................................... 12 Figure 12: Spatial Distribution of Potential Evaporation in Namibia.......................... 13 Figure 13: Average Monthly Maximum and Minimum Temperatures at Katima Mulilo
.......................................................................................................................... 14 Figure 14: Dominant Soil Types in Eastern Caprivi .................................................. 15 Figure 15: Soil Texture in Eastern Caprivi ................................................................ 15 Figure 16: Political Boundaries and distribution of Population in the Eastern Caprivi16 Figure 17: Monthly Average Runoff at Kongola /Kwando River................................ 18 Figure 18: Annual Runoff at Kongola/Kwando River ................................................ 19 Figure 19: Daily Streamflow at Lianshulu/Kwando River .......................................... 19 Figure 20: Monthly Average Runoff at Lianshulu/Kwando River............................... 20 Figure 21: Annual Runoff at Lianshulu/Kwando River .............................................. 20 Figure 22: Differences in Monthly Runoff between the Stations at Kongola and at
Lianshulu (water years 1994/95 – 2002/03) ...................................................... 21 Figure 23: Differences in Annual Runoff between the Stations at Kongola and at
Lianshulu ........................................................................................................... 22 Figure 24: Topographic Gradients near Kwando and Zambezi Rivers ..................... 23 Figure 25: Daily Runoff at Katima Mulilo/Zambezi River .......................................... 24 Figure 26: Monthly Average Runoff at Katima Mulilo/Zambezi River........................ 24 Figure 27: Annual Runoff at Katima Mulilo/Zambezi River ....................................... 25 Figure 28: Map showing the Regional Geological Setup (based on 1:1,000,000
Geological Map of Namibia; GSN, 1980)........................................................... 26 Figure 29: Assumed Distribution of Karoo Deposits under Kalahari Cover in
Botswana........................................................................................................... 27 Figure 30: Schematic Block Diagram showing Assumed Block Faulting in the Eastern
Caprivi and Adjacent Areas ............................................................................... 28 Figure 31: Lineament Analysis based on SRTM Topography Data in the Greater
Caprivi Area....................................................................................................... 29 Figure 32: Yield and Location of Boreholes drilled by KfW....................................... 32 Figure 33: Generalized Classification of the Drilling Results with Respect to the
Hydrogeological Concept .................................................................................. 34 Figure 34: Boreholes with Lithological Logs (borehole symbol)................................ 38

Technical Cooperation Project Investigation of Groundwater Resources and Airborne-Geophysical Investigation of Selected Mineral Targets in Namibia Groundwater Investigations in the Eastern Caprivi Region Main Hydrogeological Report
Page IV
Figure 35: Location of TEM soundings and Section Lines and assumed Horizontal Distribution of Rock Resistivities at 120 m Depth .............................................. 39
Figure 36: North-South Vertical Section along TEM line 1 Showing Assumed Resistivity Distribution ....................................................................................... 40
Figure 37: Assumed Resistivity Distribution at 40 m bgl Based on a Helicopter Electromagnetic Survey..................................................................................... 42
Figure 38: Distribution of Total Dissolved Solids (TDS; in mg/l) in the Upper Aquifer (grey line: HEM survey area; blue symbols: new DWA-BGR boreholes)........... 43
Figure 39: Assumed Resistivity Distribution at 20 m bgl Based on a Helicopter Electromagnetic Survey..................................................................................... 44
Figure 40: Depth to Magnetic Basement (modified after SIEMON et al., 2005)........ 45 Figure 41: Schematic Concept showing the Structure of the Aquifer System in the
Eastern Caprivi .................................................................................................. 46 Figure 42: Groundwater Flow Pattern in the Upper Aquifer in the Eastern Caprivi
Region ............................................................................................................... 49 Figure 43: Groundwater Flow Pattern in the Lower Aquifer in the Eastern Caprivi
Region ............................................................................................................... 50 Figure 44: Recommended Yields (m³/h) of Boreholes drilled by DWA/BGR in the
Lower Aquifer of the Eastern Caprivi ................................................................. 53 Figure 45: Yields (m³/h) of Boreholes in the Upper Aquifer of the Eastern Caprivi ... 53 Figure 46: Transmissivities (m²/d) of Upper Aquifer (including WW identification
numbers; orange symbols/numbers: DWA/BGR boreholes; blue symbols/numbers: KfW boreholes).................................................................... 54
Figure 47: Transmissivities (m²/d) of Lower Aquifer (including WW identification numbers; orange symbols/numbers: DWA/BGR boreholes) ............................. 55
Figure 48: Water Quality Areas for the Upper Aquifer .............................................. 56 Figure 49: TDS Distribution in the Upper Aquifer (blue borehole symbol: DWA-BGR-
boreholes) ......................................................................................................... 59 Figure 50: Predominance of Calcium in the Upper Aquifer (meq%) ......................... 59 Figure 51: Predominance of Bicarbonate in the Upper Aquifer (meq%) ................... 60 Figure 52: Predominance of Sodium in the Upper Aquifer (meq%) .......................... 60 Figure 53: Ratio of Sodium/(Calcium+Magnesium) in the Upper Aquifer ................. 61 Figure 54: Ratio of Sodium/Chloride in the Upper Aquifer ........................................ 61 Figure 55: Chloride Contents in the Upper Aquifer (mg/l) ......................................... 62 Figure 56: Sulphate Contents in the Upper Aquifer (mg/l) ........................................ 62 Figure 57: Nitrate (NO3-N) Contents in the Upper Aquifer (mg/l).............................. 63 Figure 58: Iron Contents in the Upper Aquifer (mg/l) ................................................ 63 Figure 59: Fluoride Contents in the Upper Aquifer (mg/l) ......................................... 64 Figure 60: Distribution of Water Types in the Eastern Caprivi Region...................... 65 Figure 61: Stability of Water in Relation with Redox- and pH-Conditions ................. 66 Figure 62: Piper Diagram showing Water Composition for the Boreholes Drilled
Within the DWA-BGR Project ............................................................................ 67 Figure 63: δ 18O Values in the Upper Aquifer (‰) .................................................... 71 Figure 64: δ D Values in the Upper Aquifer (‰) ....................................................... 72 Figure 65: δ D versus δ 18O Relationship ................................................................. 72 Figure 66: Tritium Values in the Upper Aquifer (TU)................................................. 73 Figure 67: 14C Values in the Upper Aquifer (pMC).................................................... 73 Figure 68: 14C Values in the Lower Aquifer (pMC).................................................... 74 Figure 69: Relationship of 14C (pMC) with δ13C (‰) ................................................ 74
Technical Cooperation Project Investigation of Groundwater Resources and Airborne-Geophysical Investigation of Selected Mineral Targets in Namibia Groundwater Investigations in the Eastern Caprivi Region Main Hydrogeological Report
Page V
Figure 70: Relationship of 3H (TU) with 14C (pMC) ................................................... 75 Figure 71: Water Supply Network in the Linyanti Region ......................................... 79 List of Tables Table 1: Stratigraphy in NE-Namibia (modified after CHRISTELIS & STRUCKMEIER,
2001) ................................................................................................................. 25 Table 2: Results of INTERCONSULT Drilling Campaign in the Eastern Caprivi....... 30 Table 3: Results of KfW Drilling Campaign in the Eastern Caprivi............................ 32 Table 4: Basic Data of Boreholes Drilled within the Framework of the Project ......... 33 Table 5: Lithology and Thickness of Penetrated Rock units ..................................... 35 Table 6: Characteristics of Aquifer Units in the Eastern Caprivi ............................... 36 Table 7: Design of Step Tests .................................................................................. 52 Table 8: Results of Step Tests.................................................................................. 52 Table 9: Design of Constant Discharge Tests .......................................................... 54 Table 10: Results of Constant Discharge Tests........................................................ 54 Table 11: Maximum and Average Contents of the Main Hydrochemical Elements in
the Upper Aquifer .............................................................................................. 57 Table 12: Chemical Composition of Groundwater in the Lower Aquifer ................... 68 Table 13: Uncorrected Mean Residence Times in the Upper Aquifer....................... 70 Table 14: Uncorrected Mean Residence Times in the Lower Aquifer....................... 70

Technical Cooperation Project Investigation of Groundwater Resources and Airborne-Geophysical Investigation of Selected Mineral Targets in Namibia Groundwater Investigations in the Eastern Caprivi Region Main Hydrogeological Report
Page VI
Abbreviations a year asl above (mean) sea level B Linear well-loss coefficient (h/m2) bgl below ground level BGR Bundesanstalt für Geowissenschaften und Rohstoffe, Germany BIWAC Bittner Water Consult, Windhoek C Non-linear well-loss coefficient (h2/m5) CBA Carr Barbour & Associates CD Constant discharge CDT Constant discharge test CES Consulting Engineers Salzgitter, Germany D deuterium DWA Department of Water Affairs, Namibia E Well efficiency (%) EC Electric conductivity (mS/m) GMWL global meteoric water line GSD Geological Survey Department, Botswana GSN Geological Survey of Namibia GTZ Gesellschaft fuer Technische Zusammenarbeit, Eschborn, Germany HEM Helicopter electromagnetics HLEM Horizontal loop electromagnetics IAEA International Atomic Energy Agency, Vienna KfW Kreditanstalt fuer Wiederaufbau, Frankfurt, Germany Lat Latitude LCE Lund Consulting Engineers, Windhoek Long Longitude MRT Mean residence time MY Million years MCM Million cubic meters NOLIDEP Northern Livestock Development Programme P Exponent in non-linear well loss term or pMC Percent modern carbon Q Pumping rate (m³/h) Qrec Recommended maximum abstraction (m³/h) RWL Rest water level (m below datum) S Storage coefficient smax Maximum drawdown during pumping test (m) sres Residual drawdown after recovery (m) SRTM Shuttle Radar Topography Mission T Transmissivity (m²/d) or T Temperature TEM Time-domain electromagnetics TD Total depth TDS Total dissolved solids (mg/l) TU Tritium units uPVC unplasticized polyvinyl chloride UTM Universal Transverse Mercator

Technical Cooperation Project Investigation of Groundwater Resources and Airborne-Geophysical Investigation of Selected Mineral Targets in Namibia Groundwater Investigations in the Eastern Caprivi Region Main Hydrogeological Report
Page VII
VES Vertical electric soundings WAPCOS Water and Power Consultancy Services, New Delhi, India WCE Windhoek Consulting Engineers yr(s) Year(s)

Technical Cooperation Project Investigation of Groundwater Resources and Airborne-Geophysical Investigation of Selected Mineral Targets in Namibia Groundwater Investigations in the Eastern Caprivi Region Main Hydrogeological Report
Page 1
Foreword
This report is part of a series of Technical Reports published by the Technical Cooperation Project “Investigation of Groundwater Resources and Airborne-Geophysical Investigation of Selected Mineral Targets in Namibia”, which is being implemented by the Federal Institute of Geosciences and Natural Resources (BGR), Germany, and the Department of Water Affairs (DWA). This project started in October 2002 and ends with its first phase in March 2005. This report documents the hydrogeological situation in the Eastern Caprivi Region as it is known to date. Within the framework of the project four deep and two shallow boreholes have been drilled with the aim to investigate the deep aquifer, especially to:
• Delineate the extent of the fresh groundwater body and the general chemical composition of the groundwater;
• Determine its hydraulic properties, and • Evaluate the exploitation potential of this aquifer.
All basic data related to the drilling program are documented in Volume IV.GW.2.2: Groundwater Investigations in the Eastern Caprivi Region – Documentation Compendium on the 2004 Drilling Campaign (WIERENGA et al., 2004). The pumping test evaluations are documented in Volume IV.GW.2.3: Groundwater Investigations in the Eastern Caprivi Region – Evaluation of Pumping Tests (MARGANE & BAEUMLE, 2004).
Technical Cooperation Project Investigation of Groundwater Resources and Airborne-Geophysical Investigation of Selected Mineral Targets in Namibia Groundwater Investigations in the Eastern Caprivi Region Main Hydrogeological Report
Page 2
1 Summary
The aim of this study was to investigate whether there are fresh groundwater resources of sufficient exploitation potential in the Eastern Caprivi which may be used for rural or even semi-urban water supply. To meet this objective, extensive geophysical investigations were carried out, both on ground and by helicopter. The aim of the helicopter electromagnetic survey was to detect possible fresh groundwater resources in the upper 50 m of the southern part of the Eastern Caprivi. Based on previous drilling results it was assumed that this area contains mostly brackish groundwater in the upper 80 m. The result of the geophysical measurements confirms the previous assumption that the chances to find fresh groundwater resources which may be sufficient for rural water supply in this area are small. There may be fresh groundwater resources of small extent in channel-like topographic lows in the central part of the surveyed area, however, their exploitation potential is very low. Furthermore it is assumed that there are fresh groundwater resources in the southwestern and extreme northeastern part of the surveyed area at shallow depth. In the former, however, exploitation is difficult due to frequent flooding of the area. In the latter it is likely that only very little amounts of groundwater may be developed. Later geophysical investigations therefore concentrated on the possibility of finding fresh groundwater resources at greater depths, since most previous boreholes were drilled only to around 100 m depth. This required the use of vertical electric soundings (VES) or time-domain electromagnetics (TEM). Since VES proved to be difficult to conduct, TEM soundings were carried out in the western and central part of the Eastern Caprivi. The results of these measurements pointed towards the possible existence of fresh groundwater resources underneath the Upper Aquifer at depths exceeding 80-120 m. It was assumed that this Lower Aquifer is separated from the Upper Aquifer by a more or less continuous clayey aquitard. The geophysical investigation was followed by a drilling program. However, due to limited budget only six boreholes could be drilled. Four of these boreholes penetrated a high yielding rock unit below a depth of 125-135 m in the western part of the Eastern Caprivi. This Lower Aquifer consists of fine to coarse grained sandstone or semi-consolidated sand and is covered by an aquitard of bluish-green clay with a thickness of 15-25 m. Whereas the Upper Aquifer becomes increasingly brackish towards east and south, fresh groundwater of good drinking water quality has been encountered in the Lower Aquifer at all drilling locations. Basalt has been found at three locations underneath the Lower Aquifer. At the southernmost drilling location basalt is either deeper than the total depth of the borehole or non-existing. At the drilling locations the Lower Aquifer had a thickness of between 55 and > 125 m and a transmissivity ranging from 58 to 774 m²/d. This aquifer has therefore a higher exploitation potential and is freshwater bearing in a larger area than the Upper Aquifer. The aquifer is therefore seen as a possible additional source for rural or semi-urban water supply, especially in those areas which are presently not or
Technical Cooperation Project Investigation of Groundwater Resources and Airborne-Geophysical Investigation of Selected Mineral Targets in Namibia Groundwater Investigations in the Eastern Caprivi Region Main Hydrogeological Report
Page 3
insufficiently supplied by piped surface water and where groundwater resources in the Upper Aquifer are not usable for drinking purposes due to elevated mineralization. Even though it is assumed that the Lower Aquifer occurs at greater depth under the Upper Aquifer in large parts of the Eastern Caprivi, the knowledge about the extent and distribution of yield, transmissivity and salinity is presently insufficient. Before the start of a development program it is therefore recommended to conduct further investigations in the Lower Aquifer.
2 Introduction
The Project Area comprises the Linyanti, Sibbinda, Kongola and Katima Mulilo administrative constituencies and covers an area of 11,877 km². Despite the fact that the Eastern Caprivi Region receives the highest amount of rainfall it is still one of the areas with the lowest population densities in Namibia. Under South African rule military bases were established in the Caprivi Region which has caused a substantial change in the settlement pattern and development of the area. Despite the fact that the major rivers, which bound the area to the West, South and East, carry enormous amounts of water, surface water plays a major role for water supply only in the immediate vicinity of the riverine areas. Most other rural areas heavily rely on groundwater resources. However, groundwater is frequently of poor quality and available in insufficient quantities. Especially in the area between the villages of Masokotwane and Batubaja along the southern highway (C49; Kongola–Linyanti–Katima Mulilo), groundwater is predomin-antly of poor quality, and the DWA is investigating the different water supply options in this region. An option to overcome water supply problems presented the construction of a 60 km long pipeline from Katima Mulilo to Linyanti, and the RWS Directorate is currently already in the process to carry out the establishment of this pipeline network. The other option would be the supply from local groundwater resources, if suitable. It is for this reason that the present investigation was initiated, the aim being a more precise delineation of groundwater quality in the southern part of the Eastern Caprivi Region and the study of an alternative supply from the deeper part of the aquifer system. The study comprised
• A helicopter electromagnetic survey (HEM; SIEMON et al., 2004; SIEMON et al., 2005) in the southern part of the Eastern Caprivi, with the aim of investigating the resistivity distribution in the shallow part of the aquifer system,
• The performance of time-domain electromagnetic (TEM) ground measurements throughout the Eastern Caprivi, aiming at proving information about the resistivity distribution in the deeper part of the aquifer system, and

Technical Cooperation Project Investigation of Groundwater Resources and Airborne-Geophysical Investigation of Selected Mineral Targets in Namibia Groundwater Investigations in the Eastern Caprivi Region Main Hydrogeological Report
Page 4
• The drilling of 6 boreholes to the north of the HEM survey area (Figure 1). The project area comprises the Eastern Caprivi Strip between:
UTM-E 740,000 – 930,000 UTM-N 7,950,000 – 8,070,000
equivalent to (lower left – upper right) LAT -18.52617 – -17.41398 LONG 23.27492 – 25.04757
of UTM zone 34S. The regional topographic conditions governing the project area are shown in Figures 1 and 2. These maps were prepared based on Shuttle Radar Topography Mission (SRTM) data which were recorded in February 2000. Data represent a 90 m * 90 m grid and elevation accuracy is estimated at 4 m. Topography in the project area varies between approximately 1030 and 930 m asl. Surface water drainage is controlled by the Kwando River, Linyanti River, Chobe River, and Zambezi River, all of which are cut into unconsolidated Kalahari sediments. The topographic maps as well as the satellite image reveal the presence of a graben structure trending in a SW-NE (50°) direction (Figure 3). For a better orientation Annex 10 shows the locations and names of all villages in the Eastern Caprivi.

Technical Cooperation Project Investigation of Groundwater Resources and Airborne-Geophysical Investigation of Selected Mineral Targets in Namibia Groundwater Investigations in the Eastern Caprivi Region Main Hydrogeological Report
Page 5
Figure 1: General Topography in the Eastern Caprivi Region, Location of HEM Survey Area (blue line), TEM soundings (grey-blue stars) and Drilling Sites (blue borehole symbols) (elevation scale in m asl; orange contours; labels indicating TDS content in mg/l)

Technical Cooperation Project Investigation of Groundwater Resources and Airborne-Geophysical Investigation of Selected Mineral Targets in Namibia Groundwater Investigations in the Eastern Caprivi Region Main Hydrogeological Report
Page 6
a)
b)
Figure 2: General Topography in the Eastern Caprivi Region, based on Wireframe Feature
(SURFER; 50 m intervals, elevation scale in m asl); a) view angle: 215° b) view angle: 35°

Technical Cooperation Project Investigation of Groundwater Resources and Airborne-Geophysical Investigation of Selected Mineral Targets in Namibia Groundwater Investigations in the Eastern Caprivi Region Main Hydrogeological Report
Page 7
Figure 3: Landsat TM 7 Satellite Image of the Eastern Caprivi Region (Channels 7-4-1) with location of boreholes drilled by the project

Technical Cooperation Project Investigation of Groundwater Resources and Airborne-Geophysical Investigation of Selected Mineral Targets in Namibia Groundwater Investigations in the Eastern Caprivi Region Main Hydrogeological Report
Page 8
3 General Conditions
3.1 Climatic Conditions
The general distribution of precipitation in Namibia is shown in Figure 4. It depicts an average rainfall of 450-500 mm/a in the project area.
Figure 4: Spatial Distribution of Precipitation in Namibia (adopted from NEW et al., 1999;
blue line: Investigation Area)

Technical Cooperation Project Investigation of Groundwater Resources and Airborne-Geophysical Investigation of Selected Mineral Targets in Namibia Groundwater Investigations in the Eastern Caprivi Region Main Hydrogeological Report
Page 9
There is presently only one rainfall station in the area, located at Katima Mulilo. Rainfall was registered at the old station until 1978, and then resumed in 1987 at the new station. Annual rainfall measurements at those two stations, however, show entirely different pictures. Whereas rainfall measurements varied strongly at the old station between 262 and 1473 mm/a (Figure 5; average 693 mm/a), measurements are more constant at the new station, fluctuating between 419 and 692 mm/a (Figure 6; average 514 mm/a). It remains unclear whether this may be due to different registration methods/staff or reflects true variations in the amount of rainfall. Peak rainfall is commonly reached during the month of January (Figures 7 and 8). There is commonly almost no precipitation during the months of June to August.
Annual Rainfall at Station 1269510 Katima Mulilo
738
393
884
298 262
623
974
823 803
987
725 713
1473
592645 664
541
852
493
262
568 601
821
583
474
606
1004
396
1127
818
536
1060
911
0
200
400
600
800
1000
1200
1400
1600
1945
/46
1947
/48
1949
/50
1951
/52
1953
/54
1955
/56
1957
/58
1959
/60
1961
/62
1963
/64
1965
/66
1967
/68
1969
/70
1971
/72
1973
/74
1975
/76
1977
/78
water year
rain
fall
(mm
/a)
average: 693 mm/a
Figure 5: Annual Rainfall at Katima Mulilo (old station)

Technical Cooperation Project Investigation of Groundwater Resources and Airborne-Geophysical Investigation of Selected Mineral Targets in Namibia Groundwater Investigations in the Eastern Caprivi Region Main Hydrogeological Report
Page 10
Annual Rainfall at Station 126948 Katima Mulilo
599.2
691.7
510.6475
419.3
623.3
470.8
597.4556.5
638.9
519.5
673.6645.4
0
100
200
300
400
500
600
700
800
1987
/88
1988
/89
1989
/90
1990
/91
1991
/92
1992
/93
1993
/94
1994
/95
1995
/96
1996
/97
1997
/98
1998
/99
1999
/ 0
water year
rain
fall
[mm
/a]
average: 514.3
Figure 6: Annual Rainfall at Katima Mulilo (new station)
Monthly Average Rainfall at Station 1269510 Katima Mulilo(1945/46 - 1977/78)
20.4
72.7
146
176
162.8
97.4
20.4
1.8 0.6 0 0.5 2.10
20
40
60
80
100
120
140
160
180
200
Oct Nov Dec Jan Feb Mar Apr May Jun Jul Aug Sep
month
rain
fall
(mm
)
Figure 7: Average Monthly Rainfall at Katima Mulilo (old station)

Technical Cooperation Project Investigation of Groundwater Resources and Airborne-Geophysical Investigation of Selected Mineral Targets in Namibia Groundwater Investigations in the Eastern Caprivi Region Main Hydrogeological Report
Page 11
Monthly Average Rainfall at Station 126948 Katima Mulilo(1987/88 - 1999/2000)
16.4
54.3
126.5
145.7
125.4
69.8
8.81.4 0 0 0 2.8
0
20
40
60
80
100
120
140
160
Oct Nov Dec Jan Feb Mar Apr May Jun Jul Aug Sep
month
rain
fall
[mm
]
Figure 8: Average Monthly Rainfall at Katima Mulilo (new station)
Evaporation measurements are available from Katima Mulilo. They indicate a relatively constant annual potential evaporation of around 2,500 mm (Figure 9), ranging between 150 mm/month in June and 300 mm/month in October (Figure 10). Possibilities for groundwater recharge from rainfall are low due to the large evaporation excess even during peak rainfall months (Figure 11).
Annual Evaporation at Station 1269E510 Katima Mulilo
0
500
1000
1500
2000
2500
3000
1958
/59
1959
/60
1960
/61
1961
/62
1962
/63
1963
/64
1964
/65
1965
/66
1966
/67
1967
/68
1968
/69
1969
/70
1970
/71
1971
/72
1972
/73
1973
/74
1974
/75
1975
/76
1976
/77
1977
/78
1978
/79
1979
/80
1980
/81
water year
evap
orat
ion
(mm
/a)
average: 2507 mm/a
Figure 9: Annual Potential Evaporation at Katima Mulilo

Technical Cooperation Project Investigation of Groundwater Resources and Airborne-Geophysical Investigation of Selected Mineral Targets in Namibia Groundwater Investigations in the Eastern Caprivi Region Main Hydrogeological Report
Page 12
Monthly Average Evaporation at Station 1269E510 Katima Mulilo
301.87
240.73
204.6 198.04184.78
210.52
190.73181.26
154.43
172.56
214.43
253.04
0
50
100
150
200
250
300
350
Oct Nov Dec Jan Feb Mar Apr May Jun Jul Aug Sep
month
evap
orat
ion
(mm
/mon
th)
Figure 10: Monthly Potential Evaporation at Katima Mulilo
Rainfall and Evaporation at Katima Mulilo(station 1269510)
-400
-300
-200
-100
0
100
200
300
400
Oct Nov Dec Jan Feb Mar Apr May Jun Jul Aug Sep
month
amou
nt (m
m)
rainfallevaporationrainfall-evaporation
Figure 11: Rainfall Minus Evaporation

Technical Cooperation Project Investigation of Groundwater Resources and Airborne-Geophysical Investigation of Selected Mineral Targets in Namibia Groundwater Investigations in the Eastern Caprivi Region Main Hydrogeological Report
Page 13
Based on global data from Namibia (Figure 12) potential evaporation in the project area also is in the range of 2400 to 2600 mm/a.
Figure 12: Spatial Distribution of Potential Evaporation in Namibia (adopted from DWA, unpublished data)
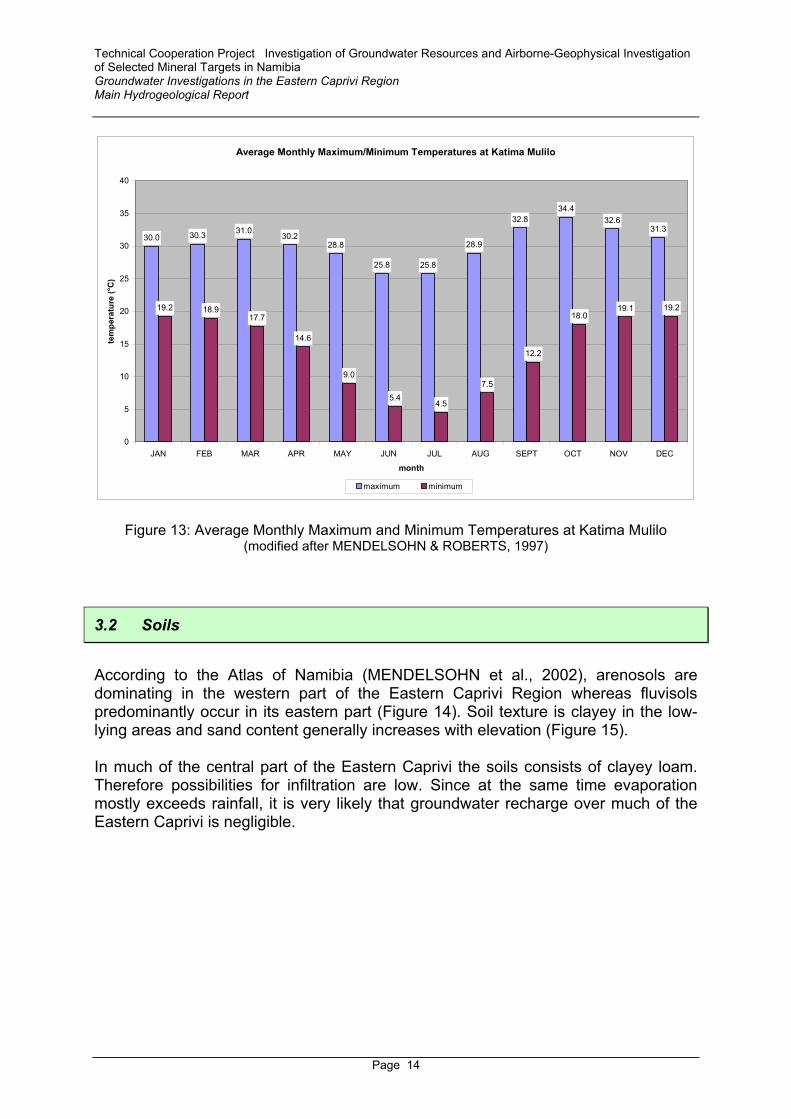
Mean monthly maximum temperatures are relatively constant, ranging between 25.8°C during June and July and 34.4°C in October (Figure 13).
Technical Cooperation Project Investigation of Groundwater Resources and Airborne-Geophysical Investigation of Selected Mineral Targets in Namibia Groundwater Investigations in the Eastern Caprivi Region Main Hydrogeological Report
Page 14
Average Monthly Maximum/Minimum Temperatures at Katima Mulilo
30.0 30.3 31.030.2
28.8
25.8 25.8
28.9
32.834.4
32.631.3
19.2 18.917.7
14.6
9.0
5.44.5
7.5
12.2
18.019.1 19.2
0
5
10
15
20
25
30
35
40
JAN FEB MAR APR MAY JUN JUL AUG SEPT OCT NOV DEC
month
tem
pera
ture
(°C
)
maximum minimum
Figure 13: Average Monthly Maximum and Minimum Temperatures at Katima Mulilo (modified after MENDELSOHN & ROBERTS, 1997)
3.2 Soils
According to the Atlas of Namibia (MENDELSOHN et al., 2002), arenosols are dominating in the western part of the Eastern Caprivi Region whereas fluvisols predominantly occur in its eastern part (Figure 14). Soil texture is clayey in the low-lying areas and sand content generally increases with elevation (Figure 15). In much of the central part of the Eastern Caprivi the soils consists of clayey loam. Therefore possibilities for infiltration are low. Since at the same time evaporation mostly exceeds rainfall, it is very likely that groundwater recharge over much of the Eastern Caprivi is negligible.

Technical Cooperation Project Investigation of Groundwater Resources and Airborne-Geophysical Investigation of Selected Mineral Targets in Namibia Groundwater Investigations in the Eastern Caprivi Region Main Hydrogeological Report
Page 15
Figure 14: Dominant Soil Types in Eastern Caprivi
(adopted from MENDELSOHN et al., 2002)
Figure 15: Soil Texture in Eastern Caprivi (adopted from INTERCONSULT, 2000)

Technical Cooperation Project Investigation of Groundwater Resources and Airborne-Geophysical Investigation of Selected Mineral Targets in Namibia Groundwater Investigations in the Eastern Caprivi Region Main Hydrogeological Report
Page 16
3.3 Socio-Economic Conditions
The Eastern Caprivi Region is divided into 5 constituencies: Katima Mulilo, Kabe, Sibinda, Kongola and Linyanti (Figure 16).
Figure 16: Political Boundaries and distribution of Population in the Eastern Caprivi The total number of population at the time of the last census in 1996 was around 74,000. Population density is highest along the major infrastructure lines. Population growth rate is quite high: during the past 90 years the population number has risen by an average of 3.3 % per year, exceeding 4 % during the past three decades. More than 40 % of the population is younger than 15 years. The main source of income is provided by crop and stock farming. Due to the poor soil fertility in many areas (see below), fields can only successfully be cultivated on clayey, loamy soils, i.e. mainly along a narrow strip close to the main rivers. As a main base for income and self-sufficiency, the number of cattle has grown enormously since the country’s independence, exceeding 120,000 in 1996.

Technical Cooperation Project Investigation of Groundwater Resources and Airborne-Geophysical Investigation of Selected Mineral Targets in Namibia Groundwater Investigations in the Eastern Caprivi Region Main Hydrogeological Report
Page 17
3.4 Hydrology
The surface water courses in the project area are part of the Zambezi surface water catchment area. There are four perennial water courses in the area (Figure 1), the
• Kwando River, • Linyanti River, • Chobe River and • Zambezi River.
The Kwando River has its origin in Angola and covers a catchment of some 120,000 km2 before it crosses into Caprivi. At the Angolan border the Kwando River has a main channel approximately 30 m wide and a flood plain of about 2 km width with various side channels and oxbow lakes. Soon after the Kwando River passes the village of Balelwa it enters a region known as the Linyanti Swamp (Figure 3). The Linyanti River bed is approximately 10 km wide and composed of a few isolated open water channels with the majority of the region being swampy. As the satellite image shows (Figure 3), this Linyanti swamp is sharply bounded on the Botswana side where the terrain is slightly higher. It is believed that the southeastern limit of the swamp follows a major fault line, along which the southeastern side has been uplifted. When water levels are high enough, the Kwando River connects with the Zambezi River through the Linyanti River, Lake Liambezi and Chobe River. At such times the Kwando River may also collect water from the Okavango River through the Selinda Spillway. The Linyanti River drains into Lake Liambezi, which during periods of flooding covers an area of more than 260 km2. Drainage into Lake Liambezi also occurs from the local catchment area and from the Bukalo Channel, by which Lake Liambezi receives water from the Zambezi River at times of peak floods. Water from Lake Liambezi is flowing out to the Chobe swamp of the Chobe River to the east. During periods of high flow in the Zambezi, backwater pushes up the Chobe from the confluence and it has been observed that back flows reached Lake Liambezi. Since 1981 the levels of Lake Liambezi started to drop significantly and the lake has been dry since 1985. The base flow of the Kwando River is not sufficient to support both Lake Liambezi and the Linyanti Swamp and River. During runoff peaks in the Zambezi and the Kwando there is a high risk of flooding especially in the low-lying eastern parts of the eastern Caprivi (MENDELSOHN & ROBERTS, 1997). Streamflow of the Kwando River is monitored at Kongola (Station 2400M01; LAT -17.7902°/LONG 23.34553°; UTM-E 748497/ UTM-S 8031379, zero elevation gauging plate: 960.37 m, size of catchment area: 170,000 km²) since 1969/70 and at Lianshulu (Station 2400M20; LAT -18.03877°/LONG 23.32346°; UTM-E 745813/ UTM-S 8003892) since June 1994. The flow in the Kwando River is relatively

Technical Cooperation Project Investigation of Groundwater Resources and Airborne-Geophysical Investigation of Selected Mineral Targets in Namibia Groundwater Investigations in the Eastern Caprivi Region Main Hydrogeological Report
Page 18
constant, revealing only significant peaks at times of very intensive rainfall, because this river drains a large swampy area in Angola, slowing and delaying runoff. The long-term average of annual runoff at Kongola is 941 MCM/a (Figure 18). The average annual runoff of the time period 1994/95 – 2002/03 is 644 MCM/a. Average monthly runoff is relatively stable, varying between 72 MCM in November and December and 96 MCM during June (Figure 17). The daily records (Figure 19) show that streamflow at Lianshulu is commonly above 8 m³/s throughout the years. The lowest runoff is mostly recorded during the months of November, however, peak runoff may occur at different times of the year. The monthly average of the time period 1994/95 – 2002/03 amounts to 39.1 MCM (Figure 20) and the yearly to 469 MCM (Figure 21).
Average Monthly Runoff at Station 2400M01 Kongola/Kwando
78.8
71.4 71.675.5 77.5
89.685.3
90.393.5
95.992.7
0.0
20.0
40.0
60.0
80.0
100.0
120.0
Oct Nov Dec Jan Feb Mar Apr May Jun Jul Aug
month
runo
ff (M
CM
)
monthly average: 87.6 MCM
Figure 17: Monthly Average Runoff at Kongola /Kwando River

Technical Cooperation Project Investigation of Groundwater Resources and Airborne-Geophysical Investigation of Selected Mineral Targets in Namibia Groundwater Investigations in the Eastern Caprivi Region Main Hydrogeological Report
Page 19
Annual Runoff at Station 2400M01 Kongola/Kwando15
97.1
1487
.5
770.
8
1429
.1
2101
.6
1729
.4
921.
5
835.
2
868.
1
878.
2
911.
7
928.
0
785.
6
1024
.9
1062
.2
793.
7
659.
4 783.
2
842.
4
583.
6
471.
8
521.
3
483.
4
503.
0 685.
4 864.
5 1021
.5
658.
4
0.0
500.0
1000.0
1500.0
2000.0
2500.0
1969
/70
1971
/72
1972
/73
1973
/74
1974
/75
1980
/81
1981
/82
1982
/83
1983
/84
1984
/85
1985
/86
1986
/87
1987
/88
1988
/89
1989
/90
1990
/91
1991
/92
1992
/93
1993
/94
1994
/95
1995
/96
1996
/97
1997
/98
1998
/99
1999
/ 0
2000
/ 1
2001
/ 2
2002
/ 3
wateryear
runo
ff (M
CM
)
average: 941 MCM/a
Figure 18: Annual Runoff at Kongola/Kwando River
Streamflow at Lianshulu
0
5
10
15
20
25
30
35
01-01-1994 01-01-1995 01-01-1996 31-12-1996 01-01-1998 01-01-1999 01-01-2000 31-12-2000 01-01-2002 01-01-2003 01-01-2004
time
disc
harg
e (m
³/sec
)
Figure 19: Daily Streamflow at Lianshulu/Kwando River

Technical Cooperation Project Investigation of Groundwater Resources and Airborne-Geophysical Investigation of Selected Mineral Targets in Namibia Groundwater Investigations in the Eastern Caprivi Region Main Hydrogeological Report
Page 20
Monthly Average Runoff at Lianshulu/Kwando River
36.133.7
35.9
39.037.9
43.4
40.8 40.439.0
41.342.4
39.3
0.0
5.0
10.0
15.0
20.0
25.0
30.0
35.0
40.0
45.0
50.0
Oct Nov Dec Jan Feb Mar Apr May Jun Jul Aug Sep
month
runo
ff [M
CM
]
average: 39.1 MCM/month
Figure 20: Monthly Average Runoff at Lianshulu/Kwando River
Annual Runoff at Lianshulu/Kwando River
431.2
335.5356.2
328.0
390.9
548.9579.5
725.0
528.1
0.0
100.0
200.0
300.0
400.0
500.0
600.0
700.0
800.0
1994/95 1995/96 1996/97 1997/98 1998/99 1999/ 0 2000/ 1 2001/ 2 2002/ 3
wateryear
runo
ff [M
CM
]
average: 469 MCM/a
Figure 21: Annual Runoff at Lianshulu/Kwando River
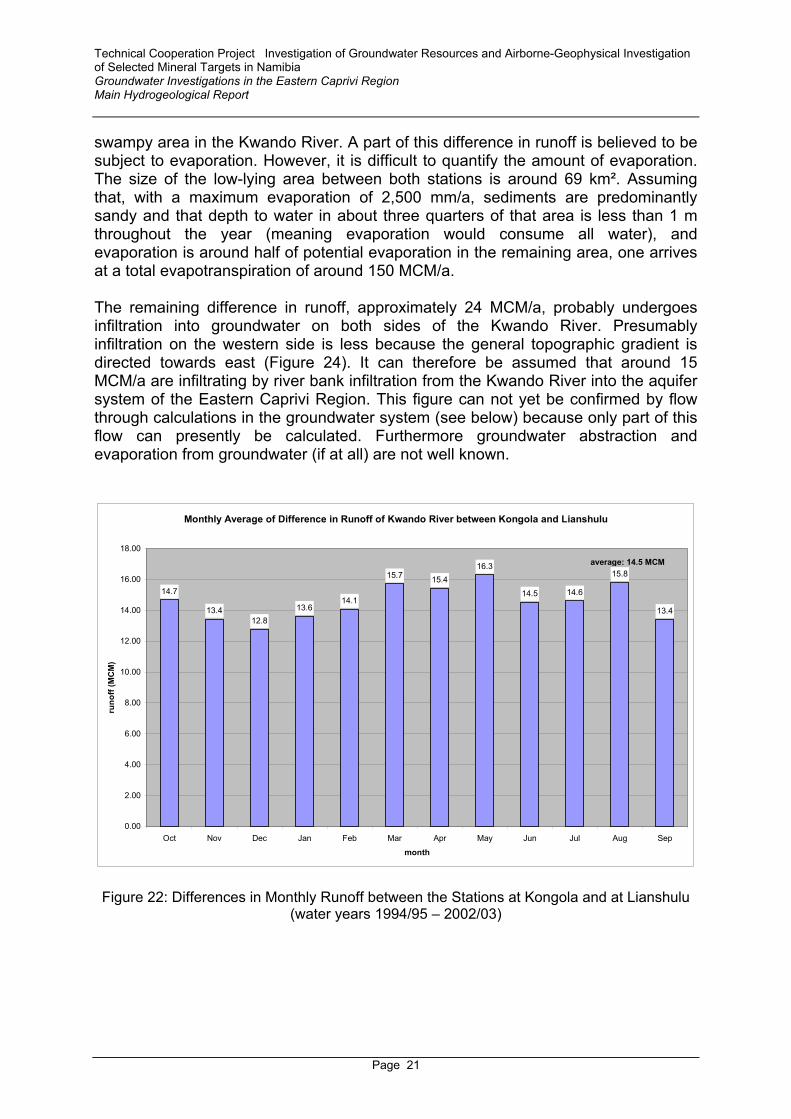
The difference in runoff between the two stations is considerable. During the time period 1994/95 – 2002/03 it amounts to 174 MCM/a and 14.5 MCM/month, respectively (Figures 22 and 23). The runoff gauge Lianshulu is located north of the
Technical Cooperation Project Investigation of Groundwater Resources and Airborne-Geophysical Investigation of Selected Mineral Targets in Namibia Groundwater Investigations in the Eastern Caprivi Region Main Hydrogeological Report
Page 21
swampy area in the Kwando River. A part of this difference in runoff is believed to be subject to evaporation. However, it is difficult to quantify the amount of evaporation. The size of the low-lying area between both stations is around 69 km². Assuming that, with a maximum evaporation of 2,500 mm/a, sediments are predominantly sandy and that depth to water in about three quarters of that area is less than 1 m throughout the year (meaning evaporation would consume all water), and evaporation is around half of potential evaporation in the remaining area, one arrives at a total evapotranspiration of around 150 MCM/a. The remaining difference in runoff, approximately 24 MCM/a, probably undergoes infiltration into groundwater on both sides of the Kwando River. Presumably infiltration on the western side is less because the general topographic gradient is directed towards east (Figure 24). It can therefore be assumed that around 15 MCM/a are infiltrating by river bank infiltration from the Kwando River into the aquifer system of the Eastern Caprivi Region. This figure can not yet be confirmed by flow through calculations in the groundwater system (see below) because only part of this flow can presently be calculated. Furthermore groundwater abstraction and evaporation from groundwater (if at all) are not well known.
Monthly Average of Difference in Runoff of Kwando River between Kongola and Lianshulu
14.7
13.412.8
13.614.1
15.7 15.416.3
14.5 14.6
15.8
13.4
0.00
2.00
4.00
6.00
8.00
10.00
12.00
14.00
16.00
18.00
Oct Nov Dec Jan Feb Mar Apr May Jun Jul Aug Sep
month
runo
ff (M
CM
)
average: 14.5 MCM
Figure 22: Differences in Monthly Runoff between the Stations at Kongola and at Lianshulu
(water years 1994/95 – 2002/03)

Technical Cooperation Project Investigation of Groundwater Resources and Airborne-Geophysical Investigation of Selected Mineral Targets in Namibia Groundwater Investigations in the Eastern Caprivi Region Main Hydrogeological Report
Page 22
Annual Difference in Runoff of Kwando River between Kongola and Lianshulu
152.4136.3
165.1155.4
112.1
136.5
285.0296.5
130.3
0.00
50.00
100.00
150.00
200.00
250.00
300.00
350.00
1994/95 1995/96 1996/97 1997/98 1998/99 1999/ 0 2000/ 1 2001/ 2 2002/ 3
wateryear
runo
ff (M
CM
)
average: 174.4 MCM
Figure 23: Differences in Annual Runoff between the Stations at Kongola and at Lianshulu
Technical Cooperation Project Investigation of Groundwater Resources and Airborne-Geophysical Investigation of Selected Mineral Targets in Namibia Groundwater Investigations in the Eastern Caprivi Region Main Hydrogeological Report
Page 23
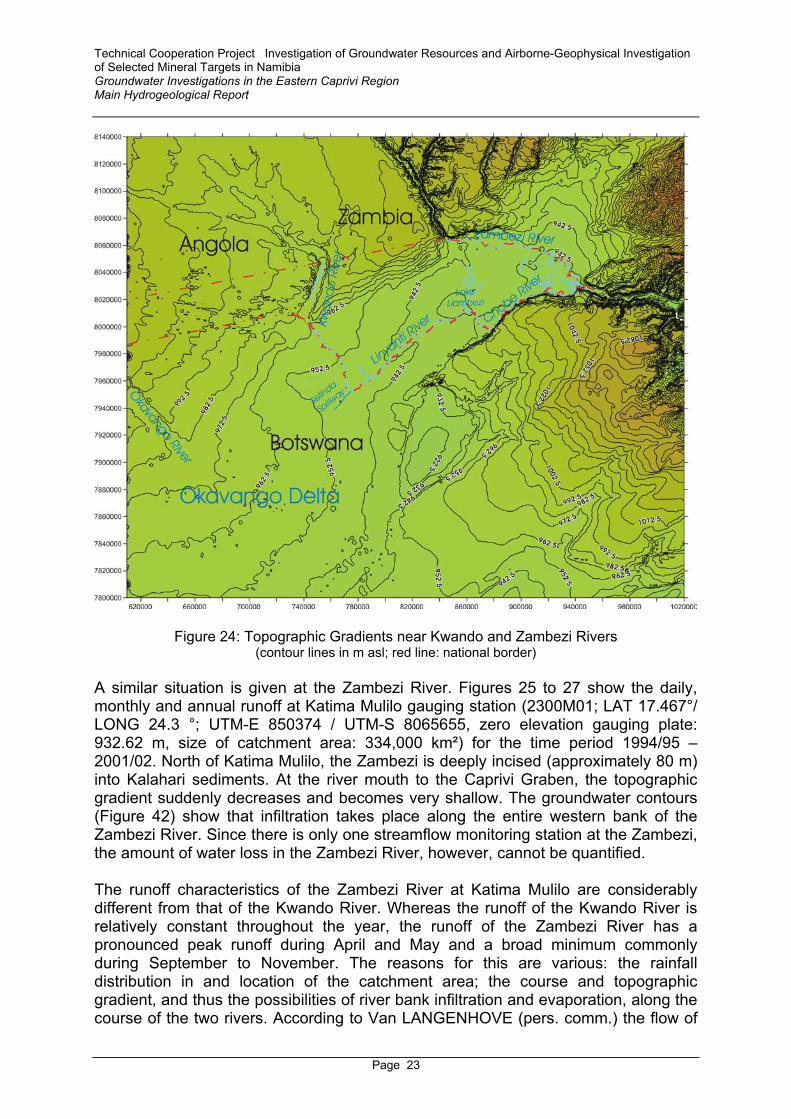
Figure 24: Topographic Gradients near Kwando and Zambezi Rivers (contour lines in m asl; red line: national border)
A similar situation is given at the Zambezi River. Figures 25 to 27 show the daily, monthly and annual runoff at Katima Mulilo gauging station (2300M01; LAT 17.467°/ LONG 24.3 °; UTM-E 850374 / UTM-S 8065655, zero elevation gauging plate: 932.62 m, size of catchment area: 334,000 km²) for the time period 1994/95 – 2001/02. North of Katima Mulilo, the Zambezi is deeply incised (approximately 80 m) into Kalahari sediments. At the river mouth to the Caprivi Graben, the topographic gradient suddenly decreases and becomes very shallow. The groundwater contours (Figure 42) show that infiltration takes place along the entire western bank of the Zambezi River. Since there is only one streamflow monitoring station at the Zambezi, the amount of water loss in the Zambezi River, however, cannot be quantified. The runoff characteristics of the Zambezi River at Katima Mulilo are considerably different from that of the Kwando River. Whereas the runoff of the Kwando River is relatively constant throughout the year, the runoff of the Zambezi River has a pronounced peak runoff during April and May and a broad minimum commonly during September to November. The reasons for this are various: the rainfall distribution in and location of the catchment area; the course and topographic gradient, and thus the possibilities of river bank infiltration and evaporation, along the course of the two rivers. According to Van LANGENHOVE (pers. comm.) the flow of

Technical Cooperation Project Investigation of Groundwater Resources and Airborne-Geophysical Investigation of Selected Mineral Targets in Namibia Groundwater Investigations in the Eastern Caprivi Region Main Hydrogeological Report
Page 24
the Kwando is more constant because it passes through a large swamp which acts like a sponge.
Daily Runoff at Station 2300M01 Katima Mulilo
5844
0
1000
2000
3000
4000
5000
6000
01-01
-1994
01-01
-1995
01-01
-1996
31-12
-1996
01-01
-1998
01-01
-1999
01-01
-2000
31-12
-2000
01-01
-2002
01-01
-2003
01-01
-2004
31-12
-2004
time
runo
ff (m
³/s)
Figure 25: Daily Runoff at Katima Mulilo/Zambezi River
Average Monthly Runoff at Station 2300M01 Katima Mulilo(1994/95-2001/02)
0
1000
2000
3000
4000
5000
6000
7000
8000
OCT NOV DEC JAN FEB MAR APR MAY JUN JUL AUG SEP
time
runo
ff (M
CM
)
Figure 26: Monthly Average Runoff at Katima Mulilo/Zambezi River

Technical Cooperation Project Investigation of Groundwater Resources and Airborne-Geophysical Investigation of Selected Mineral Targets in Namibia Groundwater Investigations in the Eastern Caprivi Region Main Hydrogeological Report
Page 25
Annual Runoff at Station 2300M01 Katima Mulilo
0
5000
10000
15000
20000
25000
30000
35000
40000
45000
50000
1994/95 1995/96 1996/97 1997/98 1998/99 1999/00 2000/01 2001/02
time
runo
ff (M
CM
)
average: 28700 MCM/a
Figure 27: Annual Runoff at Katima Mulilo/Zambezi River
3.5 Geological Setup
The geological setup in the project area is not very well known since most of the area is covered by Kalahari sediments and only few deeper penetrating wells exist. Based on the succession further to the West, the lithostratigraphic succession in the project area is expected to be as follows: Table 1: Stratigraphy in NE-Namibia (modified after CHRISTELIS & STRUCKMEIER, 2001)
Group Formation Age Age (MY) Kalahari Recent –
Tertiary/? Upper Cretaceous
0-65 (135)
Disconformity (65-130 MY) Karoo Rundu Fm./Kalkrand Fm. (Basalt)
Etjo Fm. (Sst) Omingonde Fm.
Jurassic – Permian
135-300
Erosion (300-500 MY) Damara Mulden Group
Otavi Group Nosib Group
Namibian – Early Cambrian
500-1000
Pre-Damara Gamsberg Suite Abbabis Complex Grootfontein Complex Hohenwarte Complex
Cambrian – Precambian

Technical Cooperation Project Investigation of Groundwater Resources and Airborne-Geophysical Investigation of Selected Mineral Targets in Namibia Groundwater Investigations in the Eastern Caprivi Region Main Hydrogeological Report
Page 26
Figure 28: Map showing the Regional Geological Setup (based on 1:1,000,000 Geological
Map of Namibia; GSN, 1980) (J – Jurassic basalts; Tk – Tertiary Kalahari sediments; C-TR – Karoo, undifferentiated)
The Eastern Caprivi is dominated at the surface by Kalahari deposits. The geological map (Figure 28; GSN, 1980) shows a thickness of Kalahari deposits in this area exceeding 150 m. No lithostratigraphic differentiation of the Kalahari has been undertaken to date. Apart from Kalahari sediments, Karoo basalt has been reported from various areas: - basalt under 9 to 16 m of silcrete at the rapids of the Zambezi upstream of Katima
Mulilo (source: www.klausdierks.com; internet; described as C-TR on geological map)
- basalt at the rapids and in water boreholes near Katima Mulilo (BIESCHEUVEL, 1980)
- basalt at the confluence of the Chobe and Zambezi Rivers (J in above geological map)
- basalt near Ngoma at the Chobe River (J in above geological map) - borehole WW37223 (UTM-E 821909, UTM-S 8054555): a section of 84 m of
basalt was penetrated between 80 to 164 m depth (= TD). The basalt near Ngoma can clearly be identified on the satellite image (Figure 3). Strangely enough, no basalt has been reported from water wells thus far except for borehole WW37223. The composition and age of the basalts in the Eastern Caprivi is presently unknown. However, basalt has also been reported from Zambia (DRYSDALL & WELLER, 1966) where it is believed to underlie the Kalahari of the Barotseland Basin. EALES et al. (1984) mention that they believe that the Caprivi is

Technical Cooperation Project Investigation of Groundwater Resources and Airborne-Geophysical Investigation of Selected Mineral Targets in Namibia Groundwater Investigations in the Eastern Caprivi Region Main Hydrogeological Report
Page 27
underlain by basalt. The basalts in the Zambezi Valley were dated at 166 MY and it is likely that the basalts in the Caprivi are of the same age. WCE (2000) present a map showing the pre-Kalahari near surface rock units in the Caprivi. According to this map, Etjo sandstone (equivalent to Cave Sandstone in Botswana) should be present underneath the Kalahari sediments in the entire southwestern part of the Eastern Caprivi which, however, could not be confirmed by the present drilling campaign. This hypothesis may have been based on a map prepared by the Geological Survey Department of Botswana (GSD 1981) showing the distribution of the Karoo in Botswana. This map (Figure 29) shows the presence of Stormberg lavas (Upper Karoo) south of the Chobe River and in the area west of the Kwando River and south of the eastern part of the Western Caprivi. Outcrops of Karoo lavas in Botswana are described by SMITH (1984). A description of the lava composition is given in ELLIS (1978). This description is based on deep boreholes drilled for coal exploration underneath the Stormberg Lava in the Nata Sub-Basin/Botswana, located to the SE of the project area. There the volcanic sequence consists of several successions of lava flows each up to 50 m thick. In each flow there is a basal zone which is finer grained, fractured, associated with thin tuffaceous bands and commonly of purplish grey color. In the thicker flows a core of fine to medium crystalline dolerite developed, which is dark grey-green, fresher and more massive. Thin red sandy siltstones occur between some lava flows where the tops had been laterized. Below the laterite a thin band of more acidic lava is reported, whereas a zone of andesitic lava is recognized at the bottom of the flow.
Figure 29: Assumed Distribution of Karoo Deposits under Kalahari Cover in Botswana (modified after GSD 1981)

Technical Cooperation Project Investigation of Groundwater Resources and Airborne-Geophysical Investigation of Selected Mineral Targets in Namibia Groundwater Investigations in the Eastern Caprivi Region Main Hydrogeological Report
Page 28
3.6 Structural Setup
The presence of SW-NE (50°) trending faults was inferred from the analysis of the Landsat TM 7 image (Figure 3) and the topography (Figure 31) as well as from the depth to basalt known from different locations. Figure 30 shows a schematic block diagram of the possible tectonic evolution in the Eastern Caprivi Region. It is assumed that uplifting in the East occurred probably during late Tertiary times and that the center of the Caprivi Graben was downlifted along SW-NE trending faults probably in response to NW-SE dilatation (σ1 = 50°). The compressional force would then be σ3 = 140°. Three main faults are believed to form the graben structure:
• In the North faults are assumed to follow the pronounced topographic gradient (Figures 1 and 31).
• In the center the Linyanti is since long times believed to follow a major fault due to the fact that the Kwando River turns abruptly at the intersection with this fault and that the higher elevated southeastern bank of the Linyanti River forms a sharp contrast to the swampy area to the northwest of it; the assumed Linyanti Fault is in direct continuation of the assumed Okavango Delta Fault which bounds the Okavango Delta to the south (Figure 31).
• The Chobe Fault trends in the same direction as the former and is marked by a steep slope at the southern boundary of the Caprivi Graben to the hills in the Kasane area (Botswana).
Figure 30: Schematic Block Diagram showing Assumed Block Faulting in the Eastern Caprivi
and Adjacent Areas

Technical Cooperation Project Investigation of Groundwater Resources and Airborne-Geophysical Investigation of Selected Mineral Targets in Namibia Groundwater Investigations in the Eastern Caprivi Region Main Hydrogeological Report
Page 29
Another direction which is typically found is trending around 20° and may correspond to right lateral shear faults. An analysis of the regional topography clearly reveals the presence of numerous lineaments of the above mentioned directions (Figure 31).
Figure 31: Lineament Analysis based on SRTM Topography Data in the Greater Caprivi Area
(blue line: Eastern Caprivi Region; for data source compare Chapter 2)

Technical Cooperation Project Investigation of Groundwater Resources and Airborne-Geophysical Investigation of Selected Mineral Targets in Namibia Groundwater Investigations in the Eastern Caprivi Region Main Hydrogeological Report
Page 30
4 Previous Investigations
Numerous drilling programs have been conducted in the Eastern Caprivi until present. An overview on the hydrogeology is given by a desk study prepared by INTERCONSULT (1991, 1992). This company carried out a comprehensive hydrocensus with hydrochemical sampling, geophysical investigations (72 vertical electrical soundings, 36.3 km magnetic field profiling), the drilling of 15 exploration boreholes with test pumping in the Eastern Caprivi area. A total of 228 boreholes and 230 dug wells were inventoried during the first phase of the project, many of which were dry or not operated for various reasons. The results of the INTERCONSULT drilling program are summarized in Table 2. Table 2: Results of INTERCONSULT Drilling Campaign in the Eastern Caprivi
YIELD [m³/h]
no. of wells
DEPTH [m]
no. of wells
<1 3 <=50 51-5 1 >50-100 9
5-10 0 >100-150 110-20 2 >150-200 0
>20 2 >200 0total 8 total 15
Eighteen boreholes were drilled in the framework of a ‘Feasibility Study for the Development of Water Supply’ in 1993 (CES & LCE, 1994) in the Eastern Caprivi, funded by KfW. In 1996, WAPCOS Ltd., an Indian Contractor, drilled 34 boreholes in the eastern part of the Project Area between Katima Mulilo and Ngoma. 30 of the 34 boreholes were successful in terms of water quality and quantity and were installed with the Mark II, an Indian made hand pump (WAPCOS, 1995, 1996). In 1997, CNI, a Chinese Contractor, drilled approximately 30 boreholes in the area between Linyanti and Lianshulu in the southern part of the project area. The boreholes were drilled to shallow depth, yielding mostly freshwater. Areas with brackish groundwater were successfully identified and avoided, applying direct current soundings (CNI, 1997; cited in WCE, 2000). NamWater investigated the groundwater resources of the Chinchimane Water Supply Scheme in 1997. It was concluded that a shallow freshwater resource covers a brackish aquifer that occurs below a maximum depth of 50 m. Six production boreholes, drilled in 1995, penetrate the freshwater aquifer and were recommended to be pumped at a rate of 192 m3/day as production boreholes of the local water supply scheme (WESSELS, 1997; cited in WCE, 2000).

Technical Cooperation Project Investigation of Groundwater Resources and Airborne-Geophysical Investigation of Selected Mineral Targets in Namibia Groundwater Investigations in the Eastern Caprivi Region Main Hydrogeological Report
Page 31
In 1997/98, an isotope study was implemented by DWA and IAEA in the eastern Caprivi area, with the aim to investigate the origin and dynamic behavior of the local groundwater. Stable and radioactive isotopes samples (2H – deuterium, 18O – oxygen-18, 3H – tritium) of surface (4 samples) and groundwater (60 samples) were analyzed together with the chemical composition of the water. First results were presented in a draft report, showing that recharge from the perennial rivers is only effective up to a distance of approximately 2 to 5 km from the river course. Groundwater sampled at greater distance from the rivers was found to be recharged by local precipitation (BEDMAR, 1999). A tracer test was conducted injecting tritium (20 Ci) and Rhodamine WT (10 l) into the Kwando River (at Golden Highway bridge). Breakthrough curves were observed at Lianshulu gauging station (around 3 km west of Lizauli; see Figure 3 and Chapter 3.4) and Hippo pool (Linyanti River). However, unfortunately these tests were never evaluated and data could not be made available. δ 18O values from the three observation points in the Kwando River showed enrichment in 18O as a consequence of evaporation (BEDMAR, 1999). The groundwater samples showed that δ 18O values decrease with distance from the rivers, proving infiltration from river water into groundwater. The -2‰-line is located at on average 5 km from the rivers (compare Chapter 6.4.2, Figure 63). With increasing distance from the rivers waters are increasingly depleted in 18O. The distribution of δ 18O is therefore seen as an indicator for river bed infiltration into groundwater. Tritium (3H) analyses are difficult to interpret (many analyses were not available at the time of BEDMAR’s report and actually had never been evaluated until present). High tritium values, indicating recent recharge, occur near the main rivers. Values near 0 TU occur at the Golden Highway near Sibbinda and at the southern highway (Kongola-Linyanti-Katima Mulilo road). However, even in these areas some tritium contents indicating recent recharge were locally observed. The conclusion that can be drawn from the observed data is that throughout the Eastern Caprivi recent recharge is predominantly negligible and occurs only in areas near depressions and dry valleys (the so-called mulapos) where surface runoff may collect after intense rainfall events. In some of these depressions surface water bodies are known to remain for a number of months, almost until the beginning of the next rainy season. Unfortunately, there are no 14C data available for the IAEA study. The most significant investigation was undertaken by a KfW funded project in the late 1990s. In 1993/94 a feasibility study had been carried out for the development of water supply in the area and the DWA decided to introduce a groundwater-based supply scheme, mainly along the Golden Highway (B8) between Kongola and Katima Mulilo CES & LCE (1994). Boreholes were sited by means of electromagnetic profiling, using the Geonics EM 34 instrument. Between November 1996 and June 1998 altogether 227 boreholes were drilled to depths of between 26 and 109 m (average: 60 m; CBA, 1998). Twenty boreholes were dry, while of the remaining 207 boreholes 66 did not meet the water quality limit of class B. The majority of boreholes have a yield between 10 and 20 m³/h (average: 11 m³/h; Figure 32). Unfortunately only 13 of the successful boreholes were test pumped so that only few hydraulic parameters to these boreholes are available. Finally 191 boreholes were

Technical Cooperation Project Investigation of Groundwater Resources and Airborne-Geophysical Investigation of Selected Mineral Targets in Namibia Groundwater Investigations in the Eastern Caprivi Region Main Hydrogeological Report
Page 32
recommended for installation. The pump tested boreholes were installed with solar pumps while the remainder of the boreholes was installed with hand pumps. Table 3: Results of KfW Drilling Campaign in the Eastern Caprivi
YIELD no. of wells DEPTH
no. of wells
<1 28 <=50 491-5 26 >50-100 177
5-10 46 >100-150 110-20 96 >150-200 0
>20 31 >200 0total 227 total 227
average 60.3 average 11.1mix 109 mix 25.92min 26 min 0.05
Figure 32 shows the location and yields of the boreholes drilled by KfW (CBA, 1998). In 1999 a desk study was prepared for the project by BIWAC compiling all essential hydrogeological information. This desk study formed the basis for the work later on conducted within the framework of the Namibian-German technical cooperation project.
740000 750000 760000 770000 780000 790000 800000 810000 820000 830000 840000 850000 860000 870000 880000 890000 900000 910000 920000 9300007950000
7960000
7970000
7980000
7990000
8000000
8010000
8020000
8030000
8040000
8050000
8060000
8070000
0.05 to 1 1 to 5 5 to 10 10 to 20 20 to 25.93
Yield [m³/h]
Figure 32: Yield and Location of Boreholes drilled by KfW Within the framework of the Northern Livestock Development Programme (NOLIDEP) program 9 boreholes were drilled in the year 2003.

Technical Cooperation Project Investigation of Groundwater Resources and Airborne-Geophysical Investigation of Selected Mineral Targets in Namibia Groundwater Investigations in the Eastern Caprivi Region Main Hydrogeological Report
Page 33
5 Summary of Drilling Results
Six boreholes were drilled within the framework of this project. Their location and some essential base data are documented in Figure 1 and Table 4. A topographic survey of the newly drilled boreholes was undertaken in January 2005 (Annex 9). Table 4: Basic Data of Boreholes Drilled within the Framework of the Project
WW-NoGeophysical Sounding UTM-E UTM-S Lat Long Elevation TD Started Completed
m m ° ° m m (test pumping)WW41002 6_1 764464.20 8013659.98 -17.94836 23.4983 953.787 193 06.09.2004 09.11.2004WW41003 1_180 793428.19 8024633.93 -17.84557 23.77002 946.671 198 11.09.2004 04.10.2004WW41004 7_180 800956.64 8019955.64 -17.88678 23.84167 944.560 222 21.09.2004 18.10.2004WW41005 7_180 800973.89 8019955.36 -17.88678 23.84183 944.596 70 27.09.2004 09.11.2004WW41006 1_150 794256.79 8010321.56 -17.97468 23.77985 947.307 250 29.09.2004 27.10.2004WW41007 1_150 794250.63 8010337.99 -17.97453 23.77979 947.635 99 04.10.2004 09.10.2004 WW-No
Screen length RWL_CDT RWL_asl Collar height Yield CDT EC CDT Transmissivity
Yield recommended Efficiency
m m m m m³/h mS/m m²/d m³/h %WW41002 58.25 16.18 937.6 0.10 57.8 102.3 774 84 90WW41003 58.22 11.69 935.0 0.26 16.0 96 143 14 70WW41004 82.66 11.48 933.1 0.55 55.5 135.2 57.6 78 90WW41005 31.24 26.18 918.4 0.43 0.3 2290 0.14 0.3 -WW41006 90.10 15.07 932.2 0.29 55.3 119.2 79 66 90WW41007 42.60 28.69 918.9 0.61 4.1 321 103 3.9 70 remark: TD – total depth, CDT – constant discharge test; elevation and coordinates determined by DGPS The aim of the drilling program was to verify whether a deep Kalahari aquifer exists in the Eastern Caprivi area and where it contains freshwater of sufficient quantity. Until that time most boreholes in that area were only around 100 m deep (and therefore the deep aquifer had not yet been tapped), with the exception of 5 boreholes, the deepest of which was drilled at around 20 km W of Katima Mulilo to a depth of 164 m (WW37223; basalt below 80 m depth; brackish groundwater). The lithological logs of all 6 boreholes are attached as Annex 1. The generalized lithological description of the penetrated rock units is summarized in Table 5, the hydrogeological characteristics of the aquifer units are listed in Table 6. Four of the DWA-BGR boreholes were drilled to depths of around 200-250 m, successfully tapping the deeper Kalahari aquifer and two as observation boreholes next to deep boreholes into the shallow Kalahari aquifer in order to determine the hydraulic head difference between the two aquifers. With the exception of borehole WW41003 (recommended yield: 14 m³/h; due to low well efficiency) all deep boreholes were extremely successful with recommended yields ranging between 66 and 84 m³/h. Electric conductivities of the groundwater in the Lower Aquifer vary between 96 and 135 mS/m (approximately 600 to 850 mg/l TDS). With regards to its hydrochemical composition, the water in the Lower Aquifer at the drilling locations is of drinking water quality and for most components meets group A standards (compare Table 12 in Chapter 6.4.1). The Lower Aquifer consists of fine to coarse grained semi-consolidated sandstone which is partly calcareous and partly gravelly and has a transmissivity of 56 to 774

Technical Cooperation Project Investigation of Groundwater Resources and Airborne-Geophysical Investigation of Selected Mineral Targets in Namibia Groundwater Investigations in the Eastern Caprivi Region Main Hydrogeological Report
Page 34
m²/d. In all four deep boreholes the penetrated lithological sequence is quite similar. The Upper Aquifer reaches to a depth of around 110 m and consists of mostly unconsolidated fine to medium grained sand of light brown color, followed by a bluish-green predominantly clayey aquitard of around 14 to 26 m thickness. Below follows the Lower Aquifer with predominantly medium grained sand or sandstone of olive-green color. Its thickness varies between 56 and > 125 m. At a depth of between 185 and 217 m basalt was encountered in three boreholes. Only in the southernmost borehole basalt has not been penetrated, meaning that it either is located deeper that 250 m or that it is not present at this site. Basalt is weathered in the penetrated section but was entered only a few meters in order to verify the lithological composition. At each of the two drilling sites WW41004 and WW41006 a shallow borehole was drilled at a distance of 17.5 m tapping the shallow aquifer. These proved information that the hydraulic head is much higher in the Lower compared to the Upper Aquifer (difference: 13.62 m at WW41004 and 14.70 m at WW41006). The present concept concerning the setup of the aquifer system is depicted in Figure 33 and in Table 6.
WW41002AQ1: 0-114
AT: bluish-green clayAQ2: 128-185
greenish sst, H2S, reduced water
Basalt
WW41003AQ1: 0-115
AT: bluish-green clayAQ2: 135-191
greenish sst, H2S, reduced water
Basalt
WW41004AQ1: 0-108AT: bluish-green clayAQ2: 134-216greenish sst, H2S, reduced waterBasalt
WW41006AQ1: 0-102
AT: bluish-green clay/siltAQ2: 125-?
no basalt to 250
Upper Aquifer (AQ1)Aquitard (AT)Lower Aquifer (AQ2)Basalt
Figure 33: Generalized Classification of the Drilling Results with Respect to the Hydrogeological Concept

Technical Cooperation Project Investigation of Groundwater Resources and Airborne-Geophysical Investigation of Selected Mineral Targets in Namibia Groundwater Investigations in the Eastern Caprivi Region Main Hydrogeological Report
Page 35
Table 5: Lithology and Thickness of Penetrated Rock units
Borehole Screened Aquifer
Upper Aquifer Aquitard Lower Aquifer Karoo Basalt
WW40002 Lower Aquifer 124.75-183 m
Lithology: predominantly fine grained, partly calcareous sandstone with intercalations of silicified sandstone Saturated thickness: unknown (?-114 m)
Lithology: bluish-green claystone/siltstone with intercalations of calcareous sandstone and chert/silcrete Thickness: 14 m (114-128 m)
Lithology: olive-green to bluish-grey fine to coarse grained sandstone, partly calcareous with intercalations of silicified sandstone Thickness: 57 m (128-185 m)
yes 185-193 m
WW40003 Lower Aquifer 133.18-191.4 m
Lithology: fine to coarse grained, partly calcareous sandstone with intercalations of silicified sandstone Saturated thickness: unknown (?-115 m)
Lithology: bluish-green fine to medium grained calcareous sandstone in clayey matrix with intercalations of silicified sandstone Thickness: 20 m (115-135 m)
Lithology: olive-green fine to medium grained sandstone with layers of coarse grained sandstone and pebbles Thickness: 56 m (135-191 m)
yes 191-198 m
WW40004 Lower Aquifer 133.26-215.92 m
Lithology: very fine to coarse grained, partly calcareous sandstone Saturated thickness: 81.8 m (26.2-108 m)
Lithology: very fine to fine grained olive-green sandstone with clayey matrix, intercalated layers of bluish-green clay Thickness: 26 m (108-134 m)
Lithology: fine to coarse grained, partly calcareous sandstone with layers of bluish-green clay Thickness: 82 m (134-216 m)
yes 216-222 m
WW40005 Upper Aquifer 33.66-65.90 m
Lithology: compare WW41004 Saturated thickness: 43.8 m (26.2-70 m)
not reached not reached
WW40006 Lower Aquifer 149.81-239.91 m
Lithology: very fine to fine grained, clayey sandstone with intercalations of reworked calcareous sandstone pebbles Saturated thickness: 73.3 m (28.7-102 m)
Lithology: very fine to fine grained calcareous sandstone with olive-green clay layers Thickness: 23 m (102-125 m)
Lithology: fine to coarse grained, partly calcareous sandstone with layers of bluish-green clay Thickness: >125 m (125-? m)
not reached
WW40007 Upper Aquifer 53.89-96.49 m
Lithology: compare WW41006 Saturated thickness: 70.3 m (28.7-99 m)
not reached not reached

Technical Cooperation Project Investigation of Groundwater Resources and Airborne-Geophysical Investigation of Selected Mineral Targets in Namibia Groundwater Investigations in the Eastern Caprivi Region Main Hydrogeological Report
Page 36
Table 6: Characteristics of Aquifer Units in the Eastern Caprivi
Rock Unit Lithology Thickness EC [mS/m]
Recommended Yield [m³/h]
Transmissivity[m²/d]
Upper Aquifer
very fine to coarse grained, partly calcareous sandstone with intercalations of silicified sandstone *
102 – 115 m* 5 – 3460 ** 0 – 40 ** 0.1 – 343 **
Aquitard bluish-green clay, fine to medium grained sandstone
14 – 26 m - - -
Lower Aquifer
fine to coarse grained, partly calcareous sandstone with layers of bluish-green clay
56 – >125 m 96 – 135 14 – 84 58 – 774
Karoo Basalt
dark green weathered basalt, with abundant calcite coating on fracture planes
? – not penetrated ? ? ?
Karoo Sandstone
? – not reached ? ? ?
* DWA-BGR boreholes; ** all boreholes in E-Caprivi

Technical Cooperation Project Investigation of Groundwater Resources and Airborne-Geophysical Investigation of Selected Mineral Targets in Namibia Groundwater Investigations in the Eastern Caprivi Region Main Hydrogeological Report
Page 37
6 Groundwater Resources
6.1 Description of Aquifer System
6.1.1 Information from Water and Exploration Wells (Hydrogeological Database) There are altogether 1170 boreholes in the database for Eastern Caprivi. However not all data are complete (borehole diameter 59%, total depth: 82%, yield: 68%, rest water level: 75%, deepest water strike: 19%) and some valuable information is missing (screen depths, water strikes, step test/constant discharge test data with results, TDS, EC, and other hydrochemical data registered at the time of drilling). Figure 3 shows the locations of all boreholes in the project area. A more detailed borehole location map with the identification numbers of wells is attached as Annex 3. The lithological logs are shown in an overview in Annex 4 and separately documented on the enclosed CD (pdf files). Lithological logs were available for 168 boreholes in the project area as depicted in Figure 34, most of which are located along the main roads. Almost all of those describe sand forming the main aquifer. Some clayey strata occur in the area east of Sibbinda (between the villages of Newlook and Sachinga), south of Katima Mulilo (around Liselo) and around Lizauli. Calcretes occur predominantly around Choi and Sachona (both south of Kongola) and between Masida and Sibbinda. Rock salt (30-34 m bgl) is described from a borehole (WW36611) near the village of Imukusi, east of Katima Mulilo. This may be an indication that at some time evaporites have formed in the Eastern Caprivi and is therefore a valuable information for the hydrogeological interpretation of the region. It is recommended to conduct further investigations in the area around this site in order to verify this finding (e.g. VES soundings).

Technical Cooperation Project Investigation of Groundwater Resources and Airborne-Geophysical Investigation of Selected Mineral Targets in Namibia Groundwater Investigations in the Eastern Caprivi Region Main Hydrogeological Report
Page 38
Figure 34: Boreholes with Lithological Logs (borehole symbol)

Technical Cooperation Project Investigation of Groundwater Resources and Airborne-Geophysical Investigation of Selected Mineral Targets in Namibia Groundwater Investigations in the Eastern Caprivi Region Main Hydrogeological Report
Page 39
6.1.2 Information from Geophysical Surveys Ground geophysical surveys were conducted by INTERCONSULT (2000) throughout the Eastern Caprivi Region for site selection of rural water supply wells on behalf of DWA using horizontal loop electromagnetics (HLEM; Geonics EM 34-3) with 40 m coil separation. On behalf of the DWA-BGR technical cooperation project POSEIDON/Botswana conducted a total of 57 time-domain electromagnetic (TEM) soundings across the Eastern Caprivi Region, located on lines with an irregular spacing between TEM measurements and varying directions of the lines. Figure 1 shows the location of these measurements. The results of the TEM measurements are documented in FIELITZ et al. (2004) of this series of reports. The location of boreholes in relation to the TEM soundings and the assumed distribution of resistivities at 120 m depth is shown in Figure 35.
760000E 780000E 800000E 820000E 840000E
Caprivi: resistivities at about 120 m below surface
7980000N
8000000N
8020000N
8040000N
2_20
2_50
6_1
6_10
6_30
6_5
6_7
6_9
7_150 7_180 7_190 7_200
8_10 8_20 8_30
8_708_80 8_90
9_40
10_50
11_10
15_10
15_30
15_40
1_301_401_50
1_60
1_80
1_1001_110
1_120
1_140
1_150
1_160
1_180
1_130
1_170
1_190
Res
istiv
ity [o
hm-m
]
11.422.53.23.9568101316202532395060801001301602002501000
0 5 10 km
1
8
7
6
WW41002
WW41003
WW41006WW41007
WW41004WW41005
Figure 35: Location of TEM soundings and Section Lines and assumed Horizontal Distribution of Rock Resistivities at 120 m Depth
(large numbers indicate TEM line numbers; 1_120: TEM sounding 120 on line 1; WW numbers 41002-41007: boreholes drilled by the project)

Technical Cooperation Project Investigation of Groundwater Resources and Airborne-Geophysical Investigation of Selected Mineral Targets in Namibia Groundwater Investigations in the Eastern Caprivi Region Main Hydrogeological Report
Page 40
According to the TEM measurements there should be decreasing resistivities in the lower part of the aquifer system towards south and east, either due to increasing clay contents or increasing salinities (Figures 35 and 36). It was also assumed that the low resistivities in the upper part would represent a confined layer between an upper aquifer and a lower aquifer.
Figure 36: North-South Vertical Section along TEM line 1 Showing Assumed Resistivity Distribution
This conceptual model was partly confirmed by the boreholes drilled. However, the predicted salinity increase towards SE, predicted by the TEM soundings, could not be validated. A helicopter electromagnetic (HEM) survey was conducted by the project (Vol. II.GW.3 of project reports; SIEMON et al., 2005) in a 20-30 km wide strip north of the Linyanti River. For technical details and the scientific background of the methodology it is referred to the above mentioned report. Four frequencies were used: 41,300 Hz, 8,610 Hz, 1,830 Hz and 384 Hz, the lowest reaching a depth of between 20 and 70 m bgl. The most important results from the hydrogeological point of view are the maps showing the horizontal distribution of resistivities at specific depths (maps 19 to 26 of SIEMON et al., 2005). In the surveyed area groundwater levels in the shallow aquifer vary between 1 and 25 m bgl. The thickness of the upper aquifer is assumed to exceed 100 m. Therefore the most relevant map for a characterization of the water quality of the upper aquifer is that showing the resistivity distribution at a depth of 40 m bgl which is presented in Figure 37. It shows that resistivities are below 5 Ωm almost throughout the entire central part of the survey area. This more or less coincides with the area where high groundwater salinities (mostly above 2,000 mg/l TDS) have been observed (Figure 38). The map showing the resistivity distribution at a depth of 20 m bgl (Figure 39) is shown to demonstrate where shallow fresh groundwater resources may be found. As
S N
-35 -30 -25 -20 -15 -10 -5 0 5 10 15 20Distance [km]
Caprivi: vertical resistivity section 1
600
650
700
750
800
850
900
950
1000
Elev
atio
n [m
]
600
650
700
750
800
850
900
950
100030 40 50 60 80 100110 120 130 140 150 160 170 180
190
11.422.53.23.956810131620253239506080101316202510
WW41003 WW41006
TD : 250 m
TDS: 119 mS/m
TD : 198 m
TDS: 96 mS/m
Aquitard
Lower Aquifer

Technical Cooperation Project Investigation of Groundwater Resources and Airborne-Geophysical Investigation of Selected Mineral Targets in Namibia Groundwater Investigations in the Eastern Caprivi Region Main Hydrogeological Report
Page 41
expected, resistivities in the area covered by the Linyanti swamp are somewhat higher, which also coincides with the known TDS distribution. Somewhat more extended are the shallow fresh groundwater resources in the southwestern part of the surveyed area. Here, resistivities are between 10 and 50 Ωm at 20 m bgl and decrease to a maximum of around 20 Ωm at a depth of 40 m bgl. It has to be assumed that also here groundwater becomes more brackish with depth. Exploitation of groundwater resources in this area may be difficult due to frequent flooding and because of possible upconing that may occur after development of the brackish to saline groundwater below 40 m bgl. In the extreme northeastern part of the surveyed area, near Bukalo, fresh groundwater resources may also be found locally. Here the HEM survey indicates resistivities between 20 and 100 Ωm even at 40 m bgl (Figure 37). Depth to groundwater commonly is less than 10 m so that the vertical extent of the freshwater resources may be around 30m. The horizontal extent, however, is only a few hundred meters, so that it is recommended to conduct a detailed ground-based resistivity survey prior to the drilling of exploration boreholes, if intended, in order to select the optimal location for groundwater exploitation. The HEM measurements added some information about the salinity distribution in the Upper Aquifer which may be important for rural water supply of small communities. However, such small freshwater occurrences (their existence still needs to be proven through drilling) would have to be exploited very carefully in order to avoid upconing of brackish or saltwater. An information which is relevant for the aquifer geometry is shown on the maps of total magnetic field and the map of depth to magnetic basement (maps 28 and 30 of SIEMON et al., 2005). For preparation of these maps the total magnetic field was recorded by helicopter. The depth to magnetic basement map (Figure 40) was obtained using Euler deconvolution and variogram analysis using the daily magnetic variations recorded at a base station and the geomagnetic reference field. Details about the processing of the map are documented in chapter 6 of SIEMON et al., 2005. Figure 40 shows that the depth to magnetic basement is at a depth of between 50 and 450 m in the eastern part of the HEM survey area. This coincides with the assumption that Karoo basalt must be at shallow depth there. Striking are the high differences in depth to magnetic basement between the western and the eastern part. In the western part of the HEM survey area, the map indicates that the magnetic basement is at a depth of mostly below 700 m. It may therefore be that in this area basalt is either missing or located very deep. Presently the former hypothesis is favored as it would coincide with earlier observations made in Botswana (Figure 29).

Technical Cooperation Project Investigation of Groundwater Resources and Airborne-Geophysical Investigation of Selected Mineral Targets in Namibia Groundwater Investigations in the Eastern Caprivi Region Main Hydrogeological Report
Page 42
Figure 37: Assumed Resistivity
Distribution at 40 m bgl Based on a Helicopter Electromagnetic
Survey
Linyanti swamp
Bukalo

Technical Cooperation Project Investigation of Groundwater Resources and Airborne-Geophysical Investigation of Selected Mineral Targets in Namibia Groundwater Investigations in the Eastern Caprivi Region Main Hydrogeological Report
Page 43
740000 750000 760000 770000 780000 790000 800000 810000 820000 830000 840000 850000 860000 870000 880000 890000 900000 910000 920000 9300007950000
7960000
7970000
7980000
7990000
8000000
8010000
8020000
8030000
8040000
8050000
8060000
8070000
Zambia
Botswana
Kongola
Linyanti
Ngoma
Katima Mulilo
Kalambesa
Lusese
Schuckmannsburg
Bukalo
Caprivi Region - TDS Content
600
990
1980
2640
5000
7500
10000
12500
Figure 38: Distribution of Total Dissolved Solids (TDS; in mg/l) in the Upper Aquifer (grey line: HEM survey area; blue symbols: new DWA-BGR boreholes)

Technical Cooperation Project Investigation of Groundwater Resources and Airborne-Geophysical Investigation of Selected Mineral Targets in Namibia Groundwater Investigations in the Eastern Caprivi Region Main Hydrogeological Report
Page 44
Figure 39: Assumed Resistivity Distribution at 20 m bgl Based on a Helicopter Electromagnetic Survey

Technical Cooperation Project Investigation of Groundwater Resources and Airborne-Geophysical Investigation of Selected Mineral Targets in Namibia Groundwater Investigations in the Eastern Caprivi Region Main Hydrogeological Report
Page 45
Figure 40: Depth to Magnetic Basement (modified after SIEMON et al., 2005) Borehole geophysical logging was conducted in the drilled boreholes and in 2 other boreholes in the project area, located nearby the newly drilled wells (Vol. IV.GW.2.2 of the project reports; WIERENGA et al., 2004). However, to both of the other boreholes there is no lithological borehole log available. Both boreholes were partly cased so that the geophysical log yields only information for lithological interpretation about the lower part of the borehole which is uncased.
6.1.3 Lateral and Vertical Extent of the Aquifer System The drilling results and the interpolated resistivity section in Figure 36 which was obtained from TEM soundings clearly show a structuring into two superposed aquifers being separated by a probably continuous aquitard. Based on the available information the following schematic concept is supported, as depicted in Figure 41 :
• The Upper Aquifer has a thickness between around 100 and 115 m and is composed mainly of fine to medium grained sand with thin intercalated clay layers. This aquifer is obviously becoming increasingly silty/clayey towards the centre of the Eastern Caprivi.
• This aquifer is underlain by a sequence of around 15 to 25 m thickness which is predominantly composed of bluish-green clay and forms an aquitard.
• Underneath follows the Lower Aquifer consisting of fine to coarse grained, semi-consolidated to consolidated sandstone of greenish color. This aquifer is between around 55 and > 125 m thick.

Technical Cooperation Project Investigation of Groundwater Resources and Airborne-Geophysical Investigation of Selected Mineral Targets in Namibia Groundwater Investigations in the Eastern Caprivi Region Main Hydrogeological Report
Page 46
• It is underlain by basalt either in part of or in the entire Eastern Caprivi. Groundwater in the basalt is known to be brackish to saline in the Rundu area and was found to be brackish in the northern part of the Eastern Caprivi (borehole WW37223).
• The basalt is probably underlain by Karoo Sandstone, equivalent to the Etjo Sandstone in central Namibia and the Cave Sandstone in Botswana.
Figure 41: Schematic Concept showing the Structure of the Aquifer System in the Eastern Caprivi
This concept is only valid for the area where the four project boreholes were drilled. Due to the limited number of deep boreholes drilled into the Lower Aquifer it is presently not possible to more precisely describe or delineate the aquifer system. It is assumed that the Eastern Caprivi was subjected to block faulting during the Tertiary and Quaternary (see Figures 30 and 41) and it is therefore likely that the lithological successions vary significantly in the different blocks. Before starting to develop the Lower Aquifer it is recommended to conduct further investigations because a number of facts which are presently insufficiently known should be clarified. Those are listed in Chapter 8 of this report.

Technical Cooperation Project Investigation of Groundwater Resources and Airborne-Geophysical Investigation of Selected Mineral Targets in Namibia Groundwater Investigations in the Eastern Caprivi Region Main Hydrogeological Report
Page 47
6.2 Groundwater Flow Pattern
For most boreholes in the project area there was no reliable information concerning their elevation. Such data, if existing, was previously commonly compiled based on elevations estimated from topographic map information. Since elevation intervals usually are 20 m these data are in most cases inadequate for the establishment of a piezometric map. A major problem that hampers the establishment of such a map is the existence of only few benchmarks in the area (along the Kongola-Katima Mulilo road). A complete topographic survey of all water wells in the project area would have been too costly to conduct. Another problem is that such a map would require conducting a survey of water levels during a specific time period, which in such a remote area where almost no roads exist is extreme time consuming and costly. This idea was therefore not pursued. A much better solution proved to be the use of elevation data based on SRTM data (compare above). The piezometric map shown in Figure 42 is therefore partly based on elevations taken from SRTM images (for those boreholes in flat-lying areas where previously no elevation had been determined; for boreholes where elevation had been available both values were compared and found to be quite similar in flat-lying areas; in areas with a more pronounced topography differences between both values are higher and therefore SRTM data were preferred due to their better horizontal resolution). For the Upper Aquifer there are altogether around 970 piezometric heads so that the base for this piezometric map is rather good. However, for many of those there are no dates of measurement available and the available dates cover a wide time span from the 1960s to 2004. In order to have a sufficiently large data base for a groundwater contour map, all values were used without regarding the time of their recording. Furthermore some values deviate significantly from surrounding ones and were therefore not taken into consideration. In the Upper Aquifer (Figure 42) groundwater flow directions are reflecting recharge from surface water by river bed infiltration from the Kwando River, the Linyanti River and the Zambezi River (compare Chapter 6.4.2). In the northern central part of the Eastern Caprivi groundwater contours and topography are somehow correlated and it may therefore be assumed that there is limited groundwater recharge from rainfall in the north. However, the number of values in this area is very low. In the northwest, west and south the groundwater flow pattern in the Upper Aquifer mainly reflects inflow from the surrounding rivers (effluent conditions). Inflow into the Upper Aquifer is also assumed to take place in the upper part of the Zambezi River. In the lower part of the Zambezi River, however, contours mostly indicate influent conditions, i.e. outflow from groundwater into surface water.

Technical Cooperation Project Investigation of Groundwater Resources and Airborne-Geophysical Investigation of Selected Mineral Targets in Namibia Groundwater Investigations in the Eastern Caprivi Region Main Hydrogeological Report
Page 48
The groundwater contour map shows a marked depression northwest of the village of Linyanti which is difficult to explain. Since depth to groundwater in this area is mostly exceeding 10 m it cannot be caused by evaporation from groundwater. Moreover there is no major abstraction in this area. There are also some smaller, isolated depressions in the groundwater contour map, located mainly along the Golden Highway and the southern highway, connecting Katima Mulilo and Linyanti. However, they are most probably related with groundwater abstraction in these more densely populated areas. Concerning the Lower Aquifer (Figure 43) there are presently only those four values from the DWA-BGR drilling program. They indicate a much more shallow gradient of around 0.4 ‰, compared to the Upper Aquifer (approximately 1 ‰). Groundwater contours suggest inflow from the west (from the Kwando or beyond) as well as from the north (Zambia). The northern gradient seems to be somewhat higher than the western gradient. Other than in the Upper Aquifer, the flow in the Lower Aquifer can presently not be calculated because most of the required parameters are not sufficiently well known. The hydraulic head difference between the Upper and the Lower Aquifer is around 14 m at boreholes WW41004/05 and WW41006/07. The vertical hydraulic gradient is directed upwards. Head difference at the other two boreholes drilled by the project is unknown. It is recommended to drill a piezometer in the shallow aquifer near WW41002 and WW41003. It is noteworthy that the hydraulic head at borehole WW37223, drilled into the basalt in the NE of the project area, is around 40 m higher than in the shallow aquifer tapped by surrounding boreholes. Water in this borehole is reported to be brackish. However, unfortunately no water sample was taken from this borehole. It is therefore assumed that there exists an aquifer in the basalt which may largely be brackish. The basalt may have a higher hydraulic head than the Lower Aquifer.

Technical Cooperation Project Investigation of Groundwater Resources and Airborne-Geophysical Investigation of Selected Mineral Targets in Namibia Groundwater Investigations in the Eastern Caprivi Region Main Hydrogeological Report
Page 49
Figure 42: Groundwater Flow Pattern in the Upper Aquifer in the Eastern Caprivi Region
(blue lines: groundwater contour lines; red line: HEM flight area; blue boreholes symbols: DWA-BGR boreholes; stars: TEM-measurements; black squares: villages and towns)

Technical Cooperation Project Investigation of Groundwater Resources and Airborne-Geophysical Investigation of Selected Mineral Targets in Namibia Groundwater Investigations in the Eastern Caprivi Region Main Hydrogeological Report
Page 50
Figure 43: Groundwater Flow Pattern in the Lower Aquifer in the Eastern Caprivi Region (blue lines: groundwater contour lines; red line: HEM flight area; stars: TEM-measurements; small blue boreholes symbols: DWA-BGR boreholes in Upper Aquifer; purple: borehole WW37223 with water level; black squares: villages and towns)

Technical Cooperation Project Investigation of Groundwater Resources and Airborne-Geophysical Investigation of Selected Mineral Targets in Namibia Groundwater Investigations in the Eastern Caprivi Region Main Hydrogeological Report
Page 51
6.3 Hydraulic Parameters
Few documents are available on pumping tests of previously drilled wells. Mostly not even drawdowns during pumping tests are reported, so that not even maps showing the potential exploitation potential can be drawn. Therefore, the only hydraulic parameters available for this area are those recorded during the current project and the 13 pumping test carried out within the framework of the KfW project (CBA, 1998). Pumping test data of the current project are documented in Volume IV.GW.2.2 of this series of reports (WIRENGA et al., 2004). The evaluation of the pumping tests is documented in Volume IV.GW.2.3 (MARGANE & BAEUMLE, 2004). The results are summarized in Tables 7 to 10 and Figures 44 to 47. Since no observation boreholes were located close enough to the boreholes drilled within the framework of the project in the same aquifer, storage coefficients could not be determined but only transmissivities. Since the hydraulic data on the aquifers are very scarce, the yields of the wells may be used as additional information for an assessment of the spatial distribution of transmissivities. This, however, should be used with care, since the yield often depend on external factors, such as the availability of appropriate pumps, etc. The distribution of reported well yields in the Upper Aquifer is shown in Figure 45. It shows that well yields are predominantly below 2 m³/h in the quadrangle between south of Sibinda, Linyanti, Bukalo and Kasheshe and transmissivities are believed to be, with few exceptions, mainly below 10 m²/d in this area. In the eastern part of the Eastern Caprivi, i.e. in the constituencies of Katima Mulilo and Kabe, well yields are predominantly above 10 m³/h. The same counts for the area along the Golden Highway (B8) from Kongola to Katima Mulilo. Here, and presumably also further north of this road, the average yield is 10 m³/h. The transmissivities reported by the KfW project (CBA, 1998) from this area are mostly between 50 and 200 m²/d. The transmissivities evaluated for the Lower Aquifer cover a wide range between 58 and 774 m²/d. From their presently known distribution it may be assumed that they decrease towards east. This may be due to the fact that deposition of the sediments in the Lower and Upper Aquifers occurred from west to east so that sediments deposited further to the east are more distal and thus in general more fine grained. It is anticipated, however, that transmissivities vary over short distances because the depositional environment probably is that of a braided river system which continuously changed its course within the Caprivi Graben. Comparing the lithology of the Upper and Lower Aquifers at the new drilling locations it is, however, inferred that the transmissivity in the Lower Aquifer must in general be higher than that of the Upper Aquifer because of generally coarser grain sizes in the former. As outline before, it is stressed that it is presently unknown how far towards east the Lower Aquifer actually extends. This should be evaluated by further exploratory drilling programs.

Technical Cooperation Project Investigation of Groundwater Resources and Airborne-Geophysical Investigation of Selected Mineral Targets in Namibia Groundwater Investigations in the Eastern Caprivi Region Main Hydrogeological Report
Page 52
Table 7: Design of Step Tests
Pumped Well
Aquifer Date No. of steps
Duration of steps [h]
Duration of recovery [h]
Range of pumping rate Q [m3/h]
Pump test crew
WW41002 Lower Kalahari
04-11-2004 6 2 2 10.7-57.2 DWA
WW41003 Lower Kalahari
29-09-2004 6 1-2 15.33 4 – 19.4 DWA
WW41004 Lower Kalahari
06-10-2004 6 1-2 17 9.6 – 56.4 DWA
WW41005 Upper Kalahari
yield too low – only CD test performed
WW41006 Lower Kalahari
21-10-2004 6 1 14.17 6.4 – 48.6 DWA
WW41007 Upper Kalahari
07-10-2004 5 0.17-1 14.33 2.0 – 11.3 Metzger
Table 8: Results of Step Tests
Pumped Well
RWL [m]
Max. PWL [m]
smax [m]
sres [m]
B [h/m2]
C [h2/m5]
P [-]
Qrec [m3/h]
Evalu-ation Method
Determi-nation of drawdown sn
WW41002 16.18 44.18 28.00 -0.02 5.17E-1 6.58E-4 2 84 Jacob Hantush-Bierschenk
WW41003 11.66 76.66 65.00 0.04 5.77E-1 1.43E-1 2 14 Jacob Rorabaugh WW41004 11.22 46.04 34.82 0.36 5.93E-1 8.12E-4 2 78 Jacob Hantush-
Bierschenk WW41005 yield too low – only CD test performed WW41006 14.76 32.08 17.32 0.32 2.81E-1 4.61E-4 2 66 Jacob Hantush-
Bierschenk WW41007 28.66 74.66 46.00 0.03 1.75E+0 1.94E-1 2 3.9 Jacob Rorabaugh

Technical Cooperation Project Investigation of Groundwater Resources and Airborne-Geophysical Investigation of Selected Mineral Targets in Namibia Groundwater Investigations in the Eastern Caprivi Region Main Hydrogeological Report
Page 53
740000 750000 760000 770000 780000 790000 800000 810000 820000 830000 840000 850000 860000 870000 880000 890000 900000 910000 920000 9300007950000
7960000
7970000
7980000
7990000
8000000
8010000
8020000
8030000
8040000
8050000
8060000
8070000
WW41002
WW41003
WW41004
WW4100684
14
78
66
Zambia
Botswana
Kongola
Linyanti
Ngoma
Katima Mulilo
Kalambesa
Lusese
Schuckmannsburg
Bukalo
Figure 44: Recommended Yields (m³/h) of Boreholes drilled by DWA/BGR in the Lower
Aquifer of the Eastern Caprivi
Figure 45: Yields (m³/h) of Boreholes in the Upper Aquifer of the Eastern Caprivi

Technical Cooperation Project Investigation of Groundwater Resources and Airborne-Geophysical Investigation of Selected Mineral Targets in Namibia Groundwater Investigations in the Eastern Caprivi Region Main Hydrogeological Report
Page 54
Table 9: Design of Constant Discharge Tests
Pumped Well
Aquifer Observation Well (s)
Date Duration of pumping [h]
Duration of recovery [h]
Pumping rate Q [m3/h]
Pump test crew
WW41002 Lower Kalahari
- 05-11-2004 72 2.5 57.8 DWA
WW41003 Lower Kalahari
- 30-09-2004 72 24 16.07 DWA
WW41004 Lower Kalahari
WW41005 13-10-2004 72 48 55.85 DWA
WW41005 Upper Kalahari
WW41004 08-11-2004 10 24 0.33 DWA
WW41006 Lower Kalahari
WW41007 22-10-2004 72 72 55.04 DWA
WW41007 Upper Kalahari
WW41006 08-10-2004 24 3 4.08 Metzger
Table 10: Results of Constant Discharge Tests
Pumped Well
RWL [m]
Max. PWL [m]
smax [m]
sres [m]
EC [mS/m]
T [m2/d]
Evaluation Method Comments
WW41002 16.18 41.55 25.37 -0.01 109 774 Theis recovery WW41003 11.69 64.79 53.10 0.03 96.0 143 Theis recovery WW41004 11.48 45.35 33.87 1.35 135.2 57.6 Theis recovery WW41005 26.18 41.66 15.34 0.29 229 0.14 Theis recovery WW41006 15.07 33.92 18.85 1.16 120 79 Theis recovery WW41007 28.69 39.46 10.77 0.04 321 103 Theis recovery
740000 750000 760000 770000 780000 790000 800000 810000 820000 830000 840000 850000 860000 870000 880000 890000 900000 910000 920000 9300007950000
7960000
7970000
7980000
7990000
8000000
8010000
8020000
8030000
8040000
8050000
8060000
8070000
WW41002
WW41003WW41004WW41005
WW41006WW41007
11181
25689
100
211
343330
10314
218
101
WW36451
WW36463WW36468
WW36529WW36531
WW36543
WW36550
WW36557
WW36558
WW36561
WW36567
WW36575
WW36576
Zambia
Botswana
Kongola
Linyanti
Ngoma
Katima Mulilo
Kalambesa
Lusese
Schuckmannsburg
Bukalo
0.1
103
70
Figure 46: Transmissivities (m²/d) of Upper Aquifer (including WW identification numbers; orange symbols/numbers: DWA/BGR boreholes; blue symbols/numbers: KfW boreholes)
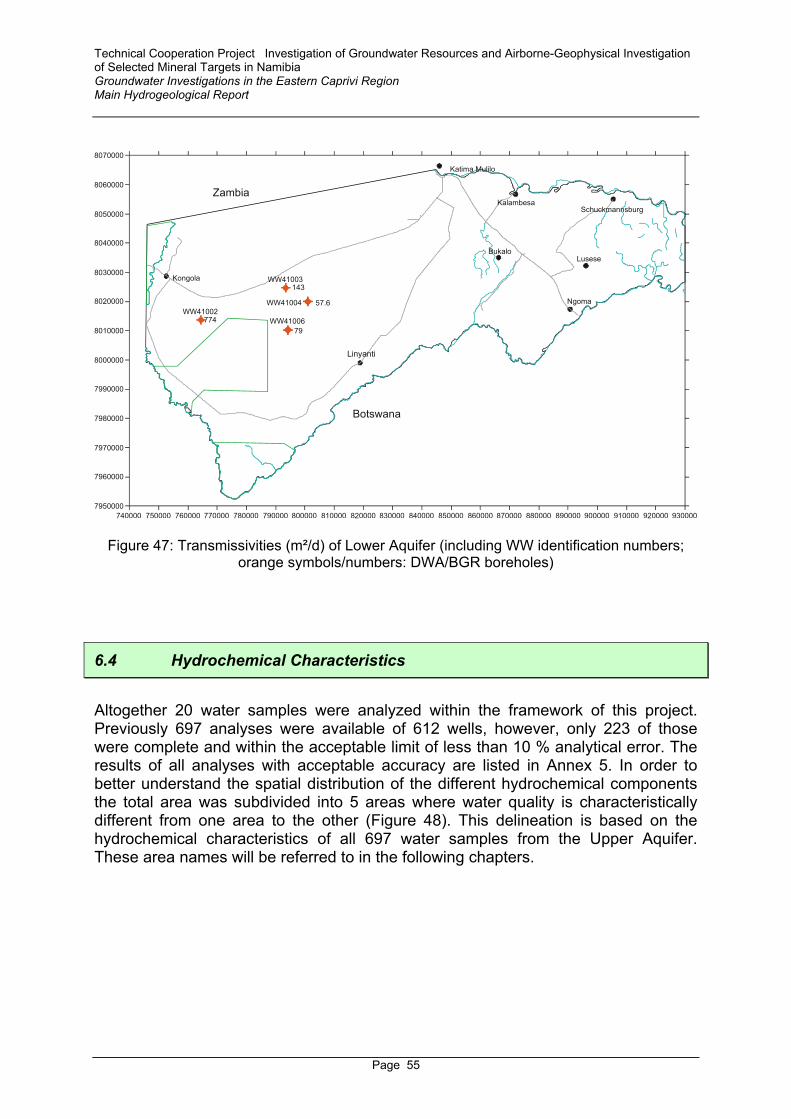
Technical Cooperation Project Investigation of Groundwater Resources and Airborne-Geophysical Investigation of Selected Mineral Targets in Namibia Groundwater Investigations in the Eastern Caprivi Region Main Hydrogeological Report
Page 55
740000 750000 760000 770000 780000 790000 800000 810000 820000 830000 840000 850000 860000 870000 880000 890000 900000 910000 920000 9300007950000
7960000
7970000
7980000
7990000
8000000
8010000
8020000
8030000
8040000
8050000
8060000
8070000
WW41002
WW41003
WW41004
WW41006774
143
57.6
79
Zambia
Botswana
Kongola
Linyanti
Ngoma
Katima Mulilo
Kalambesa
Lusese
Schuckmannsburg
Bukalo
Figure 47: Transmissivities (m²/d) of Lower Aquifer (including WW identification numbers; orange symbols/numbers: DWA/BGR boreholes)
6.4 Hydrochemical Characteristics
Altogether 20 water samples were analyzed within the framework of this project. Previously 697 analyses were available of 612 wells, however, only 223 of those were complete and within the acceptable limit of less than 10 % analytical error. The results of all analyses with acceptable accuracy are listed in Annex 5. In order to better understand the spatial distribution of the different hydrochemical components the total area was subdivided into 5 areas where water quality is characteristically different from one area to the other (Figure 48). This delineation is based on the hydrochemical characteristics of all 697 water samples from the Upper Aquifer. These area names will be referred to in the following chapters.

Technical Cooperation Project Investigation of Groundwater Resources and Airborne-Geophysical Investigation of Selected Mineral Targets in Namibia Groundwater Investigations in the Eastern Caprivi Region Main Hydrogeological Report
Page 56
Figure 48: Water Quality Areas for the Upper Aquifer

Technical Cooperation Project Investigation of Groundwater Resources and Airborne-Geophysical Investigation of Selected Mineral Targets in Namibia Groundwater Investigations in the Eastern Caprivi Region Main Hydrogeological Report
Page 57
6.4.1 Groundwater Quality Upper Aquifer The basic characteristics of the main water components in the Upper Aquifer in the different water quality areas are given in Table 11 and Figure 49. Table 11: Maximum and Average Contents of the Main Hydrochemical Elements in the Upper Aquifer
Maximum Average Maximum Average Maximum Average Maximum Average Maximum Average Maximum AverageDepth [m] 150 52.90 79 54.08 93 38.51 150 41.18 109 68.51 140 42.20Yield [m³/h] 32 9.43 25.2 11.71 25.9 11.01 25 9.85 25.9 9.83 10 2.80Waterlevel [m bgl] 55 16.58 50 20.87 45 7.81 40 9.56 43.4 22.69 38.1 7.97pH 9.9 7.54 8.3 7.61 9.5 7.36 8.2 7.03 8.6 7.79 8.6 7.50EC [mS/m] 2770 136.61 516 48.90 103.8 29.43 1010 98.87 209 109.36 2770 297.58TDS [mg/l] 22836 1046.57 4071 345.55 1936 268.92 6666 668.53 8134 1576.60 22836 2134.03Na [mg/l] 7750 230.35 970 26.09 580 60.86 1260 139.23 2550 425.78 7750 459.83K [mg/l] 182 9.35 105 7.31 31 4.05 111 10.12 68 9.21 182 18.30Ca [mg/l] 1835 134.94 295 124.83 120 35.96 215 69.01 1835 189.80 800 115.60Mg [mg/l] 1708 77.44 156 38.25 50 14.44 309 39.86 1354 129.76 296 62.11Fe [mg/l] 13.1 0.85 13.1 0.58 5.6 1.14 3.5 1.24 8.5 0.48 10.8 1.40Mn [mg/l] 2.9 0.44 0.4 0.20 0.1 0.10 2.9 0.70Cl [mg/l] 5200 156.58 180 7.61 270 21.43 420 75.69 2100 312.38 5200 231.76HCO3 [mg/l] 2238 295.66 475 229.68 766 160.05 800 189.99 1134 365.09 2238 432.52SO4 [mg/l] 10600 282.44 2000 42.89 460 31.23 2100 154.52 4000 483.78 10600 665.68NO3 [mg/l] 47.5 1.18 18 0.41 45 1.49 46 2.39 6 0.33 47.5 2.66NO2 [mg/l] 2.4 0.07 0.9 0.05 0.3 0.05 2.4 0.16 1.1 0.06 1.4 0.10SiO2 [mg/l] 125 52.49 120 77.62 105 36.00 79 46.66 125 42.52 107 55.42F [mg/l] 10.6 0.39 10.6 0.34 1.4 0.27 1.1 0.23 1.2 0.25 5.2 0.67
AREA Golden Highway Area Linyanti AreaEntire Area Kwando Area North-Zambezi Area Bukalo-Ngoma Area
Groundwater quality strongly varies throughout the Eastern Caprivi, as groundwater is subject to various degrees of evaporation before infiltration and is largely affected by cation exchange processes further along the flowpath. Concerning the TDS distribution in the Upper Aquifer, Figure 49 shows that in an around 15 km wide strip near the Kwando River (Kwando Area) and an around 20 km wide strip near the Zambezi River (North-Zambezi Area) TDS values mostly fall into group A (less than 1,500 mg/l; excellent water quality) category. These are the main areas of groundwater inflow into the Upper Aquifer. On the other hand the group B limit for TDS of the Namibian Drinking Water Guideline (Annex 6) of 2,000 mg/l (low and high risk water) is often exceeded in the Golden Highway Area as well as the Linyanti Area (compare Figure 38). Since there is no natural source for these increased salinities in the sediments themselves, the high mineralization must chiefly originate from rainfall evaporation. The few values of lower salinities in this area indicate that localized recharge may take place there under favorable conditions. Another source for the high salinities may be lateral inflow as discussed further below in this chapter. That surface water from the main rivers is recharging the surrounding groundwater resources by means of river bed infiltration is evidenced by the fact that TDS values are mostly below 250 mg/l in these two areas. TDS near the Zambezi River is even considerably less than near the Kwando River, probably as a result of the higher recharge from surface water infiltration due to frequent flooding (ponding). In the Kwando area calcium, magnesium and bicarbonate predominate (Figures 50 and 51), resulting in Ca-HCO3, Ca-Mg-HCO3, Mg-Ca-HCO3 or similar water types (Figure 60), whereas sodium dominates in the entire central and eastern part of the project area (Figures 52 and 53). In the Golden Highway Area Na-HCO3 type (and

Technical Cooperation Project Investigation of Groundwater Resources and Airborne-Geophysical Investigation of Selected Mineral Targets in Namibia Groundwater Investigations in the Eastern Caprivi Region Main Hydrogeological Report
Page 58
similar type) waters prevail, whereas the remaining area with Na-predominance is mostly of mixed water type. Na-HCO3 waters result from cation exchange of Ca against Na from clay minerals in the sediments. This is indicated by the sodium/chloride ratio which is commonly well above 1 (Figure 54). Chloride contents mostly are below 10 mg/l near the Kwando and Zambezi Rivers (Figure 55) whereas they often exceed 100 mg/l in the Golden Highway Area. There, the group C limit for chloride of 1,200 mg/l was exceeded in 30 samples. Sulphate contents near the Kwando and Zambezi Rivers usually are well below 20 mg/l whereas they are on average 480 mg/l in the Golden Highway Area between Mabanga and Sachinda (Figure 56). They are even higher in the Linyanti Area between Linyanti and Makolonga where the average sulphate content is around 670 mg/l. Sulphate may be formed by pyrite oxidation. Pyrite was observed in borehole WW41005 and is stable under anoxic conditions. Pyrite oxidation may result in the formation of FeOOH or Fe(OH)3, a process often recognized in mine waters. Nitrate contents (NO3-N) are relatively low, reaching 47.5 mg/l as a maximum. Most elevated contents (above 25 mg/l) are recognized in the eastern part of the Linyanti Area and further east of it, around Kalambesa, Lusese and Bukalo (Figure 57). The group B limit for iron of 1.0 mg/l is frequently exceeded in the eastern part of the Eastern Caprivi Region and near the Kwando River. High values especially occur around the village of Masokotwane (Figure 58). Fluoride (Figure 59) may cause fluorotoxicosis if ingested over extended periods of time in amounts exceeding 1.5 mg/l (drinking water standard of WHO, 1993). Therefore the use of water resources for human consumption with fluoride contents above this limit must be considered a health risk. The highest content encountered in the Eastern Caprivi Region is 10.6 mg/l (WW23281 at Singalamwe, near the Kwando River). The risk of fluorotoxicosis is high in the Linyanti area, especially around the village of Makolonga (around 4 mg/l). Figure 60 shows the spatial distribution of water types in the Eastern Caprivi Region based on the 223 complete analyses. Ca-Mg-HCO3-type waters prevail near the Kwando river but are present also elsewhere. In the central part sodium-type (sodium-bicarbonate, Na-mixed anions) waters are dominant. Waters with dominance of sulphate anions chiefly occur in the eastern part.

Technical Cooperation Project Investigation of Groundwater Resources and Airborne-Geophysical Investigation of Selected Mineral Targets in Namibia Groundwater Investigations in the Eastern Caprivi Region Main Hydrogeological Report
Page 59
740000 750000 760000 770000 780000 790000 800000 810000 820000 830000 840000 850000 860000 870000 880000 890000 900000 910000 920000 9300007950000
7960000
7970000
7980000
7990000
8000000
8010000
8020000
8030000
8040000
8050000
8060000
8070000
Zambia
Botswana
Kongola
Linyanti
Ngoma
Katima Mulilo
Kalambesa
Lusese
Schuckmannsburg
Bukalo
Content [mg/l] 43 to 250 250 to 750 750 to 1500 1500 to 2000 2000 to 3000 3000 to 14790
group Agroup Bgroup Cgroup D
Figure 49: TDS Distribution in the Upper Aquifer (blue borehole symbol: DWA-BGR-
boreholes)
740000 750000 760000 770000 780000 790000 800000 810000 820000 830000 840000 850000 860000 870000 880000 890000 900000 910000 920000 9300007950000
7960000
7970000
7980000
7990000
8000000
8010000
8020000
8030000
8040000
8050000
8060000
8070000
Zambia
Botswana
Kongola
Linyanti
Ngoma
Katima Mulilo
Kalambesa
Lusese
Schuckmannsburg
Bukalo
Relative Content [meq%] 0 to 15 15 to 30 30 to 45 45 to 60 60 to 75 75 to 100
Figure 50: Predominance of Calcium in the Upper Aquifer (meq%)

Technical Cooperation Project Investigation of Groundwater Resources and Airborne-Geophysical Investigation of Selected Mineral Targets in Namibia Groundwater Investigations in the Eastern Caprivi Region Main Hydrogeological Report
Page 60
740000 750000 760000 770000 780000 790000 800000 810000 820000 830000 840000 850000 860000 870000 880000 890000 900000 910000 920000 9300007950000
7960000
7970000
7980000
7990000
8000000
8010000
8020000
8030000
8040000
8050000
8060000
8070000
Zambia
Botswana
Kongola
Linyanti
Ngoma
Katima Mulilo
Kalambesa
Lusese
Schuckmannsburg
Bukalo
Relative Content [meq%] 0 to 15 15 to 30 30 to 45 45 to 60 60 to 75 75 to 100
Figure 51: Predominance of Bicarbonate in the Upper Aquifer (meq%)
740000 750000 760000 770000 780000 790000 800000 810000 820000 830000 840000 850000 860000 870000 880000 890000 900000 910000 920000 9300007950000
7960000
7970000
7980000
7990000
8000000
8010000
8020000
8030000
8040000
8050000
8060000
8070000
Zambia
Botswana
Kongola
Linyanti
Ngoma
Katima Mulilo
Kalambesa
Lusese
Schuckmannsburg
Bukalo
Relative Content [meq%] 0 to 15 15 to 30 30 to 45 45 to 60 60 to 75 75 to 100
Figure 52: Predominance of Sodium in the Upper Aquifer (meq%)
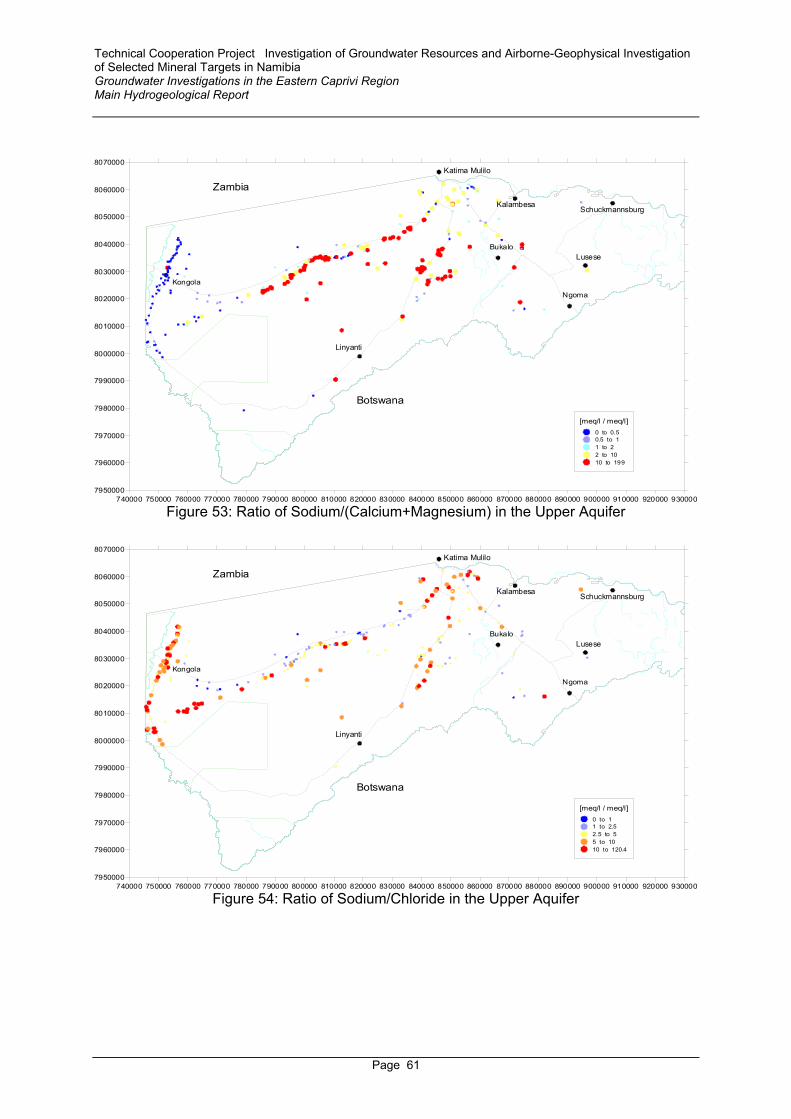
Technical Cooperation Project Investigation of Groundwater Resources and Airborne-Geophysical Investigation of Selected Mineral Targets in Namibia Groundwater Investigations in the Eastern Caprivi Region Main Hydrogeological Report
Page 61
740000 750000 760000 770000 780000 790000 800000 810000 820000 830000 840000 850000 860000 870000 880000 890000 900000 910000 920000 9300007950000
7960000
7970000
7980000
7990000
8000000
8010000
8020000
8030000
8040000
8050000
8060000
8070000
Zambia
Botswana
Kongola
Linyanti
Ngoma
Katima Mulilo
Kalambesa
Lusese
Schuckmannsburg
Bukalo
[meq/l / meq/l] 0 to 0.5 0.5 to 1 1 to 2 2 to 10 10 to 199
Figure 53: Ratio of Sodium/(Calcium+Magnesium) in the Upper Aquifer
740000 750000 760000 770000 780000 790000 800000 810000 820000 830000 840000 850000 860000 870000 880000 890000 900000 910000 920000 9300007950000
7960000
7970000
7980000
7990000
8000000
8010000
8020000
8030000
8040000
8050000
8060000
8070000
Zambia
Botswana
Kongola
Linyanti
Ngoma
Katima Mulilo
Kalambesa
Lusese
Schuckmannsburg
Bukalo
[meq/l / meq/l] 0 to 1 1 to 2.5 2.5 to 5 5 to 10 10 to 120.4
Figure 54: Ratio of Sodium/Chloride in the Upper Aquifer

Technical Cooperation Project Investigation of Groundwater Resources and Airborne-Geophysical Investigation of Selected Mineral Targets in Namibia Groundwater Investigations in the Eastern Caprivi Region Main Hydrogeological Report
Page 62
740000 750000 760000 770000 780000 790000 800000 810000 820000 830000 840000 850000 860000 870000 880000 890000 900000 910000 920000 9300007950000
7960000
7970000
7980000
7990000
8000000
8010000
8020000
8030000
8040000
8050000
8060000
8070000
Zambia
Botswana
Kongola
Linyanti
Ngoma
Katima Mulilo
Kalambesa
Lusese
Schuckmannsburg
Bukalo
Content (mg/l) 0 to 50 50 to 250 250 to 600 600 to 1200 1200 to 2000 2000 to 6000
group Agroup Bgroup Cgroup D
Figure 55: Chloride Contents in the Upper Aquifer (mg/l)
740000 750000 760000 770000 780000 790000 800000 810000 820000 830000 840000 850000 860000 870000 880000 890000 900000 910000 920000 9300007950000
7960000
7970000
7980000
7990000
8000000
8010000
8020000
8030000
8040000
8050000
8060000
8070000
Zambia
Botswana
Kongola
Linyanti
Ngoma
Katima Mulilo
Kalambesa
Lusese
Schuckmannsburg
Bukalo
Content (mg/l) 2 to 100 100 to 200 200 to 600 600 to 1200 1200 to 2000 2000 to 10600
group Agroup Bgroup Cgroup D
Figure 56: Sulphate Contents in the Upper Aquifer (mg/l)

Technical Cooperation Project Investigation of Groundwater Resources and Airborne-Geophysical Investigation of Selected Mineral Targets in Namibia Groundwater Investigations in the Eastern Caprivi Region Main Hydrogeological Report
Page 63
740000 750000 760000 770000 780000 790000 800000 810000 820000 830000 840000 850000 860000 870000 880000 890000 900000 910000 920000 9300007950000
7960000
7970000
7980000
7990000
8000000
8010000
8020000
8030000
8040000
8050000
8060000
8070000
Zambia
Botswana
Kongola
Linyanti
Ngoma
Katima Mulilo
Kalambesa
Lusese
Schuckmannsburg
Bukalo
Content (mg/l) 0.0 to 5.0 5.0 to 10.0 10.0 to 15.0 15.0 to 25.0 25.0 to 47.5
group Agroup Bgroup Cgroup D
Figure 57: Nitrate (NO3-N) Contents in the Upper Aquifer (mg/l)
740000 750000 760000 770000 780000 790000 800000 810000 820000 830000 840000 850000 860000 870000 880000 890000 900000 910000 920000 9300007950000
7960000
7970000
7980000
7990000
8000000
8010000
8020000
8030000
8040000
8050000
8060000
8070000
Zambia
Botswana
Kongola
Linyanti
Ngoma
Katima Mulilo
Kalambesa
Lusese
Schuckmannsburg
Bukalo
Content (mg/l) 0.0 to 0.1 0.1 to 1.0 1.0 to 2.0 2.0 to 5.0 5.0 to 13.1
group Agroup Bgroup Cgroup D
Figure 58: Iron Contents in the Upper Aquifer (mg/l)

Technical Cooperation Project Investigation of Groundwater Resources and Airborne-Geophysical Investigation of Selected Mineral Targets in Namibia Groundwater Investigations in the Eastern Caprivi Region Main Hydrogeological Report
Page 64
740000 750000 760000 770000 780000 790000 800000 810000 820000 830000 840000 850000 860000 870000 880000 890000 900000 910000 920000 9300007950000
7960000
7970000
7980000
7990000
8000000
8010000
8020000
8030000
8040000
8050000
8060000
8070000
Zambia
Botswana
Kongola
Linyanti
Ngoma
Katima Mulilo
Kalambesa
Lusese
Schuckmannsburg
Bukalo
Content (mg/l) 0 to 1.5 1.5 to 2 2 to 3 3 to 5 5 to 11
group Agroup Bgroup Cgroup D
Figure 59: Fluoride Contents in the Upper Aquifer (mg/l)

Technical Cooperation Project Investigation of Groundwater Resources and Airborne-Geophysical Investigation of Selected Mineral Targets in Namibia Groundwater Investigations in the Eastern Caprivi Region Main Hydrogeological Report
Page 65
Figure 60: Distribution of Water Types in the Eastern Caprivi Region

Technical Cooperation Project Investigation of Groundwater Resources and Airborne-Geophysical Investigation of Selected Mineral Targets in Namibia Groundwater Investigations in the Eastern Caprivi Region Main Hydrogeological Report
Page 66
Lower Aquifer Because of the predominantly greenish color of the sediments and the presence of H2S (strong smell) in the Lower Aquifer the groundwater can be characterized as intermediary water between oxidized and reduced conditions (Figure 61). Typical for these conditions are the low redox potentials (+82 to +157 mV) and the low oxygen content (0.8 to 2.8 mg/l) which were measured during pumping tests. The formation of H2S may be caused by sulphate reduction (sulphate + organic matter + water > bicarbonate + hydrogen sulphide). The pH measured in the field was commonly above 9. The Ryznar-Index varies between 8.5 and 9.1 and water is therefore classified as corrosive. For development of the Lower Aquifer it needs to be considered that water treatment is required and that casing and pumps must be resistant to corrosion.
Figure 61: Stability of Water in Relation with Redox- and pH-Conditions (blue symbol indicates average composition of groundwater in the Lower Aquifer)
All samples are almost devoid of calcium, magnesium, potassium, iron and manganese, whereas sodium constitutes more than 90% of the cations (Table 12, Figure 62). Anions are more or less evenly distributed between bicarbonate, sulphate and chloride. Concerning the analyzed additional elements, Br, As, B, Pb, Cu, Zn and Sr, most analyses show contents below or near the detection limits and in no case the limit for group A was reached (Table 12).
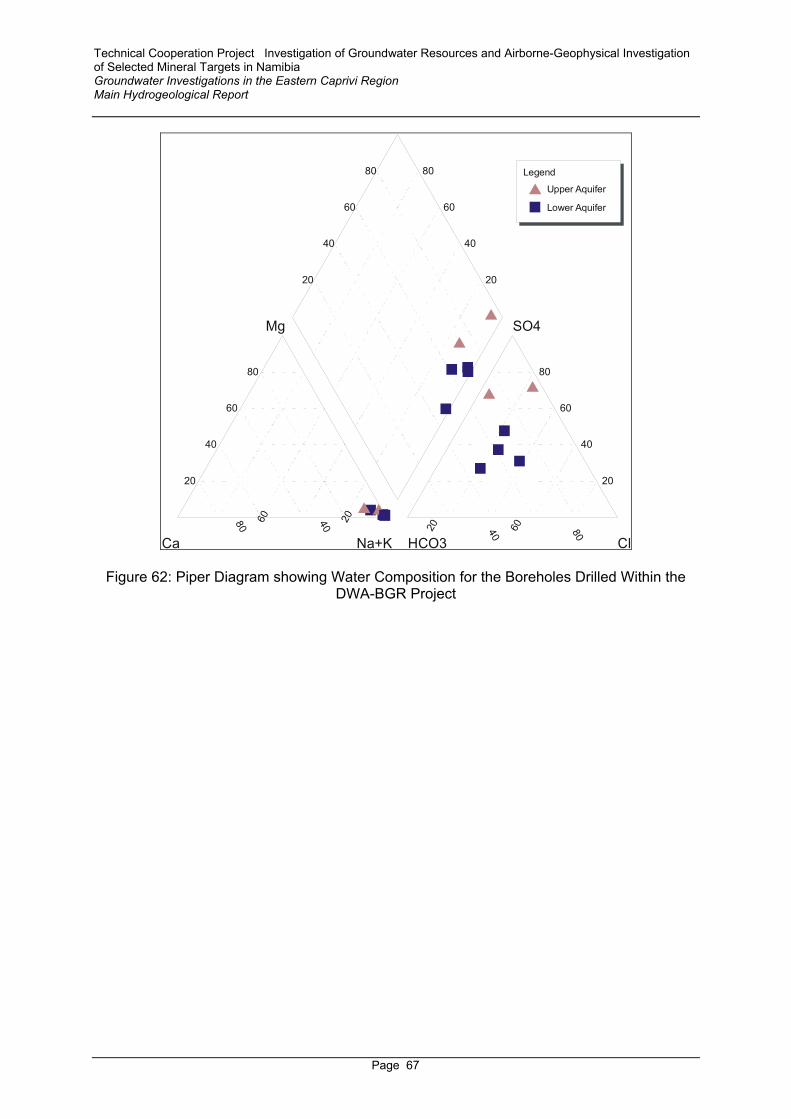
Technical Cooperation Project Investigation of Groundwater Resources and Airborne-Geophysical Investigation of Selected Mineral Targets in Namibia Groundwater Investigations in the Eastern Caprivi Region Main Hydrogeological Report
Page 67
80 60 40 20
20 40 60 80
20
40
60
80 80
60
40
20
20
40
60
80
20
40
60
80
Ca Na+K HCO3 Cl
Mg SO4
D
D
D
D
D
D
D
D
D
A
A
A
D
D
D
A
A
A
LegendLegend
A Upper Aquifer
D Lower Aquifer
Figure 62: Piper Diagram showing Water Composition for the Boreholes Drilled Within the DWA-BGR Project

Technical Cooperation Project Investigation of Groundwater Resources and Airborne-Geophysical Investigation of Selected Mineral Targets in Namibia Groundwater Investigations in the Eastern Caprivi Region Main Hydrogeological Report
Page 68
Table 12: Chemical Composition of Groundwater in the Lower Aquifer
Main Components pH EC TD
S
Turb
idity
Sulp
hate
as
SO4
Chl
orid
e as
Cl
Fluo
ride
as F
Nitr
ate
as N
Nitr
ite a
s N
Silic
a as
SiO
2
P-A
lkal
inity
as
CaC
O3
T-A
lkal
inity
as
CaC
O3
T-H
ardn
ess
as C
aCO
3, ca
l
Cal
cium
as
Ca
Mag
nesi
um a
s M
g
Sodi
um a
s N
a
Pota
ssiu
m a
s K
mS/m mg/l NTU mg/l mg/l mg/l mg/l mg/l mg/l mg/l mg/l mg/l mg/l mg/l mg/l mg/l6.0 - 9.0 150 1500 1 200 250 1.5 10 300 150 70 100 2005.5 - 9.5 300 2000 5 600 600 2 20 650 200 100 400 4004.0-11.0 400 3000 10 1200 1200 3 40 1300 400 200 800 8004.0-11.0 6000 1500 3000 6 100 10 1000 500 2000
41002 8.6 98.7 550 0.4 169 83 0.3 1.1 33 186 46 12 4.2 198 2.141003 9.4 96.3 564 0.2 201 70 0.2 0.9 32 136 12 3.2 1.1 204 1.141004 9.5 138.3 912 0.10 192 175 0.6 28 26 208 10 2.1 1.1 293 1.141006 9.5 108.3 592 0.10 136 80 1.1 0.4 30 29 281 10 2.1 1.1 246 2.1
WW
Trace Elements
WW41002 WW41003 WW41004 WW41006 Group A Group B Group C Lievestock-wateringBromide as Br- 0.2 <0.2 0.4 <0.2 1.0 3.0 6.0Arsenic as As 0.01 0.01 0.01 0.01 0.1 0.3 0.6 0.5Boron as B <0.01 <0.01 <0.01 <0.01 0.5 2.0 4.0 5Lead as Pb <0.01 <0.01 <0.01 <0.01 0.05 0.1 0.2 0.1Copper as Cu 0.01 0.13 0.01 0.01 0.5 1.0 2.0 5Zinc as Zn 0.01 0.02 0.01 0.01 1.0 5 10 20Strontium as Sr 0.24 0.08 0.08 0.05

Technical Cooperation Project Investigation of Groundwater Resources and Airborne-Geophysical Investigation of Selected Mineral Targets in Namibia Groundwater Investigations in the Eastern Caprivi Region Main Hydrogeological Report
Page 69
6.4.2 Isotopic Composition In the late 1990s the International Atomic Energy Agency (IAEA) in cooperation with DWA conducted an isotope study in the Eastern Caprivi Region in order to determine whether and to what extent river bed infiltration takes place at the Kwando and Zambezi Rivers (BEDMAR, 1999). Deuterium (2H; D), oxygen-18 (18O) and tritium (3H) were analyzed at 122 boreholes. Unfortunately carbon-14 (14C) and carbon-13 (13C) were not analyzed and complete 2H, 18O and 3H analyses were only carried out at 56 locations. Concerning the stable isotopes 2H and 18O, values are expressed as deviations from the Vienna Standard Mean Ocean Water (VSMOW) standard in per mil. The deuterium excess (∆D) is calculated using the equation: ∆D = δD – 8* δ18O. The isotope data to this study are documented in Annex 7. For the current investigation stable and radioactive isotopes were analyzed by the Schonland Institute, Johannesburg, South Africa, at 16 boreholes in the Upper Aquifer and 4 boreholes in the Lower Aquifer. The related report is attached as Annex 8. Figure 63 shows that δ 18O values of groundwater in the Upper Aquifer are usually > -2‰ near the main rivers, the Kwando, Linyanti and Zambezi, which indicates recharge from surface water being “heavier”, i.e. less depleted in 18O than the Vienna SMOW. As Verhagen points out (Annex 8) this may be caused not only by river bank infiltration but also by ponding during extended flooding periods. The Zambezi River is slightly less enriched in heavy isotopes than the Kwando River. An enrichment of heavy isotopes near the rivers is also valid for the distribution of δ D (Figure 64). Near the rivers δD commonly exceeds -30‰. Plotting δD versus δ18O values it becomes evident that most values for groundwater of the Upper Aquifer do not plot on the Global Meteoric Water Line (GMWL; δD = 8* δ18O + 10) but on an evaporation line that follows roughly the equation: δD = 5.2* δ18O – 14.2. As can be seen on Figure 65, surface water from the Kwando, Linyanti and Zambezi Rivers which was analyzed simultaneously also plot on this evaporation line so that it may be justified assuming that this evaporation line also represents the mean isotopic composition in the catchment areas of those rivers (BEDMAR, 1999). The distribution of tritium values of groundwater in the Upper Aquifer (Figure 66) above zero indicate that some recent recharge occurs in the area. However, in the Golden Highway Area and the Linyanti Area values are predominantly near zero, meaning that present-day recharge there is mostly negligible. As pointed out by Verhagen (Annex 8), tritium values of approximately 0 indicate mean residence times of > 500 years. The highest tritium level encountered is 5.8 TU (± 0.2) in a borehole near the Kwando River at Ngonga (south of Kongola). The only 14C and 13C analyses available for the project area are those conducted by the Schonland Institute in the framework of the current investigation (Annex 8). The pMC values (percent modern carbon) in the Upper Aquifer (Figure 67) show a general decrease towards east so that it may be assumed that groundwater ages increase in that direction. The same trend is recognized in the Lower Aquifer (Figure 68), however, at much lower pMC values. The rather low pMC values in the Upper

Technical Cooperation Project Investigation of Groundwater Resources and Airborne-Geophysical Investigation of Selected Mineral Targets in Namibia Groundwater Investigations in the Eastern Caprivi Region Main Hydrogeological Report
Page 70
Aquifer, especially in the central part, support the hypothesis of negligible groundwater recharge to the Upper Aquifer. The very low pMC values in the Lower Aquifer of the central part speak for rather high residence times, exceeding 10,000 years in the central part, confirming the concept of predominantly lateral flow with upward leakage in the Lower Aquifer. But even in the Upper Aquifer residence times are mostly around 5,000 to 10,000 years and more. The mean residence time (MRT) is calculated based on the following formula:
MRT = ln(2)
lnC(t)
C0
( )-
where C(t): measured 14C content (pMC) C0: initial 14C content (pMC); uncorrected: 100 For the Upper Aquifer the following uncorrected mean residence times are calculated (Table 13): Table 13: Uncorrected Mean Residence Times in the Upper Aquifer
Laboratory Sample UTM-E UTM-S δ13C uncorrected MRTNumber Identification (‰) (yrs)NWA 57 WW36567 799774.35 8030584.67 19.8 ±1.7 -6.82 13388NWA 58 WW36557 795208.45 8028712.64 15.8 ±1.7 -6.21 15253NWA 59 WW36537 764780.09 8013529.13 48.3 ±2.1 -8.87 6016NWA 60 WW36529 762288.48 8013451.79 66.6 ±2.2 -10.61 3360NWA 61 WW36080 778537.46 8018776.58 70.7 ±2.3 -9.61 2866NWA 62 WW36536 759867.55 8011501.89 46.3 ±2.0 -9.70 6366NWA 63 WW36531 759663.09 8010463.75 46.5 ±2.0 -9.27 6330NWA 64 WW36534 758659.25 8010676.31 62.5 ±2.2 -10.23 3885NWA 65 WW34608 756292.05 8027482.14 57.8 ±2.2 -7.44 4532NWA 66 WW36505 758931.82 8028222.90 49.5 ±2.1 -9.87 5813NWA 67 WW36551 788710.76 8023852.21 39.3 ±2.0 -11.98 7721NWA 68 WW36543 787363.21 8023445.45 35.6 ±1.9 -9.99 8538NWA 69 WW36468 802703.96 8034137.78 28.6 ±1.8 -10.49 10348NWA 70 WW37077 839095.45 8020031.08 2.0 ±1.5 -5.27 32339NWA 74 WW41005 800966.57 8019952.35 52.8 ±2.1 -6.44 5280NWA 76 WW41007 794186.00 8010257.00 42.5 ±2.0 -6.72 7073
14C(pMC)
For the Lower Aquifer the following uncorrected mean residence time are calculated (Table 14): Table 14: Uncorrected Mean Residence Times in the Lower Aquifer
Laboratory Sample UTM-E UTM-S δ13C uncorrected MRTNumber Identification (‰) (yrs)NWA 71 WW41002 764462.00 8013669.00 33.3 ±1.9 -9.50 9090NWA 72 WW41003 793427.00 8024630.00 10.7 ±1.6 -6.41 18475NWA 73 WW41004 800950.00 8019950.00 5.7 ±1.6 -4.87 23681NWA 75 WW41006 794186.00 8010257.00 0.0 ±1.4 -5.32 > 30000
14C(pMC)

Technical Cooperation Project Investigation of Groundwater Resources and Airborne-Geophysical Investigation of Selected Mineral Targets in Namibia Groundwater Investigations in the Eastern Caprivi Region Main Hydrogeological Report
Page 71
Presently it is not possible to meaningfully correct the MRT and the MRT values give therefore only a very general indication about residence times. Moreover, the high MRT values must be considered with care because they have a comparably low level of accuracy. The presence of H2S in the Lower Aquifer that was noticed during drilling is attributed to sulfate reduction by bacteria (APPELO & POSTMA, 1994). This process leads to isotopic enrichment in 34S in sulfate whereas the H2S becomes isotopically reduced in 34S because the bacteria preferentially reduce 32S. Unfortunately no isotopic analysis of 34S/32S was conducted. It is recommended to carry out 34S isotopic sampling in the framework of new investigations in the Eastern Caprivi. Verhagen, however, points out (Annex 8) that the slightly negative trend of the δ13C – 14C relationship (Figure 69), though not unambiguously developed, contradicts the hypothesis of sulphate reduction because in such a case one would expect a positive trend of the correlation instead of a negative one. The presence of tritium in samples WW35629 (0.4 TU) and WW36531 (0.5 TU) in combination with relatively low pMC values (67 respectively 50) may indicate mixing of relatively old with relatively young water in these boreholes (Figure 70).
740000 750000 760000 770000 780000 790000 800000 810000 820000 830000 840000 850000 860000 870000 880000 890000 900000 910000 920000 9300007950000
7960000
7970000
7980000
7990000
8000000
8010000
8020000
8030000
8040000
8050000
8060000
8070000
Zambia
Botswana
Kongola
Linyanti
Ngoma
Katima Mulilo
Kalambesa
Lusese
Schuckmannsburg
Bukalo
Content (per mil) -9.0 to -7.0 -7.0 to -6.0 -6.0 to -4.0 -4.0 to -2.0 -2.0 to -1.0 -1.0 to 0.0
> -2 ‰< -2 ‰
Figure 63: δ 18O Values in the Upper Aquifer (‰)

Technical Cooperation Project Investigation of Groundwater Resources and Airborne-Geophysical Investigation of Selected Mineral Targets in Namibia Groundwater Investigations in the Eastern Caprivi Region Main Hydrogeological Report
Page 72
740000 750000 760000 770000 780000 790000 800000 810000 820000 830000 840000 850000 860000 870000 880000 890000 900000 910000 920000 9300007950000
7960000
7970000
7980000
7990000
8000000
8010000
8020000
8030000
8040000
8050000
8060000
8070000
Zambia
Botswana
Kongola
Linyanti
Ngoma
Katima Mulilo
Kalambesa
Lusese
Schuckmannsburg
Bukalo
Content (per mil) -64.7 to -50.0 -50.0 to -40.0 -40.0 to -30.0 -30.0 to -20.0 -20.0 to -10.0 -10.0 to 0.0
Figure 64: δ D Values in the Upper Aquifer (‰)
δ Deuterium - δ Oxygen-18 Correlation
δD = 5.2*δ18O - 14.2R2 = 0.97
δD = 8*δ18O + 10
-80
-70
-60
-50
-40
-30
-20
-10
0
10
20-12 -10 -8 -6 -4 -2 0 2 4
δ oxygen-18 (‰)
δ de
uter
ium
(‰)
groundwater surface water
GMWL
Figure 65: δ D versus δ 18O Relationship

Technical Cooperation Project Investigation of Groundwater Resources and Airborne-Geophysical Investigation of Selected Mineral Targets in Namibia Groundwater Investigations in the Eastern Caprivi Region Main Hydrogeological Report
Page 73
740000 750000 760000 770000 780000 790000 800000 810000 820000 830000 840000 850000 860000 870000 880000 890000 900000 910000 920000 9300007950000
7960000
7970000
7980000
7990000
8000000
8010000
8020000
8030000
8040000
8050000
8060000
8070000
Zambia
Botswana
Kongola
Linyanti
Ngoma
Katima Mulilo
Kalambesa
Lusese
Schuckmannsburg
Bukalo
Tritium Units 0.0 to 0.2 0.2 to 0.5 0.5 to 1.0 1.0 to 2.0 2.0 to 5.8
Figure 66: Tritium Values in the Upper Aquifer (TU)
740000 750000 760000 770000 780000 790000 800000 810000 820000 830000 840000 850000 860000 870000 880000 890000 900000 910000 920000 9300007950000
7960000
7970000
7980000
7990000
8000000
8010000
8020000
8030000
8040000
8050000
8060000
8070000
2015
4867
71
465063
57
503936
29
253
43
Zambia
Botswana
Kongola
Linyanti
Ngoma
Katima Mulilo
Kalambesa
Lusese
Schuckmannsburg
Bukalo
Content [pmc] 2.0 to 20.0 20.0 to 40.0 40.0 to 50.0 50.0 to 60.0 60.0 to 70.7
~3,000 - 5,000 yrs
~10,000 - 15,000 yrs
Figure 67: 14C Values in the Upper Aquifer (pMC)

Technical Cooperation Project Investigation of Groundwater Resources and Airborne-Geophysical Investigation of Selected Mineral Targets in Namibia Groundwater Investigations in the Eastern Caprivi Region Main Hydrogeological Report
Page 74
Figure 68: 14C Values in the Lower Aquifer (pMC)
Delta C-13 vs C-14
-12
-11
-10
-9
-8
-7
-6
-5
-40 10 20 30 40 50 60 70 80
C-14 (pMC)
C-1
3 (‰
)
Lower Aquifer Upper Aquifer Linear (Lower Aquifer) Linear (Upper Aquifer) Figure 69: Relationship of 14C (pMC) with δ13C (‰)

Technical Cooperation Project Investigation of Groundwater Resources and Airborne-Geophysical Investigation of Selected Mineral Targets in Namibia Groundwater Investigations in the Eastern Caprivi Region Main Hydrogeological Report
Page 75
Tritium vs C-14
0
10
20
30
40
50
60
70
80
0 2 4 6 8 10 12 14 16 18
tritium (TU)
C-1
4 (p
MC
)
Upper Aquifer Lower Aquifer Figure 70: Relationship of 3H (TU) with 14C (pMC)
6.5 Groundwater Monitoring
Presently there are no wells for monitoring of groundwater levels or groundwater quality in the area. Before starting to develop the newly detected groundwater resources it is strongly recommended to use the newly drilled boreholes WW41004/ WW41005 and WW41006/WW41007 for monitoring purposes over a sufficiently long time period in order to provide data on the range of water level fluctuations and possible fluctuations in the chemical composition of the water. From the water level rise after rainfall and the time lag between rainfall events and peak water levels it may be possible to draw conclusions about the mechanism and amount of groundwater recharge. For this calculation it is, however, also required to determine the storage coefficient/specific yield, meaning that another pair of monitoring wells would have to be drilled near the existing ones.
6.6 Groundwater Exploitation Potential
In the absence of sufficient information on the correct geometry of the aquifer system, the horizontal and vertical distribution of hydraulic conductivities and the hydraulic gradient it is difficult to properly estimate the exploitation potential of the aquifer.

Technical Cooperation Project Investigation of Groundwater Resources and Airborne-Geophysical Investigation of Selected Mineral Targets in Namibia Groundwater Investigations in the Eastern Caprivi Region Main Hydrogeological Report
Page 76
The yields in the Lower Aquifer (Figure 44) so far encountered are considerably higher than those of the Upper Aquifer (Figure 45). The reason for this is the higher transmissivity and higher saturated thickness of the Lower Aquifer. Therefore the exploitation potential of the Lower Aquifer is much higher than that of the Upper Aquifer. However, the recharge mechanism and amount are presently not well understood so that further investigations of this aquifer are required prior to its development. Based on the groundwater contour map of the Upper Aquifer (Figure 42) the flow in this aquifer can be estimated. For this purpose the 940 m contour line was chosen. The average gradient is around 1 ‰, the length of the considered section is 96 km and the transmissivity in this area is assumed to be around 100 m²/d. With these data one arrives at a volume flow in the Upper Aquifer of around 3.5 MCM/a passing the 940 m contour line between Sangwali and north of Masida. This amount seems comparatively low even though it only comprises part of the flow in this aquifer. Flow in the lower aquifer can presently not be estimated because data are only available from a small area. For the establishment of the water balance most of the input data can presently not be sufficiently sound estimated. It is therefore currently refrained from providing a water balance for the Eastern Caprivi. In order to arrive at a better basis for this calculation the following is required:
• metering and recording of groundwater abstractions; • metering and recording of surface water import (in order to estimate the return
flow components from surface water); • determination whether/where river bank infiltration into the Lower Aquifer
occurs and quantification of recharged amount • determination whether/where inflow from very deep aquifers take place (i.e.
inflow from the Karoo basalt and below). Most of these components are rather difficult to quantify and it is therefore believed difficult to establish a comprehensive water balance in the Eastern Caprivi.
Technical Cooperation Project Investigation of Groundwater Resources and Airborne-Geophysical Investigation of Selected Mineral Targets in Namibia Groundwater Investigations in the Eastern Caprivi Region Main Hydrogeological Report
Page 77
7 Water Demand
Several studies of the water demand have been conducted within the framework of previous projects as well as by DWA itself. In 1990 DWA compiled a Preliminary Master Water Plan and determined the water demand. The report stated that water supply by the 5 bulk water supply schemes for Katima Mulilo (13,400 inhabitants in 1991), Mafuta, Chinchimane, Linyanti and Bukalo were sufficient at least until 2005. At that time the Katima, Linyanti and Chinchimane areas were supplied by river water, whereas Mafuta and Bukalo relied on groundwater. The water pipeline (125 mm uPVC) at the Golden Highway which was constructed in 1980 for the tar road construction was not operated between after the completion of the road and 1987, when it was recommissioned for water supply to the population which had in the mean time settled along the road. Water was pumped from the Zambezi at Katima to Sibbinda (approximately 70 km long pipeline) and from the Kwando at Kongola to Makanga (approximately 45 km long pipeline). However, the pumped river water was untreated and the pumped amounts were insufficient. The area had to be supplied by tankers to meet the demand until a sufficient number of boreholes had been drilled by the KfW project (CBA, 1998). The pipeline seems to be still in use today but water is not reaching the end points. DWA (1990) estimated the semi-urban water demand in 2005 as follows:
Town/Area Demand (m³/a) Katima 2,600,000 Chinchimane 88,800 Linyanti 38,900 Bukalo 85,500 Total 2,813,200
Rural water demand was estimated at 2.637 MCM/a (including livestock water demand), so that the total water demand estimate for 2005 was around 5.45 MCM/a. The DWA study advised against the option to use single water points exploiting groundwater because of the high installation and maintenance costs compared to the use of piped surface water in connection with local bulk water distribution schemes. In the year 2000 WINDHOEK CONSULTING ENGINEERS prepared a Rural Water Supply Development Plan for the Caprivi Region (WCE, 2000), not encompassing the urban area of Katima Mulilo. It estimates a total rural population of 57,400 in 2000 in the Eastern Caprivi and projects the number to 69,000 in 2015. The report states that even though present demand may be small, it may grow in the near future with increasing migration due to the completion of the Trans-Kalahari Highway and the Zambezi bridge, especially along the main infrastructure lines. A water use survey arrived at an average present demand of only 16 l/capita*day, however, with large local differences ranging from 7 to 43. At present the average walking distance to a water point is 1.25 km which is below the DWA standard of 2.5 km. With an upgraded

Technical Cooperation Project Investigation of Groundwater Resources and Airborne-Geophysical Investigation of Selected Mineral Targets in Namibia Groundwater Investigations in the Eastern Caprivi Region Main Hydrogeological Report
Page 78
network and increased development the water demand is expected to rise to an average of around 25 l/capita*day. With this and a fully implemented standard of a maximum walking distance of 2.5 km as well as a maximum of 200 people per water point, the study arrives at an overall future water rural water demand of 0.52 MCM/a (human consumption demand). Concerning stock water demand, the study estimates the present number of cattle at around 108,500 and the number of goats at around 40,700. With a water demand of 45 l/head*day for cattle and 10 l/head*day for goats and a maximum carrying capacity of 1 large stock per ha, it arrives at a present water demand of 2.4 MCM/a and a future demand (not related to date but carrying capacity) of 2.6 MCM/a. The WCE study advised against the use of piped water because it would lead to unwanted migration of people and to uncontrolled and illegal connections. It was therefore proposed to rehabilitate some of the existing water points and to drill a total of 165 boreholes in the Eastern Caprivi for human consumption in the rural areas. Concerning livestock, the consultant suggests that the carrying capacity of the area is already exceeded by a factor of 2 (current stock: 147,150; maximum capacity: 74,160). Traditionally, the rural population utilizes groundwater by means of hand-dug wells and shallow boreholes, which are typically equipped with hand pumps. Many boreholes are, however, unsuccessful in terms of water quality, and the ever growing water demand of the rural population cannot be met by the currently developed groundwater resources so that approximately 50 % of the population in the area are supplied by tanker service or piped water (WCE, 2000). A project to construct a pipeline from the Zambezi River to Linyanti, connecting the villages along the Katima Mulilo – Linyanti road is presently underway (LCE, 2002). The main conveyor line is already completed and it is envisaged to construct feeder lines connecting the smaller villages in the next construction phase (Figure 71). In this supply area the chances for finding adequate groundwater resources are small, even in the deeper part of the aquifer system. In the northern, western and central supply areas, however, groundwater resources, especially from the Lower Aquifer, may constitute an alternative to the supply from surface water.

Technical Cooperation Project Investigation of Groundwater Resources and Airborne-Geophysical Investigation of Selected Mineral Targets in Namibia Groundwater Investigations in the Eastern Caprivi Region Main Hydrogeological Report
Page 79
Figure 71: Water Supply Network in the Linyanti Region
(under construction; adopted from LCE, 2002)

Technical Cooperation Project Investigation of Groundwater Resources and Airborne-Geophysical Investigation of Selected Mineral Targets in Namibia Groundwater Investigations in the Eastern Caprivi Region Main Hydrogeological Report
Page 80
8 Recommendations and Conclusions
Within the framework of this investigation four boreholes were drilled into a formerly undiscovered high yielding rock unit in the western part of the Eastern Caprivi. This so-called Lower Aquifer consists of fine to coarse grained sandstone or semi-consolidated sand and is covered by a probably continuous aquitard of bluish-green clay. Whereas the Upper Aquifer becomes increasingly brackish towards east and south, fresh groundwater of good drinking water quality has been encountered in the Lower Aquifer at all drilling locations. Basalt has been found at three locations underneath the Lower Aquifer. At the southernmost drilling location basalt is either deeper than the total depth of the borehole or non-existing. At the drilling locations the Lower Aquifer has a thickness of between 55 and > 125 m and a transmissivity ranging from 58 to 774 m²/d. This aquifer has therefore a higher exploitation potential and is freshwater bearing in a larger area than the Upper Aquifer. The aquifer is therefore seen as a possible additional source for rural water supply, especially in those areas which are presently not or insufficiently supplied by piped surface water and where groundwater resources in the Upper Aquifer are not usable for drinking purposes due to elevated mineralization. Even though it is assumed that the Lower Aquifer occurs at greater depth under the Upper Aquifer in the entire Eastern Caprivi, the knowledge about the extent and distribution of yield, transmissivity and salinity of the Lower Aquifer is still insufficient. Before the start of a development program it is recommended to conduct further investigations covering the following aspects :
• The top and bottom of the Lower Aquifer (aquifer geometry) must be determined in more detail in the entire Eastern Caprivi, starting from the presently known extent of the aquifer.
• It is presently assumed that basalt forms the base of the Lower Aquifer in large parts of the area. This, however, may not be the case in some parts as being suggested by previous publications (Figure 29) and the magnetic field survey conducted by the project. Concerning future investigations into this matter, not only the availability or absence but also the thickness of the underlying Karoo basalt and hydraulic behavior should be determined as this may have a considerable influence on the entire hydraulic system and the hydrochemical composition thereof.
• It is presently unknown whether there is an aquifer in sediments, possibly the Karoo sandstone, underneath the basalt and what its exploitation potential and hydrochemical composition is. A few boreholes should therefore be targeted at this aquifer.
• The location and throw along tectonic faults should be determined together with the hydraulic function of them. It is assumed that the Caprivi Graben is composed of a system of tectonic blocks which have been vertically displaced along a system of SW-NE and NE-SW striking faults. It is presently assumed

Technical Cooperation Project Investigation of Groundwater Resources and Airborne-Geophysical Investigation of Selected Mineral Targets in Namibia Groundwater Investigations in the Eastern Caprivi Region Main Hydrogeological Report
Page 81
that water in the Lower Aquifer preferably discharges into the Upper Aquifer along such faults.
• The thickness and lithological composition of the Kalahari sediments is assumed to be different between the Caprivi Graben and the area north and south of it since after the formation of the graben considerable amounts of sediments must have deposited in the graben in a fluvial regime. It is therefore important to investigate the lithological differences of the Kalahari sediments.
• The direction of groundwater flow and the amounts of groundwater inflow and outflow to/from the aquifer system should be determined.
• It should be evaluated whether there is and what the amount of local groundwater recharge is to the Upper Aquifer.
• The spatial distribution of the hydraulic parameters and hydrochemical composition in the Lower Aquifer should be investigated.
• A groundwater balance should be established. In order to improve the information base for the piezometric maps, it is recommended to conduct a topographic survey of elevations of all boreholes and measure water levels at a specific time. For establishment of the outflow components the quantification of groundwater abstraction is important. It is recommended to install flow meters and record groundwater abstraction at least once a year. More hydrochemical and isotope analyses should be conducted, especially in the northern part in order to determine whether and to what extent the Upper Aquifer receives present-day recharge. Also the distribution of the “water age” in the Lower Aquifer should be investigated in more detail. Before development of the Lower Aquifer it is strongly recommended to monitor the water level and hydrochemical composition over an extended period of time (at least two years). Pumping tests should be carried out in areas where there is presently only insufficient knowledge concerning the main hydraulic parameters (transmissivity and storage coefficient). Based on the results the long-term sustainable yield of the Upper and if possible the Lower Aquifer should be evaluated. The drilling concept of the present investigation proved to be suitable. In respect of the corrosive conditions in the aquifers it is recommended to use uPVC casing wherever possible. It is also recommended to more carefully select the grain size of the filter pack and the screen slot size than it was possible within the framework of this project. Treatment of the groundwater from the Lower Aquifer will be required due its H2S content (reduced water). Some other recommendations of minor importance are mentioned in the report.

Technical Cooperation Project Investigation of Groundwater Resources and Airborne-Geophysical Investigation of Selected Mineral Targets in Namibia Groundwater Investigations in the Eastern Caprivi Region Main Hydrogeological Report
Page 82
BUNDESANSTALT FÜR GEOWISSENSCHAFTEN UND ROHSTOFFE
Federal Institute for Geosciences and Natural Resources
Hannover, 05 April 2005
________________________ _____________________ Dr. Michael Schmidt-Thomé Dr. Armin Margane
Director of Division B1 –
Resources and International Cooperation
Senior Hydrogeologist Section B 1.16

Technical Cooperation Project Investigation of Groundwater Resources and Airborne-Geophysical Investigation of Selected Mineral Targets in Namibia Groundwater Investigations in the Eastern Caprivi Region Main Hydrogeological Report
Page 83
9 References
APPELO, C.A.J. & POSTMA, D. (1994): Geochemistry, Groundwater and Pollution. –
536 p.; Rotterdam (Balkema).
BEDMAR, A.P. (1999): Groundwater Investigation at Caprivi Region using Isotope and Chemical Techniques. – Report prepared by IAEA for DWA, Project NAM/8/002, 45 p.; Windhoek and Vienna.
BIESCHEUVEL, K. (1980): Report on Resistivity Depth Soundings carried out in the Eastern Caprivi Zipfel, Namibia. – Prepared for CDM Mineral Surveys.
BIWAC (1999): Data Base for Further Decisions Regarding the Necessity and Feasibility of Future Geophysical and Hydrogeological Investigations in the Study Areas Oshivelo, Eastern Caprivi and Eastern Tsumkwe-Otjinene (North-Eastern Namibia). - Prepared for Technical Cooperation Project Investigation of Groundwater Resources and Airborne-Geophysical Investigation of Selected Mineral Targets in Namibia, 62 p.; Windhoek.
CBA (1998): Eastern Caprivi Water Supply Project. – Final Report on the Implementation of the Drilling Programme, prepared for DWA; Windhoek.
CES & LCE (1994): Feasibility Study for the Development of Water Supply for the Area between Katima Mulilo and Kongola in the Eastern Caprivi. – Prepared for KfW & DWA, Volume 5: Groundwater Investigation; Windhoek.
CHRISTELIS & STRUCKMEIER (2001): Groundwater in Namibia – An Explanation to the Hydrogeological Map. – 128 p.; Windhoek (John Meinert Printing).
DRYSDALL & WELLER, (1966): Karoo Sedimentation in Northern Rhodesia. – Geol.Soc.S.Africa, 69, 39-69; Johannesburg.
DWA (1990): Preliminary Master Water Plan for the Eastern Caprivi Region. – File No. 13/1/6/3, 35 p.; Windhoek.
DWA (1991): Guidelines for the Evaluation of Drinking-Water for Human Consumption with Reference to Chemical, Physical and Bacteriological Quality. – Windhoek.
EALES, H.V., MARSH, J.S. & COX, K.G. (1984): The Karoo Igneous Province: An Introduction. – Special Publication Geol.Soc.S.Africa, 13, pp 1-26; Johannesburg.
FIELITZ, K. , STADTLER, C. & SCHILDKNECHT, F. (2004): Results of Time-Domain Electromagnetic Soundings and Direct Current Soundings for Groundwater Exploration in Three Regions in Namibia. – Report prepared for Technical Cooperation Project Investigation of Groundwater Resources and Airborne-

Technical Cooperation Project Investigation of Groundwater Resources and Airborne-Geophysical Investigation of Selected Mineral Targets in Namibia Groundwater Investigations in the Eastern Caprivi Region Main Hydrogeological Report
Page 84
Geophysical Investigation of Selected Mineral Targets in Namibia, BGR archive no. 124259, 17 p.; Hannover.
GSN (1980): Geological Map of Namibia. – 4 sheets, 1:1,000,000; Windhoek.
GSD (1981): Distribution of the Karoo in Botswana. – Map, scale 1:2,000,000; Lobatse.
INTERCONSULT (1991): Groundwater Investigation Work in Eastern Caprivi – Phase 1, Final Report, 2 Volumes, 87 p.; Windhoek.
INTERCONSULT (1992): Groundwater Investigation Work in Eastern Caprivi – Phase 2, Final Report, 106 p.; Windhoek.
INTERCONSULT (2000): Geophysical Surveying and Borehole Siting in Eastern Caprivi – prepared for DWA/NOLIDEP project, 25 p; Windhoek.
LCE (2002): Katima Mulilo – Linyanti Rural Water Supply Project – Final Bulk Design Report. – Unpublished Report prepared for DWA; Windhoek.
MARGANE, A. & BÄUMLE, R. (2004): Groundwater Investigations in the Eastern Caprivi – Evaluation of Pumping Tests. – Unpublished Report prepared for Technical Cooperation Project Investigation of Groundwater Resources and Airborne-Geophysical Investigation of Selected Mineral Targets in Namibia, Volume IV.GW.3.3, 48 p.; Windhoek.
MENDELSOHN, J., JARVIS, A., ROBERTS, C. & ROBERTSON, T. (2002): Atlas of Namibia. – 200 p.; David Philip Publishers/Capetown.
MENDELSOHN, J. & ROBERTS, C. (1997): An Environmental Profile and Atlas of the Caprivi. – 44 p.; Gamsberg Macmillan Publishers/Windhoek.
NEW, M., HULME, M. & JONES, P. (1999): Representing twentieth-century space-time climate variability. Part I: development of 1961-1990 mean monthly terrestrial climatology. - Journal of Climate, 12: 829-56.
SIEMON, B., ROETTGER, B. & PIELAWA, J., (2005): Interpretation of the Helicopter-Borne Groundwater Survey Data of the Eastern Caprivi Area – German-Namibian Groundwater Exploration Project “Groundwater Exploration in the North East and Airborne Geophysical Investigations on Selected Mineral Targets”, Vol. II.GW3; Hannover.
SIEMON, B., ROETTGER, B., REHLI, H.-J., VOSS, W. & PIELAWA, J. (2004): Technical Report on the Helicopter-Borne Groundwater Exploration Surveys. – German-Namibian Groundwater Exploration Project “Groundwater Exploration in the North East and Airborne Geophysical Investigations on Selected Mineral Targets”, Vol. II.GW1, BGR archive no. 0124563; Hannover.
SMITH (1984): The Lithostratigraphy of the Karoo Supergroup in Botswana. – Geol.Survey Dep. Botswana, Bull. Series, Bulletin 26, 239 p.; Lobatse.

Technical Cooperation Project Investigation of Groundwater Resources and Airborne-Geophysical Investigation of Selected Mineral Targets in Namibia Groundwater Investigations in the Eastern Caprivi Region Main Hydrogeological Report
Page 85
WAPCOS (1995): Exploration and taping of potable groundwater resources in Eastern Caprivi region, Phase I Completion Report. – Unpublished report prepared for DWA, DWA Archive, Windhoek.
WAPCOS (1996): Exploration and taping of potable groundwater resources in Eastern Caprivi region, Phase II Completion Report. – Unpublished report prepared for DWA, DWA Archive, Windhoek.
WCE (2000): Rural Water Supply Development Plan for the Caprivi Region. – Final Report prepared by WINDHOEK CONSULTING ENGINEERS for Department of Water Affairs, 2 vols.; Vol. 1: Text, 127 p., Vol. 2: Annexes; Windhoek.
WIERENGA, A., MARGANE, A., BÄUMLE, R., SCHILDKNECHT, F., KATJIUONGUA, T.T. & METZGER, W. (2004): Groundwater Investigations in the Eastern Caprivi – Documentation Compendium on the 2004 Drilling Campaign. – Unpublished Report prepared for Technical Cooperation Project Investigation of Groundwater Resources and Airborne-Geophysical Investigation of Selected Mineral Targets in Namibia, Volume IV.GW.3.2, 184 p.; Windhoek.
WRC (1997): Maun Groundwater Development Project; Phase 1: Exploration and Resource Assessment, Final Report. – Unpublished report prepared by WATER RESOURCES CONSULTANTS for DWA/ Botswana.

Technical Cooperation Project Investigation of Groundwater Resources and Airborne-Geophysical Investigation of Selected Mineral Targets in Namibia Groundwater Investigations in the Eastern Caprivi Region Main Hydrogeological Report
Page 86
Annex 1: Lithological Logs of Boreholes Drilled by the Project

Technical Cooperation Project Investigation of Groundwater Resources and Airborne-Geophysical Investigation of Selected Mineral Targets in Namibia Groundwater Investigations in the Eastern Caprivi Region Main Hydrogeological Report
Page 87
2.00 green, fine grained, TOPSOIL, 'turfy' soil2.00
20.00 light-olive-green, fine grained,SANDSTONE, with some minor grits of qz,silcrete/chert (angular); highly calc.:10-19m20.00
40.00 light-olive-green, fine grained,SANDSTONE, with thin intercalated silicifiedsst layers40.00
48.00 light-olive-green, very fine grained,SANDSTONE, with some minor qz grits48.0049.00 light-olive-green, very fine grained,clayey, SANDSTONE, with some minor qzgrits; intercalated silicified sst layers49.0057.00 light-olive-green, fine grained,SANDSTONE, with intercal. siltstone57.0065.00 light-olive-green, fine grained,SANDSTONE, with abundant qz grits (1-3mmin diam - sub-angular), water struck (57-65)65.0071.00 olive-green, fine grained, SANDSTONE,with interbedded silt-/claystone layers; gritty:68-69m71.0093.00 light-olive-green, olive-green, very finegrained, fine grained, medium grained,SANDSTONE, coarser grained downwards;thin olive-green siltstone layers: 88-89m; minorqz grits: 76-80m93.0098.00 light-olive-green, olive-green, finegrained, SANDSTONE, with intercalated layersof silicified sst98.00100.00 olive-green, very fine grained, finegrained, SANDSTONE100.00114.00 light-brown, light-olive-green, mediumto coarse grained, SANDSTONE, intercalatedsilcrete layers: 104-106m, 108-109m, 110-111,water struck (100-114)114.00121.00 blue-green, clayey, SILTSTONE, thinintercalated silcrete/chert layer: 120-121m121.00128.00 light-greenish-brown, very fine grained,fine grained, SANDSTONE, thin intercalatedlayers of silcrete/chert: 121-124m; silicified sstlayers: 124-128m128.00136.00 green-blue, fine to medium grained,SANDSTONE, alternating layers of calc. andsilicified sst (greyish colour); more sandybetween 134-136m; prominent sulphuric smell.136.00139.00 light-olive-green, very fine grained, finegrained, SANDSTONE, with intercalatedsilcrete layers139.00144.00 light-olive-green, olive-green, fine tomedium grained, SANDSTONE, coarsergrained downwards; prominent sulphuric smell144.00156.00 olive-green, blue-green, fine grained,SANDSTONE, alternating calc. and silicified sstlayers; sulphuric smell156.00167.00 light-olive-green, fine to mediumgrained, SANDSTONE167.00185.00 olive-green, blue-green, fine to mediumgrained, SANDSTONE, alternating layers ofcalc. sst and silicified sst (f-m grained); moresandy with depth; prominent sulphuric smell,water struck (167-185)185.00193.00 dark-grey, BASALT, fine grained,mafic/ultramafic rock; calcite coating onfracture planes; surface weathered and highlyfractured, water struck (185)193.00
0
10
20
30
40
50
60
70
80
90
100
110
120
130
140
150
160
170
180
190
0
10
20
30
40
50
60
70
80
90
100
110
120
130
140
150
160
170
180
190
-0.500.002.505.506.00
81.00
108.00
116.00
120.50124.00124.75
177.00
183.00185.00
190.00193.00
Cement -0.50-0.00Cement -0.50-2.50Standpipe Steel -0.50-5.50 OD 324mmBorehole diameter360mmRotary fluidflush
Borehole diameter311mmRotary fluidflush
Unknown backfill 2.50-108.00Unknown backfill 6.00-108.00Casing uPVC -0.50-124.75 OD186 mm
Unknown backfill 81.00-108.00Borehole diameter311mmReversecirculation fluid flus
Clay 108.00-120.50Clay 116.00-120.50Sand 120.50-124.00
Borehole diameter311mmRotary fluidflushFilter, horizontalslits uPVC 124.75-183.00 OD186 mmGravel 124.00-190.00
Gravel 177.00-190.00Shoe uPVC 183.00-185.00 OD186 mmBorehole diameter311mmReversecirculation fluid flusUnknown backfill 190.00-193.00
10.0
20.0
30.0
40.0
50.0
60.0
70.0
80.0
90.0
100.0
110.0
120.0
130.0
140.0
150.0
160.0
170.0
180.0
190.0
0 10 20 30Penetration rate
Borehole WW41002
Easting (UTM Zone 34S): 764462.00000000
Northing (UTM Zone 34S): 8013669.00000000
16.18
57.00
100.00
139.00
167.00
185.00
Lithological Log Well Design Penetration RateNamibian-GermanTechnical Cooperation
Investigation ofGroundwater Resources
and Airborne-GeophysicalInvestigation of Selected
Mineral Targets inNamibia
Log Authors: AnneliseWierenga, Winfried Metzger,T.T. Katjiuongua, Dr. ArminMargane
Date: September 2004
Departmentof WaterAffairs
NAMIBIA
Federal Institutefor Geosciences
and NaturalResourcesGERMANY
min/m

Technical Cooperation Project Investigation of Groundwater Resources and Airborne-Geophysical Investigation of Selected Mineral Targets in Namibia Groundwater Investigations in the Eastern Caprivi Region Main Hydrogeological Report
Page 88
1.00 green-brown, fine grained, SAND, aeolinesand; grains frosted1.003.00 light-brown, very fine grained, SAND,aeoline sand3.00
21.00 light-brown, very fine grained, finegrained, SAND, fluvial sand (poorly sorted)21.00
37.00 very fine grained, fine to mediumgrained, poorly graded, SANDSTONE, withinterlayered calc. sst and silicified sst pebbles(reworked)37.00
53.00 light-olive-green, light-yellow, fine tomedium grained, clayey, SANDSTONE,intercalated layers of calc. & silified sst:46-47m, 49-54m; slightly gritty (qz grains1-2mm diam): 46-47m, 50-54m53.0063.00 yellow-orange, fine to medium grained,poorly graded, SANDSTONE, limonized sand(FeO-staining); gritty: 54-56m; FeO-stainingdecreases below 63m63.0069.00 light-yellowish-brown, fine to mediumgrained, SANDSTONE, with intercalated layersof silicified sst; coarser grained to the bottom69.0077.00 friable, light-yellowish-brown, fine tocoarse grained, SANDSTONE, coarser grainedto 74m and finer grained to 77m; very grittybeween 75-76m, water struck (69)77.00
100.00 light-olive-green, olive-green, fine tomedium grained, SANDSTONE, with thin layersof silt/claystone: 81-84m; slightly gritty:83-85m, 94-96m, 98-100m; coarser graineddownwards100.00109.00 olive-green, fine to medium grained,clayey, SANDSTONE, coarser and more grittyto the base of unit109.00115.00 friable, lightbrown, light-olive-green,medium to coarse grained, SANDSTONE, thinintercalated calc. & silicified sstlayers:112-115m115.00
135.00 light-olive-green, olive-green,blue-green, fine to medium grained, clayey,SANDSTONE, thin silicified sst layers135.00
162.00 light-olive-green, blue-green, fine tomedium grained, clayey, SANDSTONE,alternating layers of calc. and silicified sst,silcrete/chert fragments (?pebbles): 136-138m,141-143m, water struck (135-162)162.00
176.00 light-olive-green, olive-green, fine tomedium grained, SANDSTONE, alternatinglayers of calc. and silicified sst; coarser grained downwards; sulphuric smell176.00
187.00 light-olive-green, olive-green, fine tomedium grained, SANDSTONE, water struck(176-187)187.00191.00 light-olive-green, olive-green,SANDSTONE, alternating layers of calc. andsilicified sst; coarser grained downwards;sulphuric smell191.00198.00 dark-green, BASALT, mafic/ultramaficrock; calcite coating on fracture planes; surfaceweathered and highly fractured, water struck(191)198.00
0
10
20
30
40
50
60
70
80
90
100
110
120
130
140
150
160
170
180
190
0
10
20
30
40
50
60
70
80
90
100
110
120
130
140
150
160
170
180
190
-0.500.002.505.506.00
122.00
128.20130.00133.18
191.40194.46198.00
Cement -0.50-0.00Cement -0.50-2.50Standpipe steel -0.50-5.50 OD 324mmBorehole diameter360mmRotary fluidflush
Unknown backfill 2.50-122.00Unknown backfill 6.00-122.00Casing uPVC -0.50-133.18 OD186 mm
Borehole diameter311mmRotary fluidflush
Clay 122.00-128.20Sand 128.20-130.00
Filter, horizontalslits uPVC 133.18-191.40 OD186 mmGravel 130.00-198.00
Shoe uPVC 191.40-194.46 OD186 mm
10.0
20.0
30.0
40.0
50.0
60.0
70.0
80.0
90.0
100.0
110.0
120.0
130.0
140.0
150.0
160.0
170.0
180.0
190.0
0 10 20 30Penetration rate
Borehole WW41003
Easting (UTM Zone 34S): 793427.00000000
Northing (UTM Zone 34S): 8024630.00000000
11.69
69.00
119.00
135.00
176.00
191.00
Lithological Log Well Design Penetration RateNamibian-GermanTechnical Cooperation
Investigation ofGroundwater Resources
and Airborne-GeophysicalInvestigation of Selected
Mineral Targets inNamibia
Log Authors: AnneliseWierenga, Winfried Metzger,T.T. Katjiuongua, Dr. ArminMargane
Date: September 2004
Departmentof WaterAffairs
NAMIBIA
Federal Institutefor Geosciences
and NaturalResourcesGERMANY
min/m

Technical Cooperation Project Investigation of Groundwater Resources and Airborne-Geophysical Investigation of Selected Mineral Targets in Namibia Groundwater Investigations in the Eastern Caprivi Region Main Hydrogeological Report
Page 89
1.00 greyish, TOPSOIL, aoline1.006.00 light-greyish-brown, CALCRETE, in amatrix of very fine to fine grained,light-grayish-brown, sand; grains poorly sortedand frosted.6.0012.00 light-greyish-brown, very fine grained,fine grained, SAND12.0015.00 light-yellowish-brown, fine grained,SAND, limonized15.00
56.00 light-yellowish, very fine grained, finegrained, SANDSTONE, minor qz grits: 15-18m,38-40m, 51-56m; fragments of ?reworked calc.sst pebbles (sub-rounded up to 10mm indiam.) : 20-21m, 31-33, 34-38m, water struck(20-56)56.0070.00 creamy-yellow, fine grained, mediumgrained, SANDSTONE, with ?reworked calc.sst pebbles: 61-62m; 64-65m. Formation gritty(qrtz grits) between 57-58m, 62-63m, 68-69m;coarser grained to base, water struck (56-70)70.0072.00 light-yellow, CLAY72.0080.00 creamy-yellow, very fine grained, finegrained, SANDSTONE, minor qz grits: 74-80m(sub-rounded, up to 5mm in diam); formationbecomes more clayey with depth (78-80m),water struck (72-80)80.0083.00 light-yellow-green, very fine grained,CLAY, highly calcareous: 80-81m83.0092.00 creamy-yellow, fine grained,SANDSTONE, finer grained downwards92.00108.00 light-olive-green, fine to coarsegrained, SANDSTONE, slightly calcareous withthin intercalated layers of bluish-green clay;gritty: 93-96m, 99-100m, 100-108m; formationmore clayey: 95-96m;,102-104m; sst coarsergrained with depth., water struck (92-108)108.00134.00 light-olive-green, olive-green, very finegrained, fine grained, SANDSTONE, slightly tohighly calcareous; with intercalatedbluish-green clay layers; brownish-blacksilcrete/chert fragments (probably pebbles -sub-angular to angular): 121-125m; clayeymatrix: 109-134m134.00140.00 light-olive-green, olive-green, mediumto coarse grained, SANDSTONE, gritty:134-136m; thin intercalated bluish-green claylayers; below 136m: sst chips, probablyreworked sst pebbles (sub-rounded - up to20mm in diam.), water struck (134-140)140.00155.00 light-olive-green, green-blue, fine tomedium grained, SANDSTONE, ?reworked sstpebbles (silicified sst, calc. sst, qz, chalcedony;up to 10mm in diam.); more clayey: 149-152m,water struck (140-155)155.00165.00 light-olive-green, very fine grained, finegrained, SANDSTONE, prominent bluish-greenclay layers; clay content increases with depth;more clayey: 155-156m, 158-160m, 163-165m165.00170.00 light-olive-green, fine grained,SANDSTONE, with thin intercalatedbluish-green clay layers170.00173.00 light-olive-green, fine grained,SANDSTONE, with intercalated bluish-greenclay layers; clay content more than in abovesection173.00190.00 light-olive-green, olive-green, fine tomedium grained, SANDSTONE, alternatinglayers of calc. and silicified sst withbluish-green clay intercalated; sulphuric smell.190.00215.00 light-olive-green, olive-green, mediumto coarse grained, SANDSTONE, reworked sstpebbles (up to 60mm in diam.); thinbluish-green clay layers; prominent layers ofreworked sst pebbles: 190-194, 196-197,210-213m; highly calcareous: 214-215m;sulphuric smell, water struck (190-215)215.00
0
10
20
30
40
50
60
70
80
90
100
110
120
130
140
150
160
170
180
190
200
210
0
10
20
30
40
50
60
70
80
90
100
110
120
130
140
150
160
170
180
190
200
210
-0.690.002.50
10.5011.00
123.50127.20128.00133.26137.00
Cement -0.69-0.00Cement -0.69-2.50Standpipe steel -0.69-10.50 OD 324mmBorehole diameter360mmRotary fluidflush
Unknown backfill 2.50-123.50Casing uPVC -0.69-133.26 OD186 mmUnknown backfill 11.00-123.50Borehole diameter311mmRotary fluidflush
Clay 123.50-127.20Sand 127.20-128.00
Gravel 128.00-222.00Borehole diameter311mmReversecirculation fluid flusFilter, horizontalslits uPVC 133.26-215.92 OD186 mmGravel 137.00-222.00
10.0
20.0
30.0
40.0
50.0
60.0
70.0
80.0
90.0
100.0
110.0
120.0
130.0
140.0
150.0
160.0
170.0
180.0
190.0
200.0
210.0
0 10 20 30Penetration rate
Borehole WW41004
Easting (UTM Zone 34S): 800950.00000000
Northing (UTM Zone 34S): 8019950.00000000
11.22
20.00
56.00
72.00
92.00
134.00
140.00
190.00
Lithological Log Well Design Penetration RateNamibian-GermanTechnical Cooperation
Investigation ofGroundwater Resources
and Airborne-GeophysicalInvestigation of Selected
Mineral Targets inNamibia
Log Authors: AnneliseWierenga, Winfried Metzger,T.T. Katjiuongua, Dr. ArminMargane
Date: September 2004
Departmentof WaterAffairs
NAMIBIA
Federal Institutefor Geosciences
and NaturalResourcesGERMANY
min/m

Technical Cooperation Project Investigation of Groundwater Resources and Airborne-Geophysical Investigation of Selected Mineral Targets in Namibia Groundwater Investigations in the Eastern Caprivi Region Main Hydrogeological Report
Page 90
216.00 light-olive-green, very fine grained, finegrained, SANDSTONE, with fragments ofsiliceous material216.00217.00 light-olive-green, light-brown, very finegrained, fine to coarse grained, SAND ANDGRAVEL, contact zone, water struck (216-217)217.00222.00 purplish-red, highly weathered,BASALT, with abundant calcite; clayey below220m (reddish-brown), water struck (217-222)222.00
220 220215.92
221.76222.00
Shoe uPVC 215.92-221.76 OD186 mm
220.0
0 10 20 30Penetration rate
Borehole WW41004
Easting (UTM Zone 34S): 800950.00000000
Northing (UTM Zone 34S): 8019950.00000000
216.00217.00
Lithological Log Well Design Penetration RateNamibian-GermanTechnical Cooperation
Investigation ofGroundwater Resources
and Airborne-GeophysicalInvestigation of Selected
Mineral Targets inNamibia
Log Authors: AnneliseWierenga, Winfried Metzger,T.T. Katjiuongua, Dr. ArminMargane
Date: September 2004
Departmentof WaterAffairs
NAMIBIA
Federal Institutefor Geosciences
and NaturalResourcesGERMANY
min/m

Technical Cooperation Project Investigation of Groundwater Resources and Airborne-Geophysical Investigation of Selected Mineral Targets in Namibia Groundwater Investigations in the Eastern Caprivi Region Main Hydrogeological Report
Page 91
1.00 green-brown, fine grained, TOPSOIL,'turfy' soil; aeoline1.006.00 light-green-brown, very fine grained, finegrained, SAND, less clayey than above; somecalcrete grits: 2-3m.6.0012.00 light-green-brown, very fine grained, finegrained, SAND, slightly clayey; more clayey:10-11m12.0023.00 light-olive-green, very fine grained, finegrained, SANDSTONE, some qrtz gritsbetween 15-19m and ?reworked sst pebblesbetween 18-23m.23.0043.00 light-yellow-orange, fine grained, SAND,limonized; reworked calc. sst - (sub-rounded)and silicified sst (sub-angular) pebbles:23-38m, 42-43m; FeO staining less withdepth; formation more clayey downwards,water struck (26-43)43.0056.00 light-yellow-green, fine to mediumgrained, SANDSTONE, some oxidized sst:50-51m; formation less clayey than between23-43m, water struck (43-56)56.0070.00 creamy-yellow, fine to medium grained,SANDSTONE, ?reworked calc. sst pebbles:56-67m; formation gritty (qz grits): 56-67m;from 67-70m formation becomes slightly clayeywith depth, water struck (56-70)70.00
0
10
20
30
40
50
60
70
0
10
20
30
40
50
60
70
-0.470.001.732.002.50
17.00
34.66
65.9068.7470.00
Cement -0.47-0.00Borehole diameter360mmRotary fluidflushStandpipe steel -0.47-1.73 OD 324mmCement -0.47-2.50Cement 2.00-2.50Unknown backfill 2.50-17.00Casing uPVC -0.47-34.66 OD 186mmBorehole diameter311mmRotary fluidflushGravel 17.00-70.00Filter, horizontalslits uPVC 34.66-65.90 OD186 mmShoe uPVC 65.90-68.74 OD186 mm
10.0
20.0
30.0
40.0
50.0
60.0
70.0
0 10 20 30Penetration rate
Borehole WW41005
Easting (UTM Zone 34S): 800966.57000000
Northing (UTM Zone 34S): 8019952.35000000
26.0026.18
43.00
56.00
Lithological Log Well Design Penetration RateNamibian-GermanTechnical Cooperation
Investigation ofGroundwater Resources
and Airborne-GeophysicalInvestigation of Selected
Mineral Targets inNamibia
Log Authors: AnneliseWierenga, Winfried Metzger,T.T. Katjiuongua, Dr. ArminMargane
Date: September 2004
Departmentof WaterAffairs
NAMIBIA
Federal Institutefor Geosciences
and NaturalResourcesGERMANY
min/m

Technical Cooperation Project Investigation of Groundwater Resources and Airborne-Geophysical Investigation of Selected Mineral Targets in Namibia Groundwater Investigations in the Eastern Caprivi Region Main Hydrogeological Report
Page 92
1.00 dark-green-brown, very fine grained,TOPSOIL, 'turfy' soil1.004.00 light-brown, very fine grained, SAND, withcalcrete grits4.0012.00 light-brown, very fine grained, finegrained, SAND, with calcrete grits; less calcretegrits with depth; thin brownish clay layersintercalated; formation more sandy: 8-12m12.0020.00 light-brown, fine grained, SANDSTONE,with thin interbedded brownish clay layers;formation more clayey: 12-13m; more sandy:18-19m; some qz grits (sub-rounded andfrosted): 19-20m20.0023.00 light-brown, very fine grained, clayey,SAND23.0033.00 brown-purple, silty, CLAYSTONE33.0048.00 creamy-yellow, very fine grained, finegrained, clayey, SANDSTONE, silcrete/chertpebbles present: 42-43m; more sandy: 46-48m48.00
102.00 light-yellow-brown, light-yellow-orange,very fine grained, fine grained, clayey,SANDSTONE, ?Reworked calc. sstpebbles:74-75m, 76-77m, 87-88m, 96-102;silcrete pebbles: 72-73m, 75-76m; some qrtzgrits: 51-52m, 63-65m, 96-97m102.00
125.00 light-olive-green, very fine grained, finegrained, SANDSTONE, with thin olive greenclay layers; sst coarser grained with depth125.00
160.00 olive-green, fine to medium grained,SANDSTONE, clay layers interbedded; verygritty (qz): 155-157m; formation more sandywith depth; prominent clayeyhorizons:146-150m, 158-159m.160.00
189.00 light-olive-green, greenish-blue, fine tomedium grained, SANDSTONE, withbluish-green clay layers; 170-172m; calc. sst(qz grains), poorly sorted (f-c grained):170-172m, 175-177m; more clayey: 177-178m,179-182m, 187-189m189.00
0
10
20
30
40
50
60
70
80
90
100
110
120
130
140
150
160
170
180
0
10
20
30
40
50
60
70
80
90
100
110
120
130
140
150
160
170
180
-0.290.001.00
11.7112.00
138.05
143.00
149.81
Unknown backfill -0.29-0.00Cement 0.00-1.00Borehole diameter360mmRotary fluidflushStandpipe steel -0.29-11.71 OD 324mm
Unknown backfill -0.29-138.05Unknown backfill 12.00-138.05
Casing uPVC -0.29-149.81 OD186 mm
Borehole diameter311mmRotary fluidflush
Clay 138.05-143.00
10.0
20.0
30.0
40.0
50.0
60.0
70.0
80.0
90.0
100.0
110.0
120.0
130.0
140.0
150.0
160.0
170.0
180.0
0 10 20 30Penetration rate
Borehole WW41006
Easting (UTM Zone 34S): 794186.00000000
Northing (UTM Zone 34S): 8010257.00000000
15.07
48.00
125.00
160.00
189.00
Lithological Log Well Design Penetration RateNamibian-GermanTechnical Cooperation
Investigation ofGroundwater Resources
and Airborne-GeophysicalInvestigation of Selected
Mineral Targets inNamibia
Log Authors: AnneliseWierenga, Winfried Metzger,T.T. Katjiuongua, Dr. ArminMargane
Date: September 2004
Departmentof WaterAffairs
NAMIBIA
Federal Institutefor Geosciences
and NaturalResourcesGERMANY
min/m

Technical Cooperation Project Investigation of Groundwater Resources and Airborne-Geophysical Investigation of Selected Mineral Targets in Namibia Groundwater Investigations in the Eastern Caprivi Region Main Hydrogeological Report
Page 93
250.00 light-olive-green, greenish-blue, fine tocoarse grained, SANDSTONE, poorly sorted;sst chips: weathered, not FeO stained;intercalated bluish-green clay layers: 189m,215m; from 215m sst coarser grained;abundant qz grits: 229-234m; more sandy:229-238m; more clayey: 242-243m, 246-248m250.00
190
200
210
220
230
240
250
190
200
210
220
230
240
250
239.91
248.30249.30250.00
Filter, horizontalslits uPVC 149.81-239.91 OD186 mmGravel 143.00-249.30
Casing uPVC 239.91-248.30 OD186 mm
200.0
210.0
220.0
230.0
240.0
250.0
0 10 20 30Penetration rate
Borehole WW41006
Easting (UTM Zone 34S): 794186.00000000
Northing (UTM Zone 34S): 8010257.00000000
189.00
Lithological Log Well Design Penetration RateNamibian-GermanTechnical Cooperation
Investigation ofGroundwater Resources
and Airborne-GeophysicalInvestigation of Selected
Mineral Targets inNamibia
Log Authors: AnneliseWierenga, Winfried Metzger,T.T. Katjiuongua, Dr. ArminMargane
Date: September 2004
Departmentof WaterAffairs
NAMIBIA
Federal Institutefor Geosciences
and NaturalResourcesGERMANY
min/m

Technical Cooperation Project Investigation of Groundwater Resources and Airborne-Geophysical Investigation of Selected Mineral Targets in Namibia Groundwater Investigations in the Eastern Caprivi Region Main Hydrogeological Report
Page 94
1.00 dark-green-brown, very fine grained,TOPSOIL, 'turfy' soil1.004.00 light-brown, very fine grained, SAND, withcalcrete grits4.0020.00 light-brown, very fine grained, finegrained, SANDSTONE, with calc. fossil shellsand ?worm casts; slightly gritty: 19-20m; thinbrownish clay layers: 5-8m, 14-15m20.0023.00 light-brown, very fine grained,SANDSTONE, with brownish clay layers23.00
48.00 creamy-yellow, very fine grained, finegrained, clayey, SANDSTONE, ?Worm casts:29-33m; thin silt-/claystone layers: 41-43m;reworked silcrete/chert pebbles: 42-43m48.00
97.00 light-yellow-brown, light-yellow-orange,very fine grained, fine grained, clayey,SANDSTONE, sSlightly gritty: 49-52, 80-81m,96-97m; highly calcareous thin siltstonehorizons: 59-62m; silicified sst pebbels:54-56m; slight FeO-staining: 84-94m, waterstruck (48-97)97.00
0
10
20
30
40
50
60
70
80
90
100
0
10
20
30
40
50
60
70
80
90
100
-0.610.002.502.78
22.0025.00
53.89
96.4998.34
100.00
Cement -0.61-0.00Cement -0.61-2.50Casing steel -0.61-2.78 OD 324mmUnknown backfill 2.50-22.00
Sand 22.00-25.00Casing uPVC -0.61-53.89 OD 186mm
Borehole diameter311mmRotary fluidflush
Gravel 25.00-100.00
Filter, horizontal slitsuPVC 53.89-96.49 OD 186 mm
Casing u 96.49-98.34 OD 186 mm
10.0
20.0
30.0
40.0
50.0
60.0
70.0
80.0
90.0
0 10 20 30Penetration rate
Borehole WW41007
Easting (UTM Zone 34S): 794186.00000000
Northing (UTM Zone 34S): 8010257.00000000
28.69
48.00
Lithological Log Well Design Penetration RateNamibian-GermanTechnical Cooperation
Investigation ofGroundwater Resources
and Airborne-GeophysicalInvestigation of Selected
Mineral Targets inNamibia
Log Authors: AnneliseWierenga, Winfried Metzger,T.T. Katjiuongua, Dr. ArminMargane
Date: September 2004
Departmentof WaterAffairs
NAMIBIA
Federal Institutefor Geosciences
and NaturalResourcesGERMANY
min/m
Technical Cooperation Project Investigation of Groundwater Resources and Airborne-Geophysical Investigation of Selected Mineral Targets in Namibia Groundwater Investigations in the Eastern Caprivi Region Main Hydrogeological Report
Page 95
Annex 2: Groundwater Database
Red numbers indicate elevation data adopted from SRTM model.

Technical Cooperation Project Investigation of Groundwater Resources and Airborne-Geophysical Investigation of Selected Mineral Targets in Namibia Groundwater Investigations in the Eastern Caprivi Region Main Hydrogeological Report
Page 96

Technical Cooperation Project Investigation of Groundwater Resources and Airborne-Geophysical Investigation of Selected Mineral Targets in Namibia Groundwater Investigations in the Eastern Caprivi Region Main Hydrogeological Report
Page 97

Technical Cooperation Project Investigation of Groundwater Resources and Airborne-Geophysical Investigation of Selected Mineral Targets in Namibia Groundwater Investigations in the Eastern Caprivi Region Main Hydrogeological Report
Page 98

Technical Cooperation Project Investigation of Groundwater Resources and Airborne-Geophysical Investigation of Selected Mineral Targets in Namibia Groundwater Investigations in the Eastern Caprivi Region Main Hydrogeological Report
Page 99

Technical Cooperation Project Investigation of Groundwater Resources and Airborne-Geophysical Investigation of Selected Mineral Targets in Namibia Groundwater Investigations in the Eastern Caprivi Region Main Hydrogeological Report
Page 100

Technical Cooperation Project Investigation of Groundwater Resources and Airborne-Geophysical Investigation of Selected Mineral Targets in Namibia Groundwater Investigations in the Eastern Caprivi Region Main Hydrogeological Report
Page 101

Technical Cooperation Project Investigation of Groundwater Resources and Airborne-Geophysical Investigation of Selected Mineral Targets in Namibia Groundwater Investigations in the Eastern Caprivi Region Main Hydrogeological Report
Page 102

Technical Cooperation Project Investigation of Groundwater Resources and Airborne-Geophysical Investigation of Selected Mineral Targets in Namibia Groundwater Investigations in the Eastern Caprivi Region Main Hydrogeological Report
Page 103

Technical Cooperation Project Investigation of Groundwater Resources and Airborne-Geophysical Investigation of Selected Mineral Targets in Namibia Groundwater Investigations in the Eastern Caprivi Region Main Hydrogeological Report
Page 104

Technical Cooperation Project Investigation of Groundwater Resources and Airborne-Geophysical Investigation of Selected Mineral Targets in Namibia Groundwater Investigations in the Eastern Caprivi Region Main Hydrogeological Report
Page 105

Technical Cooperation Project Investigation of Groundwater Resources and Airborne-Geophysical Investigation of Selected Mineral Targets in Namibia Groundwater Investigations in the Eastern Caprivi Region Main Hydrogeological Report
Page 106

Technical Cooperation Project Investigation of Groundwater Resources and Airborne-Geophysical Investigation of Selected Mineral Targets in Namibia Groundwater Investigations in the Eastern Caprivi Region Main Hydrogeological Report
Page 107

Technical Cooperation Project Investigation of Groundwater Resources and Airborne-Geophysical Investigation of Selected Mineral Targets in Namibia Groundwater Investigations in the Eastern Caprivi Region Main Hydrogeological Report
Page 108

Technical Cooperation Project Investigation of Groundwater Resources and Airborne-Geophysical Investigation of Selected Mineral Targets in Namibia Groundwater Investigations in the Eastern Caprivi Region Main Hydrogeological Report
Page 109

Technical Cooperation Project Investigation of Groundwater Resources and Airborne-Geophysical Investigation of Selected Mineral Targets in Namibia Groundwater Investigations in the Eastern Caprivi Region Main Hydrogeological Report
Page 110
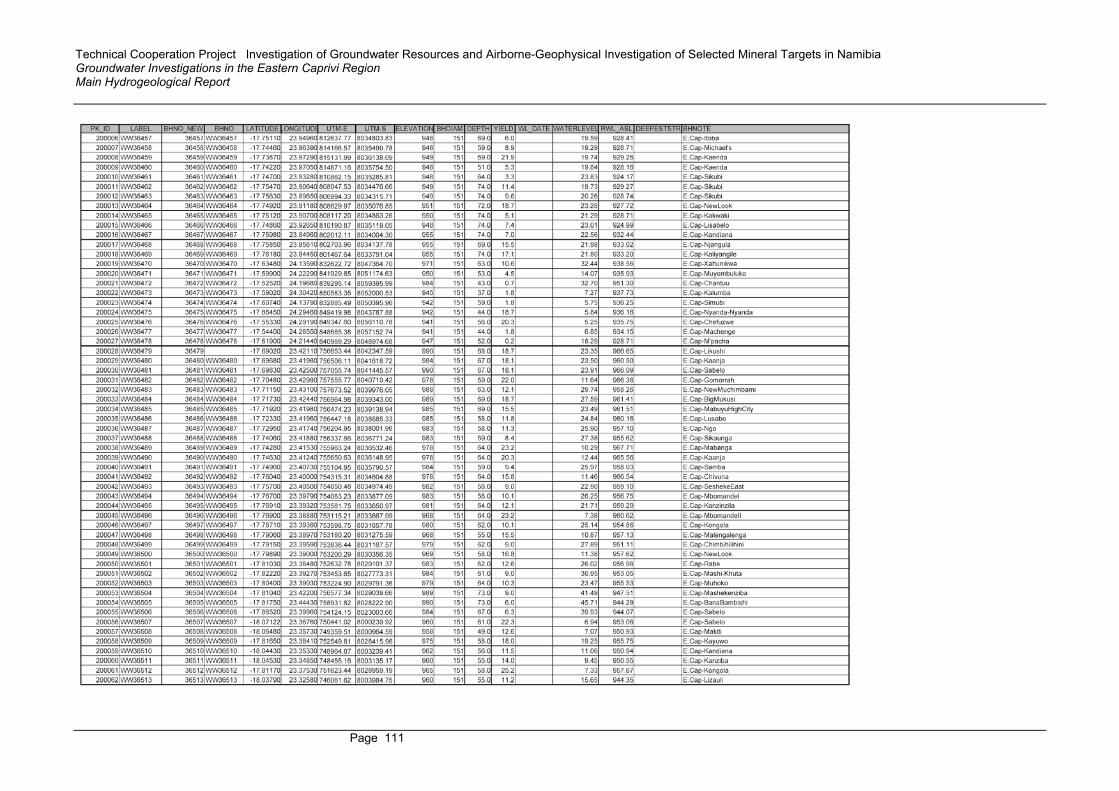
Technical Cooperation Project Investigation of Groundwater Resources and Airborne-Geophysical Investigation of Selected Mineral Targets in Namibia Groundwater Investigations in the Eastern Caprivi Region Main Hydrogeological Report
Page 111

Technical Cooperation Project Investigation of Groundwater Resources and Airborne-Geophysical Investigation of Selected Mineral Targets in Namibia Groundwater Investigations in the Eastern Caprivi Region Main Hydrogeological Report
Page 112

Technical Cooperation Project Investigation of Groundwater Resources and Airborne-Geophysical Investigation of Selected Mineral Targets in Namibia Groundwater Investigations in the Eastern Caprivi Region Main Hydrogeological Report
Page 113

Technical Cooperation Project Investigation of Groundwater Resources and Airborne-Geophysical Investigation of Selected Mineral Targets in Namibia Groundwater Investigations in the Eastern Caprivi Region Main Hydrogeological Report
Page 114

Technical Cooperation Project Investigation of Groundwater Resources and Airborne-Geophysical Investigation of Selected Mineral Targets in Namibia Groundwater Investigations in the Eastern Caprivi Region Main Hydrogeological Report
Page 115

Technical Cooperation Project Investigation of Groundwater Resources and Airborne-Geophysical Investigation of Selected Mineral Targets in Namibia Groundwater Investigations in the Eastern Caprivi Region Main Hydrogeological Report
Page 116

Technical Cooperation Project Investigation of Groundwater Resources and Airborne-Geophysical Investigation of Selected Mineral Targets in Namibia Groundwater Investigations in the Eastern Caprivi Region Main Hydrogeological Report
Page 117
Annex 3: Borehole Location Map
Technical Cooperation Project Investigation of Groundwater Resources and Airborne-Geophysical Investigation of Selected Mineral Targets in Namibia Groundwater Investigations in the Eastern Caprivi Region Main Hydrogeological Report
Page 118
Annex 4: Spatial Distribution of Lithological Units
For recognition of further details, please zoom in on the pdf-file of this report on enclosed CD. For further details to individual logs, please refer to pdf-files of logs on enclosed CD.

Technical Cooperation Project Investigation of Groundwater Resources and Airborne-Geophysical Investigation of Selected Mineral Targets in Namibia Groundwater Investigations in the Eastern Caprivi Region Main Hydrogeological Report
Page 119

Technical Cooperation Project Investigation of Groundwater Resources and Airborne-Geophysical Investigation of Selected Mineral Targets in Namibia Groundwater Investigations in the Eastern Caprivi Region Main Hydrogeological Report
Page 120
Annex 5: Hydrochemical Data
Complete Data Sets Only Part 1: Contents in mg/l (EC in mS/m)

Technical Cooperation Project Investigation of Groundwater Resources and Airborne-Geophysical Investigation of Selected Mineral Targets in Namibia Groundwater Investigations in the Eastern Caprivi Region Main Hydrogeological Report
Page 121
continued:

Technical Cooperation Project Investigation of Groundwater Resources and Airborne-Geophysical Investigation of Selected Mineral Targets in Namibia Groundwater Investigations in the Eastern Caprivi Region Main Hydrogeological Report
Page 122
continued:

Technical Cooperation Project Investigation of Groundwater Resources and Airborne-Geophysical Investigation of Selected Mineral Targets in Namibia Groundwater Investigations in the Eastern Caprivi Region Main Hydrogeological Report
Page 123
Part 2: Contents in meq/l and meq%

Technical Cooperation Project Investigation of Groundwater Resources and Airborne-Geophysical Investigation of Selected Mineral Targets in Namibia Groundwater Investigations in the Eastern Caprivi Region Main Hydrogeological Report
Page 124
continued:

Technical Cooperation Project Investigation of Groundwater Resources and Airborne-Geophysical Investigation of Selected Mineral Targets in Namibia Groundwater Investigations in the Eastern Caprivi Region Main Hydrogeological Report
Page 125
Annex 6: Guideline Values of the Namibian Drinking Water Guideline
Namibia, Department of Water Affairs
Guidelines for the evaluation of drinking-water for human consumption with reference to chemical,
physical and bacteriological quality, July 1991
Parameter and
Expression of the results
Group A Excellent Quality
Group B Good
Quality
Group C Low Health
Risk
Group D Unsuitable
Temperature T °C - - - Hydrogen ion conc. pH, 25°C - 6.0 to 9.0 5.5 to 9.5 4.0 to 11.0 <4.0 to >1 1.0 Elec. conductivity EC, 25° mS/m 150 300 400 >400 Total dissolved solids TDS mg/l - - - - Total Hardness CaCO3 mg/I 300 650 1300 >1300 Aluminium AI µg/l 150 500 1000 >1000 Ammonia NH4* mg/l N mg/l
1.5 1.0
2.5 2.0
5.0 4.0
>5.0 >4.0
Antimony Sb µg/l 50 100 200 >200 Arsenic As µg/l 100 300 600 >600 Barium Ba µg/l 500 1000 2000 >2000 Beryllium Be µg/l 2 5 10 >10 Bismuth Bi µg/l 250 500 1000 >1000 Boron B µg/l 500 2000 4000 >4000 Bromate BrO3
- µg/l - - - - Bromine Br µg/l 1000 3000 6000 >6000 Cadmium Cd µg/l 10 20 40 >40 Calcium Ca mg/l CaC03 mg/l
150 375
200 500
400 1000
>400 >1000
Cerium Ce µg/l 1000 2000 4000 >4000 Chloride Cl- rng/l 250 600 1200 >1200 Chromium Cr µg/l 100 200 400 >400 Cobalt Co µg/l 250 500 1000 >1000 Copper Cu µg/l after 12 hours in pipe µg/l
500 -
1000 -
2000 -
>2000 -
Cyanide CN- 200 300 600 >600 Fluoride F mg/l mg/l
1.5 -
2.0 -
3.0 -
>3.0 -
Gold Au µg/l 2 5 10 >10 Hydrogen sulphide H2S µg/l 100 300 600 >600 Iodine l µg/l 500 1000 2000 >2000 Iron Fe µg/l 100 1000 2000 >2000 Lead Pb µg/l 50 100 200 >200 Lithium Li µg/l 2500 5000 10000 >10000 Magnesium Mg mg/l as CaCO3 mg/l
70 290
100 420
200 840
>200 >840
Manganese Mn µg/l 50 1000 2000 >2000 Mercury Hg µg/l 5 10 20 >20 Molybdenum Mo µg/l 50 100 200 >200 Nickel Ni µg/l 250 500 1000 >1000 Nitrate* N03
- mg/l N mg/l
45 10
90 20
180 40
>180 >40
Nitrite* NO2- mg/l - - - -

Technical Cooperation Project Investigation of Groundwater Resources and Airborne-Geophysical Investigation of Selected Mineral Targets in Namibia Groundwater Investigations in the Eastern Caprivi Region Main Hydrogeological Report
Page 126
Namibia, Department of Water Affairs Guidelines for the evaluation of drinking-water
for human consumption with reference to chemical, physical and bacteriological quality,
July 1991 Parameter
and Expression of the results
Group A Excellent Quality
Group B Good
Quality
Group C Low Health
Risk
Group D Unsuitable
N mg/l - - - - Oxygen, dissolved 02 % sat. - - - - Phosphorus P205 µg/l P04
3- µg/l - -
- -
- -
- -
Potassium K mg/l 200 400 800 >800 Selenium Se µg/l 20 50 100 >100 Silver Ag µg/l 20 50 100 >100 Sodium Na mg/l 100 400 800 >800 Sulphate SO4
2- mg/l 200 600 1200 >1200 Tellurium Te µg/l 2 5 10 >10 Thallium TI µg/l 5 10 20 >20 Tin Sn µg/l 100 200 400 >400 Titanium Ti µg/l 100 500 1000 >1000 Tungsten W µg/l 100 500 1000 >1000 Uranium U µg/l 1000 4000 8000 >8000 Vanadium V µg/l 250 500 1000 >1000 Zinc Zn µg/l after 12 hours in pipe P911
1000 -
5000 10000 >10000 -
* CNO3/GVNO3+CNO2/GVN02-≤1

Technical Cooperation Project Investigation of Groundwater Resources and Airborne-Geophysical Investigation of Selected Mineral Targets in Namibia Groundwater Investigations in the Eastern Caprivi Region Main Hydrogeological Report
Page 127
Annex 7: Isotope Data of the IAEA Study (modified after DWA database; δ18O, δ2H and respective errors in ‰; 3H and respective error in TU) PK_ID BHNO UTM-E UTM-S d18O d2H ∆D 3H 3H_ERROR200235 773357.17 7980868.37 -3.39 -35.2 -8.08 1.1 0.2200300 851400.71 8063532.37 -2.86 -23.9 -1.02 2.1 0.3200188 WW36080 778537.46 8018776.58 -6.93 1 0.16200165 WW36616 844903.19 8054780.22 -7.44 0.74 0.15200162 WW36613 852593.36 8055721.79 7.51 1.78 0.18200154 WW36605 848169.28 8028152.73 -5.68 -45.5 -0.06 0 0.2200153 WW36604 849722.97 8030186.44 -5.84 -42.4 4.32 2.5 0.3200111 WW36562 800674.94 8033443.07 -4.96 -39.6 0.08 0 0.2200111 WW36562 800674.94 8033443.07 -4.63 -40.4 -3.36 0 0.2200106 WW36557 795208.45 8028712.64 -6.79200105 WW36556 807201.10 8035334.89 -7.52 -54.4 5.76 0 0.2200102 WW36553 793028.96 8028111.45 -4.25 0.58 0.16200101 WW36552 803619.10 8034993.32 -6.47 -50.7 1.06 0.2 0.2200101 WW36552 803619.10 8034993.32 -6.19 -41.6 7.92 3 0.2200099 WW36550 805393.49 8035466.82 -7.5 -55.1 4.9 2.6 0.2200089 WW36540 751331.11 7998636.28 -6.01 0.45 0.14200086 WW36537 764780.09 8013529.13 -6.66 1.53 0.18200085 WW36536 759867.55 8011501.89 -7.36200078 WW36529 762288.48 8013451.79 -8.05 0.36 0.14200077 WW36528 752211.55 8026836.96 -7.14 -49.5 7.62 2.4 0.2200077 WW36528 752211.55 8026836.96 -6.83 -46.2 8.44 1.1 0.2200071 WW36522 749244.50 8021958.61 -3.49 0.53 0.14200065 WW36516 746251.66 8010680.82 0.32 0.14200063 WW36514 753228.42 8026746.48 -5.54 0.17 0.13200061 WW36512 751623.44 8028959.19 -4.23 1.74 0.16200058 WW36509 752549.81 8028415.96 -4.82 0.53 0.15200025 WW36476 849347.60 8056110.78 -7.51 3.04 0.18200025 WW36476 849347.60 8056110.78 -6.9200025 WW36476 849347.60 8056110.78 3.04 0.18200025 WW36476 849347.60 8056110.78 0.84 0.14200022 WW36473 850583.35 8052000.53 -7.19 0.61 0.16200016 WW36467 802012.11 8034004.30 -6.15 0.17 0.13200013 WW36464 808629.97 8035076.85 -7.41 -51 8.28 0.6 0.2200010 WW36461 810862.15 8035285.81 -7.86 -50 12.88 0 0.2200005 WW36456 813176.53 8035315.99 -8.06 -64.7 -0.22 0 0.2200237 WW36385 -8.21 -59.1 6.58 0 0.2200237 WW36385 -7.86 -53.7 9.18 0 0.2200238 779272.72 7978482.46 0.27 -10.6 -12.76 0 0.2200239 WW36329 768968.28 7981413.87 0.61 -13.1 -17.98 0.2 0.2200240 794879.45 7975046.04 -1.07 -16.9 -8.34 4 0.3200240 794879.45 7975046.04 -1 -13.7 -5.7 4 0.3200241 812799.08 7992258.59 0.54 -8.4 -12.72 0 0.2200241 812799.08 7992258.59 0.57 -6.6 -11.16 0 0.2200242 800623.81 7980565.41 -1.69 -22.9 -9.38 0 0.2200242 800623.81 7980565.41 -1.22 -19.8 -10.04 0 0.2200243 784700.41 7979037.79 -3.6 -33 -4.2 0.6 0.2200243 784700.41 7979037.79 -3.29 -33.3 -6.98 0.6 0.2200244 813039.87 7992939.31 0.86 -1.3 -8.18 2.5 0.3200244 813039.87 7992939.31 1.33 -0.4 -11.04 2.5 0.3200245 WW35309 811422.55 7988974.03 -0.9 -18.5 -11.3 0 0.2200246 790950.68 7979367.73 0.52 -14.2 -18.36 0.6 0.2200247 906957.93 8025145.29 -3.87200248 850970.32 8028687.34 -6.15 -43 6.2200249 793208.51 8027125.30 0.37 0.15200085 WW36536 759867.55 8011501.89 0.93 0.15200251 832737.58 8007228.50 -3.63 -30.6 -1.56200251 832737.58 8007228.50 -3.6 -39.1 -10.3 0.4 0.2200251 832737.58 8007228.50 -2.57 -27.9 -7.34200251 832737.58 8007228.50 -2.23 -30.4 -12.56 0.1 0.28212 WW35396 867146.09 8027400.45 -0.4 -15.9 -12.7 4.4 0.48208 WW35392 872630.78 8010329.27 -1.848164 WW35382 852387.42 8028986.89 -6.72 -49.1 4.66

Technical Cooperation Project Investigation of Groundwater Resources and Airborne-Geophysical Investigation of Selected Mineral Targets in Namibia Groundwater Investigations in the Eastern Caprivi Region Main Hydrogeological Report
Page 128
Annex 8: Report on the Interpretation of Environmental Isotope Data
Subcontracted to Balt Verhagen of the Schonland Institute, Johannesburg, South Africa The following report does not necessarily represent the opinion of the authors of this report.

Technical Cooperation Project Investigation of Groundwater Resources and Airborne-Geophysical Investigation of Selected Mineral Targets in Namibia Groundwater Investigations in the Eastern Caprivi Region Main Hydrogeological Report
Page 129
Report on environmental isotope data for the BGR-DWA ground water study of the eastern Caprivi and Oshivelo/Mangetti areas. March 2005 B. Th. Verhagen Honorary Research Fellow School of Geosciences University of the Witwatersrand, Johannesburg South Africa 1. Introduction Two sets of samples were submitted for isotope analysis to the (then) Schonland Research Institute Environmental Isotope Laboratory (EIL). Batch 1 (NWA 36-56) consisted of water samples and field precipitates from the Eiseb graben, with the request for full isotope analysis (oxygen-18, deuterium, tritium, carbon-14/carbon-13). Submitted: 6 September 2004 Completed: 15 November 2004 Reported: November 2004 Batch 2 consisted of water and precipitate samples from eastern Caprivi (NWA 57-76) plus 9 water samples and 8 precipitates from the Oshivelo/Mangetti area (NWA 77-88) with the request for full isotopic analysis. Submitted: 23 November 2004 Completed: 22 February 2005 Reported: February 2005 A belated final water sample and precipitate (NWA 89) for full isotopic analysis. Submitted: 4 January 2005 Completed: 22 March 2005 Reported: This report A batch of water samples (NWA 1-35), taken in eastern Caprivi, was submitted in 1998 with the request for stable isotope (δ2H and δ18O) and tritium (3H) analysis. This data has been included in the IAEA Caprivi data base. A preliminary report on the interpretation of the data for the Eiseb graben (Batch 2) was submitted along with the data in November 2004. 2. Comments on isotope data quality The EIL participates regularly in international intercomparison exercises, where it is usually amongst the top 10 international laboratories for the isotopic analysis of δ18O, δ2H and 3H. Analytical standard deviations are typically better than:
δ18O : 0.1 ‰ δ2H : 1 ‰
tritium : 0-2 TU: ±0.2; 2-5 TU: ±0.3 radiocarbon : 0-20 pMC: ±1.7 pMC; > 20
pMC:±2.5 pMC

Technical Cooperation Project Investigation of Groundwater Resources and Airborne-Geophysical Investigation of Selected Mineral Targets in Namibia Groundwater Investigations in the Eastern Caprivi Region Main Hydrogeological Report
Page 130
3. Notes on environmental radioisotopes employed in this study
3.1 Tritium
Tritium is an extremely useful environmental radioisotope in hydrology, i.a. for assessing mean residence times (MRT) up to ~ 200 yr. Concentrations in rain have returned to almost natural levels, in particular in the southern Hemisphere, following the thermonuclear peaks of the early 60’s. As part of the water molecule it is a conservative hydrological tracer. Tritium is uncomplicated in sampling and robust in its hydrological interpretation, as opposed to chlorofluorocarbons, trace gases dissolved from the atmosphere. Contrary to previously expressed opinions (e.g. Herczeg, 2004), careful analytical procedures and quality control give confidence in measured concentrations down to at least 0.5 TU. 3.2 Radiocarbon Useful in assessing MRT up to some 35000 yr. As it is present in a solute - DIC (dissolved inorganic carbon) - various correction models have been proposed for the “correction” of radiocarbon values in order to account for reduction in concentration other than by radioactive decay – or apparent “ageing”. These are usually on the basis of the “dilution” of biogenic DIC δ13C ~ -12 ‰ to –25‰ PDB with marine limestone carbon, taken to be free of carbon-14 and with a δ13C value of ~ 0 ‰ PDB. As these models of necessity are either too complex, or oversimplify the underlying hydrochemical processes, the results are rarely realistic. Where measurable tritium is present (> ~0.5TU) it is possible to assess the dilution on the basis of the difference between the 14C value expected to accompany such tritium values, and the observed value. See under 3.4. 3.3 Mean residence time This concept is important for assessing ground water dynamics in diffusely recharged, unconfined aquifers, so-called phreatic flow. This implies flow along different flow lines, with transit times from the recharge area increasing with depth in the aquifer. Water pumped from a borehole represents a mixture of water arriving at that point along different pathways. This gives rise to the concept of mean residence time (MRT), which depends on the transport model chosen, e.g. piston flow, dispersive, exponential. The exponential mixing model is chosen as representing the flow situation towards a borehole, and the isotopic response i.t.o. MRT. Where flow occurs under completely confined conditions, flow lines are parallel, ie. transit times from the recharge zone at a cross section of the aquifer are the same. This is described as plug or piston flow, the MRT being the transit time of the plug which is the equivalent of the age. 3.4 Towards a regional interpretative base Figure 1(a) shows a set of curves generated by the exponential mixing model (Maloszewski and Zuber 1996, Verhagen et al 1991) for a uniformly recharged, isotropic phreatic aquifer, using the input values for tritium in southern African rain and radiocarbon in southern Hemisphere atmospheric CO2 back to 1950. The three curves shown give the expected values in ground water respectively for 100%, 90% and 80% atm. (ie. percentage of atmospheric 14C values, simulating isotopic dilution) for different MRT values.

Technical Cooperation Project Investigation of Groundwater Resources and Airborne-Geophysical Investigation of Selected Mineral Targets in Namibia Groundwater Investigations in the Eastern Caprivi Region Main Hydrogeological Report
Page 131
To assess the validity of these curves for the area of investigation, a data set with sufficienly high 3H values is required. This was found in Cuvelai Database.mdb (Margane, priv. comm.). The 3H and 14C values plotted in Figure 1(a). The provenance of the analytical data is not stated, but it is assumed to originate from at least three environmental isotope laboratories. Many values could not be used as the data base does not distinguish between a “0” result and the absence (“0”) of a sample. A similar set of points is shown in Figure 1(b), adapted from Bäumle (2004). Most of the points above 80 pMC lie on or between the model curves. A 70% atm. curve would have encompassed a number of additional points. However, such dilutions – even in karstic limestone terrain e.g. the Otavi dolomites, are less likely in hydrochemically “open” systems.
(a) (b) Figure 1. (a) Exponential model plots of 14C against 3H for southern Africa for
different 14C dilution factors. Data points from the Cuvelai data base (see text). (b) Plot of 14C against 3H, modified after Bäumle (2004).
An alternative interpretation would be mixtures of proportions of shallower, low TAlk, tritium-containing water, drawn in whilst pumping the borehole, with older, high TAlk water. The corresponding, model-derived values of mean residence time (MRT) are given along the top of the diagram. The plots for the two isotopes appear to be a realistic to the extent that no points fall above the 100% curve - the so-called “forbidden zone” (Verhagen et al. 2004). This plot can be employed as a guide for the interpretation of radiocarbon and tritium data for the various sets of samples submitted for isotopic analysis under the present project. It is realised that for the different areas studied, hydrological conditions are variable, and that individual boreholes sampled may (partially) represent confined conditions. For higher MRT values, where the resolution of the plot is reduced, the likely dilution factor can be estimated and the following exponential model expression (Gieske 1995; Verhagen et al. 1991) used for 14C:

Technical Cooperation Project Investigation of Groundwater Resources and Airborne-Geophysical Investigation of Selected Mineral Targets in Namibia Groundwater Investigations in the Eastern Caprivi Region Main Hydrogeological Report
Page 132
MRT = 8270 [(Ao/A) – 1] …..eqn 1. Where Ao is the estimated initial, recharge value and A the observed value of 14C. 4. Comments on Oshivelo/Mangetti project isotope data 4.1 The data set Isotopic information is given in Appendix 3. Of the 8 Mangetti boreholes sampled, only 5 water samples were received. Tritium and stable isotopes could therefore not be measured in three cases. A few deuterium analyses needed to be repeated, but two water samples had been completely used for 3H analysis. Two carbon-13 analyses were lost due to instrument failure. The Mangetti data set is therefore incomplete. 4.2 Isotopic background information on Oshivelo ground water Bäumle (2004) presents an extensive discussion of earlier isotope studies of the Oshivelo aquifers, including the artesian section of the Kalahari aquifer to the west. The report presents extensive isotope data, obtained during project IAEA/008/04, augmented by data drawn from previous studies. In this report, Bäumle attempts to apportion stable and radioactive isotope signatures to the various aquiferous units in the Kalahari and older formations. In this, he finds that only the KDP (discontinuous perched) aquifer has a quite distinctive evaporation signal, albeit based on very few observations. The other Kalahari aquifers all show a somewhat reduced deuterium excess, evidence of a degree of evaporation before infiltration. Part of this enrichment he erroneously ascribes to transpiration, which is a non-fractionating loss mechanism. In a detailed examination of the altitude correction to the stable isotope signature proposed by Geyh (1999), Bäumle (2004) correctly concludes that there is insufficient basis for such a correction. A similar opinion was expressed by Verhagen (2002). Bäumle furthermore attempts to “correct” radiocarbon values for isotopic dilution, based on the associated δ13C values, following a correction model proposed by e.g. Pearson (1965). This gives rise to unrealistically “modern” values of ground water ages. There is no correlation between δ13C and 14C for the entire data set (Fig.17 in Bäumle 2004) which argues against the validity of these δ13C-based corrections. Mean radiocarbon and tritium values show similar trends for the different aquifers (Fig. 15, Bäumle 2004), emphasising the influence of local, diffuse and/or concentrated (channelled) recharge in the omurambas. On the other hand, in his Figure 16 Bäumle sees no relationship between 3H when plotted against 14C. It is clear however, that the data points (Figure 1(b)) follow the predictions of the so-called exponential model for a diffusely recharged, isotropic, phreatic aquifer (Verhagen et al. 1991; Gieske 1995).

Technical Cooperation Project Investigation of Groundwater Resources and Airborne-Geophysical Investigation of Selected Mineral Targets in Namibia Groundwater Investigations in the Eastern Caprivi Region Main Hydrogeological Report
Page 133
4.3 Stable isotopes As mentioned previously, the absence of a number of samples resulted in a rather limited Mangetti data set. The stable isotope values are displayed on a δ2H/δ18O diagram in Figure 2(a). The three rainfall values plot on a regression line y = 7.2x + 6.2, close to the LMWL y = 7.1x + 8.0 (Bäumle 2004). The isotopic signature of rainfall in the Oshivelo region therefore does not appear to differ greatly from the LMWL established for Windhoek. The data pairs for 4 ground water samples plot to the right of this line in the area of values for the KOV and DO aquifers (Figure 8 in Bäumle 2004) indicating minimal evaporation.
(a) (b) Figure 2. δ2H/δ18O diagrams for (a) Mangetti ground water, and Cuvelai rain
water. (b) Rain water from the Tsumeb area (Verhagen 2001) Radiocarbon values, ranging between 16 and 61 pMC, are low for such relatively shallow and probably unconfined (see also: Caprivi, Section 5.5) ground water and suggest that a substantial proportion of the ground water is derived from deeper aquifers. The occasional just measurable tritium suggests either some local recharge or the admixture of perched water to the water pumped from the boreholes, which might increase the radiocarbon above in situ values.

Technical Cooperation Project Investigation of Groundwater Resources and Airborne-Geophysical Investigation of Selected Mineral Targets in Namibia Groundwater Investigations in the Eastern Caprivi Region Main Hydrogeological Report
Page 134
Figure 3. 14C data for Mangetti boreholes, plotted against total borehole depth and depth to the mid-point of the borehole screen respectively
For a number of boreholes, total depth and screen position data is available. The mean screen depth and total depth are plotted against radiocarbon values in Figure 3. There is a clear correlation with both these parameters, suggesting a decrease of 14C with depth of about 2 pMC per 10 metres. This data suggests that water in the aquifer(s) tapped is age-layered which resembles a phreatic system. Depending on the flow model (confined, ie “piston” or phreatic, ie “exponential”) the estimated range of residence times for the data set is given in the table below:
pMC MRT (yr) piston flow MRT (yr) exp. flow 16.4 13000 36000 61.1 2600 3300
Figure 4. GW contour map for the Oshivelo/Mangetti area showing borehole
numbers with 14C (pMC) (large type) and δ18O (‰) (smaller type) Radiocarbon and oxygen-18 data is displayed on a groundwater contour map in Figure 4. The samples were obtained from boreholes of different total depths and different depths below surface and lengths of screens. Even allowing for a depth dependence (see Figure 3), there is no evidence of downstream “ageing”. The isotopic data therefore provides no information on ground water flow.The stable isotope data and low tritium values, suggest that diffuse, areal recharge is very limited. In spite of the rather low radiocarbon values (apparent MRT values ~ 4000 – 10000+ yr), the available chemical data, with one exception, show the general characteristic of recently recharged ground water (Ca,Mg-HCO3 dominant, see Piper diagram, Figure 5.). No major shift has therefore occurred in the ionic ratios, which could be interpreted as established in the dolomite aquifer. The fairly uniform δ13C values for a wide range of 14C values are a further indication of the limited degree of hydrochemical development in this aquifer system.

Technical Cooperation Project Investigation of Groundwater Resources and Airborne-Geophysical Investigation of Selected Mineral Targets in Namibia Groundwater Investigations in the Eastern Caprivi Region Main Hydrogeological Report
Page 135
Figure 5. Piper diagram of ionic ratios for Mangetti boreholes
5. Comments on Eastern Caprivi project isotope data 5.1 Introduction The alluvial deposits which form the aquifers in this region appear to be separated by a fairly widespread clay layer into an upper and lower aquifer (Margane et al. 2005). Water samples taken under this study are from Water Affairs (WW) boreholes previously drilled (mainly?) into the shallow aquifer and a set of project boreholes that were drilled into both the upper and lower aquifers. The discussion will involve the results from an earlier project (NWA 1-35; Appendix 1) submitted for stable isotope and tritium analysis in 1998 from WW boreholes as well as from village water supply points. Reference will also be made to an IAEA database of tritium and stable isotope results (Margane, priv. comm.) into which the NWA 1-35 data series appears to have been incorporated. This data will be used as a background to the discussion on the project data NWA 57-76 (Appendix 3). No information is available on the conditions under which samples have been taken, nor what precautions were taken to ascertain their provenance. In the following discussion it is assumed that samples can be allocated to the ascribed aquiferous horizons. 5.2 Stable isotopes The stable isotope values for the complete NWA 1-35 data set fall on a regression line δ2H = 5.25 δ18O – 13.3. The regression line for village water points only is slightly different (Figure 6(a)). These slopes are typical for recharge by (rain) water which has undergone a degree of evaporative loss at surface before infiltrating (ponding, swamps, rivers) in this environment. A similar slope is to be found in ground water at Stampriet (Verhagen and Butler 2004). The most negative values lie close to the point of intersection with the GMWL (δ18O ~ -8.7; δ2H ~ -58) that may be taken as the weighted mean of rainfall generating recharge in the area. At Stampriet, in SE Namibia, this point of intersection is somewhat less negative, δ18O ~ -7.7; δ2H ~ -54).

Technical Cooperation Project Investigation of Groundwater Resources and Airborne-Geophysical Investigation of Selected Mineral Targets in Namibia Groundwater Investigations in the Eastern Caprivi Region Main Hydrogeological Report
Page 136
-4-5-6-7-8-9
-70
-60
-50
-40
-30
dD
dD L
O (o/oo)
H(o/oo)
δ 2
18δ
upperlower
y = - 19.2+ 4.65x R^2 = 0.98
GMWL
Figure 6. δ2H – δ18O diagrams for (a) for NWA 1-35 samples, showing three groupings: “village supply boreholes (no WW numbers), WW boreholes and rivers (b) for samples from present project NWA 57-76, grouped according to upper and lower aquifers
The few river samples fall on the general evaporation regression line which is characteristic for the region. The Zambezi samples are less enriched than the Kwando and Linyanti Rivers. This is not surprising, in view of the much greater flow rate of the former. Although the conclusions from the IAEA study claim that the stable isotope signature allows for the tracing of river water infiltration for up to two km, it is doubtful whether this can be ascribed to bank infiltration or the result of ponding of rain and occasional flooding by the river. The overlapping stable isotope signatures do not seem to be helpful in identifying recharge from rivers. The large dose of tritium introduced into the Linyanti River during the IAEA study could at present be employed as a tracer of river water and prove infiltration into surrounding ground water. Figure 6(b) shows a δ2H - δ18O plot for project boreholes NWA 57-76 (Appendix 3). This regression line shows distinct differences with 6(a). The slope is lower and the regression line intersects the WMWL at more negative values. It suggests that the area in which the samples were taken has physiographic features which differ from the wider area over which the samples for the IAEA sample set were taken. The range of values is also much smaller and, in contrast, tritium values are mostly ~ 0 TU. The four samples from the lower aquifer seem themselves to fall in two groups: those that plot close to the GMWL (direct rain recharge; regional confined flow?) and those that reflect the same degree of evaporation as the upper aquifer; leakage?). . 5.3 Environmental tritium The tritium values for the IAEA data set, which includes NWA 1-35, is plotted on a frequency histogram in Figure 7. As expected, the 0 – 0.2 TU category dominates, as this implies tritium below the measurable limit. The remainder, i.e. measurable tritium, shows a bi-modal distribution, around 0.7 TU and around 2.5 TU. A tentative interpretation would be that the < 1.0 TU group, including the 0-0.2 TU group, generally shows the influence of the lower

Technical Cooperation Project Investigation of Groundwater Resources and Airborne-Geophysical Investigation of Selected Mineral Targets in Namibia Groundwater Investigations in the Eastern Caprivi Region Main Hydrogeological Report
Page 137
aquifer, and (semi-)confined conditions in the upper aquifer, whilst the higher group characterises active recharge to the upper aquifer.
Figure 7. Frequency histogram of tritium values for ground water samples from
eastern Caprivi (IAEA database). The distribution is bi-modal, with substantial populations around 0.7 TU and 2.5 TU
0-10-20-30-40-50-60-70
0
1
2
3
4
5
TU
River-associated ground water?
H (o/oo)2δ Figure 8. Caprivi 3H vs δ2H for the IAEA data set. Note absence of correlation,
but a distinct separation into groups of higher and lower 3H. An additional ground water group is tentatively described as river-associated.
A plot of 3H vs δ2H from the IAEA data set (Figure 8), shows no correlation suggesting that recharge is largely independent of the mechanism of infiltration. The separation into two

Technical Cooperation Project Investigation of Groundwater Resources and Airborne-Geophysical Investigation of Selected Mineral Targets in Namibia Groundwater Investigations in the Eastern Caprivi Region Main Hydrogeological Report
Page 138
groups (see also histogram in Figure 7) could be ascribed to the influence of the deep and shallow aquifers. Both these groups cover a wide range of δ2H values interpreted as showing that there is a variety of recharge mechanisms operating in the area influencing both aquifers. The MRT and therefore the recharge rate is independent of the recharge mechanism. The geographical locations of the third group (high 3H,δ2H) suggest the influence of the rivers. 5.4 Project boreholes Six boreholes, WW41002-7 drilled under the project targeting the upper and the lower aquifers, were sampled. The lower aquifer was reported (Margane 2005) to show reducing tendencies (strong H2S smell), but that measurable oxygen was present. This may have been due to a degree of aeration during pumping and sampling, or mixing with water from the shallow aquifer. The piezometric levels of the two lower aquifer boreholes stand some 11 metres higher than than those in the upper aquifer. This implies an upward-directed piezometric gradient, with the possibility of upwards leakage through the aquitard. The major ionic ratios for a selection of Caprivi WW production boreholes are displayed on a Piper diagram in Figure 9. These have all been drilled in the upper aquifer, which is unconfined to semi-confined. There is a spread of ionic ratios, from Ca,Mg-HCO3 dominant through ion exchange to saline types, suggesting a variety of hydrochemical processes. The ionic ratios for the project boreholes WW 41002-7 are plotted separately for the upper and lower aquifers in Figure 10. These samples show a rather distinctive Na-dominant saline grouping, suggesting sulphate reduction. The lower aquifer shows a complete overlap with compositions seen in the upper aquifer (Figure 9), whilst the two upper aquifer samples 41005/7 show a Na-Cl dominance not seen elsewhere.
80 60 40 20 20 40 60 80
20
40
60
80 80
60
40
20
20
40
60
80
20
40
60
80
Ca Na HCO3 Cl
Mg SO434608
36468
36505
36531
3653636537
36543
36551
36557
3656737077
Figure 9. Chemical signature of Caprivi WW production boreholes all ascribed
to the upper aquifer (unconfined to semi-confined). Note spread from Ca,Mg-HCO3 dominant through ion exchange to saline.

Technical Cooperation Project Investigation of Groundwater Resources and Airborne-Geophysical Investigation of Selected Mineral Targets in Namibia Groundwater Investigations in the Eastern Caprivi Region Main Hydrogeological Report
Page 139
80 60 40 20 20 40 60 80
20
40
60
80 80
60
40
20
20
40
60
80
20
40
60
80
Ca Na HCO3 Cl
Mg SO4
410024100341004
41005
41006
41007
Legend:
LowerUpper
Figure 10. Chemical signature of Caprivi project bh’s. The two upper aquifer
sample show a signature (anions) not seen in Figure 9
5.5 Carbon isotopes The radiocarbon values for the project WW boreholes are displayed (Figure 11) on a map (large type) along with the values for the existing WW boreholes in the same area (smaller type). The 14C values for the “shallow” project boreholes lie in the same range as those for the surrounding WW boreholes, the depths of which range between some 50-80 metres. It is therefore assumed that they tap mainly the upper aquifer.

Technical Cooperation Project Investigation of Groundwater Resources and Airborne-Geophysical Investigation of Selected Mineral Targets in Namibia Groundwater Investigations in the Eastern Caprivi Region Main Hydrogeological Report
Page 140
Figure 11. Map of Caprivi boreholes showing 14C values in pMC for project
boreholes (large type) and WW boreholes (smaller type)
806040200
-12
-10
-8
-6
-4
d13Cd13C L
C (pMC)
C(o/oo)
13δupperlower
14
Figure 12. Plot of δ13C against 14C for Caprivi project and production borehole
The stable carbon isotope value δ13C in ground water gives an indication of the hydrochemical processes that have established the dissolved inorganic carbon (DIC). Although its quantitative interpretation may not lead to meaningful “corrections” of 14C values subject to dilution by other sources of DIC, a more qualitative approach may give an indication of the processes involved. Figure 12 shows a plot of δ13C against 14C for all available Caprivi data.

Technical Cooperation Project Investigation of Groundwater Resources and Airborne-Geophysical Investigation of Selected Mineral Targets in Namibia Groundwater Investigations in the Eastern Caprivi Region Main Hydrogeological Report
Page 141
300250200150100500
0
10
20
30
40
50
60
14C U
14C L
TD (m)
C (pMC)
14
upperlower
403020100-9
-8
-7
-6
-5
-4
d18O L
C (pMC)
O (o/oo)δ 18
14
loweraquifer
Figure 13. (a) Plot of 14C against total borehole depth of upper and lower aquifer
project boreholes in east Caprivi. (b) plot of δ18O against 14C for the lower aquifer
The is a weak negative correlation, which might also reflect the different behaviour of the upper and lower aquifers, shows the usual trend of dilution of isotopically depleted organic carbon with more enriched (inorganic, marine limestone ?) carbon. Sulphate reduction in the lower aquifer would involve the oxidation of dissolved (“fossil”) organic carbon, and would produce the opposite trend. In any case, the range of δ13C values is fairly limited and would not produce significant apparent ageing effects. The results from the project boreholes, deep and shallow, show a decrease of 14C values with increasing borehole depth which is continued in the lower aquifer (Figure 13 (a)). There is a suggestion of a break in the relationship at about the position of the aquitard. Figure 13 (b) shows the relationship between δ18O against 14C for the lower aquifer. The higher 14C values are associated with more evaporated water, a characteristic of the shallow aquifer. With the possible exception of two cases in the data set NWA 57-76 (Appendix 3), tritium values are ~ 0 TU, implying MRT > ~500 yr. However, it is remarkable that 14C values are

Technical Cooperation Project Investigation of Groundwater Resources and Airborne-Geophysical Investigation of Selected Mineral Targets in Namibia Groundwater Investigations in the Eastern Caprivi Region Main Hydrogeological Report
Page 142
so low (<<80 pMC) for what amounts to relatively shallow, and probably sustained, phreatic/semi-çonfined conditions. 5.6 Tentative conclusions Piezometric contour maps for eastern Caprivi (Margane 2005) suggest somewhat different flow regimes for the upper and lower aquifers. The piezometric level in the deep Caprivi project boreholes stood some 11 metres higher than in the two shallow boreholes in 2004. On hydrological evidence, upwards leakage can occur from the deep to the shallow aquifer at the time of observation. Provided reliable sample allocation, the overall interpretation of the chemical and isotopic data is that the two aquifers influence each other and that, under different climatological/exploitation conditions, this piezometric differential would be reversed. This model could explain the more or less continuous decline of 14C with increasing borehole depth across the aquitard, and that upwards leakage at present probably masks isotopically the effect of diffuse rain recharge to the upper aquifer. In the comparatively shallow, upper phreatic aquifer the radiocarbon values are relatively low, whilst in the deep, (semi-)confined aquifer a range of 14C values, up to 32 pMC, is encountered, with a clear depth dependence. As in the case of Mangetti (Section 4.2) this proposed vertical leakage may dominate the isotope data for the very few sampling points established by the project boreholes. The two results (NWA ), with low radiocarbon and stable isotope signature on the GMWL, may represent water derived from the unconfined reaches of the deep aquifer. Otherwise, the isotope data can not provide any information on the regional flow dynamics of the deep aquifer. 6. References Baeumle, R. (2004) Groundwater investigations of the Oshivelo artesian aquifer – Isotope-
sampling campaign for the investigation of the recharge, groundwater quality and flow mechanisms. File No. NAM8/004. Interim report. IAEA/DWA Namibia.
Geyh M.A. (1999) Hydrogeology and isotope hydrology of the Otavi Mountain Land and its surroundings (Karst_01 and Karst_02). Unpublished Report; German-Namibian Groundwater Exploration Project (GNGEP) no. 89.2034.0, FIGNR, Germany & DWA Namibia. Reports on hydrogeological and isotope hydrological investigations – Vol. D-III: 65 pp; Hanover.
Gieske, A. (1995) Hydrodynamics of 14C analysis in unconfined aquifers. Paper 29 in: Ground Water ’95. Procs. Symposium, Midrand, South Africa ISBN 0-620-19572-X
GKW Consult & Bicon Namibia (2003) Report on the groundwater quality and the isotope hydrology/recharge.- Unpublished; Tsumeb Groundwater Study Final report Vol. 6: 48 pp.; Windhoek.
Herczeg, A (2004) End of mission report/Comments on interim report NAM/8/004
IAEA/WMO Global Network for Isotopes in Precipitation (GNIP) Data
Maloszewski, P. and Zuber, A. (1996) Lumped parameter models for interpretation of environmental tracer data. In: Manual on mathematical models in isotope hydrogeology. IAEA-TECDOC-910. Vienna
Margane, A, Baeumle, R. Schildknecht, F and Wierenga, A (2005) Groundwater Investigations in the Eastern Caprivi Region. Main Hydrogeological Report. Technical Cooperation Project No.: 2001.2137.6

Technical Cooperation Project Investigation of Groundwater Resources and Airborne-Geophysical Investigation of Selected Mineral Targets in Namibia Groundwater Investigations in the Eastern Caprivi Region Main Hydrogeological Report
Page 143
Pearson, F.J. (1965) Use of C-13/C-12 ratios to correct radiocarbon ages of material initially diluted by limestone In: procs. Of the 6th International Conference on Radiocarbon and Tritium Dating, Pulman, Washington, 357.
Verhagen, B.Th., Geyh, M.A., Froehlich, K. & Wirth, K. (1991). Isotope hydrological methods for the quantitative evaluation of ground water resources in arid and semi-arid areas. - Development of a methodology. Research Reports of the Federal Ministry for Economic Cooperation of the Federal Republic of Germany. Bonn.
Verhagen, B. Th. (2002) Contribution to: Tsumeb Groundwater Study Final report (GKW Consult & Bicon Namibia 2003)
Verhagen, B.Th. and Butler. M.J. (2004) Ground water input to a rare flood event in an arid zone ephemeral river identified with isotopes and chemistry WISA Conference, Cape Town, May 2004
Verhagen, B. Th., Butler, M.J., van Wyk, E, & Levin, M. (2004) Environmental isotope studies as part of a rural ground water supply development : Taaibosch area, Limpopo Province, South Africa. In: Southern and eastern African regional programme on sustainable water resources, RAF/8/029. In press. TecDoc, IAEA, Vienna.

Technical Cooperation Project Investigation of Groundwater Resources and Airborne-Geophysical Investigation of Selected Mineral Targets in Namibia Groundwater Investigations in the Eastern Caprivi Region Main Hydrogeological Report
Page 144
Appendix 1. Eastern Caprivi isotope data (1998)
Laboratory Sample δ D δ18 O δ13 C
Number Identification (‰) (‰) (‰)NWA 1 WW 35324 -15.2 -0.41 0.3 ±0.2NWA 2 WW 35396 Tololi -15.9 -0.40 4.4 ±0.4NWA 3 WW 35401 Chinchimane 15 m -30.4 -2.23 0.1 ±0.2NWA 4 WW 35401 Chinchimane 60 m -39.1 -3.60 0.4 ±0.2NWA 5 WW 36310 -1.3 +0.86 2.5 ±0.3NWA 6 WW 36318 -33.3 -3.29 0.6 ±0.2NWA 7 WW 36319 -22.9 -1.69 0.0 ±0.2NWA 8 WW 36320 -6.6 +0.57 0.9 ±0.2NWA 9 WW 36322 -16.9 -1.07 4.0 ±0.3
NWA 10 WW 36385 -53.7 -7.86 0.0 ±0.2NWA 11 WW 36528 -46.2 -6.83 1.1 ±0.2NWA 12 WW 36552 -50.7 -6.47 0.2 ±0.2NWA 13 WW 36556 30 m -54.4 -7.52 0.0 ±0.2NWA 14 WW 36562 -40.4 -4.63 0.0 ±0.2NWA 15 CB 7305 -44.9 -6.58 0.6 ±0.2NWA 16 Kapolota -36.8 -4.45 2.4 ±0.2NWA 17 Linyante dug well -15.8 -1.79 2.6 ±0.2NWA 18 Lisauli -13.2 3.0 ±0.2NWA 19 Masida hand pump -51.5 -7.91 0.0 ±0.2NWA 20 Lusua -27.9 -2.45 0.4 ±0.2NWA 21 Mbilanje -24.6 -1.43 0.1 ±0.2NWA 22 Zambezi River -23.9 -2.86 2.1 ±0.3NWA 23 Kwando River at Lianchulu -17.7 -0.60 2.4 ±0.3NWA 24 Sauzoo -11.3 +0.41 1.8 ±0.3NWA 25 Blikalo -30.4 -3.24 0.0 ±0.2NWA 26 Kambwabwana -20.4 -1.90 4.1 ±0.3NWA 27 Muyako -22.7 -1.44 0.0 ±0.2NWA 28 Choi clinic -26.2 -1.87 2.5 ±0.3NWA 29 Chinchimane SWS -16.7 -0.27 0.0 ±0.2NWA 30 CBJ 173 / 38 m -46.1 -6.71 2.3 ±0.3NWA 31 CBJ 173 / 70 m -37.7 -4.82 0.0 ±0.2NWA 32 Linyanti River pump station -3.0 +1.68 3.7 ±0.3NWA 33 Ranger Station -36.7 -3.89 0.7 ±0.2NWA 34 CBJ 147 -50.5 -7.73 0.7 ±0.2NWA 35 Batubaja Clinic -7.2 +1.08 3.3 ±0.3
Tritium Carbon-14(T.U.) (pMC)

Technical Cooperation Project Investigation of Groundwater Resources and Airborne-Geophysical Investigation of Selected Mineral Targets in Namibia Groundwater Investigations in the Eastern Caprivi Region Main Hydrogeological Report
Page 145
Appendix 2. Eiseb graben data
Appendix 3. Eastern Caprivi and Oshivelo/Mangetti isotope data
Laboratory Sample δ D δ18 O δ13 C
Number Identification (‰) (‰) (‰)NWA 36 1 2004/08/15 WW39907 Pos 11 -54.6 -7.93 0.0 ±0.2 30.9 ±1.9 -9.46NWA 37 2 2004/08/14 WW35433 Pos 3 -55.0 -7.90 0.2 ±0.2 12.5 ±1.6 -6.87NWA 38 3 2004/08/10 WW35434 Pos 4 -54.3 -7.53 0.2 ±0.2 53.9 ±2.1 -9.52NWA 39 4 2004/08/07 WW10413 Agaroppos (Nam/Botsw Border) -53.2 -7.56 0.0 ±0.2 40.2 ±2.0 -8.74NWA 40 5 2004/08/14 WW35431 Pos 1 -54.7 -7.81 0.0 ±0.2 15.8 ±1.7 -7.08NWA 41 6 2004/08/14 WW35432 Pos 2 -53.3 -7.62 0.5 ±0.2 63.3 ±2.2 -9.72NWA 42 7 2004/08/15 WW35439 Pos 9 -53.3 -7.90 0.0 ±0.2 19.6 ±1.7 -10.24NWA 43 8 2004/08/23 WW35440 Pos 10 -54.8 -7.87 0.2 ±0.2 10.7 ±1.6 -10.33NWA 44 9 2004/08/25 WW35435 Pos 5 -49.8 -7.03 0.0 ±0.2 62.1 ±2.2 -9.50NWA 45 10 2004/08/16 Rooiboklaagte Omuramba-Otjovakuru -53.5 -7.28 0.1 ±0.2 47.5 ±2.0 -8.67NWA 46 11 2004/08/16 Rooiboklaagte Omuramba-Otjovakuru/2 -44.9 -6.15 0.1 ±0.2 47.4 ±2.0 -9.70NWA 47 12 2004/08/23 Ovie -59.6 -8.76 0.6 ±0.2 60.9 ±2.2 -7.81NWA 48 13 2004/08/23 Otjoahe -58.8 -8.49 0.0 ±0.2 49.0 ±2.1 -10.18NWA 49 14 2004/08/25 Otjiparu -59.5 -8.57 0.3 ±0.2 62.0 ±2.2 -9.65NWA 50 15 2004/08/25 Ojovazandu -54.4 -7.94 0.2 ±0.2 49.7 ±2.5 -9.60NWA 51 16 2004/08/05 WW33168 Ojtitazu -54.2 -7.92 0.7 ±0.2 13.5 ±1.7 -9.17NWA 52 17 2004/08/05 + 2004/08/08 Embonde (South) -54.2 -8.12 0.1 ±0.2 18.7 ±1.7 -9.35NWA 53 18 2004/08/06 Otjora -48.4 -6.94 0.1 ±0.2 0.0 ±1.5 -7.32NWA 54 19 24-Aug-04 WW41023 BE-1 -55.1 -7.87 0.3 ±0.2 60.7 ±2.2 -9.88NWA 55 20 26-Aug-04 WW41023 BE-1 -54.0 -7.85 0.1 ±0.2 55.2 ±2.1 -9.73NWA 56 21 17-Aug-04 WW41024 BE-2 -52.8 -7.62 0.0 ±0.2 51.1 ±2.1 -9.65
Tritium Carbon-14(T.U.) (pMC)

Technical Cooperation Project Investigation of Groundwater Resources and Airborne-Geophysical Investigation of Selected Mineral Targets in Namibia Groundwater Investigations in the Eastern Caprivi Region Main Hydrogeological Report
Page 146
Laboratory Sample δ D δ18 O δ13 C Model* MRTNumber Identification (‰) (‰) (‰) (yr)NWA 57 WW36567 19/10/04 -55.4 -8.02 0.0 ±0.2 19.8 ±1.7 -6.82 E 27200NWA 58 WW36557 22/10/04 -50.3 -6.88 0.0 ±0.2 15.0 ±1.7 -6.21 E >35000NWA 59 WW36537 06/11/04 -53.4 -7.32 0.0 ±0.2 48.3 ±2.1 -8.87 E 6300NWA 60 WW36529 07/11/04 -59.2 -8.42 0.4 ±0.2 66.6 ±2.2 -10.61 E 2300NWA 61 WW36080 09/11/04 -57.2 -8.24 0.0 ±0.2 70.7 ±2.3 -9.61 E 1700NWA 62 WW36536 07/11/04 -55.2 -7.82 0.0 ±0.2 46.3 ±2.0 -9.70 E 6900NWA 63 WW36531 07/11/04 -55.9 -7.81 0.5 ±0.2 49.5 ±2.1 -9.27 E 5900NWA 64 WW36534 07/11/04 -59.1 -8.50 0.2 ±0.2 63.1 ±2.2 -10.23 E 2900NWA 65 WW34608 06/11/04 -50.1 -6.60 0.0 ±0.2 57.4 ±2.2 -7.44 E 4000NWA 66 WW36505 06/11/04 -39.4 -4.37 0.0 ±0.2 49.5 ±2.1 -9.87 E 5900NWA 67 WW36551 09/11/04 -59.1 -8.49 0.0 ±0.2 39.3 ±2.0 -11.98 E 9600NWA 68 WW36543 23/10/04 -54.8 -7.95 0.2 ±0.2 35.6 ±1.9 -9.99 E 11500NWA 69 WW36468 20/10/04 -48.3 -6.40 0.2 ±0.2 28.6 ±1.8 -10.49 E 16300NWA 70 WW37077 23/10/04 -55.6 -7.98 0.0 ±0.2 2.0 ±1.5 -5.27 E >35000NWA 71 WW41002 09/11/04 -37.7 -4.15 0.2 ±0.2 33.3 ±1.9 -9.50 P 07800NWA 72 WW41003 03/10/04 -43.6 -5.38 0.1 ±0.2 10.7 ±1.6 -6.41 P 17100NWA 73 WW41004 16/10/04 -59.9 -8.62 0.2 ±0.2 5.7 ±1.6 -4.87 P 22400NWA 74 WW41005 25/10/04 -55.8 -7.52 0.0 ±0.2 52.8 ±2.1 -6.44 E 5000NWA 75 WW41006 25/10/04 -61.7 -8.67 0.0 ±0.2 0.0 ±1.4 -5.32 P >35000NWA 76 WW41007 09/10/04 -44.1 -5.24 0.2 ±0.2 42.5 ±2.0 -6.72 E 8300NWA 77 WW40020 11/06/04 -61.9 -7.75 0.0 ±0.2 41.8 ±2.0 -9.41 P 5900NWA 78 WW40931 29/04/04 -57.8 0.3 ±0.2 27.3 ±1.8 -9.02 P 9400NWA 79 WW40932 06/05/04 16.4 ±1.7 -8.55 P 13600NWA 80 WW40933 13/05/04 37.7 ±1.9 -9.22 P 6700NWA 81 WW40934 14/05/04 61.1 ±2.2 -7.20 E 3200NWA 82 WW40935 22/07/04 -62.3 -8.15 0.0 ±0.2 24.3 ±1.8 -9.42 P 10400NWA 83 WW40936 08/10/04 -63.3 -8.40 0.5 ±0.2 42.5 ±2.0 E 8300NWA 84 WW40967 20/07/04 -63.3 -8.09 0.3 ±0.2 24.9 ±1.8 P 10200NWA 85 CUV001 28/07/04 -29.6 2.4 ±0.2NWA 86 CUV003 28/07/04 -53.7 -8.32 2.5 ±0.2NWA 87 14 30/07/04 -46.4 -7.31NWA 88 143 30/07/04 -28.5 -4.82NWA 89 WW40974 05/12/04 -60.0 -8.76 0.1 ±0.2 28.4 ±1.8 E 16500
* E=Exponential; P=Piston
Tritium Carbon-14(T.U.) (pMC)

Technical Cooperation Project Investigation of Groundwater Resources and Airborne-Geophysical Investigation of Selected Mineral Targets in Namibia Groundwater Investigations in the Eastern Caprivi Region Main Hydrogeological Report
Page 147
Annex 9: Topographic Survey of DWA-BGR Boreholes In January 2005 the newly drilled boreholes were surveyed for their coordinates and elevations. The following list contains the final coordinate and elevation data used in this report. The coordinates and elevation data documented in Volume IV.GW.2.2 and 2.3 were preliminary data.
WW-No UTM-E UTM-S Lat LongElevation *
m m ° ° mWW41002 764464.20 8013659.98 -17.942358 23.38817 953.787WW41003 793428.19 8024633.93 -17.840685 23.391 946.671WW41004 800956.64 8019955.64 -17.885414 23.39167 944.560WW41005 800973.89 8019955.36 -17.885414 23.39167 944.596WW41006 794256.79 8010321.56 -17.971484 23.391 947.307WW41007 794250.63 8010337.99 -17.971396 23.391 947.635

Technical Cooperation Project Investigation of Groundwater Resources and Airborne-Geophysical Investigation of Selected Mineral Targets in Namibia Groundwater Investigations in the Eastern Caprivi Region Main Hydrogeological Report
Page 148
Annex 10: Locations and Names of Villages in the Eastern Caprivi
Copyright © 2022 FDOKUMEN