Electrical resistivity survey for groundwater investigations and shallow subsurface evaluation of...
9
This article appeared in a journal published by Elsevier. The attached copy is furnished to the author for internal non-commercial research and education use, including for instruction at the authors institution and sharing with colleagues. Other uses, including reproduction and distribution, or selling or licensing copies, or posting to personal, institutional or third party websites are prohibited. In most cases authors are permitted to post their version of the article (e.g. in Word or Tex form) to their personal website or institutional repository. Authors requiring further information regarding Elsevier’s archiving and manuscript policies are encouraged to visit: http://www.elsevier.com/copyright
Transcript of Electrical resistivity survey for groundwater investigations and shallow subsurface evaluation of...

This article appeared in a journal published by Elsevier. The attachedcopy is furnished to the author for internal non-commercial researchand education use, including for instruction at the authors institution
and sharing with colleagues.
Other uses, including reproduction and distribution, or selling orlicensing copies, or posting to personal, institutional or third party
websites are prohibited.
In most cases authors are permitted to post their version of thearticle (e.g. in Word or Tex form) to their personal website orinstitutional repository. Authors requiring further information
regarding Elsevier’s archiving and manuscript policies areencouraged to visit:
http://www.elsevier.com/copyright

Author's personal copy
Electrical resistivity survey for groundwater investigations and shallowsubsurface evaluation of the basaltic-greenstone formation of the urbanBulawayo aquifer
Innocent Muchingami a,b,⇑, D.J. Hlatywayo a, J.M. Nel b, C. Chuma a
a Applied Physics Department, National University of Science and Technology, Box AC939, Ascot, Bulawayo, Zimbabweb Department of Earth Sciences, University of the Western Cape, Box X17, Bellville 7535, South Africa
a r t i c l e i n f o
Article history:Available online 31 August 2012
Keywords:Electrical resistivityGroundwaterResistivity models2D (two-dimensional)Unconfined aquifer
a b s t r a c t
Electrical resistivity surveying methods have been widely used to determine the thickness and resistivityof layered media for the purpose of assessing groundwater potential and siting boreholes in fracturedunconfined aquifers. Traditionally, this has been done using one-dimensional (1D) vertical electricalsounding (VES) surveys. However, 1D VES surveys only model layered structures of the subsurface anddo not provide comprehensive information for interpreting the structure and extent of subsurfacehydro-geological features. As such the incorporation of two-dimensional (2D) geophysical techniquesfor groundwater prospecting has often been used to provide a more detailed interpretation of the subsur-face hydro-geological features from which potential sites for successful borehole location are identified.In this study, 2D electrical resistivity tomography was combined with 1D VES to produce a subsurfaceresistivity model for assessing the availability of groundwater in the basaltic-greenstone formation ofthe Matsheumhlope well field in Bulawayo, Zimbabwe. Low resistivity readings (<50 Xm) towards thecentral region of the study area suggest a high groundwater potential, while high resistivities(>500 Xm) around the western margin of the study area suggests a low groundwater potential. 2D elec-trical resistivity surveys provide a more detailed subsurface structure and may assist in identifying theconfiguration of possible fractures which could conduct groundwater into the shallow subsurface ofstudy area. It is concluded that 2D electrical resistivity methods is an effective tool for assessing the avail-ability of groundwater in the highly weathered and fractured basaltic greenstone rocks. The methods pro-vided a more precise hydro-geophysical model for the study area compared to the traditional VES. Resultsfrom this study are useful for technical groundwater management as they clearly identified suitable bore-hole locations for long term groundwater prospecting.
� 2012 Elsevier Ltd. All rights reserved.
1. Introduction
Availability of groundwater in unconfined aquifers underlain byimpermeable crystalline igneous and/or metamorphic rocks is of-ten controlled by the development of secondary porosity and per-meability from weathering and fracturing. To ensure maximumand perennial yields, a borehole should be sited where it can pen-etrate the maximum possible thickness of the regolith. In the base-ment areas of western Zimbabwe, Wright (1990) and Ndlovu et al.(2010) noted that a minimum overburden of 20–25 m is needed forsiting a borehole. Here, a thick regolith of about 40 m developed
under wet, tropical conditions and serves as the shallow watertable aquifer with hydraulic properties largely controlled by faultsand shear zones (Mangore and Taigbenu, 2004).
Hydrogeological and geophysical investigations are often con-ducted to assess the groundwater potential of a particular area.Geophysical investigations, although sometimes plagued withambiguities and uncertainties in interpretation, provide a rapidand cost-effective means of deriving distributed information onsubsurface hydrogeology (Kearey and Brooks, 1991). The use ofgeophysical methods for both groundwater resource mappingand water quality evaluation has increased dramatically over thelast decade due to rapid advances in electronic technology andthe development of numerical modeling solutions (e.g. in Olayinka(1991), Ndlovu et al. (2010), and Metwaly et al. (2009)). Althoughvarious hydro-geophysical techniques are available, electricalresistivity is a popular method because of its low cost, simple oper-ation, and efficiency in areas with high contrasting resistivity, such
1474-7065/$ - see front matter � 2012 Elsevier Ltd. All rights reserved.http://dx.doi.org/10.1016/j.pce.2012.08.014
⇑ Corresponding author at: Applied Physics Department, National University ofScience and Technology, Box AC939, Ascot, Bulawayo, Zimbabwe. Tel.: +263774606348.
E-mail addresses: [email protected], [email protected](I. Muchingami).
Physics and Chemistry of the Earth 50–52 (2012) 44–51
Contents lists available at SciVerse ScienceDirect
Physics and Chemistry of the Earth
journal homepage: www.elsevier .com/locate /pce
Author's personal copy
as between the weathered overburden and the bedrock (Telfordet al., 1990). Electrical methods are particularly suitable forgroundwater studies because hydrogeologic properties, such asporosity and permeability, can be correlated to electrical resistivityvalues. Geo-electrical techniques are essentially concerned withthe measurement of electrical resistivities of subsurface materials,which preferentially provides information on the different geolog-ical layers, structures and the associated occurrence of groundwa-ter (e.g. in Van Overmeeren (1989), Stewart (1982), Dahlin et al.(1999), Nowroozi et al. (1999), and Meju (2005)). Resistivity is re-lated to various geological parameters such as the mineral andfluid content, porosity, and degree of water saturation. Occurrenceof groundwater in rocks and soil materials is summarized by Ar-chie’s Law;
q ¼ aqw/�m ð1Þ
where q is the bulk resistivity, qw is fluid resistivity, / is porosity,and a and m are empirical parameters (Keller and Frischknecht,1966).
Traditionally, one-dimensional (1D) vertical electrical sound-ings (VES) have been used to obtain a layered model of the subsur-face and the depth to bed rock (e.g., in Ako et al. (1986), McDowell(1979), Martinelli (1978), and Olorunfemi and Olorunnlwo (1985)).In many cases, however, the subsurface cannot sensibly be re-solved into horizontal homogeneous layers or into simple zoneswith lateral conductivity variations as required for profile interpre-tation. In this study, two-dimensional (2D) electrical resistivitytomography (ERT) surveys were combined with VES surveys to as-sess groundwater potential and evaluate the shallow subsurface ofthe basaltic greenstone formation of the Matsheumhlope well fieldaquifer in Bulawayo, Zimbabwe.
The specific objectives of the study are to (a) determine thedepth, thickness, and extent of potential water bearing formations,(b) generate a 2D resistivity model of the shallow subsurface
showing the thickness of weathered and fractured zones, and (c)develop a model of the structural and stratigraphic conditions con-trolling the groundwater occurrence in the shallow subsurface ofthe study area.
2. The study area
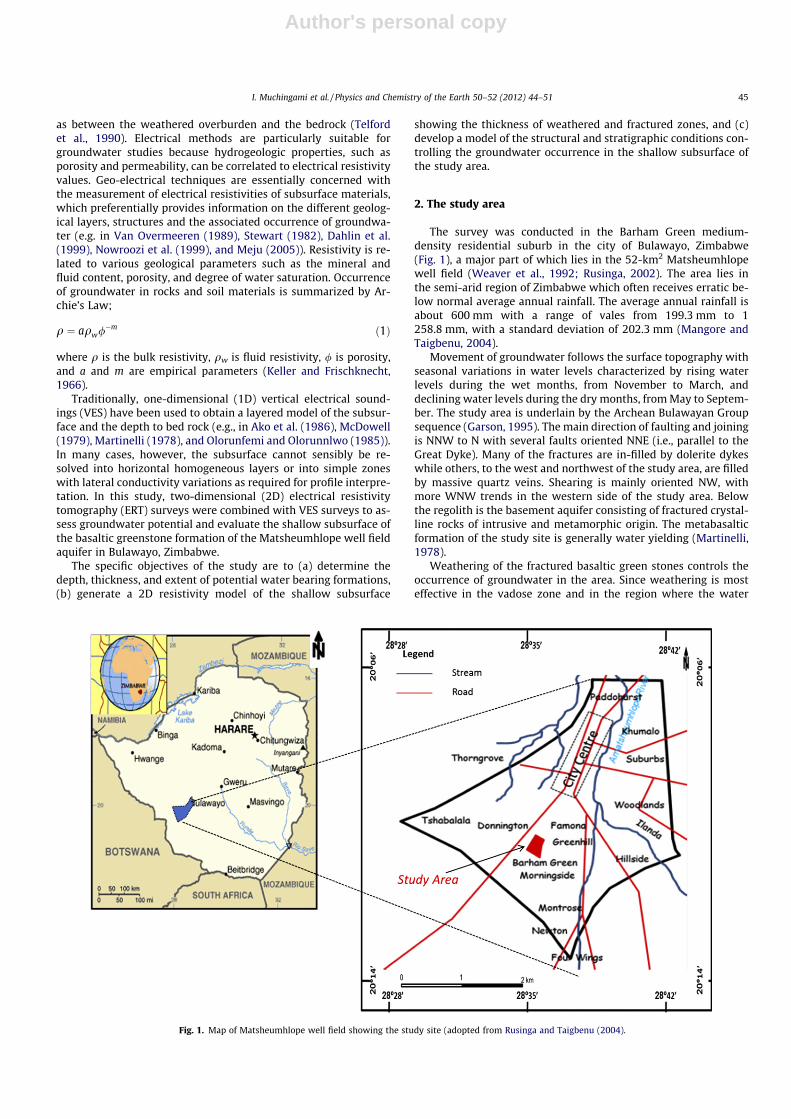
The survey was conducted in the Barham Green medium-density residential suburb in the city of Bulawayo, Zimbabwe(Fig. 1), a major part of which lies in the 52-km2 Matsheumhlopewell field (Weaver et al., 1992; Rusinga, 2002). The area lies inthe semi-arid region of Zimbabwe which often receives erratic be-low normal average annual rainfall. The average annual rainfall isabout 600 mm with a range of vales from 199.3 mm to 1258.8 mm, with a standard deviation of 202.3 mm (Mangore andTaigbenu, 2004).
Movement of groundwater follows the surface topography withseasonal variations in water levels characterized by rising waterlevels during the wet months, from November to March, anddeclining water levels during the dry months, from May to Septem-ber. The study area is underlain by the Archean Bulawayan Groupsequence (Garson, 1995). The main direction of faulting and joiningis NNW to N with several faults oriented NNE (i.e., parallel to theGreat Dyke). Many of the fractures are in-filled by dolerite dykeswhile others, to the west and northwest of the study area, are filledby massive quartz veins. Shearing is mainly oriented NW, withmore WNW trends in the western side of the study area. Belowthe regolith is the basement aquifer consisting of fractured crystal-line rocks of intrusive and metamorphic origin. The metabasalticformation of the study site is generally water yielding (Martinelli,1978).
Weathering of the fractured basaltic green stones controls theoccurrence of groundwater in the area. Since weathering is mosteffective in the vadose zone and in the region where the water
Fig. 1. Map of Matsheumhlope well field showing the study site (adopted from Rusinga and Taigbenu (2004).
I. Muchingami et al. / Physics and Chemistry of the Earth 50–52 (2012) 44–51 45

Author's personal copy
table fluctuates, an upper and lower saprolite tends to develop rel-ative to current or previous water table elevation. In addition,weathering of the basal brecciated zone also occurs where rockfragmentation is largely unaccompanied by mineralogical changes.The regolith is the main groundwater storage compartment, withits hydraulic properties largely controlled by faults and shearzones. The average hydraulic conductivity of the aquifer is0.55 m/day and sustainable yield ranges from 100 to 250 m3/day(Rusinga, 2002). Although the aquifer is of regional extent, it re-sponds to abstraction in a ‘discontinuous’ fashion, either due todiscontinuities and barrier boundaries within the fracture systemor to the constraints of the low-permeability regolith.
3. Materials and methods
The resistivity data acquisition system used in this survey wasthe SAS 1000 ABEM Lund Imaging System (Dahlin, 1996), togetherwith a relay switching unit (Electrode Selector ES 464), four 100-mmulticonductor cables, and steel rod electrodes (Fig. 2).
A hybrid Wenner–Schulumberger array (Loke, 2000) was usedfor this study. This array arrangement is moderately sensitive toboth horizontal and vertical structures and has a horizontal cover-age and depth of penetration that is about 15% larger than theWenner array. Each survey line utilized 20 electrodes, spaced5 m apart, giving a depth of penetration of approximately 18 m(i.e., 1.8% of the maximum electrode spacing) (Loke, 2000). An in-put current of 100 mA was used and values of apparent resistivitywere manually filtered during the survey. Three parallel N–S ori-ented ERT lines were surveyed 50 m apart (Fig. 3). As a follow upto the observed results, an ERT line was surveyed along the E–Wdirection, at the 55-m point on N–S line, to determine the lateralextent of an observed low resistivity region (Fig. 3).
Apparent resistivity data were processed using RES2DINV(ver3.42d) (Loke, 2000). This program uses an inversion routinebased on the smoothness constrained least-squares technique (deGroot-Hedlin and Constable, 1990; Sasaki, 1992). It automaticallycreates a 2D model by dividing the subsurface into rectangularblocks and chooses optimum inversion parameters for the data
which include the damping factor, vertical to horizontal flatnessfilter ratio, convergence limit, and number of iterations. The usercan modify the inversion parameters to suit different data types.The program calculates the apparent resistivity values of the modelblocks using either a finite difference or finite element method andcompares these to measured data. The resistivity of the modelblocks is adjusted iteratively until the calculated apparent resistiv-ity values of the model agree with the actual measurements (Lokeand Barker, 1996). The program generates both a pseudo-section,which is a qualitative way of presenting the spatial variations ofthe measured or calculated apparent resistivities, and an inversemodel section, which is a tomogram representing the modeleddepth and formation resistivities.
Since the depth of investigation of the 2D survey only covers thetop 18 m of the regolith, VES surveys were performed to obtaindeeper measurements. Similar to ERT, increasing the separationof the current electrodes increases the depth of current penetra-tion, which allows for a deeper depth of investigation (Fig. 4).
In a VES using the Schlumberger array, the effective depth ofpenetration is generally 20–40% that of the outer electrode spacing(AB), dependent on the earth resistivity structure (Edwards, 1977).The current flow and equi-potentials are distorted as they passfrom one resistivity medium to another. VES is useful in determin-ing the depth of overburden, thickness, structure, and resistivity offlat-lying sedimentary beds and possibly the basement, if it is nottoo deep (Telford et al., 1990). Two VES profiles were obtained inthe N–S orientation using the Schlumberger array with a maxi-mum AB/2 spacing of 100 m.
4. Results
4.1. ERT results
In all profiles, a low resistivity zone (20–150 Xm) along the cen-ter of the survey lines between the 50–60 m mark, extends todepths beyond 16.5 m (Fig. 5).
The possible extension of this low resistivity zone suggests thepresence of a fracture zone. Low resistivities on the central section
Cable to electrode jumpers
Cable joints
SAS 1000 terrameter
ES 10 -64switching unit
Cable rolls
Fig. 2. The SAS 1000 LUND imaging system and the ES 10-64e switching unit, together with the multi-electrode cables which were used for the electrical resistivitytomography survey.
46 I. Muchingami et al. / Physics and Chemistry of the Earth 50–52 (2012) 44–51

Author's personal copy
of the ERT could be due to the presence of deep seated fracturesacting as water conduits to the vadose zone. The ERT lines also sug-gest that the dykes characterizing the study area are deep seated inthe eastern side and protrude closer to the shallow subsurface inthe western side of the study area, as evidenced by high resistivityvalues in the ERT results and zones underlying the dykes for Line 2(Fig. 6).
An additional ERT line, along the E–W direction, in the centralregion of the study site was surveyed with the aim of locatingthe zone of the low resistivity anomalies observed in the three pro-file lines (Fig. 7). A distinct low resistivity section (<50 Xm) be-tween the 48–60 m mark is found below at depths >7 m. Thiszone is the most likely a potentially water-bearing fracture thatfeeds the shallow subsurface of the study site.
4.2. VES results
The apparent resistivity data obtained from VES sites were plot-ted against half the current electrode spacing (AB/2) using a VES1.30 freeware (Cooper, 2000) which interprets resistivity soundingcurves using curve matching techniques. This involves matchingsmall segments of a field curve with an approximate theoretical
curve to determine both the thickness and apparent resistivity ofparticular layers in a half space. A three layered model consistingof the topsoil, regolith and bedrock was produced from the fielddata (Figs. 8 and 9). Values of thickness and apparent resistivities(volume average resistivity of a heterogeneous half-space) werevaried until the field and theoretical curves had the least possiblemisfit.
Results from Fig. 8 suggests that the resistivity model whosecalculated apparent resistivity best fit the measurements, with amisfit factor of 20 out of 1000, is characterized by a top layer witha thickness of 7.4 m and apparent resistivities of 30 Xm, a valuecharacteristic of wet soil. The second layer is approximately 34 mthick, has an apparent resistivity of 94 Xm. The range of apparentresistivity values and thickness of the second layer is interpreted asthe weathered overburden saturated with pore water for such, assuggested in Martinelli and Hubert (1985). The third layer has anapparent resistivity of 2620 Xm and is presumed to be the bed-rock. The depth to bedrock is about 41 m, which is deep enoughfor areas where water is expected to originate from the weatheredzone (Ndlovu et al., 2010).
In the second VES survey, a resistivity model with the least pos-sible misfit of 19.5 out of 1000 (1.95%) is characterized by a top
Fig. 3. Location of electrical resistivity tomography and vertical electrical sounding survey lines within the study site.
I. Muchingami et al. / Physics and Chemistry of the Earth 50–52 (2012) 44–51 47

Author's personal copy
layer with a thickness of 7.4 m and apparent resistivities 56 Xmand a second layer has an apparent resistivity of 130 Xm with athickness of approximately 11 m. Martinelli and Hubert (1985)suggested that such thickness of the weathered overburden (i.e.,between 10 and 20 m) is associated with a borehole success rateof around 25% and thus the groundwater potential in this particu-lar region may be low.
5. Discussion and conclusions
The objective of this study is to evaluate the water potentialand investigate the shallow subsurface moisture distribution ofthe study area using a combination of ERT and VES. The extentof fracturing proposed by these surveys can be used to indicatea high ground water potential at the study area. In the ERT
Fig. 4. Illustration of the basic measurements using the method of electrical resistivity (adopted from Marescot et al. (2009)).
Fig. 5. Inverse model resistivity sections along of the sections along lines 1–3.
48 I. Muchingami et al. / Physics and Chemistry of the Earth 50–52 (2012) 44–51

Author's personal copy
surveys, a low resistivity zone along the central region of thestudy area suggests the possibility of a fracture zone. This wasalso suggested by Houston and Lewis (1988) from boreholesaround the well field where a higher frequency of fractures wasfound on the upper 20 m of the bedrock, below the regolith inter-face. The low resistivity region along survey Line 2 may suggestthe presence of a fracture zone in this region. This also agreeswith earlier studies by Rusinga (2002) who suggested that the
geological features of the study area consists of basement forma-tions in which groundwater tends to occur within residual over-burden (regolith) and the fractured zone. The presence offractures, as interpreted from the ERT tomograms, is also consis-tent with the hydro-geophysical study conducted by Martinelliand Hubert (1985) and Weaver et al. (1992) who suggested thatthe occurrence of groundwater in the study area is solelycontrolled by secondary porosity due to presence of weathered
Fig. 6. A cross section of the inverse model resistivity profiles showing the existance of two deep seated dykes protruding toward the surface in the western side of study area.
Fig. 7. Inverse model resistivity section along the east–west direction.
I. Muchingami et al. / Physics and Chemistry of the Earth 50–52 (2012) 44–51 49

Author's personal copy
fractures along the underlying bed rock. One of the main chal-lenges in the management of the Bulawayo urban aquifer hasbeen the inadequacy of hydrogeological data to reliably modelthe occurrence of groundwater throughout the well field. Theseresults may be integrated into the technical groundwater man-agement of the well field.
The study demonstrated the efficiency of using electrical resis-tivity in imaging the subsurface from which subsurface structuresand extent of fractures that influence the occurrence of groundwa-ter in basaltic greenstone rocks may be interpreted.
References
Ako, B.D., Adegoke, O.S., AJayi, T.R., AJayi, J.O., Rahaman, M.A., 1986. Groundwaterprospecting and exploitation in Nigeria. In: Proceedings of the First AnnualSymposium and Exhibition on Groundwater Resources Nigerla. NIWASA, Lagos,Nigeria.
Cooper, G.R.J., 2000. VES 1.30 Forward Modeling and Inversion of SchlumbergerResistivity Sounding for Microsoft Windows. Geophysics Department,University of the Witwatersrand. <http://space.dial.pipex.com/town/place/vy12/products/cooper/ves.html>.
Dahlin, T., Jens, E., Dowen, R., Mangeya, P., Auken, E., 1999. Geophysical andhydrogeologic investigation of groundwater in the Karoo stratigraphic sequence
Fig. 9. Vertical electrical sounding model along Line 3 in the north–south direction. The table summarizes the layer thicknesses and resistivities.
Rho (Ωm)
Thickness /m Resistivity / ΩmLayer
Fig. 8. Vertical electrical sounding model of the low resistivity region in the study area. The table summarizes the layer thicknesses and resistivities.
50 I. Muchingami et al. / Physics and Chemistry of the Earth 50–52 (2012) 44–51

Author's personal copy
at Sawmills in northern Matabeleland, Zimbabwe: a case history. Hydrogeol. J.15 (5), 945–960.
Dahlin, T., 1996. 2D resistivity surveying for environmental and engineeringapplications. First Break 14, 275–284.
de Groot-Hedlin, C., Constable, S., 1990. Occam’s inversion to generate smooth, two-dimensional models from magneto-telluric data. Geophysics 55, 1613–1624.
Edwards, L.S., 1977. A modified pseudo-section for resistivity and inducedpolarization. Geophysics 42, 1020–1036.
Garson, M.S., 1995. The geology of the Bulawayo greenstone belt and thesurrounding granitic terrain. Zimbabwe Geol. Surv. 93, 2–94.
Houston, J.F.T., Lewis, R.T., 1988. The Victoria province drought relief project, II.Borehole yield relationships. Groundwater 26, 418–426.
Kearey, P., Brooks, M., 1991. An Introduction to Geophysical Exploration, second ed.Blackwell Scientific, Oxford Publishing House.
Keller, G.V., Frischknecht, F.C., 1966. Electrical Methods in Geophysical Prospecting.Pergamon, Oxford, UK.
Loke, M.H., 2000. Electrical Imaging Surveys for Environmental andEngineering Studies. A Practical Guide to 2D and 3D Surveys. <http://www.heritagegeophysicscom>.
Loke, M.H., Barker, R.D., 1996. Rapid least squares inversion of apparent resistivitypseudo-sections by a quasi Newton method. Geophys. Prospect. 44, 131–152.
Mangore, E., Taigbenu, A.E., 2004. Land-use impacts on the quality of groundwaterin Bulawayo. Water SA 30 (4), 453–464.
Martinelli, E., Hubert, G.L., 1985. A report to the ministry of energy and waterresources and development. Master plan for rural water supply and sanitation,Norad. Hydrogeology 2, 109–118.
Martinelli, E., 1978. Groundwater exploration by geoelectrical methods in SouthernAfrica. Bull. Assoc. Eng. Geol. 15, 113–124.
Marescot, L., Monnet, R., Chapellier, D., 2009. Resistivity and induced polarizationsurveys for slope instability studies in the Swiss Alps. Eng. Geol. 98, 18–28.
McDowell, P.W., 1979. Geophysical mapping of water filled fracture zones in rocks.Bull. Int. Assoc. Eng. Geol. 19, 258–264.
Meju, M., 2005. Simple relative space–time scaling of electrical and electromagneticdepth sounding arrays: implications for electrical static shift removal and jointDC TEM data inversion with the most-squares criterion. Geophys. Prospect. 53,1–17.
Metwaly, M., El-Qady, G., Massoud, U., El-Kenawy, A., Matsushima, J., Al-Arifi, N.,2009. Integrated geoelectrical survey for groundwater and shallow subsurfaceevaluation: case study at Siliyin spring, El-Fayoum, Egypt. Int. J. Earth Sci. 99,1427–1436.
Ndlovu, S., Mpofu, V., Manatsa, D., Muchuweni, E., 2010. Mapping groundwateraquifers using dowsing, slingram electromagnetic survey method and verticalelectrical sounding jointly in the granite rock formation: a case of Matshetsherural area in Zimbabwe. J. Sustain. Develop. Afr. 12 (5), 199–208.
Nowroozi, A.A., Horrocks, S.B., Henderson, P., 1999. Saltwater intrusion into thefreshwater aquifer in the eastern shore of Virginia: a reconnaissance electricalresistivity survey. J. Appl. Geophys. 42, 1–22.
Olayinka, A.I., 1991. Geophysical siting of boreholes in crystalline basement areas ofAfrica. J. Afr. Earth Sci. 14 (2), 197–207.
Olorunfemi, M.O., Olorunnlwo, M.A., 1985. Geoelectric parameters and aquifercharacteristics of some parts of South-western Nigeria. Geol. Appl. 20, 99–109.
Rusinga, F., 2002. Hydraulic Characterization of Bulawayo Groundwater Systems.Unpublished Master of Philosophy Thesis, National University of Science andTechnology, Bulawayo, Zimbabwe.
Rusinga, F., Taigbenu, A.E., 2004. Groundwater resource evaluation of urbanBulawayo aquifer. Water S. Afr. 31 (1), 23–34.
Sasaki, Y., 1992. Resolution of resistivity tomography inferred from numericalsimulation. Geophys. Prospect. 40, 453–464.
Stewart, M.T., 1982. Evaluation of electromagnetic methods for rapid mapping ofsalt water interfaces in coastal aquifers. J. Ground Water 20, 538–545.
Telford, E., Geldart, W.M., Sheriff, R.E., 1990. Applied Geophysics. CambridgeUniversity Press, UK.
Van Overmeeren, R., 1989. Aquifer boundaries explored by geoelectricalmeasurements in the coastal plain of Yemen. A case of equivalence.Geophysics 54, 38–48.
Weaver, J.M., Conrad, C.J., Engelbrecht, J.F.P., 1992. The Matsheumhlope Well FieldProject; Well Field Evaluation for Bulawayo City Supply. Report to theMatebeleland Chamber of Industries.
Wright, E.P., 1990. Basement aquifers in Africa. Commonwealth Sci. Council Tech.Paper 273 (2), 349–363.
I. Muchingami et al. / Physics and Chemistry of the Earth 50–52 (2012) 44–51 51