Rates and Processes of Crystallization in On-axis and Off-axis MOR Basaltic Melts
15
Invited review article Rates and processes of crystallization in on-axis and off-axis MOR basaltic melts Georg F. Zellmer a, b, ⁎, Peter Dulski c , Yoshiyuki Iizuka a , Michael R. Perfit d a Institute of Earth Sciences, Academia Sinica, 128 Academia Road, Section 2, Nankang, Taipei 11529, Taiwan, ROC b Lamont-Doherty Earth Observatory of Columbia University, 61 Route 9W, Palisades, New York 10964, USA c Helmholtz Centre Potsdam, GFZ German Research Centre for Geosciences, Telegrafenberg, 14473 Potsdam, Germany d Department of Geological Sciences, University of Florida, Gainsville, Florida 32611, USA abstract article info Article history: Received 28 February 2012 Accepted 26 July 2012 Available online 3 August 2012 Keywords: MORB lavas Near-ridge seamounts Crystal residence times Geospeedometry Residence times of olivine and plagioclase phenocrysts and xenocrysts in mid-ocean ridge (MOR) basaltic melts have been studied since the mid 1980s using geospeedometric techniques (i.e. using diffusion of major and trace elements) in order to constrain the processes of melt ascent and differentiation in this impor- tant magmatic setting. Residence times range from a few hours to several years, but potential links between these timescales and specific tectonomagmatic variables such as spreading rate and relative locations of eruption site and ridge axis have remained elusive. Here we demonstrate how incomplete chemical diffusion of Sr within plagioclase crystals from MOR basalts erupted in on- and off-axis settings on a number of ridges with variable spreading rates provide geospeedometric constraints. We combine electron probe microanalyt- ical crystal maps with detailed laser ablation profiles of almost 70 plagioclase crystals from the fast spreading East Pacific Rise (EPR) at 9–10°N, the intermediate spreading Gorda and Juan de Fuca (JdF) ridges, and the ultraslow spreading Gakkel ridge to calculate crystal residence times. These range from a few days to several months. The scarcity of residence times exceeding years corroborates previous data indicating that most of the growth of plagioclase phenocrysts occurs within the conduit at the onset of and during eruption on the sea floor, and extends this result to the fast-spreading EPR. Further, statistical analysis is employed to show for the first time that residence times are systematically longer at slower spreading rates, in off-axis samples, and samples sourced from laterally distal axial melt lenses. Plagioclase textures and residence time variations appear to be linked to differences in the dynamics of late-stage, pre-eruptive magma storage and ascent in the different tectonomagmatic settings investigated. In the future, geospeedometric work on MOR samples will be required to assess if the effect of spreading rate on crystallization timescales are globally applicable, and to investigate potential variations in magma plumbing systems within individual ridge segments. © 2012 Elsevier B.V. All rights reserved. Contents 1. Introduction . . . . . . . . . . . . . . . . . . . . . . . . . . . . . . . . . . . . . . . . . . . . . . . . . . . . . . . . . . . . . . 2 2. Background of studied MOR samples . . . . . . . . . . . . . . . . . . . . . . . . . . . . . . . . . . . . . . . . . . . . . . . . . . . 3 3. Analytical techniques . . . . . . . . . . . . . . . . . . . . . . . . . . . . . . . . . . . . . . . . . . . . . . . . . . . . . . . . . . 4 4. Plagioclase petrography and mineral chemistry . . . . . . . . . . . . . . . . . . . . . . . . . . . . . . . . . . . . . . . . . . . . . . 4 5. Sr geospeedometry in plagioclase — a methodological review . . . . . . . . . . . . . . . . . . . . . . . . . . . . . . . . . . . . . . . 6 5.1. Determination of Sr chemical equilibrium . . . . . . . . . . . . . . . . . . . . . . . . . . . . . . . . . . . . . . . . . . . . . 6 5.2. Choosing an appropriate initial Sr concentration profile . . . . . . . . . . . . . . . . . . . . . . . . . . . . . . . . . . . . . . . 7 5.3. Deriving crystal residence times through known Sr diffusion rates . . . . . . . . . . . . . . . . . . . . . . . . . . . . . . . . . . 7 6. Determination of plagioclase residence times in the MORB samples of this study . . . . . . . . . . . . . . . . . . . . . . . . . . . . . . 7 7. Analysis of age clustering . . . . . . . . . . . . . . . . . . . . . . . . . . . . . . . . . . . . . . . . . . . . . . . . . . . . . . . . 8 7.1. Functional form of sample residence time distributions and clustering . . . . . . . . . . . . . . . . . . . . . . . . . . . . . . . . . 8 7.2. Qualitative analysis of age clusters . . . . . . . . . . . . . . . . . . . . . . . . . . . . . . . . . . . . . . . . . . . . . . . . . 9 7.3. Functional form of age clusters and significance of residence time differences . . . . . . . . . . . . . . . . . . . . . . . . . . . . . 9 Lithos 154 (2012) 1–15 ⁎ Corresponding author. Tel.: +886 2 2783 9910x602; fax: +886 2 2783 9871. E-mail address: [email protected] (G.F. Zellmer). 0024-4937/$ – see front matter © 2012 Elsevier B.V. All rights reserved. http://dx.doi.org/10.1016/j.lithos.2012.07.019 Contents lists available at SciVerse ScienceDirect Lithos journal homepage: www.elsevier.com/locate/lithos
Transcript of Rates and Processes of Crystallization in On-axis and Off-axis MOR Basaltic Melts

Lithos 154 (2012) 1–15
Contents lists available at SciVerse ScienceDirect
Lithos
j ourna l homepage: www.e lsev ie r .com/ locate / l i thos
Invited review article
Rates and processes of crystallization in on-axis and off-axis MOR basaltic melts
Georg F. Zellmer a,b,⁎, Peter Dulski c, Yoshiyuki Iizuka a, Michael R. Perfit d
a Institute of Earth Sciences, Academia Sinica, 128 Academia Road, Section 2, Nankang, Taipei 11529, Taiwan, ROCb Lamont-Doherty Earth Observatory of Columbia University, 61 Route 9W, Palisades, New York 10964, USAc Helmholtz Centre Potsdam, GFZ German Research Centre for Geosciences, Telegrafenberg, 14473 Potsdam, Germanyd Department of Geological Sciences, University of Florida, Gainsville, Florida 32611, USA
⁎ Corresponding author. Tel.: +886 2 2783 9910x602E-mail address: [email protected] (G.F. Z
0024-4937/$ – see front matter © 2012 Elsevier B.V. Allhttp://dx.doi.org/10.1016/j.lithos.2012.07.019
a b s t r a c t
a r t i c l e i n f oArticle history:Received 28 February 2012Accepted 26 July 2012Available online 3 August 2012
Keywords:MORB lavasNear-ridge seamountsCrystal residence timesGeospeedometry
Residence times of olivine and plagioclase phenocrysts and xenocrysts in mid-ocean ridge (MOR) basalticmelts have been studied since the mid 1980s using geospeedometric techniques (i.e. using diffusion ofmajor and trace elements) in order to constrain the processes of melt ascent and differentiation in this impor-tant magmatic setting. Residence times range from a few hours to several years, but potential links betweenthese timescales and specific tectonomagmatic variables such as spreading rate and relative locations oferuption site and ridge axis have remained elusive. Here we demonstrate how incomplete chemical diffusionof Sr within plagioclase crystals from MOR basalts erupted in on- and off-axis settings on a number of ridgeswith variable spreading rates provide geospeedometric constraints. We combine electron probe microanalyt-ical crystal maps with detailed laser ablation profiles of almost 70 plagioclase crystals from the fast spreadingEast Pacific Rise (EPR) at 9–10°N, the intermediate spreading Gorda and Juan de Fuca (JdF) ridges, and theultraslow spreading Gakkel ridge to calculate crystal residence times. These range from a few days to severalmonths. The scarcity of residence times exceeding years corroborates previous data indicating that most ofthe growth of plagioclase phenocrysts occurs within the conduit at the onset of and during eruption on thesea floor, and extends this result to the fast-spreading EPR. Further, statistical analysis is employed to showfor the first time that residence times are systematically longer at slower spreading rates, in off-axis samples,and samples sourced from laterally distal axial melt lenses. Plagioclase textures and residence time variationsappear to be linked to differences in the dynamics of late-stage, pre-eruptive magma storage and ascent inthe different tectonomagmatic settings investigated. In the future, geospeedometric work on MOR sampleswill be required to assess if the effect of spreading rate on crystallization timescales are globally applicable,and to investigate potential variations in magma plumbing systems within individual ridge segments.
© 2012 Elsevier B.V. All rights reserved.
Contents
1. Introduction . . . . . . . . . . . . . . . . . . . . . . . . . . . . . . . . . . . . . . . . . . . . . . . . . . . . . . . . . . . . . . 22. Background of studied MOR samples . . . . . . . . . . . . . . . . . . . . . . . . . . . . . . . . . . . . . . . . . . . . . . . . . . . 33. Analytical techniques . . . . . . . . . . . . . . . . . . . . . . . . . . . . . . . . . . . . . . . . . . . . . . . . . . . . . . . . . . 44. Plagioclase petrography and mineral chemistry . . . . . . . . . . . . . . . . . . . . . . . . . . . . . . . . . . . . . . . . . . . . . . 45. Sr geospeedometry in plagioclase — a methodological review . . . . . . . . . . . . . . . . . . . . . . . . . . . . . . . . . . . . . . . 6
5.1. Determination of Sr chemical equilibrium . . . . . . . . . . . . . . . . . . . . . . . . . . . . . . . . . . . . . . . . . . . . . 65.2. Choosing an appropriate initial Sr concentration profile . . . . . . . . . . . . . . . . . . . . . . . . . . . . . . . . . . . . . . . 75.3. Deriving crystal residence times through known Sr diffusion rates . . . . . . . . . . . . . . . . . . . . . . . . . . . . . . . . . . 7
6. Determination of plagioclase residence times in the MORB samples of this study . . . . . . . . . . . . . . . . . . . . . . . . . . . . . . 77. Analysis of age clustering . . . . . . . . . . . . . . . . . . . . . . . . . . . . . . . . . . . . . . . . . . . . . . . . . . . . . . . . 8
7.1. Functional form of sample residence time distributions and clustering . . . . . . . . . . . . . . . . . . . . . . . . . . . . . . . . . 87.2. Qualitative analysis of age clusters . . . . . . . . . . . . . . . . . . . . . . . . . . . . . . . . . . . . . . . . . . . . . . . . . 97.3. Functional form of age clusters and significance of residence time differences . . . . . . . . . . . . . . . . . . . . . . . . . . . . . 9
; fax: +886 2 2783 9871.ellmer).
rights reserved.

2 G.F. Zellmer et al. / Lithos 154 (2012) 1–15
8. Discussion . . . . . . . . . . . . . . . . . . . . . . . . . . . . . . . . . . . . . . . . . . . . . . . . . . . . . . . . . . . . . . . . 108.1. On-axis MOR samples from the fast spreading East Pacific Rise . . . . . . . . . . . . . . . . . . . . . . . . . . . . . . . . . . . . 118.2. On-axis MOR samples from ridges with intermediate spreading rates . . . . . . . . . . . . . . . . . . . . . . . . . . . . . . . . . 128.3. Off-axis MOR samples . . . . . . . . . . . . . . . . . . . . . . . . . . . . . . . . . . . . . . . . . . . . . . . . . . . . . . . 138.4. MOR samples from ultraslow-spreading ridges . . . . . . . . . . . . . . . . . . . . . . . . . . . . . . . . . . . . . . . . . . . 138.5. Outstanding issues and future work . . . . . . . . . . . . . . . . . . . . . . . . . . . . . . . . . . . . . . . . . . . . . . . . 13
9. Conclusions . . . . . . . . . . . . . . . . . . . . . . . . . . . . . . . . . . . . . . . . . . . . . . . . . . . . . . . . . . . . . . . 13Acknowledgements . . . . . . . . . . . . . . . . . . . . . . . . . . . . . . . . . . . . . . . . . . . . . . . . . . . . . . . . . . . . . . 14References . . . . . . . . . . . . . . . . . . . . . . . . . . . . . . . . . . . . . . . . . . . . . . . . . . . . . . . . . . . . . . . . . . 14
80
84
88
Distance from grain center (µm)0 50 100
Fo
(mol
%)
ol
pl
pl
pl
glass
(a)
(b)
Fig. 1. (a) A backscattered electron microprobe image showing a typical olivine zoningtexture from the EPR basalts studied by Pan and Batiza (2002). Darker shading of oliv-ine corresponds to higher forsterite (Fo) contents. ol, olivine; pl, plagioclase. The solidbar provides a 100 μm scale. (b) Core to rim compositional profile of the olivine grainshown in (a). 1σ error bars are smaller than symbol size. The solid curve is a calculatedspherical diffusion profile. Adapted from Pan and Batiza (2002).
1. Introduction
The global MOR system produces the greatest proportion of maficmagmas on Earth, yet we still know little about the mechanisms andtimescales of eruptive processes in this environment. It is therefore im-portant to establish potential differences in petrogenetic processes andmagma ascent rates in different tectonomagmatic settings of ridgeswith variable spreading rates. Thickness, runout, and morphology ofsubmarine lava flows are governed bymelt viscosity and flow emplace-ment conditions such as extrusion and cooling rates (Fink and Griffiths,1992; Gregg and Fink, 1995) and local topography (Escartín et al., 2007;Gregg and Smith, 2003). Flow morphologies range from pillowedmounds at slow effusion rates through lobate flows to various kinds ofsheet flows at higher effusion rates (Rubin et al., 2012, and referencestherein). Eruption dynamics andmagma ascent rates have also been re-cently constrained from observations of syn-emplacement degassing ofdissolved CO2 (Soule et al., 2012). However, potential links betweenflow emplacement and magma ascent rates, and the variables that de-termine melt transfer timescales, have to date remained elusive, andthe present review outlines a promising approach to elucidate this as-pect of MOR magmatism.
Rates of magma genesis and melt transfer may be constrained bystudies of short-lived U-series disequilibria, and yield timescales of~103 years based on 226Ra-230Th disequilibria (Rubin and Macdougall,1988; Sims et al., 2002), and more recently of as little as a few decadesbased on 210Pb-226Ra disequilibria (Rubin et al., 2005). These representupper limits for the ages of phenocrysts growing from MOR basalticmelts. Since the mid 1980s, crystal residence times in MOR basaltshave been inferred through modeling the diffusion of ions in olivinecrystals. Examples include Ni diffusion in olivine (Humler andWhitechurch, 1988; Nabelek and Langmuir, 1986), and Fe-Mg interdif-fusion between olivine and melt (Pan and Batiza, 2002) or betweenolivine host crystals and their melt inclusions (Danyushevsky et al.,2002). Fig. 1 provides an example of simple Fe-Mg interdiffusion be-tween an olivine from the East Pacific Rise (EPR) and its host glass asmodeled by Pan and Batiza (2002). The initial composition of thegrain is given by the constant core composition of about Fo89. The de-crease in forsterite content towards the rim is interpreted to be due toFe-Mg interdiffusion between the crystal and the less magnesian melt,which for this particular crystal yields a residence time of 140 daysbased on the liquidus temperature of the host glass (for details, seePan and Batiza, 2002). More recently, plagioclase residence times havebeen studied using Mg diffusion (Costa et al., 2010) and Sr diffusion(Zellmer et al., 2011a,b). Table 1 provides a summary of previous stud-ies on the timescales of crystallization inMORbasalticmelts, which typ-ically range from a few hours to a few years (Costa et al., 2010;Danyushevsky et al., 2002; Humler and Whitechurch, 1988; Nabelekand Langmuir, 1986; Pan and Batiza, 2002; Zellmer et al., 2011b).
MOR basalt (MORB) samples are commonly sparsely phyric, parti-cularly at fast spreading ridges, where >70% of samples carry lessthan 5% crystals (Coogan, 2007). However, when crystals are abun-dant, their zoning profiles are often more complex than shown inFig. 1. Therefore, previous studies of olivine and plagioclase residencetimes have generally focused on the few MORB samples suitable for
such diffusion studies. Together with a general absence of constraintson precise eruption locations and geologic settings, this has signifi-cantly hampered attempts to relate phenocryst residence times tovariations in geodynamic parameters between different ridges orridge segments.
At constant crustal thickness, MOR spreading rates can be regardedas a proxy for average melt supply (Perfit and Chadwick, 1998; Small,1998). Although this relationship breaks down over short time scalesor near hot spots (Rubin and Sinton, 2007; Rubin et al., 2009), spreadingrate nevertheless provides a first order context for the interpretation oftimescales of generation, differentiation, and ascent of MOR magmas.The present study compares plagioclase crystal residence times fromultra-slow, intermediate, and fast spreading ridges, from on-axis andoff-axis settings, and from seamounts and different lava flowmorphol-ogies, thereby providing a first glance into differences in crystal resi-dence times within different MOR eruptive and tectonomagmaticsettings. Here we use these constraints to investigate potential differ-ences in the dynamics of magma storage and ascent between the re-spective magmatic plumbing systems.

Table 1Previous geospeedometry results on crystal residence times in MOR basaltic melts.
Location Mineral, diffusingelement(s)
No. of samplesstudied
Total no. ofcrystals
Range of residencetimes in melt
Reference Comment/interpretation
East Pacific Rise, Siqueirostransform fault
Olivine, Mg-Fe 1 1 ~23 days Danyushevsky et al.(2002)
Total residence time of single grain,modelled in two distinct coolingepisodes of ~22.5 days and ~3 hbefore eruption.
East Pacific Rise, 9°30′N and10°30′N
Olivine, Mg-Fe 4 199 b1 day to 9.3 years Pan and Batiza(2002)
Crystal growth in open systemaxial magma chambers, withmagma residence times of theorder of months.
Central Indian Ridge, nearRodriguez triple junction
Olivine, Ni 1 1 1 to 102 h Humler andWhitechurch (1988)
Crystals growth in a hybrid magmareservoir, with residence timesrepresenting the time betweenmixing of rising magma batches intothe evolved upper reservoir anderuption.
Mid-Atlantic Ridge, FAMOUS area Olivinexenocrysts, Ni
1 5 15 days to4.4 years
Nabelek andLangmuir (1986)
Xenocrysts are thought to be derivedfrom earlier solidified low-Ni basalts.Residence times represent the timebetween uptake of xenocryst intohigh-Ni host melt and its eruption.
Mid-Atlantic Ridge, Serocki Volcano(ODP Hole 648B)
Plagioclasexenocrysts, Mg
3 16 ~1 to 10 years Costa et al. (2010) Crystals are interpreted to representxenocrysts from a mush zone, andresidence times are maximum timesbetween xenocryst entrainment anderuption on the sea floor.
Costa Rica Rift (ODP Hole 896A) Plagioclasexenocrysts, Mg
3 13 Several days tob10 years
Costa et al. (2010) Crystals are interpreted to representxenocrysts from a mush zone, andresidence times are maximum timesbetween xenocryst entrainment anderuption on the sea floor.
North Gorda Ridge Plagioclase, Sr 1 7 A few weeks tomonthsa
Zellmer et al.(2011a,b)
Crystal growth during dike injectionof initially aphyric compositionallyheterogeneous basaltic melts
Juan de Fuca Ridge, Coaxial Segment Plagioclase, Sr 2 13 ~1 week to severalmonthsa
Zellmer et al.(2011a,b)
Crystal growth during dike injectionof initially aphyric compositionallyheterogeneous basaltic melts
Gakkel Ridge, WesternVolcanic Zone
Plagioclase, Sr 1 3 Several monthsa Zellmer et al.(2011a,b)
Crystal growth during dike injectionof initially aphyric compositionallyheterogeneous basaltic melts.Megacrysts form by synneusis ofcrystals during diking.
a Zellmer et al. (2011a,b) calculated equilibration times of 0.2 to 14 years and argued for actual crystal residence times of at least one order of magnitude shorter.
3G.F. Zellmer et al. / Lithos 154 (2012) 1–15
2. Background of studied MOR samples
In this study, we have chosen well-characterized samples in termsof eruption location, and eruption date (if available), covering a rangeof spreading rates, and including Axial Seamount eruptions toinvestigate the potential influence of hot spots. One condition wasthe presence of plagioclase crystals large enough for geospeedometry(ca. 100 μm across, or larger). Samples studied come from the East Pa-cific Rise (EPR) at 9–10°N, the Juan de Fuca (JdF) Ridge, the Gorda ridgeand the Gakkel ridge, with spreading rates ranging from >10 cm yr−1
tob1.5 cm yr−1. EPR on-axis eruptions are represented by the 1994Gravity Cruise sample 2772-3 of unknown eruption age (cf. Sims etal., 2003), and the Knorr dredge sample D48-1x of the 2005-6 flow,which is of the same composition as the other dredge 48 samples (cf.Goss et al., 2010). EPR off-axis eruptions are represented by the 2004Alvin Dive samples 3970-11 and 3974-10 of unknown eruption age(cf. Hinds, 2005; Schouten et al., 2004). The former is taken from a pil-lowmound believed to represent a true off-axis eruption, while the lat-ter was recovered from a flow front about 1.2 km from the axis andmay represent a channelized flow originating from the axial summittrough (Soule et al., 2005). JdF Southern Cleft on-axis eruptions of un-known eruption age are represented by the 2000 Tiburion Dive sam-ples T178-G4, T183-G16 and T183-G17 (cf. Stakes et al., 2006). Ofthese, T178-G4, although recovered from the axial valley, appeared tohave erupted along the bounding fault about 1 km away from the
axial summit trough. We also studied a young Southern Cleft off-axisseamount sample, T461-G20, collected during the 2002 Tiburion Dive(cf. Stakes et al., 2006). Further, JdF Axial Seamount eruptions are rep-resented by the 1988 NOAA Vents Dive central caldera flow sample2087-3 and the 2000 Ropos Dive central 1998 flow sample R501-12(cf. Embley et al., 1995). Finally, we include into our analysis of crystalresidence times on-axis samples from recent MORB eruptions thatwere studied previously (Zellmer et al., 2011a,b). These include basalts2792-4R and 2794-2R from the JdF Coaxial segment, erupted during1982-91 and in 1993, respectively; and basalts W9604-C3 (cf. Rubinet al., 1998) and D27-16 (cf. Michael et al., 2003) from the northernGorda Ridge and the Gakkel Ridge, respectively. The 1993 Coaxialflow, like most other eruptions from the intermediate spreading JdFand Gorda ridges, was associated with lateral dike injection (Embleyet al., 2000; Smith, 1999). However, the distance over which the dikepropagated from the seismically imaged location of the northern endof the Coaxial magma lens (Menke et al., 2002) to the eruption sitewas unusually large (60 km along-axis, compared to typically 5–30 km at ridge segments away from Axial seamount, cf. Dziak et al.,2007). A summary of all sampling locations and sample details, includ-ing their flow morphologies, is given in Table 2. The samples we stud-ied range from pillow lavas and lobate flows to sheet flows, arguablycovering the full range of MORB effusion rates (Gregg and Fink,1995). Our complete dataset comprises 69 plagioclase crystals from10 newly and 4 previously studied (Zellmer et al., 2011a) MOR samples

Table 2Sample details.
Sample # Location Details Relative agea SiO2 MgO Mg# Number of crystals Figure Min. T (°C) k
2772-3 EPR 9–10 N on-axisb Lobate flow, axial summit trough 1 49.57 7.57 0.56 3 S1 1135D48-1x EPR 9–10 N on-axisc Lobate flow, 2005–2006 eruption 0 50.66 8.16 0.61 4 S2 11553970-11 EPR 9–10 N off-axisd Pillow, off-axis pillow mound 2 50.72 7.77 0.58 7 S3 11403974-10 EPR 9–10 N off-axisd Pillow, pillow front of flow channel
off-axis2 50.11 8.33 0.61 4 S4 1155
T178-G4 JdF Cleft on-axise Pillow, axial pillow mound 1 53.72 4.89 0.43 4 S5 1150T183-G16 JdF Cleft on-axise Pillow, elongate pillow flow 1 50.45 7.79 0.56 4 S6 1120T183-G17 JdF Cleft on-axise Sheet flow in axial valley 1 50.67 7.25 0.53 4 S7 1120T461-G20 JdF Cleft off-axise Pillow, part of off-axis volcanic
construct1 48.50 9.77 0.68 4 S8 1170
2087-3 JdF Axial Smt.f Pillow, part of elongate flow incentral caldera
1 49.04 8.42 0.61 7 S9 1160
R501-12 JdF Axial Smt.f Sheet flow, hackley flow section of1998 flow
0 49.54 7.40 0.56 5 S10 1150
2792-4R JdF Coaxialg Sheet flow, folded section of 1982–91Flow site
0 49.30 7.20 0.51 6 Publishedj 1080
2794-2R JdF Coaxialg Pillow, small flow at distal end of1993 Flow site
0 50.60 6.90 0.50 7 Publishedj 1100
W9604-C3 North Gordah Pillow, 1996 flow, RV Wecomacamera sled
0 51.22 8.65 0.65 7 Publishedj 1130
D27-16 Western Gakkeli Tubular pillow, 2001 USCGC Healydredge
? 48.33 8.84 0.67 3 Publishedj 1145
a Relative ages: 0=historic flow, 1=very young likely in past 100 years, 2=unknown, but b80 ka.b Sims et al. (2003).c Goss et al. (2010).d Schouten et al. (2004), compositions from Hinds (2005).e Stakes et al. (2006).f Chadwick et al. (2005).g Embley et al. (2000), compositions from Smith (1999).h Rubin et al. (1998).i Michael et al. (2003), composition from Zellmer et al. (2011a).j Zellmer et al. (2011a).k Based on lowest anorthite content of all crystals in each rock sample and assuming 0.5 wt.% H2O in the primitive magma.
4 G.F. Zellmer et al. / Lithos 154 (2012) 1–15
that are representative for a range of MOR tectonomagmatic settingsand spreading rates.
3. Analytical techniques
Electron microprobe and laser ablation inductively-coupled plas-ma mass spectrometry (LA-ICPMS) facilities were identical to thoseemployed by Zellmer et al. (2011a) in order to facilitate direct com-parison of the new data with the results of previous work on MORBcrystal residence times. All details of these instruments and the ana-lytical methods employed have been described previously (Zellmeret al., 2011a). Therefore, we only give a very brief summary here.
MORB plagioclase crystals were characterized in terms of theirmajor element compositional variations by chemical mapping using afield emission electron probe microanalyser (FE-EPMA) at AcademiaSinica, Taipei. Mapping of was performed with 15 kV, 20–50 nA, and1–3 μm for the acceleration voltage, beam current and beam size,respectively. X-ray intensities of Ca-Kα, Na-Kα, and K-Kαwere countedfor 0.02–0.03 s in each spot, at 1–3 μm intervals.
Quantitative analyses of bothmajor and trace elements were under-taken by LA-ICPMS at the GeoForschungsZentrum Potsdam, Germany,using a 193 nm Eximer laser with 16 μmbeam diameter. Zoningwave-lengths of the crystals studied were typically larger, so that mixing ofdifferent growth zones and associated compositional mixing effectswere not an issue. Further, mixing below the sample surface due toprogressive ablation into the sample did not occur, as we monitoredsignal intensity during ablation. The method of major oxide analysis
Fig. 2. Morphological characteristics of MORB plagioclase crystals from the present study. (a)tabular plagioclase 2772-3-P3, EPR on-axis; (c) sector-zoning in sample 3970-11, EPR off-axisin sample T178-G4, JdF on-axis; (f) resorption of large complexly zoned crystals in sample T46flow of JdF Axial seamount; (h) complex zoning and synneusis forming plagioclase megacrystgioclase megacryst from sample D27-16, Gakkel ridge, taken from Zellmer et al. (2011a). The
by LA-ICPMS through the use of a FE-EPMA-characterized workingstandard has been described in detail by Zellmer et al. (2012). Themain advantage of this approach is that it circumvents the problemof cross-correlation of major and trace element data obtainedthrough different analytical methods. In this regard, it should benoted that the geospeedometric method used in this study relies on ahigh relative precision of any two measurements within an individualcrystal, and will remain valid even if accuracy is low (e.g. due to analy-tical bias). In the present study, we were able to precisely characterizeintracrystalline chemical variations in terms of XAn and Sr concentrationto within ±0.6% and ±1.8% (1σ), respectively, as yielded by repeatLA-ICPMS analysis of a plagioclase working standard chosen from theMORB samples investigated.
To insure consistencywith previouswork (Zellmer et al., 2011a), wehave not considered trace element substitution into the crystal struc-ture in calculations of plagioclase stoichiometry, so that SiO2, Al2O3,CaO andNa2O sum to 100% in Table S1, with totals being slightly higher.However, this has no significant effect on the calculated anorthite con-tents of our samples.
4. Plagioclase petrography and mineral chemistry
Plagioclase crystals from MOR lavas display a wide variety of tex-tures and morphologies (Fig. 2). In our set of samples, the simplestcrystal morphologies are found in on- and off-axis samples fromthe fast spreading EPR and in on-axis samples from the intermediatespreading JdF ridge. They are lath-like (Fig. 2a) or tabular (Fig. 2b)
Concentrically zoned plagioclase lath T183-G17-P2, JdF on-axis; (b) concentrically zoned; (d) complex zoning in crystal T178-G4-2P2, JdF on-axis; (e) clusters of plagioclase laths1-G20, JdF off-axis; (g) large complexly zoned plagioclase lath 2087-3-P4, central calderaR501-12-2P2, 1998 flow of JdF Axial seamount; (i) part of a blocky, complexly zoned pla-colour scale for all images is given in (h). See text for discussion.

5G.F. Zellmer et al. / Lithos 154 (2012) 1–15

6 G.F. Zellmer et al. / Lithos 154 (2012) 1–15
and display such small concentric chemical zonation that it is onlydiscernable by chemical mapping (cf. supplementary figures withchemical profiles for ranges in anorthite content across each crystal).This zoning may be normal, with crystals becoming less calcic towardstheir rim, but is often complex, displaying repeated overgrowth ofmore and less calcic zones on euhedral crystal faces without evidenceof resorption (cf. Fig. 2b). Occasionally, sector zoning is observed(Fig. 2c). However, more complicated zoningwith chemically heteroge-neous, irregular growth zones, likely associated with resorption events,is seen in some crystals (Fig. 2d). In sampleswith higher total crystallin-ity, clusters of crystals are present (e.g. Fig. 2c, e). The off-axis samplefrom the intermediate spreading JdF ridge we studied displays strong,irregular resorption textures on preexisting clusters of complexlyzoned large plagioclase crystals (Fig. 2f).We have also studied two sam-ples from the JdF Axial seamount. One shows complexly zoned plagio-clase crystals, including some large laths that begin to form crystalclusters (Fig. 2g). The other carries abundant plagioclase megacrysts.Their textures indicate synneusis of smaller crystals to build clusters(glomerophenocrysts), which form the cores of megacrysts that contin-ue to incorporate small crystals during their growth (Fig. 2h). Large,blocky megacrysts formed by synneusis of smaller crystals have alsobeen described from the Gakkel ridge sample studied previously(Zellmer et al., 2011a, cf. Fig. 2i).
Compositionally, plagioclase from the ridges we studied spans therange from An62 to An91. Some crystals display small (typicallyb50 μm,but occasionally up to a few hundred microns across) but distinct nucleiof very calcic plagioclase (An84-91), which are most clearly evident inFig. 2b, e, and g. These small calcic coresmay have crystallized fromprim-itive high Ca/Na melts that constituted a volumetrically minor fraction ofthe bulk melt supplied to the newly forming MOR crust (cf. Ridley et al.,2006). They can thus be considered xenocrystic, serving as nucleifor overgrowth within the axial magma chamber (AMC) or in theconduit during magma ascent to the sea floor. The small size ofmost of these calcic cores is in line with results from previous workthat indicate that incorporation of large crystals from the gabbroicrocks in oceanic layer 3 is rare; that most erupted MOR magmasbegin their ascent through the upper oceanic crust as essentiallyaphyric melts; and that the majority of plagioclase crystals havegrown during melt extraction in the conduit, from a compositionallyheterogeneous melt derived from pooled, compositionally distinctmelt lenses (cf. Zellmer et al., 2011a).
5. Sr geospeedometry in plagioclase — a methodological review
To determine plagioclase crystal residence times, we use the geo-speedometric approach of intracrystalline diffusional equilibration ofSr atmagmatic temperatures. In the following, we reiterate and supple-ment the details of this geospeedometric method, which has beendeveloped and employed in several previous studies (Zellmer et al.,1999, 2003, 2011a,b) and was last reviewed by Zellmer et al. (2011a).:Calculating crystal residence times at magmatic temperatures involves(1) determination of the chemical equilibrium concentration of Srwith-in the plagioclase crystal under consideration, (2) choosing an appro-priate initial Sr concentration profile, and (3) applying known Srdiffusion rates within the crystal to derive a residence time.
5.1. Determination of Sr chemical equilibrium
In chemical equilibrium, the relative Sr concentration of any twoparts i and j of a plagioclase crystal will be determined by a solid–solid partition coefficient Di/j, which is a function of the differencein their anorthite contents, XAn, and of temperature, T:
Di=jSr ¼ exp
wSr XiAn−Xj
An
� �RT
0@
1A; ð1Þ
where R is the universal gas constant (8.31451 J mol−1 K−1)and wSr is a constant, the value ofwhichhas empirically beendeterminedas −26,700±1900 J mol−1 (Blundy and Wood, 1991) or −30,400±1100 J mol−1 (Bindeman et al., 1998). Following previous work, we usethewSr value of Blundy andWood (1991). Further, we estimate the min-imum temperature of crystal growth for each rock sample based onMELTSmodeling of bulk rock composition combined with the lowest an-orthite content of the crystals studied in the sample (cf. Zellmer et al.,2011a). Minimum temperature estimates range from 1080 to 1170 °Cand are provided in Table 2. It should be noted that at such temperatures,uncertainties inwSr and T translate into a negligible (of the order of a fewpercent at most) variation in relative partitioning of Sr for growth zoneswith an anorthite difference of ΔXAn=0.1.
Absolute bulk crystal equilibrium profiles can be calculated byadopting a boundary condition such as preservation of total Sr con-tent within the crystal (e.g., Zellmer et al., 1999, 2003, 2011a), orchemical equilibrium of the crystal with an infinite melt reservoirof the composition of the glass (e.g., Costa et al., 2003, 2010). Howev-er, regardless of which boundary condition is used, the assessment ofSr chemical equilibrium or deviation thereof involves comparing Srconcentration ratios of different parts of a plagioclase crystal (ratherthan their absolute Sr concentrations) to the expected chemicalequilibrium ratios derived for these parts. Chemical equilibrium be-tween two parts i and j of a crystal is attained when
Ciobs
Cjobs
¼ Ciequil
Cjequil
¼ Di=j; ð2Þ
where C denotes trace element (in this case, Sr) concentration, im-plying that in equilibrium,
Ciobs
Ciequil
¼ Cjobs
Cjequil
: ð3Þ
If parts i and j are adjacent points within a traverse, local equilibrationmay be assessed as follows: We define ρ as the ratio between observedand equilibrium concentration at each point within the traverse, basedon any chosen boundary condition:
ρ ¼ Cobs
Cequil: ð4Þ
Local equilibration is attained where the ρ-profile has no slope,i.e. when dρ/dx=0, x being distance along the traverse. It should benoted that distinct crystal growth zone boundaries are not required toassess local chemical equilibrium between adjacent parts of a crystal.This is a major advantage over conventional geospeedometric ap-proaches, which use diffusion across sharp compositional contrasts toestimate crystal residence times.
In practice, the assessment of local disequilibria requires knowl-edge of the uncertainties in both anorthite contents and trace ele-ment concentrations under consideration. It can be demonstrated(Zellmer et al., 2003) that concentrations Ci and Cj can be consideredin equilibrium at the 95% confidence limit if
Ci
Cj−Di=j
����������≤2
ffiffiffiffiffiffiffiffiffiffiffiffiffiffiffiffiffiffiffiffiffiffiffiffiffiffiffiffiffiffiffiffiffiffiffiffiffiffiffiffiffiffiffiffiσ Ci=Cjð Þh i2 þ σDi=j
� �2r; ð5Þ
where σ denotes standard deviation, and
σDi=j ¼ wSr
RTDi=j
ffiffiffiffiffiffiffiffiffiffiffiffiffiffiffiffiffiffiffiffiffiffiffiffiffiffiffiffiffiffiffiffiffiffiffiffiffiffiffiffiffiσXi
An
� �2 þ σXjAn
� �2r
: ð6Þ
Crystals that do not display any local Sr disequilibria are in bulk Srequilibrium, which may be due to (i) original crystal growth in

1000
1100
1200
0 0.2 0.4 0.6 0.8
10-1
5 m2 s
-1
10-1
6 m2 s
-1
10-1
7 m2 s
-1
10-1
8 m2 s
-1
dry
T (
°C)
XAn
1
0.5
wt%
H2O
Fig. 3. Evolution of anorthite content calculated by MELTS fractional crystallizationmodeling (Ghiorso and Sack, 1995; Smith and Asimow, 2005) of typical MORB wholerock compositions, adapted from Zellmer et al. (2011a). Fractionation paths are givenfor dry MORB and for 0.5 wt.% H2O in the parental melt, to cover the range of H2O con-tents observed within MORB with up to 0.2 wt.% K2O (cf. Almeev et al., 2008). Contoursindicate diffusion coefficients for Sr in plagioclase as parameterized by Giletti andCasserly (1994), with ~10−17m2s−1 being appropriate for typical MORB compositions.
7G.F. Zellmer et al. / Lithos 154 (2012) 1–15
equilibrium or (ii) diffusion of initial disequilibria over time. How-ever, it should be noted that crystal growth in equilibrium would re-quire a constant Sr content in the melt during crystal growth, so thatthe Sr concentration in the crystal would be governed by its anorthitecontent only. This is unlikely, as crystal growth itself is changing theSr content of the melt locally (as long as DSr
plag/melt≠1). We note thatcrystals in bulk Sr equilibrium are fairly uncommon, which confirmsdisequilibrium growth. In the few cases of bulk Sr equilibrium, it islikely that crystal residence time was sufficiently long for equilibra-tion, but crystal growth in equilibrium cannot be strictly precluded.Such crystals therefore do not lend themselves to geospeedometricdating.
5.2. Choosing an appropriate initial Sr concentration profile
The choice of an initial Sr concentration profile is the least con-strained task in determining plagioclase crystal residence times. In con-ventional geospeedometry, sharp compositional contrasts, e.g. in majorelement chemistry, are assumed to have initially also been displayed bythe diffusing species, providing a strong boundary condition (e.g. Costaet al., 2003). In the absence of sharp compositional contrasts, however,other constraints need to be applied. For example, extreme initial con-centration contrasts across adjacent crystal growth zones can beemployed to derive residence time maxima (e.g., Zellmer et al., 1999,2011a). Alternatively, initial concentration profiles may be modeled ifreasonable assumptions can be made about the petrogenetic processesoperating during crystal growth. For example, Zellmer et al. (2003)demonstrated that in plagioclase from the Soufriere Hills andesites,Montserrat, initial Sr concentrations were relatively invariant acrossphenocrysts due to the counterbalancing effect of Sr depletion in themelt during crystallizationwithDSr
plagjmelt>1 and increasing partitioningof Sr into progressively less calcic plagioclase that is formed during pro-gressive crystallization from the evolving melt.
In the present contribution, we have studied the trace elementprofiles of a relatively large number of crystals. This facilitates an es-timation of initial disequilibria, because there is independent evi-dence that some MORB crystals record residence times of a fewhours only (cf. Table 1; Humler and Whitechurch, 1988; Pan andBatiza, 2002). Thus, the initial profile may be tagged to the largestdisequilibria observed in the large set of MORB crystals studied, asthese disequilibria reflect crystals that resided in the plumbing sys-tem for very short time periods (cf. Section 6, below). All calculatedcrystal residence times are therefore relative to the short residencetimes of the crystals with the greatest disequilibria.
5.3. Deriving crystal residence times through known Sr diffusion rates
Anorthite profiles are preserved over the time scales consideredhere, because coupled diffusion of Na, Ca, Al and Si is very slow(Morse, 1984) compared to diffusion of Sr (Cherniak and Watson,1994; Giletti and Casserly, 1994). The diffusion coefficient of Sr in pla-gioclase, ÐSr (where the use of Ð is to avoid confusion with the parti-tion coefficient, D), is a function of temperature and anorthitecontent:
ÐSr ¼ 10− 4:1XAnþ4:08ð Þ exp −3:32� 104=T
� �;
where the analytical uncertainty of ÐSr is approximately a factor of 2at the ±2σ level (Giletti and Casserly, 1994). The effect of tempera-ture on diffusivity is large by comparison, with a temperature changeof 150 °C resulting in a diffusivity change of about 1 order of magni-tude. The diffusivity of Sr increases with decreasing anorthite contentduring melt evolution, but this is balanced by the concomitantdecrease in diffusivity with decreasing temperatures, so that the Srdiffusion coefficient remains roughly constant and is of the order of10−17 m2s−1 (Zellmer et al., 2011a). This is illustrated in Fig. 3.
Crystals that show Sr concentration profiles in chemical disequilibri-um have cooled to temperatures below which Sr diffusion is insignifi-cant, before being able to fully equilibrate. In nature, bulk crystal Srdisequilibria are frequently preserved (e.g., Costa et al., 2010; Zellmeret al., 1999, 2003, 2011a,b), indicating that crystal residence times atmagmatic temperatures are generally much shorter than required forbulk crystal equilibration. However, one of the strengths of themethod-ology applied here is that it allows the assessment of local chemicaldisequilbria between closely spaced parts of a plagioclase crystal,irrespective of distinct growth zone boundaries. Thus, while the entirecrystal may not have attained complete chemical equilibration throughSr diffusion, some parts of the crystal may already have equilibratedlocally. Yet, if significant chemical disequilibria are retained at a locallevel, short crystal residence times are implied. Therefore, fine scaleanalysis potentially allows crystal residence time constraints to be ex-tended to very short timescales.
In theory, the location of local disequilibrium within a crystal is rel-evant for the interpretation of residence times. Disequilibria within therim of a crystal put constraints on the time of rim overgrowth, whiledisequilibria close to the core of a crystal may allow the determinationof the total residence time of the crystal from shortly after its nucleationto its final eruption (cf. Zellmer and Clavero, 2006). In praxis, it is diffi-cult to achieve this resolution, as initial local disequilibria are likely var-iable, depending on open system processes during crystallization. Inmost MORB plagioclase crystals, the magnitude of local disequilibriado not display a broad decrease towards the core of a crystal (Zellmeret al., 2011a). In the present study,whenever possible, we have selectedlocal disequilibria close to the crystal cores to approximate total crystalresidence time since their nucleation or overgrowth on xenocrysticcores.
6. Determination of plagioclase residence times in the MORB sam-ples of this study
Fig. 4a is an example of an EPR on-axis MORB plagioclase crystal(2772-3-P1) with a partially resorbed, likely xenocrystic (cf. Ridley etal., 2006) calcic core (An85-89) mantled by an oscillatory zoned, euhedraland less calcic overgrowth (An70-78). Its XAn profile is provided inFig. 4b. Its Sr concentration profile as determined by LA-ICPMS is givenin Fig. 4c, together with its calculated equilibrium profile as determinedfrom the observed anorthite content variations. While the observed Srconcentration profile broadly follows the equilibrium profile, there are

100
150
200
Sr
(ppm
)200 µm
(c)
-1
0
1
0 100 200 300 400 500 600
distance (µm)
dise
quili
bria
(10
-2 µ
m-1)(d)
0.66
0.72
0.78
0.84
0.90
XA
n
(b)
(a)
Fig. 4. (a) EPMA Na map of a relatively large plagioclase crystal from EPR on-axis flowsample 2772-3. Colour scale as in Fig. 2. White dots represent a LA-ICPMS spot profiletaken in the direction of the arrow, with ablation diameters of 16 μm. (b) Variation ofanorthite content across the crystal. (c) Variation of Sr concentrations across the crys-tal, and the corresponding equilibrium Sr profile as derived from variations in anorthitecontent. (d) Local disequilibria in Sr, with 2σ error envelope (stippled line), taking intoaccount the uncertainties in measured anorthite and Sr contents.
0
0.5
1.0
1.5
0
10 20 30 40 50 60
EPR on-axisEPR off-axisJdF & Gorda on-axisJdF axial seamountJdF 1993 CoaxialJdF off-axisGakkel
max
imum
abs
olut
e di
sequ
ilibr
ium
(10
-2 µ
m-1)
disequilibrium bandwidth (µm)
initial
2 wee
ks1
mon
th
6 months
2 years
initial
1 month
6 months
2 years
1 year
3 months
0.5
1.0
1.5
2.0using the extreme initial of
Zellmer et al., 2011
using the best estimate initial
(a)
(b)
Fig. 5. Sr disequilibrium maxima of 52 MOR plagioclase crystals that preserve localdisequilibria (cf Figs. S1b - S10b). Time lines of equilibration from an initial step func-tion profile (labeled “initial”) towards Sr chemical equilibrium are given for (a) the un-realistically extreme initial disequilibrium profile assumed by Zellmer et al. (2011a),and (b) a more reasonable initial profile based on the largest local disequilibriadisplayed by the crystal population studied here.
8 G.F. Zellmer et al. / Lithos 154 (2012) 1–15
significant differences in detail, resulting in about 20 μm wide bands oflocal disequilibria that are most prominent at about 210 μm, 300 μmand 360 μm(Fig. 4d). Local disequilibria represent differences in the rela-tive slopes between observed and equilibrated Sr profiles between twoclosely spaced parts of a crystal, and their chemical equilibration is a func-tion of both their magnitude and the widths over which they occur, herereferred to as “bandwidth” (cf. Zellmer et al., 1999, 2003, 2011a). 52 of the69 crystals studied (cf. supplemental Table S1, Figs. S1a - S10a, andZellmer et al., 2011a,b) preserve local disequilibria inward of their outer-most overgrowth rims (cf. supplemental Figs. S1b - S10b).Were possible,we have selected one significant disequilibrium zone close to the core(marked in grey in supplemental Figs. S1b, S10b), in order to estimatethe timescale between nucleation (or shortly thereafter) and eruption.Absolute values of these local disequilibria, and their bandwidths, areplotted in Fig. 5. Local disequilibria of up to about 1.5×10⁻² μm−1 andbandwidths of about 10 to 55 μm are observed.
The main challenge in diffusion modelling is the reliable estimationof the initial distribution of Sr within each studied crystal. Previouswork has addressed this issue by assuming initial concentration profiles
in extreme chemical disequilibrium, such that the crystal residencetimes derived were considered to be overestimates (Zellmer et al.,1999, 2011a). Superimposed on the data in Fig. 5 are timelines for thechemical equilibration of Sr. In Fig. 5a, these timelines are based onthe initial disequilibrium profile of Zellmer et al. (2011a). In thatstudy, the initial profile was recognized as an extreme overestimatethat could be used to obtain maximum equilibration times. Actual crys-tal residence times were thought to be at least one order of magnitudeshorter. In the present study, the large number of crystals available facil-itates a more reasonable estimation of initial disequilibria. Based on in-dependent evidence that someMORB crystals record residence times ofa few hours only (cf. Table 1; Humler and Whitechurch, 1988; Pan andBatiza, 2002), the initial profile may be tagged to the largestdisequilibria observed in the large set of MORB crystals studied here.This has been done in Fig. 5b. Evidently,most plagioclase crystals recordresidence times of the order of several days to months, with on-axissamples from ridges with intermediate spreading rates spanning theentire range of recorded timescales.
7. Analysis of age clustering
7.1. Functional form of sample residence time distributions and clustering
In the following, we refer to the range and distribution of plagio-clase crystal residence times determined by diffusion modeling as“residence time distributions”. With exception of a single outlier(crystalW-9604-C3-2, yielding a residence time of 1.5 years), residencetime distributions of individual samples are close to lognormal. This isevident when residence times are transformed by taking the natural
9G.F. Zellmer et al. / Lithos 154 (2012) 1–15
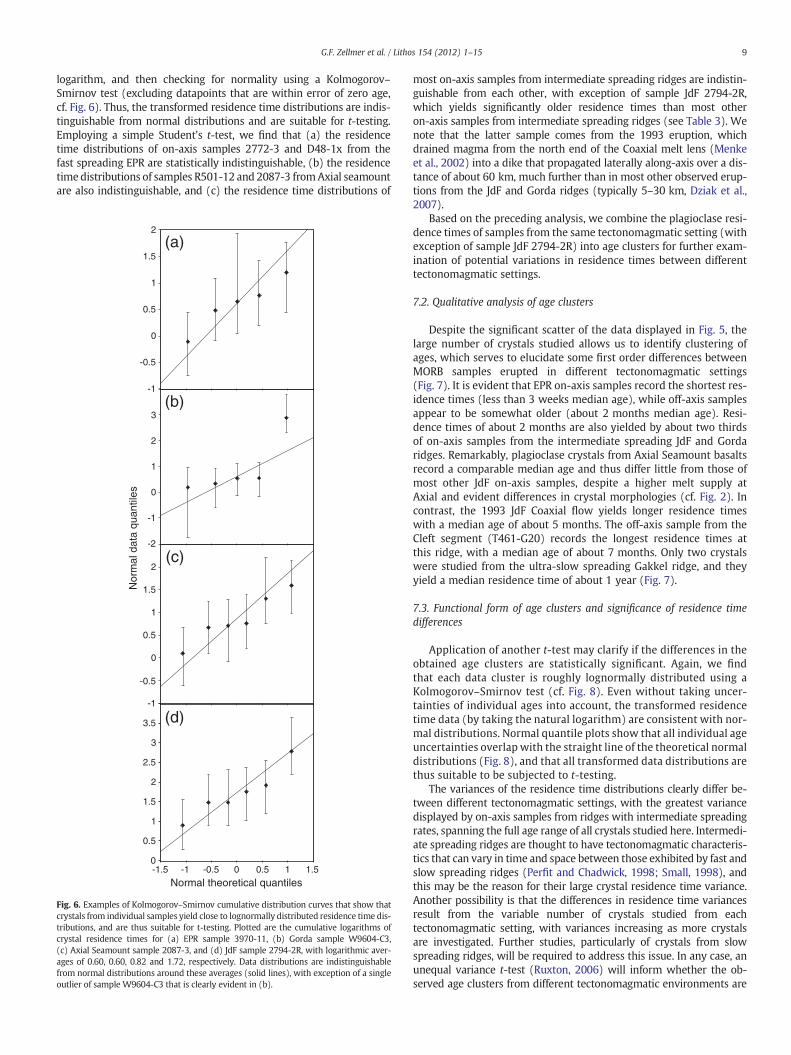
logarithm, and then checking for normality using a Kolmogorov–Smirnov test (excluding datapoints that are within error of zero age,cf. Fig. 6). Thus, the transformed residence time distributions are indis-tinguishable from normal distributions and are suitable for t-testing.Employing a simple Student's t-test, we find that (a) the residencetime distributions of on-axis samples 2772-3 and D48-1x from thefast spreading EPR are statistically indistinguishable, (b) the residencetime distributions of samples R501-12 and 2087-3 fromAxial seamountare also indistinguishable, and (c) the residence time distributions of
(a)
(b)
(c)
Nor
mal
dat
a qu
antil
es
Normal theoretical quantiles
-1
-0.5
0
0.5
1
1.5
2
0
0.5
1
1.5
2
2.5
3
3.5
-1.5 -1 -0.5 0 0.5 1 1.5
-2
-1
0
1
2
3
-1
-0.5
0
0.5
1
1.5
2
(d)
Fig. 6. Examples of Kolmogorov–Smirnov cumulative distribution curves that show thatcrystals from individual samples yield close to lognormally distributed residence time dis-tributions, and are thus suitable for t-testing. Plotted are the cumulative logarithms ofcrystal residence times for (a) EPR sample 3970-11, (b) Gorda sample W9604-C3,(c) Axial Seamount sample 2087-3, and (d) JdF sample 2794-2R, with logarithmic aver-ages of 0.60, 0.60, 0.82 and 1.72, respectively. Data distributions are indistinguishablefrom normal distributions around these averages (solid lines), with exception of a singleoutlier of sample W9604-C3 that is clearly evident in (b).
most on-axis samples from intermediate spreading ridges are indistin-guishable from each other, with exception of sample JdF 2794-2R,which yields significantly older residence times than most otheron-axis samples from intermediate spreading ridges (see Table 3). Wenote that the latter sample comes from the 1993 eruption, whichdrained magma from the north end of the Coaxial melt lens (Menkeet al., 2002) into a dike that propagated laterally along-axis over a dis-tance of about 60 km, much further than in most other observed erup-tions from the JdF and Gorda ridges (typically 5–30 km, Dziak et al.,2007).
Based on the preceding analysis, we combine the plagioclase resi-dence times of samples from the same tectonomagmatic setting (withexception of sample JdF 2794-2R) into age clusters for further exam-ination of potential variations in residence times between differenttectonomagmatic settings.
7.2. Qualitative analysis of age clusters
Despite the significant scatter of the data displayed in Fig. 5, thelarge number of crystals studied allows us to identify clustering ofages, which serves to elucidate some first order differences betweenMORB samples erupted in different tectonomagmatic settings(Fig. 7). It is evident that EPR on-axis samples record the shortest res-idence times (less than 3 weeks median age), while off-axis samplesappear to be somewhat older (about 2 months median age). Resi-dence times of about 2 months are also yielded by about two thirdsof on-axis samples from the intermediate spreading JdF and Gordaridges. Remarkably, plagioclase crystals from Axial Seamount basaltsrecord a comparable median age and thus differ little from those ofmost other JdF on-axis samples, despite a higher melt supply atAxial and evident differences in crystal morphologies (cf. Fig. 2). Incontrast, the 1993 JdF Coaxial flow yields longer residence timeswith a median age of about 5 months. The off-axis sample from theCleft segment (T461-G20) records the longest residence times atthis ridge, with a median age of about 7 months. Only two crystalswere studied from the ultra-slow spreading Gakkel ridge, and theyyield a median residence time of about 1 year (Fig. 7).
7.3. Functional form of age clusters and significance of residence timedifferences
Application of another t-test may clarify if the differences in theobtained age clusters are statistically significant. Again, we findthat each data cluster is roughly lognormally distributed using aKolmogorov–Smirnov test (cf. Fig. 8). Even without taking uncer-tainties of individual ages into account, the transformed residencetime data (by taking the natural logarithm) are consistent with nor-mal distributions. Normal quantile plots show that all individual ageuncertainties overlap with the straight line of the theoretical normaldistributions (Fig. 8), and that all transformed data distributions arethus suitable to be subjected to t-testing.
The variances of the residence time distributions clearly differ be-tween different tectonomagmatic settings, with the greatest variancedisplayed by on-axis samples from ridges with intermediate spreadingrates, spanning the full age range of all crystals studied here. Intermedi-ate spreading ridges are thought to have tectonomagmatic characteris-tics that can vary in time and space between those exhibited by fast andslow spreading ridges (Perfit and Chadwick, 1998; Small, 1998), andthis may be the reason for their large crystal residence time variance.Another possibility is that the differences in residence time variancesresult from the variable number of crystals studied from eachtectonomagmatic setting, with variances increasing as more crystalsare investigated. Further studies, particularly of crystals from slowspreading ridges, will be required to address this issue. In any case, anunequal variance t-test (Ruxton, 2006) will inform whether the ob-served age clusters from different tectonomagmatic environments are

Table 3T-values (top right) and degrees of freedom (bottom left) of Student's t-test, intermediate spreading rates.
Sample 3970-11 T183-G16 T183-G17 JdF 2792-4R T178-G4 W-9604-C3 JdF 2794-2R
3970-11 0.66 1.17 0.22 1.90 2.84 5.84T183-G16 5 0.86 0.26 0.93 0.23 3.80T183-G17 6 3 0.37 1.47 0.83 3.90JdF 2792-4R 6 3 4 0.99 0.43 2.81T178-G4 7 4 5 5 0.57 0.91W-9604-C3 8 5 6 6 7 1.75JdF 2794-2R 9 6 7 7 8 9
Underlined=significant at 95% probability (p=0.05).Italic=significant at 90% probability (p=0.1).
10 G.F. Zellmer et al. / Lithos 154 (2012) 1–15
statistically distinguishable. Table 4 lists t-values and degrees of free-dom for unequal variance t-tests undertaken for individual pairs ofdata clusters. Underlined t-values indicate that the distributions are dis-tinguishable at the 95% confidence limit (p=0.05). The statistical anal-ysis confirms the results of our qualitiative analysis above: EPR on-axiscrystal residence times are significantly shorter than EPR off-axis, inter-mediate spreading rate on-axis, and Axial Seamount residence times,which in turn are significantly shorter than the 1993 Coaxial flow andintermediate spreading rate off-axis crystal residence times. Crystalsfrom the ultra-slow spreading rate Gakkel Ridge have the longestmedi-an residence times, but these are not statistically distinguishable fromthe crystal residence times of intermediate off-axis lavas (cf. Table 4and Fig. 8f).
In summary, the data presented here provide evidence that MORcrystal residence times are linked to (a) spreading rates, with slowerspreading ridges generally yielding longer median crystal residencetimes than faster spreading ridges in magmas erupted on-axis; and(b) local variations in the magma plumbing systems, with samplessourced from the centre of an axial magma chamber (AMC) yieldingshorter residence times than samples sourced from its edge or fromdeeper, isolated melt lenses, which commonly erupt off-axis (Fig. 9).In Table 5, median plagioclase residence times are summarized foreach tectonomagmatic environment and are compared to previouslypublished estimates (cf. Zellmer et al., 2011b). The residence times de-rived here are shorter, because they consider lower, more realistic ini-tial disequilibra (cf. Fig. 5) than the previous work, in which it wasacknowledged that the obtained times represented maxima thatoverestimated actual residence times.
8. Discussion
The majority of plagioclase crystals in on-axis samples from fastspreading ridges and from intermediate spreading ridges yieldresidence times of the order of weeks to several months, similarto the overall duration of many MOR eruption episodes (Rubinet al., 2012, and references therein). Further, such short residencetimes of crystals reaching hundreds of micrometers in size indicategrowth rates of the order of 10−8 cm s−1, consistent with rapidcooling rates of up to 1 °C h−1, such as those calculated to occurin dikes (Cashman, 1993). Zellmer et al. (2011a) therefore
Table 4T-values (top right) and degrees of freedom (bottom left) of unequal variance t-test, comp
Setting Fast on-axis Fast off-axis Intermediate on-axis A
Fast on-axis 2.49 2.92Fast off-axis 6 0.60Intermediate on-axis 8 14Axial seamount 6 9 25Intermediate lateral on-axis 7 8 13 1Intermediate off-axis 5 5 7Ultraslow 3 5 15
Underlined=significant at 95% probability (p=0.05).Italic=significant at 90% probability (p=0.1).
concluded that plagioclase phenocrysts grow mostly during dike in-jection leading up to eruption on the seafloor, and that incorpora-tion of older, xenocrystic material from the gabbroic mush zoneinto MOR magmas, although occasionally observed (Costa et al.,2010; Ridley et al., 2006), may be relatively uncommon. Whileinitial dike propagation is rapid, with propagation rates rangingfrom 0.01 to 10 m s−1 (e.g., Dziak et al., 2007; Rubin, 1995),time-averaged melt ascent rates through the established conduitsare likely significantly lower, considering total emplaced magmavolumes of as little as 10−4 km3 at fast spreading rates (cf. Perfitand Chadwick, 1998), emplaced over periods of weeks to months(e.g., Rubin et al., 1994, 2012). Thus, it should be noted that “crystalgrowth during dike injection” is to be understood sensu latu, in thatgrowth occurs during magma transport in a thermally insulated en-vironment, encompassing melt ascent through the gabbroic mushsection from deeper lying lower crustal melt lenses, ascent througha readily established conduit, and magma transport within an ac-tive flow field during inflation of flow lobes. The observed differ-ences in plagioclase residence times between ridges of variablespreading rates may in part be due to differences in AMC depthbelow the sea floor, and differences in magma transport pathwayssuch as vertical versus lateral dike injections. Seismic imaging sug-gests that AMC depth varies approximately by a factor of 3 (Purdyet al., 1992), from about 1.2 km beneath the EPR, to 2.1–2.7 km be-neath the JdF, and to >3 km beneath slow spreading ridges (cf.Rubin et al., 2009).
Only very few data exist at present on plagioclase residence timesat slow spreading ridges (cf. Table 1). Data from the Mid-Atlanticridge suggests xenocryst residence times of 1–10 years, interpretedto represent the timing between xenocryst entrainment from thecrystal mush and eruption on the sea floor (Costa et al., 2010).There are at present no residence time data on plagioclase pheno-crysts from MOR samples erupted at slow spreading rates. Likewise,no data exist for superfast spreading rates (such as the southernEPR). Further work will be required to elucidate the crystallization pro-cesses operating at these ridges, which in terms of geospeedometricconstraints are undersampled (cf. Fig. 9).
A common origin of MORB plagioclase phenocrysts at fast to inter-mediate (and ultraslow) spreading rates by growth during magma as-cent through the conduit may at first be conterintuitive given the
aring different tectonomagmatic settings.
xial seamount Intermediate lateral on-axis Intermediate off-axis Ultraslow
3.95 5.35 5.87 9.261.52 3.38 4.11 7.590.79 2.69 3.47 6.21
2.24 3.11 6.570 1.01 2.345 6 0.739 5 3

crystal residence time (months)0.03 0.3 3 30
EPRon-axis
EPRoff-axis
JdF and Gordaon-axis
JdF Axialseamount
JdF 1993 Coaxial(60 km lateral diking)
JdFoff-axis
Gakkel
2 w
eeks
1 m
onth
6 m
onth
s
2 ye
ars
Fig. 7. Distribution of crystal residence times from various ridge settings, as derivedfrom Fig. 5b. Median ages for each setting are indicated by the vertical lines. See textfor discussion.
(a) (b)
Nor
mal
dat
a qu
antil
es
Normal theoretical quantiles
-2
-1
0
1
2
3
-2.5
-2
-1.5
-1
-0.5
0
0.5
1
-1
-0.5
0
0.5
1
1.5
2
-1
-0.5
0
0.5
1
1.5
2
2.5
0
0.5
1
1.5
2
2.5
3
3.5
-2 -1 0 10.5
1
1.5
2
2.5
3
3.5
-2 -1 0 1 2
(c) (d)
(e) (f)
Fig. 8. Kolmogorov–Smirnov cumulative distribution curves that show that crystalsfrom different tectonomagmatic settings yield close to lognormally distributed resi-dence time distributions, and are thus suitable for t-testing. Plotted are the cumulativelogarithms of crystal residence times (in months) for (a) on-axis samples of fastspreading ridges, (b) off-axis samples from fast spreading ridges, (c) on-axis samplesfrom intermediate spreading ridges, (d) Axial Seamount samples, (e) the samplefrom the 1993 eruption of the Juan-de-Fuca ridge, and (f) off-axis samples from inter-mediate ridges combined with the ultra-slow spreading Gakkel ridge samples. Thesesettings record logarithmic averages of −0.24, 0.60, 0.79, 1.02, 1.72 and 2.20, respec-tively. Data distributions are indistinguishable from normal distributions aroundthese averages (solid lines).
11G.F. Zellmer et al. / Lithos 154 (2012) 1–15
highly variable crystal morphologies displayed in Fig. 2. Sector-zonedlaths are indicative of rapid cooling rates of >1 °C per hour (Smithand Lofgren, 1982) and thus consistent with growth during dike injec-tion. Concentrically zoned laths and euhedral tabular forms (Fig. 2a–c)are also easily reconcilablewith growthduringmagmaascent,with var-iations in crystal chemistry due tomelt heterogeneities within the con-duit (Zellmer et al., 2011a). The apparent lack of significant plagioclasecrystal growth in the AMC has been attributed to very short AMC resi-dence times of originally aphyric magmas that are aggregated fromsmall, sill-shaped melt lenses at the onset of eruption (Zellmer et al.,2011a). In this context, plagioclase megacrysts (e.g. Fig. 2h, i) are
thought to be formed by synneusis within the ascending magma(Zellmer et al., 2011a), a process clearly evident in Fig. 2h. More com-plex patterns, which are observed in a few samples and involve one orseveral resorption events, appear to be an exception, but they aremore difficult to explain as part of an individualmelt ascent episode. In-stead, in these cases plagioclase crystals likely began to grow in a crustalmagma reservoir (e.g. the AMC) prior to eruption. In the following, wediscuss the crystal residence time and zoning results of samples studiedhere in some more detail.
8.1. On-axis MOR samples from the fast spreading East Pacific Rise
For on-axis EPR samples, short plagioclase residence times of a fewweeks contrast with typically longer, previously reported averageolivine residence times of about 2 to 3 months, which have beenmodeled to represent growth within the AMC during temporarymagma storage (Pan and Batiza, 2002, cf. Table 1). If mafic melts(>8 wt.% MgO) enter the AMC, they will have olivine on the liquidus,and olivine growth therefore begins during early stages of coolingwith-in the AMC. Onset of plagioclase crystallization is in part a function ofmagmatic water content, which for on-axis samples of the EPR at 9–

Table 5Calculated timescales for plagioclase equilibration and residence in MOR basaltic melts.
Setting Zellmer et al. (2011) equilibration timeoverestimate (months)
Residence timeoverestimateusing initial of Zellmer et al., 2011 (months)
Residence time using best initial from this study (months)
Fast on-axis – 2.0 0.6Fast off-axis – 3.0 1.9Intermediate on-axis 10 4.0 1.7Axial seamount – 5.2 2.2Intermediate lateralon-axis
13 10 5.1
Intermediate off-axis – 15 7.3Ultraslow 88 19 11
12 G.F. Zellmer et al. / Lithos 154 (2012) 1–15
10°N is up to about 0.2 wt.% (le Roux et al., 2006). MELTS and Petrologcrystallization models suggest that such melts will have to cool by 10–40 °C below their liquidus before plagioclase begins to form. With me-dian ages for olivine and plagioclase crystals of 64 and 17 days, respec-tively (Pan and Batiza, 2002, and this study), the AMC would thus haveto experience a rapid cooling rate of the order of 0.5 °C per day for pla-gioclase phenocryst growth to occur prior to melt extraction from theAMC. Such a scenario appears unlikely given (a) the scarcity of olivinephenocrysts in our sample, and (b) the small change in lava composi-tion and thus inferred temperature between the 1991 and 2005 erup-tions, which suggests recharging of the melt lens over decadal timescales (Goss et al., 2010). We conclude that few if any plagioclase crys-tals grow prior to melt extraction through a conduit at the onset oferuption. This analysis corroborates previous data that indicated plagio-clase phenocryst formation during dike emplacement (Zellmer et al.,2011a), extends this result to the fast spreading EPR, and is consistentwith the simple concentric or sector zoning patters displayed by allEPR plagioclase crystals. An exception is the presence of some (general-ly quite small) highly calcic crystal cores that can be attributed to bexenocrystic and have likely been remobilized from the gabbroic mushzone in oceanic layer 3 (e.g. Fig. 2b).
8.2. On-axis MOR samples from ridges with intermediate spreading rates
With the exception of the 1993 Coaxial flow, plagioclase crystalsfrom on-axis segments of the JdF and Gorda ridges yield a median
0.3
3
30
0 2 4 6 8 10 12
on-axis
distant lateral
and off-axis
?
full spreading rate (cm yr-1)
plag
iocl
ase
resi
denc
e tim
e (m
onth
s)
ultraslow slow intermediate fast superfast
14
Fig. 9. Plagioclase crystal residence time averages and standard deviations as a functionof spreading rate. Intermediate spreading rates slightly offset from each other for clar-ity. Note the systematic shift to longer residence times for off-axis lavas and far lateraldike propagation. Transitions between ultraslow, slow, intermediate, fast and superfastare approximate (e.g., Dick et al., 2003). There is at present no data available at slowand superfast spreading rates, which should be targeted by future studies. See textfor discussion.
age of 53 days. Again, most crystals are euhedral and show relativelysimple zoning textures, consistent with growth in the conduit. Longerresidence times than obtained from the fast spreading EPR may thusbe largely attributable to longer magma ascent times as a conse-quence of being sourced from deeper melt lenses at intermediatespreading ridges (2.1–2.7 km beneath the JdF compared to about1.2 km beneath the EPR) and long lateral diking distances from themelt lens to the eruption site, which are common at intermediatespreading rate ridges (Dziak et al., 2007). However, sampleT178-G4, a basaltic andesite from the southern Cleft segment,shows some complex plagioclase growth zones that indicate inter-mittent crystal resorption. This sample is evolved enough (4.9 wt.%MgO) to have had a prolonged AMC history, with some plagioclasecrystallization starting within the AMC shortly (days to weeks) priorto eruption. Erupted from the edge of the axial valley along the faultbounded walls rather than the axial summit trough, this basaltic an-desite may have been sourced from the edge of the cooling axialmelt lens. Its eruption may have been triggered by influx of newmelt into the reservoir, leading to magma mixing and partial resorp-tion and overgrowth of a preexisting crystal load (cf. Wanless et al.,2010).
Interestingly, samples from Axial Seamount, a ridge-centered sea-mount that lies in the middle of the Axial segment of the JdF ridge,yield similar residence times to most other normal sections of theJdF ridge. This is true even for sample R501-12, which carries com-plexly zoned megacrysts of plagioclase that show clear evidence ofhaving formed by synneusis of smaller crystals that served as buildingblocks. Comparing EPMA maps and disequilibrium profiles of individ-ual megacrysts in detail (Fig. S10), it is apparent that few localdisequilibria separate large sections (some several hundred micronsacross) that are in chemical equilibrium. Some of those disequilibriamark the boundaries between the building blocks of smaller crystalsand their megacrystic overgrowth (e.g., at ~350 μm and ~800 μm incrystal R501-12-2P2). Using seismic evidence, West et al. (2001)has argued for the presence of a large (250 km3), long-lived mushzone beneath Axial volcano, with up to about 25% porosity at about2.5 km below the sea floor, consistent with increased melt supply tothis ridge segment. The combined evidence of complex plagioclasemorphology formed by synneusis of older, smaller crystals, andshort megacryst residence times, indicates that plagioclase crystalli-zation occurred during rapid melt ascent through this subvolcanicmush zone, with incorporation of small crystals from the mushresulting in the formation of megacrysts. Our geospeedometric datatherefore show that while the building blocks of the plagioclasemegacrysts may be somewhat older, the formation of megacrysts oc-curred very recently. This suggests that the rates of melt accumula-tion into an ephemeral eruptible melt lens, followed by melttransfer to the surface, are independent of the melt supply rate fromthe mantle.
Plagioclase crystals of the 1993 flow from the JdF Coaxial segment,just northeast of Axial Seamount, yield residence times of severalmonths, about 3 times longer than most on-axis samples from

13G.F. Zellmer et al. / Lithos 154 (2012) 1–15
intermediate spreading centers. However, crystals show relativelysimple zoning patterns similar to other samples erupted at intermedi-ate spreading rates. The 1993 flow is more evolved (in terms of SiO2,cf. Table 2) than the 1982–91 flow erupted adjacent to it, and hasbeen associated with a laterally propagating dyke, which travelledover an unusually long distance (ca. 60 km), compared to typical lat-eral propagation distances at intermediate spreading ridges of 5–30 km (cf. Dziak et al., 2007). Growth zones of plagioclase crystalsfrom the 1993 eruption in local equilibrium are not uncommon (cf.Fig. S3 of Zellmer et al., 2011a), and local disequilibria are typicallyless pronounced than in crystals from other JdF eruption products(Fig. 5). The simplest interpretation of these data in the context ofthe 1993 diking event would be plagioclase growth during prolongedalong-axis magma transfer from the northern end of the Coaxial meltlens to the distal eruption site 60 km to the north, although we can-not preclude that some crystal growth began in a somewhat more dif-ferentiated edge region of the AMC.
8.3. Off-axis MOR samples
The off-axis samples studied here yield consistently longer aver-age plagioclase residence times than samples recovered on-axis, byseveral weeks for the fast spreading EPR, and by several months forthe intermediate spreading JdF ridge (Fig. 7). For the EPR, where pla-gioclase crystals are euhedral and show simple textures in both on-and off-axis samples, longer off-axis residence times are consistentwith slower vertical transport of magma away from the axis as in-ferred from geochemical magma-vapour equilibrium considerations(le Roux et al., 2006). In contrast, the prominent and multiple resorp-tion textures characterizing the plagioclase crystals of the JdF off-axissample we studied (cf Fig. 2f) are indicative of an extended growthhistory in an open system characterized by highly variable tempera-tures, e.g. due to repeated recharge heating. The key to understandinglonger residence times of off-axis magmas lies in the identification ofthe source of these melts. At intermediate spreading rates, the occa-sional formation of relatively young pillow mounds and small maficseamounts several kilometers away from the ridge has been attribut-ed to the eruption of isolated, deep off-axis melt lenses such as thoseseismically imaged at a depth of 5 to 6 km several kilometers fromthe axis of the Cleft segment on the JdF Ridge (Canales et al., 2009).If mafic off-axis basalts, such as the Cleft seamount sample studiedhere, are indeed sourced from such lower crustal melt lenses, theirlonger plagioclase residence times are likely linked to significant crys-tal growth and residence within slowly cooling, thermally insulated,open-system off-axis reservoirs, rather than being solely attributableto slower melt ascent rates through a thicker crustal section awayfrom the actively spreading part of the ridge.
8.4. MOR samples from ultraslow-spreading ridges
We have too few data to provide reliable insights into magma stor-age and ascent processes at slower spreading ridges, but our two datafrom sample D27-16 from the ultraslow-spreading Gakkel ridge bothyield a residence time of about 1 year, following the overall trend tolonger plagioclase residence times as spreading rate decreases. Thelarge crystals of this sample have been interpreted to have formed bysynneusis of plagioclase phenocrysts that grewwithin the conduit dur-ing melt ascent (Zellmer et al., 2011a). While it cannot be precludedthat some of these crystals may have started to grow within a deep,short-lived, mafic AMC, their residence times clearly indicate that theyare phenocrysts that formed several months prior to eruption, ratherthan xenocrysts sourced from decade to century old mush zones. How-ever, as is the case for slow spreading ridges, further work will be re-quired on samples erupted at ultraslow spreading rates in order toelucidate the range of crystal growth processes operating in this setting.
8.5. Outstanding issues and future work
Fig. 9 serves well in showing the suggested dependence of plagio-clase crystal residence time on spreading rate, while pointing out theimportance of other parameters such as the effects of melt ascentthrough on- versus off-axis conduits, and great lateral melt injectiondistances that may prolong crystal residence times duringmelt transferfrom the gabbroic zone to the site of eruption. However, the figure alsoclearly shows that a significant range of spreading rates in the slow andsuperfast regime have not yet been investigated, and that our knowl-edge of the processes controlling plagioclase growth and residence dur-ing magma transfer from source to surface is still quite preliminary.Future work will have to target on- and off-axis samples from slowand superfast spreading ridges to improve our understanding ofmagma ascent and crystallization processes at the global MOR system.One key issue will be sampling statistics: the present review has clearlyshown the limitations of dealing with small sample sets. Future prog-ress will likely depend on the availability of geospeedometric datafrom larger number of crystals and a greater set of MOR lavas. Finally,a larger number of samples will need to be studied to address potentialrelationships between flow morphologies (pillow, lobate, or sheetflows), which have been linked to effusion rates, and plagioclase crystalresidence times, which typically reflect magma transfer times fromsource to surface, as we have argued here. A priori, rapid effusion rateswould imply short transfer times, implying that sheet flows may yieldthe shortest residence times and pillow mounds the longest. However,our analysis has shown that this relationship is not as clear cut as onemight think: although the Gakkel ridge sample and the off-axis flowsstudied in this paper are all pillow lavas, consistent with long magmatransfer times, the EPR-on axis samples with the shortest residencetimes are lobate flows, not sheet flows, and the intermediate spreadingJdF Cleft segment produces both pillow and sheet flows hosting crystalswith essentially indistinguishable residence times. Clearly, local effu-sion rates are a function not only of magma ascent rate, but may be af-fected by other parameters, e.g. differences between conduit width atthe site of eruption and at depth. Further work on morphologicallywell-characterized lavas will be required to further elucidate this issue.
9. Conclusions
• MOR basalts are typically aphyric to sparsely phyric, with about 60%of all samples having less than 5% crystals. This suggests that manyMORB magmas traverse the lower crust as virtually crystal-freemelts.
• Residence times of olivine and plagioclase phenocrysts and xenocrystsin their host basaltic melt have been reported in the literature andrange from a few hours to several years. For the relatively large set ofsamples we studied, xenocrystic calcic plagioclase cores are small(typicallyb50 μmin size) or absent, suggesting thatmostMORBplagio-clase crystals are phenocrystic.
• Short plagioclase residence with a median age of less than 3 weeks inEPR samples erupted on-axis corroborates previous work, whichsuggested that plagioclase residence times decrease with increasingspreading rates. This is consistent with the bulk of plagioclase crystal-lization occurring during melt ascent from an AMC, the depth ofwhich decreases with increasing spreading rates. In contrast, olivinephenocrysts may begin to grow (and fractionate) earlier, duringpre-eruptive magma storage.
• Plagioclase crystals in the off-axis lavas we studied yield longer resi-dence times than those in on-axis lavas from the same ridge segment.This is consistent with longer melt ascent timescales, but may also bedue to some crystal growth occurring in deep, thermally bufferedlower crustal melt lenses tapped by off-axis eruptions. Further workwill be required to assess if these systematics are general features,or specific to the samples we investigated. Judging from similar pla-gioclase residence times in the two studied JdF Axial Seamount

14 G.F. Zellmer et al. / Lithos 154 (2012) 1–15
lavas compared to most other on-axis lavas erupted at intermediatespreading centers, crustal magma ascent rates may be independentof the melt supply rate from the mantle. Again, additional samplesneed to be investigated to assess the reliability of this result, as it isunclear whether the samples investigated represent the full rangeof extant melt supply or storage conditions at this ridge segment.
• The range of plagioclase crystal residence times obtained from indi-vidual MORB samples highlights the need to study a relatively largenumber of crystals to obtain statistically reliable results on magmatransfer timescales. In the future, even larger sets of samples from in-dividual eruption sites will need to be studied to developmore robustconclusions.
• At present, our understanding of crystal growth and residence in MORlavas is still quite limited, and further work will be required to extendour knowledge to the slow and superfast spreading regimes. Neverthe-less, this contribution shows the great potential of geospeedometricdating in constraining some of the processes operating at the onset ofMOR eruptive activity.Supplementary data to this article can be found online at http://
dx.doi.org/10.1016/j.lithos.2012.07.019.
Acknowledgements
GFZ is grateful to Joerg Erzinger for his continued hospitality at theGeoForschungZentrum Potsdam. The NOAA Undersea Research Pro-gram and the National Science Foundation provided generous sup-port for the cruises and dives. We are grateful to the science partieswho collected the samples and provided their geological context.We thank Greg Shellnutt for discussions and Ya-Ting Hsu for techni-cal assistance during electron microprobe work. Constructive reviewsof Laurence Coogan, Ken Rubin and an anonymous reviewer im-proved earlier versions of this script. We also thank Andrew Kerr forefficient editorial handling. This research was funded by grants of theNational Science Council of Taiwan (NSC 99-2116-M-001-010 and100-2116-M-001-007 to GFZ, and 99-2116-M-001-013 to YI), and bypartial support from NSF grants OCE-0221541, OCE-138088 andOCE-9530299 to MRP.
References
Almeev, R., Holtz, F., Koepke, J., Haase, K., Devey, C., 2008. Depths of partial crystalliza-tion of H2O-bearing MORB: phase equilibria simulations of basalts at the MAR nearAscension Island (7-11°S). Journal of Petrology 49, 25–45.
Bindeman, I.N., Davis, A.M., Drake, M.J., 1998. Ion microprobe study of plagioclase-basalt partition experiments at natural concentration levels of trace elements.Geochimica et Cosmochimica Acta 62, 1175–1193.
Blundy, J.D., Wood, B.J., 1991. Crystal-chemical controls on the partitioning of Sr and Babetween plagioclase feldspar, silicate melts, and hydrothermal solutions. Geochimicaet Cosmochimica Acta 55, 193–209.
Canales, J.P., Nedimovic, M.R., Kent, G.M., Carbotte, S.M., Detrick, R.S., 2009. Seismic re-flection images of a near-axis melt sill within the lower crust at the Juan de Fucaridge. Nature 460, 89–94.
Cashman, K.V., 1993. Relationship between plagioclase crystallization and cooling ratein basaltic melts. Contributions to Mineralogy and Petrology 113, 126–142.
Chadwick, D.J., Perfit, M.R., Ridley, W.I., Jonassan, I.R., Kamenov, G., Chadwick, W.W.,Embley, R., le Roux, P.J., Smith, M.C., 2005. Magmatic effects of the Cobb hotspoton the Juan de Fuca ridge. Journal of Geophysical Research 110, B03101.
Cherniak, D.J., Watson, E.B., 1994. A study of strontium diffusion in plagioclase usingRutherford backscattering spectroscopy. Geochimica et Cosmochimica Acta 58,5179–5190.
Coogan, L.A., 2007. The lower oceanic crust. In: Rudnick, R.L. (Ed.), The crust. Elsevier,Amsterdam, pp. 1–45.
Costa, F., Chakraborty, S., Dohmen, R., 2003. Diffusion coupling between trace andmajor elements and a model for calculation of magma residence times using pla-gioclase. Geochimica et Cosmochimica Acta 67, 2189–2200.
Costa, F., Coogan, L.A., Chakraborty, S., 2010. The time scales of mixing and mingling in-volving primitive melts and melt-mush interaction at Mid-Ocean Ridges. Contribu-tions to Mineralogy and Petrology 159, 371–387.
Danyushevsky, L.V., Sokolov, S., Falloon, T.J., 2002. Melt inclusions in olivine pheno-crysts: using diffusive re-equilibriation to determine the cooling history of a crys-tal, with implications for the origin of olivine-phyric volcanic rocks. Journal ofPetrology 43, 1651–1671.
Dick, H.J.B., Lin, J., Schouten, H., 2003. An ultraslow-spreading class of ocean ridge. Nature426, 405–412.
Dziak, R.P., Bohnenstiehl, D.R., Cowen, J.P., Baker, E.T., Rubin, K.H., Haxel, J.H., Fowler,M.J., 2007. Rapid dike emplacement leads to eruptions and hydrothermal plumerelease during seafl oor spreading events. Geology 35, 579–582.
Embley, R.W., Chadwick Jr., W.W., Jonasson, I.R., Butterfield, D.A., Baker, E.T., 1995. Ini-tial results of the rapid response to the 1993 CoAxial event: relationships betweenhydrothermal and volcanic processes. Geophysical Research Letters 22, 143–146.
Embley, R.W., Chadwick Jr., W.W., Perfit, M.R., Smith, M.C., Delaney, P., 2000. Recenteruptions on the CoAxial segment of the Juan de Fuca Ridge: implications formid-ocean ridge accretion processes. Journal of Geophysical Research 105,16501–16525.
Escartín, J., Soule, S.A., Fornari, D.J., Tivey, A., Schouten, H., Perfit, M.R., 2007. Interplaybetween faults and lava flows in the construction of the upper oceanic crust: theEast Pacific Rise crest 9°25′–9°58′N. Geochemistry, Geophysics, Geosystems 8,Q06005.
Fink, J.H., Griffiths, R.W., 1992. A laboratory analog study of the surface morphology oflava flows extruded from point and line sources. Journal of Volcanology and Geo-thermal Research 54, 19–32.
Ghiorso, M.S., Sack, R.O., 1995. Chemical mass transfer in magmatic processes IV. A re-vised and internally consistent thermodynamic model for the interpolation andextrapolation of liquid-solid equilibria in magmatic systems at elevated tempera-tures and pressures. Contributions to Mineralogy and Petrology 119, 197–212.
Giletti, B.J., Casserly, J.E.D., 1994. Strontium diffusion kinetics in plagioclase feldspars.Geochimica et Cosmochimica Acta 58, 3785–3793.
Goss, A.R., Perfit, M.R., Ridley, W.I., Rubin, K.H., Kamenov, G.D., Soule, S.A., Fundis, A.,Fornari, D.J., 2010. Geochemistry of lavas from the 2005–2006 eruption at theEast Pacific Rise, 9°46′N–9°56′N: Implications for ridge crest plumbing and decadalchanges in magma chamber compositions. Geochemistry, Geophysics, Geosystems11 (Q05T09).
Gregg, T.K.P., Fink, J.H., 1995. Quantification of submarine lava-flow morphologythrough analog experiments. Geology 23, 73–76.
Gregg, T.K.P., Smith, D.K., 2003. Volcanic investigations of the Puna Ridge, Hawaii: re-lations of lava flow morphologies and underlying slopes. Journal of Volcanologyand Geothermal Research 126, 63–77.
Hinds, J., 2005. Construction of the Oceanic Crustal Layer 2A: A Detailed Petrographicand Geochemical Study of Lavas from 9°30' N and 9°50' N East Pacific Rise. MS The-sis, University of Florida.
Humler, E., Whitechurch, H., 1988. Petrology of basalts from the Central Indian Ridge(lat. 25°23′S, long. 70°04′E): estimates of frequencies and fractional volumes ofmagma injections in a two-layered reservoir. Earth and Planetary Science Letters88, 169–181.
le Roux, P.J., Shirey, S.B., Hauri, E.H., Perfit, M.R., Bender, J.F., 2006. The effects of vari-able sources, processes and contaminants on the composition of northern EPRMORB (8–10°N and 12–14°N): evidence from volatiles (H2O, CO2, S) and halogens(F, Cl). Earth and Planetary Science Letters 251, 209–231.
Menke, W., West, M., Tolstoy, M., 2002. Shallow-crustal magma chamber beneath theaxial high of the Coaxial segment of Juan de Fuca Ridge at the source site of the1993 eruption. Geology 2002, 359–362.
Michael, P.J., Langmuir, C.H., Dick, H.J.B., Snow, J.E., Goldstein, S.L., Graham, D.W.,Lehnert, K., Kurras, G., Jokat, W., Mühe, R., Edmonds, H.N., 2003. Magmatic andamagmatic seafloor generation at the ultraslow-spreading Gakkel ridge, ArcticOcean. Nature 423, 956–961.
Morse, S.A., 1984. Cation diffusion in plagioclase feldspar. Science 225, 504–505.Nabelek, P.I., Langmuir, C.H., 1986. The significance of unusual zoning in olivines from
FAMOUS area basalt 527-1-1. Contributions to Mineralogy and Petrology 93, 1–8.Pan, Y., Batiza, R., 2002. Mid-ocean ridge magma chamber processes: constraints from
olivine zonation in lavas from the East Pacific Rise at 9°30′N and 10°30′N. Journalof Geophysical Research 107 (ECV 9).
Perfit, M.R., Chadwick Jr., W.W., 1998. Magmatism at mid-ocean ridges: constraints fromvolcanological and geochemical investigations. GeophysicalMonograph 106, 59–115.
Purdy, G.M., Kong, L.S.L., Christeson, G.L., Solomon, S.C., 1992. Relationship betweenspreading rate and the seismic structure of mid-ocean ridges. Nature 355, 815–817.
Ridley,W.I., Perfit, M.R., Smith, M.C., Fornari, D.J., 2006. Magmatic processes in developingoceanic crust revealed in a cumulate xenolith collected at the East Pacific Rise, 9°50′N. Geochemistry, Geophysics, Geosystems 7 (Q12O04).
Rubin, A.M., 1995. Propagation of magma-filled cracks. Annual Review of Earth andPlanetary Sciences 23, 287–336.
Rubin, K.H., Macdougall, J.D., 1988. 226Ra excesses in mid-ocean-ridge basalts and man-tle melting. Nature 335, 158–161.
Rubin, K.H., Sinton, J.M., 2007. Inferences on mid-ocean ridge thermal and magmaticstructure from MORB compositions. Earth and Planetary Science Letters 260,257–276.
Rubin, K.H., Macdougall, J.D., Perfit, M.R., 1994. 210Po-210Pb dating of recent volcaniceruptions on the sea floor. Nature 368, 841–844.
Rubin, K.H., Smith, M.C., Perfit, M.R., Christie, D.M., Sacks, L.F., 1998. Geochronology andgeochemistry of lavas from the 1996 North Gorda Ridge eruption. Deep-Sea Re-search II 45, 2571–2597.
Rubin, K.H., van der Zander, I., Smith, M.C., Bergmanis, E.C., 2005. Minimum speed limitfor ocean ridge magmatism from 210Pb-226Ra-230Th disequilibria. Nature 437,534–538.
Rubin, K.H., Sinton, J.M., Maclennan, J., Hellebrandt, E., 2009. Magmatic filtering ofmantle composition at mid-ocean ridge volcanoes. Nature Geosciences 2, 321–328.
Rubin, K.H., Soule, S.A., Chadwick Jr., W.W., Fornari, D.J., Clague, D.A., Embley, R.W.,Baker, E.T., Perfit, M.R., Caress, D.W., Dziak, R.P., 2012. Volcanic eruptions in thedeep sea. Oceanography 25, 142–157.

15G.F. Zellmer et al. / Lithos 154 (2012) 1–15
Ruxton, G.D., 2006. The unequal variance t-test is an underused alternative to Student'st-test and the Mann-Whitney U test. Behavioral Ecology 17, 688–690.
Schouten, H., Tivey, M., Fornari, D.J., Seyfried, W., Ship Board Science and TechnicalTeams, 2004. Central anomaly magnetic high and volcanic processes on fast-spreading mid-ocean ridges. Cruise Report R/V Atlantis Voyage 11 Leg 7, 1/26-22/24/2004.
Sims, K.W.W., Goldstein, S.J., Blichert-Toft, J., Perfit, M.R., Kelemen, P., Fornari, D.J.,Michael, P., Murrell, M.T., Hart, S.R., DePaolo, D.J., Layne, G., Ball, L., Jull, M.,Bender, J., 2002. Chemical and isotopic constraints on the generation and transportof magma beneath the East Pacific Rise. Geochimica et Cosmochimica Acta 66,3481–3504.
Sims, K.W.W., Blichert-Toft, J., Fornari, D.J., Perfit, M.R., Goldstein, S.J., Johnson, P.,DePaolo, D.J., Hart, S.R., Murrell, M.T., Michael, P.J., Layne, G.D., Ball, L.A., 2003. Ab-errant Youth: chemical and isotopic constraints on the young off-axis lavas of theEast Pacific Rise. Geochemistry, Geophysics, Geosystems 4, 8621.
Small, C., 1998. Global systematics of mid-ocean ridge morphology. Geophysical Mono-graph 106, 1–25.
Smith, M.C., 1999. Geochemistry of Eastern Pacific MORB: Implications for MORB Pet-rogenesis and the Nature of Crustal Accretion Within the Neovolcanic Zone ofTwo Recently Active Ridge Segments. University of Florida, Gainsville, FL, p. 164.
Smith, P.M., Asimow, P.D., 2005. Adiabat_1ph: a new public front-end to the MELTS,pMELTS, and pHMELTS models. Geochemistry, Geophysics, Geosystems 6, Q02004.
Smith, R.K., Lofgren, G.E., 1982. An analytical and experimental study of zoning in pla-gioclase. Lithos 16, 153–168.
Soule, S.A., Fornari, D.J., Perfit, M.R., Tivey, M.A., Ridley, W.I., Schouten, H., 2005. Chan-nelized lava flows at the East Pacific Rise crest 9–10° N: the importance of off-axislava transport in developing the architecture of young oceanic crust. Geochemis-try, Geophysics, Geosystems 6, Q08005.
Soule, S.A., Nakata, D.S., Fornari, D.J., Fundis, A.T., Perfit, M.R., Kurz, M.D., 2012. CO2 var-iability in mid-ocean ridge basalts from syn-emplacement degassing: constraintson eruption dynamics. Earth and Planetary Science Letters 327–328, 39–49.
Stakes, D.S., Perfit, M.R., Tivey, M.A., Caress, D.W., Ramires, T.M., Maher, N., 2006. Thecleft revealed: geologic, magnetic, and morphologic evidence for construction ofupper oceanic crust along the southern Juan de Fuca Ridge. Geochemistry, Geo-physics, Geosystems 7, Q04003.
Wanless, V.D., Perfit, M.R., Ridley, W.I., Klein, E., 2010. Dacite petrogenesis on mid-ocean ridges: evidence for oceanic crustal melting and assimilation. Journal ofPetrology 51, 2377–2410.
West, M., Menke, W., Tolstoy, M., Webb, S., Sohn, R., 2001. Magma storage beneathaxial volcano on the Juan de Fuca mid-ocean ridge. Nature 413, 833–836.
Zellmer, G.F., Clavero, J., 2006. Using trace element correlation patterns to decipher asanidine crystal growth chronology: an example from Taapaca volcano, CentralAndes. Journal of Volcanology and Geothermal Research 156, 291–301.
Zellmer, G.F., Blake, S., Vance, D., Hawkesworth, C., Turner, S., 1999. Plagioclase resi-dence times at two island arc volcanoes (Kameni islands, Santorini, and Soufriere,St. Vincent) determined by Sr diffusion systematics. Contributions to Mineralogyand Petrology 136, 345–357.
Zellmer, G.F., Sparks, R.S.J., Hawkesworth, C.J., Wiedenbeck, M., 2003. Magma emplace-ment and remobilization timescales beneath Montserrat: insights from Sr and Bazonation in plagioclase phenocrysts. Journal of Petrology 44, 1413–1431.
Zellmer, G.F., Rubin, K.H., Dulski, P., Iizuka, Y., Goldstein, S.L., Perfit, M.R., 2011a. Crystalgrowth during dike injection of MOR basaltic melts: evidence from preservation oflocal Sr disequilibria in plagioclase. Contributions to Mineralogy and Petrology 161,153–173.
Zellmer, G.F., Rubin, K.H., Dulski, P., Iizuka, Y., Goldstein, S.L., Perfit, M.R., 2011b. Erratum to:Crystal growth during dike injection of MOR basaltic melts: evidence from preservationof local Sr disequilibria in plagioclase. Contributions to Mineralogy and Petrology 161,175–176.
Zellmer, G.F., Dulski, P., Iizuka, Y., 2012. Combined major and trace element LA-ICP-MSanalysis of compositional variations in simple solid solutions through cross-correlation with an EPMA-characterized working standard. Microscopy and Micro-analysis 18, 852–859.