Chlorine Solutions for a Safe Method of Decontamination of ...
Gmchimico et Cowmchimica Acla Vol. 58, pp. 113-123 Copyright 0 1994 Elsevier Science Ltd. Printed in U.S.A.
0016-7037/94/$6.00 + .iN
Diffusion of chlorine in granitic melts
T. B. BAI* and A. F. KOSTER VAN GROOS
Department of Geological Sciences, University of Illinois at Chicago, Chicago, IL 60680, USA
(Received December 23, 1992; accepted in revisedform July 2, 1993)
Abstract-The chemical diffusivity ofC1 in granitic and haplogranitic melts was determined as a function of temperature (650-14OO”C), pressure ( 1 bar-46 kbar), Hz0 content, and NaCl concentration. Three series of experiments were made: ( 1) high tern~mtu~ runs at 1 atm with a NaCl liquid, (2) runs at pressures to 2 kbar with a pure NaCl liquid or NaCl-rich brine, and (3) HzO-rich runs with NaCI/HCl solutions at pressures to 4.6 kbar. Chlorine concentrations were determined by electron microprobe. Chlorine diffusion follows the Arrhenius equation in both high temperature (log (D) = -4.5-45021 T (K)) and HzO-rich runs containing 10 wt% NaCl solution at 2 kbar (log (D) = -2.19-5780/T(K)). The pressure effect at 850°C is moderate for both NaCl-rich (log (I)) = -8.487-0.125P) and HzO-rich runs (log (I?) = -7.26-O. 103P). Dc, is related to the concentration of NaCl in the initial solutions for HzO-rich runs. At 850°C and 2 kbar, Da ranges from log (D) = -7.24 (5.8 wt% NaCl solution) to log (D) = -7.59 (20 wt% NaCl solution), where D is in cm2fs. DC, in runs with a 10 wt% HCI solution is several times higher than with a 10 wt% NaCl solution at the same PTconditions. Furthermore, at higher concentration of NaCl, Da is lower. It was found that in the NaCl-rich series DC, increases very sharply with the addition of Hz0 to the glass to 2-3 wt%, further addition of H20 has a significantly smaller effect. This difference is interpreted as a result of the change in the melt structure. The relationship of Dc, and viscosity does not follow the Eyring equation in the high temperature runs. The results of this study, combined with other investi~tions suggest that diffusion rates of volatiles decrease as: C02>H20>Cl>F. This indicates that during magma evolution differentiation of the volatile constituents may occur.
I~RODU~ON
ALTHOUGH ELEMENT DIFFUSION coefficients in melt are small enough that large scale transport in igneous bodies cannot be explained by diffusion ( HOFMANN, 1980), the role of dif- fusion is important in local processes involving crystal growth, formation of oscillatory zoning of mineral& element parti- tioning, etc. Recent studies (WATSON, 1979,198 1; HARRISON and WATSON, 1983; BAKER, 1991; etc.) show that element diffusion coefficients increase rapidly with the addition of Hz0 to the melt, implying that element differentiation through diffusion becomes much more effective during the evolution of hydrous magma. In addition to H20, other vol- atiles, such as Cl, F, or CO*, are ~tentially important in magma evolution and element differentiation ( BURNHAM, 1979), particularly for trace elements and ore-forming ele- ments ( EUGSTER, 1985, 1986). At this time, however, there are only a few studies (WATSON et al., 1982; HARRISON and WATSON, 1983; DINGWELL and SCARFE, 1984, 1985; WAT- SON, 199 1) on the diffusion of volatiles other than Hz0 in melts.
Several reasons prompted the study of Cl diffusion in sil- icate melt. First, Cl is the most important volatile in trans- porting ore-forming elements ( EUGSTER, 1985, 1986). Therefore, knowledge of the diffusion rate of Cl in silicate melts is necessary to model ore-element ~~e~n~a~on during magma c~s~li~tion. Second, Cl has a very strong effect on
* Author to whom correspondence should LX addressed.
element partitioning between melt and vapor phases (CAN- DELA and HOLLAND, 1984; KEPPLER and WYLLIE, 1989), suggesting that the rate of Cl diffusion may have a large effect on element partitioning. A third reason is that Cl tends to become enriched in a vapor phase that is being separated from a magma because of its strong partitioning in the vapor phase ( BURNHAM, 1967; KOSTER VAN GR~ and WYLLIE, 1969; KIL~NC and BURNHAM, 1972; WEBSTER, 1992), thus affecting the solidus temperature and, likely, the viscosity of the magma (WYLLIE and TUTTLE, 1964; HIRAYAMA and CAMP, 1969; KOSTER VAN GROOS and WYLLIE, 1969; PER- SIKOV et al, 1990; WEBSTER, 1992).
Without information on Cl diffusivity, processes such as the differentiation of volatiles or the partition of metals be- tween vapor and melts cannot be assessed properly. The only previous studies of Cl diffusion in melts are from WATSON and BENDER ( 1980) and WATSON ( 199 1). WATSON ( 199 1) reported on five Cl diffusion data obtained in a hydrous silicic to intermediate magma containing 8 wt% Hz0 at 800- 1 100°C and 10 kbar, but he did not provide much infor- mation on the relations between the diffusion coefficients and the run temperature, pressure, and other conditions. In the present paper the results of a study on the effect of tem- perature, pressure, and Cl concentration on Cl diffusion in silicate melts are reported.
E~E~ME~AL PR~EDURE
Starting Materials
The starting materials used were a haplogranitic glass and a LGB glass. The haplogranitic glass, which has a composition corresponding
113
114 T. B. Bai and A. F. Koster van Groos
to the thermal minimum in the haplogranite system at 2 kbar Hz0 pressure (TUTTLE and BOWEN, 1958), was prepared from a gel (HAMILTON and HENDERSON, 1968) and ground to pass 200 mesh. After grinding, it was dried to constant weight at 110°C. Next, the gel was loaded in Pt capsules together with 8 wt% H20. The capsules were welded shut and run at 800°C and 2.6 kbar for three days, after which the quenched glasses were ground in an agate mortar and ran in Pt capsules held at 1300°C and 5 kbar for three hours. The final glasses are clear and bubble free. In some cases, a vacuum pump was used during sealing, but no significant differences in the glass was observed.
Samples of natural (0.1-0.2 wt% HzO) and a fused (6 ppm H,O) LGB glass (Little Glass Butte, Oregon) were obtained from D. B. Dingwell and N. Bagdassorov of the Bayerishes Geoinstitut, Germany. Some physical properties of fused LGB melt have been determined by Dingwell and coworkers ( DINGWELL, 1990, DINGWELL and WEBB, 1990; WEBB and DINGWELL, 1989; NEUVILLE et al., 1993). To in- vestigate the effect of Hz0 content in the melt on Dc,, we hydrated some LGB glass by sealing varying amounts of Hz0 and the glass in Pt capsules and ran them at 3 kbar and 850°C for three days. The homogeneity of Hz0 in these glasses was verified by electron micro- probe analysis, see below.
Glass spheres of about 2 mm in diameter were manufactured fol- lowing the method of J~OND ( 195 1) . They were washed with dilute HCI at room temperature for ten minutes to remove possible con- tamination during grinding, cleaned with distilled HzO, and dried at 110°C for one hour. The compositions of the starting glasses are listed in Table I. The composition of the LGB glass was provided by D. B. Dingwell (pers. commun.); the haplogranitic glass com- position was verified by electron microprobe.
Experimental Method
Three series of experiments were made. A high-temperature run series was designed to study the temperature effect on Cl diffusion in the melt. Therefore, high-temperature runs were made at 1 atm, using dry LGB glass spheres embedded in pure NaCl powder, and sealed in a Pt capsule. Runs were between 850 and 14OO”C, using a I -atmosphere tungsten-wound furnace. Inside the capsule the pressure could reach several bars because of the expansion of air, causing some capsules to leak out part or all of the NaCl present. If the loss of NaCl was such that the silicate sphere was no longer embedded in NaCl aRer the quench, the run was discarded.
The second series, using NaCl-rich fluids, was made to assess the effect of Hz0 and pressure on the diffusion of Cl in granitic melt. In these runs, either dry, hydrated, or natural LGB glass was loaded and sealed in Au capsules, together with a large amount of NaCl. In some cases a small amount of water was added also. In al1 cases, NaCl composed 80-90 wt% of the total starting materials. The runs were made at 850°C and 200-2,000 bars in cold-seal pressure vessels (TURTLE, 1949).
The third H,O-rich run series was used to investigate the effect of Cl concentration on Cl diffusion. In these runs the starting material is haplogranitic glass, with a solution/glass > 1. Chlorine was added
Table I. Composition of starting glasses.
Haplogranite LGB
so, *V’s Na,O
GO Fe0
M@ MnO CaO TiO,
HZ0
Total
74.61 77.86 10.81 12.64 3.67 3.88 3.88 4.03
__ 0.80 _- 0.06 __ 0.04 __ 0.62 __ 0.07 6.4kO.3 2.6 ppm
99.37 100.00
as a NaCI or a HCl solution. The temperature ranged from 650 to 900°C and the pressure from 1 to 4.6 kbar. The glass sphere and NaCl brine were loaded in a Au capsule, 4 mm in diameter and 10 mm in length, and welded shut. Either a horizontally mounted in- ternally heated pressure vessel (IHPV) ( HOLL,OWAY, 197 1) or ver- tically mounted cold-seal pressure vessels were used. Temperatures, measured with a Pt/PtwRhlo (IHPV) or a chromel/alumel ther- mocouple (cold-seal vessel), are believed accurate to within 5°C. Pressures were determined with a Bourdon-type Heise gauge; they are accurate to within 0.2%. The runs were between a half and ten hours long. All runs were quenched rapidly by turning the IHPV to a vertical position. This causes the capsules to drop to a cool part of the vessel and the quench takes only a few seconds (VISSER and KOSTER VAN GROOS, 1979).
All run products were mounted in epoxy, sliced in half, polished, and examined by SEM. Only samples without crystals and large bub- bles were used to analyze Cl diffusion profiles. Because the location of the section is important for the diffusivity measurements, we checked the diameter of the section under microscope during every step of polishing. When the diameter of the section became equal to the diameter of the sphere. it was used for the line-scan analysis.
Analytical Procedure
The charges were analyzed by a Cameca EMP with 4 wavelength dispersive spectrometers ( WDS) for Na, K, Al, Si, Ca, Mg, Fe, and Cl at the Bayerisches Geoinstitut, Germany. Operating conditions were 15 kV accelerating voltage, 8 nA sample current, and 100 second counting time per point with a beam spot of 5-10 pm. To obtain the Cl profile, line scans were made over the diameter of the glass bead. A typical profile consists of 20-30 points. Three profiles were made for each sample. The standards used for the analysis are albite for Na, Si, and Al, orthoclase for K, forsterite for Mg, andradite for Ca, and vanadinite for Cl. The Cl concentrations are within the range of0.40-0.00 I wt%. Water content in the hydrated glass was obtained using the following method. A series of analyses of the anhydrous LGB glass yielded totals of 99.9 f 0.2%. The difference in the total of the analysis of the hydrated LGB glass was assumed to represent the Hz0 content. Thus, if the averaged total of a hydrated glass is 95.6 & 0.2%, we assume a Hz0 content of4.3 + 0.4 wt%. This method has several problems. For example, it is difficult to distinguish inferior analyses. However, by averaging the analyses, most of these problems are alleviated.
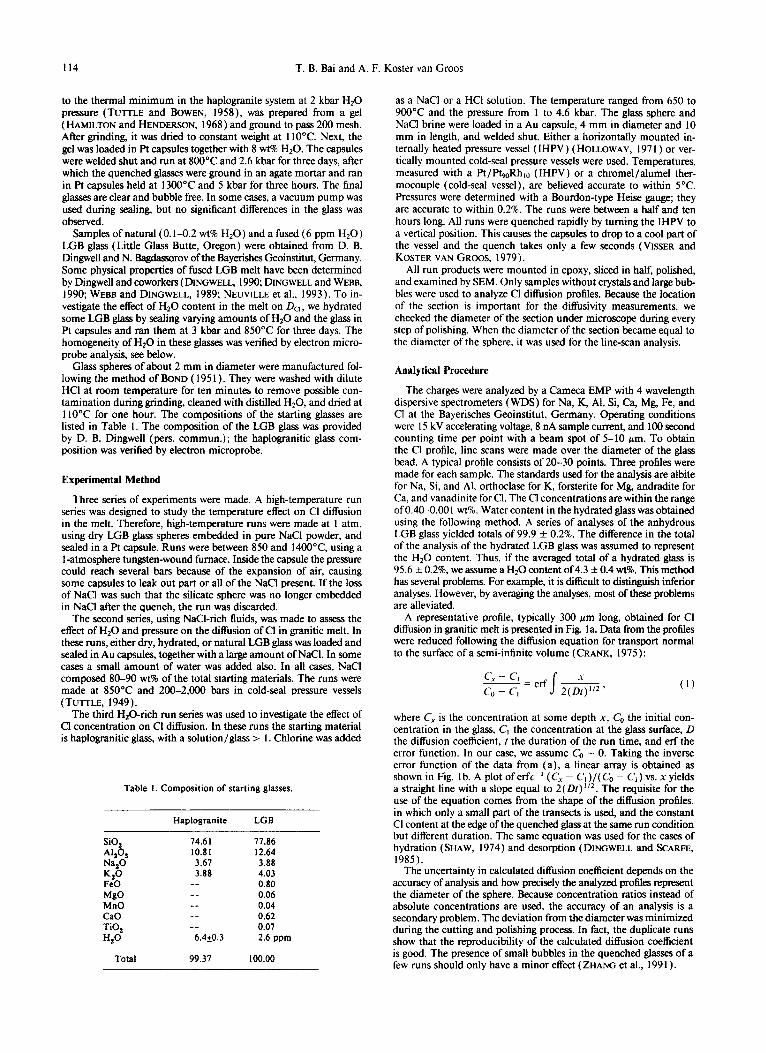
A representative profile, typically 300 pm long, obtained for Cl diffusion in granitic melt is presented in Fig. la. Data from the profiles were reduced following the diffusion equation for transport normal to the surface of a semi-infinite volume (CRANK, 1975):
c, - C’, - = erf s X
C” - C, 2(ot)“2 ’ (1)
where C’, is the concentration at some depth x, C, the initial con- centration in the glass, C, the concentration at the glass surface, D the diffusion coefficient, t the duration of the run time, and erf the error function. In our case, we assume Co = 0. Taking the inverse error function of the data from (a), a linear array is obtained as shown in Fig. lb. A plot of erfc-’ (C, - C, )/(C,, - C,) vs. x vields a straight line with a slope equal to i( Dt) iii.‘The rec$site fir the use of the equation comes from the shape of the diffusion profiles, in which only a small part of the transects is used, and the constant Cl content at the edge of the quenched glass at the same run condition but different duration. The same equation was used for the cases of hydration ( SHAW, 1974) and desorption ( DINGWELL and SCARFE, 1985).
The uncertainty in calculated diffusion coefficient depends on the accuracy of analysis and how precisely the analyzed profiles represent the diameter of the sphere. Because concentration ratios instead of absolute concentrations are used, the accuracy of an analysis is a secondary problem. The deviation from the diameter was minimized during the cutting and polishing process. In fact, the duplicate runs show that the reproducibility of the calculated diffusion coefficient is good. The presence of small bubbles in the quenched glasses of a few runs should only have a minor effect ( ZHANG et al., 199 1) .
Diffusion of Cl in silicate melts 115
FIG. 1. (a) Representive profile of Cl concentration vs. depth into a LGB glass sphere after anneal at 1400°C and 1 bar. Zero micron represents the surface of the sphere. (b) Data from (a) calculated as the inverse error function of the Cl concentration vs. depth into the sphere. The solid line is a least-squares linear regression fit to the data(r = 0.999).
RESULTS
High Tempevatwe Series
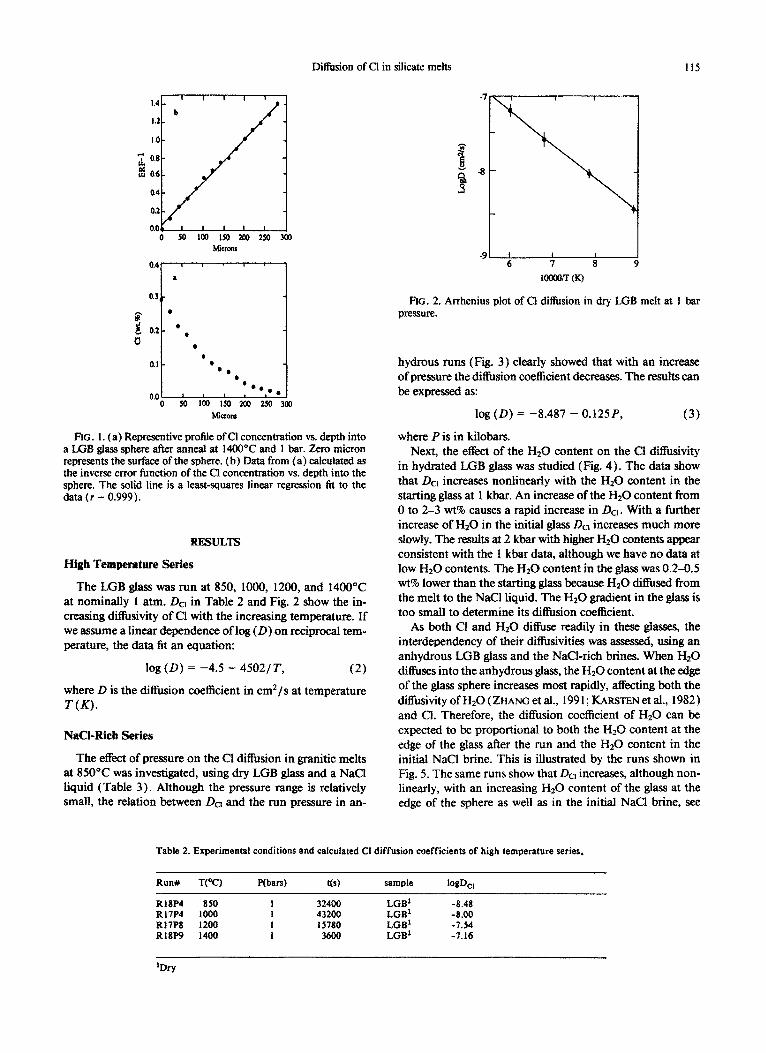
The LGB glass was run at 850, 1000, 1200, and 1400°C at nominally 1 atm. DC, in Table 2 and Fig. 2 show the in- creasing diffisivity of Cl with the increasing temperature. If we assume a linear dependence of log (D) on reciprocal tem- perature, the data fit an equation:
log (D) = -4.5 - 4502/T, (2)
where D is the diffusion coefficient in cm2/s at temperature
T(K).
Nail-Rich series
The effect of pressure on the Cl diffusion in granitic melts at 850°C was investigated, using dry LGB glass and a NaCl liquid (Table 3). Although the pressure range is relatively small, the relation between DC, and the run pressure in an-
-9 1 I I 6 7 8 9
FIG. 2. Arrhenius plot of Cl diffusion in dry LGB melt at I bar
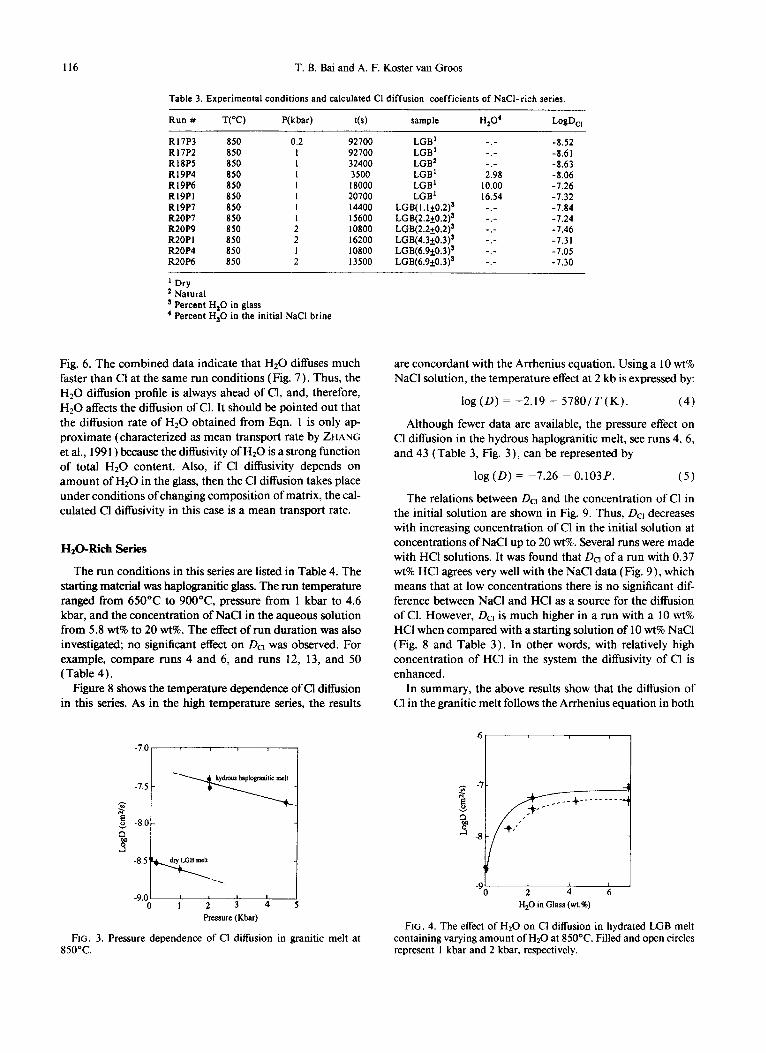
hydrous runs (Fig. 3) clearly showed that with an increase of pressure the diflirsion coefficient decreases. The results can be expressed as:
log(D) = -8.487 - O.l25P,
where P is in kilobars.
(3)
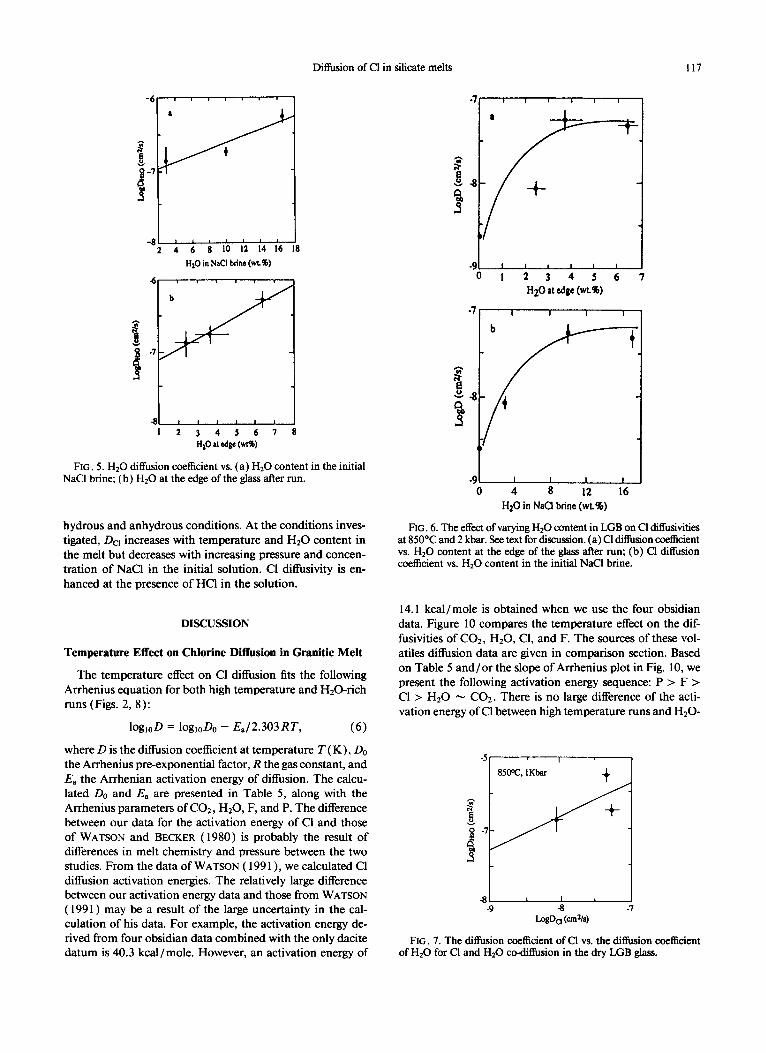
Next, the effect of the Hz0 content on the Cl diffusivity in hydrated LGB glass was studied (Fig. 4). The data show that DC, increases nonlinearly with the Hz0 content in the starting glass at 1 kbar. An increase of the Hz0 content from 0 to 2-3 w-t% causes a rapid increase in DC,. With a further increase of Hz0 in the initial glass DC, increases much more slowly. The results at 2 kbar with higher Hz0 contents appear consistent with the 1 kbar data, although we have no data at low Hz0 contents. The Hz0 content in the glass was 0.2-0.5 wt% lower than the starting glass because Hz0 diffused from the melt to the NaCl liquid. The Hz0 gradient in the glass is too small to determine its diffusion coefficient.
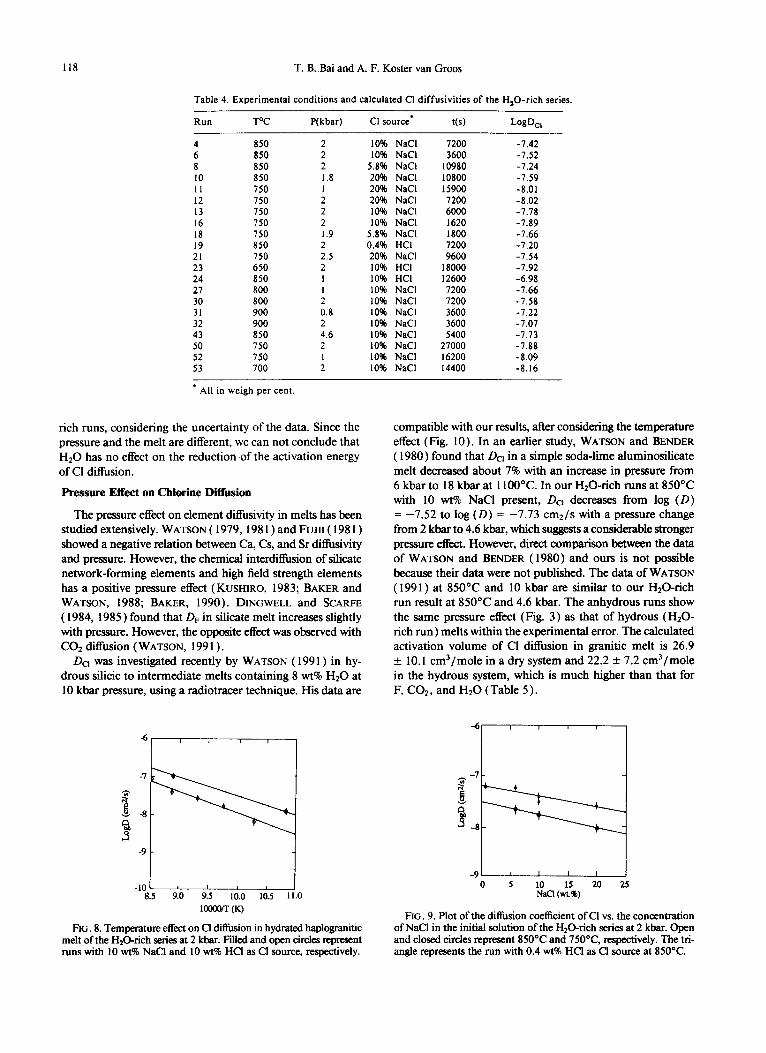
As both Cl and Hz0 diffuse readily in these glasses, the intetde~ndency of their di~si~ti~ was assessed, using an anhydrous LGB glass and the NaCl-rich brines. When Hz0 diffuses into the anhydrous glass, the Hz0 content at the edge of the glass sphere increases most rapidly, affecting both the diffisivity of H20 ( ZHANG et al., 1991; KAMTEN et al., 1982) and Cl. Therefore, the diffusion coefficient of Hz0 can be expected to be propo~ional to both the Hz0 content at the edge of the glass after the run and the Hz0 content in the initial NaCl brine. This is illustrated by the runs shown in Fig. 5. The same runs show that Da increases, although non- linearly, with an increasing Hz0 content of the glass at the edge of the sphere as well as in the initial NaCl brine, see
Table 2. Experimental conditions and calculated Cl diffusion coefficients of high temperature series,
_ Runx -J-W) P(bars) t(s) sample rc@c,
R18P4 850 1 32400 LGB’ -8.48 RI7P4 loo0 1 43200 LGB’ -8.00 R17P8 1200 1 15780 LGB’ -7.54 R18P9 1400 1 3600 LGB’ -7.16
‘Dry
116 T. B. Bai and A. F. Koster van Groos
Table 3. Experimental conditions and calculated Cl diffusion coefficients of NaCI-rich series.
Run # TW) P(kbar) t(s) sample HsO’ Lo8D,,
R17P3 850 R17P2 850 RISPS 850 R19P4 850 R19P6 850 R19PI 850 R19P7 850 R20P7 850 R20P9 850 R20P1 850 R2OP4 850 R20P6 850
0.2 1 I I I I 1 I 2 2
l Dry ’ Natural s Percent HsO in glass ’ Percent HsO in the initial NaCl brine
92700 92700 32400 3500 18000 20700 14400 15600 10800 16200 10800 13500
Fig. 6. The combined data indicate that Hz0 diffuses much faster than Cl at the same run conditions (Fig. 7 ). Thus, the Hz0 diffusion profile is always ahead of Cl, and, therefore, Hz0 affects the diffusion of Cl. It should be pointed out that the diffusion rate of Hz0 obtained from Eqn. 1 is only ap- proximate (characterized as mean transport rate by ZHANG
et al., 199 1) because the diffusivity of Hz0 is a strong function of total Hz0 content. Also, if Cl diffusivity depends on amount of Hz0 in the glass, then the Cl diffusion takes place under conditions of changing composition of matrix, the cal- culated Cl difisivity in this case is a mean transport rate.
H20-Rich Series
The run conditions in this series are listed in Table 4. The starting material was haplogranitic glass. The run temperature ranged from 650°C to 900°C pressure from 1 kbar to 4.6 kbar, and the concentration of NaCl in the aqueous solution from 5.8 wt% to 20 wt%. The effect of run duration was also investigated, no significant effect on Dc, was observed. For example, compare runs 4 and 6, and runs 12, 13, and 50 (Table 4).
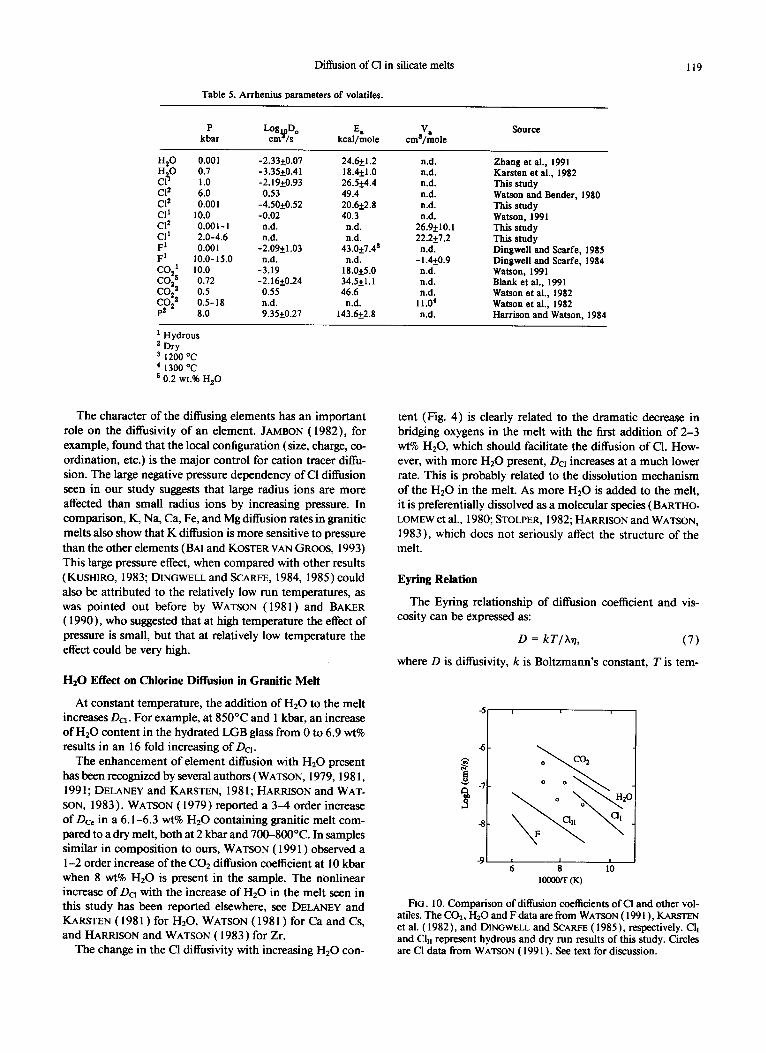
Figure 8 shows the temperature dependence of Cl diffision in this series. As in the high temperature series, the results
-7.0, I
E -8.0 -
-9.0 1 I t I I 0 1 2 3 4 5
Pressure (Kbat)
FIG. 3. Pressure dependence of Cl diffusion in granitic melt at 850°C.
LGB1 LGB’ LGB’ LGB’ LGB’ LGB’
LGB(l.l~0.2)s LCiB(2.2&0.2)s LGB(Z.ZtO.2)s LGB(4.39.3)’ LGB(6.99.3)s LGB(6.99.3)’
-
-_- 2.98
10.00 16.54 -.- -.-
-.- -.- -.-
-8.52 -8.61 -8.63 -8.06 -7.26 -7.32 -7.84 -7.24 -7.46 -7.31 -7.05 -7.30
are concordant with the Arrhenius equation. Using a 10 wt% NaCl solution, the temperature effect at 2 kb is expressed by:
log(D) = -2.19 - 5780/T(K). (4)
Although fewer data are available, the pressure effect on Cl diffusion in the hydrous haplogranitic melt, see runs 4,6, and 43 (Table 3, Fig. 3), can be represented by
log (D) = -7.26 - 0.103P. (5)
The relations between Dc, and the concentration of Cl in the initial solution are shown in Fig. 9. Thus, Dcr decreases with increasing concentration of Cl in the initial solution at concentrations of NaCl up to 20 wt%. Several runs were made with HCl solutions. It was found that Da of a run with 0.37 wt% HCl agrees very well with the NaCl data (Fig. 9)) which means that at low concentrations there is no significant dif- ference between NaCl and HCl as a source for the diffusion of Cl. However, DC, is much higher in a run with a 10 wt% HCl when compared with a starting solution of 10 wt% NaCl (Fig. 8 and Table 3). In other words, with relatively high concentration of HCI in the system the diffusivity of Cl is enhanced.
In summary, the above results show that the diffusion of Cl in the granitic melt follows the Arrhenius equation in both
HsO in Glass (wt.%)
FIG. 4. The effect of Hz0 on Cl diffusion in hydrated LGB melt containing varying amount of Hz0 at 850°C. Filled and open circles represent I kbar and 2 kbar, respectively.
Diffusion of Cl in silicate melts 117
-81 2 4 6 8 10 12 14 16 18
Ha0 at edge (WI%)
! 8
FIG. 5. Hz0 diffusion coefficient vs. (a) Hz0 content in the initial NaCl brine; (b) HI0 at the edge of the glass after run.
hydrous and anhydrous conditions. At the conditions inves- tigated, Da increases with temperature and Hz0 content in the melt but decreases with increasing pressure and concen- tration of NaCl in the initial solution. Cl diffusivity is en- hanced at the presence of HCl in the solution.
DISCUSSION
Temperature Effect on Chlorine Diffusion in Granitic Melt
The temperature effect on Cl diffusion fits the following Arrhenius equation for both high temperature and HzO-rich runs (Figs. 2, 8 ):
log,,D = log,OD,, - Ea/2.303RT, (6)
where D is the diffusion coefficient at temperature T(K), Do the Arrhenius pre-exponential factor, R the gas constant, and E. the Arrhenian activation energy of diffusion. The calcu- lated Do and E. are presented in Table 5, along with the Arrhenius parameters of C02, H20, F, and P. The difference between our data for the activation energy of Cl and those of WATSON and BECKER ( 1980) is probably the result of differences in melt chemistry and pressure between the two studies. From the data of WATSON ( 199 1) , we calculated Cl diffusion activation energies. The relatively large difference between our activation energy data and those from WATSON ( 199 1) may be a result of the large uncertainty in the cal- culation of his data. For example, the activation energy de- rived from four obsidian data combined with the only dacite datum is 40.3 kcal/mole. However, an activation energy of
Hz0 at edge (wtS)
=I-
Hz0 in NaCl brine (wL%)
FIG. 6. The effect of varying Hz0 content in LGB on Cl diEusivities at 850°C and 2 kbar. See text for discussion. (a) Cl diffusion coefficient vs. Hz0 content at the edge of the glass after run; (b) Cl diffusion coefficient vs. Hz0 content in the initial NaCl brine.
14.1 kcal/mole is obtained when we use the four obsidian data. Figure 10 compares the temperature effect on the dif- fusivities of COz, H20, Cl, and F. The sources of these vol- atiles diffusion data are given in comparison section. Based on Table 5 and/or the slope of Arrhenius plot in Fig. 10, we present the following activation energy sequence: P > F > Cl > Hz0 - COz. There is no large difference of the acti- vation energy of Cl between high temperature runs and HrO-
-5 I
85O=C. IKbar 4
a1 I I I -9 8 -7
lxgDa (cm*/a)
FIG. 7. The diffusion coefficient of Cl vs. the diffusion coe.fficient of HZ0 for Cl and Hz0 co-diffusion in the dry LGB glass.
118 T. B. Bai and A. F. Koster van Groos
Table 4. Experimental conditions and calculated Cl diffusivities of the HsO-rich series.
Run TOC P(kbar) Cl source’ t(s) Lo@,,
: 850 850 2 2 10% 10% NaCl NaCl 7200 3600 -7.42 -7.52 8 850 2 5.8% NaCl 10980 -7.24 10 850 1.8 20% NaCl 10800 -7.59 11 750 1 20% NaCl 15900 -8.01 12 750 2 20% NaCl 7200 -8.02 13 750 2 10% NaCl 6000 -7.78 16 750 2 10% NaCl 1620 -7.89 18 750 1.9 5.8% NaCl 1800 -7.66 19 850 2 0.4% HCI 7200 -7.20 21 750 2.5 20% NaCl 9600 -7.54 23 650 2 10% HCI 18000 -7.92 24 850 1 10% HCI 12600 -6.98 27 800 I 10% NaCl 7200 -7.66 30 800 2 10% NaCl 7200 -7.58 31 900 0.8 10% NaCl 3600 -7.22 32 900 2 10% NaCl 3600 -7.07 43 850 4.6 10% NaCl 5400 -7.73 50 750 2 10% NaCl 27000 -7.88 52 750 I 10% NaCl 16200 -8.09 53 700 2 10% NaCl 14400 -8.16
l All in weigh per cent.
rich runs, considering the uncertainty of the data. Since the pressure and the melt are different, we can not conclude that Hz0 has no effect on the reduction of the activation energy of Cl diffusion.
Pressure Effect on Chlorine Diffusion
The pressure effect on element diffusivity in melts has been studied extensively. WATSON ( 1979, 198 1) and FUJII ( 198 1)
showed a negative relation between Ca, Cs, and Sr diffisivity and pressure. However, the chemical interdiffusion of silicate network-forming elements and high field strength elements has a positive pressure effect (KUSHIRO, 1983; BAKER and WATSON, 1988; BAKER, 1990). DINGWELL and SCARFE
( 1984, 1985 ) found that DF in silicate melt increases slightly with pressure. However, the opposite effect was observed with CO* diffusion (WATSON, 199 1) .
Da was investigated recently by WATSON ( 199 1) in hy- drous silicic to intermediate melts containing 8 wt% Hz0 at 10 kbar pressure, using a radiotracer technique. His data are
-7
2
B
ja
-9
;:-::::-::::::-I
T3e.o 10.0 10.5
t@MXT (K)
FIG. 8. Temperature effect on Cl diffusion in hydrated haplogranitic melt of the H,O-rich series at 2 kbar. Fiied and open circles represent runs with 10 wt% NaCl and 10 wt% HCI as Cl source, respectively.
compatible with our results, after considering the temperature effect (Fig. 10). In an earlier study, WATSON and BENDER
( 1980) found that Da in a simple soda-lime ahtminosilicate melt decreased about 7% with an increase in pressure from 6 kbar to 18 kbar at 1100°C. In our HzO-rich runs at 850°C with 10 wt% NaCl present, Da decreases from log (D) = -7.52 to log (D) = -7.73 cmz/s with a pressure change from 2 kbar to 4.6 kbar, which suggests a considerable stronger pressure effect. However, direct comparison between the data of WATXJN and BENDER ( 1980) and ours is not possible because their data were not published. The data of WATSON
( 1991) at 850°C and 10 kbar are similar to our HzO-rich run result at 850°C and 4.6 kbar. The anhydrous runs show the same pressure effect (Fig. 3) as that of hydrous (HzO- rich run) melts within the experimental error. The calculated activation volume of Cl diffusion in granitic melt is 26.9 + 10.1 cm3/mo1e in a dry system and 22.2 f 7.2 cm3/mo1e in the hydrous system, which is much higher than that for F, COz, and Hz0 (Table 5).
-9’ 0 5 10 15 Xl 25
NaCl (wt%)
FIG. 9. Plot of the diffusion coefficient of Cl vs. the concentration of NaCl in the initial solution of the H@-rich series at 2 kbar. Open and closed circles represent 850°C and 750°C, respectively. The tri- angle represents the run with 0.4 wt% HCl as Cl source at 850°C.
Diffusion of Cl in silicate melts 119
Table 5. Arrhenius parameters of volatiles.
P kbar
HZ0 0.001 Cl’l H 0 0.7
Cl2 :.: 0:oot Cl2
Cl’ 10.0 Cl2 0.001-1
Cl’ 2.0-4.6 5: 0.001
10.0-15.0
co,’ 10.0
co,6 0.72 co*s 0.5 co,2 0.5-18 P2 8.0
Log D, Y cm /s
-2.33&0.07 -3.359.41 -2.19*0.93
0.53 -45050.52 -0.02 n.d.
n.d. -2.09+1.03 _;.:9
-2:16~0.24 0.55 n.d. 9.35kO.27
E. kcat/mole
24.6k1.2 18.4tl .O 26.5~4.4
49.4 20.6k2.8 40.3 n.d.
n.d. 43.Ok7.43 nd.
18.0+5.0 34.5kl.l 46.6 n.d.
143.6k2.8
V, cme/mole
n.d. n.d. n.d.
n.d. n.d. nd.
26.9+10.1 22.2k7.2 n.d.
-
n.d. 1.49.9
n.d. n.d.
11.0’ n.d.
Source
Zhang et al., 1991 Karsten et al., 1982 This study Watson and Bender, 1980 This study Watson, 1991 This study This study Dingwell and Scarfe, 1985 Dingwell Scarfe, and 1984 Watson, 1991 Blank et al., 1991 Watson et al., 1982 Watson et at., 1982 Harrison and Watson, 1984
’ Hydrous a Dry 3 1200 oc ’ 1300 “C ’ 0.2 wt.% H,O
The character of the diffusing elements has an important role on the diffusivity of an element. JAMBON ( 1982), for example, found that the local configuration (size, charge, co- ordination, etc.) is the major control for cation tracer diffu- sion. The large negative pressure dependency of Cl diffusion seen in our study suggests that large radius ions are more affected than small radius ions by increasing pressure. In comparison, K, Na, Ca, Fe, and Mg diffusion rates in granitic melts also show that K diffusion is more sensitive to pressure than the other elements ( BAI and KOSTER VAN GROOS, 1993) This large pressure effect, when compared with other results (KUSHIRO, 1983; DINGWELL and SCARFE, 1984, 1985) could also be attributed to the relatively low run temperatures, as was pointed out before by WATSON ( 198 1) and BAKER
( 1990)) who suggested that at high temperature the effect of pressure is small, but that at relatively low temperature the effect could be very high.
Hz0 Effect on Chlorine Diffusion in Grauitic Melt
At constant temperature, the addition of Hz0 to the melt increases Da. For example, at 850°C and 1 kbar, an increase of Hz0 content in the hydrated LGB glass from 0 to 6.9 wt% results in an 16 fold increasing of Da.
The enhancement of element diffusion with Hz0 present has been recognized by several authors (WATSON, 1979,198 1, 199 1; DELANEY and KARSTEN, 198 1; HARRISON and WAT- SON, 1983). WATSON ( 1979) reported a 3-4 order increase of D,-= in a 6.1-6.3 wt% HZ0 containing granitic melt com- pared to a dry melt, both at 2 kbar and 700-8OO’C. In samples similar in composition to ours, WATKIN ( 199 1) observed a l-2 order increase of the COZ diffusion coefficient at 10 kbar when 8 w-t% Hz0 is present in the sample. The nonlinear increase of Da with the increase of Hz0 in the melt seen in this study has been reported elsewhere, see DELANEY and
KARSTEN ( 198 1) for HzO, WATSON ( 198 1) for Ca and Cs, and HARRISON and WATSON ( 1983) for Zr.
The change in the Cl diffusivity with increasing Hz0 con-
tent (Fig. 4) is clearly related to the dramatic decrease in bridging oxygens in the melt with the first addition of 2-3 wt% H20, which should facilitate the diffusion of Cl. How- ever, with more HZ0 present, Da increases at a much lower rate. This is probably related to the dissolution mechanism of the HZ0 in the melt. As more Hz0 is added to the melt, it is preferentially dissolved as a molecular species ( BARTHO- LOMEW et al., 1980; STOLPER, 1982; HARRISON and WATSON,
1983), which does not seriously affect the structure of the
melt.
Eyring Relation
The Eyring relationship of diffusion coefficient and vis- cosity can be expressed as:
D = kT/Xq, (7)
where D is diffisivity, k is Boltzmann’s constant, T is tem-
lm 6)
FIG. 10. Comparison of diffusion coefficients of Cl and other vol- atiles. The CO,, Hz0 and F data are from WATSON ( 199 I ) , KARSTEN et al. ( 1982), and DINGWELL and SCARFE (1985), respectively. Cl, and Cl,, represent hydrous and dry run results of this study. Circles are Cl data from WATSON ( 199 1). See text for discussion.
120 T. B. Bai and A. F. Koster van Groos
perature (K), X is the jump-distance, and 11 is viscosity. Thus, diffusivity and viscosity are inversely linearly related at con- stant T and jump distance.
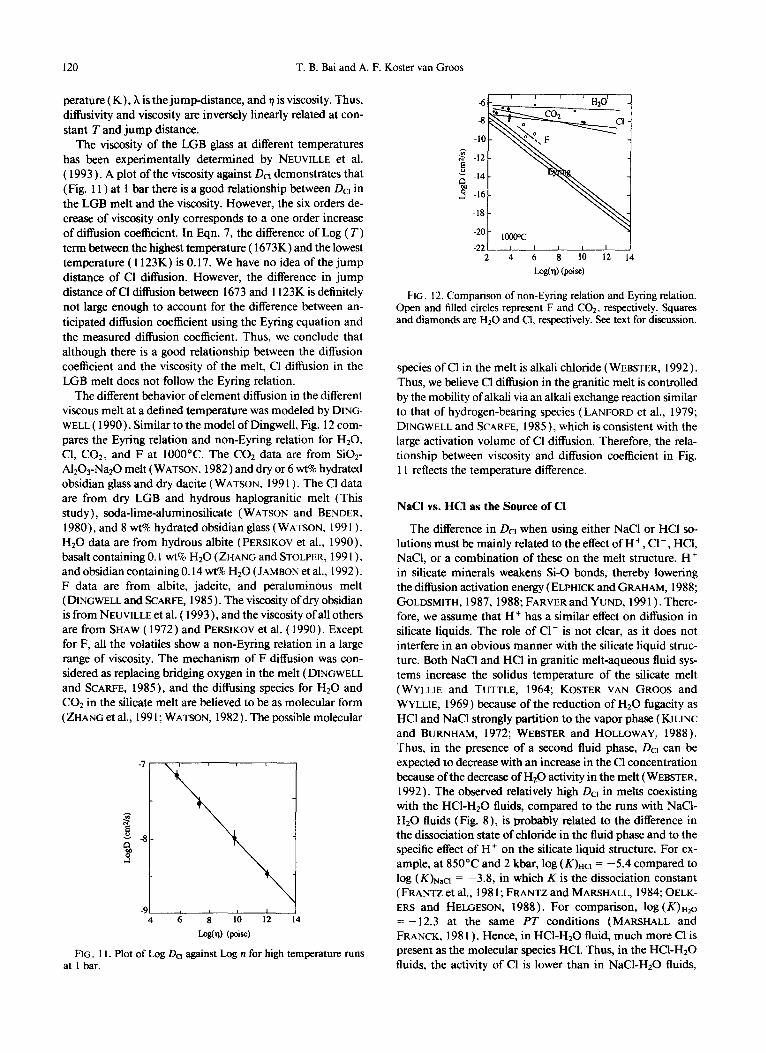
The viscosity of the LGB glass at different temperatures has been experimentally determined by NEUVILLE et al. ( 1993 ) . A plot of the viscosity against &I demonstrates that (Fig. 11) at 1 bar there is a good relationship between &I in the LGB melt and the viscosity. However, the six orders de- crease of viscosity only corresponds to a one order increase of diffusion coefficient. In Eqn. 7, the difference of Log (T) term between the highest temperature ( 1673K) and the lowest temperature ( 1123K) is 0.17. We have no idea of the jump distance of Cl diffusion. However, the difference in jump distance of Cl diffusion between 1673 and 1123K is definitely not large enough to account for the difference between an- ticipated diffusion coefficient using the Eyring equation and the measured diffusion coefficient. Thus, we conclude that although there is a good relationship between the diffusion coefficient and the viscosity of the melt, Cl diffusion in the LGB melt does not follow the Eyring relation.
The different behavior of element diffusion in the different viscous melt at a defined temperature was modeled by DING- WELL ( 1990). Similar to the model of Dingwell, Fig. 12 com- pares the Eyring relation and non-Eyring relation for HzO, Cl, CO*, and F at 1000°C. The COr data are from Si02- A1,03-Na20 melt (WATSON, 1982) and dry or 6 wt% hydrated obsidian glass and dry dacite (WATSON, 199 1). The Cl data are from dry LGB and hydrous haplogranitic melt (This study), soda-lime-aluminosilicate (WATSON and BENDER, 1980), and 8 wt% hydrated obsidian glass (WATSON, 199 1). Hz0 data are from hydrous albite ( PERSIKOV et al., 1990), basalt containing 0.1 wt% Hz0 ( ZHANG and STOLPER, 199 1 ), and obsidian containing 0.14 wt% Hz0 ( JAMBON et al., 1992). F data are from albite, jadeite, and peraluminous melt ( DINGWELL and SCARFE, 1985 ) . The viscosity of dry obsidian is from NEUVILLE et al. ( 1993 ) , and the viscosity of all others are from SHAW ( 1972) and PERSIKOV et al. ( 1990). Except for F, all the volatiles show a non-Eyring relation in a large range of viscosity. The mechanism of F diffusion was con- sidered as replacing bridging oxygen in the melt ( DINGWELL and SCARFE, 1985), and the diffusing species for Hz0 and CO* in the silicate melt are believed to be as molecular form ( ZHANG et al., 199 1; WATSON, 1982). The possible molecular
Log(tl) (pi=)
FIG. 11. Plot of Log Da against Log n for high temperature runs at I bar.
-18 -
I 2 4 6 8 10 12 14
I.&l) (poise)
FIG. 12. Comparison of non-Eyring relation and Eyring relation. Open and filled circles represent F and CO*, respectively. Squares and diamonds are Hz0 and Cl, respectively. See text for discussion.
species of Cl in the melt is alkali chloride (WEBSTER, 1992). Thus, we believe Cl diffusion in the granitic melt is controlled by the mobility of alkali via an alkali exchange reaction similar to that of hydrogen-bearing species ( LANFORD et al., 1979; DINGWELL and SCARFE, 1985), which is consistent with the large activation volume of Cl diffusion. Therefore, the rela- tionship between viscosity and diffusion coefficient in Fig. 1 I reflects the temperature difference.
NaCl vs. HCI as the Source of Cl
The difference in DcI when using either NaCl or HCl so- lutions must be mainly related to the effect of H+, Cl-, HCl, NaCl, or a combination of these on the melt structure. H+ in silicate minerals weakens Si-0 bonds, thereby lowering the diffusion activation energy ( ELPHICK and GRAHAM, 1988; GOLDSMITH, 1987,1988; FARVER and YUND, 199 1). There- fore, we assume that H+ has a similar effect on diffusion in silicate liquids. The role of Cl- is not clear, as it does not interfere in an obvious manner with the silicate liquid struc- ture. Both NaCl and HCI in granitic melt-aqueous fluid sys- tems increase the solidus temperature of the silicate melt ( WYLLIE and TUTTLE, 1964; KOSTER VAN GROOS and WYLLIE, 1969) because of the reduction of Hz0 fugacity as HCl and NaCl strongly partition to the vapor phase (KILINC and BURNHAM, 1972; WEBSTER and HOLLOWAY, 1988). Thus, in the presence of a second fluid phase, Da can be expected to decrease with an increase in the Cl concentration because of the decrease of Hz0 activity in the melt (WEBSTER, 1992). The observed relatively high DC, in melts coexisting with the HCl-HrO fluids, compared to the runs with NaCl- Hz0 fluids (Fig. 8), is probably related to the difference in the dissociation state of chloride in the fluid phase and to the specific effect of H+ on the silicate liquid structure. For ex- ample, at 85O’C and 2 kbar, log (K&, = -5.4 compared to log (K)NacI = -3.8, in which K is the dissociation constant ( FRANTZ et al., 198 1; FRANTZ and MARSHALL, 1984; OELK- ERS and HELGESON, 1988). For comparison, log ( K)HP = - 12.3 at the same PT conditions (MARSHALL and FRANCK, 198 1) . Hence, in HCl-Hz0 fluid, much more Cl is present as the molecular species HCl. Thus, in the HCl-Hz0 fluids, the activity of Cl is lower than in NaCl-H20 fluids,
Diffusion of Cl in silicate melts 121
suggesting that the driving force for Cl diffusion into the sil- icate melt with HCl-Hz0 fluids is equal or less than with NaCl-Hz0 fluids. Therefore, the relatively high Da in the runs with HCl is attributed by the effect of H+ on the liquid structure as discussed above.
The dependency of DC1 on the initial NaCl concentration (Fig. 9) could be a result of the compositional dependency of Cl diffusivity on Cl content of the glass (S. Chakraborty, pers. commun.). By using initial solutions with different Cl contents, we may change the composition of glass by altering the amount of initial flux of Cl into the glass. Thus, subse- quent diffusion occurs in a glass with a different Cl content and, therefore, the overall integrated diffusivity is higher. The reduction of Hz0 activity and the increase of Cl distribution coefficient with the increase of NaCl concentration in the solution are also reasonable explanations. A further study on this subject is necessary.
Comparison with Other Volatiles and Anions
Like cations, the different anions act differently in the melt structure, resulting in a different behavior of diffisivity. The addition of Hz0 and/or F in the melt tends to reduce bonding in the silicate structure. In contrast, an increase in COz or Cl in the melt enhances bonding, reflected by the increase of melt viscosity (HIRAYAMA and CAMP, 1969). Thus, diffusion of these components in the melt will have a significant effect on the melt evolution. The difisivities of Hz0 in the rhyolitic melt with more than 3 wt% Hz0 (KARSTEN et al., 1982), F in dry peraluminous melt ( DINGWELL and SCAR!=E, 1985), COz in the rhyolitic melt with 8 wt% Hz0 (WATSON, 1991), and Cl in dry and hydrated granitic melt (WATSON, 199 1; this study) are compared in Fig. 10. The diffusion matrices are obsidian or rhyolitic melts. The pressure used by WATSON ( 199 1) and DINGWELL and SCARFE ( 1985) are 10 kbar and 1 bar, respectively; for the others, pressures are between 1 and 3 kbar. The pressure effect on bulk COz diffusion ex- pressed by WATSON ( 199 1) is negative but not large, whereas the diffusivity of F is to increase with pressure ( DINGWELL and SCARFE, 1984, 1985 ) . The diagram implies that the dif- fusivity of volatiles increases according to the sequence of F < Cl < Hz0 < CO2 in silica-rich melts. The difference between the diffusion coefficient of Hz0 and COz is quite small in a hydrous silicate melts, but that between CO* and Cl is ap- proximately a factor of 5-8. There are no data available con- cerning the difisivity of F in the presence of H20, but we may expect that the diffusivity is increased. Although the constraints of diffusion are different, this diffusivity sequence is opposite to the sequence of activation energy, which suggest that with a higher activation energy, the diffusing ions or atoms have more difficulty to overcome the energy barrier of diffusion, lowering their diffusivity. This sequence is some what similar to that of DE JONG and BROWN ( 1980), who, using a molecular orbital calculation model, concluded that the degree of weakening of Si-0 bond as a function of the adions and admolecules followed the sequence: H+ > CO1 > Na+ > H20 > K+.
The compensation law of cations in silicate melts has been well documented by WINCHELL and NORMAN ( 1969), HOF- MANN (1980), and HENDERSON et al. (1985). They con-
eluded that there is a positive correlation between the exper-
imental activation energy E, and the pre-exponential factor DO in the Arrhenius equation. For example, HOFMANN ( 1980) gave the following equation for cation tracer diffusion:
Log,,D,, = 1.08 X lo-*E, - 5.50, (8)
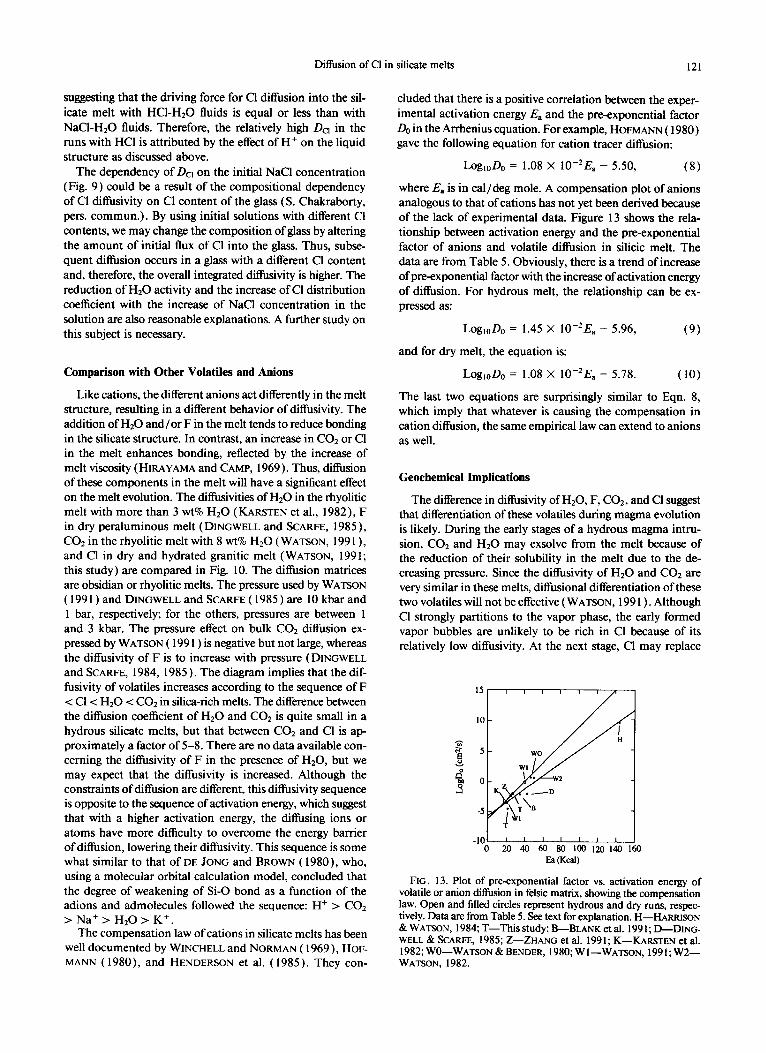
where E. is in cal/deg mole. A compensation plot of anions analogous to that of cations has not yet been derived because of the lack of experimental data. Figure 13 shows the rela- tionship between activation energy and the pre-exponential factor of anions and volatile diffusion in silicic melt. The data are from Table 5. Obviously, there is a trend of increase of pre-exponential factor with the increase of activation energy of diffusion. For hydrous melt, the relationship can be ex- pressed as:
Log,,D,, = 1.45 X lo-*E, - 5.96, (9)
and for dry melt, the equation is:
Log,,DO = 1.08 X IO-‘E, - 5.78. (10)
The last two equations are surprisingly similar to Eqn. 8, which imply that whatever is causing the compensation in cation diffusion, the same empirical law can extend to anions as well.
Geochemical Implications
The difference in diffisivity of H20, F, CO,, and Cl suggest that differentiation of these volatiles during magma evolution is likely. During the early stages of a hydrous magma intru- sion, CO2 and Hz0 may exsolve from the melt because of the reduction of their solubility in the melt due to the de- creasing pressure. Since the diffusivity of Hz0 and COz are very similar in these melts, diffusional differentiation of these two volatiles will not be effective ( WATSON, 199 1) . Although Cl strongly partitions to the vapor phase, the early formed vapor bubbles are unlikely to be rich in Cl because of its relatively low diffusivity. At the next stage, Cl may replace
-101 ’ ’ ’ ’ ’ ’ ’ I 0 20 40 60 80 100 120 140 160
~3 Wd
FIG. 13. Plot of pre-exponential factor vs. activation energy of volatile or anion diffusion in felsic matrix, showing the compensation law. Open and filled circles represent hydrous and dry runs, respec- tively. Data are from Table 5. See text for explanation. H-HARRISON &WATSON, 1984; T-This study; B-BLANK et al. 199 1; D-DING- WELL & SCARFE, 1985; Z-ZHANG et al. 1991; K-KARSTEN et al. 1982; WO-WATSON &BENDER, 1980; WI-WATSON, 1991; W2- WATSON, 1982.
122 T. B. Bai and A. F. Koster van Groos
COs as the second important volatile in the vapor. Water is the dominant volatile in the last stage of vapor differentiation, along with small amount of Cl and F. The relatively low diffusivity and the very low partition coefficient (WEBSTER, 1990) of F result in its low activity during the magma evo- lution. Most ofthe F remains after crystallization of the melt.
This sequence of volatile differentiation is supported by
fluid inclusion studies of the granitic rocks (THOMAS and SPOONER. 1992: MOORE et al.. 1992 ). esneciallv with the Cu. MO, W, and/or’% miner~i~tion. l&evious works (PREECE
and BEANE, 1982; ROEDDER, 1984) show that, if present, fluid inclusions containing COz phases usually concentrate at the top of porphyry type Cu and MO mineralized granitic intrusions. Fluid inclusions that are rich in Cl-phases, are preferentially present in mineralized bodies that are usually located below the zones beneath those containing COz-richer inclusions. For example, POLLARD et al. ( 199 1) found that nrimarv CO2 rich fluid inclusions occur in the marginal peg-
88 16898 ) and the Petroleum Research Fund of the American Chem- ical Society (grant 200 16AC2 ) .
Editorial handling: P. C. Hess
REFERENCES
BAI 7‘. B. and KOSTER VAN GRAMS A. F. ( 1993) The diffusivi~~ of network modifying elements in granitic melts. In prep.
BAKER D. R. ( 1990) Chemical interdiffusion of dacite and rhyolite. Contrib. Mineral. Petrol. 104, 407-423.
BAKER D. R. ( 1991) Interdiffision of hydrous dacitic and rhvolitic melts and the efficacy ofrhyolite inclination of dacitic en&ves. Contrib. Mineral. Petrol. 106,462~473.
BAKER D. R. and WATSON E. B. ( 1988) Diffusion of major and trace elements in compositionally complex Cl- and F- bearing silicate melts. J. Non-Crystal. Solids 102,62-70.
BARTHOLOMEW R. F., BUTLER B. L., HOOVER H. L., and WV C. K. ( 1980) Infrared spectra of a water-containing glass. J. Amer. Ceram. Sot. 63,481-485.
BLANK J. G., STOLPER E. M., and ZHANG Y. ( 1991) Diffusion of CO? in rhvolitic melt. EOS 72. 3 12.
BOND-W. L: ( 195 1 f Making smkl spheres. Rev. ScL I~sir~~rn. 22, _ - - _- matite quartz over the disseminated and pipe style Sn-min- eralized granitic body at Zaaiplaats Mine. Within the min- eralized granitic body, fluid inclusions contain a high amount of Cl. The presence of the COz-richer fluid phase suggests a possible involvement in the early stage of pipe formation. The degassing of rhyolitic magma during ascent and em- placement was separated as two stages by WESTRICH et al. ( 1988 ). The first stage due to the rapid decompression in- volves loss of HsO-rich fluid until a close approach to litho- static equilibrium is achieved. The second stage boiling is a slower process and produces a Cl-rich fluid. On the basis of our data, it appears that these two stages relate to the differ- ences in the diffusion rate of the volatiles in the melt. The rapid processes favor HzO-rich and/or CO&ch fluids be- cause of their fast diffusion. On the other hand, a slow process favors Cl-rich fluid.
344-345. BURNHAM C. W. ( 1967) Hydrothermal fluids at the magmatic stage.
In Geochemistry of hydrothermal ore deposits (ed. H. L. BARNES), pp. 34-76. Holt, Rhinehart and Winston Inc.
BURNHAM C. W. f 1979) Magmas and hydrothe~~ fluids. In Geo- chemistry of hydrothermal ore deposits, 2nd Edition fed. H. L. BARNES), pp. 71-136. Wiley & Sons.
CANDELA P. A. and HOLLAND H. D. ( 1984) The partitioning of copper and molybdenum between silica melts and aqueous fluids. Geochim. Cosm~h~m. Acta 48,373-380.
CRANK J. ( 1975) The mathematics ofdt~~s~on. CIarenden Press. DELANEY J. R. and KARSTEN J. L. ( 1981) Ion microprobe studies
of water in silicate melts: concentration-dependent diffusion in obsidian, Earth Planet. Sci. Lett. 52, 191-202.
DINGWELL D. B. ( I987) Melt viscosities in the system NaAISisOB- HzO-F,O_, . In ~agrnati~~ Processes: P~~ys~~o&hern~ca[ Principles (ed. B. 0. MYSEN), pp. 423-433. Geochemical Society.
DINGWELL D. B. ( 1990) Effect of structure relaxation on cationic tracer diffusion in silicate melts. Chem. Geol. 82, 209-216.
DINGWELL D. B. and SCARE C. M. ( 1984) Chemical diffusion of fluorine in iadeite melt at high nressure. Geochim. Cosm~him. Acta 48,25i 7-2525. - .
DINGWELL D. B. and SCARFE C. M. ( 1985) Chemical diffusion of fluorine in melts in the system Na20-A1203-Si02. Earth Planet. Sci. L&f. 73, 377-384.
CONCLUSIONS
The present study shows that the diffusion of Cl in both drv and hvdrous eranitic magma conforms to an Arrhenius
a d
law. Compared with that of other anions and volatiles, the pressure effect on the diffusivity of Cl is relatively large at the pressures up to 4.4 kbar, which probably results from its large radius and the relatively low run temperature. The diffusivity of Cl in the melt is enhanced by an increase in the concen- tration of H+, but reduced by high initial concentration of NaCl in the starting solution. The presence of 2-3 wt% Hz0 in the melt increases the diffusivity of Cl dramatically, but at higher Hz0 contents the Cl ditfusivity is much less affected. This-probably reflects a structural change or a different dif- fusion mechanism in the melt. The high temperature diffusion of Cl in dry LGB glass does not satisfy the Eyring equation, which imply that the diffusion is not directly controlled by viscosity. Comparison with the diffusivity of other anions and using geological evidence, we concluded that Cl may be differentiated during magma evolution.
DINGWELL D. B. and WEBB S. L. ( 1989) Structure relaxation in silicate melts and non-newtonian melt rheology in geologic pro- cesses. Phys. Chem. Mineral. 16, 508-5 16.
DINCWELL D. B. and WEBB S. L. ( 1990) Relaxation in silicate melts. Eur. J. Mineral. 2,427-449.
ELPHICK S. C. and GRAHAM C. M. ( 1988) The effect of hydrogen on oxygen diffusion in quartz: Evidence for fast proton transients? Nature 335, 243-245.
EUGSTER H. P. ( 1985) Granites and hydrothermal ore deposits: a geochemical framework. Mineral. Mag. 49, 7-23.
EUGSTER H. P. ( 1986) Minerals in hot water. Amer. Mj~erui. 71, 655-673.
FARVER J. R. and YUNW R. A. ( 1991) Oxygen diffusion in quartz: Dependence on temperature and water fugacity. Chem. Geol. 90, 55-70.
FRANTZ J. D. and MARSHALL W. L. ( 1984) Electrical conductances and ionization constants of sahs, acids, and bases in supercritical aqueous fluids. 1. Hydrochloric acid from 100” to 700°C and at pressures to 4000 bars. Amer. J. Sri. 284,65 l-667.
FRANTZ J. D., POPP R. K., and BOCTOR N. Z. ( 1981) Mineral-
Acknowledgments-We are grateful for many analyses made for us by Mr. Detlef Krausse at the Bayerisches Geoinstitut. Also we wish to express our thanks to Mr. Gene Harris for the instructions of the SEM anaiysis. We thank Drs. D. B. Dinawell and S. Chakrabortv for their constructive comments on the initial manuscript. This siudy was supported by the National Science Foundation (grant EAR-
solution equilibria. V. Solubilities of rock-forming mineraIs in su- percritical fluids. Geochim. Cosmochim. Acta 45,69-77.
FUJII T. ( 1981) Ca-Sr chemical diffusion in melts of albite at hi& temperature and pressure. EOS 62, 429, (abstr.) ,
GOLDSMITH J. R. I 1987) Al/Si interdiffusion in albite: The effect of pressure and the role ‘of hydrogen. Contrib. Mineral. Petrol. 95, 31 l-321.
Diffusion of Cl in silicate melts 123
GOLDSMITH J. R. ( 1988) Enhanced Al/B diffusion in KAl&Os at high pressure: the effect of hydrogen. J. Geol. 96, 109-124.
HARRISON T. M. and WATSON E. B. ( 1983) Kinetics of zircon dis solution and zirconium diffusion in granitic melts of variable water content. Contrib. Mineral. Petrol. 84,66-72.
HARRISON T. M. and WAIXON E. B. ( 1984) The behavior of apatite during equilibrium and kinetic considerations. Geochim. Cos- mochim. Acta 48, 1467-1477.
HAMILTON D. L. and HENDERSON C. M. B. ( 1968) The preparation of silicate compositions by a gelling method. Mineral. Mag. 36, 832-838.
HENDERSON P., NOLAN J., CUNNINGHAM G., and J_QWRY R. K. ( 1985) Structure controls and mechanisms of diffusion. Contrib. Mineral. Petrol. 89,263-272.
HIRAYAMA C. and CAMP F. E. ( 1969) The effect of fluorine and chlorine substitution on the viscosity and fining of soda-lime and a potassium-barium silicate glass. Glass Tech. IO, 123- 127.
HOFMANN A. W. ( 1980) Diffusion in natural silicate melts: a critical review. In Physics ofMagmatic Processes (ed. R. B. HARGRAVES), pp. 385-4 18. Princeton Univ. Press.
HOLLOWAY J. R. ( 197 I ) Internally heated pressure vessels. In Re- search for High Pressure and Temperature (ed. G. C. ULMER), pp. 2 17-258. Springer-Verlag.
JAMBON A. ( 1982) Tracer diffusion in granitic melts. J. G. R. 87, 10797-10810.
JAMB~N A., ZHANG Y., and STOLPER E. M. (1992) Experimental dehydration and estimation of Duzo at low water contents. Gec- chim. Cosmochim. Acta 56,2931-2935.
DE JONG B. H. W. S. and BROWN G. E. ( 1980) Polymerization of silicate and aluminate tetrahedra in glasses, melts and aqueous solutions. II. The network modifying effects of Mg’+, K+, Na+, Li+, H+, OH-, F-, H20, CO*, and H,O+ on silicate polymers. Geochim. Cosmochim. Acta 44, 1627-1642.
KAR~TEN J. L.. HOLLOWAY J. R.. and DELANEY J. R. I 1982) Ion . I
microprobe studies of water in silicate melts: temperature-depen- dence water diffusion in obsidian. Earth Planet. Sci. Lett. 59,420- 428.
KEPPLER H. and WYLLIE P. J. ( 1989) Partitioning of MO, W, U, Cu, and Sn between granitic melt and fluid phase. EOS 70, 1403.
KILINC I. A. and BURNHAM C. W. ( 1972) Partitioning of chlorine between a silicate melt and coexisting aqueous phase from 2 to 8 kilobars. Econ. Geol. 67, 231-235.
KUSHIRO I. ( 1983) Effect of pressure on the diffusivity of network- forming cations in melts of jadeitic compositions. Geochim. Cos- mochim. Acta 47, 1415-1422.
KOSTER VAN GROOS A. F. and WYLLIE P. J. ( 1969) Melting rela- tionships in the system NaAlSi308-NaCl-H20 to 1 kilobar pres- sure. J. Geol. 77, 58 I-605.
LANFORD W. A., DAVIS K., LAMARCHE P., LAURSEN T., GROLEAU R., and DOREMUS R. H. ( 1979) Hydration of soda-lime glass. J. Non-Crystal. Solids 33,249-266.
MARSHALL W. L. and FRANCK E. U. ( 1981) Ion product of water substance, 0- I OOO”C, 1 - 10,000 bars new international formulation and its background. J. Phys. Chem. Ref: Data 10,295-304.
MOORE J. N., ADAMS M. C., and LEMIEUX M. M. ( 1992) The for- mation and distribution of COz-enriched fluid inclusions in epi- thermal environments. Geochim. Cosmochim. Acta 56,49-65.
NEUVILLE D. R., COURTIAL P., DINGWELL D. B., and RICHET P. ( 1993) Thermodynamic and rheological properties ofrhyolite and andesite melts. Contrib. Mineral. Petrol. 113, 572-58 1.
OELKERS E. H. and HELGESON H. C. ( 1988) Calculation ofthe ther- modynamic and transport properties of aqueous species at high pressure and temperature: Dissolution constants for supercritical alkali metal halide at temperatures from 400 to 800°C and pressures from 500 to 4000 bar. J. Phys. Chem. 92, 1631-1639.
PER~IKOV E. S., ZHARIKOV V. A., BUKHTIYAROV P. G., and POL%KOY S. F. ( 1990) The effect of volatiles on the properties of magmatic melts. Eur. .I. Mineral. 2, 621-642.
POLLARD P. J., ANDREW A. S., and TAYLOR R. G. ( 1991) Fluid inclusion and stable isotope evidence for interaction between granites and magmatic hydrothermal fluids during formation of disseminated and pipe-style mineralization at the Zaaiplaats tin mine. Econ. Geol. 86, 121-141.
PREECE R. K. and BEANE R. E. ( 1982) Contrasting evolutions of hydrothermal alteration in quartz monzonite and quartz diorite wall rocks at the Sienite porphyry copper deposit, Arizona. Econ. Geol. 77, 1621-1641.
ROEDDER E. ( 1984) Fluid inclusions. Rev. Mineral. 12. SHAW H. R. ( 1972 j Viscositv of maamatic silicate liouids: An em-
pirical method of prediction. Amer. .I Sci. 272, 876-893. SHAW H. R. ( 1974) Diffusion of Hz0 in granitic liquids, I. Experi-
mental data. In Geochemical Transport and Kinetics (ed. A. W. HOFMANN et al.); Carnegie Inst. Wash. Publ. 634, 139-154.
STOLPER E. M. ( 1982) Speciation of water in silicate melts. Geochim. Cosmochim. Acta 46,2609-2620.
THOMAS A. V. and SFQONER E. T. C. ( 1992) The volatile geochem- istry of magmatic H,O-COz fluid inclusion from the Tanco zoned granitic pegmatite, Southeastern Manitoba, Canada. Geochim. Cosmochim. Acta 56, 121-135.
TUTTLE 0. F. ( 1949) Two pressure vessels for silicate-water studies. Geol. Sot. Amer. Bulletin 60, 1727-1729.
TUTTLE 0. F. and BOWEN N. L. ( 1958) Origin ofgranite in the light of experimental studies in the system NaAISi308-KAlSi308SiO2- H20. Geol. Sot. Amer. Mem. 74.
VISSER W. and KOSTER VAN GRAMS A. F. ( 1979) The effect of pres- sure on liquid immiscibility in the system K20-FeO-A1203-Si02- Ti02-P205. Amer. .I. Sci. 279, 1160-I 175.
WATSON E. B. ( 1979) Diffusion of Cesium Ions in HZO-saturated granitic melt. Science 205, 1259-1260.
WATSON E. B. ( 198 1) Diffusion in magmas at depth in the earth: The effects of pressure and dissolved water. Earth Planet. Sci. Lett. 52,291-301.
WATSON E. B. ( 1982) Basalt contamination by continental crust: some experiments and models. Contrib. Mineral. Petrol. 80, 73- 87.
WAIXON E. B. ( 199 1) Diffusion of dissolved CO2 and Cl in hydrous silicic to intermediate magmas. Geochim. Cosmochim. Acta 55, 1897-1902.
WEBSTER J. D. ( 1990) Partitioning of F between H20 and CO2 fluids and topaz rhyohte melt. Contrib. Mineral. Petrol. 104,424- 438.
WATSON E. B. and BENDER J. F. ( 1980) Diffusion of cesium, sa- marium, strontium and chlorine in molten silicate at high tem- peratures and pressures. Geol. Sci. Am. Abstr. Progr 12, 545.
WATSON E. B., SNEERINGER M. A., and Ross A. ( 1982) Diffusion of dissolved carbonate in magmas: experimental results and ap phcations. Earth Planet. Sci. Lett. 61, 346-358.
WEBB S. L. and DINGWELL D. B. ( 1989) Non-Newtonian rheology of igneous melts at high stresses and strain rates: Experimental results for rhyohte, andesite, basalt and nephelinite. J. G. R. 95, 15,695-15,701.
WEBSTER J. D. ( 1992) Water solubility and chlorine partitioning in Cl-rich granitic systems: Effects of melt composition at 2 Kbar and 800°C. Geochim. Cosmochim. Acta 56.679-687.
WEBSTER J. D. and HOLLOWAY J. R. ( 1988) Experimental constraints on the partitioning of Cl between topaz rhyolite melt and Hz0 and Hp0+C02 fluids: New implications for aranitic differentiation and ore deposition. Geochim.-Cosmochim. Acta 52,2901-2105.
WESTRICH H. R., STOCKMAN H. W., and EICHELBERGER J. C. ( 1988) Degassing of rhyolitic magma during ascent and emplacement. J. G. R. 93,6503-65 I 1.
WINCHELL P. and NORMAN J. H. ( 1969) A study of the diffusion of radioactive nuclides in molten silicates at high temperatures. In High Temperature Technology: Third International Symposium Asilomar 1967, pp. 479-492.
WYLLIE P. J. and TUTTLE 0. F. ( 1964) Experimental invest&ions of silicate systems containing two volatile constituents. III. The effect of SO?, P,O,. HCI and Li,O. in addition to H,O. on the - _. melting temperatures ofalbite and granite. Amer. .I. Sci:292,930- 939.
ZHANG Y. and STOLPER E. M. ( 1991) Water diffusion in a basaltic melt. Nature 351, 306-309.
ZHANG Y., STOLPER E. M., and WA.SSERBURG G. J. ( 1991) DiBusion of water in rhyolitic glasses. Geochim. Cosmochim. Acta 55,441- 456.
Copyright © 2022 FDOKUMEN