Trends of stratospheric chlorine and fluorine reservoir species
Upload
khangminh22Category
view
2download
0
water
Article
Impact of Suspended Solids and Organic Matter on Chlorineand UV Disinfection Efficiency of Greywater
Eran Friedler 1 , Diana F. Chavez 2, Yuval Alfiya 1, Yael Gilboa 1 and Amit Gross 2,*
�����������������
Citation: Friedler, E.; F. Chavez, D.;
Alfiya, Y.; Gilboa, Y.; Gross, A. Impact
of Suspended Solids and Organic
Matter on Chlorine and UV
Disinfection Efficiency of Greywater.
Water 2021, 13, 214. https://doi.org/
10.3390/w13020214
Received: 4 December 2020
Accepted: 13 January 2021
Published: 18 January 2021
Publisher’s Note: MDPI stays neutral
with regard to jurisdictional claims in
published maps and institutional affil-
iations.
Copyright: © 2021 by the authors.
Licensee MDPI, Basel, Switzerland.
This article is an open access article
distributed under the terms and
conditions of the Creative Commons
Attribution (CC BY) license (https://
creativecommons.org/licenses/by/
4.0/).
1 Faculty of Civil & Environmental Engineering, Technion—Israel Institute of Technology, Technion,Haifa 3200, Israel; [email protected] (E.F.); [email protected] (Y.A.); [email protected] (Y.G.)
2 Zuckerberg Institute for Water Research, Blaustein Institutes for Desert Research, Sede Boqer Campus,Ben-Gurion University of the Negev, Midreshet Ben-Gurion 84990, Israel; [email protected]
* Correspondence: [email protected]
Abstract: Reusing greywater (GW) can lower domestic water consumption. However, the GW mustbe treated and disinfected for securing user health. This research studied at the laboratory scale, andin flow-through setups, which are generally used in full-scale GW treatment the disinfection efficiencyof the two commonly used technologies (a) chlorination and (b) low-pressure UV irradiation. Thedisinfection methods were studied under a commonly found range of total suspended solids (TSS;3.9–233 mg/L) and 5-d biochemical oxygen demand (BOD5) concentrations (0–107 mg/L) as arepresentative/proxy of bioavailable organic matter. The negative effect of TSS began even at lowconcentrations (<20 mg/L) and increased consistently with increasing TSS concentrations across allthe concentrations tested. On the other hand, the negative effect of BOD5 on FC inactivation wasobserved only when its concentration was higher than 50 mg/L. Multiple linear regression modelswere developed following the laboratory results, establishing a correlation between FC inactivationby either chlorination or UV irradiation and initial FC, TSS, and BOD5 concentrations. The modelswere validated against the results from the flow-through reactors and explained the majority of thevariability in the measured FC inactivation. Conversion factors between the laboratory scales andthe flow-through reactor experiments were established. These enable the prediction of the requiredresidual chlorine concentration or the UV dose needed for an on-site flow-through reactor. Thisapproach is valuable from both operational and research perspectives.
Keywords: BOD5; suspended solids; chlorination; UV disinfection; greywater; chlorine tablet;chlorine flow-through chamber; flow-through UV reactor
1. Introduction
Greywater (GW; domestic wastewater excluding toilet water) reuse for non-potablepurposes, such as garden irrigation, can decrease domestic water demand and, thus, miti-gate the pressure on depleted water resources while reducing household water costs [1].However, untreated GW contains pathogens and other pollutants and may pose environ-mental and health risks if used without treatment and disinfection [2,3]. Chlorination andlow-pressure UV irradiation are probably the most widely used disinfection methods insmall, on-site GW systems [4–6].
Chlorine is dependably effective against a wide spectrum of pathogenic microorganismsand is considered to be a cost-effective disinfectant [3,7]. In addition, residual chlorine remainsin the effluent after application, ensuring continued disinfection throughout the conveyancesystem, reducing potential regrowth [8,9]. Furthermore, chlorine dosing is flexible and can becontrolled by simple, low-cost devices. Nonetheless, chlorine is toxic and corrosive; thus, itsstorage, shipping, handling, and application must be managed responsibly.
UV irradiation prevents replication of microorganisms through a photochemicalreactions that damage their nucleic acids in either DNA or RNA [10]. The main reasons forthe use of low-pressure UV (254 nm) irradiation in small on-site systems are: (1) it does
Water 2021, 13, 214. https://doi.org/10.3390/w13020214 https://www.mdpi.com/journal/water
Water 2021, 13, 214 2 of 12
not require chemical additives (making transport, storage, and dosing irrelevant), (2) it hasbeen found to be effective on numerous pathogens including viruses and protozoans whichwere found to be chlorine-resistant, (3) it is cost-effective on both initial capital investmentand operational levels, and (4) both the equipment operation and maintenance are simpleand safe [4].
It should be noted that varying disinfection efficiencies have been reported in full-scaleinstallations [11], and some studies have demonstrated that sub-standard water qualitycan reduce the efficiency of both chlorine and UV disinfection. Specifically, the presenceof particulate matter and organic substances in the water may negatively impact thesedisinfection methods’ performances [4,12]. In the case of chlorination, this negative effectis expressed by increasing the chlorine demand as dissolved and suspended organic matteris oxidized by chlorine. Thus, the overall disinfection efficiency decreases. Microorganismsattach to particles present in water, thus reducing the chance for efficient contact betweenthe microorganism and the chlorine, compared to non-attached bacteria [12,13]. Evenmore, the presence of organic matter may further reduce chlorine disinfection efficiencyby stabilizing microbial cell membranes [14]. Lastly, the presence of organic matter maylead to the formation of unwanted disinfection by-products (including known or suspectedcarcinogens), thereby not only impeding the disinfection process [15] but also posing ahealth hazard. Winward et al. [12] investigated the effects of organic and particulate matteron GW chlorine disinfection in a batch system, and claimed that an increase in the organicmatter enhanced the chlorine demand but did not affect total coliforms’ resistance to chlo-rine. However, these authors recommended removing organic matter prior to chlorinationin order to reduce the chlorine demand and the potential for microbial regrowth.
In the case of UV irradiation, particles interfere with the exposure of the target microor-ganisms to the irradiation [15–17], either by shielding them, or by absorbing or scatteringthe light, thus reducing the UV dose received by the microorganisms and, consequently,the method’s efficiency. The presence of particulate matter and organics in GW has beennoted in many studies, yet only a few discussed their adverse impact on UV disinfectionefficiency. For example, the authors of [4] studied disinfection of artificial GW, proposedlimits of 60 mg/L of suspended solids and a turbidity of 125 NTU, beyond which GWcannot practically be disinfected to achieve a 4-log reduction of fecal coliforms (FC), re-gardless of UV reactor dimensions. Ref. [18] recommended removing particles throughfiltration to obtain a turbidity level of 2 NTU (Nephelometric Turbidity Units), to increaseUV disinfection efficiency. Other studies have focused on the particle sizes that blockmicroorganisms from UV light [12], and the specific particle types associated with certainbacteria in treated GW that cause bacterial shielding from UV disinfection [19].
Interestingly, no systematic information exists regarding the combined impact of sus-pended solids and organic matter (measured as 5-d biochemical oxygen demand (BOD5)),on low-pressure UV disinfection and chlorine disinfection in both batch and continuous-flow disinfection units. This study aimed to test the efficiency of both disinfection methodson GW under a range of total suspended solids (TSS) and BOD5 concentrations. Experi-ments were performed in controlled batch laboratory setups and in flow-through reactors.Moreover, the study’s objectives included the development of regression models to predictthe impact of TSS and BOD5 on chlorine and UV disinfection efficiency in both setups.
2. Materials and Methods
The research was performed in two stages. Initially, treated GW samples, varying intheir TSS and BOD5 concentrations, were disinfected in a batch setup by either a hypochlo-rite solution or UV radiation using a collimated beam. The results obtained from this stagewere used to develop two multiple linear regression models (one for chlorination and theother for UV irradiation). In the second stage, treated GW, from on-site treatment systems(outlined underneath), was disinfected in a flow-through disinfection unit using one of thetwo methods: chlorine tablets or commercial low-pressure UV. The models’ applicabilityand verification were studied, and then compared with the results of the second stage.
Water 2021, 13, 214 3 of 12
2.1. GW Treatment System
Eleven single-family full-scale recirculating vertical flow constructed wetland (RVFCW)systems were used for treating domestic GW (Figure S1). The RVFCW system comprisedtwo 500-L plastic containers (1.0 m × 1.0 m × 0.5 m) placed on top of each other. The topcontainer that had a perforated bottom held a planted three-layered bed, while the lowercontainer functioned as a reservoir. The bed consisted of a 10-cm lower layer of limestonepebbles, with a 35-cm middle layer of tuff gravel, and a 5-cm upper layer of woodchips.GW was pumped from a 200-L settling-equalization tank from which it was conveyed tothe top of the bed. From there, it trickled through the bed layers (unsaturated flow) andinto the reservoir. GW was recirculated from the reservoir to the upper bed at a rate ofabout 300 L/h for 8 h, after which it was filtered through a 130-µm filter and then reusedfor garden irrigation. Additional details about the system can be found in [20,21].
2.2. Batch Experiment
Treated domestic GW samples (1 L) from the 11 RVFCW were collected at least fourtimes along the study and brought to the laboratory shortly after collection in a cooler. Thequality of the pre-disinfected treated GW was examined for the following parameters: TSSby the gravimetric method, BOD5 using standard 300-mL bottles, % irradiation transmis-sion at 254 nm by a spectrophotometer (Genesys 10, Thermo), turbidity using a HACH2100P Turbidimeter, and FC by membrane-filtration methods using mTEC agar (Lesher,Michigan USA, Acumedia). All analyses followed standard procedures [22].
Treated GW samples were examined either as is or after they were subjected toconcentration increases in either TSS (final TSS concentrations ranging from 1–130 mg/L)or organic matter (measured as BOD5 with concentrations ranging from 3–100 mg/L) or acombination of both suspended particles and organic matter concentrations at differentratios. Increasing the TSS was conducted by adding different amounts of powdered driedsuspended solids to the treated GW. The suspended solids were prepared by concentratingraw GW (centrifugation at 6000 rpm for 5 min) and drying the pellet at 60 ◦C for 48 h.Organic matter concentration was increased by introduction of different quantities of0.2 µm- filtered raw GW with known BOD5 concentrations to the treated GW. The requiredcomponents were stirred in a beaker for 15 min to produce a uniform mixture. Additionally,FC were introduced by adding < 0.5 mL/L GW sample of kitchen effluent to ensure FCconcentrations of 104 to 105 CFU/100 mL. Overall, 432 combinations were tested.
Subsamples were analyzed before and after disinfection, when disinfection efficiencywas determined by calculating the log inactivation of FC.
2.2.1. Chlorination Experiment
The efficient application of a disinfection agent should take into consideration therequired dose, which can be achieved by varying the chlorine concentration and disin-fection contact time. The required dose varies based on chlorine demand (wastewatercharacteristics) and residual chlorine requirements. According to [23] the free residualchlorine concentration should be ≥0.5 mg/L after at least 30 min contact time at pH < 8.0.Subsamples were disinfected in a batch mode. Initially, the chlorine demand of the subsam-ples was determined. For this, aliquots of 25 mL were exposed to four different chlorinedoses of 0.5, 1, 3, and 6 mg/L. Samples were gently stirred and after 1 h, the total and freeresidual chlorine levels were determined by the DPD method [22].
2.2.2. Collimated Beam Setup
A quasi-parallel beam bench-scale UV apparatus (Trojan Technologies Inc., Ontario,Canada) was used to test the efficiency of UV disinfection (Figure S2). The system consistedof an 11-W low-pressure mercury vapor germicidal UV lamp, emitting monochromatic UVradiation at 254 nm directly over an inner 25-cm-long non-reflective collimated beam witha diameter of 40 mm. An ILT 1700 radiometer (International Light, Peabody, Massachusetts,USA) with a detector sensitive at 254 nm (IL photonic SED240) was used to measure
Water 2021, 13, 214 4 of 12
the intensity of the incident UV light. Samples (25 mL aliquots) were placed under thecollimation tube in a 50 × 35 mm crystallization dish and mixed with stirring bar (~110 rpm)allowing a uniform UV dose application to the entire sample.
Control over the UV dose was conducted by a shutter that allowed changing theexposure time of the stirred sample. Samples were exposed to three UV irradiation doses:7.5, 15, and 30 mJ/cm2. Exposure times for each UV dose depended on several factors,including: incident intensity, reflection, petri factors, divergence, and water factors. Themethods used for determining these factors are described in [24]. The divergence andreflection factors were constant in all experiments, and their values were 0.960 and 0.975,respectively. The petri factor was calculated every week and averaged 0.88 ± 0.05. Thewater factor varied from 0.40 to 0.89, and the incident intensity measured at the watersurface varied from 0.30 to 0.32 mW/cm2.
2.3. Flow-Through Setups
Treated GW samples (10 L) were taken from the on-site full-scale single-family RVFCW(Section 2.1 above), immediately transported to the laboratory, and served as inflow to thecontinuous-flow disinfection units. All samples were analyzed for TSS, BOD5, % irradiationtransmission at 254 nm, turbidity, and FC as described above. After disinfection, sampleswere analyzed again for FC.
2.3.1. Flow-Through Chlorination Chamber
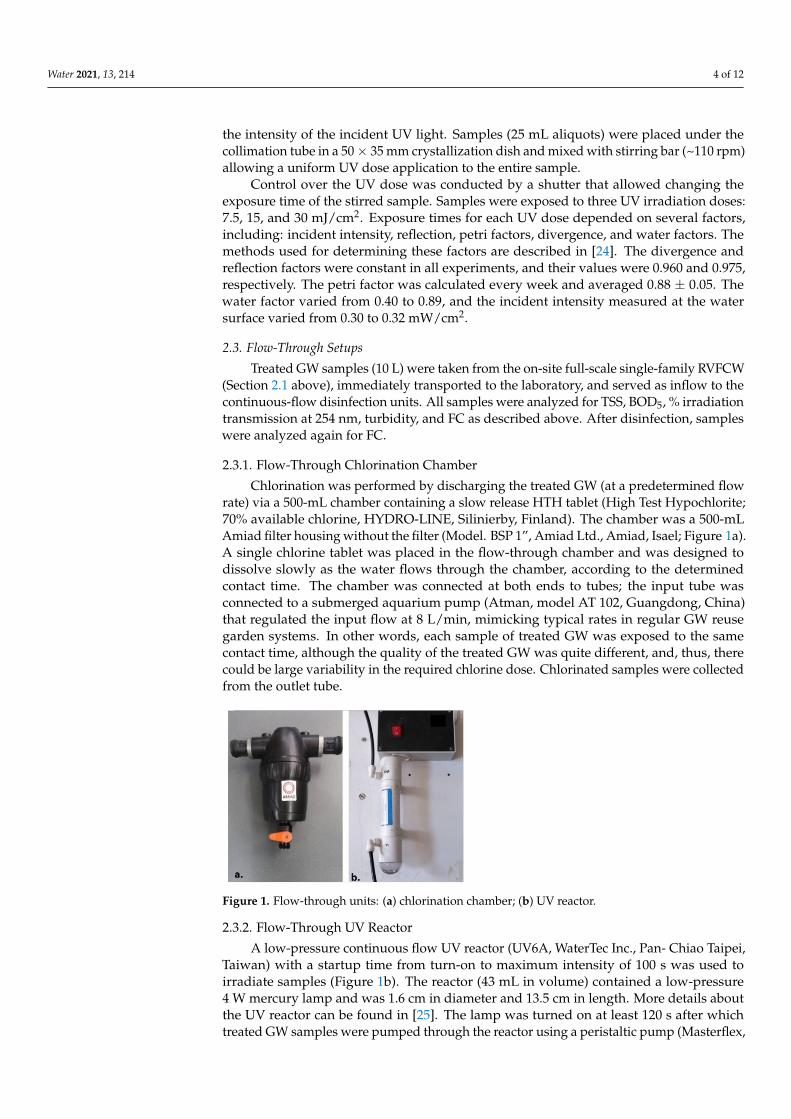
Chlorination was performed by discharging the treated GW (at a predetermined flowrate) via a 500-mL chamber containing a slow release HTH tablet (High Test Hypochlorite;70% available chlorine, HYDRO-LINE, Silinierby, Finland). The chamber was a 500-mLAmiad filter housing without the filter (Model. BSP 1”, Amiad Ltd., Amiad, Isael; Figure 1a).A single chlorine tablet was placed in the flow-through chamber and was designed todissolve slowly as the water flows through the chamber, according to the determinedcontact time. The chamber was connected at both ends to tubes; the input tube wasconnected to a submerged aquarium pump (Atman, model AT 102, Guangdong, China)that regulated the input flow at 8 L/min, mimicking typical rates in regular GW reusegarden systems. In other words, each sample of treated GW was exposed to the samecontact time, although the quality of the treated GW was quite different, and, thus, therecould be large variability in the required chlorine dose. Chlorinated samples were collectedfrom the outlet tube.
Water 2021, 13, x FOR PEER REVIEW 4 of 12
2.2.2. Collimated Beam Setup A quasi-parallel beam bench-scale UV apparatus (Trojan Technologies Inc., Ontario,
Canada) was used to test the efficiency of UV disinfection (Figure S2). The system con-sisted of an 11-W low-pressure mercury vapor germicidal UV lamp, emitting monochro-matic UV radiation at 254 nm directly over an inner 25-cm-long non-reflective collimated beam with a diameter of 40 mm. An ILT 1700 radiometer (International Light, Peabody, Massachusetts, USA) with a detector sensitive at 254 nm (IL photonic SED240) was used to measure the intensity of the incident UV light. Samples (25 mL aliquots) were placed under the collimation tube in a 50 × 35 mm crystallization dish and mixed with stirring bar (~110 rpm) allowing a uniform UV dose application to the entire sample.
Control over the UV dose was conducted by a shutter that allowed changing the ex-posure time of the stirred sample. Samples were exposed to three UV irradiation doses: 7.5, 15, and 30 mJ/cm2. Exposure times for each UV dose depended on several factors, including: incident intensity, reflection, petri factors, divergence, and water factors. The methods used for determining these factors are described in [24]. The divergence and re-flection factors were constant in all experiments, and their values were 0.960 and 0.975, respectively. The petri factor was calculated every week and averaged 0.88 ± 0.05. The water factor varied from 0.40 to 0.89, and the incident intensity measured at the water surface varied from 0.30 to 0.32 mW/cm2.
2.3. Flow-Through Setups Treated GW samples (10 L) were taken from the on-site full-scale single-family
RVFCW (Section 2.1 above), immediately transported to the laboratory, and served as in-flow to the continuous-flow disinfection units. All samples were analyzed for TSS, BOD5, % irradiation transmission at 254 nm, turbidity, and FC as described above. After disin-fection, samples were analyzed again for FC.
2.3.1. Flow-Through Chlorination Chamber Chlorination was performed by discharging the treated GW (at a predetermined flow
rate) via a 500-mL chamber containing a slow release HTH tablet (High Test Hypochlorite; 70% available chlorine, HYDRO-LINE, Silinierby, Finland). The chamber was a 500-mL Amiad filter housing without the filter (Model. BSP 1″, Amiad Ltd., Amiad, Isael; Figure 1a). A single chlorine tablet was placed in the flow-through chamber and was designed to dissolve slowly as the water flows through the chamber, according to the determined con-tact time. The chamber was connected at both ends to tubes; the input tube was connected to a submerged aquarium pump (Atman, model AT 102, Guangdong, China) that regu-lated the input flow at 8 L/min, mimicking typical rates in regular GW reuse garden sys-tems. In other words, each sample of treated GW was exposed to the same contact time, although the quality of the treated GW was quite different, and, thus, there could be large variability in the required chlorine dose. Chlorinated samples were collected from the out-let tube.
Figure 1. Flow-through units: (a) chlorination chamber; (b) UV reactor. Figure 1. Flow-through units: (a) chlorination chamber; (b) UV reactor.
2.3.2. Flow-Through UV Reactor
A low-pressure continuous flow UV reactor (UV6A, WaterTec Inc., Pan- Chiao Taipei,Taiwan) with a startup time from turn-on to maximum intensity of 100 s was used toirradiate samples (Figure 1b). The reactor (43 mL in volume) contained a low-pressure4 W mercury lamp and was 1.6 cm in diameter and 13.5 cm in length. More details aboutthe UV reactor can be found in [25]. The lamp was turned on at least 120 s after whichtreated GW samples were pumped through the reactor using a peristaltic pump (Masterflex,

Water 2021, 13, 214 5 of 12
Cole-Parmer Instrument Co., Chicago, IL, USA) at a flow rate of 24 L/h. The iodide–iodatechemical actinometry (for details see [25]) was used to determine the actual average UVdose in the reactor which was found to be 44 mJ/cm2, with a calculated lamp intensity of2.8 mW/cm2 and a mean residence time of 14 s.
2.4. Multiple Linear Regression (MLR) Models
The results of the batch experiments were used to develop MLR models. The modelsare intended to predict the log inactivation of FC based on water quality parameters andapplied disinfectant dose (chlorine or UV irradiation). The water quality parameters chosenfor the model (TSS, BOD5 and log FC concentrations in the GW prior to disinfection) wereexpected to significantly affect the model prediction and the coefficient of determination(R2). The developed models were validated against the results from the on-site greywatersamples that were obtained from the flow-through reactor experiments. Finally, the modelswere used to propose a conversion factor between the chlorination or UV collimated beambatch laboratory setups and the experimental continuous-flow reactors results.
3. Results and Discussion3.1. Batch Experiments
Treated GW samples, containing different BOD5 and TSS concentrations, were dis-infected by chlorine or UV irradiation. In order to distinguish between the effect of eachparameter (TSS or dissolved BOD5) on FC reduction, the results of the batch disinfectionexperiments (chlorination or UV irradiation) were divided into two categories: (1) chang-ing the TSS concentration while keeping the BOD5 concentration below 10 mg/L, and (2)changing the BOD5 concentration while keeping the TSS concentration below 10 mg/L.These thresholds were chosen in accordance with the Israeli government’s regulation forunlimited treated wastewater reuse in irrigation [26]. It should be noted that the range ofTSS and BOD5 concentrations that were used in this study represent concentrations thatare found in GW [27].
3.1.1. Chlorination
As expected, the presence of TSS and organic matter reduced the chlorination efficiencyof removing FC and was more pronounced for the lower initial chlorine concentrationsused, such as 0.5 and 1 mg/L.
The reduction in chlorination efficiency was usually more pronounced when the TSSconcentration was increased, rather than when BOD5 concentrations were higher (Figure 2).Moreover, the negative effect of TSS began even at low concentrations (<20 mg/L) and in-creased consistently with increasing TSS concentrations across all the concentrations tested.On the other hand, the negative effect of BOD5 on FC inactivation was observed only whenits concentration was higher than 50 mg/L. These results are consistent with previous find-ings [12,13] that suggested that coliforms in GW were associated with particles and weresheltered by them; thus, they were resistant to disinfection, whereas organic matter affectedchlorine demand (and thus residual chlorine concentration) but not bacterial resistance.
Water 2021, 13, x FOR PEER REVIEW 6 of 12
Figure 2. Effects of TSS and dissolved BOD5 concentrations in treated greywater on fecal coliform inactivation within a total residual chlorine concentration range of 0.5–1.5 mg/L for three different scenarios: increase of TSS (a), increase of BOD5 (b), and increase of TSS and BOD5 (c). Colors represent percent inactivation from 96–100 % with a line interval of 0.5%.
3.1.2. Collimated Beam The UV disinfection efficiency of FC increased as the UV dose increased but was neg-
atively affected by the presence of TSS and BOD5 (Figure 3). This was anticipated given that these constituents are known to absorb and/or scatter light, thereby reducing the UV dose absorbed by the bacteria [16,28–30]. These results are in line with [13] who recom-mended filtration prior to UV disinfection, to remove particles, for more efficient disin-fection.
(a) (b) (c)
Figure 3. Effects of TSS and dissolved BOD5 concentrations in treated greywater on fecal coliform inactivation under three UV doses: (a) 7.5, (b) 15 and (c) 30 mJ/cm2. Colors represent percent inactivation from 96–100% with a line interval of 0.5%.
Increasing the TSS concentration reduced the UV disinfection efficiency more than increasing the BOD5 concentration (Figure 4). The reduction in UV FC inactivation effi-ciency was more pronounced at the lower UV doses (7.5 and 15 mJ/cm2). At those of 7.5 mJ/cm2, the threshold for reduction of FC inactivation efficiency was 50 mg/L TSS, reach-ing ~1 log reduction in the inactivation efficiency when the TSS concentration was ~100 mg/L. At UV dose of 15 mJ/cm2 the effect of high TSS on FC removal was lower, and at UV dose of 30 mJ/cm2 was hardly observed. These results accord with previous findings by [4] who stated that a 4-log reduction of FC can be achieved by low-pressure UV irradi-ation when the TSS concentration is kept below 60 mg/L. In contrast, at the highest exam-ined dose of 30 mJ/cm2, nearly 100% FC inactivation was achieved for the entire range of TSS and BOD5 concentrations tested.
BOD5 (dissolved) exhibited a different trend than TSS, with FC inactivation barely changing when the UV dose increased from 15 to 30 mJ/cm2. Almost 100% FC inactivation
Figure 2. Effects of TSS and dissolved BOD5 concentrations in treated greywater on fecal coliform inactivation within a totalresidual chlorine concentration range of 0.5–1.5 mg/L for three different scenarios: increase of TSS (a), increase of BOD5 (b),and increase of TSS and BOD5 (c). Colors represent percent inactivation from 96–100 % with a line interval of 0.5%.

Water 2021, 13, 214 6 of 12
3.1.2. Collimated Beam
The UV disinfection efficiency of FC increased as the UV dose increased but was nega-tively affected by the presence of TSS and BOD5 (Figure 3). This was anticipated given thatthese constituents are known to absorb and/or scatter light, thereby reducing the UV doseabsorbed by the bacteria [16,28–30]. These results are in line with [13] who recommendedfiltration prior to UV disinfection, to remove particles, for more efficient disinfection.
Water 2021, 13, x FOR PEER REVIEW 6 of 12
Figure 2. Effects of TSS and dissolved BOD5 concentrations in treated greywater on fecal coliform inactivation within a total residual chlorine concentration range of 0.5–1.5 mg/L for three different scenarios: increase of TSS (a), increase of BOD5 (b), and increase of TSS and BOD5 (c). Colors represent percent inactivation from 96–100 % with a line interval of 0.5%.
3.1.2. Collimated Beam The UV disinfection efficiency of FC increased as the UV dose increased but was neg-
atively affected by the presence of TSS and BOD5 (Figure 3). This was anticipated given that these constituents are known to absorb and/or scatter light, thereby reducing the UV dose absorbed by the bacteria [16,28–30]. These results are in line with [13] who recom-mended filtration prior to UV disinfection, to remove particles, for more efficient disin-fection.
(a) (b) (c)
Figure 3. Effects of TSS and dissolved BOD5 concentrations in treated greywater on fecal coliform inactivation under three UV doses: (a) 7.5, (b) 15 and (c) 30 mJ/cm2. Colors represent percent inactivation from 96–100% with a line interval of 0.5%.
Increasing the TSS concentration reduced the UV disinfection efficiency more than increasing the BOD5 concentration (Figure 4). The reduction in UV FC inactivation effi-ciency was more pronounced at the lower UV doses (7.5 and 15 mJ/cm2). At those of 7.5 mJ/cm2, the threshold for reduction of FC inactivation efficiency was 50 mg/L TSS, reach-ing ~1 log reduction in the inactivation efficiency when the TSS concentration was ~100 mg/L. At UV dose of 15 mJ/cm2 the effect of high TSS on FC removal was lower, and at UV dose of 30 mJ/cm2 was hardly observed. These results accord with previous findings by [4] who stated that a 4-log reduction of FC can be achieved by low-pressure UV irradi-ation when the TSS concentration is kept below 60 mg/L. In contrast, at the highest exam-ined dose of 30 mJ/cm2, nearly 100% FC inactivation was achieved for the entire range of TSS and BOD5 concentrations tested.
BOD5 (dissolved) exhibited a different trend than TSS, with FC inactivation barely changing when the UV dose increased from 15 to 30 mJ/cm2. Almost 100% FC inactivation
Figure 3. Effects of TSS and dissolved BOD5 concentrations in treated greywater on fecal coliform inactivation under threeUV doses: (a) 7.5, (b) 15 and (c) 30 mJ/cm2. Colors represent percent inactivation from 96–100% with a line interval of 0.5%.
Increasing the TSS concentration reduced the UV disinfection efficiency more than in-creasing the BOD5 concentration (Figure 4). The reduction in UV FC inactivation efficiencywas more pronounced at the lower UV doses (7.5 and 15 mJ/cm2). At those of 7.5 mJ/cm2,the threshold for reduction of FC inactivation efficiency was 50 mg/L TSS, reaching ~1 logreduction in the inactivation efficiency when the TSS concentration was ~100 mg/L. AtUV dose of 15 mJ/cm2 the effect of high TSS on FC removal was lower, and at UV dose of30 mJ/cm2 was hardly observed. These results accord with previous findings by [4] whostated that a 4-log reduction of FC can be achieved by low-pressure UV irradiation whenthe TSS concentration is kept below 60 mg/L. In contrast, at the highest examined doseof 30 mJ/cm2, nearly 100% FC inactivation was achieved for the entire range of TSS andBOD5 concentrations tested.
BOD5 (dissolved) exhibited a different trend than TSS, with FC inactivation barelychanging when the UV dose increased from 15 to 30 mJ/cm2. Almost 100% FC inacti-vation was achieved for the entire range of BOD5 concentrations tested (while keepingTSS < 10 mg/L) for UV doses of 15 mJ/ cm2 and higher. This indicates that TSS influenceUV disinfection efficiency more than dissolved organic substances. These findings weredemonstrated previously by [31] who suggested that adjusting UV absorption throughthe composition of organic extracellular polymeric substances does not have a significanteffect on UV disinfection. Furthermore, Ref. [30] compared the levels of UV absorption ofvarious constituents and determined that wastewater and surface water organic matterexhibit lower UV absorption than suspended solids.

Water 2021, 13, 214 7 of 12
Water 2021, 13, x FOR PEER REVIEW 7 of 12
was achieved for the entire range of BOD5 concentrations tested (while keeping TSS < 10 mg/L) for UV doses of 15 mJ/ cm2 and higher. This indicates that TSS influence UV disin-fection efficiency more than dissolved organic substances. These findings were demon-strated previously by [31] who suggested that adjusting UV absorption through the com-position of organic extracellular polymeric substances does not have a significant effect on UV disinfection. Furthermore, Ref. [30] compared the levels of UV absorption of vari-ous constituents and determined that wastewater and surface water organic matter ex-hibit lower UV absorption than suspended solids.
(a) (b)
Figure 4. Effects of TSS and dissolved BOD5 on FC inactivation under three UV doses: 7, 15 and 30 mJ/cm2: (a) at low BOD5 concentration (<10 mg/L) and (b) at low TSS concentration (<10 mg/L).
3.2. Multiple Linear Regression (MLR) Model MLR models were developed to describe the relationship between log FC inactiva-
tion and TSS, BOD5, log FC concentration of the treated GW (before disinfection), and either the measured total residual chlorine (Equation (1)) or the applied UV dose (Equa-tion (2)).
FCinactivation = β1·[BOD5] + β2·[TSS]+ β3·[log FC raw]+ β4·[residual chlorine] (1)
FCinactivation = β5·[BOD5]+ β6·[TSS]+ β7·[log FC raw]+ β8·[UV dose] (2)
where FCinactivation is in log(cfu/100 mL); BOD5, TSS and residual chlorine is in mg/L; log FC raw is in log(cfu/100 mL); UV dose in mJ/cm2 and β1–β8 are coefficients estimating the explanatory variables (Table 1).
All coefficients were established based on the batch disinfection experiments, and both models were found to be statistically significant (p < 0.0001) with R2 = 0.76 and R2 =
Figure 4. Effects of TSS and dissolved BOD5 on FC inactivation under three UV doses: 7, 15 and 30 mJ/cm2: (a) at lowBOD5 concentration (<10 mg/L) and (b) at low TSS concentration (<10 mg/L).
3.2. Multiple Linear Regression (MLR) Model
MLR models were developed to describe the relationship between log FC inactivationand TSS, BOD5, log FC concentration of the treated GW (before disinfection), and eitherthe measured total residual chlorine (Equation (1)) or the applied UV dose (Equation (2)).
FCinactivation = β1·[BOD5] + β2·[TSS]+ β3·[log FC raw]+ β4·[residual chlorine] (1)
FCinactivation = β5·[BOD5]+ β6·[TSS]+ β7·[log FC raw]+ β8·[UV dose] (2)
where FCinactivation is in log(cfu/100 mL); BOD5, TSS and residual chlorine is in mg/L;log FC raw is in log(cfu/100 mL); UV dose in mJ/cm2 and β1–β8 are coefficients estimatingthe explanatory variables (Table 1).
All coefficients were established based on the batch disinfection experiments, and bothmodels were found to be statistically significant (p < 0.0001) with R2 = 0.76 and R2 = 0.60for chlorination and UV disinfection, respectively (Table 1). Moreover, for chlorination,all explanatory variables were found to be statistically significant, indicating that thatthese chosen variables have a significant influence on the efficiency of chlorine disinfection(in the examined ranges). On the other hand, for the UV collimated beam experiments,dissolved BOD5 concentration was not found to be statistically significant, indicating thatdissolved BOD5 had only a moderate impact (if any) on the UV disinfection efficiency(at the concentrations tested, <20–100 mg/L), and the model’s statistical estimation wassimilar when the BOD5 concentration was excluded/included in the model.
Water 2021, 13, 214 8 of 12
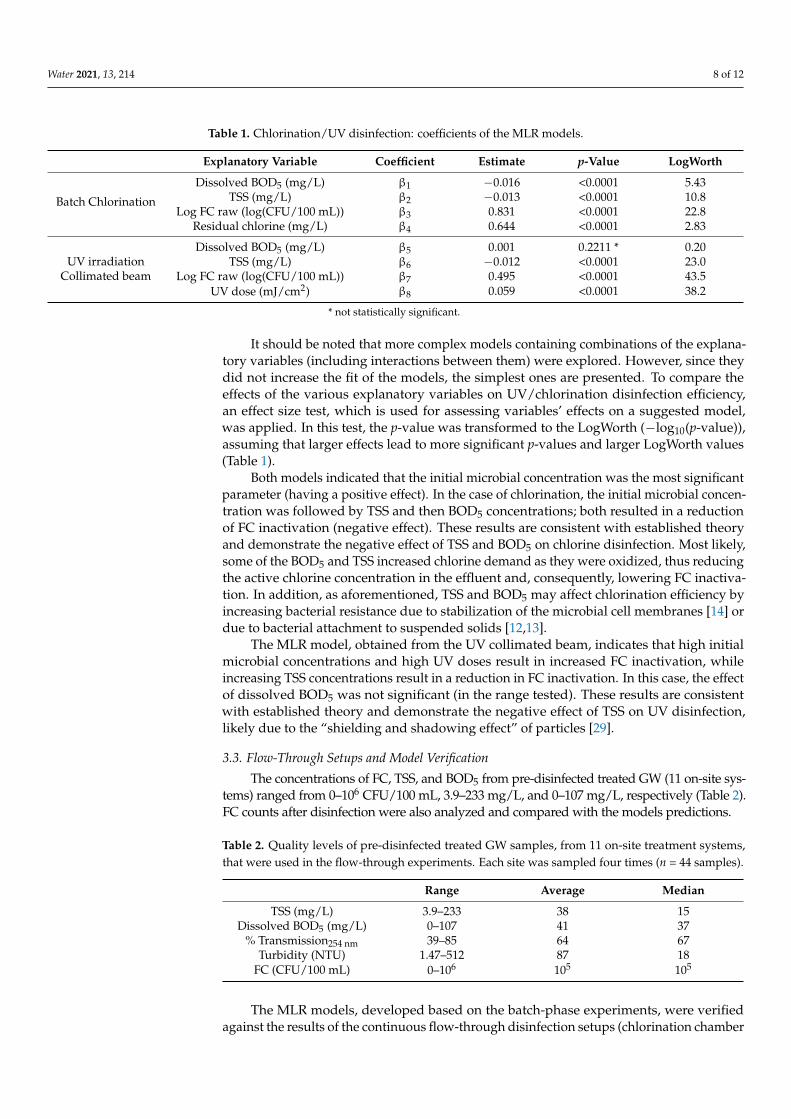
Table 1. Chlorination/UV disinfection: coefficients of the MLR models.
Explanatory Variable Coefficient Estimate p-Value LogWorth
Batch Chlorination
Dissolved BOD5 (mg/L) β1 −0.016 <0.0001 5.43TSS (mg/L) β2 −0.013 <0.0001 10.8
Log FC raw (log(CFU/100 mL)) β3 0.831 <0.0001 22.8Residual chlorine (mg/L) β4 0.644 <0.0001 2.83
UV irradiationCollimated beam
Dissolved BOD5 (mg/L) β5 0.001 0.2211 * 0.20TSS (mg/L) β6 −0.012 <0.0001 23.0
Log FC raw (log(CFU/100 mL)) β7 0.495 <0.0001 43.5UV dose (mJ/cm2) β8 0.059 <0.0001 38.2
* not statistically significant.
It should be noted that more complex models containing combinations of the explana-tory variables (including interactions between them) were explored. However, since theydid not increase the fit of the models, the simplest ones are presented. To compare theeffects of the various explanatory variables on UV/chlorination disinfection efficiency,an effect size test, which is used for assessing variables’ effects on a suggested model,was applied. In this test, the p-value was transformed to the LogWorth (−log10(p-value)),assuming that larger effects lead to more significant p-values and larger LogWorth values(Table 1).
Both models indicated that the initial microbial concentration was the most significantparameter (having a positive effect). In the case of chlorination, the initial microbial concen-tration was followed by TSS and then BOD5 concentrations; both resulted in a reductionof FC inactivation (negative effect). These results are consistent with established theoryand demonstrate the negative effect of TSS and BOD5 on chlorine disinfection. Most likely,some of the BOD5 and TSS increased chlorine demand as they were oxidized, thus reducingthe active chlorine concentration in the effluent and, consequently, lowering FC inactiva-tion. In addition, as aforementioned, TSS and BOD5 may affect chlorination efficiency byincreasing bacterial resistance due to stabilization of the microbial cell membranes [14] ordue to bacterial attachment to suspended solids [12,13].
The MLR model, obtained from the UV collimated beam, indicates that high initialmicrobial concentrations and high UV doses result in increased FC inactivation, whileincreasing TSS concentrations result in a reduction in FC inactivation. In this case, the effectof dissolved BOD5 was not significant (in the range tested). These results are consistentwith established theory and demonstrate the negative effect of TSS on UV disinfection,likely due to the “shielding and shadowing effect” of particles [29].
3.3. Flow-Through Setups and Model Verification
The concentrations of FC, TSS, and BOD5 from pre-disinfected treated GW (11 on-site sys-tems) ranged from 0–106 CFU/100 mL, 3.9–233 mg/L, and 0–107 mg/L, respectively (Table 2).FC counts after disinfection were also analyzed and compared with the models predictions.
Table 2. Quality levels of pre-disinfected treated GW samples, from 11 on-site treatment systems,that were used in the flow-through experiments. Each site was sampled four times (n = 44 samples).
Range Average Median
TSS (mg/L) 3.9–233 38 15Dissolved BOD5 (mg/L) 0–107 41 37
% Transmission254 nm 39–85 64 67Turbidity (NTU) 1.47–512 87 18
FC (CFU/100 mL) 0–106 105 105
The MLR models, developed based on the batch-phase experiments, were verifiedagainst the results of the continuous flow-through disinfection setups (chlorination chamber
Water 2021, 13, 214 9 of 12
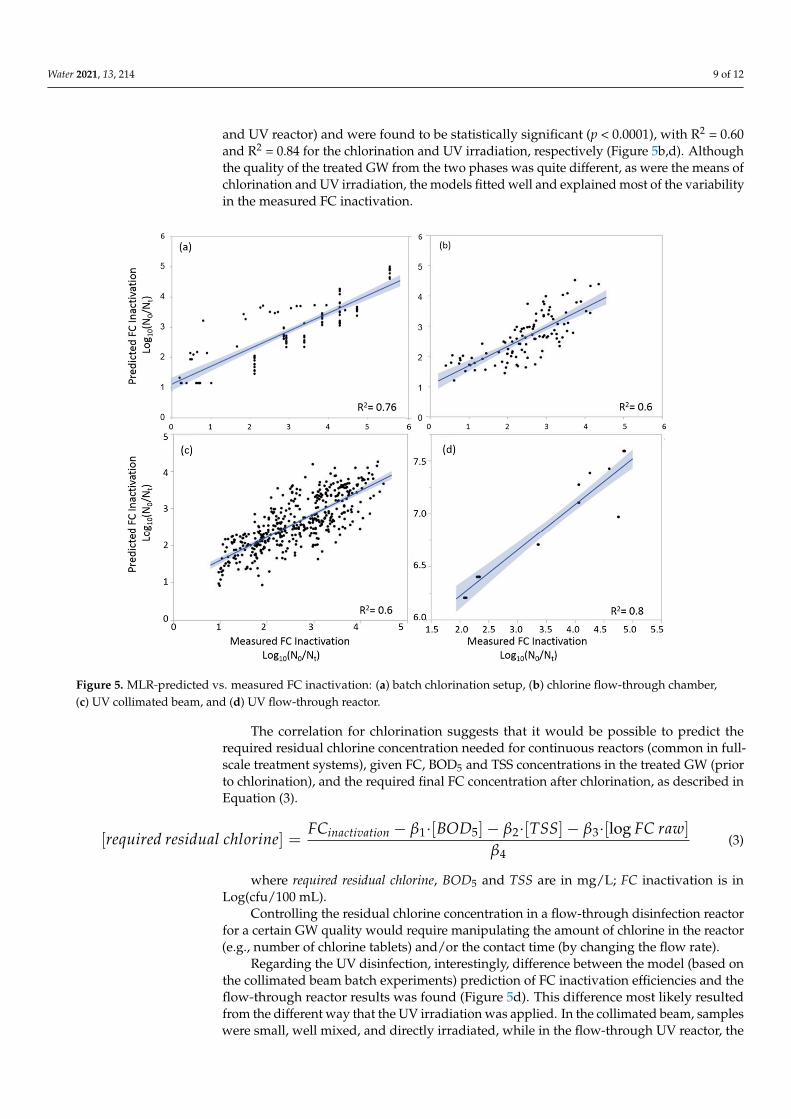
and UV reactor) and were found to be statistically significant (p < 0.0001), with R2 = 0.60and R2 = 0.84 for the chlorination and UV irradiation, respectively (Figure 5b,d). Althoughthe quality of the treated GW from the two phases was quite different, as were the means ofchlorination and UV irradiation, the models fitted well and explained most of the variabilityin the measured FC inactivation.
Water 2021, 13, x FOR PEER REVIEW 9 of 12
Table 2. Quality levels of pre-disinfected treated GW samples, from 11 on-site treatment systems, that were used in the flow-through experiments. Each site was sampled four times (n = 44 sam-ples).
Range Average Median TSS (mg/L) 3.9–233 38 15
Dissolved BOD5 (mg/L) 0–107 41 37 % Transmission254 nm 39–85 64 67
Turbidity (NTU) 1.47–512 87 18 FC (CFU/100 mL) 0–106 105 105
The MLR models, developed based on the batch-phase experiments, were verified against the results of the continuous flow-through disinfection setups (chlorination cham-ber and UV reactor) and were found to be statistically significant (p < 0.0001), with R2 = 0.60 and R2 = 0.84 for the chlorination and UV irradiation, respectively (Figure 5b,d). Alt-hough the quality of the treated GW from the two phases was quite different, as were the means of chlorination and UV irradiation, the models fitted well and explained most of the variability in the measured FC inactivation.
Figure 5. MLR-predicted vs. measured FC inactivation: (a) batch chlorination setup, (b) chlorine flow-through chamber, (c) UV collimated beam, and (d) UV flow-through reactor.
The correlation for chlorination suggests that it would be possible to predict the re-quired residual chlorine concentration needed for continuous reactors (common in full-scale treatment systems), given FC, BOD5 and TSS concentrations in the treated GW (prior to chlorination), and the required final FC concentration after chlorination, as described in Equation (3).
Figure 5. MLR-predicted vs. measured FC inactivation: (a) batch chlorination setup, (b) chlorine flow-through chamber,(c) UV collimated beam, and (d) UV flow-through reactor.
The correlation for chlorination suggests that it would be possible to predict therequired residual chlorine concentration needed for continuous reactors (common in full-scale treatment systems), given FC, BOD5 and TSS concentrations in the treated GW (priorto chlorination), and the required final FC concentration after chlorination, as described inEquation (3).
[required residual chlorine] =FCinactivation − β1·[BOD5]− β2·[TSS]− β3·[log FC raw]
β4(3)
where required residual chlorine, BOD5 and TSS are in mg/L; FC inactivation is inLog(cfu/100 mL).
Controlling the residual chlorine concentration in a flow-through disinfection reactorfor a certain GW quality would require manipulating the amount of chlorine in the reactor(e.g., number of chlorine tablets) and/or the contact time (by changing the flow rate).
Regarding the UV disinfection, interestingly, difference between the model (based onthe collimated beam batch experiments) prediction of FC inactivation efficiencies and theflow-through reactor results was found (Figure 5d). This difference most likely resultedfrom the different way that the UV irradiation was applied. In the collimated beam, sampleswere small, well mixed, and directly irradiated, while in the flow-through UV reactor, the

Water 2021, 13, 214 10 of 12
flow regime was more complex (being partially well-mixed and partially plug-flow [25]).Thus, not all the GW passing through the reactor received the same UV dose, meaning thatnot all FC present in the GW were exposed to the same dose. For the same log inactivation,dividing the measured UV dose in the flow-through reactor (44 mJ/cm2 in this study) bythe model-predicted UV dose (based on the batch collimated beam results) resulted in acorrection factor (CF) of 7.47 (STD = 1.25). This factor transforms the UV dose requiredfor certain FC inactivation in the collimated beam batch experiments to the dose requiredby the UV flow-through reactor for the same FC inactivation. In other words, in order toachieve the same log FC inactivation for waters of comparable quality (i.e., TSS, BOD5and pre-disinfection FC concentrations), the UV dose required in the flow-through reactoris 7.47 times higher than the dose required in the collimated beam. Refs. [32,33] reportsimilar differences between collimated beam experimental results and the flow-throughreactor results. Using the model amended by the CF, the required UV dose in flow-throughreactors can be assessed based on laboratory tests (Equation (4)).
[required UV dose] = CF· FCinactivation − β5·[BOD5]− β6·[TSS]− β7·[log FC raw]
β8(4)
where required UV dose is in mJ/cm2, FC inactivation is in Log(cfu/100 mL), BOD5 andTSS are in mg/L; log FC row in Log(cfu/100 mL); CF: 7.47 (unitless).
4. Conclusions
This study quantified the effects of treated greywater quality (TSS, BOD5, and FC) onboth chlorination and UV disinfection efficiencies in batch and continuous flow setups.
The efficiency of chlorine disinfection of treated GW was found to decrease as a resultof increasing TSS and BOD5 concentrations, in which the effect of TSS was continuousstarting from low concentrations, while the effect of BOD5 became significant only above acertain threshold concentration. Batch chlorination experiments have shown that dissolvedorganic matter affects chlorination efficiency significantly less than TSS, as reflected by themuch lower LogWorth value. Based on the batch chlorination results, an MLR model wasdeveloped and successfully verified against the results of a flow-through chlorination unit.
The results of the batch UV disinfection experiments suggest that the UV disinfectionefficiency of treated GW decreases as a result of increasing TSS concentrations beyond athreshold value of 50 mg/L. Yet, as the applied UV dose increased, the influence of TSSdecreased. The effect of dissolved BOD5 on UV disinfection efficiency was found to benegligible (in the concentration range tested).
Similarly, based on the batch UV disinfection experiments an MLR model wasdeveloped and was verified against the results of treated GW that was disinfected bya flow-through UV reactor. Using these two models, one can assess the UV dose, orthe residual chlorine concentration required in flow-through reactors based on batchresults. This approach is valuable not only from an operational standpoint, but also froma research perspective.
Supplementary Materials: The following are available online at https://www.mdpi.com/2073-4441/13/2/214/s1, Figure S1: Schematic of the onsite recirculating vertical flow constructed wetlands(RVFCW) GW treatment system (After Alfiya et al., 2013); Figure S2: Trojan UV collimated beamsystem excluding the shutter.
Author Contributions: Conceptualization, funding acquisition, methodology, supervision, review,and editing: A.G. and E.F. Methodology, validation data curation, writing: D.F.C. and Y.A. Visualiza-tion, writing—original draft, project administration: Y.G. All authors have read and agreed to thepublished version of the manuscript.
Funding: This research was funded by the Zuk Maccabi Research Fund.
Institutional Review Board Statement: Not applicable.
Informed Consent Statement: Not applicable.
Water 2021, 13, 214 11 of 12
Data Availability Statement: Data is contained within the article or supplementary material.
Conflicts of Interest: The authors declare no conflict of interest. The funders had no role in the designof the study; in the collection, analyses, or interpretation of data; in the writing of the manuscript, orin the decision to publish the results.
Abbreviations
BOD5 five-day biochemical oxygen demandFC fecal coliformsGW greywaterMLR multiple linear regressionRVFCW recirculating vertical flow constructed wetlandTSS total suspended solidsUV ultraviolet irradiationβ1–β8 coefficients
References1. Maimon, A.; Tal, A.; Friedler, E.; Gross, A. Safe on-site reuse of greywater for irrigation-a critical review of current guidelines.
Environ. Sci. Technol. 2010, 44, 3213–3220. [CrossRef] [PubMed]2. March, J.G.; Gual, M. Studies on chlorination of greywater. Desalination 2009, 249, 317–322. [CrossRef]3. USEPA (U.S. Environmental Protection Agency). Onsite Wastewater Treatment Systems Manual; EPA 625-R- 00-008, Office of Water;
U.S. Environmental Protection Agency: Washington, DC, USA, 2002.4. Fenner, R.A.; Komvuschara, K. A new kinetic model for ultraviolet disinfection of greywater. J. Environ. Eng. 2005, 131, 850–864.
[CrossRef]5. Ekeren, K.M.; Hodgson, B.A.; Sharvelle, S.E.; De Long, S.K. Investigation of pathogen disinfection and regrowth in a simple
graywater recycling system for toilet flushing. Desalination Water Treat. 2016, 57, 26174–26186. [CrossRef]6. Oh, K.S.; Leong, J.Y.C.; Poh, P.E.; Chong, M.N.; Von Lau, E. A review of greywater recycling related issues: Challenges and future
prospects in Malaysia. J. Clean. Prod. 2018, 171, 17–29. [CrossRef]7. Leverenz, H.L.; Darby, J.; Tchobanoglous, G. Comparison of a commercially available chlorine and an ultraviolet disinfection unit
for onsite wastewater systems. Small Flows Mag. 2007, 8, 11–21.8. Friedler, E.; Kovalio, R.; Ben-Zvi, A. Comparative study of the microbial quality of greywater treated by three on-site treatment
systems. Environ. Technol. 2006, 27, 653–663. [CrossRef]9. Friedler, E.; Yardeni, A.; Gilboa, Y.; Alfiya, Y. Disinfection of greywater effluent and regrowth potential of selected bacteria.
Water Sci. Technol. 2011, 63, 931–940. [CrossRef]10. USEPA (United States Environmental Protection Agency). Ultraviolet Disinfection Guidance Manual for the Final Long Term 2
Enhanced Surface Water Treatment Rule; EPA 815-R-06-007 Office of Water; USEPA: Washington, DC, USA, 2006.11. Benami, M.; Gillor, O.; Gross, A. The question of pathogen quantification in disinfected graywater. Sci. Total Environ. 2015,
506, 496–504. [CrossRef]12. Winward, G.; Avery, L.; Stephenson, T.; Jefferson, B. Ultraviolet (UV) disinfection of grey water: Particle size effects. Environ. Tech-
nol. 2008, 29, 235–244. [CrossRef]13. Bohrerova, Z.; Linden, K.G. Ultraviolet and chlorine disinfection of Mycobacterium in wastewater: Effect of aggregation.
Water Environ. Res. 2006, 78, 565–571. [CrossRef] [PubMed]14. Virto, R.; Manas, P.; Alvarez, I.; Condon, S.; Raso, J. Membrane damage and microbial inactivation by chlorine in the absence and
presence of a chlorine-demanding substrate. Appl. Environ. Microbiol. 2005, 71, 5022–5028. [CrossRef] [PubMed]15. Onga, Z.C.; Asadsangabifardb, M.; Ismailb, Z.; Tama, J.H.; Roushenasa, P. Design of a compact and effective greywater treatment
system in Malaysia. Desalination Water Treat. 2019, 146, 141–151. [CrossRef]16. Christensen, J.; Linden, K.G. How particles affect UV light in the UV disinfection of unfiltered drinking water. J. Am. Water Works
Assoc. 2003, 95, 179–189. [CrossRef]17. Carré, E.; Pérot, J.; Jauzein, V.; Lopez-Ferber, M. Impact of suspended particles on UV disinfection of activated-sludge effluent
with the aim of reclamation. J. Water Process Eng. 2018, 22, 87–93. [CrossRef]18. Beck, S.E.; Rodríguez, R.A.; Salveson, A.; Goel, N.; Rhodes, S.; Kehoe, P.; Linden, K.G. Disinfection methods for treating low TOC,
light graywater to California title 22 water reuse standards. J. Environ. Eng. 2013, 139, 1137–1145. [CrossRef]19. Madge, B.A.; Jensen, J.N. Ultraviolet disinfection of fecal coliform in municipal wastewater: Effects of particle size.
Water Environ. Res. 2006, 78, 294–304. [CrossRef]20. Gross, A.; Shmueli, O.; Ronen, Z.; Raveh, E. Recycled Vertical Flow Constructed Wetland (RVFCW)—a novel method of recycling
greywater for landscape irrigation in small communities and households. Chemosphere 2007, 66, 916–923. [CrossRef]21. Alfiya, Y.; Gross, A.; Sklarz, M.; Friedler, E. Reliability of on-site greywater treatment systems in Mediterranean and arid
environments—A case study. Water Sci. Technol. 2013, 67, 1389–1395. [CrossRef]
Water 2021, 13, 214 12 of 12
22. APHA; AWWA; WEF. Standard Methods for the Examination of Water and Wastewater, 22nd ed.; American Public Health Association,American Water Works Association, Water Environment Federation: Washington, DC, USA, 2012.
23. WHO (World Health Organization). Guidelines for the Safe Use of Wastewater, Excreta and Greywater—Volume 1 and Vol. 4—Excretaand Greywater Use in Agriculture Policy and Regulatory Aspects; WHO: Geneva, Switzerland, 2006.
24. Mamane, H.; Linden, K.G. UV disinfection of indigenous aerobic spores: Implications for UV reactor validation in unfilteredwaters. Water Res. 2004, 38, 2898–2906. [CrossRef]
25. Friedler, E.; Gilboa, Y. Performance of UV disinfection and the microbial quality of greywater effluent along a reuse system fortoilet flushing. Sci. Total Environ. 2010, 408, 2109–2117. [CrossRef] [PubMed]
26. Inbar, Y. New standards for treated wastewater reuse in Israel. In Wastewater Reuse-Risk Assessment, Decision-Making andEnvironmental Security; Springer: Berlin/Heidelberg, Germany, 2007; pp. 291–296.
27. Gross, A.; Maimon, A.; Alfiya, Y.; Friedler, E. Greywater Reuse; CRC Press: New York, NY, USA, 2015.28. Crittenden, J.; Trussell, R.; Hand, D.; Howe, K.; Tchobanoglous, G. Water Treatment: Principles and Design, 2nd ed.; John Wiley &
Sons Inc.: Hoboken, NJ, USA, 2005.29. Mamane, H. Impact of particles on UV disinfection on water and wastewater effluents: A review. Rev. Chem. Eng. 2008, 24, 65–157.
[CrossRef]30. Cantwell, R.E.; Hofmann, R. Ultraviolet absorption properties of suspended particulate matter in untreated surface waters.
Water Res. 2011, 45, 1322–1328. [CrossRef] [PubMed]31. Scott, H.E.; Liss, S.N.; Farnood, R.R.; Allen, D.G. Ultraviolet disinfection of sequencing batch reactor effluent: A study of
physiochemical properties of microbial floc and disinfection performance. J. Environ. Eng. Sci. 2005, 4, S65–S74. [CrossRef]32. Cabaj, A.; Sommer, R.; Schoenen, D. Biodosimetry: Model calculations for UV water disinfection devices with regard to dose
distributions. Water Res. 1996, 30, 1003–1009. [CrossRef]33. Kuo, J.; Chen, C.L.; Nellor, M. Standardized collimated beam testing protocol for water/wastewater ultraviolet disinfection.
J. Environ. Eng. 2003, 129, 774–779. [CrossRef]
Copyright © 2022 FDOKUMEN