Numerical modelling of the suspended particulate matter ...
43
HAL Id: hal-02553064 https://hal.archives-ouvertes.fr/hal-02553064 Submitted on 16 May 2020 HAL is a multi-disciplinary open access archive for the deposit and dissemination of sci- entific research documents, whether they are pub- lished or not. The documents may come from teaching and research institutions in France or abroad, or from public or private research centers. L’archive ouverte pluridisciplinaire HAL, est destinée au dépôt et à la diffusion de documents scientifiques de niveau recherche, publiés ou non, émanant des établissements d’enseignement et de recherche français ou étrangers, des laboratoires publics ou privés. Numerical modelling of the suspended particulate matter dynamics in a regulated river network M. Launay, V. Dugué, J.-B. Faure, Marina Coquery, B. Camenen, J. Le Coz To cite this version: M. Launay, V. Dugué, J.-B. Faure, Marina Coquery, B. Camenen, et al.. Numerical modelling of the suspended particulate matter dynamics in a regulated river network. Science of the Total Environment, Elsevier, 2019, 665, pp.591-605. 10.1016/j.scitotenv.2019.02.015. hal-02553064
-
Upload
khangminh22 -
Category
Documents
-
view
0 -
download
0
Transcript of Numerical modelling of the suspended particulate matter ...
HAL Id: hal-02553064https://hal.archives-ouvertes.fr/hal-02553064
Submitted on 16 May 2020
HAL is a multi-disciplinary open accessarchive for the deposit and dissemination of sci-entific research documents, whether they are pub-lished or not. The documents may come fromteaching and research institutions in France orabroad, or from public or private research centers.
L’archive ouverte pluridisciplinaire HAL, estdestinée au dépôt et à la diffusion de documentsscientifiques de niveau recherche, publiés ou non,émanant des établissements d’enseignement et derecherche français ou étrangers, des laboratoirespublics ou privés.
Numerical modelling of the suspended particulatematter dynamics in a regulated river network
M. Launay, V. Dugué, J.-B. Faure, Marina Coquery, B. Camenen, J. Le Coz
To cite this version:M. Launay, V. Dugué, J.-B. Faure, Marina Coquery, B. Camenen, et al.. Numerical modelling of thesuspended particulate matter dynamics in a regulated river network. Science of the Total Environment,Elsevier, 2019, 665, pp.591-605. �10.1016/j.scitotenv.2019.02.015�. �hal-02553064�

Numerical modelling of the suspended particulatematter dynamics in a regulated river network
M. Launaya,b, V. Duguea,c, J.-B. Faurea, M. Coquerya, B. Camenena,J. Le Coza,1
aIrstea, UR RiverLy, 5 rue de la Doua CS 20244, 69625 Villeurbanne Cedex, FrancebNow at Stucky SA, Rue du Lac 33, 1020 Renens VD, Switzerland
cNow at CNR, Compagnie Nationale du Rhone, 2 rue Andre Bonin, 69004 Lyon, France
Abstract
Understanding and predicting the propagation, deposition and re-suspension
of suspended particulate matter (SPM) in river networks is important for man-
aging water resources, ecological habitat, pollution, navigation, hydropower gen-
eration, reservoir sedimentation, etc. Observational data are scarce and costly,
and there is little feedback on the efficiency of numerical simulation tools for
compensating the lack of data on a river scale of several hundreds of kilometres.
This paper aims at exploring the use of a one-dimensional (1-D) hydrodynamical
model for understanding the source and fate of SPM during complex events. The
numerical model was applied to the May-June 2008 flood in the Lower Rhone
River, France. This event was a combination of floods of the Isere (including
dam flushing operations in the Lower Isere River) and Durance tributaries over
a two-week period. The simulation code was used to model the SPM fluxes at
a high spatial and temporal resolution using a multi-class approach. Approx-
imately half of the 4.9 Mt of SPM measured at the outlet at Beaucaire were
found to come from the Isere River and the other half from the Durance River,
whereas previous studies estimated that most of the SPM flux at the outlet
came from the Durance River. The amount of SPM trapped within the river
network, mainly behind the first hydropower structure downstream of the Isere
confluence, was estimated to be 3.7 Mt due to the deposition of the coarsest
∗Corresponding author
Preprint submitted to Science of the Total Environment January 29, 2019
Science of the Total Environment, 2019
Author-produced version of the article published in Launay, M., Dugué, V., Faure, J.-B., Coquery, M., Camenen, B., Le Coz, J. (2019) Numerical modelling of the suspended particulate matter dynamics in a regulated river network, Science of the Total Environment, 665, 591-605, DOI : 10.1016/j.scitotenv.2019.02.015
particles. Such a model proved to be able to compute the interaction of various
grain size classes with dams and other structures. In turn, the quality of the
results of SPM fluxes and deposition is highly sensitive to particle parameters,
especially grain size distribution, and to the operational rules of reservoirs.
Keywords: suspended sediment, suspended solids, 1-D hydrodynamical
model, numerical simulation, Rhone River, flood
1. Introduction1
Monitoring the suspended particulate matter (SPM) dynamics in river sys-2
tems is crucial for multiple environmental management issues, such as the eco-3
logical restoration of aquatic habitats, the sustainable operation of reservoirs,4
or the management of particle-bound contaminant fluxes (Walling et al., 2003).5
These questions are generally facing a lack of data available at the watershed6
scale and at time scales from flood events to several years (Horowitz et al., 2015).7
The presence of dams significantly affects the SPM dynamics with large deposi-8
tion in the reservoirs and possible resuspension during specific events when dam9
gates are opened. Sediment management in dam reservoirs and regulated rivers10
is indeed one important issue of the 21st century (Kondolf et al., 2014).11
The development of station networks measuring SPM and particulate con-12
taminants at large catchment scales remains limited due to the water sampling13
constraints and the cost of analyses (Horowitz , 2008). Data on SPM concentra-14
tion (CSPM) are mostly derived from discrete water sampling carried out as part15
of water quality monitoring programs (Walling and Webb, 1985; Phillips et al.,16
1999; Horowitz et al., 2001). The frequency of these measurements, generally17
performed with a fixed periodicity, is almost never high enough to measure the18
fine temporal variations in CSPM, leading to large uncertainties in flux budget19
estimation (Moatar et al., 2008). In recent decades, the development of surro-20
gate techniques (Gray and Gartner , 2010) such as Optical Backscatter Systems21
(OBS, also known as turbidity meters) has allowed the continuous measurement22
of the SPM concentration, provided that sufficient calibration data are available23
2
Author-produced version of the article published in Launay, M., Dugué, V., Faure, J.-B., Coquery, M., Camenen, B., Le Coz, J. (2019) Numerical modelling of the suspended particulate matter dynamics in a regulated river network, Science of the Total Environment, 665, 591-605, DOI : 10.1016/j.scitotenv.2019.02.015
(Foster et al., 1992; Gippel , 1995; Clifford et al., 1995; Thollet et al., 2013; Dru-24
ine et al., 2018). Hydro-sedimentary stations based on water sampling and/or25
turbidity measurements at one point of the cross-section rely on the assumption26
of homogeneous SPM concentration (Horowitz , 2008). Nevertheless, the direct27
measurement of CSPM at the river basin scale remains very expensive, time con-28
suming and in many instances problematic, especially in inaccessible sections29
and during floods (Ulke et al., 2017). Most of the time, field data are available30
only for a particular event or over a limited period of time (Mano et al., 2008;31
Navratil et al., 2012).32
Together with the deployment of denser measuring networks, hydro-sedimen-33
tary modelling allows the development of operational tools to improve the knowl-34
edge of the fate of suspended sediment in the river network (Wu et al., 2004).35
Moreover, it allows testing alternative management scenarios and several hy-36
potheses on the water and SPM inputs. The use of numerical hydro-sedimentary37
models has increased considerably in the last decades in conjunction with the38
advances in computational techniques. One-dimensional (1-D) codes are admit-39
ted to be suitable for simulation over large temporal and spatial scales as they40
require less field data and computational resources than 2-D and 3-D codes do.41
The limited ability of 1-D codes to reproduce fine physical processes is compen-42
sated by the stability of their numerical schemes and their fast calculation speed43
(Papanicolaou et al., 2008; El Kadi Abderrezzak and Paquier , 2009). Numerous44
1-D codes have been developed and are frequently used for engineering pur-45
poses. Amongst others, Wu et al. (2004) and Papanicolaou et al. (2008) listed46
several 1-D codes and their applications to rivers and dam reservoirs. These47
codes can be classified according to their range of application or their formu-48
lations: steady/unsteady flow, fully coupled/semi-coupled/decoupled flow and49
suspended sediment modelling, uniform/non-uniform grain size, equilibrium/non-50
equilibrium suspended sediment transport model. 1-D modelling is particularly51
suitable for calculating SPM dynamics since SPM concentrations are generally52
assumed to be homogeneously distributed throughout a river cross-section and53
modelling transverse mixing is not necessary (Garneau et al., 2015). Modelling54
3
Author-produced version of the article published in Launay, M., Dugué, V., Faure, J.-B., Coquery, M., Camenen, B., Le Coz, J. (2019) Numerical modelling of the suspended particulate matter dynamics in a regulated river network, Science of the Total Environment, 665, 591-605, DOI : 10.1016/j.scitotenv.2019.02.015
a flood event at the river basin scale requires i) calibrating the hydraulic and55
suspended sediment transport parameters, ii) specifying the water and SPM56
inputs (upstream boundary conditions) and iii) validating the results along the57
river system, including at the outlet.58
The objective of this paper is to explore the use of a 1-D numerical model59
to better understand the spatial and temporal dynamics of SPM during floods60
throughout complex river networks. In particular, we test the application of61
a 1-D numerical model in simulating the SPM dynamics in a river regulated62
by a series of run-of-the-river dams and other infrastructure. There is indeed63
very limited feedback in the literature on the following questions. What kind of64
results is a 1-D model able to provide and what is the added value compared to65
observational data? What are the most sensitive parameters, hence the main66
sources of error? What are the most restrictive assumptions and the main67
perspectives for improvement?68
The first part of the paper describes the May-June 2008 flood event in the69
Lower Rhone River. This hydro-sedimentary event was selected for testing the70
model as it was a typical combination of floods and dam flushing operations and71
it comes with a complete set of high temporal resolution measurements on the72
main tributaries and at the outlet. The second part of the paper presents the73
hydro-sedimentary numerical tools and the Rhone 1-D model used to simulate74
the May-June 2008 event. The Rhone 1-D model was developed as part of the75
Rhone Sediment Observatory (OSR) to become an efficient tool for managing76
SPM at the scale of the river basin. The third part details the results of the77
modelling and highlights the impacts of grain size distribution and hydropower78
structures on the simulated SPM concentrations and deposits. The main lessons79
learnt from the modelling exercise are briefly discussed and summarised in con-80
clusive comments.81
4
Author-produced version of the article published in Launay, M., Dugué, V., Faure, J.-B., Coquery, M., Camenen, B., Le Coz, J. (2019) Numerical modelling of the suspended particulate matter dynamics in a regulated river network, Science of the Total Environment, 665, 591-605, DOI : 10.1016/j.scitotenv.2019.02.015

2. Case study82
2.1. The Rhone River83
The Rhone River flows 810 km from its source in the Swiss Alps to its out-84
let to the Mediterranean Sea in the South of France (Fig. 1). It is the largest85
single source of freshwater to the Mediterranean Sea (Ludwig et al., 2009). Its86
hydrological regime is influenced by snow melting in headwater catchments,87
and by oceanic and Mediterranean rain events (Parde, 1925). The three tribu-88
taries with the largest mean discharges are the Saone, Isere and Durance Rivers89
(Tab. 1). The Rhone River basin is characterized by a large geological and90
climatic heterogeneity, and by a dense network of hydropower schemes. From91
Lake Geneva to the Mediterranean Sea, the Rhone River is equipped with 2192
hydropower schemes, all of which are run-of-the-river schemes except Genissiat93
Dam in the Upper French Rhone River (Fig. 1).94
The Bourg-les-Valence scheme detailed in Fig. 1 is typical of the other run-of-95
the-river, by-passing hydropower plants (cf. Camenen et al. (2019) for a detailed96
description and analysis of sand fluxes). The Roche-de-Glun dam controls the97
discharge distribution between the Old Rhone and the power canal containing98
the Bourg-les-Valence hydropower plant. A minimum compensation discharge99
is maintained in the Old Rhone at any time. During floods, when discharge100
exceeds the canal capacity, the excess flow is released in the Old Rhone. The101
particularity of this scheme lies in the confluence between the Isere River and102
the canal. In case of flood of the Isere River, the so-called Isere dam located103
between the headrace canal and the Old Rhone (cf. Fig. 1) can derive the excess104
discharge into the Old Rhone.105
The Rhone River delivers substantial amounts of SPM to the Mediterranean106
Sea (Radakovitch et al., 2008; Launay , 2014) with a mean inter-annual SPM107
flux varying between 4.7 and 7.4 Mt/yr (Pont et al., 2002; Eyrolle et al., 2012;108
Ollivier et al., 2010; Launay , 2014; Copard et al., 2018; Poulier et al., 2019)109
but with huge variations of the annual SPM flux from one year to another. For110
example, annual SPM flux ranged from 1.2 to 22.7 Mt/yr between 1992 and111
5
Author-produced version of the article published in Launay, M., Dugué, V., Faure, J.-B., Coquery, M., Camenen, B., Le Coz, J. (2019) Numerical modelling of the suspended particulate matter dynamics in a regulated river network, Science of the Total Environment, 665, 591-605, DOI : 10.1016/j.scitotenv.2019.02.015

Drôme
Lyon
Rhône
Ardèche
Arc
Isèr
e
Durance
Petit
Rhô
ne
Monitoring stations 2008 Hydropower plants and dams
Valence Bridge0 1 2 km
Isère
Rhône
Roche-de-Glun dam
Isère dam
Bourg-lès-Valence (BLV) plant
TernayO
ld R
hôn
e
Power
Canal
Mediterranean Sea
GenevaLa
ke G
enev
a
Saône Arve
Tullins
Romans-sur-Isère
Grand R
hône
Beauchastel (BCT) plant
Baix-Le Logis Neuf (BLN) plant
Montélimar (MTL) plant
Pontamafrey
Beaumont-Monteux
Grenoble
Fauries Bridge 0 10 20 30 km
Bonpas
Arles
Beaucaire
Viviers
N
Saint-Egrève dam
Lower Isèredams
Génissiat dam
CadaracheMallemortFourques
Figure 1: River network and hydroelectric schemes of the Rhone River from Lake Geneva
to the Mediterranean Sea with a close-up view of the Bourg-les-Valence hydroelectric scheme
at the Rhone-Isere confluence. Monitoring stations of the May-June 2008 flood event in the
Rhone, Arc, Isere and Durance Rivers are displayed.
1995 (Pont , 1997). Based on the long-term monitoring of CSPM at Arles near112
the delta of the Rhone River, Eyrolle et al. (2012) showed that singular events113
(flood or dam flushing) can represent up to 95 % of the annual SPM budget. The114
need for a better monitoring of SPM fluxes through the Rhone River motivated115
the creation of the Rhone Sediment Observatory (OSR) in 2009. As part of the116
OSR, an SPM monitoring network in the Rhone River and its tributaries from117
Lake Geneva to the Mediterranean Sea was developed mostly based on turbidity118
measurements calibrated with frequent SPM samples.119
6
Author-produced version of the article published in Launay, M., Dugué, V., Faure, J.-B., Coquery, M., Camenen, B., Le Coz, J. (2019) Numerical modelling of the suspended particulate matter dynamics in a regulated river network, Science of the Total Environment, 665, 591-605, DOI : 10.1016/j.scitotenv.2019.02.015
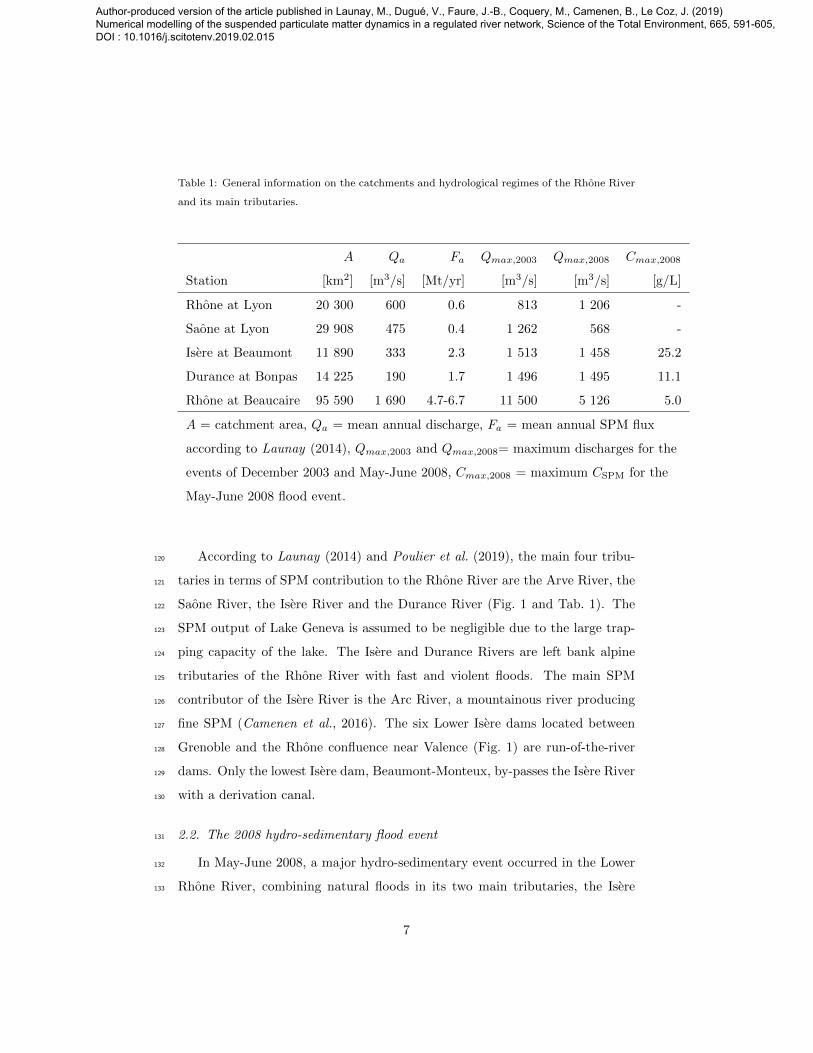
Table 1: General information on the catchments and hydrological regimes of the Rhone River
and its main tributaries.
A Qa Fa Qmax,2003 Qmax,2008 Cmax,2008
Station [km2] [m3/s] [Mt/yr] [m3/s] [m3/s] [g/L]
Rhone at Lyon 20 300 600 0.6 813 1 206 -
Saone at Lyon 29 908 475 0.4 1 262 568 -
Isere at Beaumont 11 890 333 2.3 1 513 1 458 25.2
Durance at Bonpas 14 225 190 1.7 1 496 1 495 11.1
Rhone at Beaucaire 95 590 1 690 4.7-6.7 11 500 5 126 5.0
A = catchment area, Qa = mean annual discharge, Fa = mean annual SPM flux
according to Launay (2014), Qmax,2003 and Qmax,2008= maximum discharges for the
events of December 2003 and May-June 2008, Cmax,2008 = maximum CSPM for the
May-June 2008 flood event.
According to Launay (2014) and Poulier et al. (2019), the main four tribu-120
taries in terms of SPM contribution to the Rhone River are the Arve River, the121
Saone River, the Isere River and the Durance River (Fig. 1 and Tab. 1). The122
SPM output of Lake Geneva is assumed to be negligible due to the large trap-123
ping capacity of the lake. The Isere and Durance Rivers are left bank alpine124
tributaries of the Rhone River with fast and violent floods. The main SPM125
contributor of the Isere River is the Arc River, a mountainous river producing126
fine SPM (Camenen et al., 2016). The six Lower Isere dams located between127
Grenoble and the Rhone confluence near Valence (Fig. 1) are run-of-the-river128
dams. Only the lowest Isere dam, Beaumont-Monteux, by-passes the Isere River129
with a derivation canal.130
2.2. The 2008 hydro-sedimentary flood event131
In May-June 2008, a major hydro-sedimentary event occurred in the Lower132
Rhone River, combining natural floods in its two main tributaries, the Isere133
7
Author-produced version of the article published in Launay, M., Dugué, V., Faure, J.-B., Coquery, M., Camenen, B., Le Coz, J. (2019) Numerical modelling of the suspended particulate matter dynamics in a regulated river network, Science of the Total Environment, 665, 591-605, DOI : 10.1016/j.scitotenv.2019.02.015

and Durance Rivers, and flushing operations of the Lower Isere dams. All the134
reservoirs of the Lower Isere and the Lower Rhone are run-of-river dams with135
very limited storage capacity. They can be partially drained and sediment136
flushing operations must meet precise regulation requirements. Isere dams can137
be flushed during flood falling phases in order to evacuate excess deposited138
sediment. Rhone dams are not expected to be flushed but their operation can139
be adapted to avoid deposition in critical areas such as around navigation locks140
or dam gates. This could not be done during the 2008 event presented here due141
to a lack of understanding and forecasting of the hydro-sedimentary processes,142
and a lack of real-time coordination between the two distinct companies that143
operate the Isere dams and the Rhone dams, respectively.144
The peak discharge recorded at the Beaucaire station during this event was145
5 125 m3/s, corresponding to a 2-year return period flood. Between May 26th146
and June 8th 2008, the Arles station recorded a total SPM flux of 4.2 Mt at the147
Rhone outlet (Eyrolle et al., 2012), equivalent to the SPM output of the 100-year148
flood in 2003 which had a twice larger peak discharge (Tab. 1). The May-June149
2008 flood event in the Lower Rhone River was also remarkable because it150
produced an SPM flux almost equal to the mean annual SPM export of the151
Rhone River to the Mediterranean Sea recorded since 2005 (Launay , 2014).152
During the 2008 flood event, SPM concentrations were measured at the153
monitoring stations presented in Fig. 1, either continuously using OBS or the154
acoustic attenuation method presented by Moore et al. (2012), or by sampling-155
filtration method (AFNOR, 2005). All the SPM samples were taken near the156
free-surface using buckets or automatic samplers. They include the homoge-157
neously distributed suspension (”washload”), not the graded sand suspension.158
Well mixed cross-sections were chosen for the monitoring of CSPM except for159
the Rhone station at Valence Bridge, where the Isere and Rhone waters were160
not fully mixed. Available SPM data cover the Arc-Isere-Rhone river network,161
the Rhone-Isere confluence with numerous samples, the Durance River network,162
and some stations along the Rhone River.163
Fig. 2 presents the water discharge times series and CSPM data collected164
8
Author-produced version of the article published in Launay, M., Dugué, V., Faure, J.-B., Coquery, M., Camenen, B., Le Coz, J. (2019) Numerical modelling of the suspended particulate matter dynamics in a regulated river network, Science of the Total Environment, 665, 591-605, DOI : 10.1016/j.scitotenv.2019.02.015
during the event at the outlet of the Arc, Isere and Durance Rivers, and at four165
stations of the Rhone River. The Rhone at Ternay station is located upstream of166
the Isere confluence and monitors the discharge and SPM inputs from the Upper167
Rhone River. The Rhone at Viviers station provides an intermediate checkpoint168
to study the Isere River input independently from the Durance input. This is169
the first monitoring station downstream of the Isere confluence with a complete170
CSPM time series for the May-June 2008 flood event, while the Rhone at Valence171
station recorded CSPM only during the third period of the event. The Beaucaire172
station located near the outlet of the Rhone River gives indication on the SPM173
fluxes delivered to the Mediterranean Sea. The Beaucaire station is the last174
discharge monitoring station for the Rhone River before the separation of the175
two branches of the Rhone Delta. The measurement of CSPM is performed at176
the Arles station located about 13 km downstream on the Grand Rhone branch.177
The SPM concentrations are considered to be the same at Beaucaire and Arles178
for the SPM flux calculation.179
The measured SPM fluxes were determined by multiplying the instanta-180
neous water discharges and the instantaneous CSPM. For monitoring stations181
with occasional CSPM measurements (samples), the SPM fluxes were estimated182
by establishing a power relation between discharge and CSPM to reconstruct a183
continuous CSPM time series.184
The event can be divided into three SPM-producing periods (Fig. 2). The185
first period covers the dam flushing of the Saint-Egreve dam occurring between186
26/05/2008 and 29/05/2008 in the Isere River. This dam flushing was trig-187
gered concomitantly with a 1-year return period flood of the Isere River, with188
discharges up to 1 000 m3/s at the Beaumont-Monteux station. During this pe-189
riod, the Lower Isere dams were operated with high water levels in the reservoirs,190
and the water overflowing the gates. Meanwhile, a substantial flood occurred191
in the Durance River, with CSPM greater than 10 g/L on the 27/05/2008. The192
management of the hydropower schemes of the Durance River during this pe-193
riod led to mitigate the discharge (around 800 m3/s) while releasing a large194
amount of SPM. To account for the flood wave time lag between the upstream195
9
Author-produced version of the article published in Launay, M., Dugué, V., Faure, J.-B., Coquery, M., Camenen, B., Le Coz, J. (2019) Numerical modelling of the suspended particulate matter dynamics in a regulated river network, Science of the Total Environment, 665, 591-605, DOI : 10.1016/j.scitotenv.2019.02.015
part of the catchment and its downstream part, the ending date of the first196
period was postponed to the 30/05/2008 for the downstream part. During the197
second period, from 29/05/2008 to 02/06/2008, a large flood of the Arc River198
was recorded with CSPM greater than 30 g/L, causing a CSPM peak greater199
than 20 g/L in the Isere at Beaumont-Monteux on the 30/05/2008. This peak200
propagated in the Rhone River and about 8 g/L were recorded at Viviers on201
the 31/05/2008. During this period, the Lower Isere dams were not flushed,202
but the bottom gates were opened. The second period runs from 30/05/2008203
to 03/06/2008 to account for flood propagation delay. During this period, a204
major flood occurred in the Durance River with discharge up to 1 500 m3/s and205
CSPM up to 6 g/L. The third period lasted from 02/06/2008 to 10/06/2008, for206
which the Lower Isere dams were flushed, with low water level in the reservoirs207
to evacuate the deposited sediments. The cloud of SPM was recorded around208
04/06/2008 in the Isere at Beaumont-Monteux with maximum CSPM around209
20 g/L. It was recorded in the Rhone at Viviers with a propagation delay of one210
day and the peak CSPM was about 2 g/L.211
10
Author-produced version of the article published in Launay, M., Dugué, V., Faure, J.-B., Coquery, M., Camenen, B., Le Coz, J. (2019) Numerical modelling of the suspended particulate matter dynamics in a regulated river network, Science of the Total Environment, 665, 591-605, DOI : 10.1016/j.scitotenv.2019.02.015

0
500
1000
1500Q
(m
3/s
)Arc at Pontamafrey Isère at Beaumont−Monteux
0
10
20
30
27 May 29 May 31 May 02 June 04 June 06 June 08 June 10 June 12 June
● ●●●●●●● ●●●●●● ●● ●●
St Egrève dam flushing
0
500
1000
1500
Q (
m3
/s)
Durance at Bonpas
0
5
10
15
0100020003000400050006000
Q (
m3
/s)
Rhône at TernayRhône at Valence
Rhône at ViviersRhône at Beaucaire
0
2
4
6
8
10
●●●●●●●●●●●●●●●●●●●●●●●●●●●●●●●●●●●●●●●●●●●●●●●●●●●●●●●●●●●●●●●●●●●●●●●●
●●●●●●●●●●●●●●●●●●●●●●●●●●●●●●●●●●●●●●●●●●●●●●●●
●
●●
●
●●●●
●●●●
●
●●●●
●●●
●
●●●
●●●●●●●●●
●●●●●●●●●●●●●●●●●●●●●
●●●●●●
●●●
●●●●●●●●●● ●●●●●●●●
●●
●
●●●●●●●●●●●●●●●● ●●●●●●●●●●●●●●●
●●●●●●
Arc-Isère flood
Lower Isère dams flushing
27 May 29 May 31 May 02 June 04 June 06 June 08 June 10 June 12 June
27 May 29 May 31 May 02 June 04 June 06 June 08 June 10 June 12 June
a)
b)
c)
CS
PM
(g/
L)C
SP
M (
g/L)
CS
PM
(g/
L)
Figure 2: Discharges and SPM concentration (CSPM) in (a) the Arc and Isere Rivers, (b) the
Durance River and (c) the Rhone River during the May-June 2008 flood event. The limits of
the three periods are shown with vertical dashed lines: on the 29/05/2008 and 02/06/2008
for the Isere River, on the 30/05/2008 and 03/06/2008 for the Durance River and the Lower
Rhone River. Monitoring stations indicated in bold are the upstream boundary conditions of
the model.
11
Author-produced version of the article published in Launay, M., Dugué, V., Faure, J.-B., Coquery, M., Camenen, B., Le Coz, J. (2019) Numerical modelling of the suspended particulate matter dynamics in a regulated river network, Science of the Total Environment, 665, 591-605, DOI : 10.1016/j.scitotenv.2019.02.015

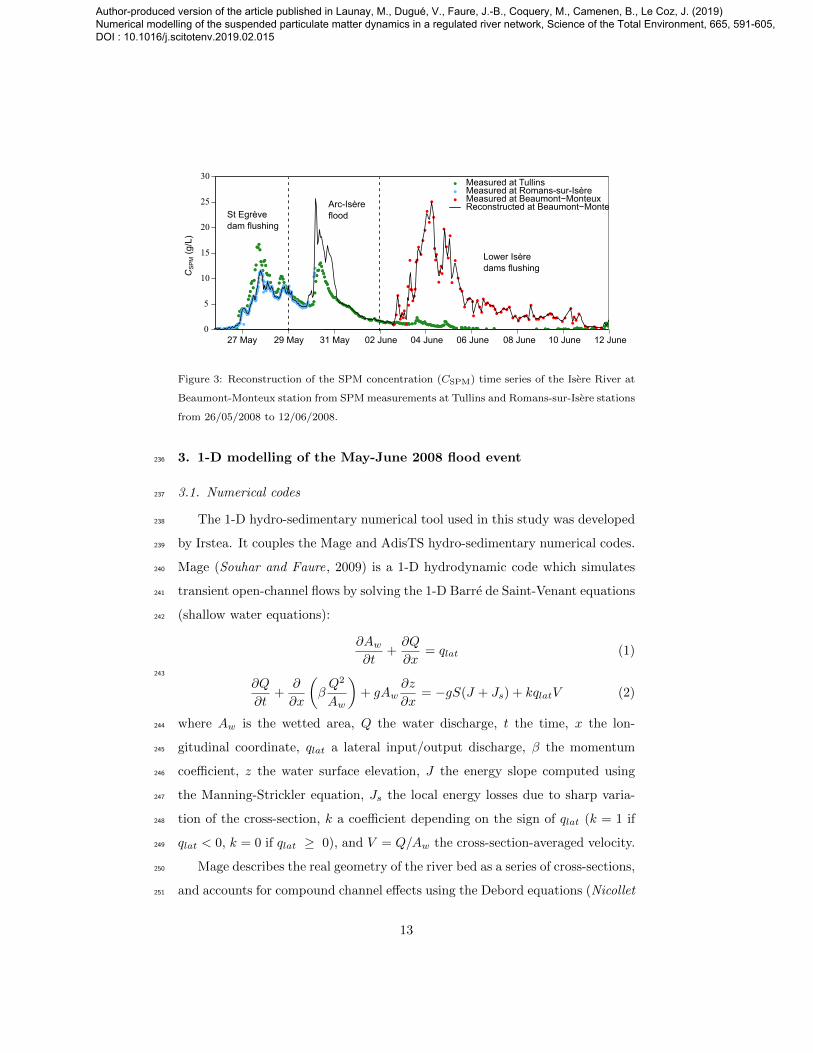
2.3. SPM inputs from the Isere River212
A CSPM time series was reconstructed at the outlet of the Isere River since213
a continuous CSPM time series was not available at the Isere at Beaumont-214
Monteux for the entire event (Fig. 3). The measurements used for the re-215
construction were taken at Tullins (turbidimeter, Rieux , 2008), Romans-sur-216
Isere (side-looking hydroacoustic profiler, Moore et al., 2012), Beaumont-Mon-217
teux (manual water samples, Rieux , 2008) and the Rhone at Viviers. Between218
26/05/08 and 30/05/08, the reconstructed CSPM time series followed the mea-219
surements at Romans-sur-Isere, the closest station upstream of Beaumont-Mon-220
teux, with an estimated time lag of 1 h. Time lag between stations was cal-221
culated based on CSPM peaks. Similarly, between 01/06/08 and 02/06/08, the222
reconstructed CSPM time series followed the measurements at Tullins with an223
estimated time lag of 10 h. However data based on Tullins station may be un-224
derestimated if erosion occurs in the Lower Isere reservoirs. Between 30/05/08225
and 01/06/08, those reservoirs were flushed; as no representative measurements226
were available, the SPM concentration at Beaumont-Monteux was evaluated as227
the SPM flux in the Rhone at Viviers divided by the water discharge of the Isere228
at Beaumont-Monteux. The rationale behind this computation is that during229
that period the SPM flux coming from the Rhone upstream of the Isere junction230
was negligible with respect to the SPM flux coming from the Isere. This ap-231
proximation is reasonable as discharges and SPM concentrations remained very232
low in the Rhone upstream of the Isere junction during that period of time.233
Finally, from 03/06/2008 on, SPM concentrations were measured at Beaumont-234
Monteux.235
12
Author-produced version of the article published in Launay, M., Dugué, V., Faure, J.-B., Coquery, M., Camenen, B., Le Coz, J. (2019) Numerical modelling of the suspended particulate matter dynamics in a regulated river network, Science of the Total Environment, 665, 591-605, DOI : 10.1016/j.scitotenv.2019.02.015
● ●●●●●●● ●● ● ● ●●●
●●●●●●●●●
●
●●●
●●
●
●
●●
●●●●
●●●
●●●
●●●
●●●●●●●●
●
●●●●●●●●●●●●●●●●●●●●●●●●●●●●●●●●●
●
●
●
●●●
●●●●●●●●●●●●●●●●●●●●●●●●●●●●●●●●●●●●●●●●●●●●●●●●●●●●●●●●●●●●●●●●●●●●●●●●●●●●●●●●●●
●●●●●●●●●●●●●●●●●●●●●●●●●●●●●
●●●●●●●●●●●● ●●●●●●●●● ● ● ● ●● ●●●●●●● ●●●●●●●●●● ●●● ●●●●●●●●●●●●●●●0
5
10
15
20
25
30
● ●●●●●●● ●● ● ● ●●●
●●●●●●●●●
●
●●●
●●
●
●
●●
●●●●
●●●
●●●
●●●
●●●●●●●●
●
●●●●●●●●●●●●●●●●●●●●●●●●●●●●●●●●●
●
●
●
●●●
●●●●●●●●●●●●●●●●●●●●●●●●●●●●●●●●●●●●●●●●●●●●●●●●●●●●●●●●●●●●●●●●●●●●●●●●●●●●●●●●●●
●●●●●●●●●●●●●●●●●●●●●●●●●●●●●
●●●●●●●●●●●● ●●●●●●●●● ● ● ● ●● ●●●●●●● ●●●●●●●●●● ●●● ●●●●●●●●●●●●●●●●●●●●●●●●●●●●●●●●●●●●●●●●●●●●●●●●●●●●●●●●●●●●●●●●
●●●●●●●●●●●●●●●●●●●●●●●●●●●●●●●●●●●●●●●●●●●●●●●●●●●●●●●
●
●●●●●●●●●●●●●●●●●●●●●●●●●●●●●●●●●●●●●●●●●●●●●●●●●●●●●●●●●●●●●●●●●●●●●●●●●●●
●●●●●
●
●
●●●●●●●●●●●●●●●●●●●●●●●●●●●●●●●●●●●●●●●●●●●●●●●●●●●●●●●●●●●●●●●●
●●●●●●●●●●●●●●●●●●●●●●●●●●●●●●●●●●●●●●●●●●●●●●●●●●●●●●●●●●●●●●●●●●●●●●●●●●●●●●●●●●●●●●●●●●●●●●●●●●●●●●●
●●●●●●●●●●●●●●●●
●●●●●●
●●
●
●
●
●●●●
●
●
●
●
●
●●
●●
●
●●
●
●
●
●
●
●
●
●
●
●
●
●
●
●
●
●
●
●
●
●
●
●
●●
●
●●●
●
●
●●
●
●●●●●● ●
●●●
●●●● ●●
●
●
●●●●●
●●●●●●
●●
●
●
●●
●
●● ●● ●
St Egrèvedam flushing
Arc-Isèreflood
Lower Isèredams flushing
●
●
●
Measured at TullinsMeasured at Romans-sur-IsèreMeasured at Beaumont−MonteuxReconstructed at Beaumont−Monteux
27 May 29 May 31 May 02 June 04 June 06 June 08 June 10 June 12 June
CS
PM (
g/L)
Figure 3: Reconstruction of the SPM concentration (CSPM) time series of the Isere River at
Beaumont-Monteux station from SPM measurements at Tullins and Romans-sur-Isere stations
from 26/05/2008 to 12/06/2008.
3. 1-D modelling of the May-June 2008 flood event236
3.1. Numerical codes237
The 1-D hydro-sedimentary numerical tool used in this study was developed238
by Irstea. It couples the Mage and AdisTS hydro-sedimentary numerical codes.239
Mage (Souhar and Faure, 2009) is a 1-D hydrodynamic code which simulates240
transient open-channel flows by solving the 1-D Barre de Saint-Venant equations241
(shallow water equations):242
∂Aw
∂t+∂Q
∂x= qlat (1)
243
∂Q
∂t+
∂
∂x
(βQ2
Aw
)+ gAw
∂z
∂x= −gS(J + Js) + kqlatV (2)
where Aw is the wetted area, Q the water discharge, t the time, x the lon-244
gitudinal coordinate, qlat a lateral input/output discharge, β the momentum245
coefficient, z the water surface elevation, J the energy slope computed using246
the Manning-Strickler equation, Js the local energy losses due to sharp varia-247
tion of the cross-section, k a coefficient depending on the sign of qlat (k = 1 if248
qlat < 0, k = 0 if qlat ≥ 0), and V = Q/Aw the cross-section-averaged velocity.249
Mage describes the real geometry of the river bed as a series of cross-sections,250
and accounts for compound channel effects using the Debord equations (Nicollet251
13
Author-produced version of the article published in Launay, M., Dugué, V., Faure, J.-B., Coquery, M., Camenen, B., Le Coz, J. (2019) Numerical modelling of the suspended particulate matter dynamics in a regulated river network, Science of the Total Environment, 665, 591-605, DOI : 10.1016/j.scitotenv.2019.02.015
and Uan, 1979). Storage nodes can be defined to model floodplain areas where252
the water velocity may be assumed to be negligible. No storage nodes were used253
in the presented simulations. The river network topology may be looped (bi-254
furcations, confluences), with multiple downstream boundary conditions. The255
1-D Barre de Saint-Venant equations are solved using a four point semi-implicit256
finite-difference scheme (Preissmann scheme).257
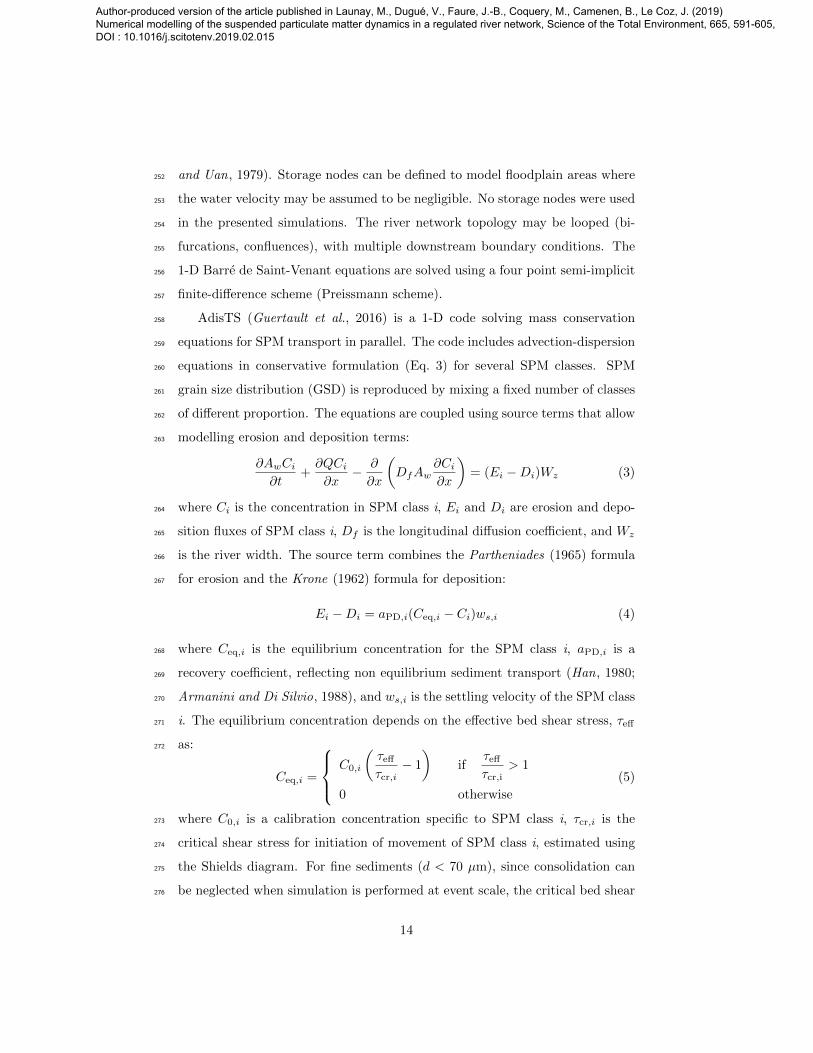
AdisTS (Guertault et al., 2016) is a 1-D code solving mass conservation258
equations for SPM transport in parallel. The code includes advection-dispersion259
equations in conservative formulation (Eq. 3) for several SPM classes. SPM260
grain size distribution (GSD) is reproduced by mixing a fixed number of classes261
of different proportion. The equations are coupled using source terms that allow262
modelling erosion and deposition terms:263
∂AwCi
∂t+∂QCi
∂x− ∂
∂x
(DfAw
∂Ci
∂x
)= (Ei −Di)Wz (3)
where Ci is the concentration in SPM class i, Ei and Di are erosion and depo-264
sition fluxes of SPM class i, Df is the longitudinal diffusion coefficient, and Wz265
is the river width. The source term combines the Partheniades (1965) formula266
for erosion and the Krone (1962) formula for deposition:267
Ei −Di = aPD,i(Ceq,i − Ci)ws,i (4)
where Ceq,i is the equilibrium concentration for the SPM class i, aPD,i is a268
recovery coefficient, reflecting non equilibrium sediment transport (Han, 1980;269
Armanini and Di Silvio, 1988), and ws,i is the settling velocity of the SPM class270
i. The equilibrium concentration depends on the effective bed shear stress, τeff271
as:272
Ceq,i =
C0,i
(τeff
τcr,i− 1
)if
τeff
τcr,i> 1
0 otherwise
(5)
where C0,i is a calibration concentration specific to SPM class i, τcr,i is the273
critical shear stress for initiation of movement of SPM class i, estimated using274
the Shields diagram. For fine sediments (d < 70 µm), since consolidation can275
be neglected when simulation is performed at event scale, the critical bed shear276
14
Author-produced version of the article published in Launay, M., Dugué, V., Faure, J.-B., Coquery, M., Camenen, B., Le Coz, J. (2019) Numerical modelling of the suspended particulate matter dynamics in a regulated river network, Science of the Total Environment, 665, 591-605, DOI : 10.1016/j.scitotenv.2019.02.015
stress is assumed independent of the grain size for fine sediments (τcr = 0.15 Pa).277
The effective bed shear stress is computed as τeff = (KS/K′S)τ , with KS the278
total Strickler coefficient, K ′S = 24/d
1/690 the skin-friction Strickler coefficient.279
The total bed shear stress τ = ρgRhJ is computed using the 1-D hydraulic280
model (ρ water density and Rh hydraulic radius). The calibration of the two281
AdisTS parameters, aPD,i and C0,i, was performed as functions of the grain size282
by Guertault et al. (2016) on Genissiat hydropower scheme in the Rhone River.283
The longitudinal diffusion coefficient Df was calculated using the formula of284
Iwasa and Aya (1991) as Launay et al. (2015) concluded it was the best suited285
based on their analysis of tracing experiments and hydro-acoustic measurements286
in the Rhone River near Lyon.287
AdisTS is loosely coupled with Mage software. The bed geometry remains288
fixed over time but the model simulates a potential stock of sediments available289
over each channel (main channel and floodway) in each cross-section. This stock290
is spatially distributed using a mean thickness and assuming a constant porosity291
p = 0.45; it can vary in mass and GSD over time due to erosion and deposition.292
Indeed, the advection-dispersion equation is solved for each sediment class and293
the GSD of bed sediment stocks depend on the erosion or deposition simulated294
along the system for each class independently. It is possible to specify initial295
sediment stocks along the river system but for the presented simulations no ini-296
tial stock was assumed. Over long timescales, there may be geometric feedbacks297
that change channel capacity when erosion and sedimentation do not balance.298
However, the fixed-bed assumption has limited consequences over the timescale299
of an individual event. It allows a faster calculation which is of particular inter-300
est when dealing with long river reaches and long-term scenarios with limited301
bed evolution.302
The 1-D numerical tool can be used to identify the origin of the water flowing303
at a downstream monitoring station. This identification is done by injecting a304
numerical tracer in each tributary j with concentration Cj,ref = 1 g/L. At a305
downstream monitoring station where the total water discharge Q is calculated,306
the proportion of water Qj/Q coming from the tributary j can be determined307
15
Author-produced version of the article published in Launay, M., Dugué, V., Faure, J.-B., Coquery, M., Camenen, B., Le Coz, J. (2019) Numerical modelling of the suspended particulate matter dynamics in a regulated river network, Science of the Total Environment, 665, 591-605, DOI : 10.1016/j.scitotenv.2019.02.015
based on the tracer mass continuity equation: Qj/Q = Cj/Cj,ref , where Cj308
is the concentration of tracer coming from the tributary j calculated at the309
station. Similarly, each SPM class i from each tributary j can be traced so310
that concentration CSPM,i,j is computed at each node and at each time of the311
simulation.312
3.2. 1-D model of the Rhone River313
The Rhone 1-D model, developed by Irstea as part of the OSR program, rep-314
resents the Rhone River from Lake Geneva to the Mediterranean Sea (Fig. 1).315
Bathymetry surveys of the river cross-sections are available every 500 m stream-316
wise. Lidar data were used to complete some profiles in the main channel and317
to estimate the extent of the floodway. Additional profiles were included to rep-318
resent dams and hydroelectric plants. In the model, cross-sectional profiles were319
interpolated every 100 m. Cross-sections of the major tributaries (Arve, Ain,320
Saone, Isere and Durance Rivers) were also included to represent their lowest321
sections up to their confluences with the Rhone River. Other tributaries are322
only represented as local inputs.323
Flow resistance coefficients of the main channel (30 ≤ KS ≤ 42 m1/3/s)324
were calibrated and validated over each reach using longitudinal water profiles325
measured over a wide range of discharges from low water to flood conditions326
(1500 ≤ Q ≤ 4500 m3/s). It was not necessary to vary the flow resistance327
coefficients with discharge to achieve an acceptable calibration, i.e. stage errors328
lower than 0.1 m, typically. Flow resistance coefficients of the floodways (over329
bars, islands, etc.) were assumed to be equal to 20 m1/3/s everywhere. The330
floodways of the Rhone River are narrow due to the presence of dykes and331
overbank flows are limited. Therefore, the results are not much sensitive to the332
values of the flow resistance coefficient defined for the floodways. The model333
does not include floodplains and cannot be used to simulate flooding over dikes.334
The model includes the operation rules of the 21 run-of-the-river hydropower335
schemes (Dugue et al., 2015). All the Rhone dams included in the model have336
a bypass channel (remember that no Isere dams are included in the computa-337
16
Author-produced version of the article published in Launay, M., Dugué, V., Faure, J.-B., Coquery, M., Camenen, B., Le Coz, J. (2019) Numerical modelling of the suspended particulate matter dynamics in a regulated river network, Science of the Total Environment, 665, 591-605, DOI : 10.1016/j.scitotenv.2019.02.015

tional domain). The operation rules of the run-of-the-river hydropower schemes338
impose a minimum compensation discharge in the bypassed channel and a max-339
imum discharge in the power canal as allowed by the hydropower plant (Dugue340
et al., 2015). Also, the maximum water level at a regulation point in each reser-341
voir is prescribed through legal dam operation rules which the operator has to342
follow, especially during floods, whatever the initial storage is. Such run-of-343
river dams actually have a limited storage capacity and the water level in the344
reservoir can be regulated by opening the dam gates, typically. The legal dam345
operation rules are specific to each dam and relate the maximum allowed water346
level as a function of inflow, usually.347
For the specific study of the May-June 2008 flood event, the 1-D numerical348
model was restricted to the Lower Rhone River, starting from Ternay station.349
Eleven hydropower schemes are present in the study area. In this configuration,350
the model has three main upstream boundary conditions: the Rhone at Ternay,351
the Isere at Beaumont-Monteux (i.e. just downstream of the last dam of the352
Lower-Isere chain of dams) and the Durance at Bonpas (see Fig. 1). The smaller353
tributaries located between Ternay and the Mediterranean Sea are considered354
as local water inputs. Both discharge and CSPM time series for the three main355
upstream boundaries are indicated as thick lines in Fig. 2. The discharge of the356
smaller tributaries were also simulated. The downstream boundary conditions357
on the Rhone Delta are the water levels measured in the Grand Rhone branch358
and in the Petit Rhone branch (cf. Fig. 1).359
Upstream of the Isere confluence, the SPM concentration in the Rhone River360
at Ternay was lower than 0.2 g/L typically (cf. Fig. 2c), which is much lower361
than the SPM concentration of the Isere and Durance tributaries during the362
flood event. As the discharge time series at Ternay does not indicate any flood,363
the SPM input at Ternay was set to zero for the simulations. The CSPM time364
series used as input for the Isere River at Beaumont-Monteux was reconstructed365
as discussed in section 2.3. For the Durance River, SPM time series was recorded366
at Bonpas turbidity station (Fig. 2b). SPM inputs from smaller tributaries were367
considered to be negligible during the May-June 2008 flood event compared to368
17
Author-produced version of the article published in Launay, M., Dugué, V., Faure, J.-B., Coquery, M., Camenen, B., Le Coz, J. (2019) Numerical modelling of the suspended particulate matter dynamics in a regulated river network, Science of the Total Environment, 665, 591-605, DOI : 10.1016/j.scitotenv.2019.02.015

the inputs of the Isere and Durance Rivers.369
3.3. Grain size distributions370
The 1-D numerical model requires information on the grain size distribution371
(GSD) of the SPM. Numerical simulations on the Rhone River were performed372
using six SPM classes with variable grain sizes from clay to medium sand, and373
assuming grain size distribution of each class to be log-normal of parameters374
d50,i and σi (see Tab 2). d50,i and σi are assumed constant in time; only the375
relative proportion of the class i (in the total SPM concentrations and stocks)376
may vary in time.377
The three classes with the finest SPM were determined based on grain size378
analysis of Rhone SPM samples (Launay , 2014) and the three classes with the379
coarsest SPM were defined by Guertault (2015). These classes were defined380
so as to best represent main groups of particles that systematically show up381
in the measured grain size distributions. Eventually, only the first four finest382
classes will be used for this study, the two coarsest sand classes being easily383
trapped by dam reservoirs (Camenen et al., 2019). The representative settling384
velocity ws,i for each class of sediment i was calculated using Camenen (2007)385
formula and assuming the grain size distribution of each class to be log-normal386
(cf. Tab. 2). Cohesion is neglected since organic content is very low (< 5%,387
typically) as well as cohesiveness (Legout et al., 2018). The impact on settling388
velocity (flocculation) is thus relatively low, and there is actually no possible389
validation of any flocculation model for this specific case.390
No GSD was measured in the Isere or Durance Rivers during the May-June391
2008 flood event. Grain size analysis of the SPM of the Isere River in 2008 and392
during a similar hydrological event in 2015 showed that the particles of the Isere393
River and the SPM collected in the Rhone River during the 2012 dam flushes394
have similar grain size distributions. Therefore, the parameters calibrated by395
Guertault et al. (2016) were kept to simulate the 2008 flood event. The same396
assumption was made on Durance SPM although no grain size analysis was397
performed on SPM samples of the Durance River.398
18
Author-produced version of the article published in Launay, M., Dugué, V., Faure, J.-B., Coquery, M., Camenen, B., Le Coz, J. (2019) Numerical modelling of the suspended particulate matter dynamics in a regulated river network, Science of the Total Environment, 665, 591-605, DOI : 10.1016/j.scitotenv.2019.02.015
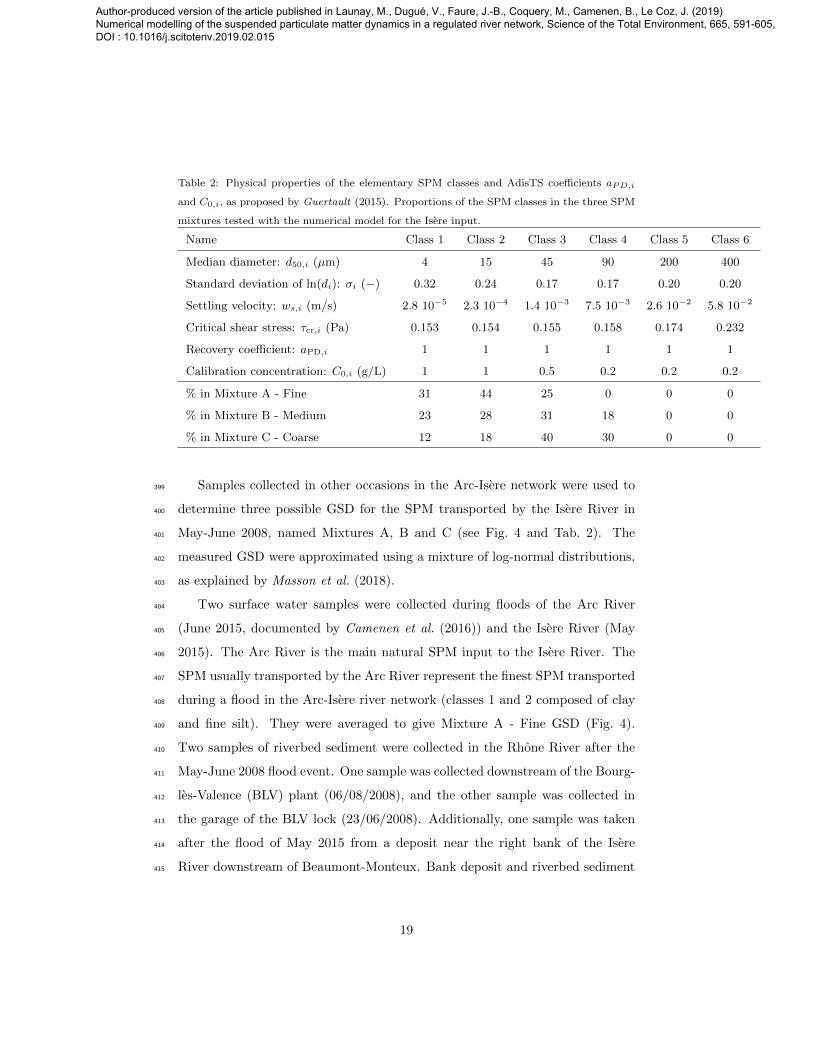
Table 2: Physical properties of the elementary SPM classes and AdisTS coefficients aPD,i
and C0,i, as proposed by Guertault (2015). Proportions of the SPM classes in the three SPM
mixtures tested with the numerical model for the Isere input.
Name Class 1 Class 2 Class 3 Class 4 Class 5 Class 6
Median diameter: d50,i (µm) 4 15 45 90 200 400
Standard deviation of ln(di): σi (−) 0.32 0.24 0.17 0.17 0.20 0.20
Settling velocity: ws,i (m/s) 2.8 10−5 2.3 10−4 1.4 10−3 7.5 10−3 2.6 10−2 5.8 10−2
Critical shear stress: τcr,i (Pa) 0.153 0.154 0.155 0.158 0.174 0.232
Recovery coefficient: aPD,i 1 1 1 1 1 1
Calibration concentration: C0,i (g/L) 1 1 0.5 0.2 0.2 0.2
% in Mixture A - Fine 31 44 25 0 0 0
% in Mixture B - Medium 23 28 31 18 0 0
% in Mixture C - Coarse 12 18 40 30 0 0
Samples collected in other occasions in the Arc-Isere network were used to399
determine three possible GSD for the SPM transported by the Isere River in400
May-June 2008, named Mixtures A, B and C (see Fig. 4 and Tab. 2). The401
measured GSD were approximated using a mixture of log-normal distributions,402
as explained by Masson et al. (2018).403
Two surface water samples were collected during floods of the Arc River404
(June 2015, documented by Camenen et al. (2016)) and the Isere River (May405
2015). The Arc River is the main natural SPM input to the Isere River. The406
SPM usually transported by the Arc River represent the finest SPM transported407
during a flood in the Arc-Isere river network (classes 1 and 2 composed of clay408
and fine silt). They were averaged to give Mixture A - Fine GSD (Fig. 4).409
Two samples of riverbed sediment were collected in the Rhone River after the410
May-June 2008 flood event. One sample was collected downstream of the Bourg-411
les-Valence (BLV) plant (06/08/2008), and the other sample was collected in412
the garage of the BLV lock (23/06/2008). Additionally, one sample was taken413
after the flood of May 2015 from a deposit near the right bank of the Isere414
River downstream of Beaumont-Monteux. Bank deposit and riverbed sediment415
19
Author-produced version of the article published in Launay, M., Dugué, V., Faure, J.-B., Coquery, M., Camenen, B., Le Coz, J. (2019) Numerical modelling of the suspended particulate matter dynamics in a regulated river network, Science of the Total Environment, 665, 591-605, DOI : 10.1016/j.scitotenv.2019.02.015

samples correspond to the coarsest SPM transported during a flood. They were416
averaged to compose Mixture C - Coarse GSD, which is considered as an extreme417
scenario for which most of the SPM would be made of that coarsest fraction.418
Finally, one sample taken in the water column close to the bottom at the Rhone419
and Isere confluence during the May 2015 flood contained particles from clay to420
coarse silt in equal proportions. This intermediate sample constitutes Mixture421
B - Medium GSD.422
100 1000101D (µm)
Vol
ume
(%)
0.0
0.5
1.0
1.5
Mixture A - Fine Mixture B - MediumMixture C - Coarse
Figure 4: Three possible grain size distributions for the SPM transported by the Isere River
during the May-June 2008 flood event.
The SPM of the Durance River was assumed to be composed of clay only423
(class 1), with a median diameter d50 of 4 µm. This hypothesis relies only424
on field observation of the very fine aspect of the washload transported by the425
Durance River.426
4. Results427
4.1. Origin of water discharge during the May-June 2008 flood event428
The contributions of the Isere and Durance Rivers to the Rhone River water429
discharge during the May-June 2008 event were evaluated using the 1-D model.430
The hydrograph decomposition results are presented for the Rhone at Valence431
20
Author-produced version of the article published in Launay, M., Dugué, V., Faure, J.-B., Coquery, M., Camenen, B., Le Coz, J. (2019) Numerical modelling of the suspended particulate matter dynamics in a regulated river network, Science of the Total Environment, 665, 591-605, DOI : 10.1016/j.scitotenv.2019.02.015
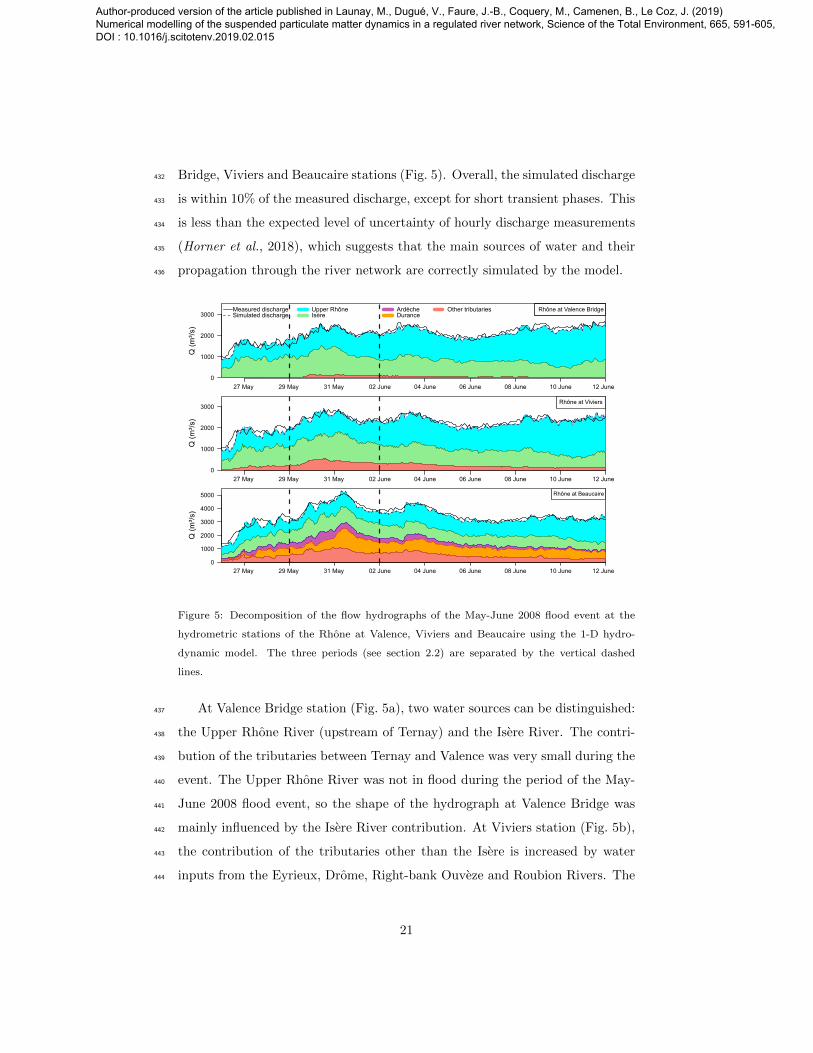
Bridge, Viviers and Beaucaire stations (Fig. 5). Overall, the simulated discharge432
is within 10% of the measured discharge, except for short transient phases. This433
is less than the expected level of uncertainty of hourly discharge measurements434
(Horner et al., 2018), which suggests that the main sources of water and their435
propagation through the river network are correctly simulated by the model.436
0
1000
2000
3000
Q (
m³/
s)
Upper RhôneIsère
ArdècheDurance
Other tributaries Rhône at Valence Bridge
0
1000
2000
3000
Q (
m³/
s)
0
1000
2000
3000
4000
5000
Q (
m³/
s)
Rhône at Beaucaire
27 May 29 May 31 May 02 June 04 June 06 June 08 June 10 June 12 June
Measured dischargeSimulated discharge
Rhône at Viviers
27 May 29 May 31 May 02 June 04 June 06 June 08 June 10 June 12 June
27 May 29 May 31 May 02 June 04 June 06 June 08 June 10 June 12 June
Figure 5: Decomposition of the flow hydrographs of the May-June 2008 flood event at the
hydrometric stations of the Rhone at Valence, Viviers and Beaucaire using the 1-D hydro-
dynamic model. The three periods (see section 2.2) are separated by the vertical dashed
lines.
At Valence Bridge station (Fig. 5a), two water sources can be distinguished:437
the Upper Rhone River (upstream of Ternay) and the Isere River. The contri-438
bution of the tributaries between Ternay and Valence was very small during the439
event. The Upper Rhone River was not in flood during the period of the May-440
June 2008 flood event, so the shape of the hydrograph at Valence Bridge was441
mainly influenced by the Isere River contribution. At Viviers station (Fig. 5b),442
the contribution of the tributaries other than the Isere is increased by water443
inputs from the Eyrieux, Drome, Right-bank Ouveze and Roubion Rivers. The444
21
Author-produced version of the article published in Launay, M., Dugué, V., Faure, J.-B., Coquery, M., Camenen, B., Le Coz, J. (2019) Numerical modelling of the suspended particulate matter dynamics in a regulated river network, Science of the Total Environment, 665, 591-605, DOI : 10.1016/j.scitotenv.2019.02.015
discharge contribution of these tributaries is higher than that of previous trib-445
utaries between Ternay and Valence but remains small. At Beaucaire (Fig. 5c),446
most of the water came from the Upper Rhone (from 20 to 40 %), the Isere447
(around 25 %)and the Durance (around 25 %) Rivers, with smaller inputs from448
the Ardeche and other tributaries.449
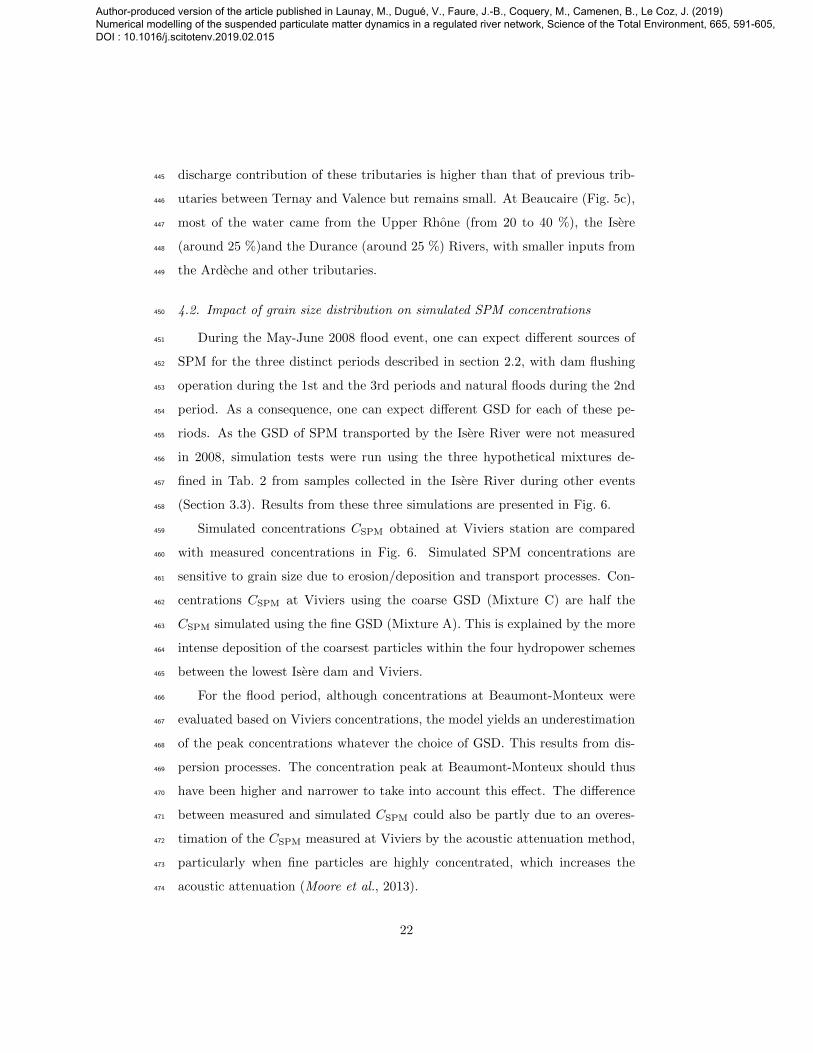
4.2. Impact of grain size distribution on simulated SPM concentrations450
During the May-June 2008 flood event, one can expect different sources of451
SPM for the three distinct periods described in section 2.2, with dam flushing452
operation during the 1st and the 3rd periods and natural floods during the 2nd453
period. As a consequence, one can expect different GSD for each of these pe-454
riods. As the GSD of SPM transported by the Isere River were not measured455
in 2008, simulation tests were run using the three hypothetical mixtures de-456
fined in Tab. 2 from samples collected in the Isere River during other events457
(Section 3.3). Results from these three simulations are presented in Fig. 6.458
Simulated concentrations CSPM obtained at Viviers station are compared459
with measured concentrations in Fig. 6. Simulated SPM concentrations are460
sensitive to grain size due to erosion/deposition and transport processes. Con-461
centrations CSPM at Viviers using the coarse GSD (Mixture C) are half the462
CSPM simulated using the fine GSD (Mixture A). This is explained by the more463
intense deposition of the coarsest particles within the four hydropower schemes464
between the lowest Isere dam and Viviers.465
For the flood period, although concentrations at Beaumont-Monteux were466
evaluated based on Viviers concentrations, the model yields an underestimation467
of the peak concentrations whatever the choice of GSD. This results from dis-468
persion processes. The concentration peak at Beaumont-Monteux should thus469
have been higher and narrower to take into account this effect. The difference470
between measured and simulated CSPM could also be partly due to an overes-471
timation of the CSPM measured at Viviers by the acoustic attenuation method,472
particularly when fine particles are highly concentrated, which increases the473
acoustic attenuation (Moore et al., 2013).474
22
Author-produced version of the article published in Launay, M., Dugué, V., Faure, J.-B., Coquery, M., Camenen, B., Le Coz, J. (2019) Numerical modelling of the suspended particulate matter dynamics in a regulated river network, Science of the Total Environment, 665, 591-605, DOI : 10.1016/j.scitotenv.2019.02.015
0
2
4
6
8
10
CS
PM (
g/L)
Measured CSPMClayFine silt
Medium siltCoarse silt
St Egrèvedam flushing
Arc-Isèreflood
Lower Isèredams flushing
(a)
02 June 04 June 06 June 08 June 10 June 12 June31 May29 May27 May
Measured CSPMClayFine silt
Medium siltCoarse silt
St Egrèvedam flushing
Arc-Isèreflood
Lower Isèredams flushing
0
2
4
6
8
10
CS
PM (
g/L)
(b)
02 June 04 June 06 June 08 June 10 June 12 June31 May29 May27 May
02 June 04 June 06 June 08 June 10 June 12 June31 May29 May27 May
Measured CSPMClayFine silt
Medium siltCoarse silt
St Egrèvedam flushing
Arc-Isèreflood
Lower Isèredams flushing
0
2
4
6
8
10
CS
PM (
g/L)
(c)
Figure 6: Simulated and measured SPM concentration (CSPM) at Viviers station for the three
hypothetical GSD defined in Tab. 2: (a) Mixture A - Fine, (b) Mixture B - Medium and (c)
Mixture C - Coarse.
Simulation tests also confirm that the GSD of the SPM transported was475
different during the three periods of the May-June 2008 flood event. During the476
23
Author-produced version of the article published in Launay, M., Dugué, V., Faure, J.-B., Coquery, M., Camenen, B., Le Coz, J. (2019) Numerical modelling of the suspended particulate matter dynamics in a regulated river network, Science of the Total Environment, 665, 591-605, DOI : 10.1016/j.scitotenv.2019.02.015

St Egreve Dam flushing period, the model using medium or coarse GSD (Mix-477
tures B or C) yields CSPM-values in relatively good agreement with measured478
data. Mixture B was eventually preferred since it corresponds to measured data479
during the flood period of a similar event (in 2015). Also, it yields a better es-480
timation of peak concentrations. Flushing operation evacuated the coarse SPM481
from the St Egreve reservoir, but they were partially stored into the Lower Isere482
reservoirs, as the Lower Isere dams were operated with high water levels during483
this period. This could explain why the medium GSD is consistent with this484
situation.485
During the Arc-Isere flood period, the CSPM peak measured at Viviers486
reached about 9 g/L. Mixture A yielded the best agreement between simu-487
lated and measured CSPM time series. Such very fine washload material, poorly488
represented in the bed, is brought from the Isere basin by the flood wave. Nev-489
ertheless, the simulated CSPM peak reached only 6 g/L. As discussed above,490
the concentration peak at Beaumont-Monteux should have been higher and491
narrower. Using a finer GSD could also increase the simulated CSPM peak.492
However, as discussed in section 3.3, a finer GSD would no longer correspond493
to the samples measured in the Isere River during floods of the Arc River.494
For the third period of the event, corresponding to the Lower Isere dams495
flushing, Mixture C yields CSPM at Viviers station that are in best agreement496
with measurements. This is consistent with the opening of the dam gates and497
the resuspension of coarser particles previously settled in the reservoir.498
According to these observations, the GSD was parametrized as follows for499
the simulation of the May-June 2008 flood event: the medium GSD of Mixture500
B for the first period, the fine GSD of Mixture A for the second period and the501
coarse GSD of Mixture C for the third period.502
4.3. Interaction of SPM with hydropower schemes503
The objective of this section is to study the SPM dynamics in interaction504
of SPM with hydropower schemes between the lowest Isere dam and Viviers505
station (Fig. 1). Five additional simulations were carried out to study the de-506
24
Author-produced version of the article published in Launay, M., Dugué, V., Faure, J.-B., Coquery, M., Camenen, B., Le Coz, J. (2019) Numerical modelling of the suspended particulate matter dynamics in a regulated river network, Science of the Total Environment, 665, 591-605, DOI : 10.1016/j.scitotenv.2019.02.015

position/erosion processes occurring in each hydropower scheme of the reach.507
The first simulation was run without activating deposition/erosion within the508
entire river system. In the other four simulations, deposition/erosion was suc-509
cessively activated in the four hydropower schemes of the system, which led to510
the decrease of the CSPM simulated at Viviers (Fig. 7). Simulation of deposition511
is necessary to reproduce the CSPM measured at Viviers. The simulated CSPM512
peak decreased from 4 to 2 g/L, 9 to 6 g/L, and 8 to 2 g/L in the first, second,513
and third period, respectively. This confirms that hydropower schemes are an514
obstacle to SPM transport due to the decreased flow velocity in dam reservoirs,515
which enhances deposition particularly for coarse SPM. Deposition is particu-516
larly intense during the dam flushing periods (first and third periods), as coarser517
GSD was parameterized for these periods (see section 4.2). These simulations518
also suggest that the largest decrease of CSPM occurred in the Bourg-les-Valence519
(BLV) scheme, between the lowest Isere dam and BLV dam. SPM also settled520
down within the next three hydro-electric schemes, but to a lesser extent since521
most of the coarsest particles settled down in the first scheme.522
Measured CSPMSimulated CSPM without depositionSimulated CSPM with deposition in BLV
Simulated CSPM with deposition in BLV+BCTSimulated CSPM with deposition in BLV+BCT+BLNSimulated CSPM with deposition in BLV+BCT+BLN+MTL
02 June 04 June 06 June 08 June 10 June 12 June31 May29 May27 May0
2
4
6
8
10
CS
PM (
g/L)
12
St Egrèvedam flushing
Arc-Isèreflood
Lower Isèredams flushing
Figure 7: Measured and simulated SPM concentration (CSPM) at Viviers station during the
May-June 2008 flood event, with deposition/erosion processes successively activated in the
four hydropower schemes located between the lowest Isere dam and Viviers. BLV = Bourg-
les-Valence, BCT = Beauchastel, BLN = Baix-Le Logis Neuf, MTL = Montelimar. Coloured
areas represent the cumulative SPM trapped in successive reservoirs.
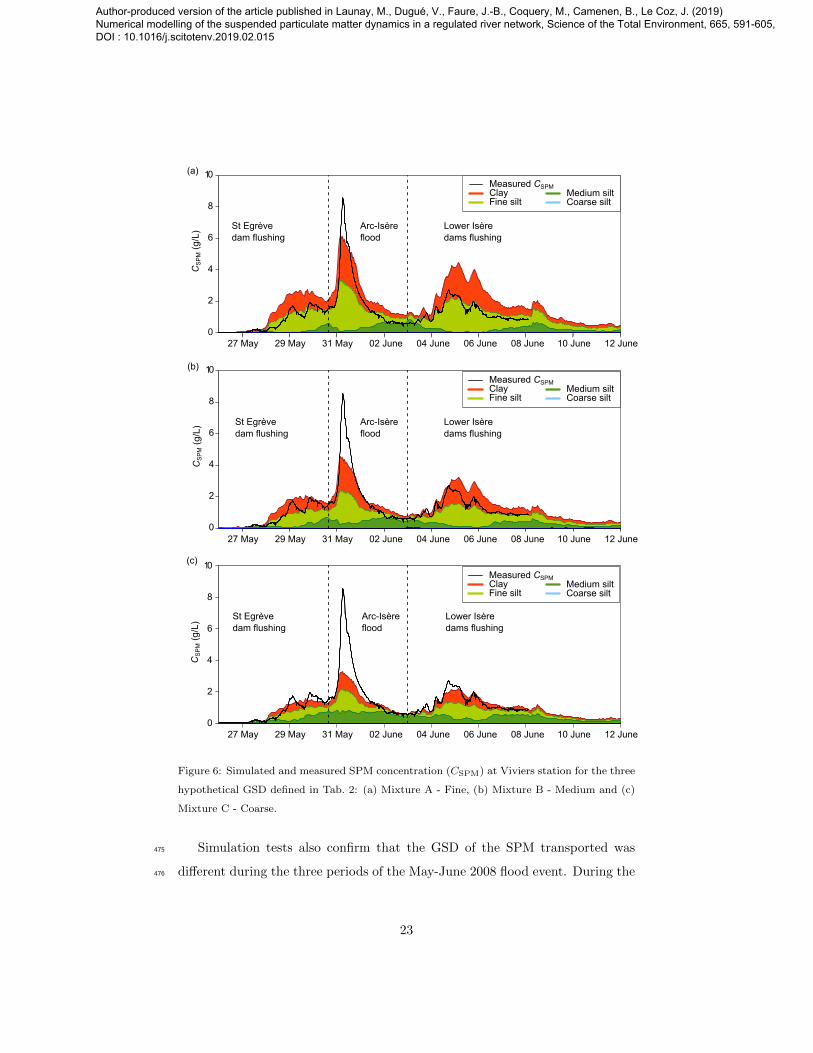
The numerical model provides detailed information on the quantity and grain523
25
Author-produced version of the article published in Launay, M., Dugué, V., Faure, J.-B., Coquery, M., Camenen, B., Le Coz, J. (2019) Numerical modelling of the suspended particulate matter dynamics in a regulated river network, Science of the Total Environment, 665, 591-605, DOI : 10.1016/j.scitotenv.2019.02.015

size distribution of the SPM present in each branch of the river system at any524
time of the simulation. In order to better understand the deposition processes525
between the lowest Isere dam and the BLV dam observed in Fig. 7, the cumu-526
lative amounts of SPM settled in the area are presented in Fig. 8. At the scale527
of the entire event, the Isere River produced a total amount of 7.7 Mt of SPM,528
of which 2.8 Mt deposited at the Isere-Rhone confluence (Fig. 8d). The SPM529
deposition occurred mainly within three branches of the network: 60% in the530
lowest Isere branch, and 30% in the BLV and Beauchastel (BCT) power canals.531
Deposition mainly occurred during the second and third periods with a segre-532
gation in the grain size of the particle deposited, as also observed by Camenen533
et al. (2019). The Isere River produced 2.8 Mt during the second period, and534
80 % of this input, mainly composed of fine SPM, travelled through the BLV535
and BCT schemes. The remaining 20%, mainly composed of class 3 particles,536
were trapped in the BCT and BLV power canals, and not in the lowest Isere537
branch. But most of the deposition occurred during the third period when the538
Lower Isere dams were flushed. The SPM flux during this period was 3.8 Mt, i.e.539
half of the total input of the Isere during the event. SPM of class 4 represented540
30 % of the Isere River input, and these particles massively deposited within541
the Isere branch, and to a lesser extent within the BLV and BCT power canals.542
The deposits simulated in the downstream Isere reach are mainly composed of543
classes 3 and 4, which is consistent with available observations and with the544
choice of Mixture C as a coarse GSD representative of a deposit collected after545
the May 2015 flood.546
26
Author-produced version of the article published in Launay, M., Dugué, V., Faure, J.-B., Coquery, M., Camenen, B., Le Coz, J. (2019) Numerical modelling of the suspended particulate matter dynamics in a regulated river network, Science of the Total Environment, 665, 591-605, DOI : 10.1016/j.scitotenv.2019.02.015
(a) (b)
Rhône
Isère
BCT
BLV
0.00 Mt
1.09 Mt
Rhône0.61 Mt
1st period Rhône
Isère
BCT
BLV
Rhône2.33 Mt
2.85 Mt
0.00 Mt 2nd period
(c) (d)
Rhône
Isère
BCT
BLV
Rhône1.97 Mt
3.78 Mt
0.00 Mt 3rd period
Isère
Class 1 Class 2 Class 3Class 4
Dams
Rhône4.91 Mt
7.72 Mt
0.05 0.50.1 1.0 Mt
BCT
BLV
Hydropower plants
Cumulative deposits
Grain size
Fluxes at boundaries
Entire event 0.00 Mt
Rhône
Figure 8: Mass and grain size composition of SPM deposited in the Isere-Rhone confluence
system during the May-June 2008 flood event: first period (a), second period (b), third period
(c) and entire event (d). See section 2.2 for definition of periods and Tab.2 for definition of
grain size classes. The mass and grain size composition of SPM fluxes at boundaries are also
shown. The thickness of the lines is proportional to the mass of SPM deposited in each reach.
BLV = Bourg-les-Valence scheme and BCT = Beauchastel scheme.
27
Author-produced version of the article published in Launay, M., Dugué, V., Faure, J.-B., Coquery, M., Camenen, B., Le Coz, J. (2019) Numerical modelling of the suspended particulate matter dynamics in a regulated river network, Science of the Total Environment, 665, 591-605, DOI : 10.1016/j.scitotenv.2019.02.015
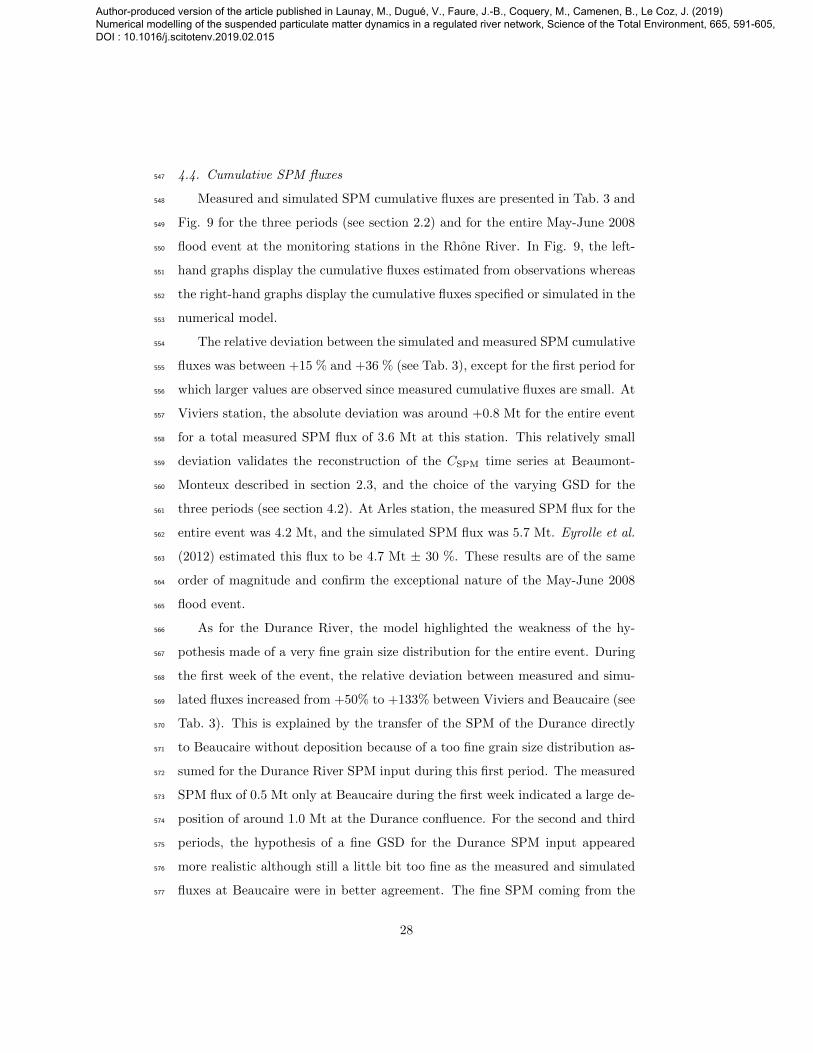
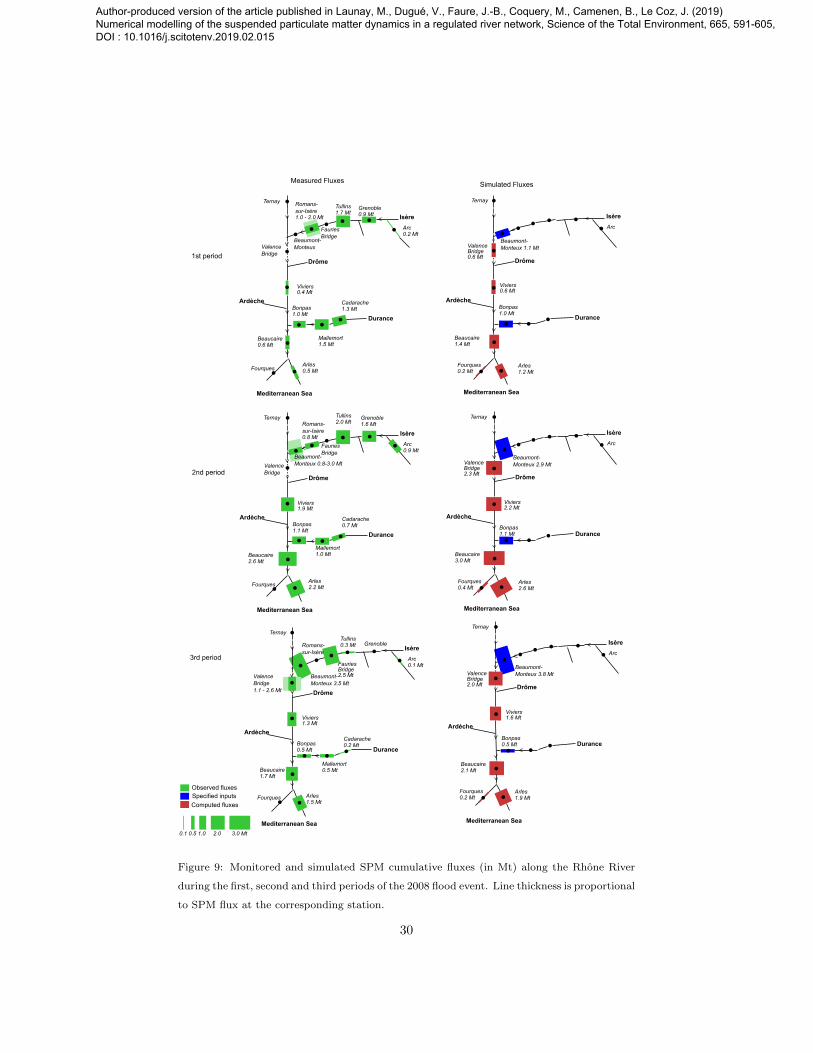
4.4. Cumulative SPM fluxes547
Measured and simulated SPM cumulative fluxes are presented in Tab. 3 and548
Fig. 9 for the three periods (see section 2.2) and for the entire May-June 2008549
flood event at the monitoring stations in the Rhone River. In Fig. 9, the left-550
hand graphs display the cumulative fluxes estimated from observations whereas551
the right-hand graphs display the cumulative fluxes specified or simulated in the552
numerical model.553
The relative deviation between the simulated and measured SPM cumulative554
fluxes was between +15 % and +36 % (see Tab. 3), except for the first period for555
which larger values are observed since measured cumulative fluxes are small. At556
Viviers station, the absolute deviation was around +0.8 Mt for the entire event557
for a total measured SPM flux of 3.6 Mt at this station. This relatively small558
deviation validates the reconstruction of the CSPM time series at Beaumont-559
Monteux described in section 2.3, and the choice of the varying GSD for the560
three periods (see section 4.2). At Arles station, the measured SPM flux for the561
entire event was 4.2 Mt, and the simulated SPM flux was 5.7 Mt. Eyrolle et al.562
(2012) estimated this flux to be 4.7 Mt ± 30 %. These results are of the same563
order of magnitude and confirm the exceptional nature of the May-June 2008564
flood event.565
As for the Durance River, the model highlighted the weakness of the hy-566
pothesis made of a very fine grain size distribution for the entire event. During567
the first week of the event, the relative deviation between measured and simu-568
lated fluxes increased from +50% to +133% between Viviers and Beaucaire (see569
Tab. 3). This is explained by the transfer of the SPM of the Durance directly570
to Beaucaire without deposition because of a too fine grain size distribution as-571
sumed for the Durance River SPM input during this first period. The measured572
SPM flux of 0.5 Mt only at Beaucaire during the first week indicated a large de-573
position of around 1.0 Mt at the Durance confluence. For the second and third574
periods, the hypothesis of a fine GSD for the Durance SPM input appeared575
more realistic although still a little bit too fine as the measured and simulated576
fluxes at Beaucaire were in better agreement. The fine SPM coming from the577
28
Author-produced version of the article published in Launay, M., Dugué, V., Faure, J.-B., Coquery, M., Camenen, B., Le Coz, J. (2019) Numerical modelling of the suspended particulate matter dynamics in a regulated river network, Science of the Total Environment, 665, 591-605, DOI : 10.1016/j.scitotenv.2019.02.015
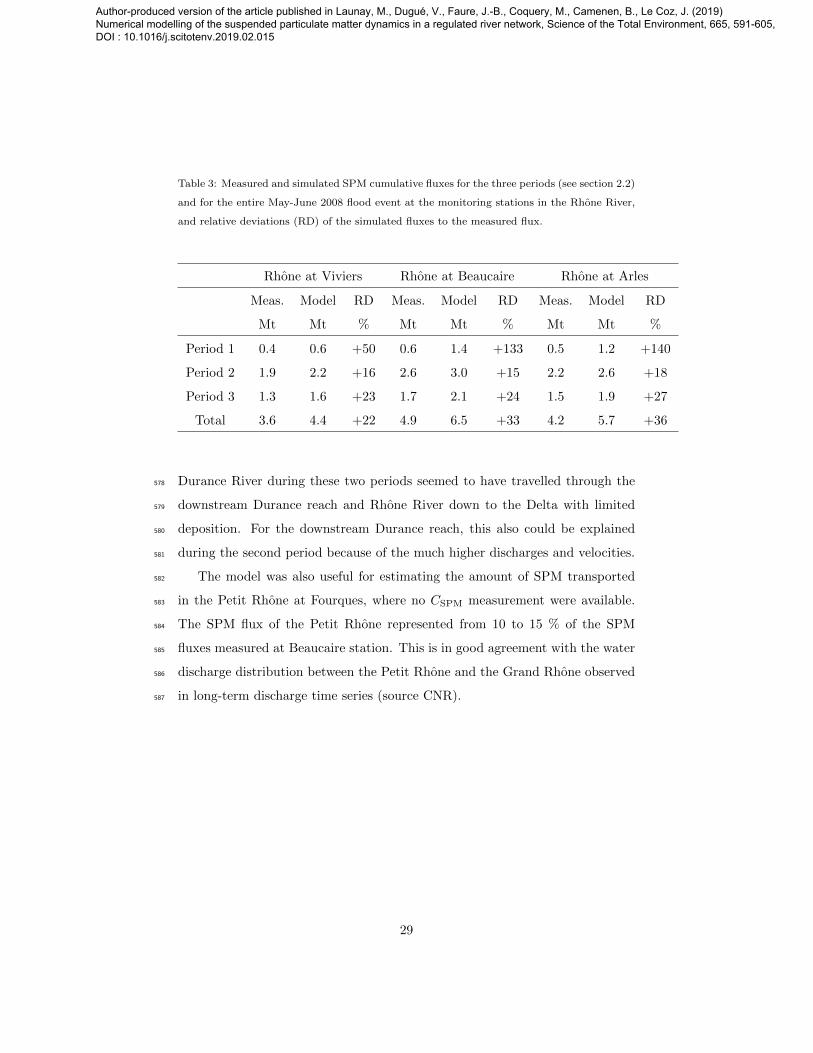
Table 3: Measured and simulated SPM cumulative fluxes for the three periods (see section 2.2)
and for the entire May-June 2008 flood event at the monitoring stations in the Rhone River,
and relative deviations (RD) of the simulated fluxes to the measured flux.
Rhone at Viviers Rhone at Beaucaire Rhone at Arles
Meas. Model RD Meas. Model RD Meas. Model RD
Mt Mt % Mt Mt % Mt Mt %
Period 1 0.4 0.6 +50 0.6 1.4 +133 0.5 1.2 +140
Period 2 1.9 2.2 +16 2.6 3.0 +15 2.2 2.6 +18
Period 3 1.3 1.6 +23 1.7 2.1 +24 1.5 1.9 +27
Total 3.6 4.4 +22 4.9 6.5 +33 4.2 5.7 +36
Durance River during these two periods seemed to have travelled through the578
downstream Durance reach and Rhone River down to the Delta with limited579
deposition. For the downstream Durance reach, this also could be explained580
during the second period because of the much higher discharges and velocities.581
The model was also useful for estimating the amount of SPM transported582
in the Petit Rhone at Fourques, where no CSPM measurement were available.583
The SPM flux of the Petit Rhone represented from 10 to 15 % of the SPM584
fluxes measured at Beaucaire station. This is in good agreement with the water585
discharge distribution between the Petit Rhone and the Grand Rhone observed586
in long-term discharge time series (source CNR).587
29
Author-produced version of the article published in Launay, M., Dugué, V., Faure, J.-B., Coquery, M., Camenen, B., Le Coz, J. (2019) Numerical modelling of the suspended particulate matter dynamics in a regulated river network, Science of the Total Environment, 665, 591-605, DOI : 10.1016/j.scitotenv.2019.02.015
Ternay
Drôme
Ardèche
Isère
Arc0.9 Mt
Durance
Romans-sur-Isère0.8 Mt
Tullins2.0 Mt
Grenoble1.6 Mt
Viviers1.9 Mt
Bonpas1.1 Mt
Beaucaire2.6 Mt
Arles2.2 Mt
Mallemort1.0 Mt
Cadarache0.7 Mt
Valence Bridge
Beaumont-Monteux 0.8-3.0 Mt
Fauries Bridge
Mediterranean Sea
Mediterranean Sea
Ternay
Drôme
Ardèche
Isère
Arc0.1 Mt
Durance
Tullins0.3 Mt Grenoble
Viviers1.3 Mt
Bonpas0.5 Mt
Beaucaire1.7 Mt
Arles1.5 Mt
Mallemort0.5 Mt
Cadarache0.2 Mt
ValenceBridge1.1 - 2.6 Mt
Beaumont-Monteux 3.5 Mt
FauriesBridge2.5 Mt
Ternay
Drôme
Ardèche
Isère
Arc
Durance
Viviers2.2 Mt
Bonpas1.1 Mt
Beaucaire3.0 Mt
Fourques0.4 Mt
Arles2.6 Mt
ValenceBridge2.3 Mt
Beaumont-Monteux 2.9 Mt
Ternay
Drôme
Ardèche
Isère
Arc
Durance
Viviers1.6 Mt
Bonpas0.5 Mt
Beaucaire2.1 Mt
Fourques0.2 Mt
Arles1.9 Mt
ValenceBridge2.0 Mt
Beaumont-Monteux 3.8 Mt
2nd period
3rd period
Mediterranean Sea
Mediterranean Sea
Ternay
Drôme
Ardèche
Isère
Arc0.2 Mt
Durance
Romans-sur-Isère1.0 - 2.0 Mt
Tullins1.7 Mt
Grenoble0.9 Mt
Viviers0.4 Mt
Bonpas1.0 Mt
Beaucaire0.6 Mt
Arles0.5 Mt
Mallemort1.5 Mt
Cadarache1.3 Mt
Valence Bridge
Beaumont-Monteux
Fauries Bridge
Measured Fluxes
Mediterranean Sea
Ternay
Drôme
Ardèche
Isère
Arc
Durance
Viviers0.6 Mt
Bonpas1.0 Mt
Beaucaire1.4 Mt
Fourques0.2 Mt
Arles1.2 Mt
ValenceBridge0.6 Mt
Beaumont-Monteux 1.1 Mt
1st period
Simulated Fluxes
Mediterranean Sea
Observed fluxesSpecified inputs
Computed fluxes
0.1 0.5 1.0 2.0 3.0 Mt
Fourques
Fourques
Fourques
Romans-sur-Isère
Figure 9: Monitored and simulated SPM cumulative fluxes (in Mt) along the Rhone River
during the first, second and third periods of the 2008 flood event. Line thickness is proportional
to SPM flux at the corresponding station.
30
Author-produced version of the article published in Launay, M., Dugué, V., Faure, J.-B., Coquery, M., Camenen, B., Le Coz, J. (2019) Numerical modelling of the suspended particulate matter dynamics in a regulated river network, Science of the Total Environment, 665, 591-605, DOI : 10.1016/j.scitotenv.2019.02.015
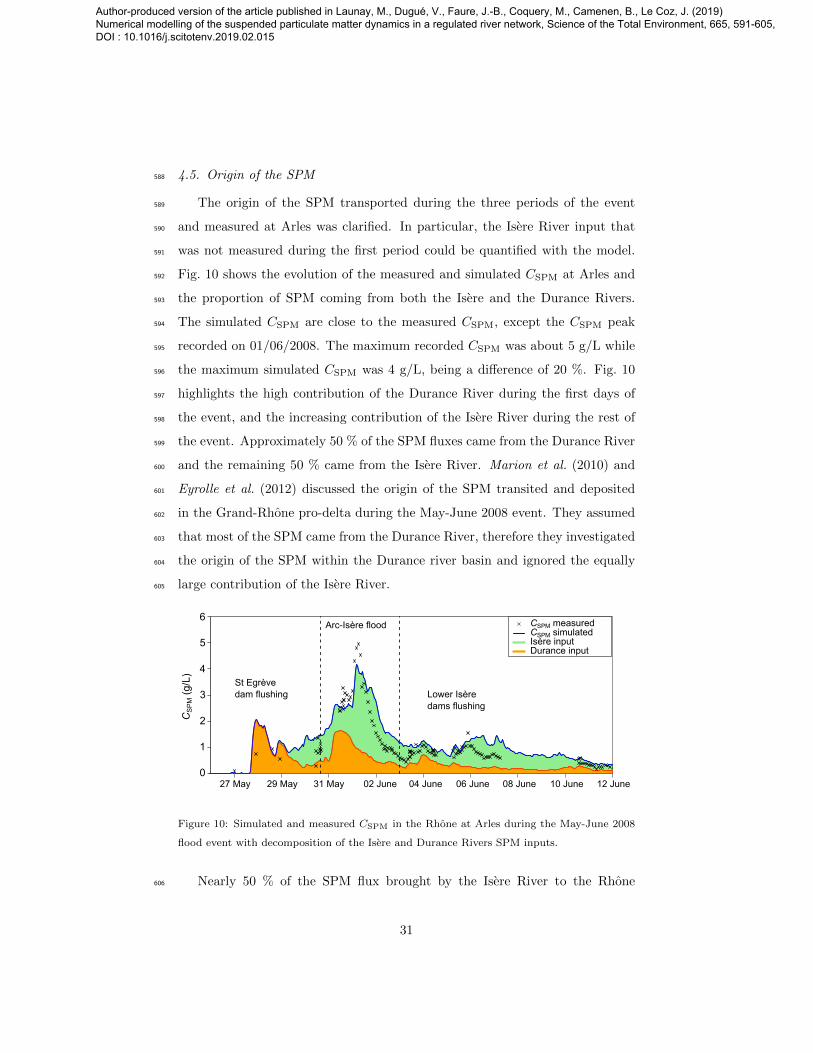
4.5. Origin of the SPM588
The origin of the SPM transported during the three periods of the event589
and measured at Arles was clarified. In particular, the Isere River input that590
was not measured during the first period could be quantified with the model.591
Fig. 10 shows the evolution of the measured and simulated CSPM at Arles and592
the proportion of SPM coming from both the Isere and the Durance Rivers.593
The simulated CSPM are close to the measured CSPM, except the CSPM peak594
recorded on 01/06/2008. The maximum recorded CSPM was about 5 g/L while595
the maximum simulated CSPM was 4 g/L, being a difference of 20 %. Fig. 10596
highlights the high contribution of the Durance River during the first days of597
the event, and the increasing contribution of the Isere River during the rest of598
the event. Approximately 50 % of the SPM fluxes came from the Durance River599
and the remaining 50 % came from the Isere River. Marion et al. (2010) and600
Eyrolle et al. (2012) discussed the origin of the SPM transited and deposited601
in the Grand-Rhone pro-delta during the May-June 2008 event. They assumed602
that most of the SPM came from the Durance River, therefore they investigated603
the origin of the SPM within the Durance river basin and ignored the equally604
large contribution of the Isere River.605
CSPM measuredCSPM simulatedIsère inputDurance input
0
1
2
3
4
5
6
CS
PM (
g/L) St Egrève
dam flushing
Arc-Isère flood
Lower Isèredams flushing
27 May 02 June31 May29 May 04 June 06 June 08 June 10 June 12 June
Figure 10: Simulated and measured CSPM in the Rhone at Arles during the May-June 2008
flood event with decomposition of the Isere and Durance Rivers SPM inputs.
Nearly 50 % of the SPM flux brought by the Isere River to the Rhone606
31
Author-produced version of the article published in Launay, M., Dugué, V., Faure, J.-B., Coquery, M., Camenen, B., Le Coz, J. (2019) Numerical modelling of the suspended particulate matter dynamics in a regulated river network, Science of the Total Environment, 665, 591-605, DOI : 10.1016/j.scitotenv.2019.02.015
River system deposited in the river network before reaching Viviers. Although607
the model confirmed that the Rhone reservoirs acted as sediment sinks during608
the May-June 2008 flood event, they can turn to act as sediment sources due to609
resuspension during other floods. In the annual SPM fluxes computed by Poulier610
et al. (2019), there is evidence that the SPM deposited and stored during the611
2008 event were later re-suspended and exported during floods.612
5. Conclusive comments613
This paper explores the potential of numerical simulation to predict the614
sources and fate of SPM in regulated river networks. The main questions on615
numerical simulation tools addressed through this case study were: What is616
the added value of 1-D modelling of SPM fluxes? What are the most sensitive617
parameters? What are the main limitations and perspectives for improvement?618
A 1-D hydrodynamical model was built and applied to a major hydro-619
sedimentary event in May-June 2008 in the Lower Rhone River, France. Such620
model would be the simplest and fastest possible hydrodynamical model that621
could be constructed and some physical processes that may be important are622
neglected in exchange for that simplicity. The Rhone River has a complex river623
network with confluences, bifurcations and hydropower schemes. The simula-624
tion code (AdisTS) was able to model the SPM fluxes at a high spatial and625
temporal resolution, which is useful to understand the SPM dynamics over the626
whole river system on time scales ranging from hour to decades, thanks to fast627
computational times. Especially, SPM supplies from the main tributaries and628
deposition of the coarsest particles behind hydropower structures could be quan-629
tified precisely, at any time and at any cross-section of the river network. The630
model provides insights that are not available from observational data alone. Es-631
pecially, the model simulates the continuous dynamics and spatial distribution632
of deposits, which would have allowed a better anticipation and management of633
sedimentation in critical areas of the Rhone reservoirs.634
In the presented study case, approximately half of the 4.9 Mt of SPM mea-635
32
Author-produced version of the article published in Launay, M., Dugué, V., Faure, J.-B., Coquery, M., Camenen, B., Le Coz, J. (2019) Numerical modelling of the suspended particulate matter dynamics in a regulated river network, Science of the Total Environment, 665, 591-605, DOI : 10.1016/j.scitotenv.2019.02.015
sured at the outlet of the Rhone River catchment during the event were found636
to come from the Isere River and the other half from the Durance River whereas637
previous studies estimated that most of the flux at the outlet came from the638
Durance River. Also, the model confirmed that a large amount of the SPM de-639
livered by the Isere River was trapped behind the first hydro-electric scheme in640
the Rhone River, a cause of conflicts between dam operators. The high temporal641
and spatial resolution of fluxes computation is highly valuable for reconstruct-642
ing past events and also for managing future events like natural floods or dam643
flushing operations, by testing multiple dam operation scenarios. If forecasts644
of water discharges and SPM inputs are available, such a model can be used645
to compute real-time forecasts of SPM concentrations, fluxes and deposition646
throughout the river network.647
As a basis for hydraulic simulation, an accurate description of the channel648
geometry and of the artificial structures is necessary, along with a conventional649
calibration of the friction coefficients along the river stretches. This was easily650
achieved in our case study. As for SPM simulation, the quality of the numeri-651
cal results was found to be highly sensitive to suspended sediment parameters,652
especially grain size, and to the operational rules of artificial structures. This653
may lead to substantial errors because accurate information on grain size distri-654
bution is often difficult to obtain, grain size varies spatially and temporally, and655
the coarsest particles may not be homogeneously distributed throughout the656
river cross-section. In this study, sensitivity tests made on the grain size dis-657
tribution of the SPM improved our knowledge of the Isere River input, despite658
the lack of measurements. Finer SPM particles were mostly transported during659
the natural flood period while coarser SPM were transported during the dam660
flushing periods. The simulation of deposition and erosion processes within the661
hydropower schemes was necessary to reproduce the strong deposition of SPM662
at the Isere confluence and further downstream. Deposits were mainly com-663
posed of the coarsest SPM (cf. Camenen et al., 2019), while finer SPM travelled664
through the hydropower schemes without settling down.665
Of course, observation and modelling supplement each other: dense and666
33
Author-produced version of the article published in Launay, M., Dugué, V., Faure, J.-B., Coquery, M., Camenen, B., Le Coz, J. (2019) Numerical modelling of the suspended particulate matter dynamics in a regulated river network, Science of the Total Environment, 665, 591-605, DOI : 10.1016/j.scitotenv.2019.02.015

precise SPM observational data measured at key points of the river system667
are necessary to specify the boundary conditions of numerical models, and to668
calibrate and validate them. An extended sensitivity analysis could be done669
to better infer upstream sediment supply, i.e. input concentrations and GSD.670
In the present paper, we constrained the tests to prior knowledge based on671
actual measurements and uncertainties. Another perspective of this work is to672
compare 1-D numerical modelling with chemical fingerprinting for quantifying673
SPM sources in the Rhone River for various hydrological conditions.674
The 1-D numerical model applied in this study is typical of modern simu-675
lation tools used in river engineering applications. While the principles of 1-D676
hydrodynamical codes have virtually not changed for fifty years or so, their677
computation performance and the power of the available computers have been678
greatly improved. Compared to 2-D or 3-D hydrodynamical codes, 1-D hydro-679
dynamical codes offer much faster computational times allowing for real-time680
or long-term simulations and uncertainty analysis through Monte Carlo sim-681
ulation or sensitivity analysis (Souhar and Faure, 2009), which is practically682
challenging with higher level codes. The spatial resolution of 1-D hydrodynam-683
ical codes is sufficient for studying SPM dynamics on the river network scale,684
while 2-D or 3-D hydrodynamical codes would be required for studying local685
processes, in the close vicinity of artificial structures for instance. However, most686
1-D hydrodynamical codes still come with restrictive assumptions that call to be687
improved through future research. Computing the flow and suspended sediment688
flux interactions between the main channel and the floodways, or floodplains,689
is still motivating active research. More generally, the spanwise distribution of690
velocities, SPM concentrations and deposition/erosion fluxes throughout cross-691
sections has to be predicted from 1-D, i.e. cross-sectional average results. A692
major limitation of 1-D hydrodynamical codes is the usual assumption of full,693
instantaneous mixing of water and SPM downstream of confluences. In the case694
of the Rhone River, full mixing after a confluence is actually seldom reached695
before the next bifurcation between the navigation canal and the by-passed696
channel of the Old Rhone. Formulas for predicting the degree of mixing and the697
34
Author-produced version of the article published in Launay, M., Dugué, V., Faure, J.-B., Coquery, M., Camenen, B., Le Coz, J. (2019) Numerical modelling of the suspended particulate matter dynamics in a regulated river network, Science of the Total Environment, 665, 591-605, DOI : 10.1016/j.scitotenv.2019.02.015
spanwise distribution of SPM concentrations still have to be elaborated, based698
on tracing experiments conducted in the laboratory and in the field.699
Acknowledgments700
This study was conducted within the Rhone Sediment Observatory (OSR),701
a multi-partner research program funded through the Plan Rhone by the Euro-702
pean Regional Development Fund (ERDF), Agence de l’eau RMC, CNR, EDF703
and three regional councils (Auvergne-Rhone-Alpes, PACA and Occitanie). The704
PhD scholarship of Marina Launay (2010-2014) was funded by the Rhone-Alpes705
regional council. Authors also thank many collaborators at Irstea, Cerege,706
IRSN, MIO and Ifremer for their contributions to the field work and the chem-707
ical analyses. This work builds on the developments of earlier versions of the708
1-D Rhone model achieved by Emilie Andries and Carla Walter (Irstea).709
References710
AFNOR (2005), NF EN 872 : Water quality - Determination of suspended711
solids - Method by filtration through glass fibre filters (in French), 10 p.712
Armanini, A., and G. Di Silvio (1988), A one-dimensional model for the trans-713
port of a sediment mixture in non-equilibrium conditions, 26 (3), 275–292,714
doi:10.1080/00221688809499212.715
Camenen, B. (2007), Simple and general formula for the settling velocity of716
particles, Journal of Hydraulic Engineering-ASCE, 133, 229–233, doi:10.1061/717
(ASCE)0733-9429(2007)133:2(229).718
Camenen, B., E. Perret, A. Herrero, C. Berni, F. Thollet, A. Buffet, G. Dramais,719
C. Le Bescond, and M. Lagouy (2016), Estimation of the volume of a fine720
sediment deposit over a gravel bar during a flushing event, in River Flow721
2016, CRC Press, pp. 533–540.722
35
Author-produced version of the article published in Launay, M., Dugué, V., Faure, J.-B., Coquery, M., Camenen, B., Le Coz, J. (2019) Numerical modelling of the suspended particulate matter dynamics in a regulated river network, Science of the Total Environment, 665, 591-605, DOI : 10.1016/j.scitotenv.2019.02.015
Camenen, B., G. Naudet, G. Dramais, J. Le Coz, and A. Paquier (2019) A multi-723
technique approach for evaluating sand dynamics in a complex engineered724
piedmont river system, Science of the Total Environment, 657, 485—497, doi:725
10.1016/j.scitotenv.2018.11.394.726
Clifford, N., K. Richards, R. Brown, and S. Lane (1995), Laboratory and field727
assessment of an infrared turbidity probe and its response to particle-size and728
variation in suspended sediment concentration, Hydrological Sciences Journal,729
40 (6), 771–791, doi:10.1080/02626669509491464.730
Copard, Y., F. Eyrolle, O. Radakovitch, A. Poirel, P. Raimbault, S. Gairoard,731
and C. Di-Giovanni (2018) Badlands as a hot spot of petrogenic contribution732
to riverine particulate organic carbon to the Gulf of Lion (NW Mediterranean733
Sea), Earth Surface Processes and Landforms, in press, doi:10.1002/esp.4409734
Druine, F., R. Verney, J. Deloffre, J.P. Lemoine, M. Chapalain, V. Landemaine,735
and R. Lafite (2018), In situ high frequency long term measurements of sus-736
pended sediment concentration in turbid estuarine system (Seine Estuary,737
France): Optical turbidity sensors response to suspended sediment character-738
istics, Marine Geology, 400, 24–37739
Dugue, V., C. Walter, E. Andries, M. Launay, J. Le Coz, B. Camenen, and740
J.-B. Faure (2015), Accounting for hydropower schemes’ operation rules in741
the 1D hydrodynamic modeling of the Rhone River from Lake Geneva to the742
Mediterranean Sea, in E-proceedings of the 36th IAHR World Congress, 28743
June - 3 July, 2015, The Hague, The Netherlands, p. 9.744
El Kadi Abderrezzak, K., and A. Paquier (2009), One-dimensional numerical745
modeling of sediment transport and bed deformation in open channels, Water746
Resources Research, 45 (5), doi:10.1029/2008{WR}007134, W05404.747
Eyrolle, F., O. Radakovitch, and P. Raimbault (2012), Consequences of hydro-748
logical events on the delivery of suspended sediment and associated radionu-749
clides from the Rhone River to the Mediterranean Sea, Journal of Soils and750
Sediments, 12, 1479–1495, doi:10.1007/s11368-012-0575-0.751
36
Author-produced version of the article published in Launay, M., Dugué, V., Faure, J.-B., Coquery, M., Camenen, B., Le Coz, J. (2019) Numerical modelling of the suspended particulate matter dynamics in a regulated river network, Science of the Total Environment, 665, 591-605, DOI : 10.1016/j.scitotenv.2019.02.015

Foster, I., R. Millington, and R. Grew (1992), The impact of particle size752
controls on stream turbidity measurement; some implications for suspended753
sediment yield estimation, Erosion and sediment transport monitoring pro-754
grammes in river basins, 210, 51–62.755
Garneau, C., S. Sauvage, A. Probst, and J. Sanchez-Perez (2015), Mod-756
elling of trace metal transfer in a large river under different hydrological757
conditions (the Garonne River in southwest France), Ecological Modelling,758
306 (Supplement C), 195 – 204, doi:https://doi.org/10.1016/j.ecolmodel.2014.759
09.011.760
Gippel, C. (1995), Potential of turbidity monitoring for measuring the transport761
of suspended-solids in streams, Hydrological Processes, 9 (1), 83–97, doi:10.762
1002/hyp.3360090108.763
Gray, J. and J. Gartner (2010)., Technological advances in suspended-sediment764
surrogate monitoring, Water Resources Research, 46 (4):W00D29765
Guertault, L. (2015), Evaluation of the hydro-sedimentary processes of an elon-766
gated dam reservoir: Application to the Genissiat reservoir located on the767
Upper-Rhone River (in French), PhD, Universite Claude Bernard Lyon 1,768
Lyon, France, 239 p.769
Guertault, L., B. Camenen, C. Peteuil, A. Paquier, and J.-B. Faure (2016), One-770
Dimensional Modeling of Suspended Sediment Dynamics in Dam Reservoirs,771
Journal of Hydraulic Engineering-ASCE, 142 (10), doi:10.1061/({ASCE}772
){HY}.1943-7900.0001157.773
Han, Q. (1980), A study on the non-equilibrium transportation of suspended774
load, in 1st Int. Symp. on River Sedimentation, Chinese Society of Hydraulic775
Engineering, China, pp. 793–802.776
Horner I., B. Renard, J. Le Coz, F. Branger, H.K. McMillan, and G. Pierrefeu777
(2018), Impact of stage measurement errors on streamflow uncertainty, Water778
Resources Research, 54, 1952–1976.779
37
Author-produced version of the article published in Launay, M., Dugué, V., Faure, J.-B., Coquery, M., Camenen, B., Le Coz, J. (2019) Numerical modelling of the suspended particulate matter dynamics in a regulated river network, Science of the Total Environment, 665, 591-605, DOI : 10.1016/j.scitotenv.2019.02.015

Horowitz, A. (2008), Determining annual suspended sediment and sediment-780
associated trace element and nutrient fluxes, Science of the Total Environ-781
ment, 400 (1-3), 315–343, doi:10.1016/j.scitotenv.2008.04.022.782
Horowitz, A., K. Elrick, and J. Smith (2001), Estimating suspended sediment783
and trace element fluxes in large river basins: methodological considerations784
as applied to the NASQAN programme, Hydrological Processes, 15 (7), 1107–785
1132, doi:10.1002/hyp.206.786
Horowitz, A. J., R. T. Clarke, and G. H. Merten (2015), The effects of sample787
scheduling and sample numbers on estimates of the annual fluxes of suspended788
sediment in fluvial systems, Hydrological Processes, 29 (4), 531–543, doi:10.789
1002/hyp.10172.790
Iwasa, Y., and S. Aya (1991), Predicting longitudinal dispersion coefficient in791
open channel flows, in Int. Symp. on Environmental Hydraulics, IAHR, Hong-792
Kong, China, pp. 505–510.793
Kondolf, G.M., Y. Gao, G.W. Annandale, G.L. Morris, E. Jiang, J. Zhang,794
Y. Cao, P. Carling, K. Fu, Q. Guo, R. Hotchkiss, C. Peteuil, T. Sumi, H.-795
W. Wang, Z. Wang, Z. Wei, B. Wu, C. Wu, and C.T. Yang (2015), Sustain-796
able sediment management in reservoirs and regulated rivers: Experiences797
from five continents, Earth’Future, 2, 1 – 25, doi:http://dx.doi.org/10.1002/798
2013EF000184.799
Krone, R. (1962), Flume studies of the transport of sediment in estuarial shoal-800
ing processes: final report, Tech. rep., Hydraulic Eng. Lab. and Sanitary Eng.801
Res. Lab., University of California, Berkeley, California, USA, 110 p.802
Launay, M. (2014), Fluxes of suspended particulate matters, particulate mer-803
cury and PCBs in the Rhone River, from Lake Geneva to the Mediterranean804
Sea (in French), PhD, Claude Bernard University Lyon 1, Lyon, France,805
432 p.806
38
Author-produced version of the article published in Launay, M., Dugué, V., Faure, J.-B., Coquery, M., Camenen, B., Le Coz, J. (2019) Numerical modelling of the suspended particulate matter dynamics in a regulated river network, Science of the Total Environment, 665, 591-605, DOI : 10.1016/j.scitotenv.2019.02.015
Launay, M., J. Le Coz, B. Camenen, C. Walter, H. Angot, G. Dramais, J.-807
B. Faure, and M. Coquery (2015), Calibrating pollutant dispersion in 1-D808
hydraulic models of river networks, Journal of Hydro-Environment Research,809
9 (1), 120 – 132, doi:http://dx.doi.org/10.1016/j.jher.2014.07.005.810
Legout, C., I.A. Droppo, J. Coutaz, C. Bel, and M. Jodeau (2018), Assess-811
ment of erosion and settling properties of fine sediments stored in cob-812
ble bed rivers: the Arc and Isere alpine rivers before and after reservoir813
flushing, Earth Surface Processes and Landforms, 43 (6), 1295 – 1309, doi:814
http://dx.doi.org/10.1002/esp.4314.815
Ludwig, W., E. Dumont, M. Meybeck, and S. Heussner (2009), River discharges816
of water and nutrients to the Mediterranean and Black Sea: Major drivers for817
ecosystem changes during past and future decades? Progress in Oceanography,818
80 (3-4), 199 – 217, doi:https://doi.org/10.1016/j.pocean.2009.02.001.819
Mano, V., J. Nemery, P. Belleudy, and A. Poirel (2008), One year of suspended820
particle matter (SPM) and carbon fluxes on an alpine river : the Isere River821
(in French), La Houille Blanche, (5), 64 p.822
Marion, C., G. Maillet, M. Arnaud, and F. Eyrolle (2010), Quantification of the823
Rhone solid fluxes at the mouth: contributions of the Durance River during824
the exceptional flood of May 2008 (in French), La Houille Blanche, (5), 72–80,825
doi:10.1051/lhb/2010057.826
Masson, M., H. Angot, C. Le Bescond, M. Launay, A. Dabrin, C. Miege, J. Le827
Coz, and M. Coquery (2018), Sampling of suspended particulate matter using828
particle traps in the Rhone River: Relevance and representativeness for the829
monitoring of contaminants, Science of the Total Environment, 637–638, 538–830
549, doi:10.1016/j.scitotenv.2018.04.343.831
Moatar, F., M. Meybeck, S. Raymond, A. Coynel, W. Ludwig, V. Mano, J. Ne-832
mery, A. Poirel, H. Etcheber, and P. Crouzet (2008), SPM fluxes estimates833
from discrete monitoring: comparison of calculation methods and uncertaini-834
ties, La Houille Blanche, (4), 64–71.835
39
Author-produced version of the article published in Launay, M., Dugué, V., Faure, J.-B., Coquery, M., Camenen, B., Le Coz, J. (2019) Numerical modelling of the suspended particulate matter dynamics in a regulated river network, Science of the Total Environment, 665, 591-605, DOI : 10.1016/j.scitotenv.2019.02.015
Moore, S. A., J. Le Coz, D. Hurther, and A. Paquier (2012), On the Application836
of Horizontal ADCPs to Suspended Sediment Transport Surveys in Rivers,837
Continental Shelf Research, 46, 50–63.838
Moore, S. A., J. Le Coz, D. Hurther, and A. Paquier (2013), Using multi-839
frequency acoustic attenuation to monitor grain size and concentration of840
suspended sediment in rivers, Journal of the Acoustical Society of America,841
133 (4), 1959–1970, doi:{10.1121/1.4792645}.842
Navratil, O., O. Evrard, M. Esteves, C. Legout, S. Ayrault, J. Nemery, A. Mate843
Marin, M. Ahmadi, I. Lefevre, A. Poirel, and P. Bonte (2012), Temporal844
variability of suspended sediment sources in an alpine catchment combining845
river/rainfall monitoring and sediment fingerprinting, Earth Surface Processes846
and Landforms, 37 (8), 828–846, doi:10.1002/esp.3201.847
Nicollet, G., and M. Uan (1979), Permanent flows with free surface in com-848
pounds beds (in French), La Houille Blanche, 1, 21–30.849
Ollivier, P., B. Hamelin, and O. Radakovitch (2010), Seasonal variations of phys-850
ical and chemical erosion: A three-years survey of the Rhone river (France),851
Geochimica et Cosmochimica Acta, 74 (no 3), 907–927.852
Papanicolaou, A. T. N., M. Elhakeem, G. Krallis, S. Prakash, and J. Edinger853
(2008), Sediment Transport Modeling Review: Current and Future De-854
velopments, Journal of Hydraulic Engineering-ASCE, 134 (1), 1–14, doi:855
10.1061/({ASCE})0733-9429(2008)134:1(1).856
Parde, M. (1925), The hydrological regime of the Rhone River (in French).857
Institut de Geographie Alpine, vol. 13:3, 459–547 pp.858
Partheniades, E. (1965), Erosion and deposition of cohesive soils, Journal of859
Hydraulic Division, 91, 105–139.860
Phillips, J., B. Webb, D. Walling, and G. Leeks (1999), Estimating the sus-861
pended sediment loads of rivers in the LOIS study area using infrequent sam-862
ples, Hydrological Processes, 13 (7), 1035–1050.863
40
Author-produced version of the article published in Launay, M., Dugué, V., Faure, J.-B., Coquery, M., Camenen, B., Le Coz, J. (2019) Numerical modelling of the suspended particulate matter dynamics in a regulated river network, Science of the Total Environment, 665, 591-605, DOI : 10.1016/j.scitotenv.2019.02.015
Pont, D. (1997), The discharge of suspended sediments near to the mouth of864
the Rhone recent statistics (1994-1995) (in French), Revue de Geographie de865
Lyon, 72 (1), 23–33, doi:10.3406/geoca.1997.4675.866
Pont, D., J. Simonnet, and A. Walter (2002), Medium-term changes in sus-867
pended sediment delivery to the ocean: Consequences of catchment hetero-868
geneity and river management (Rhone River, France), Estuarine Coastal and869
Shelf Science, 54 (1), 1–18, doi:10.1006/ecss.2001.0829.870
Poulier, G., M. Launay, C. Le Bescond, F. Thollet, M. Coquery, and J. Le Coz871
(2019), Combining flux monitoring and data reconstruction to establish an-872
nual budgets of suspended particulate matter, mercury and PCB in the Rhone873
River from Lake Geneva to the Mediterranean Sea, Science of the Total En-874
vironment, 658, 457–473, doi:10.1016/j.scitotenv.2018.12.075.875
Radakovitch, O., V. Roussiez, P. Ollivier, W. Ludwig, C. Grenz, and J.-L.876
Probst (2008), Input of particulate heavy metals from rivers and associated877
sedimentary deposits on the Gulf of Lion continental shelf, Estuarine, Coastal878
and Shelf Science, 77 (2), 285–295.879
Rieux, C. (2008), Report of the Lower Isere dam flushing. Results of the physico-880
chemical monitoring from 2 to 12 of June 2008 (in French), Tech. Rep.881
D4161/RAP/2008-00653-A, EDF, 29 p.882
Souhar, O., and J.-B. Faure (2009), Approach for uncertainty propagation and883
design in Saint-Venantequations via automatic sensitive derivatives applied884
to Saar river, Canadian Journal of Civil Engineering, 36 (7), 1144–1154.885
Thollet, F., J. Le Coz, G. Antoine, P. Francois, L. Saguintaah, M. Launay, and886
B. Camenen (2013), Influence of grain size changes on the turbidity mea-887
surement of suspended solid fluxes in watercourses (in French), La Houille888
Blanche, 4, 50–56.889
Ulke, A., G. Tayfur, and S. Ozkul (2017), Investigating a suitable empirical890
model and performing regional analysis for the suspended sediment load pre-891
41
Author-produced version of the article published in Launay, M., Dugué, V., Faure, J.-B., Coquery, M., Camenen, B., Le Coz, J. (2019) Numerical modelling of the suspended particulate matter dynamics in a regulated river network, Science of the Total Environment, 665, 591-605, DOI : 10.1016/j.scitotenv.2019.02.015
diction in major rivers of the Aegean region, Turkey, Water Resources Man-892
agement, 31 (3), 739–764, doi:10.1007/s11269-016-1357-z.893
Walling, D., and B. Webb (1985), Estimating the discharge of contaminants894
to coastal waters by rivers - some cautionary comments, Marine Pollution895
Bulletin, 16 (12), 488–492, doi:10.1016/0025-326{X}(85)90382-0.896
Walling, D., P. Owens, J. Carter, G. Leeks, S. Lewis, A. Meharg, and J. Wright897
(2003), Storage of sediment-associated nutrients and contaminants in river898
channel and floodplain systems, Applied Geochemistry, 18 (2), 195–220.899
Wu, W., D. A. Vieira, and S. S. Y. Wang (2004), One-Dimensional Numerical900
Model for Nonuniform Sediment Transport under Unsteady Flows in Channel901
Networks, Journal of Hydraulic Engineering-ASCE, 130 (9), 914–923, doi:10.902
1061/({ASCE})0733-9429(2004)130:9(914).903
42
Author-produced version of the article published in Launay, M., Dugué, V., Faure, J.-B., Coquery, M., Camenen, B., Le Coz, J. (2019) Numerical modelling of the suspended particulate matter dynamics in a regulated river network, Science of the Total Environment, 665, 591-605, DOI : 10.1016/j.scitotenv.2019.02.015


![[A FIELD STUDY]. WATER EXCHANGE AND FLUXES OF PARTICULATE ORGANIC MATTER AT AO YON [1987]](https://static.fdokumen.com/doc/165x107/6322f11061d7e169b00cdae6/a-field-study-water-exchange-and-fluxes-of-particulate-organic-matter-at-ao-yon.jpg)