Chemical speciation of respirable suspended particulate matter during a major firework festival in...
10
Journal of Hazardous Materials 184 (2010) 321–330 Contents lists available at ScienceDirect Journal of Hazardous Materials journal homepage: www.elsevier.com/locate/jhazmat Chemical speciation of respirable suspended particulate matter during a major firework festival in India Sayantan Sarkar, Pandit S. Khillare ∗ , Darpa S. Jyethi, Amreen Hasan, Musarrat Parween Environmental Monitoring and Management Laboratory, School of Environmental Sciences, Jawaharlal Nehru University, New Delhi 110067, India article info Article history: Received 6 March 2010 Received in revised form 29 July 2010 Accepted 10 August 2010 Available online 18 August 2010 Keywords: Fireworks Diwali Metals Carbonaceous aerosol Polycyclic aromatic hydrocarbons (PAHs) India abstract Ambient respirable particles (PM ≤ 10 m, denoted by PM 10 ) were characterized with respect to 20 ele- ments, 16 polycyclic aromatic hydrocarbons (PAHs), elemental and organic carbon (EC and OC) during a major firework event—the “Diwali” festival in Delhi, India. The event recorded extremely high 24-h PM 10 levels (317.2–616.8 gm −3 , 6–12 times the WHO standard) and massive loadings of Ba (16.8 gm −3 , mean value), K (46.8 gm −3 ), Mg (21.3 gm −3 ), Al (38.4 gm −3 ) and EC (40.5 gm −3 ). Elemental con- centrations as high as these have not been reported previously for any firework episode. Concentrations of Ba, K, Sr, Mg, Na, S, Al, Cl, Mn, Ca and EC were higher by factors of 264, 18, 15, 5.8, 5, 4, 3.2, 3, 2.7, 1.6 and 4.3, respectively, on Diwali as compared to background values. It was estimated that firework aerosol contributed 23–33% to ambient PM 10 on Diwali. OC levels peaked in the post-Diwali samples, per- haps owing to secondary transformation processes. Atmospheric PAHs were not sourced from fireworks; instead, they correlated well with changes in traffic patterns indicating their primary source in vehicular emissions. Overall, the pollutant cocktail generated by the Diwali fireworks could be best represented with Ba, K and Sr as tracers. It was also found that chronic exposure to Diwali pollution is likely to cause at least a 2% increase in non-carcinogenic hazard index (HI) associated with Al, Mn and Ba in the exposed population. © 2010 Elsevier B.V. All rights reserved. 1. Introduction Fireworks are truly unique sources of atmospheric pollution that generate massive quantities of pollutants within a short span of time. They are generally associated with festivities worldwide, such as New Year’s Eve celebrations, the Las Fallas in Spain, the Lantern Festival in China, Bonfire Night in UK, the 4th of July celebrations in US and Diwali (or Deepawali) festival in India. These events involve extensive use of pyrotechnics on a regional, and often, national scale. This provides scientists with a unique opportunity to study short-term degradation of air quality and its likely human health impacts. Fireworks are associated with elevated levels of pollutant gases like SO 2 and NO x along with high loadings of ambient particulates [1–3]. Crackers contain a variety of metal salts such as chlorates, perchlorates, nitrates, etc. along with charcoal and sulfur which is manifested in the extremely high ambient concentrations of these species during the festive days. Kulshrestha et al. [4] reported that concentrations of Ba, K, Al and Sr went up by 1091, 25, 18 and 15 times, respectively, during Diwali in Hyderabad, India. Vecchi et al. ∗ Corresponding author at: Room No. 325, School of Environmental Sciences, Jawaharlal Nehru University, New Delhi 110067, India. Tel.: +91 11 26704325. E-mail address: [email protected] (P.S. Khillare). [1] also observed high enrichment of atmospheric particulates with Sr, Mg, Ba, K and Cu during a firework episode in Milan, Italy. Pro- nounced signatures of New Year’s Eve firework activity has been recorded in fine particulate species in Mainz, Germany [5] and in snowflakes in the Austrian Alps [6]. Primary components of fire- work aerosol (Ba, K, Sr, Cl − , Pb, Mg) and secondary components such as sulfates, nitrates, oxalate, malonate, succinate and glutarate were over 5 times higher during the Lantern festival in China than normal days [7]. Chemical characterization of firework aerosol is important for two reasons. Firstly, these events give rise to extremely high lev- els of atmospheric pollutants that have substantial health effects. Short-term particulate pollution episodes are associated with car- diopulmonary ailments [8], while similar effects are also seen for elevated SO 2 and NO x levels [9]. Firework smoke is known to lead to acute eosinophilic pneumonia [10]. Barium-rich aerosols released from fireworks may be responsible for a significant rise in the num- ber of asthma cases [11]. A majority of barium compounds released from pyrotechnics are water-soluble and thus, bioavailable, which may cause even greater harm [6]. Perchlorates that are used as oxi- dizers in fireworks are teratogenic and can adversely affect thyroid functions [12–15]. Secondly, these episodes are important from the point of view of atmospheric chemistry as well. For example, Attri et al. [16] reported formation of O 3 without the participation of NO x due to burning of sparkles during Diwali. The cocktail of primary 0304-3894/$ – see front matter © 2010 Elsevier B.V. All rights reserved. doi:10.1016/j.jhazmat.2010.08.039
Transcript of Chemical speciation of respirable suspended particulate matter during a major firework festival in...

Cfi
SE
a
ARRAA
KFDMCPI
1
gtaFUessi
l[pmsct
J
0d
Journal of Hazardous Materials 184 (2010) 321–330
Contents lists available at ScienceDirect
Journal of Hazardous Materials
journa l homepage: www.e lsev ier .com/ locate / jhazmat
hemical speciation of respirable suspended particulate matter during a majorrework festival in India
ayantan Sarkar, Pandit S. Khillare ∗, Darpa S. Jyethi, Amreen Hasan, Musarrat Parweennvironmental Monitoring and Management Laboratory, School of Environmental Sciences, Jawaharlal Nehru University, New Delhi 110067, India
r t i c l e i n f o
rticle history:eceived 6 March 2010eceived in revised form 29 July 2010ccepted 10 August 2010vailable online 18 August 2010
eywords:ireworksiwali
a b s t r a c t
Ambient respirable particles (PM ≤ 10 �m, denoted by PM10) were characterized with respect to 20 ele-ments, 16 polycyclic aromatic hydrocarbons (PAHs), elemental and organic carbon (EC and OC) during amajor firework event—the “Diwali” festival in Delhi, India. The event recorded extremely high 24-h PM10
levels (317.2–616.8 �g m−3, 6–12 times the WHO standard) and massive loadings of Ba (16.8 �g m−3,mean value), K (46.8 �g m−3), Mg (21.3 �g m−3), Al (38.4 �g m−3) and EC (40.5 �g m−3). Elemental con-centrations as high as these have not been reported previously for any firework episode. Concentrationsof Ba, K, Sr, Mg, Na, S, Al, Cl, Mn, Ca and EC were higher by factors of 264, 18, 15, 5.8, 5, 4, 3.2, 3, 2.7,1.6 and 4.3, respectively, on Diwali as compared to background values. It was estimated that fireworkaerosol contributed 23–33% to ambient PM on Diwali. OC levels peaked in the post-Diwali samples, per-
etalsarbonaceous aerosololycyclic aromatic hydrocarbons (PAHs)ndia
10
haps owing to secondary transformation processes. Atmospheric PAHs were not sourced from fireworks;instead, they correlated well with changes in traffic patterns indicating their primary source in vehicularemissions. Overall, the pollutant cocktail generated by the Diwali fireworks could be best representedwith Ba, K and Sr as tracers. It was also found that chronic exposure to Diwali pollution is likely to causeat least a 2% increase in non-carcinogenic hazard index (HI) associated with Al, Mn and Ba in the exposed
population.. Introduction
Fireworks are truly unique sources of atmospheric pollution thatenerate massive quantities of pollutants within a short span ofime. They are generally associated with festivities worldwide, suchs New Year’s Eve celebrations, the Las Fallas in Spain, the Lanternestival in China, Bonfire Night in UK, the 4th of July celebrations inS and Diwali (or Deepawali) festival in India. These events involvextensive use of pyrotechnics on a regional, and often, nationalcale. This provides scientists with a unique opportunity to studyhort-term degradation of air quality and its likely human healthmpacts.
Fireworks are associated with elevated levels of pollutant gasesike SO2 and NOx along with high loadings of ambient particulates1–3]. Crackers contain a variety of metal salts such as chlorates,erchlorates, nitrates, etc. along with charcoal and sulfur which is
anifested in the extremely high ambient concentrations of thesepecies during the festive days. Kulshrestha et al. [4] reported thatoncentrations of Ba, K, Al and Sr went up by 1091, 25, 18 and 15imes, respectively, during Diwali in Hyderabad, India. Vecchi et al.
∗ Corresponding author at: Room No. 325, School of Environmental Sciences,awaharlal Nehru University, New Delhi 110067, India. Tel.: +91 11 26704325.
E-mail address: [email protected] (P.S. Khillare).
304-3894/$ – see front matter © 2010 Elsevier B.V. All rights reserved.oi:10.1016/j.jhazmat.2010.08.039
© 2010 Elsevier B.V. All rights reserved.
[1] also observed high enrichment of atmospheric particulates withSr, Mg, Ba, K and Cu during a firework episode in Milan, Italy. Pro-nounced signatures of New Year’s Eve firework activity has beenrecorded in fine particulate species in Mainz, Germany [5] and insnowflakes in the Austrian Alps [6]. Primary components of fire-work aerosol (Ba, K, Sr, Cl−, Pb, Mg) and secondary componentssuch as sulfates, nitrates, oxalate, malonate, succinate and glutaratewere over 5 times higher during the Lantern festival in China thannormal days [7].
Chemical characterization of firework aerosol is important fortwo reasons. Firstly, these events give rise to extremely high lev-els of atmospheric pollutants that have substantial health effects.Short-term particulate pollution episodes are associated with car-diopulmonary ailments [8], while similar effects are also seen forelevated SO2 and NOx levels [9]. Firework smoke is known to lead toacute eosinophilic pneumonia [10]. Barium-rich aerosols releasedfrom fireworks may be responsible for a significant rise in the num-ber of asthma cases [11]. A majority of barium compounds releasedfrom pyrotechnics are water-soluble and thus, bioavailable, whichmay cause even greater harm [6]. Perchlorates that are used as oxi-
dizers in fireworks are teratogenic and can adversely affect thyroidfunctions [12–15]. Secondly, these episodes are important from thepoint of view of atmospheric chemistry as well. For example, Attriet al. [16] reported formation of O3 without the participation of NOxdue to burning of sparkles during Diwali. The cocktail of primary
322 S. Sarkar et al. / Journal of Hazardous Materials 184 (2010) 321–330
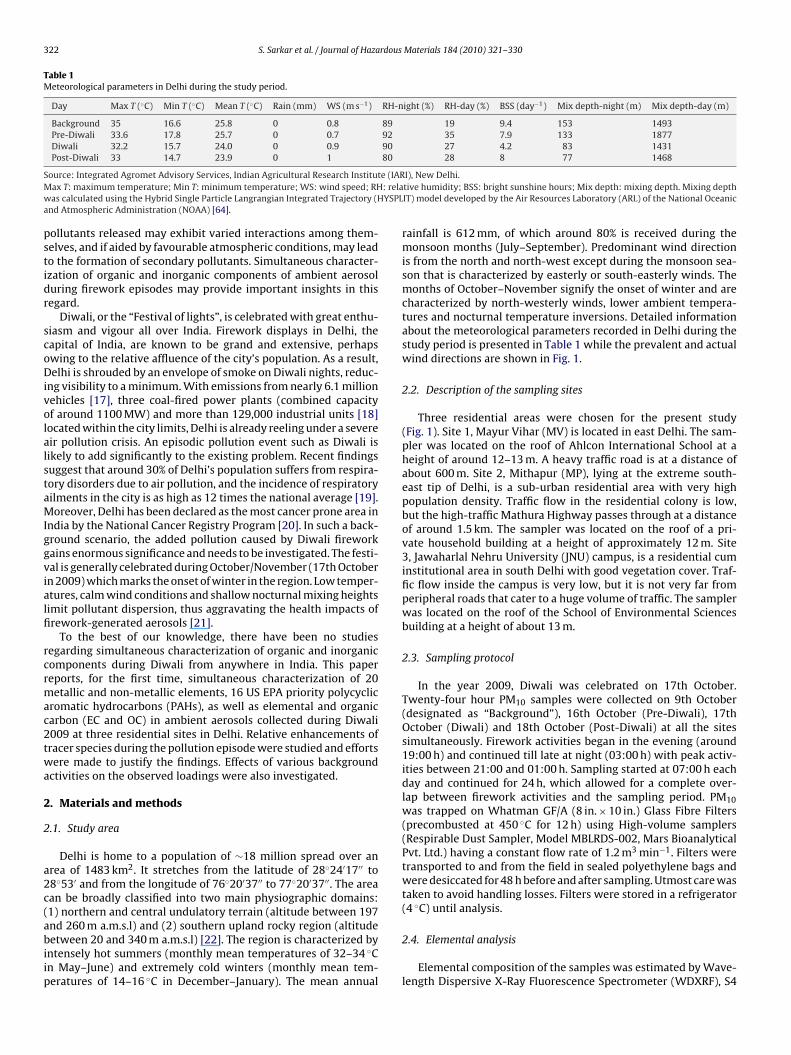
Table 1Meteorological parameters in Delhi during the study period.
Day Max T (◦C) Min T (◦C) Mean T (◦C) Rain (mm) WS (m s−1) RH-night (%) RH-day (%) BSS (day−1) Mix depth-night (m) Mix depth-day (m)
Background 35 16.6 25.8 0 0.8 89 19 9.4 153 1493Pre-Diwali 33.6 17.8 25.7 0 0.7 92 35 7.9 133 1877Diwali 32.2 15.7 24.0 0 0.9 90 27 4.2 83 1431Post-Diwali 33 14.7 23.9 0 1 80 28 8 77 1468
S e (IARM : relaw YSPLa
pstidr
scoDivolalstaMIggvialfi
rcrmac2twa
2
2
a2c(abiip
ource: Integrated Agromet Advisory Services, Indian Agricultural Research Institutax T: maximum temperature; Min T: minimum temperature; WS: wind speed; RHas calculated using the Hybrid Single Particle Langrangian Integrated Trajectory (H
nd Atmospheric Administration (NOAA) [64].
ollutants released may exhibit varied interactions among them-elves, and if aided by favourable atmospheric conditions, may leado the formation of secondary pollutants. Simultaneous character-zation of organic and inorganic components of ambient aerosoluring firework episodes may provide important insights in thisegard.
Diwali, or the “Festival of lights”, is celebrated with great enthu-iasm and vigour all over India. Firework displays in Delhi, theapital of India, are known to be grand and extensive, perhapswing to the relative affluence of the city’s population. As a result,elhi is shrouded by an envelope of smoke on Diwali nights, reduc-
ng visibility to a minimum. With emissions from nearly 6.1 millionehicles [17], three coal-fired power plants (combined capacityf around 1100 MW) and more than 129,000 industrial units [18]ocated within the city limits, Delhi is already reeling under a severeir pollution crisis. An episodic pollution event such as Diwali isikely to add significantly to the existing problem. Recent findingsuggest that around 30% of Delhi’s population suffers from respira-ory disorders due to air pollution, and the incidence of respiratoryilments in the city is as high as 12 times the national average [19].oreover, Delhi has been declared as the most cancer prone area in
ndia by the National Cancer Registry Program [20]. In such a back-round scenario, the added pollution caused by Diwali fireworkains enormous significance and needs to be investigated. The festi-al is generally celebrated during October/November (17th Octobern 2009) which marks the onset of winter in the region. Low temper-tures, calm wind conditions and shallow nocturnal mixing heightsimit pollutant dispersion, thus aggravating the health impacts ofrework-generated aerosols [21].
To the best of our knowledge, there have been no studiesegarding simultaneous characterization of organic and inorganicomponents during Diwali from anywhere in India. This papereports, for the first time, simultaneous characterization of 20etallic and non-metallic elements, 16 US EPA priority polycyclic
romatic hydrocarbons (PAHs), as well as elemental and organicarbon (EC and OC) in ambient aerosols collected during Diwali009 at three residential sites in Delhi. Relative enhancements ofracer species during the pollution episode were studied and effortsere made to justify the findings. Effects of various background
ctivities on the observed loadings were also investigated.
. Materials and methods
.1. Study area
Delhi is home to a population of ∼18 million spread over anrea of 1483 km2. It stretches from the latitude of 28◦24′17′′ to8◦53′ and from the longitude of 76◦20′37′′ to 77◦20′37′′. The areaan be broadly classified into two main physiographic domains:1) northern and central undulatory terrain (altitude between 197
nd 260 m a.m.s.l) and (2) southern upland rocky region (altitudeetween 20 and 340 m a.m.s.l) [22]. The region is characterized byntensely hot summers (monthly mean temperatures of 32–34 ◦Cn May–June) and extremely cold winters (monthly mean tem-eratures of 14–16 ◦C in December–January). The mean annual
I), New Delhi.tive humidity; BSS: bright sunshine hours; Mix depth: mixing depth. Mixing depthIT) model developed by the Air Resources Laboratory (ARL) of the National Oceanic
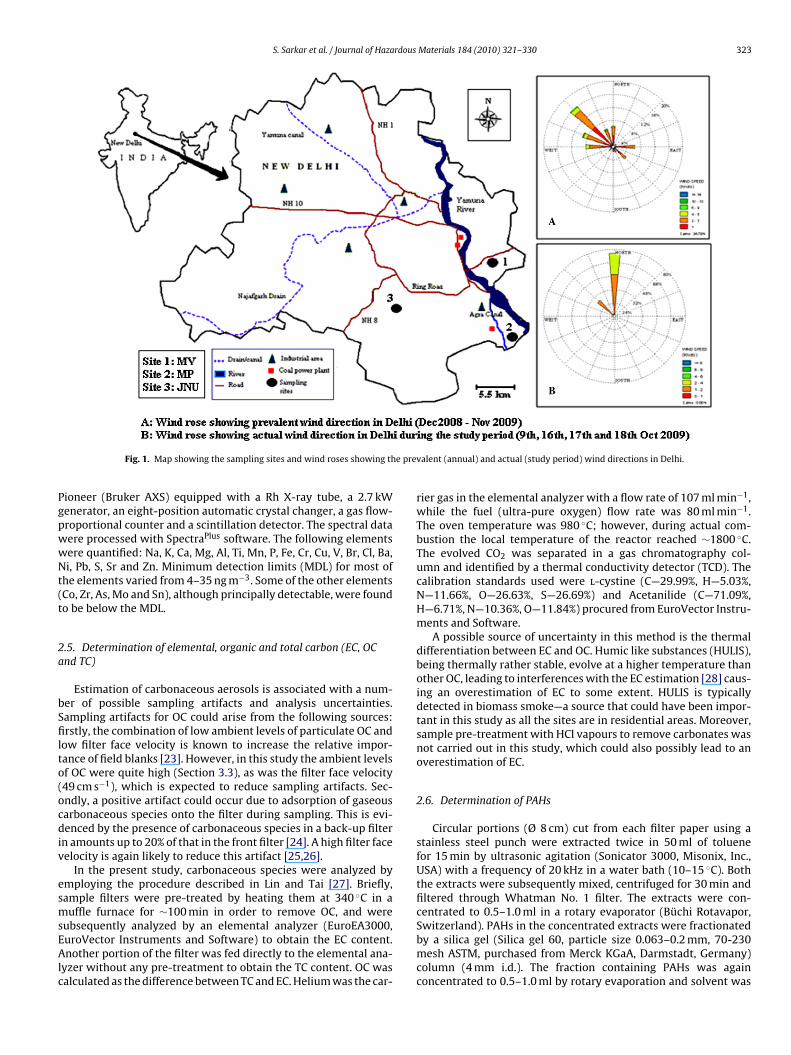
rainfall is 612 mm, of which around 80% is received during themonsoon months (July–September). Predominant wind directionis from the north and north-west except during the monsoon sea-son that is characterized by easterly or south-easterly winds. Themonths of October–November signify the onset of winter and arecharacterized by north-westerly winds, lower ambient tempera-tures and nocturnal temperature inversions. Detailed informationabout the meteorological parameters recorded in Delhi during thestudy period is presented in Table 1 while the prevalent and actualwind directions are shown in Fig. 1.
2.2. Description of the sampling sites
Three residential areas were chosen for the present study(Fig. 1). Site 1, Mayur Vihar (MV) is located in east Delhi. The sam-pler was located on the roof of Ahlcon International School at aheight of around 12–13 m. A heavy traffic road is at a distance ofabout 600 m. Site 2, Mithapur (MP), lying at the extreme south-east tip of Delhi, is a sub-urban residential area with very highpopulation density. Traffic flow in the residential colony is low,but the high-traffic Mathura Highway passes through at a distanceof around 1.5 km. The sampler was located on the roof of a pri-vate household building at a height of approximately 12 m. Site3, Jawaharlal Nehru University (JNU) campus, is a residential cuminstitutional area in south Delhi with good vegetation cover. Traf-fic flow inside the campus is very low, but it is not very far fromperipheral roads that cater to a huge volume of traffic. The samplerwas located on the roof of the School of Environmental Sciencesbuilding at a height of about 13 m.
2.3. Sampling protocol
In the year 2009, Diwali was celebrated on 17th October.Twenty-four hour PM10 samples were collected on 9th October(designated as “Background”), 16th October (Pre-Diwali), 17thOctober (Diwali) and 18th October (Post-Diwali) at all the sitessimultaneously. Firework activities began in the evening (around19:00 h) and continued till late at night (03:00 h) with peak activ-ities between 21:00 and 01:00 h. Sampling started at 07:00 h eachday and continued for 24 h, which allowed for a complete over-lap between firework activities and the sampling period. PM10was trapped on Whatman GF/A (8 in. × 10 in.) Glass Fibre Filters(precombusted at 450 ◦C for 12 h) using High-volume samplers(Respirable Dust Sampler, Model MBLRDS-002, Mars BioanalyticalPvt. Ltd.) having a constant flow rate of 1.2 m3 min−1. Filters weretransported to and from the field in sealed polyethylene bags andwere desiccated for 48 h before and after sampling. Utmost care wastaken to avoid handling losses. Filters were stored in a refrigerator(4 ◦C) until analysis.
2.4. Elemental analysis
Elemental composition of the samples was estimated by Wave-length Dispersive X-Ray Fluorescence Spectrometer (WDXRF), S4
S. Sarkar et al. / Journal of Hazardous Materials 184 (2010) 321–330 323
e pre
PgpwwNt(t
2a
bSfilto(ocdiv
esmsEAlc
Fig. 1. Map showing the sampling sites and wind roses showing th
ioneer (Bruker AXS) equipped with a Rh X-ray tube, a 2.7 kWenerator, an eight-position automatic crystal changer, a gas flow-roportional counter and a scintillation detector. The spectral dataere processed with SpectraPlus software. The following elementsere quantified: Na, K, Ca, Mg, Al, Ti, Mn, P, Fe, Cr, Cu, V, Br, Cl, Ba,i, Pb, S, Sr and Zn. Minimum detection limits (MDL) for most of
he elements varied from 4–35 ng m−3. Some of the other elementsCo, Zr, As, Mo and Sn), although principally detectable, were foundo be below the MDL.
.5. Determination of elemental, organic and total carbon (EC, OCnd TC)
Estimation of carbonaceous aerosols is associated with a num-er of possible sampling artifacts and analysis uncertainties.ampling artifacts for OC could arise from the following sources:rstly, the combination of low ambient levels of particulate OC and
ow filter face velocity is known to increase the relative impor-ance of field blanks [23]. However, in this study the ambient levelsf OC were quite high (Section 3.3), as was the filter face velocity49 cm s−1), which is expected to reduce sampling artifacts. Sec-ndly, a positive artifact could occur due to adsorption of gaseousarbonaceous species onto the filter during sampling. This is evi-enced by the presence of carbonaceous species in a back-up filter
n amounts up to 20% of that in the front filter [24]. A high filter faceelocity is again likely to reduce this artifact [25,26].
In the present study, carbonaceous species were analyzed bymploying the procedure described in Lin and Tai [27]. Briefly,ample filters were pre-treated by heating them at 340 ◦C in auffle furnace for ∼100 min in order to remove OC, and were
ubsequently analyzed by an elemental analyzer (EuroEA3000,uroVector Instruments and Software) to obtain the EC content.nother portion of the filter was fed directly to the elemental ana-
yzer without any pre-treatment to obtain the TC content. OC wasalculated as the difference between TC and EC. Helium was the car-
valent (annual) and actual (study period) wind directions in Delhi.
rier gas in the elemental analyzer with a flow rate of 107 ml min−1,while the fuel (ultra-pure oxygen) flow rate was 80 ml min−1.The oven temperature was 980 ◦C; however, during actual com-bustion the local temperature of the reactor reached ∼1800 ◦C.The evolved CO2 was separated in a gas chromatography col-umn and identified by a thermal conductivity detector (TCD). Thecalibration standards used were l-cystine (C—29.99%, H—5.03%,N—11.66%, O—26.63%, S—26.69%) and Acetanilide (C—71.09%,H—6.71%, N—10.36%, O—11.84%) procured from EuroVector Instru-ments and Software.
A possible source of uncertainty in this method is the thermaldifferentiation between EC and OC. Humic like substances (HULIS),being thermally rather stable, evolve at a higher temperature thanother OC, leading to interferences with the EC estimation [28] caus-ing an overestimation of EC to some extent. HULIS is typicallydetected in biomass smoke—a source that could have been impor-tant in this study as all the sites are in residential areas. Moreover,sample pre-treatment with HCl vapours to remove carbonates wasnot carried out in this study, which could also possibly lead to anoverestimation of EC.
2.6. Determination of PAHs
Circular portions (Ø 8 cm) cut from each filter paper using astainless steel punch were extracted twice in 50 ml of toluenefor 15 min by ultrasonic agitation (Sonicator 3000, Misonix, Inc.,USA) with a frequency of 20 kHz in a water bath (10–15 ◦C). Boththe extracts were subsequently mixed, centrifuged for 30 min andfiltered through Whatman No. 1 filter. The extracts were con-centrated to 0.5–1.0 ml in a rotary evaporator (Büchi Rotavapor,
Switzerland). PAHs in the concentrated extracts were fractionatedby a silica gel (Silica gel 60, particle size 0.063–0.2 mm, 70-230mesh ASTM, purchased from Merck KGaA, Darmstadt, Germany)column (4 mm i.d.). The fraction containing PAHs was againconcentrated to 0.5–1.0 ml by rotary evaporation and solvent was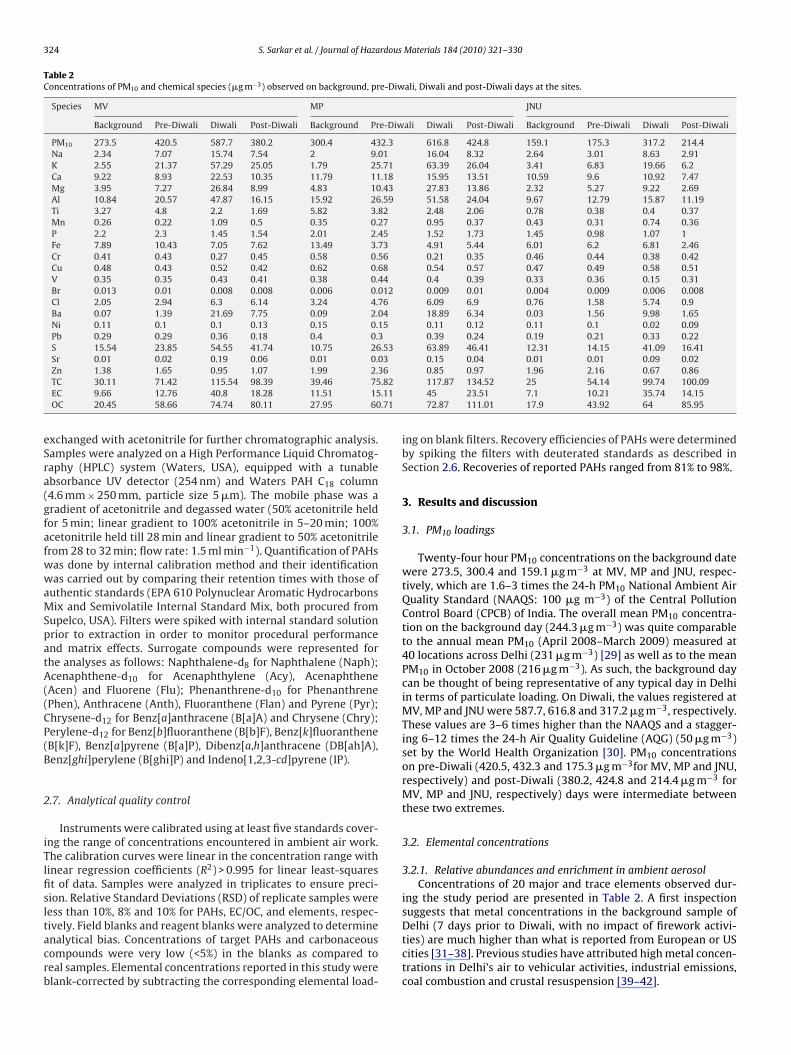
324 S. Sarkar et al. / Journal of Hazardous Materials 184 (2010) 321–330
Table 2Concentrations of PM10 and chemical species (�g m−3) observed on background, pre-Diwali, Diwali and post-Diwali days at the sites.
Species MV MP JNU
Background Pre-Diwali Diwali Post-Diwali Background Pre-Diwali Diwali Post-Diwali Background Pre-Diwali Diwali Post-Diwali
PM10 273.5 420.5 587.7 380.2 300.4 432.3 616.8 424.8 159.1 175.3 317.2 214.4Na 2.34 7.07 15.74 7.54 2 9.01 16.04 8.32 2.64 3.01 8.63 2.91K 2.55 21.37 57.29 25.05 1.79 25.71 63.39 26.04 3.41 6.83 19.66 6.2Ca 9.22 8.93 22.53 10.35 11.79 11.18 15.95 13.51 10.59 9.6 10.92 7.47Mg 3.95 7.27 26.84 8.99 4.83 10.43 27.83 13.86 2.32 5.27 9.22 2.69Al 10.84 20.57 47.87 16.15 15.92 26.59 51.58 24.04 9.67 12.79 15.87 11.19Ti 3.27 4.8 2.2 1.69 5.82 3.82 2.48 2.06 0.78 0.38 0.4 0.37Mn 0.26 0.22 1.09 0.5 0.35 0.27 0.95 0.37 0.43 0.31 0.74 0.36P 2.2 2.3 1.45 1.54 2.01 2.45 1.52 1.73 1.45 0.98 1.07 1Fe 7.89 10.43 7.05 7.62 13.49 3.73 4.91 5.44 6.01 6.2 6.81 2.46Cr 0.41 0.43 0.27 0.45 0.58 0.56 0.21 0.35 0.46 0.44 0.38 0.42Cu 0.48 0.43 0.52 0.42 0.62 0.68 0.54 0.57 0.47 0.49 0.58 0.51V 0.35 0.35 0.43 0.41 0.38 0.44 0.4 0.39 0.33 0.36 0.15 0.31Br 0.013 0.01 0.008 0.008 0.006 0.012 0.009 0.01 0.004 0.009 0.006 0.008Cl 2.05 2.94 6.3 6.14 3.24 4.76 6.09 6.9 0.76 1.58 5.74 0.9Ba 0.07 1.39 21.69 7.75 0.09 2.04 18.89 6.34 0.03 1.56 9.98 1.65Ni 0.11 0.1 0.1 0.13 0.15 0.15 0.11 0.12 0.11 0.1 0.02 0.09Pb 0.29 0.29 0.36 0.18 0.4 0.3 0.39 0.24 0.19 0.21 0.33 0.22S 15.54 23.85 54.55 41.74 10.75 26.53 63.89 46.41 12.31 14.15 41.09 16.41Sr 0.01 0.02 0.19 0.06 0.01 0.03 0.15 0.04 0.01 0.01 0.09 0.02
36.82.11.71
eSra(gfafwwaMSpatA((CP(B
2
iTlfisltacrb
Zn 1.38 1.65 0.95 1.07 1.99 2.TC 30.11 71.42 115.54 98.39 39.46 75EC 9.66 12.76 40.8 18.28 11.51 15OC 20.45 58.66 74.74 80.11 27.95 60
xchanged with acetonitrile for further chromatographic analysis.amples were analyzed on a High Performance Liquid Chromatog-aphy (HPLC) system (Waters, USA), equipped with a tunablebsorbance UV detector (254 nm) and Waters PAH C18 column4.6 mm × 250 mm, particle size 5 �m). The mobile phase was aradient of acetonitrile and degassed water (50% acetonitrile heldor 5 min; linear gradient to 100% acetonitrile in 5–20 min; 100%cetonitrile held till 28 min and linear gradient to 50% acetonitrilerom 28 to 32 min; flow rate: 1.5 ml min−1). Quantification of PAHsas done by internal calibration method and their identificationas carried out by comparing their retention times with those of
uthentic standards (EPA 610 Polynuclear Aromatic Hydrocarbonsix and Semivolatile Internal Standard Mix, both procured from
upelco, USA). Filters were spiked with internal standard solutionrior to extraction in order to monitor procedural performancend matrix effects. Surrogate compounds were represented forhe analyses as follows: Naphthalene-d8 for Naphthalene (Naph);cenaphthene-d10 for Acenaphthylene (Acy), Acenaphthene
Acen) and Fluorene (Flu); Phenanthrene-d10 for PhenanthrenePhen), Anthracene (Anth), Fluoranthene (Flan) and Pyrene (Pyr);hrysene-d12 for Benz[a]anthracene (B[a]A) and Chrysene (Chry);erylene-d12 for Benz[b]fluoranthene (B[b]F), Benz[k]fluorantheneB[k]F), Benz[a]pyrene (B[a]P), Dibenz[a,h]anthracene (DB[ah]A),enz[ghi]perylene (B[ghi]P) and Indeno[1,2,3-cd]pyrene (IP).
.7. Analytical quality control
Instruments were calibrated using at least five standards cover-ng the range of concentrations encountered in ambient air work.he calibration curves were linear in the concentration range withinear regression coefficients (R2) > 0.995 for linear least-squarest of data. Samples were analyzed in triplicates to ensure preci-ion. Relative Standard Deviations (RSD) of replicate samples wereess than 10%, 8% and 10% for PAHs, EC/OC, and elements, respec-
ively. Field blanks and reagent blanks were analyzed to determinenalytical bias. Concentrations of target PAHs and carbonaceousompounds were very low (<5%) in the blanks as compared toeal samples. Elemental concentrations reported in this study werelank-corrected by subtracting the corresponding elemental load-0.85 0.97 1.96 2.16 0.67 0.86117.87 134.52 25 54.14 99.74 100.0945 23.51 7.1 10.21 35.74 14.1572.87 111.01 17.9 43.92 64 85.95
ing on blank filters. Recovery efficiencies of PAHs were determinedby spiking the filters with deuterated standards as described inSection 2.6. Recoveries of reported PAHs ranged from 81% to 98%.
3. Results and discussion
3.1. PM10 loadings
Twenty-four hour PM10 concentrations on the background datewere 273.5, 300.4 and 159.1 �g m−3 at MV, MP and JNU, respec-tively, which are 1.6–3 times the 24-h PM10 National Ambient AirQuality Standard (NAAQS: 100 �g m−3) of the Central PollutionControl Board (CPCB) of India. The overall mean PM10 concentra-tion on the background day (244.3 �g m−3) was quite comparableto the annual mean PM10 (April 2008–March 2009) measured at40 locations across Delhi (231 �g m−3) [29] as well as to the meanPM10 in October 2008 (216 �g m−3). As such, the background daycan be thought of being representative of any typical day in Delhiin terms of particulate loading. On Diwali, the values registered atMV, MP and JNU were 587.7, 616.8 and 317.2 �g m−3, respectively.These values are 3–6 times higher than the NAAQS and a stagger-ing 6–12 times the 24-h Air Quality Guideline (AQG) (50 �g m−3)set by the World Health Organization [30]. PM10 concentrationson pre-Diwali (420.5, 432.3 and 175.3 �g m−3for MV, MP and JNU,respectively) and post-Diwali (380.2, 424.8 and 214.4 �g m−3 forMV, MP and JNU, respectively) days were intermediate betweenthese two extremes.
3.2. Elemental concentrations
3.2.1. Relative abundances and enrichment in ambient aerosolConcentrations of 20 major and trace elements observed dur-
ing the study period are presented in Table 2. A first inspectionsuggests that metal concentrations in the background sample of
Delhi (7 days prior to Diwali, with no impact of firework activi-ties) are much higher than what is reported from European or UScities [31–38]. Previous studies have attributed high metal concen-trations in Delhi’s air to vehicular activities, industrial emissions,coal combustion and crustal resuspension [39–42].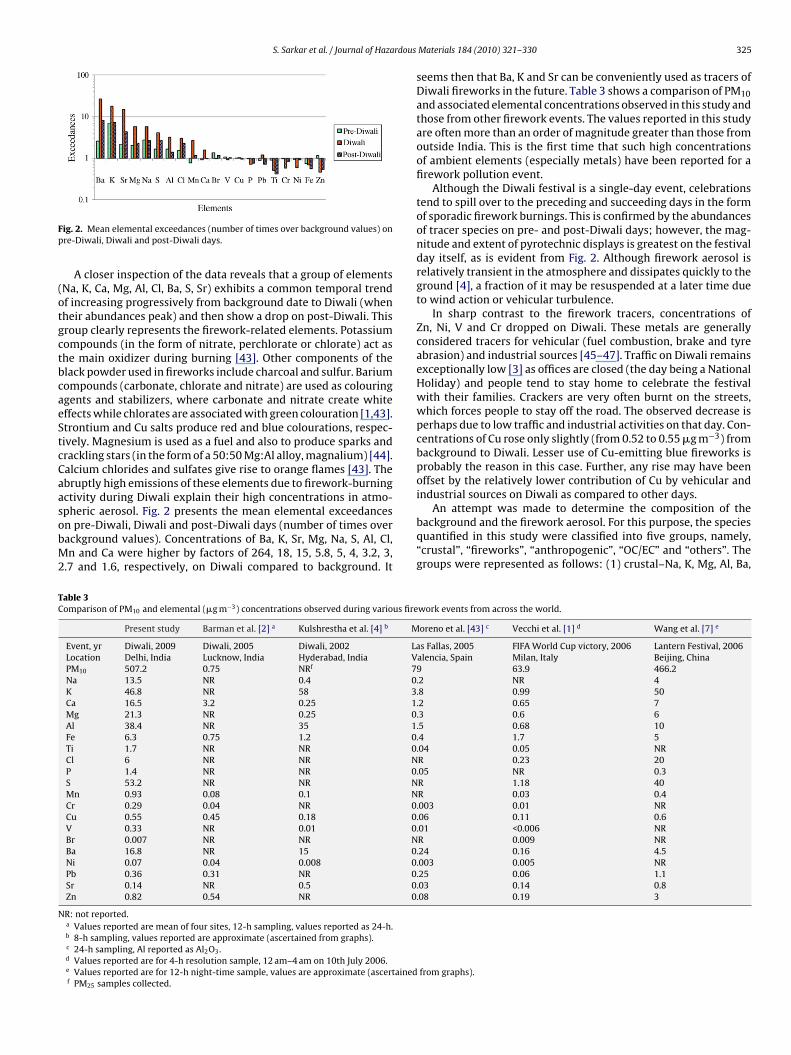
S. Sarkar et al. / Journal of Hazardous
Fp
(otgctbcaeStcCaasobM2
An attempt was made to determine the composition of the
TC
N
ig. 2. Mean elemental exceedances (number of times over background values) onre-Diwali, Diwali and post-Diwali days.
A closer inspection of the data reveals that a group of elementsNa, K, Ca, Mg, Al, Cl, Ba, S, Sr) exhibits a common temporal trendf increasing progressively from background date to Diwali (whenheir abundances peak) and then show a drop on post-Diwali. Thisroup clearly represents the firework-related elements. Potassiumompounds (in the form of nitrate, perchlorate or chlorate) act ashe main oxidizer during burning [43]. Other components of thelack powder used in fireworks include charcoal and sulfur. Bariumompounds (carbonate, chlorate and nitrate) are used as colouringgents and stabilizers, where carbonate and nitrate create whiteffects while chlorates are associated with green colouration [1,43].trontium and Cu salts produce red and blue colourations, respec-ively. Magnesium is used as a fuel and also to produce sparks andrackling stars (in the form of a 50:50 Mg:Al alloy, magnalium) [44].alcium chlorides and sulfates give rise to orange flames [43]. Thebruptly high emissions of these elements due to firework-burningctivity during Diwali explain their high concentrations in atmo-
pheric aerosol. Fig. 2 presents the mean elemental exceedancesn pre-Diwali, Diwali and post-Diwali days (number of times overackground values). Concentrations of Ba, K, Sr, Mg, Na, S, Al, Cl,n and Ca were higher by factors of 264, 18, 15, 5.8, 5, 4, 3.2, 3,.7 and 1.6, respectively, on Diwali compared to background. It
able 3omparison of PM10 and elemental (�g m−3) concentrations observed during various fire
Present study Barman et al. [2] a Kulshrestha et al. [4] b M
Event, yr Diwali, 2009 Diwali, 2005 Diwali, 2002 LaLocation Delhi, India Lucknow, India Hyderabad, India VPM10 507.2 0.75 NRf 7Na 13.5 NR 0.4 0K 46.8 NR 58 3Ca 16.5 3.2 0.25 1Mg 21.3 NR 0.25 0Al 38.4 NR 35 1Fe 6.3 0.75 1.2 0Ti 1.7 NR NR 0Cl 6 NR NR NP 1.4 NR NR 0S 53.2 NR NR NMn 0.93 0.08 0.1 NCr 0.29 0.04 NR 0Cu 0.55 0.45 0.18 0V 0.33 NR 0.01 0Br 0.007 NR NR NBa 16.8 NR 15 0Ni 0.07 0.04 0.008 0Pb 0.36 0.31 NR 0Sr 0.14 NR 0.5 0Zn 0.82 0.54 NR 0
R: not reported.a Values reported are mean of four sites, 12-h sampling, values reported as 24-h.b 8-h sampling, values reported are approximate (ascertained from graphs).c 24-h sampling, Al reported as Al2O3.d Values reported are for 4-h resolution sample, 12 am–4 am on 10th July 2006.e Values reported are for 12-h night-time sample, values are approximate (ascertainedf PM25 samples collected.
Materials 184 (2010) 321–330 325
seems then that Ba, K and Sr can be conveniently used as tracers ofDiwali fireworks in the future. Table 3 shows a comparison of PM10and associated elemental concentrations observed in this study andthose from other firework events. The values reported in this studyare often more than an order of magnitude greater than those fromoutside India. This is the first time that such high concentrationsof ambient elements (especially metals) have been reported for afirework pollution event.
Although the Diwali festival is a single-day event, celebrationstend to spill over to the preceding and succeeding days in the formof sporadic firework burnings. This is confirmed by the abundancesof tracer species on pre- and post-Diwali days; however, the mag-nitude and extent of pyrotechnic displays is greatest on the festivalday itself, as is evident from Fig. 2. Although firework aerosol isrelatively transient in the atmosphere and dissipates quickly to theground [4], a fraction of it may be resuspended at a later time dueto wind action or vehicular turbulence.
In sharp contrast to the firework tracers, concentrations ofZn, Ni, V and Cr dropped on Diwali. These metals are generallyconsidered tracers for vehicular (fuel combustion, brake and tyreabrasion) and industrial sources [45–47]. Traffic on Diwali remainsexceptionally low [3] as offices are closed (the day being a NationalHoliday) and people tend to stay home to celebrate the festivalwith their families. Crackers are very often burnt on the streets,which forces people to stay off the road. The observed decrease isperhaps due to low traffic and industrial activities on that day. Con-centrations of Cu rose only slightly (from 0.52 to 0.55 �g m−3) frombackground to Diwali. Lesser use of Cu-emitting blue fireworks isprobably the reason in this case. Further, any rise may have beenoffset by the relatively lower contribution of Cu by vehicular andindustrial sources on Diwali as compared to other days.
background and the firework aerosol. For this purpose, the speciesquantified in this study were classified into five groups, namely,“crustal”, “fireworks”, “anthropogenic”, “OC/EC” and “others”. Thegroups were represented as follows: (1) crustal–Na, K, Mg, Al, Ba,
work events from across the world.
oreno et al. [43] c Vecchi et al. [1] d Wang et al. [7] e
s Fallas, 2005 FIFA World Cup victory, 2006 Lantern Festival, 2006alencia, Spain Milan, Italy Beijing, China9 63.9 466.2.2 NR 4.8 0.99 50.2 0.65 7.3 0.6 6.5 0.68 10.4 1.7 5.04 0.05 NRR 0.23 20.05 NR 0.3R 1.18 40R 0.03 0.4.003 0.01 NR.06 0.11 0.6.01 <0.006 NRR 0.009 NR.24 0.16 4.5.003 0.005 NR.25 0.06 1.1.03 0.14 0.8.08 0.19 3
from graphs).
326 S. Sarkar et al. / Journal of Hazardous
FtaM
SamMwseafitDwtAcssgaChBmw3etaswF
Fr
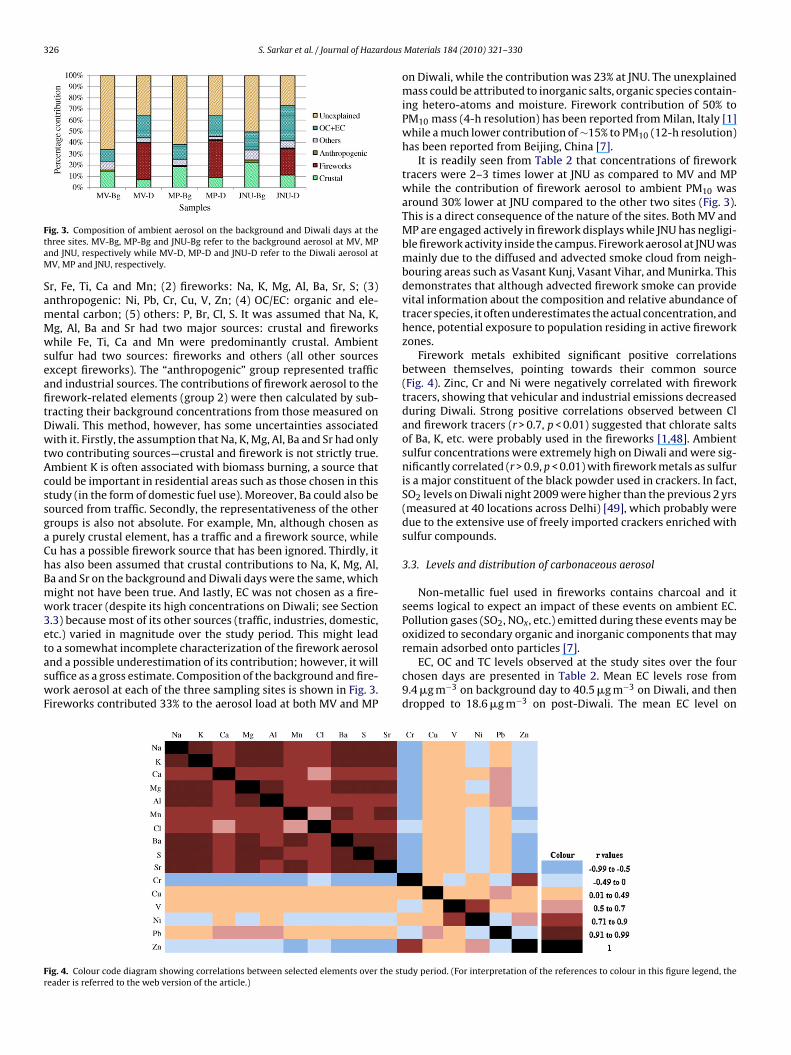
ig. 3. Composition of ambient aerosol on the background and Diwali days at thehree sites. MV-Bg, MP-Bg and JNU-Bg refer to the background aerosol at MV, MPnd JNU, respectively while MV-D, MP-D and JNU-D refer to the Diwali aerosol atV, MP and JNU, respectively.
r, Fe, Ti, Ca and Mn; (2) fireworks: Na, K, Mg, Al, Ba, Sr, S; (3)nthropogenic: Ni, Pb, Cr, Cu, V, Zn; (4) OC/EC: organic and ele-ental carbon; (5) others: P, Br, Cl, S. It was assumed that Na, K,g, Al, Ba and Sr had two major sources: crustal and fireworkshile Fe, Ti, Ca and Mn were predominantly crustal. Ambient
ulfur had two sources: fireworks and others (all other sourcesxcept fireworks). The “anthropogenic” group represented trafficnd industrial sources. The contributions of firework aerosol to therework-related elements (group 2) were then calculated by sub-racting their background concentrations from those measured oniwali. This method, however, has some uncertainties associatedith it. Firstly, the assumption that Na, K, Mg, Al, Ba and Sr had only
wo contributing sources—crustal and firework is not strictly true.mbient K is often associated with biomass burning, a source thatould be important in residential areas such as those chosen in thistudy (in the form of domestic fuel use). Moreover, Ba could also beourced from traffic. Secondly, the representativeness of the otherroups is also not absolute. For example, Mn, although chosen aspurely crustal element, has a traffic and a firework source, whileu has a possible firework source that has been ignored. Thirdly, itas also been assumed that crustal contributions to Na, K, Mg, Al,a and Sr on the background and Diwali days were the same, whichight not have been true. And lastly, EC was not chosen as a fire-ork tracer (despite its high concentrations on Diwali; see Section
.3) because most of its other sources (traffic, industries, domestic,tc.) varied in magnitude over the study period. This might lead
o a somewhat incomplete characterization of the firework aerosolnd a possible underestimation of its contribution; however, it willuffice as a gross estimate. Composition of the background and fire-ork aerosol at each of the three sampling sites is shown in Fig. 3.ireworks contributed 33% to the aerosol load at both MV and MP
ig. 4. Colour code diagram showing correlations between selected elements over the steader is referred to the web version of the article.)
Materials 184 (2010) 321–330
on Diwali, while the contribution was 23% at JNU. The unexplainedmass could be attributed to inorganic salts, organic species contain-ing hetero-atoms and moisture. Firework contribution of 50% toPM10 mass (4-h resolution) has been reported from Milan, Italy [1]while a much lower contribution of ∼15% to PM10 (12-h resolution)has been reported from Beijing, China [7].
It is readily seen from Table 2 that concentrations of fireworktracers were 2–3 times lower at JNU as compared to MV and MPwhile the contribution of firework aerosol to ambient PM10 wasaround 30% lower at JNU compared to the other two sites (Fig. 3).This is a direct consequence of the nature of the sites. Both MV andMP are engaged actively in firework displays while JNU has negligi-ble firework activity inside the campus. Firework aerosol at JNU wasmainly due to the diffused and advected smoke cloud from neigh-bouring areas such as Vasant Kunj, Vasant Vihar, and Munirka. Thisdemonstrates that although advected firework smoke can providevital information about the composition and relative abundance oftracer species, it often underestimates the actual concentration, andhence, potential exposure to population residing in active fireworkzones.
Firework metals exhibited significant positive correlationsbetween themselves, pointing towards their common source(Fig. 4). Zinc, Cr and Ni were negatively correlated with fireworktracers, showing that vehicular and industrial emissions decreasedduring Diwali. Strong positive correlations observed between Cland firework tracers (r > 0.7, p < 0.01) suggested that chlorate saltsof Ba, K, etc. were probably used in the fireworks [1,48]. Ambientsulfur concentrations were extremely high on Diwali and were sig-nificantly correlated (r > 0.9, p < 0.01) with firework metals as sulfuris a major constituent of the black powder used in crackers. In fact,SO2 levels on Diwali night 2009 were higher than the previous 2 yrs(measured at 40 locations across Delhi) [49], which probably weredue to the extensive use of freely imported crackers enriched withsulfur compounds.
3.3. Levels and distribution of carbonaceous aerosol
Non-metallic fuel used in fireworks contains charcoal and itseems logical to expect an impact of these events on ambient EC.Pollution gases (SO2, NOx, etc.) emitted during these events may beoxidized to secondary organic and inorganic components that may
remain adsorbed onto particles [7].EC, OC and TC levels observed at the study sites over the fourchosen days are presented in Table 2. Mean EC levels rose from9.4 �g m−3 on background day to 40.5 �g m−3 on Diwali, and thendropped to 18.6 �g m−3 on post-Diwali. The mean EC level on
udy period. (For interpretation of the references to colour in this figure legend, the

S. Sarkar et al. / Journal of Hazardous
Fh
DMDire
vir0aismfswhatab[odttsOlsstt
3
cr(DDsieci
3.5. Health risk assessment of chronic exposure to Diwali
ig. 5. Ring-wise distribution (shaded areas) and∑
16PAH concentrations (columneights) observed in this study.
iwali was 4.3 times higher than the background value. Babu andoorthy [50] reported a 3- to 4-fold increase in aerosol BC duringiwali at Thumba, India while Wang et al. [7] observed a 5 times
ncrease in BC during the Lantern Festival in China. Vecchi et al. [1]eported an increase of 3.1 times in aerosol EC during a fireworkpisode in Milan, Italy.
The sudden rise in EC on Diwali despite low contributions fromehicular and industrial sources on that day obviously points tots source in firework burnings. This is confirmed by the high cor-elation coefficients between EC and the firework tracers (r = 0.91,.89, 0.75, 0.89, 0.82, 0.85, 0.89, 0.96 and 0.94, p < 0.01, between ECnd Na, K, Ca, Mg, Al, Cl, S, Ba and Sr, respectively). In contrast, OCncreased on Diwali by a smaller margin. The pre-Diwali samplehowed considerably higher OC than the background value, whichay be linked to increased emissions due to a large influx of traffic
rom neighbouring regions into Delhi during this time due to thehopping rush [51]. Post-Diwali OC levels were higher than Diwalihereas EC levels dropped. Low wind speed and low mixing heightselp in trapping pollution gases near the surface and high humiditylong with low ambient temperatures may aid in their secondaryransformation and subsequent condensation onto pre-existingerosol. As a result, concentrations of secondary components maye high in the post-firework period as observed by Wang et al.7]. Meteorological conditions over Delhi were favourable for sec-ndary transformation on the night of Diwali and on the followingay (Table 1). Considering a wind speed of 1 m s−1, it would haveaken 12 h for the pollution gases to travel ∼43 km (roughly equal tohe north-south extent of Delhi), thus providing sufficient time forecondary transformation. It seems plausible, then, that enhancedC levels in the post-Diwali samples could have been due to high
evels of secondary organic carbon (SOC); however, this remainsubject to confirmation as secondary components were not mea-ured separately in this study. Apart from influencing secondaryransformation, prolonged residence of the pollution plume overhe city is bound to cause greater inhalation exposure.
.4. Polycyclic aromatic hydrocarbons
∑16PAH concentrations (sum of 16 PAHs analyzed) along with
orresponding ring-wise distributions observed in this study areepresented in Fig. 5. Mean
∑16PAH levels rose from background
72.8 ng m−3) to pre-Diwali (102.6 ng m−3) and then fell sharply oniwali (44.3 ng m−3), followed by a further small decline on post-iwali (42.6 ng m−3). However, Harrad and Laurie [52] observed
ignificantly enhanced levels of PAHs during Bonfire Night festival
n UK, while Dyke and Coleman [53] observed high levels of ambi-nt dioxins during the same festival. This seeming contradictionan be rationalized by keeping in mind the fundamental differencesn the nature of the two firework events in question. The BonfireMaterials 184 (2010) 321–330 327
Night festival, as the name suggests, involves lighting numerousbonfires, in addition to fireworks, which amounts to large-scalewood burning. Enhanced levels of PAHs during such events areexpected, since wood combustion is widely recognized as a majorsource of atmospheric PAHs [54–56]. In fact, Fleischer et al. [57]found nominal levels of PCDD/Fs during lab-scale combustion ofpyrotechnics, and concluded that high levels of dioxins observedby Dyke and Coleman [53] were probably from bonfires, not fromfireworks. Our results indicate that Diwali fireworks are not majorsources of particulate PAHs in the atmosphere.
We believe that the sharp drop in PAH levels on Diwali waslinked to the dearth of traffic on that day more than anything else.High PAH levels on pre-Diwali coincided with the rush of pre-Diwalitraffic [51].
∑16PAHs were either uncorrelated or negatively cor-
related with firework metals (Na, K, Mg, Al, Ba, Sr) indicating thatfirework is not a major source of PAHs, but were positively cor-related with industrial and vehicular markers (Zn, V, Ni, Cr, Cu;r > 0.5) suggesting their common origin. Concentrations of DB[ah]A,B[ghi]P and IP, all of which are known traffic markers, fell by 82%,76% and 83%, respectively, on Diwali as compared to pre-Diwalivalues. This strengthens our assumption that reduced traffic wasthe main cause of low PAH levels on Diwali. Low
∑16PAH concen-
tration in the post-Diwali sample (Sunday) was again due to lowtraffic. In this context, Li et al. [58] observed that total PAH lev-els fell from 95.9 to 58.9 ng m−3 during the Chinese Spring Festival(also a firework event) in Beijing, and attributed it to the reducedindustrial and vehicular emissions.
The overall PAH profile at the study sites was dominated byB[b]F, which contributed ∼22% (16.8–26.7%) to
∑16PAHs. This was
followed by B[a]P (13.9%), DB[ah]A (11.8%), B[ghi]P (9.8%) and B[k]F(9.3%). Ring-wise distribution showed dominance of 5-ring species(57%, overall mean), followed by 4-ring (18%), 6-ring (15%) and 3-ring species (8%). The seven carcinogenic PAHs—B[a]A, Chry, B[b]F,B[k]F, B[a]P, DB[ah]A and IP [59] contributed 73% (overall mean;range: 41–88%) to total PAHs implying considerable carcinogenicexposure to the population. Concentrations of B[a]P, the most car-cinogenic of the priority PAHs, varied from 3 to 20.2 ng m−3 at thesites, with a considerably high overall mean of 8.6 ng m−3.
Values of the molecular diagnostic ratios Flan/Flan + Pyr,IP/IP + B[ghi]P, B[a]A/Chry and B[a]P/B[ghi]P for the individual daysare presented in Table 4. The ratios gave fingerprints of coal com-bustion and vehicular emission as the chief sources of atmosphericPAHs during the study period. Two coal-fired power plants (RajghatPower Plant, 135 MW and Indraprastha Power Plant, 247.5 MW) arepresent around 4–4.5 km upwind of MV site while Badarpur PowerPlant (720 MW, coal-fired) is present at about 2.5 km upwind ofMP site. Apart from these, the use of low-grade coal for cookingpurposes, especially around MP and JNU, serves as a source of coalcombustion at the study sites. On the other hand, traffic, varyingfrom moderate to heavy, is present in the vicinity of all the sites.This explains the dominance of these two sources as revealed bydiagnostic ratios. In this context, it was interesting to note the vari-ation of B[a]P/B[ghi]P over the study period. On the backgroundand pre-Diwali days, the ratio indicated dominance of vehicularemissions, presumably due to the pre-Diwali rush. However, thevalues shifted markedly to the coal combustion domain on Diwaliand post-Diwali days, which could be best explained by the dearthof traffic on these 2 days. Comparatively lower contributions by thevehicular source on these days were very likely translated into thedominance of the coal source.
firework aerosol
An attempt was made to quantify the excess chronic healthrisk to an individual due to Diwali fireworks. For this purpose,

328 S. Sarkar et al. / Journal of Hazardous Materials 184 (2010) 321–330
Table 4Molecular diagnostic ratios (mean of the three sites) of PAHs for the background, pre-Diwali, Diwali and post-Diwali days in Delhi.
Ratios Sources and values Background Pre-Diwali Diwali Post-Diwali
Flan/Flan + Pyr Coal/wood: >0.5a 0.25 0.68 0.83 0.5Gasoline: 0.4b
Petroleum: <0.4a
IP/IP + B[ghi]P Gasoline: 0.22c 0.37 0.37 0.23 0.35Diesel: 0.5c
Petroleum: 1.3c
B[a]A/Chry Vehicles: 0.53d 1.08 1.5 1.5 1.24Coal: 1.11d
B[a]P/B[ghi]P Coal: 0.9–6.6b 0.88 0.87 3.45 4.09Vehicles: 0.3–0.78b
a Yunker et al. [65].b Simcik et al. [66].c Yassaa et al. [67].d Dickhut et al. [68].
Table 5Estimation of non-carcinogenic health risk.
Species RfCa RfDb Scenario I Scenario II
HQ1 HQ2a HQ2b
Al 5.00 E−03 1.43 E−03 2.33 2.31 0.04Mn 5.00 E−05 1.43 E−05 6.64 6.58 0.09Ba 5.00 E−04 1.43 E−04 0.12 0.12 0.13
HI 9.09 9.01 0.26
HQ1 refers to the hazard quotient for exposure to Al, Mn and Ba for 350 days/yr at their respective background concentrations. HQ2a refers to the hazard quotient forexposure to Al, Mn and Ba for 347 days/yr at their respective background concentrations. HQ2b refers to the hazard quotient for exposure to Al, Mn and Ba for 3 days/yrat their respective concentrations during Diwali (mean of pre-Diwali, Diwali and post-Diwali). Here, inhalation rate (IR) = 20 m3 day−1; exposure frequency (EF) = 350, 347a espec(
wcacStDcDcH
s
H
wcl
D
wrd(
wt
qt
nd 3 days/yr for Scenario I, first part of Scenario II and second part of Scenario II, rLT) = 60 yrs × 365 days, i.e. 21,900 days.
a Source: The Risk Assessment Information System (www.rais.ornl.gov).b Calculated from RfC.
e considered two scenarios. Scenario I involved calculating theumulative Hazard Index (HI) due to some firework tracers (Al, Mnnd Ba) for an annual period (350 days) utilizing their backgroundoncentrations (this study) as a surrogate for their annual means.cenario II involved two separate calculations: firstly, to find outhe HI for Al, Mn and Ba for 347 days (350 days minus 3 days foriwali) using their background concentrations and secondly, to cal-ulate the HI for the 3 days of Diwali (using the mean of pre-Diwali,iwali and post-Diwali values). These were then added to get theumulative HI for Scenario II, which was then compared with theI from Scenario I to get the excess risk due to Diwali.
The non-carcinogenic health risk to an individual due to expo-ure to a chemical is given by [60,61]
azard Quotient (HQ) = DiRfD
here Di = Daily intake dose (mg kg−1 day−1), RfD = Inhalationhronic reference dose (mg kg−1 day−1). Further, Di can be calcu-ated as
i = CC × IR × EF × EDBW × LT
here CC = contaminant concentration (mg m−3), IR = inhalationate (m3 day−1), EF = exposure frequency (days/yr), ED = exposureuration (yrs), BW = body weight (kg) and LT = average lifetimedays) i.e. age (yr) × 365 days/yr.
RfD can be calculated as RfD = (RfC × inhalation rate)/body
eight [62], where RfC is the Inhalation chronic reference concen-ration (mg m−3).Adverse non-carcinogenic health effects are expected if this
uotient exceeds unity. A different HQ is estimated for each con-aminant and sometimes for each pathway if pathway specific
tively; Exposure Duration (EF) = 60 yrs; body weight (BW) = 70 kg; average lifetime
reference doses are known [60]. The HQs are combined to formHI which assumes that the effects of the different chemicals areadditive.
HI =∑
i
(HQ)i
where i is the contaminant and/or pathway index, and (HQ)i is thehazard quotient for contaminant or pathway i.
The parameters used for calculating health risks and results ofthe assessment are presented in Table 5. The cumulative HI for Sce-nario I is very high (9.09) indicating significant health effects at thebackground levels of the chosen contaminants. Including Diwali inthis calculation (Scenario II) further raises the HI to 9.27. This trans-lates into a 2% rise in health effects due to chronic lifetime exposureto Al, Mn and Ba alone during Diwali. We stress at this point that theactual effects, however, should be far more severe due to chronicexposure to high levels of other pollutants such as PM10, SO2, NOx,EC, etc., in addition to the acute effects of the said pollutants.
4. Conclusions
This paper shows that atmospheric pollution due to the Diwalifirework event comes primarily from very high concentrations ofrespirable particulates and associated metals (Ba, K, Na, Al, Sr) alongwith EC. Extremely high PM10 loadings (6–12 times the WHO limit)on Diwali is bound to affect sensitive groups of the exposed popula-
tion. Concentrations of Ba, K, Sr and Na increased by factors of 264,18, 15 and 5, respectively, commensurate with the abundant useof these metals in pyrotechnic compositions. Very high concentra-tion of Ba in atmospheric aerosol (mean 16.85 �g m−3) on Diwali isparticularly of concern from the health effects point of view. Fire-
rdous
wD(dawptucalsrsPii
ttohtawtarht
A
itRtfc
R
[
[
[
[
[
[
[
[
[
[
[
[
[
[
[
[
[
[
[
[
[
[
[
[
[
[
[
[
[
S. Sarkar et al. / Journal of Haza
ork aerosol contributed 23–33% to the ambient aerosol loads oniwali. Metals having primarily a vehicular and industrial origin
Zn, Cr, V and Ni) showed lower abundances on Diwali, presumablyue to lower traffic and industrial activities. The firework event waslso characterized by an increase in the EC levels by a factor of 4.3,hich agrees well with previous studies. OC levels were higher onost-Diwali compared to Diwali, which may be due to secondaryransformation of pollutant gases released during firework burningnder favourable meteorological conditions. We observed signifi-antly low PAH levels on Diwali, and thereby confirm that fireworksre not major sources of particulate PAHs. Instead, PAH levels corre-ated well with the traffic trend during Diwali, indicating its majorource as vehicular emissions. The analysis of molecular diagnosticatios corroborated this argument and identified vehicular emis-ions and coal combustion as predominant sources of atmosphericAHs. It was estimated that chronic exposure to Diwali pollutions likely to cause at least a 2% increase in non-carcinogenic hazardndex associated with Al, Mn and Ba in the exposed population.
Overall, we conclude that the festival of Diwali adds significantlyo the existing pollution problem in Delhi, albeit for a short period ofime. In general, people’s perception of Diwali pollution is centeredn criteria pollutants like ambient particulates, SO2, NOx, etc. It is,owever, vitally important to characterize specific tracers emit-ed during firework episodes to get a better understanding of thectual scenario. Although SO2 and NOx levels on Diwali 2009 wereell below stipulated standards [63], the present study reveals that
he event generates enormous quantities of other pollutants (met-ls, EC, etc.) that pose a high health risk. As Clark [21] has noted,egulating or banning such events would be socially unacceptable;owever, adequate knowledge of the scenario is vital to ensure thathe sensitive populace takes precautionary measures.
cknowledgements
The Advanced Instrumentation Research Facility (AIRF) at JNUs acknowledged for providing WDXRF facilities. The authors arehankful to the NOAA Air Resources Laboratory (ARL) and theEADY website (http://www.arl.noaa.gov/ready.php) for providinghe HYSPLIT transport and dispersion model. The authors grate-ully acknowledge the anonymous reviewers for their valuable andonstructive suggestions.
eferences
[1] R. Vecchi, V. Bernardoni, D. Cricchio, A. D’Alessandro, P. Fermo, F. Lucarelli, S.Nava, A. Piazzalunga, G. Valli, The impact of fireworks on airborne particles,Atmos. Environ. 42 (2008) 1121–1132.
[2] S.C. Barman, R. Singh, M.P.S. Negi, S.K. Bhargava, Ambient air quality of LucknowCity (India) during use of fireworks on Diwali festival, Environ. Monit. Assess.137 (2008) 495–504.
[3] D.P. Singh, R. Gadi, T.K. Mandal, C.K. Dixit, K. Singh, T. Saud, N. Singh, P.K.Gupta, Study of temporal variation in air quality during Diwali festival in India,Environ. Monit. Assess. (2009), doi:10.1007/s10661-009-1145-9.
[4] U.C. Kulshrestha, T.N. Rao, S. Azhaguvel, M.J. Kulshrestha, Emissions and accu-mulation of metals in the atmosphere due to crackers and sparklers duringDiwali festival in India, Atmos. Environ. 38 (2004) 4421–4425.
[5] F. Drewnick, S.S. Hings, J. Curtius, G. Eerdekens, J. Williams, Measurement offine particulate and gas-phase species during the New Year’s fireworks in 2005in Mainz, Germany, Atmos. Environ. 40 (2006) 4316–4327.
[6] G. Steinhauser, J.H. Sterba, M. Foster, F. Grass, M. Bichler, Heavy metals frompyrotechnics in New Years Eve snow, Atmos. Environ. 42 (2008) 8616–8622.
[7] Y. Wang, G. Zhuang, C. Xu, Z. An, The air pollution caused by the burning offireworks during the Lantern Festival in Beijing, Atmos. Environ. 41 (2007)417–431.
[8] C.A. Pope III, D.W. Dockery, Health effects of fine particulate air pollution: lines
that connect, J. Air Waste Manage. Assoc. 56 (2006) 709–742.[9] L. Curtis, W. Rea, W.P. Smith, E. Fenyves, Y. Pan, Adverse health effects of out-door air pollutants, Environ. Pollut. 32 (2006) 815–830.
10] K. Hirai, Y. Yamazaki, K. Okada, S. Furuta, K. Kubo, Acute eosinophilic pneumo-nia associated with smoke from fireworks, Intern. Med. 39 (2000) 401–403.
11] O.P. Murty, Diwali toxicity, J. Forensic Med. Toxicol. 17 (2000) 23–26.
[
[
Materials 184 (2010) 321–330 329
12] O.P. Soldin, L.E. Braverman, S.H. Lamm, Perchlorate clinical pharmacology andhuman health: a review, Therap. Drug Monit. 23 (2001) 316–331.
13] J. Saas, U.S. Department of Defense and White House working together to avoidcleanup and liability for perchlorate pollution, Int. J. Occup. Environ. Health 10(2004) 330–334.
14] E.K. Mantus, Health implications of perchlorate ingestion, in: Preprints ofExtended Abstracts Presented at the ACS National Meeting, vol. 45, AmericanChemical Society, Division of Environmental Chemistry, 2005, pp. 873.
15] R.T. Wilkin, D.D. Fine, N.G. Burnett, Perchlorate behavior in a municipallake following fireworks displays, Environ. Sci. Technol. 41 (2007) 3966–3971.
16] A.K. Attri, U. Kumar, V.K. Jain, Formation of ozone by fireworks, Nature 411(2001) 1015.
17] Transport Dept., Delhi Govt, 2009, http://www.delhi.gov.in/wps/wcm/connect/doit transport/Transport/Home/General+Information/Few+Interesting+Statistics.
18] Delhi Govt., Background Note on Delhi’s Industrial Policy, Planning Depart-ment, Govt. of National Capital Territory (NCT) of Delhi, 2006.
19] J.S. Pandey, R. Kumar, S. Devotta, Health risks of NO2, SPM and SO2 in Delhi(India), Atmos. Environ. 39 (2005) 6868–6874.
20] ICMR, Development of an Atlas of Cancer in India, Indian Council of MedicalResearch, New Delhi, 2005.
21] H. Clark, Light blue touch paper and retire. . ., Atmos. Environ. 31 (1997)2893–2895.
22] B.L. Kaul, M.K. Pandit, Morphotectonic evaluation of the Delhi region in north-ern India, and its significance in environmental management, Environ. Geol. 46(2004) 1118–1122.
23] K.E. Yttri, W. Aas, A. Bjerke, J.N. Cape, F. Cavalli, D. Ceburnis, C. Dye, L. Emblico,M.C. Facchini, C. Forster, J.E. Hansson, S.G. Jennings, W. Maenhaut, J.P. Putaud,K. Tørseth, Elemental and organic carbon in PM10: a one year measurementcampaign within the European Monitoring and Evaluation Programme EMEP,Atmos. Chem. Phys. 7 (2007) 5711–5725.
24] H. ten Brink, W. Maenhaut, R. Hitzenberger, T. Gnauk, G. Spindler, A. Even, X.Chi, H. Bauer, H. Puxbaum, J.-P. Putaud, J. Tursic, A. Berner, INTERCOMP 2000:the compatibility of methods in use in Europe for measuring the carbon contentof aerosol, Atmos. Environ. 38 (2004) 6507–6519.
25] S.R. McDow, J.J. Huntzicker, Vapor adsorption artifact in the sampling of organicaerosol: face velocity effects, Atmos. Environ. 24 (1990) 2563–2571.
26] B.J. Turpin, J.J. Huntzicker, S.V. Hering, Investigation of organic aerosol samplingartefacts in the Los Angeles basin, Atmos. Environ. 34 (1994) 3061–3071.
27] J.J. Lin, H.-S. Tai, Concentrations and distributions of carbonaceous speciesin ambient particles in Kaohsiung City, Taiwan, Atmos. Environ. 35 (2001)2627–2636.
28] P. Reisinger, A. Wonaschütz, R. Hitzenberger, A. Petzold, H. Bauer, N. Jankowski,H. Puxbaum, X. Chi, W. Maenhaut, Intercomparison of measurement tech-niques for black or elemental carbon under urban background conditions inwintertime: influence of biomass combustion, Environ. Sci. Technol. 42 (2008)884–889.
29] DPCC, Monthly Ambient Air Monitoring Data, Delhi Pollution Control Commit-tee, New Delhi, 2010, http://www.dpcc.delhigovt.nic.in/Air40.html.
30] WHO, WHO Air Quality Guidelines for Particulate Matter, Ozone, NitrogenDioxide and Sulfur Dioxide: Global Update 2005, World Health Organization,2005.
31] Y Gao, E.D. Nelson, M.P. Field, Q. Ding, H. Li, R.M. Sherrell, C.L. Gigliotti, D.A. vanRy, T.R. Glenn, S.J. Eisenreich, Characterization of atmospheric trace elementson PM2.5 particulate matter over the New York–New Jersey harbour estuary,Atmos. Environ. 36 (2002) 1077–1086.
32] A.J. Fernández Espinosa, M.T. Rodriguez, F.J.B. de la Rosa, J.C.J. Sánchez, A chemi-cal speciation of trace metals for fine urban particles, Atmos. Environ. 36 (2002)773–780.
33] R.M. Miranda, M.F. Andrade, A. Worobiec, R. Van Grieken, Characterisation ofaerosol particles in the São Paulo Metropolitan Area, Atmos. Environ. 36 (2002)345–352.
34] H. Bem, M. Gallorini, E. Rizzio, M. Krzeminska, Comparative studies on the con-centrations of some elements in the urban air particulate matter in Lodz Cityof Poland and in Milan, Italy, Environ. Int. 29 (2003) 423–428.
35] T. Moreno, X. Querol, A. Alastuey, M. Viana, P. Salvador, A.S. de la Campa, B.Artinano, J. de la Rosa, W. Gibbons, Variations in atmospheric PM trace metalcontent in Spanish towns: illustrating the chemical complexity of the inorganicurban aerosol cocktail, Atmos. Environ. 40 (2006) 6791–6803.
36] G. Dongarrà, E. Manno, D. Varrica, M. Vultaggio, Mass levels, crustal compo-nent and trace elements in PM10 in Palermo, Italy, Atmos. Environ. 41 (2007)7977–7986.
37] J. Meresová, M. Florek, K. Holy, M. Jeskovsky, I. Sykora, M.V. Frontasyeva,S.S. Pavlov, M. Bujdos, Evaluation of elemental content in air-borne particu-late matter in low-level atmosphere of Bratislava, Atmos. Environ. 42 (2008)8079–8085.
38] M. Viana, X. Querol, A. Alastuey, F. Ballester, S. Llop, A. Esplugues, R. Fernández-Patier, S.G. dos Santos, M.D. Herce, Characterising exposure to PM aerosols foran epidemiological study, Atmos. Environ. 42 (2008) 1552–1568.
39] S. Balachandran, B.R. Meena, P.S. Khillare, Particle size distribution and its ele-mental composition in the ambient air of Delhi, Environ. Int. 26 (2000) 49–54.
40] P.S. Khillare, S. Balachandran, B.R. Meena, Spatial and temporal variation ofheavy metals in atmospheric aerosol of Delhi, Environ. Monit. Assess. 90 (2004)1–21.

3 rdous
[
[
[
[
[
[
[
[
[
[
[
[
[
[
[
[
[
[
[
[
[
[
[
[
[
[
[
30 S. Sarkar et al. / Journal of Haza
41] A. Srivastava, V.K. Jain, Seasonal trends in coarse and fine particle sources inDelhi by the chemical mass balance receptor model, J. Hazard. Mater. 144(2006) 283–291.
42] A. Srivastava, V.K. Jain, Size distribution and source identification of totalsuspended particulate matter and associated heavy metals in the urban atmo-sphere of Delhi, Chemosphere 68 (2007) 579–589.
43] T. Moreno, X. Querol, A. Alastuey, M.C. Minguillon, J. Pey, S. Rodriguez, J.V.Miro, C. Felis, W. Gibbons, Recreational atmospheric pollution episodes: inhal-able metalliferous particles from fireworks displays, Atmos. Environ. 41 (2007)913–922.
44] R. Lancaster, R. Butler, J. Lancaster, T. Shimizu, T. Smith, Fireworks: Principlesand Practice, Chemical Publishing Company, New York, 1998.
45] J.M. Pacyna, in: J.O. Nriagu, C.I. Davison (Eds.), Toxic Metals in the Atmosphere,Wiley, New York, 1986, pp. 1–52.
46] X. Querol, A. Alastuey, J. Rosa, A.S. de la Campa, F. Plana, C. Ruiz, Source appor-tionment analysis of atmospheric particulates in an industrialised urban site insouthwestern Spain, Atmos. Environ. 36 (2002) 3113–3125.
47] W. Birmili, A. Allen, F. Bary, R. Harrison, Trace metal concentrations and watersolubility in size-fractionated atmospheric particles and influence of road traf-fic, Environ. Sci. Technol. 14 (2006) 1144–1153.
48] K.D. Perry, Effects of outdoor pyrotechnic displays on the regional air qualityof Western Washington State, J. Air Waste Manage. Assoc. 49 (1999) 146–155.
49] DPCC, SO2 Level on Deepawali Night, Delhi Pollution Control Committee, NewDelhi, 2009, http://www.dpcc.delhigovt.nic.in/diwali-so2.html.
50] S.S. Babu, K.K. Moorthy, Anthropogenic impact on aerosol black carbon massconcentration at a tropical coastal station: a case study, Curr. Sci. 81 (2001)1208–1214.
51] A. Tandon, S. Yadav, A.K. Attri, City-wide sweeping a source for respirable par-ticulate matter in the atmosphere, Atmos. Environ. 42 (2008) 1064–1069.
52] S. Harrad, L. Laurie, Concentrations, sources and temporal trends in atmo-spheric polycyclic aromatic hydrocarbons in a major conurbation, J. Environ.Monit. 7 (2005) 722–727.
53] P. Dyke, P. Coleman, Dioxins in ambient air, bonfire night 1994, Chemosphere34 (1997) 1191–1201.
54] N.R Khalili, P.A. Scheff, T.M. Holsen, PAH source fingerprints for coke ovens,diesel and gasoline engines, highway tunnels, and wood combustion emissions,Atmos. Environ. 29 (1995) 533–542.
55] S.V. Kakareka, T.I. Kukharchyk, V.S. Khomich, Study of PAH emission fromthe solid fuels combustion in residential furnaces, Environ. Pollut. 133 (2005)383–387.
[
Materials 184 (2010) 321–330
56] K. Hytonen, P. Yli-Pirila, J. Tissari, A. Grohn, I. Riipinen, K.E.J. Lehtinen, J.Jokiniemi, Gas-particle distribution of PAHs in wood combustion emissiondetermined with annular denuders, filter, and polyurethane foam adsorbent,Aerosol Sci. Technol. 43 (2009) 442–454.
57] O. Fleischer, H. Wichmann, W. Lorenz, Release of polychlorinated dibenzo-p-dioxins and dibenzofurans by setting off fireworks, Chemosphere 39 (1999)925–932.
58] X. Li, X. Guo, X. Liu, C. Liu, S. Zhang, Y. Wang, Distribution and sources of solventextractable organic compounds in PM2.5 during 2007 Chinese Spring festival inBeijing, J. Environ. Sci. 21 (2009) 142–149.
59] US EPA, Polycyclic Organic Matter, US Environmental Protection Agency, Wash-ington, DC, 2002, http://www.epa.gov/ttn/atw/hlthef/polycycl.html.
60] B.R. Gurjar, M. Mohan, Potential health risks due to toxic contamination in theambient environment of certain Indian states, Environ. Monit. Assess. 82 (2003)203–223.
61] J.M. Lim, J.H. Lee, Y.S. Chung, J.H. Moon, K.H. Kim, Risk assessment of inhala-tion exposure for airborne toxic metals using instrumental neutron activationanalysis, J. Radioanal. Nucl. Chem. 281 (2009) 185–188.
62] S.W. See, R. Balasubramanian, Risk assessment of exposure to indoor aerosolsassociated with Chinese cooking, Environ. Res. 102 (2006) 197–204.
63] DPCC, Air Pollution Level on Deepawali Night, Delhi Pollution Control Commit-tee, New Delhi, 2009, http://www.dpcc.delhigovt.nic.in/pollu-diwali.html.
64] R.R. Draxler, G.D. Rolph, HYSPLIT (HYbrid Single-Particle Lagrangian Inte-grated Trajectory) Model Access via NOAA ARL READY, NOAA Air ResourcesLaboratory, Silver Spring, Silver Spring, MD, 2003, http://www.arl.noaa.gov/HYSPLIT.php.
65] M.B. Yunker, R.W. Macdonald, R. Vingarzan, R.H. Mitchell, D. Goyette, S.Sylvestre, PAHs in the Fraser River basin: a critical appraisal of PAH ratiosas indicators of PAH source and composition, Org. Geochem. 33 (2002)489–515.
66] M.F. Simcik, S.J. Eisenreich, P.J. Lijoy, Source apportionment and source/sinkrelationship of PAHs in the coastal atmosphere of Chicago and Lake Michigan,Atmos. Environ. 33 (1999) 5071–5079.
67] N. Yassaa, Y. Meklati, A. Cecinato, F. Marino, Particulate n-alkanes, n-alkanoic
acids and polycyclic aromatic hydrocarbons in the Algiers City Area, Atmos.Environ. 35 (2001) 1843–1851.68] R.M. Dickhut, E.A. Canuel, K.E. Gustafson, K. Liu, K.M. Arzayus, S.E. Walker,G. Edgecombe, M.O. Gaylor, E.H. Macdonald, Automotive sources of carcino-genic polycyclic aromatic hydrocarbons associated with particulate matter inChesapeake Bay region, Environ. Sci. Technol. 34 (2000) 4635–4640.