Extensive gene flow over Europe and possible speciation
19
Extensive gene flow over Europe and possible speciation over Eurasia in the ectomycorrhizal basidiomycete Laccaria amethystina complex LUCIE VINCENOT,* 1 KAZUHIDE NARA,† CHRISTOPHER STHULTZ,* JESSY LABBE ´ ,‡§ MARIE-PIERRE DUBOIS,* LEHO TEDERSOO, – FRANCIS MARTIN‡ and MARC-ANDRE ´ SELOSSE* *UMR5175, Centre d’Ecologie Fonctionnelle et Evolutive, 1919 route de Mende, 34293 Montpellier Cedex 5, France, †Department of Natural Environmental Studies, The University of Tokyo, 5-1-5 Kashiwanoha, Kashiwa, Chiba 277-8563, Japan, ‡UMR1136, Interactions Arbres ⁄ Microorganismes, INRA-Nancy, 54280 Champenoux, France, §Environmental Sciences Division, Oak Ridge National Laboratory, Oak Ridge, TN 37831-6034, USA, –Institute Ecology and Earth Sciences and The Natural History Museum, University of Tartu, 40 Lai Str., 51005 Tartu, Estonia Abstract Biogeographical patterns and large-scale genetic structure have been little studied in ectomycorrhizal (EM) fungi, despite the ecological and economic importance of EM symbioses. We coupled population genetics and phylogenetic approaches to understand spatial structure in fungal populations on a continental scale. Using nine microsatellite markers, we characterized gene flow among 16 populations of the widespread EM basidiomycete Laccaria amethystina over Europe (i.e. over 2900 km). We also widened our scope to two additional populations from Japan (10 4 km away) and compared them with European populations through microsatellite markers and multilocus phylogenies, using three nuclear genes (NAR, G6PD and ribosomal DNA) and two mitochondrial ribosomal genes. European L. amethystina populations displayed limited differentiation (average F ST = 0.041) and very weak isolation by distance (IBD). This panmictic European pattern may result from effective aerial dispersal of spores, high genetic diversity in populations and mutualistic interactions with multiple hosts that all facilitate migration. The multilocus phylogeny based on nuclear genes confirmed that Japanese and European specimens were closely related but clustered on a geographical basis. By using microsatellite markers, we found that Japanese populations were strongly differentiated from the European populations (F ST = 0.416), more than expected by extrapolating the European pattern of IBD. Population structure analyses clearly separated the populations into two clusters, i.e. European and Japanese clusters. We discuss the possibility of IBD in a continuous population (considering some evidence for a ring species over the Northern Hemisphere) vs. an allopatric speciation over Eurasia, making L. amethystina a promising model of intercontinental species for future studies. Keywords: cryptic speciation, ectomycorrhizal fungi, gene flow, inbreeding, isolation by distance, microsatellite markers, phylogeography, population structure Received 11 July 2011; revision received 27 October 2011; accepted 1 November 2011 Introduction Many fungal species extend over a whole continent, or even over several continents (Douhan et al. 2007; Queloz et al. 2011), and a comparative analysis of regional inventories revealed that 28–63% of macrofungal spe- cies are shared by at least two continental regions (Mueller et al. 2007). Hence, they seem to follow the Correspondence: Lucie Vincenot, Fax: (+39 0461650872); E-mail: [email protected] 1 Present address: Sustainable Agro-Ecosystems and Bioresources, Fondazione Edmund Mach-IASMA, via Edmund Mach 1, 38100 San Michele all’Adige, Italy ȑ 2011 Blackwell Publishing Ltd Molecular Ecology (2011) doi: 10.1111/j.1365-294X.2011.05392.x
Transcript of Extensive gene flow over Europe and possible speciation

Molecular Ecology (2011) doi: 10.1111/j.1365-294X.2011.05392.x
Extensive gene flow over Europe and possible speciationover Eurasia in the ectomycorrhizal basidiomyceteLaccaria amethystina complex
LUCIE VINCENOT,* 1 KAZUHIDE NARA,† CHRISTOPHER STHULTZ,* JESSY LABBE ,‡§
MARIE-PIERRE DUBOIS , * LEHO TEDERSOO,– FRANCIS MARTIN‡ and MARC-ANDRE SELOSSE*
*UMR5175, Centre d’Ecologie Fonctionnelle et Evolutive, 1919 route de Mende, 34293 Montpellier Cedex 5, France,
†Department of Natural Environmental Studies, The University of Tokyo, 5-1-5 Kashiwanoha, Kashiwa, Chiba 277-8563, Japan,
‡UMR1136, Interactions Arbres ⁄ Microorganismes, INRA-Nancy, 54280 Champenoux, France, §Environmental Sciences
Division, Oak Ridge National Laboratory, Oak Ridge, TN 37831-6034, USA, –Institute Ecology
and Earth Sciences and The Natural History Museum, University of Tartu, 40 Lai Str., 51005 Tartu, Estonia
Corresponde
E-mail: lucie.1Present addr
Fondazione E
38100 San M
� 2011 Black
Abstract
Biogeographical patterns and large-scale genetic structure have been little studied in
ectomycorrhizal (EM) fungi, despite the ecological and economic importance of EM
symbioses. We coupled population genetics and phylogenetic approaches to understand
spatial structure in fungal populations on a continental scale. Using nine microsatellite
markers, we characterized gene flow among 16 populations of the widespread EM
basidiomycete Laccaria amethystina over Europe (i.e. over 2900 km). We also widened
our scope to two additional populations from Japan (104 km away) and compared them
with European populations through microsatellite markers and multilocus phylogenies,
using three nuclear genes (NAR, G6PD and ribosomal DNA) and two mitochondrial
ribosomal genes. European L. amethystina populations displayed limited differentiation
(average FST = 0.041) and very weak isolation by distance (IBD). This panmictic European
pattern may result from effective aerial dispersal of spores, high genetic diversity in
populations and mutualistic interactions with multiple hosts that all facilitate migration.
The multilocus phylogeny based on nuclear genes confirmed that Japanese and
European specimens were closely related but clustered on a geographical basis. By
using microsatellite markers, we found that Japanese populations were strongly
differentiated from the European populations (FST = 0.416), more than expected by
extrapolating the European pattern of IBD. Population structure analyses clearly
separated the populations into two clusters, i.e. European and Japanese clusters. We
discuss the possibility of IBD in a continuous population (considering some evidence for
a ring species over the Northern Hemisphere) vs. an allopatric speciation over Eurasia,
making L. amethystina a promising model of intercontinental species for future studies.
Keywords: cryptic speciation, ectomycorrhizal fungi, gene flow, inbreeding, isolation by
distance, microsatellite markers, phylogeography, population structure
Received 11 July 2011; revision received 27 October 2011; accepted 1 November 2011
nce: Lucie Vincenot, Fax: (+39 0461650872);
ess: Sustainable Agro-Ecosystems and Bioresources,
dmund Mach-IASMA, via Edmund Mach 1,
ichele all’Adige, Italy
well Publishing Ltd
Introduction
Many fungal species extend over a whole continent, or
even over several continents (Douhan et al. 2007; Queloz
et al. 2011), and a comparative analysis of regional
inventories revealed that 28–63% of macrofungal spe-
cies are shared by at least two continental regions
(Mueller et al. 2007). Hence, they seem to follow the

2 L. VINCENOT ET AL.
classic Beijerinckian paradigm for microbes, ‘everything is
everywhere, but, the environment selects’ (O’Malley 2007).
Indeed, high dispersibility of spores could allow exten-
sive flow of propagules over intra- and intercontinental
distances. However, because morphological observa-
tions used to name fungi may not distinguish closely
related biological species (i.e. groups of organisms capa-
ble of interbreeding), claims based on such surveys
remain questionable. Indeed, molecular phylogenetic
analyses often challenge global and intercontinental
fungal species (Douhan et al. 2011) and suggest that
morphospecies often encompass cryptic biological spe-
cies, which remain hidden because of the limited mor-
phological characters available for fungi (Taylor et al.
2006; Jargeat et al. 2010). Although multigene phyloge-
nies indirectly allow delineation of biological species by
enforcing the Phylogenetic Species Concept (Taylor
et al. 2000; Douhan et al. 2007), it is often difficult to
settle a clear species boundary within quickly evolving
species complexes. In such cases, population genetics
approaches are powerful tools to reveal reproductive
isolation and thus biological species. Unfortunately,
population genetics studies remain limited for fungi as
compared with other eukaryotes (in ISI Web of Knowl-
edge for 2010, 55 papers dealt with ‘population genet-
ics’ or ‘gene flow’ for fungi, compared with 129 for
animals and 379 for plants). Moreover, because most of
these studies were conducted at a local scale, mycolo-
gists recently called for larger-scale population genetics
studies (Taylor et al. 2006; Halling et al. 2008; Douhan
et al. 2011).
Long-distance dispersal (LDD) via recent human
transport or natural aerial dispersal has been well rec-
ognized in pathogenic fungi (Brown & Hovmøller
2002). This leads to large, continental-scale distributions
of plant pathogenic ascomycetes (Dilmaghani et al.
2009) and basidiomycetes (Barres et al. 2008). Large dis-
tribution areas and efficient LDD have also been
reported in saprobic fungi, e.g. the Ganoderma applana-
tum ⁄ G. australe complex from the Southern Hemisphere
(Moncalvo & Buchanan 2008), Schizophyllum commune
(James et al. 1999) or Serpula lacrymans (Kauserud et al.
2007; human dispersion being involved in this case).
However, for ectomycorrhizal (EM) fungi that associate
with forest trees in most temperate and boreal forests,
the picture remains unclear. The structure of EM popu-
lations has mainly been explored at small local scales,
focusing on genet size, inbreeding and diversity (e.g.
Bergemann & Miller 2002; Gherbi et al. 1999; see review
in Douhan et al. 2011). Among a few large-scale studies
on gene flow, Bergemann & Miller (2002) found strong
genetic differentiation between populations of Russula
brevipes situated 1500 km apart in North American for-
ests and questioned their conspecificity. Xu et al. (2008)
detected isolation by distance (IBD) over 1050 km in
Tricholoma matsutake from Southwestern China. In Eur-
ope, significant IBD over 900 km was found in two truf-
fles, Tuber magnatum (i.e. its whole geographical range;
Rubini et al. 2005) and T. melanosporum (Murat et al.
2004). Significant IBD were even seen at smaller scales
for species such as Rhizopogon spp. (over 5 km, Kretzer
et al. 2005) or Cenococcum geophilum (over 250 km, Jany
et al. 2002), but these species, together with Tuber spp.,
do not produce wind-dispersed spores and depend on
animals for spore dispersal. Moreover, population
genetics sometimes revealed sympatric cryptic species,
e.g. in Tricholoma ‘scalpturatum’ (Carriconde et al. 2008;
Jargeat et al. 2010), Amanita muscaria (Geml et al. 2009)
or Cantharellus formosus (Dunham et al. 2003).
However, no EM population genetic study to date
has extended over more than 1500 km (Douhan et al.
2011). At such scales, EM fungi were investigated by
phylogenetic ⁄ phylogeographic approaches, relying on a
limited number of individuals and molecular loci. Some
monophyletic EM taxa with intercontinental distribution
were divided into several units, a result also obtained
for several non-EM fungi (Taylor et al. 2006). For exam-
ple, Wu et al. (2000) found that morphologically indis-
tinguishable Suillus spraguei specimens from China and
North America belonged to a paraphyletic assemblage.
The putatively global Pisolithus tinctorius was split into
geographical species (Martin et al. 2002). Geml et al.
(2006, 2009) also found several geographical clades
within A. muscaria sensu lato. However, the putative
species, phylogenetic clades or geographical groups
resulting from these phylogenetic approaches were
determined without directly assessing the degree of
gene flow and reproductive isolation, which can be
assessed by population genetics approach using neutral
markers.
Our study combines population genetics and phylo-
genetic approaches over Eurasia, using the EM basidio-
mycete Laccaria amethystina as a model. Mature
dikaryotic individuals of L. amethystina arise from
mating without nuclear fusion between two different
haploids (because of two self-incompatibility genes;
Niculita-Hirzel et al. 2008). Haploids are transient and
arise by germination of small wind-dispersed meiotic
spores that are produced in fleshy fruitbodies. The
sequenced genome of the related L. bicolor (Martin et al.
2008) recently offered the first full genomic resources
for an EM basidiomycete. Although populations of
L. bicolor have been studied at local scales (e.g. Selosse
et al. 1997, 1998), this species rarely forms fruitbodies in
natural forests. Conversely, the Eurasian L. amethystina
fruits abundantly and forms locally abundant small
genets in Europe (Gherbi et al. 1999; Fiore-Donno &
Martin 2001) and Japan (Wadud 2007). Roy et al. (2008)
� 2011 Blackwell Publishing Ltd

EURASIAN POPULATI ON GE NETICS OF LACCARIA A METHYSTINA 3
showed it to be multihost and did not detect any signif-
icant genetic differentiation of L. amethystina over
450 km in France, suggesting that only larger-scale
studies could reveal IBD. Conversely, limited portability
of microsatellites between Europe and Japan suggests a
possible differentiation at this distance (Donges et al.
2008; Roy et al. 2008).
Here we tested the null hypotheses that distant popu-
lations of L. amethystina morphospecies form a single
biological species with few or no spatial structure over
Eurasia. To investigate the genetic structure at two
scales (103 and 104 km), we designed new markers at
microsatellite (neutral) and coding (likely non-neutral)
loci. Together with previously defined markers, they
revealed gene flow in L. amethystina all over Europe
but demonstrated strong differentiation between Euro-
pean and Japanese populations, questioning their con-
specificity. Based on these results, we discuss gene flow
and speciation for EM basidiomycete at the continental
scale.
Materials and methods
Sampling and DNA extraction
Five hundred and nineteen fruitbodies of Laccaria ame-
thystina were collected in the autumn of 2007 and 2008
from 16 European localities, with a maximum distance
of 2900 km between any two sites (Fig. 1a; Table 1). In
Japan, 36 and 35 fruitbodies were collected on Mount
Fuji in 2008 and on Mount Tokachi in 2009, respec-
tively. These two sites are located 960 km apart
(Fig. 1b). We reused 58 fruitbodies of two French popu-
(a)
Fig. 1 The 18 sampling sites in Europe (a), covering a maximal dista
(b), covering a distance of 960 km. (Sco), Kirkhill, Scotland; (Eng), Ne
France; (Bel), Boisfort, Belgium; (FrO), Orry-la-Ville, France; (FrL), Ly
many; (GeGS), Gut Sunder, Germany; (Aus), Rotwald, Austria; (Pol
fstrom, Sweden; (Fin), Ruissalo, Finland; (Est), Jarvselja, Estonia; (JaM
� 2011 Blackwell Publishing Ltd
lations from a previous study (FrO and FrB are respec-
tively populations Ba and Bbq from Roy et al. 2008). In
all, 667 fruitbodies were used (Table 1). As average
genet diameter found in previous studies was £1.2 m
(Gherbi et al. 1999; Fiore-Donno & Martin 2001; Wadud
2007), fruitbodies were collected in £300 · 300 m plots,
at >1.5 m distance intervals to avoid redundant sam-
pling of the same genet. Fruitbodies were dried and
stored at )20 �C upon arrival at the laboratory. DNA
was extracted as in the study by Roy et al. (2008). We
initially intended to collect populations evenly over
Eurasia, but scarce fructifications in Eastern Europe and
Central Asia from 2007 to 2009 prevented sampling.
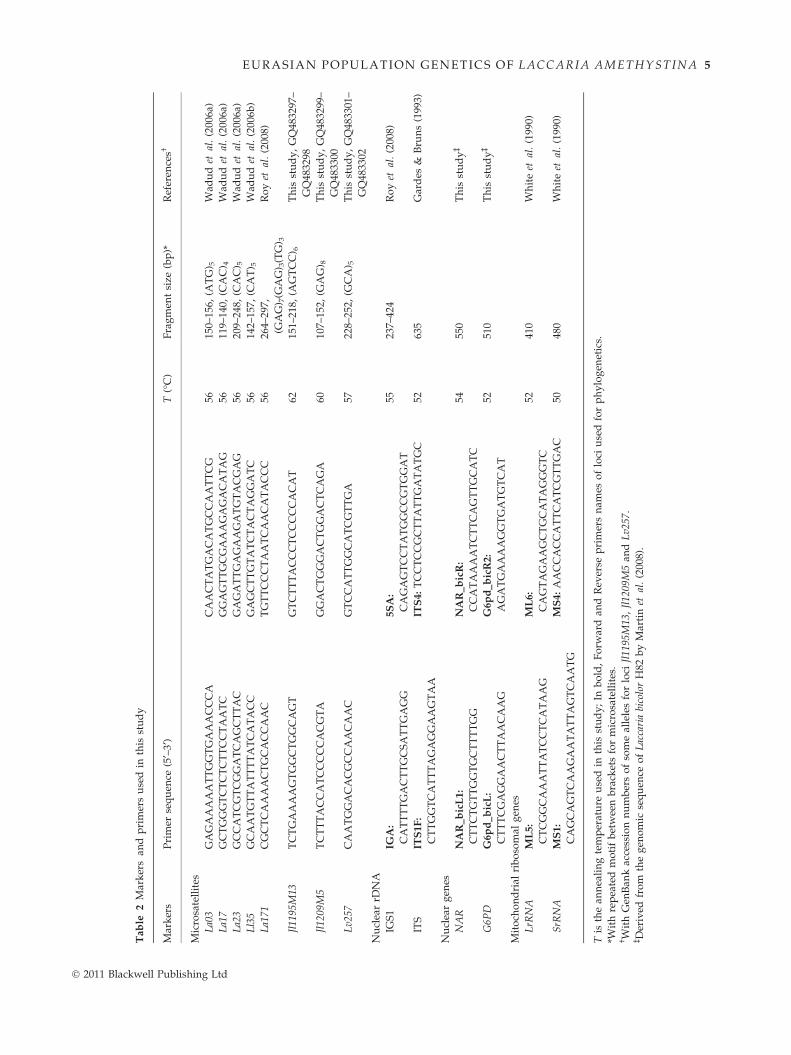
Markers for population genetics
Eight microsatellite markers and one rDNA intergenic
spacer, IGS1 (Martin et al. 1999), were used to address
population genetic structure of L. amethystina (Table 2).
Four microsatellites (La03, La17, La23, and Ll35) were
previously published by Wadud et al. (2006a,b), and
La171 and IGS1 were designed by Roy et al. (2008;
La115 was not used because of frequent amplification
problems mentioned in the former paper). We used the
L. bicolor genome sequence (Martin et al. 2008) to find
additional microsatellites portable to L. amethystina.
Microsatellite repetition motifs were detected in the
L. bicolor genome (http://genome.jgi-psf.org/Lacbi2/
Lacbi2.home.html) using MAGELLAN 1.1 software as in
Labbe et al. (2008). Primers were designed with the
online tool PRIMER3 (http://frodo.wi.mit.edu/primer3/).
Each candidate locus was also verified by BLAST for
occurrence as a single copy in the L. bicolor genome.
(b)
nce of 2900 km from Spain (Sp) to Finland (Fin), and in Japan
wton Common, England; (Sp), Guipuscoa, Spain; (FrB), Belleme,
on, France; (CH), Eschenbach, Switzerland; GeF), Freising, Ger-
), Łopuch�owka, Poland; (Den), Østerild, Denmark; (Swe), Olo-
F), Mount Fuji, Japan; (JaMT), Mount Tokachi, Japan.

Table 1 Geographical and forest characteristics of the 18 sampled sites
Population Locality Site location n Overstorey trees
Age of the
forest (years)*
Sco Scotland Kirkhill (57�21¢30¢¢N; 2�46¢47¢¢W) 41 Fagus sylvatica, Larix decidua 150–200
Eng England Newtown Common (51�25¢47¢¢N; 1�26¢30¢¢W) 40 Betula pendula, Quercus robur 50–100
Sp Spain Guipuscoa (43�07¢16¢¢N; 2�15¢38¢¢W) 38 Fagus sylvatica 120–150
FrB† France Belleme (48�22¢36¢¢N; 0�33¢35¢¢E) 26 Abies alba 30–80
Bel Belgium Boisfort (50�49¢43¢¢N; 4�18¢26¢¢E) 46 Fagus sylvatica 250
FrO† France Orry-la-Ville (49�07¢56¢¢N; 2�30¢48¢¢E) 32 Carpinus betulus, Quercus robur 20–50
FrL France Lyon (45�45¢04¢¢N; 4�46¢60¢¢E) 40 Quercus robur, Carpinus betulus 25–50
CH Switzerland Eschenbach (47�09¢24¢¢N; 8�12¢53¢¢E) 43 Picea abies 20–80
GeF Germany Freising (48�29¢52¢¢N; 11�34¢22¢¢E) 36 Fagus sylvatica, Picea abies 60–80
GeGS Germany Gut Sunder (52�43¢60¢¢N; 9�49¢00¢¢E) 44 Fagus sylvatica, Pseudotsuga
menziesii
30–40
Aus Austria Rotwald (47�47¢01¢¢N; 15�03¢29¢¢E) 15 Fagus sylvatica, Picea abies >150
Pol Poland Łopuch�owka (50�17¢25¢¢N; 22�58¢13¢¢E) 39 Larix decidua, Fagus sylvatica 80–110
Den Denmark Østerild (57�09¢34¢¢N; 8�43¢53¢¢E) 37 Fagus sylvatica, Picea abies 40–60
Swe Sweden Olofstrom (56�20¢29¢¢N; 14�26¢06¢¢E) 41 Fagus sylvatica 80
Fin Finland Ruissalo (60�31¢03¢¢N; 22�10¢17¢¢E) 32 Quercus petraea, Corylus avellana 200–400
Est Estonia Jarvselja (58�18¢52¢¢N; 27�15¢23¢¢E) 37 Picea abies, Tilia cordata, Populus tremula 80–100
JapMF Japan Mount Fuji (35�20¢24¢¢N; 138�47¢55¢¢E) 36 Salix reinii <300
JapMT Japan Mount Tokachi (43�27¢31¢¢N; 142�38¢62¢¢E) 35 Salix bakko mainly <90‡
n, number of genotyped fruitbodies.
*Age of oldest individuals for the most common tree species.†FrB, FrO: respectively, Ba and Bbq populations from the study by Roy et al. (2008).‡Sparsely established vegetation patches, established after the last big Mount Tokachi eruption in 1926.
4 L. VINCENOT ET AL.
Reproducible amplification was tested with nonfluores-
cent primers with an annealing temperature gradient
from 50 to 65 �C, on a set of four L. bicolor and eight
European L. amethystina specimens. The presence of
single bands of the expected size was checked on aga-
rose gels. Then, polymorphism in L. amethystina was
examined in 32 European specimens of L. amethystina,
with fluorescent-labelled primers for loci that survived
the initial screening. Of 233 microsatellite loci tested,
only three were portable to L. amethystina and appeared
polymorphic enough (Jl1195M13, Jl1209M5, Lv257;
Table 2). For genotyping, microsatellite loci and IGS1
were amplified as in Roy et al. (2008; annealing temper-
atures are in Table 2). Detection of amplified fragments
was carried out on an ABI PRISM 3130 XL Genetic ana-
lyser (Applied Biosystems, Courtaboeuf, France). Frag-
ment sizes were analysed with GENEMAPPER 3.7 (Applied
Biosystems), using default parameters for microsatellite
analysis. Of 667 genotyped specimens (Data S1, Sup-
porting information), 12 failed to be amplified for at
least two loci and were omitted from further analyses.
Data analysis for population genetics
Allelic frequencies, departure from Hardy–Weinberg
equilibrium, expected and observed heterozygosities
(HE, HO) as well as linkage between loci were calculated
with GENEPOP’007 (Rousset 2008). To assess the discrimi-
nation power of the genetic markers, the probability of
random occurrence was calculated for each genotype
based on allelic frequencies considering all available
fruitbodies and assuming independence between loci,
as in the study by Bergemann & Miller (2002). A corre-
spondence factorial analysis (CFA) using multilocus
genotype data was performed with GENETIX4.05.2
(http://kimura.univ-montp2.fr/genetix/) to detect Wa-
hlund effects within each population. The presence of
null alleles was tested for each locus using Microcheck-
er (Van Oosterhout et al. 2004). Wright indices (FIS, FST)
were calculated with GENEPOP’007. Selfing rates (s) were
evaluated based on FIS (2 FIS ⁄ (1 + FIS)) or using RMES
software (David et al. 2007), which estimates s from the
correlation of heterozygosity between different loci,
independently of FIS and of other technical biases such
as the presence of null alleles.
To detect IBD, correlations between genetic distances
(FST ⁄ (1)FST)) and geographical distances were calcu-
lated by use of Mantel tests as implemented in GENE-
POP’007, with 10 000 permutations. Similarly, Mantel tests
were performed to assess the relationship between
genetic distances and each of the following factors: lati-
tude, longitude, altitude, temperature and precipitations
(climatic data from WorldClim; Hijmans et al. 2005).
These Mantel tests were performed over (i) Europe,
� 2011 Blackwell Publishing Ltd
Ta
ble
2M
ark
ers
and
pri
mer
su
sed
inth
isst
ud
y
Mar
ker
sP
rim
erse
qu
ence
(5¢–
3¢)
T(�
C)
Fra
gm
ent
size
(bp
)*R
efer
ence
s†
Mic
rosa
tell
ites
La0
3G
AG
AA
AA
AT
TG
GT
GA
AA
CC
CA
CA
AC
TA
TG
AC
AT
GC
CA
AT
TC
G56
150–
156,
(AT
G) 5
Wad
ud
etal
.(2
006a
)
La1
7G
CT
GG
GT
CT
CT
CT
TC
CT
AA
TC
GG
AG
TT
GC
GA
AA
GA
GA
CA
TA
G56
119–
140,
(CA
C) 4
Wad
ud
etal
.(2
006a
)
La2
3G
CC
AT
CG
TC
GG
AT
CA
GC
TT
AC
GA
GA
TT
GA
GA
AG
AT
GT
AC
GA
G56
209–
248,
(CA
C) 5
Wad
ud
etal
.(2
006a
)
Ll3
5G
CA
AT
GT
TA
TT
TT
AT
CA
TA
CC
GA
GC
TT
GT
AT
CT
AC
TA
GG
AT
C56
142–
157,
(CA
T) 5
Wad
ud
etal
.(2
006b
)
La1
71C
GC
TC
AA
AA
CT
GC
AC
CA
AC
TG
TT
CC
CT
AA
TC
AA
CA
TA
CC
C56
264–
297,
(GA
G) 7
(GA
G) 3
(TG
) 3
Ro
yet
al.
(200
8)
Jl11
95M
13T
CT
GA
AA
AG
TG
GC
TG
GC
AG
TG
TC
TT
TA
CC
CT
CC
CC
CA
CA
T62
151–
218,
(AG
TC
C) 6
Th
isst
ud
y,
GQ
4832
97–
GQ
4832
98
Jl12
09M
5T
CT
TT
AC
CA
TC
CC
CC
AC
GT
AG
GA
CT
GG
GA
CT
GG
AC
TC
AG
A60
107–
152,
(GA
G) 8
Th
isst
ud
y,
GQ
4832
99–
GQ
4833
00
Lv2
57C
AA
TG
GA
CA
CG
CC
AA
CA
AC
GT
CC
AT
TG
GC
AT
CG
TT
GA
5722
8–25
2,(G
CA
) 5T
his
stu
dy
,G
Q48
3301
–
GQ
4833
02
Nu
clea
rrD
NA
IGS
1IG
A:
CA
TT
TT
GA
CT
TG
CS
AT
TG
AG
G
5S
A:
CA
GA
GT
CC
TA
TG
GC
CG
TG
GA
T
5523
7–42
4R
oy
etal
.(2
008)
ITS
ITS
1F
:
CT
TG
GT
CA
TT
TA
GA
GG
AA
GT
AA
ITS
4:
TC
CT
CC
GC
TT
AT
TG
AT
AT
GC
5263
5G
ard
es&
Bru
ns
(199
3)
Nu
clea
rg
enes
NA
RN
AR
_b
icL
1:
CT
TC
TG
TT
GG
TG
CT
TT
TG
G
NA
R_
bic
R:
CC
AT
AA
AA
TC
TT
CA
GT
TG
CA
TC
5455
0T
his
stu
dy
‡
G6P
DG
6p
d_
bic
L:
CT
TT
CG
AG
GA
AC
TT
AA
CA
AG
G6
pd
_b
icR
2:
AG
AT
GA
AA
AG
GT
GA
TG
TC
AT
5251
0T
his
stu
dy
‡
Mit
och
on
dri
alri
bo
som
alg
enes
LrR
NA
ML
5:
CT
CG
GC
AA
AT
TA
TC
CT
CA
TA
AG
ML
6:
CA
GT
AG
AA
GC
TG
CA
TA
GG
GT
C
5241
0W
hit
eet
al.
(199
0)
SrR
NA
MS
1:
CA
GC
AG
TC
AA
GA
AT
AT
TA
GT
CA
AT
G
MS
4:
AA
CC
AC
CA
TT
CA
TC
GT
TG
AC
5048
0W
hit
eet
al.
(199
0)
Tis
the
ann
eali
ng
tem
per
atu
reu
sed
inth
isst
ud
y;
Inb
old
,F
orw
ard
and
Rev
erse
pri
mer
sn
ames
of
loci
use
dfo
rp
hy
log
enet
ics.
*Wit
hre
pea
ted
mo
tif
bet
wee
nb
rack
ets
for
mic
rosa
tell
ites
.†W
ith
Gen
Ban
kac
cess
ion
nu
mb
ers
of
som
eal
lele
sfo
rlo
ciJl
1195
M13
,Jl
1209
M5
and
Lv2
57.
‡D
eriv
edfr
om
the
gen
om
icse
qu
ence
of
Lac
cari
abi
colo
rH
82b
yM
arti
net
al.
(200
8).
EURASIAN POPULATI ON GE NETICS OF LACCARIA A METHYSTINA 5
� 2011 Blackwell Publishing Ltd

6 L. VINCENOT ET AL.
including 16 European populations, and (ii) Eurasia, by
adding two Japanese populations to the European pop-
ulations. In both cases, we performed CFA on popula-
tions to detect Wahlund effects as described earlier.
Population structure was also analysed by using GENE-
LAND (Guillot et al. 2008) and STRUCTURE 2.2 (Pritchard
et al. 2000, http://pritch.bsd.uchicago.edu/struc-
ture.html) with the number of initial clusters ranging
from K = 1 to 16 (or 18 for the Eurasian level) and
10 000 iterations. For the cluster analysis with STRUCTURE
2.2, we tested four possible a priori parameter sets
(ancestry model with or without admixture, associated
with allelic frequencies correlated or independent) and
found them to have no effect on the number of a poste-
riori detected clusters if K ‡ 2 (not shown). The amount
of genetic variance between European and Japanese
populations was analysed by AMOVA (10 000 permuta-
tions) as implemented in ARLEQUIN 3.5 (Excoffier &
Lischer 2010).
Sequencing of non-neutral loci for phylogeneticanalysis
Coding (or transcribed) genes were amplified from 35
L. amethystina specimens, i.e. one or two samples for
each investigated population, plus one sample from the
Ukraine and one from Belarus (no exact location was
provided by the samplers). We also included three
specimens of L. bicolor from France and one from Ser-
bia, and a single specimen of each of the following spe-
cies: L. amethysteo-occidentalis, L. laccata, L. anglica
[PAM0090406], L. scotica [PAM0010112], L. proxima
[PAM01102104], L. moelleri [PAM97090101], L. macrocys-
tidiata [PAM99082801], L. oblongispora [PAM01042805]
(numbers between brackets are accessions in the Herbi-
er de Botanique at the Universite de Lille). For these 45
samples, we tentatively sequenced five loci: the partly
transcribed ITS region of nuclear ribosomal DNA, two
transcribed mitochondrial ribosomal genes (for large
and small subunits, LrRNA and SrRNA, respectively),
and two nuclear coding genes for glucose-6-phosphate
dehydrogenase (G6PD) and nitrate reductase (NAR; see
primers in Table 2). PCR conditions included an initial
denaturation at 95 �C for 5 min, followed by 30 cycles
of denaturation at 94 �C for 30 s, annealing (tempera-
tures on Table 2) for 60 s and extension at 72 �C for
45 s, with a final extension at 72 �C for 10 min.
Sequences were obtained from both strands using
the PCR primers (Table 2), and were manually cor-
rected and aligned using the software SEQSCAPE 2.6
(Applied Biosystems). Corrected sequences were depos-
ited in GenBank (accessions GQ406389–GQ406568 and
HQ896282–HQ896286, Data S2, Supporting information).
Phylogenetic analyses
Phylogenetic analyses were conducted using maxi-
mum-likelihood (ML) and Bayesian methods, by use of
PHYML 3.0 (Guindon & Gascuel 2003) and MRBAYES
3.1.2 (Ronquist & Huelsenbeck 2003), respectively.
Related sequences for each locus (ITS, G6PD, NAR and
mitochondrial LrRNA and SrRNA) were retrieved from
UNITE (Abarenkov et al. 2010) and GenBank databases,
which included sequences of L. bicolor genome (http://
genome.jgi-psf.org/Lacbi2/Lacbi2.home.html). The best
evolutionary model was determined by hierarchical
likelihood ratio tests using PAUP*4.0b (Swofford 2002)
and MRMODELEST 2.3 (Nylander 2004). In the Bayesian
analyses, gaps were treated as (i) missing data or (ii)
presence ⁄ absence of indels (only the first option was
used in PHYML). Analyses were first performed on each
locus separately (for all loci, ML and both Bayesian
analyses provided the same topologies, thus only
Bayesian trees generated from alignments without gaps
are presented here). We built a supermatrix concatenat-
ing the informative loci for all samples, but. We
excluded the two mitochondrial loci, which carried
negligible phylogenetic information, and samples for
which not all nuclear sequences were available. This
supermatrix thus concatenated three nuclear sequences
for 28 samples that were analysed in MRBAYES 3, as
above.
Coalescence test
We tested for migration events between European and
Japanese populations on the basis of each nuclear
sequence sets (ITS, NAR and G6PD) using the program
MDIV (Nielsen & Wakeley 2001). MDIV uses a Markov
Chain Monte Carlo coalescent-based approach to esti-
mate the migration rate M ⁄ 2 (i.e. the mean number of
migrants per generation), the scaled divergence time
T = t ⁄ Ne (where t is the divergence time in generations
and Ne, the effective population size) and the scaled
migration rate H = Ne · M. MDIV was run under the
HKY model of sequence evolution. Starting parameters
were adjusted by a first short run (2.106 Markov chain
generations plus 5.105 as a burn-in), and the program
was then run again with longer chains (107 generations,
5.106 as a burn-in).
Results
Genetic diversity and inbreeding within populations
All nine microsatellite markers were polymorphic in
Europe, with 3–12 alleles per locus, each one never
� 2011 Blackwell Publishing Ltd

Ta
ble
3A
llel
icri
chn
ess,
gen
oty
pic
div
ersi
ty,
exp
ecte
dan
do
bse
rved
het
ero
zyg
osi
ties
and
inb
reed
ing
wit
hin
the
16E
uro
pea
nan
dtw
oJa
pan
ese
po
pu
lati
on
s
Po
pu
lati
on
n**
All
elic
rich
nes
so
flo
ci*
Het
ero
zyg
osi
ties
†F
ISb
ased
on
sm
odo
Dav
idet
al.
(200
7)§
sb
ased
on
FIS
–
IGS
1Jl
1195
M13
Jl12
09M
5L
a03
La1
7L
a23
La1
71L
l35
Lv2
57T
ota
lH
EH
O9
loci
4lo
ci‡
9lo
ci4
loci
‡
Sco
41(4
0)4
43
13
39
33
290.
460.
330.
280.
040.
040.
440.
08E
ng
40(4
0)4
53
24
410
22
320.
430.
270.
380.
150.
190.
550.
26S
p38
(38)
7(1
)4
(1)
31
33
102
336
(2)
0.47
0.33
0.29
)0.
050.
020.
45—
FrB
26(2
2)5
33
34
37
32
280.
480.
260.
470.
210.
020.
640.
35B
el46
(46)
7(2
)6
(1)
32
4(1
)3
92
238
(4)
0.47
0.35
0.27
)0.
080.
180.
42—
FrO
32(3
2)3
4(1
)3
24
38
3(1
)2
32(2
)0.
470.
240.
49)
0.04
0.01
0.66
—F
rL40
(40)
53
43
5(1
)4
(1)
92
237
(2)
0.44
0.30
0.33
0.16
0.02
0.49
0.28
CH
43(4
2)4
33
23
38
23
270.
410.
270.
340.
090.
020.
510.
17G
eF36
(36)
43
5(1
)2
33
(1)
82
232
(2)
0.41
0.29
0.29
0.09
0.20
0.45
0.16
GeG
S44
(44)
53
32
33
72
225
0.43
0.32
0.25
0.03
0.06
0.41
0.05
Au
s15
(15)
23
22
34
73
226
0.39
0.27
0.33
0.32
0.02
0.49
0.49
Po
l39
(39)
53
42
43
112
231
0.45
0.32
0.29
0.08
0.10
0.46
0.15
Den
37(3
7)5
33
23
39
3(1
)3
34(1
)0.
410.
310.
260.
080.
070.
410.
16S
we
41(4
1)4
5(1
)2
23
310
23
34(1
)0.
410.
340.
18)
0.09
0.02
0.31
—F
in32
(31)
52
22
33
61
221
0.42
0.33
0.21
0.10
0.01
0.35
0.19
Est
37(3
5)4
22
13
310
23
260.
360.
250.
290.
020.
270.
450.
04A
llE
uro
pe
587
(570
)9
(3)
10(4
)6
(1)
36
(2)
7(2
)12
5(2
)4
62(1
4)0.
430.
290.
310.
070.
080.
470.
20Ja
pM
F36
(36)
410
(4)
41
54
6(2
)3
137
(6)
0.45
0.39
0.13
0.05
0.27
0.23
0.09
Jap
MT
32(3
2)4
44
15
34
31
290.
430.
360.
12)
0.12
0.16
0.21
—A
llJa
pan
*71
(71)
4((
4))
10((
4))
41
5((
1))
4((
1))
6((
2))
3((
2))
137
((14
))0.
460.
38)
0.04
)0.
020.
23—
—
*Bet
wee
nb
rack
ets,
nu
mb
ero
fp
riv
ate
alle
les
wit
hin
the
po
pu
lati
on
;b
etw
een
do
ub
leb
rack
ets,
nu
mb
ero
fp
riv
ate
alle
les
of
the
two
Jap
anes
ep
op
ula
tio
ns
vs.
all
Eu
rop
ean
po
pu
lati
on
s.†H
Ean
dH
Oar
ere
spec
tiv
ely
the
exp
ecte
dan
do
bse
rved
het
ero
zyg
osi
ties
wit
hin
po
pu
lati
on
s.A
llH
Od
iffe
rv
ery
sig
nifi
can
tly
fro
mH
E(P
<0.
0001
,ex
cep
tfo
rA
us:
P=
0.00
2).
‡U
sin
gth
esu
bse
to
ffo
ur
loci
(un
bia
sed
loci
)th
atd
on
ot
sig
nifi
can
tly
dep
art
fro
mH
ard
y–W
ein
ber
geq
uil
ibri
um
inE
uro
pea
np
op
ula
tio
ns
(IG
S1,
La0
3,L
a23,
and
Lv2
57).
§S
elfi
ng
rate
ss
calc
ula
ted
wit
hth
eso
ftw
are
RM
ES
(Dav
idet
al.
2007
;n
ose
nsi
tiv
ity
ton
ull
alle
les)
.–S
elfi
ng
rate
sb
ased
on
FIS
=s
⁄(2)
s),
ifF
IS>
0.**
Nu
mb
ero
ffr
uit
bo
die
sin
ves
tig
ated
and
,b
etw
een
bra
cket
s,n
um
ber
of
dis
tin
ctg
eno
typ
esfo
un
d.
EURASIAN POPULATI ON GE NETICS OF LACCARIA A METHYSTINA 7
� 2011 Blackwell Publishing Ltd

pu
lati
on
s
lF
rOF
rLC
HG
eFG
eGS
Au
sP
ol
Den
Sw
eF
inE
stJa
pM
FJa
pM
T
.032
0.04
00.
054
0.06
30.
100
0.06
60.
071
0.05
50.
054
0.04
70.1
17
0.08
50.4
30
0.4
16
.001
0.01
90.
015
0.02
60.
046
0.03
60.
027
0.02
90.
020
0.00
90.
077
0.02
90.4
30
0.4
21
.002
0.03
30.
027
0.04
10.
033
0.06
10.
034
0.02
40.
028
0.03
10.
065
0.04
60.4
16
0.4
00
.039
0.03
90.
060
0.05
40.
078
0.1
00
0.06
00.
025
0.04
30.
053
0.1
34
0.1
10
0.4
00
0.3
92
0.02
90.
020
0.03
00.
041
0.05
30.
032
0.01
90.
009
0.02
20.
063
0.04
70.3
99
0.3
90
.022
—0.
024
0.01
70.
039
0.03
50.
019
0.00
70.
030
0.01
70.1
11
0.04
00.4
02
0.3
88
.009
0.01
6—
0.00
60.
011
0.04
90.
034
0.02
10.
013
0.02
00.
039
0.03
70.4
00
0.3
84
.003
)0.
006
)0.
002
—0.
013
0.06
80.
003
0.00
60.
010
0.01
50.
070
0.02
40.4
28
0.4
11
.021
0.04
10.
018
0.02
5—
0.05
80.
013
0.01
80.
034
0.03
00.
041
0.01
90.4
12
0.3
95
.045
0.02
00.
038
0.02
60.
010
—0.
057
0.05
40.
079
0.02
70.
094
0.06
50.4
23
0.4
16
.017
0.00
90.
012
0.00
3)
0.01
5)
0.00
6—
0.00
50.
030
0.01
90.
083
0.01
00.4
17
0.3
97
.029
0.00
30.
025
0.00
60.
027
0.02
2)
0.00
2—
0.00
90.
020
0.07
90.
036
0.4
01
0.3
83
.003
0.00
4)
0.00
1)
0.00
60.
041
0.04
80.
026
0.00
9—
0.01
70.
076
0.03
70.4
32
0.4
14
.024
)0.
002
0.01
60.
005
0.03
90.
013
0.01
80.
027
0.02
0—
0.08
40.
019
0.4
48
0.4
35
.057
0.1
46
0.05
40.1
02
0.05
00.1
18
0.07
70.1
18
0.1
02
0.1
38
—0.
079
0.3
93
0.3
74
.003
0.02
20.
003
0.00
6)
0.00
50.
018
)0.
010
0.02
20.
021
0.02
20.
060
—0.4
66
0.4
43
.497
0.5
55
0.4
92
0.5
13
0.5
11
0.5
35
0.5
41
0.5
19
0.5
24
0.5
63
0.4
89
0.5
30
—0.
041
.559
0.6
17
0.5
55
0.5
77
0.5
79
0.5
94
0.6
15
0.5
79
0.5
79
0.6
19
0.5
44
0.5
97
0.00
5—
dia
go
nal
,in
gre
y,
FS
Tca
lcu
late
dw
ith
fou
rlo
cisu
pp
ort
ing
Har
dy
–Wei
nb
erg
equ
ilib
riu
m;
inb
old
,F
ST
val
ues
sho
win
g
5%,
P=
0.05
).
8 L. VINCENOT ET AL.
exceeding 0.89 in frequency (Table 3). The allelic rich-
ness differed in the Japanese populations: La03 and
Lv257 were monomorphic (Table 3), La171 failed to
amplify in some fruitbodies, while the six remaining
loci showed 3–10 alleles per locus. We found a high
diversity within populations, with 646 multilocus geno-
types of 655 successfully typed fruitbodies. All popula-
tions showed a tendency to heterozygote deficiency
(Table 3), which was significant in more than half of
the populations for the five loci Jl1195M13, Jl1209M5,
La17, La171 and Ll35. However, the populations did not
significantly deviate from Hardy–Weinberg equilibrium
for the four other loci, La03, La23, Lv257 and IGS1
(which is unlikely to provide null alleles). This discrep-
ancy suggests that null alleles occurred for Jl1195M13,
Jl1209M5, La17, La171 and Ll35. As no null homozygote
was found in these five loci (except for La171 in Japan),
null allele frequencies were probably low, which was
confirmed by Microchecker analysis (not shown). FIS
values were high when using the nine loci (Table 3),
but decreased when the analyses were restricted to the
four loci supporting Hardy–Weinberg equilibrium
(hereafter ‘unbiased loci’): they ranged from )0.09 to
0.32 in Europe and from )0.12 to 0.05 in Japan. Selfing
rates, based on FIS values in the four unbiased loci, var-
ied from null (nonsignificant excess of heterozygotes in
some populations) to 0.49. Using the RMES method, the
estimated selfing rates were lower, but still variable
among populations (0.008–0.267; Table 3). The selfing
rates estimated with RMES did not correlate with those
estimated from FIS values, and none of the selfing rates
correlated with forest age (not shown). After Bonferroni
corrections for multiple comparisons, no significant
linkage disequilibrium between pairs of markers was
found, either within populations in Europe or in Japan,
or over Europe (not shown). Thus, in spite of some
inbreeding, sexual recombination was predominant
within Laccaria amethystina populations.
Tab
le4
Gen
etic
dif
fere
nti
atio
nb
etw
een
pai
rso
fp
o
Po
pu
lati
on
Sco
En
gS
pF
rBB
e
Sco
—0.
024
0.05
70.
053
0
En
g0.
032
—0.
014
0.06
30
Sp
0.07
00.
006
—0.
041
0
FrB
0.04
30.
039
0.07
7—
0
Bel
0.03
00.
007
0.00
30.
041
—
FrO
0.05
10.
013
0.04
3)
0.00
60
FrL
0.03
00.
007
0.00
30.
033
)0
CH
0.03
40.
001
0.02
00.
006
0
GeF
0.1
04
0.02
40.
010
0.07
50
GeG
S0.1
17
0.03
90.
033
0.05
30
Au
s0.
089
0.01
30.
020
0.03
20
Po
l0.
061
0.03
30.
046
0.00
10
Den
0.01
30.
006
0.02
60.
005
0
Sw
e0.
070
0.01
10.
027
0.02
40
Fin
0.1
35
0.08
20.
044
0.1
74
0
Est
0.07
20.
001
0.00
10.
053
0
Jap
MF
0.5
57
0.5
35
0.5
42
0.5
58
0
Jap
MT
0.6
02
0.5
99
0.5
93
0.6
16
0
Up
per
dia
go
nal
,F
ST
calc
ula
ted
wit
hn
ine
loci
;lo
wer
sig
nifi
can
td
iffe
ren
tiat
ion
bet
wee
np
op
ula
tio
ns
(CI
9
Population structure over EuropeFST values between pairs of populations in Europe ran-
ged from 0.001 to 0.134, with a mean FST value of 0.041
over all loci (Table 4). Among 120 pairwise FST, 82 were
lower than 0.05, and only five showed a significant dif-
ferentiation (CI: 95% with Bonferroni correction,
a = 0.05). Using the four unbiased loci, the mean FST
value decreased to 0.032, while FST values between
pairs of populations were more variable, ranging from
)0.015 to 0.174 (Table 4). Although FST values for the
Finnish population were relatively high compared with
eight other European populations based on the unbi-
ased loci (Table 4), no genetic structure appeared
among European populations. Congruently, a Mantel
� 2011 Blackwell Publishing Ltd

R² = 0.098
0.00
0.02
0.04
0.06
0.08
0.10
0.12
0.14
0.16
0.18
0 500 1000 1500 2000 2500 3000
Geographic distance (km)
R² = 0.951
0.00
0.10
0.20
0.30
0.40
0.50
0.60
0.70
0.80
0.90
0 2000 4000 6000 8000 10000
F ST/
(1 –
FST
)F S
T/(1
– F
ST)
Geographic distance (km)
*
(a)
(b)
Fig. 2 Mantel tests showing correlation between genetic and
geographical Euclidian distances (d, in km) for Laccaria amethy-
stina populations. In Europe (a), FST ⁄ (1)FST) = 0.02 + 1.59 ·10)5 d. For European plus Japanese populations (b),
FST ⁄ (1)FST) = )0.05 + 8.38 · 10)5 d. The dashed line with aster-
isk in (b) extrapolates the regression line inferred for European
populations.
EURASIAN POPULATI ON GE NETICS OF LACCARIA A METHYSTINA 9
test comparing geographical distances and genetic dif-
ferentiation revealed that IBD was only marginally sig-
nificant (R2 = 0.098, P = 0.056; Fig. 2a). Genetic distance
between populations did not significantly correlate with
latitude, longitude, elevation or climatic factors such as
mean annual temperature and precipitations (not
shown). CFA revealed that there was no obvious geo-
graphical pattern among 16 European populations
(Fig. 3a). The cluster analysis with the program STRUC-
TURE suggested that whichever be the prerequisites on
ancestry model and allelic frequencies, a single popula-
tion over Europe was the most likely scenario (Fig. S1,
Supporting information). In addition, five repeated runs
of GENELAND supported the single population hypothesis
with a maximum a posteriori estimate (not shown).
Thus, there was no clear IBD over 2900 km among
European L. amethystina populations.
Population structure between Europe and Japan
The two Japanese populations were genetically similar
to each other (FST = 0.04 on nine loci), suggesting lim-
ited IBD over 960 km in Japan. Whereas only seven of
the 16 European populations harboured private alleles
� 2011 Blackwell Publishing Ltd
(at most four per population, with frequencies ranging
up to 0.02), 14 alleles found in at least one Japanese pop-
ulation did not occur in European populations (Table 3)
and their frequencies ranged up to 0.028. Moreover, null
alleles were frequent at locus La171, with 67% and 72%
of null homozygotes in JapMF and JapMT, respectively,
whereas no null homozygote existed in European popu-
lations. AMOVA on all populations showed that 43.1% of
the molecular variance was explained by the differentia-
tion between Europe and Japan (significant at P < 10)5),
whereas differentiation among the 16 European popula-
tions or among the two Japanese populations accounted
for 2.4% of the variance. The differentiation within pop-
ulations explained 54.5% of the molecular variance. FST
values between pairs of Japanese and European popula-
tions (from 0.374 to 0.443) were always consistently
higher than within Europe or within Japan, and the glo-
bal FST between European and Japanese populations
was 0.416 (based on nine loci) or 0.516 (based on the
four unbiased loci; Table 4). A CFA plot clearly distin-
guished a cluster of Japanese populations and another
of European populations, separated on the first axis,
which explained 69.0% of variance (or 78.5% when
using the four unbiased loci; Fig. 3b). The allelic diver-
sity in the Japanese populations was similar to that in
European populations (37 and 29 vs. 30.5 ± 4.8,
mean ± SD). Both STRUCTURE (Fig. S1, Supporting infor-
mation) and GENELAND (data not shown) analyses distin-
guished two clusters, representing respectively all
European populations and the two Japanese popula-
tions. At the Eurasian scale, the Mantel test revealed a
highly significant correlation between geographical and
genetic distances (R2 = 0.95, P = 3.10)4; Fig. 2b) that was
driven by the extreme values involving the Japanese
populations. Thus, a strong IBD pattern occurred
between European and Japanese populations.
Molecular phylogeny in the Laccaria amethystinapopulations
ITS sequences of Laccaria spp. were obtained from 49
fruitbodies (including 11 non-L. amethystina; GenBank
accession numbers GQ406458–GQ406468). Two data sets
were analysed: one containing all the sequences from
this study plus 29 sequences from the UNITE database
with robust identifications (Fig. 4) and a larger one con-
taining all available Laccaria ITS, by retrieving all
related sequences from GenBank (138 sequences in all;
Fig. S2, Supporting information). Both data sets
revealed two well-supported L. amethystina clades, one
from Japan and the other from Europe (Fig. 4),
although their phylogenetic position was unresolved
because of polytomy with other Laccaria taxa. A North
American L. amethystina isolate was a putative sister to

(a)
(b)
Fig. 3 Correspondence factorial analy-
sis (CFA) on European and Eurasian
populations. For European populations
(a), the two mains axes 1 and 2 of the
CFA explain 16.5% and 14.5% of the
variation, respectively, for European
plus Japanese populations (b), the two
mains axes 1 and 2 of the CFA explain
69.0% and 4.8% of the variation, respec-
tively.
10 L . V I N C ENO T ET AL.
the Japanese clade (with 89% posterior probabilities in
the Bayesian analysis, Fig. S2, Supporting information).
Nucleotide variations within the ITS region were low in
Europe (at least 99.7% identity between sequences,
indels not taken into account), while Japanese sequences
were 97.5% identical to the European consensus besides
a 12-bp deletion and two (2 and 4 bp) insertions
(Fig. S3, Supporting information). The American
sequence was intermediate between European and Japa-
nese sequences for nucleotide substitutions (98.0% and
99.3% identity to the respective consensus, not consid-
ering indels; Fig. S3, Supporting information).
We obtained 40 NAR sequences (including eight non-
L. amethystina; GQ406531–GQ406540) that formed two
well-supported geographical clusters in a Bayesian anal-
ysis (Fig. 5a). European sequences were >98.2% similar
to each other, but differed by at least 4.7% from the
Japanese consensus. We obtained 34 G6PD sequences
(including 10 from non-L. amethystina; GQ406340,
GQ406413–GQ406416 and GQ406418–GQ406421) that, in
a Bayesian analysis, also supported two geographical
clusters (Fig. 5b). The Japanese L. amethystina and
American L. amethysteo-occidentalis clustered with good
statistical support (posterior probability of the clade:
97%). The European and Japanese L. amethystina
sequences differed by at least 15 point nucleotide sub-
stitutions (including four nonsynonymous mutations),
while the Japanese L. amethystina sequences and North
American L. amethysteo-occidentalis differed by eight
substitutions only (including two nonsynonymous
mutations). Mitochondrial genes for small (Fig. S4a,
Supporting information) and large (Fig. S4b, Support-
ing information) ribosomal subunits showed low vari-
ability and did not separate European and Japanese
sequences. A Bayesian analysis of the nuclear superma-
trix concatenating the three nuclear genes for 28 fruit-
bodies showed that the Japanese L. amethystina clade
was sister to the European clade, both of which formed
a monophyletic clade with North American L. amethys-
teo-occidentalis (Fig. 5c).
The distributions of probabilities for coalescent analy-
sis parameters were coherent for the three nuclear
sequence sets (using the program MDIV; not shown). For
each locus, the migration rate between European and
Japanese L. amethystina populations was estimated to 0,
indicating a complete genetic isolation between these
� 2011 Blackwell Publishing Ltd

Fig. 4 Bayesian phylogram of Laccaria spp. based on ITS sequences (81 taxa, 635 characters; gaps were encoded in a matrix of in-
dels). The best-fit nucleotide evolutionary model was GTR + I (I = 0.52). Dashed lines represent subtrees with posterior probabilities
<97%; only probabilities ‡90% are indicated; outgroups are from the Unite database. ‘Laccaria amethystina (Europe)’ consists of all 35
European sequences from this study, plus seven European sequences from Unite (UDB002418 and UDB000158 from Scotland,
UDB001687, UDB001492, UDB000039, UDB000019 and UDB000006 from Denmark). ‘L. amethystina (Japan)’ includes three Japanese
sequences from this study. ‘L. bicolor H82’ is an American L. bicolor sequence (Martin et al. 2008).
EURASIAN POPULATI ON GE NETICS OF LACCARIA AMETHYSTINA 11
� 2011 Blackwell Publishing Ltd

12 L . V I N C ENO T ET AL.
two populations. The scaled divergence time T was esti-
mated between 5.5 and 8.4 generations ⁄ Ne, but the
effective population size Ne cannot be estimated (see
Discussion). Hence, the divergence time between
European and Japanese L. amethystina could not be esti-
mated. Therefore, a clear divergence between the Euro-
pean and Japanese L. amethystina was found for the
three nuclear loci, in spite of the sister positions of these
geographical clades.
Discussion
Reproductive biology of Laccaria amethystina
Nine neutral markers revealed high local genotypic
diversities within populations: 97–100% of the fruitbod-
ies showed unique genotypes in each population, and
differentiation within populations accounted for 54.5%
of the genetic variance observed. Such intrapopulation
diversity has already been reported in Laccaria amethysti-
na (Gherbi et al. 1999; Fiore-Donno & Martin 2001) and
other basidiomycetes with aerial spore dispersal (Carri-
conde et al. 2008; Engh et al. 2010). Only 16 genotypes
were found more than once (they accounted for a total of
35 fruitbodies). Ten of these genotypes (3.0% of all fruit-
bodies) were found in two different populations and one
in three populations (Est, Eng and Den). Their probability
P of occurrence by chance ranged from 1.3 · 10)6 to
5.8 · 10)4. They are unlikely to represent the same clone,
because meiotic spore dispersal is the only way to
migrate into distant populations. Six other genotypes
(2.3% of all fruitbodies) were found at least twice within
a single population and had P £ 5.2 · 10)4. Although re-
sampling of the same genet within a population remains
possible, we favour that they represent different clones
because (i) their P-value is in the range of the genotypes
repeated in different populations, which are different
clones, and (ii) genet size is smaller than the sampling
distance (see Materials and methods). Anyway, as in the
study by Roy et al. 2008, discarding genetically identical
fruitbodies produced the same conclusions (not shown).
Fig. 5 Unrooted Bayesian phylograms for nuclear genes of Laccari
Dashed lines represent subtrees with posterior probabilities <97%; on
ican L. bicolor sequence (Martin et al. 2008). (a) Phylogram based on
evolutionary model was HKY + c (a = 0.36). ‘Laccaria amethystina (E
and ‘L. amethystina (Japan)’ groups the two Japanese sequences (GQ4
(34 taxa, 511 characters). The best-fit nucleotide evolutionary model
consists of groups of 13 European sequences from Belgium, Denmar
raine (GQ406393, GQ406395, GQ406412, GQ406398, GQ406399, G
GQ406411, respectively) and ‘L. amethystina (Japan)’ groups the two
based on a concatenation of the ITS, NAR and G6PD loci (28 taxa, 1
HKY + I + c (I = 0.74; a = 1.37). ‘L. bicolor’ consists of three sequence
thystina (Europe)’ groups 19 European fruitbodies, while ‘L. amethysti
Most populations displayed positive FIS values, and
all loci showed the same patterns within each popula-
tion. There were thus some heterozygote deficiencies, as
reported by Fiore-Donno & Martin (2001), Wadud et al.
(2006a) and Roy et al. (2008). This could either reflect (i)
a Wahlund effect, (ii) the presence of null alleles, (iii) a
tendency to autogamy, or (iv) any mix of these explana-
tions. No Wahlund effect was detected in CFAs within
populations (data not shown; as in Roy et al. 2008).
Null or preferentially amplified alleles may occur in our
data set, as shown by null homozygotes for locus La171
in Japan, or by the discrepancy between loci that follow
Hardy–Weinberg equilibrium and those that do not.
However, a tendency to inbreeding persisted even
when considering the four loci that did not significantly
depart from Hardy–Weinberg equilibrium. Most impor-
tantly, this tendency was also observed using a method
insensitive to null alleles (RMES; s = 0.01–0.27).
We thus suggest that some inbreeding produced local
heterozygote deficiencies, as described in this species
(Roy et al. 2008) and other basidiomycetes (Douhan
et al. 2011). Abundant aerial fruiting entails massive
emission of meiotic spores, most of which fall within a
few metres around the fruitbody (Li 2005). This may
favour mating among genetically close siblings, because
the tetrapolar incompatibility system in basidiomycetes
allows mating between some meiotic spores from the
same parent, at a rate of 25% (Niculita-Hirzel et al.
2008). Haploid hyphae generated from meiotic spores
near the parent dikaryon may even undergo dikaryon-
monokaryon mating (=di-mon mating), which is typical
for basidiomycetes, including Laccaria spp. (de La Bas-
tide et al. 1995). The level of inbreeding differed among
populations, but, because there was no correlation with
their age, a founder effect is unlikely to contribute. To
explore kinship relationships between genets at the
local scale, it is necessary to sample local populations
over several years, including small genets that may only
be detected on root tips. Beyond this tendency to
inbreeding, the absence of significant linkage disequilib-
rium between loci provides further evidence that
a spp. including European and Japanese Laccaria amethystina.
ly probabilities ‡90% are indicated. ‘L. bicolor H82’ is an Amer-
the NAR locus (42 taxa, 560 characters). The best-fit nucleotide
urope)’ consists of all 28 European sequences from this study
06524 and HQ896584). (b) Phylogram based on the G6PD locus
was K80 + c (a = 0.31). ‘Laccaria amethystina (Europe) subgroup’
k, Estonia, England, Germany, Poland, Spain, Sweden and Uk-
Q406400, GQ406402, GQ406403, GQ406046, GQ406408 and
Japanese sequences (GQ406417 and HQ896283). (c) Phylogram
706 characters). The best-fit nucleotide evolutionary model was
s of L. bicolor (two from France, one from Serbia). ‘Laccaria ame-
na (Japan)’ groups two Japanese fruitbodies.
� 2011 Blackwell Publishing Ltd

(a)
(b)
(c)
EURASIAN POPULATI ON GE NETICS OF LACCARIA AMETHYSTINA 13
� 2011 Blackwell Publishing Ltd

14 L . V I N C ENO T ET AL.
L. amethystina is mainly outcrossing and that recombi-
nation occurs within populations.
Limited geographical structure over Europe
We found very limited genetic differentiation over Europe
(FST values ranging from 0.001 to 0.134) and no IBD
over 2900 km, extending the lack of genetic structure
reported over 450 km in France (Roy et al. 2008). The
northernmost Finnish population showed higher FST
values compared with some European populations, per-
haps because of its low allelic diversity (Table 3). How-
ever, IBD may not account for this observation, because
it had no private alleles and no significant differentia-
tion from its most distant (Spanish) population. Simi-
larly, the low FST value between the two Japanese
populations that were separated by 960 km indicated
very weak IBD. Applying the equation established for
all European populations (Fig. 2a) to the distance
between the two Japanese populations provides an
expected FST value of 0.034, which is close to the
observed value (0.041). The weak IBD in L. amethystina
within Japan and Europe may result from the same
underlying mechanisms and is also reflected in the low
sequence variation within Europe and within Japan for
the five sequenced nuclear loci. Although Japanese data
are congruent with European tendencies, the discussion
below is limited to Europe, given the limited number of
Japanese populations sampled.
The absence of IBD indicates large panmictic L. ame-
thystina populations over 2900 km, with extensive gene
flow in Europe. Another less likely explanation would
be the retention of an ancient polymorphism, without
loss of ancestral alleles because of a very large effective
population size in every European site. Unfortunately,
Ne of L. amethystina remains to be estimated. Private
alleles, which may exist because of local mutations,
remain scarce in Europe (frequencies from 0.01 to 0.02),
and the dominance of the same common alleles in dif-
ferent populations supports quasi-panmixia over Eur-
ope. The abundant meiotic spore production, allowed
by the abundant fruitbody formation, may allow dis-
persal over hundreds of kilometres of at least some
spores by wind, especially by turbulence (Prospero et al.
2005), contributing to frequent gene flow between popu-
lations over large distances. Alternatively, repeated ser-
ies of short- to medium-distance dispersals may finally
build this pattern. Therefore, the heavy local spore rain
and resulting local inbreeding discussed above may be a
by-product of long-distance spore dispersal.
Although previous studies of EM species extended
over <1500 km, they demonstrated some IBD. EM spe-
cies that fruit hypogeously, or do not sporulate, show
IBD over distances of 10–100 km (Jany et al. 2002; Kret-
zer et al. 2005), while EM species dispersed by airborne
spores usually show IBD over distances of 1000 km:
Xu et al. (2008) showed IBD for Tricholoma matsutake
over 1000 km (FST values were similar to those
observed here, but for at least threefold shorter dis-
tances); Bergemann & Miller (2002) detected high IBD
among Russula brevipes populations separated by
1500 km (FST = 0.43, as between Europe and Japan in
this study). Thus, a panmictic population with gene
flow at this 2900-km scale has never before been
described in EM fungi. However, in the EM Tricholoma
‘scalpturatum’ complex, data from a limited number of
fruitbodies showing homogeneity of ITS sequences
(Jargeat et al. 2010) and Inter Simple Sequence Repeats
(ISSR) patterns (Carriconde et al. 2008) in Europe sug-
gest limited IBD over 2000 km. Some saprotrophic bas-
idiomycetes with air-dispersed spores also have low
IBD over Europe, such as Phlebiopsis gigantea (Vainio
et al. 1998) and Serpula lacrymans (Engh et al. 2010), so
this pattern may be soon discovered in some other EM
basidiomycetes.
Several nonexclusive factors may favour the absence
of IBD in European L. amethystina populations.
Although major examples of dispersal over hundreds of
kilometres for microbial species imply single-step or
gradual wind dispersal of propagules (Brown & Hov-
møller 2002; Prospero et al. 2005), anthropogenic dis-
persal may cover longer distances than airstreams. For
L. amethystina, anthropogenic dispersal (e.g. by way of
nursery trees) seems improbable in Europe, where this
species occurs in ancient natural forests rather than in
nurseries or early successional environments. Spontane-
ous aerial, gradual and multidirectional dispersal of
meiotic spores likely predominates in Europe. Land-
scape barriers hamper aerial gene flows, as shown in
Himalayan T. matsutake populations, where treeless
ridgelines act as barriers to gene flow (Amend et al.
2010). Aerial dispersal of spores throughout Europe
could be favoured by the absence of major geographical
barriers to airstreams (neither high mountain chains nor
sea channels larger than 50 km). However, in assigna-
tion tests (not shown; see Roy et al. 2008), fruitbodies
from small populations from the island of Corsica
(�100 km away from continental Europe) or Central
Europe (separated by the Alps from the study area)
belonged to the same pan-European population. Thus,
the high gene flow may also result from spore dispersal
over hundreds of kilometres.
This may be attributable to L. amethystina biological,
ecological and reproductive traits. Patchiness of host
communities and host specificity often prevent the dis-
persal and establishment of natural fungal populations
(Brown & Hovmøller 2002). For the wood saprotrophic
Datronia caperata, high host specificity exacerbates the
� 2011 Blackwell Publishing Ltd

EURASIAN POPULATI ON GE NETICS OF LACCARIA AMETHYSTINA 15
effect of fragmentation of the habitat, generating IBD
(Parrent et al. 2004). Edman et al. (2004) observed that
the dispersal and germination potential of spores were
affected by habitat fragmentation in Swedish forests for
two wood saprotrophic basidiomycetes, Fomitopsis rosea
and Phlebia centrifuga. The situation is quite different in
L. amethystina, a truly multihost, nonspecific EM species
(Roy et al. 2008): even if EM tree species differ, forests
show discontinuous but regular distribution in North-
ern and Western Europe (1–100% of forest area per
km2; data from European Forest Institute), facilitating
migration. In the comparably multihost R. brevipes,
Bergemann & Miller (2002) showed that the host popu-
lation patchiness is not a barrier to gene flow. Indeed,
we confirmed the large ecological range of L. amethysti-
na, because we found no correlation between popula-
tion differentiation and the age of the forest stand, the
climatic conditions or the geographical position (alti-
tude ⁄ latitude).
Other intrinsic features specific to L. amethystina may
also be involved. The high diversity of small genets at a
local scale (up to 14 660 genets ⁄ ha, Fiore-Donno & Mar-
tin 2001) suggests a high Ne which, together with the
repeated settlement of new spores every year (Gherbi
et al. 1999), may limit genetic drift. As an example of the
opposite tendency, Amanita muscaria displays stronger in-
tracontinental structure (Geml et al. 2009) and, although
it has aerial spore dispersal similar to that of L. amethysti-
na, it has a greater genet size and lifespan (Bagley & Orlo-
vich 2004). Lastly, high spore germination potential in
L. amethystina (Ishida et al. 2008), combined with abun-
dant meiotic spore production, may also enhance dis-
persal efficiency and gene flow. In the coming years,
comparison of diverse EM species (differing by host or
ecological specificity, size or lifespan of genets, sporulat-
ing effort, etc.) will clarify the factors determining the
strength of IBD in EM fungi (Douhan et al. 2011). In all,
the lack of major geographical barriers in Europe, as well
as the multihost strategy and population dynamics of
L. amethystina, likely favour gene flow over long dis-
tances and prevent local genetic drift in Europe.
Geographical structure (and possible speciation) overEurasia
Contrasting with the gene flow observed on a 1000-km
scale, neutral and selected molecular markers revealed
a clear divergence between Japanese and European
L. amethystina populations, i.e. over the 10 000 km Eur-
asian scale. Although Japanese and European genets
meet the criterion of ‡97% ITS similarity usually
applied to delineate conspecificity (Hughes et al. 2009),
three nuclear non-neutral loci (ITS, NAR and G6PD)
showed that Japanese haplotypes were not present in
� 2011 Blackwell Publishing Ltd
European populations and vice versa. No differentiation
was found for mitochondrial ribosomal genes: congru-
ently, 99.98% similarity over 1839 bp of mitochondrial
LrDNA was previously reported for American and
European L. bicolor differing by nuclear markers (Selos-
se et al. 1998), suggesting that genes may evolve more
slowly in mitochondria in Laccaria spp. Marked differ-
ences in allelic distributions were also observed for the
putatively neutral microsatellites, with FST reaching
0.42. Limited portabilities of markers from Europe to
Japan and vice versa also point to strong differentiation:
according to Donges et al. (2008), Roy et al. (2008) and
this study, only three of the nine markers designated
for Japanese L. amethystina by Wadud et al. (2006a)
were applicable to European samples (La03, La17, La23),
while other loci (La07, La12 and La14) were not ampli-
fied in European material. Reciprocally, Lv257 and La03
designed for European samples were monomorphic in
Japan, and La171 did not amplify for some Japanese
materials. A similarly low portability of microsatellite
loci from Japanese to American Suillus spraguei popula-
tions was recently described by Burchhardt et al. (2011).
One may a posteriori consider the population genetics
approach of limited relevance over Eurasia: this is in
itself a result of this study. Nevertheless, some micro-
satellite loci were portable and useful in the other geo-
graphical area, so that a population genetics approach
still makes sense for evolutionarily close populations.
Noteworthily, European and Japanese L. amethystina
populations have distinctive ecological traits: European
populations are late-stage EM partners in mature forests
(Gherbi et al. 1999; Fiore-Donno & Martin 2001) and so
far have been uncultivable (F. Le Tacon & M.-A. Selos-
se, unpublished observations); conversely, in Japan,
L. amethystina populations are early to middle succes-
sional, and the fungus is easily cultivable (Nara et al.
2003; Nara 2005; Wadud 2007). Although Japanese
L. amethystina tends to be generalist as well, its fruit-
bodies are often found under Salix spp., a situation very
rare in Europe (K. Nara & M.-A. Selosse, personal
observations). Lastly, preliminary morphological inves-
tigations also suggest some subtle differences (G. Muel-
ler, personal communication).
While not documented for EM species, IBD over Eurasia
is reported among saprotrophic basidiomycetes, such
as Megacollybia platyphylla (Hughes et al. 2007) and
S. lacrymans (Engh et al. 2010). Any recent founder
event is unlikely to explain our data because both
European and Japanese populations are molecularly
diverse and display private alleles; moreover, the
molecular diversity in one population is not nested
within the other, as would be expected if one popula-
tion was derived from the other (Barres et al. 2008). We
thus propose two equally parsimonious explanations:

16 L . V I N C ENO T ET AL.
(i) ancient allopatric speciation (i.e. molecular similari-
ties are plesiomorphic traits) or (ii) gradual variation
because of IBD (i.e. molecular similarities result from
limited gene flow).
Sibling allopatric biological species, which are hardly
or not distinguishable by morphology, have been dem-
onstrated in basidiomycetes within the Southern Hemi-
sphere (e.g. for the saprotrophic Ganoderma spp.,
Moncalvo & Buchanan 2008; or the EM Tylopilus spp.,
Halling et al. 2008), between Europe and North Amer-
ica (e.g. for the saprotrophic Lentinula spp., Hibbett
2001, or the parasitic Melampsora larici-populina, Barres
et al. 2008), and between Asia and North America (e.g.
for the saprotrophic S. lacrymans, Kauserud et al. 2007;
or the EM Suillus spp., Wu et al. 2000). Some globally
distributed EM species have been divided into more or
less regional biological species, such as the EM Pisoli-
thus tinctorius (Martin et al. 2002) and A. muscaria
(Geml et al. 2009), although gene flow still occurs in
some cases (Moncalvo & Buchanan 2008). Although the
definition of biological species in L. amethystina is not
possible from our data, allopatric speciation may occur.
One scenario is that during one or more past ice ages,
individuals from a unique preglacial population colo-
nized separate glacial refugia in Asia and Europe. In
Europe, refugia in Italy are postulated during the last
ice age for Tuber melanosporum (Murat et al. 2004) and
T. magnatum (Rubini et al. 2005), followed by recolon-
ization of more northern regions accompanying the
migration of host trees. At the continental scale, the
ancient populations of L. amethystina may have accu-
mulated divergences either during glacial isolation or to
adapt in different environments in Asia vs. Europe,
with limited gene flow between them after divergence.
This predicts that molecular differences do not accumu-
late gradually with distance over Eurasia, but that some
frontier between the two populations may exist; how-
ever, the story may be more complex, with secondary
hybrid zones or rare LDD events, as in allopatric speci-
ations of other basidiomycetes (Hosaka et al. 2008;
Moncalvo & Buchanan 2008).
The alternative model is a progressive IBD within a
continuously distributed species that may produce a
gradual variation over distances of 10 000 km. Similarly,
in S. lacrymans, the divergent Japanese and European
populations are both connected to a centre of diversity in
continental Asia (Engh et al. 2010). Interestingly, L. ame-
thystina IBD over Eurasia was not congruent with extrap-
olation of IBD over Europe: the slope of IBD over Eurasia
was five times higher than that over Europe (Fig. 2b).
This can be viewed as evidence for two distinct biological
species, but we cannot rule out the possibility that some
biological or geographical barriers may locally limit gene
flow and LDD over Eurasia. The prediction of a more or
less gradual genetic variation between Europe and Asia,
contrasting with the previous scenario of sharp popula-
tion delineation, can be tested in the future because
L. amethystina exists in China and Siberia.
The pattern is stranger when considering the limited
data for North American violet Laccaria species: first, a
North American L. amethystina ITS (EU819476) shows a
mix of Japanese and European traits and clusters with
Japanese sequences (Fig. 4); second, the close phyloge-
netic and genetic relationship between North American
L. amethysteo-occidentalis and L. amethystina deserves
further analysis. While the morphology groups together
Japanese and European L. amethystina and contrasts
them with the American L. amethysteo-occidentalis, G6PD
clusters together L. amethysteo-occidentalis and Japanese
L. amethystina, excluding European L. amethystina. An
appealing hypothesis is that the L. amethystina ⁄ L. ame-
thysteo-occidentalis complex undergoes a ring speciation
over the Northern Hemisphere. Ring species show a
gradual population variation between two divergent
and sympatric forms (Irwin 2009), in this case
L. amethysteo-occidentalis and L. amethystina in North
America. So far, there are few examples of true ring
speciation (Irwin 2009), and none among fungi. More
continuous sampling around the Northern Hemisphere,
especially in North America, will be required to test
this hypothesis for L. amethystina.
Perspectives
Our results support the high local genet diversity and
panmictic pattern with some inbreeding previously
reported for L. amethystina in Europe. Finer estimation
of genet turnover, inbreeding level and genet diversity
may explain gene flow at local scales. As for many
other fungal species, estimates of potential for spore
dispersal (e.g. proportion of spores able to escape and
survive in higher airstreams for LDD) would improve
our understanding of gene flow.
In vitro crossing tests may evaluate how far genetic
divergence reflects reproductive isolations over Eurasia.
Prezygotic isolation can easily be tested in vitro (as
between American and European L. bicolor; Selosse et al.
1997, 1998), but testing postzygotic isolation will require
F1 sporulating fruitbodies (Moncalvo & Buchanan 2008).
So far, although Japanese L. amethystina strains are easy
to cultivate and inoculate on seedlings (producing many
fruitbodies; Nara 2005), such tests have been hampered
by the noncultivability of European L. amethystina.
Further analyses of the L. amethystina complex and
the testing of two hypotheses (allopatric speciation vs.
progressive isolation by distance, if not a ring species)
will benefit from a combination of population genetics
and phylogenetic analyses, as in the present study. As
� 2011 Blackwell Publishing Ltd

EURASIAN POPULATI ON GE NETICS OF LACCARIA AMETHYSTINA 17
only two Japanese populations were investigated, future
studies should include more samples from Asia, to
investigate the isolation by distance between 2900 and
10 000 km. Sampling in America, especially around the
Beringia, which turns out to be of major importance in
EM biogeography (Wu et al. 2000; Geml et al. 2006,
2009), is also required. In a context where too few phy-
logeographic hypotheses are available for EM fungi (as
compared with saprobes; Halling et al. 2008; Douhan
et al. 2011), elucidating the biogeography of violet Lac-
caria spp. would generate a first evolutionary model for
EM fungi over the Northern Hemisphere.
Acknowledgements
We warmly thank Mohammad Bahram, Simon Egli, Andreas
Gminder, Ibai Olariaga Ibarguren, Pavel Kolmakov, Damjan
Krstajic, Thomas Lassøe, Mireille Lenne, Daniel Mousain, Jor-
ma Palmen, Mykola Prydiuk, Stefan Raidl, Franck Richard,
Maria Rudawska, Arne Ryberg, Stuart Skeates, Yutaka Tamai,
Alexander Urban and Sietse Van der Linde for help in sam-
pling, and Sebastien Leclerq for help in screening of microsat-
ellites. We thank Joelle Ronfort, Finn Kjellberg, Patrice David,
Francois Rousset, Noppol Kobmoo, Pierre-Olivier Cheptou and
Mathieu Sauve for discussions on population genetics, as well
as Marc de Dinechin and Pierre-Henri Fabre for help in phylo-
genetic analyses. We also acknowledge Gerhardt Kost, Thomas
Kuyper, Greg Mueller and Pierre-Arthur Moreau for inspiring
discussions on the model taxon and three anonymous referees
for their comments on an earlier version of this manuscript,
and David Marsh for English correction. This work was
funded by the European Commission Network of Excellence
EVOLTREE (to F.M. and M.-A.S.) and the Agence Nationale de
la Recherche (SYSTRUF programme to M.-A.S). L.T. receives
support from ESF grants JD-92, 6606 and FIBIR. Most molecu-
lar data used in this work were produced at the IFR119 ‘Mont-
pellier Environnement Biodiversite’.
References
Abarenkov K, Nilsson RH, Larsson K-H et al. (2010) The UNITE
database for molecular identification of fungi—recent updates
and future perspectives. New Phytologist, 186, 281–285.
Amend A, Garbelotto M, Fang Z, Keeley S (2010) Isolation by
landscape in populations of a prized edible mushroom
Tricholoma matsutake. Conservation Genetics, 11, 795–802.
Bagley SJ, Orlovich DA (2004) Genet size and distribution of
Amanita muscaria in a suburban park, Dunedin, New
Zealand. New Zealand Journal of Botany, 42, 939–947.
Barres B, Halkett F, Dutech C, Andrieux A, Pinon J, Frey P
(2008) Genetic structure of the poplar rust fungus
Melampsora larici-populina: evidence for isolation by distance
in Europe and recent founder effects overseas. Infection,
Genetics and Evolution, 8, 577–587.
Bergemann SE, Miller SL (2002) Size, distribution, and
persistence of genets in local populations of the late-stage
ectomycorrhizal basidiomycete, Russula brevipes. New
Phytologist, 156, 313–320.
� 2011 Blackwell Publishing Ltd
Brown JKM, Hovmøller MS (2002) Epidemiology—aerial
dispersal of pathogens on the global and continental scales
and its impact on plant disease. Science, 297, 537–541.
Burchhardt KM, Rivera Y, Baldwin T, Vanearden D, Kretzer
AM (2011) Analysis of genet size and local gene flow in the
ectomycorrhizal basidiomycete Suillus spraguei (synonym
S. pictus). Mycologia, 103, 722–730.
Carriconde F, Gardes M, Jargeat P, Heilmann-Clausen J,
Mouhamadou B, Gryta H (2008) Population evidence of
cryptic species and geographical structure in the
cosmopolitan ectomycorrhizal fungus, Tricholoma
scalpturatum. Microbial Ecology, 56, 513–524.
David P, Pujol B, Viard F, Castella V, Goudet J (2007) Reliable
selfing rate estimates from imperfect population genetic
data. Molecular Ecology, 16, 2474–2487.
Dilmaghani A, Balesdent MH, Didier JP et al. (2009) The
Leptosphaeria maculans—Leptosphaeria biglobosa species complex
in the American continent. Plant Pathology, 58, 1044–1058.
Donges K, Schlobinski D, Cremer E, Rexer KH, Kost G (2008)
Six newly developed microsatellite markers of Laccaria
amethystina, using an improved CSSR approach. Mycological
Progress, 7, 285–290.
Douhan GW, Huryn KL, Douhan LI (2007) Significant diversity
and potential problems associated with inferring population
structure within the Cenococcum geophilum species complex.
Mycologia, 99, 812–819.
Douhan G, Vincenot L, Gryta H, Selosse MA (2011) Population
genetics of ectomycorrhizal fungi: from current knowledge
to emerging directions. Fungal Biology, 115, 569–597.
Dunham SM, Kretzer A, Pfrender ME (2003) Characterization
of Pacific golden chanterelle (Cantharellus formosus) genet size
using co-dominant microsatellite markers. Molecular Ecology,
12, 1607–1618.
Edman M, Gustafsson M, Stenlid J, Ericson L (2004)
Abundance and viability of fungal spores along a forestry
gradient—responses to habitat loss and fragmentation?
Oikos, 104, 35–42.
Engh IB, Carlsen T, Sætre GP, Hogberg N, Doi S, Kauserud H
(2010) Two invasive populations of the dry rot fungus
Serpula lacrymans show divergent population genetic
structures. Molecular Ecology, 19, 706–715.
Excoffier L, Lischer HEL (2010) Arlequin suite ver. 3.5: a new
series of programs to perform population genetics analyses
under Linux and Windows. Molecular Ecology Resources, 10,
564–567.
Fiore-Donno AM, Martin F (2001) Populations of
ectomycorrhizal Laccaria amethystina and Xerocomus spp.
show contrasting colonization patterns in a mixed forest.
New Phytologist, 152, 533–542.
Gardes M, Bruns TD (1993) ITS primers with enhanced
specificity for basidiomycetes: application to the identification
of mycorrhiza and rusts. Molecular Ecology, 2, 113–118.
Geml J, Laursen GA, O’Neill K, Nusbaum HC, Taylor DL
(2006) Beringian origins and cryptic speciation events in the
fly agaric Amanita muscaria. Molecular Ecology, 15, 225–239.
Geml J, Laursen GA, Timling I et al. (2009) Molecular
phylogenetic biodiversity assessment of arctic and boreal
ectomycorrhizal Lactarius Pers. (Russulales; Basidiomycota)
in Alaska, based on soil and sporocarp DNA. Molecular
Ecology, 18, 2213–2227.

18 L . V I N C ENO T ET AL.
Gherbi H, Delaruelle C, Selosse MA, Martin F (1999) High
genetic diversity in a population of the ectomycorrhizal
basidiomycete Laccaria amethystina in a 150-year-old beech
forest. Molecular Ecology, 12, 2003–2013.
Guillot G, Santos F, Estoup A (2008) Analysing georeferenced
population genetics data with Geneland: a new algorithm to
deal with null alleles and a friendly graphical user interface.
Bioinformatics, 24, 1406–1407.
Guindon S, Gascuel O (2003) A simple, fast and accurate
method to estimate large phylogenies by maximum
likelihood. Systematic Biology, 52, 696–704.
Halling RE, Osmundson TW, Neves MA (2008) Pacific boletes:
implications for biogeographic relationships. Mycological
Research, 112, 437–447.
Hibbett DS (2001) Shiitake mushrooms and molecular clocks:
historical biogeography of Lentinula. Journal of Biogeography,
28, 231–241.
Hijmans RJ, Cameron SE, Parra JL, Jones PG, Jarvis A (2005)
Very high resolution interpolated climate surfaces for global
land areas. International Journal of Climatology, 25, 1965–1978.
Hosaka K, Castellano MA, Spatafora JW (2008) Biogeography
of Hysterangiales (Phallomycetidae, Basidiomycota).
Mycological Research, 112, 448–462.
Hughes KW, Petersen RH, Lickey EB (2007) Megacollybia
(Agaricales). Reports of the Tottori Mycological Institute, 45, 1–57.
Hughes KW, Petersen RH, Lickey EB (2009) Using
heterozygosity to estimate a percentage DNA sequence
similarity for environmental species’ delimitation across
basidiomycete fungi. New Phytologist, 182, 795–798.
Irwin DE (2009) Incipient ring speciation revealed by a
migratory divide. Molecular Ecology, 18, 2923–2925.
Ishida TA, Nara K, Tanaka M, Kinoshita A, Hogetsu T (2008)
Germination and infectivity of ectomycorrhizal fungal spores
in relation to their ecological traits during primary
succession. New Phytologist, 180, 491–500.
James TY, Porter D, Hamrick JL, Vilgalys R (1999) Evidence for
limited intercontinental gene flow in the cosmopolitan
mushroom, Schizophyllum commune. Evolution, 53, 1665–1677.
Jany JL, Garbaye J, Martin F (2002) Cenococcum geophilum
populations show a high degree of genetic diversity in beech
forests. New Phytologist, 154, 651–659.
Jargeat P, Martos F, Carriconde F, Gryta H, Moreau P-A,
Gardes M (2010) Phylogenetic species delimitation in
ectomycorrhizal fungi and implications for barcoding: the
case of the Tricholoma scalpturatum complex (Basidiomycota).
Molecular Ecology, 19, 5216–5230.
Kauserud H, Svegarden IB, Sætre GP et al. (2007) Asian origin
and rapid global spread of the destructive dry rot fungus
Serpula lacrymans. Molecular Ecology, 16, 3350–3360.
Kretzer AM, Dunham S, Molina R, Spatafora JW (2005)
Patterns of vegetative growth and gene flow in Rhizopogon
vinicolor and R. vesiculosus (Boletales, Basidiomycota).
Molecular Ecology, 14, 2259–2268.
de La Bastide PY, Kropp BR, Piche R (1995) Vegetative
interactions among mycelia of Laccaria bicolor in pure culture
and in symbiosis with Pinus banksiana. Canadian Journal of
Botany, 73, 1768–1779.
Labbe J, Zhang X, Yin T et al. (2008) A genetic linkage map for
the ectomycorrhizal fungus Laccaria bicolor and its alignment
to the whole-genome sequence assemblies. New Phytologist,
180, 316–328.
Li DW (2005) Release and dispersal of basidiospores from
Amanita muscaria var. alba and their infiltration into a
residence. Mycological Research, 109, 1235–1242.
Martin F, Selosse M-A, Le Tacon F (1999) The nuclear
ribosomal DNA intergenic spacers of the ectomycorrhizal
basidiomycete Laccaria bicolor: structural analysis and
intraspecific polymorphisms. Microbiology, 145, 1605–1611.
Martin F, Diez J, Dell B, Delaruelle C (2002) Phylogeography of
the ectomycorrhizal Pisolithus species as inferred from nuclear
ribosomal DNA ITS sequences. New Phytologist, 153, 345–357.
Martin F, Aerts A, Ahren D et al. (2008) The genome of
Laccaria bicolor provides insights into mycorrhizal symbiosis.
Nature, 452, 88–93.
Moncalvo JM, Buchanan PK (2008) Molecular evidence for
long distance dispersal across the Southern Hemisphere in
the Ganoderma applanatum-australe species complex
(Basidiomycota). Mycological Research, 112, 425–436.
Mueller GM, Schmit JP, Leacock PR et al. (2007) Global
diversity and distribution of macrofungi. Biodiversity and
Conservation, 16, 37–48.
Murat C, Diez J, Luis P et al. (2004) Polymorphism at the
ribosomal DNA ITS and its relation to postglacial re-
colonization routes of the Perigord truffle Tuber
melanosporum. New Phytologist, 164, 401–411.
Nara K (2005) Ectomycorrhizal networks and seedling
establishment during early primary succession. New
Phytologist, 169, 169–178.
Nara K, Nakaya H, Wu B, Zhou Z, Hogetsu T (2003)
Underground primary succession of ectomycorrhizal fungi in
a volcanic desert on Mount Fuji. New Phytologist, 159, 743–746.
Niculita-Hirzel H, Labbe J, Kohler A et al. (2008) Gene
organization of the mating type regions in the
ectomycorrhizal fungus Laccaria bicolor reveals distinct
evolution between the two mating type loci. New Phytologist,
180, 329–342.
Nielsen R, Wakeley JW (2001) Distinguishing migration from
isolation: an MCMC approach. Genetics, 158, 885–896.
Nylander JAA (2004) MrModeltest v2. Program distributed by
the author. Evolutionary Biology Centre, Uppsala University,
Uppsala, Sweden.
O’Malley MA (2007) The nineteenth century roots of
‘everything is everywhere’. Nature Reviews Microbiology, 5,
647–651.
Parrent JL, Garbelotto M, Gilbert GS (2004) Population genetic
structure of the polypore Datronia caperata in fragmented
mangrove forests. Mycological Research, 108, 403–410.
Pritchard JK, Stephens M, Donnelly P (2000) Inference of
population structure using multilocus genotype data.
Genetics, 155, 945–959.
Prospero JM, Blades E, Mathison G, Naidu R (2005)
Interhemispheric transport of viable fungi and bacteria from
Africa to the Caribbean with soil dust. Aerobiologia, 21, 1–19.
Queloz V, Sieber TN, Holdenrieder O, McDonald BA, Grunig CR
(2011) No biogeographical pattern for a root-associated fungal
species complex. Global Ecology and Biogeography, 20, 160–169.
Ronquist F, Huelsenbeck JP (2003) MrBayes 3: Bayesian
phylogenetic inference under mixed models. Bioinformatics,
19, 1572–1574.
Rousset F (2008) GENEPOP’007: a complete re-implementation
of the GENEPOP software for Windows and Linux.
Molecular Ecology Resources, 8, 103–106.
� 2011 Blackwell Publishing Ltd

EURASIAN POPULATI ON GE NETICS OF LACCARIA AMETHYSTINA 19
Roy M, Dubois MP, Proffit M, Vincenot L, Desmarais E,
Selosse MA (2008) Evidence from population genetics that
the ectomycorrhizal basidiomycete Laccaria amethystina is an
actual multihost symbiont. Molecular Ecology, 17, 2825–2838.
Rubini A, Paolocci F, Riccioni C, Vendramin GG, Arcioni S
(2005) Genetic and phylogeographic structures of the
symbiotic fungus Tuber magnatum. Applied and Environmental
Microbiology, 71, 6584–6589.
Selosse MA, Martin F, Bouchard D, Le Tacon F (1997)
Temporal persistence and spatial distribution of an
American inoculant strain of the ectomycorrhizal
basidiomycete Laccaria bicolor in French plantations.
Molecular Ecology, 7, 561–574.
Selosse MA, Jacquot D, Bouchard D, Martin F, Le Tacon F
(1998) Survival of an introduced ectomycorrhizal Laccaria
bicolor strain in a European forest plantation monitored by
mitochondrial ribosomal DNA analysis. New Phytologist, 140,
753–761.
Swofford DL (2002) PAUP*: Phylogenetic Analysis Using
Parsimony (*and Other Methods). Version 4.10 b. Sinauer,
Sunderland, Massachusetts, USA.
Taylor JW, Jacobson DJ, Kroken S et al. (2000) Phylogenetic
species recognition and species concepts in fungi. Fungal
Genetics and Biology, 31, 21–32.
Taylor AFS, Hills AE, Simonini G, Both EE, Eberhardt U (2006)
Detection of species within the Xerocomus subtomentosus
complex in Europe using rDNA-ITS sequences. Mycological
Research, 110, 276–287.
Vainio EJ, Korhonena K, Hantulaa J (1998) Genetic variation in
Phlebiopsis gigantea as detected with random amplified
microsatellite (RAMS) markers. Mycological Research, 102,
187–192.
Van Oosterhout C, Hutchinson WF, Wills DPM, Shipley P
(2004) MICRO-CHECKER: software for identifying and
correcting genotyping errors in microsatellite data. Molecular
Ecology Notes, 4, 535–538.
Wadud MA (2007) Reproduction ecology of pioneer ectomycorrhizal
fungi, Laccaria amethystina and L. laccata, in the volcanic
desert on Mount Fuji. PhD Thesis, The University of Tokyo,
Tokyo, Japan.
Wadud MA, Lian CL, Nara K, Ishida TA, Hogetsu T (2006a)
Development of microsatellite markers from an ectomycorrhizal
fungus, Laccaria amethystina, by a dual-suppression-PCR
technique. Molecular Ecology Notes, 6, 130–132.
Wadud MA, Lian CL, Nara K, Hogetsu T (2006b) Isolation and
characterization of five microsatellite loci in an
ectomycorrhizal fungus Laccaria laccata. Molecular Ecology
Notes, 6, 700–702.
White TJ, Bruns T, Lee S, Taylor J (1990) Amplification and
direct sequencing of fungal ribosomal RNA genes for
phylogenetics. In: PCR Protocols. A Guide to Methods and
Applications (eds. Innis MA, Gelfand DH, Sninsky JJ, White
JJ), pp. 315–322. Academic Press, San Diego, California.
Wu QX, Mueller GM, Lutzoni FM, Huang YQ, Guo SY (2000)
Phylogenetic and biogeographic relationships of Eastern
Asian and Eastern North American disjunct Suillus species
(Fungi) as inferred from nuclear ribosomal RNA ITS
sequences. Molecular Phylogenetics and Evolution, 17, 37–47.
Xu J, Sha T, Li YC, Zhao ZW, Yang ZL (2008) Recombination
and genetic differentiation among natural populations of the
� 2011 Blackwell Publishing Ltd
ectomycorrhizal mushroom Tricholoma matsutake from
southwestern China. Molecular Ecology, 17, 1238–1247.
This work is part of L.V.’s PhD thesis on Laccaria amethystina
population genetics. She did the molecular typing and genetic
analyses, with help from M.-P.D., and J.L., C.S., K.N. and L.T.
helped with sampling and data analysis. L.V. wrote the paper
together with M.-A.S. This project was designed by M.-A.S.
with the help of F.M.
Data accessibility
DNA sequences of microsatellite alleles for loci Jl1195M13,
1209M5, Lv257: GenBank accessions GQ483297–GQ483302
(Data S1).
DNA sequences for multiple gene phylogenies: GenBank acces-
sions GQ406389–GQ406568 plus HQ896282–HQ896286 (Data
S2).
Phylogenetic data for ITS, ITS extended, NAR, G6PD, three
concatenated nuclear loci, LsurRNA, SsurRNA: TreeBASE
Study accessions no.11481, 11482, 11483, 11484, 11485, 11486,
11487.
Data deposited in the Dryad repository: doi: 10.5061/
dryad.21pm7p6n.
Supporting information
Additional supporting information may be found in the online
version of this article.
Fig. S1 Structure diagram of European and Japanese popula-
tions, based on the software STRUCTURE 2.2 for K = 2 clusters.
Fig. S2 Bayesian phylogram of Laccaria spp. using ITS
sequences from this study, Unite and GenBank (138 taxa, 622
characters).
Fig. S3 Alignment of ITS sequences from L. amethystina and
L. amethysteo-occidentalis.
Fig. S4 Unrooted Bayesian phylograms of L. amethystina in
Europe and Japan for two mitochondrial ribosomal genes,
SrRNA (a, 29 taxa, 477 characters) and LrRNA (b, 37 taxa, 410
characters).
Data S1. Microsatellites diploid genotypes for 667 individuals
in 18 L. amethystina populations, 9 microsatellites loci.
Data S2. Genbank accession numbers for sequences of 5 coding
or non-coding loci, on purpose of phylogenetic analysis. Asso-
ciated phylogenetic trees are available on TREEBASE, study
accessions no.11481, 11482, 11483, 11484, 11485, 11486, 11487.
Please note: Wiley-Blackwell are not responsible for the content
or functionality of any supporting information supplied by the
authors. Any queries (other than missing material) should be
directed to the corresponding author for the article.