Comparison of Effluent Suspended Solid Concentrations from ...
20
Citation: Lee, B. Comparison of Effluent Suspended Solid Concentrations from Two Types of Rectangular Secondary Clarifiers. Water 2022, 14, 1577. https:// doi.org/10.3390/w14101577 Academic Editor: Christos S. Akratos Received: 27 March 2022 Accepted: 12 May 2022 Published: 14 May 2022 Publisher’s Note: MDPI stays neutral with regard to jurisdictional claims in published maps and institutional affil- iations. Copyright: © 2022 by the author. Licensee MDPI, Basel, Switzerland. This article is an open access article distributed under the terms and conditions of the Creative Commons Attribution (CC BY) license (https:// creativecommons.org/licenses/by/ 4.0/). water Article Comparison of Effluent Suspended Solid Concentrations from Two Types of Rectangular Secondary Clarifiers Byonghi Lee Department of Environmental Energy Engineering, Kyonggi University, Suwon 16227, Korea; [email protected]; Tel.: +82-31-249-9737 Abstract: Secondary clarifiers play a significant role in the successful operation of activated sludge systems. Because of the restriction of available land, South Korean domestic wastewater treatment plants tend to employ rectangular clarifiers to settle mixed liquor suspended solids (MLSS) for activated sludge systems. A high MLSS concentration must be maintained in the bioreactor to ensure nitrification during winters, and achieve stringent effluent quality. The effluent suspended solid (SS) concentrations of two clarifier types currently being used in South Korea, primary rectangular clarifier-type and Gould Type I secondary clarifiers, were compared using computerized fluid dynamic simulations and hourly secondary effluent suspended solid concentrations. In addition, operational data such as hourly influent flow, daily MLSS concentrations, and sludge volume index were obtained and reviewed. This comparison reveals that the Gould Type I secondary clarifier is resilient to loading variation and produces effluent with a consistently lower suspended solid concentration than the primary rectangular clarifier-type under similar loading conditions and higher loading variations. The results suggest that the existing primary rectangular clarifier-type secondary clarifiers must be converted to Gould Type I. Keywords: rectangular clarifier; Gould Type I; secondary clarifier 1. Introduction Solid-liquid separation in secondary clarifiers plays an important role in the successful operation of suspended growth-activated sludge systems. The secondary clarifier is ex- pected to provide high-quality supernatant along with thickened underflow, which is called return-activated sludge [1]. To achieve the stringent suspended solid (SS) concentration limits at final discharge, it is common to install filtration units after a secondary clarifier [2], and a secondary effluent with a low SS concentration has to be constantly provided for efficient operation of the filtration unit. When the SS concentration of the secondary effluent is high, the filtration unit must undergo frequent backwash operations. The backwash water thus produced must return to the headwork, adding extra flow and solid load to the mainstream process, in turn causing high strain during the wastewater treatment process. To achieve stable operation of the treatment process with a filtration unit, it is important that the secondary effluent has a consistently low SS concentration. Several types of secondary clarifiers have been developed and used, including circular and rectangular clarifiers. There are two types of circular clarifiers based on feed location: center and peripheral feed clarifiers [3]. There are also two types of rectangular secondary clarifiers based on hopper locations [4]. When the activated sludge system was introduced in South Korea in 1970, the use of center-feed circular clarifiers was common. Since the 1980s, South Korea has experienced rapid urban growth, which demands efficient use of land for wastewater treatment plants. Because of the lower land requirement for rectangular clarifiers, they are being used as primary and secondary clarifiers since the 1990s. Although the solids settled in the primary clarifier are different from those settled in the secondary clarifier, the primary rectangular clarifier-type has been adopted as the Water 2022, 14, 1577. https://doi.org/10.3390/w14101577 https://www.mdpi.com/journal/water
-
Upload
khangminh22 -
Category
Documents
-
view
0 -
download
0
Transcript of Comparison of Effluent Suspended Solid Concentrations from ...

Citation: Lee, B. Comparison of
Effluent Suspended Solid
Concentrations from Two Types of
Rectangular Secondary Clarifiers.
Water 2022, 14, 1577. https://
doi.org/10.3390/w14101577
Academic Editor: Christos S.
Akratos
Received: 27 March 2022
Accepted: 12 May 2022
Published: 14 May 2022
Publisher’s Note: MDPI stays neutral
with regard to jurisdictional claims in
published maps and institutional affil-
iations.
Copyright: © 2022 by the author.
Licensee MDPI, Basel, Switzerland.
This article is an open access article
distributed under the terms and
conditions of the Creative Commons
Attribution (CC BY) license (https://
creativecommons.org/licenses/by/
4.0/).
water
Article
Comparison of Effluent Suspended Solid Concentrations fromTwo Types of Rectangular Secondary ClarifiersByonghi Lee
Department of Environmental Energy Engineering, Kyonggi University, Suwon 16227, Korea; [email protected];Tel.: +82-31-249-9737
Abstract: Secondary clarifiers play a significant role in the successful operation of activated sludgesystems. Because of the restriction of available land, South Korean domestic wastewater treatmentplants tend to employ rectangular clarifiers to settle mixed liquor suspended solids (MLSS) foractivated sludge systems. A high MLSS concentration must be maintained in the bioreactor to ensurenitrification during winters, and achieve stringent effluent quality. The effluent suspended solid(SS) concentrations of two clarifier types currently being used in South Korea, primary rectangularclarifier-type and Gould Type I secondary clarifiers, were compared using computerized fluiddynamic simulations and hourly secondary effluent suspended solid concentrations. In addition,operational data such as hourly influent flow, daily MLSS concentrations, and sludge volume indexwere obtained and reviewed. This comparison reveals that the Gould Type I secondary clarifieris resilient to loading variation and produces effluent with a consistently lower suspended solidconcentration than the primary rectangular clarifier-type under similar loading conditions and higherloading variations. The results suggest that the existing primary rectangular clarifier-type secondaryclarifiers must be converted to Gould Type I.
Keywords: rectangular clarifier; Gould Type I; secondary clarifier
1. Introduction
Solid-liquid separation in secondary clarifiers plays an important role in the successfuloperation of suspended growth-activated sludge systems. The secondary clarifier is ex-pected to provide high-quality supernatant along with thickened underflow, which is calledreturn-activated sludge [1]. To achieve the stringent suspended solid (SS) concentrationlimits at final discharge, it is common to install filtration units after a secondary clarifier [2],and a secondary effluent with a low SS concentration has to be constantly provided forefficient operation of the filtration unit. When the SS concentration of the secondary effluentis high, the filtration unit must undergo frequent backwash operations. The backwashwater thus produced must return to the headwork, adding extra flow and solid load to themainstream process, in turn causing high strain during the wastewater treatment process.To achieve stable operation of the treatment process with a filtration unit, it is importantthat the secondary effluent has a consistently low SS concentration.
Several types of secondary clarifiers have been developed and used, including circularand rectangular clarifiers. There are two types of circular clarifiers based on feed location:center and peripheral feed clarifiers [3]. There are also two types of rectangular secondaryclarifiers based on hopper locations [4]. When the activated sludge system was introducedin South Korea in 1970, the use of center-feed circular clarifiers was common. Sincethe 1980s, South Korea has experienced rapid urban growth, which demands efficientuse of land for wastewater treatment plants. Because of the lower land requirement forrectangular clarifiers, they are being used as primary and secondary clarifiers since the1990s. Although the solids settled in the primary clarifier are different from those settledin the secondary clarifier, the primary rectangular clarifier-type has been adopted as the
Water 2022, 14, 1577. https://doi.org/10.3390/w14101577 https://www.mdpi.com/journal/water

Water 2022, 14, 1577 2 of 20
secondary rectangular clarifier, which is explained in detail in Section 2.1. No problems areknown to occur in the secondary clarifier when a primary rectangular clarifier-type is usedto settle mixed liquor suspended solids (MLSS) in a conventional activated sludge system,which maintains a bioreactor MLSS concentration of approximately 2000 mg/L.
In 1995, the South Korean government imposed a total nitrogen limit on the finaleffluent from wastewater treatment plants [5]. To remove nitrogen from wastewater,nitrification must occur in the aeration tank, and a high sludge retention time (SRT) mustbe maintained to ensure nitrification, especially in winters [6]. Because SRT is the ratio oftotal MLSS mass to that wasted within the system [7], a high system MLSS concentrationis essential for a long SRT. For a conventional active sludge system that only removesorganic matter, the system MLSS concentration is approximately 2000 mg/L. However, thisconcentration could reach approximately 3500 mg/L for nitrification, and this high MLSSconcentration must be settled in the secondary clarifier.
Since 1995, almost all rectangular clarifiers in South Korea have experienced opera-tional problems in winters. There are three issues with primary rectangular clarifier-typesecondary clarifiers that settle MLSS from nitrification bioreactors. The most significantproblem is rising sludge because of endogenous denitrification in the sludge blanket [8].The risen sludge in the secondary clarifier becomes the effluent solid concentration in thesecondary clarifier, which reduces the total MLSS mass and decreases the SRT. Eventually,nitrification will fail if the sludge rising continues. The second issue is varying secondaryeffluent SS concentrations. A sudden increase in the SS concentration is observed duringa high inflow at the treatment facility. This increase results in a high solid load in thesubsequent filtration unit and leads to the production of a final effluent with a high SSconcentration. The third issue is the low MLSS concentration of the return activated sludge(RAS) due to clarifier shape. The settled MLSS in the secondary clarifier is collected inthe hopper and sent back to the bioreactor as RAS. To achieve a high concentration ofMLSS in bioreactors, the MLSS concentration of the RAS must be high. All three issuesare correlated with SS concentration at secondary clarifier effluent, thus, the methods toproduce constantly low SS concentrations must be investigated for the successful operationof the secondary clarifier.
The rectangular secondary clarifier with a hopper at the end is called Gould Type I [9],and one treatment plant in South Korea uses this type of clarifier. The operation data fromthis plant reveal that Gould Type I produces effluent with a constantly low SS concentrationregardless of the variation in loading [10,11]. However, a comprehensive sampling isnecessary to confirm these results, because weekly grabbed samples of secondary effluentare measured for SS concentrations in the previous report [10]. To compare the effluentSS concentrations from both the primary rectangular clarifier-type and Gould Type Iclarifiers, effluents must be collected from both clarifiers at the same frequency. In addition,computational fluid dynamics (CFD) simulations must be performed with operational data,such as diurnal inflow, to confirm the experimental data.
2. Materials and Methods
Two wastewater treatment plants that use different types of rectangular secondaryclarifiers were selected to compare the secondary effluent SS concentrations in winter. Ahigh concentration of MLSS must be maintained in the bioreactor to sustain a long SRTin winter, which burdens secondary clarifier operation with high MLSS concentrations.To determine the difference in secondary effluent SS concentrations by clarifier type, thesecondary effluent SS concentrations from each type were measured during the winterwhen the inflow to each clarifier had a high MLSS concentration.
The selected wastewater treatment plants include plant A and plant B, which use aprimary rectangular clarifier-type and a Gould Type I rectangular clarifier as the secondaryclarifier, respectively. To determine the effect of hourly inflow variation on the effluent SSconcentrations from each clarifier type, secondary effluents were sampled hourly, and SSconcentrations were measured on working days for two weeks. The corresponding hourly

Water 2022, 14, 1577 3 of 20
inflow to each plant and daily RAS flow rates were provided by the personnel from eachplant. In addition, each plant provided the daily MLSS concentrations and sludge volumeindex (SVI) of MLSS in the aeration tank during the sampling period. Although hourlysecondary effluent samples from plant B were collected on working days for two weeks, thesamples at plant A were collected sporadically. For plant A, nine 24-h hourly samples werecollected from December 2019 to March 2020, and ten 24-h hourly samples were collectedin January 2021, for plant B. An AQUAMATIC automatic sampler (Model P2-Multiform,Manchester, UK) was used for hourly sampling. The SS concentration of the secondaryeffluent was measured according to the Standard Method 2540 D [12].
CFD simulations were performed to determine the MLSS settling behaviors for eachsecondary clarifier type. A CFD package developed by McCorquodale et al. [13], whichsimulates fluid movement and MLSS settling, was used. The diurnal inflow, RAS flow, andMLSS concentration of the aeration tank, which supplied MLSS to the secondary clarifier,were used as input data for the CFD simulation. For both clarifier types, the same MLSSsettling characteristics were applied to determine the difference in performance, includingeffluent SS concentrations.
2.1. Plant A—With Primary Rectangular Clarifier-Type Secondary Clarifier
Plant A is located south of Seoul, South Korea. It was commissioned in 2009, with adesign treatment capacity of 47,000 m3/day for the daily maximum and 37,600 m3/dayfor the average daily flow. The mainstream process comprises the Bardenpho process [14],although the first aerobic reactor has media to which biomass is attached. This plant hasfour trains, each of which has two rectangular primary clarifier-type secondary clarifiers.Table 1 lists the design maximum, average daily inflow, and physical specifications for themainstream process, including the secondary clarifier. Although Metcalf & Eddy/Aecomrecommends a surface overflow rate (SOR) of 24–32 m3/m2·day for average daily flow [15],the design SOR is 18.4 m3/m2·day for average daily flow, which is well below the rec-ommended range. Although solid loading rate (SLR) must be considered a major designelement for secondary clarifiers, somehow, only SOR is regarded as the main design factorin South Korea. Figure 1 shows the longitudinal view and porous inlet wall of the clarifierused in the plant. MLSS from the second aerobic tank enters the secondary clarifier throughthe porous inlet wall. The wall has a width of 3869 mm and an effective height of 3595 mm.The diameter of each hole is 100 mm and each wall has a total of 143 holes. Based on thisconfiguration, the opening ratio of the porous inlet wall is estimated to be 8%. As shownin Figure 1, the sludge scarper transfers the settled MLSS to the hopper, located just afterthe porous inlet wall. The sludge scarper moves against the direction of fluid flow on theclarifier bottom, which has a detrimental effect on the secondary effluent SS concentration.
Table 1. Design specifications of the primary rectangular clarifier-type secondary clarifier at Plant A.
Item Values Remarks
Design FlowMaximum daily flow 47,000 m3/day
Average daily flow 37,600 m3/day
Secondary clarifier
Number of units 8
Width 8 m
Length 32 m
Effective depth 3.5 m
Total surface area 2048 m2
Design Surface OverflowRate (SOR)
For maximum daily flow 22.9 m3/m2·day
For average daily flow 18.4 m3/m2·day 24–32 m3/m2·day isrecommended [15]

Water 2022, 14, 1577 4 of 20
Water 2022, 14, x FOR PEER REVIEW 4 of 20
Design Surface Overflow Rate
(SOR) For average daily flow 18.4 m3/m2·day
24–32 m3/m2·day is recommended [15]
Figure 1. Longitudinal view of the secondary clarifier and porous inlet wall at plant A.
2.2. Plant B—With Gould Type I Secondary Clarifier Plant B has been in service since 2010 and is located in northern Seoul. The design
capacity of this plant is 14,000 m3/day for the daily maximum flow and 11,200 m3/day for the average daily flow. The main treatment process consists of two trains, each comprising pre-anoxic–anaerobic–anoxic–aerobic reactors, similar to the Johannesburg process [16]. Each train has a clarifier with 2 bays. A total of four bays of clarifiers are installed at the plant. The total surface area of the clarifier is 751.44 m2 and the corresponding SOR for the daily average flow is 14.9 m3/m2·day, which is well below the recommended values by Metcalf and Eddy/Aecom [15]. Table 2 presents the physical specifications of the second-ary clarifier at plant B, and Figure 2 shows the longitudinal view and energy dissipating inlet (EDI) of the Gould Type I clarifier. The physical aspects of the clarifier have been well documented [17,18]. In contrast to the primary rectangular clarifier-type, the hopper in Gould Type I clarifier is located at the end of the clarifier, and the sludge scraper trans-fers the settled MLSS in the same direction as the fluid flow at the bottom of the clarifier. The inflow to the clarifier must pass through the inlet diffuser, which is called the EDI, as shown in Figure 2. Three EDIs are attached to the front wall of each clarifier and the inlet pipe diameter of each EDI is 610 mm. The EDIs and hopper locations play important roles in producing effluents with constantly low SS concentrations.
Figure 1. Longitudinal view of the secondary clarifier and porous inlet wall at plant A.
2.2. Plant B—With Gould Type I Secondary Clarifier
Plant B has been in service since 2010 and is located in northern Seoul. The designcapacity of this plant is 14,000 m3/day for the daily maximum flow and 11,200 m3/day forthe average daily flow. The main treatment process consists of two trains, each comprisingpre-anoxic–anaerobic–anoxic–aerobic reactors, similar to the Johannesburg process [16].Each train has a clarifier with 2 bays. A total of four bays of clarifiers are installed at theplant. The total surface area of the clarifier is 751.44 m2 and the corresponding SOR for thedaily average flow is 14.9 m3/m2·day, which is well below the recommended values byMetcalf and Eddy/Aecom [15]. Table 2 presents the physical specifications of the secondaryclarifier at plant B, and Figure 2 shows the longitudinal view and energy dissipating inlet(EDI) of the Gould Type I clarifier. The physical aspects of the clarifier have been welldocumented [17,18]. In contrast to the primary rectangular clarifier-type, the hopper inGould Type I clarifier is located at the end of the clarifier, and the sludge scraper transfersthe settled MLSS in the same direction as the fluid flow at the bottom of the clarifier. Theinflow to the clarifier must pass through the inlet diffuser, which is called the EDI, as shownin Figure 2. Three EDIs are attached to the front wall of each clarifier and the inlet pipediameter of each EDI is 610 mm. The EDIs and hopper locations play important roles inproducing effluents with constantly low SS concentrations.
When MLSS flow enters EDI, the plate at the end of EDI blocks the flow and MLSSspreads into four (4) outlet wings which are attached to the end plate of EDI. EDI convertsMLSS flow direction from horizontal to vertical. Through this conversion, MLSS is spreadalong with the front wall of the clarifier. Normally there are three EDIs at each clarifier. Theoutlet wings of each EDI are aligned and MLSS from outlets at each EDI collide. Two EDIslocated near the side walls of the clarifier send MLSS toward side walls through two (2)outlet wings of each EDI. EDI converts flow direction and spreads MLSS throughout thewhole cross-section of the clarifier. Due to high velocity within EDI, no operational problemsuch as MLSS deposit is reported.
While EDI spreads MLSS along with the front wall, a porous inlet plate injects MLSSinto the clarifier through holes. If porous inlet plate is used instead of EDI, high horizontal

Water 2022, 14, 1577 5 of 20
velocity is expected at Gould Type I clarifier. For Gould Type I clarifier, MLSS must beentered through EDIs.
Table 2. Design specifications of the Gould Type I secondary clarifier at plant B.
Item Values Remarks
Design flowMaximum day flow 14,000 m3/day
Average daily flow 11,200 m3/day
Secondaryclarifier
Number of units 4
Width 6.2 m
Length 30.3 m
Effective depth 3.5 m
Total surface area 751.44 m2
Design SOR
For Maximum day flow 18.6 m3/m2·day
For Daily Average flow 14.9 m3/m2·day 24–32 m3/m2·day isrecommended [15]
Water 2022, 14, x FOR PEER REVIEW 5 of 20
Table 2. Design specifications of the Gould Type I secondary clarifier at plant B.
Item Values Remarks
Design flow Maximum day flow 14,000 m3/day Average daily flow 11,200 m3/day
Secondary clarifier
Number of units 4 Width 6.2 m Length 30.3 m
Effective depth 3.5 m Total surface area 751.44 m2
Design SOR For Maximum day flow 18.6 m3/m2·day
For Daily Average flow 14.9 m3/m2·day 24–32 m3/m2·day is rec-ommended [15]
Figure 2. Longitudinal view of Gould Type I secondary clarifier and energy dissipating inlet (EDI) at plant B.
When MLSS flow enters EDI, the plate at the end of EDI blocks the flow and MLSS spreads into four (4) outlet wings which are attached to the end plate of EDI. EDI converts MLSS flow direction from horizontal to vertical. Through this conversion, MLSS is spread along with the front wall of the clarifier. Normally there are three EDIs at each clarifier. The outlet wings of each EDI are aligned and MLSS from outlets at each EDI collide. Two EDIs located near the side walls of the clarifier send MLSS toward side walls through two (2) outlet wings of each EDI. EDI converts flow direction and spreads MLSS throughout the whole cross-section of the clarifier. Due to high velocity within EDI, no operational problem such as MLSS deposit is reported.
While EDI spreads MLSS along with the front wall, a porous inlet plate injects MLSS into the clarifier through holes. If porous inlet plate is used instead of EDI, high horizontal velocity is expected at Gould Type I clarifier. For Gould Type I clarifier, MLSS must be entered through EDIs.
Figure 2. Longitudinal view of Gould Type I secondary clarifier and energy dissipating inlet (EDI) atplant B.
3. Results and Discussion3.1. Experimental and Operational Data from Plant A
Supplementary Table S1 presents the diurnal secondary effluent SS concentrations andthe corresponding hourly inflow at plant A, and Figure 3 shows the diurnal variation inSS concentrations. From the table and figure, it can be noticed that SS concentrations arehighly variable and each sampling day has a sudden rise in SS concentration, except for21 January 2020. To determine the cause of diurnal variation and peak SS concentration,the average hourly SS concentration was calculated, and the impact of loading on the SSconcentration was investigated. Table 3 presents the daily MLSS concentration and RASflow ratios of the influent during the sampling period. From these data and the hourlyaverage inflow presented in Table 4, the hourly SORs and SLRs are calculated based on the

Water 2022, 14, 1577 6 of 20
total surface area of the clarifier, which is 2048 m2. Since MLSS concentration is changeddaily, an average MLSS concentration from the beginning and ending days of samplingis used for the SLR calculation. Table 4 shows the estimated average hourly secondaryeffluent SS concentrations, influent flow rates, SORs, and SLRs for each sampling hour. Thehourly influent flow is divided by the total surface area to calculate the SOR. Because theRAS pump is adjusted daily, the hourly RAS flow is assumed to be constant throughoutthe respective sampling day. For example, the hourly RAS flow is estimated at 849.75 m3/hon 9 January 2020, which is calculated as the RAS flow of 20,394 m3/day divided by 24 h.The total hourly inflow to the secondary clarifier is the sum of the influent flow and theestimated RAS flow for the respective sampling hours. The daily MLSS concentration inthe bioreactor, which is measured by the operation staff on the sampling day, is to calculatethe solid loading. Figure 4 presents the average hourly secondary effluent SS concentrationat each sampling hour, along with the corresponding estimated hourly average SORs andSLRs during the sampling period. Figure 4 reveals that the hourly SORs change in thesame pattern as hourly SLRs, and secondary effluent SS concentrations are highly relatedto SORs and SLRs.
Water 2022, 14, x FOR PEER REVIEW 6 of 20
3. Results and Discussion 3.1. Experimental and Operational Data from Plant A
Supplementary Table S1 presents the diurnal secondary effluent SS concentrations and the corresponding hourly inflow at plant A, and Figure 3 shows the diurnal variation in SS concentrations. From the table and figure, it can be noticed that SS concentrations are highly variable and each sampling day has a sudden rise in SS concentration, except for 21 January 2020. To determine the cause of diurnal variation and peak SS concentra-tion, the average hourly SS concentration was calculated, and the impact of loading on the SS concentration was investigated. Table 3 presents the daily MLSS concentration and RAS flow ratios of the influent during the sampling period. From these data and the hourly average inflow presented in Table 4, the hourly SORs and SLRs are calculated based on the total surface area of the clarifier, which is 2048 m2. Since MLSS concentration is changed daily, an average MLSS concentration from the beginning and ending days of sampling is used for the SLR calculation. Table 4 shows the estimated average hourly sec-ondary effluent SS concentrations, influent flow rates, SORs, and SLRs for each sampling hour. The hourly influent flow is divided by the total surface area to calculate the SOR. Because the RAS pump is adjusted daily, the hourly RAS flow is assumed to be constant throughout the respective sampling day. For example, the hourly RAS flow is estimated at 849.75 m3/h on 9 January 2020, which is calculated as the RAS flow of 20,394 m3/day divided by 24 h. The total hourly inflow to the secondary clarifier is the sum of the influent flow and the estimated RAS flow for the respective sampling hours. The daily MLSS con-centration in the bioreactor, which is measured by the operation staff on the sampling day, is to calculate the solid loading. Figure 4 presents the average hourly secondary effluent SS concentration at each sampling hour, along with the corresponding estimated hourly average SORs and SLRs during the sampling period. Figure 4 reveals that the hourly SORs change in the same pattern as hourly SLRs, and secondary effluent SS concentrations are highly related to SORs and SLRs.
Figure 3. Diurnal variation of secondary effluent SS concentrations at the secondary clarifier at plant A during the sampling period. Figure 3. Diurnal variation of secondary effluent SS concentrations at the secondary clarifier at plantA during the sampling period.
The hourly changes in the secondary effluent SS concentration at plant A can beexplained by the configuration of the secondary clarifier. Plant A has a primary rectangularclarifier-type secondary clarifier, in which the direction of fluid flow is opposite to that ofthe sludge scraper at the bottom of the clarifier. This opposite direction of fluid againstthat of the settled MLSS prevents the rapid removal of settled MLSS and creates a settledMLSS blanket at the bottom of the clarifier. The geometric characteristics of the primaryrectangular clarifier-type secondary clarifier cannot avoid settled MLSS blankets, andendogenous denitrification within this blanket causes sludge to rise. The risen settled MLSSflocs are released as SS in the effluent. In addition, the increasing inflow rate affects thesecondary effluent SS concentrations. Whenever there is a settled MLSS blanket in the

Water 2022, 14, 1577 7 of 20
clarifier, the secondary effluent SS concentration increased rapidly when the increasedinflow rate is sufficiently high to push the settled MLSS to the end of the clarifier.
Table 3. Daily inflows, RAS flows, RAS ratios, and MLSS concentrations on respective sampling daysat plant A.
Date
ItemsInflow
m3/DayRAS Flow
m3/DayRAS Ratio
%MLSS Conc.
mg/L
AverageMLSS Conc.
mg/L
9 January 2000 38,970 20,394 52.3 37383750
10 January 2000 37,280 22,344 59.9 3763
13 January 2000 36,670 21,512 58.7 38083790
14 January 2000 36,880 19,383 52.6 3773
21 January 2000 36,350 18,833 51.8 36883746
22 January 2000 35,580 19,005 53.4 3805
4 February 2000 35,750 19,640 54.9 36683713
5 February 2000 34,640 20,370 58.8 3758
13 February 2000 33,840 18,340 54.2 37033680
14 February 2000 34,210 18,829 55.0 3658
18 February 2000 34,650 19,409 56.0 36683684
19 February 2000 34,900 20,501 58.7 3700
27 February 2000 34,770 20,137 57.9 36183563
28 February 2000 34,210 19,492 57.0 3508
5 March 2000 34,100 19,059 55.9 35503545
6 March 2000 33,630 18,554 55.2 3540
12 March 2000 34,140 18,887 55.3 35233524
13 March 2000 34,100 18,316 53.7 3525
Average 35,259 19,611 55.6 3666 3666
Maximum 38,970 22,344 59.9 3808 3790
Minimum 33,630 18,316 51.8 3508 3524
Note: Conc. is concentration.
The hourly average secondary effluent SS concentration shown in Figure 4 continu-ously increases from 20 mg/L to 30 mg/L from 11:00 to 23:00, even though the loading tothe clarifier is constant. The rising sludge is believed to cause the high secondary effluentSS concentration. It is believed that the settled MLSS accumulates at the bottom of theclarifier because the sludge scraper in the primary rectangular clarifier-type secondaryclarifier cannot transfer settled MLSS to the hopper immediately. The opposite direction ofsettled MLSS and fluid flow at the bottom of the clarifier allows the leftover settled MLSS toaccumulate until the loading is subsided. Although the depth of the sludge blanket is notmeasured, it is believed that the depth increases during that period. As more settled MLSSaccumulates, the rate of sludge rising increases, leading to an increase in the secondaryeffluent SS concentration, as shown in Figure 4.
From 00:00 to 05:00, the loading to the clarifier is reduced, and the hourly averagesecondary effluent SS concentration drops significantly from 42 mg/L to 24 mg/L. Duringthis period, it is believed that the rate of transfer of settled MLSS to the hopper is higherthan the rate of accumulation of settled MLSS at the bottom of the clarifier; therefore, thedepth of the settled MLSS blank decreases. It is assumed that the depth is very thin, whichreduces the sludge rising. As the loading to the clarifier decreases, the sludge rising isreduced and, eventually, the secondary effluent SS concentration is declined.

Water 2022, 14, 1577 8 of 20
Table 4. Average hourly secondary effluent SS concentrations and corresponding average hourlyinflows, SORs, and SLRs at the secondary clarifier at plant A.
Sampling TimeEffluent SS
Concentrationmg/L
Inflowm3/h
SORm3/m2·h
SLRkg/m2·day
11:00 20.5 1860 21.8 115.0
12:00 13.3 1858 21.8 114.9
13:00 18.6 1860 21.8 115.0
14:00 14.4 1874 22.0 115.6
15:00 17.6 1861 21.8 115.0
16:00 24.4 1788 21.0 111.9
17:00 24.4 1758 20.6 110.6
18:00 23.6 1744 20.4 110.0
19:00 23.3 1751 20.5 110.3
20:00 22.3 1773 20.8 111.3
21:00 29.6 1806 21.2 112.7
22:00 27.1 1722 20.2 109.1
23:00 42.4 1329 15.6 92.2
0:00 35.3 1079 12.6 81.5
1:00 36.2 992 11.6 77.8
2:00 36.0 920 10.8 74.7
3:00 30.9 824 9.7 70.6
4:00 26.5 740 8.7 67.0
5:00 24.2 649 7.6 63.1
6:00 30.9 667 7.8 63.8
7:00 36.6 1207 14.1 87.0
8:00 35.9 1609 18.9 104.4
9:00 22.5 1793 21.0 112.3
10:00 16.2 1822 21.4 113.5
Average 26.3 1470.3 17.2 98.3
Maximum 42.4 1874.4 21.0 115.6
Minimum 13.2 648.9 7.6 63.1
Note: Average MLSS concentrations from Table 4 is used to calculate the SLR for the respective sampling day.
When the loading to the clarifier is increased in the morning hours, there are twodistinct aspects of the secondary effluent SS concentration. Hourly average secondaryeffluent SS concentration increases to 36 mg/L from 24 mg/L during 05:00–07:00 as SORand SLR increase from 7.8 to 14.1 m3/m2·day and from 63.1 to 87.0 kg/m2·day, respectively.However, the hourly average secondary effluent SS concentration decreases from 35.9 to16.2 mg/L during 08:00–10:00 when the SOR and SLR increase from 18.9 to 21.4 m3/m2·dayand from 104.4 to 113.5 kg/m2·day, respectively. It seems that simply increasing the loadingto the clarifier does not bring about a high secondary effluent SS concentration and that therate of loading increase plays an important role in the secondary effluent SS concentrations.From 05:00 to 07:00, the hourly increases in SOR and SLR are 3.2 m3/m2·day per hour and12.0 kg/m2·day per hour, respectively. However, the hourly increases in SOR and SLRfrom 08:00 to 10:00 are 1.3 m3/m2·day per hour and 4.6 kg/m2·day per hour, respectively,which are about one-third of the corresponding increase from 05:00 to 07:00. The hourly

Water 2022, 14, 1577 9 of 20
average secondary effluent SS concentration increases from 05:00 to 07:00. However, thehourly average secondary effluent SS concentration decreases from 08:00 to 10:00. Fromthese changes, it can be deduced that the high fluid momentum created by the increasedloading during 05:00–07:00 pushes the settled MLSS to the end of the clarifier and over theeffluent weir. This carried-over MLSS causes a high effluent SS concentration. However,the fluid momentum created by the increased loading during 08:00–10:00 is not sufficientlylarge to push the settled MLSS to the effluent weir. During this period, it is believed that theincoming MLSS settles well, and sludge rising does not occur because of the small amountof accumulated settled MLSS at the bottom of the clarifier.
Water 2022, 14, x FOR PEER REVIEW 8 of 20
4:00 26.5 740 8.7 67.0 5:00 24.2 649 7.6 63.1 6:00 30.9 667 7.8 63.8 7:00 36.6 1207 14.1 87.0 8:00 35.9 1609 18.9 104.4 9:00 22.5 1793 21.0 112.3 10:00 16.2 1822 21.4 113.5
Average 26.3 1470.3 17.2 98.3 Maximum 42.4 1874.4 21.0 115.6 Minimum 13.2 648.9 7.6 63.1
Note: Average MLSS concentrations from Table 4 is used to calculate the SLR for the respective sampling day.
Figure 4. Average hourly effluent SS concentrations with average hourly SORs and SLRs at the sec-ondary clarifier at plant A.
The hourly changes in the secondary effluent SS concentration at plant A can be ex-plained by the configuration of the secondary clarifier. Plant A has a primary rectangular clarifier-type secondary clarifier, in which the direction of fluid flow is opposite to that of the sludge scraper at the bottom of the clarifier. This opposite direction of fluid against that of the settled MLSS prevents the rapid removal of settled MLSS and creates a settled MLSS blanket at the bottom of the clarifier. The geometric characteristics of the primary rectangular clarifier-type secondary clarifier cannot avoid settled MLSS blankets, and en-dogenous denitrification within this blanket causes sludge to rise. The risen settled MLSS flocs are released as SS in the effluent. In addition, the increasing inflow rate affects the secondary effluent SS concentrations. Whenever there is a settled MLSS blanket in the clarifier, the secondary effluent SS concentration increased rapidly when the increased inflow rate is sufficiently high to push the settled MLSS to the end of the clarifier.
Figure 4. Average hourly effluent SS concentrations with average hourly SORs and SLRs at thesecondary clarifier at plant A.
For a typical secondary clarifier design, the recommended SOR for biological nutrientremoval processes, such as plant A, ranges from 24 to 32 m3/m2·day at average flowand from 42 to 64 m3/m2·day at peak flow [15]. The recommended design SLR valuesrange from 120 to 192 kg/m2·day at average daily flow, and 240 kg/m2·day at peakflow. Because the secondary clarifier at plant A has an SOR of 21 m3/m2·day and an SLRof 115.6 kg/m2·day at peak flow during the study period, this clarifier is assumed to beoperated at well under the recommended loading conditions. Also, the average hourly SORvalues range from 7.6 to 21.0 m3/m2·day with an average value of 17.2 m3/m2·day and theaverage hourly SLR values range from 63.1 to 115.6 kg/m2·day, with an average value of98.3 kg/m2·day. From these values, the ratios of maximum to minimum average hourlySORs and SLRs are 2.9 and 1.8, respectively. The ratio of 2.9 and 1.8 indicate approximatelya threefold variation in inflow to the plant, and a twofold variation in loading to the clarifierwithin a day, respectively. Thus, the diurnal loading of the secondary clarifier at plant Ais highly variable. The ratio of maximum to minimum average hourly secondary effluentSS concentrations is 3.2, implying that the variation in SS concentration is higher than that

Water 2022, 14, 1577 10 of 20
of both SOR and SLR. From these data, it can be inferred that other factors, such as risingsludge, affect the effluent SS concentration along with the loading variation.
Table 3 shows daily MLSS concentrations in the bioreactor during the sampling periodat plant A. The average, maximum, and minimum MLSS concentrations are 3666; 3808;and 3508 mg/L, respectively. Table 5 presents SVI values for the corresponding samplingday. The average, maximum, and minimum SVI values are 210, 213, and 201 mL/mg,respectively. SVI is known to represent the settling characteristics of MLSS [19]. Asshown in Table 5, the SVI values are almost constant throughout the sampling period.Since SVI values above 200 mL/g are known to indicate sludge bulking by filamentousmicroorganisms [20], it can be assumed that MLSS contains filamentous microorganisms.The high SVI values at plant A can be responsible for the high effluent SS concentrations,because the operational SORs and SLRs are much lower than the recommended values.
Table 5. SVI values for respective sampling days at plant A.
Date SVImL/mg
9 January 2000 210
10 January 2000 208
13 January 2000 210
14 January 2000 209
21 January 2000 210
22 January 2000 213
4 February 2000 201
5 February 2000 212
13 February 2000 209
14 February 2000 211
18 February 2000 213
19 February 2000 211
27 February 2000 210
28 February 2000 209
5 March 2000 209
6 March 2000 207
12 March 2000 209
13 March 2000 210
Average 210
Maximum 213
Minimum 201
3.2. Experimental and Operational Data from Plant B
Supplementary Table S2 presents the diurnal secondary effluent SS concentrationsand corresponding hourly inflow at plant B and Figure 5 shows the diurnal variationin effluent SS concentration during the sampling period at plant B. In contrast to plantA, no significant diurnal secondary effluent SS concentration variation is observed inplant B. Table 6 presents the daily MLSS concentrations and RAS flow ratios during thesampling period at plant B. From this table, SORs and SLRs are calculated based on thetotal surface area of the clarifier, which is 751.4 m2. Table 7 presents average hourly effluentSS concentrations, inflow, SOR, and SLRs at each sampling hour. Similar to plant A, thedaily RAS pumping rate is provided by the plant personnel. Table 8 presents the daily SVIvalue of MLSS at the aeration tank in plant B during the sampling period.

Water 2022, 14, 1577 11 of 20Water 2022, 14, x FOR PEER REVIEW 11 of 20
Figure 5. Diurnal variation in secondary effluent SS concentrations at the secondary clarifier at plant B during the sampling period.
Table 6. Daily inflow, RAS flow, RAS ratio, and MLSS concentrations on each sampling day at plant B.
Items
Date
Inflow m3/Day
RAS Flow m3/Day
RAS Ratio %
MLSS Concentration mg/L
Average MLSS Concentration
mg/L 10 January 10, 2021 11,331 10,953 96.7 3284
3290 11 January 2021 10,800 11,392 105.5 3295 11 January 2021 10,800 11,392 105.5 3295
3287 12 January 2021 11,031 11,235 101.8 3278 12 January 2021 11,031 11,235 101.8 3278
3271 13 January 2021 11,630 12,009 103.3 3264 13 January 2021 11,630 12,009 103.3 3264
3258 14 January 2021 11,352 11,533 101.6 3251 14 January 2021 11,352 11,533 101.6 3251
3244 15 January 2021 11,185 11,612 103.8 3237 17 January 2021 11,300 11,786 104.3 3223
3216 18 January 2021 11,004 11,301 102.7 3209 18 January 2021 11,004 11,301 102.7 3209
3203 19 January 2021 10,797 11,774 109.0 3196 19 January 2021 10,797 11,774 109.0 3196
3178 20 January 2021 10,988 11,479 104.5 3160 20 January 2021 10,988 11,479 104.5 3160
3168 21 January 2021 11,055 11,820 106.9 3177 21 January 2021 11,055 11,820 106.9 3177 3172
Figure 5. Diurnal variation in secondary effluent SS concentrations at the secondary clarifier at plantB during the sampling period.
Table 6. Daily inflow, RAS flow, RAS ratio, and MLSS concentrations on each sampling day at plant B.
Date
ItemsInflow
m3/DayRAS Flow
m3/DayRAS Ratio
%MLSS Concentration
mg/L
AverageMLSS Concentration
mg/L
10 January 2021 11,331 10,953 96.7 32843290
11 January 2021 10,800 11,392 105.5 3295
11 January 2021 10,800 11,392 105.5 32953287
12 January 2021 11,031 11,235 101.8 3278
12 January 2021 11,031 11,235 101.8 32783271
13 January 2021 11,630 12,009 103.3 3264
13 January 2021 11,630 12,009 103.3 32643258
14 January 2021 11,352 11,533 101.6 3251
14 January 2021 11,352 11,533 101.6 32513244
15 January 2021 11,185 11,612 103.8 3237
17 January 2021 11,300 11,786 104.3 32233216
18 January 2021 11,004 11,301 102.7 3209
18 January 2021 11,004 11,301 102.7 32093203
19 January 2021 10,797 11,774 109.0 3196
19 January 2021 10,797 11,774 109.0 31963178
20 January 2021 10,988 11,479 104.5 3160
20 January 2021 10,988 11,479 104.5 31603168
21 January 2021 11,055 11,820 106.9 3177
21 January 2021 11,055 11,820 106.9 31773172
22 January 2021 11,084 11,589 104.6 3166
Average 11,111 11,551 104.0 3229 3229
Maximum 11,630 12,009 109.0 3295 3290
Minimum 10,797 10,953 96.7 3160 3168

Water 2022, 14, 1577 12 of 20
Table 7. Average hourly secondary effluent SS concentrations and corresponding average hourlyinflows, SORs, and SLRs at the secondary clarifier at plant B.
Sampling TimeHour
Effluent SSConcentration
mg/L
Average Hourly Inflowm3/h
SORm3/m2·h
SLRkg/m2·day
11:00 4.5 550 17.6 115.5
12:00 4.2 551 17.6 115.7
13:00 4.2 554 17.7 116.3
14:00 4.8 562 17.9 118.0
15:00 4.4 555 17.7 116.5
16:00 4.5 549 17.6 115.3
17:00 4.9 538 17.2 112.9
18:00 5.8 549 17.5 115.2
19:00 4.4 554 17.7 116.3
20:00 4.7 557 17.8 117.0
21:00 4.1 565 18.1 118.7
22:00 4.4 564 18.0 118.4
23:00 4.7 556 17.8 116.8
0:00 5.2 538 17.3 113.4
1:00 4.4 514 16.7 108.3
2:00 5.0 430 13.1 90.6
3:00 4.4 273 8.4 57.5
4:00 5.3 190 6.1 40.2
5:00 4.9 188 6.0 39.5
6:00 4.6 254 7.9 53.6
7:00 3.9 295 9.5 62.2
8:00 4.9 442 14.3 93.1
9:00 5.0 519 16.7 109.4
10:00 4.1 539 17.2 113.7
Average 4.6 474 15.1 99.8
Maximum 5.8 565 18.1 118.7
Minimum 3.9 188 6.0 39.5
Note: The average MLSS concentrations from Table 8 are used to calculate the SLR for the respective sampling day.
Figure 6 shows the time-series of average hourly secondary effluent SS concentrations,SORs, and SLRs. As displayed in the figure, secondary effluent SS concentrations arerelatively constant regardless of SOR and SLR. SOR ranges from 6.0 to 18.1 m3/m2·day,with an average value of 17.2 m3/m2·day. SLR ranges from 39.5 to 118.7 kg/m2·day,with an average value of 63.1 kg/m2·day. From these values, the ratios of maximum tominimum average hourly SOR and SLR values are 3.0 and 3.0, respectively, indicatinga threefold variation in SOR and SLR within a day. Although plant B has a similar SORratio to plant A, the ratio of SLR is 40% higher in plant B. This implies that the secondaryclarifier at plant B receives 40% more variable solid loading than plant A. The overallaverage hourly secondary effluent SS concentration is 4.6 mg/L and the maximum andminimum average hourly SS concentrations are 5.8 and 3.9 mg/L, respectively. The ratioof maximum to minimum SS concentration is 1.5, which is half the ratio of maximum tominimum SOR and SLR. From this comparison, it can be inferred that the loading variation

Water 2022, 14, 1577 13 of 20
to the secondary clarifier at plant B does not have a significant effect on the variation ineffluent SS concentration like in plant A.
Table 8. SVI values for respective sampling day at plant B.
Date SVImL/mg
10 January 2021 272
11 January 2021 273
12 January 2021 274
13 January 2021 275
14 January 2021 275
15 January 2021 276
17 January 2021 276
18 January 2021 277
19 January 2021 278
20 January 2021 279
21 January 2021 279
22 January 2021 280
Average 276
Maximum 280
Minimum 272
Table 6 presents the daily bioreactor MLSS concentrations during the sampling periodat plant B. As shown in the table, the average, maximum, and minimum MLSS concen-trations are 3229; 3295; and 3160 mg/L, respectively. Table 8 presents SVI values for thecorresponding sampling days. The average, maximum, and minimum SVI values are 276,280, and 272 mL/mg, respectively. The SVI values in plant B are relatively constant, similarto SVI values at plant A. However, at plant B, the average MLSS concentration is 11.5%lower and the SVI value is 31.3% higher in comparison to plant A. Although the MLSSconcentration in plant B is less than that in plant A, secondary clarifiers at both the plantshave similar SLRs as shown in Tables 4 and 7. This anomaly can be explained by the higherRAS ratios at plant B.
The primary rectangular clarifier-type secondary clarifier at Plant A cannot operatewith a high RAS ratio. The transportation of settled MLSS to the hopper needs more timethan at Gould Type I secondary clarifier, since settled MLSS is moved toward the hopperagainst the direction of flow on the bottom of clarifier. When the RAS ratio is high atthis type of clarifier, the hopper cannot have settled MLSS, and the MLSS with the sameconcentration of inflow to the clarifier will be RAS. Since RAS is diluted with influentto the bioreactor, the high concentration of MLSS in RAS has to be maintained to keep adesired MLSS concentration in the bioreactor. It is believed that Plant A can only afford theRAS ratios in Table 4 due to the shape of the primary rectangular clarifier-type secondaryclarifier. If RAS ratios are higher than those in Table 4, there is no means to sustain theMLSS concentrations presented in Table 3.
Table 9 presents SVI values of Plant A and B. As shown on this table, the MLSS atPlant B has higher SVI values that those in Plant A.

Water 2022, 14, 1577 14 of 20
Water 2022, 14, x FOR PEER REVIEW 13 of 20
17 January 2021 276 18 January 2021 277 19 January 2021 278 20 January 2021 279 21 January 2021 279 22 January 2021 280
Average 276 Maximum 280 Minimum 272
Figure 6 shows the time-series of average hourly secondary effluent SS concentra-tions, SORs, and SLRs. As displayed in the figure, secondary effluent SS concentrations are relatively constant regardless of SOR and SLR. SOR ranges from 6.0 to 18.1 m3/m2·day, with an average value of 17.2 m3/m2·day. SLR ranges from 39.5 to 118.7 kg/m2·day, with an average value of 63.1 kg/m2·day. From these values, the ratios of maximum to mini-mum average hourly SOR and SLR values are 3.0 and 3.0, respectively, indicating a three-fold variation in SOR and SLR within a day. Although plant B has a similar SOR ratio to plant A, the ratio of SLR is 40% higher in plant B. This implies that the secondary clarifier at plant B receives 40% more variable solid loading than plant A. The overall average hourly secondary effluent SS concentration is 4.6 mg/L and the maximum and minimum average hourly SS concentrations are 5.8 and 3.9 mg/L, respectively. The ratio of maxi-mum to minimum SS concentration is 1.5, which is half the ratio of maximum to minimum SOR and SLR. From this comparison, it can be inferred that the loading variation to the secondary clarifier at plant B does not have a significant effect on the variation in effluent SS concentration like in plant A.
Figure 6. Average hourly effluent SS concentration along with average hourly SOR and SLR at the secondary clarifier at plant B. Figure 6. Average hourly effluent SS concentration along with average hourly SOR and SLR at the
secondary clarifier at plant B.
Table 9. SVI values for respective sampling day at plant A and B.
Plant A Plant B
Date SVImL/mg Date SVI
mL/mg
9 January 2000 210 10 January 2021 272
10 January 2000 208 11 January 2021 273
13 January 2000 210 12 January 2021 274
14 January 2000 209 13 January 2021 275
21 January 2000 210 14 January 2021 275
22 January 2000 213 15 January 2021 276
4 February 2000 201 17 January 2021 276
5 February 2000 212 18 January 2021 277
13 February 2000 209 19 January 2021 278
14 February 2000 211 20 January 2021 279
18 February 2000 213 21 January 2021 279
19 February 2000 211 22 January 2021 280
27 February 2000 210
28 February 2000 209
5 March 2000 209
6 March 2000 207
12 March 2000 209
13 March 2000 210
Average 210 276
Maximum 213 280
Minimum 201 272

Water 2022, 14, 1577 15 of 20
3.3. Secondary Effluent SS Concentrations Comparison by Experimental Data of Plants A and B
Tables 4 and 7 show the average hourly effluent SS concentrations, inflows, SLRs,and SORs for the rectangular primary clarifier-type and Gould Type I secondary clarifiers,respectively. From these tables, the overall average hourly SOR of the rectangular primaryclarifier-type secondary clarifier is 17.2 m3/m2·day, which 1 s 10.8% higher than that ofGould Type I clarifier, which is 15.1 m3/m2·day. However, the overall average hourly SLRof rectangular primary clarifier type secondary clarifier (98.3 kg/m2·day) is 0.5% lowerthan that of Gould Type I clarifier (99.8 kg/m2·day). This discrepancy between the SORand SLR lies in the RAS ratio difference between plants A and B. Because plant B has higherRAS ratios than those of plant A, plant B has a slightly higher overall average hourly SLRthan that of plant A.
Since the purpose of a secondary clarifier is the settling of MLSS, the SLR is consid-ered a more important design and operational factor than the SOR [21]. As discussed inSection 3.2, plant B has a higher ratio of maximum to minimum hourly average SLR valuesthan that of plant A, and higher SVI values. The higher ratio can be attributed to a morevariable MLSS load. The higher MLSS loading variation and SVI values imply that plantB has poorer operational conditions than plant A. However, plant B always has lowersecondary effluent SS concentrations. From the diurnal SLR variation and SVI values, itcan be concluded that plant A has better operational conditions for settling MLSS at thesecondary clarifier. However, the effluent SS concentrations from plant B are consistentlylower than those from plant A, regardless of the higher SLR variation and SVI values. Theconstantly low effluent SS concentrations from plant B can only be explained by the shapeof the secondary clarifier. The concurrent movement of settled MLSS by the sludge scraperto the hopper at the bottom of the Gould Type I clarifier is believed to play an importantrole in maintaining consistently low effluent SS concentrations.
3.4. Computational Fluid Dynamic Simulation Results
CFD simulation is used to observe the movement of fluid and particles in the clarifiers.A simulation package developed by McCorquodale et al. [13] is used to determine theoperational differences in the clarifier type. Because this simulation package can handleonly two dimensions, an inlet wall with one slot is incorporated in the Gould Type I clarifiersimulation for the EDI. For the primary rectangular-type clarifier, a vertical wall withmultiple holes, as explained in Section 2.2, is incorporated for simulation. The physicalspecifications for both clarifiers, which are presented in Tables 1 and 2, are used as inputdata for each simulation. The empirical settling equation (Equation (1)), which is presentedby Takacs et al. [22], is incorporated to express the MLSS settling in the secondary clarifiers.Coefficients of (Equation (1)) are adopted from Lee [23], and are presented in Table 10. Toobserve the difference in secondary effluent SS concentrations, the same constants are usedfor both types of clarifier simulations.
Vs = Vo
(e−K1 (X−Xmin) − e−K2 (X−Xmin)
)(1)
where Vo = Stokes velocity (settling velocity of a single particle in clear water) (m/h),K1 = empirical coefficient for rapidly settling flocs resulting from the fit of batch settlingdata (m3/kg), Xmin = the concentration of non-settling flocs (kg/m3), and K2 = a settlingexponent for the poorly settling particles (m3/kg).
Figure 7 shows the simulation results depicting the settled MLSS blanket according tothe clarifier type. The settled MLSS blanket depth in the Gould Type I clarifier was muchshallower than that in the primary rectangular clarifier-type. Endogenous denitrificationwithin the blanket was susceptible in the MLSS blanket in primary rectangular clarifier-type. As explained previously, sludge rise can occur by endogenous denitrification withinthe settled MLSS. Because the CFD simulation in this study could not handle biologicalreactions, sludge rising caused by endogenous denitrification cannot be illustrated. Fromthe operation data and simulation results, it is believed that a high depth of settled MLSS

Water 2022, 14, 1577 16 of 20
blanket encourages endogenous denitrification at the bottom of the clarifier, resulting inhigh effluent SS concentrations in the primary rectangular clarifier-type secondary clarifier.
Table 10. Solid settling parameters used in computerized fluid dynamics (CFD) simulation.
ElementsValues
RemarksPlant A Plant B
MLSS (kg/m3) 3.400 3.300
ESS (kg/m3) 0.005 Xmin in Equation (1)
Vo (m/h) 14.718
K1 (m3/kg) 0.484
K2 (m3/kg) 9.500
Water 2022, 14, x FOR PEER REVIEW 16 of 20
K1 (m3/kg) 0.484 K2 (m3/kg) 9.500
Figure 7 shows the simulation results depicting the settled MLSS blanket according to the clarifier type. The settled MLSS blanket depth in the Gould Type I clarifier was much shallower than that in the primary rectangular clarifier-type. Endogenous denitrifi-cation within the blanket was susceptible in the MLSS blanket in primary rectangular clar-ifier-type. As explained previously, sludge rise can occur by endogenous denitrification within the settled MLSS. Because the CFD simulation in this study could not handle bio-logical reactions, sludge rising caused by endogenous denitrification cannot be illustrated. From the operation data and simulation results, it is believed that a high depth of settled MLSS blanket encourages endogenous denitrification at the bottom of the clarifier, result-ing in high effluent SS concentrations in the primary rectangular clarifier-type secondary clarifier.
(a)
(b)
Figure 7. (a) Two-dimensional SS concentration contour profile for the secondary clarifier at plant A.(b) Two-dimensional SS concentration contour profile for the secondary clarifier at Plant B.
Figure 8 shows the simulation results of hourly effluent SS concentrations profileat primary rectangular-type secondary clarifier along with hourly SORs and SLRs. The
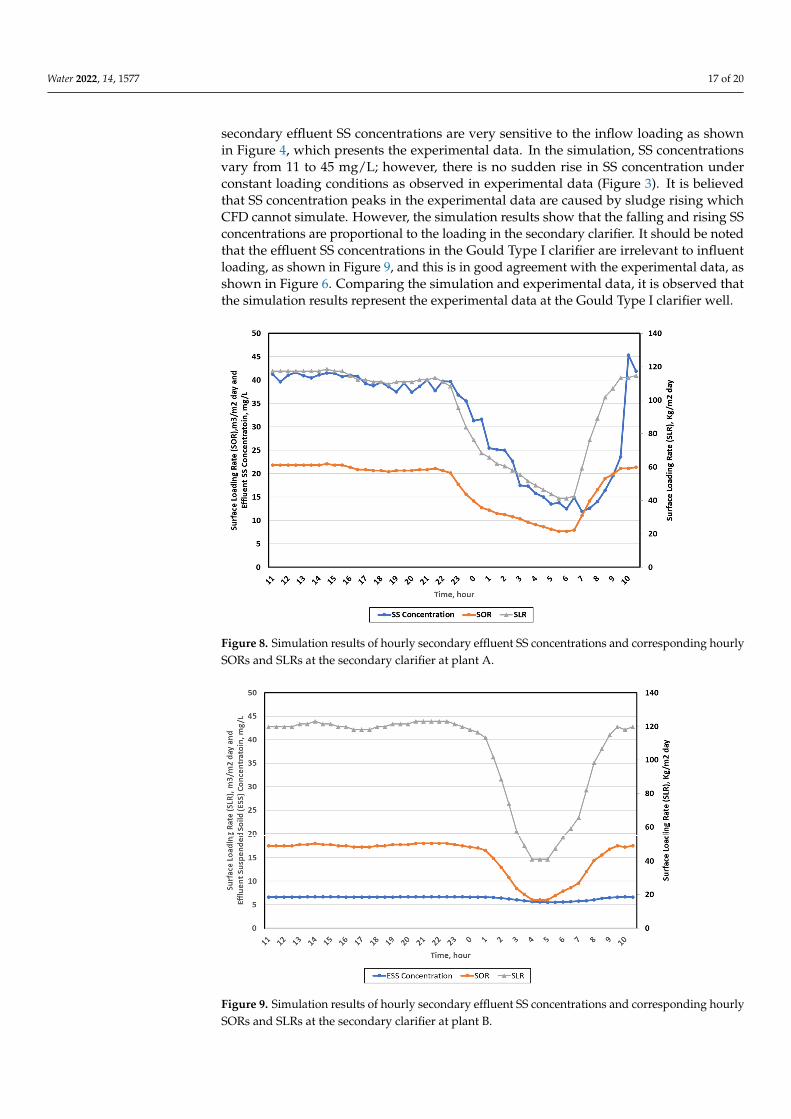
Water 2022, 14, 1577 17 of 20
secondary effluent SS concentrations are very sensitive to the inflow loading as shownin Figure 4, which presents the experimental data. In the simulation, SS concentrationsvary from 11 to 45 mg/L; however, there is no sudden rise in SS concentration underconstant loading conditions as observed in experimental data (Figure 3). It is believedthat SS concentration peaks in the experimental data are caused by sludge rising whichCFD cannot simulate. However, the simulation results show that the falling and rising SSconcentrations are proportional to the loading in the secondary clarifier. It should be notedthat the effluent SS concentrations in the Gould Type I clarifier are irrelevant to influentloading, as shown in Figure 9, and this is in good agreement with the experimental data, asshown in Figure 6. Comparing the simulation and experimental data, it is observed thatthe simulation results represent the experimental data at the Gould Type I clarifier well.
Water 2022, 14, x FOR PEER REVIEW 17 of 20
Figure 7. (a) Two-dimensional SS concentration contour profile for the secondary clarifier at plant A. (b) Two-dimensional SS concentration contour profile for the secondary clarifier at Plant B.
Figure 8 shows the simulation results of hourly effluent SS concentrations profile at primary rectangular-type secondary clarifier along with hourly SORs and SLRs. The sec-ondary effluent SS concentrations are very sensitive to the inflow loading as shown in Figure 4, which presents the experimental data. In the simulation, SS concentrations vary from 11 to 45 mg/L; however, there is no sudden rise in SS concentration under constant loading conditions as observed in experimental data (Figure 3). It is believed that SS con-centration peaks in the experimental data are caused by sludge rising which CFD cannot simulate. However, the simulation results show that the falling and rising SS concentra-tions are proportional to the loading in the secondary clarifier. It should be noted that the effluent SS concentrations in the Gould Type I clarifier are irrelevant to influent loading, as shown in Figure 9, and this is in good agreement with the experimental data, as shown in Figure 6. Comparing the simulation and experimental data, it is observed that the sim-ulation results represent the experimental data at the Gould Type I clarifier well.
Figure 8. Simulation results of hourly secondary effluent SS concentrations and corresponding hourly SORs and SLRs at the secondary clarifier at plant A. Figure 8. Simulation results of hourly secondary effluent SS concentrations and corresponding hourlySORs and SLRs at the secondary clarifier at plant A.
Water 2022, 14, x FOR PEER REVIEW 18 of 20
Figure 9. Simulation results of hourly secondary effluent SS concentrations and corresponding hourly SORs and SLRs at the secondary clarifier at plant B.
Figure 10 presents simulation results as normalized effluent SS concentrations and normalized SLRs for the respective clarifier type. For normalized SLRs, Plant A and B have ranges from 0.44 to 1.28 and from 0.40 and 1.19, respectively. For normalized SS concentrations, Plant A and B have ranges from 0.38 to 1.44 and from 0.85 to 1.04, respec-tively. Simulation results show that the difference in normalized SS concentrations at Plant B is small compared with those at Plant B, although normalized SLRs are similar for both types. Simulation shows that effluent SS concentration at Gould Type I clarifier is very resilient against SLR variation.
Figure 10. Normalized hourly effluent SS concentrations and SLRs at Plants A and B.
Figure 9. Simulation results of hourly secondary effluent SS concentrations and corresponding hourlySORs and SLRs at the secondary clarifier at plant B.

Water 2022, 14, 1577 18 of 20
Figure 10 presents simulation results as normalized effluent SS concentrations andnormalized SLRs for the respective clarifier type. For normalized SLRs, Plant A andB have ranges from 0.44 to 1.28 and from 0.40 and 1.19, respectively. For normalizedSS concentrations, Plant A and B have ranges from 0.38 to 1.44 and from 0.85 to 1.04,respectively. Simulation results show that the difference in normalized SS concentrations atPlant B is small compared with those at Plant B, although normalized SLRs are similar forboth types. Simulation shows that effluent SS concentration at Gould Type I clarifier is veryresilient against SLR variation.
Water 2022, 14, x FOR PEER REVIEW 18 of 20
Figure 9. Simulation results of hourly secondary effluent SS concentrations and corresponding hourly SORs and SLRs at the secondary clarifier at plant B.
Figure 10 presents simulation results as normalized effluent SS concentrations and normalized SLRs for the respective clarifier type. For normalized SLRs, Plant A and B have ranges from 0.44 to 1.28 and from 0.40 and 1.19, respectively. For normalized SS concentrations, Plant A and B have ranges from 0.38 to 1.44 and from 0.85 to 1.04, respec-tively. Simulation results show that the difference in normalized SS concentrations at Plant B is small compared with those at Plant B, although normalized SLRs are similar for both types. Simulation shows that effluent SS concentration at Gould Type I clarifier is very resilient against SLR variation.
Figure 10. Normalized hourly effluent SS concentrations and SLRs at Plants A and B. Figure 10. Normalized hourly effluent SS concentrations and SLRs at Plants A and B.
4. Conclusions
To determine the difference in performance between secondary clarifier types, primaryrectangular clarifier-type and Gould Type I secondary clarifiers were studied. Effluentsfrom both types of secondary clarifiers were collected hourly for two weeks to measureSS concentrations and CFD simulations for both types were also conducted. In addition,clarifier operation data were evaluated to determine the effect of loading variation insecondary clarifiers on effluent SS concentrations. Based on this evaluation, the findingsare summarized as follows:
SS concentrations in effluents from Gould Type I were relatively constant, althoughthe variation in solid loading in this clarifier was greater than that in primary rectangularclarifier-type secondary clarifiers. For Gould Type I clarifier, the cocurrent flow of fluidand movement of settled MLSS on the bottom of clarifier was believed to resist the highvariation in the solid load rate ratio (maximum to minimum SLR ratio of 3.0). The ratioof maximum to minimum SLR was 1.8 for the primary rectangular clarifier-type (40%lower than that of Gould Type I). The maximum ESS concentration in Gould Type I was12.0 mg/L, whereas the maximum ESS concentration in primary rectangular-type clarifierwith a similar average SLR was 130.0 mg/L. These experimental data prove that the GouldType I clarifier produces effluents with a constantly low SS concentration under highlyvariable loading conditions.
As shown in the experimental data, the CFD simulation shows highly fluctuating andhigh effluent SS concentrations in the primary rectangular clarifier-type secondary clarifier.However, the Gould Type I clarifier shows consistently low effluent SS concentrations.The simulation showed a thick settled MLSS blanket at the bottom of the clarifier in theprimary rectangular clarifier-type secondary clarifier. This thick blanket is believed to

Water 2022, 14, 1577 19 of 20
have undergone endogenous denitrification, which caused sludge to rise. Sludge rising isbelieved to cause extremely high ESS concentrations, as shown in the experimental data.
Primary rectangular clarifier-type secondary clarifiers are commonly adopted in SouthKorea. Many treatment facilities with this type of secondary clarifier experience fluctuatingand high secondary effluent SS concentrations during winters. From the observations andsimulation results, it is highly recommended to convert the existing primary rectangularclarifier-type clarifiers to Gould Type I to produce the effluent having consistently low SSconcentrations.
Supplementary Materials: The following are available online at https://www.mdpi.com/article/10.3390/w14101577/s1, Table S1: Diurnal secondary effluent SS concentrations and inflows duringsampling period at plant A, Table S2: Diurnal secondary effluent SS concentrations and inflowsduring sampling period at Plant B during.
Funding: This research was funded by Kyonggi University Research Grant grant number 2019-001.
Institutional Review Board Statement: Not applicable.
Informed Consent Statement: Not applicable.
Acknowledgments: This work was supported by a Kyonggi University Research Grant (2019). Theauthor would like to thank Kyoon Bum Choi, Seung Won Seo, and Sung-Chul Jung at the Departmentof Environmental Energy Engineering of Kyonggi University and the wastewater treatment plantstaff who provided the operation data. Also, I would like to acknowledge the late Randal WayneSamstag who inspired me to pursue this study.
Conflicts of Interest: The authors declare no conflict of interest.
References1. Peavy, H.S.; Rowe, D.R.; Tchobanoglous, G. Environmental Engineering; McGraw-Hill Publishing Company: New York, NY, USA,
1985; pp. 234–235.2. Qasim, S.R. Wastewater Treatment Plants—Planning, Design and Operation; Technomic Publishing Company: Lancaster, PA, USA,
1999; pp. 921–926.3. Water Pollution Control Federation. Clarifier Design; Water Pollution Control Federation: Washington, DC, USA, 1985; pp. 51–72.4. Water Environmental Federation. Clarifier Design, 2nd ed.; McGraw-Hill: New York, NY, USA, 2006; pp. 492–495.5. ENVINEWS. Available online: http://www.envinews.co.kr/news/articleView.html?idxno=75 (accessed on 9 February 2022).
(In Korean)6. Grady, C.P.L., Jr.; Daigger, G.T.; Lim, H.C. Biological Wastewater Treatment, 2nd ed.; Marcel Dekker, Inc.: New York, NY, USA, 1999;
pp. 208–212.7. Eckenfelder, W.W.; Grau, P. Activated Sludge Process Design and Control-Theory and Practice; Technomic Publishing Company:
Lancaster, PA, USA, 1998; p. 73.8. Al-Shammari, S.B.; Shahalam, A. Analysis of Sludge Settling and Rising Behavior in Sewage Treatment Plant in Kuwait. J. Environ.
Sci. Eng. 2018, B7, 141–148. [CrossRef]9. Liquid Stream Fundamentals: Sedimentation. Available online: https://www.wef.org/globalassets/assets-wef/direct-download-
library/public/03---resources/wsec-2017-fs-022-liquid-stream-fundamentals--clarification-sedimentation_final.pdf (accessedon 9 February 2022).
10. Lee, B. Evaluating Two Types of Rectangular Secondary Clarifier Performance at Biological Nutrient Removal Facilities. J. KoreanSoc. Water Wastewater 2013, 27, 561–570. (In Korean) [CrossRef]
11. Wahlberg, E.J. WERF/CRTC Protocols for Evaluating Secondary Clarifier Performance; Water Environment Research Foundation:Alexandria, VA, USA, 2001; p. C2-55.
12. American Public Health Association; American Water Works Association; Water Environment Federation. Standard Methods forthe Examination of Water and Wastewater, 20th ed.; American Public Health Association: Washington, DC, USA, 1999; pp. 2-57–2-58.
13. McCorquoda, J.A.; Griborio, A.; Georgiou, I. Application of a CFD Model to Improve the Performance of Rectangular Clarifiers.In Proceedings of the WEFTEC, Dallas, TX, USA, 21–25 October 2006; pp. 310–320.
14. Digger, G.T.; Buttz, J.A. Upgrading Wastewater Treatment Plants; Technomic Publishing Company: Lancaster, PA, USA, 1998; p. 83.15. Metcalf & Eddy/Aecom. Wastewater Engineering—Treatment and Resource Recovery, 5th ed.; McGraw-Hill: New York, NY, USA,
2014; p. 890.16. Water Environment Federation; American Society of Civil Engineering; Environmental and Water Resources Institute. Design
Municipal Wastewater Treatment, 5th ed.; ASCE/EWRI: Reston, VA, USA, 2010; Volume 2, pp. 14–109.

Water 2022, 14, 1577 20 of 20
17. Wahlberg, E.J.; Stahl, J.F.; Chen, C.-L.; Augustus, M. Field Application of the Clarifier Research Technical Committee’s Protocolfor Evaluating Secondary Clarifier Performance: Rectangular, Co-current Sludge Removal Clarifier. In Proceedings of the WaterEnvironmental Federation 66th Annual Conference and Exposition, Anaheim, CA, USA, 3–7 October 1993.
18. Ekama, G.A.; Barnard, J.L.; Gunthert, F.W.; Krebs, P.; McCorquodale, J.A.; Parker, D.S.; Wahlberg, E.J. Secondary Settling Tank;International Association on Water Quality: London, UK, 1997; pp. 189–190.
19. Jenkins, D.; Richard, M.G.; Digger, G. Manual on the Causes and Control of Activated Sludge Bulking, Foaming, and Other SolidsSeparation Problems, 3rd ed.; CRC Press: Boca Raton, FL, USA, 2017; pp. 50–52.
20. Wanner, J. AS Separation Problems. In Activated Sludge Separation Problems-Theory, Control Measures, Practical Experience; Tandol,V., Jenkins, D., Wanner, J., Eds.; IWA Publishing: London, UK, 2006; pp. 37–38.
21. Wahlberg, E.J. Update on Secondary Clarifiers: Design, Operation and Performance. In Proceedings of the Forth NationalWastewater Treatment Technology Transfer Workshop, Kansas City, MI, USA, 17-19 May 1995.
22. Takacs, I.; Patry, G.G.; Nolasco, D.A. Dynamic Model of the Clarification-Thickening Process. Water Res. 1991, 25, 1263–1271.[CrossRef]
23. Lee, B. Evaluation of Double Perforated Baffles Installed in Rectangular Secondary Clarifiers. Water 2017, 9, 407. [CrossRef]