investigation0nphysico-chemical parameters of tannery effluent in bangladesh
13
Investigation of physico-chemical parameters of tannery effluent in Bangladesh Md. Farhad Ali 1 , Umme Habiba Bodrun Naher 2 , Md. Mahamudul Hasan 3 Institute of Leather Engineering and Technology, University of Dhaka, Bangladesh 1. [email protected] 2. [email protected] 3. [email protected] Abstract This study was conducted to determine the quality of tannery effluent with the analysis of physico- chemical parameters of effluents discharged by different tanneries in Dhaka, Bangladesh .The samples of effluent were taken from Nine tanneries and three points of Hazaribagh , Dhaka. Different physical and chemical properties like Temperature, Color , Odor, The PH, Electrical Conductivity( EC), total Dissolved Solids( TDS), Dissolved Oxygen(DO), Chemical Oxygen Demand(COD),Biological Oxygen Demand(BOD5), Suspended Solid(SS), Chloride, Nitrate, Sulphate, Phosphorous, etc. were measured and compared. The value range of the observed parameters are 1072-3833 mg/L for TSS, 1251-6240 mg/L for COD, 3.2-10.43 for pH, 2375-4385 mg/L for TDS, 200-1257 mg/L for BOD5, 7.81-13.85 mg/L for phosphorous, 2100-9745.8 μs/cm for EC, 684-1020.2 mg/L for alkalinity, 2.85-22.34 mg/L Cr 3+ ,8-26 mg/L for NO3 - ,484-1928 mg/L for Cl - , 0.68-2.8 mg/L for NO2 - and 124-512 mg/L for SO4 2- . Index Terms : Tannery Effluent, Chemical Oxygen Demand, Biological Oxygen Demand. Electrical Conductivity, Alkalinity, Total Dissolved Solid , Suspended Solid, Dissolved Oxygen. Introduction Tannery industries are one of the oldest industries in Bangladesh. About 95% of the tanneries of the country are situated in the area of Hazaribagh, Dhaka.The total area of Hazaribagh and also the whole capital are being largely polluted with the untreated effluent discharged by different tanneries. Specially the water of the river Buriganga situated by the area of Hazaribagh is being polluted significantly. Recently Hazaribagh area has been included at the list of top 10 most polluted places of the world [11]. The river of Buriganga in Bangladesh is considered as one of the most polluted rivers in the world. The tanneries of Hazaribagh are discharging the solid waste and effluent containing putrid rotten flesh, fat, blood and skin. Toxic chemicals, dissolved lime, chromium sulfate, alkali, hydrogen sulfide , sulfuric acid, bleach, dyes , oils formic acid, heavy metal, suspended solids , organic matt etc. Which are generally flown to the river of Buriganga without any treatment[2] 15800m3/day of waste water with a BOD load of 17600 kg/day and high chromium concentration is discharged from the tanneries at Hazaribagh [3].The heavy metals can cause cancer brain or kidney damage. Here one of the greatest environmental problems in the tannery industries is the disposal of chromium contents sludge created as a by product. Tannery effluent largely affects the ecosystem of river and decreases seeds germination in extensively cultivable crops[4].
-
Upload
independent -
Category
Documents
-
view
0 -
download
0
Transcript of investigation0nphysico-chemical parameters of tannery effluent in bangladesh

Investigation of physico-chemical parameters of tannery effluent in Bangladesh
Md. Farhad Ali1 , Umme Habiba Bodrun Naher2 , Md. Mahamudul Hasan3
Institute of Leather Engineering and Technology, University of Dhaka, Bangladesh
1. [email protected] 2. [email protected] 3. [email protected]
Abstract
This study was conducted to determine the quality of tannery effluent with the analysis of physico-
chemical parameters of effluents discharged by different tanneries in Dhaka, Bangladesh .The samples
of effluent were taken from Nine tanneries and three points of Hazaribagh , Dhaka. Different physical
and chemical properties like Temperature, Color , Odor, The PH, Electrical Conductivity( EC), total
Dissolved Solids( TDS), Dissolved Oxygen(DO), Chemical Oxygen Demand(COD),Biological Oxygen
Demand(BOD5), Suspended Solid(SS), Chloride, Nitrate, Sulphate, Phosphorous, etc. were measured and
compared. The value range of the observed parameters are 1072-3833 mg/L for TSS, 1251-6240 mg/L
for COD, 3.2-10.43 for pH, 2375-4385 mg/L for TDS, 200-1257 mg/L for BOD5, 7.81-13.85 mg/L for
phosphorous, 2100-9745.8 μs/cm for EC, 684-1020.2 mg/L for alkalinity, 2.85-22.34 mg/L Cr3+ ,8-26
mg/L for NO3 - ,484-1928 mg/L for Cl-, 0.68-2.8 mg/L for NO2- and 124-512 mg/L for SO4
2-.
Index Terms : Tannery Effluent, Chemical Oxygen Demand, Biological Oxygen Demand. Electrical
Conductivity, Alkalinity, Total Dissolved Solid , Suspended Solid, Dissolved Oxygen.
Introduction
Tannery industries are one of the oldest industries in Bangladesh. About 95% of the tanneries of the
country are situated in the area of Hazaribagh, Dhaka.The total area of Hazaribagh and also the whole
capital are being largely polluted with the untreated effluent discharged by different tanneries. Specially
the water of the river Buriganga situated by the area of Hazaribagh is being polluted significantly.
Recently Hazaribagh area has been included at the list of top 10 most polluted places of the world [11].
The river of Buriganga in Bangladesh is considered as one of the most polluted rivers in the world. The
tanneries of Hazaribagh are discharging the solid waste and effluent containing putrid rotten flesh, fat,
blood and skin. Toxic chemicals, dissolved lime, chromium sulfate, alkali, hydrogen sulfide , sulfuric acid,
bleach, dyes , oils formic acid, heavy metal, suspended solids , organic matt etc. Which are generally
flown to the river of Buriganga without any treatment[2]
15800m3/day of waste water with a BOD load of 17600 kg/day and high chromium concentration is
discharged from the tanneries at Hazaribagh [3].The heavy metals can cause cancer brain or kidney
damage. Here one of the greatest environmental problems in the tannery industries is the disposal of
chromium contents sludge created as a by product. Tannery effluent largely affects the ecosystem of
river and decreases seeds germination in extensively cultivable crops[4].

Materials and Methods
In the present study, Effluents were collected from nine tanneries and three final discharged points
from Hazaribagh and other areas near it.
Table I. Identification of Samples
Collected Samples ID Name of the Tannery/points
A Apex Tannery Ltd
B F.K Leather Complex Ltd
C Bangla Tannery
D R M M Leather Industry Ltd.
E H B Tannery Ltd.
F Fancy Leather Ltd.
G Beri Badh point -1
H Rayerbazar point -2
I Hazaribagh Bazar Point-3
J Ruma tannery
K Chowdhury tannery
L Madina tannery
Effluent Collection
The samples were collected in plastic bottles and some parameters were analyzed within four hours.
Most of the samples were analyzed at the analytical chemistry Lab ( ISO 17025 accredited ) at the
Institute of Leather Engineering and Technology, University Of Dhaka . Some tests were done at Center
for Advanced Research and Sciences, University Of Dhaka and Bangladesh Council of Scientific and
Industrial Research, Dhaka.

Table II. Analysis Of Physico-chemical Parameters
Parameters Method of Analysis / Instruments
pH pH meter
Electrical Conductivity ( EC) Digital conductivity meter
Total Dissolved Solid( TDS) Gravimetric Method
Dissolved Oxygen(DO) Titrimetric Method
Chemical Oxygen Demand( COD) Titrimetric Method
Biological Oxygen Demand(BOD5) Microbiological titration method
Suspended Solid(SS) Gravimetric Method
Chloride (Cl-) Colorimetric method
Nitrite ( No2-) Colorimetric Method
Sulphate (So4--) UV- visible Spectrophotometer
Phoisphorous (Po4--- ) Molybdo-vanado phoshphoric acid method
Alkalinity Titrimetric Method
Color and Odor Visual Observation
Temperature Thermometer
Chromium Colorimetric method
Nitrate( No3- ) Colorimetric Method
Results and Discussion
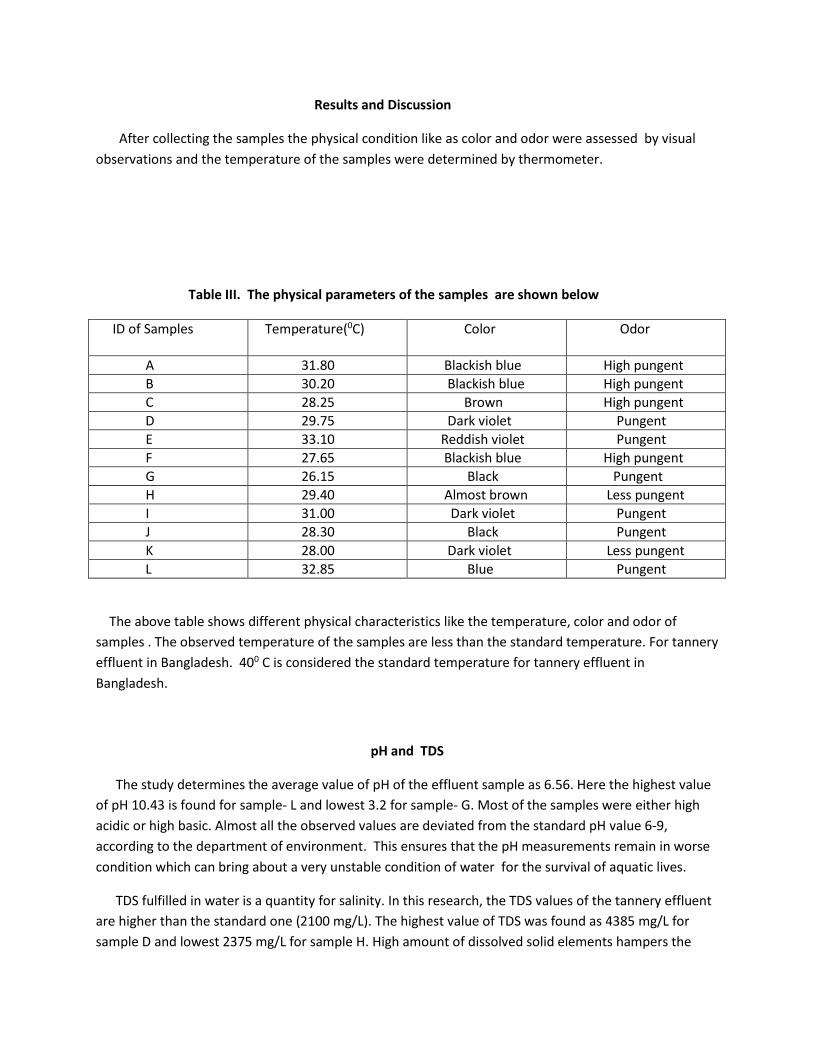
After collecting the samples the physical condition like as color and odor were assessed by visual
observations and the temperature of the samples were determined by thermometer.
Table III. The physical parameters of the samples are shown below
ID of Samples Temperature(0C) Color Odor
A 31.80 Blackish blue High pungent
B 30.20 Blackish blue High pungent
C 28.25 Brown High pungent
D 29.75 Dark violet Pungent
E 33.10 Reddish violet Pungent
F 27.65 Blackish blue High pungent
G 26.15 Black Pungent
H 29.40 Almost brown Less pungent
I 31.00 Dark violet Pungent
J 28.30 Black Pungent
K 28.00 Dark violet Less pungent
L 32.85 Blue Pungent
The above table shows different physical characteristics like the temperature, color and odor of
samples . The observed temperature of the samples are less than the standard temperature. For tannery
effluent in Bangladesh. 400 C is considered the standard temperature for tannery effluent in
Bangladesh.
pH and TDS
The study determines the average value of pH of the effluent sample as 6.56. Here the highest value
of pH 10.43 is found for sample- L and lowest 3.2 for sample- G. Most of the samples were either high
acidic or high basic. Almost all the observed values are deviated from the standard pH value 6-9,
according to the department of environment. This ensures that the pH measurements remain in worse
condition which can bring about a very unstable condition of water for the survival of aquatic lives.
TDS fulfilled in water is a quantity for salinity. In this research, the TDS values of the tannery effluent
are higher than the standard one (2100 mg/L). The highest value of TDS was found as 4385 mg/L for
sample D and lowest 2375 mg/L for sample H. High amount of dissolved solid elements hampers the

density of water. Thus, it creates impact on osmoregulation of water and also lessens solubility of gasses
[9].
COD and TSS
Chemical oxygen demand (COD) is the amount of oxygen in milligrams consumed by the oxidisable
substance having in one litre of sample. The result of the present study expressed that COD levels of
tannery effluent are significantly higher than the standard level 200 mg/L(for inland surface) -
400mg/L(irrigation land). The average COD value of observation is 2776.83mg/L. Here, the highest value
is found for sample- E and lowest for sample- L. This ensures the incompatibility for the existence of the
aquatic organism.
0
2
4
6
8
10
12
A B C D E F G H I J K L
PH
Val
ue
Collected Sample ID
0
500
1000
1500
2000
2500
3000
3500
4000
4500
A B C D E F G H I J K L
Tota
l Su
spe
nd
ed
So
lid(m
g/L)
Collected Sample ID

The result of the study expresses the higher level of TSS of the effluent. It exceeds the permissible
TSS level of 150-500 mg/L. High level of TSS present in the effluent could be attributed to the increase at
the time of processing of finished leather. Presence of total suspended solid in water results poor
photosynthetic process in the aquatic process and hampers respiratory system of fishes a lot.
BOD5 and EC
BOD5 is one of the most common processes of determining for pollutant organic material in water. It
is the rate of discharge of oxygen by microorganism in aerobic decline of the dissolved organic
substance in water. The experimental average BOD5 value is 754.15 mg/L for effluent which is extremely
higher than the permissible limit of 50(inland surface)-250(irrigation land) mg/L. The sample sample- E,
shows the highest BOD5 value of 1257 mg/L and sample- A of 200 mg/L as lowest.
0
1000
2000
3000
4000
5000
6000
7000
A B C D E F G H I J K L
Ch
em
ical
Oxy
gen
De
man
d(m
g\L)
Collected Sample ID
0
500
1000
1500
2000
2500
3000
3500
4000
4500
5000
A B C D E F G H I J K L
Tota
l Dis
solv
ed
So
lids(
mg\
L)
Collected Sample ID

The experimented average EC value is 5610.46 μs/cm for the observed tannery effluent is significantly
higher than the standard value 1200 μs/cm. The highest EC value of the samples 9745.8 μs/cm was
found for the sample- K and lowest 2100 μs/cm for sample- A which is very large in amount. Augment in
EC values shows higher concentration of ions [1].
Alkalinity and Phosphorus
Alkalinity of water is the capability of neutralization of acid. The study reveals the alkalinity among
the observed effluent samples 1420.2 mg/L as highest and 684 mg/L as lowest. The average value of
alkalinity of the experiment is 1018.08 mg/L. This study found large amount of it. Reasons of large
portion of it is having hydroxides, carbonates and bicarbonates [8].
0
200
400
600
800
1000
1200
1400
A B C D E F G H I J K L
Bio
logi
cal O
xyge
n D
em
and
(mg\
L)
Collected Sample ID
0
2000
4000
6000
8000
10000
12000
A B C D E F G H I J K L
Ele
ctri
cal C
on
du
ctiv
ity(μ
s\cm
)
Collected Sample ID

The experimental average phosphorus value is 10.35 mg/L. The highest observed value of it is 13.78
mg/L for sample L and 7.81 mg/L for sample- E as lowest. The observed results are larger than the
standard value of 8 mg/L for municipal process. Increased concentration of phosphorus accelerates the
growth of water plants and modifies the water feature.
Sulfate and DO
The average sulfate substance of the tannery effluent is found as 300.75 mg/L The highest value of
sulfate was found 412 mg/L for sample- E and 158 mg/L for sample- A as lowest. Sulfates in tannery
effluent are originated from the use of sulfuric acid or creation with a high sodium sulfate content [7].
0
200
400
600
800
1000
1200
1400
1600
A B C D E F G H I J K L
Alk
alin
ity(
mg/
L)
Collected Sample ID
0
2
4
6
8
10
12
14
16
A B C D E F G H I J K L
Ph
osp
ho
rou
s(m
g/L)
Collected Sample ID

DO, the most important factor of water quality [1] was found in a very low amount for the collected
effluent. For the samples of D, G and H DO was found nil. The highest amount was found as 3.8 mg/L
for sample -A. This absence of Oxygen is a great threat for the aquatic creatures.
Cr3+ and NO2-
Chromium, an essential element of chrome tanning process, is toxic carcinogenic at high
concentration. It exists in oxidation states of +2,+3 and +6. The chromium(+3) is a compulsory element
for mammals needed in extent amount. But Cr(VI) is a widespread contaminant can be created by the
tannery effluent easily soluble with water with great danger. This is created by untreated process of
effluent with great amount. This observation expresses the average chromium value of 1.95 mg/L which
is significantly higher than the standard (0.5-10) mg/L range.
Again, the sample sample- G expresses the highest amount of 2.79 mg/L and sample -A for 0.68 mg/L
as lowest. The average observed amount is 1.47 mg/L.
0
100
200
300
400
500
600
A B C D E F G H I J K L
Sulp
hat
e(m
g/L)
Collected Sample ID

Cl- and NO3-
The observed average value of chloride is 1333.67 mg/L and the highest Chloride value 1928 mg/L for
sample- E and the lowest 484 mg/L for sample- L. The increased amount of chloride enhances the
acridity of water [6].
Nitrate was recorded 26 mg/L for sample- E and 8 mg/L for sample- F. The average nitrate value of
the observation is 15.83 mg/L. The amount of the nitrate is higher than the standard 10 mg/L almost all
observations. High concentration of nitrate can create health problem if it is used for the purpose of
cultivation and thirst quenching.
0
5
10
15
20
25
A B C D E F G H I J K L
Ch
rom
ium
(mg/
L)
COllected Sample ID
0
0.5
1
1.5
2
2.5
3
A B C D E F G H I J K L
NIt
rite
(mg/
L)
Collected Sample ID

0
500
1000
1500
2000
2500
A B C D E F G H I J K L
Ch
lori
de
(mg/
L)
Collected Sample ID
0
5
10
15
20
25
30
A B C D E F G H I J K L
Nit
rate
(m
g/L)
Collected Sample ID

Table IV. Experimental average values with standard values
Sl. No.
Parameters Values of experiments Standard value
1 pH value 6.56 6-9
2 TSS (mg/L) 2048.42 150-500
3 COD (mg/L) 2776.83 200 -400
4 TDS (mg/L) 3516.5 2100
5 BOD (mg/L) 754.5 50-250
6 EC (μs/cm) 5409.50 1200
7 Alkalinity (mg/L) 1018.08 500
8 Phosphorous (mg/L) 10.35 8-15
9 Chlorides (mg/L) 1333.67 600
10 Nitrite (mg/L) 1.47 -
11 DO (mg/L) 1.58 4.5-8
12 Sulfate (mg/L) 300.75 -
13 Nitrate (mg/L) 15.83 10
14 Chromium (mg/L) 12.95 0.5-1.0
Conclusion
Conclusively, this paper reported that the values of the parameters of the effluent are extensively
deviated from the standards. For examples, the average value of BOD5 is about seven times than it’s
standard value and chromium is about twelve times. Again other parameters remain in worst condition.
Because of lacking of proper effluent treatment plants, the untreated effluent get mixed with the river
of Buriganga and other areas devastatingly which affect human lives, plants, aquatic creatures and also
total environment adversely. The ensuring of special treatment plants and other necessary steps must
be taken as soon as possible for protecting the environment from being spoilt.
References
1. Deepali, K.K. Gangwar and B. D. Joshi, Comparative study of physic-chemical properties of
effluent from tannery industries, Indian Journal of Environmental Scince j 3 (2) 2009, pp/49-
152 Green Earth Foundation.
2. Manjushree Chowdhury, M.G. Mostafa, Tapan Kumar Biswas, Ananda Kumar Saha,
Treatment of leather Industrial Effluent by filtration and coagulation processes, ELSEVIR
water resource and industry 3(2013)11-22.
3. P. Saranraj and D. Sujitha, Microbial Bioremediation of Chromium in Tannery Effluent,
International Journal of Microbiological research 4(3): 305-320, 2013

4. Aklilu Asfaw, Mengistu Sime, Fisseha Itanna, Determination of Tannery effluent on seeds
germination of some vegetables in Ejersa Area of East Shoa, Ethiopia, International Journal
of Scientific and Research publications, volume -2, issue 12,2012, ISSN 2250-3153.
5. Introduction to Treatment of Tannery Effluents, United Nation Industrial Development
organization, Vienna, 2011.
6. M.A. Rouf, M.S. Islam, M.Z. Haq, N. Ahmed and T. Rabeya, Characterization of Effluents
of Leather Industries in Hazaribagh Area of Dhaka city, Bangladesh J.Sci.Ind.Res.48(3), 155-
166, 2013
7. United Nations Industrial Development organization(2000) , Regional programme foe
pollution control in the training industry in South-East Asia.
8. B.I.Islam, A. E Musa, E.H. Ibrahim, Salma, A.A. Sharafa and Babiker M. Elfaki, Evaluation
and characterization of tannery waste water, Journal of Forrest Products and Industries, 2014
3(3) 141-150.
9. Ram S. Lokhande, Pravin U. Singare, Deepali, S. Pimple, Study on Physico-chemical
parameters of waste water Effluents from Taloja Indutrial Area of Mumbai, India;
International journal of Eco-system 2011, 1(1) 1-9.
10. Siva Kumar P, Kanagappan M. and Sam Manohar Das S, Toxicity evaluation and behavioral
responses of Danio renio expose to tannery effluent, JEZS 2014,2(6) , 288-291.
11. Blacksmith Institute , Switzerland. 2013, The worlds worst 2013, the top ten toxic threats.