PAQUES - Anaerobic effluent treatment Pulp & Paper
53
13-2-2013 Anaerobic effluent treatment in the pulp and paper industry www.paques.nl
-
Upload
independent -
Category
Documents
-
view
0 -
download
0
Transcript of PAQUES - Anaerobic effluent treatment Pulp & Paper

13-2-2013
Anaerobic effluent treatment in the pulp and paper industry
www.paques.nl

2
Who is Paques?
• Family owned business
• Founded in 1960
• Number of employees : ~400
• Operations in The Netherlands, China, Brazil, and sales office in Canada
• Worldwide presence through network of partners, partnering strategy
• Innovative biological applications for wastewater and gas
• 2011: SKion GmbH, the investment firm of German entrepreneur Susanne Klatten (BMW, ALTANA, SGL) purchases 20% shares
• 2011: JV with Shell for biological gas desulphurization

3

4
• Paques has around 1500 references worldwide
– Mainly anaerobic water treatment (energy from wastewater) and biogas desulphurization
– Market leader in pulp & paper, beer & beverage and food sector
– Strong portfolio in sulphur based biotechnology
• Growing and developing in:
– Metal and Mining
– Oil and Gas through Paqell
– Petrochemical
– Algeae
– Biobased chemicals
Who is Paques?

5
• Meet safe water discharge requirements
• Reduce water consumption (water footprint)
• Produce green gas (carbon footprint)
• Upgrade biogas
• Resource recovery from used water
By offering:
• Biological processes and engineering packages
• Integrated solutions • Reliable
• High uptime
• Energy efficient
• Best performance with attractive economics
Paques helps companies to:

6
• Process design
• Basic and detailed engineering
• Manufacturing
• Contracting
• Construction
• Research & Development
• Laboratory services
• Pilot testing
• Consultancy and services
Paques’ services

7
More than 1,500 reference plants in more
than 60 countries in the following industries:
• Pulp and Paper
• Beer and Beverages
• Food
• Distilleries
• Chemical industry
• Metal and Mining
• Oil and Gas
• Municipalities

8
Anaerobic Waste Water Treatment
Pulp & Paper

9
Purpose
• Removal of organic contaminants
• Biogas production
Paques
• The word leader in anaerobic treatment
• More than 875 references in more than 60 countries
Anaerobic COD removal

10
Smurfit Kappa Roermond Papier 1983
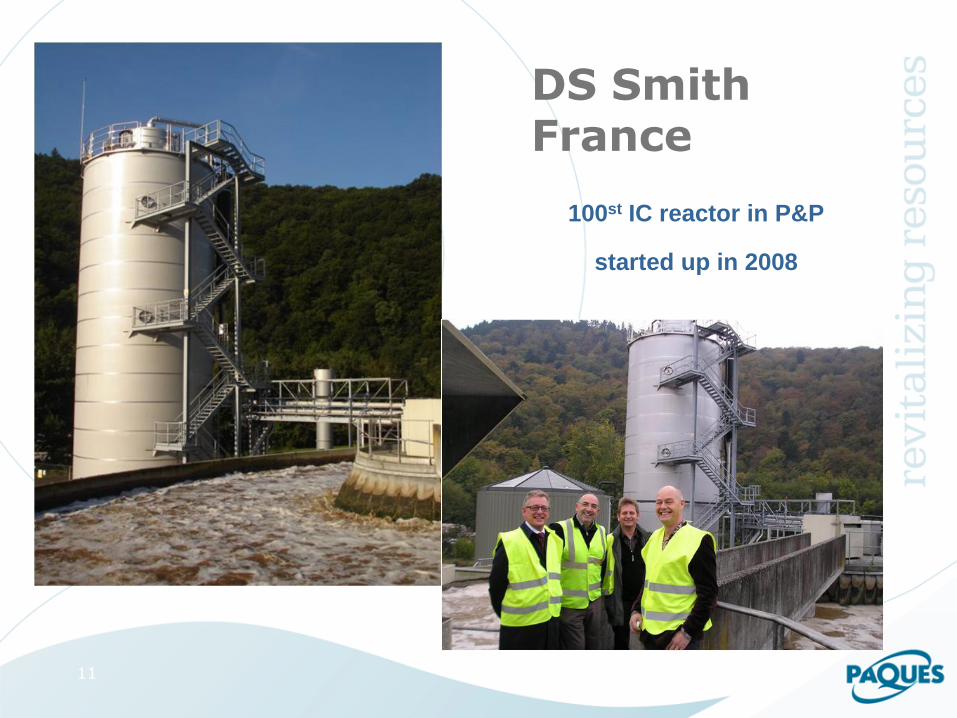
11
100st IC reactor in P&P
started up in 2008
DS Smith France

12
Sludge granulation is the most popular anaerobic technology to treat pulp & paper effluent
UASB/IC
75%
AF
2%CSTR
7%
FB
2%
EGSB
14%

13
No.1 in anaerobic treatment of wastewater for pulp & paper industry
PAQUES
59%
A
17%
B
8%
C
6%
D
6%E
4%

14
Traditional aerobic process
BOD + O2 H2O + CO2 + BIOMASS
CO2 + H20
45
45
10 100
Aerobic sludge
Effluent
Aerobic biomass (~4 g/l MLSS)
Aerobic sludge
• High growth rate
• High energy requirement
• High sludge production
• Flocculant sludge

15
Concerns of Aerobic Treatment
- Important Space needed - Energy Requirement for Aeration - Important Sludge Production - Sensitive to Loading Variation - Problems of Sludge Separation

16
Anaerobic process
COD CH4 + CO2 + BIOMASS
Anaerobic methanogenic biomass
• Low growth rate
• Production of reusable methane (green
energy)
• Low sludge production (& biomass is
asset rather than waste)
• Granular biomass
Anaerobic biomass
CO2 + H20
45
45
10
Effluent 100
Aerobic sludge
CH4 + CO2
75
20
100
5
Effluent
Anaerobic sludge

17
Why anaerobic pre-treatment ?
- reduced energy consumption
- reduced sludge production
- more stable operation
- energy production
- reduced green house effect
In aerobic
plant
Revenue

18
Secondary Clarifier before anaerobic system installed

19
Secondary Clarifier after anaerobic system installed

20
Improvement of aerobic sludge
Before anaerobic
system installed
After anaerobic
system installed

21
Lab testing: Oxitop

22
Pilot testing

23

24
• High rate (20-30 kg COD/m3/d)
• Small footprint
• Low hydraulic retention time
• Self regulating system
• Intensely mixed biomass at bottom reactor
• Optimal sludge retention at top reactor
BIOPAQ®IC reactor

25

26
Advantages BIOPAQ® IC reactor
• Proven technology, > 875 BIOPAQ references
• Closed system, corrosion free materials
• Minimal foot-print (space saving and odor emission
surface limited)
• Completely mixed reactor compartment due to Internal
Circulation principle
• Optimal sludge retention due to two-staged separation
• Maximal recovery of biological alkalinity, reduced
chemical costs
• Robust & more stable due to
- two-staged concept
- automatic internal dilution (IC)

27
Feasibility of anaerobic effluent treatment MILL PROCESS FEASIBILITY OF ANAEROBIC
TREATMENT
Mechanical Pulping
Debarking
RMP, Ground wood
TMP, BTMP (Peroxide)
CTMP, BCTMP (Peroxide)
APMP (Peroxide)
-
+
++
+/++
++
Semi Chemical Pulping
NSSC
Soda pulping
+
+
Chemical Pulping
Sulfite pulp condensate
Sulfite bleaching: E,O,P
Sulfite bleaching: C,H,D
++
+
-
Kraft pulp condensate
Kraft bleaching: E,O,P
Kraft bleaching: C,H,D
++
+
-
Dissolving pulp condensate
Bleaching: E,O,P
Bleaching: C,H,D
+
+
-
Secondary Fibres
Wastepaper, DIP ++
Non-wood (soda) Pulping
Straw, Bagasse, Cotton Linters
+

28
Raw material and COD removal
Raw material COD efficiency %
OCC 75 – 85
MWP 65 - 75
MOW 60 - 70
ONP 50 - 55
Mech. pulp / spruce 50 - 55
Mech. pulp / aspen 65 - 75
Condensates 75 - 95

29
General flow diagram
Sludge
dewatering
N,P
Effluent
Primary clarifier Aeration tanks
Sec. clarifier
sieve
Influent
Return sludge
Biogas
Gasholder Flare
IC reactor Conditioning
tank

30
Zero discharge concept at paper mill
Conditioning tank IC Reactor
Aereation
Water storage tank
Secondary clarifier
Aereation basins

31
SCA Newhythe - UK
IC diameter 9.5 m
Height 20 m
Volume 1,400 m3
Flow 6,000 m3/d
COD 5,000 mg/l
COD 30 tpd

32
COD-load (kg/d)
IC Reactor COD load
0
5000
10000
15000
20000
25000
30000
35000
40000
45000
1-1
-2004
15-1
-2004
29-1
-2004
12-2
-2004
26-2
-2004
11-3
-2004
25-3
-2004
8-4
-2004
22-4
-2004
6-5
-2004
20-5
-2004
3-6
-2004
17-6
-2004
1-7
-2004
15-7
-2004
29-7
-2004
12-8
-2004
26-8
-2004
9-9
-2004
23-9
-2004
7-1
0-2
004
21-1
0-2
004
4-1
1-2
004
18-1
1-2
004
2-1
2-2
004
16-1
2-2
004
30-1
2-2
004
kg
CO
D/d

33
Final effluent COD (mg/l)
Final Effluent COD
0
20
40
60
80
100
120
140
160
180
200
1-1
-2004
15-1
-2004
29-1
-2004
12-2
-2004
26-2
-2004
11-3
-2004
25-3
-2004
8-4
-2004
22-4
-2004
6-5
-2004
20-5
-2004
3-6
-2004
17-6
-2004
1-7
-2004
15-7
-2004
29-7
-2004
12-8
-2004
26-8
-2004
9-9
-2004
23-9
-2004
7-1
0-2
004
21-1
0-2
004
4-1
1-2
004
18-1
1-2
004
2-1
2-2
004
16-1
2-2
004
30-1
2-2
004
CO
D (
mg
/l)

34
COD removal (%)
IC Reactor COD removal efficiency (%)
0,0
10,0
20,0
30,0
40,0
50,0
60,0
70,0
80,0
90,0
100,0
1-1
-2004
15-1
-2004
29-1
-2004
12-2
-2004
26-2
-2004
11-3
-2004
25-3
-2004
8-4
-2004
22-4
-2004
6-5
-2004
20-5
-2004
3-6
-2004
17-6
-2004
1-7
-2004
15-7
-2004
29-7
-2004
12-8
-2004
26-8
-2004
9-9
-2004
23-9
-2004
7-1
0-2
004
21-1
0-2
004
4-1
1-2
004
18-1
1-2
004
2-1
2-2
004
16-1
2-2
004
30-1
2-2
004
Eff
icie
ncy (
%)

35
SAICA 3, Spain
Diameter 9.5 m Height 24 m Volume 1,680 m3
Flow 8,000 m3/d COD 5,800 mg/l COD 47 tpd

36
SAICA 3: Biogas production and VLR
15.000
15.500
16.000
16.500
17.000
17.500
18.000
18.500
JAN FEB MAR APR MAY JUN JUL AUG
Bio
gas p
rod
ucti
on
in
m3/h
22
23
24
25
26
27
28
29
30
VL
R i
n k
g C
OD
/ m
3.d
Biogas production Nm3/h VLR in kg COD / m3.d
Loading rate and biogas

37
VLR vs COD Efficiency
0
10
20
30
40
50
60
70
80
90
100
0,0 5,0 10,0 15,0 20,0 25,0 30,0 35,0 40,0 45,0
VLR kg/m3/d
CO
D e
ffic
ien
cy
Performance at high loading
Volumetric Loading Rate (VLR) in kg COD/m3.d Loading rate versus biogas

38
Palm Wörth, Germany
Diameter 9.5 m Height 24 m Volume 2 x 1,680 m3
Flow 9,000 m3/d COD 5,500 mg/l COD 50 tpd

39
Papierfabrik Palm, Germany TL, CM
BIOPAQ®IC
2 x 1680 m³, Gasbuffer 500 m³, Gasflare 1200 m³/h
THIOPAQ®60/1.2

40
Ruhrverband, Germany Tissue
BIOPAQ®IC
2 x 195 m³
THIOPAQ®ECO
2004

41
Emin-Leydier, France Diameter 9.5 m Height 24 m Volume 1,680 m3
Flow 6,500 m3/d COD 5,500 mg/l COD 36 tpd

42
Cartonneries de Gondardennes France TL, CM
Turn-key wwtp
Anaerbic + aerobic
BIOPAQ®IC 1190 m³
Gasbuffer 30 m³
Gasflare 900 m³/h
2006

43
Rock-Tenn Solvay Paperboard, USA

44
Smurfit Kappa, UK
IC 6 x 24 m Flow 3000 m3/d COD 6000 mg/l

45
Stora Enso, Germany
Hagen Kabel (LWC from spruce)
Diameter 2 x 8 m Flow 24,000 m3/d
Height 20 m COD 1,200 mg/l
Volume 2 x 1,000 m3 COD 30 ton/d
Eilenburg (DIP, Newsprint)
Diameter 4 x 5 m Flow 15,000 m3/d
Height 16 m COD 1,500 mg/l
Volume 4 x 310 m3 COD 22 ton/d
46
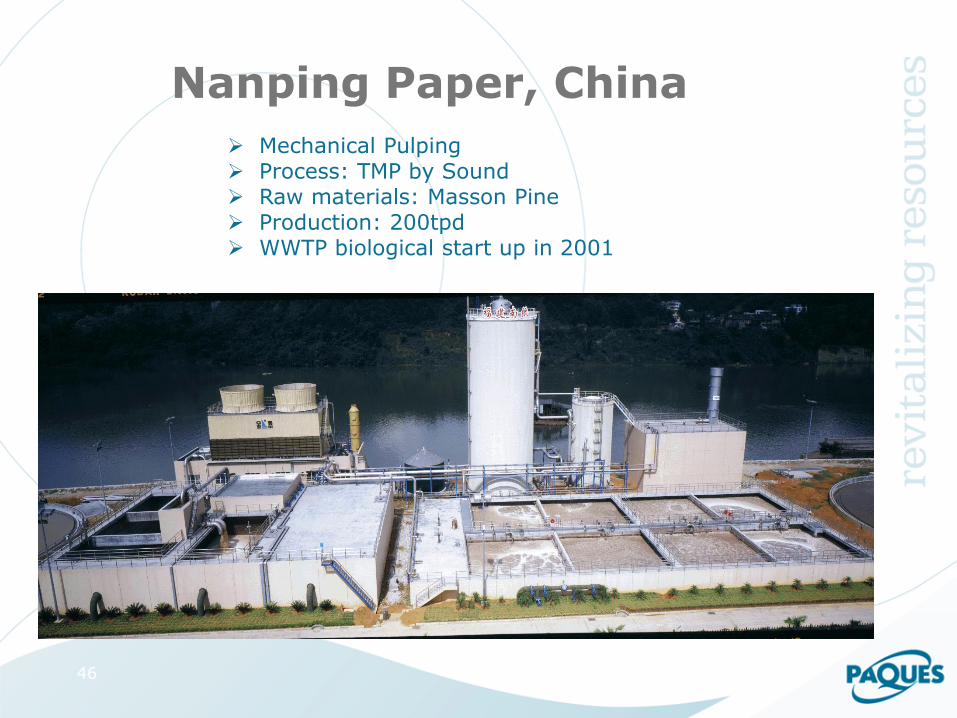
Mechanical Pulping Process: TMP by Sound Raw materials: Masson Pine Production: 200tpd WWTP biological start up in 2001
Nanping Paper, China

47
Mechanical Pulping Process: PRC-APMP by Andritz Raw materials: Aspen Production: 500tpd WWTP biological start up in 2002
Yueyang Paper, China

48
UPM Kymmene, Germany SC/LWC

49
Fujian Nanping Paper, China TMP/DIP

50
YueYang Paper, China
Mechanical Pulping: Aspen/Eucalyptus

51
Chen Loong, China

52
M-Real, Austria Sulphite Condensate