Hybrid polyhydroxyurethanes: How to overcome limitations ...
Upload
khangminh22Category
view
2download
0

DEVELOPMENT DOCUMENT FOR
EFFLUENT LIMITATIONS GUIDELINES NEW SOURCE PERFORMANCE STANDARDS
AND PRETREATMENT STANDARDS
FOR THE ORGANIC CHEMICALS
AND THE PLASTICS AND SYNTHETIC FIBERS
POINT SOURCE CATEGORY Volume I
Lee M. Thomas Administrator
Lawrence J. Jensen Assistant Administrator~for Water
William A. Whittington Director
Office of Water Regulations and Standards
Devereaux Barnes, Director Industrial Technology Division
Marvin B. Rubin Chief, Chemicals Industry Branch
Elwood H. Forsht Senior Project Officer
Frank H. Hund Hugh E. Wise
Janet K. Goodwin Wendy D. Smith Project Team
October 1987
Industrial Technology Division Office of Water Regulations and Standards
U.S. Environmental Protection Agency Washington, D.C. 20460

ABSTRACT
This document describes the technical development of the U.S.
Environmental Protection Agency's promulgated effluent limitations guidelines
and standards that control the discharge of pollutants into navigable waters
and publicly owned treatment works (POTNs) by existing and new sources in the
organic chemicals, plastics, and synthetic fibers point source category. The
regulation establishes effluent limitations guidelines attainable by the
application of the "best practicable control technology currently available"
(BPT) and the "best available technology economically achievable" (BAT),
Pretreatment standards applicable to existing and new discharges to POTNs
(PSES and PSNS, respectively), and new source performance standards (NSPS)
attaina~e by the application of the i'best available demonstrated control
technology." The regulation was promulgated under the authority of Sections
301, 304, 306, 307, 308, and 501 of the Clean Water Act (the Federal Water
Pollution Control Act Amendments of 1972, 33 U.S.C. 1251 et seq.,as amended)~
It was also promulgated in response to the Settlement Agreement in Natural
Resources Defense Council, Inc. v. Trian, 8 ERC 2120 (D.D.C. 1976), modified,
12 ERC 1833 (D.D.C.).

TABLE OF CONTENTS VOLUME I
Pa~e
I. INTRODUCTION
A. LEGAL AUTHORITY . . . . . . . . . . . . . . . . . . . . . I-I
i. Best Practicable Control Technology Currently Available (BPT) . . . . . . . . . . . . . . . . . . I-2
2. Best Available Technology Economically Achievable (BAT) . . . . . . . . . . . . . . . . . I-3
3. Best Conventional Pollutant Control Technology (BCT) . . . . . . . . . . . . . . . . . I-3
4. New Source Performance Standards (NSPS) ...... . I-4 5. Pretreatment Standards for Existing
Sources (PSES) . . . . . . . . . . I-4 6. Pretreatment Standards fo; Ne; Source; (PSNS).... I-4
B. HISTORY OF OCPSF RULEMAKING EFFORTS ........... I-5
II. SUMMARY AND CONCLUSIONS
A. OVERVIEW OF THE INDUSTRY . . . . . . . . . . . . . . . . II-I
B.........CONCLUSIONS . . . . . . . . . . . . . . . . . . . . . . . II-5
I. Applicability of the Promulgated Regulation ..... II-5 2. BPT . . . . . . . . . . . . . . . . . . . . . . . . . II-6 3. BCT . . . . . . . . . . . . . . . . . . . . . . . . . II-8 4. BAT . . . . . . . . . . . . . . . . . . . . . . . . . II-8 5. NSPS .... . . . . . . . . . . . . . . . . . . . . II-ll 6. PSES . . . . . . . . . . . . . . . . . . . . . . . . II-16 7. PSNS . . . . . . . . . . . . . . . . . . . . . . . . II-17
III. INDUSTRY DESCRIPTION
A. INTRODUCTION . . . . . . . . . . . . . . . . . . . . . . III-i
B. DEFINITION OF THE INDUSTRY . . . . . . . . . . . . . . . III-3
I. Standard Industrial Classification System ...... III-3 2. Scope of the Final Regulation . . . . . . . . . . . . III-3 3. Raw Materials and Product Processes ......... III-20 4. Geographic Distribution . . . . . . . . . . . . . . . III-32 5. Plant Age . . . . . . . . . . . . . . . . . . . . . . III-32 6. Plant Size . . . . . . . . . . . . . . . . . . . . . III-35 7. Mode of Discharge . . . . . . . . . . . . . . . . . . III-41
C. DATA BASE DESCRIPTION . . . . . . . . . . . . . . . . . . 111-41
I. 1983 Section 308 Questionnaire Data Base ..... . III-41 2. Daily Data Base Development . . . . . . . . . . . . . 111-46 3. BAT Data Base . . . . . . . . . . . . . . . . . . . . III-47
iii

TABLE OF CONTENTS (Continued)
IV. SUBCATEGORIZATION
A. INTRODUCTION . . . . . . . . . . . . . . . . . . . . . .
B. BACKGROUND . . . . . . . . . . . . . . . . . . . . . . .
i. March 21, 19821, Proposal . . . . . . . . . . . . . . 2. July 17, 1985, Federal Register NOA . . . . . . . . . 3. December 8, 1986, Federal Register . . . . . . . . .
C. FINAL ADOPTED BPT AND BAT SUBCATEGORIZATION
i. Performance and Treatment System Shifts ....... 2. Flow and Total Production Adjustment Factors ....
E. SUBCATEGORIZATION FACTORS . . . . . . . . . . . . . . . .
I. Introduction . . . . . . . . . . . . . . . . . . . . 2. Manufacturing Product/Process . . . . . . . . . . . . 3. Raw Materials . . . . . . . . . . . . . . . . . . . . 4. Facility Size ....... . . . . . . . . . . . . . 5. Geographical Location . . . . . . . . . . . . . . . . 6. Age of Facility and Equipment . . . . . . . . . . . . 7. Wastewater Characteristics and Treatability .....
V. WATER USE AND WASTEWATER CHARACTERIZATION
A. WATER USE AND SOURCES OF WASTEWATER . . . . . . . . . . .
B. WATER USE BY MODE OF DISCHARGE . . . . . . . . . . . . .
C. WATER USE BY SUBCATEGORY . . . . . . . . . . . . . . . .
D. WATER REUSE AND RECYCLE . . . . . . . . . . . . . . . . .
I. Water Conservation and Reuse Technologies ...... 2. Current Levels: of Reuse and Recycle . . . . . . . . .
E. WASTEWATER CHARACTERIZATION . . . . . . . . . . . . . . .
I. Conventional Pollutants . . . . . . . . . . . . . . .
Page
IV-I
METHODOLOGY AND RATIONALE . . . . . . . . . . . . . . .
b. FINAL ADOPTED BAT SUBCATEGORIZATION APPROACH ......
2. Occurrence and Prediction of Priority Pollutants
IV-2
IV-2 IV-3 IV-5
IV-9
IV-12 IV-13
IV-16
IV-18
IV-18 IV-19 IV-22 IV-24 IV-24 IV-26 IV-28
V-i
V-3
:' V-3
V-23
V-23 V-24
V-29
V-29 V-49
iv

TABLE OF CONTENTS (Continued)
P a g e
• i ? ,
F. RAW WASTEWATER CHARACTERIZATION DATA .... • .• • .. . ~ V-89 •
i. General. . . . . v-89 2. Raw Wast,water Data Collection Studies ...... ,.. V-90 3. Screening Phase I . . . . . . . . . . .... ',:. •. ~ V-90 4. Screening Phase II . . . . . . . . . . . . . ..... V-94 5. Verification Program .............. • .... V-94 6. EPA/CMA Five-Plant Sampling Program. V-IOI 7. 12-Plant Long-Term Sampling Program. • V-103
G. WASTEWATER DATA SUMMARY. ~ ' V-f05
i. Organic Toxic Pollutants . . . . . . . . . . . . . . . . V-105 2. Toxic Pollutant Metals .... ,.. V-II2
VI. SELECTION OF POLLUTANT PARAMETERS
A. INTRODUCTION . . . . . . . . . . . . . . . . . . . . . . . . VI-I
B. CONVENTIONAL POLLUTANT PARAMETERS ................ ~ . VI-2
I. Five-Day Biochemical Oxygen Demand (BODs).. ~ . . . VI-2 2. Total Suspended Solids (TSS) .............. VI-3 3. pH . VI-4 4 . Oil a n d ' G r e a s e i O & G i " " " . . . . . . . . . . : " " ~ " VI-5
C. NONCONVENTIONAL POLLUTANT PARAMETERS . . . . . . . . . . VI-6
I. Chemical Oxygen Demand (COD)'.. ' . . ~ . . . . . .. IVi_6 2. Total Organic Carbon (TOC) ........ ~ . .... :~ v;-6
D. TOXIC POLLUTANT PARAMETERS ...... :. . . ....... VI-7
E. SELECTION CRITERIA . . . . . . . . . ~ ..... .:: ....... , VI-9
i. Conventional Pollutants . . . . . . . . . . :,.... . VI-9 2. Nonconventional Pollutants . . . . . . . . . . . . . VI-lO 3. Toxic Pollutants . . . . . . . . . . . . ,.... , : . VI-IO
REFERENCES . . . . . . •.......... . . . . . . i.. ~. VI-44
VII. CONT_ROL AND TREATMENT TECHNOLOGIES
A. INTRODUCTION " VII-I' " • '
B. BEST MANAGEMENT PRACTICES . . . . . . . . . . . . . . . . VII-4
i. In-Plant Source Controls . . . . . . . . . . . . . . VII-4 2. Operation and Maintenance (O&M) Practices . . . . . . VII-9

TABLE OF CONTENTS (Continued)
C. IN-PLANT TREATMENT TECHNOLOGIES . . . . . . . . . . . . .
i. Introduction . . . . . . . . . . . . . . . . . . . . 2. Chemical Oxidation (Cyanide Destruction) ...... 3. Chemical Precipitation . . . . . . . . . . . . . . . 4. Chemical Reduction (Chromium Reduction) ....... 5. Gas Stripping (Air and Steam) . . . . . . . . . . . . 6. Solvent Extraction . . . . . . . . . . . . . . . . . 7. Ion Exchange . . . . . . . . . . . . . . . . . . . . 8. Carbon Adsorption . . . . . . . . . . . . . . . . . . 9. Distillation . . . . . . . . . . . . . . . . . . . .
II. Ultrafiltration . . . . . . . . . . . . . . . . . . . 12. Resin Adsorption . . . . . . . . . . . . . . . . . . 13. In-Plant Biological Treatment . . . . . . . . . . . .
D. END-OF-PIPE TREATMENT TECHNOLOGIES . . . . . . . . . . .
i. Introduction . . . . . . . . . . . . . . . . . . . . 2. Primary Treatment Technologies . . . . . . . . . . . 3. Secondary Treatment Technologies . . . . . . . . . . 4. Polishing and Tertiary Treatment Technologies.
E. TOTAL TREATMENT SYSTEM PERFORMANCE . . . . . . . . . . .
. . . . . . . . . . . . . . . . . . . . System . . . . . . . . . . . . . . . . Treatment Systems . . . . . . . . . . . System . . . . . . . . . . . . . . . .
F. WASTEWATER DISPOSAL . . . . . . . . . . . . . . . . . . .
I. Introduction . . . . . . . . . . . . . . . . . . . . 2. Deep Well Injection . . . . . . . . . . . . . . . . . 3. Off-Site Treatment/Contract Hauling . . . . . . . . . 4. Incineration . . . . . . . . . . . . . . . . . . . . 5. Evaporation . . . . . . . . . . . . . . . . . . . . . 6. Surface Impoundment . . . . . . . . . . . . . . . . . 7. Land Application . . . . . . . . . . . . . . . . . .
H. LIMITATIONS DEVELOPMENT . . . . . . . . . . . . . . . . .
I. BPT Effluent Limitations . . . . . . . . . . . . . . 2. BAT Effluent Limitations . . . . . . . . . . . . . . 3. BAT and PSES Metals and Cyanide Limitations .....
Rayon by the Viscose Process and Acrylic Fibers by the Zinc Chloride/Solvent Process ....
Page
VII-II
Vll-ll Vll-13
i0. Reverse Osmosis . . . . . . . . . . . . . . . . . . .
i. Introduction 2. BPT Treatment 3. Nonbiological 4. BAT Treatment
G, SLUDGE TREATMENT AND DISPOSAL . . . . . . . . . . . . . .
4. BAT Zinc Limitations for Plants Manufacturing
VII-18 VII-27 VII-29 VII-36 VII-39 VII-40 VII-42 VII-44 VII-46 VII-48 VII-48
VII-49
VII-49 VII-51 VII-61 VII-f05
VII-125
VII-125 VII-127 VII-127 VII-137
VII-138
VII-138 VII-138 VII-147 VII-148 VII-149 VII-149 VII-150
VII-150
VII-153
VII-153 Vli-183 VII-219
VII-227
vi

TABLE OF CONTENTS (Continued)
5. PSES Effluent Limitations . . . . . . . . . . . . . .
REFERENCES . . . . . . . . . . . . . . . . . . . . . . . .
VOLUME II
VIII. ENGINEERING COSTS AND NON-WATER QUALITY ASPECTS
A. INTRODUCTION . . . . . . . . . . . . . . . . . . . . .
i. BPT Costing Methodology.. ~ . . . . . . . . . . . 2. BAT Costing Methodology . . . . . . . . . . . . . . 3. PSES Costing Methodology . . . . . . . . . . . . . 4. Other Factors ...... ~ . . . . . . . . . . . .
B. BPT TECHNOLOGIES . . . . . . . . . . . . . . . ; • • •
i . A c t i v a t e d S l u d g e . . . . . . . . . ~ , . . . . . . . 2 . B i o l o g i c a l T r e a t m e n t U p g r a d e s . . . . . . . . . . .
3 . C h e m i c a l l y A s s i s t e d C l a r i f i c a t i o n . . . . . . . . . . 4 . F i l t r a t i o n S y s t e m s . . . . , . . . . . . . . . . . . . 5 . P o l i s h i n g P o n d s . . . . . . . . . . . . . . . . . .
6 . A l g a e C o n t r o l . . . . . . . . . . . . . . . . . . .
C. BAT AND PSES TECHNOLOGIES . . . . . . . . ~ ......
i . S t e a m S t r i p p i n g . . . . . . . . . . . . . . ~ . . . 2 . A c t i v a t e d C a r b o n S y s t e m s . . . . . . . . . . . . . 3 . C o a g u l a t i o n / F l o c c u l a t i o n / C l a r i f i c a t i o n S y s t e m . . . 4 . C y a n i d e D e s t r u c t i o n . . . . . . . . . . . . . . . . 5 . I n - P l a n t B i o l o g i c a l T r e a t m e n t . . . . . . . . . . .
D. ADDITIONAL COSTS ...... . . . . . . . . . . . . .
I. Contract Hauling ..... , . . . . . . . . . . . 2. Monitoring Costs . . . . . . . . . . . . . . . . . 3. Sludge Disposal and Incineration . . . . . . . . . 4. RCRA Baseline Costs . . . . . . . . . . . . . . . .
E. WASTEWATER AND AIR EMISSION LOADINGS .... , ....
I. BPT Conventional Pollutant wastewater Loadings . 2. BAT and PSES Toxic Pollutant Wastewater
Loadings . . . . . . . . . . . . . . . . . . . . .
Loadings . . . . . . . . . . . . . . . . . . . . 3. BAT and PSES Toxic Pollutant Air Emission
Pa~e
VII-228
VII-230
VIII-I
VIII-2 VIII-7 VIII-24 VIII-26
VIII-40
VIII-40 VIII-56 VIII-67 VIII-77 VIII-78 VIII-84
VIII-95
VIII-95 VIII-f19 VIII-139 VIII-180 VIII-187
VIII-197
VIII-197 VIII-198 VIII-203 VIII-222
VIII-236
VIII-236
VIII-236
VIII-270
v i i

TABLE OF CONTENTS (Con t inued )
Page
IX. EFFLUENT QUALITY ATTAINABLE THROUGH THE APPLICATION OF BEST PRACTICABLE CONTROL TECHNOLOGY CURRENTLY AVAILABLE
A. INTRODUCTION . . . . . . . . . . . . . . . . . . . . . . IX-I
i. Regulated Pollutants . . . . . . . . . . . . . . . . IX-2 2. BPT Subcategorization . . . . . . . . . . . . . . . . IX-2
B. TECHNOLOGY SELECTION . . . . . . . . . . . . . . . . . . IX-2
C. BPT EFFLUENT LIMITATIONS GUIDELINES . . . . . . . . . . IX-5
D. COST AND EFFLUENT REDUCTIONBENEFITS . . . . . . . . . . IX-9
E. IMPLEMENTATION OF THE BPT EFFLUENT LIMITATIONS GUIDELINES . . . . . . . . . . . . . . . . . . . . . . IX-9
F. NON-WATER QUALITY ENVIRONMENTAL IMPACTS . . . . . . . . . IX-12
I. Air Pollution . . . . . . . . . . . . . . . . . . . . IX-12 2. Solid Waste . . . . . . . . . . . . . . . . . . . . . IX-13 3. Energy Requirement . . . . . . . . . . . . . . . . . IX-13
X. EFFLUENT QUALITY ATTAINABLE THROUGH THE APPLICATION OF
BEST AVAILABLE TECHNOLOGY ECONOMICALLY ACHIEVABLE
A. INTRODUCTION . . . . . . . . . . . . . . . . . . . . . . X-I
B. BAT SUBCATEGORIZATION . . . . . . . . . . . . . . . . . . X-I
C. TECHNOLOGY SELECTION . . . . . . . . . . . . . . . . . . X-2
i. Option I . . . . . . . . . . . . . . . . . . . . . . X-3 2. Option II . . . . . . . . . . . . . . . . . . . . . . X-3 3. Option III . . . . . . . . . . . . . . . . . . . . . X-4
D, POLLUTANT SELECTION . . . . . . . . . . . . . . . . . . . X-4
E. BAT EFFLUENT LIMITATIONS GUIDELINES . . . . . . . . . . . X-IO
I. Volatiles Limits . . . . . . . . . . . . . . . . . . X-If 2. Cyanide Limitations . . . . . . . . . . . . . . . . . X-If 3. Metals Limitations . . . . . . . . . . . . . . . . . X-12 4. Other Organic Pollutants . . . . . . . . . . . . . . X-28
F. COST AND EFFLUENT REDUCTION BENEFITS IMPLEMENTATION OF THE BAT EFFLUENT . . . . . . . . . . . . . . . . . . X-31
viii
TABLE OF CONTENTS ( C o n t i n u e d )
G. LIMITATIONS GUIDELINES . . . . . . . . . . . . . . . . . .
1. NPDES P e r m i t L i m i t a t i o n s . . . . . . . . . . . . . 2 . NPDES M o n i t o r i n g R e q u i r e m e n t s . . . . . . i
H. NON-WATER QUALITY ENVIRONMENTAL IMPACTS . . . . . . . . . .
1. A i r P o l l u t i o n . . . . . . . . . . . . . . . . . . . 2 . S o l i d W a s t e . . . . . . . . . . . . ~ . . . . . . . 3. E n e r g y R e q u i r e m e n t s . . . . . . . . . . . . . . . . .
XI. EFFLUENT QUALITY ATTAINABLE THROUGH THE APPLICATION OF NEW SOURCE PERFORMANCE STANDARDS ( N S F S )
A. INTRODUCTION . . . . . . . . . . . . . . . . . . , . . . .
B. POLLUTANT AND TECHNOLOGY SELECTION . . . . . . . . . . .
XII. EFFLUENT QUALITY ATTAINABLE THROUGH THE PRETREATMENT STANDARDS FOR EXISTING SOURCES AND PRETREATMENT STANDARDS FOR NEW SOURCES
A. INTRODUCTION . . . . . . . . . . . . . . . . . . . . . .
B. POLLUTANT SELECTION . . . . . . . . . . . . . . . . . . . . .
C. TECHNOLOGY SELECTION . . . . . . . . . . . . . . . . . . .
D. FSES AND PSNS . . . . . . . . . . . . . . . . . . . . . . . .
E. COST AND EFFLUENT REDUCTION BENEFITS . . . . . . . . . .
F. NON-WATER QUALITY ENVIRONMENTAL IMPACTS . . . . . . . . .
1. A i r P o l l u t i o n . . . . . . . . . . . . . . . . . . . . 2 . S o l i d W a s t e . . . . . . . . . . . . . . . . . . . . . 3 . E n e r g y R e q u i r e m e n t s . . . . . . . . . . . . . . . . .
XIII. BEST CONVENTIONAL POLLUTANT CONTROL TECHNOLOGY . . . . j . . . .
XIV. ACKNOWLEDGEMENTS . . . . . . . . . . . . . . . . . . . . . .
XV. GLOSSARY . . . . . . . . . . . . . . . . . • .........
APPENDIX III-A:
APPENDIX IV-A:
PRODUCT LISTINGS BY INDUSTRIAL SEGMENT ......
RATIONALE FOR THE FORM OF THE BPT BOD s REGRESSION MODEL . . . . . . . . . . . . . . . .
Page
X&31
X-31 X-32
X-36
X - 3 7 X - 3 7 X - 3 7
XI-1
XI-1
XII-I
XII-i
XII-2
XII-3
XII-6
XII-6
XII-7 XII-7 XII-7
XIII-1
XIV-I
XV-I
III-A1
IV-A1
i x

TABLE OF CONTENTS (Continued)
Page
APPENDIX VI-A: LIST OF THE 126 PRIORITY POLLUTANTS ....... VI-AI
APPENDIX VII-A: BPT LONG-TERM AVERAGE B0D s AND TSS PLANT- SPECIFIC TARGETS . . . . . . . . . . . . . . . . VII-A1
APPENDIX VII-B: RAW WASTEWATER AND TREATED EFFLUENT BOD_, TSS, COD, AND TOC DATA BEFORE AND AFTER ADJUSTMENT BY PLANT-SPECIFIC DILUTION FACTORS ....... VII-B1
APPENDIX VII-C: LISTING OF 69 BPT DAILY DATA PLANTS INCLUDED AND EXCLUDED FROM BPT VARIABILITY FACTOR CALCULATIONS . . . . . . . . . . . . . . VII-C1
APPENDIX VII-D: BPT STATISTICAL METHODOLOGY . . . . . . . . . . . VII-D1
APPENDIX VII-E: DISTRIBUTIONAL HYPOTHESIS TESTING ........ VII-El
APPENDIX VII-F:, BAT STATISTICAL METHODOLOGY . . . . . . . . . . . VII-F1
APPENDIX VII-G: EVALUATION OF THE VALIDITY OF USING FORM 2C DATA TO CHARACTERIZE PROCESS AND FINAL EFFLUENT WASTEWATER JUNE 17, 1985 ....... VII-GI
APPENDIX VIII-A: METHODOLOGY FOR CALCULATING BPT TARGETS AND IMPUTING MISSING ACTUAL B0D s AND TSS EFFLUENT VALUES . . . . . . . . . . . . . . . . VIII-A1
APPENDIX VIII-B: BPT, BAT, AND PSES COMPLIANCE COST ESTIMATES AND TECHNOLOGY BASIS ............... VIII-B1
APPENDIX VIII-C: BPT PLANT-BY-PLANT BOD 5 AND TSS LOADINGS ..... VIII-C1
APPENDIX VIII-D: BAT AND PSES PLANT-BY-PLANT TOXIC POLLUTANT WASTEWATER LOADINGS . . . . . . . . . . . . . . VIII-D1
APPENDIX VIII-E: BAT AND PSES PLANT-BY-PLANT AIR EMISSION LOADINGS . . . . . . . . . . . . . . . . . . . . VIII-E1
X

Figure
I I I - 1
IV-1
IV-2
IV-3
IV-4
IV-5
IV-6
IV-7
V-I
V-2
V-3
V-4
V-5
V-6
V-7
V-8
V-9
V-IO
V-li
V-12
V-13
LIST OF FIGURES VOLUME I
Page
R e l a t i o n s h i p s Among t h e SIC Codes R e l a t e d t o t h e P r o d u c t i o n o f O r g a n i c C h e m i c a l s , P l a s t i c s , and S y n t h e t i c F i b e r s . . . . . . . . . . . . . . . . . . . III-6
D i s t r i b u t i o n o f P l a n t s by P r o d u c t and BOD5 ( T h e r m o p l a s t i c s ) . . . . . . . . . . . . . . . . . . . IV-30
D i s t r i b u t i o n o f P l a n t s by P r o d u c t and BOD s ( T h e r m o s e t s ) . . . . . . . . . . . . . . . . . . . . . IV-31
D i s t r i b u t i o n o f P l a n t s by P r o d u c t and BOD 5 (Rayon) . . . IV-32
D i s t r i b u t i o n o f P l a n t s by P r o d u c t and BOD 5 ( F i b e r s ) . . . IV-33
D i s t r i b u t i o n o f P l a n t s by P r o d u c t and BOD5 (Commodi ty ) . . . . . . . . . . . . . . . . . . . . . . IV-34
D i s t r i b u t i o n o f P l a n t s by P r o d u c t and BOD 5 ( B u l k ) . . . . IV-35
D i s t r i b u t i o n o f P l a n t s by P r o d u c t and BOD s ( S p e c i a l t y ) . IV-36
P r i m a r y F e e d s t o c k S o u r c e s . . . . . . . . . . . . . . . . V-57
Coa l T a r R e f i n i n g . . . . . . . . . . . . . . . . . . . V-58
Methane . . . . . . . . . . . . . . . . . . . . . . . . . V-59
E t h y l e n e . . . . . . . . . . . . . . . . . . . . . . . . . V-60
P r o p y l e n e . . . . . . . . . . . . . . . . . . . . . . . . V-61
B u t a n e s / B u t e n e s . . . . , . . . . . . . . . , . . . . . . V-62
A r o m a t i c s . . . . . . . . . . . . . . . . . . . . . . . . V-63
P l a s t i c s and F i b e r s . . . . . . . . . . . . . . . . . . . V-64
P l a s t i c s and F i b e r s . . . . . . . . . . . . . . . . . . . V-65
N i t r o a r o m a t i c s , N i t r o p h e n o l s , B e n z i d i n e s , P h e n o l s , N i t r o s a m i n e s . . . . . . . . . . . . . . . . . . . . . V-66
C h l o r o p h e n o l s , C h l o r o a r o m a t i c s , H a l o a r y l E t h e r s , PCBs. • V-67
C h l o r i n a t e d C2s, C4, C h l o r o a l k y l E t h e r s . . . . . . . . . V-68
C h l o r i n a t e d C3s, Chloroalkyl Ethers, Acrolein, Acrylonitrile, Isophorone ........... ~ . . . V-69
x i

LIST OF FIGURES (Continued)
Figure
V-14
V-15
V-16
VII-I
VII-2
VIII-I
Vlll-2
VIII-3
VIII-4
VIII-5
VIII-6
VIII-7
VIII-8
VIII-9
VIII-10
VIII-f1
VIII-12
Halogenated Methanes ..................
Priori ty Pollutant (PRIPOL) Profile of the OCPSF Industry . . . . . . . . . . . . . . . . . . .
A Chemical Process . . . . . . . . . . . . . . . . . . .
Solubility of Metal Hydroxides and Sulfides as a Function of pH . . . . . . . . . . . . . . . . . . . .
Plot of Average TSS Effluent Versus BOD 5 Effluent for Plants With Biological Only Treatment With = 95% BOD s Removal or BOD s Effluent ~ = 40 mg/l ....
VOLUME II
Annualized Capital Cost Versus Additional BOD Removal . . . . . . . . . . . . . . . . . . . . . .
Annualized Unit Capital Cost Curve Versus Additional BOD s Removal . . . . . . . . . . . . . . . . . . . . .
Total Capital Cost Curve Versus Flow for Chemically Assisted Clarification Systems ............
Annual O&M Cost Curve Versus Flow for Chemically Assisted Clarification Systems ............
Land Requirements Curve Versus Flow for Chemically Assisted Clarification Systems ............
Total Capital Cost Curve Versus Flow for Multi- media Filter Systems .................
Annual O&M Cost Curve Versus Flow for Multi-media Filter Systems . . . . . . . . . . . . . . . . . . . .
Land Requirements Curve Versus Flow for Multi- media Filter Systems .................
Total Capital Cost Curve Versus Flow for Polishing Pond Systems . . . . . . . . . . . . . . . . . . . . .
Annual O&M Cost Curve Versus Flow for Polishing Pond Systems . . . . . . . . . . . . . . . . . . . . .
Land Requirements Curve Versus Flow for Polishing Pond Systems . . . . . . . . . . . . . . . . . . . . .
Annual O&M Cost Curve Versus Flow for Algae Control in Polishing Ponds Systems ..........
Page
V-70
V-73
V-75
VII-20
VII-167
VIII-64
VIII-65
VIII-72
VIII-73
VIII-74
VIII-81
VIII-82
Vlii-83
VIII-86
VIII-87
VIII-88
VIII-91
xii

LIST OFFIGURES (Continued)
Figure
VIII-13 Capital Cost Curve Versus Flow for Benzene at ' Effluent Concentration of 0.01 mg/! ..........
VIII-14 Capital Cost Curve Versus Flow for Benzene at' : '~ Effluent Concentration of 1.0 mg/l ...... • . . • . • •
VIII-15 Capital Cost Curve Versus Flow for Hexachloro- benzene a t Effluent Concentration 0 f 0 ; 0 1 m g / ' l ' ~". . . " ~." ',
VIII-16 Capital Cost Curve Versus Flow for Hexach!oro- ~ /,~ benzene of Effluent Concentration of I. 0 mg/iV. ' . .
VIIII-17 Annual O&M Cost Curve Versus Flow for Benzene ' and Hexachlorobenzene .................
VIII-18 Total Capital Cost Curve Versus Flow for Large BAT In-Plant Control CarbonTreatment "Systems; .... :
Medium Carbon Adsorption Capacity ....... .', . .
VIII-19 Total Capital :cost Curve Versus Flow for Large ~ PSES In-Plant Confrol Carbon Treatment Systems; Medium Carbon Adsorption Capacity ............
Vlil-20 Annual O&M Cost Curve Versus F10w f~r ]~arge BAT ;~ In-Plant Control Carbon Treatment Systems; Medium Carbon Adsorption Capacity ' ".
...[ - , , ..
VIII-21 Annual O&M Cost Curve Versus Flow for Large PSES In-Plant ContrOl Carbon Treatment Systems; Medium Carbon Adsorption Capacity ....... . . . .
VIII-22 Total Capital Cost Curve Versus Flow for Large BATI " In-Plant Control Carbon'Treatment Systems; " Low Carbon Adsorption Capacity . )......, ? . .
'VIII-23 Total Capital Cost Curve Versus Flow for Large PSES In-Plant Control Carbon Treatment Systems; Low C a r b o n A d s o r p t i o n C a p a c i t y ,. . . . . . . . . . . . " . . ". "'.'" .
V I I I - 2 4 A n n u a l O&M C o s t C u r v e V e r s u s F l o w f o r L a r g e BAT In-Plant Control Carbon Treatment Systems;
' Low C a r b o n A d s o r p t i o n C a p a c i t y . . . . . . . ' . . . . " .~
V I I I - 2 5 A n n u a l O&M C o s t ' C u r v e V e r s u s F l o w f o r L a r g e PSES " ' In-Plant Control Carbon Treatment Systems; Low Carbon Adsorption Capacity ............
VIII-2'6 Total Capital Cost Curves Versus Flow for Large End-of-Pipe Carbon Treatment Systems (On-site Carbon Regeneration Systemls) "i "'."" "'" "" i; t .,'.. ":""
Pa~e,,; ..
V I I I - 1 1 1
VIII-112
viii-n4
VIII-II5
VIII-143
v!II;~1.44
VIII-l~5
VIII-146 .,- -~
VIIi-f47
Vinli48
VIII-149
: L
VIII-150
VlIl-:I51
xiii

LIST OF FIGURES (Continued)
Figure
VIII-27 Annual O&M Cost Curves Versus Flow for Large End-of-Pipe Carbon Treatment Systems (On-site Carbon Regeneration Systems) .............
VIII-28 Total Capital Cost Curve Versus Flow for Small In-Plant and End-of-Pipe Carbon Treatment Systems (Low, Medium, High Carbon Adsorption Capacities) . . . . . . . . . . . . . . . . . . . . . .
VIII-29 Annual O&M Cost Curve Versus Flow for Small BAT In-Plant Control Carbon Treatment Systems; Medium Carbon Adsorption Capacity ...........
VIII-30 Annual O&M Cost Curve Versus Flow for Small PSES In-Plant Control Carbon Treatment Systems; Medium Carbon Adsorption Capacity ...........
VIII-31 Annual O&M Cost Curve Versus Flow for Small BAT In-Plant Control Carbon Treatment Systems; Low Carbon Adsorption Capacity .............
VIII-32 Annual O&M Cost Curve Versus Flow for Small PSES In-Plant Control Carbon Treatment Systems; Low Carbon Adsorption Capacity .............
VIII-33 Annual O&M Cost Curves Versus Flow for Small End-of-Pipe Carbon Treatment Systems ..........
VIII-34 Land Requirements Curve Versus Flow for Activated Carbon Treatment Systems ................
VIII-35 Total Capital Cost Curve Versus Flow for Coagulation/Flocculation/Clarification Systems .....
VIII-36 Land Requirements Curve Versus Flow for Coagulation/Flocculation/Clarification Systems .....
VIII-37 Annual O&M Cost Curve Versus Flow for Coagulation/Flocculation/Clarification Systems .....
VIII-38 Comparison of Actual Systems Capital Cost and EPA's Estimates for Coagulation/Flocculation/ Clarification . . . . . . . . . . . . . . . . . . . . .
VIII-39 Total Capital Cost Curve Versus Flow for Sulfide Precipitation Systems ..................
VIII-40 Annual O&M Cost Curve Versus Flow for Sulfide Precipitation Systems .................
Pa~e
VIII-152
VIII-157
VIII-158
VIII-159
VIII-160
VIII-161
VIII-162
VIII-163
VIII-166
VIII-168
VIII-169
VIII-173
VIII-177
VIII-178
xiv

Figure
VIII-41
VIII-42
VIII-43
VIII-44
VIII-45
VIII-46
,VIII-47
VIII-48
VIII-49
VIII-50
VIII-51
VIII-52
VIII-53
VIII-54
VIII-55
VIII-56
VIII-57
LIST OF FIGURES (Continued)
.Page
Total Capital Cost Curve Versus Flow for Cyanide Destruction Systems .............. .... VIII-185
Annual O&M Cost Curve Versus Flow for Cyanide Destruction Systems .................. VIII-186
Total Capital Cost Curve Versus In-Plant Biological Treatment
Flow for Small Systems ......... VIII-190
Total Capital Cost Curve Versus Flow for Large In-Plant Biological Treatment Systems ......... VIII-191
Annual O&M Cost Curve Versus Flow for Small In-Plant Biological Treatment Systems ......... VIII-192
Annual O&M Cost Curve Versus Flow for Large In-Plant Biological Treatment Systems ...... . . . VIII-193
Land Requirements Curve Versus Flow for Small In-Plant Biological Treatment Systems .........
Land Requirements Curve Versus Flow for Large In-Plant Biological Treatment Systems .........
VIII-195 i
VIII-196"
Total Capital Cost Curve Versus Flow for Belt Filter Press Systems .................. VIII-209
Land Requirements Curve Versus Flow for Belt Filter Press Systems .................. VIII-210
Annual 0&M Cost Curve Versus Flow for Belt Filter Press Systems .................. VIII-212
Total Capital Cost Curve Versus Flow for Fluidized Bed Incineration Systems ........... VIII-217
Annual O&M Cost Curve Versus Fluidized Bed Incineration
Flow for Systems ........... VIII-219,
Overview of Methodology for Identification of OCPSF Plants Requiring RCRA Baseline Costing ....... Vlii-223
Raw Waste Load Calculation Logic Flow .......... VIII-261
BPT, BAT, and Current Waste Load Calculation Logic Flow . . . . . . . . . . . . . . . . . . . . . . . VLII-268
PSES Waste Load Calculation ............... VIII-269
XV

Table
II-I
11-2
11-3
11-4
III-I
111-2
III-3
III-4
III-5
111-6
111-7
III-8
111-9
III-I0
III-II
111-12
LIST OF TABLES VOLUME I
BPT Effluent Limitations and NSPS by Subcategory (mg/l) . . . . . . . . . . . . . . . . . .
BAT Effluent Limitations and NSPS for the End-of- Pipe Biological Treatment Subcategory .........
BAT Effluent Limitations and NSPS for the Non-End- of-Pipe Biological Treatment Subcategory .......
Pretreatment Standards for Existing and New Sources (PSES and PSNS) . . . . . . . . . . . . . . . . . . . .
SIC 2865: Cyclic (Coal Tar), Crudes, and Cyclic Intermediates, Dyes, and Organic Pigments (Lakes and Toners) . . . . . . . . . . . . . . . . . .
SIC 2869: Industrial Organic Chemicals, Not Elsewhere Classified .................
SIC 2821: Plastic Materials, Synthetic Resins, and Nonvulcanizable Elastomers ............
SIC 2823: Cellulosic Man-Made Fibers ..........
SIC 2824: Synthetic Organic Fibers, Except Cellulosic . . . . . . . . . . . . . . . . . . . . . .
OCPSF Chemical Products Also Listed as SIC 29110582 Products . . . . . . . . . . . . . . . . . . . . . . .
OCPSF Chemical Products Also Listed as SIC 29116324 Products . . . . . . . . . . . . . . . . . . . . . . .
Major Generalized Chemical Reactions and Processes of the Organic Chemicals, Plastics, and Synthetic Fibers Industry ...............
Plant Distribution by State ...............
Distribution of Plants by age of Oldest OCPSF Process Still Operating as of 1984 ..........
Plant Distribution by Number of Employees ........
Plant Distribution by Number of Product/Processes and Product/Product Groups for Primary Producers That are AlsoDirect and/or Indirect Dischargers
PaGe
II-9
11-12
II-14
II-18
III-lO
III-12
III-15
III-16
111-17
III-18
III-19
III-29
III-33
III-34
III-36
111-37
xvi

Table
III-13
111-14
III-15
III-16
IV-I
V-I
V-2
V-3
V-4
V-5
V-6
V-7
V-8
V-9
V-IO
LIST OF TABLES (Continued)
Distribution of 1982 Plant Production 0uantity by OCPSF SIC Group ....................
Distribution of 1982 Plant Sales Value by OCPSF SIC Group .......................
Mode of Discharge ....................
Data Base Designation ..................
BAT Effluent Estimated Long-Term Average Concentration Comparison Between Plastics and Organics Plants and Pure BPT Subcategory Plants ............
Total oCPSF Plant Process Wastewater Flow Characteristics by Type of Discharge .........
Total OCPSF Plant Nonprocess Wastewater Flow Characteristics by Type of Discharge .........
Process Wastewater Flow for Primary OCPSF Producers by Subcategory and Disposal Method ............
Process Wastewater Flow During 1980 for Secondary OCPSF Producers by Subcategory and Disposal Method .
Process Wastewater Flow for Primary and Secondary OCPSF Producers That are Zero/Alternative Dischargers ......................
Non-Process Wastewater Flow During 1980 for Secondary OCPSF Producers and Zero/Alternative Dischargers by Subcategory and Disposal Method ..........
Total OCPSF Non-Process Wastewater Flow in 1980 for Primary Producers by Subcategory and Disposal Method . . . . . . . . . . . . . . . . . . . . . . . .
Non-Process Cooling Water Flow for Primary OCPSF Producers by Subcategory and Disposal Method .....
OCPSF Miscellaneous Non-Cooling Non-Process Wastewater Flow for Primary Producers by Sub- category and Disposal Method .............
Process Wastewater Flow for Primary OCPSF Producers by Subcategory and Disposal Method ..........
Page
111-39
111-40
111-42
111-49
IV-40
V-4
V-5
V-7
V-8
V-9
V-lO
V-II
V-12
V-13
V-14
x v i i

LIST OF TABLES (Con t inued)
Table Page
V - l l Process Wastewater Flow During 1980 for Secondary OCPSF Producers by Subcategory and Disposal Method . . V-15
V-12 Process Wastewater Flow for Primary and Secondary OCPSF Producers That are Zero/Alternative Dischargers ....................... V-16
V-13 Non-Process Wastewater Flow During 1980 for Secondary OCPSF P r o d u c e r s and Z e r o / A l t e r n a t i v e D i s c h a r g e r s by Subca t ego ry and Disposa l Method . . . . . . . . . . V-17
V-14 Total OCPSF Non-Process Wastewater Flow in 1980 for Primary Producers by Subcategory and Disposal Method . . . . . . . . . . . . . . . . . . . . . . . V-18
V-15 Non-Process P r o d u c e r s
Cool ing Water Flow f o r P r imary OCPSF by Subca t ego ry and Di sposa l Method . . . . . V-19
V-16 OCPSF Miscellaneous Non-Cooling Non-Process Waste- wate r Flow f o r Pr imary P r o d u c e r s by Subca t ego ry and Di sposa l Method . . . . . . . . . . . . . . . . . . V-20
V-17 Water C o n s e r v a t i o n and Reuse T e c h n o l o g i e s . . . . . . . . V-25
V-18 Water R e c i r c u l a t e d and Reused I n d u s t r i e s 1978 Census Data
by Use f o r the OCPSF (a) . . . . . . . . . . . . V-27
V-19 Summary of OCPSF P r oces s and Nonprocess Wastewater R e c yc l e Flow f o r Pr imary P r o d u c e r s Exc lud ing Zero D i s c h a r g e r s . . . . . . . . . . . . . . . . . . . V-28
V-20 Summary Statistics of Raw Wastewater BOD Concen-trations by Subcategory Group and Disposal Methods Producer = Primary .................. V-32
V-21 Summary Statistics of Raw Wastewater BOD Concen- trations by Subcategory Group and Disposal Method Producer = Secondary ................. V-33
V-22 Summary Statistics of Raw Wastewater COD Concen- trations by Subcategory Group and Disposal Method Producer = Primary .......... ........ V-34
V-23 Summary Statistics of Raw Wastewater COD Concen- trations by Subcategory Group and Disposal Method Producer = Secondary ................. V-35
V-24 Summary Statistics of Raw Wastewater TOC Concen- trations by Subcategory Group and Disposal Method Producer = Primary .................. V-36
x v i i i

LIST OF TABLES (Continued)
Table
V-25 Summary Statistics of Raw Wastewater TOC Concen- trations by Subcategory Groupand Disposal Method Producer = Secondary . . . . . . . . . . . . . . . . .
V-26 Summary Statistics of Raw Wastewater TSS Concen- trations by Subcategory Group and Disposal Method Producer = Primary . . . . . . ........ ~ . . .
V-27 Summary Statistics of RawWastewater TSS Concen- trations by Subcategory Group and Disposal Method Producer = Secondary . . . . . . . . . . . . . . . . .
V-28 Summary Statistics of Raw Wastewater BOD Concen a t r a t i o n s by Subca tegory Group and Disposa l Method (wi th 95% and 70% Rule) P roducer = Pr imary . . . . . . .
V-29 Summary Statistics of Raw Wastewater BOD Concen- trations by Subcategory Group and Disposal Method (with 95% and 70% Rule) Producer = Secondary ......
V-30. Summary Statistics of Raw Wastewater COD ConcenC : trations by Subcategory Group and Disposal Method (with 95% and 70% Rule) Producer = Primary ......
V-31 Summary Statistics of Raw Wastewater COD Concen- trations by Subcategory Group and Disposal Method (with 95% and 70% Rule) Producer = Secondary .....
V-32 Summary Statistics of Raw Wastewater TOC Concen- trations by Subcategory Group and Disposal Method (with 95% and 70% Rule) Producer = Primary ..... •
V-33 Summary Statistics of Raw Wastewater TOC Concen- trations by Subcategory Group and Disposal Method (with 95% and 70% Rule) Producer = Secondary .....
V-34 Summary Statistics of Raw Wastewater TSS Concen- trations by Subcategory Group and Disposal Method (with 95% and 70% Rule) Producer = Primary ......
V-35 Summary Statistics of Raw Wastewater TSS Concen- trations by Subcategory Group and DispoSal Method (with 95% and 70% Rule) Producer = Secondary
V-36 Generic Procceses Used Chemical Products
to Manufacture Organic
V-37 Major Plastics and synthetic Fibers Products by Generic Process ...... ". ....... • .' • . • •
Pa~e
V-37
V-38
V-39.
V-41
V/42"
vi43
V-44
V-45
V-46
V-~47
V-48.
V-52
V-54
•x i x

LIST OF TABLES (Continued)
Table
V-38 Critical Precursor/Generic Process Combinations That Generate Priority Pollutants ...........
V-39 Organic Chemicals Effluents with Significant Concentrations (>0.5 ppm) of Priority Pollutants . . .
V-40 Plastics/Synthetic Fibers Effluents with Significant Concentrations (>0.5 ppm) of Priority Pollutants . . .
V-41 Priority Pollutants in Effluents of Precursor- Generic Process Combination ..............
V-42 Overview of Wastewater Sampling Programs Included in BAT Raw Waste Stream Data Base ...........
V-43 Phase II Screening - Product/Process and Other Waste Streams Sampled at Each Plant ..........
V-44 Selection Criteria for Testing Priority Pollutants in Verification Samples ................
V-45 Number of Sampling Days for 12-Plant Long-Term Sampling Program . . . . . . . . . . . . . . . . . . .
V-46 Summary Statistics for Influent Concentrations for All OCPSF Plants . . . . . . . . . . . . . . . . . . .
V-47 Summary Statistics for Influent Concentrations Organics-Only OCPSF Plants ..............
for
V-48 Summary Statistics for Influent Concentrations Plastics-Only OCPSF Plants ..............
for
V-49 Summary Statistics for Influent Concentrations for Organics and Plastics OCPSF Plants ..........
V-50 Summary of Priority Pollutant Metal-Product/ Process-Plant Validation ...............
VI-1 Twenty-six Toxic Pollutants Proposed for Exclusion
VI-2 Frequency of Occurrence and Concentration Ranges for Selected Priority Pollutants in Untreated Wastewater . . . . . . . . . . . . . . . . . . . . . .
VI-3 ...Toxic Pollutants Excluded from Regulation for BAT Subcategories One and Two Under Paragraph 8(a)(iii) of the Settlement Agreement Because they Were ......
Page
V-72
V-77
V-81
V-84
V-91
V-95
V-lO0
V-104
V-106
V-I08
V-I09
V-ll0
V-l15
VI-8
VI-12
VI-16
XX

LIST OF TABLES (Continued)
Table Page
VI-4 Wastewater Loading for Eight Toxic Pollutants Being Considered for Paragraph Eight Exclusion .... Vl-19
VI-5 Four Toxic Pollutants Reserved from Regulation Under BAT for Subcategory One. ......... ...... Vl-21
VI-6 Eight Toxic Pollutants Reserved from Regulation Under BAT for Subcategory Two ............. Vl-21
VI-7 Final PSES Pass-Through Analysis Results (Non- End-of-Pipe Biological Subcategory Data) ....... Vi-23
VI-8 Final PSES Pass-Through Analysis Results (End-of- Pipe Biological Subcategory Data) ........... Vii25
VI-9 Volatile and Semivolatile Toxic Pollutants Targeted for Control Due to Air Stripping ....... VI-29
VI-IO Estimated POTW Removal Data from Pilot- or Bench- scale Studies for Selected Toxic Pollutants ...... VI-35
VI-II Forty-seven Toxic Pollutants Determined to Interfere With, Inhibit, or Pass-Through POTWs, and Regulated Under PSES and PSNS Based on Table VII-7 ....... VI-39
VI-12 Six Toxic Pollutlnts Determined not to Interfere With, Inhibit, or Pass-Through POTWs, and Excluded from Regulation Under PSES and PSNS .......... VI-40
VI-13 Six Toxic Pollutants That Do Not Volatilize Extensively and Do Not Have POTW Percent Removal Data ..................... Vl-40
Vl-14 Results of PSES Analysis to Determine if Toxic Pollutant Removals were "...Sufficiently Controlled by Existing Technologies..." ............. VI-41
VI-15 Three Toxic Pollutants Excluded from PSES and PSNS Regulation Under Paragraph 8(a)(iii) of the Settle- ment Agreement because they were "... Sufficiently Controlled by Existing Technologies..." ........ VI-42
Vl-16 Three Pollutants Reserved from Regulation Under PSES and PSNS Due to Lack of POTW Percent Removal Data . ~ ................... VI-42
VII-I Frequency of In-Plant Treatment Technologies in the OCPSF Industry Listed by Mode of Discharge and Type of 0uestionnaire Response ............ VII-12
xxi

Table
VII-2
Vll-3
VII-4
VII-5
VII-6
VII-7
VII-8
Vll-9
VII-10
VII-ll
VII-12
VII-13
VII-14
VII-15
Vll-16
Vll-17
VII-18
LIST OF TABLES (Continued)
Oxidation of Cyanide Wastes With Ozone .........
Performance Data for Total Cyanide Oxidation Using Chlorination . . . . . . . . . . . . . . . . . .
Comparison of OCPSF and Metal Finishing Raw Waste Metals and Cyanide Concentrations ...........
Raw Waste and Treated Effluent Zinc Concentrations from Rayon and Acrylic Fibers Manufacturing ......
Henry's Law Constant (Hi) Groupings ...........
Steam Stripping Performance Data ............
Steam Stripping and Activated Carbon Performance Data . . . . . . . . . . . . . . . . . . . . . . . . .
Daily Activated Carbon Performance Data for Nitrobenzene, Nitrophenols, and 4,6-Dinitro- O-Cresol Plant No. 2680T . . . . . . . . . . . . . . .
Typical Ion Exchange Performance Data .........
Carbon Adsorption Performance Data from Plant No. 2680T . . . . . . . . . . . . . . . . . . . . . . .
Performance Data from Hydroxide Precipitation and Hydroxide Precipitation Plus Filtration for Metal Finishing Facilities . . . . . . . . . . . . . .
Ultrafiltration Performance Data for Metals in Laundry Wastewater-OPA Locka, Florida .........
Performance Data Basis for In-Plant Biological Systems . . . . . . . . . . . . . . . . . . . . . . .
Frequency of Primary Treatment Technologies in the OCPSF Industry . . . . . . . . . . . . . . . . . . . .
Frequency of Secondary Treatment Technologies in the OCPSF Industry . . . . . . . . . . . . . . . . . .
Frequency of Polishing/Tertiary Treatment Technologies in the OCPSF Industry ..........
Activated Sludge Performance Data for BOD 5 and TSS . . . . . . . . . . . . . . . . . . . . . . .
Page
Vll-15
VII-16
VII-25
Vli-28
VII-33
Vli-35
VII-37
VII-38
VII-41
VII-43
VII-45
VII-47
Vll-50
VII-52
VII-53
VII-54
VII-65
x x i i

Table
Vll-19
VII-20
VII-21
VII-22
Vli-23
Vli-24
VII-25
VII-26
VII-27
VII-28
VII-29
VII-30
VII-31
VII-32
VII-33
VII-34
vii-35
VII-36
LIST OF TABLES (Continued)
Lagoon Performance Data for BOD s and TSS ........
Attached Growth Treatment Systems Performance Data for BOD 5 and TSS .... ............
Typical Design Parameters for Secondary Clarifiers Treating Domestic Wastewater ...... .......
Monthly BOD 5 Removal Efficiency ............
Monthly BOD 5 Efficiency by Region Subset I (Northern--W-V, IA, IL, IN, RI) ............
Monthly BOD 5 Efficiency by Region Subset II (Southern--GA, LA, SC, TX).
Monthly BOD s Efficiency by Region Subset III (Middle-Latitude--VA, NC) . . . . ..........
Average Effluent BOD by Month .............
Average Effluent TSS by Month .............
Monthly Effluent BOD s by Region Subset I (Northern--WV, IL, RI, IA, IN) ............
Monthly Effluent BOD s by Region Subset II (Southern--TX, GA, LA, SC) ..............
Monthly Effluent BOD. by Region Subset III (Middle-Latitude--~A, NC) ..............
Monthly Effluent TSS by Region Subset I (Northern--WV, IL9 RI, IA, IN). . . . ........
Monthly Effluent TSS by Region Subset II (Southern--TX, GA, LA, SC). . . ~ ..........
Monthly Effluent TSS by Region Subset III (Middle-Latitude--VA, NC) ..............
Monthly Data for Plant #2394 ..............
Matrix of 18 Plants With Polishing Ponds Used as Basis for BPT Option II Limitations .... . .
Option III OCPSF Plants With Biological Treatment Plus Filtration Technology That Pass the BPT Editing Criteria ..... ...... ........
Page
VII-69
Vli-72
Vli-74
VII-84
VII-85
VII-86
VII-87
Vll-91
Vli-92
VII-94
VII-95
VII-96
VII-97.
VII-98
VII-99
VII-103
. . VII-106
VII-109
x x i i i

LIST OF TABLES (Continued)
Table
Vli-37
VII-38
VII-39
Vll-40
Vll-41
VII-42
VII-43
VII-44
VII-45
VII-46
VII-46
VII-48
VII-49
Vll-50
Vll-51
VII-52
Summary of Chemically Assisted Clarification Technology Performance Data .............
Final Effluent Quality of a Chemically Assisted Clarification System Treating Bleached Kraft Wastewater . . . . . . . . . . . . . . . . . . .
Classes of Organic Compounds Adsorbed on Carbon ....
Summary of Carbon Adsorption Capacities ........
End-of-Pipe Carbon Adsorption Performance Data from Plant No. 302[3 ..................
Treatment Technologies for Direct Nonbiological Plants...'. . . . . . . . . . . . . . . . . . . . .
Performance of OCPSF Nonbiological Wastewater Treatment Systems ..................
BOD s and TSS Reductions by Clarification at Selected Pulp, Paper, and Paperboard Mills ......
List of Regulated Toxic Pollutants and the Technology Basis for BAT Subcategory One and Two Effluent Limitations ...............
Summary of the Long-Term Weighted Average Effluent Concentrations for the Final BAT Toxic Pollutant Data Base for BAT Subcategory One ..........
Summary of the Long-Term Weighted Average Effluent Concentrations for the Final BAT Toxic Pollutant Data Base for BAT Subcategory Two ..........
Frequency of Waste Stream Final Discharge and Disposal Techniques .................
Frequency of Sludge Handling, Treatment, and Disposal Techniques .................
Contaminated and Uncontaminated Miscellaneous "Nonprocess" Wastewaters Reported in the 1983 Section 308 Questionnaire ..............
Summary Statistics for Determination of BPT BOD s Editing Criteria by Groups ..............
Rationale for Exclusion of Daily Data Plants from Data Base . . . . . . . . . . . . . . . . . . . .
Page
Vll-l14
VII-If6
Vll-121
VII-122
VII-126
VII-128
VII-135
VII-136
VII-139
VII-142
Vli-144
VII-146
Vll-151
VII-155
VII-163
Vli-173
xxiv

LIST OF TABLES (Continued)
Table
VII-53
VII-54
VII-55
VII-56
VII-57
VII-58
VII-59
VII-60
VII-61
VII-62
VII-63
VII-64
VII-65
VII-66
VII-67
BPT Subcategory Long-Term Averages (LTAs) for BOD 5 . . . . . . . . . . . . . . . . . . . . . . .
BPT Subcategory Long-Term Averages (LTAs) for TSS . . . . . . . . . . . . . . . . ~ ......
Overall Average Versus Production-Proportion- Weighted Variability Factors .............
BOD s Variability Factors for Biological 0nly Systems (Effluent BOD s < 40 mg/1 or BOD 5 Percent Removal > 95%).
TSS Variability Factors for Biological Only Systems (Effluent BOD_ < 40 mg/l or BOD_ Percent Removal > 95%~and TSS < I00 mg/~)'~ .....
Priority Pollutant (PRIPOL) Data Sources for the Final OCPSF Rule ............ '. , . . . . .
Data Retained from Data Sets 3 and 4 Following BAT Toxic Pollutant Editing Criteria .... .....
Explanation of BAT Toxic Pollutant Data Base Performance Edits . . . . . . . . . . . . . . . . . .
Plant and Pollutant Data Retained in BAT Organic Toxic Pollutant Data Base for BAT Subcategory One Limitations ..... . . ............
Plant and Pollutant Data Retained in BAT Organic Toxic Pollutant Data Base for BAT Subcategory Two Limitations ............. ~ . . . . .
Treatment Technologies for Plants in the Final BAT Toxic Pollutant Data Base . . . . . . . . . . . . . .
BAT Toxic Pollutant Median of Estimated Long-Term Averages for BAT Subcategory One and Two .......
Priority Pollutants by Chemical Groups .........
Individual Toxic Pollutants Variability Factors for BAT Subcategory One . . . . . . . . . . . . . . .
Individual Toxic Pollutants Variability Factors for BAT Subcategory Two . ~ ..............
Page
VII-176
VII-176
VII-178
VII-179
VII-181
VII-184
VII-188
VII-189
VII-191
Vli-199
VII-202
Vli-208
VII-212
VII-220
VII-223
XXV
i

LIST OF TABLES (Continued)
Table
VII-68
VII-69
VIII-I
VIII-2
VIII-3
VIII-4
VIII-5
Vlll-6
Vlll-7
VIII-8
VIII-9
VIII-lO
VIII-II
VIII-12
Page
BAT Subcategory One and Two Long-Term Averages and Variability Factors for Metals and Total Cyanide. VII-226
BAT Zinc Long-Term Averages and Variability Factors for Rayon (Viscose Process) and Acrylic (Zinc Chloride/Solvent Process) Fibers Plants ....... VIII-229
VOLUME II
BPT Costing Rules .................... VIII-3
Generic Chemical Processes ............... VIII-8
"Trigger" Values Used as BAT Option II In-Plant Costing Targets for Plants With End-of-Pipe Biological Treatment In-Place ............ VIII-IO
BAT Long-Term Medians Used as Costing Targets for Plants Without Biological Treatment In-Place ..... VIII-12
Pollutants to be Controlled Using In-Plant Biological Treatment ................. VIII-14
High Strippability ]Priority Pollutants Costed Steam Stripping for BAT Option IIA and PSES IVA . . . VIII-16
Medium Strippability Priority Pollutants Costed for Steam Stripping for BAT Option IIA and PSES Option IVA ................... Vlll-17
Medium Adsorpability Priority Costed for Activated Carbon for BAT Option IIA and PSES Option IVA .... VIII-18
Low Adsorpability Priority Pollutants Costed for Activated Carbon for BAT Option IIA and PSES Option IVA ...................... VllI-19
High Strippability Priority Pollutants Costed for Steam Stripping for BAT Option IIB and PSES Option lib ...................... VIII-20
Medium Strippability Priority Pollutants Costed for Steam Stripping for BAT Option IIB and PSES Option IVB .................... VIII-21
Medium Adsorpability Priority Pollutants Costed for Activated Carbon for BAT Option IIB and PSES Option IVB .................... VIII-22
xxvi

LIST OF TABLES (Continued)
Table
V I I I - 1 3
V!II-14
VIII-15
Vlll-16
VIII-17
VII I -18
VIII-19
VIII-20
VIII-21
VIII-22
VIII-23
VIII-24
VIII-25
VIII-26
VIII-27
VIII-28
VIII-29
Page
Low A d s o r p a b i l i t y P r i o r i t y Pollutants Costed for Steam Stripping for BAT Option IIB and PSES Option IVB ................... VIII-23
Overall Averages of the Average Ratio Values (Process to Total Flow) . . . . . . . . . . . . . . . . . VIII-25
Regulated Pollutants and LTMs for PSES Option IV . . VIII-27
Temperatures and Temperature Cost Factors Used tO Calculate Activated Sludge Cost and to Adjust Biological Treatment Upgrade Costs ..... . VIII-30
~and Cos t f o r Suburban Areas . . . . . . . . . . . . . VIII-33
Summary of Land Cost in the United States ....... VIII-37
Activated Sludge Default and Replacement Data for Unit Cost Items Used in Costing Exercise CAPDET Model (1979) ................. VIII-42
Activated Sludge K-Valuesand MLVSS Values from 308 Questionnaires ............... VIII-43
Activated Sludge Table of Reported 308 Questionnaire Data . . . . . . . . . . . . . . . . . VIII-45
Activated Sludge Table of Reported Capital Cost Per Gallon and O&M Cost per 19000 Gallon ...... VIII-46
Activated Sludge Comparison of CAPDET and Reported Capital and O&M Costs (1982 Dollars) .... VII I -48
Activated Sludge Comparison Of Reported and CAPDET Detention Times (Td) ............. VI I I - 49 ,
Activated Sludge Comparison of Reported and and CAPDET O&M Costs (1982 Dollars)... ...... VIII-50
Activated Sludge Comparison of Operation and Maintenance Man-Hours ................ VIII-52
Activated Sludge Table of Reported Operating and Maintenance Labor Rates (1982 Dollars). .... VIII-54
Activated Sludge Revised Land Requirements ...... VIII-55
Capital and Annual Costs of Biological Treatment Modifications for Activated Sludge System Upgrades .................... VIII-58
xxvii

LIST OF TABLES (Continued)
Table
Vlll-30
VIII-31
VIII-32
VIII-33
VIII-34
VIII-35
VIII-36
VIII-37
VIII-38
VIII-39
VIII-40
VIII-41
VIII-42
VIII-43
Product Mix of the Five Facilities Used in the Development of the Capital Cost Curve for Activated Sludge System Upgrades ..........
Current Influent and Effluent B0D 5 Concen- trations at the ]Five Facilities Used in the Development of Capital Cost Curves for Activated Sludge System Upgrades ..........
Project Capital and Operation and Maintenance (O&M) Costs Associated with Activated Sludge System Upgrades ...................
Summary of Chemically Assisted Clarification Specifications ...................
Itemized Capital Costs for Chemically Assisted Clarifiers .....................
Itemized Annual Operating Costs for Chemically Assisted Clarifiers .................
Benchmark Comparison .................
Summary of Filtration System Specifications ......
Summary of Capital and O&M Costs for Filtration Systems 1982 Dollars (March) ............
Summary of Capital and O&M Costs for Polishing Ponds . . . . . . . . . . . . . . . . . . . . . . . .
Annual Operating Cost for Algae Control in Polishing Ponds (1982 Dollars) ...........
Ten Treatment Systems With Polishing Ponds In-Place (At Nine Plants) That Were Costed 0nly for Copper Sulfate Addition ..........
Summary of Capital and O&M Costs for Polymer Addition Systems for Upgrading Secondary Clarifiers .....................
Summary of Polymer Addition Costs for Six Treatment Systems Selected for Secondary Clarifier Upgrades .................
Page
VIII-59
VIII-62
Vlii-66
VIII-68
VIII-69
VIII-71
VIII-75
VIII-79
VIII-80
VIII-85
VIII-90
VIII-92
VIII-93
Vlii-94
xxviii

Table
VIII-44
VIII-45
VIII-46
VIII-47
VIII-48
VIII-49
VIII-50
VIll-51
VIII-52
VIII-53
VIII-54
VlllU55
Vlii-56
VIII-57 3
VIII-58
J
VIII-59
LIST OF TABLES (Continued)
Comparison of Predicted and Reported Capital and O&M Costs for Steam Stripping ..........
Priority Pollutants Divided Into Groups According to Henry's Constant Values ........
Reported Steam Stripping Average Influent and Effluent BAT from the 1983 Supplemental Questionnaire .................. . •
Steam Stripping Design Parameters for High Henry's Law Constant Pollutants ...........
Steam Stripping Design Parameters for Medium Henry's Law Constant Pollutants ...........
Steam Stripping Design Parameters for Low Henry's Law Constant Pollutants ...........
Steam Stripping Results for Removal of Benzene (1982 Dollars) ...............
Steam Stripping Results for Removal of Hexachlorobenzene (1982 Dollars) ...........
Equations for Determining Computerized Cost Curves from Steam Stripping Results (1982 Dollars) ...................
Steam Stripping ($$) Overhead Disposal Cost Estimates ......................
Steam Stripping Upgrade Costs .............
Adjustments to CAPDET Default Data and Results for Activated Carbon Systems ............
Influent/Effluent Levels of Total Organic Priority Pollutants of Biological Treatment Systems for Typical Organic Chemical Plants .....
Summary of In-Plant Carbon Adsorption Capacities (lbs of Pollutants Adsorbed/lb Carbon) .......
Carbon Usage Rate for Priority Pollutants (In-Plant BAT Treatment) (ibs of Pollutants Adsorbed/lb Carbon) .................
Summary of In-Plant Carbon Adsorption Capacities (lbs of Pollutants Adsorbed/lb Carbon) .......
VIII-96
VIII-99
VIII-100
Vlll-102
VIII-104
VIII-106
VIII-108
VIII-109
VIII-IIO
VIII-If7
Vlll-120
VIII-122
VIII-125
VIII-127
VIII-130
VIII-131
xxix

LIST OF TABLES (Continued)
Table
VIII-60
VIII-61
VIII-62
VIII-63
VIII-64
Vlii-65
VIII-66
VIII-67
VIII-68
VIII-69
VIII-70
VIII-71
VIII-72
VIII-73
Carbon Usage Rate for Priority Pollutants (In-Plant PSES Treatment) (ibs of Pollutants Adsorbed/ib Carbon) .................
Summary of Carbon Adsorption Capacities (End- of-Pipe) (lbs of Pollutants Adsorbed/lb Carbon) . . . . . . . . . . . . . . . . . . . . . . .
Carbon Usage Rate for Priority Pollutants (End-of-Pipe Treatment) (ibs of Pollutants Adsorbed/ib Carbon) .................
Granular Activated Carbon Equipment Cost Basis In-Plant Carbon Treatment System Low Carbon Adsorption Capacity .................
Granular Activated Carbon Equipment Cost Basis In-Plant Carbon Treatment System Low Carbon Adsorption Capacity .................
Granular Activated Carbon Equipment Cost Basis (Erd-of-Pipe Treatment) ...............
Total Capital and O&M Costs for Large In-Plant Medium Carbon Adsorption Treatment Systems (1982 Dollars) ....................
Total Capital and O&M Costs for Large In-Plant Low Carbon Adsorption Treatment Systems (1982 Dollars) ....................
Cost Estimate for Large End-of-Pipe Carbon Treatment Systems (1982 Dollars) ..........
Itemized Capital Cost for Small In-Plant and End-of-Pipe Carbon Treatment Systems (1982 Dollars) ....................
Itemized O&M Cost for Small In-Plant Medium Carbon Treatment Systems (1982 Dollars) .......
Itemized O&M Cost for Small In-Plant Low Carbon Treatment Systems (1982 Dollars) .......
Itemized O&M Cost for Small End-of-Pipe Carbon Treatment Systems (1982 Dollars) .......
i
Itemized Capital Costs for Coagulation/ Flocculation/Clarification Systems .........
PaGe
VIII-133
VIII-134
VIII-135
VIII-136
VIII-137
Vlii-138
VIII-140
VIII-141
VIII-142
VIII-153
VIII-154
VIII-155
VIII-156
VIII-165
XXX

Table
VIII-74
VIII-75
Vlii-76
VIII-77
Vlii-78
VIII-79
VIII-80
VIII-81
VIII-82
VIII-83
VIII-84
VIII-85
Vlii-86
VIII-87
VIII-88
VIII-89
VIII-90
LIST OF TABLES (Continued)
Itemized Annual Operating Costs for Coagulation/ Flocculation/Clarification Systems .........
Benchmark Comparison for Coagulation/ Flocculation/Clarification Systems .........
Itemized Capital Costs for Sulfide Precipitation Systems . . . . . . . . . . . . . . . . . . . . . . .
Annual Operating Costs for Sulfide Precipitation Systems . . . . . . . . . . . . . . . . . . . . . . . .
A Comparison of Annual Operating Cost for Lime Precipitation Systems and Sulfide Precipitation Systems . . . . . . . . . . . . . . . . . . . . . . .
Chemica l P r e c i p i t a t i o n Upgrade C o s t s . . . . . . . . .
Design Specifications for Cyanide Destruction System . . . . . . . . . . . . . . . . . . . . . . .
Total Capital and O&M Cost for Cyanide Destruction Systems .................
Comparison of Technology Costs for PSES Plants ....
Total Capital and O&M Cost for the In-Plant Biological Treatment Control Systems ........
In-Plant Biological Treatment Land Requirements ....
M o n i t o r i n g F r e q u e n c i e s . . . . . . . . . . . . . . . .
Number of Parameters and Fractions to be Analyzed.
Comparison of Annual Monitoring Cost (1982 Dollars) for Organic and Plastics Facilities Using Analysis Methods 624/625 or 1624/1625 With Either a More Stringent or Less Stringent Monitoring Frequency ................
Summary of Design Specifications for Belt Filter Press Systems ....................
Itemized Capital Costs for Belt Filter Press Systems . . . . . . . . . . . . . . . . . . . . . . .
Itemized Annual Operating Cost for Belt Filter Press Systems ....................
Page
VIII-170
VIII-171
VIII-175
VIII-176
VIII-179
Vlll-181
VIII-183
VIII-184
VIII-188
VIII-189
VIII-194
VIII-200
VIII-201
VIII-204
Vlii-207
VIII-208
Vlll-211
xxxi

LIST OF TABLES (Continued)
Table
VIII-91
VIII-92
VIII-93
VIII-94
VIII-95
VIII-96
VIII-97
VIII-98
VIII-99
VIII-100
VIII-lOl
VIII-102
VIII-I03
VIII-I04
VIII-105
VIII-I06
Vlll-107
Vlll-108
Page
Summary of Fluidized Bed Incinerator System Design Specifications ................ Vlii-214
Itemized Capital Costs for Fluidized Bed Incinerator Systems ................. Vlii-215
Itemized Annual Operating Cost for Fluidized Bed Incineration Systems .............. VIII-218
Capital and O&M Costs for the Belt Filter Press and Fluidized Bed Incineration Systems ....... VIII-220
Annualized Cost for Sludge Handling Systems ...... VIII-221
Parameters Used to Design and Cost Liners and Monitoring . . . . . . . . . . . . . . . . . . . . . VIII-226
Liner and Monitoring Well Equipment and Installation Costs for Selected OCPSF Facilities VIII-228
Summary of Liner, Monitoring, and Administrative RCRA Baseline Costs ................. VIII-232
Summary of BPT, BAT, and PSES Compliance Costs For Final Regulatory Options (1982 Dollars) ..... VIII-233
Plants With No Cost .................. VIII-234
Major Products by Process of the Organic Chemicals Industry ................. VIII-239
Major Products by Process of the Plastics/ Synthetic Fibers Industry .............. VIII-247
Generic Chemical Processes .............. VIII-250
Overview of Wastewater Studies Included in Raw Wastewater Toxic Pollutant Loadings Calculations . VIII-251
Phase II Screening- Product/Process and Other Waste Streams Sampled at Each Plant ......... Vlii-255
BPT, BAT Option II, BAT Option III, and PSES Toxic Pollutant Concentrations Used in Loadings. VIII-263
BAT Wastewater Toxic Pollutant Loadings ........ VIII-271
PSES Wastewater Toxic Pollutant Loadings ....... VIII-273
x x x i i

LIST OF TABLES ( C o n t i n u e d )
Table
V I I I - I 0 9
VIII-IIO
VIII-Ill
Vlll-l12
IX-I
IX-2
X-I
X-2
X-3
X-4
X-5
Xll-i
P r i o r i t y P o l l u t a n t s C o n s i d e r e d f o r E s t i m a t i n g a P o r t i o n o f t he OCPSF I n d u s t r y A i r E m i s s i o n s from W a s t e w a t e r T r e a t m e n t Sys tems f o r 32 S e l e c t e d VOCs . . . . . . . . . . . . . . . . . . . .
V o l a t i l i z a t i o n from P r e - B i o l o g i c a l Uni t O p e r a t i o n s f o r S e l e c t e d VOCs . . . . . . . . . . . . . . . . . .
BAT Toxic Pollutants Air Emission Loadings (ibs/year) .....................
PSES Toxic Pollutant Air Emission Loadings (ibs/year) .....................
BPT Effluent Limitations and NSPS by Subcategory (mg/l) . . . . . . . . . . . . . . . . . . . . . . .
D e r i v a t i o n o f BPT L i m i t a t i o n s f o r a H y p o t h e t i c a l P l a n t . . . . . . . . . . . . . . . . . . . . . . . .
BAT Effluent Limitations and NSPS for the End-of- Pipe Biological Treatment Subcategory ........
BAT Effluent Limitations and NSPS for the Non- End-of-Pipe Biological Treatment Subcategory ....
Cyanide-Bearing Waste Streams (by product/ process) ......................
Noncomplexed Metal-Bearing Waste Streams for Chromium, Copper, Lead, Nickel, and Zinc (by product/process) ................
Complexed Metal Bearing Waste Streams for Chromium, Copper, Lead, Nickel, and Zinc (by product/process) ................
P r e t r e a t m e n t S t a n d a r d s f o r Existing and New Sou rce s (PSES and PSNS) . . . . . . . . . . . . . . .
Page
VIII-277
VIII-281
VIII-284
VIII-285
IX-8
IX-ll
X-6
X-8
X-13
X-15
X-26
XII-4
x x x i i i

SECTION I
INTRODUCTION
This document describes the technical development of the U.S.
Environmental Protection Agency's (EPA's) promulgated effluent limitations
guidelines and standards that limit the discharge of pollutants into navigable
waters and publicly owned treatment works (POTWs) by existing and new sources
in the organic chemicals, plastics, and synthetic fibers (OCPSF) point source
category. The regulation establishes effluent limitations guidelines
attainable by the application of the "best practicable control technology
currently available" (BPT) and the "best available technology economically
achievable" (BAT), pretreatment standards applicable to existing and new
d~scharges to POTWs (PSES and PSNS, respectively), and new source performance
standards (NSPS) attainable by the application of the "best available
demonstrated technology."
A. LEGAL AUTHORITY
This regulation was promulgated under the authority of Sections 301, 304,
306, 307, 308, and 501 of the Clean Water Act (the Federal Water Pollution
Control Act Amendments of 1972, 33 U.S.C. 1251 et seq., as amended) also
referred to as "the Act" or "CWA." It was also promulgated in response to the
Settlement Agreement in Natural Resources Defense Council, Inc. v. Train,
8 ERC 2120 (D.D.C. 1976), modified, 12 ERC 1833 (D.D.C. 1979), modified by
Orders dated October 26, 1982; August 2, 1983; January 6, 1984; July 5, 1984;
January 7, 1985; April 24, 1986; and January 8, 1987.
The Federal Uater Pollution Control Act Amendments of 1972 established a
comprehensive program to "restore and maintain the chemical, physical, and
biological integrity of the Nation's waters" (Section 101(a)). To implement
the Act, EPA was required to issue effluent limitations guidelines, pretreat-
ment standards, and NSPS for industrial dischargers.
I-i

In addition to these regulations for designated industrial categories,
EPA was required to promulgate effluent limitations guidelines and standards
applicable to all discharges of toxic pollutants. The Act included a time-
table for issuing these standards. However, EPA was unable to meet many of
the deadlines and, as a result, in 1976, it was sued by several environmental
groups. In settling this lawsuit, EPA and the plaintiffs executed a "Settle-
ment Agreement" that was approved by the Court. This agreement required EPA
to develop a program and adhere to a schedule for controlling 65 "priority"
toxic pollutants and classes of pollutants. In carrying out this program, EPA
was required to promulgate BAT effluent limitations guidelines, pretreatment
standards, and NSPS for a variety of major industries, including the 0CPSF
industry.
Many of the basic elements of the Settlement Agreement were incorporated
into the Clean Water Act of: 1977. Like the Agreement, the Act stressed con-
trol of toxic pollutants, including the 65 priority toxic pollutants and
classes of pollutants.
Under the Act, the EPA is required to establish several different kinds
of effluent limitations guidelines and standards. These are summarized
briefly below.
i. Best Practicable Control Technology Currently Available (BPT)
BPT effluent limitations guidelines are generally based on the average of
the best existing performance by plants of various sizes, ages, and unit pro-
cesses within the category or subcategory for control of familiar (e.g., con-
ventional) pollutants, such as BOD s, TSS, and pH.
In establishing BPT effluent limitations guidelines, EPA considers the
total cost in relation to the effluent reduction benefits, age of equipment
and facilities involved, processes employed, process changes required,
engineering aspects of the control technologies, and nonwater quality
environmental impacts (including energy requirements). The Agency balances
the category-wide or subcategory-wide cost of applying the technology against
the effluent reduction benefits.
I-2

2. Best Available Technology Economically Achievable (BAT)
BAT effluent limitations guidelines, in general, represent the best
existing performance in the category or subcategory. The Act establishes BAT
as the principal national means of controlling the direct discharge of toxic
and nonconventional pollutants to navigable waters.
In establishing BAT, the Agency considers the age of equipment and facil-
ities involved, processes employed, engineering aspects of the control
technologies, process changes, cost of achieving such effluent reduction, and
nonwater quality environmental impacts.
3. Best Conventional Pollutant Control Technology (BCT)
The 1977 Amendments to the Clean Water Act added Section 301(b)(2)(E),
establishing "best conventional pollutant control technology" (BCT) for the
discharge of conventional pollutants from existing industrial point sources.
Section 304(a)(4) designated the following as conventional pollutants: BODs,
TSS, fecal coliform, pH, and any additional pollutants defined by the Admin-
istrator as conventional. The Administrator designated oil and grease a con-
ventional pollutant on July 30, 1979 (44 FR 44501).
BCT is not an additional limitation, but replaces BAT for the control of
conventional pollutants. In addition to other factors specified in Section
304(b)(4)(B), the Act requires that the BCT effluent limitations guidelines be
assessed in light of a two part "cost-reasonableness" test [American Paper
Institute v. EPA, 660 F.2d 954 (4th Cir. 1981)]. The first test compares the
cost for private industry to reduce its discharge of conventional pollutants
with the costs to POTWs for similar levels of reduction in their discharge of
these pollutants. The second test examines the cost-effectiveness of
additional industrial treatment beyond BPT. EPA must find that limitations
are "reasonable" under both tests before establishing them as BCT. In no case
may BCT be less stringent than BPT.
EPA has promulgated a methodology for establishing BCT effluent limita-
tions guidelines (51FR 24974, July 8, 1986).
I-3

4. New Source Performance Standards (NSPS)
NSPS are based on the performance of the best available demonstrated
technology. New plants have the opportunity to install the best and most
efficient production processes and wastewater treatment technologies. As a
result, NSPS should represent the most stringent numerical values attainable
through the application of best available demonstrated control technology for
all pollutants (i.e., toxic:, conventional, and nonconventional).
5. Pretreatment Standards for Existing Sources (PSES)
PSES are designed to prevent the discharge of pollutants that pass
through, interfere with, oz" are otherwise incompatible with the operation of
POTWs. The Clean Water Act: requires pretreatment standards for pollutants
that pass through POTWs or interfere with either the POTW's treatment process
or chosen sludge disposal method. The legislative history of the 1977 Act
indicates that pretreatment: standards are to be technology-based and analogous
to the BAT effluent limitations guidelines for removal of toxic pollutants.
For the purpose of determining whether to promulgate national category-wide
PSES and PSNS, EPA generally determines that there is pass through of pollu-
tants, and thus a need for categorical standards if the nationwide average
percentage of pollutants removed by well-operated POTUs achieving secondary
treatment is less than the percent removed by the BAT model treatment system.
The General Pretreatment Regulations, which serve as the framework for
categorical pretreatment standards, are found at 40 CFR Part 403. (Those
regulations contain a definition of pass through that addresses localized
rather that national instances of pass through and does not use the percent
removal comparison test described above (52 FR 1586, January 14, 1987).)
6. Pretreatment Standards for New Sources (PSNS)
Like PSES, PSNS are designed to prevent the discharge of pollutants that
pass through, interfere with, or are otherwise incompatible with the operation
of a POTW. PSNS are to be issued at the same time as NSPS. New indirect
dischargers, like new direct dischargers, have the opportunity to incorporate
in their plant the best available demonstrated technologies. The Agency con-
siders the same factors in promulgating PSNS as it considers in promulgating
NSPS.
1-4

B. HISTORY OF OCPSF RULEMAKING EFFORTS
EPA originally promulgated effluent limitations guidelines and standards
for the organic chemicals manufacturing industry in two phases. Phase I,
covering 40 product/processes (a product that is manufactured by the use of a
particular process -- some products may be produced by any of several proces-
ses), was promulgated on April 25, 1974 (39 FR 14676). Phase II, covering 27
additional product/processes, was promulgated on January 5, 1976 (41 FR 902).
The Agency also promulgated effluent limitations guidelines and standards for
the plastics and synthetic fibers industry in two phases. Phase I, covering
13 product/processes, was promulgated on April 5, 1974 (39 FR 12502). Phase
II, covering eight additional product/processes, was promulgated on January
23, 1975 (40 FR 3716).
These regulations were challenged, and on February i0, 1976, the Court in
Union Carbide v. Train, 541F.2d 1171 (4th Cir. 1976), remanded the Phase I
organic chemicals regulation. EPA also withdrew the Phase II organic chem-
icals regulation on April i, 1976 (41FR 13936). However, pursuant to an
agreement with the industry petitioners, the regulations for butadiene manu-
facture were left in place. The Court also remanded the Phase I plastics and
synthetic fibers regulations in FMC Corp. v. Train, 539 F.2d 973 (4th Cir.
1976) and in response EPA withdrew both the Phase I and II plastics and
synthetic fibers regulations on August 4, 1976 (41FR 32587) except for the pH
limitations, which had not been addressed in the lawsuit. Consequently, only
the regulations covering butadiene manufacture for the organic chemicals
industry and the pH regulations for the plastics and synthetic fibers industry
have been in effect to date. These regulations were superseded by the regula-
tions described in this report.
In the absence of promulgated, effective effluent limitations guidelines
and standards, OCPSF direct dischargers have been issued National Pollutant
Discharge Elimination System (NPDES) permits on a case-by-case basis using
best professional judgment (BPJ), as provided in Section 402(a)(i) of the CWA.
Subsequent to the withdrawal/suspension of the national regulations cited
above, studies and data-gathering were initiated in order to provide a basis
I-5

for issuing effluent limitations guidelines and standards for this industry.
These efforts provided a basis for the March 21, 1983 proposal (48 FR 11828);
the July 17, 1985 (50 FR 29(371), October II, 1985 (50 FR 41528), and December
8, 1986 (51FR 44082) post-proposal notices of availability of information;
and the final regulation.
This report presents a summary of the data collected by the Agency since
1976, the data submitted by the OCPSF industry in response to the Federal
Register notices cited above, and the analyses used to support the promulgated
regulations. Section II presents a summary of the findings and conclusions
developed in this document as well as the promulgated regulations. Sections
III through VIII present the technical data and the supporting analyses used
as the basis for the promulgated regulations, and Sections IX through XIII
include the rationale and derivation of the national effluent limitations and
standards. Detailed data displays and analyses are included in the
appendices.
I-6

SECTION II
SUMMARY AND CONCLUSIONS
A. OVERVIEW OF THE INDUSTRY
The organic chemicals, plastics, and synthetic fibers (OCPSF) industry is
large and diverse, and many plants in the industry are highly complex. The
industry includes approximately 750 facilities whose principal or primary
production activities are covered under the OCPSF regulations. There are
approximately 250 other plants that are secondary producers of OCPSF products
(i.e., OCPSF production is ancillary to their primary production activities).
Thus, the total number of plants to be regulated totally or in part by the
OCPSF industry regulation is approximately 1,000. Secondary OCPSF plants may
be part of the other chemical producing industries such as the petroleum
refining, inorganic chemicals, pharmaceuticals, and pesticides industries as
well as the chemical formulation industries such as the adhesives and
sealants, paint and ink, and the plastics molding and forming industries.
Although over 25,000 different organic chemicals, plastics, and synthetic
fibers are manufactured, less than half of these products are produced in
excess of 1,000 pounds per year.
Some plants produce chemicals in large volumes while others produce only
small volumes of "specialty" chemicals. Large volume production tends to
utilize continuous processes. Continuous processes are generally more effi-
cient than batch processes in minimizing water use and optimizing the consump-
tion of raw materials.
Different products are made by varying the raw materials, the chemical
reaction conditions, and the chemical engineering unit processes. The
products being manufactured at a single large chemical plant can vary on a
weekly or even daily basis. Thus, a single plant may simultaneously produce
many different products using a variety of continuous and batch operations,
and the product mix may change on a weekly or daily basis.
II-i

A total of 940 facilities (based on 1982 production) are included in the
technical and economic studies used as a basis for this regulation. Approxi-
mately 76 percent of these facilities are primary OCPSF manufacturers (over
50 percent of their total plant production involves OCPSF products), and
approximately 24 percent of the facilities are secondary OCPSF manufacturers
that produce mainly other types of products. An estimated 32 percent of the
plants are direct dischargers; about 42 percent discharge indirectly to
publicly owned treatment works (POTWS); and the remaining facilities
(26 percent) are either zero or alternative dischargers, or their discharge
status is unknown. The estimated average daily process wastewater discharge
per plant is 1.31 millions of gallons per day (MGD) for direct dischargers and
0.25 MGD for indirect dischargers. The non-discharging plants use dry
processes, reuse their wastewater, or dispose of their wastewater by deep well
injection, incineration, contract hauling, or by means of evaporation and
percolation ponds.
As a result of the wide variety and complexity of raw materials and
processes used and of products manufaclured in the OCPSF industry, an excep-
tionally wide variety of pollutants are found in the wastewaters of this
industry. This includes conventional pollutants (pH, BOD s, TSS, and oil and
grease); an unusually wide ~ariety of toxic priority pollutants (both metals
and organic compounds); and a large number of nonconventional pollutants.
Many of the toxic and nonconventional pollutants are organic compounds
produced by the industry for sale. Others are created by the industry as
by-products of their production operations. This study focused on the
conventional pollutants and on the 126 priority pollutants.
To control the wide variety of pollutants discharged by the OCPSF
industry, OCPSF plants use a broad range of in-plant controls, process
modifications, and end-of-pipe treatment techniques. Most plants have
implemented programs that combine elements of both in-plant control and
end-of-pipe wastewater treatment. The configuration of controls and
technologies differs from plant to plant, corresponding to the differing mixes
of products manufactured by different facilities. In general, direct
dischargers treat their wastes more extensively than indirect dischargers.
II-2

The predominant end -o f -p ipe con t ro l technology for d i r e c t d i s c h a r g e r s in
the OCPSF i n d u s t r y i s b i o l o g i c a l t r ea tment . The c h i e f forms of biolog~ical
t rea tment a re a c t i v a t e d s ludge and ae ra t ed lagoons. Other systems, such as
extended a e r a t i o n and t r i c k l i n g f i l t e r s , a re a l so used, but l e s s e x t e n s i v e l y .
All of these systems reduce biochemical oxygen demand (BOD S) and t o t a l
suspended s o l i d s (TSS) load ings , and in many i n s t a n c e s , i n c i d e n t a l l y remove
tox ic and nonconvent iona l p o l l u t a n t s . B i o l o g i c a l systems biodegrade some of
the o rgan ic p o l l u t a n t s , remove b i o - r e f r a c t o r y o rgan ics and metals by s o r p t i o n
into the sludge, and strip some volatile organic compounds (VOCs) into the
air. Well-designed biological treatment systems generally incorporate
secondary clarification unit operations to ensure adequate control of solids.
Other end-of-pipe treatment technologies used in the OCPSF industry
include neutralization, equalization, polishing ponds, filtration, and carbon
adsorption. While most direct dischargers use these physical/chemical
technologies in conjunction with end-of-pipe biological treatment, at least
71 direct dischargers use only physical/chemical treatment.
In-plant control measures employed at OCPSF plants include water
reduction and reuse techniques, chemical substitution, and process changes.
Techniques to reduce water use include the elimination of water use where
practicable, and the reuse and recycling of certain streams, such as reactor
and floor washwater, surface runoff, scrubber effluent, and vacuum seal
discharges. Chemical substitution is utilized to replace process chemicals
possessing highly toxic or refractory properties with others that are less
toxic or more amenable to treatment. Process changes include various measures
that reduce water use, waste discharges, and/or waste loadings while improving
process efficiency. Replacement of barometric condensers with surface
condensers, replacement of steam jet ejectors with vacuum pumps, recovery of
product or by-product by steam stripping, distillation, solvent extraction or
recycle, oil-water separation, and carbon adsorption, and the addition of
spill control systems are examples of process changes that have been
successfully employed in the OCPSF industry to reduce pollutant loadings while
improving process efflclencies.
11-3

Another type of control widely used in the OCPSF industry is physical/
chemical in-plant control. This treatment technology is generally used
selectively on certain process wastewaters to recover products or process
solvents, to reduce loadings that may impair the operation of the biological
system, or to remove certain pollutants that are not treated sufficiently by
the biological system. In-plant technologies widely used in the OCPSF
industry include sedimentation/clarification, coagulation, flocculation,
equalization, neutralization, oil-water separation, steam stripping, distil-
lation, and dissolved air flotation.
Some OCPSF plants also use physical/chemical treatment after biological
treatment. Such treatment is usually intended to reduce solids loadings that
are discharged from biological treatment systems. The most common post-
biological treatment unit operations are polishing ponds and multimedia
filtration. These unit operations are sometimes used in lieu of secondary
clarification or to improve upon substandard biological treatment systems. A
few plants also use activated carbon after biological treatment as a final
"polishing" step.
At approximately g percent of the direct discharging plants surveyed,
either no treatment is provided or no treatment beyond equalization and/or
neutralization is provided. At another Ig percent, only physical/chemical
treatment is provided. The remaining 72 percent utilize biological treatment.
Approximately 41 percent of biologically treated effluents are further treated
by polishing ponds, filtration, or other forms of physical/chemical control.
At approximately 39 percent of the indirect discharging plants surveyed9
either no treatment is provided or no treatment beyond equalization and/or
neutralization is provided. At another 47 percent, some physical/chemical
treatment is provided. The remaining 14 percent utilize biological treatment.
Approximately 22 percent of biologically treated effluents are further treated
by polishing ponds, filtration, or other forms of physical/chemical control.
Economic data provided in response to questionnaires completed pursuant
to Section 308 of the CWA indicate that 0CPSF production in lgB2 totaled 185
billion pounds and that the quantity shipped was 151 billion pounds. The
II-4

corresponding value of shipments equaled $59 billion, while employment in the
industry totaled 187,000 in 1982. In that same, year a total of 455 firms
operated the 940 facilities referenced above.
B. CONCLUSIONS
i. Applicability of the Promulgated Regulation
The OCPSF regulation applies to process wastewater discharges from
existing and new organic chemicals, plastics, and synthetic fibers (OCPSF)
manufacturing facilities. OCPSF process wastewater discharges are defined as
discharges from all establishments or portions of establishments that manufac-
ture products or product groups listed in the applicability sections of the
promulgated regulation (see Appendix III-A of this report), and are included
within the following U.S. Department of Commerce, Bureau of the Census,
Standard Industrial Classification (SIC) major groups:
• SIC 2865 - Cyclic Crudes and Intermediates, Dyes, and Organic Pigments
• SIC 2869 - Industrial Organic Chemicals, not Elsewhere Classified
• SIC 2821 - Plastic Materials, Synthetic Resins, and Nonvulcanizable Elastomers
• SIC 2823 - Cellulosic Man-Made Fibers
• SIC 2824 - Synthetic Organic Fibers, Except Cellulosic.
The regulations apply to plastics molding and forming processes only when
plastic resin manufacturers mold or form (e.g., extrude and pelletize) crude
intermediate plastic material for shipment off-site. This regulation also
applies to the extrusion of fibers. Plastic molding and forming processes
other than those described above are regulated by the plastics molding and
fomming effluent guidelines and standards found in 40 CFR Part 463.
The regulations also apply to wastewater discharges from 0CPSF research
and development, pilot plant, technical service, and laboratory bench-scale
operations if such operations are conducted in conjunction with and related to
existing OCPSF manufacturing activities at the plant site.
II-5

The regulations do not apply to discharges resulting from the manufacture
of OCPSF products if the products are included in the following SIC subgroups,
and have in the past been reported by the establishment under these subgroups
and not under the OCPSF SIC groups listed above:
• SIC 2843085 - Bulk Surface Active Agents
• SIC 28914 - Synthetic: Resin and Rubber Adhesives
• Chemicals and Chemical Preparations, not Elsewhere Classified
- SIC 2899568 - sizes, all types
- SIC 2899597 - other industrial chemical specialtieS, including fluxes, plastic wood preparations, and embalming fluids
• SIC 2911058 - Aromatic Hydrocarbons Manufactured from Purchased Refinery Products
• SIC 2911632 - Aliphatic Hydrocarbons Manufactured from Purchased Refinery Products.
The regulations are not applicable to any discharges for which a
different set of previously promulgated effluent limitations guidelines and
standards in 40 CFR Parts 405 through 699 apply, unless the facility reports
OCPSF production under SIC codes 2865, 2869, or 2821, and the facility's OCPSF
wastewater is treated in a separate treatment system or discharged separately
to a POTW. They also do not apply to any process wastewater discharges from
the manufacture of organic chemical compounds solely by extraction from plant
and animal raw materials or by fermentation processes.
2. BPT
The technology basis for the promulgated effluent limitations for each
BPT subcategory consists of biological treatment, which usually involves
either activated sludge or aerated lagoons, followed by clarification (and
preceded by appropriate process controls and in-plant treatment to ensure that
the biological system may be operated optimally). Many of the direct dis-
charge facilities have insta]led this level of treatment.
11-6

The Agency designated seven subcategory classifications for the OCPSF
category to be used for establishing BPT limitations. These subcategory
classifications are I) rayon fibers (viscose process only); 2) other fibers
(SIC 2823, except rayon, and 2824); 3) thermoplastics (SIC 28213); 4 thermo-
sets (SIC 28214); 5) commodity organic chemicals (SIC 2865 and 2869); 6) bulk
organic chemicals (SIC 2865 and 2869); and 7) specialty organic chemicals
(SIC 2865 and 2869). The specific products and product groups within each
subcategory are listed in Appendix III-A.
While some plants may have production that falls entirely within one of
the seven subcategory classifications, most plants have production that is
divided among two or more subcategories. In applying the subcategory
limitations set forth in the regulation, the permit writer will use what is
essentially a building-block approach that takes into consideration applicable
subcategory characteristics based upon the proportion of production quantities
within each subcategory at the plant. Production characteristics are
reflected explicitly in the plant's limitations through the use of this
approach.
The long-term median effluent BOD s concentrations were calculated for
each subcategory through the use of a mathematical equation that estimates
effluent BOD 5 as a function of the proportion of the production of each
subcategory at each facility. The coefficients of this equation were
estimated from reported plant data using standard statistical regression
methods. Plants were selected for developing BPT BOD S limitations only if
they achieved at least 95 percent removal for BOD S or a long-term average
effluent BOD s concentration at or below 40 mg/1. The long-term median
effluent TSS concentrations were calculated for each subcategory through the
use of a mathematical equation that estimates effluent TSS as a function of
effluent BOD s. The coefficients of this equation were also estimated from
reported plant data using standard statistical regression methods. Plants
were selected for developing BPT TSS limitations if they passed the BOD S edit
and also achieved a long-term average effluent TSS concentration at or below
i00 mg/1. This statistical analysis is described in detail in Sections IV and
VII.
11-7

"Maximum for monthly average" and "maximum for any one day" effluent
limitations were determined by multiplying long-term median effluent concen-
trations by appropriate variability factors that were calculated through
statistical analysis of long-term B0D 5 and TSS daily data. This statistical
analysis is described in detail in Section VII.
The BPT subcategory BOD s and TSS effluent limitations are presented in
Table II-l; pH, also a regulated parameter, must remain within the range of
6.0 to 9.0 at all times. EFA has determined that the BPT effluent limitations
shall apply to alldirect discharge point sources.
3. BCT
The Agency did not promulgate BCT effluent limitations as part of this
regulation. BCT is reserved until a future BCT analysis is completed.
4. BAT
The Agency promulgated BAT limitations for two subcategories. These
subcategories are largely determined by conventional pollutant raw waste
characteristics. The end-of-pipe biological treatment subcategory (BAT Sub-
category One) includes plants that have or will install biological treatment
to comply with BPT limits. The non-end-of-pipe biological treatment sub-
category (BAT Subcategory Two) includes plants that either generate such low
levels of BOD 5 that they do not need to utilize biological treatment, or that
choose to use physical/chemical treatment to comply with the BPT limitations.
The Agency has concluded that, within each subcategory, all plants can treat
priority pollutants to the levels established for that subcategory.
Different limits are being established for these two subcategories.
Biological treatment is an integral part of the model BAT treatment technology
for the end-of-pipe biological treatment subcategory; it achieves incremental
removals of some priority pollutants beyond the removals achieved by in-plant
treatment without end-of-pipe biological treatment. In addition, the Agency
is establishing two different limitations for zinc. One is based on data
collected from rayon manufacturers and acrylic fibers manufacturers using the
zinc chloride/solvent process. This limitation applies only to those plants
II-8

TABLE II-l. BPT EFFLUENT LIMITATIONS AND NSPS BY SUBCATEGORY (mg/l)
Effluent L i m i t a t i o n s 1 Maximum for Maximum for
Monthly Average Any One Day
Subcategory 2 BOD 5 TSS BOD s TSS
Rayon Fibers 24 40 64 130
Other Fibers 18 36 48 115
Thermoplastic Resins 24 40 64 130
Thermosetting Resins 61 67 163 216
Commodity Organic Chemicals 30 46 80 149
Bulk Organic Chemicals 34 49 92 159
Specialty Organic Chemicals 45 57 120 183
I pH, also a regulated parameter, shall remain within the range of 6.0 to 9.0 at all times.
2product and product group listings f o r each subcategory are contained in Appendix III-A.
II-9

that use the viscose process to manufacture rayon and the zinc chloride/
solvent process to manufacture acrylic fibers. The other zinc limitation is
based on the performance of chemical precipitation technology used in the
metal finishing point source category, and applies to all plants other than
those described above.
The concentration-based BAT effluent limitations hinge on the performance
of the end-of-pipe treatment component (biological treatment for the end-of-
pipe biological treatment subcategory and physical/chemical treatment for the
non-end-of-pipe biological treatment subcategory) plus in-plant control
technologies that remove priority pollutants prior to discharge to the
end-of-pipe treatment system°
The i n - p l a n t t echno log ies inc lude steam s t r i p p i n g to remove s e l e c t e d
v o l a t i l e and s e m i v o l a t i l e p r i o r i t y p o l l u t a n t s , such as to luene , benzene,
carbon t e t r a c h l o r i d e , and the d ich lorobenzenes ; a c t i v a t e d carbon for s e l e c t e d
b a s e / n e u t r a l p r i o r i t y p o l l u t a n t s , such as 4 -n i t ropheno l and 4 , 6 - d i n i t r o -
o - c r e s o l ; hydroxide p r e c i p i t a t i o n for metals ; a l k a l i n e c h l o r i n a t i o n for
cyanide; and i n - p l a n t b i o l o g i c a l t reatment for s e l e c t e d acid and b a s e / n e u t r a l
p r i o r i t y p o l l u t a n t s , such as phenol, the ph tha l a t e e s t e r s , and the polynuclear
aromat ics .
The limits are based on priority pollutant data from both OCPSF and other
industry plants with well-designed and well-operated BAT model treatment
technologies in place. The organic priority pollutant limits are derived from
selected data within the Agency's verification study, cooperative EPA/CMA
study, the 12-Plant Study, and the industry-supplied data base. Except as
noted above, the cyanide and metal priority pollutant limits are derived from
the metal finishing industry data base. The organic priority pollutant limits
apply at the end-of-pipe process wastewater discharge point. There are no
in-plant limitations established for volatile organic priority pollutants.
However, the cyanide and metal limitations apply only to the process waste-
water flow from cyanide-bearing and metal-bearing waste streams. Compliance
for cyanide and metals could be monitored in the plant or, after accounting
for dilution by noncyanide- and nonmetal-bearing process wastewater and
nonprocess wastewater, at the outfall.
II-i0

Derivation of the limitations is detailed in Section VII. "Maximum for
Monthly Average" and "Maximum for Any One Day" limitations have been
calculated for each regulated pollutant. Effluent limitations have been
established for 63 pollutants for the end-of-pipe biological treatment
subcategory and 59 pollutants for the non-end-of-pipe biological treatment
subcategory; these limitations are listed in.Tables II-2 and 11-3,
respectively.
In the final rule, EPA has decided that each discharger in a subcategory
will be subject to the effluent limitations for allpollutants regulated for
that subcategory. Once a pollutant is regulated in the OCPSF regulation, it
must also be limited in the NPDES permit issued to direct dischargers (see
Sections 301 and 304 of the Act; see also 40 CFR Part 122.44(a)). ~EPA
recognizes that guidance on appropriate monitoring requirements for OCPSF
plants would be useful, particularly to assure that monitoring will not be
needlessly required for pollutants that are not likely to be discharged at a
plant. EPA intends to publlsh guldance on 0CPSF monitoring in the near
future. This guidance will address the issues of compliance monitoring in
general, of initially determining which pollutants should be subject only tO
infrequent monitoring based on a conclusion that they are unlikely to be
discharged, and of determining the appropriate flow upon which to derive
mass-based permit requirements.
EPA has determlned that this technology basis is the best available
technology economically achievable for all plants except for a subset of small
facilities. For plants whose annual OCPSF production is less than or equal to
5 million pounds, EPA has concluded that the BAT effluent limitations are not
economically achievable. For these plants, EPA has set BAT equal to BPT.
5. NSPS
EPA promulgated new source performance standards (NSPS) on the basis of
the best available demonstrated technology. NSPS are established for conven-
tional pollutants (BODs, TSS, and pH) on the basis of BPT model treatment
technology. Priority pollutant limits are based on BAT model treatment
technology.
II-ll

TABLE II-2. BAT EFFLUENT LIMITATIONS AND NSPS FOR THE
END-OF-PIPE BIOLOGICAL TREATMENT SUBCATEGORY
Pollutant Number
7 8 9
I0 ii 12 13 14 16 23 24 25 26 27 29 30 31 32 33 34 35 36 38 39 42 44 45 52 55 56 57 58 59 60 65 66 68 70
Pollutant Name
Acenaphthene Acrylonitrile Benzene Carbon Tetrachloride Chlorobenzene 1,2,4-Trichlorobenzene Hexachlorobenzene 1,2-Dichloroethane l,l,l-Trichloroethane Hexachloroethane l-l-Dichloroethane l,l,2-Trichloroethane Chloroethane Chloroform 2-Chlorophenol 1,2-Dichlorobenzene 1,3~Dichlorobenzene 1,4-Dichlorobenzene l,l-Dichloro~thylene 1,2-Trans-dichloroethylene 2,4-Dichlorophenol l~2-Dichloropropane 1,3-Dichloropropene 2,4-Dimethylphenol 2,4-Dinitrotoluene 2,6-Dinitrotoluene Ethylbenzene Fluoranthene Bis(2-Chloroisopropyl)ether Methylene Chloride Methyl Chloride Hexachlorobutadiene Naphthalene Nitrobenzene 2-Nitrophenol 4-Nitrophenol 2,4-Dinitrophenol 4,6-Dinitro-o-cresol Phenol Bis(2-ethylhexyl)phthalate Di-n-butyl phthalate Diethyl phthalate
BAT Effluent Limitations and NSPS I Maximum for Maximum for Any One Day Monthly Average
59 22 242 96 136 37 38 18 28 15
140 68 28 15
211 68 54 21 54 21 59 22 54 21
268 104 46 21 98 31
163 77 44 31 28 15 25 16 54 21 112 39 230 153 44 29 36 18
285 113 641 255 108 32 68 25
757 301 89 40 190 86 49 20 59 22 68 27 69 41
124 72 123 71 277 78 26 15
279 103 57 27
203 81
11-12

TABLE.II-2. BAT EFFLUENT LIMITATIONS AND NSPS FOR THE
END-OF-PIPE BIOLOGICALTREATMENT SUBCATEGORY (Continued)
BAT Effluent Limitations and NSPS I Pollutant Maximum for Maximum for Number Pollutant Name Any One Day Monthly Average
71 Dimethyl phthalate 47 19 72 Benzo(a)anthracene 59 22 73 Benzo(a)pyrene 61 23 74 3,4-Benzofluoranthene 61 23 75 Benzo(k)fluoranthene 59 22 76 Chrysene 59 22 77 Acenaphthylene 59 .~ 22 78 Anthracene 59 ,~ 22 80 Fluorene 59 22 81 Phenanthrene 59 22 84 Pyrene 67 25 85 Tetrachloroethylene 56 22 86 Toluene 80 26 87 Trichloroethylene 54 21 88 Vinyl Chloride 268 104 119 Total Chromium 2 2,770 I,II0 120 Total Copper 3,380 1,450 121 Total Cyanide 3 1,200 420 122 Total Lead 2 690 320 124 Total Nickel 2 3,980 1,690 128 Total Zinc ~'4 2,610 1,050
IAII units are micrograms per liter.
2Metals limitations apply only to noncomplexed metal-bearing waste streams, including those listed in Table X-4. Discharges of chromium, copper, lead, nickel, and zinc from "complexed metal-bearing process wastewater," listed in Table X-5, are not subject to these limitations.
3Cyanide limitations apply only to cyanide-bearing waste streams, including those listed in Table X-3.
4Total zinc limitations and standards for rayon fiber manufacture by the viscose process and acrylic fiber manufacture by the zinc chloride/solvent process are 6,796 ~g/1 and 3,325 ~g/1 for Maximum for Any One Day and Maximum for Monthly Average, respectively.
II-!3

TABLE II-3. BAT EFFLUENT LIMITATIONS AND NSPS FOR THE
NON-END-OF-PIPE BIOLOGICAL TREATMENT SUBCATEGORY
Pollutant Number
1 3 4 6 7 8 9
I0 ii 12 13 14 16 23 25 26 27 29 30 32 33 34 38 39 42 44 45 52 55 56 57 58 59 60 65 66 68 70
Pollutant Name
Acenaphthene Acrylonitrile Benzene Carbon Tetrachloride Chlorobenzene 1,2,4-Trichlorobenzene Hexachlorobenzene 1,2-Dichloroethane l,l,l-Trichloroethane Hexachloroethane l-l-Dichloroethane l,l,2-Trichloroethane Chloroethane Chloroform 1,2-Dichlorobenzene i 3-Dichlorobenzene I 4-Dichlorobenzene I l-Dichloroethylene
BAT Effluent Limitations and NSPS I Maximum for Maximum for Any One Day Monthly Average
47 19 232 94 134 57 380 142 380 142 794 196 794 196 574 180 59 22
794 196 59 22
127 32 295 Ii0 325 Iii 794 196 380 142 380 142 60 22
1 2-Trans-dichloroethylene 66 25 1 2-Dichloropropane 794 196 1,3-Dichloropropene 794 196 2 4-Dimethylphenol 47 19 Ethylbenzene 380 142 Fluoranthene 54 22 Bis(2-Chloroisopropyl)ether 794 196 Methylene Chloride 170 36 Methyl Chloride 295 llO Hexachlorobutadiene 380 142 Naphthalene 47 19 Nitrobenzene 6,402 2,237 2-Nitrophenol 231 65 4-Nitrophenol 576 162 2,4-Dinitrophenol 4,291 1,207 4,6-Dinitro-o-cresol 277 78 Phenol 47 19 Bis(2-ethylhexyl)phthalate 258 95 Di-n-butyl phthalate 43 20 Diethyl phthalate i13 46
II-14

TABLE 11-3. BAT EFFLUENT LIMITATIONS AND NSPS FOR THE
NON-END-OF-PIPE BIOLOGICAL TREATMENT SUBCATEGORY (Continued)
Pollutant Number Pollutant Name
• 71 Dimethyl phthalate 72 Benzo(a)anthracene 73 Benzo(a)pyrene 74 3,4-Benzofluoranthene 75 Benzo(k)fluoranthene 76 Chrysene 77 Acenaphthylene 78 Anthracene 80 Fluorene 81 Phenanthrene 84 Pyrene 85 Tetrachloroethylene 86 Toluene 87 Trichloroethylene 88 Vinyl Chloride
119 Total Chromium 2 120 Total Copper 121 Total Cyanide 3 122 Total Lead 2 124 Total Nickel 2 128 Total Zinc 2'4
IAII units are micrograms per liter.
BAT Effluent Limitations and NSPS I Maximum for Maximum for Any One Day Monthly Average
47 19 47 19 48 20 48 20 47 19 47 19 47 19 47 19 47 19 47 19 48 20
164 52 74 28 69 26
172 97 2,770 I,II0 3,380 1,450 1,200 420
690 320 3,980 1,690 2,610 1,050
2Metals limitations apply only to noncomplexed metal-bearing waste streams, including those listed in Table X-4. Discharges of chromium, copper, lead, nickel, and zinc from "complexed metal-bearing process wastewater," listed in Table X-5, are not subject to these limitations.
3Cyanide limitations apply only to cyanide-bearing waste streams, including those listed in Table X-3.
4Total zinc limitations and standards for rayon fiber manufacture by the viscose process and acrylic fiber manufacture by the zinc chloride/solvent process are 6,796 ~g/1 and 3,325 ~g/1 for Maximum for Any One Day and Maximum for Monthly Average, respectively.
II-15

The Agency issued conventional pollutant new source standards for the
same seven subcategories for which BPT limits were established. These
standards are equivalent to the limits established for BPT shown in
Table II-l. Priority pollutant new source standards are applied to new sources
according to the same subcategorization scheme applicable under BAT. The set
of 63 standards listed in Table II-2 for the end-of-pipe biological treatment
subcategory will apply to new sources that use biological treatment in order
to comply with BOD 5 and TSS limitations. The standards in the subcategory for
sources that do not use end-of-pipe biological treatment apply to new sources
that will either generate such low levels of BOD 5 that they do not need to use
end-of-pipe biological treatment, or that choose to use physical/chemical
treatment to comply with the BOD 5 standard. These facilities will have to
meet the 59 priority pollutant standards listed in Table II-3, which are based
on the application of in-plant control technologies with or without end-of-
pipe physical/chemical treatment.
EPA has determined that NSPS will not cause a barrier to entry for new
source OCPSF plants.
6. PSES
Pretreatment standards for existing sources applicable to indirect
dischargers are generally analogous to BAT limitations applicable to direct
dischargers. The Agency promulgated PSES for 47 priority pollutants which
were determined to pass through POTWs. The standards apply to all existing
indirect discharging OCPSF plants. EPA determines which pollutants to
regulate in PSES on the basis of whether or not they pass through, cause an
upset, or otherwise interfere with operation of a POTW (including interference
with sludge practices). A detailed discussion of the pass-through analysis is
presented in Section VI.
Indirect dischargers generate wastewater with the same pollutant
characteristics as the direct discharge plants; therefore, the same tech-
nologies that were discussed for BAT are appropriate for application at PSES.
The Agency established PSES for all indirect dischargers on the same
technology basis as the BAT non-end-of-pipe biological treatment subcategory.
11-16

Therefore, the pretreatment standards for existing sources,-shovn in Table
II-4, are equivalent to the BAT limitations for the non-end-of-pipe biological
treatment subcategory for the pollutants deemed to pass through.
EPA i s no t i n c l u d i n g e n d - o f - p i p e b i o l o g i c a l t r e a t m e n t i n t he f i n a l PSES
model t e c h n o l o g y in p a r t , b e c a u s e , as a m a t t e r o f t r e a t m e n t t h e o r y , b i o l o g i c a l
p r e t r e a t m e n t may be l a r g e l y r e d u n d a n t to t he b i o l o g i c a l t r e a t m e n t p r o v i d e d by
t h e POTW.
A l t h o u g h EPA has r e j e c t e d the o p t i o n o f a d d i n g e n d - o f - p i p e b i o l o g i c a l
t r e a t m e n t , EPA somet imes u s e s b i o l o g i c a l t r e a t m e n t as p a r t o f i t s model
t e c h n o l o g y f o r t h e i n - p l a n t t r e a t m e n t o f c e r t a i n s e m i v o l a t i l e p o l l u t a n t s such
as p h e n o l , t he p h t h a l a t e e s t e r s , and the p o l y n u c l e a r a r o m a t i c s . S p e c i f i c a l l y ,
f o r such p o l l u t a n t s , EPA has in some c a s e s used i n - p l a n t b i o l o g i c a l t r e a t m e n t
s y s t e m s as an a l t e r n a t i v e to i n - p l a n t a c t i v a t e d ca rbon a d s o r p t i o n f o r t h e s e
o r g a n i c p o l l u t a n t s . Thus , EPA a c t u a l l y has used b i o l o g i c a l t r e a t m e n t as p a r t
o f PSES model t r e a t m e n t t e c h n o l o g y where a p p r o p r i a t e .
7. PSNS
Like PSES and BAT, PSNS is generally analogous to NSPS. However, as for
PSES, EPA is not establishing PSNS limits for conventional pollutants or
including end-of-pipe biological treatment in its PSNS model treatment tech-
nology, for the same reasons discussed above with respect to PSES. The Agency
promulgated PSNS on the same technology basis as PSES, and issued standards
for the 47 priority pollutants in Table II-4 that have been determined to pass
through or otherwise interfere with the operation of POTWs. The Agency has
determined that PSNS will not cause a barrier to entry for new source OCPSF
plants.
II-17

TABLE II-4. PRETREATMENT STANDARDS FOR EXISTING AND NEW SOURCES (PSES AND PSNS)
Pollutant Number
1 4 6 7 8 9
I0 Ii 12 13 14 16 23 25 26 27 29 30 32 33 34 38 39 44 45 52 55 56 57 58 60 65 66 68 70 71 78 80 81 84 85 86 87
Pollutant Name
Acenaphthene Benzene Carbon Tetrachloride Chlorobenzene 1,2,4-Trichlorobenzene Hexachlorobenzene 1,2-Dichloroethane l,l,l-Trichloroethane Hexachloroethane l-l-Dichloroethane 1,1,2-Trichloroethane Chloroethane Chloroform 1,2-Dichlorobenzene 1,3-Dichlorobenzene 1,4-Dichlorobenzene 1 l-Dichloroethylene I 2-Trans-dichloroethylene 1 2-Dichloropropane 1 3-Dichloropropene 2 4-Dimethylphenol Ethylbenzene Fluoranthene Methylene Chloride Methyl Chloride Hexachlorobutadiene Naphthalene Nitrobenzene 2-Nitrophenol 4-Nitrophenol 4,6-Dinitro-o-cresol Phenol Bis(2-ethylhexyl)phthalate Di-n-butyl phthalate Diethyl phthalate Dimethyl phthalate Anthracene Fluorene Phenanthrene Pyrene Tetrachloroethylene Toluene Trichloroethylene
Pretreatment Standards I Maximum for Maximum for Any One Day Monthly Average
47 19 134 57 380 142 380 142 794 196 794 196 574 180 59 22
794 196 59 22
127 32 295 II0 325 iii 794 196 380 142 380 142 60 22 66 25
794 196 794 196 47 19
380 142 54 22
170 36 295 Ii0 380 142 47 19
6,402 2,237 231 65 576 162 277 78 47 19
258 95 43 20
113 46 47 19 47 19 47 19 47 19 48 20
164 52 74 28 69 26
II-18

TABLE II-4. PRETREATMENT STANDARDS FOREXISTING AND NEW SOURCES (PSES AND PSNS)
(Continued)
Pre t rea tmen t Standards 1 P o l l u t a n t Maximum for Maximum for Number Pollutant Name Any One Day Monthly Average
88 Vinyl Chlorid~ 172 97 121 Total Cyanide- 1,200 420 122 Total Lead s 690 320 128 Total Zinc 3'4 2,610 1,050
IAII u n i t s a re micrograms per l i t e r .
2Cyanide limitations apply only to cyanide-bearlng waste streams, including those listed in Table X-3.
~Metals l i m i t a t i o n s apply only to noncomplexed me ta l -bea r ing waste s t reams, i nc lud ing those l i s t e d in Table X-4. Discharges of lead and z inc from "complexed me ta l -bea r ing process wastewaterg" l i s t e d in Table X-5, a re not sub j ec t to these l i m i t a t i o n s .
4Total z inc l i m i t a t i o n s and s tandards for rayon f i b e r manufacture by the v i scose process and a c r y l i c f i b e r manufacture by the z inc c h l o r i d e / s o l v e n t process are 6,796 ug/1 and 3,325 ~g/1 for Maximum for Any One Day and Maximum for Monthly Average, r e s p e c t i v e l y .
II-19

SECTION III
INDUSTRY DESCRIPTION
A. INTRODUCTION
The organic chemicals industry began modestly in the middle of the 19th
century. The production of coke, used both as a fuel and reductant in blast
furnaces for steel production, generated coal tar as a by-product. These tars
were initially regarded as wastes. However, with the synthesis of the first
coal tar dye by Perkin in 1856, chemists and engineers began to recover the
waste tar and use it to manufacture additional products.
The organic chemicals industry began with the isolation and commercial
production of aromatic hydrocarbons (e.g., benzene and toluene and phenolics
from coal tar). As more organic compounds possessing valuable properties were
identified, commercial production methods for these compounds became desir-
able. The early products of the chemical industry were dyes, explosives, and
pharmaceuticals.
The economic incentive to recover and use by-products was a driving force
behind the growing synthetic chemicals industry. For example, the manufacture
of chlorinated aromatics was prompted by: I) the availability of large
quantities of chlorine formed as a by-product from caustic soda production
(already a commodity chemical), 2) the availability of benzene derived from
coal tar, and 3) the discovery that compounds could serve as intermediates for
the production of other valuable derivatives, such as phenol and picric acid.
Specialty products such as surfactants, pesticides, and aerosol propellants
were developed later to satisfy particular commercial needs.
The plastics and synthetic fibers industry began later as an outgrowth of
the organic chemicals industry. The first commercial polymers, rayon and
bakelite, were produced in the early 1900's from feedstocks manufactured by
the organic chemicals industry. In the last several decades, the development
of a variety of plastic and synthetic fiber products and the diversity of
III-I

markets and applications of these products have made the plastic and synthetic
fibers industry the largest (measured by volume) consumer of organic
chemicals.
Chemicals derived from coal were the principal feedstocks of the early
industry, although ethanol[, derived from fermentation, was the source of some
aliphatic compounds. Changing the source of industry feedstocks to less ex-
pensive petroleum derivatives lowered prices and opened new markets for
organic chemicals, plastics, and synthetic fibers during the 1920's and
1930's. By World War II, the modern organic chemicals and plastics and syn-
thetic fiber industries based on petro-chemicals were firmly established in
the United States.
Today, the organic chemicals, plastics and synthetic fibers (OCPSF)
industry includes production facilities of two distinct types: those whose
primary function is chemical synthesis, and those that recover organic chemi-
cals as by-products from unrelated manufacturing operations such as coke
plants (steel production) and pulp mills (paper production). The majority of
the plants in this iedustry are plants that process chemical precursors (raw
materials) into a wide variety of products for virtually every industrial and
consumer market.
Approximately 90 percent (by weight) of the precursors, the primary
feedstocks for all of the industry's thousands of products, are derived from
petroleum and natural gas. The remaining i0 percent is supplied by plants
that recover organic chemicals from coal tar condensates generated by coke
production.
There are numerous ways to describe the OCPSF industry; however, tradi-
tional profiles such as number of product lines or volume of product sales
mask the industry's complexity and diversity. The industry is even more
difficult to describe in terms that make distinctions among plants according
to wastewater characteristics. Subsequent parts of this section discuss the
OCPSF industry from several different perspectives, including product line,
product sales, geographic distribution, facility size, facility age, and
wastewater treatment and disposal methods as practiced by the industry. OCPSF
III-2

w a s t e w a t e r t r e a t m e n t p r a c t i c e s a r e summarized in S e c t i o n I I and d e s c r i b e d in
d e t a i l in S e c t i o n VII of t h i s document. The s u b c a t e g o r i z a t i o n of p l a n t s
w i t h i n the OCFSF i n d u s t r y by p roce s s c h e m i s t r y , raw and t r e a t e d w a s t e w a t e r
c h a r a c t e r i s t i c s , and o t h e r p l a n t - s p e c i f i c f a c t o r s , i s d i s c u s s e d in S e c t i o n IV.
B. DEFINITION OF THE INDUSTRY
A single definition of the OCPSF industry is difficult to derive because
of the complexity and diversity of the products and the manufacturing proces-
ses used in the industry. However, some traditional profiles can provide
general descriptions of the industry, and these are discussed briefly in the
following subsections:
• S tandard I n d u s t r i a l C l a s s i f i c a t i o n (SIC) sys tem
• Scope of the f i n a l r e g u l a t i o n
• Raw m a t e r i a l s and p roduc t p r o c e s s e s
• G e o g r a p h i c l o c a t i o n
• Age of p l a n t
• S ize of p l a n t
• Mode of d ~ s c h a r g e .
1. S t anda rd I n d u s t r i a l C l a s s i f i c a t i o n System
S tanda rd I n d u s t r i a l C l a s s i f i c a t i o n (SIC) codes , e s t a b l i s h e d by the U.S.
Depar tment of Commerce, a r e c l a s s i f i c a t i o n s of commercia l and i n d u s t r i a l e s -
t a b l i s h m e n t s by type of activity in which they are engaged. The primary pur-
pose of the SIC code is to classify the manufacturing industries for the col-
lection of economic data. For this reason, the product descriptions in SIC
codes are arbitrary, often technically ambiguous, and in some cases inaccur-
ately representative of the products that are purported to be classified. SIC
codes also list archaic products that are no longer relevant to the OCPSF
industry. In some industries the SIC Code(s) match the activities covered by
the issuance of effluent guidelines and standards regulations. For the OCPSF
industry, product descriptions under the following SIC codes are nominal at
b e s t :
2865 Cyclic (Coal Tar) Crudes, and Cyclic Intermediates, Dyes, and Organic Pigments (Lakes and Toners)
111-3

2869 Industrial Organic Chemicals, Not Elsewhere Classified
2821 Plastics Materials, Synthetic Resins, and Nonvulcanizable Elastomers
2823 Cellulosic Man-Made Fibers
2824 Synthetic Organic Fibers, Except Cellulosic.
In addition, as a result of 1976 litigation and agreement, the organic chemi-
cals manufacturing, and the plastics and synthetic materials manufacturing
industries (since combined into the industry category addressed by this devel-
opment document) was defined to include all facilities manufacturing products
that could be construed to fall within these specific SIC codes. The U.S.
Environmental Protection Agency (EPA) considered two of these SIC codes: SIC
2865, cyclic (coal tar) crudes, and cyclic intermediates, dyes, and organic
pigments (lakes and toners); and SIC 2869, industrial organic chemicals, not
elsewhere classified, to be applicable to the organic chemicals manufacturing
industry.
The products that the SIC Manual includes in the industrial organic chem-
ical industry (SIC 286) are natural products such as gum and wood chemicals
(SIC 2861), aromatic and other organic chemicals from the processing of coal
tar and petroleum (SIC 2865), and aliphatic or acyclic organic chemicals (SIC
2869).
These chemicals are the raw materials for deriving products such as plas-
tics, rubbers, fibers, protective coatings, and detergents, but have few
direct consumer uses. Gum and wood chemicals (SIC 2861) are regulated under a
separate consent decree industrial category, gum and wood chemicals manufac-
turing (40 CFR 454).
The plastics and synthetic materials manufacturing category as defined by
the 1976 agreement, comprises SIC 282, plastic materials and synthetic resins,
synthetic rubber, and synthetic and other manmade fibers, except glass. SIC
282 includes the following SIC codes:
2821 Plastics Materials, Synthetic Resins, and Nonvulcanizable Elastomers
111-4

2822 Synthetic Rubber (Vulcanizable Elastomers)
2823 Cellulosic Man-Made Fibers
2824 Synthetic Organic Fibers, Except Cellulosic.
Of these codes, SIC 2822 is covered specifically in the 1976 agreement by
another industrial category, rubber manufacturing (40 CFR 428). Similarly,
miscellaneous plastic products (SIC 3079), which is related to the plastics
industry, is covered by the specific industrial category, plastics molding and
forming (40 CFR 463). EPA considers a plant that merely processes a polymeric
material for any end use other than as a fiber to be in SIC 3079. In con-
trast, if the plant manufactures that polymeric material from monomeric raw
materials, then that portion of its production is in SIC 2821.
The relationship of all the industries listed in the SIC Manual as being
related to production of organic chemicals, plastics, or synthetic fibers is
shown in Figure III-l.
a. Additional SIC Codes Could Be Considered as Part of the OCPSF Industry
A review of SIC product code data supplied by OCPSF industry facilities
in the 1983 Section 308 Questionnaire identified Ii SIC product categories
that are classified under SIC codes different from those in the Settlement
Agreement discussed above that could be considered as part of the OCPSF
industry because they include the manufacture of OCPSF products or utilize
OCPSF process chemistry. These additional SIC code product categories are
also shown in Figure III-i and listed below.
SIC Code Description
2891400 Synthetic Resin (and Rubber) Adhesives
2891423 Phenolics and Modified Phenolics Adhesives
Urea and Modified Urea Adhesives 2891433
2891453 Acrylic Adhesives
III-5

Petrochemical Inter-Industry Relationship
Feedstock Industries Petrochemical Industries Petrochemical-Dependent Chemical Industries
2821 3079 Plastic IL Misc. Plastics
Materials Products
2822 Synthetic Rubbers
2824 •.,,==~ Synthetic
Fibers
2843 Surfactants
1321 2865 Natural Cyctics and
Gas Liquids Aromatics I 2823 Cellulosic Fibers
2831 Biologicals
2869 2833 Medicinals and Botanicals Acyclics and 2834 Pharmaceuticals
Aliphatics 2841 Detergents
1311 2842 Polishes Crude
Petroleum 2844 Toiletries and Natural Gas 2851 Paints
2879 Pesticides
2891 Adhesives
2874 Phosphatic Fertilizers
2911 ,.-.~ Petroleum
2873 ~ Nitrogenous
Fertilizers
I .. L ~
2875 Mixed Fertilizers
2892 Explosives Refining
2895 Carbon 2893 Printing Inks
Black
Source: U.S. Department of Commerce, 1981. " 1981 U.S. Industrial Outlook." Bureau of Industrial Econ6mics, Washington, D.C.
Figure II1-1. Relationships Among the SIC Codes Related to the Production
of Organic Chemicals, Plastics, and Synthetic Fibers
III-6

2843085 Bulk Surface Act ive Agents
2899568 Sizes, All Types
2899597 Other I n d u s t r i a l Chemical S p e c i a l t i e s , I n c l u d i n g F luxes , P l a s t i c Wood Prep- a r a t i o n s and Embalming Chemicals
2899598 Other I n d u s t r i a l Chemical S p e c i a l t i e s , I n c l u d i n g Fluxes and P l a s t i c Wood P r e p a r a t i o n s
2911058 Aromatics,-Made from Purchased Refinery Products
2911632 L i q u i f i e d Re f ine ry Gases ( I n c l u d i n g Other A l i p h a t i c s ) , Made from Purchased R e f i n e r y Produc t s
3079000 Miscellaneous Plastics Products (Including Only Cellophane Manufacture From the Viscose Process)
b. Primary, Secondary, and Tertiar 7 SiC Codes
SIC codes, established by the U.S. Department of Commerce, are classifi-
cations of commercial and industrial establishments by type of activity in
which they are engaged. The SIC code system is commonly employed for collec-
tion and organization of data (e.g., gross production, sales, number of em-
ployees, and geographic location) for U.S. industries. An establishment is
an economic unit that produces goods or services (e.g., a chemical plant, a
mine, a factory, or a store). The establishment is a single physical loca-
tion and is typically engaged in a single or dominant type of economic activ-
ity for which an industry code is applicable,
Where a s i n g l e p h y s i c a l l o c a t i o n encompasses two or more d i s t i n c t and
s e p a r a t e economic a c t i v i t i e s fo r which d i f f e r e n t i n d u s t r i a l c l a s s i f i c a t i o n
codes seem a p p l i c a b l e ( e . g . , a s t e e l p l a n t t ha t produces o rgan i c chemica l s as
a r e s u l t of i t s coking o p e r a t i o n s ) , such a c t i v i t i e s a re t r e a t e d as s e p a r a t e
e s t a b l i s h m e n t s under s e p a r a t e SIC codes , p rov ided t h a t : 1) no one i n d u s t r y
d e s c r i p t i o n in the SIC i n c l u d e s such combined a c t i v i t i e s ; 2) the employment in
each such economic a c t i v i t y i s s i g n i f i c a n t ; 3) such a c t i v i t i e s a re not
o r d i n a r i l y a s s o c i a t e d wi th one ano the r a t common p h y s i c a l l o c a t i o n s ; and
1il-7

4) reports can be prepared on the number of employees, their wages and r
salaries, and other establishment type data. A single plant may include more
than one establishment and more than one SIC code.
A plant is assigned a primary SiC code corresponding to its primary
activity, which is the activity producing its primary product or group of
products. The primary product is the product having the highest total annual
shipment value. The secondary products of a plant are all products other
than the primary products. Frequently in the chemical industry a plant may
produce large amounts of a low-cost chemical, but be assigned another SIC code
because of lower-volume production of a high-priced specialty chemical. Many
plants are also assigned secondary, tertiary, or lower order SIC codes corres-
ponding to plant activities beyond their primary activities. The inclusion
of plants with a secondary or lower order SIC code produces a list of plants
manufacturing a given class of industrial products, but also includes plants
that produce only minor (or in some cases insignificant) amounts of those
products. While the latter plants are part of an industry economically, their
inclusion may distort the description of the industry's wastewater production
and treatment, unless the wastewaters can be segregated by SIC codes.
c. Products of Various SIC Categories
Important classes of chemicals of the organic chemicals industry within
SIC 2865 include: I) derivatives of benzene, toluene, naphthalene, anthra-
cene, pyridine, carbazole, and other cyclic chemical products; 2) synthetic
organic dyes; 3) synthetic organic pigments; and 4) cyclic (coal tar) crudes,
such as light oils and light oil products; coal tar acids; and products of
medium and heavy oil such as creosote oil, naphthalene, anthracene and their
high homologues, and tar.
Important classes of chemicals of the organic chemicals industry within
SIC 2869 include: l) non-cyclic organic chemicals such as acetic, chloro-
acetic, adipic, formic, oxalic acids and their metallic salts, chloral, for-
maldehyde, and methylamine; 2) solvents such as amyl, butyl, and ethyl alco-
hols; methanol; amyl, butyl, and ethyl acetates; ethyl ether, ethylene glycol
ether, and diethylene glycol[ ether; acetone, carbon disulfide, and chlorinated
III-8

s o l v e n t s s u c h as carbon t e t r a ch lo r i de , t e t r ach lo roe thene , ' and t r i ch lo roe thene ;
3) polyhydric a lcohols such as e thylene g lycol , s o r b i t o l , p e n t a e r y t h r i t o l , and
syn the t i c g lyce r in ; 4) syn the t i c perfume and f lavor ing mater ia l s such as
coumarin, methyl s a l i c y l a t e , saccharin , c i t r a l , c i t r o n e l l a l , syn the t i c
geran~ol, ionone, t e rp ineo l , and syn the t i c v a n i l l i n ; 5) rubber processing
chemicals such as acce le ra to r s and an t iox idan t s , both cyc l i c and acyc l i c ; 6)
p l a s t i c i z e r s , both cyc l i c and acyc l i c , such as e s t e r s of phosphoric acid,
ph tha l ic anhydride, adipic acid, l au r i e acid, o le i c acid, sebacic acid, and ~-i?
s t e a r i c acid; 7) syn the t i c tanning agents such as su l fon ic acid condensates;
and 8) e s t e r s , amines, e tc . of polyhydric a lcohols and f a t t y and other ac ids .
Tables I I I - 1 and I I I - 2 l i s t spec i f i c products of SIC 2865 and SIC 2869,
r e spec t i ve ly .
Important products produced by the p l a s t i c s and syn the t i c f ibe r s indus t ry
wi thin SIC 2821 include: ce l lu lose ace ta te , phenolic, and other tar acid
r e s ins ; urea and melamine res ins ; v inyl ace ta te r e s ins ; polyethylene res ins ;
polypropylene r e s ins ; ros in modified res ins ; coumarone-indene r e s ins ;
petroleum res ins ; polyamide res ins , s i l i c o n e s , po ly isobuty lenes , po lyes te r s ,
polycarbonate r e s in s , ace ta l r e s ins , fluorohydrocarbon r e s in s . Table I I I - 3
l i s t s important products of SIC 2821.
Important cellulosic man-made fibers (SIC 2823) include: cellulose
acetate, cellulose triacetate and rayon, triacetate fibers. Important non-
cellulosic synthetic organic fibers (SIC 2824) include: acrylic, modacrylic,
fluorocarbon, nylon, olefin, polyester, and polyvinyl. Tables III-4 and III-5
list specific products of SIC 2823 and SIC 2824, respectively.
Certain products of SIC groups other than 2865, 2969, 2821, 2823, and
2824 are identical to OCPSF industry products. Benzene, toluene, and mixed
xylenes manufactured from purchased refinery products in SIC 29110582 (in
contrast to benzene, toluene, and mixed xylenes manufactured in refineries--
SIC 29110558) are manufactured with the same reaction chemistry and unit
operations as OCPSF products (see Table III-6). Similar considerations apply
to aliphatic hydrocarbons manufactured from purchased refinery products--
SIC 29116324 (see Table III-7).
III-9

TABLE III-I. SiC 2865: CYCLIC (COAL TAR), CRUDES, AND CYCLIC INTERMEDIATES,
DYES, AND ORGANIC PIGMENTS (LAKES AND TONERS)
Acid dyes, synthetic Acids, coal tar: derived from coal tar
distillation Alkylated diphenylamines, mixed Alkylated phenol, mixed Aminoanthraquinone Aminoazobenzene Aminoazotoluene Amlnophenol Aniline Aniline oil Anthracene Anthraquinone dyes Azine dyes Azo dyes Azobenzene Azoic dyes Benzaldehyde Benzene hexachloride (BHC) Benzene, product of coal tar
distillation Benzoic acid
Hydroquinone Isocyanates Lake red C toners Leather dyes and stains, synthetic Lithol rubine lakes and toners Maleic anhydride Methyl violet toners Naphtha, solvent: product of coal
tar distillation Naphthalene chips and flakes Naphthalene, product of coal tar
distillation Naphthol, alpha and beta Nitro dyes Nitroaniline Nitrobenzene Nitrophenol Nitroso dyes Oil, aniline Oils: light, medium, and heavy--pro-
duct of coal tar distillation Organic pigments (lakes and toners)
Benzol, product of coal tar distillation Orthodichlorobenzene Biological stains Chemical indicators Chlorobenzene Chloronaphthalene Chlorophenol Chlorotoluene Coal tar crudes, derived from coal
tar distillation Coal tar distillates Coal tar intermediates Color lakes and toners Color pigments, organic: except animal
black and bone black Colors, dry: lakes, toners, or full
strength organic colors Colors, extended (color lakes) Cosmetic dyes, synthetic Creosote oil, product of coal tar
distillation Cresols, product of coal tar
distillation Cresylic acid, product of coal tar
distillation Cyclic crudes, coal tar: product of
coal tar distillation
Paint pigments, organic Peacock blue lake Pentachlorophenol Persian orange lake Phenol Phloxine toners Phosphomolybdic acid lakes and toners Phosphotungstic acid lakes and toners Phthalic anhydride Phthalocyanine toners Pigment scarlet lake Pitch, product of coal tar
distillation Pulp colors, organic 0uinoline dyes Resorcinol Scarlet 2 R lake Stains for leather Stilbene dyes Styrene Styrene monomer Tar, product of coal tar distillation Toluene, product of coal tar
distillation
III-i0

TABLE III-l. SIC 2865: CYCLIC (COAL TAR), CRUDES, AND CYCLIC INTERMEDIATES,
DYES, AND ORGANIC PIGMENTS (LAKES AND TONERS) (Continued)
Cyclic intermediates Toluidines Cyclohexane Toluol, product of coal tar distilla- Diphenylamine tion Drug dyes, synthetic Vat dyes, synthetic Dye (cyclic) intermediates Xylene, product of coal tar distilla- Dyes, food: synthetic tion Dyes, synthetic organic Xylol, product of coal tar distilla- Eosine toners tion Ethylbenzene
Source: OMB 1972. Standard Industrial Classification Manual 1972. Statistical Policy Division, Washington, D.C.
III-ll

TABLE 111-2. SiC 2869: INDUSTRIAL ORGANIC CHEMICALS, NOT ELSEWHERE
CLASSIFIED
Accelerators, rubber processing: Coumarin cyclic and acyclic Cream of tartar
Acetaldehyde Cyclopropane Acetates, except natural acetate of DDT, technical
lime Decahydronaphthalene Acetic acid, synthetic Dichlorodifluoromethane Acetic anhydride Diethylcyclohexane (mixed isomers) Acetin Diethylene glycol ether Acetone, synthetic Dimethyl divinyl acetylene Acid esters, amines, etc. (di-isopropenyl acetylene) Acids, organic Dimethylhydrazine, unsymmetrical Acroleln Embalming fluids Acrylonitrile Enzymes Adiplc acid Esters of phosphoric, adlpic, Adipic acid esters lauric, oleic, sebacic, and Adlponitrile stearic acids Alcohol, aromatic Esters of phthalic anhydride Alcohol, fatty: powdered Ethanol, industrial Alcohol, methyl: synthetic Ether
(methanol) Ethyl acetate, synthetic Alcohols , i n d u s t r i a l : denatured Ethyl alcohol, industrial
(nonbeverage) (non-beverage) Algin products Ethyl butyrate Amyl a c e t a t e and a lcohol Ethyl cellulose, unplasticized Ant iox idan t s , rubber p rocess ing : Ethyl chloride
c y c l i c and a c y c l i c Ethyl ether Bromochloromethane Ethyl formate Butadiene, from a lcohol Ethyl nitrite Butyl a c e t a t e , a l coho l , and Ethyl perhydrophenanthrene
propr iona te Ethylene Butyl e s t e r s o l u t i o n of 2, 4-D Ethylene glycol Calcium oxa la t e Ethylene glycol ether Camphor, s y n t h e t i c Ethylene glycol, inhibited Carbon b i s u l f i d e ( d i s u l f i d e ) Ethylene oxide Carbon t e t r a c h l o r i d e Fatty acid esters, amines, etc. Casing fluids, for curing fruits, Ferric ammonium oxalate
spices, tobacco, etc. Flavors and flavoring materials, Cellulose acetate, unplasticized synthetic Chemical warfare gases Fluorinated hydrocarbon gases Chloral Formaldehyde (formalin) Chlorinated solvents Formic acid and metallic salts Chloroacetic acid and metallic Freon
salts Fuel propellants, solid: organic Chloroform Fuels, high energy: organic Chloropicrin Geraniol, synthetic Citral Glycerin, except from fats Citrates (synthetic) Citric acid Grain alcohol, industrial Citronellal (non-beverage)
111-12

TABLE III-2. SIC 2869: INDUSTRIAL ORGANIC CHEMICALS, NOT ELSEWHERE
CLASSIFIED (Continued)
Hexamethylenediamine Hexamethylenetetramine High purity grade chemicals,
organic: refined from technical grades
Hydraulic fluids, synthetic base Hydrazine Industrial organic cycle compounds Ionone Isopropyl alcohol Ketone, methyl ethyl Ketone, methyl isobutyl Laboratory chemicals, organic Lauric acid esters Lime citrate Malononitrile, technical grade Metallic salts of acyclic organic
chemicals Metal l ic s t e a r a t e Methanol, synthe t ic (methyl
alcohol) Methyl chlor ide Methyl perhydrofluorine Methyl s a l i c y l a t e Methylamine Methylene chloride Monochlorodifluoromethane Monomethylparaminophenol sulfate Monosodium glutamate Mustard gas Napthalene sulfonic acid
condensates Naphthenic acid soaps Normal hexyl decalin Nuclear fuels, organic Oleic acid esters Organic acid esters Organic chemicals, acyclic Oxalates Oxalic acid and metallic salts Pentaerythritol Perchloroethylene Perfume materials, synthetic Phosgene Phthalates Plasticizers, organic: cyclic and
acyclic Polyhydric alcohol esters, amines,
etc.
Polyhydric alcohols Potassiium bitartrate Propellants for missiles, solid:
organic Propylene Propylene glycol Quinuclidinol ester of benzylic
acid Reagent grade chemicals, organic:
refined from technical grades Rocket engine fuel, organic Rubber processing chemicals,
organic: accelerators and antioxidants
Saccharin Sebacic acid Silicones Soaps, naphthenic acid Sodium acetate Sodium alginate Sodium benzoate Sodium glutamate Sodium pentachlorophenate Sodium sulfoxalate formaldehyde Solvents, organic Sorbitol Stearic acid salts Sulfonated naphthalene Tackifiers, organic Tannic acid Tanning agents, synthetic organic Tartaric acid and metallic salts Tartrates Tear gas Terpineol Tert-butylated bis
(p-phenoxyphenyl) ether fluid Tetrachloroethylene Tetraethyl lead Thioglycolic acid, for permanent
wave lotions Trichloroethylene Trichloroethylene stabilized,
degreasing Trichlorophenoxyacetic acid Trichlorotrifluoroethane
tetrachlorodi fluoroethane isopropyl alcohol
T~icresyl phosphate
III-13

TABLE III-2. SIC 2869: INDUSTRIAL ORGANIC CHEMICALS, NOT ELSEWHERE
CLASSIFIED (Continued)
Tridecyl alcohol Trimethyltrithiophosphite (rocket
propellants) Triphenyl phosphate Vanillin, synthetic Vinyl acetate
Source: OMB 1972. Standard Industrial Classification Manual 1972. Statistical Policy Division, Washington, D.C.
III-14

TABLE III-3. SIC 2821: PLASTIC MATERIALS, SYNTHETIC RESINS,
AND NONVULCANIZABLE ELASTOMERS
Acetal resins Acetate, cellulose (plastics) Acrylic resins Acrylonitrile-butadiene-styrene resins Alcohol resins, polyvinyl Alkyd resins Allyl resins Butadiene copolymers, containing less
than 50% butadiene Carbohydrate plastics Casein plastics Cellulose nitrate resins Cellulose propionate (plastics) Coal tar resins Condensation plastics Coumarone-indene resins Cresol-furfural resins Cresol resins Dicyandiamine resins Diisocyanate resins Elastomers, nonvulcanizable (plastics) Epichlorohydrin bisphenol Eplchlorohydrin diphenol Epoxy resins Ester gum Ethyl cellulose plastics Ethylene-vinyl acetate resins Fluorohydrocarbon resins Ion exchange resins lonomer resins Isobutylene polymers Lignin plastics Melamine resins Methyl acrylate resins Methyl cellulose plastics Methyl methacrylate resins Molding compounds, plastics Nitrocellulose plastics (pyroxylin)
Nylon resins Petroleum polymer resins Phenol-furfural resins Phenolic resins Phenoxy resins Phthalic alkyd resins Phthalic anhydride resins Polyacrylonitrile resins Polyamide resins Polycarbonate resins Polyesters Polyethylene resins Polyhexamethylenediamine adipamide
resins Polyisobutylenes Polymerization plasticS, except fibers Polypropylene resins Polystyrene resins Polyurethane resins Polyvinyl chloride resins Polyvinyl halide resins Polyvinyl resins Protein plastics Pyroxylin Resins, phenolic Resins, synthetic: coal tar and
non-coal tar Rosin modified resins Silicone fluid solution (fluid for
sonar transducers) Silicone resins Soybean plastics Styrene resins Styrene-acrylonitrile resins Tar acid resins Urea resins Vinyl resins
Source: OMB 1972. Standard Industrial Classification Manual 1972. Statistical Policy Division, Washington, D.C.
III-15

TABLE III-4. SIC 2823: CELLULOSIC MAN-MADE FIBERS
A c e t a t e fibers Cellulose a c e t a t e monofilament, yarn,
staple, or tow Cellulose fibers, man-made Cigarette tow, cellulosic fiber Cuprammonium fibers Fibers, cellulose man-made Fibers, rayon Horsehair, artifical: rayon Nitrocellulose fibers
Rayon primary products: fibers, straw, strips, and yarn
Rayon yarn, made in chemical plants (primary products)
Regenerated cellulose fibers Triacetate fibers Viscose fibers, bands, strips,
and yarn Yarn, cellulosic: made in chemical
plants (primary products)
Source: OMB, 1972. Standard Industrial Classification Manual 1972. Statistical Policy Division, Washington, D.C.
111-16

TABLE III-5 SIC 2824: SYNTHETIC ORGANIC FIBERS, EXCEPT CELLULOSIC
Acryl ic f i b e r s A c r y l o n i t r i l e f i b e r s Anidex f i b e r s Casein f i b e r s Elastomeric fibers Fibers, man-made: except cellulosic Fluorocarbon fibers Horsehair, artificial: nylon Linear esters fibers Modacrylic fibers Nylon fibers and bristles Olefin fibers Organic fibers, synthetic: except
cellulosic
Po lyes t e r f i b e r s Polyvinyl e s t e r f i b e r s Po lyv iny l idene c h l o r i d e f i b e r s P ro te in f i b e r s Saran f i b e r s Soybean fibers (man-made textile
materials) Vinyl fibers Vinylidene chloride fibers Yarn, organic man-made fiber
except cellulosic Zein fibers
Source: OMB 1972. Standard Industrial Classification Manual 1972. Statistical Policy Division, Washington, D.C.
111-17

TABLE III-6. OCPSF CHEMICAL PRODUCTS ALSO LISTED AS SiC 29110582 PRODUCTS
Benzene
Cresylic acid
Cyclopentane
Naphthalene
Naphthenic Acid
Toluene
Xylenes, Mixed
C9 Aromatics
Source: 1982 Census of Manufacturers and Census of Mineral Industries. Numerical List of Manufactured and Mineral Products. U.S. Department of Commerce, Bureau of the Census, 1982.
111-18

TABLE 111-7. OCPSF CHEMICAL PRODUCTS ALSO LISTED AS SIC 29116324 PRODUCTS
C2 Hydrocarbons Acetylene Ethane Ethylene C3 Hydrocarbons Propane Propylene C4 Hydrocarbons Butadiene and butylene fractions 1,3-Butadiene, grade for rubber n-Butane Butanes, mixed l-Butene 2-Butene 1-Butane and 2-butene, mixed Hydrocarbons, C4, fraction Hydrocarbons, C4, mlxtures Isobutane (2-Methylpropane) Isobutylene (2-Methylpropene) C4 Hydrocarbons, all other
amylenes Dibutanized aromatic concentrate C5 Hydrocarbon, mixtures Isopentane (2-Methylbutane) Isoprene (2-Methyl-l,3-bu~adiene) n-Pentane 1-Pentene Pentenes, mixed Piperylene (1,3-Pentadlene) C5 Hydrocarbons, all other C6 Hydrocarbons Diisopropane Hexane Hexanes, mixed Hydrocarbons, C5-C6, mixtures Hydrocarbons, C5-C7, mixtures Isohexane Methylcyclopentadiene Neohexane (2,2-Dimethylbutane) C6 Hydrocarbons, C6, all other n-Heptane Heptenes, mixed Isoheptanes C7 Hydrocarbons C8 Hydrocarbons
Diisobutylene (Diisobutene) n-Octane Octenes, mixed 2,2,4-Trimethylpentane (Isooctane) C8 Hydrocarbons, all other C9 and above Hydrocarbons Dodecene Eicosane Nonene (Tripropylene) Alpha olefins Alpha olefins, C6-Ci0 Alpha olefins, Cll and higher n-Paraffins n-Paraffins, C6-C9 n-Parafflns , C9-C15 n-Parafflns, CI0-C14 n-Parafflns, CI0-C16 n-Parafflns, C12-C18 n-Parafflns, C15-C17 n-Parafflns, other Hydrocarbons, C5-C9, mixtures Polybutene Hydrocarbon derivatives n-Butyl mercaptan (l-Butanethlol) sec-Butyl mercaptan (2-Butanethlol) tert-Butyl mercaptan (2-Methyl-
2-propanethlol) Di-tert-butyl disulfide Diethyl sulfide (Ethyl sulfide) Dimethyl sulfide Ethyl mercaptan (Ethanethiol) Ethylthloethanol n-Hexyl mercaptan (1-Hexanethiol) Isopropyl mercaptan (2-Propanethlol) Methyl ethyl sulfide Methyl mercaptan (Methanethlol) tert-Octyl mercaptan (2,4,4-Trlmethyl-
2-pentanethlol) Octyl mercaptans Thiophane (Tetrahydrothiophene) Hydrocarbon derivatives: all other
hydrocarbon derivatives Hydrocarbons, C9 and above, all other,
including mixtures
Source: 1982 Census of Manufacturers and Census of Mineral Industries. Numerical List of Manufactured and Mineral Products. U.S. Department of Commerce, Bureau of the Census, 1982.
III-19

2. Scope of the Final Regulation
The promulgated regulation establishes effluent limitations guidelines
and standards for existing and new organic chemicals, plastics, and synthetic
fibers manufacturing facilities (BPT, BAT, NSPS, PSES, and PSNS). The final
regulations apply to process wastewater discharges from these facilities.
For the purposes of this regulation, 0CPSF process wastewater discharges
are defined as discharges from all establishments or portions of establish-
ments that manufacture the products or product groups listed in the applica-
bility sections of the regulation and also in Appendix III-A of this document,
and are included within the following U.S. Department of Commerce Bureau of
the Census SIC major groups:
• SIC 2865 - Cyclic Crudes and Intermediates, Dyes, and Organic Pigments
• SIC 2869 - Industrial Organic Chemicals, Not Elsewhere Classified
• SIC 2821 - Plastic Materials, Synthetic Resins, and Nonvulcanizable Elastomers
• SIC 2823 - Cellulosic Man-Made Fibers
• SIC 2824 - Synthetic Organic Fibers, Except Cellulosic.
The OCPSF regulation does not apply to process wastewater discharges from
the manufacture of organic chemical compounds solely by extraction from plant
and animal raw materials or by fermentation processes. Thus, ethanol derived
from natural sources (SIC 28095112) is not considered to be an OCPSF industry
product; however, ethanol produced synthetically (hydration of ethene) is an \
OCPSF industry product.
The OCPSF regulation covers all 0CPSF products or processes whether or
not they are located at facilities where the 0CPSF covered operations are a
minor portion of and ancillary to the primary production activities or a major
portion of the activities.
The 0CPSF regulation does not apply to discharges from OCPSF product/
process operations that are covered by the provisions of other categorical
111-20

industry effluent limitations guidelines and standards if the wastewater is
treated in combination with the non-OCPSF industrial category regulated waste-
water. (Some products or productgroups are manufactured by different pro-
cesses and some processes with slight operating condition variations give dif-
ferent products; EPA uses the term "product/process" to define all different
variations within this category of the same basic process to manufacture dif-
ferent products as well as to manufacture the same product using different
processes.) However, the OCPSF regulation applies to the product/processes
covered by this regulation if the facility reports OCPSF products under SIC
codes 2865, 2869, or 2821, and its OCPSF Wastewaters are treated in a separate
treatment system at the facility or discharged separately to a publicly owned
treatment works (POTW).
For example, some vertically integrated petroleum refineries and p~arma-
ceutical manufacturers discharge wastewaters from the production of synthetic
organic chemical products that are specifically regulated under the petrochem-
ical and integrated subcategories of the petroleum refining point source cate-
gory (40 CFR Part 419, Subparts C and E) or the chemical synthesis products
subcategory of the pharmaceuticals manufacturing point source category (40 CFR
Part 439, Subpart C). Thus, the principles discussed in the preceding para-
graph apply as follows: the process wastewater discharges by petro!eum refin-
eries and pharmaceutical manufacturers from production of organic chemical
products specifically covered by 40 CFR Part 419 Subparts C and E and Part 439
Subpart C, respectively, that are treated in combination with other petroleum
refinery or pharmaceutical manufacturing wastewater, respectively, are not
subject to regulation no matter what SIC they use to report their products.
However, if the wastewaters from their OCPSF production is separately dis-
charged to a POTW or treated in a separate treatment system, and they report
their products (from these processes) under SIC codes 2865, 2869, or 2821,
then these manufacturing operations are subject to regulation under the OCPSF
regulation, regardless of whether the OCPSF products are covered by 40 CFR
Part 419, Subparts C and E and Part 439, Subpart C.
The promulgated OCPSF category regulation applies to plastics molding and
forming processes when plastic resin manufacturers mold Or form (e.g., extrude
and pelletize) crude intermediate plastic material for shipment off-site.
III-21

This regulation also applies to the extrusion of fibers. Plastics molding and
forming processes other than those described above are regulated by the plas-
tics molding and forming effluent guidelines and standards (40 CFR Part 463).
Public comments requested guidance relating to the coverage of OCPSF
research and development facilities. Stand-alone OCPSF research and develop-
ment, pilot-plant, technical service, and laboratory bench-scale operations
are not covered by the 0CPSF regulation. However, wastewater from such opera-
tions conducted in conjunction with and related to existing OCPSF manufactur-
ing operations at OCPSF facilities is covered by the OCPSF regulation because
these operations would most likely generate wastewater with characteristics
similar to the commercial manufacturing facility. Research and development,
pilot-plant, technical service, and laboratory operations that are unrelated
to existing OCPSF plant operations, even though conducted on-site, are not
covered by the OCPSF regulation because they may generate wastewater with
characteristics dissimilar to that from the commercial OCPSF manufacturing
facility.
Finally, as described in the following paragraphs, this regulation does
not cover certain production that has historically been reported to the Bureau
of Census under a non-OCPSF SIC subgroup heading, even if such production
could be reported under one of the five SIC code groups covered by the final
regulation.
The Settlement Agreement required the Agency to establish regulations for
the organic chemicals manufacturing SIC codes 2864 and 2869 and for the plas-
tics and synthetic materials manufacturing SIC Code 282. SIC 282 includes the
three codes covered by this regulation, 2821, 2823, and 2824, as well as SIC
2822, synthetic rubber (vulcanizable elastomers), which is covered specific-
ally in the Settlement Agreement by another industrial category, rubber manu-
facturing (40 CFR 428). The Agency therefore directed its data collection
efforts to those facilities that report manufacturing activities under SIC
codes 2821, 2823, 2824, 2865, and 2869. Based on an assessment of this infor-
mation and the integrated nature of the synthetic OCPSF industry, the Agency
also defined the applicability of the OCPSF regulation by listing the specific
products and product groups that provide the technical basis for the regula-
tion (see Appendix Ill-A).
111-22

Since many of these products may be reported under more than one SIC code
even though they are often manufactured with the same reaction chemistry or
unit operations, the Agency proposed to extend the applicability of the 0CPSF
regulation (50 FR 29068; July 17, 1985 or 51FR 44082; December 8, 1986) to
include 0CPSF production reported under the following SIC subgroups:~
• SIC 2911058 - aromatic hydrocarbons manufactured from purchased refinery products
• SIC 2911632 - aliphatic hydrocarbons manufactured from purchased refinery products
SIC 28914 - synthetic resin and rubber adhesives (including only those synthetic resins listed under both SIC 28914 and SIC 2821 that are polymerized for use or sale by adhesive manufacturers)
Chemicals and chemical preparations, not elsewhere classified:
- SIC 2899568 - sizes, all types
- SIC 2899597 - other industrial chemical specialties, including fluxes, plastic wood preparations, and embalming fluids
SIC 2843085 - bulk surface active agents
SIC 3079 - miscellaneous plastics products (including only cellophane manufacture from the viscose process).
However, for the reasons discussed below, the Agency has decided not to extend
the applicability of the OCPSF regulation to discharges from establishments
that manufacture OCPSF products and have, in the past, reported such produc-
tion under these non-OCPSF SIC subgroups.
As notedearlier, the SIC codes are classifications of commercial and
industrial establishments by type of activity in which they are engaged. The
predominant purpose of the SIC code is to classify the manufacturing indus-
tries for the collection of economic data. The product descriptions in SIC
codes are often technically ambiguous and also list products that are no
longer produced in commercial quantities. For this reason, the AgenCy pro-
posed to define the applicability of the OCPSF regulation in terms of both SIc
codes and specific products and product groups (50 FR 29073, July 17, 1985).
Many chemical products may appear under more than one SIC code depending on
III-23

the manufacturing raw material sources, use in the next stage of the manufac-
turing process, or type of sale or end use. For example, phenolic, urea, and
acrylic resin manufacture may be reported under SIC 28914, synthetic resin
adhesives, as well as under SIC 2821, plastics materials and resins. Benzene,
toluene, and xylene manufacture may be reported under SIC 2911, petroleum
refining, or under SIC 2911058, aromatics, made from purchased refinery pro-
ducts, as well as SIC 2865, cyclic crudes and intermediates. Likewise, alkyl-
benzene sulfonic acids and salts manufacture may be reported under SIC
2843085, bulk surface active agents, which include all amphoteric, anionic,
cationic, and nonionic bulk surface active agents excluding surface active
agents produced or purchased and sold as active incredients in formulated
products, as well as SIC 286, industrial organic chemicals.
Many commenters stated that the Agency's OCPSF technical and economic
studies do not contain sufficient information to extend coverage to all
facilities reporting OCPSF manufacturing under all of the above SIC subgroups.
The Agency agrees in part with these commenters. The OCPSF technical, cost,
and economic impact data-gathering efforts focused only on those primary and
secondary manufacturers that report OCPSF manufacturing activities under SIC
codes 2821, 2823, 2824, 2865, and 2869. Specific efforts were not directed
toward gathering technical and financial data from facilities that report
OCPSF manufacturing under SIC subgroups 2911058, 2911632, 28914, 2843085,
2899568, 2899597, and 3079. As a result, EPA lacks cost and economic informa-
tion from a significant number of plants that report OCPSF manufacturing
activities to the Bureau of the Census under these latter SIC subgroups. Con-
sequently, the applicability section of the final regulation (§414.il) clari-
fies that the OCPSF regulation does not apply to a plant's OCPSF production
that has been reported by the plant in the past under SIC groups 2911058,
2911632, 28914, 2843085, 2899568, 2899597, and 3079.
Approximately 140 of the 940 OCPSF plants that provide the technical
basis for the final regulation reported parts of their OCPSF production under
SIC codes 2911058, 2911632, 28914, 2843085, 2899568, and 2899597, as well as
SIC codes 2821, 2823, 2824, 2865, and 2869. As a result of the definition of
applicability, a smaller portion of plant production than was reported as
OCPSF production for these plants is covered by the final regulation.
III-24

The Agency does note , however, t h a t t h e OCPSF manufai6turing processes are
e s s e n t i a l l y i d e n t i c a l r e g a r d l e s s of how manufacturing f a c i l i t i e s may repor t
OCPSF product ion to the Bureau of the Census. Therefore , the OCPSF t e c h n i c a l
d a t a base and e f f l u e n t l i m i t a t i o n s and s tandards provide permit i s s u i n g
a u t h o r i t i e s wi th t e c h n i c a l guidance for e s t a b l i s h i n g "Best P r o f e s s i o n a l Judg-
ment" (BPJ) permits for OCPSF product ion a c t i v i t i e s to which t h i s r e g u l a t i o n
does not apply .
Some of the non-OCPSF SIC subgroups were the subject of prior EPA deci-
sions not to establish national regulations for priority pollutants under the
terms of Paragraph 8 of the Settlement Agreement. Such action was taken for
adhesive and sealant manufacturing (SIC 2891), as well as plastics molding and
forming (SIC 3079), paint and ink formulation and printing (which industries
were within SIC 2851, 2893, 2711, 2721, 2731 and I0 other SIC 27 groups) and
soap and detergent manufacturing (SIC 2841). However, it should be noted that
in specific instances where a plant in these categories has OCPSF production
activities, toxic pollutants may be present in the discharge in amounts that
warrant BPJ regulatory control. Moreover, the adhesives and sealants, plas- l
tics molding and forming, and paint and ink formulation and printing Paragraph
8 exclusions do not include process wastewater from the secondary manufacture
of synthetic resins. Similarly, the soaps and detergents Paragraph 8 exclu-
sion does not include process wastewater from the manufacture of surface
active agents (SIC 2843). In these cases, and even in cases where priority
pollutants from OCPSF production covered by other categorical standards (e.g.,
petroleum refining and pharmaceuticals)have been excluded from those regula-
tions under the terms of Paragraph 8 of the Settlement Agreement, BPJ priority
pollutant regulation for individual plants having OCPSF production may be
appropriate.
3. Raw Materials and Product Processes
a. Raw Materials
Synthetic organic chemicals are derivatives of naturally occurring mater-
ials (petroleum, natural gas, and coal) that have undergone at least one chem-
ical reaction. Given the large number of potential starting materials and
111-25

chemical reactions available to the industry, many thousands of organic chemi-
cals are produced by a potentially large number of basic processes having many
variations. Similar considerations also apply to the plastics and synthetic
fibers industry, although ]both the number of starting materials and processes
are more limited. Both organic chemicals and plastics are commercially pro-
duced from six major raw material classifications: methane, ethane, propene,
butanes/butenes, and higher aliphatic and aromatic compounds. This list can
be expanded to eight by further defining the aromatic compounds to include
benzene, toluene, and xylene. These raw materials are derived from natural
gas and petroleum, although a small portion of the aromatic compounds is
derived from coal.
Using these eight basic raw materials (feedstocks) derived from the
petroleum refining industry, process technologies used by the OCPSF industry
lead to the formation of a wide variety of products and intermediates, many of
which are produced from more than one basic raw material either as a primary
reaction product or as a co-product. Furthermore, the reaction product of one
process is frequently used as the raw material for a subsequent process. The
primary products of the organic chemicals industry, for example, are the raw
materials of the plastics and synthetic fibers industry. Furthermore, the
reaction products of one process at a plant are frequently the reactants for
other processes at the same plant, leading to the categorization of a chemical
as a product in one process and a reactant in another. This ambiguity con-
tinues until the manufacture of the ultimate end product, normally at the
fabrication or consumer stage. Many products/intermediates can be made from
more th~n one raw material. Frequently, there are alternate processes by
which a product can be made from the same basic raw material.
A second characteristic of the OCPSF industry that adds to the complexity
of the industry is the high degree of integration in manufacturing units.
Most plants in this industry use several of the eight basic raw materials
derived from petroleum or natural gasto produce a single product.
In addition, many plants do not use the eight basic raw materials, but
rather use products produced at other plants as their raw materials. Rela-
tively few manufacturing facilities are single product/process plants unless
111-26

the final product is near the fabrication or consumer product stage. Any
attempt to define or subcategorize the industry on the basis of the 8 raw
materials would require the establishment of over 256 definitions or subcate-
gories. Schematic diagrams illustrating some of these relationships are shown
in Section V of this document (see Figures V-1 to V-16).
b. Process Chemistry
Chemical and plastics manufacturing plants share an important character-
istic: chemical processes never convert I00 percent of the feedstocks to the
desired products, since the chemical reactions/processes never proceed to
total completion.
Moreover, because there is generally a variety of reactibn pathways
available to reactants, undesirable by-products are often generated. This
produces a mixture of unreacted raw materials, products, and by-products that
must be separated and recovered by operations that generate residues with
little or no commercial value. These losses appear in process wastewater, in
air emissions, or directly as chemical wastes. The specific chemicals that
appear as losses are determined by the feedstock and the process chemistry
imposed upon it. The different combinations of products and production
processes distinguish the wastewater characteristics of one plant from those
of another.
Manufacture of a chemical product necessarily consists of three steps:
i) combination of reactants under suitable conditions to yield the desired
product; 2) separation of the product from the reaction matrix (e.g., by-
products, co-products, reaction solvents); and 3) final purification and/or
disposal of the wastewaters. Pollutants arise from the first step as a
result of alternate reaction pathways; separation of reactants and products
from a reaction mixture is imperfect and both raw materials and products are
typically found in process wastewaters.
Although there is strong economic incentive to recover both raw materials
and products, there is little incentive to recover the myriad of by-products
formed as the result of alternate reaction pathways. An extremely wide
111-27

variety of compounds can form within a given process. Typically, chemical
species do not react via a single reaction pathway; depending on the nature of
the reactive intermediate, there is a variety of pathways that lead to a
series of reaction products. Often, and certainly the case for reactions of
industrial significance, one pathway may be greatly favored over all others,
but never to total exclusion. The direction of reactions in a process
sequence is controlled through careful adjustment and maintenance of condi-
tions in the reaction vessel. The physical condition of species present
(liquid, solid, or gaseous phase), conditions of temperature and pressure, the
presence of solvents and catalysts, and the configuration of process equipment
dictate the kinetic pathway by which a particular reaction will proceed.
Therefore, despite the differences between individual chemical production
plants, all transform one chemical to another by chemical reactions and physi-
cal processes. Although each transformation represents at least one chemical
reaction, production of most of the industry's products can be described by
one or more of the 41 major generalized chemical reactions/processes listed in
Table III-8. Subjecting the basic feedstocks to sequences of these 41 generic
processes produces most commercial organic chemicals and plastics.
Pollutant formation is dependent upon both the raw material and process
chemistry, and broad generalizations regarding raw wastewater loads based
solely on process chemistry are difficult at best. Additionally, OCPSF manu-
facturing processes typically employ unique combinations of the major generic
processes shown in Table III-8 to produce organic chemicals, plastics, and
synthetic fibers that tend to blur any distinctions possible.
c. Product/Processes
Each chemical product may be made by one or more combinations of raw
feedstock and generic process sequences. Specification of the sequence of
product synthesis by identification of the product and the generic process by
which it is produced is called a "product/process." There are, however,
thousands of product/processes within the OCPSF industries. Data gathered on
the nature and quantity of pollutants associated with the manufacture of
specific products within the organic chemicals and plastic/synthetic fibers
III-28

TABLE III-B. MAJOR GENERALIZED CHEMICAL REACTIONS AND PROCESSES
OF THE ORGANIC CHEMICALS, PLASTICS, AND SYNTHETIC FIBERS INDUSTRY
Acid cleavage Alk0xylation Alkylation Amination Ammonolysis Ammoxidation Carbonylation Chlorohydrination Condensation Cracking Crystallization/Distillatlon Cyanation/Hydrocyanatlon Dehydration Dehydrogenation Dehydrohalogenation Distillation Electrohydrodimerization Epoxidation Esterification Etherification Extractive distillation Extraction
Fiber product ion Halogenation Hydra t ion . Hydroacetylat ion Hydrodealkylation Hydrogenation Hydrohalogenation Hydrolysis Isomerizat ion Neut ra l i za t ion Ni t r a t ion Oxidation Oxyhalogenation Oxymation ' Peroxidation Phosgenation Polymerization Pyrolysis Sulfonation
III-29

industries have been indexed for 176 product/processes. These data are dis-
cussed in Section V of this document.
Organic chemical plants vary greatly as to the number of products manu-
factured and processes employed, and may be either vertically or horizontally
integrated. One representative plant, which is both vertically and horizon-
tally integrated, may produce a total of 45 high-volume products with an
additional 300 lower-volume products. In contrast, a specialty chemicals
plant may produce a total of 1,000 different products with 70 to I00 of these
being produced on any given day.
On the other hand, specialty chemicals may involve several chemical
reactions and require a more detailed description. For example, preparation
of toluene diisocyanate involves three synthesis steps -- nitration, hydro-
genation, and phosgenation. This example, in fact, is relatively simple;
manufacture of other specialty chemicals is more complex. Thus, as individual
chemicals become further removed from the feedstock of the industry, more
processes are required to produce them.
In contrast to organic chemicals, plastics and synthetic fibers are
polymeric products. Their manufacture directly utilizes only a small subset
of either the chemicals manufactured or processes used within the OCPSF indus-
try. Such products are manufactured by polymerization processes in which
organic chemicals (monomers) react to form macromolecules or polymers, com-
posed of thousands of monomer units. Reaction conditions are designed to
drive the polymerization as far to completion as practical and to recover
unreacted monomer.
Unless a solvent is used in the polymerization, by-products of polymeric
product manufacturers are usually restricted to the monomer(s) or to oliomers
(a polymer consisting of only a few monomer units). Because the mild reaction
conditions generate few by-products, there is economic incentive to recover
the monomer(s) and oliomers for recycle; the principal yield loss is typically
scrap polymer. Thus, smaller amounts of fewer organic chemical co-products
(pollutants) are generated by the production of polymeric plastics and syn-
thetic fibers than are generated by the manufacture of the monomers and other
organic chemicals.
III-30

For t he p u r p o s e s o f c h a r a c t e r i z i n g the OCPSF i n d u s t r y in t h i s s e c t i o n ,
t he m a n u f a c t u r i n g f a c i l i t i e s a r e a s s i g n e d to one of the f o l l o w i n g t h r e e g r o u p s
based on SIC codes r e p o r t e d in the 1983 S e c t i o n 308 Q u e s t i o n n a i r e .
P l a n t Group Associated SIC Codes Reported
O r g a n i c s P l a n t s 2865, 2869
P l a s t i c s P l a n t s 2821, 2823, 2824
O r g a n i c s and P l a s t i c s One or more from each of- P l a n t s (Mixed) the two groups above
d. I n d u s t r y S t r u c t u r e by P r o d u c t / P r o c e s s
A p o r t i o n of t he b r anched p r o d u c t s t r u c t u r e o f t he OCPSF i n d u s t r y i s
i l l u s t r a t e d in F i g u r e s V-1 to V-16 of S e c t i o n V, which i n c l u d e key OCPSF p r o -
d u c t s and o r g a n i c p r i o r i t y p o l l u t a n t s . The t o t a l p r o d u c t l i n e o f t he i n d u s t r y
i s . c o n s i d e r a b l y more complex , but F i g u r e s V-1 to V-16 i l l u s t r a t e t he a b i l i t y
o f t he o r g a n i c c h e m i c a l s i n d u s t r y to p roduce a p r o d u c t by d i f f e r e n t s y n t h e s i s
r o u t e s . For each o f the p r o d u c t s t h a t a r e p roduced in e x c e s s o f 1 ,000 pounds
pe r y e a r ( a p p r o x i m a t e l y 1 ,500 to 2 ,500 p r o d u c t s ) , t h e r e i s an a v e r a g e o f two
s y n t h e t i c r o u t e s . The more than 20 ,000 compounds t h a t a r e p roduced in s m a l l e r
q u a n t i t i e s by t he i n d u s t r y t end to be more complex m o l e c u l e s t h a t can be s y n -
t h e s i z e d by m u l t i p l e r o u t e s . Because many p r o d u c t s a r e o f t e n p roduced by more
than one m a n u f a c t u r e r , u s i n g the same or d i f f e r e n t s y n t h e t i c r o u t e s , few
p l a n t s have e x a c t l y t he same p r o d u c t / p r o c e s s c o m b i n a t i o n s as o t h e r p l a n t s .
An important characteristic of the OCPSF industry is the degree of verti-
cal integration among manufacturing units at individual plants. Since a
majority of the basic raw materials is derived from petroleum or natural gas,
many of the commodity organic chemical manufacturing plants are either part of
or contiguous to petroleum refineries; most of these plants have the flexi-
bility to produce a wide variety of products.
Relatively few organic chemical manufacturing facilities are single
product/process plants, unless the final product is near the fabrication or
consumer p r o d u c t s t a g e .
III-31

Additionally, many process units are integrated in such a way that pro-
duction levels of related products can be varied as desired over wide ranges.
There can be a wide variation in the size (production capacity) of the manu-
facturing complex, as well as diversity of product/processes. In addition to
variations based on the design capacity and design product mix, economic and
market conditions of both the products and raw materials can greatly influence
the production rate and the processes that are employed even on a relatively
short-term basis.
4. Geographic Distribution
Plant distribution by state is presented in Table 111-9. Most organic
chemical plants are located in coastal regions or on waterways near either
sources of raw materials (especially petrochemicals) or transportation
centers. Plastics and synthetic fibers plants are generally located near
organic chemicals plants to minimize costs of monomer feedstock transporta-
tion. However, a significant number of plastics plants are situated near
product markets (i.e., large population centers) to minimize costs of trans-
porting the products to market.
5. Plant Age
The ages of plants within the OCPSF industry are difficult to define,
since the plants are generally made up of more than one process unit, each
designed to produce different products. As the industry introduces new pro-
ducts and product demand grows, process units are added to a plant. It is not
clear which process should be chosen to define plant age. Typically, the
oldest process in current operation is used to define plant age. Information
concerning plant age was requested in the 1983 "308" Questionnaire.
Respondents were asked to report the year plant operation began and the
year the oldest OCPSF process line still operating went into operation. Table
III-I0 presents the plant distribution of the age of the oldest OCPSF process
line still operating. Table III-I0 indicates that a few plants are currently
operating processes that are over i00 years old. However, over two-thirds of
the plants began operating the oldest process within the past 35 years. In
addition, the startup of new plants has been declining since the early 1970's.
III-32

Organics State* Plants
AL 14 AR 4 CA 19 CO 2 CT 6 DE 5 FL 2 GA 7 IA 2 IL 16 IN 7 KS 3
KY 7 LA 27 MA 4 MD 4 MI 9 MN 1 MO 8 MS 4 MT -NC 13 NE i
NB 2 NJ 70 NY 23 OH 27 OK -OR 1 PA 22 PR -RI 4 SC 17 TN 8 TX 57 UT 2 VA 7 WA 3 WI 4 WV 13
Total 425
*Only states that contain
Source: EPA CWA Section
TABLE 111-9. PLANT DISTRIBUTION BY STATE
Plastics Organics and Plants Plastics Plants Total
4 5 23 2 2 8
40 4 63 1 - 3 8 2 16 2 2 9 6 3 ii 9 2 18 4 - 6
24 15 55 3 2 12 - 1 4 9 5 21
12 8 47 13 3 20 5 1 I0 8 4 21 I i 3 6 I 15 5 3 12 - 1 1
18 I0 41 - - 1 2 - 4
23 16 109 15 5 43 30 12 69 2 - 2 5 4 I0
13 8 43 1 1 2 2 3 9
12 8 37 6 4 18
20 29 106 - - 2
15 2 24 4 i 8 5 3 12 3 6 22
338 177 940
at least one facility are listed.
308 Survey, October 1983.
111-33

TABLE III-i0. DISTRIBUTION OF PLANTS BY AGE OF OLDEST OCPSF PROCESS STILL OPERATING AS OF 1984
Organics Plastics Organics and Plant Age Plants Plants Plastics Plants Total
1-5 24 14 2 40 6-10 37 29 2 68
11-15 40 41 20 101 16-20 55 54 17 126 21-25 44 46 19 109 26-30 50 41 28 119 31-35 42 24 20 86 36-40 24 17 21 62 41-50 30 23 16 69 51-60 23 19 8 50 61-70 28 16 10 54 71-80 16 4 5 25 81-90 3 5 4 12
91-100 3 i 3 7 101-120 5 i - 6
>120 - - i* i*
Data not Available 1 3 1 5
Total 425 338 177 940
*Note: The one plant whose age is >120 is 137 years old.
Source: EPA CWA Section 308 Survey, 1983.
III-34

This major decline in startup of combined organics and plastics plants in
the past I0 years may indicate a trend toward construction of plants that
produce fewer products or many s p e c i a l t y products geared toward s p e c i f i c mar-
ke t s , s ince the combined p l an t s tend to be the l a r g e r , mu l t i -p roduc t , v e r t i -
c a l l y i n t e g r a t e d p l a n t s .
6. Plant Size
Although plant size may be defined in many ways, including number of
employees, number of product/processes, plant capacity, production volume, and
sales volume, none of these factors alone is sufficient to define plant size;
each is discussed in this subsection.
a. Number of Employees
Perhaps the most obvious definition of plant size would be the number of
workers employed. However, continuous process plants producing high-volume
commodity chemicals typically employ fewer workers per unit of production than
do plants producing specialty (relatively low-volume) chemicals. Table III-ll
presents the plant distribution by the average number of employees engaged in
OCPSF operations during 1982. These data were obtained from the 1983 Section
308 Questionnaire.
b. Number of Product /Processes
Plant size may also be expressed in terms of the number of product/
processes that are operated at a plant. Analysis of the number of product/
processes for 546 primary producers in the edited 1983 Section 308 Question-
naire data base is presented in Table III-12. The table generally includes
only direct and indirect discharge facilities whose total plant production is
greater than 50 percent OCPSF products. Detailed product/process information
was not collected from zero discharge or secondary OCPSF manufacturing
facilities.
The data presented in Table 111-12 may understate the number of distinct
product/processes because plants were requested to group certain products that
were listed in the questionnaire instructions or that individually constituted
less than i percent of the total plant production. For example, many dye
111-35

TABLE III-ll. PLANT DISTRIBUTION BY NUMBER OF EMPLOYEES
Number of Organics Plastics Organics and Employees Plants Plants Plastics Plants Total
1-105 70 73 19 162 11-20 55 58 16 129 21-30 41 32 ii 94 31-40 39 26 l0 75 41-50 34 23 4 61
51-100 64 45 21 130 101-200 53 27 14 94 201-500 36 23 30 89
501-1000 7 9 19 35 1001-2000 5 9 17 31 2001-5000 - 7 8 15
>5000 - - *I *i
Data not A v a i l a b l e II 6 7 24
T o t a l 425 338 177 940
*Note: The only plasnt with >5,000 employees hasd 11,262 employees.
Source: EPA CWA Section 308 Survey, 1983.
111-36

TABLE III-12. PLANT DISTRIBUTION BY NUMBER OF PRODUCT/PROCESSES AND PRODUCT GROUPS FOR PRIMARY PRODUCERS THAT ARE ALSO
DIRECT AND/OR INDIRECT DISCHARGERS*
Number of Organics Plastics Organicsand Product/Processes Plants Plants Plastics Plants Total
1 41 72 113 2 23 30 5 58 3 30 27 15 72 4 24 17 16 57 5 15 8 13 36 6 34 I0 ii 55 7 18 6 13 37 8 Ii 2 - 13 9 6 2 3 ii
i0 16 - 5 21 11-12 12 1 13 26 13-15 9 - 6 15 16-20 4 - 7 II 21-30 7 - 12 19 31-40 - - 1 1 41-50 - - 1 (50) 1
Total 250 175 121 546
*Table consists of plants that completed Part B of the 1983 Section 308 Questionnaire.
III-37

plants reported individual dye products, while others reported types of dyes
such as Azo- or Vat-dyes as one product. A review of Table III-12 shows that:
plastics plants tend to have fewer product/processes with 88 percent reporting
5 or fewer; organics plants have a wider range of number of product/processes
with 87 percent reporting lO or fewer; and that plants manufacturing both
organics and plastics, although fewer in number, tend to have more product/
processes with 88 percent reporting 20 or fewer.
c. Plant Capacity and Production Volume
For the purposes of this report, plant size cannot be sufficiently de-
fined based on design capacity due to the often broad differences between a
plant's design capacity or rate and its average production rate per year.
Plants continuously producing high-volume chemicals (generally employing
relatively few workers), may be physically smaller than plants producing
lower-volume specialty chemicals by batch processes. Table III-13 presents
the distribution of plant OCPSF production and total production for the year
1982 with plants sorted by their primary SIC code. The rates given are total
(all products) production for the plant, not just the product SIC group under
which they are listed. All data are from the 1983 Section 308 Questionnaire.
Additional production information is available in the Economic Impact Analysis
Report. Even though the table includes 38 plants that have been determined to
be non-scope facilities, the general trends reflected in the table should
apply to the final list of 940 scope facilities.
d. Plant Sales Volume
Sales volume alone is not necessarily an accurate indicator of plant
size. High-volume commodity chemicals are typically less expensive than
specialty chemicals. However, sales volume or production volume in terms of
dollars is very useful in describing plant size in economic terms. This
definition of size has been used in the economic analysis for this OCPSF rule.
Table III-14 presents the distribution of plants by OCPSF total 1982 sales
value with plants sorted by their major SIC code. These 1983 Section 308
Questionnaire data are presented in the same format as production volumes
above. Additional sales data are available in the Economic Impact Analysis
Report. Like Table III-13, Table III-14 includes 38 facilities that have been
determined to be non-scope facilities.
III-38

TABLE III-13. DISTRIBUTION OF 1982 PLANT PRODUCTION 0UANTITY BY OCPSF SIC GROUP
No SIC 2821 2823 2824 2865 2869 All All
No. of No. of No. of No. of No. of No. of No. of Plants Plants Plants Plants Plants Plants Plants Percent
OCPSF Production (Million ibs.)
No data 39 3 2 - 3 47 4.8
0-.2 - I0 - 6 29 45 4.6
.2-1 - 22 1 17 22 62 6.3
I-2 - 18 - 5 19 42 4.3
2-10 - 67 6 25 75 174 17.8
10-20 - 60 2 i0 37 109 II.I
20-I00 - 120 1 12 14 109 256 26.2
I00 Plus - 83 4 18 34 104 243 24.8
All 39 383 6 41 IIi 398 9781 i00.0
Total Production (Million ibs.)
Nodata 12 3 - 2 - 3 20 2.0
0-.2 2 6 - - 3 22 33 3.4
.2-1 2 12 - I 14 12 41 4.2
1-2 1 12 - - 7 Ii 31 3.2
2-10 12 40 I 6 23 65 147 15.0
10-20 5 50 - 2 Ii 33 i01 10.3
20-100 3 151 1 ii 14 107 287 29.3
I00 Plus 2 109 4 19 39 145 318 32.5
All 39 383 6 41 iii 398 9781 i00.0
11ncludes 38 plants that have been determined to be non-scope facilities.
Source: OCPSF Economic Impact Analysis.
III-39

TABLE III-14. DISTRIBUTION OF 1982 PLANT SALES VALUE BY OCPSF SiC GROUP
No SIC 2821 2823 2824 2865 2869 All All
No. of No. of No. of No. of No. of No. of No. of Plants Plants Plants Plants Plants Plants Plants Percent
OCPSF P r o d u c t i o n (Million $)
No data 39 II - 2 - 8 60 6.1
0-I - 34 - - 5 39 78 8.0
1-5 - 76 - 2 23 56 157 16.1
5-10 - 61 1 3 Ii 47 123 12.6
10-50 - 128 1 8 45 132 314 32.1
50-100 - 33 - 5 I0 43 91 9.3
100-500 - 38 4 20 17 57 136 13.9
500 Plus - 2 - 1 - 16 19 1.9
All 39 383 6 41 iii 398 9781 I00.0
Total Sales Value (Million $)
No data 13 5 - 2 - 6 26. 2.6
0-i 2 15 - - 5 26 48 4.9
1-5 9 32 - 1 15 45 102 10.4
5-10 3 56 1 3 13 33 109 II.I
10-50 9 157 1 9 47 143 366 37.4
50-100 2 58 - 5 13 46 124 12.7
100-500 1 50 4 20 18 82 175 17.9
500 Plus - I0 - 1 - 17 28 2.9
All 39 383 6 41 III 398 9781 i00.0
11ncludes 38 plants that have been determined to be non-scope facilities.
Source: OCPSF Economic Impact Analysis.
III-40

7. Mode of Discharge ':
There are three basic discharge modes utilized by the industry: direct,
indirect, and zero or alternative disposal/discharge. Direct dischargers are
plants that produce a contaminated process wastewater, treated or untreated,
that is discharged directly into a surface water. Plants that produce only
noncontact cooling water and/or sanitary sewage effluents (non-process waste-
water) are not considered to be direct dischargers of OCPSF process wastewater
for purposes of this report. Indirect dischargers are plants that route their
OCPSF process wastewater effluents to POTWs. Zero or alternative disposal/
dischargers are plants that discharge no OCPSF process wastewater to surface
streams or to POTWs. For the purposes of this report, these include plants
that generate no process wastewaters, plants that recycle all contaminated
waters, and plants that use some kind of alternative disposal technology
(e.g., deep well injection, incineration, contractor,removal, etc).
The d i s c h a r g e o f p r o c e s s w a s t e w a t e r s i n t o the sy s t em of an a d j o i n i n g
m a n u f a c t u r i n g f a c i l i t y or t ~ ' a t r e a t m e n t sy s t em no t owned by a gove rnmen t
e n t i t y i s n o t c o n s i d e r e d i n d i r e c t d i s c h a r g e , but i s t e rmed o f f - s i t e t r e a t m e n t
and i s c o n s i d e r e d an a l t e r n a t i v e d i s p o s a l method. Tab le I I I - 1 5 shows t he
p l a n t d i s t r i b u t i o n based on mode of d i s c h a r g e . The t a b l e a l s o shows t he
d i s t r i b u t i o n be tween p r i m a r y p r o d u c e r s ( i . e . , p l a n t s 'whose OCPSF p r o d u c t i o n
e x c e e d s 50 p e r c e n t o f t he p l a n t t o t a l ) and s e c o n d a r y p r o d u c e r s .
Fifteen plants discharge treated and/or untreated wastewater both di-
rectly and indirectly. In general, these plants discharge high-strength or
"difficult to treat" wastewater to POTWs and direct discharge more easily
treated low-strength wastewater.
C. DATA BASE DESCRIPTION
I. 1983 Section 308 Questionnaire Data Base
In the preamble to the March 21, 1983 proposed regulation, the Agency
recognized the need to gather additional data to ensure that the final regula-
tlon is based upon information that represents the entire industry and to
assess wastewater treatment installed since 1977. Therefore, the Agency
111-41
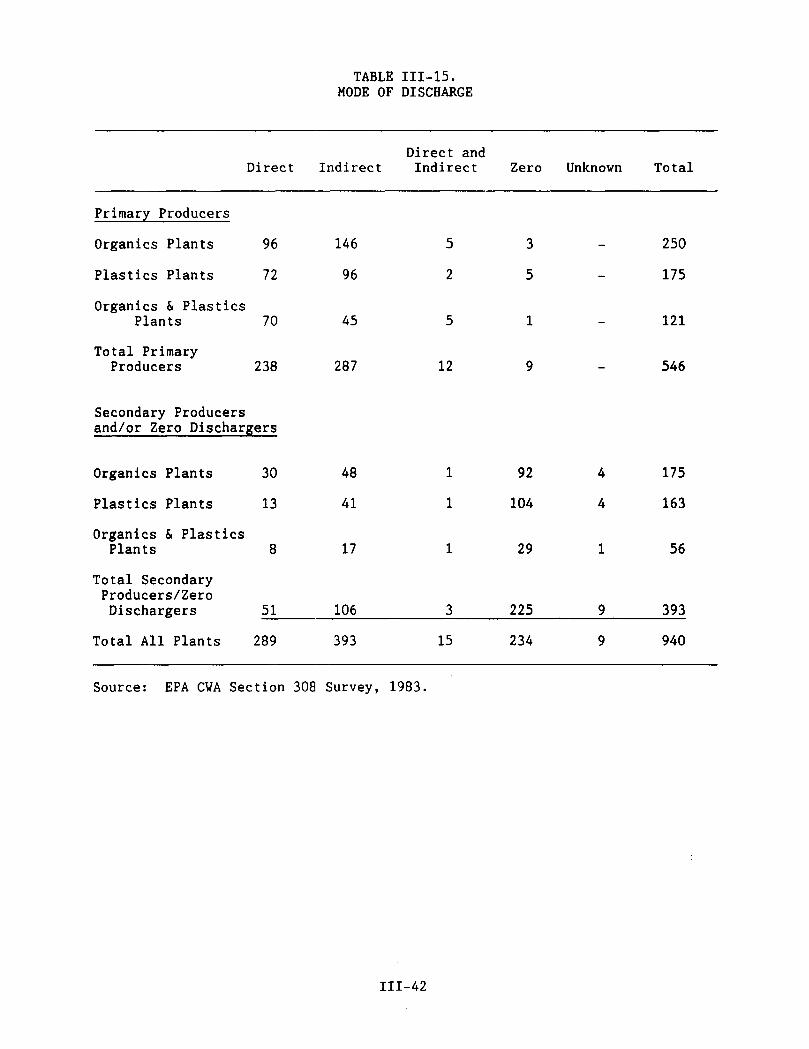
TABLE III-15. MODE OF DISCHARGE
Direct Indirect Direct and Indirect Zero Unknown Total
Primary Producers
Organics Plants 96 146 5 3 250
Plastics Plants 72 96 2 5 175
Organics & Plastics Plants 70 45 5 1 121
Total Primary Producers 238 287 12 9 546
Secondary Producers and/or Zero Dischargers
Organics Plants 30 48 1 92 4 175
Plastics Plants 13 41 1 104 4 163
Organics & Plastics Plants 8 17 1 29 i 56
Total Secondary Producers/Zero Dischargers 51 106 3 225 9 393
Total All Plants 289 393 15 234 9 940
Source: EPA CWA Section 308 Survey, 1983.
111-42

conducted an extensive data-gathering program to improve the coverage of all
types of OCPSF manufacturers. A comprehensive Clean Water Act Section 308
Questionnaire was developed and distributed in 1983. The mailing list was
compiled from the following references that identify manufacturers of OCPSF
products:
• Economic Information Service
• SRI Directory of Chemical Manufacturers
• Dun and Bradstreet Middle Market Directory
• Moody's Industrial Manual
• Standard and Poor's Index
• Thomas Register
• Red Book of Plastics Manufacturers
• 1976 and 1977 308 Questionnaire Data Bases
• Plastics Manufacturers Telephone Survey of 301 Plants.
In October 1983, the Agency sent a General Questionnaire to 2,840 facili-
ties and corporate headquarters to obtain information regarding individual
plant characteristics, wastewater treatment efficiency, and the statutory
factors expected to vary from plant to plant. The General Questionnnaire
consisted of three parts: Part I (General Profile), Part II (Detailed Produc-
tion Information), and Part III (Wastewater Treatment Technology, Disposal
Techniques, and Analytical Data Summaries).
Some plants that received the Section308 Questionnaire had OCPSF
operations that were a minor portion of their principal production activities
and related wastewater streams. The data collected from these facilities
allow the Agency to characterize properly the impacts of ancillary (secondary)
OCPSF production. Generally, if a plant's 1982 OCPSF production was less than
50 percent of the total facility production (secondary manufacturer), then
only Part I of the questionnaire was completed.
Part I identified the plant, determined whether the plant conducted
activities relevant to the survey, and solicited general data (plant age,
ownership, operating status, permit numbers, etc.). General OCPSF and non-
OCPSF production and flow information was collected for all plant manufactur-
ing activities. This part also requested economic information, including data
III-43

on shipments and sales by product groups, as well as data on plant employment
and capital expenditures.
Part I determined whetlher a respondent needed to complete Parts II and
III (i.e., whether the plant is a primary or secondary producer of OCPSF pro-
ducts, whether the plant discharges wastewater, and for secondary producers,
whether the plant segregates OCPSF process wastewaters). For those plants
returning only the General Profile, Part I identified the amounts of process
wastewater generated, in-place wastewater treatment technologies, wastewater
characteristics, and disposal techniques.
Part II requested detailed 1980 production information for 249 specific
OCPSF products, 99 specific OCPSF product groups, and OCPSF products that
constituted more than 1 percent of total plant production. Less detailed
information was requested for the facility's remaining OCPSF and non-OCPSF
produc'tion. Part II also requested information on the use or known presence
of the priority pollutants for each OCPSF product/process or product group.
Part III requested detailed information on plant wastewater sources and flows,
technology installed, treatment system performance, and disposal techniques.
Responses to economic and sales items in Part I pertained to calendar
year 1982, which were readily available, since the plants were required to
submit detailed 1982 information to the Bureau of the Census. This reduced
the paperwork burden for responding plants.
The remainder of the Section 308 Ouestionnalre, however, requested data
for 1980, a more representative production year. The Agency believed that
treatment performance in 1982 would be unrepresentative of treatment during
more typical production periods. This is because decreased production nor-
mally results in decreased wastewater generation. With lower volumes Of
wastewater being treated, plants in the industry might be achieving levels of
effluent quality that they could not attain during periods of higher produc-
tion. The year 1980 was selected in consultation with industry as representa-
tive of operations during more normal production periods, but recent enough to
identify most new treatment installed by the industry since 1977. The indus-
try representatives did not assert that significant new treatment had been
installed since 1980.
III-44

The S e c t i o n 308 Q u e s t i o n n a i r e s were de s igned to be ~ncoded i n t o a
computer d a t a base d i r e c t l y from the q u e s t i o n n a i r e s . To e n s u r e t h a t the ques -
t i o n n a i r e s were f i l l e d out c o m p l e t e l y and c o r r e c t l y a copy of each q u e s t i o n -
n a i r e was r ev iewed by e n g i n e e r s . Due to the d i v e r s i t y and c o m p l e x i t y of the
OCPSF i n d u s t r y , a number of problems were e n c o u n t e r e d in r e v i e w i n g the ques -
t i o n n a i r e s . Some of the problems e n c o u n t e r e d i n c l u d e d i n c o r r e c t u n i t s of
measure , i n c o m p l e t e r e s p o n s e s , m i s i n t e r p r e t a t i o n of d a t a r e q u e s t e d , c o n f l i c t -
ing d a t a f o r d i f f e r e n t q u e s t i o n s , poo l i ng of d a t a f o r s e p a r a t e q u e s t i o n s , and
unusua l c i r c u m s t a n c e s a t the p l a n t .
Solutions to these problem included recalculation of the data, followup
contacts for clarification, or in some cases rejection of the data. Some of
these problems may be explained in part by the fact that some companies simply
did not keep records of the information that was requested by the question-
naire, and consequently could not respond fully on all items of interest.
The d a t a were encoded onto computer t apes from the c o r r e c t e d c o p i e s of
the q u e s t i o n n a i r e s . Each q u e s t i o n n a i r e was double e n t e r e d by s e p a r a t e i n d i -
v i d u a l s to h e l p e l i m i n a t e keypunch e r r o r s . The d a t a were then s o r t e d i n t o
s e p a r a t e compute r f i l e s f o r each q u e s t i o n .
The data in each question-file were then verified by various means.
Verification methods included but were not limited to: visual inspection of
the file printout, checks for missing data, checks for conflicting data, and
checks for unusually high or low values. In addition, many of the engineering
analyses required a more detailed review of the data, plus the execution of
the analyses often exposed faulty data through erroneous results or the in-
ability of a program to run. Wherever suspect data were identified, they were
referred to the review engineers who then took appropriate action to resolve
the problem. The economic study assessments also determined that some plants
that responded as a scope facility should be considered non-scope. A separate
data file called the Master Analysis File has been created from the 308
Questionnaire data. This data file contains only data that are useful in the
engineering analyses and are used for that purpose.
III-45

The Section 308 Questionnaires were mailed in October 1983. In February
1984, Section 308 followup letters were sent to 914 nonrespondents. A total
of 940 questionnaire responses provide the basis for the final technical and
economic studies. A total of 1,574 responses were from facilities that were
determined to be outside of the scope of the final regulations (e.g., sales
offices, warehouses, chemical formulators, non-scope production, etc.); 166
were returned by the Post Office; and 160 did not respond. A followup
telephone survey of 52 randomly selected nonrespondents concluded that over 90
percent of the nonrespondents were not manufacturers of OCPSF products.
In addition, a Supplemental Questionnaire was sent to 84 facilities known
to have installed selected wastewater treatment unit operations. Detailed
design and cost information was requested for four major treatment components
commonly used to treat OCPSF wastewaters (i.e., biological treatment, steam
stripping, solvent extraction, and granular activated carbon) and summary
design and cost information for other wastewater and sludge treatment compon-
ents. The questionnaires also collected available treatment system perform-
ance data for in-plant wastewater control or treatment unit operations, in-
fluent to the main wastewater treatment system, intermediate waste stream
sampling locations, and final effluent from the main wastewater treatment
system. Unlike the General Questionnaire, it asked for individual daily data
rather than summary data. After a followup effort 64 plants responded with
useful data and information.
2. Daily Data Base Development
One of the major purposes of this study is the development of long-term
daily pollutant data. These data are required to derive variability factors
that characterize wastewater treatment performance and provide the basis for
derivation of proposed effluent limitations guidelines and standards. Hun-
dreds of thousands of data points have been collected, analyzed, and entered
into the computer.
The first effort at gathering daily data involved the BPT and BAT mail-
ings in 1976 and 1977. These questionnaires asked each plant for backup
information to support the long-term pollutant values reported. Many plants
III-46

submitted influent and effluent daily observations convering the time period
of interest in the BPT questionnaire (January l, 1976 to September 30, 1976).
Additionally, there were other conventional and nonconventional pollutant
daily data in the files from the period of verification sampling. Some plants
also submitted additional data with their public comments for the 1983 pro-
posed requlations. Additional data were collected through the supplemental
1983 Section 308 Supplemental Questionnaires.
3. BAT Data Base
The BAT Data Base contains long- and short-term priority pollutant data
used in the development of effluent limits. The data base consists primarily
of end-of-pipe wastewater treatment system influent and effluent data, but
also includes other types of samples. These other samples include individual
process streams, intermediate samples within the end-of-pipe system, and in-
fluent and effluent samples of individual treatment units, especially those
under consideration as BAT technology.
Data sources include both EPA sampling programs and data supplied by
0CPSF plants. In all cases, the analytical data have been considered accept-
able for limitations development only if the QA/0C procedures were documented
and in the case o£ organic pollutants the analyses were confirmed by GC/MS or
known to be present based on process chemistry. The major sources of data are
listed below:
• EPA Screening Sampling Program (1977 to 1979)
• EPA Verification Sampling Program (1978 to 1980)
• EPA/CMA Five-Plant Study (1980 to 1981)
• EPA 12-Plant Sampling Program (1983 to 1984)
• Plant Submissions Accompanying Comments to the March 1983 Proposed Regulations
• Plant Submissions Accompanying Comments to the July and October 1985 and December 1986 Notices of New Information
• Supplemental Sections to the 1983 Section 308 Questionnaire.
111-47

The d a t a base d e s i g n a t i o n s used th roughou t t h i s r e p o r t a r e l i s t e d in
Tab le I I I - 1 6 . The f o u r EPA sampl ing programs a r e d i s c u s s e d in g r e a t e r d e t a i l
in S e c t i o n s V and VII of t h i s r e p o r t .
III-48

TABLE III-16. DATA BASE DESIGNATION
Data Base F i l e Name D e s c r i p t i o n
308 Data Base Data base Containing all data extracted from 1983 Section 308 Questionnaires
Master Analysis File (MAF) Contains data excerpted from the 1983 Section 308 Data Base (includes conventional pollutant parameter long-term average data)
Daily Data Base Contains long-term conventional pollutant effluent d a i l y data from 69 plants
BAT Data Base Contains long- and short-term treatment system influent and effluent daily data for priority pollutants
Master Process File (MPF) Contains priority pollutant raw wastewater characterization data for 176 OCPSF product/processes
IIi-49

SECTION IV
SUBCATEGORIZATION
A. INTRODUCTION
Sections 304(b)(1)(B) and 304(b)(4)(B) of the Clean Water Act (CVA) re-
quire the U.S. Environmental Protection Agency (EPA) to assess certain factors
in establishing effluent limitations guidelines based on the best practicable
control technology (BPT) and best available technology economically achievable
(BAT). These factors include the age of equipment and facilities involved;
the manufacturing process employed; the engineering aspects of the application
of recommended control technologies,.including process changes and in-plant
controls; nonwater quality environmental impacts, including energy require-
ments; and such other factors as deemed appropriate by the Administrator.
To accommodate these factors, it may be necessary to divide a major
industry into a number of subcategories of plants sharing some common charac-
teristics. This allows the establishment of uniform national effluent limita-
tions guidelines and standards, While at the same time accounting for the
particular characteristics of different groups of facilities.
The factors considered for technical significance in the subcategoriza-
tlon of the Organic Chemicals and Plastics and Synthetics Fibers (OCPSF) point
source categories include:
• M a n u f a c t u r i n g p r o d u c t / p r o c e s s e s
• Raw m a t e r i a l s
• W a s t e w a t e r c h a r a c t e r i s t i c s
• F a c i l i t y s i z e
• G e o g r a p h i c a l l o c a t i o n
• Age of facility and equipment
• Treatability
• Nonwater quality environmental impacts
• Energy requirements.
IV-I

The impacts of these factors have been evaluated to determine if sub-
categorization is necessary or feasible. These evaluations, which are dis-
cussed in detail in the following sections, result in the following final
subcategories:
o BPT: Rayon, other f ibe r s , thermoplast ic r e s ins , thermoset t ing r e s ins , commodity organics , bulk organics , and s p e c i a l t y organics
o BAT: Subcategory One (end-of-pipe b io log ica l treatment) and Subcate-gory Two (non-end-of-pipe b io log ica l t reatment) .
B. BACKGROUND
In the March 21, 1983, Federal Regis ter , EPA proposed a subcategor iza t ion
approach for regulation of the OCPSF industry. A Notice of Availability (NOA)
appeared in the July 17, 1985, Federal Register, which addressed a number of
concerns raised by industry relating to the March 1983 proposal. Another NOA
appeared in the December 8, 1986, Federal Register, which presented an altern-
ative subcategorization approach. This section discusses the subcategoriza-
tion methodologies for the proposal and the two NOAs and presents the concerns
and issues raised during the public comment periods for each.
I. March 21, 1983 Proposal
The March 21, 1983, proposal established four subcategories (Plastics
Only, Oxidation, Type I, and Other Discharges) for BPT effluent limitations,
which were based on generic chemical reactions such as oxidation, peroxida-
tion, acid cleavage, and esterfication and whether a plant produced plastics
or organics. This approach was found to be too cumbersome to implement be-
cause the process information necessary to place a plant in a subcategory was
not readily available. Also, a major problem raised by both industry and
regulatory agencies in public comments on the proposal was that a plant could
shift from one subcategory to another simply by changing a single product/
process.
The March 21, 1983, proposal also established two subcategories (Plastics
Only and Not Plastics Only) for BAT effluent limitations. The rationale for
this two-subcategory approach was that plants in the Plastics Only subcategory
tended to have fewer toxic pollutants present and less significant levels than
IV-2

t he r e m a i n i n g d i s c h a r g e s , a l l o f which r e s u l t from the m a n u f a c t u r e o f a t l e a s t
some o r g a n i c c h e m i c a l s which were c o n t a i n e d in the Not P l a s t i c s Only s u b c a t -
e g o r y . The Agency a l s o announced i t s i n t e n t i o n to e s t a b l i s h a s e p a r a t e BAT
s u b c a t e g o r y w i t h d i f f e r e n t z i n c l i m i t a t i o n s fo r t h o s e p l a n t s m a n u f a c t u r i n g
rayon and u t i l i z i n g t he v i s c o s e p r o c e s s .
After reviewing public comments and evaluating its proposed subcategori-
zation methodology, the Agency decided to revise its approach and developed
another subcategorization approach, which was published for public comment in
the July 17, 1985, Federal Register NOA. This revised methodology is dis-
cussed in the following section.
2. July 17, 1985, Federal Register NOA
The July 17, 1985, Federal Register NOA sought to correct some of the
difficulties described above by categorizing plants according to the products
accounting for most of their production, under this subcategorization strat-
egy, every plant was to be put into a single categoric grouping. The subcate-
gories in this approach were as follows:
I. Thermoplastics Only (SIC 28213)
2. Thermosets (SIC 28214 plus Organics)
3. Rayon (Viscose)
4. Other Fibers (SIC 2824 and 2823 plus Organics)
5. Thermoplastics and Organics (SIC 28213 and 2865 or 2869)
6. Commodity Organics
7. Bulk Organics
8., Specialty Organics.
These eight subcategories were defined as follows:
@ Subcategories 1 and 3 were defined as facilities that produced at least 95 percent thermoplastics and rayon, respectively.
Subcategories 2 and 4 were for facilities whose productio n was at least 95 percent of the subcategory heading or facilities whose combi- nation of organic chemicals and the subcategory heading represented at least 95 percent of the plant production.
IV-3

Subcategory 5 represented plants with a production that was at least 95 percent thermoplastic and organic products with neither product group representing 95 percent production. This group was interpreted to be vertically integrated plants producing organics, which were then used primarily for the production of thermoplastics.
Subcategories 6 through 8 identified the relatively pure organics plants that had a production that was at least 95 percent organics. Organics production was further subdivided according to volume.
- Commodity: Those chemicals produced nationally in amounts greater than or equal to i billion pounds per year.
- Bulk: Those chemicals produced nationally in amounts less than 1 billion but more than 40 million pounds per year.
- Specialty: Those chemicals produced nationally in amounts less than or equal to 40 million pounds per year.
Plants were assigned to these categories based on their mix of produc-
tion; plants having at least 75 percent commodity or specialty were assigned
to these respective subcategories. Remaining plants were assigned to the bulk
subcategory. Thus, a plant might be assigned to the bulk subcategory, but it
could also manufacture both commodity and specialty chemicals.
The July 17, 1985, Federal Register NOA also announced the Agency's in-
tentions to establish a single set of BAT effluent limitations that would be
applicable to all OCPSF facilities rather than the two subcategory approach
presented in the March 21, 1983, proposal. The rationale for this "one BAT
subcategory" approach was that the available data for BAT show that plants in
differing BPT subcategories can achieve similar low toxic pollutant effluent
concentrations by installing the best available treatment components. The
Agency also again announced its intention to establish a separate BAT subcate-
gory with different zinc limitations for those plants manufacturing rayon and
utilizing the viscose process.
While the subcategories developed for the July 17, 1985, Federal Register
NOA were more useful than those established for the March 21, 1983, proposal,
the revised subcategorization approach was still criticized by OCPSF trade
associations and companies for the reasons summarized below.
IV-4

a. Multiple Subcategory Plants
A significant number of the plants cannot be classified according to the
July 17, 1985, Federal Register N0A subcategorization approach for the follow-
ing reasons:
• No single subcategory accounts for the majority of the production at a number of plants. ' .
• No allowance was made in the thermoplastics and organics subcategory for variations in the types of organic products produced. From analy- sis of the data, plants with high specialty volume can beexpected to have higher BOD effluent concentrations when compared to plants with
5 high commodity production.
• Plants could change their subcategory classifications by making small changes in the proportion of products produced.
b. Low Flow/High F10w Plants
In the March 21, 1983, Proposal, the Agency incorporated a low flow/high
flow cutoff in one of its proposed subcategories, because flow was found to be
a statistically significant subcategorization factor. This adjustment was not
made in the July 17, 1985, Federal Register NOA because flow was not found to
be a statistically significant factor for the revised subcategorization
approach. However, the Agency received numerous public comments requesting
that consideration be given to plants that conserve water and are low water
users.
All the above considerations led the Agency to modify the July 17, 1985,
subcategorization apProach to accommodate these issues while trying to pre-
serve a workable subcategorization and guideline structure.
3. December 8, 1986, Federal Register
The Agency again revised its subcategorization methodology and presented
it in the December 8, 1986, Federal Register NOA. Initially, a regulatory
approach that would have created plant specific long-term averages based on a
flow proportioning of individual product subcategory long-term averages was
attempted. This would have eliminated a number of difficulties associated
with multiple subcategory plants and was consistent with current permit writ-
ing "building block" practices.
IV-5

Production/flow information had been requested from industry in the 1983
308 Questionnaire Survey in anticipation of implementing such an approach.
Unfortunately, much of the production/flow information (when supplied) was
either estimated or grouped with other product/process flows and was con-
sidered too inaccurate or nebulous for subcategorization purposes. However,
since relatively accurate production volume information by product/process or
product groups was available, a regulatory approach that proportions the vari-
ous subcategory long-term averages for each plant based on the reported pro-
portion of production by product group was developed. This revised subcate-
gorization approach incorporated essentially the same product-based subcate-
gories as presented in the July 17, 1985, Federal Register NOA:
i. Thermoplastics (SIC 28213)
2. Thermosets (SIC 28214)
3. Rayon (Viscose Process)
4. Other Fibers (SIC 2823 and 2824)
5. Commodity Organics (SIC 2865 and 2869)
6. Bulk Organics (SIC 2865 and 2869)
7. Specialty Organics (SIC 2865 and 2869).
While the prior subcategorization approaches incorporated subcategories that
included both a major production group and other secondary production, these
seven subcategories represented only single production groups, while plants
that have production that falls into more than one production groupwere
handled by a regression model that emulates the production proportioning used
by permit writers. This regression model was as follows:
7
In(BOD i ) = a + Z w..'T. + B'[in(flowi) ] + D'I5. + e. j=:l 13 3 l l
where In(BOD=), w , in(flow ), and 15. are plant-specific data available in'the ~ta base (~or plant ~), and the parameters a, Tj, and D are values estimated from the data base using standard statistical regression methods. Definitions of the terms in this regression equation (and also used in subsequent equations) are as follows:
In(BOD i ) = natural logarithm (in) of the 1980 annual arithmetic average BOD_ effluent in mg/1, which has been adjusted for dilution with uncontaminated miscellaneous wastewaters (as described in Section VII), for plant i.
IV-6

in(flow i ) = in(total flow (MGD)), corrected for non-process waste streams) for plant i, with associated coefficient B.
15 i = indicator variable for plant i
= i, if plant i meets 95 percent BOD 5 removal or at most 50 mg/l BOD S effluent editing criteria (95/50), for plants with biological treatment and polishing ponds,
• = O, otherwise
w, i]. = proportion of OCPSF 1980 production from plant i from sub-
category j
e,x = statistical error term associated with plant i
The seven subcategories, represented by the subscript j, are as follows:
j=l: Thermoplastics
j=2: Thermosets
j=3: Rayon
j=4: Other Fibers
j=5: Commodity Organics
j=6: Bulk Organics
j=7: Specialty Organics.
The coefficients Tj and D are related to the intercept of this equation
(denoted by "a"). The T. coefficients are subcategorical deviations from the 3
7 overall intercept "a." The restriction E T.=O is placed on the regression
j=l
equation, as discussed in Appendix IV-A, to allow for estimation of these
values by standard multiple regression methods. The coefficient D represents
the difference between the intercept of this equation (based on all full-
response, direct discharge OCPSF plants that have at least biological treat-
ment in place and have provided BOD 5 effluent, subcategorical production, and
flow data) and the intercept based on the subset of these plants that have
biological treatment and polishing ponds and meet the 95/50 editing criteria
used by EPA at the time of the 1986 NOA.
IV-7

In addition to its production proportioning approach, the Agency also
included a flow adjustment factor in its regression model in an attempt to
respond to public comments criticizing its elimination in the July 17, 1985,
subcategorization approach. When included in the regression model and tested
statistically, the flow adjustment coefficient, B, was found to be statistic-
ally significant in explaining plant-to-plant variation of reported average
BOD 5 effluent.
A regression model relating effluent TSS to effluent BOD 5 was also devel-
oped to calculate estimated TSS effluent long-term averages for individual
plants, as follows:
In(TSS i) = a + b'[In(BOD i)] + e i
where:
in(TSSi) = in(1980 annual arithmetic average TSS effluent in mg/l, which has been adjusted for dilution with uncontaminated misce].laneous wastewaters, as described in Section VII), for p].ant i
e = statistical error term associated with plant i. i
The data base used to determine these long-term averages included all
full-response, direct discharge OCPSF plants with biological treatment and
polishing ponds that met the 95/50 editing criteria for BOD S described pre-
viously and that had TSS effluent concentrations of at most 100 mg/1. The
variables ln(BODi) [defined previously] and ln(TSSi) are plant-specific data
available in this data base, and the intercept and slope parameters a and b,
respectively, are values estimated from the data base using standard statis- |
tical regression methods.
The December 8, 1986, Federal Register NOA retained the "one BAT subcate-
gory" approach along with the separate subcategory and different zinc limita-
tions for rayon manufacturer's utilizing the viscose process.
While the revised subcategorization approach was yet another improvement
on previous subcategorizations, a number of major issues were raised during
the public comment period for the December 8, 1986, Federal Register NOA,
which are detailed below.
IV-8

a. Flow A d j u s t m e n t F a c t o r
Many comments were r e c e i v e d which s t a t e d t h a t t he f low a d j u s t m e n t f a c t o r
was no t t h e e q u i t a b l e f low c o r r e c t i o n t h a t t he Agency i n t e n d e d , s i n c e i t u t i l -
i z e d t o t a l w a s t e w a t e r f low in i t s a d j u s t m e n t t h a t would p e n a l i z e h i g h -
p r o d u c t i o n f a c i l i t i e s w i t h h i g h f lows and p l a n t s w i t h c e r t a i n p r o d u c t /
p r o c e s s e s t h a t t y p i c a l l y u t i l i z e and d i s c h a r g e l a r g e volumes o f w a s t e w a t e r
( e . g . , r ayon and f i b e r s p l a n t s ) . Commenters s u g g e s t e d t h a t t he f low a d j u s t -
ment f a c t o r be changed to a c c o u n t f o r p r o d u c t i o n volume a t each f a c i l i t y ;
i . e . , u se a g a l l o n of w a s t e w a t e r / p o u n d p r o d u c t i o n a d j u s t m e n t f a c t o r .
A r e l a t e d i s s u e r a i s e d by commenters a l s o c o n c e r n e d t h e f low a d j u s t m e n t
f a c t o r : a f low a d j u s t m e n t c o e f f i c i e n t based on t he use o f a l l OCPSF p l a n t s
w i t h b i o l o g i c a l t r e a t m e n t , r e g a r d l e s s o f e f f l u e n t BODs, c a u s e s a s m a l l g roup
of p l a n t s e x h i b i t i n g h i g h e f f l u e n t B0D 5 and low w a s t e w a t e r f low to d i s p r o p o r -
t i o n a t e l y i n f l u e n c e t he e s t i m a t e d l o n g - t e r m a v e r a g e s f o r o t h e r p l a n t s , based
on the r e g r e s s i o n model . The commenters s t a t e d t h a t i f a p p r o x i m a t e l y 16
p l a n t s w i t h e f f l u e n t BOD 5 v a l u e s g r e a t e r than 200 mg/1 were removed from t he
r e g r e s s i o n , t he f low a d j u s t m e n t c o e f f i c i e n t , B, was no l o n g e r s i g n i f i c a n t .
b. T o t a l P r o d u c t i o n
Commenters s t a t e d t h a t a t o t a l p r o d u c t i o n f a c t o r s h o u l d be i n c l u d e d in
t he r e g r e s s i o n model even though p r o d u c t i o n was e v a l u a t e d in t he December 8,
1986, s u b c a t e g o r i z a t i o n a p p r o a c h and was found no t to be s i g n i f i c a n t .
C. FINAL ADOPTED BPT AND BAT SUBCATEGORIZATION METHODOLOGY ANDRATIONALE
Based on an a s s e s s m e n t o f t he comments on t he s u b c a t e g o r i z a t i o n me thod-
o l o g y p r e s e n t e d in t he December 8, 1986, F e d e r a l R e g i s t e r NOA, t he Agency
r e v i s e d i t s r e g r e s s i o n model and the me thodo logy f o r u s i n g t he model to e s t a b -
l i s h e f f l u e n t BOD 5 l o n g - t e r m a v e r a g e s . The f i n a l r e v i s e d r e g r e s s i o n model i s
as follows:
7 in(BODi) = a + Z Wij'T j + B'I4 i + C-Ib i + e i
j=l
IV-9

where:
14 i = performance indicator variable for plant i
l, if plant i meets the 95 percent BOD s removal or at most 40 mg/1 BOD s effluent editing criteria (the final BOD 5 perform- ance editing criteria)
= O, otherwise
Ib i = treatment indicator variable for plant i
= i, if plant i has only biological treatment
= O, if plant i has treatment in addition to biological treatment
e i = statistical error term associated with plant i.
The other terms have been defined previously.
The values for a, Tj, B and C are regression coefficients that are esti-
mated from the 157 full-response, direct discharge OCPSF plants that have at
least biological treatment in place and provided BOD s effluent and subcategor-
ical production data.
Procedures used to estimate the model coefficients and the estimates are
presented in Appendix IV-A, Exhibit I. The data base employed to obtain the
estimates is presented in Appendix IV-A, Exhibit 8.
This regression model differs from the model presented in the December 8,
1986, Federal Register NOA in several major respects:
BPT Treatment System: The revised regression model is designed to estimate BOD_ effluent long-term averages for biological treatment only (the selected BPT regulatory option) rather than for biological treatment and polishing ponds (see Section IX for rationale of options selection).
BOD_ Performance Edit: The indicator variable 15 in the December 8, 198g subcategorlzatlon speclfled at least 95 percent BOD removal or
B at most 50 mg/l BOD 5 in the treated wastewater (95/50), while the revised regression model has indicator variable I4~, which specifies 95/40 (see Section VII for discussion on change of~performance editing rules).
IV-lO

Performance and Treatment System Shifts: The regression model pre- sented in the December 8, 1986 Federal Re~ister NOA included a single parameter to account for differences in the logarithm of BOD s due to treatment systems other than biological treatment and polishing ponds and less than adequate performance (defined as 95/50). The revised regression model includes separate parameters to accoufft for differ- ences: one parameter to distinguish between BPT treatment systems (now biological only) and other treatment systems; and another para-meter to account for performance (now defined as 95/40). Discussion of these changes in parameters is included in this section.
• A d j u s t m e n t f o r OCPSF f low: The model p u b l i s h e d in t he December 8, 1986, s u b c a t e g o r i z a t i o n i n c l u d e d an OCPSF f low a d j u s t m e n t , bu t t he c u r r e n t model i n c l u d e s no such a d j u s t m e n t f o r f low. D i s c u s s i o n of t h i s change i s i n c l u d e d in t h i s s e c t i o n .
Individual Plant Versus Subcategory Long-Term Averages: While the subcategorization methodology published in the December 8, 1986, NOA yielded individual plant-specific long-term averages, the revised subcategorization methodology yields pure subcategory BOD s and TSS effluent long-term averages that will be applied by the NPDES permit writers.
Theprocedures used to calculate the pure subcategory long-term averages are
presented in Appendix IV-A. (See Section VII for discussion of rationale for
choosing between pure subcategory and individual plant-specific iong-term
averages.)
The Agency retained the same methodology presented in the December 8,
1986, Federal Register NOA for calculating TSS effluent long-term averages. A
discussion of the relationship of TSS to BOD s effluent concentrations is pre-
sented in Section VII, along with a discussion of the final TSS performance
criterion. The regression model for estimating TSS effluent long-term
averages is as follows:
In(TSSI) = a + b'[in(BODi) ] + e i
The c o e f f i c i e n t s a and b a r e e s t i m a t e d from the 610CPSF p l a n t s t h a t have
o n l y b i o l o g i c a l t r e a t m e n t i n p l a c e , meet t he 95/40 e d i t i n g c r i t e r i a f o r BOD 5
d e s c r i b e d p r e v i o u s l y , and have TSS e f f l u e n t c o n c e n t r a t i o n s o f a t most
I00 mg/l.
IV-ll

Estimates of the TSS°-model coefficients are given in Appendix IV-A,
Exhibit 2. The data base employed to generate the estimates is presented in
Appendix IV-A, Exhibit 8.
The following sections discuss the rationale behind some of the changes
made to the subcategorization methodology.
i. Performance and Treatment System Shifts
One change in the form of the BOD s long-term average model is a revision
of the indicator functions. The regression model published in the December 8,
1986, Federal Register NOA had a single shift indicator. This indicator was
the sole explanatory variable to account for adjusted differences in average
treatment performance between biological plants having polishing ponds and
satisfying the proposed 95/50 performance criterion and all other plants.
If this kind of single indicator function was applied to the revised BPT
treatment and performance standards of biological only and 95/40, then this
single shift indicator would account for adjusted differences between biologi-
cal only, 95/40 plants and all other plants. The set of all other facilities
can be divided into three distinct subsets: plants with treatment othe~ than
biological only which satisfy the performance criterion; plants with treatment
other than biological only' which do not satisfy the performance criterion; and
plants with only biological treatment which do not satisfy the performance
criterion. Clearly, plants with more than biological treatment are expected
to perform at least as well as biological-only facilities, and biological-only
plants that fail to satisfy the 95/40 edit will perform below the BPT "average
of the best" performance. A single shift indicator alone, similar to that
included in the regression model published in the December 8, 1986, NOA,
cannot separately account for the adjusted differences due to treatment and
performance between the biological-only, 95/40 plants and all other plants.
In an effort to reformulate the revised BOD s long-term average model to better
reflect the separate effects of the treatment and performance characteristics
of the data base, EPA redefined the single indicator shift in the form of two
indicator variables for the model: one indicator accounts for adjusted dif-
ferences between biological only treatment and treatment other than biological
IV-12

only, and the other indicator accounts for adjusted differences between plants
meeting the 95/40 performance criteria and those that do not.
2. Flow and Total Production Adjustment Factors
The regression model published in the December 8, 1986, Federal Register
NOA contained a flow adjustment term in the form of the natural logarithm of
the plant OCPSF flow in MGD. EPA included this term in an effort to account
for plants that practice water conservation. The regression coefficient for
that term was negative, which resulted in a decreasing BOD s long-term average
concentration for increasing flow. Although this result is reasonable and may
account for water conservation, it could impose unreasonably low limitations
on plants with a high proportion of fibers production that already achieve low
effluent BOD 5 levels (i.e., 12 mg/1). Industry commenters claimed that flow
rate alone cannot distinguish between plants that practice water conservation
and those plants that use excessive amounts of water. Certain product/pro-
cesses (e.g., rayon manufacture) must use large amounts of water in relation
to other plants and are then unjustly penalized with lower limits. Further-
more, commenters stated the inclusion of the flow adjustment term does not
reflect total production, which should be incorporated into the subcategorical
regression model. According to the commenters, increased production should
result in larger flows and higher B0D 5 concentrations, which is contrary to
the results obtained from the regression model EPA published in the December
8, 1986, NOA. An examination of these issues is summarized below.
EPA reexamined the inclusion of the flow adjustment factor. Based on
that examination, EPA agrees that flow rate alone does not indicate whether a
plant practices water conservation. Moreover, the 1986 published model, in
EPA's assessment, did result in excessively low BOD 5 long-term average con-
centrations for some plants with large flows.
Commenters further argued that the statistical significance of the flow
adjustment factor for the regression model presented in the December 8, 1986,
NOA was due entirely to a small number of plants with small flows and large
BOD 5 effluents. EPA's examination of the data base revealed that facilities
IV-13

with relatively high BOD s and low flows are mostly facilities that have bio-
logical treatment but failed the 95/40 performance criteria. To formalize
this analysis, EPA considered models in the context of the data base used for
determining BOD S effluent long-term averages to explore the effects of these
plants on flow adjustments. In particular, the model
7 In(BODi) = a + F. wij.T j + F.[in(flowi) ] + ei
j=l
was examined separately for the following four subsets of the data base:
(I) Biological only and 95/40
(2) Biological only and not 95/40
(3) Not biological only and 95/40
(4) Not biological only and not 95/40
These four mutually exclusive subsets partition completely the 153 full-
response, direct discharger OCPSF plants that have at least biological treat-
ment in place and provided BOD 5 effluent, flow, and subcategorical production
data. The computer analysis for these regression models and plots of In(BOD S
effluent) versus in(flow) are presented in Appendix IV-A, Exhibit 3. Note
that the set of plants in (i) above has information regarding all subcate-
gories. Rayon plants are not present in the set of plants in subsets (2),
(3), and (4), however, and the term corresponding to rayon has been excluded
from the model for these se~ts of plants. Also, fibers plants are not present
in the set of plants in subset (4), and the term corresponding to fibers has
also been excluded from the model when examining the set of plants in (4).
These models were examined for the significance of the coefficient F, corres-
ponding to the natural logarithm of flow.
Based on this analysis~ the Agency agrees with the commenters that the
significance of the flow adjustment term in the December model is largely
influenced by the poorly performing plants (plants that do not meet the 95/40
BPT performance edit) with only biological treatment. Because this pattern is
exhibited only by a subset of plants that are not well-designed and operated,
IV-14

the Agency concludes that this pattern should not be reflected in the esti-
mation of long-term BOD 5 averages as a construct of the model. Therefore, EPA
has deleted the flow adjustment factor from the model.
EPA has also examined the inclusion of a production adjustment factor
using the following model:
7 In(BOD i) = a + r wij.T j + G.[In(prodi) ] + e i
j=l
where:
in(prodi) = In (OCPSF 1980 total production) from plant i, in millions of pounds per year, with associated coefficient G.
As described in the analysis of flow, this model was examined separately
for the four subsets of the 157 full-response, direct discharge OCPSF plants
that have at least biological treatment in place and provided B0D 5 effluent
and subcategorical production data. The computer analysis for these regres-
sion models and plots of In(BOD) are presented in Appendix IV-A, Exhibit 4.
These models were examined for the coefficient of G, corresponding to the
natural logarithm of production. The same pattern emerges with this factor as
was present when the natural logarithm of flow was examined; namely, the sig-
nificance of this term is largely due to the poorly performing plants with
biological only treatment (plants that do not meet the 95/40 BPT performance
edit). Consequently, EPA has decided not to add a production adjustment
factor to the model.
Commenters have asserted that increased production should result in
higher B0D 5 effluent concentrations. As seen by the regressions involving
total production, the data do not support a positive association between BOD 5
effluent concentration and total production (higher B0D s effluent concentra-
tions associated with higher production levels), after adjustment for propor-
tion of production in a subcategory.
IV-15

EPA has also considered the effect of flow per unit of production, using
the following model, applied separately to the 4 subsets of 153 full-response,
direct discharge OCPSF plants that have at least biological treatment in place
and provided BOD 5 effluent, flow, and subcategorical production data (4 of the
157 full-response plants did not report flow):
7 in(BODi) = a + E wij.T j + H.[In(365*flowi/prodi) ] + e i
j =l
where:
flowi/prod i = annual total flow (MGD), corrected for non-process waste streams, for plant i, divided by OCPSF 1980 production (in millions of pounds per year), for plant i.
The units for in(365*flowi/prodi) are gallons/pound--the significance of
the coefficient H, associated with this quantity, was examined. Results simi-
lar to those found for flow and production were observed, in the sense that
this flow per unit production variable is only marginally significant for
plants with biological only treatment that do not meet the 95/40 BPT perform-
ance edit (see Appendix I~rA, Exhibit 5). The Agency concluded that a flow
per unit production adjustment factor was not appropriate for the same reasons
described for flow and production; that is, the model should not reflect a
pattern exhibited only by a subset of plants that are not well-designed and
operated.
D. FINAL ADOPTED BAT SUBCATEGORIZATION APPROACH
Based on comments received during public comment periods for the proposal
and the NOAs, the Agency noted that a certain subset of OCPSF plants existed
that either generate such low raw waste BOD s levels that they do not require
end-of-pipe biological treatment or choose to use physical/chemical treatment
alone to comply with BPT effluent limitations. The Agency has decided to
establish two BAT subcategories that are largely determined by raw waste BOD s
characteristics, as follows}
• Subcategory One - all plants that have or will install biological treatment to comply with BAT effluent limitations.
IV-16

Subcategory Two - all plants which, based on raw waste characteris- tics, will not utilize biological treatment to comply with BPT effluent limitations.
In addition, the Agency is also establishing a different BAT effluent
limitation for zinc, including manufacturers of rayon by the viscose process
and plants manufacturing acrylic fibers utilizing the zinc chloride/solvent
process.
BAT effluent limitations for Subcategory One will be based on the per-
formance of biological treatment and in-plant controls. Biological treatment
is an integral part of this subcategory's model BAT treatment technology; it
achieves incremental removals of some toxic pollutants beyond the removals
achieved by in-plant treatment without end-of-pipe biological treatment. BAT
effluent limitations for Subcategory Two will be based on the performance of
only in-plant treatment technologies such as steam stripping, activated
carbon, chemical precipitation, cyanide destruction, and in-plant biological
treatment of selected waste streams. The Agency has concluded that, within
each subcategory, all plants can treat priority pollutants to the levels
established. (The Agency determined that further BPT subcategorization for
plants without end-of-pipe biological treatment is unnecessary. As described
in the Section VII assessment of nonbiological end-of-pipe treatment systems,
the Agency concluded that plants that do not need biological treatment to
comply with the BPT BOD s limitations can meet the TSS limitations with physi-
cal/chemical controls alone. As also shown, some plants achieve sufficient
control of BOD 5 through the use of only physical/chemical treatment unit
operations.)
The Agency also received comments (supported by submitted data) during
public comment periods stating that plants manufacturingacrylic fibers by the
zinc chloride/solvent process produced raw waste and treated effuent levels of
zinc similar to those levels produced by rayon manufacturers utilizing the
viscose process. After examining these data, the Agency agreed with the
commenters that it was appropriate to include these plants along with rayon
manufacturers. Based on this decision, the Agency is establishing two dif-
ferent limitations for the pollutant zinc. One is based on data collected
IV-17

from rayon manufacturers and acrylic fibers manufacturers using the zinc
chloride/solvent process. This limitation applies only to those plants that
use the viscose process to manufacture rayon and the zinc chloride/solvent
process to manufacture acrylic fibers. The other zinc limitation is based on
the performance of chemical precipitation technology used in the metal fin-
ishing point source category, and applies to all plants other than described
above.
E. SUBCATEGORIZATION FACTORS
I. Introduction
All nine factors listed in the beginning of this section were examined
for technical significance in the development of the proposed subcategoriza-
tion scheme. However, in general, the proposed subcategorization reflected
primarily differences in waste characteristics, since many of the other eight
factors, while considered, could not be examined in appropriate technical and
statistical depth due to the intricacies of the plants in this industry.
Therefore, variations in waste characteristics were utilized to evaluate the
impact of the other eight factors on subcategorization. For example~ the
ideal data base for evaluating the need for subcategorization and the develop-
ment of individual subcategories would include raw wastewater and final efflu-
ent pollutant data for facilities which segregate and treat each process raw
waste stream separately. In this manner, each factor could be evaluated
independently. However, the available information consists of historical data
collected by individual companies, primarily for the purpose of monitoring the
performance of end-of-pipe wastewater treatment technology and compliance with
NPDES pemmit limitations. The OCPSF industry is primarily composed of multi-
product/process, integrated facilities. Wastewaters generated from each
product/process are typically collected in combined plant sewer systems and
treated in one main treatment facility.
Therefore, each plant's overall raw wastewater characteristics are
affected by all of the production processes occurring at the site at one time.
The effects of each production operation on the raw wastewater characteristics
cannot be isolated accurately from all of the other site-specific factors.
Therefore, a combination of both technical and statistical methodologies had
IV-18

to be used to evaluate the significance of each of the subcategorlzation fac-
tors. The methodologies and analyses necessarily are limited to indicating
trends rather than yielding definitive quantitative slgniflcance of the fac-
tors considered.
In the methodology that was employed, the results of the technical analy-
sis were compared to the results of the statistical efforts to determine the
usefulness of each factor as a basis for subcategorization. The combined
technical/statistical evaluations of the nine factors are presented below.
2. Manufacturing Product/Processes
Comments have been received that state that the choice of the final seven
subcategories based on production is arbitrary, since the Agency did not per-
form a statistical analysis to group plants in optimal subcategories. Product
groups are based on both the marketing structure of the industry and technical
factors affecting the generation of contaminants.
By choosing subcategories based on SIC codes, the marketing character-
istics by which the industry is organized are emphasized; facilities can be
easily classified since the SIC codes are readily available to the plant.
Furthermore, from a technical point of view, based on engineering judgment and
analysis of the data supplied by the industry, most of these subcategories
represent different waste streams.
The p u r p o s e o f s u b c a t e g o r i z a t i o n i s t he d i v i s i o n of the OCPSF i n d u s t r y
into smaller groups that account for the particular common characteristics of
different facilities. The OCPSF industry (as defined by EPA) is recognized to
comprise several product groups:
• Organic Chemicals (SiC 2865/2869)
• Plastic Materials and Synthetic Resins (SIC 2821)
• Cellulosic Manmade Fibers (SIC 2823)
• Synthetic Organic Fibers (SIC 2824).
IV-19

Vertical integration of plants within these industries is common, however,
blurring distinctions between organic chemical plants and plastics/synthetic
fibers plants. As a practical matter, the OCPSF industry is divided among
three types of plants:
• Plants manufacturing only organic chemicals (SIC 2865/2869)
• Plants manufacturing only plastics and synthetic materials (SIC 2821/ 2823/2824)
• Integrated plants manufacturing both organic chemicals-and plastics/ synthetic materials (SIC 2865/2869/2821/2823/2824).
Each type of plant is unique not only in terms of product type (e.g., plas-
tics) but also in terms of process chemistry and engineering. Using raw
materials provided by organic chemical plants, plastic plants employ only a
small subset of the chemistry practiced by the OCPSF industry to produce a
limited number of products (approximately 200). Additionally, product re-
covery from process wastewaters in plastic plants generally is possible, thus
lowering raw waste BOD 5 concentrations. Plants producing organic chemicals,
on the other hand, utilize a much larger set of process chemistry and engi-
neering to produce approximately 25,000 products; process wastewaters from
these plants are in general not as amenable to product recovery and are gen-
erally higher in raw waste BOD 5 concentration and priority pollutant loadings.
Further divisions are possible within these broad groupings. Plastic
materials and synthetic resins manufacturers can be subdivided into thermo-
plastic materials (SIC 28213) producers and thermosetting resin (SIC 28214)
producers. Rayon manufacturers and synthetic organic fiber manufacturers are
also both unique. Again, process chemistry and engineering are broadly con-
sistent within these groupings in terms of B0D 5.
The organic chemicals industry produces many more products that does the
plastics/synthetic fibers industry and is correspondingly more complex. While
it is indeed possible to separate this industry into product groups, the num-
ber of such product groups is large. Moreover, with few exceptions, plants
produce organic chemicals from several product groups and thus limit the
utility of such an approach.
IV-20

J
An alternative to a product-based approach is an approach based on the
type of manufacturing conducted at a plant. Large plants producing primarily
commodity chemicals (the basic chemicals of the industry, e.g., ethylene,
propylene, benzene) comprise the first group of plants. A second tier of
plants, includes plants that produce high-volume intermediates (bulk chemi-
cals). Plants within this tier typically utilize the products of the com-
modity chemical plants (first tier plants) to produce more structurally com-
plex chemicaIs. Bulk chemical plants are generally smaller than those in the
first group, but still may produce several hundred million pounds of chemicals
per year (e.g., aniline, methylene dianiline, toluene diisocyanate). The
third group includes those plants that are devoted primarily to manufacture of
specialty chemicals -- chemicals intended for a particular end use (e.g., dyes
and pigments). Generally, specialty chemicals are more complex structurally
than either commodity or bulk chemicals.
tChemicals within the three groups -- commodity, bulk, and specialty --
are defined on the basis of national production. Commodity chemicals are
those Chemicals produced nationally in amounts greater than or equal to 1
billion pounds per year. Bulk chemicals are defined to be those chemicals
produced nationally in amounts less than i billion but more than 40 million ~
pounds per year. Specialty chemicals arethose chemicals produced nationally
in amounts less than or equal to 40 million pounds per year. Using these
definitions, there are 35 commodity chemicals, 229 bulk chemicals or bulk
chemical groups, and more than 786 specialty chemicals or specialty chemical
g r o u p s .
In general, the rate of biodegradation decreases with increasing molecu-
lar complexity. Because commodity chemical plants produce the least complex
chemicals, a general trend of lower BOD 5 effluent concentrations for commodity
chemical plants to higher BOD S effluent concentrations for specialty chemical
plants is observed.
With regard to subcategorization for BAT, the Agency considered whether
the industry should be subcategorized by evaluating the same subcategorization
approach developed for BPT, which is based primarily on manufacturing product/
processes. The available data for BAT show that plants in differing BPT sub-
categories can achieve similar low toxic pollutant effluent concentrations by
IV-21

i n s t a l l i n g t he b e s t a v a i l a b l e t r e a t m e n t componen t s . S ince a l l p l a n t s w i t h i n
the two BAT t e c h n o l o g y - b a s e d s u b c a t e g o r i e s can a c h i e v e c o m p l i a n c e w i t h the
same BAT e f f l u e n t l i m i t a t i o n s t h r o u g h some c o m b i n a t i o n of d e m o n s t r a t e d t e c h -
n o l o g y , t he p r e d o m i n a n t i s s u e r e l a t e s to the c o s t o f t he r e q u i r e d t r e a t m e n t
t e c h n o l o g y . EPA has a n a l y z e d t h e s e c o s t s and t h e i r a s s o c i a t e d i m p a c t s and has
d e t e r m i n e d them to be r e a s o n a b l e . T h e r e f o r e , the Agency b e l i e v e s t h a t BAT
s u b c a t e g o r i z a t i o n based on m a n u f a c t u r i n g p r o d u c t / p r o c e s s e s i s no t n e c e s s a r y
f o r e f f e c t i v e , e q u i t a b l e r e g u l a t i o n .
3. Raw Materials
Synthetic organic chemicals can be defined as derivative products of
naturally occurring materials (e.g., petroleum, natural gas, and coal) that
have undergone at least one chemical reaction, such as oxidation, hydrogena-
tion, halogenation, or alkylation. This definition, when applied to the
larger number of potential starting materials and the host of chemical reac-
tions that can be applied, leads to the possibility of many thousands of
organic chemical compounds being produced by a potentially large number of
basic processes having many variations. There are more than 25,000 commercial
organic chemical products derived principally from petrochemical sources.
These are produced from five major raw material classifications: methane,
ethylene, propylene, C 4 hydrocarbons and higher aliphatics, and aromatics.
This major raw materials list can be expanded by further defining the aro-
matics to include benzene, toluene, and xylene. These raw materials are
derived from natural gas and petroleum, although a small portion of the
aromatics are derived from coal.
Currently, approximately 90 percent (by weight) of the organic chemicals
used in the world are derived from petroleum or natural gas. Other sources of
raw materials are coal and some naturally occurring renewable material of
which fats, oils, and carbohydrates are the most important.
Regardless of the relatively limited number of basic raw materials util-
ized by the organic chemicals industry, process technologies lead to the for-
mation of a wide variety of products and intermediates, many of which can be
produced from more than one basic raw material either as a primary reaction
IV-22

product or as a byproduct. Furthermore, primary reaction products are fre-
quently processed to other chemicals that categorize the primary product from
one process as the raw material for a subsequent process.
Delineation between raw materials and products is nebulous at best, since
the product from one manufacturer can be the raw material for another manufac-
turer. This lack of distinction is more pronounced as the process approaches
the ultimate end product, which is normally the fabrication or consumer stage.
Also, many products/intermediates can be made from more than one raw material.
Frequently, there are alternate processes by which a product can be made from
the same basic raw. material. "
Another characteristic o f the OCPSF industry that makes subcategorization
by raw material difficult is the high degree of integration in manufacturing
units. Since the majority of basic raw materials derive from petroleum and
natural gas, many of the organic chemical manufacturing plants are either
incorporated into or contiguous to petroleum refineries, and may formulate a
product at almost any point in a process from any or all of the basic raw
materials. Normally, relatively few organic chemical manufacturing facilities
are single product/process plants unless the final product is near the fabri-
cation or consumer product stage.
Because of the integrated complexity of the largest (by weight) single
segment of the organics industry (petrochemicals), it may be concluded that
BPT and BAT subcategorization by raw materials is not feasible for the fol -~
lowing reasons :
• The organic chemicals industry is made up primarily of chemical complexes of various sizes and complexity.
• Very little, if any, of the total production is represented by single ~. raw material plants.
• The raw materials used by a plant can be varied "widely over shor~ time spans. -.
J /
• • ' T h e toxic, conventional, and nonconventional wastewater polh'tant parameter data gathered for this study were not collected and are not available on a raw material orientation basis, but rather rel,resent the mixed end-of-pipe plant wastewaters, i'
IV-23

4. Facility Size
Although sales volume, number of employees, area of a plant site, plant
capacity, and production rate might logically be considered to define facility
size, none of these factors alone describes facility size in a satisfactory
manner. Recognizing these limitations, the Agency has chosen total OCPSF
production to define facility size.
The regression model approach allows the Agency to easily test for BPT
subcategorization factors such as facility size as measured by total 0CPSF
production. EPA has analyzed total 0CPSF production, as discussed previously
in this section, to determine its appropriateness as a subcategorization fac-
tor, and determined that the significance of production is due largely to
plants with only biological treatment that do not meet the 95/40 BPT perform-
ance edit. Consequently, an adjustment factor for production is not incorpo-
rated into the model.
In terms of a BAT subcategorization factor, although facility sizes (as
measured by total OCPSF production) of the waste streams with the OCPSF indus-
try vary widely, ranging from less than I0,000 pounds/day to more than
5 million pounds/day, this definition fails to embody fundamental character-
istics such as continuous or batch manufacturing processes. While equivalent
production rates may be accomplished by either production method, the charac-
teristics of these waste streams in terms of toxic pollutants may vary sub-
stantially because of different yield losses inherent in each process. There-
fore, the Agency has determined that no adequate method exists for defining
facility size and that there is no technical basis for the use of facility
size as a BAT subcategorization factor.
5. Geographical Location
Companies in the 0CPSF industry usually locate their plants based on a
number of factors. These include:
• Sources of raw materials
• Proximity of markets for products
• Availability of an adequate water supply
IV-24

• Cheap sources of energy
• Proximity to proper.modes Of transportation
• Reasonably priced labor markets
In addition, a particular product/process may be located in an existing facil-
ity based on availability of certain types of equipment or land for expansion.
Companies also locate their facilities based on the type of production
involved. For example, specialty producers may be located closer t~ their
major markets, whereas bulk producers may be centrally located to service a
wide variety of markets. Also, a company that has committed itself to zero
discharge as its method of wastewater disposal has the ability to locate any-
where, while direct dischargers must locate near receiving waters, and in-
direct dischargers must locate in a city or town that has an adequate POTW
capacity to treat OCPSF wastewaters.
Because of the complexity and Inter-relatlonshlps of the factor~: affect-
ing plant locations outlined above, no clear basis for either BPT or BAT sub-
categorization according to plant location could be found. Therefore, loca-
tion is not a basis for BPT and BAT subcategorlzatlon of the OCPSF industry.
Since biological treatment installed to meet BPT effluent limitations is
an important part of both BPT and BAT subcategorlzatlon approaches, the Agency
decided to perform an analysis to confirm that temperature (as defined by the
heating-degree day variable to measure winter/summer effects), instead of
location, is not a subcategorizatlon factor. The Agency used a regres:~ion
model approach similiar to the analysis for facility size. Analysis on ~he
following regression model was performed to test for the significance o! this
f a c t o r :
7 In(BOD i) = a + r wij.T j + J.(degree daysi) + e i
j=l
where:
degree days i = the number of. degrees that the mean daily outdoor temperature is below 65°F for a given day, accumu- lated over the number of days in the yea'c that the
IV-25

mean temperature is below 65°F, at plant i (with associated coefficient J).
This a n a l y s i s was per fo rmed s e p a r a t e l y f o r the f o u r s u b s e t s d e s c r i b e d
p r e v i o u s l y which p a r t i t i o n the 157 f u l l - r e s p o n s e , d i r e c t d i s c h a r g e OCPSF
p l a n t s t h a t have a t l e a s t b i o l o g i c a l t r e a t m e n t in p l a c e and p rov ided BOD 5
e f f l u e n t and s u b c a t e g o r i c a l p r o d u c t i o n d a t a . The computer a n a l y s i s f o r t h e s e
r e g r e s s i o n models i s p r e s e n t e d in Appendix IV-A, E x h i b i t 6. In none of t h e s e
fou r s u b s e t s was t e m p e r a t u r e s i g n i f i c a n t , and c o n s e q u e n t l y a t e m p e r a t u r e
f a c t o r i s d e t e r m i n e d to be i n a p p r o p r i a t e .
6. Age of Facility and Equipment
The age of an OCPSF plant is difficult to define accurately. This is
because production facilities are continually modified to meet production
goals and to accommodate new product lines. Therefore, actual process equip-
ment is generally modern (i.e., 0-15 years old). However, major building
structures and plant sewers are not generally upgraded unless the plant
expands significantly. Older plants may use open sewers and drainage ditches
to collect process wastewater. In addition, cooling waters, steam conden-
sates, wash waters, and tank drainage waters are sometimes collected in these
drains due to their convenience and lack of other collection alternatives.
These ditches may run inside the process buildings as well as between manu-
facturing centers. Therefore, older facilities are likely to exhibit higher
wastewater discharge flow rates than newer facilities. In addition, since the
higher flows may result from the inclusion of relatively clean noncontact
cooling waters and steam condensates as well as infiltration/inflow, raw
wastewater concentrations may be lower due to dilution effects. Furthermore,
recycle techniques and wastewater segregation efforts normally cannot be
accomplished with existing piping systems, and would require the installation
of new collection lines as well as the isolation of the existing collection
ditches. However, due to water conservation measures as well as ground con-
tamination control, many older plants are upgrading their collection systems.
In addition, the energy crisis of recent years has caused many plants to
upgrade their steam and cooling systems to make them more efficient. Based on
the factors mentioned above, the Agency has determined its only accurate age
IV-26

measurement to be the age of the oldest process at each DCPSF facility.
Analysis on the following regression model was performed to test for the
s ignif icance of age:
7 In(BOD i) = a + r. wij.T j + K.(agei) + e i
j=l
where:
age i = the age of the o l d e s t p roce s s a t p l a n t i ( w i t h a s s o c i a t e d c o e f f i c i e n t K).
This a n a l y s i s was per formed s e p a r a t e l y fo r the four s u b s e t s d e s c r i b e d
p r e v i o u s l y t h a t p a r t i t i o n the 157 f u l l - r e s p o n s e , d i r e c t ! t i s c h a r g e OCPSF p l a n t s
t ha t have a t l e a s t b i o l o g i c a l t r e a t m e n t in p l a c e and p rov ided BOD S e f f l u e n t
and s u b c a t e g o r i c a l p r o d u c t i o n d a t a . The computer a n a l y s i s fo r t h e s e r e g r e s -
s ion models i s p r e s e n t e d in Appendix IV-A, E x h i b i t 7. R e s u l t s of t h i s
a n a l y s i s a r e s i m i l a r to r e s u l t s seen fo r p r o d u c t i o n , f l ew, and f low per u n i t
of production; that is , the only group of plants that exhibit a relationship
between age and effluent BOD 5 concentration is the subset of poorly performing
biological-only plants (plants that do not meet the 95/4) BPT edit ing cr i -
te r ia ) . Consequently, the Agency has determined that an age factor is not
a p p r o p r i a t e .
The extent to which process wastewaters are contami~lated with toxic pol-
lutants depends mainly upon the degree of contact that p~cocess water has with
reactants/products, the effectiveness of the separation train, and the
physical-chemical properties of those priority pollutan~s formed in the reac-
tion. Raw wastewater quality is determined by the specific process design and
chemistry. For example, water formed during a reactior, used to quench a
reaction mixture, or used to wash reaction products will contain greater
amounts of pollutants than does water that does not COl le into direct contact
with reactants or products. The effectiveness of a se!mration train is deter-
mined by the process design and the physical-chemicaljproperties of those
pollutants present. While improvements are continual~y made in the design and
construction of process equipment, the basic design oi such equipment may be
IV-27

quite old. Process equipment does, however, deteriorate during use and re-
quires maintenance to ensure optimal performance. When process losses can no
longer be effectively controlled by maintenance, process equipment is re-
placed. The maintenance schedule and useful life associated with each piece
of equipment are in part determined by equipment age and process conditions.
Equipment age, however, does not directly affect either pollutant concentra-
tions in influent or effluent wastewaters and is therefore inappropriate as a
basis for BAT subcategorization.
7. gastewater Characteristics and Treatability
a. BPT Subcategorization
The treatability of OCPSF wastewaters is discussed in detail in Section
VII. The treatability of a given wastewater is affected by the presence of
inhibitory materials (toxics), availability of alternative disposal methods,
and pollutant concentrations in, and variability of, the raw wastewater con-
centrations. However, all of these factors can be controlled by sound waste
management, treatment technology design, and operating practices. Examples of
these are:
The presence of toxic materials in the wastewater can be controlled by in-plant treatment methods. Technologies such as steam stripping, metals precipitation, activated carbon, and reverse osmosis can elimi- nate the presence of materials in a plant's wastewater that may inhibit or upset biological treatment systems.
Although some plants utilize deep well injection for disposal of high- ly toxic wastes to avoid treatment system upsets, other alternative disposal techniques such as contract hauling and incineration are available to facilities that cannot utilize deep well disposal. In addition, stricter groundwater regulations may eliminate the option of deep well disposal for some plants and make it uneconomical for others, forcing facilities to look more closely at these other options.
Raw waste concentration variability can easily be controlled by the use of equalization basins. In some plants, "at-process" storage and equalization is used to meter specific process wastewaters, on a con- trolled basis, into the plant's wastewater treatment system.
Raw waste concentrations can be reduced with roughing biological filters or with the use of two-stage biological treatment systems. These techniques are discussed in detail in Section VII.
IV-28

OCPSF wastewaters can be treated by either physical-chemical or biologi-
cal methods, depending on the pollutant to be removed. Also, depending on the
specific composition of the wastewater, any pollutant may be removed to a
greater or lesser degree by technology not designed for removal of this pol-
lutant. For example, a physical-chemical treatment system designed to remove
suspended solids will also remove a portion of the BOD 5 of a wastewater if the
solids removed are organic and biodegradable. It is common in the OCPSF in-
dustry to use a combination of technologies adapted to the individual waste-
water stream to achieve desired results. These concepts are discussed in
detail in Section VII. In general, the percent removals of BOD 5 and TSS are
consistent across the seven final subcategories. It is also possible for
plants in these subcategories to achieve high percent removals (greater than
95~) for both BOD s and TSS (data supporting these removals are presented and
discussed in Section VII). Also, 0CPSF plants producing the same products and
generating similiar raw waste BOD 5 concentrations are, in general, equally
distributed above and below the pure subcategory long-term averages for BOD 5
effluent as determined by the BPT regression equation. Figures IV-I through
IV-7 present the distribution of plants within each pure subcategory (defined
as full-response direct discharge plants that have at least 80 percent of
their total OCPSF production in one of the seven final subcategories) by
effluent BOD 5 and the product(s) each plant produces. Also included with each
plant's BOD 5 effluent is its associated raw waste BOD 5 concentration (when
available); in addition, if a plant produces more than one product within a
subcategory, its effluent and raw waste BOD 5 values are repeated and noted on
each figure, as multiple effluent and influent, respectively.
In reviewing these figures, it should be noted that for most of the pro-
ducts within a pure subcategory, plants with fairly high raw waste BOD s con-
centrations are equally distributed above and below the subcategory long-term
average BOD 5 effluent and that even for plants producing the same products
that did not have raw waste B0D 5 concentration data, BOD 5 effluents are fairly
well-distributed above and below the subcategory median BOD 5 effluent for
certain products within selected subcategories. Situations in which there are
a disproportionate number of plants either above or below the subcateogry
long-term average maybe explained by a number of factors, including the con-
tribution of remaining 20 percent of each plant's product mix to its BOD5
IV-29

5 -
b_ o
_J I T o ~ 3
~E uJ t~ z.<H I m
In I o o DIJ m m Q 2 T: !T TIT A I
< II __L[
L~ 0
1 i i 8 ;46/1.
[ ] r-!
A - ABS RESIN 0 B - P O L Y E S T E R
C -- PVC
O - CELLULOSE A B C D E F G H I d K L M A C E T A T E F I B E F I ~
E - P O L Y S T Y R E I ~ E
F - P O L Y E T H Y L E N E PRODUCT 8 - P O L Y P R O P Y L E N E
H - P O L Y V Z N Y L A C E T A T E
I - A C R Y L I C L A T E X TYPE + + + SINGLE INFLUENT D [] [ ] S I N G L E E F F L U E N T
d - S A N RESIN @ ~ • MULTIPLE INF, A A A MULTIPLE E F F . K - NYLON F I B I ~ R S
L - P O L Y A N Z D L ~
N - OTHER
Figure IV-1 Distribution of Plants by
Product and BOD 5 (Thermoplastics)

5
T T I IU.
o _J 3 I I O~ Dl I
X I.U I Ir , ,~Z
t-4 nO I + I
I 2~ D i I iO 0 , . - Im 4 1 M O / L
A A A A A A A
0
A - A C R Y L I C R E S I N S A B C D E F G H B - ~ . K Y D R E S I N S C - UFIEA RESINS O - EPOXY R E S I N S PRODUCT E - R t E N I X . I C F IEBINS F 6
--
P O L Y E E T E R R E S I N S 14ELANINE R E B I N 8 TYPE + + + S INGLE INFLUENT [] [] [] SINGLE EFFLUENT
H - OI_YOXAL R E S I N S ~ ~ MULTIPLE I N F . A A A MULTIPLE EFF.
Figure IV-2 Distribution of Plants by
Product and BOD 5 (Thermosets)

5
4
o ._J
~(.,1
LUm Z + nn
It1 2 I II~a _.I00
P~ I
0
A
A - RAYON-FIBER/VISCOSE B - NYLON-MELT SPZNNZNg TYPE C - RAYON YARN
I ! I I I I P_PPLLIENT LTA , IB NS/L
[ ]
B c
P R O D U C T
+ + + S I N G L E I N F L U E N T D [ ] D S I N G L E E F F L U E N T
t • MULTIPLE I N F . A A MULTIPLE EFF.
F i g u r e IV-3
D i s t r i b u t i o n o f P l a n t s b y
P r o d u c t a n d B O D 5
( R a y o n )

5
4
I
b_ 0
.J
, ~ L 9 ~r
bJ ~Z
m I11
o o 2 T II
I II
I
I II
[]
[]
I I I I I
I I I I I i
T I
~mmJm~u I I []
I I I I I~.1,1
i i i ii i i i , I ~ I , ~ I L , , ~2 NS/L
0
A - NYLON RESZN/FZBEP.S B - ACRYLZC FZBEP.S C m NYLON SALT,/FZBIERS O - POLYPROPYLEME F]rBEi~ E - POLYESTER FZBEI:m F - POLYAMZI]E RES]B~I/FZBEI:I8 • - SPN~I~.X FZBERS
A
T Y P E + +
$
+
•
B C
P R O D U C T
S I N G L E Z N F L U E N T
H U L T I P L E Z N F .
0
A
D
[ ] [ ]
A A
E F
S I N G L E E F F L U E N T
N U L T Z P L E E F F .
G
Figure IV-4 Distribution of Plants by
Product and BOD s (Fibers}

5
m.z. 0
..J o~ q,-J~
~Z
TI, T T T T TUJ
<[H
m L n " 3 I I I . ° ° - tTJ J iTT TT~ T T ] IT
II T TTTT []
o o
!
I : I I ,, 1
2~A -TULUE:NE, - - - - __~ ._~__~ _~ _ I XYLENE~
.G~-~ ; 2o ~ / L B ACETIC ACID i C - OLEFIN8
(ETHYLENE. [] PROPYLENE. B~rYLENEI
D - ALCOHOLS (I~'TICaNOL ISOPROPANO) 0
E BUI"ADIENE F - 8TYRENE A B C D E F G H I K L M N 0 P 8 - PYROt.YgI8 8A8. OIL H - ETHYL BENZENE Z - V I N e . . CHLORIDE PRODUCT J - P H E N O L S
K - F ~
L - ACRYNONZTRILE TYPE + + + SINGLE INFLUENT [] [] [] SINGLE EFFLUENT N - AC~TONE * * * MULTIPLE INF. A A A MULTIPLE EFF. N - PHTHALATE ACIDS O - I. S- DZCHLDROETHENE8 p - VZNYI.. ACETATE
F igure IV-5 Dist r ibut ion of Plants by
Product and BOD 5 (Commodi ty )

h o
_J o~ ~-4L9
Z
3 I I
l I
LU
P~ <~ I
L~ ~n
~ z < [ H m
Ln (.9(:1O •j m
2 [ ]
A A
2 9 MQ/L
D T3
-•
0 k - NYLON SALTS a - PHENOLS A B . C D ' E F G H I C - CREOSOTE D - PHOSPHATE ESTERS E - £CI"DS P R O D U C T F - ANINES g - BENZENe. TOLUENE COMPOUNDS TYPE H - CREOS0L + + + SINGLE INFLUENT O D [] S I N G L E E F F L U E N T
I - ETHOXYLATES • * MULTIPLE INF. A A A MULTIPLE E F F .
Figure IV-6 Dis t r ibu t ion of Plants by
Product and B O D 5 (Bulk)

[]
<:: I
C~
u_ o
.J o ~ ,-,co
Z uJ u ] z< [ Hm
In c o o o o. J m
3
2
[ ]
I Ii - !
J
; / ;
I I i
i I
E] J l
- - - 0 . . . . . .
[]
I Ii
[]
I!
i I
so NeA_
I-1
A -
B -C -O -E -F -
• -X -Z -J -K -L -
S U L F I D E S . SULJ:O~L*TES O POLYI4ERS NITRO C l . C2. C3 DITHIO CARBONATES ANT~IE8 OReANZC P Z E N E N T S / DYES S I L I C O N E ANHYDRZDE8 NORPHOLINE8 OREANO--TIN CONPIXJND8 EE.YCOLS OTHER
A B C
T Y P E
O
+ ÷
•
+
•
E F G
PRODUCT
S I N G L E I N F L U E N T
M U L T I P L E I N F .
H I J K
[] [] O SINGLE EFFLUENT A A A MULTIPLE EFF.
L
Figure IV-7 D i s t r i b u t i o n o f P lants by
P r o d u c t and BOD 5 (Spec ia l ty )

effluent, the end-of-pipe treatment systems in place at each plant and the
in-plant controls currently in place at each plant that may cause raw waste
BOD 5 concentrations to be reduced or that may remove toxic pollutants that
inhibit biological activity and cause higher BOD s effluent concentrations. It
should also be noted in any event that for those plants substantially above
the subcategory long-term average BOD s effluent value, as well as for other
plants, EPA's costing methodology and resulting cOSt estimates and economic
impact estimates have fully accounted for any required treatment improvement.
Based on the distribution of raw waste and effluent BOD S concentrations,
the relative consistency of percent removal data across the final seven sub-
categories, and BOD s effluent data within subcategories and product groups
within those subcategories, the Agency has concluded that the adopted BPT
subcategorization accounts sufficiently for wastewater characteristics and
treatability.
b. BAT Subcategorization
Typically, the treatability of a waste stream is described in terms of
its biodegradability, as biological treatment Usually provides the most cost-
effective means of treating a high volume, high (organic) strength industrial
waste (i.e., minimum capital and operating costs). Furthermore, biodegrad-
ability serves as an important indicator of the toxic nature of the waste load
upon discharge to the environment. Aerobic (oxygen-rich) biological treatment
processes achieve accelerated versions of the same type of biodegradation that
would occur much more slowly in the receiving water. These treatment pro-
cesses accelerate biodegradation by aerating the wastewater to keep the dis-
solved oxygen concentration high and recycling microorganisms to maintain
extremely high concentrations of bacteria, algae, fungi, and protozoa in the
treatment system. Certain compounds that resist biological degradation in
natural waters may be readily oxidized by a microbial population adapted to
the waste. As would occur in the natural environment, organic compounds may
be removed by volatilization (e.g., aeration) and adsorption on solid mater-
ials (e.g., sludge) during biological treatment.
IV-37

One of the primary limitations of biological treatment of wastewaters
from the OCPSF industry is the presence of both refractory (difficult to
treat) compounds as well as compounds that are toxic or inhibitory to biologi-
cal processes. Compounds oxidized slowly by microorganisms can generally be
treated by subjecting the wastewater to biological treatment for a longer
time, thereby increasing the overall conventional and toxic pollutant re-
movals. Lengthening the duration of treatment, however, requires larger
treatment tanks and more aeration, both of which add to the expense of the
treatment. Alternatively, pollutants that are refractory, toxic, or inhibi-
tory to biological processes can be removed prior to biological treatment of
wastewaters. Removal of pollutants prior to biological treatment is known as
pretreatment.
The successful treatment of wastewaters of the OCPSF industries primarily
depends on effective physical-chemical pretreatment of wastewaters, the abil-
ity to acclimate biological organisms to the remaining pollutants in the waste
stream (as in activated sludge processes), the year-round operation of the
treatment system at an efficient removal rate, the resistance of the treatment
system to toxic or inhibitory concentations, and the stability of the treat-
ment system during variations in the waste loading (i.e., changes in product
mixes).
However, as discussed earlier in this section, the Agency determined that
a subset of OCPSF plants, based on their low raw waste BOD s levels, did not
necessarily require biological treatment to comply with BPT effluent limita-
tions. Some of these plants produced chlorinated hydrocarbons that typically
generate~wastewater characterized by low raw waste BOD s concentrations. In
these cases, biological treatment would not be effective in treating refrac-
tory priority pollutants that would not be amenable to biodegradation. There-
fore, the Agency decided that separate BAT effluent limitations based on the
performance of physical-chemical treatment technologies only were appropriate
and has established a separate subcategory for these plants based on their
unique raw wastewater characteristics and treatability.
The Agency also maintains that similar toxic pollutant effluent concen-
trations can be achieved by plants in differing BPT subcategories, i.e.,
IV-38

plants withdifferent product mixes, by installing the best available treat-
ment technologies. These toxic pollutants are being controlled using a combi-
nation of in-plant and end-of-pipe treatment technologies. The in-plant
controls are based upon specific pollutants or groups of pollutants identified
in waste streams and controlled by technologies for which treatment data are
available or transferred with appropriate basis (see Section VII of this docu-
ment). Thus, subcategory groupings of plants based on product mix for BAT are
not appropriate. Nevertheless, the Agency has attempted to perform a quanti-
tative assessment of treatability of BAT toxic pollutants by BPT subcategory
classification. The capability to perform this assessment is limited because
the frequency of occurrence of BAT toxic pollutants is determined by the pres-
ence of specific product/processes (or reaction chemistry) within plants that
is not totally dependent on BPT subcategory classifications. Table IV-I pre-
sents a comparison of toxic pollutant mean effluent concentrations achieved by
I00 percent plastics and organics plants contained in the final, edited BAT
toxic pollutant data base that were used in the calculation of BAT effluent
limitations. Also included is the same comparison between those I00 percent
"pure" BPT subcategory plants contained in the same data base. The first
comparison shows that, with the exception of two pollutants (#I0 and #32),
plastics and organics plants achieve effluent concentrations that approach the
analytical minimum level. The same results are found for the second "pure"
subcategory comparison, even though fewer plants were available for the analy-
sis. For the two pollutants with disparate results, the Agency believes that
these differences are not the result of dissimilar wastewater treatability,
but a lack of effluent concentration data for these pollutants from I00 per-
cent plastics plants. EPA notes that when more than one I00 percent plastics
plant is available for comparison (e.g., pollutant #86), the effluent concen-
trations are similar.
In addition to each OCPSF plant's ability to achieve similar effluent
concentrations, the Agency also believes that its extensive BAT toxic pollu-
tant data base is representative of OCPSF wastewaters, treatment technologies,
processes, and products. In total, 186 plants were sampled in the Agency's
screening, verification, 5-plant, and 12-plant studies. After editing the
data base so that only quality data (i.e., having adequate QA/QC) representing
BAT treatment were used, the edited BAT data base contains sampling data for
IV-39

TABLE IV-I. BAT EFFLUENT ESTIMATED LONG-TERM AVERAGE CONCENTRATION COMPARISON
BETWEEN PLASTICS AND ORGANICS PLANTS AND PURE BPT SUBCATEGORY PLANTS
Concentrations (ppb) by Plant Pollutant Number Numbers 4 i0 32 38 65 86 87
Plastics vs. Organics
Plastics
883 - - - i0 - - -
2221 - - - I0 I0 i0 -
4051 i0 1016 923 - - 103 16 1349 1617 . . . . . i0
2536 - - - i0 10 - -
Organics
12 I0 - - i0 12 i0 -
296 i0 12 - - i0 I0 -
444 I0 . . . . i0 -
1609 i0 - - - i0 18 I0
1753 - - - i0 - - -
2394 - - - I0 59 I0 -
2693 3033 - I0 13 - 15 - -
Pure Subcategory
Thermoplastics
883 - - - I0 - - -
1617 . . . . . i0 4051 i0 1016 923 - - 103 16 2536 - - - I0 i0 - -
1349
Thermosets
2221 I0 I0 i0
Bulk Organics
444 10 . . . . 10
Specialty Organics
1753 I0
IV-40

36 OCPSF plants (including industry supplied data) representing 232 product/
processes. These 36 plants account for approximately 26 percent of production
volume and 24 percent of the process wastewater flow of the entire industry.
The types of product/processes utilized by these 36 plants represent approxi-
mately 13 percent of the types of OCPSF product/processes in use. Since the
products manufactured by these facilities are manufactured at other OCPSF
facilities, the data obtained from these plants represent even greater per-
centages of total industry production and flow. Thus, about 68 percent of
OCPSF industry production (in total pounds) is represented and about 57 per-
cent of the OCPSF industry Wastewater is accounted for by the products and
processes utilized by the 36 plants in the limitations data base. Products
that could be manufactured by the 232 product/processes utilized at or manu-
factured by the 36 plants account for 84 percent of industry production and
76 percen t of process wastewater.
The OCPSF industry manufactures more than 20,000 individual products;
however, overall production is concentrated in a limited number of high-volume
chemicals. Excluding consideration of plastics, resins, and synthetic fibers,
EPA has identified 36 organic chemicals that are manufactured in quantities
greater than 1 billion pounds per year. These chemicals are referred to as
commodity chemicals. Two hundred eighteen organic chemicals are manufactured
in quantities between 40 million and I billion pounds per year. These chemi-
cals are referred to as bulk chemicals. Together, these 254 chemicals account
for approximately 91 percent of total annual production volume of organic
chemicals as reported in the 308 Questionnaire survey data base for the OCPSF
industry. By sampling OCPSF plants that manufacture many of these high-volume
chemicals, as well as other types of OCPSF plants, EPA has, in fact, gathered
sampling data that are representative of production in the entire industry.
Based on the results of its comparison analysis and the adequate coverage
of the OCPSF industry in its sampling programs, the Agency believes that
plants within each of its BAT subcategories can achieve BAT effluent limita-
tions despite differing product/process mix.
The Agency has also determined that because of their unique high raw
wastewater zinc characteristics and treatability noted in Sections V and VII,
IV-41

respectively, producers of rayon by the viscose process and acrylic fibers by
the zinc chloride/solvent process will receive different BAT effluent limita-
tions for zinc than the remainder of the 0CPSF industry, whose BAT limitations
will be based on the performance of chemical precipitation technology used in
the Metal Finishing Point Source Category.
c. Energy and Non-Water Quality Aspects
Energy and non-water quality aspects include the following:
• Sludge production
• Air pollution derived from wastewater generation and treatment
• Energy consumption due to wastewater generation and treatment
• Noise from wastewater treatment.
The basic treatment step, used by virtually all plants in all subcategories
that generate raw wastes containing basically BOD 5 and TSS, is biological
treatment. Therefore, the generation of sludges, air pollution, noise, and
the consumption of energy will be homogeneous across the industry. However,
the levels of these factors will relate to the volume of wastewater treated
and their associated pollutant loads. Since the volumes of wastewater gener-
ated and wastewater characteristics were considered in earlier sections, it is
believed that all energy and nonwater quality aspects have been adequately
addressed in this final subcategorization approach.
IV-42

SECTION V ,
WATER USE AND WASTEWATER CHARACTERIZATION
A. WATER USE AND SOURCES OF wASTEWATER
The Organ ic C h e m i c a l s , P l a s t i c s , and S y n t h e t i c F i b e r s (OCPSF) i n d u s t r y
u s e s l a r g e vo lumes o f w a t e r i n t he m a n u f a c t u r e o f p r o d u c t s . Water use and
w a s t e w a t e r g e n e r a t i o n o c c u r a t a number o f p o i n t s i n m a n u f a c t u r i n g p r o c e s s e s
and a n c i l l a r y o p e r a t i o n s , i n c l u d i n g : 1) d i r e c t and i n d i r e c t c o n t a c t p r o c e s s
w a t e r ; 2) c o n t a c t and n o n c o n t a c t c o o l i n g w a t e r ; 3) u t i l i t i e s , m a i n t e n a n c e , and
h o u s e k e e p i n g w a t e r s ; and 4) w a t e r s from a i r p o l l u t i o n c o n t r o l s y s t e m s Such as
V e n t u r i s c r u b b e r s .
The OCPSF effluent limitations and standardsapply to the discharge of
"process wastewater," which is defined as any water that, during manufacturing
or processing, comes into direct contact with or results from the production
or use of any raw material, intermediate product, finished product,
by-product, or waste product (40 CFR 401.11(q)). An example of'direct contact
process wastewater is the use of aqueous reaction media. The use of water as
a medium for certain chemical processes becomes a major hlgh-strength process
wastewater source after the primary reaction has been completed and the final
product has been separated from the water media, leaving residual product and
unwanted by-products formed during secondary reactions in solution.
Indirect contact process wastewaters, such as those discharged from
vacuum jets and steam ejectors, involve the recovery of solvents and volatile
organics from the chemical reaction kettle. In using vacuum jets, a stream of
water is ~sed to create a vacuum, but also draws off volatilized solvents and
organics from the reaction kettle into solution. Later, recoverable solvents
are separated and reused while unwanted volatile organics remain in solution
in the vacuum water, which is discharged as process wastevater. Steam ejector
systems are similar to vacuum jets with steam being substituted for water.
The steam is then drawn off and condensed to form a source of process
wastewater.
V-i

The major volume of water used in the OCPSF industry is cooling water.
Cool ing w a t e r may be c o n t a m i n a t e d , such as c o n t a c t c o o l i n g wa te r ( c o n s i d e r e d
p r o c e s s w a s t e w a t e r ) from b a r o m e t r i c c o n d e n s e r s , or uncon tamina t ed n o n c o n t a c t
c o o l i n g w a t e r . "Noncon tac t c o o l i n g w a t e r " i s d e f i n e d as wa te r used f o r
c o o l i n g t h a t does not come i n t o d i r e c t c o n t a c t w i th any raw m a t e r i a l , i n t e r -
med ia t e p r o d u c t , was te p r o d u c t , or f i n i s h e d p r o d u c t (40 CFR 4 0 1 . 1 1 ( n ) ) .
F r e q u e n t l y , l a r g e volumes of n o n c o n t a c t c o o l i n g wa te r may be used on a once -
through b a s i s and d i s c h a r g e d a f t e r commingling wi th p r o c e s s w a s t e w a t e r . Many
of the w a s t e w a t e r c h a r a c t e r i s t i c s r e p o r t e d by p l a n t s in the d a t a b a s e s were
based on f low volumes t h a t i n c l u d e d both p r o c e s s w a s t e w a t e r and n o n p r o c e s s
w a s t e w a t e r such as n o n c o n t a c t c o o l i n g w a t e r . Other t y p e s o f n o n p r o c e s s
w a s t e w a t e r i n c l u d e : b o i l e r blowdown, wa te r t r e a t m e n t w a s t e s , s t o r m w a t e r ,
s a n i t a r y w a s t e , and s team c o n d e n s a t e . An a d j u s t m e n t o f the r e p o r t e d volumes
of the e f f l u e n t s was t h e r e f o r e r e q u i r e d to a r r i v e a t pe r fo rmance o f t r e a t m e n t
sy s t ems and o t h e r e f f l u e n t c h a r a c t e r i s t i c s .
This adjustment was made by eliminating the uncontaminated cooling water
volume from the total volume, to arrive at the contaminated wastewater flow at
the sampling site. The concentrations of the conventional pollutants BOD5,
COD, TSS, and TOC were adjusted using the simplifying judgment that the
uncontaminated cooling water did not contribute to the pollutant level.
However, it should be noted that in some cases noncontact cooling water can
contribute pollutant loading, especially to typically low-strength plastics
and synthetic materials wastewaters.
In some cases, effluent priority pollutant and daily conventional
pollutant data submitted by plants were from sample sites that included
nonprocess wastewater. Where this dilution with noncontact cooling water or
other nonprocess wastewater was significant (i.e., >25 percent of total), such
data were considered nonrepresentative of actual treatment systems' daily
performance and were excluded from the data base used for assessing treatment
system performance variability factors.
V-2

B. WATER USE BY MODE OF DISCHARGE
Industry process wastewater flow descriptive statistics are summarized in
Table V-I for 929 OCPSF plants that submitted sufficient information in the
1983 Section 308 Questionnaire. This database is classified by direct,
indirect, or zero discharge status. "Zero" discharge methods include no
discharge, land application, deep well injection, incineration, contractor
removal, evaporation, off-slte treatment by a privately owned treatment
system, and discharge to septic and leachate fields.
Some of the plants in the 308 data base discharge waste streams by more
than one method. However, for purposes of tabulating wastewater data, each
plant was assigned to a single discharge category (i.e., no double counting
appears in the direct, indirect, and zero discharge data columns). A plant
was classified as a zero or alternate discharger only if all of its waste
streams were reported as zero or alternate discharge streams. Plants were
classified as direct dischargers if at least one process wastewater stream was
direct. Plants whose process wastewater streams were discharged to publicly
owned t r e a t m e n t works (POTWs) were classified as indirect dischargers. Many
of the indirect discharge plants discharge noncontact cooling water directly
to surface waters.
Industry nonprocess wastewater flow descriptive statistics are summarized
in Table V-2 for 718 OCPSF plants as classified in Table V-I by process
wastewater discharge status.
C. WATER USE BY SUBCATEGORY
As discussed previously in Section IV, data relating product/process
production information to flow was requested from industry in the 1983 Section
308 Questionnaire to facilitate the flow proportioning of individual product
subcategory limitations for multiple subcategory plants. This information
would have also facilitated the presentation of the wastewater flow data by
subcategory. Unfortunately, much of the production/flow information (when
supplied) was either estimated or grouped with other product/process flows and
was considered too inaccurate or nebulous for use. Since this information
V-3

TABLE V-I. TOTAL OCPSF PLANT PROCESS WASTEWATER
FLOW CHARACTERISTICS BY TYPE OF DISCHARGE
Process Wastewater Discharge Status
D i r e c t I n d i r e c t Zero
Descriptive Statistics
Number of Plants* 304 393 232
Percentage of Plants 33% 42% 25%
Total Flow (NGD) 387 94 32
Average Flow (MGD) 1.31 0.25 0.24
Median Flow (MGD) 0.40 0.04 0.007
Frequency Counts (# of Plants) By Flow Range
<0.005 MGD 25 106 161
0.005 to 0.01MGD 12 34 11
>0.01 to 0.i0 MGD 54 136 30
>0.I0 to 0.50 MGD 80 77 16
>0.5 to 1.0 MGD 43 26 4
>i.0 to 5.0 MGD 75 12 10
>5.0 to I0.0 MGD 8 i 0
>I0 MGD (up to a maximum of 19.3 MGD) 7 1 0
*(N) = 929 out of 940 scope facilities
Source: 1983 Section 308 Questionnaire Responses
V-4

TABLE V-2. TOTAL OCPSF PLANT NONPROCESS WASTEWATER
FLOW CHARACTERISTICS BY TYPE OF DISCHARGE
Nonprocess Wastewater Discharge Status
D i r e c t I n d i r e c t Zero
D e s c r i p t i v e S t a t i s t i c s
Number o f P l a n t s * 278 332 108
P e r c e n t a g e of P l a n t s 39~ 46Z 15Z
T o t a l Flow (MGD) 3,973 353 103
Average Flow (MGD) 14.29 1.06 0.95
Median Flow (MGD) 0.40 0.03 0.05
Frequency Counts (# of Plants) By Flow Range
<0.005 MGD Ii 76 21
0.005 to 0.01MGD 14 36 16
>0.01 to 0.I0 MGD 53 117 34
>0.I0 to 0.50 MGD 77 56 20
>0.5 to 1.0 MGD 32 22 8
>I.0 to 5.0 MGD 42 19 5
>5.0 to I0.0 MGD 12 3 1
>i0 MGD (up to a maximum of 1,732 MGD) 37 3 3
*(N) = 718 ou t o f 940 scope f a c i l i t i e s r e p o r t i n g d i s c h a r g e o f n o n p r o c e s s wastewater
Source : 1983 S e c t i o n 308 Q u e s t i o n n a i r e Responses
V-5

could not be used to group these flow data accurately, the Agency has decided
to present these data using; two methodologies. The first method utilizes an
approach similar to the regression model used for subcategorization to
proportion these data among subcategories. The second methodology places
individual plants completely in one of the seven final subcategories based on
a prescribed set of rules. These two methodologies are discusssed in more
detail in the following sections.
Tables V-3 through V-16 provide the 1980 process and nonprocess
wastewater flow statistics by subcategory and disposal method. Tables V-3
through V-9 present separate tabulations for primary and secondary producers
and for process and nonprocess wastewater. In each table, the mean and median
flows for multi-subcategory plants have been divided into subcategories using
the regression methodology described in Section IV based on plant production
volume proportions for each subcategory. Thus, mean and median flows given in
some cases may not represent actual plant subcategory flow since, on a unit of
production basis, different products produce different flow volumes. However,
data constraints preclude direct attribution of process and nonprocess flows
to individual products or product subcategory groups. Production weighted
mean subcategory flow values were calculated using the following formula:
Production Weighted Mean = PIFI + P2 F2 + P3F3 + "'" + PiFi
PI + P2 + P3 + "'" + Pi
Where:
PI = Decimal subcategory proportion of total OCPSF plant production for plant #1 (range = 0 to 1.0)
F 1 = Total process flow for plant #i.
In determining the median, the wastewater flow of each plant that has at
least one product within a subcategory are ranked from lowest to highest. The
subcategory decimal production proportions are summed starting from the lowest
flow plant until the sum equals or exceeds 50 percent of the total of all the
decimal production proportions. The wastewater flow of the plant whose
proportions when added to tile proportion sum causes the total to exceed
V-6

TABLE V-3 PROCESS NASTEWATER FLOM FOR PRIMARY OCPSF PRODUCERS
BY SUBCATEGORY AND DISPOSAL METHOD DIRECT DISCHARGERS
SUBCATEGORY MEAN MEDIAN STANDARD NUMBER OF NUMBER OF (HOD) ( M G D ) DEVIATION OBSERVATIONS PLANTS
THERMOPLASTICS 1.00 0.43 1.70 60.99 104
THERMOSETS 0.71 0.08 1.66 12.10 31
RAYON 8.04 8.57 2.98 3.19 5
FIBERS 1.14 0.57 2.31 13.73 22
COHMODITY ORGANICS 2.16 1.00 3.75 48.85 84
BULK ORGANICS 1.53 0.29 3.43 47.53 113
SPECIALTY ORGANICS 0.84 0.30 1.74 41.61 103
INDIRECT DISCHARGERS
SUBCATEGORY MEAN MEDIAN STANDARD NUMBER OF NUMBER OF (MGD) ( M G D ) DEVIATION OBSERVATIONS PLANTS
THERMOPLASTICS 0.25 0.05 0.65 68.57 108
THERMOSETS 0.08 0.02 0.28 40.97 80
FIBERS 0.05 0.02 0.06 7,00 8
COHMOOITY ORGANICS 0.57 0.04 1.71 18,43 36
BULK ORGANICS 0.48 0.05 1.15 33.71 84
SPECIALTY ORGANICS 0.34 0.06 1.49 106.31 154
V-7

TABLE V'4
PROCESS WASTEWATER FLOi~ DURING 1980 FOR SECONDARY OCPSF
PRODUCERS BY SUBCATEGORY AND DISPOSAL METHOD
DIRECT DISCHARGERS
SUBCATEGORY MEAN
(MGD)
MEDIAN
(MGD)
STANDARD
DEVIATION
NUMBER OF
OBSERVATIONS
NUMBER OF
PLANTS
THERMOPLASTICS 0.15 0.08 0.26 8.68 12
THERMOSETS 0.50 0.01 0.93 4.03 5
ORGANICS 0.70 0.20 1.2T 28.29 30
INDIRECT DISCHARGERS
SUBCATEGORY MEAN
(MGD)
MEDIAN
(MC, D)
STANDARD
DEVIATION
NUMBER OF
OBSERVATIONS
NUMBER OF
PLANTS
THERMOPLASTICS 0.03 0.01 0.05 16.59 2?
THERMOSETS 0.03 0.00 0.08 20.90 30
ORGANICS 0.11 0.02 0.18 52.51 58
V-8

TABLE V-5
PROCESS WASTEWATER FLOW FOR PRIMARY & SECONDARY
OCPSF PRODUCERS THAT ARE ZERO~ALTERNATIVEDISCHARGERS
SUBCATEGORY
THERMOPLASTICS
THERMOSETS
ORGANICS
FIBERS
COMMODITY ORGANICS
BULK ORGANICS
SPECIALTY ORGANICS
MEAN MEDIAN
(MGD) ( M G D )
0.08 0.01
0.01 0.00
0.42 0.03
0,33 0.08
0.91 0.91
0.31 0.30
0.16 0.11
STANDARD
DEVIATION
0.26
0.08
0.93
0.98
0.37
0.19
NUMBER OF NUMBER OF
OBSERVATIONS PLANTS
24.92 36
33.11 40
60.71 69
2.31 3
0.84 1
1.30 3
2.81 4
V-9

TABLE V-6
NON-PROCESS WASTEWATER FLOW DURING 1980
FOR SECONDARY OCPSF PRODUCERS
AND ZERO/ALTERNATIVE DISCHARGERS
BY SUBCATEGORY & DISPOSAL METHOD
SECONDARY AND DIRECT DISCHARGE PLANTS
SUBCATEGORY MEAN
(MGD)
MEDIAN
(MGD)
STANDARD
DEVIATION
NUMBER OF
OBSERVATIONS
NUMBER OF
PLANTS
THERMOPLASTICS
THERMOSETS
ORGANICS
0.320
0.242
3.564
0.190
0.250
0.255
0.760
0.242
11.546
8.72
1.03
27.25
12
2
29
SECONDARY AND INDIRECT DISCHARGE PLANTS
SUBCATEGORY MEAN
(MGD)
MEDIAN
(MGD)
STANDARD
DEVIATION
NUMBER OF
OBSERVATIONS
NUMBER OF
PLANTS
THERMOPLASTICS
THERMOSETS
ORGANICS
0.072
0.458
1.240
0.005
0.020
0.015
0.206
1.179
6.470
19.50
17.99
46.51
29
27
52
SECONDARY AND OTHER DISCHARGE PLANTS*
SUBCATEGORY MEAN
(MGO)
M E D I A N
(MGD)
STANDARD
DEVIATION
NUMBER OF
OBSERVATIONS
NUMBER OF
PLANTS
THERMOPLASTICS
THERMOSETS
ORGANICS
FIBERS
0.242
0.101
0.658
6.455
0.013
0.019
0.031
0.710
1.367
0.184
2.960
20.921
18.00
27.01
47.67
1.31
26
33
57
2
NOTE: THERE ARE 9 PRIMARY PLANTS NOT INCLUDED IN
THAT ARE ZERO DISCHARGERS.
THIS TABLE
V-lO

TABLE V-7
TOTAL OCPSF NON-PROCESS WASTEWATER FLOW IN 1980
FOR PRINARY PRODUCERS BY SUBCATEGORY & DISPOSAL NETHO0
DIRECT DISCHARGERS
SUBCATEGORY NEAN
( NGD )
NEDIAN
( NOD )
STANDARD
DEVIATION
NUNBER OF
OBSERVATIONS
NUHBER OF
PLANTS
THERMOPLASTICS
THERNOSETS
RAYON FIBERS
COMMOOITY ORGANICS
BULK ORGANICS
SPEC[ALTY ORGANICS
9.266
5.228
2.295 9.279
55.125
21.990
8.142
0.280
0.450
2.500
1.910
0.720
0.475
0.200
67.664
62.392
4.263
17.113
232.600
128.821
42.871
58.905
11.904
2.187
11.851
45.738
46.253
35.162
101
33
4
19
78
108
96
INDIRECT DISCHARGERS
SUBCATEGORY NEAN
( NOD )
NEDIAN
( NOD )
STANDARD
DEVIATION
NUHBER OF
OBSERVATIONS
NUNBER OF
PLANTS
THERMOPLASTICS
THERNOSETS
FIBERS
COHHOOITY ORGANICS
BULK ORGANICS
SPECIALTY ORGANICS
0.211
0.141
0,077
3.434
4.808
0.418
0.027
0.020
0.024
0.311
'0.064
0.043
1,326
0.738
0.090
11.510
21.021
1.765
55.056
29.003
4.002
15,329
27.823
74.786
85
62
5
30
67
116
DISCHARGERS OTHER THAN DIRECT OR INDIRECT
SUBCATEGORY HEAN
( NGD )
HEDIAN
( NGD )
STANDARD
DEVIATION
NUHBER OF
OBSERVATIONS
NUNBER OF
PLANTS
THERHOPLASTICS
THERNOSETS
BULK ORGANICS
SPECIALTY ORGANICS
0.027
0.000
0.150
14.560
0.010
0.000
0.150
0.150
0.026
24.171
2.122
0.878
0.208
2.792
V-ll

TABLE V-8
NON-PROCESS COOLING WATER FLOW FOR PRIMARY
OCPSF PRODUCERS BY SUBCATEGORY & DISPOSAL NETHO0
DIRECT DISCHARGERS
SUBCATEGORY MEAN
( MGD )
MEDIAN
( MGD )
STANDARD
DEVIATION
NUMBER OF
OBSERVATIONS
NUMBER OF
PLANTS
THERMOPLASTICS
TNERMOSETS
RAYON
FIBERS
COHMOOITY ORGANICS
BULK ORGANICS
SPECIALTY ORGANICS
0.814
0.259
0.140
0.369
1.097
0.431
0.381
0.182
0.063
0.120
0.337
0.537
0.100
0.077
2.058
0.661
0.125
0,321
1.651
0.936
1.042
58.415
11.992
2.187
12.153
42.908
43.148
42.196
96
33
4
19
75
107
100
INDIRECT DISCHARGERS
SUBCATEGORY MEAN
( MGD )
MEDIAN
( MGD )
STANDARD
DEVIATION
NUMBER OF
OBSERVATIONS
NUMBER OF
PLANTS
THERMOPLASTICS
THERMOSETS
FIBERS
COHMODITY ORGANICS
BULK ORGANICS
SPECIALTY ORGANICS
0.085
0.171
0.068
0.776
0.213
0.097
0.012
0.007
0.090
0.118
0.028
0.011
0.204
1.015
0.057
1.781
0.380
0.231
45.578
25.319
4.027
13.479
24.790
68.806
73
52
5
25
59
99
DISCHARGERS OTHER THAN DIRECT OR INDIRECT
SUBCATEGORY MEAN
( MGD )
MEDIAN
( MGD )
STANDARD
DEVIATION
NUMBER OF
OBSERVATIONS
NUMBER OF
PLANTS
THERMOPLASTICS
THERMOSETS
COMMODITY ORGANICS
BULK ORGANICS
SPECIALTY ORGANICS
0.065
0.004
0.121
0.039
0.023
0.043
0.004
0.121
0.003
0.003
0.039
0.036
2.168
0.878
0.838
0.302
2.815
V-12

TABLE V-9
OCPSF MISCELLANEOUS NON-COOLING NON-PROCESS WASTEWATER FLOW
FOR PR[MARY PRODUCERS BY SUBCATEGORY & DISPOSAL NETHO0
DIRECT DISCHARGERS
SUBCATEGORY MEAN MEDIAN STANDARD NUMBER OF NUMBER OF
( MGD ) ( MGD ) DEVIATION OBSERVATIONS PLANTS
THERHOPLASTICS 9.474 0.485 66.066 62.632 107
THERMOSETS 4.956 0.290 59.320 13.183 36
RAYON 1.67T 0.240 3.467 3.187 5
FIBERS 9.288 1.585 16.800 12.323 20
COHMOOITY ORGANICS 52.918 1.400 226.990 48.535 84
BULK ORGANICS 20.449 0.660 : 123.687 50.649 118 SPECIALTY ORGANICS 6.504 0 , 2 3 3 37.616 46.491 111
INDIRECT DISCHARGERS
SUBCATEGORY MEAN MEDIAN STANDARD NUMBER OF NUMBER OF ( MGD )' ( NGD ) DEVIATION OBSERVATIONS PLANTS
THERMOPLASTICS 0.262 0.030 1.318 64.020 100 THERMOSETS 0.236 0.025 1.088 35.707 72 FIBERS 0.116 0.063 0.130 5.002 6 COHMODITY ORGANICS 3.727 0.639 11.519 16.932 32 BULK ORGANICS 4.365 0.106 1 9 . 7 9 8 31.855 7S
SPECIALTY ORGANICS 0.434 0.069 1.708 87.683 131
DISCHARGERS OTHER THAN DIRECT OR INDIRECT
SUBCATEGORY MEAN MEDIAN STANDARD NUMBER OF NUMBER OF ( MGD ) ( MGD ) DEVIATION OBSERVATIONS PLANTS
THERMOPLASTICS 0.063 0.090 0~048 3.168 5
THERHOSETS 0.004 0.004 0.878 1
COHMODITY ORGANICS 0.121 0.121 0.838 1
BULK ORGANICS 0.143 0.153 0.302 2
SPECIALTY ORGANICS 14.466 0.153 24.107 2.815 4
V-13

TABLE V-lO
PROCESS; WASTEWATER FLOW FOR PRIMARY OCPSF PRODUCERS
BY SUBCATEGORY AND DISPOSAL METHOD
DIRECT DISCHARGERS
( 95X & 70% RULES )
SUBCATEGORY TOTAL.
FLOW (MGD) °
MIN
(MGD)
MAX
(MGD)
MEAN
(MGD)
MEDIAN
(MGD)
STANDARD
DEVIATION
NUMBER OF PLANTS
THERMOPLASTICS
THERMOSETS
RAYON FIBERS
COMMODITY ORGANICS BULK ORGANICS
SPFCIALTY ORGANICS
MIXED
24.884
3.080
24.639' 7.422
25.909 27.146
16.985 194.299
0,02100
0.00001
5,03000 0,24300
0.00144 0.00020
0.00075 0.00002
3.450
2.680
11.039 1,482
3.890 18.000
3.450 19.323
0.61
0.51
8.21 0.82
0.96 1.06
0.59 2.23
0.31
0.09
8.57 0.63
0.66
0.11
0.26 0.85
0.73
1,06
3.02 0.46
1,04
3.49
0.91 3.68
A1
6
3 9
27
26
29
87
INDIRECT DISCHARGERS
( 95X & 70X RULES )
SUBCATEGORY TOTAL FLOW
(MGD)
MIN (MGD)
MAX (MGD)
MEAN ( M G D )
MEDIAN (MGD)
STANDARD DEVIATION
NUMBER OF PLANTS
THERMOPLASTICS
THERMOSETS
FIBERS COMMODITY ORGANICS
BULK ORGANICS
SPECIALTY ORGANICS
MIXED
8.0439
0.7884 0,3768
11.4154 8.1822
32.4242
22.3383
0.0000070
0.0001000 0.0003000
0.0078000 0.0007000
0.0000100
0.0000343
1.240
0.350 0.160
7.970
2.963
15.439
4.840
0.16
0.05 0.05
1.14 0.48
0.36
0.26
0.05
0.00 0.02
0.28
0.05
0.07
0.03
0.27
0.10 0.06
2.46 0.92 1.63
0.74 :,
49
16
7
10
17
90
86
V-14

TABLE V'11 PROCESS WASTEWATER FLOW DURING 1980 FOR SECONDARY OCPSF
PRODUCERS BY SUBCATEGORY AND D|SPOSAL METHOD ( 95 ~ RULE )
DIRECT DISCHARGERS
SUBCATEGORY MINIMUM MAXIMUM MEAN MEDIAN STANDARD NUMBER OF
(HGD) (MGD) (MGD) ( M G D ) DEVIATION OBSERVAT)ONS
THERMOPLASTICS 0.00016 0.20 0.08 0.05 0.08 8
THERMOSETS 0.00369 1.90 0.50 0.06 0.93 4
ORGANICS 0.00001 4.70 0.69 0.17 1.30 27
MIXED 0.75000 0.97 0.86 0.86 0.16 2
( 95 X RULE )
INDIRECT DISCHARGERS
SUBCATEGORY MINIMUM MAXIMUH' MEAN MEDIAN STANDARD NUMBER OF
(MGD) (MGD) (MGD) ( H G D ) DEVIATION OBSERVATIONS
THERMOPLASTICS O.OOO3OO 0.0920 0.02 0.01 0.03 11
THERMOSETS 0.000054 0.1400 0.02 0.00 0.04 15
ORGANICS 0.000050 0.6300 0.10 0.02 0.17 48
MIXED 0.000200 0.5585 0.07 0.01 0.15 16
V-15

TABLE V-12
PROCESS WASTEWATER FLOW FOR PRIMARY & SECONDARY
OCPSF PRODUCERS THAT ARE ZERO/ALTERNATIVE DISCHARGERS
( 95% & 70% RULES )
SUBCATEGORY MINIMUM MAXIMUM MEAN MEDIAN STANDARD NUMBER OF
(MGD) (MGD) (MGD) (MGD) DEVIATION PLANTS
THERMOPLASTICS 0.00001 0.34 0.05 0.01 0.09 21
THERMOSETS 0.00004 0.02 0.00 0.00 0.00 27
ORGANICS 0.00000 4.40 0.40 0.03 0.94 55
FIBERS 0.00010 0.08 0.04 0.04 0.06 2
COMMODITY ORGANICS 0.90700 0.91 0.91 0.91 I
BULK ORGANICS 0.29700 0.30 0.30 0.30 I
SPECIALTY ORGANICS 0.00450 0.33 0.15 0.11 0.16 3
MIXED 0.00006 2.20 0.33 0.01 0.70 16
V-16

TABLE V-13
NON-PROCESS WASTEWATER FLOW DURING 1980
FOR SECONDARY OCPSF PRODUCERS
AND ZERO/ALTERNATIVE DISCHARGERS
BY SUBCATEGORY & DISPOSAL METHOD
( 95% & 70% RULES )
SECONDARY AND DIRECT DISCHARGE PLANTS
SUBCATEGORY MINIMUM
(MGD)
MAXIMUM
(HOD)
MEAN
(HOD)
MEDIAN
(MGD)
STANDARD
DEVIATION
NUMBER OF
PLANTS
THERMOPLASTICS
THERMOSETS
ORGANICS
MIXED
0.00165
0.25000
0.00200
0.19000
0.710
0.250
59.800
7.600
0.234
0.250
3.500
3.510
0.120
0.250
0.125
2.740
0.289
12.038
3.765
8
1
25
3
( 95% & 70% RULES )
SECONDARY AND INDIRECT DISCHARGE PLANTS
SUBCATEGORY MINIMUM
(MGD)
MAXIMUM
(MGD)
MEAN
(MGD)
MEDIAN
(MGD)
STANDARD
DEVIATION
NUMBER OF
PLANTS
THERMOPLASTICS
THERMOSETS
ORGANICS
MIXED
0.00010
0.00090
0.00010
0.00050
0.250
5.000
44.100
2.100
0.037
0.492
1.317
0.341
0.003
0.007
0.012
0.059
0.072
1.372
6.806
0.590
14
13
42
15
( 95% & 70% RULES )
SECONDARY AND OTHER DISCHARGE PLANTS*
SUBCATEGORY MINIMUM
(MGD)
MAXIMUM
(MGD)
MEAN
(MGD)
MEDIAN
(MGD)
STANDARD
DEVIATION
NUMBER OF
PLANTS
THERMOPLASTICS
THERMOSETS
ORGANICS
FIBERS
MIXED
0.00050
0.00171
0.00001
0.71000
0.0g370
1.500
0.590
5.750
0.710
24.700
0.136
0.092
0.360
0.710
1.935
0.010
0.020
0.028
0.710
0.076
0.381
0.156
0.934
6.559
15
22
42
1
14
NOTE: THERE ARE 9 PRIMARY PLANTS NOT INCLUDED IN THIS TABLE
THAT ARE ZERO DISCHARGERS.
V-17

TABLE V-14
TOTAL OCPSF NON-PROCESS WASTEWATER FLOt4 IN 1980
FOR PRIMARY PRODUCERS BY SUBCATEGORY & DISPOSAL METHOD
DIRECT DISCHARGERS
( 95X & 70% RULES )
SUBCATEGORY MINIMUM
( MGD )
MAXIMUM
( MGD )
MEAN
( MGD )
MEDIAN
( MGD )
STANDARD
DEVIATION
NUMBER OF
PLANTS
THERMOPLASTICS
TNERMOSETS
RAYON
FIBERS
COMMODITY ORGANICS
BULK ORGANICS
SPECIALTY ORGANICS
MIXED
0.00022
0.00007
0.14000
0.07200
0.00200
0.00521
0.00266
0.00010
30.744
15.605
2.500
44.364
648.000
38.400
15.626
1731.700
2.106
2.659
1.320
10.727
25.595
3.267
1.842
43.023
0.212
0.218
1,320
4.526
0.409
0.269
0.179
1.281
5.603
5.741
1.669
15.621
126.949
8.123
3.613
195.531
39
7
2
8
26
25
22
83
INDIRECT DISCHARGERS
( 95% & 70% RULES )
SUBCATEGORY MINIMUM
( MGD )
MAXIMUM
( MGD )
MEAN
( MGD )
MEDIAN
( MGD )
STANDARD
DEVIATION
NUMBER OF
PLANTS
THERMOPLASTICS
THERMOSETS
FIBERS
COMMODITY ORGANICS
BULK ORGANICS
SPECIALTY ORGANICS
MIXED
0.00000
0.00030
0.01770
0.00520
0.00290
0.00020
0.00010
1.490
0.335
0.210
47.146
111.260
8.830
11.157
0.154
0.052
0.077
6.859
8.662
0.439
0.469
0.021
0,012
0.040
1.159
0.060
0.063
0.030
0.306
0.099
0.090
16.310
30.827
1.271
1.648
40
11
4
8
13
61
69
DISCHARGERS OTHER THAN DIRECT OR INDIRECT
( 95% & 70% RULES )
SUBCATEGORY MINIMUM
( MGD )
MAXIMUM
( MGD )
MEAN
( MGD )
MEDIAN
( MGD )
STANDARD
DEVIATION
NUMBER OF
PLANTS
THERMOPLASTICS
SPECIALTY ORGANICS
MIXED
0.01000
0.05000
0.00010
0.047
40.480
0.000
0.028
13.560
0.000
0.028
0.150
0.000
0.026
23.313
V-18

TABLE V-15
NON-PROCESS COOLING WATER FLOW FOR PRIMARY
OCPSF PROOUCERS BY SUBCATEGORY & DISPOSAL METHO0
DIRECT DISCHARGERS
( 95~ & 70X RULES )
SUBCATEGORY MINIMUM
( MGD )
MAXIMUM
( MGD )
MEAN
( MGD )
MEDIAN
( MGD )
STANDARD
DEVIATION
NUMBER OF
PLANTS
THERMOPLASTICS
THERNOSETS
RAYON
FIBERS
COMMODITY ORGANICS
BULK ORGANICS
SPECIALTY ORGANICS
MIXED
0.00414
0.00007
0,10000
0.08300
0.00500
0.00165
0.00001
0.00070
10.045
1.072
0.120
1,086
3.167
3.300
2.303
12.400
0,T36
0.290
0.110
0.411
0.884
0.277
0.229
0.843
0.177
0.038
0.110
0.325
0.468
0.078
0.041
0.288
1.969
0.441
0.014
0.351
0.999
0.699
0.456
1.791
40
7
2
8
24
22
29
81
INDIRECT DISCHARGERS
( 95~ & 70~ RULES )
SUBCATEGORY MINIMUM
( MGD )
HAXIMUM
( MGD )
MEAN
( MGD )
MEDIAN
( MGD )
STANDARD
DEVIATION
NUMBER OF
PLANTS
THERMOPLASTICS
THERHOSETS
FIBERS
COMMODITY ORGANICS
BULK ORGANICS
SPECIALTY ORGANICS MIXED
0.00009
0.00010
0.00731
0.02814
0.00300
0.00004 0.00001
0.890
0.029
0.135
2.758
0.999
1,600 8.000
0.077
0.009
0.067
0.786
0.172
0.096 0.247
0.012
0.006
0.063
0.481
0,014
0.011 0.016
0.194
0.009 0.057
0.931
0.320
0.232 1.074
34
9
4
8
13
58 56
DISCHARGERS OTHER THAN DIRECT OR INDIRECT
( 95~ & 70~ RULES )
SUBCATEGORY MINIMUM
( MGD )
MAXIMUM
( MGD )
MEAN
( MGD )
MEDIAN
( MGD )
STANDARD
DEVIATION
NUMBER OF
PLANTS
THERMOPLASTICS
COMMODITY ORGANICS
SPECIALTY ORGANICS
MIXED
0.04300
0.12100
0.00120
0.00400
0,092
0.121
0.060
0.004
0.067
0.121
0.021 .
0.004
0.067
0.121
0.003
0.004
0.035
0.034
V-19

TABLE V-16
OCPSF MISCELLANEOUS NON-COOLING NON'PROCESS WASTEWATER FLOW
FOR PRIMARY PRODUCERS BY SUBCATEGORY & DISPOSAL METHOD
DIRECT DISCHARGERS
( 95~ & 70% RULES )
SUBCATEGORY MINIMUM MAXIMUM MEAN MEDIAN STANDARD NUMBER OF
( MGD ) ( MGD ) ( MGD ) ( MGD ) DEVIATION PLANTS
THERMOPLASTICS 0.00100 30.896 2.657 0.396 6.235 42
THERMOSETS 0.00015 15.643 2.949 0.290 5.687 7
RAYON 0.12000 2.500 0.953 0.240 1.341 3 FIBERS 0.22100 44.447 11.138 4.929 15.500 8
COMMOOITY ORGANICS 0.01200 651.167 25.432 0.884 125.062 27
BULK ORGANICS 0.00521 41.700 3.135 0.304 8.264 28
SPECIALTY ORGANICS 0.00031 15.703 1.474 0.173 3.097 32
MIXED 0.00080 1739,330 40,435 1.410 188,898 90
INDIRECT DISCHARGERS
( 95% & 70% RULES )
SUBCATEGORY MINIMUM MAXIMUM MEAN MEDIAN STANDARD NUMBER OF
( MGD ) ( MGD ) ( MGD ) ( MGD ) DEVIATION PLANTS
THERMOPLASTICS 0.00000 2.380 0.187 0.028 0.411 47
THERMOSETS 0.00010 0.350 0.047 0.018 0.092 14
FIBERS 0.02411 0.345 0.115 0.063 0.131 5
COMMODITY ORGANICS 0.04480 49.904 6.795 0.898 16.218 9
BULK ORGANICS 0.00300 111.960 7.178 0.081 27.944 16
SPECIALTY ORGANICS 0.00004 9.367 0.449 0.080 1.286 72
MIXED 0.00011 11.417 0.592 0.052 1.797 78
DISCHARGERS OTHER THAN DIRECT OR INDIRECT
( 95% & 70% RULES )
SUBCATEGORY MINIMUM MAXIMUM MEAN MEDIAN STANDARD NUMBER OF
( MGD ) ( MGD ) ( MGD ) ( MGD ) DEVIATION PLANTS
THERMOPLASTICS 0.01000 0.092 0.064 0.090 0.047
COMMODITY ORGANICS 0.12100 0.121 0.121 0.121
SPECIALTY ORGANICS 0.05120 40.540 13.581 0.153 23.347
MIXED 0.00410 0.004 0.004 0.004
V-20

50 percent is then chosen as the median. If, however, the total equals
50 percent exactly, then the median is the average of the wastewater flow of
that plant and the next plant in the sequence. The tables are divided into
primary and secondary producers because less detailed production data were
collected from secondary producers. Likewise, less detailed data were
collected from both primary and secondary zero discharge plants. Production
data are identified only by Standard Industrial Classification (SIC) code for
secondary or zero discharge producers, and thus the organics subcategorles
(i.e., bulk, commodity, specialty) must be grouped together.
In each table, the column for "Number of Plants" represents the total
number of plants for whom at least part of their flow was used to derive the
subcategory statistics. Therefore, double or multiple counting of plants
occurs for multi-subcategory plants. The column for "Number of Observations"
represents the sum of plant subcategory production proportions.
Tables V-lO through V-16 also provide 1980 process and nonprocess
wastewater flow statistics by subcategory and disposal technique, but use a
different method to aggregate plants by subcategory. Plants were placed in
one of five categories (Thermoplastics, Thermosets, Rayon, Organics, Fibers)
if their production was at least 95 percent contained in that category.
Plants having less than 95 percent were placed in a sixth category (Mixed).
The organics category was then further subdivided into three subcategories
(Commodity, Bulk, Specialty) if the plant's organics production was at least
70 percent contained in one of the subcategories. Plants with less than
70 percent production were also placed in the mixed category. As with the
tables generated using the regression methodology, production data are
identified only by SIC code for secondary or zero discharge producers, and
thus the organics subcategories (Commodity, Bulk, Specialty) were grouped
together in the tables for these plants.
Tables V-3 and V-4 provide process wastewater flow statistics for primary
and secondary producers, respectively, with each divided into direct and
indirect dischargers using the regression methodology. Tables V-10 and V-f1
present the same flow statistics using the 95 percent production basis for
assigning plants to subcategories for the four nonorganics subcategories and
V-21

the 70 percent organics production basis for the three organics subcategories
(95/70 methodology). Table V-5 provides process wastewater flow statistics
for the zero or alternate discharge plants using the regression methodology,
while Table V-12 presents the same flow statistics using the 95/70 methodology.
Tables V-6 through V-9 provide 1980 flow statistics for nonprocess wastewaters
using the regression methodology, while Tables V-13 through V-16 present the
same flow statistics using the 95/70 methodology.
The data in each table are grouped by the disposal method of the plants'
process wastewater. In general, plants that discharge process wastewater
directly will also discharge nonprocess wastewater directly. However, in some
cases, plants that discharge process wastewater indirectly or by zero or
alternate discharge methods may discharge their non-process wastewaters
directly due to the generally lower treatment requirements of many nonprocess
waste streams.
Tables V-6 and V-13 provide the nonprocess flow statistics for secondary
producers and zero and alternate dischargers. Tables V-7 and V-14 provide the
total nonprocess flow statistics for primary producers, while Tables V-8
through V-9 and Tables V-15 through V-16 provide the portions of these flows
that are composed of cooling water versus other miscellaneous nonprocess
wastewater.
The cooling water In TELbles V-8 and V-15 include both once-through
noncontact cooling water plus cooling tower blowdown and for some plants may
include other nonprocess wastewater where flows were reported as a combined
total. It Is evident from these tables that cooling water comprises the major
portion of nonprocess wastewater for most plants and that direct dischargers
produce greater quantities of nonprocess wastewater than indirect dischargers.
In general, the summary statistics for wastewater flow by subcategory
that were generated by the two methodologies compare favorably; all of the
differences between subcategory medians calculated by the two methodologies
fell within the standard deviations calculated by either methodology. Reasons
for the differences include the inaccurate nature of assigning individual
plants to subcategories, i.e., the arbitrary assignment of plants based on the
V-22

95/70 rule, which was determined to be insufficient for previous sub-
categorization efforts, as well as the relative contribution of the extra 5 or
30 percent of other subcategories' flows depending on if the plant is pre-
dominantly plastics or organics, respectively. Based on the inherent
limitations of the 95/70 methodology, the Agency has much more confidence in
the utility of the regression methodology summary statistics, but has included
the 95/70 summary statistics for comparison purposes.
D. WATER REUSE AND RECYCLE
1. Water Conserva t ion and Reuse Technologies
A v a r i e t y of water conse rva t ion p r a c t i c e s and t echno log i e s a re a v a i l a b l e
to OCPSF p l a n t s . Because of the d i v e r s i t y wi th in the i n d u s t r y , no one se t of
conservation practices is appropriate for all plants. Decisions regarding
water reuse and conservation depend on plant-speclflc characteristics, as well
as slte-speciflc water supply and environmental factors (e.g., water avail-
ability, cost, and quality). Therefore, this section will describe the range
of practices and technologies available for water conservation.
Conventional water conservation practices include (HcGovern 1973; Holiday
!982):
• Recovery and reuse of steam condensates and process condensates, where possible
• Process modifications to recover more product and solvents
• Effective control of coollng-tower treatment and blowdown to optimize cycles of concentration
• Elimination of contact cooling for off vapors
• Careful monitoring of water uses; maintenance of raw water treatment systems and prompt attention to faulty equipment, leaks, and other problems
• Installation of automatic monitoring and alarm systems on in-plant discharges. ,~
V-23

Table V-17 summarizes water conservation technologies, and their applications,
limitations, and relative costs to industry plants. Some of these technolo-
gies, such as steam stripping, are also considered effluent pollution control
technologies. Water conservation, in fact, can often be a benefit of mandated
pollution control.
2. Current Levels of Reuse and Recycle
Data on the amount of water reused and recycled in the OCPSF industry
from the 1978 Census Bureau survey and the 1983 308 Questionnaires are
presented in Tables V-18 and V-19, respectively.
In Table V-18, the Census Bureau defines "recirculated or reused water"
as the volume of water recirculated multiplied by the number of times the
water was reclrculated. Seventy-nine percent of the OCPSF plants surveyed by
the Census Bureau reported some recirculation or reuse of water. Census
Bureau statistics show that the bulk of recirculated water is used for cooling
and condensing operations, such as closed-loop cooling systems for heat
transport. Chemical algaecides and fungicides are routinely added to these
cooling waters to prevent organism growth and suppress corrosion, both of
which can cause exchanger fouling and reduction of heat transfer co-
efficients.
As water evaporates and leaks from such closed systems, the concentration
of minerals in these waters increases, which may lead to scale formation,
reducing heat transfer efficiency. To reduce such scaling, a portion of such
closed system waters is periodically discharged as blowdown and replaced by
clean water.
Table V-19 shows the 1980 recycle flow of process and nonprocess
wastewaters for OCPSF plants that are primary producers, excluding zero and
alternate dischargers as reported in the 1983 Section 308 Questionnaire. The
flow rates shown were for wastewater streams where the final disposal method
was reported as recycle. Thus, the data do not reflect the number of times
the wastewater is recycled (as in Census Bureau data), nor do they include
flow in closed-loop systems such as cooling towers, since water in such
V-24

TABLE V-17. WATER CONSERVATION AND REUSE TECHNOLOGIES
Technique
Vapor-compression
Waste hea t e v a p o r a t i o n
Reverse osmosis , ! u l t r a f i l t r a t i o n I,o
E l e c t r o d i a l y s i s
Stream s t r i p p i n g
App l i ca t i ons
Concen t r a t i on of wastewater or coo l ing tower blowdown
Concurrent p roduc t ion of h i g h - p u r i t y water
Concen t r a t i on of wastewater
Condensate r e cove ry
Removal of ionized s a l t s , plus many organ ics
Recovery of heavy meta l s , c o l l o i d a l m a t e r i a l
P roduc t ion o f u l t r a p u r e water
Potable water from s a l i n e or brackish source
Recovery of p rocess condensa tes and o t h e r contaminated waters
Recovery of H~S, NIt~ plus some h g h t o rgan ic s
R e l a t i v e Costs L i m i t a t i o n s Cap i t a l Operat ing
Not f o r o rgan ic s tha t High High form a z e o t r o p e s or s t e a m - d i s t i l l
Foul ing must be c o n t r o l l a b l e
Not fo r o rgan ic s Medium Medium tha t fo rm•azeo t ropes
or s t e a m - d i s t i l l
F o u l i n g - s e n s i t i v e Medium Medium Stream must not
degrade membranes Re jec t s t ream may
be high-volume
Limited to i o n i z a b l e • Medium- Medium salts high
S t r ipped condensa tes Medium Medium-may need f u r t h e r . h i g h p roces s ing
Commen t s
Rapid growth H i g h - q u a l i t y distillate
handles broad range of c o n t a m i n a n t s in water
Not widely used now Future p o t e n t i a l good
Future p o t e n t i a l s t rong I n t e n s e a p p l i c a t i o n -
development underway
• Modest f u t u r e p o t e n t i a l
Well.established as part of some processes

TABLE V-17. WATER CONSERVATION AND REUSE TECHNOLOGIES (Continued)
Technique Applications
Combination we t /d ry c oo l i ng towers
Puts pa r t of tower load on a i r f i n s
Can cut fogging
A i r - f i n coo l ing Numerous process applications
<~ I
Sidestream softening
Reduce cooling- tower blowdown
Source: Holiday 1982
L imi t a t i ons R e l a t i v e Costs
Cap i ta l Opera t ing Comments
Costly compared with wet cooling tower
Medium Medium Growth expected areas
in a r i d
For higher-level heat transfer
Can be prone to freeze-up, waxing
Medium Medium W e l l - e s t a b l i s h e d Good for h igher temper-
a t u r e heat r e j e c t i o n
Dissolved solids must be removable
Control can be difficult
Low-medium
Low-medium
Not widely used Future potential good

TABLE V-18. WATER RECIRCULATED AND REUSED BY USE FOR THE OCPSF INDUSTRIES
1978 CENSUS DATA (a)
Water Recirculated by Use (Billions of Gallons) (b) Industry No. of Establish- Cooling and Condensin ~ Group ments Reporting Steam
(by SIC Code) Recirc/reuse (as Electric Power Air Sanitary Boiler g of Est. Surveyed) Total Process Generation Conditioning Other Service Feed
Organic Chemicals 2865 51 (67%) 279 1.3 (c) 0.2 274 - 3.4 2869 165 (84%) 3,583 76 (c) 33 3,380 (c) 51
T o t a l 216 (79g) 3,862 78 - 34 3,654 - 54
P l a s t i c s / S y n t h e t i c ! F i b e r s to 2821 102 (77%) 653 . 62 (c ) ( c ) 575 (c ) 8 .8
2823 6 (86%) 89 (c ) (c ) 6 45 - (c ) 2824 32 (78%) 458 44 36 163 205 (c ) 2 .8 T o t a l 140 (78%) 1,200 - - - 825 - -
TOTAL 356 (79%) 5,062 - - - 4,479
SOb"RCE: Bureau of the Census 1981
(a) Represents data collected in a special 1978 Survey of Water Use for establishments using 20 million gallons or more of water/year in 1977; smaller volume users were excluded in this survey.
(b) Water R e c i r c u l a t e d and Reused was d e f i n e d as the volume of wate r r e c i r c u l a t e d m u l t i p l i e d by the number o f t imes r e c i r c u l a t e d ; e . g . , i f 100 m i l l i o n g a l l o n s o f i n t a k e wa te r were r e c i r c u l a t e d tw ice , the m a n u f a c t u r e r r e p o r t e d r e c i r c u l a t i o n / r e u s e o f 200 m i l l i o n g a l l o n s .
( c ) Data w i t h h e l d to avo id d i s c l o s i n g o p e r a t i o n s o f i n d i v i d u a l companies .

Plant Group
Organics unxyA-~-- Plastics & Organics Plastics Only All Plants
!
OO Organics Only Plastics & Organics Plastics Only All Plants
TABLE V-19. SUMMARY OF OCPSF PROCESS AND NONPROCESS WASTEWATER
RECYCLE FLOW FOR PRIMARY PRODUCERS EXCLUDING ZERO DISCBARGERS
# of Plants % of All Total Recycle % of Total Flow Reporting Recycle Plants Flow (MGD) of Recyle Plants
Process Wastevater Recycle
17 6.80000 0.6048 6.9487 9 7.43802 16.4571 22.5151
10 5.71429 !.7315 10.7613 36 6.59341 18.7934 19.1990
Nonprocess Wastewater Recycle
2 0.88496 0.02710 2.5566 1 0.85470 0.00010 0.8000 3 1.88679 7.71407 78.4579 6 1.19522 7.74127 70.9908
Z of Total Flow of All Plants
0.56302 4.47080 2.16426 3.38300
0.00447 0.00000 2.94295 0.15497

systems is not considered wastewater until it Reaves the system as blowdown.
As a result of these differences, Table V-19 shows a much lower number of
plants reporting recycle.
The fact that Table V-19 excludes plants that are considered zero dis-
chargers may account for some of this discrepancy, slnceany plant that recy-
cles 100 percent of its process wastewater would be excluded.
D. WASTEWATER CHARACTERIZATION
1. C o n v e n t i o n a l P o l l u t a n t s
A number o f d i f f e r e n t p o l l u t a n t p a r a m e t e r s a r e used to c h a r a c t e r i z e
w a s t e w a t e r d i s c h a r g e d by OCPSP m a n u f a c t u r i n g f a c i l i t i e s . These i n c l u d e :
• Biochemical Oxygen Demand (BODs)
• Total Suspended Solids (TSS)
• pH
• Chemical Oxygen Demand (COD)
• Total Organic Carbon (TOC)
• Oil and Grease (O&G).
BOD 5 is one of the most important gauges of the pollution potential of a
wastewater and varies with the amount of biodegradable matter that can be
assimilated by biological organisms under aerobic conditions. Large, complex
facilities tend £o discharge a higher BOD 5 mass loading, although concentra-
tions are not necessarily different from smaller or less complex plants. The
nature of specific chemicals discharged into wastewater affects the BOD 5 due
to the differences in susceptability of different molecular structures to
microbiological degradation. Compounds with lower susceptibility to decom-
position by microorganisms tend to exhibit lower BOD 5 values, even though the
total organic loading may be much higher than compounds exhibiting
substantially higher BOD 5 values.
V-29

Raw w a s t e w a t e r TSS i s a f u n c t i o n of the p r o d u c t s manu fac tu r ed and t h e i r
p r o c e s s e s , as w e l l as the manner in which f i n e s o l i d s t h a t may be removed by a
p r o c e s s i n g s t e p a r e hand led in the o p e r a t i o n s . I t can a l s o be a f u n c t i o n of a
number of o t h e r e x t e r n a l f a c t o r s , i n c l u d i n g s t o r m v a t e r r u n o f f , r u n o f f from
m a t e r i a l s t o r a g e a r e a s , and l a n d f i l l l e a c h a t e s t h a t may be d i v e r t e d to the
w a s t e w a t e r t r e a t m e n t sys tem. S o l i d s a r e f r e q u e n t l y washed i n t o the p l a n t
sewer and removed a t the w a s t e w a t e r t r e a t m e n t p l a n t . The s o l i d s may be
o r g a n i c , i n o r g a n i c , or a m i x t u r e of both . S e t t l e a b l e p o r t i o n s of the
suspended s o l i d s a r e u s u a l l y removed in a p r imary c l a r i f i e r . F i n e r m a t e r i a l s
a r e c a r r i e d th rough the sys tem, and in the case of an a c t i v a t e d s l u d g e sys tem,
become enmeshed wi th the biomass where they a r e then removed wi th the s l u d g e
d u r i n g s e c o n d a r y c l a r i f i c a t i o n . Many of the m a n u f a c t u r i n g p l a n t s show an
i n c r e a s e in TSS in the e f f l u e n t from the t r e a t m e n t p l a n t . This c h a r a c t e r i s t i c
is usually associated with biological systems and indicates an inefficiency of
secondary clarification in removal of secondary solids. Also, treatment
systems that include polishing ponds or lagoons may exhibit this characteristic
due to algae growth. However, in plastics and synthetic materials wastewaters,
formation of biological solids within the treatment plant may cause this
solids increase due to the low strength nature of the influent wastewater.
Raw wastewater pH can be a function of the nature of the processes
contributing to the waste stream. This parameter can vary widely from plant
to plant and can also show extreme variations in a single plant's raw
wastewater, depending on such factors as waste concentration and the portion
of the process cycle discharging at the time of measurement. Fluctuations in
pH are readily reduced by equalization followed by a neutralization system, if
necessary. Control of pH is important regardless of the disposition of the
wastewater stream (i.e., indirect discharge to a POTW or direct discharge) to
maintain favorable conditions for biological treatment system organisms, as
well as receiving streams.
COD is a measure of oxidizable material in a wastewater as determined by
subjecting the waste to a powerful chemical oxidizing agent (such as dichro-
mate) under standardized conditions. Therefore, the COD test can show the
presence of organic materials that are not readily susceptible to attack by
biological microorganisms. As a result of this difference, COD values are
V-30

almost invariably higher than BOD s values for the same sample. The COD test
cannot be substituted directly for the BOD 5 test because the CODIBOD 5 ratio is
a factor that is extremely variable and is dependent on the specific chemical
constituents in the wastevater. However, a COD/BOD s ratlofor the vastewater
from a single manufacturing facility with a constant product mix may be
established. This ratio is applicable only to the vastewater from which it
was derived and cannot be utilized to estimate the BOD s of another plant's
vastewater. It is often established by plant personnel to monitor process and
treatment plant performance with a minimum of analytical delay. As production
rate and product mix changes, however, the COD/BOD s ratio must be reevaluated
for the new conditions. Even if there are no changes in production, the ratio
should be reconfirmed periodically.
TOC measurement i s a n o t h e r means o f d e t e r m i n i n g the p o l l u t i o n p o t e n t i a l
o f w a s t e w a t e r . T h i s measurement shows t he p r e s e n c e of o r g a n i c compounds no t
n e c e s s a r i l y measured by e i t h e r BOD or COD t e s t s . TOC can a l s o be r e l a t e d to
d e l a y . As p r o d u c t i o n r a t e and p r o d u c t mix changes , however , t he COD/BOD 5
r a t i o must be r e e v a l u a t e d f o r t he new c o n d i t i o n s . Even i f t h e r e a r e no
changes in p r o d u c t i o n , t he r a t i o s h o u l d be r e c o n f i r m e d p e r i o d i c a l l y .
Tables V-20 through V-27 provide a statistical analysis of raw wastewater
BODs, COD, TOC, and TSS by subcategory and disposal method. For
multl-subcategory plants, the plants' pollutant values have been
production-weighted for calculation of mean values and selection of median
values. The following equation illustrates the method for calculating the
production-welghted mean concentrations:
S u b c a t e g o r y :
P r o d u c t i o n - w e i g h t e d Mean = PICI + P2C2 + P3C3 + .... + PiCi
PI + P2 + P3 + .... + Pi
Where:
P1 = Decimal s u b c a t e g o r y p r o p o r t i o n o f t o t a l p l a n t p r o d u c t i o n f o r p l a n t #I (Range 0 to 1.0)
C I = Pollutant concentration for plant #i.
V/31

TABLE V-20
SUMMARY STATISTICS OF RAW WASTEWATER BOD CONCENTRATIONS
BY SUBCATEGORY GROUP AND DISPOSAL METHOD
. . . . . . . . . . . . . . . . . . . . . . . . . . . . . . . . . . . . . . . . . . . . . . . . . . . . . . . . . . . . . . . . . . . . . . . . . . . . . . . . . . . . . . . . . . . . . . . . . . . . . . . . . . . . . . P R O D U C E R = P R I M A R Y
DISPOSAL SUBCATEGORY # OF # OF PLANTS PRODUCTION PRODUCTION PRODUCTION
METHOD PLANTS (PRODUCTION WEIGHTED WEIGHTED WEIGHTED
WEIGHTED) MEAN MEDIAN STD. DEV.
ALL PLANTS THERMOPLASTICS 108 65.7538 1328.886 351.000 4634.526
TNERMOSETS 44 15.6468 1856.433 572.000 4824.965
RAYON 4 2.1871 169.756 175.000 11.139
FIBERS 20 13.1475 921.281 986.000 663.397
COMMODITY ORGANICS 51 29.9702 1724.727 679.000 2284.493
BULK ORGANICS 95 34.9281 1465.540 705.000 2120.879
SPECIALTY ORGANICS 104 60.3664 1320.423 715.000 1819.967
DIR/IND THERMOPLASTICS I 1.0000 469.000 469.000
THERMOSETS I 0.0337 577.000 577.000
BULK ORGANICS 1 0.2863 577.000 577.000
SPECIALTY ORGANICS 2 1.6800 245.745 20.500 429.352
DIRECT THERMOPLASTICS 62 37.1289 725.190 386.000 830.834
THERMOSETS 16 4.0231 1569.784 668.000 2119.824
RAYON 4 2.1871 169.756 175.000 11.139
FIBERS 18 11.1475 904.556 706.200 724.331
COMMODITY ORGANICS 38 21.6020 1504.018 694.000 2009.651
BULK ORGANICS 53 16.8416 1199.871 668.000 1399.325
SPECIALTY ORGANICS 46 18.0697 1347.053 718.000 2038.317
INDIRECT THERMOPLASTICS 43 27.4570 2182.704 198.000 7093.989
THERMOSETS 26 10.7119 2092.435 453.800 5779.452
FIBERS 2 2.0000 1014.500 1014.500 40.305
COMMODITY ORGANICS 12 7.5305 2518.558 679.000 3042.237
BULK ORGANICS 40 17.7067 1738.854 705.000 2665.783
SPECIALTY ORGANICS 55 40.5939 1353.627 715.000 1766.617
ZERO THERMOPLASTICS 2 0.1680 323.534 340.000
THERMOSETS I 0.8781 340.000 340.000
COMMODITY ORGANICS I 0.8377 280.000 280.000
BULK ORGANICS I 0.0935 280.000 280.000
SPECIALTY ORGANICS I 0.0228 280.000 280.000
V-32

TABLE V-21
SUMMARY STATIST]CS OF RAW WASTEWATER BOP CONCENTRATIONS
BY SUBCATEGORY GROUP AND DISPOSAL METHOD
. . . . . . . . . . . . . . . . . . . . . . . . . . . . . . . . . . . . . . . . . . . . . . PRODUCER=SECONDARY . . . . . . . . . . . . . . . . . . . . . . . . . . . . . . . . . . . . . . . . . . . . . . . . .
DISPOSAL SUBCATEGORY # OF # OF PLANTS PRODUCTION PRODUCTION PRODUCTION METHOD PLANTS (PRODUCTION WEIGHTED WEIGHTED WEIGHTED
WEIGHTED) MEAN MEDIAN STD. DEV.
ALL PLANTS THERMOPLASTICS 30 17.6317 673.612 117.800 1698.067 THERMOSETS 24 16.6878 796.882 304.000 1459.787 ORGANICS 62 55.8805 920.621 96.900 2228.595
DIR/IND THERMOPLASTICS 2 1.0567 42.073 9.230 595.622 ORGANICS 1 0.9433 621.500 621.500
DIRECT THERMOPLASTICS 9 5.6808 66.951 54.500 73.167 THERMOSETS 3 2.0319 39,624 24.000 22.498 ORGANICS 23 21.2874 58.193 41.000 75.010
INDIRECT THERMOPLASTICS 17 9.1103 1194.172 361.000 2276.641 THERMOSETS 21 14.6559 901.867 360.000 1533.251 ORGANICS 37 33.2337 1492.966 451.000 2758.663
Z E R O THERMOPLASTICS 1 0.5839 7.000 7.000
ORGANICS 1 0.4161 7.000 7.000 UNKNOWN THERMOPLASTICS 1 1.0000 434.000 434.000
V-33

TABLE V-22
SUMMARY STATISTICS OF RAW WASTEWATER COD CONCENTRATIONS
BY SUBCATEGORY GROUP AND DISPOSAL METHOD
. . . . . . . . . . . . . . . . . . . . . . . . . . . . . . . . . . . . . . . . . . . . . . . . . . . . . . . . . P R O D U C E R = P R I N A R Y . . . . . . . . . . . . . . . . . . . . . . . . . . . . . . . . . . . . . . . . . . . . . . . . . . . . . . . . .
DISPOSAL SUBCATEGORY # OF # OF PLANTS PRODUCTION PRODUCTION PRODUCTION
METHOD PLANTS (PRODUCTION WEIGHTED WEIGHTED WEIGHTED
WEIGHTED) MEAN MEDIAN STD. D E V .
ALL PLANTS THERMOPLASTICS 95 53.6896 3035.613 1395.000 5851.739
THERMOSETS 49 20.3799 7497.533 2709.000 10315.211
RAYON 4 2.1871 503.405 500.000 83.729
FIBERS 17 11.5417 1657.671 1501.000 1668.644
COMMODITY ORGANICS 62 33.9393 3457.453 1645.000 5075.267
BULK ORGANICS 79 27.2478 4811.004 2066.000 8651.988
SPECIALTY ORGANICS 93 46.0146 3362.890 1772.500 5231.467
DIR/IND THERMOPLASTICS 2 1.0293 944.575 850.000 3269.370
THERMOSETS 1 0.0337 6912.000 6912.000
BULK ORGANICS 2 1.2533 4794.021 4167.000 2563.254
SPECIALTY ORGANICS 2 0.6836 6897.501 6912.000
DIRECT THERMOPLASTICS 56 32.0356 2429.787 1425.000 4783.865
THERMOSETS 18 6.6961 9414.566 4094.000 11736.8!3
RAYON 4 2.1871 503.405 500.000 83.729
FIBERS 15 9.5417 1632.135 1217.000 1847.690
COMMODITY ORGANICS 43 24.1352 2600.765 1645.000 2737.533
BULK ORGANICS 48 13.7100 3291.938 3092.000 3011.197
SPECIALTY ORGANICS 41 15.6944 2354.756 1756.000 2418.299
INDIRECT THERMOPLASTICS 35 20.4567 3927.833 1226.800 7041.918
THERMOSETS ~9 12.7719 4870.899 2394.000 7574.041
FIBERS 2 2.0000 1779.500 1779.500 393.858
COMMODITY ORGANICS 18 8.9665 6030.363 2709.000 8614.405
BULK ORGANICS 28 12.1911 6553.362 1435.000 12603.269
SPECIALTY ORGANICS 49 29.6138 3817.702 1772.500 6242.976
ZERO THERMOPLASTICS 2 0.1680 22733.387 31105.000
THERMOSETS I 0.8781 31105.000 31105.000
COMMODITY ORGANICS I 0.8377 600.000 600.000
BULK ORGANICS I 0.0935 600.000 600.000
SPECIALTY ORGANICS I 0.0228 600.000 600.000
V-34

TABLE V-23
SUMMARY STATISTICS OF RAW WASTEWATER COD CONCENTRATIONS
BY SUBCATEGORY GROUP AND DISPOSAL METHOD
. . . . . . . . . . . . . . . . . . . . . . . . . . . . . . . . . . . . . . . . . . . . . . . . . . . . . . . . PRODUCER=SECONDARY . . . . . . . . . . . . . . . . . . . . . . . . . . . . . . . . . . . . . . . . . . . . . . . . . . . . . . . . .
DISPOSAL SUBCATEGORY # OF # OF PLANTS PRODUCTION PRODUCTION PRODUCTION
METHO0 PLANTS (PRODUCTION WEIGHTED WEIGHTED WEIGHTED
~EIGHTED) MEAN MEDIAN STD. DEV.
ALL PLANTS THERMOPLASTICS 24 11.1848 1825.124 800.000 2640.893
THERMOSETS 19 14.2420 3282.064 1808.000 3996.106
ORGANICS 49 45.5732 3126.985 636.700 6883.309
DIR/IND THERMOPLASTICS 2 1.0567 795.978 41.000 13691.642
ORGANICS 1 0.9433 14115.333 14115.333
D IRECT THERMOPLASTICS 7 3.7185 272.776 141,000 219.334
THERMOSETS 1 1.0000 274.500 274.500
ORGANICS 19 18.2815 377.963 248.000 571.528
INDIRECT THERMOPLASTICS 14 5.8257 3157.083 1995.000 2623.567
THERMOSETS 18 13.2420 3509.167 2340.000 4059.385
ORGANICS 28 25.9323 4710.872 1698.000 8463,117
Z E R O THERMOPLASTICS 1 0.5839 284.100 284.100
ORGANICS 1 0.4161 284.100 284.100
V-35

TABLE V'24
SUMMARY STATISTICS OF RAW WASTEWATER TOC CONCENTRATIONS
BY SUBCATEGORY GROUP AND DISPOSAL METHOD
. . . . . . . . . . . . . . . . . . . . . . . . . . . . . . . . . . . . . . . . . . . . . . . . . . . . . . . . . . PRODUCER=PRIMARY . . . . . . . . . . . . . . . . . . . . . . . . . . . . . . . . . . . . . . . . . . . . . . . . . . . . . . . . .
DISPOSAL SUBCATEGORY # OF # OF PLANTS PRODUCTION PRODUCTION PRODUCTION
METHOD PLANTS (PRODUCTION WEIGHTED WEIGHTED WEIGHTED
WEIGHTED) MEAN MEDIAN STD. DEV.
ALL PLANTS THERMOPLASTICS 42 18.9470 992.384 486.000 1997.567
THERMOSETS 16 4.8893 426.877 349.000 274.541
FIBERS 7 3.8143 475.170 391.200 173.191
COMMODITY ORGANICS 39 20.6337 1096.466 418.000 1385.640
BULK ORGANICS 56 23.5709 989.221 484.000 1749.485
SPECIALTY ORGANICS 55 22.1449 1247.866 575.000 2463.687
DIRECT THERMOPLASTICS 31 14.5154 1132.305 522.000 2124.494
THERMOSETS 7 1.2449 351.164 349.000 182.526
FIBERS 7 3.8143 475.170 391.20O 173.191
COMMODITY ORGANICS 37 19.3261 970.419 418.000 1199.265
BULK ORGANICS 45 17.6060 897.761 358.000 1557.493
SPECIALTY ORGANICS 41 14.4933 1424.170 424.000 2965.838
INDIRECT THERMOPLASTICS 11 4.4316 534.079 50.000 1654.798
THERMOSETS 9 3.6444 452.741 654.000 322.723
COMMODITY ORGANICS 2 1.3076 2959.352 4660.000 4594.570
BULK ORGANICS 11 5.9648 1259.177 505.000 2384.023
SPECIALTY ORGANICS 14 7.6516 913.918 604.000 1120.472
V-36

TABLE V'25
SUMMARY STATISTICS OF RAW WASTEWATER TOC CONCENTRATIONS
BY SUBCATEGORY GROUP AND DISPOSAL METHOD
. . . . . . . . . . . . . . . . . . . . . . . . . . . . . . . . . . . . . . . . . . . . . . . . . . . . . . . . PRODUCER=SECONDARY . . . . . . . . . . . . . . . . . . . . . . . . . . . . . . . . . . . . . . . . . . . . . . . . . . . . . . . .
DISPOSAL SUBCATEGORY # OF # OF PLANTS PRODUCTION PRODUCTION PRODUCTION
METHOD PLANTS (PRODUCTION WEIGHTED WEIGHTED WEIGHTED
WEIGHTED) MEAN MEDIAN STD. DEV.
ALL PLANTS THERMOPLASTICS 9 5.4525 349.877 215.000 698.064
THERMOSETS 7 4.7260 278.596 78.000 365.633
ORGANICS 27 24.8216 1478.439 249.000 3094.234
DIR/IND THERMOPLASTICS 2 1.0567 316.970 15.000 5476.268
ORGANICS 1 0.9433 5644.333 5644.333
D IRECT THERMOPLASTICS 5 2.6737 131.137 118.000 87.972
THERMOSETS 2 1.0319 68.104 68.000 3.298
ORGANICS 13 11.2945 174.445 23.800 414.016 INDIRECT THERMOPLASTICS 2 1,7221 709.665 500.000 381.009
THERMOSETS 5 3.6941 337.393 145.500 403.957
ORGANICS 13 12.5838 2336.539 445.000 3957.989
V-37

TABLE V-26
SUMMARY STATISTICS OF RAW WASTEWATER TSS CONCENTRATIONS
BY SUBCATEGORY GROUP AND DISPOSAL METHOD
. . . . . . . . . . . . . . . . . . . . . . . . . . . . . . . . . . . . . . . . . . . . . . . . . . . . . . . . . . . . . . . . . . . . . . . . . . . . . . . . . . . . . . . . . . . . . . . . . . . . . . . . . . . . . . . . . . P R O D U C E R = P R I M A R Y
DISPOSAL SUBCATEGORY # OF # OF PLANTS PRODUCTION PRODUCTION PRODUCTION
METHOD PLANTS (PRODUCTION WEIGHTED WEIGHTED WEIGHTED
WEIGHTED) MEAN MEDIAN STD. DEV.
ALL PLANTS THERMOPLASTICS 113 69.2105 639.742 263.000 971.596
THERMOSETS 54 21.9417 822.065 212.000 1203.909
RAYON 3 1.9756 399.500 635.000 339.319
FIBERS 15 9.8263 135.510 72.000 126.695
COMMODITY ORGANICS 56 29.1388 378.424 157.000 678.674
BULK ORGANICS 92 37.3944 1026.209 174.000 2990.516
SPECIALTY ORGANICS 109 60.5127 526.438 154.000 1236.554
DIR/IND THERMOPLASTICS 2 1.0293 66.792 63.000 131.090
THERMOSETS I 0.0337 6103.000 6103.000
BULK ORGANICS 2 1.2533 1545.294 196.000 5515.897
SPECIALTY ORGANICS 3 1.6836 2485.942 34.700 4672.420
DIRECT THERMOPLASTICS 55 32.7511 729.522 302.000 1115.037
THERMC~ETS 15 5.4898 1756.192 1598.000 1358.482
RAYON 3 1.9756 399.500 635.000 339.319
FIBERS 13 7.8263 158.895 156.000 132.934
COMMODITY ORGANICS 36 19.4999 302.818 157.000 433.753
BULK ORGANICS 44 14.5703 603.532 234.000 913.698
SPECIALTY ORGANICS 37 13.8871 381.469 194.000 473.399
INDIRECT THERMOPLASTICS 55 35.3082 564.396 202.000 824.529
THERMOSETS 37 15.5401 347.309 129.400 739.290
FIBERS 2 2.0000 44.000 44.000 4.243
COMMODITY ORGANICS 20 9.6390 531.376 186.000 1028.767
BULK ORGANICS 46 21.5708 1281.553 129.400 3832.206
SPECIALTY ORGANICS 69 44.9420 497.827 151.800 1229.205
ZERO THERMOPLASTICS I 0.1219 3181.000 3181.000
THERMOSETS I 0.8781 3181.000 3181.000
V-38

TABLE V-27
SUHHARY STATISTICS OF RAW WASTEWATER TSS CONCENTRATIONS
BY SUBCATEGORY GROUP AND DISPOSAL METHOD
. . . . . . . . . . . . . . . . . . . . . . . . . . . . . . . . . . . . . . . . . . . . . . . . . . . . . . . . PRODUCER=SECONDARY . . . . . . . . . . . . . . . . . . . . . . . . . . . . . . . . . . . . . . . . . . . . . . . . . . . . . . . .
DISPOSAL SUBCATEGORY # OF # OF PLANTS PRODUCTION PRODUCTION PRODUCTION
METHOO PLANTS (PRODUCTION WEIGHTED WEIGHTED WEIGHTED
WEIGHTED) MEAN MEDIAN STD. DEV.
ALL PLANTS THERMOPLASTICS 31 18.2239 121.241 64.000 122.123
THERMOSETS 25 17.7299 255.721 168.000 262.125
ORGANICS 64 58.0462 800.089 76.700 4456.709
DIR/IND THERMOPLASTICS 2 1.0567 25.286 6.880 333.790
ORGANZCS 1 0,9433 350.000 350.000
D IRECT THERMOPLASTICS 9 5.6808 32.303 29.000 20.124
THERHOSETS 3 2.0319 38.924 26.000 19.618
ORGANICS 26 24.2876 76.918 38.900 107.027
INDIRECT THERMOPLASTICS 18 9.9025 164.678 130.000 112.000
THERHOSETS 22 15.6980 283.782 168.000 266.163
ORGANICS 36 32.3995 1365.387 173.000 5943.781
Z E R O THERMOPLASTICS 1 0 .5839 14.600 14.600
ORGANICS 1 0.4161 14.600 14.600
UNKNOWN THERMOPLASTICS 1 1.0000 360.000 360.000
V-39

In determining the median, the actual pollutant concentrations_of each
plant that has at least one product within a subcategory are ranked from
lowest to highest. The subcategory decimal production proportions are summed
starting from the lowest concentration plan t until the sum equals or exceeds
50 percent of the total of all the decimal production proportions. The
pollutant concentration of the plant whose proportions when added to the
proportion sum causes the total to exceed 50 percent is then chosen as the
median. If, however, the sum equals 50 percent exactly, then the median is
the average of the pollutant concentrations of that plant and the next plant
in the sequence.
Tables V-28 through V-35 also provide raw wastewater statistics for BODs,
COD, TOC, and TSS by subcategory and discharge technique, but use the 95/70
methodology discussed earlier in this section to aggregrate plants by subcate-
gory. As in previous tables concerning wastewater volumes, these tables are
separated into primary producers and a few zero/alternate dischargers versus
secondary producers and most zero dischargers. For some indirect and zero
dischargers who pretreat their wastewater, the data used are typically from
the effluent of their pretreatment system rather than strictly raw wastewater.
Most indirect dischargers only sample their wastewater at the point where it
enters the POTW collection system. It should also be noted that, as described
in Section VII, the concentrations of pollutants for raw wastewater of the
primary producers that are direct dischargers have been corrected for dilution
by uncontaminated nonprocess wastewater. This correction was not performed on
secondary producers, nor on indirect and zero dischargers.
As with the summary statistics for wastewater flow by subcategory, the
summary statistics for raw wastewater BODs, COD, TOC, and TSS concentrations
by subcategory that were generated by the two methodologies compare favorably;
most of the differences between subcategory medians calculated by the two
methodologies fell within the standard deviations calculated by either
methodology. For the reasons stated earlier in this section when discussing
the summary statistics for wastewater flow by subcategory, the Agency has much
more confidence in the accuracy of the summary statistics calculated by the
regression methodology, but has included the summary statistics calculated by
the 95/70 methodology for comparison purposes.
V-40

TABLE V-28
SUMMARY STATISTICS OF RAW WASTEWATER BOD CONCENTRATIONS
BY SUBCATEGORY GROUP AND DISPOSAL METHOD
( WITH 95~ & 70~ RULE )
. . . . . . . . . . . . . . . . . . . . . . . . . . . . . . . . . . . . . . . . . . . . . . . . . . . . . . . . PRODUCER=PRIMARY . . . . . . . . . . . . . . . . . . . . . . . . . . . . . . . . . . . . . . . . . . . . . . . . . . . . . . . . .
DISPOSAL SUBCATEGORY # OF MEAN MEDIAN STD. DEV.
METHOD PLANTS
ALL PLANTS THERMOPLASTICS 48 1088.883 266.500 4312.183
THERMOSETS 5 1191.200 250,000 1991.833
RAYON 2 169.000 169.000 8.485
FIBERS 9 739.244 706.200 531.238
COHMODITY ORGANICS 14 2099.000 629.500 2887.453
BULK ORGANICS 18 940.156 3 9 3 . 5 0 0 1074.395
SPECIALTY ORGANICS 52 1263.161 704.500 1623.229
MIXED 74 1814.754 737.000 3811.602
DIR/IND THERMOPLASTICS 1 469.000 469.000
BULK ORGANICS 0
SPECIALTY ORGANICS 1 20.500 20.500
MIXED 1 577.000 577.000
D IRECT THERMOPLASTICS 26 647.205 380.500 810.973
THERMOSETS 2 2415.500 2415.500 3239.256
RAYON 2 169.000 169.000 8.485
FIBERS 7 660.600 444,000 586.126
COMMODITY ORGANICS 9 2209.946 694.000 2959.328
BULK ORGANICS 8 901.625 264.000 1051.801
SPECIALTY ORGANICS 12 1534.810 773.500 2567.712
MIXED 45 1079.856 785.000 920.978
INDIRECT THERMOPLASTICS 21 1665.240 138.000 6500.336
THERMOSETS 3 375.000 250.000 436.148 FIBERS 2 1014.500 1014.500 40.305
COHMODITY ORGANICS 4 2304.125 766.500 3402.801
BULK ORGANICS 10 970.980 430.000 1147.855
SPECIALTY ORGANICS 39 1211.440 694.000 1249.419
MIXED 27 3140.048 757.000 6037.743
Z E R O THERMOPLASTICS 0
COMMODITY ORGANICS 1 280.000 280.000
BULK ORGANICS 0
SPECIALTY ORGANICS 0
MIXED 1 340.000 340.000
V-41

TABLE V-29
SUMMARY STATISTICS OF RAW WASTEWATER BOD CONCENTRATIONS
BY SUBCATEGORY GROUP AND DISPOSAL METHOD
( WITH 95% & 70% RULE )
. . . . . . . . . . . . . . . . . . . . . . . . . . . . . . . . . . . . . . . . . . . . . . . . . . . . . . . . PRODUCER=SECONDARY . . . . . . . . . . . . . . . . . . . . . . . . . . . . . . . . . . . . . . . . . . . . . . . . . . . . . . . .
DISPOSAL SUBCATEGORY # OF MEAN MEDIAN STD. DEV.
METHOD PLANTS
ALL PLANTS THERMOPLASTICS 12 441.894 161.900 705.702
THERMOSETS 13 623.608 277.000 871.510
ORGANICS 51 972.029 82.000 2327.405
FIBERS 0 MIXED 14 964.434 302.000 2239.655
DIR/IND THERMOPI.ASTICS I 9.230 9.230
ORGANICS 0
MIXED I 621.500 621.500
DIRECT THERMOPLASTICS 5 70.940 54.500 77.758
THERMOSETS 2 39.950 39.950 22.557
ORGANICS; 20 60.801 43.000 76.557
MIXED 2 24.500 24.500 30.406
INDIRECT THERMOPLASTICS 5 900.960 651.000 938.746
THERMOSETS 11 729.727 360.000 911.519
ORGANICS 31 1559.918 451.000 2848.442
MIXED 10 1282.458 402.000 261 I. 835
ZERO THERMOPLASTICS 0
THERMOSETS 0
ORGANICS 0
FIBERS 0
MIXED I 7.000 7.000
UNKNOWN THERMOPLASTICS 1 434.000 434.000
THERMOSETS 0
ORGANICS 0
V-42

' TABLE V-30
SUMMARY STATISTICS OF RAW WASTEWATER COD CONCENTRATIONS
BY SUBCATEGORY GROUP AND DISPOSAL METHOD
( WITH95~ & 70~ RULE )
. . . . . . . . . . . . . . . . . . . . . . . . . . . . . . . . . . . . . . . . . . . . . . . . . . . . . . .
DISPOSAL SUBCATEGORY
METHOD
ALL PLANTS THERMOPLASTICS
THERMOSETS
RAYON
FIBERS
COMMODITY ORGANICS
SULK ORGANICS
SPECIALTY ORGANICS
MIXED
DIR/IND THERMOPLASTICS
SULK ORGANICS
SPECIALTY ORGANICS
MIXED
D IRECT THERMOPLASTICS
THERMOSETS
RAYON
FIBERS
COMMODITY ORGANICS
BULK ORGANICS
SPECIALTY ORGANICS
MIXED
INDIRECT THERMOPLASTICS THERMOSETS
FIBERS
COMMODITY ORGANICS
BULK ORGANICS
SPECIALTY ORGANICS
MIXED
Z E R O THERMOPLASTICS
COMMODITY ORGANICS
BULK ORGANICS
SPECIALTY ORGANICS
MIXED
PRODUCER=PRIMARY . . . . . . . . . . . . . . . . . . . . . . . . . . . . . . . . . . . . . . . . . . . . . . . . . . . . . . . . .
# OF MEAN MEDIAN STD. DEV.
PLANTS
34 2172.459 1158.000 3478.292
7 5773.143 1700.000 7882.793
2 522.500 522.500 31.820
8 1132.000 1000.000 875.063
15 2914.633 1943.000 3401.295
11 2839.545 598.000 3411,839
37 2658.803 1692.000 2746.715
81 5450.385 2066.000 9051.549
1 850.000 850.000
1 4167.000 4167;000
0
1 6912.000 6912.000
19 1774.974 1286.000 1734.512
4 8865.250 6815.500 9586.722
2 522.500 522.500 31.820
6 916.167 710.000 904.102
10 2579.200 1971.500 2590.289
5 5020.200 3796.000 3896.203
12 2173.000 1544.500 2220.908
46 3254.714 1689.500 5735.796
14 2806.365 455.500 5074.226 3 1650.333 509.000 1984.647
2 1779.500 1779.500 393.858
4 4331.875 2229.250 5387.018
5 393.400 500.000 238.931
25 2891.989 1692.000 2980.155
33 7689.313 2709.000 11217.300
0
1 600.000 600.000
0
0
1 31105,000 31105.000
V-43

TABLE V-31
SUMMARY STATISTICS OF RAW NASTENATER COD CONCENTRATIONS
BY SUBCATEGORY GROUP AND DISPOSAL METHOD
( NITH 95% & 70~ RULE )
. . . . . . . . . . . . . . . . . . . . . . . . . . . . . . . . . . . . . . . . . . . . . . . . . . . . . . PRODUCER=SECONDARY . . . . . . . . . . . . . . . . . . . . . . . . . . . . . . . . . . . . . . . . . . . . . . . . . . . . . . . .
DISPOSAL SUBCATEGORY # OF MEAN MEDIAN STD. DEV.
METHOD PLANTS
ALL PLANTS THERMOPLASTICS 8 1509.000 646.000 2032.859
THERMOSETS 12 3219.000 1753.500 4181.376
ORGANICS 40 3007.794 582.500 7111.048
FIBERS 0 MIXED 11 3513.803 1364.000 4438,984
DIR/IND THERMOPLASTICS 1 41.000 41.000
ORGANICS 0
MIXED 1 14115.333 14115.332
DIRECT THERMOPLASTICS 3 245.333 141.000 214.463
THERMOSETS 1 274.500 274,500
ORGANICS 17 393.626 248.000 587.223
MIXED 2 248.200 248.200 341.957
INDIRECT THERMOPLASTICS 4 2823.7'50 2247.500 2234.261
THERMOSETS 11 3486.682 2340.000 4276.269
ORGANICS 23 4940.004 1698.000 8955.829
MIXED 7 3393.714 1808.000 2962.999
Z E R O THERMOPLASTICS 0
THERMOSETS 0
ORGANICS 0
FIBERS 0
MIXED 1 284.100 284,100
UNKNOWN THERMOPLASTICS 0
THERMOSETS 0
ORGANICS 0
V-44

TABLE V-32
SUMMARY STATISTICS OF RAW WASTEWATER TOC CONCENTRATIONS
BY SUBCATEGORY GROUP AND DIsPosAL METHOD
( WITH 95~ & 70~ RULE )
. . . . . . . . . . . . . . . . . . . . . . . . . . . . . . . . . . . . . . . . . . . . . . . . . . . . . . . PRODUCER=PRIMARY . . . . . . . . . . . . . . . . . . . . . . . . . . . . . . . . . . . . . . . . . . . . . . . . . . . . . . . . .
DISPOSAL SUBCATEGORY # OF MEAN MEDIAN STD. DEV.
METHOD PLANTS
ALL PLANTS THERMOPLASTICS 11 470.470 166.000 770.042
THERMOSETS 0
RAYON 0
FIBERS 3 472.733 391.200 160.829
COMMODITY ORGANICS 10 1811.067 1088.000 1860.990
BULK ORGANICS 9 637.000 308.000 1013.431
SPECIALTY ORGANICS 16 1252.500 516.500 2764.300
MIXED 45 1017.778 505.000 1774.971
DIR/IND THERMOPLASilCS' 0
BULK ORGANICS 0
SPECIALTY ORGANICS 0
MIXED 0
D I R E C T THERMOPLASTICS 8 618.396 418.000 868.222 THERMOSETS 0
RAYON 0
FIBERS 3 472.733 391.200 160.829
COMMODITY• ORGANIcs 9 1494.519 389.000 1664.006
BULK ORGANICS 6 758.667 238.500 1254.864
SPECIALTY ORGANICS 10 1472.000 408.000 3514.778
MIXED 35 994.250 486.000 1695.554
INDIRECT THERMOPLASTICS 3 76.000 35.000 74.505
THERMOSETS 0
FIBERS 0
COMMODITY ORGANICS I 4660.000 4660.000
BULK ORGANICS 3 393.667 500.000 195.541
SPECIALTY ORGANICS 6 886.667 777.000 656.135
MIXED I0 1100.126 579.500 2128.878
Z E R O THERMOPLASTICS 0
COMMODITY ORGANICS 0
BULK ORGANICS 0
SPECIALTY ORGANICS 0
MIXED 0
V-45

TABLE V'33
SUNNARY STATISTICS OF RAW WASTEWATER TOC CONCENTRATIONS
BY SUBCATEGORY GROUP AND D]SPOSAL HETHOD
( WITH 95~ & 70~ RULE )
. . . . . . . . . . . . . . . . . . . . . . . . . . . . . . . . . . . . . . . . . . . . . . . . . . . . . . . . PRODUCER=SECONDARY . . . . . . . . . . . . . . . . . . . . . . . . . . . . . . . . . . . . . . . . . . . . . . . . . . . . . . .
D]SPOSAL SUBCATEGORY # OF MEAN NED]AN STD. DEV.
METHOD PLANTS
ALL PLANTS THERMOPLASTICS 4 200.337 143.175 216.795 THERNOSETS 4 259.125 111.750 325.740 ORGANICS 22 1423.514 259.750 3144.832 FIBERS 0 MIXED 5 1353.267 118.000 2434.943
DIRIIND THERNOPLASTICS 1 15.000 15.000 ORGANICS 0
MIXED 1 5644.333 5644.332
DIRECT THERMOPLASTICS 2 143.175 143.175 101.576 THERNOSETS I 68.000 68.000 .
ORGANICS 10 191.480 30.400 439.123 NIXED 2 61.000 61.000 80.610
INDIRECT THERMOPLASTICS I 500.000 500.000 . THERNOSETB 3 322 833 145.500 367.162
ORGANICS 12 2450,208 612.500 4024.083 MIXED 2 500 000 500.000 707.107
Z E R O THERMOPLASTICS 0
THERNOSETS 0 ORGANICS 0
FIBERS 0 MIXED 0
UNKNOWN THERHOPI.ASTICS 0
THERHOSETS 0
ORGANICS 0
V-46

TABLE V-34 SUMMARY STATISTiCS OF'RA~WAsTENATER TSS CONCENTRATIONS
BY SUBCATEGORY GROUP AND DISPOSAL METHOD ( WITH 95~ & 70X RULE )
. . . . . . . . . . . . . . . . . . . . . . . . . . . . . . . . . . . . . . . . . . . . . . . . . . . . . . . . . PRODUCER=PRIMARY . . . . . . . . . . . . . . . . . . . . . . . . . . . . . . . . . . . . . . . . . . . . . . . . . . . . . . . . .
DISPOSAL sUBCATEGORY # OF MEAN MEDIAN STD. DEV. METHOD PLANTS
ALL PLANTS THERMOPLASTICS 49 640.032 182.000 1066.040 THERMOSETS 7 1 2 1 2 . 0 0 0 362.000 1425.356
RAYON 2 396.500 396.500 337.290
FIBERS 7 117.286 50.000 126.805 COMMODITY ORGANICS 10 247.658 140.000 251.969 SULK ORGANICS 20 1 3 5 8 . 9 5 9 1 2 4 . 5 0 0 3979.027
SPECIALTY ORGANICS 51 445.072 151.800 1124.192 MIXED 84 617.603 232.000 1020.612
DIR/ IND THERMOPLASTICS I 63.000 63.000 .
SULK ORGANICS 1 196.000 196.000 . SPECIALTY ORGANICS I 34.700 34.700 . MIXED 1 6103.000 6103.000
DIRECT THERMOPLASTICS 21 749.452 237.000 1273.399 THERMOSETS 3 2590.333 2509.000 1035.399
RAYON 2 396.500 396.500 337.290 FIBERS 5 146.600 72.000 142.672 COMMODITY ORGANICS 6 194.222 , 139,000 143.518 BULK ORGANICS 6 977.333 180.500 1348.864 SPECIALTY ORGANICS 10 404.466 193,500 528.479 MIXED 43 452.398 235.000 584.672
INDIRECT THERMOPLASTICS 27 576.299 1 5 4 . 0 0 0 905.587 THERMOSETS 4 178.250 155.500 154.675 FIBERS 2 44.000 44.000 4.243 COMMODITY ORGANICS 4 327.813 186.500 376.642
BULK ORGANICS 13 1624.552 83.000 4903.910 SPECIALTY ORGANICS 40 465.482 1 5 1 . 4 0 0 1245.249 MIXED 39 593.374 187.000 948.802
ZERO THERMOPLASTICS 0
COHMODITY ORGANICS 0 BULK ORGANICS O
SPECIALTY ORGANICS 0 MIXED 1 3181.000 3181.000
V-47

TABLE V-35
SUMMARY STATISTICS OF RAW WASTEWATER TSS CONCENTRATIONS
BY SUBCATEGORY GROUP AND DISPOSAL METHOD
( WITH 95% & 70~ RULE )
. . . . . . . . . . . . . . . . . . . . . . . . . . . . . . . . . . . . . . . . . . . . . . . . . . . . . . . . PRODUCER=SECONDARY . . . . . . . . . . . . . . . . . . . . . . . . . . . . . . . . . . . . . . . . . . . . . . . . . . . . . . . .
DISPOSAL SUBCATEGORY # OF MEAN MEDIAN STD. DEV.
METHOD PLANTS
ALL PLANTS THERMOPLASTICS 12 98.348 49.200 112.008
THERMOSETS 14 284.270 168.000 281.031
ORGANICS 53 861.552 76.700 4663.029
FIBERS 0 MIXED 15 157.557 130.000 134.590
DIR/IND THERMOPLASTICS I 6.880 6.880
ORGANICS 0
MIXED I 350.000 350.000
DIRECT THERMOPLASTICS 5 29.860 29.000 19.646
THERMOSETS 2 39.450 39.450 19.021
ORGANICS 23 79.553 38.900 109.397
MIXED 2 36.400 36.400 27.719
INDIRECT THERMOPLASTICS 5 132.800 122.000 86.955
THERMOSETS 12 325.073 189.500 283 886
ORGANICS 30 1461.083 165.500 6174 386
MIXED 11 175.087 163.000 127,525
ZERO THERMOPLASTICS 0
THERMOSETS 0
ORGANICS 0
FIBERS 0
MIXED I 14.600 14.600
UNKNOWN THERMOPLASTICS I 360.000 360.000
THERMOSETS 0
ORGANICS 0
V-48

2. Occurrence and P r e d i c t i o n of P r i o r i t y P o l l u t a n t s
The Clean Water Act r equ i r ed the Agency to develop da ta c h a r a c t e r i z i n g
the presence (or absence) of 129 p r i o r i t y p o l l u t a n t s in raw and t r e a t e d waste-
waters of the OCPSF i n d u s t r y . These data have been ga the red by EPA from
i n d u s t r y sources and ex t ens ive sampling and a n a l y s i s of i n d i v i d u a l OCPSF
process was tewaters . An ad junc t to these d a t a - c o l l e c t i o n e f f o r t s was the
c o r r e l a t i o n of p r i o r i t y p o l l u t a n t occur rence with p roduc t /p roces s sources by a
c o n s i d e r a t i o n of the r e a c t a n t s and process chemis t ry . This approach o f f e r s
the advantage of q u a l i t a t i v e p r e d i c t i o n of o rgan ic p r i o r i t y p o l l u t a n t s l i k e l y
to be p resen t in p l an t was tewaters . A sys t ema t i c means of a n t i c i p a t i n g the
occur rence of p r i o r i t y p o l l u t a n t s i s b e n e f i c i a l to both the development and
implementat ion of r e g u l a t o r y g u i d e l i n e s :
I ndus t ry -wide q u a l i t a t i v e p roduc t /p rocess coverage becomes f e a s i b l e wi thout the n e c e s s i t y of sampling and ana lyz ing hundreds of e f f l u e n t s beyond major p r o d u c t / p r o c e s s e s .
Guidance is provided for d i scha rge permit writers, permit a p p l i c a n t s , or anyone t r y i n g to a n t i c i p a t e p r i o r i t y p o l l u t a n t s tha t a re l i k e l y to be found in the combined wastewaters of a chemical p lan t when the p r o d u c t / p r o c e s s e s ope ra t i ng at the f a c i l i t y are known.
Q u a l i t a t i v e p r e d i c t i o n of p r i o r i t y p o l l u t a n t s for these i n d u s t r i e s i s pos s ib l e
because, c la ims of uniqueness no twi th s t and ing , a l l p l an t s w i th in the OCPSF
i n d u s t r y a re a l i k e in one important s e n s e - - a l l t ransform feeds tocks to
products by chemical r e a c t i o n s and phys i ca l p rocesses in a s tepwise fash ion .
Although each t r ans fo rma t ion r e p r e s e n t s at l e a s t one chemical r e a c t i o n ,
v i r t u a l l y a l l can be c l a s s i f i e d by one or more g e n e r a l i z e d chemical r e a c t i o n s /
p rocesses . Impos i t ion of these processes upon the e igh t bas ic f eeds tocks lead
to commercial ly produced organ ic chemicals and p l a s t i c s . I t i s the permuta-
t ion of the f e e d s t o c k / p r o c e s s combinat ions tha t permit the i n d u s t r i e s to
produce such a wide v a r i e t y of p roduc ts .
Chemical manufacturing plants share a second important similarity;
chemical processes almost never convert I00 percent of the feedstocks to the
lesired products; that is, the chemical reactions/processes never proceed to
V-49

total completion. Moreover, because there are generally a variety of reaction
pathways available to reactants, undesirable by-products are often unavoidably
generated. This results in a mixture of unreacted raw materials and products
that must be separated and recovered by unit operations that often generate
residues with little or no commercial value. These yield losses appear in
process contact wastewater, in air emissions, or directly as chemical wastes.
The specific chemicals that appear as yield losses are determined by the feed-
stock and the process chemistry imposed upon it, i.e., the feedstock/generic
process combination.
a. General
Potentially, an extremely wide variety of compounds could form within a
given process. The formation of products from reactants depends upon the
relationship of the free enthalpies of products and reactants; more important,
however, is the existence of suitable reaction pathways. The rate at which
such transformations occur cannot (in general) be calculated from first
principles and must be empirically derived. Detailed thermodynamic calcu-
lations, therefore, are of limited value in predicting the entire spectrum of
products produced in a process, since both the identity of true reacting
species and the assumption of equilibrium between reacting species are often
speculative. Although k~netic models can in principle predict the entire
spectrum of products formed in a process, kinetic data concerning minor side
reactions are generally unavailable. Thus, neither thermodynamic nor kinetic
analyses alone can be used for prediction of species formation. I What these
analyses do provide, however, is a framework within which pollutant formation
may be considered and generalized.
IPrediction of pollutant formation is necessarily of a qualitative rather than quantitative nature; although reactive intermediates may be identified without extensive kinetic measurements, their rate of formation (and thus quantities produced) are difficult to predict without kinetic measurements. Other quantitative approaches, for example, detailed calculation of an equilibrium composition by minimization of the free energy of a system, require complete specification of all species to be considered. Because such methods necessarily assume equilibrium, the concentrations generated by such methods represent only trends: or, perhaps at best, concentration ratios.
V-50

The r e a c t i o n chemis t ry of a process sequence i s c o n t r o l l e d through
c a r e f u l ad jus tment and maintenance of cond i t i ons in the r e a c t i o n v e s s e l . The
p h y s i c a l c o n d i t i o n of spec i e s p resen t ( l i q u i d , s o l i d , or gaseous phase) ,
c o n d i t i o n Of tempera ture and p r e s s u r e , the presence of s o l v e n t s and c a t a l y s t s ,
and the c o n f i g u r a t i o n of process equipment are des igned to favor a r e a c t i o n
pathway by which a p a r t i c u l a r product i s produced. From t h i s knowledge, i t i s
p o s s i b l e to i d e n t i f y r e a c t i v e i n t e r m e d i a t e s and thus a n t i c i p a t e spec ie s
( p o t e n t i a l p o l l u t a n t s ) formed.
Most chemical transformations performed by the OCPSF industry may be
reduced to a small number of basic steps or unit processes. Each step or
process represents a chemical modification of the starting matrials and is
labeled a "generic process." For example, the generic process " nitration"
may represent either the substitution or addition of an "-NO2" functional
group to an organic chemical. Generic processes may be quite complex
involving a number of chemical bonds being broken and formed, with the overall
transformation passing through a number of distinct (if transitory) inter-
mediates. Simple stoichiometic equations, therefore, are inadequate
descriptions of chemical reactions and only rarely account for observed
by-products.
Table V-36 lists the major organic chemicals produced by the OCPSF
industry (approximately 250) by process, and Table V-37 gives the same
information for the plastics/synthetic fibers industry. Certain products
shown in Table V-36 are not derived from primary feedstocks, but rather from
secondary or higher order materials (e.g., aniline is produced by hydrogena-
tion of'nitrobenzene that is produced by nitration of benzene). For such
multistep syntheses, generic processes appropriate to each step must be
evaluated separately. For many commodity and bulk chemicals, it is sufficient
to specify a feedstock and a single generic process, because they are gener-
ally manufactured by a one-step process. Nitration of benzene to produce
nitrobenzene, for example, is a sufficient description to predict constituents
of the process wastewater: benzene, nitrobenzene, phenol, and nitrophenols
will be the principal process wastewater constituents. Similarly, oxidation
of butane to produce acetic acid results in wastewater containing a wide
cariety of oxidized species, including formaldehyde, methanol, acetaldehyde,
n-propanol, acetone, methyl ethyl ketone, etc.
V-51

• • •
GENERIC PROCESS
ALKOXYt AIION
HAt(X~NAnON
OXIDATION
POL yMIP R |TJ~TION
HYDROL Y .T4~
H Y D R O ~ E N A ~
F.~TERIRCA TION
PYROLYSIS
AI.K YLATION
OEHY ORO~ENAI"IO~
AMINATION (AMMONOLyS~$)
NTI'R ATION
~ULFONAT1ON
AMMOXIDATION
CARBONYLATION
HYDROtlALO~ENA T10~
DEHYDRATION
OEH y OIIt (~tlA LCX; EN A T I I ~
OX YHALOGENATION
CATALYTIC CRACKING
H~'DROOEALKYLATIO~
~ E N A I " I O ~
F.XTRACTION
OISTII.LATIO~
OTHFR
HYDRATION
\ Table V-36 Generic Processes Used to Manufacture Organic Chemical Products
ACIDS $~L.CO~ ALDEHYDES~ AMI~ ESTERS
9
• c u-J~L ---
' ' o - ° ; ° ,
,,( ,,c ~ ,~ m 0 ' ' .." ~, F z z c ,~ ,~ "~ =: z z - ' z ,,: 0 ~, ~:
@@ •
O O • 0 0 0 0 0@00 0 0
O O 0 •
®Oe@O O OO @@ @0 O@ @ • O @@@ @0 O • 0@00 • @ •
O0 • O O • @ OO 0 0
go • • • 00@ @0 @ 0 • • • • OO
O 0 @eO@O0@O@O@O@ O0@O0@OOe@ @@
0 0 0 0 000 Oe 0 0 • o oo
0 •
0 0
o o@
0000o
o
0 • • eeoo 0 0@00 0 00000 • 0 • • •
V-52

Tabh V-36 (Continued) Generic Processes Used to IV anufacture Organic Chemical Products
E T H E R S H A L O C A R B O N S H Y D R O C A R B O N S K E T O N E 5 N 1 T R I L E S ~ S P H E N O L S S A L T S M I S C E L L A N E O U S
_ - ~ ~
G E N E R I C P R O C E S S
- ~z ~-_ ~=~_. ~=_ ~ ~'~' ¸
U ~--~:.c ~,. a U-- ~ - - '~ o ~lS-~.-~ ~ : - ~_~,~ z u ~.c c . c ~ " U u , 1 & .= z: .c.c r 'm~j: --
ALKOXYL^110~ O
CONDENSATION 0 0 O 0 0 • O0 0 0 O0
H ALOG EN A'nO4~l O OOO0@O OO00@OOO0 O0 O0@OOOOO000 OO0 0
OXIOAT'K)N • O0 o o • 0 O0
POLYMERIZATION
HYDROLYSIS
H y DROGENATION 0 • 0 o o •
IESTERIFICATIC~I
PYROLYSIS @ • O 0
ALK YLATIC)N • • • • • 0
DEHYDROGENATION O 0 tO • • 0 0
AMINATION (AMMONOLY$1$) o o
NITRATION • 0 0 000 o o 0
SULFONATION 0 O 0
AMMOXIDATION OO
CAR~ONYLATION
HY DROHALCX~ENATION oo 0 oo 0 •
DEHYnRATION 0 O00 0
DEHYDROHALOGENATION o' • OO
OX Y H ALOGENAI"ION • o
CATALY'nc CRACKING 0
HYDRODEALK YLATION 0
PHO5GENATIC~N
EXTRACTION • • • -@ 0 o 0
I~I STItLA'nC~ 0 O00 O0 • • • O00 OO0 O000 O@ o e o o
OTHER 0 0 O 0 0 • O0 @00 o e o o 0 0 0 0
HYDRATION
• Prodbuc"lfl>roc.e~,~ El |lucnt ~mple<l by OC8 " 0 Pro(kJclJProoc~ Ffflu~nt Not ~,ampk~d
V-53

z
I
4>
GENERIC PROCESS
ADDITION POLYMERIZATION MASS
EMULATION
SUSPENSION
l i l l l l l l l l l l l I l H I I I I I I I I I
I I I I I I I I
I I I I I I l l l l
I I I l I I I I I
I n l l l R i l l
I l i i R I I !
I I l l I IPll
SOLVENT
SOLVENT-NONSOLVENT
OTHER A
CONDENSATION POLYMERIZATION
ARing opening and other "addit ion" polymerization processes in which the polymer grows in a manner other than by a chain reaction.
TABLE V-37 Major Plastics and Synthetic Fibers Products by Generic Process

Specialty chemicals, on the other hand, may involve several chemical
reactions and require a fuller description. For example, preparation of
toluene diisocyanate from commodity chemicals involves four synthetic steps
and three generic processes as shown below:
Nitration Hydrogenation
NO 2 Ot 3 ~NCO
NIt 2
Phosgenation
N C 0
This example is relatively simple and manufacture of other specialty chemicals
may be more complex. Thus, as individual chemicals become further removed
from the basic feedstocks of the industry, fuller description is required for
unique specification of process wastewaters. A mechanistic analysis of
individual generic processes permits a spectrum of product classes to be
associated with every generic process provided a feedstock is specified. Each
product class represents compounds that are structurally related to the
feedstock through the chemical modification afforded by the generic process.
b. Product/Process Chemistry Overview
The primary feedstocks of the OCPSF industry include: benzene, toluene,
o,p-xylene, ethene, propene, butane/butene, and methane; secondary feedstocks
include the principal intermediates of the synthetic routes to high-volume
V-55

organic chemicals and plastics/synthetic fibers. Other products that are
extraneous to these routes, but are priority pollutants, are also considered
because of their obvious importance to guidelines development.
Flow charts used to illustrate a profile of the key products of the two
categories were constructed by compositing the synthetic routes from crude oil
fractions, natural gas, and coal tar distillates (three sources of primary
feedstocks) to the major plastics and synthetic fibers. Figures V-I through
V-7 depict the routes through the eight primary feedstocks and various inter-
mediates to commercially produced organic chemicals; Figures V-8 and V-9 show
the combinations of monomers that are polymerized in the manufacture of major
plastics and synthetic fiber products. Also shown in Figures V-I through V-7
are processes in current use within these industries.
These charts illustrate the tree-shaped structure of this industry's
product profile (i.e., several products derived from the same precursor). By
changing the specific conditions of a process, or use of a different process,
several different groups of products can be manufactured from the same feed-
stock. There is an obvious advantage in having to purchase and maintain a
supply of as few precursors (feedstocks) and solvents as possible. It is also
important to integrate the product mix at a plant so that one product provides
feedstock for another. A typical chemical plant is a community of production
areas, each of which may produce a different product group. While the product
mix at a given plant is self-consistently interrelated, a different mix of
products may be manufactured from plant to plant. Thus, a plant's product mix
may be independent of, or may complement the product mix at, other plants
within a corporate system.
The synthetic routes to priority pollutants are illustrated in Figures
V-IO through V-14; these flow charts provide a separate scheme for each of the
following five classes of generic groups of priority pollutants:
. Nitroaromatic compounds, nitrophenols, phenols, benzidines and nitrosamines
. Chlorophenols, chloroaromatic compounds, chloropolyaromatic compounds, haloaryl ethers and PCBs
V-56

REFINERY OPERATIONS I OCPSF PLANT OPERATIONS ! !
Crude--i P Refinery Synthesis Gas ~ Oil (CO & Hydrogen)
Hydrogen
Gas [- [ i I P ETHYLENE = LP Gas 2 --4 4 1
--~Naphtha--l~ I , - PROPYLENE 9----4
--~Gas 0ii~4 L I I 2~ Cyclohexane----ll-IU--Ethylbenzene*
I---~KerosineDS--~ Naphthalene*
Waxy 5--P BUTYLENES Distillates
= Heavy 5--D ISOBUTYLENE Fuel Oil Vacuum ~5--, Butadiene Bottoms
--~Pyrolysis Cyclopentadiene Gasoline
I IsopreneLn -4 BENZENE*
- Reformate TOLUENE* D6
XYLENES
Polyaromatics*
Generic Processes Notes i. Distillation 7. Liquid-liquid extraction Major routes to feedstocks 2. Steam cracking(pyrolysis) 8. Extractive distillation ..... Division between refinery 3. Steam reforming 9. Dehydrogenation operations and typical OCPSF 4. Catalytic reforming i0. Alkylation plant operations. 5. Hydrocracking ii. Hydrogenation * Priority pollutant(PRIPOL) 6. Hydrodealkylation
Source: Wise & Fahrenthold, 1981.
Figure V-1 Primary Feedstock Sources

Coal--I = Gas * METHANE
Pyridines
Picolines =Light Oils
L BENZENE*
- TOLUENE*
Naphtha~ XYLENES
v Coumarone-Indene
~ 3-~ Phenol*
Condensate--2----P r---,-Carbolic oil L Cresols
L3 Naphthalene*
Light cresote oil
~Tars 2 ~ Anthracene* |
- Heavy cresote oiI--2 Phenanthrene* 0o
Other polyaromatics*
- Refined tar
Pitch
- Coke
Generic Processes Notes I. Pyrolysis ..... Product recovery route 2. Distillation * Priority pollutant(PRIPOL) 3. Liquid-liquid extraction (after adjusting pH to >ii)
Source: Wise & Fahrenthold, 1981.
Figure V-2 Coal Tar Refining

METHANE 1
I 2
1S y n t h e s i s • Methanol Gas(CO & Hydrogen)
Acrylic acid
Methacrylic acid
Generic Processes I. Chlorination 2. Oxidation 3. Oxo(carbonylation 4. Esterification 5. Hydrochlorination
• Methyl* --i ~ Methylene* chloride chloride
Chloroform*
Carbon* tetrachloride
- Formaldehyde
, Acetic acid
I 4 Methyl acrylate
, Methyl methacrylate
Notes ..... Major synthetic route * Priority pollutant(PRIPOL)
Source: Wise & Fahrenthold, 1981.
Figure V-3 Methane
V-59

BENZENE*
i LEthylbenzene* 2 Styrene
F 4--Ketene -
m3 Acetaldehyde--3 Acetic acid--4 ~ 5 Acetic anhydride
6 -- Vinyl acetate
7---~Ethylene oxide i 8. : Ethylene glycol
ETHYLENE---~ 9 - - ~ Ethoxylates
i ~ ~I I~ i, 2-Dichloroethane* 12 Vinyl chloride* I
i0 13 I
Tetrachloroethylene* ! I
Carbon tetrachloride* i
i0 I
i0 1,1, l-Trichloroethane*
14-~ Ethanol 6 Ethyl acrylate
Acrylic acid
Generic Processes Notes I. Alkylation 6. Esterification ii. Oxyhydrochlorination Major synthetic route 2. Dehydrogenation 7. Epoxidation 12. Dehydrochlorination 3. Oxidation 8. Hydrolysis 13. Hydrochlorination * Priority pollutant(PRIPOL) 4. Dehydration 9. Ethoxylation 14. Direct hydration 5. Condensation i0. Chlorination
Source: Wise & Fahrenthold, 1981.
Figure V-4 Ethylene

F - 1 ~
BENZENE*
Cumene
2
Phenol*
PROPYLENE---~
-- 4
I
- Propylene oxide
5 ~
--- Acetone'
I
n-Butanol
17-14
6
~ I0
Methacrylic acid/MMA
Propylene glycol polyethers
Isopropanol
n-Butyl acrylate
< I
O%
9 Acrylic acid I &
_8_..~n_Butyraldehyde--ll-12-5---~2-Ethylhexan01-m--!0
--13--~AIIyI chloride 4
w9---~Acrolein* 15 - Allyl alcohol 2-14
16
2-Ethylhexyl acrylate
Epichlorohydrin 1. Glycerin-~--14
Acrylonitrile *~
Generic Processes i. Alkylation 2. Peroxidation 3. Epoxidation 4. Chlorohydrination 5. Hydrogenation 6. Propoxylation
7. Directhydration 13. Chlorination 8. Oxo (carbonylation)14. Hydrolysis 9. Oxidation 15. Reduction
i0. Esterification 16. Ammoxidation Ii. Aldol condensation 17. Cyanation 12. Dehydration
Notes
Major synthetic route
* Priority pollutant(PRIPOL)
Source: Wise & Fahrenthold, 1981
Figure V-5 Propylene

l-Butene
2-Butene
n-Butane
] - |
i----~ sec-Butanol
- 2 ,,-•2 • Butadiene
2 Methyl ethyl
3---,Adiponitrile--9---~Hexamethylene
-- ketone(MEK)
diamine
• Polybutadiene
Maleic anhydride
- Acetic acid
,PROPYLENE
iso-Butane 8 ] 5 - Propylene oxide
|
bo
tert-Butanol 6--4 • Methyl methacrylate
Generic Processes I. Hydration 2. Dehydrogenation 3. Hydrocyanation 4. Oxidation 5. Epoxidation
6. Dehydration 7. Polymerization 8. Peroxidation 9. Hydrogenation
Notes ~Major
Source:
synthetic routes
Wise & Fahrenthold, 1981.
Figure V-6 Butanes/Butenes

TOLUENE* 1 = Dinitrotoluene* Toluene diamine--3 • Tolylene diisocyanate
Terephthalic acid ~ p-Xylene 4 L--5-~ Dimethylterephthalate
XYLENES m-Xylene 4
P Isophthalic acid
r o-Xylene 4 Phthalic anhydride
Naphthalene* 4
Nitrobenzene* 2m6 z Aniline----i----7--~Polymeric 3--~ Polymeric 1 MDI
L4 Formaldehyde I MDA
b Maleic anhydride
BENZENE* 2---~Cyclohexane 4 • Cyclohexanone--8 ~ Caprolactam I
- Cyclohexanol--4 I ~ Adipic acid
iI~12 J ,I I
! Acrylonitrile* i0 Adiponitrile~2' ~ Hexamethylene diamine I
LO - 13-IV~ Cumene_~l:~ Phenol* 9m8 7--~ Bisphenol A
I t -- Acetone
15 Propylene oxide
~Propylene LI2 a-Methyl styrene
9 Sytrene 713--~E~hy[le~ nzene*
16 Chlorophenols*
16 Chlorobenzenes*
NotesGeneric Processes Major synthetic route i. Nitration 6. Reduction(Iron catalyst)ii, Amidification * Priority pollutant(PRIPOL) 2. Hydrogenation 7. Condensation 12. Dehydration 3. Phosgenation 8. Oximation/Rearrangement 13. Alkylation 4. Oxidation 9. Dehydrogenation 14. Peroxidation 5. Esterification i0. Hydrodimerization 15. Epoxidation
16. Chlorination Source: Wise & Fahrenthold, 1981.
Figure V-7 Aromatics

Monomer(s) Plastics Synthetic (Resins) Fibers
Styrene 2abc t Polystyrene Resins
~ m -2d Styrene-Butadiene Resins (Latex)
Polybutadiene E-2cd • SAN Resins
--2d , ABS Resins
Acrylonitrile* Polyvinyl alcohol Resins- |
Hydrolysis +Vinyl acetate 2d-~ Polyvinyl acetate Resins I
(Latex)
+Vinyl chloride* • 2c -~ Copolymer 3--4 = Acrylic Fibers (85% Acrylonitrile)
+Methyl methacrylate
+Methyl acrylate
+Acrylamide.
Acrylic acid esters 2d-~ Acrylic Resins(Latex)
Methyl methacrylate 2ab Acrylic Resins
Phenol* 1 P Phenolic Resins J
Forma idehyde ~-:
~ Melamine [ 1 ~ • Melamine Resins
Urea , Urea Resins
Epichlorohydrin--i T • Epoxy Resins
Bisphenol A
Phosgene 1 Polycarbonate Resins
Generic Processes Plastics Polymerization Fibers Spinning Notes I. Condensation 3. Wet Synthetic route 2. Addition 4. Dry * Priority pollutant a. Mass c. Suspension 5. Melt + Variable comonomer b. Solution d. Emulsion
Source: Wise & Fahrenthold, 1981.
Figure V-8 Plastics and Fibers
V-64

Monomer(s) Plastics Synthetic (Resins) Fibers
Terephthalic acid i-~ Polyester 5----Polyester Dimethyl terephthalate I Resins Fiber Ethylene glycol-
Glycerin
Isophthalic acid l----~Alkyd Resins
Phthalic anhydride~
Maleic anhydride 1 Unsaturated Polyester Resin
Propylene glycol
Styrene
Cellulose J v I
P Cellulose xanthate 3-~ Rayon Fiber
i---~ Cellulose acetate 4-~ Cellulose Acetic anhydride ~ acetate Diketene I Fiber
Coumarone-Indene 2b ---~ Petroleum Dicyclopentadiene 2b---~ hydrocarbon Resins
2a---~ LD Polyethylene Resins ETHYLENE,
2b ~ HD Polyethylene Resins
PROPYLENE 2c---~Polypropylene Resins--5--~ Polypropylene Fiber
Vinyl chloride* 2bcd---~ Polyvinyl chloride Resins
Hexamethylene--~Nylon--l--~ Nylon 66 Resins 5-~Nylon 66 Fiber diamine ~ salt
Adipic acid
Caprolactam I ~ Nylon 6 Resins 5-~ Nylon 6 Fiber
Tolylene diisocyanate-1--l~l Polyurethane Resins Polymeric MDI ' I and Foams Propylene glycol
polyethers
Generic Processes Plastics Polymerization Fiber Spinning Notes I. Condensation 3. Wet Synthetic route 2. Addition 4. Dry Priority pollutant a. Mass c. Suspension 5. Melt b. Solution d. Emulsion
Source: Wise & Fahrenthold, 1881.
Figure V-9 Plastics and Fibers
V-65

7a 6
Chlorobenzene* o-Chloronitrobenzene , 2,2 ' -Dichlorodiphenylhydrazine p 3,3 ' -Dichlorobenzidine* 7a 6
i i, 2-Dilhenylhydrazine* ,~Benzidine*
Dipheny~llmine---;b ........... w N-Nitrosodiphenylamine* (as diphenylamine) 5b
N-Nitrosodi-n-propylamine* ~ Di-n-propylamine 3 5b
Phenyl Esters N-Nitrosodimethylamine** Dimethylamine I ,
Phenol* ~-7
BENZENE*! Nitrobenzene*l • Aniline_~ I Benzene diazonium chloride • Phenylhydrazine
........................................... i
2-Nltrophenol
I 4 ~ 2-Nitr°aniline 2 ~ " • 2,4-Dinitrophenol*~
211 ; 2,4-Dinitroaniline
i 4 I ~ 4-Nitroaniline m-DinitrobenzeneO~ TOLUENE* ~ 2,4-Dinitrotoluene*
I 4-Nitrophenol*~ --I ,
~ 2,6-Dinitr~toluene*
o-Cresol = 4,6-Dinitro-o-cresol* 5a
m-Xylene 2,4-Dimethylphenol*
Notes Generic Processes i. Chlorination (Fe+3 catalyst) 5. Oxidation (a. Oxygen, b. Nitric acid) Major synthetic route 2. Diazotization 6. Rearrangement (Acid catalyzed) Principal coproduct 3. Hydrolysis 7. Reduction (a. Zinc/caustic, b. Iron/acid) ..... Minor coproduct 4. Nitration 8. Hydrogenation (Nickel catalyst) * PRIPOL
Source: Wise & Fahrenthold, 1981.
Figure %/-10 Nitroaromatics, Nitrophenols, Benzidines, Phenols, Nitrosamines

2b m-Cresol 4-Chloro-m-cresol*
2-Chlorophenol*
2 - C h l o r o a n i l i n e - 1
Phenol* 2 ~ 2b! 2,4-Dichlorophenol* j 2b I 2,4,6-Trich iorophenol*,_.2b m Pentachlorophenol*
II; 2b I 3 Aniline 2,4-Dichloroaniline 2,4,6-Trichloroaniline~
I ?_ 4- Ch loropheno i :~_:_:~ - ~, I
_~J , I jI 4-Chloroaniline ..... -'-~-2b 4
Hexachlorobenzene* J
i, 3,5-Trichlorobenzene-- PCB's* q ........ p................. J 2b 2b 2b
i p-Dichlorobenzene* _ _ • = 1,2,4-Trichlorobenzene* Pentachlorobenzene o~ i -4 2 b I 2b 2b 2b 4I"
BENZENE*_ • Chlorobenzene* - o-Dichlorobenzene* _-- 1,2,3-Trichlorobenzene - 1,2,3,5-Tetrachlorobenzene--
: ,L/=-- ~ ___J I ~b' m-Dichlorobenzene* .......... J
- s o d i u m p h e n o l a t e . . . . . . . . . . . . . . . . . . . . . . . . . . . . . . i
1 i [ -- Bromobenzene - p-Dibromobenzene - 4-Bromophenyl phenyl Ether*
2 b i l Naphthalene* p 2-Chloronaphthalene* L...... "-- 4-Chlorophenyl phenyl Ether*
generic Processes Notes i. Bromination 4. Hydrolysis (Alkaline) 2. Chlorination (a. Thermal, b. Fe+3 catalyzed) 5. Rearrangement (AICI3 catalyst) Major synthetic route 3. Diazotization Principal coproduct
..... d~inor coproduc~ "~ Priority Pollutant(PRIPOL)
Source: Wise & Fahrenthold, 1981.
Figure V-11 Chlorophenols, Chloroaromatics, Eialoaryl EtherS, PCB's

Carbon tetrachlorlde* Carbon tetrachlorlde* Carbon te~tachlollde* Methyl chloride* la " ¢ Methylene chloride* la = Chloroform* --la--
i Ethane --la~Chloloethane* --la l,l-Dichloroethane*--la l,l,l-Trlchloroethane*--la I _.~l , l , l ,2 -Tet rachloroethane- la~Pentachloroethane~laP,opaoo r t 7- t -? t
J H . . . . hlo~obutadiene* I I I I .
--- Trlchloroethylene* - - ~ ;,Tetrachlorethylene*
Hexaehlo~obenzene- | ~
ETHYLENE la I , 2-Dichlvroethane* --la i, 1 , 2-Trlch oroethane* ~ ta l.].2.2Tctrachloroothane'--laJq=H .... hl ..... h .... ,l5 J I Carbon tetrachloride* ~
~ 2 ! Vinyl chloride* PVC Resins
b--~ 1 , 2-t-Dichloroethylene* -
p Chloral .... la ............... ~ Chloroform*
~-3-~ bls(2-Chloroethyl) Ether* [
ETHYLEHE--6~ Ethylene--3a I , Ethylene oxide chlorohydrin I P 2-Chloroethyl vinyl Ether* <
! O~ Gener Ic Processes
OO I. Chlorination(a. Thermal, b. Ferric chloride catalyst) Notes 2. Dehydrochlorlnatlon Ma]or synthetic route 3. Hydrolysis(a. Alkallne, b. Acld) Principal coproduct 4. Hydrochlorinatlon (Perrlc chloride catalyst) ..... Minor coproduct 5. Oxyhydrochlor inat lon * Priority pollutant(PRIPOL) 6. Hypochlorlnatlon (Chlorine/Caustic)
Source: Wlse& Fahrenthold, 1981.
Figure V-12 Chlorinated C2's, C4, Chloroalkyl Ethers

BENZENE*, 2 ~ Cumene ii I Cumene ,, 9b i Phenol* hydroperoxide
--~bis(2-Chloroisopropyl)~ Acetic acid ~ Acetone ~ Isophorone* Ether*
8 .- L Ketene • Acetic anhydride 8
-5 : Propylene~9a I Propylene oxide
1,2-Dichloropropane*
PROPYLENE~ -4-- --PAllyl chloride, 5 I Propylene 9a L Epichlorohydrin dichlorohydrin ~ J
- 1,3-Dichloropropane* 9a 9a
~----~ Acrylic acid J ! - - - -10
Allyl alcohol~ll~9 ~ Glyc tin !
C~ I -~Benzene* ---~ Phenol* (Butadiene contaminant) ' (Diels Alder adduct) i
~-~ Naphthalene*
-=3 D Acrylonitrile*
Acetonitrile
Cyanide*
Generic Processes Notes I. Addition 5. Hypochlorination 9. Hydrolysis Major synthetic route
(Diels Alder) (Chlorine/Caustic) (a. Alkaline, b. Acid) Principal coproduct 2. Alkylation 6. Condensation i0. Oxidation Minor coproduct 3. Ammoxidation 7. Dehydrogenation ii. Peroxidation * Priority pollutant(PRIPOL) 4. Chlorination 8. Dehydration 12. Reduction(Isoalkoxide)
Source: Wise & Fahrenthold, 1981.
Figure %/-13 Clorinated C3"s, Chloralkyl Ethers, Acrolein, Acrylonitrile, Isophorone

Dibromochloromethane*
t METHANE~2--~Methyl chloride*~2---eMethylene chloride*~2
I 7
Meth~anolm4
I -~bis ( Chloromethyl ) J i
Ether I
Bromodichloromethane*
i 3--~Methyl bromide*~l p Bromoform*
~Chloroform* 2
Carbo~ tetrachloride* 5 I T
Trichlorofluoromethane* 5 1
Dichlorodifluoromethane*
Notes Major synthetic route
..... Minor coproduct * Priority pollutant(PRIPOL)
Source: Wise & Fahrenthold, 1981.
< I
-4
Generic Processes i. Bromination 2. Chlorination(Thermal) 3. Hydrobromination 4. Hydrochlorination
(Zinc chloride catalyst)
5. Hydrofluorination 6. Hydrolysis(Acid) 7. Via Synthesis Gas
(CO & Hydrogen)
Figure V-14 Halogenated Methanes

3. Chlorinated C2 and C4 hydrocarbons; chloroalkyl ethers
4. Chlorinated C3 hydrocarbons, acrolein, acrylonitrile, Isophorone, and chloroalkyl ethers
5. Halogenated methanes.
The ge ne r i c p rocesses a s s o c i a t e d with these s y n t h e s i s rou tes are denoted by
numbers i n d i v i d u a l l y keyed to each c h a r t .
The precursor(s) for each of these classes is reasonably obvious from the
generic group name. Classes 1 and 2 are, for the most part, substituted
aromatic compounds, while Classes 3, 4, and 5 are derivatives of ethylene,
propylene, and methane, respectively. The common response of these precursors
to the chemistry of a process has important implications, not only for the
prediction of priority pollutants, but for their regulation as well; that is,
group members generally occur together.
I t i s s i g n i f i c a n t to note that among the many p roduc t / p roce s se s of the
i n d u s t r y , the c o l l e c t i o ~ of products and gene r i c processes shown in Figures
V-IO through V-14 a re p r i m a r i l y r e spons ib l e for the g e n e r a t i o n of p r i o r i t y
p o l l u t a n t s . The c r i t i c a l p r e c u r s o r - g e n e r i c process combinat ions a s soc i a t ed
with these products a re summarized in Table V-38. While the re may be c r i t i c a l
combinat ions o t h e r than those cons idered here , Table V-38 con ta ins the most
obvious and probably the most l i k e l y combinations to be encountered in the
OCPSF i n d u s t r i a l c a t e g o r i e s .
c. Produc t /P rocess Sources of P r i o r i t y P o l l u t a n t s
The p r o d u c t / p r o c e s s e s tha t gene ra t e p r i o r i t y p o l l u t a n t s become obvious i f
the s y n t h e s i s rou tes to the p r i o r i t y p o l l u t a n t s a re , in e f f e c t , superimposed
upon the s y n t h e s i s rou tes employed by the i ndus t ry in the manufacture of i t s
p roduc ts . F igure V-15 r e p r e s e n t s a p r i o r i t y p o l l u t a n t p r o f i l e of the OCPSF
indus t ry by superimposing FiFure V-1 through V-9 and V-IO through V-14 upon
one another so as to r e l a t e p r i o r i t y p o l l u t a n t s to feeds tocks and products .

TD.P~ R V-38 . C ~ C ~ ~ ~ C PR0(]SSS ~ 0 N S q~AT ~ PRIORITY POI/IKAN~
C,~eric Process F _~t~ tock Oxidation (]~lorination Nitration Diazotization Reduction
Ber~ene Phenol C]floroaromaties N i t - - t i e s ( ] f l o ~ i s Ni t rophe~Is
Toluene 0,M-Cresol Nitroaromatics
Xylene 2,4-mmemy~h~ol 2,4-mmethy~1
mph~ 2-Ch]x)r~timlene
G-Roro~he~is Nitrophe~ls
Ck~sols ~ ~ i 4,6-Dinit~l
Chloroanilines Oaoro~emls ,< Otloroaromaties b o Aromatics
Nitrom~ N i t ~ l s Nitroaromtics Aromatics
N i t ~ 1+.4i t ~ t ~ h e n y l a d n e * a t i l ine* (mphem~m~ne)
m-Oflomnitrohenzene Benzidims** 1,2--Diphenylhyflrazir~'*
E ~ Cl~lorinatedC2'S Qhlorimted 04 (]floroa~omatics
Acrolein (]alorinated C3's
Methane ~xlorinated Methanes
*Derived di rec t ly from aniline, or indirectly via phenyltytrazine, diphenylamine is one of three s ecmda~ ~ that are precursors for n i t ~ , ~ exposed to n i t r i t e s (as in diazotization or NO.
~d)iph~lhydrazines rea~ to bemzidines Lmder acid concitions (as in diazotization).

I
Phthalate ----E-9--Phthalic Esters* | anhydride
| ~ 14 Alcohols I o-Xylene
I
Acetic acid--6--P Ketene t~
Isophorone* q Acetone ,
Nitrophenols* I i~
Nitroaromatics* ~ I 13
•--7--Coal tar ~7 distillates I
(Cyanide*)
I16-12--Cumene ~--I
, ,PhJnols*--4b
AROMATICS* 4h
18 L , Polyaromatics*--4b
e-19--Crude Oil
Natural Gas
• Ethane/Propane--4a
m ETHYLENE 15--4b
Methane 4a--3 20
Methanol I0--iI
• Cyclopentadiene--4b
Notes
Chlorophenols*
_.~,Chloroaromatics*
Chlorinated polyaromatic*
• Chlorinated C4"
--T Chlorinated C2's*~
, Halogenated~-4a ---~ F Methanes*
, Chlorinated C5"
Synthetic route * Priority pollutants(PRIPOLs)
Source: Wise & Fahrenthold, 1981.
Chloroalkyl,Ethers, ~Propylene oxide ~ 5
L--Chlorinated C3's* ---J
Epichlorohydrin ~--5-12--AIIyl chloride ~--4a I~
7
12
~ PROPYLENE*
!
~ Acrylonitrile*
I • Cyanide*
14. oxidation 15. Oxyhydrochlorination 16. Peroxidation 17. Reduction
(Alkoxide) 18. Solvent extraction 19. Steam pyrolysis 20. Via Synthesis Gas
Figure V-15
12
Glyc~erin-,--6-12 J
Allyl alcohol 4--17
Acrylic acid "---14 -~
Generic Processes i. Alkylation 2. Ammoxidation 3. Bromination(Thermal) 4. Chlorination a. Thermal b. Ferric chloride
Aluminum chloride 5. Hypochlorination
(Chlorine~Caustic) 6. Dehydration
Acrolein* ~ 14
7. D{stillation 8. Dehydrogenation 9. Esterification
10. Hydrobromination (Zinc bromide)
ii. Hydrochlorination a. Ferric chloride b. Zinc chloride 12. Hydrolysis 13. Nitration
Priority Pollutant (PRIPOL) Profile of the OCPSF Industry

In any product/process, as typified by Figure V-16, if the feedstock
(reactant), solvent, catalyst system, or product is a priority pollutant, then
it is likely to be found in that product/process wastewater effluent. Equally
obvious are metallic priority pollutants, which are certainly not transformed
to another metal (transmutation) by exposure to process conditions. Since
side reactions are inevitable and characteristic of all co-products of the
main reaction, priority pollutants may appear among the several co-products of
the main reaction. Subtler sources of priority pollutants are the impurities
in feedstocks and solvents.
Priority pollutant impurities may remain unaffected, or be transformed to
other priority pollutants, by process conditions. Commercial grades of
primary feedstocks and solvents commonly contain 0.5 percent or more of
impurities. While 99.5 percent purity approaches laboratory reagent quality,
0.5 percent is nevertheless equal to 5,000 ppm. Thus, it is not surprising
that water coming into direct contact with these process streams will acquire
up to 1 ppm (or more) of the impurities. It is not unusual to find priority
pollutants representing raw material impurities or their derivatives reported
in the 0.I-i ppm concentration range in analyses of product/process effluents.
Sensitive instrumental methods currently employed in wastewater analysis have
the ability of measuring priority pollutants at concentrations below 0.i ppm.
Specifications or assays of commercial chemicals at these trace levels are
seldom available, or were not previously (before BAT) of any interest, since
even 0.5 percent impurity in the feedstock and/or solvent would typically have
a negligible effect on process efficiency or product quality. Only in cases
where impurities affect a process (e.g., poisoning of a catalyst) are contami-
nants specifically limited.
d. Priority Pollutants in Product/Process Effluents
During the Verification sampling program, representative samples were
taken from the effluents of 147 product/processes manufacturing organic chemi-
cals and 29 product/processes manufacturing plastics/synthetic fibers. These
176 product/processes included virtually all those shown in Figures V-I
through V-9. Analyses of these samples, averaged and summarized by individual
product/processes, showed the priority pollutants observed in these effluents
V-74

° • ° ° ° • ° ° o Q ° • ° o ° ° • ° ° o ° ° ° . ° ° • ° ° °
:
"
:I Ca~a~ II I: Spent Catalyst
i i • . •
I :
[Reactant(s) ] : [Product(s)] ( Impurities ) T ROC SS il
I.
:1 I I 1: [ Solvent ]~ Derivatives
of Impurities o, • • • • •o, • • •,, •,-o • oo • • • I,- • •o [
Equipment Coproducts Cleaning Byproducts
Miscellaneous Resinous Materials*
C • Material
Losses
Notes ..... Limits of the process area in the
plant• * Still bottoms, reactor coke, etc.
Source: Wise & Fahrenthold, 1981.
Figure V-16 A Chemical Process
V-75

to be consistent with those that can be predicted, based on the precursor
(with impurities) generic process combinations.
Consistency between observation and prediction was most evident at con-
centrations >0.5 ppm. Below that level, an increasing number of extraneous
priority pollutants were reported that were unrelated to the chemistry or
feedstock of the process, and typically reported at concentrations less than
0.I ppm. These anomalies could usually be attributed to one or more of the
following sources:
Extraction solvent (methylene chloride), or its associated impurities, e.g., as residuals in the GC/MS system from previous runs
@ Sample contamination during sampling or during sample preparation at the laboratory (e.g., phthalate leached from anhydrous sodium sulfate used to dry the concentrated extract prior to injection into the GC)
• In-situ generation in the wastewater collection system (sewer).
In the reconciliation of product/process effluent analytical data, it was
expedient to initially so~t out the extraneous from the significant priority
pollutants. In most cases, only the latter can be related to the product/
process. Less than half of the effluents of key product/processes manufac-
turing organic chemicals contained priority pollutants at concentrations
greater than 0.5 ppm. The generic groups of priority pollutants associated
with these product/processes are summarized in Table V-39 and are consistent
with those predicted in Table V-36. Many product/process effluents have
little potential to contain greater than 0.5 ppm of priority pollutants,
because they do not involve critical precursor-generic process combinations.
Generic classes of priority pollutants reported at >0.5 ppm in the
effluent of product/processes manufacturing plastics/synthetic fibers are
summarized in Table V-40. The priority pollutants found in polymeric product/
process effluents are usually restricted to the monomer(s) and its impurities
or derivatives. Since all monomers or accompanying impurities are not pri-
ority pollutants, some plastics and synthetic fibers effluents are essentially
free of priority pollutants.
V-76

TA~R V-39. (IESRIC C~I~ Egg~mq~l~3~ SI(NI~CANr ~ ( N
(>0.5 gee) oF e~omTr ~mgra~rs
Bflxh~t
~z~tane Acetylene Acrolain /¢.rylic acid ~lipaai t r i le
Alkyl (C13, C19) amines A~kTZ (O3, C~) ~o~ Allyl alcohol
Ba~zyl chloride ~isph~.o~ A
l~ter~s ~ ty lbaw/1 phth-~te
Caprolacta~
tetmchlorifle
C h l o ~ (hlorofom ~ l o r ~ i t Creosote O~ne
C~mewlc ~
Al~lati~,. r~uxidat ica I ~ h ~ t i c a O~idatim Qxidatim .~mnnol~is, ~tion ~ t i o n
C~tlon, By~tion ~Ik~lat~o~ ~,~,-Oon (~ ~da~) ~tion ~~ylation BI~ Extraction
Extraction I~ Bxtraetion
(]~tion Cor~tion Extractive flisti]lation
E~t~if:ieaticn
O~idation, Q~at ica ~ t i c a , Oximtic~ afl~-inatim ~hlacimti~ Chlorimtim Ohl~ir~tim Chlarimtim D i s t i l l ~ t i ~ ~ l ky la t i~
. Fe~i~toek(s) - .
~mzene, Propyle.e •Methme erow~me erowh~e hiipic acid hr.ryloaitrile, eyflro~m CI2-CI8 alpha o]~fin, I I~ I~enol, ~ OIe£i~s Acoolein, sec-Butanol Nitrobenzene Toh~e Catalytic Peformate
tar ~t oil Pyrolysis Casoli~ Tolume R~enol, Acetone CA l~'olysates
n-~t,w~l, Benzyl chloride l~thalic ~h~k-lde C y ~ 1t1~ol Methane Ethylene dichloride Benzene Methane, ~ethyl chloride N i t ~ Coal tar 1~t oil Bering'.
Associated Priority Polluta~ts
Aromatics Aromatics, Polymumties Ac.rol~4n, Aromatics, l ~ l ~r_,ulein ~ r y l m i t r i l e ~.zylmitr i le Cyamde REr~I, Aromatics ~_mlein, ~ 1 , AL,,~ties, Polyammtics Aromatics Aromatics, Polyarc~tics
Aromatics Aromatics, l~alyarcmatics, l~er~ls; Cyanide Aromatics, Polyammties
D~um=ties Phenol, Aromatics ~zy. lamtr i le (acatc~itrile solvent) Aromatics, l~lymumties Phtl~l~tes
Aromatics Aromatics, ~ n o l C h l o r v ~ , Qklorinated C2's Chloramthanes, Chlorinated C2's C h l o ~ t i c s , Aromatics ~lorc~thanes, ~11orinated C2's Aromatics, Nitroammties, (~loroarcmties l~mmls, Ammties, Polymu.~ties Aromatics

TABLE V-39. ORC~/~IC (~MICAI~ EF~F3 ~ SIGNIFICANT ~ O N
(>0.5 ~M) OF ~0~T~
Prm~t
C y ~ l / - o n e 1,2-Dichloroe Dieyclopentadl erie Diethylphtbala te Diketene Dimethyl terel~thalate Dinitrotoluenes m~eny.nsodecy~ phosphate ~te_r
Epichlorohydrin Z ~ l a t e s 4 a k y ~ l ~.thylhn~ene
,< Zm~le.e Ethylene amines ES~ylene diamine Em~ene oxide
2-Ethylhexyl pht.l~la te
Glycerine ~methylene diamine Isobutylene ~oprme
~le ic anhydride ~thacrylic acid Methyl chloride
C, emric Process
Oxidation Oxychlorination Extraction, D~ m~rization Esterificati~n I~d ra t i on Esterifieatim Nitration ~terifcation
011omhydrinatim E ~ l a t i o n Alkylatio. Extraction from gIX
Steam Pyrolysis / ~ n a t i o n /~mmation Oxidation (tdomhydrinaticta Faterificaticta
aydmZysis ~ t i c n Extraction Extractive distil lation
(ttidaticn ~ t i o n Chlorination Bydrodflorination
( C a n t ~ )
Feedstc~Jc(s)
O y ~ Ethylene, C5 Pymlysate Ethanol, Phtbalic anhydride Acetic acid Meflmlz)l, TPA Toluene [%enol, Isodecanol
dao d A~yka~enol, ~.tiVh~e oxide Bewanm, Ethylem gl~ Extract
I/~, Naphtha, or Cas oil 1,2-Dichlomethane, Na 3 1,2-Diddoroetha~, blt 3 Ethylene Ethylene 2-~thy]h~mol Phthalic anhydride Zpichto~t~_ne miponitrne CA Pyrolysate C5 Pymlysate
Bemem Acetone Men,me Methanol
~ t e d Priority Pollutants
Fn~ols, Aromatics Chlorinated C2's Aromatics, Polyat,,,~tics ~thalates r_so~ra~ P h ~ t e s , Phenol N i t - - t i e s , Aromatics, Nitroil-ar~ls Phenol, Odorophe~ls Aromatics Odorinated C3's Phenol, At-c=rat ics Aromatics, Polyaromaties, Phenol Aromatics, Polyammties bLrylcrtitrile (acetonitrile solveat) A~c=mties, Polym-omaties, Pheml Oalorinated C2's Odorinated C2's 1,2-DidRoroetlmrm (CO z ~ b i t o r ) Oalorinated C2's, Oflo~c~]~l ethe~ Phtt~lates
Oalorinated C3's ~ y l o n i t r i l e Aromatics ~x~atics, ~ l ~ t i c s ~ r y l m i t r i l e (Aeetonitrile solv~at) Aromatics Cyanide Odoro=ethanes, Otlorinated C2's O t l o r o ~

T~mR V-39. O~CANIC (I~ICALS EF~]~WrS ~ SIGNIFICANt ~ 0 N
Pro~_~t
ltthylene chloril
~th~ethyi m~tone a-~etlvl s tTz~e Na~hthaZe~e
N i t ~
Phex)I F n ~ i c anhydride
Polymeric methylene ~ianiline
Polymeric methylene diph~yl diisocyanate
Pr~yiale ~o~lene oxide St~-~ Tet~J~iomethylena
Tetrachlorophth~l ic •anhyddde
Toluene
Tolu~ediisocyamte 1 , 2 , 4 - - T r i c h l o ~ Trichloroethylene
Vinyl acetate Vinyl chloride
Gmeric ~
~ t i m
l v ~ t i m (allco~de) Peroxidation Distillation D~t~ 11~tian Nitration
Pe~xidation Oxidation Oxidation ~xxien~tion
~ t i o n
Stem Pyrolysis thlo~d~Irimtim ~ t i m Oflnrimtim
(~flm-imtim
BIX Extractim BI~ Extraction
Extraction Hx~mation Oflorimtion Oflorimtion
Acetylation ~ r i n a t i o n
(>O.5 I ~ ) OF I~totrP/ (Cont~l~)
Feedstock(s)
M~thar~ ~th~l chiod~ Acmlein, sec-~t~ol Creme Oral tar dist i l lates l~lysis Casoline Benzene
Cuom-m mphti~1~e o-Xylene ~zfiline, Fonmlddlyde
~lymr ic mthyl~e dia~illue, Phosgene I.~G, Naphtha, Gas o i l
R t l v ~ 1,2-Dich~roettm~
Bmvies ~tha~c anh~Idde
Catalytic .refomate Cad tar light oil I~rolysis ~soline T o l ~ . i ~ i u e 1 , 4 - D i c h l o ~ 1,2--Dichloroehtaue BL'I heavies Ethylene, Acetic acid 1,2-Dichloroethane
Associated Priority Pollutants
O t i o s e , Originated C~'s
~"ole~n, Aromatics, Polym'umtics, Phenol Aromatics, Phenol A~u~ties, Polyaromatics, Phemls', Cyanide Aromatics, Polymus~ties A~um~ties, Nitroaromaties Nitrophenols Aromatics, Phemks Polyaromaties Aromatics Nitroazumtics
Chlorcm-omatics ( ~ t i o a solvent ) Aromtics, Polyaromatics, I~mols (~lorimted C3's, ~Iomallo/l etlm's Aromatics, phenol O~.1ormeti~ms, Chlorinated (R's, Chlorimted C3' S (1floroaromtics
Aromatics Aromatics, P o 1 ~ m t i ~ , t~e.o~, Or~ide Aromatics (~1omaromtics Ofloroaromtics Chlorinated C2's, ~lo~methares
Oflorinated C2's, Ehlorumthaaes

T~mP. V-39. ORC~NIC (I~MICA/~ EF~Im~Irs ~ ~CANr
(>O.5 PPM) OF PRIORITY ( C o n t ~ )
~ O N
Product Gene_r-ic I:~"o,'>~__ q Feedstock(s) Assoqiated Priority Pollutants
Vinylidene chloride [t i~:kod~rination 1,1,2-Tridlloroethane Chlorinated C2's, Orloromthanes x y ~ e s (m~xsd) ¢1~ Extraction Pyrolysis gasoline Aromatics
Extraction Catalytic reformate ALua~tics Extraction tar disti l lates 1~enols, Aromatics, Polyaromatics, Cyanide
M,p-Xy~ Distillation fflX extract Aromatics, Polyarmatics o-Xylene Distillation B1~ extract Aromatics, Polyaromatics

TABLE V-40. PLASTICS/SYNTHETIC FIBERS EFFLUENTS WITH SIGNIFICANT CONCENTRATIONS (>0.5 ppm)
OF PRIORITY POLLUTANTS
Product .
ABS resins
Acrylic f ibers
Acrylic res ins (Latex)
Acrylic res ins
Alkyd res ins
Cellulose ace ta te
Epoxy res ins
Phenolic resins
Polycarbonates
Polyester
Monomer(s)
A c r y l o n i t r i l e Styrene Polybutadiene
A c r y l o n i t r i l e Comonomer (var iab le) Vinyl chlor ide
Acrylonitrile Acrylate Ester Methylmethacrylate
Methylmethacrylate
Glycerine I soph tha l i c acid Phthal ic anhydride
Diketene ( ace ty l a t i ng agent)
Bisphenol A Epichlorohydrin
Phenol Formaldehyde
Bisphenol A
Terephthal ic ac id / Dimethylterephalate Ethylene glycol
Associated P r i o r i t y Po l lu tan t s
A c r y l o n i t r i l e Aromatics
A c r y l o n i t r i l e
Chlorinated C2's
A c r y l o n i t r i l e Acrolein
Cyanide
Acrolein Aromatics Polyaromatics
Isophorone
Phenol Chlorinated C3's AromatiCs
Phenol Aromatics
(Not inves t iga ted) Predicted: Phenol Chloroaromatics Halomethanes
Phenol Aromatics
V-81

TABLE V-40. PLASTICS/SYNTHETIC FIBERS EFFLUENTS WITH SIGNIFICANT CONCENTRATIONS (>0.5 ppm) OF PRIORITY POLLUTANTS (Continued)
Produc t
HD Polyethylene resin
Polypropylene resin
Polystyrene
Polyvinyl chloride resin
SAN resin
Styrene - Butadiene resin (Latex)
Unsaturated polyester
Monomer(s)
Ethylene
Propylene
Styrene
Vinyl chloride
Styrene Acrylonitrile
Styrene (>50%) Polybutadiene
Maleic anhydride Phthalic anhydride Propylene glycol (Styrene added later)
Associated Priority Pollutants
Aromatics
Aromatics
Aromatics
Chlorinated C2's
Aromatics Acrylonitrile
Aromatics
Phenol Aromatics
V-82

In comparison with effluents from product/processes manufacturing organic 0
chemicals, effluents from polymeric product/processes generally contained
fewer priority pollutants at lower concentrations. The polymeric plastics and
fibers considered in this report have virtually no water solubility. Further-
more, the process is designed to drive the polymerization as far to completion
as is practical and to recover unreacted monomer (often with its impurities)
for recycle to the process. Thus, the use of only a few priority pollutant-
related monomers, the limited solubility of polymeric products, and monomer
recovery, results in the reduction of the number of priority pollutants and
their relative loading in plastics/synthetic fibers effluents.
Table V-41 lists priority pollutants detected in OCPSF process
wastewaters by precursor/generic process combinations. Priority pollutants
are generically grouped and the groups are arrayed horizontally. Priority
pollutants reported from Verification analyses of product/process effluents
are noted in four concentration ranges, reading across from each precursor.
~his arrangement makes it more apparent, particularly at higher concentration
ranges, that reported priority pollutants tend to aggregate within those
groups that would be expected from the corresponding precursor-generic process
combination.
In c o n t r a s t with o rgan ic p r i o r i t y p o l l u t a n t s tha t are co-produced from
o the r o rgan ic chemica ls , m e t a l l i c p r i o r i t y p o l l u t a n t s cannot be formed from
o the r meta l s . Except for a poss ib l e change of ox ida t i on s t a t e , metals remain
immutable throughout the g e n e r i c process . Thus, to a n t i c i p a t e m e t a l l i c
p r i o r i t y p o l l u t a n t s , the metals tha t were in t roduced in to a g e n e r i c process
must be known.
Metallic priority pollutants, individually and in combinations, are most
often related to a generic process via the catalyst system. The metals
comprising catalyst systems that are commonly employed with particular
precursor/generic process combinations to manufacture important petrochemical
products have been generally characterized in the technical literature
(especially in patents). An obvious way to offer clues for predicting
metallic priority pollutants was to expand the generic process descriptors in
the listing of Table V-41 to include this information.
V-83

• •
"able V-41I
Priority Pollutants in Effluents of Precursor-Generic Process Combinations
NITROARC AATICS PHENOLS CHLOROPHENOLS NITROPHENOLS BENZIDINES
AROMAT'ICS POLYAROMATICS CHLOROAROMATICS HALOARYL ETHEl S NITROSAMINES PHTHALATES HALOGENATED METHANES
POLLUTANT
)ROOUCT =ROCESS 30DE c _
_ = -~ u ~ ~"
® = = ® = ; ~ == - ~ o ' "~ 0 0 i_
e -- =m c~ O - ~ =6 ® ~131 "o~ E f: "~ .,ToPRECURSOR ~ . ~ "
(FEEDSTOCK) ¢= ~ co -- -- ! ' ~ 0 r~ . _ ~ - ~ - .~ " ~ o N
PRIORITY , , io i ii !i i}i ii - uJ o= Z ~ <gO n~ ~ ~O nm >~ I (.3 t -
" DIRECT CHLORINATION 0890-0] Benzene 3 ~ o o 02o • • ~ ]~ 0 0 0 • O ¢
0530-0] Toluene ~ • olO o o IO o s o
3393-0] 1,4-D]chlotobenzene ~ 0 o10 O•
0g4g-0] N~trobenzene • 00IO o ~ 0 • 0 o 0 ¢ -WO
3300-0] Phtha l i c anhydr ide 00 o f 0 ¢ o o -X-o
IZ44-01 Ethy lene O ¢ o 0 ¢ 3zg5-0Z Ethylene d ich lor ide 4 ~ o • • • • O
3410-03 Ethy lene d i ch lo r ide s ~< ~ o ¢ o ~k o 0810-01 Methane 6 ~ o • • • • 0
CHLOROHYDR/N ATION 1650-01 Ally] chloride ¢ 0 O • lg80-OZ Ethylene 7 0 0 ¢ • • o 3 lZ0-OZ Propylene 7 0 ¢ ¢ • ~ o
DEHYD ROCHLOR/'N ATIOI~ • ~ • o35zo-so Ethylene dichloride
• •3530-0Z l , l ,Z-Tr ich loroethane O o ~O ~I .~ e 1 0 -~ • 0
HYDROFLUORINATION 1ZZl-01 Carbon tetrachloride • 0 0 o • •
3535-01 I, I, 1-Trichloroe thane 0 o •
PHOSGENATION 3015-01 Poly MDA 8 ¢ 0 o 0 OIO ¢
3354-01 Z,4-Tolylenediamine ¢ 0 ¢ • 0 0 0 0 o O • AMMONATION
0185-04 Adipic acid o 1 1700-01 Ethanol 0 1800-01 Ethylene dichloride 9 0 ~ C 0 O o •
ACETYLATION 08Z0-03 Cellulose/Acetic anhyd. 0
DEHYDRATION 0080-0Z Acetic acid ~ 0 o o O O O
Z690-01 Cumene hydroperoxide 0 0 ZZ65-0Z t -Butanol 0 0 0 ~1 O 0 O 0 0 O 0 0 0 0 1450-O1 Acetic acid 2 0 aoao
Notes: $ i I . [ z l l anaeus to p feduCt /g foCeSs. 4. 0 8 1 0 0 4 . has a l s l l a l soa lTe l s . 71 Caxls= esstoeatm~ o l l l u o n t . 2. False a S l a l l l e . 5. Ch le l l ne tad C2"e Ors miss ion I ron t h i s a n a l y s i s . 335~-.~1 ham s i m i l a r s n s l y s | s .
a n a l / l e a . s n o l y s l a . to! i c t l l a acid focovolad l i e n e n i d • L i o n o l s -ay l one .
3. 1210--O1,1220--01 halo s l a i l s f s i a l / l e a . " O. 0930-.~2,2020--02,2500--03 h o l t slallsI :i 3011,01 has o l n l l s l
CHLORINATED C3"s MISCELLANEOUS CHLORINATED C2's CHLOROALKYL ETHERS METALS
' * ~ i t
.~_ ~ ~ x
z ' ~ £ SlOt~ 3 -l iifi l l -3 3 ; , _0i_ 3 g z . ~
I I t l ~.2 " 0 ® • ~._~ o=_eo>~
O1 o ~ O o O ~ ¢
O o - ~ o ¢ o O 0 ¢ ~ O o O ~
• O ~ ; e 0 o
~F• O - ~ • e o o o
• o - ~ o • • o 0
o ¢ • ¢ o • ¢ o
O e O o ~ ~ 0 • • • • O .X- 0 0 0
O 0 0 0 0 0 0 0 0 0 0 (~ • o o • o ~ - O O 0 ~ 0 0 0
¢ 0 0 0 0 0 0 0 0 0 0 0 0 0 0
~ 0 o o • e O
0 0 0
0 0 ~ 0 0
O 0 0 ~ o 0 ~ o ~ o o • o ~ o
O 0 0 0
0 0 0 0 O 0
~ KEY: • = >0..5 DDm
: k = O . t - 0.5 gore =.O 1 - O. 1 POe = < . 0 I o d e . Or arialys0s
fa4ed IO (|Jrlll~C|
V-84

Table V-41 (Continued) Priority Pollutants in Effluents of Prt ,cursor-Generic Process Combinations
NITROARC MATtCS
PHENOLS AROMATICS POLYAROMATICS
CHLOROPHENOLS ;HLOROAROMATICS HALOARYL ETHEl
NITROPHENOLS BENZIDINES IS N ITROSAMINES ~HTHALATES
T ~-- , , HALOGENATED METHANES
CHLORINATED C3's MISCELLANEOUS CHLORINATED C2's CHLOROALKYL ETHERS METALS
PRIORITY POLLUTANT
PRODUCT PROCESS CODE
~ ooo~
(FEEDSTOCK) ~ X ~ i , = = = = ~ . . . . . . - - ._
z = = o o
u =
, ~
~, ~ ® o .
z
= o
z , .
o
= ?
i _u._o 3 o o o - ~=_~ - ,,~
CRACKING 1770-01 LPG 2 1770-0Z ! Naphtha/Gas oil 3 1770-04 Naphtha/LPG 4 0130-03 Naphtha/LPG
E [TRACTION/DISTILLATION] 0380 -0Z ~ a t a l y t i c r e f o r m a t e 5 I 0 3 8 0 - 0 4 C o a l ta~ l i g h t oi l 6 i 0 3 8 0 - 0 9 P y r o l y s i s g a s o l i n e }' 0 5 9 0 - 0 1 C4 P y r o l y z a t e s 1171--01 C5 P 3 ~ o l y z a t e s ZT01-0Z P y r o l y s i s g a s o l i n e ? 1 6 5 - 0 1 ~ 4 P y r o l y z a t e s 1710 -0Z BTX E x t r a c t "" Z350-0Z C5 P y r o l y z a t e s 3 7 Z 0 - 0 1 C4 P y r o l y z a t e s 8
0
o a t • • O • ~ 0 o • O,O • O • 0 • ~ 0 O 0 • o ~ 0 0 • 0 : ~ 0 0
o o o ¢ 3 ~ D O • O • I Q O O • e • o ¢ • ~ , ¢ o • o o O o O O o>~ O ¢ 0 ¢ O • o • • ",~ 0 O ¢ ¢ o o o • 0 ~ 0 ¢ 0 0 o O ¢ O D ~ O O O o o o • 0 ~ 0 ¢ 0 0 o o ¢ O 0 o O O O O O O O O • O o • O ~ k O O 0 0
0
O
° • 0 o ~ # e O o ~ O • 0 ¢ O,o OO
o o n
0 0 0 • * o O O • ~ o 0 ¢ o e o O O o e O O DO s O O • e e o o ~ O • O O • e
¢
0 0 O ¢ ¢
¢ o O
0 ¢
o
OO,oo
0
I I
It
0 0 0 ~ 0 0 0
D O 0 , I o o 0 0 0 0 0 o 0 o 0
0 0 o n o 0
e 1 0 O O
o 0
o n
O O
0 o
0
0
0 0
0
0 0 0
0 0
0 O O 0
0
0
0
0
0
ilLI, • I
q
0
o
. , o O e 0 0 O 0
o O o o o o
0
0
0 0
O o o O e ¢ o o 0 ¢ o 0 ¢ 0 o o ~ o O O o O ~ 0
0 ~ o 0
0
o
0
o o
0
o
0
A L K Y L A T I O N 1"110-0 1 Benzene/Ethylene 1060-01 ! Benzene/Propylene 9 0195-01 Phenol/Octene/Nonene
o o o o • O O ~ o ¢ o 0 ¢ ¢ 0 0 #
O 0
0 0 0 0 o
0 0 ¢
0380-01 HYDRODEALKYLATION
Toluene/Xylene s e e O • 0 o o z e O O O • O e * o ¢ 0 o ¢ e ~ O o O 01 O # o O o
OXIMATION 0"/85-06 Phenol/Cyclohexanone 0785-09 Cyclohexane/Cyclohexanone
O e
• • 0
• •
O O O O O 0 0 O O 0 0 .I o
• 0 ~ 0
o o o 0
1171-01 1450-01
DIMERIZATION Cyclopentadiene Ketene
s e e • ¢
• e * O 0 0 O e O O e • o O ,F 0
0 0 o 0 0 0 0 0 0 0 0
3170-01 CARBOXYLATION
Phenol 0 O • ,lo o 0 o o 0 ~ o o ~ o o o o NTTRATION
1550-01 Toluene Z770-01 ' Benzene
i o
• •
0 0
o e o e o
0 ~ o o ~
O O
O O
0 0
~ 0 o o ~ 0 0 o ~ 0 o o o e e O O ~ o O o e O o ¢ o
DIAZOTIZATION Uncoded I Z, 4 , 6 - T r i c h I o r o a n i l i n e o ¢ U n c o d e d A n i l i n e U n c o d e d 4 - N i t r o a . n i l i n e :
i • 0
U n c o d e d Z - N i t r o a n i l ~ e i O
Notes: KEY: • = 70.5 pore | . [ l l rensoua tO p~oduot/ptocaas. 5. 3340,-01.3541-03 have s l s i l s ~ analyses, 9. |442-01 has I l a l l e f ana lys is . -~ O. I - 0.5 ppm 2. 3Q60-,,02 has s l n l l o t anelya|a. B. 1007-01.2981--01,2701-01 have t i l l | a t analyses. |0. Calories source paabmill 50S aeast|e oetomatant. 0 =.01 - O. I ppm 3 . 3G90- -~9 ~ae s im i la r s~ l l ya la . 7. 3349~)7.3541-.01,354|-.08 have a l i l | e ! Imalyses. I I . Laie thsa l a t l l l o e t l a = n t l t i t l e i . 0 = ~-01 ppm. or analysis
"4. 30g~l| has slmlla# adelye|a. E. 3~OO-.QI hea s l a l l e t enalye le. 12. Psle|ble I l l | S i l i c a | | I l l i l a t l n l t t l l l l l t t l i | l l l l a l a l i l . failed tO detect
V~85

• • •
Table V-41 (Continued) Priority Pollutants in Effluents of Precursor-Generic Process Combinations
NITROAROMATICS PHENOLS CHLO~ROPHENOLS NITROPHENOLS BENZIDINES CHLORINATED C3's MISCELLANEOUS
AROMATICS POLYAROMATICS CHLOROAROMATICS HALOARYL ETHERS NITROSAMINES PHTHALATEI HALOGENATED METHANES CHLORINATED C2's CHLOROALKYL ETHERS METALS
P R I O R I T Y POLLUTANT
$ IODUCT z: iOCESS =-i == . ® I
)DE ® c
== o ~: .c N __ = - ~- = 3 3 c -~ o !~® = ® £ = o o_= £ ~u ~=i o ~ o o ~ ~
- -5 ® c 3 o o o o 2 / : =
- ~ o o o O C "E(FEEDSTOCK) ~ ~ ~ a"6
~ ,~- i = o- ® ÷ ~o ° i o~-~ "¢: i' !! E i Ii
®
-
j¢ N N i ~ N ~ "~ CD ¢ . . . . . ~_~'q
-~ o O~ "r o~ ",~ o~" O. z d ~ 3 •--" - -r T B.~ ";Y:5 '~
OXIDATION | 30 -01 B~rtZ e n e • [o 2 o 00 o ~ o )91-01 Cam ene 4
i
0 *o 0 ~oOooooOo L35-01 Cyclohex~ne * ~°-I* O 0 I 0 O 0 O 0 O 0 0 O0 0 o • ~ 0 0 0 0 | 80 -80 Cyclohex a .ue / -o l / -one 0 0 o )60-01 N a p h t h a l e n e O f¢ 10 0 000 o o • )60-0Z o-Xylene o 0 00 o o ~.80-01 p--Xylene 5 • o I 0 00000 )30-0Z Ethylene • * 0 l' •" 0 " • 0 • 0 O' 0o0 o )80-01 Ethylene • o o ~ k * O O o 0 0 0 o O 3 0 o0 o .40--01 Propylene 6 , o 0 L60--80 Propylene O 0 0 o• 0 0 L80-01 Cyc]ohexanol 0* 54O-07 sec -Bu tano l /Acro le in 0 0 0 0 0 ot 0 • )70--04 Aceta ldehyde 0 0 o 1 o0 0 o o )66-01 Propiona]dehyde ¢ O 0 0
~00-01 Anil ine 0 00 O ~ o e o L30-01 Methane • ; 0 . • 0 • 0 0o o0 O 0 0o 0 0 eO o 180-03 Cyclohexanol /one mix O -$ •
t30-01 Toluene 8 O 0 0 0 0 7 0 7 0 7 0 0 0 7 0 0 0 0 • HYDROGENA'FION :'°:~00-01 Acro le in / sec -But anol o 0 0 000
165-0Z Adiponi t r i le •1 0 o 0 a l e • 0 * ~40-0Z n-Butyra ldehyde 9 • 0 1 . * d c o o 0 00 0 o 0 0 o O o o O 0 0 O O O O 0 0 O o o ~* 0 o* o o• $ ~00-0Z Carbon monoxide !'o : o 1 ° o o 0 0 0 0 0 ]51-01 Din i t ro to luene 0 0 °,: 0 ~o O *O 0 ~ 0 0 0 0 0 0 0 0 100--04 Ni t robenzene • o 0 O 0 0 e0 o o 0 0 0 0 0 0 0 e * 0 0 e * 0 o o )00--01 Z - E t h y l - Z - h e x e n a l ~0 0 0 l ~ k ¢ 0 0 o 0 0 000 0 0 0 ~k0 O 0 0 )70-01 Propionaldehyde 0 O O l o o o o 0 0 C O 0 O 0 0 0 0 ¢ 0 0 0 oo 0 0 0 0 0 0 0 0 0 e * ~ k ~ o 0 0 0
DEHYDROGENATION I 0185-04 Adipoamide •1 o e l -e O 3 Z30-01 Ethylbenz ene • O 0 : 0 ¢o0 ~k • 1 0 0 0", I ZSO0-0Z Methane 0;0 0 3 o o o o o o Z040--O 1 Methanol o o o o o 0090-11 ~sopropanol ~0 o o o o o Z640-01 sac-Butanol 0 e o HYDRO] "ORMYLATION/CARBONY I 3050-01 Ethylene ~oOo~ o o o o 0 o c '0 0 0 0 O 0 0 0 0 0 0 0 o o o 3 0 o o o o : ~ * * o O o o Z750-01 I sobu t y l ene 0 0 1 " ~) 0 0 0 0 i 0 0 0 o o 0 0 O O 0 0 0 0 0 0 0 0 0 0 0 000o o o 0640=02 P r o p y l e n e 11 o I , , ~ 01 O 0 0 0 O o *0 o O o o 0 0 0 0 0 0 0 0 0 0 o o * : ~ 0 o * o o o • 0070 -05 M e t h a n o l o o 0 • 0 " O0160-03 _Acet]r lene 0 ¢ I o 0 0 0 o O 0 0 0 0 O 0 0 o 0 e o * o
Notes: I | . £stfaasous to p#nduct/plro©ma=. 4 . 2910 02 has s i m i l a r analyml8. 7. Less than v i t r i f i c a t i o n 8e lec t len ¢ ; I t e f l e n . KEY. • = >0.5 ppm 2. False io la t l v to O. O070--lO has s i m i l e ! a n a l y s i s . O. 0300,=03 ham s i m i l a r a n a l y s i s . : ~ = 0 . 1 - 0.5 ppm ~. Added Is p l l C l l 8 | l l t l p p l l e l :02 l evant ine . O. 0050~0~ ha8 s i m i l a r a f l l l y l l l . O. 2250--01 hal s i l l | I f ana lys i s . ~ ~_..01 - 0.1 ppm
0~---~.01 ppm. or analysis faile¢l to deist !
V-86

Table V- 41 (Cont inued)
Prior i ty Pol lutants in E f f luents of >recursor -Gener ic Process C o m b i n a t i o n s
NITROAROMATICS CHLOROPHENOLS | NITROPHENOLS BENZIDINES
CHLORINATED C3's CHLORINATED C2's
MISCELLANEOUS CHLOROALKYL ETHERS METALS
PHENOLS AROMATICS POLYAROMATICS
CHLOROAROMATICS HALOARYL E ~ H E R S
I NITROSAMINES PHTHALATES HALOGENATEO METHANES
i
PRIORITY POLLUTANT i GROUPS @ .-~£
PRECURSOR
== == = = [ ®
== :
=. ®
cO
0
"6
0 C¢ C0 ¢
0 .C .~ ~D 0 ( ,q, .=_ ..' o c
__
-
x
E -
'~T:
~ .
5 = _ ;
" 3 3
~ o
!i_ o- ~ •;-~
o ~ ~' ,.:~
~ ~ ~
o~-
oz~ °.~ ~ o
SS S ~ S
(FEEDSTOCK) : ? ~-~ 0 E . o o,~.o
POLYMERIZATION e ~ O
ACN/Styrene Styrene/ButadieneStyrene (..ruspension) Styrene ('o~k) ACN/AA esters /MMA Methylmethacrylate D i c y c l o p e n t a d i e n e Ethylene (HDPE) Ethylene (LDPE) Propylene Vinyl acetate Vinyl chloride (susp.) Vinyl chloride (emul.) IV'm~[ chloride (bulk) I FIBER SPINNING
: /Styrene ¢ ¢ ¢ +:~d=
O ~ O
0
~ : ~ o • 0
0 ¢ 0 • 1 0 C
0 ( ( ~c
0 0
0 O
0 ~ ¢ O
0 0 0 0 0 0
0 0
O 0 0 O 0
0 0
0 0 O, 0 0
0 0
0
o 0
o 0
O O 0 O
0 0 0
o o 0 ¢
0 0 0
0
01
D
o •
0
0 0 O 0
0 0 0
0
0
0
0
0 0 0
O 0 0
¢
o
, 0 0
o
• 0
O 0
0 ~ O 0
O O O
0
O' 0 0 o
O - 0
O .
0 0 0 0 O'
• 4 0 0 0 0
0 0 o , O o
O 0 0 0 • ~
0 @ ~ c e O
O
0
0 0 0
0
0
O 0
•
•
I Acrylic resin [ Cellulose SATIO N/PO LY M EP.IZ ATIO i Acetone/Phenol n-Butyraldehyde Epichlor ohydrin/Bisphenol A Melamine/Formaldehyde Phenol/For m aldehyde Urea/Formaldehyde Caprolactam Nylon salt Aniline/For maldehyde
ETHOXYLATION Ethylene oxide/water Ethylene glycol 2
, Ethylene glycol still btm's 3- CI1 , C1Z Linear a l c o h o l s 3 Alkylphenol
PROPOXYLATION L Propylene glycol
Glycerin
$
o ~ 9
) 0 0
¢ o ¢ 0
0
~c •
¢
~c
~< o
3 0 0 0 O0
0 0 o O o
o o o o o o o o o o o o o o 0 0 0 0 0 0 0 0 0 0 0 0 0 0
0 o
0 0
0 0
0 .4
¢ 0
0
0
0
0
¢ o o 0
o
O
0 0
0
o o o 0 -O 0
0
0
DIO o •
0 0
O 0 0 0 O 0
0
O O O
~ o 0 0 0
el
~ C O 0 C
0 . 0
0 0
~ 0 . (
O
o
o • o •
oO 0
0 0
0
0 0
o 0
~k
0
0
¢
o O
¢
o
o o O
D O 0 0 0 0
o o o 0 o o :~O " O D D
•
0 ¢ 4 0 0 0 ' *
D O o ~cO o o o
•e o • o ~ O O O O ~
o 0 0 e ~ O O O 0 ~ 0 ' 0 0 0 O •
0
o
o 0
O
o
.o
O ~ 0 •
0
o o
KEY: • = >0.5 DOra Abbfoelot lenl : 1 d¢ =0.1 - 0.5 ODin
Notes: ACN - A e f y l e n l t l l l e 0 =.Or - 0.1 ppm I . [etfaflooue to pfoduot/pfocese.
3. 34~0--03 his e l a l l e f analysis. 0 = <:.01 DPm. or analysis 4. [po~y fss ln p,0ceee peszlnoi t0 tO.l plscses. AA - A o f y l i l a c i d
2. 3460-~| hie e i l i i l s f analysis. i iA -- i e t h i e f y i l a aoid faded to detect
V - 8 7

Table V-41 ( C o n t i n u e d )
Pr ior i ty P o l l u t a n t s in E f f l u e n t s of P r e c u r s o r - G e n e r i c P r o c e s s C o m b i n a t i o n s
NITROAROMATICS PHENOLS
AROMATICS POLYAROMATICS CHLOROPHENOLS NITROPHENOLS
CHLOROAROMATICS HALOARYL ETHERS NITROSAMINES BENZIDINES
PHTHALATES HALOGENATED METHANES CHLORINATED CHLORINATED C3's MISCELLANEOUS
C2'a CHLOROALKYL ETHERS METALS P R I O R I T Y '
POLLUTANT I
PRODUCT = PROCESS
CODE
ESTERIT
l,® ® C(FEEDSTOCK} ~ / e c a ~¢
IC ATIO N/POLY MERIZ ATIO] r
• i
_ ~
=" " : ' ~=
~
®®
° * -~
~ .-
J
~
E
-
• - -
" ~ ' o ;
!=~ ,
o o
I I
= =
o c ~_
0 I t
E ~ C~ c =0 • o == a = .-. o o ~ c - "- I I
--
i .a
a a ~ o
E E "~ ~ = = a = o ~ "6"6 o E a - ° -
~ a z z
Oio"iE ~ ~ o~ am ~iol_a_a ~
•
:
¢
: ~ E
2 6 6 5 - 0 2 Acetone cy~n-ohydrin 3068-01 0240-.01
Acetic ac id /n -T~ropa~o l O O Acetic acidlPentanol (Amy1) 0 O
0 0
0 0 0 0 0 0 0
0 O 0 0 0 0 0 0 0
0 0 O 0 O O 0 0 0 0 D o
0 O 0 0 o o o
) ° O o DO
o ~ o ~ e ~ 0 a m o
3510-05, 0165--0 0i65-i 0165-0 0165-I 2470-0: 1530-01 3006-Z 2883-01 2859-O] 2863-0 Z886-O 0189-01 3501--0: 2951-01 Z 6 8 0 - 0 ]
ZO90-O] Z090--03
Acetic acid/Ethylene Acrylic a c i d / n - B u t a n o l Acrylic acid/Ethanol Acrylic acid/Isobutzmol Acrylic a c i d / Z - E t h y L h e x z m o l MMA/Butanol T P A / M e t h a n o l
T~A/Ethylene glycol PA/Ethanol PA/Z-Ethylhexanol PA/CIl-C14 A l c o h o l s PA/Butanol/Benzyl chloride PA Glycerin PA/MA/Propylene glycol POCl3/Phenol/lsodecanol Salicylic acid/Methanol HYDRATION/HYDROLYSIS AIIyl alcohol EpicbJorohydrh~
O o
0 o o I
~ 0 ~ • (: , • #
) • I o
1 0
O
e l
o ®
0 0 e l
• I
0 0 o 0
o
0
O 0 O ( 0
0 00 ¢
0
O
3 el
.3 .3
D e 0
o o • 0 0
O
0 0
o
O 0 0
¢ n
O
O O 0 0
0
0
"X-
0 O
a m
a m
0 0 0
oO
o 0
O O
0
0
0
0
0 0
O O
00
O o
0 0
0 0 0
~¢
o
0
o
O
O
o ) o )el0
o
DO o~ro, ¢ o o o e, 0 O
o -~-'x- o o o
O : ~ o O o O o
0 ~ k 0 0 O • '#- X,:
0 0 0 0 0 0
~ e 0 0 0 o 0 0 0
~o0o 0 o ¢ ~ o • ~ 0
o o o
• 00 , 0 0 ooooe*oooooo
Z460-01 3042-80 L660-01 ;360--01 )650-01
;460-01
Acetone cyanohydrin Polyv~nyl acetate 2 Ethylene Propylene Butene
HYDROCYANATION Acetone
o o I 0 0
) 0 ) 0 o 0 0 o ) o . o o o
o 0 0
o < 0 C O ~
o ¢ O O
O 0
0 o 0 0 0 O 0
0 OO
DO
0
O-~-o
o D O O 0 0 0 0
•
Oo
0
0
0 0
0
o
~f
~
o~0o o~Ooo
O o ~ , 0 0~ o
o 0
DO 0
o '665-02 )19Z-0,1
) 185 -05
Acetone/Methanol C13-C19 a l e f i ns HYDRODIMER/ZATION
A c z y l o n i t z i l e
) f.
I
0
0 0
0o
O o 0
0 0
~ o-X-g o
• • •
Z070-01 I S O M E R I Z A T I O N
Maleic acid 0 o 1 0 O 0 •
3570--~Z m-Xylene -~ o ~00 o o 0 O 0 0 0 0
O o o OoSoSOSo
o O o o
0
o o o o 0
Holoa! Io [xtlanmouo la pfoduet/pfocOmOo el Iho tel'ophthalmia i l tmlr . AbbFovlmtlonm: 2. 0070-13 hoe O I I I I o I analymlI. 4 . Ymi~'e prmbabl! hl l lher, smepled | IA - i o l h o c r y l l ¢ acid IA o Imlml¢ ambydlidm KEY" • ~ >0.5 ppm 3. Mmy be a t l l l bu tmb lo to ~-xy loaa I l i t e r mymm|de I l l e V l l I l l | I a , TPA - Telmphthall¢ mold I'IIl I- Phamphofl| | l i l h i o f l d m -X-=O.! - O.5 ppm
Impur i ty . O| m l l i d o n l i f l c m l l o n ' | . l o l l Ihm= l e l e t l l l = l l . I l l lmn t i o= ¢rl lmliO=o PA - Phthmilm acid --_..~1 - 0.1 pprn 0 =<.01 ppm. or analysfs
laded Io delecl

Copper, chromium, and zinc were the metallic priority pollutants m o s t
frequently reported in the higher concentration ranges for all product/process
effluents. Copper and chromium are used in many catalyst systems. Another
sigflificant source of chromium, as well as zinc, is the "61owdown" that is
periodically wasted from an in-plant production area's recycled noncontact
cooling water. These metals find application in noncontact cooling waters as
corrosion inhibitors. In some wastewater collection systems, it is possible
for the blowdown to become mixed with product/process effluent before the
combined flow leaves the production area to join •the main body of wastewater
within the plant. Another source of metallic priority pollutants is the
normal deterioration of production equipment that comes into contact with
process water.
Extraneous or unexpected priority pollutants were also reported in
product/process effluents. Priority pollutants may be considered extraneous
when they cannot be reconciled with the precursor (or its impurities) and the
process chemistry. In Table V-41, extraneous priority pollutants were noted
only when they were reported at greater than 0.5 ppm. Thus, the failure to
flag a priority pollutant at less than 0.5 ppm does not necessarily preclude
it from being extraneous. As a general rule, one extraneous generic group
member indicates that the entire group is probably anomalous. These data are
presented here to assist NPDES permit writers in establishing effective
monitoring requirements for OCPSF plants' end-of-pipe discharges. The
phthalate esters are an example of such a group that persisted throughout the
Verification data. Except for processes that manufacture phthalate esters,
these priority pollutants are now recognized as analytical artifacts and
edited out of the BAT and PSES effluent limitations data base.
E. RAW WASTEWATER CHARACTERIZATION DATA
I. General
As described under "Water Usage" earl~er in this section, the OCPSF
industry generates significant volumes of process wastewater containing a
variety of pollutants. Most of this raw wastewater receives some treatment,
either as an individual process waste stream or at a wastewater treatment
I V-89

plant serving waste streams from the whole manufacturing facility (see Section
VII). To decide what pollutants merit regulation and evaluate what technol-
ogies effectively reduce discharge of these pollutants, data characterizing
the raw wastewaters were collected and evaluated. This section describes the
Agency's approach to this important task and summarizes the results.
2. Raw Wastewater Data Collection Studies
Section III of this document introduced the many wastewater data
collection efforts undertaken for development of these regulations. Studies
that produced significant data on raw wastewater characteristics include the
308 Surveys, the Phase I and II screening studies, the Verification Study, the
EPA/CMA Five-Plant Study and the New 12-Plant Sampling Program. The 308
Surveys have been described in Section III; the remaining studies are
summarized in Table V-42 and are discussed below. The results of the studies
are presented in the "Wastewater Data Summary" at the end of this Section.
3. Screening Phase I
The wastewater quality data reported in the 1976 Section 308 question-
naire were the result of monitoring and analyses by each of the individual
plants and their contract laboratories. To expand its priority pollutant data
base and improve data quality' by minimizing the discrepancies among sampling
and analysis procedures, EPA in 1977 and 1978 performed its Phase I Screening
Study. The Agency and its contractors sampled at 131 plants, chosen because
they operated product/processes that produce the highest volume organic
chemicals and plastics/synthetic fibers.
Samples were taken of the raw plant water, some product/process influents
and effluents, and influents and effluents at the plant wastewater treatment
facilities. Samples were analyzed for all priority pollutants except
asbestos, and for several conventional and nonconventional pollutants.
Screening samples were collected and analyzed in accordance with procedures
described in the 1977 EPA Screening Procedures Manual. Samples for
liquid-liquid extraction (all organic pollutants except the volatile fraction)
and for metals analyses were collected in glase compositing bottles over a
24-hour period, using an automatic sampler generally set for a constant
\~ V-90 I

TAI~ V-42.
K~T RAIt VASIE ~ [~ZA B&~
V.l~t Phase I S c ~ ~mse I I ~ - e s i ~ Verification
Dates ~gust 1977 to ~ 19/8 ~ 1979 1978 to 1980
I ~D
Number of pl~ts Direct ~ Indirect ~ Othe~ discham~
40 14 24 2
37 30 5 2
Plant ~qe_lpc_tion objective
Raw ~ te r . TL~ll]e~t i n i l u ~ t and e f n , ~ t .
effluent
S ~ e as Ehase I . Verify specific poL1~tants from p~od~t/pnx~es
locations ~ t / ~ iv fh~n t s and eff luents in29 plas t ic , 147 o~anic. Treatm~t system in- fl,win_ t emd effluent. Raw ~ater.
SampUag duration (a) I day 1 day " 3days
Po] lut ,mts tested: Al l pr ior i ty poLlut~mts but asbestos
Same as ~ I Specific pollutants from specif ic
s~lected orgame poLLutants, no i ~ ' s or pesticides
Q~5-Plant
June 1980 to May 1981
5 5 --
Chemical . p l ~ t s with ~_n-desigr~d and ~ e l l ~ t e d a c t i -vated sludge t r~ t - mmlt systems
Treammt influent and e f f l u ~ t . "rzeatmmlt" im-l,rl~l neutrml i rat ion and ol*r i f ieat ion.
4 to 6 ~ k s
C ~ v e ~ t i ~ and TOC, (I~D; no heavy mt~l.~
New 12-Pla~t
March 1983 ~ May 1984
12. Ii i -
Plants with pollutants of c~o~_~ and with treatment tedmoloKies tmd~r consideration for BAT
End-of-Pipe Treammm ~ t and effluent.
imnumt and ef f lu- ent of selected BAT treatment teelmol~es, sludge.
2 to 4 ".~"~s
Conventi~ and p n o ~ pollu~ts

BAT ~ ~ ~ I ~ A BA~ (Contim,,~d)
Element Bmse I ~ I~a~'IX Sc_vmmaing ~- i f lea t ion OS/kS-Plant New 12-Plant
!
b o
finalytical metlx~ for organic pollutants
t ~ participating
( ~ S , 1977 (~/(2C protocol; 4-AAP for phenols,
EPA P~rions VII, VI, IV; ~nvin)dyne, Midwest Research Institute (MRI).
( ~ S , 1979 Qfi/(1C (~./(1) with ennfirma- protocol, tory f r . /~ (624/625)
on 10g of ~ , ~ .
Env~. .~ , ta l Sc_ie~ce I ~ : BnvL, vdyne, & l~gineec~g MR1:, Sou t i ~ t
Reseacch Institute~ Q,1 f South lteseat-d~ Institute, Jacd~ (PJB Iabs), ~ .
Mk~tly (~MS (624/625) or GC
3 I~A contract lahq, 1 0 m omtraet lab, & 4 ehemeal plant labs.
(~/MS (1624/1625)
I~: I'I' Analytical, S-CLUed, C~mtec, I~ l.a~ratories, K.~li~n, Bazelton-Ralteeh, L~S Testing, MRI
(a) Omemlly, samples were 24-4m~ mmposites; cymide, phavls, and mlat i lp m~mics ~,:e b~mm-ally grab samples or a series of grab samples.

aliquot volume and constant time, although flow- or tlme-proportlonal sampling
was allowed. For metals analysis, an aliquot of the final compositesample
was poured into a clean bottle. Some samples were preserved by acid addition
in the field, in accordance with the 1977 EPA Screening Procedures Manual;
acid was added to the remaining samples when they arrived at the laboratory.
For purge and trap (volatile organic) analysis, wastewater samples were
collected in 40- or 125-mi vials, filled to overflowing, and sealed with
Teflon-faced rubber septa. Where dechlorlnation of the samples was required,
sodium thiosulfate or sodium bisulfite was used.
Cyanide samples were collected in l-liter plastic bottles as separate
grab samples. These samples were checked for chlorine by using potassium-
iodide starch test-paper strips, treated vlth ascorbic acid to eliminate the
c h l o r i n e , then preserved with 2 ml of 10N sodium h y d r o x i d e / l i t e r of sample
(pH 12).
Samples for t o t a l (4AAP) phenol c o l o r i m e t r i c a n a l y s i s were c o l l e c t e d in
g lass b o t t l e s as separa te grab samples. These samples were a c i d i f i e d with
phosphoric or s u l f u r i c ac id to pH 4, then sea led .
Al l samples were maintained at 4°C for t r anspor t and s to rage dur ing
a n a l y s i s . Where s u f f i c i e n t data were a v a i l a b l e , o ther sample p r e s e r v a t i o n
requi rements ( e . g . , those for cyanide, phenol, and VOAs by purge and t rap as
desc r ibed above) were d e l e t e d as appropr ia te ( e . g . , !if chlor~n~ was known to
be absen t ) . No a n a l y s i s was performed for asbes tos dur ing the Phase I
sc reen ing e f f o r t . t
In gene ra l , the Phase I Screening Study genera ted data tha t were
q u a l i t a t i v e in na ture due to f a l s e p o s i t i v e p o l l u t a n t i d e n t i f i c a t i o n , which
occurs as a r e s u l t of the procedures used for i n t e r p r e t i n g ambiguous p o l l u t a n t
i d e n t i f i c a t i o n based on the 1977 sc reen ing l e v e l GC/MS a n a l y t i c a l p ro toco l s
and QA/QC procedures . These procedures a re d i scussed in more d e t a i l in
Sect ion VI of t h i s document.
'V-93

4. Screenin~ Phase II
In December 1979, samples were collected from an additional 40 plants
(known as Phase II facilities) manufacturing products such as dyes, flame
retardants, coal tar distillates, photographic chemicals, flavors, surface
active agents, aerosols, petroleum additives, chelating agents, micro-
crystalline waxes, and other low-volume specialty chemicals. As in the
Phase I Screening study, samples were analyzed for all the priority pollutants
except asbestos. The 1977 EPA Screening Procedures Manual was followed in
analyzing priority pollutants:. As in Screening Phase I, some samples for
metals analysis were preserved by addition of acid in the field (in accordance
with the 1977 Screening Manual) and acid was added to the remaining samples
when they arrived at the laboratory. In addition, the organic compounds
producing peaks not attributable to priority pollutants with a magnitude of at
least 1 percent of the total ion current were identified by computer matching.
Intake, raw influent, and effluent samples were collected for nearly
every facility sampled. In addition, product/process wastewaters that could
be isolated at a facility were also sampled, as were influents and effluents
from some treatment technologies in place. Fourteen direct dischargers,
24 indirect dischargers, and 2 plants discharging to deep wells were sampled.
Table V-43 lists the product/process and other waste streams sampled at each
plant.
As with the Phase I Screening Study, data from this study were considered
as qualitative in nature for the same reasons stated for Phase I.
5. Verification Program
The Verification Program was designed to verify the occurrence and
concentrations of specific priority pollutants in waste streams from
individual product/processes and to determine the performance of end-of-pipe
treatment systems.
The product/processes to be sampled were generally chosen to maximize
coverage of the product/processes used to manufacture organic priority pollu-
tants, chemicals derived from priority pollutants, and chemicals produced in
V-94

TABLE V - 4 3 . PHASE I I SCREENING - PRODUCT/PROCESS AND OTHER
WASTESTREAMS SAMPLED AT EACH PLANT
P l a n t Number Waste Streams Sampled
Combined raw waste ( f luorocarbon)
Anthracene Coal t a r . p i t c h
Combined raw was tes ( d y e s )
Combined raw was tes ( c o a l t a r )
Combined raw was tes ( d y e s ) .
Oxide Polymer
7 Freon
8 Freon
9 E t h o x y l a t i o n
10 Nonlube o i l a d d i t i v e s ~ Lube o i l a d d i t i v e s
11 Combined raw was tes ( d y e s )
12 Combined raw was tes ( f l a v o r s . )
13 Combined raw was tes ( s p e c i a l t y c h e m i c a l s )
14 Combined raw was tes ( f l a v o r s )
15 ' Hydroquinone
16 E s t e r s P o l y e t h y l e n e S o r b i t a n m o n o s t e r a t e
17 Dyes
18 Combined raw was te s ( s u r f a c e a c t i v e a g e n t s )
19 F a t t y a c i d s
V-95

Plant Number
20
21
22
23
24
25
26
27
28
29
30
31
32
33
34
TABLE V-43. PHASE II SCREENING PRODUCT/PROCESS AND OTHER-
WASTE STREAMS SAMPLED AT EACH PLANT (Continued)
Waste Streams Sampled
Organic pigments Salicylic acid Fluorescent brightening agent
Surfactants
Dyes
Combined raw wastes (flavors)
Chlorination of paraffin
Phthalic anhydride
Combined raw waste (unspecified)
Dicyclohexyl phthalate
Plasticizers Resins
Combined raw waste (unspecified)
Polybutyl phenol Zinc Dialkyldithiophosphate Calcium phenate Mannich condensation product Oxidized co-polymers
Tris (~-chloroethyl) phosphate
Ether sulfate sodium salt Lauryl sulfate sodium salt Cylene distillation
Dyes
Maleic anhydride Formox formaldehyde Phosphate ester Hexamethylenetetramine
V-96

TABLE V-43. PHASE II SCREENING - PRODUCT/PROCESS AND OTHER WASTE STREAMS SAMPLED AT EACH PLANT. (Continued)
Plant Number Waste Streams Sampled
35 Acetic acid i
36 Combined raw Waste (coal ta r )
37 "680" Brominated f i r e re t~rdants Tetrabromophthalic anhydride Hexabromodyclodpdecane
38 Hexabromodyclododecane
39 • Fatty acid amine es te r Calcium suylfonate in soivent (a lcohol) Oil field deemulslfier blend
(aromatic solvent) Oxylakylated phenols-formaldehyde res in Ethoxylated monyl phenol Ethoxylated phenol--formaldehyde res in
40 Combined raw waste (surface ac t ive agents)
V-97

e x c e s s o f 5 m i l l i o n pounds per y e a r . The p r i o r i t y p o l l u t a n t s s e l e c t e d f o r
a n a l y s i s in the was te s t r eam from each p r o d u c t / p r o c e s s were chosen to meet
e i t h e r o f two c r i t e r i a :
• They were believed to be raw materials, precursors, or products, in the product/process, according to the process chemistry; or
• They had been detected in the grab samples taken several weeks before the 3-day Verification exercise (see below) at concentrations exceed- ing the threshold concentrations listed Rn Table V-44.
The threshold concentrations listed in Table V-44 were selected as
follows. The concentrations for pesticides, PCBs, and other organics are
approximate quantitative detection limits. The concentrations for arsenic,
cadmium, chromium, lead, and mercury are one half the National Drinking Water
Standard (40 FR 59556 to 74; December 24, 1975).
The Agency sampled at six integrated manufacturing facilities for the
pilot program to develop the "Verification Protocol." Thirty-seven plants
were eventually involved in the Verification effort. Samples were taken from
the effuents of 147 product/processes manufacturing organic chemicals and 29
product/processes manufacturing plastics/synthetic fibers, as well as from
treatment system influents and effluents at each facility.
Each plant was visited about 4 weeks before the 3-day Verification
sampling to discuss the sampling program with plant personnel, to determine
in-plant sampling locations, and to take a grab sample at each designated
sampling site. These samples were analyzed to develop the analytical methods I
used at each plant for the 3-day sampling exercise and to develop the target
list of pollutants (analytes) for analyses at each site during the 3-day
sampling. Some pollutants that were targeted for Verification, since they
were raw materials, precursors, or co-products, were not detected in the
Verification program grab samples. If such a pollutant was also not detected
in the sample from the first day of the 3-day verification sampling, it was
dropped from the targeted list of analytes for that sample location. Other
compounds were added to the analysis list, since they were found in the grab
sample at a concentration exceeding the threshold criteria in Table V-44.
V-98

Priority pollutants known by plant personnel to be present in the plant's
wastewater were also added to the Verification list.
At each p l an t , V e r i f i c a t i o n samples g e n e r a l l y inc luded: process water
supply, p roduc t /p rocess e f f l u e n t s , and t reatment f a c i l i t y i n f l u e n t and
e f f l u e n t . Water being suppl ied to the process was sampIed to e s t a b l i s h the
background concen t r a t i on of p r i o r i t y p o l l u t a n t s . Product /pr6cess samples were
taken at l o c a t i o n s that Would best provide r e p r e s e n t a t i v e samples. At var ious
p l an t s , samples were taken at the i n f l u e n t to and e f f l u e n t from both
"in-process" and "end-of-pipe" wastewater treatment systems.
Samples were taken on each of 3 days during the V e r i f i c a t i o n e x e r c i s e .
Twenty-four hour composite samples for e x t r a c t a b l e organic compounds and
metals were taken with automatic samplers. Where automatic sampling equipment
would v i o l a t e p lant s a f e ty codes r e q u i r i n g exp los ion-proof motors, equal
volumes of sample were c o l l e c t e d every 2 hours over an 8-hour day and manually
composited. Raw water supply samples were t y p i c a l l y c o l l e c t e d as d a i l y grab
samples because of the low v a r i a b i l i t y of these waters .
Samples for cyanide ana lys i s were c o l l e c t e d as e i t h e r a s i n g l e grab
sample each day or as an equal-volume, 8-hour composite of four a l i q u o t s every
2 hours.
For purge and trap (volatile organic) analysis, duplicate grab samples
were collected four times over an 8-hour period each day.
The temperature and pH of the sample, the measured or estimated
wastewater flow at the time of sampling, and the process production levels
were all recorded, particularly in connection with operational upsets (in {he
production units or wastewater treatment facilities) that could result in the
collection of an unrepresentative sample.
It should be noted that for organic priority pollutants, gas chroma-
tography with conventional detectors (GC/CD) was used instead of GC/MS. GC/MS
analysis was used on I0 ten percent of the samples to confirm the presence or
absence of pollutants whose GC peaks overlapped other peaks. The analytical
V-99

TABLE V-44. SELECTION CRITERIA FOR TESTING
PRIORITY POLLUTANTS IN VERIFICATION SAMPLES
Parameter C r i t e r i o n (ug/1)
Pesticides and PCBs Other Organics Total Metals:
Antimony Arsenic Beryllium Cadmium Chromium Copper Lead Mercury Nickel Selenium S i lve r Thallium Zinc
TOTAL Cyanide
0.I I0
I00 25 50 5 25 20 25 1 500 i0 5 0 1,000
20
V-100

methods finally developed for a given plant were usually appiicable (with
minor modifications) to all sampling sites at that plant.
Raw da ta from a l a b o r a t o r y ' s r e p o r t i n g form were encoded on computer da ta
tapes. The encoded data were verified to be consistent with the raw data
submitted in the reporting forms. Data across injections, extracts, and
laboratories were averaged to derive a concentration value identified uniquely
by plant, chemical number, sample site, and date.
The data were then reviewed by EPA for consistency with the process
chemistry in operation at the plant during the sampling period. After being
judged acceptable for use in the OCPSF rulemaking, the data were provided to
statisticians for analysis.
6. EPA/CMA Five-Plant Sampling Program
From June 1980 to May 1981, EPA, with cooperation from the Chemical
Manufacturers Association (CMA), and five participating chemical plants,
performed the EPAICMA Five-Plant Study to gather longer-term data on
biological treatment of toxic pollutants at organic chemical plants. The
three primary objectives of the program were to:
Assess the effectiveness of biological wastewater treatment for the removal of toxic 6rganic pollutants
Investigate the accuracy, precision, and reproducibility of the analytical methods used for measuring toxic organic pollutants in OCPSF industry wastewaters
Evalua te p o t e n t i a l c o r r e l a t i o n s between b i o l o g i c a l r e m o v a l o f tox ic o rgan ic p o l l u t a n t s and b i o l o g i c a l removal of conven t iona l and nonconven t iona l p o l l u t a n t s .
Since the biological wastewater treatment system influent samples were
taken upstream of any preliminary neutralization and settling of each chemical
plant's combined waste stream, the samples of influent to biological treatment
reflect each facility's raw waste load following any in-plant treatment of
waste streams from individual product/processes.
V-IOI

EPA selected the five participants because of the specific toxic organic
pollutants expected to be found. The five participating OCPSF plants were
characterized as having well-designed and well-operated activated sludge
treatment systems. Typically, 30 sets of influent and effluent samples
(generally 24-hour composites) were collected at each plant over a 4- to
6-week sampling period.
Only selected toxic organic pollutants were included in this study;
pesticides, PCBs, metals, and cyanides were not measured. Samples were
analyzed for a selected group of toxic organic pollutants that were specific
to each plant as well as for specified conventional and nonconventional
pollutants. Not all toxic organic pollutants included in this study were
analyzed at all locations.
EPA's contract laboratories analyzed all influent and effluent samples
for toxic organic pollutants using GC/MS or GC/CD procedures (44 FR 69464 et
seq., December 3, 1979, or variations acceptable to the EPA Industrial Tech-
nologny Division). One EPA laboratory used GC coupled with flame ionization
detection (GC/FID). Approximately 25 percent of the influent and effluent
samples collected at each participating plant were analyzed by the CMA
contractor using GC/MS procedures (44 FR 69464 et seq., December 3, 1979, or
equivalent). Some variation occurred in the analytical procedures for the
toxic organic pollutants used by both the EPA contract laboratories and CMA
laboratory during this study. An extensive QA/QC program was included to
define the precision and accuracy of the analytical results.
Each p a r t i c i p a n t analyzed conven t iona l and nonconvent iona l p o l l u t a n t s in
t h e i r i n f l u e n t and e f f l u e n t wastewaters using the methods found in "Methods of
Chemical Analysis of Water and Wastes," EPA 600/4-79-020, March 1979.
Additionally, four of the participating plants analyzed from 25 to I00 percent
of the samples collected by EPA for some of the to:'ic organic pollutants being
discharged by the plant. The influent concentrations measured in this study
prior to end-of-pipe treatment are discussed later in this chapter. The
biological treatment effluent results are discussed and used in Section VII
and IX.
V-102

7. 12-Plant Long-Term Sampling Program
In response to concerns about the l i m i t e d amount of long- term tox ic
p o l l u t a n t data conta ined in the data base, EPA conducted a long- term sampling
program from March 1983 through May 1984. Twelve p lan ts were s e l e c t e d based
upon the products manufactured, the p o l l u t a n t s genera ted , and the i n - p l a n t and
end-o f -p ipe t rea tment t echno log ies employed. Specia l emphasis was placed on
i d e n t i f y i n g p lan t s with p o l l u t a n t s for which e x i s t i n g data were l i m i t e d .
The number of sampling days at the 12 plants sampled are presented in
Table V-45. The plants were visited several weeks prior to the long-term
sampling. During these visits, background data were collected, sample sites
were selected, and grab samples were collected. The grab samples enabled EPA
to confirm the presence of suspected pollutants and enabled the laboratory to
determine the proper dilutions to be used during analysis.
Samples were collected for each plant's end-of-plpe treatment system, and
included influent, effluent, and sludge samples. Where plants utilized
in-plant control or tertiary treatment, samples were also collected at the
Influent and effluent of these systems. Samples were analyzed for conven-
tional, nonconventional, and priority pollutants.
Organic priority pollutants were analyzed by EPA Method 1624, "V01atile
Organic Compounds by Isotope Dilution GC/MS"; and Method 1625, "Seml-volatile
Organic' Compounds by Isotope Dilution GC/MS." These methods employ GC/MS for
separation, detection, and quantitation of organic priorlty pollutants, based
on the capability of the mass spectrometer to distinguish the isotoplcally
labeled analogs of the organic priority pollutants that were Spiked into every
sample prior to extraction. Metal priority pollutants were analyzed by atomic
absorption (AA) spectrophotometry, using the 200 series methods in EPA
publication USEPA 600/4-79-020, "Methods for Chemlcal Analysis of Water and
WaStes." Dioxin was analyzed by EPA Method 613. Asbestos was analyzed using
the transmission electron microscopy (TEM) methods described in EPA
publication USEPA 600/4-80-005, "Interim Methodology for Determining Asbestos
in Water."
V-103

TABLE V-45. NUMBER OF SAMPLING DAYS
FOR 12-PLANT LONG-TERM SAMPLING PROGRAM
Number of Plants Number of Days Sampled
1 20
7 15
I 12
2 I0
1 I
V-104

For the first four plants, data were reported by the laboratory on
manually transcribed data sheets to EPA's Sample Control Center (SCC) for
encoding and quality assurance. For the last eight plants, data were
transmitted by the laboratories to the SCC via magnetic tape. The data were
also reviewed by EPA for consistency with the process chemistry in operation
at the plant during the sampling period. After having been judged to be
acceptable for use in the OCPSF rulemaking, the data were transmitted by SCC
to the IBM computer at EPA's National Computer Center in Research Triangle
Park, North Carolina, for loading into the 0CPSF data base.
In a d d i t i o n to da ta c o l l e c t e d in the sampling s t u d i e s d i scussed above,
the Agency a l so r ece ived da ta as par t of pub l ic comments on the March 1983
Proposal and the Ju ly 17, 1985 and December 9, 1986 Federa l R e g i s t e r Not ices
of A v a i l a b i l i t y (NOA). These data were reviewed by the Agency to de termine
t h e i r accuracy and v a l i d i t y and s e l e c t e d data were inc luded in EPA's f i n a l BAT
toxic p o l l u t a n t da ta base, which was used in l i m i t a t i o n s development. A
d i s c u s s i o n of the Agency's review and the s e l e c t i o n of p lan t da ta for the
f i n a l tox ic p o l l u t a n t da ta base i s p resen ted in Sec t ion VII .
F. WASTEWATER DATA SUMMARY
I. Organic Toxic Pollutants
The Agency's wastewater data collection studies as well as data submitted
during public comment periods on the proposal and NOAs discussed above yielded
substantial long- and short-term priority pollutant concentration data for
50 data sets from 43 manufacturing plants. Tables V-46 through V-49 provide a
statistical summary of the priority pollutant concentrations in the combined
Influent to the end-of-plpe treatment systems for these plants. For illus-
trative purposes, the data for all plants are presented in Table V-46 with
Tables V-47 through V-49 sorted into organics only, plastics only, and
organics and plastics plants, respectively.
V-105

TABLE V-46
SUMMARY STATISTICS FOR INFLUENT CONCENTRATIONS FOR
ALL OCPSF PLANTS
CHEMICAL CHEMICAL THRESHOLD OF # OF # OF MINIMUMMAXIMUM MEAN MEDIAN
NUMBER NAME VALUE FRACTION NONDETECTS DETECTS PLANTS VALUE VALUE VALUE VALUE
1 ACENAPHTHENE 10 BASE/NEUTRAL 43 30 8 10.00 7000 773.8 513.0
2 ACROLEIN 50 VOLATILES 0 3 1 2500.00 34500 13633.3 3900.0
3 ACRYLONITRILE 50 VOLATILES 2 66 7 290.00 890000 94771.4 31500.0
4 BENZENE 10 VOLATILES 24 178 23 11.00 713,740 24389.6 812.3
6 CARBON TETRACHLORIDE 10 VOLATILES 6 30 7 10.00 44000 2203.1 543.0
7 CHLOROBENZENE 10 VOLATILES 40 51 8 10.00 49775 3028.7 382.0
8 1,2,4-TRICHLOROBENZENE 10 BASE/NEUTRAL 23 355 4 20.00 2955 571.6 301.0
9 HEXACHLOROBENZENE 10 BASE/NEUTRAL 0 18 2 13.00 920 242.9 121.5
10 1,2-DICHLOROETHANE 10 VOLATILES 39 106 13 10.00 1272220 20730.2 410.0
11 1,1,1-TRICHLOROETHANE 10 VOLATILES 32 17 6 10.00 7234 594.1 30.5
12 HEXACHLOROETHANE 10 BASE/NEUTRAL 0 18 2 38.00 3400 516.7 156.5
13 1,1-DICNLOROETHANE 10 VOLATILES 20 5 2 11.00 640 163.5 15.0
14 1,1,2-TRlCHLOROETHANE 10 VOLATILES 17 14 4 10.50 1201 299.4 23.3
15 1,1,2,2-TETRACHLOROETHANE 10 VOLATILES 38 5 4 10.00 192 111.1 121.5
16 CHLOROETHANE 50 VOLATILES 30 16 4 60.00 2840 522,7 104.0
18 BIS (2-CHLOROETHYL)ETHER 10 BASE/NEUTRAL 6 13 2 25.00 1700 413.5 54.0
21 2,4,6-TRICHLOROPHENOL 10 ACIDS 11 79 7 10.00 16780 427.7 59.0
23 CHLOROFORM 10 VOLATILES 66 96 17 10.00 5250 643.0 216.0
24 2"CHLOROPHENOL 10 ACIDS 31 34 5 10.33 247370 13206.0 117.5
25 1,2-DICHLOROBENZENE 10 BASE/NEUTRAL 31 399 12 10.50 23326 1039.6 829.0
26 1,3-DICHLOROBENZENE 10 BASE/NEUTRAL 3 20 2 11.50 4616 417.3 25.5
27 1,4-DICHLOROBENZENE 10 BASE/NEUTRAL 36 22 4 10.00 721 105.6 42.0
28 3,3"DICHLOROBENZIOINE 50 BASE/NEUTRAl, 0 10 1 371.00 38351 6147.5 1700.0
29 VINYLIDENE CHLORIDE 10 VOLATILES 49 40 8 10.50 1300 348.2 262.5
30 1,2-TRANSD]CHLOROETHYLENE 10 VOLATILES 26 9 4 12.83 515 255.9 236.3
31 2,4-DICHLOROPHENOL 10 ACIDS 4 27 4 60.00 72912 7153.6 665.0
32 PROPYLENE CHLORIDE 10 VOLATILES 4 58 6 28.50 11000 1405.7 505.0
33 1,3-DICHLOROPROPENE 10 VOLATILES 14 28 4 10.00 4850 447.7 178.5
34 2,4-DIMETHYLPHENOL 10 ACIDS 3 42 7 10.00 73537 11932.6 4470.0
35 2,4-DZNITROTOLUENE 10 BASE/NEUTRAL 0 22 3 715.00 17500 3301.3 1659.0
36 2,6-DINITROTOLUENE 10 BASE/NEUTRAL 8 24 4 29.00 4675 775.0 379.5
38 ETHYLBENZENE 10 VOLATILES 31 143 20 15.50 80000 2382.5 220.0
39 FLUORANTHENE 10 BASE/NEUTRAL 2 31 6 14.87 7175 1249.9 1040.0
42 BIS-(2-OHLOROISOPROPYL) ETHER 10 BASE/NEUTRAL 3 18 2 193.00 19486 2267.9 787.0
44 DICHLOROMETHANE 10 VOLATILES 36 109 13 10.00 19000 2469.7 1091.0
45 CHLOROMETHANE 50 VOLATILES 7 8 I 51.00 129 83.4 90.0
47 BROMOFORM 10 VOLATILES 18 2 I 24.00 71 47.5 47.5
52 HEXACHLOROBUTADIENE 10 BASE/NEUTRAL 0 18 2 83.00 9100 2006.3 1111.0
54 ]SOPHORONE 16 BASE/NEUTRAL I I I 253.00 253 253.0 253.0
55 NAPHTHALENE 10 BASE/NEUTRAL 25 76 !~ 12.00 37145 4579.1 623.6
56 N]TROBENZENE 14 BASE/NEUTRAL 27 382 ~ ~ . 0 0 90500 ~81.6 2~02.0
V-I06

TABLE V.46
SUMMARY STATISTICS FOR INFLUENT CONCENTRATIONS FOR
ALL OCPSF PLANTS
CHEMICAL CHEMICAL THRESHOLD # OF # OF # OF MINIMUM MAXIMUM MEAN MEDIAN
NUMBER NAME VALUE FRACTION NONDETECTS DETECTS PLANTS VALUE VALUE VALUE VALUE
57 2-NITROPHENOL 20 ACIDS 24 31 5 26.000 1625 308.1 155.00 58 4-NITROPHENOL 50 ACIDS 32 16 4 83.000 5990 856.1 455.00 59 2,4-DINITROPHENOL 50 ACIDS 35 18 5 67.000 6748 1881.5 1662.50 64 PENTACHLOROPHENOL 50 ACIDS 9 31 4 53.500 490 205.3 137.00 65 PHENOL 10 ACIDS 35 205 32 13.000 976672 58641.1 640.00 66 BIS-(2-ETHYLHEXYL) PHTHALATE 10 BASE/NEUTRAL 0 40 2 11.000 16830 1591.8 168.50 68 DI-N-BUTYL PHTHALATE 10 BASE/NEUTRAL 0 40 2 19.000 5930 660.2 208.25 69 DI-N-OCTYL PHTHALATE 10 BASE/NEUTRAL 5 4 2 10.000 64 28.3 13.50 70 DIETHYL PHTHALATE 10 BASE/NEUTRAL 5 40 4 10.000 15000 1109.4 550.00 71 DIMETHYL PHTHALATE 10 BASE/NEUTRAL 13 21 3 10.000 625 204.9 166.92 72 BENZO(A)ANTHRACENE 10 BASE/NEUTRAL 6 20 5 12.030 2400 447.0 275.50 73 BENZO(AH)PYRENE 10 BASE/NEUTRAL 7 15 2 11.462 426 149.3 132.50 74 BENZO-B-FLUORANTHENE 10 BASE/NEUTRAL 6 12 2 12.000 374 187.2 208.25 75 BENZO(K)FLUORANTHENE 10 BASE/NEUTRAL 7 11 2 12.000 352 170.9 157.00 76 CHRYSENE 10 BASE/NEUTRAL 15 21 4 17.000 2167 510.1 251.00 77 ACENAPHTHYLENE 10 BASE/NEUTRAL 23 35 9 10.000 18500 1058.7 208.50 78 ANTHRACENE 10 BASE/NEUTRAL 39 33 8 10.000 2900 535.2 430.75 79 BENZO(GHI)PERYLENE 20 BASE/NEUTRAL 4 3 1 22.500 23 22.5 22.50 80 FLUORENE 10 BASE/NEUTRAL 16 36 8 10.000 1873 508.8 153.90 81 PHENANTHRENE 10 BASE/NEUTRAL 15 47 10 10.000 11000 1792.5 683.00 82 DIBENZO(A#H)ANTHRACENE 20 BASE/NEUTRAL 4 3 1 22.500 25 23.3 22.50 83 INDENO(1,2,3-C,D)PYRENE 20 BASE/NEUTRAL 4 3 1 22.500 23 22.5 22.50 84 PYRENE 10 BASE/NEUTRAL 16 33 7 10.000 5500 735.7 590.00 85 PERCNLOROETHYLENE 10 VOLATILES 29 35 6 11.000 31500 2558.7 405.00
86 TOLUENE 10 VOLATILES 26 201 31 13.000 160000 8108.1 3720.00 87 TRICHLOROETNYLENE 10 VOLATILES 39 31 9 10.000 484 68.6 24.00
CHLOROETHYLENE 50 VOLATILES 0 21 3 233.500 17950 3217.6 2316.00
NUMBER OF DATASETS=50, NUMBER OF PLANTS=43
V-107

TABLE V-47
SU~RY STATISTICS FOR INFLUENT CONCENTRATIONS FOR
ORGANICS-ONLY OCPSF PLANTS
CHEMICAL CHEMICAL THRESHOLD # OF # OF # OF MINIMUM MAXIMUM MEAN MEDIAN
NUMBER NAME VALUE FRACTION NONDETECTS DETECTS PLANTS VALUE VALUE VALUE VALUE
1 ACENAPHTHENE 10 BA~E/NEUTRAL 21 24 4 38.5 ?DO0 992 ?42.3
4 BENZENE 10 VOLATILES 1 . 30 5 157.0 380000 36466 737.9
6 CARBON TETRACHLORIDE 10 VOLATILES 2b 1 I 25.0 25 25 25.e
? CHLOROBENZENE 10 VOLATILES 18 5 2 10.0 17'72 598 326.5
8 lo2,4-TRICHLOROBENZENE 10 BASE/NEUTRAL 17 3 1 23.0 124 65 4?.3
10 I°2-DICHLOROETNANE 10 VOLATILES 0 3 1 445.0 1967 994 5?0.0
11 I°I,I-TRICHLOROETHANE 10 VOLATILES 1 2 1 94.5 215 155 154.8
21 2,4,6-TRICHLOROPHENOL 10 ACIDS 4 3 1 17.5 18 18 17.5
23 CHLOROFORM 10 VOLATILES 0 3 1 217.0 8 7 0 445 248.0
24 2-CHLOROPHENOL 10 ACIDS 1 2 1 13890.0 15540 14715 14715.0
25 1,2-DICHLOROBENZENE 10 BASE/NEUTRAL 16 4 1 1350.0 4387 2434 1998.8
27 1,4-DICHLOROBENZENE 10 BASE/NEUTRAL 16 4 1 150.0 721 337 238.3
31 2o4-DICHLOROPHENOL 10 ACIDS 1 2 1 674.0 842 758 758.0
34 2,4.DIMETHyLPHENOL 10 ACIDS 1 24 3 385.7 73537 18872 18898.5
38 ETHYLBENZENE 10 VOLATILES 16 18 3 76.0 80000 15573 1955.0
39 FLUORANTHENE 10 BASE/NEUTRAL 1 24 3 22.4 7175 1594 1475.8
47 BRONOFORM 10 VOLATILES 18 2 1 24.0 71 48 47.5
55 NAPHTHALENE 10 BASE/NEUTRAL 18 24 3 28.0 37145 12897 15612.5
56 MITROBENZENE 14 BASE/NEUTRAL 19 1 1 140.0 140 140 140.0
57 2-NITROPHENOL 20 ACIDS 16 4 1 389.0 1352 908 946.2
58 4-NITROPHENOL 50 ACIDS 17 3 I 370.7 1251 720 538.0
59 2,4-DINITROPHENOL 50 ACIDS 16 4 1 2254.0 6748 4113 3724.0
65 PHENOL 10 ACIDS 19 32 6 259.0 976672 345381 15548.5
72 BENZO(A)ANTHRACENE 10 BASE/NEUTRAL 3 15 2 191.0 2400 584 331.0
73 BENZO(AH)PYRENE 10 BASE/NEUTRAL ? 15 2 11.5 426 149 132.5
76 BENZO-B-FLUORANTHENE 10 BASE/NEUTRAL 5 10 1 90.0 3?4 222 231.0
75 BENZO(K)FLUORANTHENE 10 BASE/NEUTRAL 5 10 1 75.5 352 187 165.0
76 CHRYSENE 10 BASE/NEUTRAL 4 14 2 198.0 1500 4?7 287.5
7'7 ACENAPNTHYLENE 10 BASE/NEUTRAL 3 25 4 12.0 18500 1437 275.0
78 ANTHRACENE 10 BASE/NEUTRAL 20 18 3 20.0 L~00 891 756.5
7'9 BENZO(GHI)PERYLENE 20 BASE/NEUTRAL 4 3 1 22.5 23 23 22.5
80 FLUORENE 10 BASE/NEUTRAL 4 21 3 20.8 1873 788 804.0
81 PHENANTHRENE 10 BASE/NEUTRAL 3 18 3 37.8 11000 3965 34?9.5
82 DIBENZO(A,H)ANTHRACENE 20 BASE/NEUTRAL 4 3 1 22.5 25 23 22.5
83 INDENO(1,2,3-C,D)PYRENE 20 BASE/NEUTRAL 4 3 1 22.5 23 23 22.5
B4 PYRENE 10 BASE/NEUTRAL 1 24 3 23.4 5500 1007 897.8
86 TOLUENE 10 VOLATILES 17 34 6 95.0 60000 10834 745.0
87 TRICHLOROETHYLENE 10 VOLATILES 2 4 2 13.0 224 134 149.0
NUMBER OF DATASETS= 7, NUMBER OF PLANTS= 7
V-108

TABLE V-48
SUMMARY STATISTICS FOR INFLUENT CONCENTRATIONS FOR
PLASTICS-ONLY OCPSF PLANTS
CHEMICAL CHEMICAL THRESHOLD # OF # OF # OF MINIML94 HAXIMUN MEAN MEDIAN
NUMBER NAME VALUE FRACTION NONDETECTS DETECTS PLANTS VALUE VALUE VALUE VALUE
2 ACROLEIN 50 VOLATILES 0 3 1 2500.00 34500 13633 3900
" 3 ACRYLONITRILE 50 VOLATILES 0 21 3 1200.00 414785 154682 163600
4 BENZENE 10 VOLATILES 1 5 2 14.00 190 81 62
10 1,2-DICHLOROETHANE 10 VOLATILES 0 1 1 1534.00 1534 1534 1534
13 1,1-DICHLOROETHANE 10 VOLATILES 0 1 1 140.10 140 140 140
14 I.le2-TRICHLOROETHANE 10 VOLATILE$ 0 1 1 21.00 21 21 21
15 1,1,2,2-TETRACNLOROETHANE 10 VOLATILES 0 I I 188.20 188 168 168
23 CHLOROFORM 10 VOLATILE$ 0 3 1 13.75 23 17 14
VINYLIDENE CHLORIDE 10 VOLATILEB 0 1 I 52.50 53 53 53
32 PROPYLENE CHLORIDE 10 VOLATILES 0 1 1 2258.00 2258 2258 2258
33 1.3-OICHLOROPROPENE 10 VOLATILE$ 0 3 1 175.00 1095 550 380
34 2.4-D~NETHYLPHENOL 10 ACIDS 0 1 1 13.50 14 14 14
38 ETNYLBENZENE 10 VOLATILES 1 25 5 22.00 3565 435 112
44 DICHLORONETHANE 10 VOLATILES 2 1 1 10.00 23 17 17
55 NAPHTHALENE 10 BASE/NEUTRAL 0 9 3 25.00 3600 463 40
65 PHENOL 10 ACIDS 0 24 4 62.00 1900 498 472 86 TOLUENE 10 VOLATILES 0 12 4 60.00 1900 525 230
87 TRICHLOROETNYLENE 10 VOLATILES 0 1 1 483.70 484 484 484
68 CNLOROETHYLENE 50 VOLATILES 0 3 1 233.50 2396 993 350
NUMBER OF DATASETSu 7, NUMBER OF PLANTS: 7
V-I09

TABLE V-49
SUMMARY STATISTICS FOR INFLUENT CONCENTRATIONS FOR
ORGANICS & PLASTICS OCPSF PLANTS
CHEMICAL CHEMICAL THRESHOLD # OF # OF # OF MINIMUM MAXIMUM MEAN MEDIAN
NUMBER NAME VALUE FRACTION NONDETECTS DETECTS PLANTS VALUE VALUE VALUE VALUE
1 ACENAPHTHENE 10 BASE/NEUTRAL 22 6 4 10.000 57 24.5 23.0
3 ACRYLONITRILE 50 VOLATILES 2 45 4 290.000 890000 66813.2 23000.0
4 BENZENE 10 VOLATILES 22 143 16 11.000 713740 22706.0 990.0
6 CARBON TETRACHLORIDE 10 VOLATILES 4 29 6 10.000 44000 2275.7 666.3
7 CHLOROBENZENE 10 VOLATILES 22 46 6 11.500 49775 3345.7 426.0
8 1,2,4-TRICHLOROBENZENE 10 BASE/NEUTRAL 6 352 3 20.000 2955 575.9 305.5
9 HEXACHLOROBENZENE 10 BASE/NEUTRAL O 18 2 13.000 920 242.9 121.5
10 1,2-DICHLOROETHANE 10 VOLATILES 39 102 11 10.000 1272220 21491.4 374.5
11 IºI,I-TRICHLOROETHANE 10 VOLATILES 31 15 5 10.000 7234 042.9 23.5
1Z HEXACHLOROETHANE 10 BASE/NEUTRAL 0 18 Z 38.000 3400 516.7 156.5
13 1,I-DICHLOROETHANE 10 VOLATILES 20 4 I 11.000 640 169.4 13.5
14 1,1,2-TRICNLOROETHANE 10 VOLATILES 17 13 3 10.500 1201 320.8 23.5
15 1,1,2,2-TETRACHLOROETHANE 10 VOLATILES 38 4 3 10.000 192 95.7 120.0
16 CHLOROETHANE 50 VOLATILES 30 16 4 60.000 2840 522.7 104.0
18 BIS (2-CHLOROETHYL)ETNER 10 BASE/NEUTRAL 6 13 2 25.000 1700 413.5 54.0
21 2,4,6-TRICHLOROPHENOL 10 ACIDS ? 76 6 10.000 16780 443.5 59.5
23 CHLOROFORM |0 VOLATILES 66 90 15 10.000 5250 669.0 216.0
24 2-CHLC)ROPHENOL 10 ACIDS 30 32 4 10.333 247370 13111.7 96.8
25 1.2-DICHLOROBENZENE 10 BASE/NEUTRAL 15 395 11 10.500 23326 1025.5 824.0
26 lo3-DICHLOROBENZENE 10 BASE/NEUTRAL 3 20 2 11.500 4616 417.3 25.5
27 1,4-DICHLOROSENZENE 10 BASE/NEUTRAL 20 18 3 10.000 220 61.5 32.0
28 3,3-DICHLOROBENZIDINE 50 BASE/NEUTRAL 0 10 1 371.000 38351 6147.5 1700.0
29 VINYLIDENE CHLORIDE 10 VOLATILES 49 39 7 10.500 1300 355.8 270.0
30 1,2-TRANSDICHLOROETHYLENE 10 VOLATILES 26 9 4 12.833 515 255.9 236.3
31 2°4-DICHLOROPHENOL 10 ACIDS 3 25 3 60.000 72912 7665.2 655.0
32 PROPYLENE CHLORIDE 10 VOLATILES 4 57 5 28.500 11000 1390.8 480.0
33 1,3-DICNLOROPROPENE I10 VOLATILES 14 25 3 10.000 4850 435.9 173.0
34 2,4-DIMETHYLPNENOL ~0 ACIDS 2 17 3 10.000 8787 3342.0 3415.0
35 2,4-DINITROTOLUENE 10 BASE/NEUTRAL 0 22 3 715.000 17500 3301.3 1659.0
36 2o6-DINITROTOLUENE 10 BASE/NEUTRAL 8 24 4 29.000 4675 775.0 3?9.5
38 ETHYLBENZENE 10 VOLATILES 14 100 12 15.500 3850 495.2 223.5
39 FLUORANTHENE 10 BASE/NEUTRAL I 7 3 14.870 289 69.2 30.0
42 BIS'(2"CHLOROISOPROPYL) ETHER 10 BASE/NEUTRAL 3 18 2 193.000 19486 2267.9 787.0
44 DICHLOROMETHANE 10 VOLATILES 34 108 12 10.000 19000 2514.3 1110.5
45 CHLOROMETHANE 50 VOLATILES 7 8 I 51.000 129 83.4 90.0
52 HEXACHLOROBUTADIENE 10 BASE/NEUTRAL 0 18 2 83.000 9100 2006.3 1111.0
54 ISOPHORONE 16 BASE/NEUTRAL I I I 253.000 253 253.0 253.0
55 NAPHTHALENE 10 BASE/NEUTRAL 7 43 8 12.000 4018 797.9 399.5
56 NITROBENZENE 14 BASE/NEUTRAL 8 381 5 86.000 90500 3891.4 2802.0
57 2-NITROPHENOL 20 ACIDS 8 27 4 26.000 1625 219.2 147.0
58 4-NITROPHENOL 50 ACIDS 15 13 3 83.000 5990 887.6 450.0
V-llO

TABLE V-49
SUHMARY STATISTICS FOR INFLUENT CONCENTRATIONS FOR
ORGANICS & PLASTICS OCPSF PLANTS
CHEMICAL CHEMICAL THRESHOLD # OF # OF # OF MINIMUM HAXIMUM MEAN MEDIAN
NUMBER NAME VALUE FRACTION NONDETECTSDETECTS PLANTS VALUE VALUE VALUE VALUE
59 2,4-DINITROPHENOL 50 ACIDS 19 14 4 67.00 3900 1244.00 817.50
64 PENTACHLOROPHENOL 50 ACIDS 9 31 4 53.50 490 205.34 137.00
65 PHENOL 10 ACIDS 16 149 22 13.00 245000 6424.69 555.00
66 BIS-(2-ETHYLHEXYL) PHTHALATE 10 BASE/NEUTRAL 0 40 2 11.00 16830 1591.76 168.50
68 Di-N-BUTYL PHTHALATE 10 BASE/NEUTRAL 0 40 2 19.00 5930 660.18 208.25
69 DI-N-OCTYL PHTHALATE 10 BASE/NEUTRAL 5 4 2 10.00 64 28.25 13.50
70 DIETHYL PHTHALATE 10 BASE/NEUTRAL 5 40 4 10.00 15000 1109.43 550.00
71 DIHETHYL PHTHALATE 10 BASEfNEUTRAL 13 21 3 10.00 625 204.94 166.92
72 BENZO(A)ANTHRACENE 10 BASEfNEUTRAL 3 5 3 12.03 89 37.36 26.25 74 BENZO-B-FLUORANTHENE 10 BASE fNEUTRAL 1 2 1 12.00 16 14.00 14.00
75 BENZO(K)FLUORANTHENE 10 BASE fNEUTRAL 2 1 1 12.00 12 12.00 12.00
76 CHRYSENE 10 BASE/NEUTRAL 11 7 2 17.00 2167 575.89 73.00
77 ACENAPHTHYLENE 10 BASE fNEUTRAL 20 10 5 10.00 841 lC;~.74 22.00 78 ANTHRACENE 10 BASE fNEUTRAL 19 15 5 10.00 1124 134.49 51,97 80 FLUORENE 10 BASE/NEUTRAL 12 15 5 10.00 946 142.35 50.00
81 PHENANTHRENE 10 BASE/NEUTRAL 12 29 7 10.00 4990 488.9 i 127,00
84 PYRENE 10 BASE/NEUTRAL 15 9 4 10.00 539" 85.68 22,00
85 PERCHLOROETHYLENE 10 VOLATILES 29 35 6 11.00 31500 2558.70 405,00
86 TOLUENE 10 VOLATILES 9 155 21 13.00 160000 8097.24 4120.83
87 TRICHLOROETHYLENE 10 VOLATILES 37 26 6 10.00 182 44.50 21.68
88 CHLOROETHYLENE 50 VOLATILES 0 18 2 627.00 17950 3588.42 2452.00
NUMBER OF DATASETS=36. NUHBER OF PLANTS=29
V-ll!

In each table, the number of nondetects is the number of daily samples
that were taken at or below the threshold concentrations and the number of
detects are the number of daily samples that exceeded the threshold value. In
the calculation of the statistical values, all nondetect samples were assigned
the threshold value (the analytical method nominal detection limit). Specific
pollutant data for each plant were retained only if they were detected in at
least one sample.
2. Toxic Pollutant Metals
There are process sources of certain metal priority pollutants I in the
process wastewaters of the OCPSF industry. These metals (including cyanide)
and their affiliated process sources may be anticipated from published generic
process chemistry that is typically used to manufacture each of the industry's
products. Analytical data in the Master Process File from verification
sampling, in which the process effluents of 176 of the major product/processes
of the industry were characterized for both metal and organic priority
pollutants, offered confirmation of some of the metals (and cyanide) that were
anticipated. Confirmation was also found in the industry's response to the
1983 '308' Questionnaire, in which plants were asked to affiliate priority
pollutants with each of the product/processes in operation.
Concentrations of metals in wastewater from individual in-plant processes
are typically low (less than 1.0 ppm). Few of the treatment systems in the
OCPSF industry have precipitation technology being applied to a process's
wastewater prior to its joining the combined flow. Many OCPSF wastewater
treatment systems do not have a primary clarifier. This implies the absence
of solids in the combined flow that results from metals fortuitously precipi-
tated by contact with various precipitants, and a concentration of metals in
the combined flow that is typically too low to utilize precipitation technol-
ogy. One obvious exception to this generalization is plants manufacturing
rayon that are controlling zinc losses by chemical precipitation, using lime
or caustic.
iFor the purposes of this discussion, total cyanide is included in the metal priority pollutants (or toxic pollutants) term.
V-II2

I n t he 1983 308 Q u e s t i o n n a i r e , each p l a n t was a sked to a f f i l i a t e p r i o r i t y
p o l l u t a n t s w i t h t he v a r i o u s p r o d u c t / p r o c e s s e s in o p e r a t i o n a t t he p l a n t in
1980. They were a l s o a sked to i n d i c a t e t he p r i o r i t y p o l l u t a n t s ' r o l e w i t h i n
t he p r o d u c t p r o c e s s , i . e . , c a t a l y s t , s o l v e n t , raw m a t e r i a l , o r c o n t a m i n a n t i n
t h e r a w m a t e r i a l , b y - p r o d u c t , o r was te p r o d u c t . Th i s f i l e , c o n t a i n i n g
t he p r i o r i t y p o l l u t a n t m e t a l - p r o d u c t / p r o c e s s a f f i l i a t i o n s , was r e t r i e v e d from
the 308 d a t a base and a l i s t i n g was p r e p a r e d f o r each m e t a l . Ano the r f i l e ,
c o n t a i n i n g p r o d u c t / p r o c e s s - p l a n t a f f i l i a t i o n s , was a l s o r e t r i e v e d and l i s t e d
for reference.
Of the five roles, the role of solvent was dismissed for metals. In
addition in contrastto organics chemicals, metals cannot be generated by the
process chemistry, only lost from the process. For this reason, by-product
sources were also ignored. The plants frequently affiliated a metal with the
waste products of the product/process, but affiliation with wasteproducts was
considered to have merit only when the metal was also iisted as a catalyst or
raw material for the product/process. Thus, editing focused mainly on
catalyst and raw material roles of' the metal in validating the product/
process.
The e d i t i n g c r i t e r i a f o r v a l i d a t i o n of p r o d u c t / p r o c e s s e s and p l a n t s were
as follows:
@ I n v a l i d a t e a p r o d u c t / p r o c e s s a f f i l i a t e d w i t h a m e t a l l i s t e d as a b y - p r o d u c t o r was t e p r o d u c t , u n l e s s i t was a l s o l i s t e d as a c a t a l y s t o r raw m a t e r i a l . Exc lude s o l v e n t a f f i l i a t i o n s .
I n v a l i d a t e a p r o d u c t / p r o c e s s a f f i l i a t e d w i t h a m e t a l l i s t e d as a c a t a l y s t o r raw m a t e r i a l , i f a f f i l i a t i o n i s i n c o n s i s t a n t w i t h t he c h e m i s t r y o f t he g e n e r i c p r o c e s s o r i s an o t h e r w i s e anomalous a f f i l i -a t i o n . Add a p r o d u c t / p r o c e s s when a m e t a l i s g e n e r a l l y a s s o c i a t e d w i t h t h e c h e m i s t r y o f t he p r o c e s s ( o r can be c o n f i r m e d by p l a n t con-t a c t ) , bu t was no t l i s t e d by p l a n t s t h a t o p e r a t e the p r o d u c t / p r o c e s s .
Invalidate a product/process affiliated with a metal listed as part of the catalyst system, if the metal is a minor constituent (less than 5Z by weight) of the catalyst, process reactor design severely limits catalyst losses,-and/or the catalyst is exposed only to non-aqueous process streams.
V-l13

Invalidate a product/process that is a valid source of a metal, if the metal is unlikely to emerge in the wastewater from the process at a treatable level (less than I mg/1), before mixing with the wastewater from other processes in operation at the plant.
Invalidate a product/process, if less than half of the plants that operate the product/process listed the metal as being affiliated with the product/process.
Invalidate a plant affiliated with a valid product/process, if the plant no longer operates the product/process.
A summary of the results of this validation analysis is presented in
Table V-50. A listing of the product/processes that have been determined to
be process sources of metals and cyanide is presented in Section X of this
document. Based on these results, the Agency determined that a total of eight
toxic pollutant metals (including cyanide) had a substantial number of process
sources in the 0CPSF industry. Also, as discussed in the following section,
the remaining seven toxic pollutants (including arsenic) were eliminated from
further consideration for regulation under this rulemaking.
V-l14

TABLE V-50. SUMMARY OF PRIORITY POLLUTANT METAL-PRODUCT/PROCESS-PLANT VALIDATION
No. of No. of Priority No. of pp1 Plants No. of pp1 Plants Pollutant Before Before After After Metals Validation Validation Validation Validation
114 Antimony (Sb) 43 126 15 29
115 Arsenic (As) 45 113 25 18
117 Beryllium (Be) 8 19
118 Cadmium (Cd) 34 85
119 Chromium (Cr) 116 207 24 41
120 Copper (Cu) 131 240 62 71
121 Cyanide (CN) 47 73 41 62
122 Lead (Pb) 46 149 13 37
123 Mercury (Hg) 31 93 1 1
124 Nickel (Ni) 124 163 63 64
125 Selenium (Se) 20 46
126 Silver (Ag) 19 68
127 Thallium (Th) 9 20
128 Zinc (Zn) 152 298 46 81
1product/processes
V-l15

SECTION VI
SELECTION OF POLLUTANT PARAMETERS
A. INTRODUCTION
Specific toxic, conventional, and nonconventional pollutant parameters
were determined to be potentially significant in the Organic Chemicals, Plas-
tics, and Synthetic Fibers (OCPSF) Industry and were selected for evaluation
based on: 1) an industry characterization, 2) data collected from field
sampling efforts, 3) historical data collected from the literature, and 4)
data provided by industry either by questionnaire (Section 308 Questionnaire
Survey) or through public comment on the proposed regulations or subsequent
Federal Register Notices of Availability of New Information.
The U.S. Environmental Protect ion Agency (EPA) has considered for
regula t ion the following conventional po l lu tan t parameters for the f i n a l BPT
e f f luen t l i m i t a t i o n s presented in th is documentz f ive-day biochemical oxygen
demand (BODs), t o t a l suspended sol ids (TSS), pH, and o i l and grease (ObG). Nonconventional po l lu tan t parameters considered by the Agency for the f i n a l
BPT, BAT, NSPS, PSES, and PSNS effluent limitations guidelines and standards
include chemical oxygen demand (COD) and total organic carbon (TOC).
In developing its BAT, NSPS, PSES, and PSNS effluent limitations guide-
lines and standards for toxic pollutants, the Agency specifically addressed a
list of 126 toxic pollutants, which are presented in Appendix VI-A. As the
list of 65 toxic pollutants and classes of pollutants includes potentially
thousands of specific pollutants, EPA limited its data collection efforts to
the 126 specific compounds referred to as "priority" pollutants. The criteria
that were used in the late 1970's to classify these pollutants as "priority"
pollutants included the frequency of their occurrence in water, their chemical
stability and structure, the amount of the chemical produced, and the avail-
ability of chemical standards and analytical methods for measurement.
Vl-i

This section presents descriptions of each of the conventional,
nonconventional, and toxic pollutant parameters considered by the Agency and
discusses the selection criteria used to select pollutants for control under
BPT, BAT, NSPS, PSES, and PSNS.
B. CONVENTIONAL POLLUTANT PARAMETERS
i. Five-Day Biochemical Oxygen Demand (BODs)
The Five-Day Biochemical Oxygen Demand (BODs) test traditionally has been
used to determine the pollutant strength of domestic and industrial waste-
waters. It is a measure of the oxygen required by biological organisms to
assimilate the biodegradable portion of a waste under aerobic conditions
(6-I). Substances that may contribute to the BOD s include carbonaceous
materials usable as a food source by aerobic organisms; oxidizable nitrogen
derived from organic nitrogen compounds, ammonia and nitrates that are
oxidized by specific bacteria; and chemically oxidizable materials such as
ferrous compounds, sulfides, sulfite, and similiar reduced-state inorganics
that will react with dissolved oxygen or that are metabilized by bacteria.
The BOD 5 of a wastewater is a measure of the dissolved oxygen depletion
that might be caused by the discharge of that wastewater to a body of water.
This depletion reduces the oxygen available to fish, plant life, and other
aquatic species. Total exhaustion of the dissolved oxygen in water results in
anaerobic conditions, and the subsequent dominance of anaerobic species that
can produce undesirable gases such as hydrogen sulfide and methane. The
reduction of dissolved oxygen can be detrimental to fish populations, fish
growth rates, and organisms used as fish food. A total lack of oxygen can
result in the death of all aerobic aquatic inhabitants in the affected area.
The BOD s test is widely used to estimate the oxygen demand of domestic:
and industrial wastes and to evaluate the performance of waste treatment
facilities by measuring the amount of oxygen depletion in a standard size
flask after 5 days incubation. The test is widely used for measuring poten-
tial pollution, since no other test methods have been developed that are as
suitable or as widely accepted for evaluating the deoxygenation effect of a
waste on a receiving water body.
VI-2

The BOD s test measures the weight of dissolved oxygen utilized by
microorganisms as they oxidize or transform the gross mixture of chemical
compounds in the wastewater. The degree of biochemical reaction involved in
the oxidation of carbon compounds is related to the period of incubation and
the rate of biodegradation of the compound(s) within the mixture. When
municipal sewage is tested, BOD s normally measures only 60 to 80 percent of
the total carbonaceous biochemical oxygen demand of the sample. When testing
OCPSF wastewaters, however, the fraction of total carbonaceous oxygen demand
measured can range from less than 10 percent to more than 80 percent. The
actual percentage for a given waste stream will depend on the degradation
characteristics of the organic components present, the degree to which the
seed is acclimated to these components, and the degree to which toxic or
inhibitory components are present in thewaste (6-1).
2. Total Suspended Solids (TSS)
Suspended solids can include both organic and inorganic materials. The
inorganic materials include sand, silt, and clay and may include insoluble
toxic metal compounds. The organic fraction includes such materials as
grease, oils, animal and vegetable waste products, fibers, microorganisms, and
many other dispersed insoluble organic compounds (6-2). These solids may
settle rapidly and form bottom deposits that are often a mixture of both
organic and inorganic solids.
Solids may be suspended in water for a time and then settle to the bottom
of a stream or lake. They may be inert, slowly biodegradable materials, or
they may be rapidly decomposable substances. While in suspension, they
increase the turbidity of the water, reduce light penetration, and impair the
photosynthetic activity of aquatic plants. After settling to the stream or
lake bed, the solids can form sludge banks, which, if largely organic, create
localized anaerobic and undesirable benthic conditions. Aside from any toxic
effect attributable to substances leached out by water, suspended solids may
kill fish and shell-fish by causing abrasive injuries, clogging gills and
respiratory passages, screening light, and by promoting and maintaining
noxious conditions through oxygen depletion. Suspended solids may also reduce
the recreational value of a waterway and can cause problems in water used for
VI-3 _ _ _ _ J

domestic purposes. Suspended solids in intake water may interfere with many
industrial processes, and cause foaming in boilers, or encrustations on
exposed equipment, especially at elevated temperatures.
3. pH
The term pH describes the hydrogen ion-hydroxyl ion equilibria in water.
Technically, pH is a measure of the hydrogen ion concentration or activity
present in a given solution. A pH number is the negative logarithm of the
hydrogen ion concentration. A pH of 7.0 indicates neutrality or a balance
between free hydrogen and free hydroxyl ions. A pH above 7.0 indicates that a
solution is alkaline; a pH below 7.0 indicates that a solution is acidic.
The pH of discharge water is of concern because of its potential impact
on the receiving body of water. Vastewater effluent, if not neutralized
before release, may alter the pH of the receiving water. The critical range
suitable for the existence of most biological life is quite narrow, lying
between pH 6 and pH 9.
Extremes of pH or rapid pH changes can harm or kill aquatic life. Even
moderate changes from acceptable pH limits can harm some species. A change in
the pH of water may increase or decrease the relative toxicity of many mate-
rials to aquatic life. A drop of even 1.5 units, for example, can increase
the toxicity of metalocyanide complexes a thousandfold. The bactericidal
effect of chlorine in most cases lessens as the pH increases.
Waters with a pH below 6.0 corrode waterworks structures, distribution
lines, and household plumbing fixtures. This corrosion can add to drinking
water constituents such as iron, copper, zinc, cadmium, and lead. Low pH
waters not only tend to dissolve metals from structures and fixtures, but also
tend to redissolve or leach metals from sludges and bottom sediments.
Normally, biological treatment systems are maintained at a pH between 6
and 9; however, once acclimated to a narrow pH range, sudden deviations (even
in the 6 to 9 range) can cause upsets in the treatment system with a resultant
decrease in treatment efficiency.
Vl-4

4. Oil and Grease (O&G)
Oil and grease analyses do not actually measure the quantity of a
specific substance, but measure groups of substances whose common character-
istic is their solubility in freon. Substances measured may include hydro-
carbons, fatty acids, soaps, fats, oils, wax, and other materials extracted by
the solvent from an acidified sample and not volatilized by the conditions of
the test. As a result, the term "oil and grease" is more properly defined by
the conditions of the analysis rather than by a specific compound or group of
compounds. Additionally, the material identified in the O&G determination is
not necessarily free floating. It may be actually in solution but still
extractable from water by the solvent (6-3).
Oils and greases of hydrocarbon derivatives, even in small quantities,
cause troublesome taste and odor problems. Scum lines from these agents are
produced on water treatment basin walls and other containers. Fish and water
fowl are adversely affected by oils in their habitat. Oil emulsions may cause
the suffocation of fish by adhering to their gills and may taint the flesh of
fish when microorganisms exposed to waste oil are eaten. Deposition of oil
in the bottom sediments of natural waters can serve to inhibit normal benthic
growth. Oil and grease can also exhibit an oxygen demand.
Levels ofoll and grease that are toxic to aquatic organisms vary greatly
depending on the oil and grease components and the susceptibility of the
species exposed to them. Crude oil in concentrations as low as 0.3 mg/1 can
be extremely toxic to freshwater fish. Oil slicks prevent the full aesthetic
enjoyment of water. The presence of oil in water can also increase the
toxicity of other substances being discharged into the receiving bodies of
water. Municipalities frequently limit the quantity of oil and grease that
can be discharged to their wastewater treatment systems.
There are several approved modifications of the analysis for oil and
grease. Each is designed to increase the accuracy or enhance the selectivity
of the analysis. Depending on the procedure and detection method employed,
the accuracy of the test can vary from 88 percent for the Soxhlet Extraction
Method to 99 percent for the Partition-Infrared Method.
VI-5

C. NONCONVENTIONAL POLLUTANT PARAMETERS
I. Chemical Oxygen Demand (COD)
COD is a chemical oxidation test devised as an alternate method of
estimating the oxygen demand of a wastewater. Since the method relies on the
oxidation-reduction system of a chemical reaction rather than a biological
reaction, it is more precise, accurate, and rapid than the BOD 5 test. The COD
test is sometimes used to estimate the total oxygen (ultimate rather than the
five-day BODs) required to oxidize the compounds in a wastewater. In the COD
test, strong chemical oxidizing agents under acid conditions, with the assis-
tance of certain inorganic catalysts, can oxidize most organic compounds,
including many that are not biodegradable. However, it should be noted that
the COD test may not measure the oxygen demand of certain aromatic species
such as benzene, toluene, and pyridine (6-4).
The COD test measures organic components that may exert a biological
oxygen demand and may affect public health. It is a useful analytical tool
for pollution control activities. Most pollutants measured by the BOD s test
will be measured by the COD test. In addition, pollutants resistant to
biochemical oxidation will also be measured as COD.
Compounds resistant to biochemical oxidation are of great concern because
of their slow, continuous oxygen demand on the receiving water and also, in
some cases, because of their potential health effects on aquatic life and
humans. Many of these compounds result from industrial discharges and some of
the compounds have been found to have carcinogenic, mutagenic, and similar
adverse effects. Concern about these compounds has increased as a result of
demonstrations that their long life in receiving water (the result of a low
biochemical oxidation rate) allows them to contaminate downstream water
intakes. The commonly used systems of water purification are not effective in
removing these types of materials and disinfection with chlorine may convert
them into even more objectionable materials.
2. Total Organic Carbon (TOC)
TOC measures all oxidizable organic material in a waste stream, including
the organic chemicals not oxidized (and therefore not detected) in BOD s and
VI-6

COD tests. TOC analysis is a rapid test for estimating the total organic
carbon in a waste stream.
When testing for TOC, the organic carbon in a sample is converted to
carbon dioxide (C02) by catalytic combustion or by wet chemical oxidation.
The CO 2 formed can be measured directly by an infrared detector or it can be
converted to methane (CH4) and measured by a flame ionization detector. The
amount of CO 2 or CH 4 is directly proportional to the concentration of carbo-
naceous material in the sample. TOC tests are usually performed on commer-
cially available automatic TOC analyzers. Inorganic carbons, including
carbonates and bicarbonates, interfere with these analyses and must be removed
during sample preparation (6-5).
D. TOXIC POLLUTANT PARAMETERS
Paragraph 8 of the Settlement Agreement contains provisions authorizing
EPA to exclude toxic pollutants and industry subcategories from regulation
under certain circumstances. Paragraph 8(a)(iii) authorizes the Administrator
to exclude from regulation: toxic pollutants not detectable by Section 304(h)
analytical methods or other state-of-the-art methods; toxic pollutants present
in amounts too small to be effectively reduced by available technologies;
toxic pollutants present only in trace amounts and neither causing nor likely
to cause toxic effects; toxic pollutants detected in the effluent from only a
small number of sources within a subcategory and uniquely related to only
those sources; toxic pollutants that will be effectively controlled by the
technologies upon which are based other effluent limitations and standards; or
toxic pollutants for which more stringent protection is already provided under
Section 307(a) of the Act.
Pursuant to the Paragraph 8(a)(iii) criteria, the Agency decided early in
the rulemaking to eliminate from further consideration 26 toxic pollutants,
consisting of 18 pesticides, seven polychlorinated biphenyls (PCBs), and
asbestos. These toxic pollutants are listed in Table VI-I, and are excluded
because they are not produced as products or co-products and are unlikely to
appear as raw material contaminants in OCPSF product/processes. At facilities
manufacturing OCPSF product/processes, but where pesticide pollutants are also
VI-7

TABLE VI-I. TWENTY-SIX TOXIC POLLUTANTS.
PROPOSED FOR EXCLUSION
Aldrin
Dieldrin
Chlordane
4,4'-DDT
4,4'-DDE
4,4'-DDD
alpha-Endosulfan
beta-Endosulfan
Endosulfansulfate
Endrln
Endrln aldehyde
Heptachlor
Heptachlor epoxlde
alpha-BHC
beta-BHC
gamma-BHC
delta-BHC
Toxaphene
PCB-1242 (Arochlor 1242)
PCB-1254 (Arochlor 1254)
PCB-1221 (Arochlor 1221)
PCB-1232 (Arochlor 1232)
PCB-1248 (Arochlor 1248)
PCB-1260 (Arochlor 1260)
PCB-I016 (Arochlor 1016)
Asbestos
VI-8

synthesized by product/processes in SIC Codes corresponding to the pesticides
category, pesticide discharges will be regulated under effluent limitations
for the separate pesticide category. On occasion, pesticides may appear in
discharges that contain OCPSF effluents only but can be attributed to applica-
tion of pesticide formulations around the plant grounds. PCBs are no longer
manufactured in the United States; however, PCBs may occasionally appear in
OCPSF effluents and are probably the result of leaking transformers containing
PCB-contaminated oil which finds its way into the wastewater through storm-
water runoff or plant floor drains. Asbestos is neither manufactured nor
utilized as a raw material or catalyst by the OCPSF industry. In any event,
none of the 18 pesticides, 7 PCBs, and asbestos are currently related to OCPSF
production.
With the exception of dioxin, all remaining priority pollutants were
considered for regulation! however, as described later in this section, some
were ultimately excluded from regulation under Paragraph 8. Regulation of
dioxin (TCDD) has been reserved even though it was not detected at any of the
sample locations. The minimum detection or analytical threshold level of the
2,3,7,8-tetrachlorodibenzo-p-dioxin analytical method used at the time of the
EPA laboratory studies that included dioxin (March 1983 to May 1984/12-plant
study) was significantly higher than the level presently being used by the
Agency. The minimum detection level used for the OCPSF dioxin analyses was
3 x 10 -v grams/llter, which is five orders of magnitude higher than the
current minimum detection level being used by the Agency to study industrial
sources of dioxin in wastewater discharges. Thus, the Agency decided to
reserve dioxin rather than use the higher analytical detection level as a
basis for exclusion from regulation.
E. SELECTION CRITERIA
I. Conventional Pollutants
The Agency has decided to control five-day biochemical oxygen demand
(BOD5), total suspended solids (TSS), and pH under its final BPT effluent
limitations guidelines. While the Agency considered developing limitations
for oil and grease, EPA determined that the effluent levels of oil and grease
observed at BPT treatment systems were achieved through incidental removal by
VI-9

a treatment system primarily designed to remove BOD 5 and TSS. It should be
noted that certain plants install oii and grease treatment technologies to
ensure that subsequent treatment units (e.g., other physical/chemical or bio-
logical treatment) can operate properly. Therefore, based on these reasons,
the Agency decided not to establish BPT effluent limitations for oil and
grease.
2. Nonconventional Pollutants
While the Agency had considered the development of BPT, BAT, NSPS, PSES,
and PSNS effluent limitations: guidelines and standards for specific non-
conventional pollutants, EPA has determined that the regulation of nonconven-
tional pollutants will be deferred. One reason for this deferment is the
enormity of the task of developing analytical methods for many of the noncon-
ventional toxic pollutants. Another reason for not regulating the more famil-
iar nonconventional pollutants such as COD and TOC is that much of the per-
formance data obtained by the Agency is the result of incidental removals by
treatment technologies installed to remove conventional and/or toxic (prior-
ity) pollutants and not designed for the removal of the nonconventional pol-
lutants present, including COD and TOC. The Agency believes that the proper
installation of treatment technologies to meet BPT, BAT, NSPS, PSES, and PSNS
effluent limitations guidelines and standards will result in significant re-
ductions of nonconventional pollutants. For example, nonconventional volatile
pollutants such as xylene that are present in BTX process wastewaters will be
removed by steam strippers installed for removal of benzene and toluene.
3. Toxic Pollutants !
Toxic pollutant parameters are controlled under BAT and NSPS for direct
dischargers and PSES and PSNS for indirect dischargers and the criteria for
selecting toxic pollutants for regulation for each mode of discharge is dif-
ferent. Therefore, discussion of the selection criteria for BAT and NSPS and
PSES and PSNS are presented separately in the following sections.
a. Selection Criteria for BAT and NSPS Toxic Pollutants
As stated previously, dioxin was reserved from regulation at this time.
In addition, Paragraph 8 of the Settlement Agreement contains provisions
VI-IO

authorizing EPA to exclude toxic pollutants and industry subcategorles from
regulation under certain circumstances. Pursuant to these criteria (as stated
previously), the Agency eliminated 18 pesticides, 7 PCBs, and asbestos from
further regulatory consideration. The remaining 99 toxic pollutants were then
evaluated based on the specific criteria set forth in Paragraph 8 of the
Settlement Agreement.
Table VI-2 presents the frequency of occurrence of 9~ toxic pollutants
sampled for in untreated wastewaters (discharged to the end-of-pipe treatment
systems) during the following EPA toxic pollutant sampling studies: I) Phase
I Screening, 2) Phase II Screening, 3) Verification, 4) EPA/CMA 5-Plant Study,
and 5) EPA 12-Plant Study. Also presented are the minimum and maximum
reported concentrations from the last three studies.
Only the last three studies for the minimim/maximum values were used
because the analytical methods used for the two screening studies allow the
data only to be used qualitatively. False positive pollutant identification
could occur in the Phase I and II screening studies as a result of the pro~
cedures used for interpreting ambiguous pollutant identification based on the
1977 screening level GC/MS analytical protocols and QA/QC procedures. The
screening level analytical procedures based pollutant identification on three
peaks of the mass spectrum. If these peaks did not agree exactly with the
reference or library spectrum, then judgement calls were generally made in
favor of compound presence. These judgement calls were made approximately
I0 to 20 percent of the time. This was a conservative approach for identlfy~
Ing pollutants of concern for future organic priority pollutant field sampling
and analysis studies because it minimized the occurrence of false negative re-
porting. Use of the screening analytical protocols also led to the reporting
of a range of analytical threshold levels or "detection limits" for various
toxic compounds. In general, the analytical threshold levels that were
reported as "less than" values are associated with raw waste sample matrix
interferences. The reporting of data as such does not imply the presence of
the toxic compounds at the reported "less than" values. Rather, it means that
the presence ~r absence of these compounds cannot be verified due to analyti-
cal limitations. The frequency counts presented.in Table VI-2 treats reported
"less than" values as non-detected. (The initial frequency counts presented
VI-ll

TABLE V l '2
FREQUENCY OF OCCURENCE AND CONCENTRATION RANGES FOIl
SELECTED PRIORITY POLLUTANTS IN UNTREATED MASTEUATER
ORS POLLUTANT POLLUTANT NUMBER OF NIN MAX NAME FRACTION NUMBER N DET RATIO PLANTS CONCENTRATION CONCENTRATION
1 Z I N C (TOTAL) N 128 137 131 95.620 21 14.000 450000 2 COPPER (TOTAL) N 120 134 123 91.7'91 19 23.500 4834 3 MERCURY (TOTAL} N 17.3 126 95 75.397 13 0.500 900 4 PHENOL A 65 148 110 74.324 29 13.000 978672 5 CHROMIUM (TOTAL) N 119 141 102 72.340 26 60.000 5330 6 TOLUENE V 86 137 96 70.073 26 13.000 160000 7 NICKEL (TOTAL) N 124 126 80 63.492 10 49.000 37500 8 BENZENE v 4 134 78 58.209 20 12.500 713740 9 ETHYLBENZENE V ]8 130 75 57.692 18 15.500 80000
10 DICHLOROMETHANE v 44 122 69 56.557 7 10.310 12480 11 CHLOROFORN V 23 131 71 54.198 13 11.000 5250 12 ARSENIC (TOTAL) X 115 120 62 51.667 6 5.000 711 13 SILVER (TOTAL) N 126 122 58 47.541 1 3.634 18 14 BIS'(2"ETHYLHEXYL) PHTHALATE B 66 127 57 44.882 1 11.000 18830 15 CYANIDE (TOTAL) N 121 118 49 41.525 3 130.000 5063 16 CADMIUM (TOTAL) N 118 126 48 ]8.095 . 3 5.519 10 17 LEAD (TOTAL) N 122 131 49 37.405 8 103.800 430000 18 ANTINONY (TOTAL) N 114 123 42 34.146 7 5.000 630 19 NAPHTHALENE B 55 125 42 33.600 14 12.000 37145 20 SELENIUM (TOTAL) N 125 119 38 31.933 4 3.000 250 21 lel,I-TRICHLOROETHANE v 11 112 35 31.250 6 11.000 7?.34 22 1,2-DICNLOROETHANE v 10 115 34 29.565 11 12.000 1272220 23 CHLORORENZENE V 7 115 33 28.696 7 11.500 49775 24 THALLIUM (TOTAL) N 127 118 33 27.966 2 2.000 5 25 PERCHLOROETNYLENE v 85 112 28 25.000 5 11.000 31500 26 CARBON TETRACHLORIDE v 6 113 28 24.T79 6 15.000 44000 27 2,4"DINETHYLPHENOL A 34 117 28 23.932 7 13.500 73537 28 VINYLIDENE CHLORIDE V 29 106 25 23.585 7 10.500 1300 29 DI-N-BUTYL PHTHALATE B 68 118 25 21.186 1 19.000 5930 30 TRICHLOROETHYLENE v 87 113 23 20.354 8 10.222 484 31 ACENAPHTHENE B 1 117 23 19.658 7 11.000 7000 32 PHENANTHRENE B 81 117 23 19.658 10 18.500 11000 33 ANTHRACENE B 78 117 21 17.949 7 15.000 2900 34 FLUORENE B 80 118 21 17.797 9 10.500 1873 35 ACENAPHTHYLENE 8 T/' 118 19 16.102 8 12.000 18500 36 BERYLLIUM(TOTAL) N 117 118 19 16.102 37 PYRENE B 84 119 18 15.126 6 11.000 5500 38 2,4e6-TRICHLOROPHENOL A 21 113 17 15.044 6 11.000 16780 39 2-CHLOROPHENOL A 24 115 17 14.783 5 10.333 247370 40 FLUORANTHENE B 39 117 17 14.530 6 14.870 7175 41 2,4-DICHLOROPHENOL A 31 114 15 13.158 4 60.000 72912 42 1,2-TRANSDICNLOROETHYLENE V 30 107 14 13.084 4 12.833 515 43 PROPYLENE CHLORIDE V 32 107 14 13.084 5 28.500 11000 44 1,2"DICHLORO8ENZENE (O'DICHLOROBENZENE) B 25 116 15 12.931 9 10.500 23326 45 1,4"DICHLOROSENZENE (P'DICHLOROeENZENE) 8 27 113 14 12.389 4 10.500 721 46 DIETHYL PHTHALATE B 70 112 13 11.607 2 13.500 15000 47 DIMETHYL PHTHALATE B 71 113 13 11.504 1 10.333 62.5 48 BUTYLBENZYL PHTHALATE B 67 115 13 11.304 49 1,1,2,2-TETRACHLOROETHANE V 15 109 12 11.009 3 34.000 192 50 8ENZO(A)ANTHRACENE B 72 112 12 10.714 5 12.030 2400
ALL CONCENTRATION IN UNITS OF PPB
RATIO • IO0*DET/N(IO0 * # DETECTED/TOTAL)
V!-I2

TABLE VI'2(CON'T.) FREQUENCY OF OCCURENCE AND CONCENTRATION RANGES FOR- SELECTED PRIORITY POLLUTANTS IN UNTREATED NASTENATER
~S POLLUTANT POLLUTANT -NLJMBER OF NAME FRACTION NUMBER N DET RATIO PLANTS
51 CHRYSENE 76 !14 12 10.526 4 52 OICHLONOOROMOMETHANE 48 108 11 10.185 53 BROMOFOPJ4 47 105 10 9.524 1 54 ACRYLONITRILE 3 !11 10 9.009 6 55 NITROBENZENE 56 111 10 9.009 4 56 PENTACHLONOPHENOL 64 113 10 8.850 4 57 1,1,2-TRICHLOi~OETHANE 14 105 9 8.571 3 58 2,6-DINITROTOLUENE 36 110 9 8.1'82 3 59 4-NITROPHENOL 58 11,2 9 8.036 4 60 2-NITROPHENOL 57 113 9 7.965 5 61 CHLOROMETHAN| 45 101 8 7.921 1 ~62 1,1-OICHLONOETHANE 13 107 8 7.477 2 63 1,3-DICHLOR~ROPENE 33 109 8 7.339 2 64 BIS'(2-CHLONOISOPROPYL) ETHER 42 112 8 7.143 2 65 2,4"OINITROPHENOL 59 1'12 8 7.143 5 66 815 (2-CHLONOETHYL)ETHER 18 114 8 7.018 2 67 CHLONOETHANE 16 103 7 6..796 2
CHLORCOIBROMOMETHANE 51 105 7 6.667 69 1,3-DICHLONONENZENE (M-DICHLOROBENZENE) 26 112 7 6.250 2 70 Di-N.OCTYL PHTHALATE 69 112 7 6.250 1 71 1,2,4-TfllCHLON08ENZENE 8 110 6 5.455 3 72 8[NZO-8-FLUOP.ANTHENE 7 6 110 6 5.455 2 73 HEXACHLONOBENZENE 9 109 5 4.587 1 74 HEXACHLOROETHANE 12 109 5 4.587 1 75 N'NITROSODIPHENYLAMINE 62 lb9 5 4.587 76 PARA'CHLORO'NETA'CRESOL 108 4 3.704 77 2,4"DINITROTOLUENE 35 108 4 3.794 2 7B BENZO(AH)PYRENE .73 i08 4 3.7o4 2 79 1,2-DIPHENYLNYORAZINE 37 109 4 3.670 80 CHLOROETHYLENE 88 99 3 3.030 2 81 BENZO(g)FLLK3P~NTHENE 75 107 3 2.804 2 82 BENZIDINE 5 108. 3 2.TrB 83 ISOPHORONE 54 109 3 2.752 1
&,6-OINITRO-O-CRESOL 6O 109 3 2.752 1 85 ACROLEIN 2 96 :, 2.o8s I 86 2-CNLOROETHYLVINYL ETHER 19 99 2 2.0'20 87 BIS-(2-CHLOROETHOXY) METHANE 43 108 2 1.852 88 BENZO(GHI)PERYLENE 79 111 2 1.8o2 I 89 INOENO(1,2,3-C,D)PYRENE 83 111 2 1.802 1 90 8RONCI~THANE 46 96 1 1.042 . 91 N-NITROSOOI.N-PROPYLAMINE 63 106 1 0.%3
92 2-CNLONONAPHTHALENE 20 107 1 0.935 93 4-¢HLOROPHENYLPHENYL ETHER 40 107 1 0.935 94 3,3-DICHLONOBENZIOINE • 28 108 1 0.926 1
4-8ROMOPHENYLPHENYL ETHER 41 108 1 0.926
HEXACHLONOBUTADIENE 52 109 1 0.917 1
97 DIBENZO(A,H)ANTHRACENE 82 109 1 0.917 1
98 HEXACHLOROCYCLOPENTADIENE 53 109 0 o 000
99 N-NITROSOD|METHYLAMINE 61 100 0 0.000
MIN MAX CONCENTRATION ~ CONCENTRATION
17.00 2167
24.00 71 290.OO 89OO00 140.00 330000 53.50 , 490 10.50 1201 29.00 ~75 83.00 10000 26.00 30000 51.00 129 11.00 640 17.00 4850
193.00 19486 67.00 360000 25. O0 1700 60.00 1040
11.50 4616 12.50 20.00 1927 12.00 374 13.00 920 58.00 3400
38.00 17500 11./o6 426
233.50 17950 12.00 352
253.00 253 7100.00 14888 2500.00 34500
2215o 23 22.50 23
371.00 38351
83.00 9100 22.50 25
ALL CONCENTRATION IN UNITS OF PFql RATIO • IO0*DET/H(IO0 * # DETECTED/TOTAL)
VIUl3

in Table VI-2, Vol II of the proposed Development Document (EPA 440/1-83/009,
February 1983) had tabulated "less than" values as detected.)
It should also be noted that the selected untreated wastewater sampling
locations at some plants may be downstream of in-plant controls that may treat
one or more OCPSF product/process sources of wastewater before commingling
with other OCPSF process wastewater at the influent to the end-of-pipe treat-
ment system. Therefore, the end-of-pipe raw wastewater summaries include some
partially treated wastewater. This situation is unavoidable for several
reasons. Foremost is the practical difficulties of accurately sampling and
flow proportioning multiple in-plant sources of wastewater to obtain com-
pletely untreated wastewater characteristics. The Agency's in-plant sampling
efforts often required the cooperation of plant personnel to modify existing
plumbing to accommodate sampling and flow measurement devices. The OCPSF
industry does not measure most in-plant sources of wastewater (the vast major-
ity of in-plant flows reported in the 1983 Section 308 survey were qualified
estimates). In addition, ]many of these in-plant controls are operated as
product recovery rather than wastewater treatment units. For example, many
existing in-plant controls such as steam stripping were originally installed
for product recovery purposes, but may be operated more efficiently or
upgraded for pollution control purposes. Also, some in-plant controls that
precede biological treatment protect the biota and otherwise ensure that the
biological system functions effectively and consistently. Sampling prior to
product recovery and prior to necessary in-plant control elements of biologi-
cal treatment would tend to overestimate typical raw waste concentrations.
For these reasons, the Agency believes that sampling of raw wastewater prior
to end-of-pipe treatment provides the most reasonable available basis for
assessing typical current OCPSF industry plant-level priority pollutant
concentrations.
In reviewing Table VI-2, two pollutants (hexachlorocyclopentadiene and
N-nitrosodimethylamine) were not detected at any of the 186 OCPSF plants
sampled. An additional five pollutants (2-chloronaphthalene, 4-chlorophenyl
phenyl ether, 4-bromophenyl phenyl ether, methyl bromide, and N-nitrosodi
N-propylamine) were detected at only one OCPSF facility, three pollutants
(2-chloroethyl vinyl ether, acrolein, and bis(2-chloroethoxy)methane) were
VI-14

d e t e c t e d a t o n l y two OCPSF f a c i l i t i e s , one p o l l u t a n t ( b e n z i d i n e ) was d e t e c t e d
a t o n l y t h r e e OCPSF f a c i l i t i e s , two p o l l u t a n t s ( p a r a e h l o r o m e t a c r e s o l and
1 , 2 , - d i p h e n y l h y d r a z i n e ) were d e t e c t e d a t o n l y f o u r OCPSF f a c i l i t i e s , and one
p o l l u t a n t ( N - n i t r o s o d i p h e n y l a m i n e ) was d e t e c t e d a t o n l y f i v e OCPSF f a c i l i t i e s .
These p o l l u t a n t s ( w i t h t he e x c e p t i o n o f a c r o l e i n ) were no t d e t e c t e d in any of
the samples from the q u a n t i t a t i v e minimum/maximum d a t a s e t and were found a t
t h i s l i m i t e d number o f p l a n t s ou t o f a t o t a l p l a n t p o p u l a t i o n o f 186 f a c i l -
i t i e s . I n a d d i t i o n , one p o l l u t a n t ( b u t y l benzy l p h t h a l a t e ) , which was found
a t a h i g h e r p e r c e n t a g e of OCPSF f a c i l i t i e s was n e v e r d e t e c t e d in t he q u a n t i -
t a t i v e minimum/maximum d a t a s e t .
Based on the limited number of plants at which these pollutants occur,
the fact that all but one of these pollutants were never quantitatively
i d e n t i f i e d and t h a t t he q u a l i t a t i v e d a t a from t h e two s c r e e n i n g s t u d i e s t end
to e x h i b i t f a l s e p o s i t i v e v a l u e s , t he Agency b e l i e v e s t h a t t h e s e 15 o r g a n i c
t o x i c p o l l u t a n t s d e s c r i b e d above and an a d d i t i o n a l 7 p r i o r i t y t o x i c m e t a l s
( d i s c u s s e d l a t e r in t h i s s e c t i o n ) and l i s t e d in Tab le VI-3 s h o u l d be e x c l u d e d
as f o l l o w s : two p o l l u t a n t s s h o u l d be e x c l u d e d from r e g u l a t i o n unde r BAT on
the b a s i s o f P a r a g r a p h 8 ( a ) ( i i i ) o f t he S e t t l e m e n t Agreement b e c a u s e t h e s e
p o l l u t a n t s were " . . . no t d e t e c t e d by S e c t i o n 304(h) a n a l y t i c a l methods o r
o t h e r s t a t e - o f - t h e - a r t methods . . . " and the r e m a i n i n g 13 o r g a n i c t o x i c
p o l l u t a n t s and 7 m e t a l s s h o u l d be e x c l u d e d from r e g u l a t i o n unde r BAT on t he
b a s i s o f P a r a g r a p h 8 ( a ) ( i i i ) o f t he S e t t l e m e n t Agreement b e c a u s e t h e s e p o l l u -
t a n t s were " . . . d e t e c t e d in the e f f l u e n t from a s m a l l number o f s o u r c e s and
a r e u n i q u e l y r e l a t e d to t h o s e s o u r c e s . . . "
A l so , t h r e e t o x i c p o l l u t a n t s (benzo ( g h i ) p e r y l e n e , d i b e n z o ( a , h )
anthrhcene, and indeno (1,2,3-c,d) pyrene) were detected in two or fewer OCPSF
plants in the qualitative frequency of occurrence data base, were reported at
less than 25 ppb in the quantitative minimum/maximum concentration data base
and are part of the polynuclear aromatic (PNA) pollutant class, which gener-
ally occur together and for which ii of 14 pollutants in the class are being
regulated under BAT. Based on these factors, the Agency has decided to ex-
clude these three toxic pollutants (also presented in Table VI-3) from regula-
tion under BAT on the basis of Paragraph 8(a)(iii) of the Settlement Agreement
because these pollutants were "...effectively controlled by the technologies
upon which are based other effluent limitations guidelines and standards..."
VI-15

TABLE Vl-3. TWO TOXIC POLLUTANTS EXCLUDED FROM REGULATION FOR BAT
SUBCATEGORIES ONE AND TWO UNDER PARAGRAPH 8(a)(lii) OF THE SETTLEMENT AGREEMENT BECAUSE THEY WERE "... NOT DETECTED BY
SECTION 304(h) ANALYTICAL METHODS OR OTHER STATE-OF-THE-ART METHODS ...
Hexachlorocyclopentadiene N-Nitrosodimethylamine
TWENTY TOXIC POLLUTANTS EXCLUDED FROM REGULATION FOR BAT SUBCATEGORIES ONE AND TWO UNDER PARAGRAPH 8(a)(iii) BECAUSE THEY
WERE "... DETECTED IN THE EFFLUENT FROM A SMALL NUMBER OF SOURCES AND ARE UNIOUELY RELATED TO THOSE SOURCES ..."
Acrolein 2-Chloronaphthalene 4-Chlorophenyl phenyl ether 4-Bromophenyl phenyl ether Methyl Bromide N-Nitrosodl-n-propylamine 2-Chloroethyl vinyl ether Bis (2-chloroethoxy) ether Benzidine Parachlorometa Cresol 1,2-Diphenylhydrazine N-Nitrosodiphenylamine Butyl Benzyl Phthalate Arsenic Beryllium Cadmium Mercury Selenium Silver Thallium
THREE TOXIC POLLUTANTS EXCLUDED FROM REGULATION FOR BAT SUBCATEGORIES ONE AND TWO UNDER PARAGRAPH 8(a)(iii)
OF THE SETTLEMENT AGREEMENT BECAUSE THEY WERE ...EFFECTIVELY CONTROLLED BY TECHNOLOGIES UPON WHICH ARE BASED
OTHER EFFLUENT LIMITATIONS, GUIDELINES, AND STANDARDS..."
Benzo(ghi)Perylene Dibenzo(a,h)Anthracene Indeno(1,2,3-c,d) Pyrene
VI-16

TABLE Vl-3. (Continued) EIGHT TOXIC POLLUTANTS EXCLUDED FROM REGULATION FOR BAT SUBCATEGORIES
ONE AND TWO UNDER PARAGRAPH 8(a)(iii) OF THE SETTLEMENT AGREEMENT BECAUSE THEY WERE "...PRESENT ONLY IN TRACE AMOUNTS AND NEITHER
CAUSING NOR LIKELY TO CAUSE TOXIC EFFECTS..."
l,l,2,2-Tetrachloroethane Bis(2-Chloroethyl)Ether Chlorodibromomethane Isophorone Pentachlorophenol Di-n-Octyl Phthalate Bromoform Dichlorobromomethane
Vl-17

In addition to the 18 organic toxic pollutants (listed in Table VI-3)
that were excluded for the reasons mentioned above, another eight organic
toxic pollutants (also shown in Table VI-3) are being excluded after examining
the Agency's toxic pollutant wastewater loadings estimates for direct and
indirect dischargers. Table VI-4 presents a summary of the toxic pollutant
wastewater loadings estimates by direct and indirect dischargers for these
eight toxic pollutants. Three toxic pollutants (bis(2-chloroethyl)ether,
bromoform, and dichlorobromomethane), while being detected at a relatively
high number of plants (8, lO, and II plants, respectively) in the qualitative
frequency of occurrence data base, were estimated never to occur in the Agen-
cy's current toxic pollutant wastewater loadings calculations for direct and
indirect dischargers. These wastewater loadings were calculated on a plant-
by-plant basis utilizing each plant's current product/process mix as reported
in the 1983 Section 308 Questionnaire Survey and are considered an UP-to-date
quantitative measurement of a toxic pollutant's industry-wide presence. Five
toxic pollutants (l,l,2,2-tetrachloroethane, chlorodibromomethane, isophorone,
pentachlorophenol, and di-n-octyl phthalate) had relatively low current waste-
water loadings predicted using this up-to-date product/process mix information
with average current discharge loadings ranging from 0.007 to 0.237 lbs/day.
Based on these ~actors, the Agency has decided to exclude these eight toxic
pollutants from regulation under BAT on the basis of paragraph 8(a)(iii) of
the Settlement Agreement because these pollutants were "...present only in
trace amounts and neither causing nor likely to cause toxic effects,.."
In addition to the 26 organic toxic pollutants excluded from regulation
above under BAT, the Agency had intended to reserve I0 pollutants (in addition
to dioxin) in the subcategory with end-of-pipe biological treatment (BAT Sub-
category One) and 14 toxic pollutants (in addition to dioxin) from regulation
in the subcategory without end-of-pipe biological treatment (BAT Subcategory
Two) because the in-plant control performance data for carbon adsorption and
chemical precipitation that had been collected via the sampling programs,
Section 308 0uestionnaire Survey or technology transfer prior to promulgation
was not adequate in the Agency's judgment to support regulation of these
pollutants. However, based on an analysis of pollutant loading estimates for
these pollutants at direct discharge OCPSF facilities, seven pollutants (all
metals) did not appear in the wastewater loadings estimates revised by EPA
VI-18

TABLE VI-4. WASIEWATI~ ~ F(~ El(}Ir EDXlC P O ~
~ ' F ( ~ P ~ EI(~IT EXCLUSION •
Direct Indirect Total Current Current Averege
Pollutant Pollutant No. of Daily No. of Daily Plant Daily Number Name Plants Loading* Plants loading* loading
( i t s /day) (lbs/day) ( lbs/day/plant)
15 I, I, 2,2-Tetrachloroethane 30 5.358 0.179
18 Bis(2-chloroethyl) ether
47 B r o m o f o r m . . . . . .
48 Dichlorobromomethane
51 Chlomdibromometha~ 64 0.436 - - 0.007
• 54, Isophorone. , 34 8.055 - - - - 0.237
64 Pentachlorophenol -- -- 13 0.318 0.024
69 DI-N-Octyl Phtl~l~te 45 2.681 ~ - - 0.060
*Daily loadings are calo,l~ted from annual loadlngs asmmlng discharge 365 days per year.
VI-19

after conducting a thorough analysis, which was discussed in Section V, to
validate the Verification Master Process File to include only the metals
concentration data for product/processes that are confirmed process sources.
This validation found a limited number of plants that utilized these seven
metals in their processes. Therefore, based on the analysis and validation
activities, the Agency has decided to exclude an additional seven pollutants
(arsenic, beryllium, cadmium, mercury, selenium, silver, and thallium) because
they were "...detected in the effluent from a small number of sources and are
uniquely related to those sources ..." (see Table VI-3).
This leaves a total of four pollutants that the Agency intends to reserve
from regulation under BAT Subcategory One and eight pollutants that the Agency
intends to reserve from regulation under BAT Subcategory Two. Tables VI-5 and
VI-6 present the pollutants which have been reserved from regulation under the
two BAT subcategories. Based on these decisions, the Agency will regulate a
total of 63 toxic pollutants in BAT Subcategory One and 59 toxic pollutants in
BAT Subcategory Two.
b. Selection Criteria for PSES and PSNS Toxic Pollutants
As discussed in Section XI, Pretreatment Standards for Existing Sources
(PSES) and Pretreatment Standards for New Sources (PSNS), indirect dischargers
need only address those pollutants that upset, inhibit, pass-through, or
contaminate sludges at Publicly Owned Treatment Works (POTWs). The Agency has
assumed for purposes of this analysis and based upon the available data, that
within each subcategory, the raw wastewaters at indirect discharging OCPSF
plants are not significantly different from those at direct discharging OCPSF
plants. In selecting pollutants regulated for pretreatment standards, the
toxic pollutants that the Agency considered as candidates for BAT regulation
in both subcategories were evaluated with respect to the pass-through cri-
teria. In the final regulation, the Agency addressed the 59 pollutants regu-
lated for BAT Subcategory Two because it was determined that the end-of-pipe
biological treatment used for BAT Subcategory One was not the appropriate PSES
technology. The Agency ewduated data on removal of these pollutants at POTWs
and at industrial treatment plants meeting BAT, to establish which pollutants
pass through POTWs. Pollutants found not to pass through were eliminated from
VI-20

TABLE VI-5. FOUR TOXIC POLLUTANTS RESERVED FROM REGULATION
UNDER BAT FOR SUBCATEGORY ONE
2,4,6-Trichlorophenol 3,3'-Dichlorobenzidine Antimony Dioxin (TCDD)
TABLE VI-6. EIGHT TOXIC POLLUTANTS RESERVED FROM
REGULATION UNDER BAT FOR SUBCATEGORY TWO
2,4,6 - Trichlorophenol 2 - Chlorophenol 3,3' - Dichlorobenzidine 2,4 - Dichlorophenol 2,4 - Dinitrotoluene 2,6 - Dinitrotoluene Antimony Dioxin (TCDD)
VI-21

consideration for regulation under PSES and PSNS. The remaining pollutants
were then selected as candidates for regulation. The procedure used for the
pass-through analysis is described below. Results of this procedure for both
BAT subcategories are shown in Tables VI-7 and VI-8.
c. PSES Pass-Through Analysis
Prior to establishing pretreatment standards for a toxic pollutant, the
Agency must determine whether the pollutant passes through POTWs or interferes
with POTW operation or sludge disposal practices. In determining whether
pollutants pass through a POTW, the Agency generally compares the percentage
of a pollutant removed by POTWs with the percent of a pollutant removed by
direct discharging industrial facilities applying BAT. Under this approach, a
pollutant is deemed to pass through the POTW when the average percentage
removed by POTWs nationwide is less than the percentage removed by direct
discharging industrial facilities applying BAT for that pollutant.
This approach to the definition of pass-through satisfies two competing
objectives set by Congress: that standards for indirect dischargers be analo-
gous to standards for direct dischargers, and that the treatment capability
and performance of POTWs be recognized and taken into account in regulating
the discharge of pollutants from indirect dischargers. Rather than compare
the mass or concentration of pollutants discharged by POTWs with the mass or
concentration of pollutants discharged by direct dischargers, EPA compares the
percentage of the pollutants removed with POTWs' removals. EPA takes this
approach because a comparison of mass or concentration of pollutants in a POTW
effluent with pollutants in a direct discharger's effluent would not take into
account the mass of pollutants discharged to the POTW from nonindustrial
sources nor the dilution of the pollutants in the POTW effluent to lower con-
centrations from the addition of large amounts of nonindustrial wastewater.
Presented below are brief descriptions of PSES pass-through analysis
methodologies utilized for proposal and the two Federal Register NOAs as well
as a more detailed discussion of the methodology and results of the PSES pass-
through analysis used for the final regulation.
VI-22

TABLE Vl-7. FINAL PSES PASS-THROUGH ANALYSIS
RESULTS (NON-END-OF-PIPE BIOLOGICAL SUBCATEGORY DATA)
10*ML Editing 20 PPB Editing Pass-Thru Analysis Pass-Thru Analysis
Pollutant Pollutant 0CPSF POTN Pass OCPSF POTW Pass Volatile Number Name % ITEM. % REM. Through % REM. % REM. Through Override
1 Acenaphthene 98.9 98.3 Yes NA NA NA NA 3 Acrylonitrile 99.9 . . . . . . 99.9 . . . . . . . . . 4 Benzene 99.9 94.8 Yes NA NA NA NA 6 Carbontetrachloride 99.6(A) 87.9 Yes NA NA NA NA 7 Chlorobenzene 99.6(A) 96.4 Yes NA NA NA NA 8 1,2,4-Trichlorobenzene 99.6(A) 91.5 Yes NA NA NA NA 9 Hexachlorobenzene 99,6(A) . . . . . . 99.6(A) . . . . . . Yes
I0 1,2-Dichloroethane 99.9 89.0 Yes . . . . . . . . . . . . ii l,l,l-Trichloroethane 99.9 90.5 Yes NA NA NA NA 12 Hexachloroethane 99.6(A) . . . . . . 99.6(A) . . . . . . Yes ,13 l,l-Dichloroethane 99.9 . . . . . . 99.9 70.0 Yes NA
I 14 l,l,2-Trichloroethane 99.9 . . . . . . 99.9 56.0 Yes NA
Lo 16 Chloroethane 99.7 . . . . . . 99.7 27.7 Yes NA 23 Chloroform 99.9 73.4 Yes NA NA NA NA 25 1,2-Dichlorobenzene 99.6(A) 89.0 Yes NA NA NA NA 26 1,3-Diehlorobenzene 99.6(A) . . . . . . 99.6(A) 88.9 Yes NA 27 1,4-Dichlorobenzene 99.6(A) . . . . . . 99.6(A) 52.4 Yes NA 29 l,l-Dichloroethylene 99.8 (92.0) Yes NA NA NA NA 30 1,2-Trans-Dichloroethylene 99.9 . . . . . . 99.9 70.9 Yes NA 32 1,2-Dichloropropane 99.6(A) 97.7 Yes NA NA NA NA 33 1,3-Dichloropropylene 99.6(A) . . . . . . 99.6(A) 60.0 Yes NA 34 2,4-Dimethylphenol 99.9 . . . . . . 99.9 51.2 Yes NA 38 Ethylbenzene 97.2 93.8 Yes NA NA NA NA 39 Fluoranthene 99.3 . . . . . . 99.3 42.5 Yes NA 42 Bis(2-Chloroisopropyl)Ether 99.6(A) . . . . . . 99.6(A) . . . . . . . . . 44 Methylene Chloride 99.5 54.3 Yes NA NA NA NA 45 Methyl Chloride 99.9 . . . . . . 99.9 48.2 Yes NA 52 Hexachlorbutadiene 99.6(A) . . . . . . 99.6(A) . . . . . . Yes 55 Naphthalene 99.9 94.7 Yes NA NA NA NA 56 Nitrobenzene 99.8 (98.0) Yes NA NA NA NA 57 2-Nitrophenol 99.2 . . . . . . 99.2 26.8 Yes NA 58 4-Nitrophenol 99.8 . . . . . . 98.8 75.4 Yes NA 59 2,4-Dinitrophenol 98.9 . . . . . . 98.9 . . . . . . . . .

TABLE VI-7. FINAL PSES PASS-THROUGH ANALYSIS
RESULTS (NON-END-OF-PIPE BIOLOGICAL SUBCATEGORY DATA) (Continued)
10*ML Editing 20 PPB Editing Pass-Thru Analysis Pass-Thru Analysis
Pollutant Pollutant OCPSF POTW Pass OCPSF POTW Pass Volatile Number Name % REM. % REM. Through % REM. % REM. Through Override
60 4,6-Dinitro-O-Cresol 99.8 (93.0) Yes NA NA NA NA 65 Phenol 99.9 95.2 Yes NA NA NA NA 66 Bis(2-Ethylhexyl)Phthalate 95.9 59.8 Yes NA NA NA NA 68 Di-N-Butyl phthalate 96.5 --- 96.5 79.3 Yes NA
UA 70 Diethyl Phthalate 98.1 . . . . . . 98.1 59.7 Yes LIA-A
71 Dimethyl Phthalate 93.4 --- 93.4 63.2 Yes NA 72 Benzo(A)Anthracene 96.8 . . . . . . 96.8 (98.0) No No 73 Benzo(A)Pyrene 93.8 --- 93.8 (99.0) No No 74 3,4 Benzofluoranthene 94.1 . . . . . . 94.1 . . . . . . 75 Benzo(K)Fluoranthene 93.2 --- 93.2 . . . . . . 76 Chrysene 96.2 . . . . . . 96.2 (97.0) No No
H I 77 Acenaphthylene 97.9 --- 97.9 . . . . . . bo 78 Anthracene 98.6 95.6 Yes NA NA NA NA
80 Fluorene 99.2 . . . . . . 99.2 69.8 Yes NA 81 Phenanthrene 99.7 94.9 Yes NA NA NA NA 84 Pyrene 99.0 (95.0) Yes NA NA NA NA 85 Tetrachloroethylene 99.9 84.6 Yes NA NA NA NA 86 Toluene 99.9 96.2 Yes NA NA NA NA 87 Trichloroethylene 99.6 86.9 Yes NA NA NA NA 88 Vinyl Chloride 98.6 93.4 Yes NA NA NA NA
119 Chromium -40.6(P/C) 91.3 No NA NA NA NA 120 Copper 76.8(P/C) 84.1 No NA NA NA NA 121 Cyanide 99.9(P/C) 70.4 Yes NA NA NA NA 122 Lead 99.9(P/C) 91.8 Yes NA NA NA NA 124 Nickel 28.4(P/C) 51.4 No NA NA NA NA 128 Zinc 90.2(P/C) 78.0 Yes NA NA NA NA
NA - Not Applicable ( ) - Bench- or Pilot-Scale POTW Percent Removal (A) - Average of Steam Stripping Percent Removal Data HL - Minimum Level (P/C) - Percent Removal using Effluents Long-Term Average Based on Metal Finishing Industry Physical/Chemical
Treatment

TABLE VI-8. FINAL PSES PASS-THROUGH ANALYSIS
RESULTS (END-OF-PIPE BIOLOGICAL SUBCATEGORY DATA)
IO*ML Editing 20 PPB Editing Pass-Thru Analysis Pass-Thru Analysis
Pollutant Pollutant OCPSF POTW Pass OCPSF POTW Pass Volatile Number Name % REM. % REM. Through Z REM. Z REN. Through Override
1 Acenaphthene 98.9 98.3 Yes NA NA NA NA 3 Acrylonitrile 99.9 . . . . . . 99.9 . . . . . . . . . 4 Benzene 99.5 94.8 Yes NA NA NA NA 6 Carbontetrachloride 99.1 87.9 Yes NA NA NA NA 7 Chlorobenzene 99.1 96.4 Yes NA NA NA NA 8 1,2,4-Trichlorobenzene 88.3 91.5 No 84.6 90.3 No Yes 9 Hexachlorobenzene 96.5 . . . . . . 82.0 . . . . . . Yes
I0 1,2-Dichloroethane 97.4 89.0 Yes NA NA NA NA ii l,l,l-Trichloroethane 98.9 90.5 Yes NA NA NA NA 12 Hexachloroethane 96.6 96.6 . . . . . . Yes ---
< 13 l,l-Dichloroethane 93.4 . . . . . . 72.6 70.0 Yes NA
i 14 l,l,2-Trichloroethane 97.2 . . . . . . 97.2 56.0 Yes NA bo 16 Chloroethane 96.0 . . . . . . 67.4 27.7 Yes NA
23 Chloroform 98.0 73.4 Yes NA NA NA NA 25 12-Dichlorobenzene 96.2 89.0 Yes NA NA NA NA 26 13-Dichlorobenzene 96.9 . . . . . . 74.3 88.9 No Yes 27 14-Dichlorobenzene 97.0 92.0 52.4 Yes NA --- 29 l l-Dichlorobenzene 97.0 (92.0) Yes NA NA NA NA 30 12-Trans-Dichloroethylene 81.5 81.5 70.9 Yes NA --- 32 12-Dichloropropane 98.2 97.7 Yes NA NA NA NA 33 13-Dichloropropylene 92.9 92.9 60.0 Yes NA 34 24-Dimethylphenol 99.8 . . . . . . 99.8 51.2 Yes NA 38 Ethylbenzene 98.4 93.8 Yes NA NA NA NA 39 Fluoranthene 99.3 95.8 42.2 Yes NA --- 42 Bis(2-Chloroisopropyl)Ether 72.2 . . . . . . 72.2 . . . . . . . . . 44 Methylene Chloride 98.7 54.3 Yes NA NA NA NA 45 Methyl Chloride . . . . . . . . . 48.2 Yes --- 52 Hexachlorobutadiene 95.7 . . . . . . 95.7 . . . . . . Yes 55 Naphthalene 99.0 94.7 Yes NA NA NA NA 56 Nitrobenzene 98.9 (98.0) Yes NA NA NA NA 57 2-Nitrophenol 96.1 69.3 26.8 Yes NA --- 58 4-Nitrophenol 93.1 . . . . . . 90.9 75.4 Yes NA 59 2,4-Dinitrophenol 97.4 . . . . . . 97.4 . . . . . . . . .
4,6-Dinitro-o-eresol 99.8* (93.0) Yes . . . . . . . . . . . . 60

TABLE VI-8. FINAL PSES PASS-THROUGH ANALYSIS
RESULTS (END-0F-PIPE BIOLOGICAL SUBCATEGORY DATA) (Continued)
10*ML Editing 20 PPB Editing Pass-Thru Analysis Pass-Thru Analysis
Pollutant Pollutant OCPSF POTW Pass OCPSF POTW Pass Volatile Number Name % REM. % REM. Through % REM. % REM. Through Override
65 Phenol 98.4 95.2 Yes NA NA NA NA 66 Bis(2-Ethylhexyl)Phthalate 97.4 59.8 Yes NA NA NA NA 68 Di-N-Butyl phthalate 97.6 --- 97.6 79.3 Yes NA 70 Diethyl Phthalate 92.0 --- 92.0 59.7 Yes NA 71 Dimethyl Phthalate 87.4 --- 87.4 63.2 Yes NA 72 Benzo(A)Anthracene 96.6 . . . . . . 96.6 (98.0) No No 73 Benzo(A)Pyrene 93.8 . . . . . . 93.8 (99.0) No No 74 3,4-Benzofluorathene 94.1 --- 94.1 . . . . . . 75 Benzo(K)Fluoranthene 93.1 --- 93.1 ---76 Chrysene 96.8 . . . . . . 96.8 (97.0) No No 77 Acenaphthylene 98.4 . . . . . . 98.2 ---
H i 78 Anthracene 98.6 95.6 Yes NA NA NA NA bo
80 Fluorene 97.9 . . . . . . 94.0 69.8 Yes NA 81 Phenanthrene 99.6 94.9 Yes NA NA NA NA 84 Pyrene 99.0 (95.0) Yes NA NA NA NA 85 Tetrachloroethylene 98.6 84.6 Yes NA NA NA NA 86 Toluene 99.6 96.2 Yes NA NA NA NA 87 Trichloroethylene 94.3 86.9 Yes NA NA NA NA 88 Vinyl Chloride 97.5 93.4 Yes NA NA NA NA
119 Chromium -40.6(P/C) 91.3 No . . . . . . . . . 120 Copper 76.8(P/C) 84.1 No . . . . . . . . . 121 Cyanide 99.9(P/C) 70.4 Yes . . . . . . 122 Lead 99.9(P/C) 91.8 Yes . . . . . . 124 Nickel 28.4(P/C) 51.4 No . . . . . . 128 Zinc 90.2(P/C) 78.0 Yes . . . . . . . . .
NA - Not Applicable ( ) - Bench- or Pilot-Scale POTW PerceHt Removal ML - Minimum Level (P/C) - Percent Removal Using effluent Long-Term Average based on Metal Finishing Industry Physical/Chemical
Treatment *OCPSF removal based on in-plant treatment for this pollutant

March 1983 Proposal Approach
In the March 21, 1983 proposal (48 FR I1828), the Agency modified the
general pass-through analysis methodology discussed above. Cognizant of the
analytical variability typical of organic toxic pollutants in POTW and OCPSF
wastewater, EPA proposed to find that pass-through occurs only if the percent-
ageremoved of a certain pollutant by direct dischargers applying BAT is at
least 5 percent greater than the percent removed by well-operated POTWs
("Five percent differential"). The methodology used for calculating POTW and
industrial percent removals was as follows: 1) for an individual POTW or
OCPSF plant, the influent and effluent data around the particular treatment
system were paired on a daily basis; 2) daily percent removals were calculated
for each pollutant; 3) an average daily percent removal was calculated for
eachlpollutant by OCPSF plant or POTW; and 4) for each pollutant, a median
percent removal was calculated using average daily percent removals for each
OCPSF plant or POTW. Also, the Agency assumed pass-through for all pollutants
that did not have POTW percent removals, but were regulated under BAT and had
OCPSF industry percent removal data.
Using the above methodology, EPA determined tha t s ix p o l l u t a n t s in the
P l a s t i c s - O n l y subca tegory and 29 p o l l u t a n t s in the Not P l a s t i c s - O n l y subca te -
gory should be c o n t r o l l e d under PSES and PSNS on the bas i s of pass - th rough .
(These s u b c a t e g o r i e s appeared in the proposa l , but have not been r e t a i n e d in
the f i n a l r e g u l a t i o n . )
July 1985 NOA Approach
In the July 17, 1985 Federal Register NOA, the Agency retained the same
methodology used for the March 1983 proposal, but introduced several different
approaches for public comment and included additional OCPSF sampling data
(i.ei, the EPA 12-Plant Sampling Study) in the OCPSF percent removal calcula-
tion§. These approaches included the use of either a 0 percent differential
or a:lO percent differential between POTW and OCPSF percent removals in deter-
mining pass-through and the possible finding of pass-through for selected
volatile pollutants that are air stripped in POTW collection and treatment
systems, regardless of whether they passed through using the traditional pass-
VI-27

through analysis. A list of these volatile pollutants is presented in Table
VI-9. Section VIII discusses air emissions from wastewater treatment systems
and the derivation of this list.
Based on this methodology, the Agency proposed control of 48 toxic pol-
lutants under PSES and PSNS using the traditional pass-through methodology and
identifying pollutants of concern for which POTW percent removal data were not
available. The Agency also proposed to find pass-through for 12 toxic vola-
tile and semivolatile pollutants on the basis of volatilization.
December 1986 NOA Approach
After assessing the public comments on the July 17, 1985 NOA, a number of
different pass-through analysis methodology changes were examined, including:
I) the use of all published literature sources in determining a representative
POTW percent removal for all pollutants without full-scale POTW percent
removal data; 2) the continued finding of pass-through for pollutants volatil-
ized rather than treated by POTWs; 3) modifying the typical pass-through
analysis in order to not regulate certain acid and base/neutral pollutants
that were regulated based on pass-through analysis results, but might be shown
not to pass-through based on certain means of evaluating industry and POTW
removals for comparable ranges of influent pollutant concentrations; 4) chang-
ing the methodology for calculating the POTW and OCPSF percent removals; and
5) modifying the 5 percent differential rule between POTW and OCPSF percent
removals.
The first revision of the original POTW pass-through analysis incorpor-
ated literature, pilot- and bench-scale plant percent removal data for POTWs
for those toxic pollutants that were not adequately covered by the 40 POTW
Study data base. In the previous pass-through analyses, toxic pollutants with
no full-scale POTW percent removal data were considered to pass through POTW
treatment systems, requiring them to be regulated under PSES. For those pol-
lutants without full-scale POTW removal data, the PSES cost estimates for the
December 1986 NOA were based on POTW percent removals from a number of sources
that were utilized to perform the revised pass-through analysis. These
sources included a report to Congress that presented the results of a study
VI-28

TABLE VI-9. VOLATILE AND SEMIVOLATILE TOXIC POLLUTANTS TARGETED FOR CONTROL DUE TO AIR STRIPPING
(I) Acenaphthene* (3) Acrylonitrile* (4) Benzene (6) Carbon Tetrachloride (7) Chlorobenzene (8) 1,2,4-Trichlorobenzene (9) Hexachlorobenzene (10) 1,2-Dichloroethane (11) 1,1,1-Trichloroethane (12) Hexachloroethane (13) 1,1-Dichloroethane (14) 1,1,2-Trichloroethane (16) Chloroethane (23) Chloroform (25) 1,2-Dichlorobenzene (26) 1,3-Dichlorobenzene
(27) 1,4-Dichlorobenzene (29) l,l-Dichloroethylene (30) 1,2-Trans-dichloroethylene (32) 1,2-Dichloropropane (33) 1,3-Dichloropropylene (38) Ethylbenzene (42) Bis (2-chloroisopropyl) Ether* (44) Methylene Chloride (45) Methyl Chloride (48) Dichlorobromomethane (52) Hexachlorobutadiene (55) Naphthalene* (85) Tetrachloroethylene (86) Toluene (87) Trichloroethylene (88) Vinyl Chloride
*These p o l l u t a n t s were determined to be l e s s s u s c e p t i b l e to a i r s t r i p p i n g and removed from the l i s t of v o l a t i l e s for which v o l a t i l i z a t i o n o v e r r i d e s the percent removal pass - th rough a n a l y s i s .
VI-29

examining the discharge of listed hazardous wastes to POTWs (the February 1986
Domestic Sewage Study), the General Pretreatment Regulations (40 CFR 128 and
403), and the best professional judgment estimates of EPA's Wastewater Engi-
neering Research Laboratory (EPA-WERL) and other Agency personnel based on
various pilot-plant studies performed by or for EPA-WERL.
The second revision involved the permanent incorporation of the finding
of pass-through for volatile pollutants that are air stripped rather than
treated in POTWs (see Table V-9).
In addition to evaluating alternative data sources to replace missing
full-scale POTW percent removals, the Agency also performed further analyses
using the 40 POTW Study and the 0CPSF data bases to evaluate treatability of
toxic pollutants as it relates to influent concentration levels. Specific-
ally, these data were first plotted to show a relationship between percent
removal and influent concentration and then a comparison of the POTW and 0CPSF
plots were made. To facilitate the analysis, the toxic pollutants were
combined into groups that have previously been used in the calculation of
toxic pollutant variability factors (See Section VII). In general, few of the
groups had both adequate POTW and 0CPSF data to draw any firm conclusions.
Since POTWs and 0CPSF facilities do not have equivalent influent concentra-
tions for most pollutants (because of the dilution effects of domestic sewage
and other industry wastewaters on POTW influents), POTW percent removals tend
to be based upon calculations using lower average influent concentration.
Thus, the percent removal results may be strongly influenced by the influent
concentration. Another factor influencing the percent removals is related to
effluent concentration. From the groups with adequate data, a definite asymp-
totic relationship was observed for certain groups, that generally occurs
because of the analytical minimum levels ("limits of detection") at the low
end of the concentration range. For many of the pollutant groups, this does
not indicate an inability to remove pollutants but the lack of quantification
below the analytical minimum level that limits the maximum percent removal
that can be calculated.
Based on these results, selected pollutants were identified for further
analysis from the following groups:
VI-30

• Group i - Halogenated Methanes
• Group 2 - Chlorinated C2s
• Group ii - Aromatics
• Group 12 - Polyaromatics (PNAs)
• Group 13 - Chloroaromatics
• Group 16 - Phthalate Esters
• Group 18 - Benzidienes
• Group 19 - Phenols.
Comparing POTW and OCPSF percent removals at individual influent ranges,
a detailed pass-through analysis was performed for each selected pollutant.
The results of this analysis were that seven pollutants (acenaphthene, ben-
zene, chloroform, phenol, anthracene, phenanthrene, and toluene) that had
previously been considered to require regulation based on pass-through analy-
sis results were now shown not to pass-through. However, since all but three
of these pollutants were contained in the list of volatile pollutants, only
phenol, anthracene, and phenanthrene were selected for consideration in this
alternative regulatory option as not passing through.
The fourth revision involved the evaluation of the methodology used to
calculate the POTW and 0CPSF percent removals used in the PSES pass-through
analysis, which was revised to conform with other calculations being used for
limitations development and to avoid the use of daily influent/effluent pairs
in order to accommodate retention times in treatment systems larger than
24 hours. The new data editing methodology was as follows: i) all influent
and effluent data around the biological treatment system were assembled;
2) average influent and effluent concentrations were calculated for each
pollutant; 3) an average percent removal was calculated for each pollutant
(instead of an average daily percent removal); and 4) for each pollutant, a
median percent removal was calculated using the average percent removals for
each OCPSF plant or POTW. Also, based on revised BAT industry data editing
techniques, industrial percent removal data were no longer available for six
toxic pollutants (l,l-dichloroethane, bromoform, dichlorobromomethane, penta-
chlorophenol, cadmium, and silver). Therefore, these pollutants were elimi-
nated. Also, these revised BAT data editing techniques eliminated some indus-
trial data, thus changing (raising or lowering, depending on the pollutant)
the calculated industrial percent removals.
Vl-31

Finally, the Agency decided not to use a 5 or i0 percent differential and
concluded that the most reasonable approach is to accept the available data as
the best information on the relative percent removals of BAT and POTWs and to
perform BAT/POTW comparisons directly based on that data. EPA decided that
such an approach was unbiased in that it does not favor either the over-
statement or under-statement of pass-through for the pollutants.
Adopted Approach and Rationale
After reviewing public comments received on the December 1986 N0A pass-
through methodology revisions, the Agency again examined its procedures and
instituted a final set of changes. As stated previously, the Agency decided
not to use a 5 or I0 percent differential. In urging EPA to adopt a 5 or
I0 percent differential, commenters stated that use of the differential would
address the problem of low POTW effluent concentrations that may mask the full
extent of POTW treatment. These commenters also supported the rationale that,
in addition to analytical variability, a differential was supported by the
fact that POTW influent concentrati6ns are typically much lower than industry
treatment system influent concentrations, and many POTW effluent samples are
below detection, preventing a complete accounting of all pollutants removed by
the POTW.
The problem with using a differential is that it is uncertain whether the
POTWs are treating to levels substantially below detection or not, since the
data analyses results were from measurements only to the detection limits.
Thus, it is difficult to determine the extent to which POTW removals are
underestimated and the degree to which compensation is justified. (It should
be noted that the risk of underestimation exists also with respect to calcu-
lating BAT removals with data reflecting effluent levels below the detection
level.) Moreover, a 5 or i0 percent differential, unless restrictively
drafted, would often result in overcompensating for the uncertainty. It
should be noted that to allow even a few pollutants to go unregulated based on
the 5 percent differential could be significant in terms of the number of
pounds of unregulated toxic pollutants discharged. Finally, the potential
effect discussed by the commenters will be greatly mitigated by changes in the
data editing criteria, which are discussed below.
VI-32

EPA has modified the criteria under which the full-scale POTW data for
conducting the pass-through comparison test were selected. In previous analy-
ses, EPA used data when influent concentrations exceeded 20 ppb. For pollu-
tants with low influent concentrations, i.e., not much higher than 20 ppb, the
effluent concentrations were consistently below the detection level and could
not be precisely quantified. The conservative technique of estimating the
effluent by rounding it up to the detection limit had the effect of understat-
ing the POTW's percent removal, in many cases, in fact, both POTW and BAT
treatment systems with relatively low influent concentrations yielded efflu-
ents below detection, and the resulting percent removals were not true mea-
sures of treatment effectiveness, but rather were primarily functions of the
influent concentrations. The percent removal comparison thus had the effect
of determining pass-through if and only if the POTW had a lower pollutant
Influent concentration, rather than basing the determination on true treat-
ability criteria. A second concern with the 20 ug/1 criterion is its incon-
sistency with the criteria used to select industry data that EPA considers
generally acceptable for assessing treatability and calculating BAT effluent
limitations. One of EPA's criteria for using industry data to set effluent
limitations is that the influent data must exceed i0 times the pollutant's
minimum analytical threshold level for that plant. When an influent concen-
tration is below this level, effluent concentrations below the pollutant's
analytical minimum level often may be achieved using less than BAT level
t r e a t m e n t . The e d i t i n g c r i t e r i o n e n s u r e s t h a t e f f l u e n t l i m i t a t i o n s g e n e r a l l y
r e f l e c t t he t e c h n i c a l c a p a b i l i t y o f BAT l e v e l t r e a t m e n t r a t h e r than low i n f l u -
e n t c o n c e n t r a t i o n s .
C o n s i s t e n t w i t h t he g e n e r a l BAT e d i t i n g a p p r o a c h , EPA has used the " t e n
t imes t he minimum l e v e l " ( i . e . , 100 ppb f o r most p o l l u t a n t s ) c r i t e r i o n f o r BAT
and POTW i n f l u e n t s f o r p u r p o s e s o f s e l e c t i n g the d a t a used to p e r f o r m p a s s -
t h r o u g h c o m p a r i s o n s f o r t he f i n a l r u l e when a v a i l a b l e . When BAT or POTW
i n f l u e n t s g r e a t e r than " t e n t imes the minimum l e v e l " were no t a v a i l a b l e ,
p a s s - t h r o u g h c o m p a r i s o n s were made u s i n g the 20 ppb c r i t e r i o n f o r BAT and POTW
i n f l u e n t s . For t he f i n a l p a s s - t h r o u g h d e t e r m i n a t i o n , 28 of the p o l l u t a n t s
were found to p a s s - t h r o u g h u s i n g d a t a e d i t e d a t 10 t imes the minimum l e v e l ;
t h r e e p o l l u t a n t s d e m o n s t r a t e d no p a s s - t h r o u g h a t t h i s l e v e l o f e d i t i n g .
VI-33

EPA also retained the modified approach of calculating plants' percent
removals using average plant removals. Previously, for each plant, EPA had
averaged daily percent removals. This is technically inappropriate. First,
many OCPSF treatment systems have retention times exceeding one day's time.
Thus, it is improper to compare influent and effluent samples taken on the
same day. Second, even if the retention time is shorter than a full day, any
sampled influent, after mixture and dispersal within the treatment system,
cannot be traced to a particular sample leaving the system. In fact, in the
typical biological treatment system, a portion of the biological solids are
recirculated within the system. Thus again, it is improper to compare any
influent and effluent samples asa pair. Third, due ~o the low concentrations
found in both OCPSF treatment and POTW biological systems (due to dilution by
other wastewaters), small daily changes in pollutant concentrations yield a
misleading picture of variability in the daily efficiency of these systems.
Therefore, EPA has modified its approach to calculate a plant's percent
removal by averaging all influent samples, averaging all effluent samples, and
calculating percent removals using these averages.
The Agency also decided to retain the use of qualified bench- or pilot-
scale POTW percent removal data in the absence of sufficient full-scale POTW
removal data on specific pollutants to perform the removal comparison. A
summary of the bench/pilot-scale data results and the studies that are the
sources of these data is presented in Table VI-IO. Despite the fact that EPA
sampled 50 POTWs in addition to conducting many OCPSF sampling efforts, there
are 12 pollutants regulated at BAT for which EPA lacks sufficient full-scale
POTW data to perform this analysis. In the 1983 proposal, EPA adopted the
approach of assuming pass-through in the absence of data to the contrary.
Some industrial commenters objected to this approach arguing that Section
307(b) authorizes EPA to promulgate pretreatment standards only for pollutants
that pass-through or interfere with the POTW, and that EPA is thus required
to affirmatively find pass-through or interference as a precondition to pro-
mulgating pretreatment standards. Environmental groups argued to the contrary
saying that EPA has an obligation to require pretreatment if there may be
pass-through or interference and that in the absence of adequate data, the
possibility of pass-through must be assumed. In subsequent notices, EPA
requested comment on an alternative approach of using qualitative data to
determine POTW removal rates in the absence of full-scale quantitative data
VI-34

TABLE VI-IO. ESrIMA~n ~ RI~OVAL DATA FROM PilOt- OR B~U~-SCALE
Slln~%~ FOR ~;L~I~D TOXIC P O ~
(Influent cmcentration, ~I) and Pollutant Pollutant % Remval from Reference Number Shmm Below Number Name 1 2 3 4 5
13 I, l-Dichloroethane (144) 94
18 Bis(2-Chloroethyl) Ether (143) 80
27 1,4-Dichloro~ (93) 94
29 I, l-Dichloroethyle~e (79) >99 (212) 92
32 I, 2-Dichloropropm~ (309) >98
34 2,4-Dimethylphenol (96) 99
47 Bromoform (90) 65
48 Dichlorobr _r~e_ d ~ e (89) >99 I
56 Nitrobenzene (118) 98
60 4, 6-Dinitro-o-cresol (20,000) 93 3 (20,000) 92 5 (20,000) 97 7 (20,000) 99 Ii
71 Dimethyl Phthal~te (47) 98
72 Benzo(a)anthracene (24) 98
73 Benzo(a) pyrene (3S) >99 (0.4) 84
76 C ~ (39) 97 84 I~rene (30) 94 (104) 95

TJ~P. ~ri-lO.
SI~T'~ FOR .':~.'¢~) T(~C P(CLIJTR~ (Continued)
. Petrasek, A.C., et al. Fate of Toxic O~e Ctmp~._ ,~Is in gaste~ter Tl~eatm=nt Plants, Jour. WI~ 55, 1286 (19B3). Means for 8 sm~?le sets. P4]nt .-~'a]e 1.5 gpm. ~:J~mmted activated sludge.
. Petrasek, A.C., et al. I ~ and Partitioning of l~latl]e Org~e l~-iority Ibllutmts in Wastevater Treatm~t Presented at 9th U.S. J~r~n Caafemem~ on Se~ Tmeatmpnt Technology, Tokyo, Japan. Sept. 13-29 (1983). Means for 20 .~]~ sets. Pilot scale 35 gl ~. AceH,mted activated si~k,e.
. Bannah, S.A., et al. Cmtive I ~ of Tc~ic ~n,,t~ts by Six gastewater Treatment Processes. Jour. WPCF 58, 27 (1986). Means from 11-14 ~,~p]p sets. Pilot scale 1.5 gl ~. Acellm~ted activated sludge.
. ~/eber, W.J., Jr. and B.E. Jones. Toxic Substame I ~ in ~tivated Sludge and PAC Truant Systems. EPA/600/52-86-045, June 1986. Data fxcl 40 days run after acclimation in bench scale reactor with 6 day ~RT.
ILo O~ . Kitsch, E.J. and R.F. Wl~casch. Fate of Eight O~c Priority Pollutants in Biological Waste
Treatment. Stmmary Report for EPA Cooperative ~ t (N-B07638 (1982). Bemch scale ace] i,mted reactors with different ~;~rs.
. Bomeff, J. and H. Kunte. Carci~c Subs~ in gate amd Soil xIx- ~ Effect of Sewage Purification on PAH. Arch. Byg. B~3kt. 151, 2flZ (1967). As refe~__~ by Har~, R., Perry, R. and ;/ellings, R. in Water Research _9, 331 (1975). Data from spen,c~ry reference not available.

and to use that data for the comparative analysis. EPA made the alternative
approach data available for comment. After considering public comments on
this approach and on the data to be used, EPA has decided in the final rule to
use certain pilot- and bench-scale data when adequate full-scale POTW data are
lacking. These alternative data were used for seven pollutants, and four of
these pollutants were found to pass-through.
EPA d i s a g r e e s with the comment tha t i t must assume pass - th rough in the
absence of q u a n t i t a t i v e da ta t o ' t h e con t r a ry . Sec t ion 307(b) of the Act
r e q u i r e s EPA to p r o m u l g a t e p r e t r e a t m e n t s tandards " fo r those p o l l u t a n t s which
are determined not to be s u s c e p t i b l e t o ' t r e a t m e n t by (.the POTW) or which would
i n t e r f e r e with the ope ra t i on of such t rea tment works." Thus, at l e a s t one
reasonable interpretation of the statute is that EPA must make a determination
of pass-through or interference prior to promulgating pretreatment standards,
r a t h e r than assume pass - th rough . In any event , the s t a t u t e does not p r o h i b i t
the use of bench- or p i l o t - s c a l e da ta when they are the best a v a i l a b l e da ta .
C e r t a i n l y , EPA has a p r e f e r ence for f u l l - s c a l e POTW data and has expended
considerable resources to obtain such data for the 0CPSF rulemaking. However,
to address remaining full-scale POTW data gaps, EPA believes that it is
appropriate to use the be%.t alternative information available. Some industry
commenters objected that the alternative data are of lesser quality than the
full-scale POTW data and have a larger range of potential error. EPA acknow-
ledges that this may be the case with estimates not based on pilot- or bench-
scale studies. However, EPA believes that the pilot- or bench-scale data used
for the seven pollutants for which pass-through is evaluated for this rule-
making are of sufficient technical quality to use in the comparative analysis
and may thus be used in the absence of adequate full-scale POTW data. Fur-
ther, EPA does not agree that the use of a 5 or 10 percent differential to
compare BAT and POTN removal efficiencies is compelled when using alternative
data. As discussed previously, any error in the data, whether full-scale or
not, can affect results in either direction.
Finally, the Agency has retained the override of the pass-through analy-
sis results for three volatile pollutants where the overall percent removal .
includes in substantial part the emission of these pollutants to air rather
VI-37

than actual treatment. As discussed in Section VIII, EPA has decided to
regard these three pollutants (hexachlorobenzene, hexachloroethane, and hexa-
chlorobutadiene), as passing through the POTW due to volatilization and thus
warranting promulgation of pretreatment standards.
Table VI-II presents the results of the final PSES pass-through analysis
for the 59 toxic pollutants being regulated under the non-end of pipe biologi-
cal subcategory (BAT Subcategory TWo). Based on the results of this final
analysis, 47 toxic pollutants have been determined to pass-through POTWs and
thus require regulation under PSES and PSNS. Summaries of the results for
pollutants not regulated are presented in Tables VI-12 through VI-16.
The Agency performed an additional PSES pass-through analysis, which used
the same methodology as discussed above except that OCPSF percent removals
were calculated using the end-of-pipe biological (BAT Subcategory One) per-
formance data base. The results of this alternative pass-through analysis
(presented in Table VI-8) show that a total of 47 toxic pollutants pass
through. Because the final PSES are based upon physical-chemical treatment
(including in-plant biological treatment for certain organic pollutants),
unlike the proposed PSES which were based upon biological treatment, the final
pass-through analysis calculated OCPSF percent removals based upon the per-
formance required by BAT Subcategory Two (non-end-of-pipe biological treat-
ment). This ensured that PSES would be required only if the PSES limits
(which are based upon BAT Subcategory Two limits) would result in percent
removals exceeding those achieved by POTWs. These results are reflected in
Table VI-7. The six toxic pollutants, listed in Table VI-12, could not be
evaluated by the PSES pass-through analysis because estimated volatilization
rates are low and POTW percent removal data could not be obtained. An analy-
sis was conducted of pollutant loading estimates for these pollutants at indi-
rect, full response OCPSF facilities revealed that the toxic pollutants 2,4-
dinitrophenol, benzo(k) fluoranthene, and acenapthylene would be treated by an
appropriate in-plant control installed on the same waste streams for other
toxic pollutants that have been determined to pass through. Table VI-14 pre-
sents the results of this analysis. Therefore, the Agency has decided to
exclude three of these toxic pollutants from regulation under PSES and PSNS on
the basis of Paragraph 8(a) (iii)(4) of the Settlement Agreement since they
VI-38

TABLE VI-ll. FORTY-SEVEN TOXIC POLLUTANTS DETERMINED TO INTERFERE WITH, INHIBIT,
OR PASS-THROUGH POTWS, AND REGULATED UNDER PSES AND PSNS
Pol lu tant Name
Acenaphthene Benzene Carbon Tet rachlor lde Chlorobenzene 1,2,4-Trichlorobenzene Hexachlorobenzene 1,2-Dichloroethane 1 ,1 ,1-Tr ichloroethane Hexachloroethane 1,1-Dichloroethane 1 ,1 ,2-Tr ichloroethane Chloroethane Chloroform 192-Dichlorobenzene 1,3-Dichlorobenzene 1,4-Dichlorobenzene 1,1-Dichloroethylene 1,2-Trans-Dichloroethylene 1,2-Dichloropropane 1,3-Dichloropropylene 2,4-Dimethylphenol Ethylbenzene Fluoranthene Methylene Chloride Methyl Chloride Hexachlorobutadiene Naphthalene Nitrobenzene 2-Nitrophenol 4-Nitrophenol 4,6-Dinitro-O-Cresol Phenol Bis(2-Ethylhexyl)Phthalate DI-N-Butyl Phthalate Diethyl Phthalate Dimethyl Phthalate Anthracene Fluorene Phenanthrene Pyrene Tetrachloroethylene Toluene Trichloroethylene Vinyl Chloride Cyanide Lead Zinc
BASED ON TABLE VII-7
Reason For Regulation
Pass-through Comparison @ I0 x MDL Pass-through Comparison @ I0 x MDL Pass-through Comparison @ I0 x MDL Pass-through Comparison @ I0 x MDL Pass-through Comparison @ I0 x MDL Volatilization Pass-through Comparison @ I0 x MDL Pass-through Comparison @ I0 x MDL Volatilization Pass-through Comparison @ 20 ppb Pass-through Comparison @ 20 pph Pass-through Comparison @ 20 ppb Pass-through Comparlson @ i0 x MDL Pass-through Comparlson @ I0 x MDL Pass-through Comparlson @ 20 ppb Pass-through Comparlson @ 20 ppb Pass-through Comparlson @ i0 x MDL Pass-through Comparlson @ 20 ppb Pass-through Comparlson @ i0 x MDL Pass-through Comparlson @ 20 ppb Pass-through Comparlson @.20 ppb Pass-through Comparlson @ i0 x MDL Pass-through Comparlson @ 20 ppb Pass-through Comparison @ I0 x MDL Pass-through Comparison @ 20 ppb Volatilization Pass-through Comparlson @ i0 x MDL Pass-through Comparlson @ iO x MDL Pass-through Comparlson @ 20 ppb Pass-through Comparlson @ 20 pph Pass-through Comparlson @ I0 x MDL Pass-through Comparlson @ I0 x MDL Pass-through Comparlson @ lO x MDL Pass-through Comparlson @ 20 ppb Pass-through Comparlson @ 20 ppb Pass-through Comparlson @ 20 ppb Pass-through Comparlson @ I0 x MDL Pass-through Comparlson @ 20 ppb Pass-through Comparlson @ I0 x MDL Pass-through Comparlson @ I0 x MDL Pass-through Comparlson @ I0 x MDL Pass-through Comparlson @ I0 x MDL Pass-through Comparlso n @ I0 x MDL Pass-through Comparlson @ I0 x MDL Pass-through Comparlson @ I0 x MDL Pass-through Comparlson @ I0 x MDL Pass-through Comparlson @ i0 x MDL
VI-39

TABLE VI-12. SIX TOXIC POLLUTANTS DETERMINED NOT TO INTERFERE WITH, INHIBIT, OR PASS-THROUGH POTWs, AND EXCLUDED
FROM REGULATION UNDER PSES AND PSNS
Benzo(A)Anthracene Benzo(A)Pyrene Chrysene Chromium Copper N icke l
TABLE VI-13. SIX TOXIC POLLUTANTS THAT DO NOT
VOLATILIZE EXTENSIVELY AND DO NOT HAVE POTW PERCENT REMOVAL DATA
Acrylonitrile Bis(2-Chloroisopropyl)Ether 2,4-Dinitrophenol 3,4-Benzofluoranthene Benzo(K)Fluoranthene Acenaphthylene
VI-40

TABLE VI-14. RESULTS OF PSES ANALYSIS TO DETERMINE IF TOXIC
POLLUTANT REMOVALS WERE "... SUFFICIENTLY CONTROLLED BY EXISTING TECHNOLOGIES ..."
P o l l u t a n t P o l l u t a n t Number Name
Percent of plants at which the pollu- tant is adequately treated or costed due to presence of another similarly
treatable toxic pollutant
3 42 59 74 75 77
Acrylonitrile Bis(2-ChloroisoprOpyl)Ether 2,4-Dinltrophenol 3,4-Benzofluoranthene Benzo(k)Fluoranthene Acenaphthylene
39% 50% 100% ,
100% 87%
* Analysis could not be performed
VI-41

TABLE VI-15. THREE TOXIC POLLUTANTS EXCLUDED FROM PSES AND PSNS
REGULATION UNDER PARAGRAPH 8(a)(iii) OF THE SETTLEMENT AGREEMENT BECAUSE THEY WERE "... SUFFICIENTLY
CONTROLLED BY EXISTING TECHNOLOGIES ..."
2,4-Dinitrophenol Benzo(K)Fluoranthene Acenaphthylene
TABLE VI-16. THREE POLLUTANTS RESERVED FROM REGULATION UNDER
PSES AND PSNS DUE TO LACK OF POTW PERCENT REMOVAL DATA
Acrylonitrile Bis(2-Chloroisopropyl)Ether 3,4-Benzofluoranthene
VI-42

will be "...sufficiently controlled by existing technologies." The Agency has
also decided to reserve the three remaining toxic pollutants from regulation
under PSES and PSNS in addition to the seven pollutants shown in Table VI-6
(see Tables VI-15 and VI-16, respectively).
VI-43

SECTION VI
REFERENCES
6-1 APHA, AWWA AND WPCR, STANDARD METHODS FOR EXAMINATION OF WATER AND WASTEWATER, 4 T" EDITION, WASHINGTON, DC, APHA, 19076, P. 549
6-2 Ibid., p. 94
6-3 Ibid., p. 516, 517, 519, 521.
6-4 Ibid., p. 554
6-5 Ibid., p. 534
VI-44

VII. CONTROL AND TREATMENT TECHNOLOGIES
A. INTRODUCTION
This section identifies and describes the principal Best Management
Practices (BMPs) and in-plant and end-of-pipe wastewater control and treatment
technologies currently used or available for the reduction and removal of
conventional, nonconventional, and priority pollutants discharged by the OCPSF
industry. Many OCPSF plants have implemented programs that combine elements
of BMPs, In-plant wastewater treatment, and end-of-pipe wastewater treatment
to minimize pollutant discharges from their facilities. Due to the diversity
of the OCPSF industry, the configuration of these controls and technologies
differs widely from plant to plant.
BMPs are in-plant source controls and general operation and maintenance
(O&M) practices that prevent or minimize the potential for the release of
toxic pollutants or hazardous substances to surface waters or POTWs (7-1).
The following pages describe these in-plant source controls (i.e., process
modifications; instrumentation; solvent recovery; and water reuse, recycle,
and recovery) and O&M practices that are employed, or could potentially be
employed, at OCPSF plants.
Physical/chemical in-plant treatment technologies are used selectively in
the OCPSF industry on certain process wastewaters to recover products or
process solvents, to reduce loadings that may impair the operation of a
biological treatment system, or to remove certain pollutants that are not
sufficiently removed by biological treatment systems. The in-plant treatment
technologies currently used or available to the OCPSF industry and available
performance data for these technologies are described and presented in Part C
of this section.
End-of-pipe treatment systems in the OCPSF industry employ physical,
biological, and physical/chemical treatment, and often consist of a
combination of primary (neutralization and settling), secondary (biological
high rate aeration and clarification), polishing, and/or tertiary (ponds,
filtration, or activated carbon adsorption) unit operations. The end-of-pipe
VII-I

treatment t e c h n o l o g i e s c u r r e n t l y used or a v a i l a b l e to the OCPSF i n d u s t r y and
a v a i l a b l e performance data for these t e c h n o l o g i e s are d e s c r i b e d and presented
in Part D o f t h i s s e c t i o n .
The performance of selected BPT and BAT total treatment systems,
including nonbiological treatment systems, are presented in Part E of this
section. Wastewater discharge or disposal methods (other than direct to
surface waters and indirect through POTWs) used by OCPSF plants, frequently
called zero or alternate discharge methods, are presented in Part F. Part G
presents treatment and disposal options for the sludges resulting from certain
wastewater treatment operations. Finally, Part H presents the procedures used
to develop the effluent limitations guidelines and standards for the OCPSF
industry.
The Environmental Protection Agency (EPA) developed three technology
options for promulgating BPT. BPT Option I consists of biological treatment,
which usually involves either activated sludge or aerated lagoons, followed by
clarification (and preceded by appropriate process controls and in-plant
treatment to ensure that the biological system may be operated optimally).
Many of the direct discharge facilities have installed this level of treat-
ment. BPT Option II is based on Option I with the addition of a polishing
pond to follow biological treatment. BPT Option III is based on multimedia
filtration as an alternative basis (in lieu of BPT Option II polishing ponds)
for additional total suspended solids (TSS) control after biological
treatment.
EPA has selected BPT Option I--biological treatment with secondary
clarification--as the technology basis for BPT limitations controlling BOD 5
and TSS for the OCPSF industry. This option has been previously described by
EPA as "biological treatment." However, a properly designed biological treat-
ment system includes "secondary clarification" which usually consists of a
clarifier following the biological treatment step of activated sludge, aerated
lagoons, etc. The rationale for the selection of BPT Option I as the basis
for the final BPT effluent limitations is discussed in detail in Section IX.
VII-2

EPA developed three final options for BAT effluent limitations. BAT
Option I would establish concentration-based BAT effluent limitations for
priority pollutants based on using BPT-level biological treatment for the
end-of-pipe biological treatment subcategory. Since some plants do not have
sufficient BOD S in their wastewater to support (or require)biological
treatment, there is a non-end-of-pipe biological treatment subcategory. The
plants in this subcategorY do not use end-of-pipe biological treatment; their
BAT Option I treatment involves in-plant controls that consist of physical/
chemical treatment and in-plant biological treatment to achieve toxic
pollutant limitations, with end-of-pipe TSS control if necessary.
BAT Option II would establish concentration-based BAT effluent
limitations based on the performance of the end-of-pipe treatment component
(biological treatment for the end-of~pipe biological treatment subcategory and
physlcal/chemical for the non-end-of-pipe biological treatment subcategory),
plus in-plant control technologies that remove priority pollutants prior to
discharge to the end-of-pf~e treatment system. The in-plant technologies
include steam stripping to remove selected volatile and semivolatile (as
defined by the analytical methods) priority pollutants, activated carbon for
various base/neutral priority pollutants, chemical precipitation for metals,
alkaline chlorination for cyanide, and in-plant biological treatment for
removal of se lected p r i o r i t y po l lu tan t s , including several polynuclear
aromatics (PNA), several phthala te es te r s , and phenol.
BAT Option III adds activated carbon to the end-of-pipe treatment to
follow biological treatment or physical/chemical treatment in addition to the
BAT Option II level of in-plant controls.
The Agency has selected Option II as the basis for BAT limits for both
subcategories. The rationale for the selection of BAT Option II as the basis
for the final BAT effluent limitations for both subcategories is discussed in
detail in Section X.
The Agency is promulgating PSES for all indirect dischargers based on the
same technology basis as the BAT non-end-of-pipe biological treatment
subcategory. The rationale for selection of this technology basis for the
final PSES effluent limitations guidelines is discussed in ~ection XII.
VII-3

A review of waste management practices and well-designed and -operated
wastewater treatment system configurations currently in use by the OCPSF
manufacturing facilities, reveals that there are numerous approaches for
implementing effective pollutant control practices. Since the Agency does not
specify what technology must be used to achieve the promulgated numerical
effluent limitations and standards, the following portions of this section
describe the unit operations and treatment practices that provide the bases of
the selected technical options, as well as alternative unit operations and
treatment systems that may also be utilized to achieve pollutant reduction
goals. As noted in Section VIII, the Agency's methodology for estimating the
engineering costs of compliance for individual facilities is based on costing
one or more of the treatment unit operations included in the selected
technology option, depending on the difference between current effluent pollu-
tant concentrations and target effluent concentrations that would be required
to achieve compliance with regulatory requirements.
B. BEST MANAGEMENT PRACTICES
Best Management Practices (BMPs) consist of a variety of procedures to
prevent or minimize the potential for the release of toxic pollutants or
hazardous substances to surface waters or POTWs (7-1). Specific practices
that limit the volume and/or contaminant concentration of polluted waste
streams, such as solvent recovery, water reuse, and various pretreatment
options, involve applying BMPs to facility design. O&M procedures such as
preventive maintenance measures, monitoring of key parameters, and equipment
inspections that minimize the potential for unit process failures and
subsequent treatment plant upsets are also considered part of BMPs. The
following discussion is divided into two parts: in-plant source controls
(i.e., process modifications; instrumentation; solvent recovery; and water
reuse, recycle, and recovery) and general O&M practices. Several specific
examples of how wastewater treatment plants improved their performances
through minor modifications are also included.
I. In-Plant Source Controls
In-plant source controls include processes or operations that reduce
pollutant discharges within a plant. Some in-plant controls reduce or
VII-4

eliminate waste streams, while others recover valuable manufacturing
by-products.
In-plant controls provide several advantages: income from the sale of
recovered material, reduction of end-of-pipe treatment costs, and removal of
pollutants that upset or inhibit end-of-pipe treatment processes (7-2).
While many newer chemical manufacturing plants were designed to reduce
water use and pollutant generation, improvements can often be made in older
plants to control pollution from their manufacturing activities. The major
in-plant source controls that are effective in reducing pollutant loads in the
OCPSF industry are described below.
a. Process Modifications
Most manufacturers within the OCPSF industry use one or more toxic prior-
ity pollutants in various stages of production. In some cases, problems per-
taining to a difficult-to-treat pollutant can be solved by finding less toxic
or easier to treat substitutes for that compound. In many cases, a suitable
substitute can be found at no or minor additional cost.
In some situations, plants can improve their effluent quality by shifting
from batch processes to continuous operations, thus eliminating the waste-
waters generated between batches by cleanup with solvents or caustic. Such
modifications increase production yields and reduce wastewater generation.
Effluent quality at a facility can sometimes be improved by taking advan-
tage of'unused equipment or by simply reconfiguring existing equipment and
structures. Some plant-specific approaches are as follows:
Floor drains l ikely to receive sp i l l s can be designed to flow into a collection sump instead of directly into an industrial sewer system. This allows concentrated wastes to be recovered, treated, or equalized prior to being pumped or transferred to the wastewater treatment plant.
Highly acidic or basic waste streams can be neutralized or diluted by being mixed together upstream of the wastewater treatment plant.
VII-5

• Unused tanks at a facility can be fitted to intercept shock loadings and allow concentrated pollutants to be gradually mixed in with process wastewater at a high dilution rate. Excess tank or lagoon capacity can also be used to increase detention times and improve equalization of wastewaters.
• An abandoned steam stripper from a closed process line can be con- verted for use in treating in-plant waste streams containing volatile organic chemical compounds.
• Preheating or cooling waste streams designated for biological treat-ment can also be a great asset as activated sludge systems generally perform better at optimum temperatures, provided that the temperature can be consistent]y maintained.
Two examples of process modifications from other industries may be appli-
cable to the OCPSF industry. The first involves biological degradation.
Although anaerobic digestion is common at the mesophilic temperature of 30°C,
use of thermophilic digestion has gained popularity of late because of poten-
tially increased solids destruction. New York City, in its wastewater treat-
ment operation, conducted thermophilic digestion directly after mesophilic
digestion. This has led to increased sludge solids destruction, and when
employed with increased decanting, has led to a reduction in sludge volume and
more efficient operation (7-3).
Another modification involves the use of a step-feed operating program.
Having a variety of feed points enables the protection of effluent quality
while steps are taken to correct malfunctions in the biological treatment
process.
b. Instrumentation
Process upsets resulting in the discharge of products, raw materials, or
by-products are important sources of pollution in the OCPSF industry. Well-
designed monitoring, sensor, and alarm systems can enable compensatory action
to be taken before an unstable condition results in such process upsets.
Some common parameters that can be monitored and controlled using various
types of sensors and equipment include flow (both open channel and closed
conduit), pump speed, valve position, and tank level. Analytical measurements
such as pH, dissolved oxygen (DO), suspended solids, and chemical residuals
Vll-6

can also be monitored and regulated using feedback control equipment. At many
f a c i l i t i e s , the o v e r p r e s s u r i z a t i o n of r e a c t i o n k e t t l e s , the bu r s t ing of
r u p t u r e - d i s k s , and the d ischarge of chemical p o l l u t a n t s could be c o n t r o l l e d
with a proper ea r ly warning system.
c. Solvent Recovery
The recovery of waste solvents has become a common practice among plants
using solvents in their manufacturing processes. In some cases, solvents can
be recovered in a sufficiently pure form to be used in the same manner as new
solvents. Solvents of lesser quality may still be usable in other areas of
manufacturing or be sold to another facility for use in applications not
requiring a high level of purity. Also, many private companies exist that
collect and reclaim spent solvents which are then sold back to the same or
other OCPSF facilities.
Solvents that cannot be recovered or reused can be destroyed through
incineration. Incineration may also be the best disposal method for used
solvents that cannot be economically recovered and for wastes such as bottoms
from solvent recovery units.
Solvent recovery, off-site reclaiming, reuse, and incineration are
methods of removing solvents from waste streams before they arrive at an end-
of-pipe treatment system or a POTW. Therefore, they contribute to protecting
biological treatment units from toxic shocks which could cause poor effluent
quality. In addition, as the cost for disposal of hazardous liquid waste
increases, solvent recovery becomes more economical.
d. Water Reuse, Recycle, and Recovery
Water conservation through reuse, recycle, and recovery can result in
more efficient manufacturing operations and a significant reduction in indus-
trial effluent requiring treatment. Recycling cooling water through the use
of cooling towers is a common industrial practice that dramatically decreases
total discharge volume. While noncontact cooling water may require little or
no treatment prior to recycling (other than reducing the water temperature in
cooling towers and adding corrosion inhibitors), treatment of the wastewater
VII-7

prior to reuse is usually necessary to ensure a return stream of sufficient
quality for use in the process. In some cases, the treatment required is
simple, and facilities may already exist on-site (e.g., sedimentation).
By reducing the volume of wastewater discharged, recycling often allows
the use of abatement practices that are uneconomical on the full waste stream.
Further, by allowing concentrations to increase, the opportunities for recov-
ery of waste components to offset treatment cost (or even achieve profitabil-
ity) are substantially improved. In addition, pretreatment costs of process
water (and in some cases, reagent use) may be reduced. For example, removal
efficiencies for metals in chemical precipitation units are increased at
higher raw waste concentrations and proper chemical coagulant dosage. More
economical recovery of solvents is obtained from a properly designed steam
stripper at elevated solvent feed levels. Recycling also enables many plants
to achieve zero discharge, eliminating the need for ultimate disposal or
surface discharge.
Recycling systems can achieve significant pollutant load reductions or
zero discharge at relatively low cost. The systems are easily controlled by
simple instrumentation, and relatively little operator attention is required.
The most important design~arameter is the recycle rate (rate of return) to
the process stream or blowdown rate from closed loop recycle systems to avoid
build-up of dissolved solids.
Recycling limitations include the potential for plugging and scaling of
the process lines and excessive heat build-up in the recycled water which may
require cooling prior to reuse. Chemical aids are often Used in the recycle
loops to inhibit scaling or corrosion.
Other approaches to reducing industrial discharge volumes include equip-
ment modifications and separation of stormwater and process wastewater. The
use of barometric condensers can result in significant water contamination,
depending upon the nature of the materials entering the discharge water
streams. As an alternative, several plants use surface condensers to reduce
hydraulic or organic loads. Water-sealed vacuum pumps can also create water
pollution problems. These problems can be minimized by using a water recircu-
lation system to reduce the amount of water being discharged.
VII-8

Separation of stormwater and process wastewater enables each waste stream
to receive only the treatment required, and prevents problems caused by large
volumes of stormwater being contaminated by process wastewater, which sub-
sequently requires specialized treatment. If stormwater contains polluted
runoff from contaminated areas of a site, it may be possible to collect the
stormwater in retention basins and then gradually blend it in with process
wastewater in an equalization basin at the beginning of the wastewater treat-
ment cycle. ~
2. O p e r a t i o n and Main tenance (O&M) P r a c t i c e s
Many O&M p r a c t i c e s min imize t he p o t e n t i a l f o r u n i t p r o c e s s f a i l u r e s and
s u b s e q u e n t t r e a t m e n t p l a n t u p s e t s . I n s p e c t i o n s o f t h o s e a s p e c t s o f s i t e
o p e r a t i o n t h a t have t he h i g h e s t p o t e n t i a l f o r u n c o n t r o l l e d c h e m i c a l r e l e a s e s
s h o u l d be c o n d u c t e d by q u a l i f i e d m a i n t e n a n c e or e n v i r o n m e n t a l e n g i n e e r i n g
s t a f f members. C o n s t r u c t i o n r e c o r d s s h o u l d be r ev i ewed to a s s u r e t h a t u n d e r -
g round t a n k s and p i p e s have c o a t i n g s o r c a t h o d i c p r o t e c t i o n to i n h i b i t
c o r r o s i o n . S t o r a g e t anks and p i p e l i n e s s h o u l d be r e g u l a r l y i n s p e c t e d f o r
l e a k s , c o r r o s i o n , d e t e r i o r a t i o n o f f o u n d a t i o n or s u p p o r t s , p i t t i n g , c r a c k s ,
d e f o r m a t i o n , o r any o t h e r a b n o r m a l i t i e s . Seams, r i v e t s , n o z z l e c o n n e c t i o n s ,
v a l v e f u n c t i o n and p o s i t i o n , and any a s s o c i a t e d a n c i l l a r y equ ipmen t s h o u l d
a l s o be i n s p e c t e d r e g u l a r l y to check f o r d e t e r i o r a t i o n as w e l l as p o t e n t i a l
l e a k s from human e r r o r ( e . g . , v a l v e no t c l o s e d , l o o s e p i p e c o n n e c t i o n s ) .
T r a i n i n g i s i m p o r t a n t to a s s u r e t h a t an o p e r a t o r r e a c t s p r o p e r l y to u p s e t
c o n d i t i o n s . T r e a t m e n t p l a n t p e r s o n n e l s h o u l d r e c e i v e o n - t h e - j o b and c l a s s r o o m
t r a i n i n g c o v e r i n g t he f u n d a m e n t a l t h e o r i e s o f w a s t e w a t e r t r e a t m e n t , s p e c i f i c
i n f o r m a t i o n abou t t he equ ipment in use a t t h a t f a c i l i t y , t he n a t u r e o f
m a n u f a c t u r i n g p r o c e s s e s and p o t e n t i a l f o r u p s e t , and p r e a r r a n g e d p r o c e d u r e s
f o r r e s p o n d i n g to u p s e t c o n d i t i o n s . P l a n t s w i t h o p e r a t i o n a l f l e x i b i l i t y may
be a b l e to compensa t e to some d e g r e e f o r sudden changes in w e a t h e r c o n d i t i o n s
o r i n f l o w volume and q u a l i t y by a d j u s t i n g f a c t o r s such as h y d r a u l i c r e t e n t i o n
t imes and c l a r i f i e r o v e r f l o w r a t e s t h r o u g h a l t e r i n g r e c y c l i n g r a t e s , p u t t i n g
backup u n i t s o n - l i n e , o r d i r e c t i n g e x c e s s w a s t e w a t e r to a h o l d i n g b a s i n u n t i l
f low r a t e s r e t u r n to no rma l . In a d d i t i o n , m a n u f a c t u r i n g p e r s o n n e l u p s t r e a m of
a t r e a t m e n t p l a n t s h o u l d be t r a i n e d in the p r o p e r d i s p o s a l o f was te c h e m i c a l s
VII-9

and the restrictions associated with disposal of wastes in industrial sewers
or storm drains.
Facilities handling a wide range of chemicals should be particularly
sensitive to potential problems arising from incompatible materials mixing in
tanks or pipelines. Monitoring storm sewers and industrial sewers on a
regular basis for toxic and hazardous pollutants is useful in identifying
potential misuse of sewers or evidence of infiltration of industrial wastes.
This type of internal housekeeping helps to reduce the potential for uncon-
trolled releases from a facility or shock loadings to an on-site treatment
plant.
At some facilities, waste treatment operations can be improved by
bringing in private contractors to handle some or all facets of operations.
Contractors experienced in treatment plant operations may have greater avail-
able technical resources to draw from than typical plant personnel in the
event of an operational problem. For example, a company specializing in
sludge handling may be able to improve that aspect of treatment plant
operations with a higher level of expertise and a lower cost than plant
personnel. In addition, a contractor operating several treatment plants may
be able to reduce costs for all facilities through bulk purchasing of
chemicals and pooling parts inventories.
If properly applied, certain O&M practices can compensate for cold
weather temperatures. Plants operating in cold weather conditions must
recognize that unnecessary storage of wastewater prior to treatment may reduce
the temperature of the biotreatment system. Cold weather operation may
require insulation of treatment units, covering of open tanks, and/or tracing
of chemical feed lines. Maintenance of higher mixed liquor suspended solids
(MLSS) concentrations and a reduced food-to-microorganism (F/M) ratio may be
necessary. Plant-specific techniques are presented in the summer/winter
discussion in the secondary treatment technology section.
VII-lO

C. IN-PLANT TREATMENT TECHNOLOGIES
i. Introduction
In-plant treatment is directed toward removing certainpollutants from
segregated product/process waste streams before these waste streams are com-
bined with the plant's remaining wastewaters. In-plant technologies, usually
designed to treat toxic or priority pollutants, could often be used for
end-of-pipe treatment of the plant's combined waste streams. Using these
technologies on segregated internal waste streams is usually more cost-
effective, since treatment of low volume, concentrated, and homogenous waste
streams generated by specific product/processes is more efficient.
In-plant treatment is frequently employed to protect the plant's end-
of-pipe treatment by removing the following types of pollutants (7-2):
• Pollutants toxic or inhibitory to biological treatment systems
• Biologically refractive pollutants
• High concentrations of specific pollutants
• Pollutants that may offer an economic recovery potential (e.g., sol- vent recovery)
• Pollutants that are hazardous if combined with other chemicals down- stream
• Pollutants generated in small volumes in remote areas of the plant
• Corrosive pollutants that are difficult to transport.
Many technologies have proven effective in removing specific pollutants
from the wastewaters produced by OCPSF plants. The selection of a specific
in-plant treatment scheme depends on the nature of the pollutant to be
removed, and on engineering and cost considerations.
The frequency of in-plant treatment technologies in the OCPSF industry is
presented in Table VII-I. This information was compiled from the 546 OCPSF
manufacturers that responded to all three parts of the Section 308 Question-
naire and the 394 Part A plants that responded to only Part A of the Section
308 Questionnaire. OCPSF manufacturers are defined as "full-response" if
VII-II

T..ARI R VII-I. ~ OF 1N-PI2Cr ~ Tf~C~IflTr~ IN ~BE
OCPSF tNIJS'IRY LISTED BY MO~ OF DIS(]~R~ AND TYPE OF Qt~-TIO~l@aXE ~
Direct - Indirect Other Discharge, Total
# of Fuli-Resp # of Part A # of F~ll-Resp # of Part A # of Full-Resp # of Part A Plants With Plants With Plants With Plants With Plants With Plants With # of Plants With
Treatment Technology Tech. Tech. Tech. Tech. Tech. Tech. Technology
Cyanide Destruction 2 3 2 3 0 1 ii
Chemical Precipitation 19 13 6 12 0 0 50
Oh~um Reduction 2 3 I 5 0 0 ii
Air Stripping 3 1 4 0 0 0 8
Steam Stripping 50 12 17 2 1 0 82
I Solvent Extraction 13 4 8 3 1 0 29
Ion Exe~ 3 2 0 1 0 1 7
Ca~ Msorption 1 7 4 5 1 1 0 18
Distillation 35 13 14 9 0 1 72
Ommical Oxidation 2 7 2 6 3 0 1 19
Filtration ~ 17 ii 16 9 0 1 54
~Ihese teetmologies are also t e r t i a ry treatment technologies and are d i seased further in Section D.
2 (h~!ea l oxidation is discussed in the section on cyanide destruction.

ove r 50 p e r c e n t o f t h e i r t o t a l p l a n t p r o d u c t i o n i n c l u d e s OCPSF p r o d u c t s ; i f
t hey t r e a t t h e i r OCPSF w a s t e w a t e r s in a s e p a r a t e t r e a t m e n t sy s t em; o r i f o n l y
one t r e a t m e n t s y s t e m i s employed , t he non-OCPSF v a s t e w a t e r s c o n t r i b u t e l e s s
t han 25 p e r c e n t o f t he t o t a l p r o c e s s f low. P a r t A p l a n t s a r e t h o s e t h a t meet
t he d e f i n i t i o n of b e i n g ze ro d i s c h a r g e r s o r do no t meet t he f u l l - r e s p o n s e
r e q u i r e m e n t s s t a t e d above as d i r e c t o r i n d i r e c t d i s c h a r g e r s . The 1983 S e c t i o n
308 Q u e s t i o n n a i r e r e q u e s t e d i n f o r m a t i o n on the p l a n t ' s g e n e r a l p r o f i l e
( P a r t I ) ; d e t a i l e d p r o d u c t i o n i n f o r m a t i o n ( P a r t I I ) ; and w a s t e w a t e r t r e a t m e n t
t e c h n o l o g y , d i s p o s a l t e c h n i q u e s , and a n a l y t i c a l d a t a summaries ( P a r t I I I ) .
I n - p l a n t c o n t r o l s f r e q u e n t l y used by OCPSF p l a n t s f o r t he t r e a t m e n t o f
individual waste streams include steam stripping (82 plants), distillation
(72), filtration (54), chemical precipitation (50), solvent extraction (29),
and carbon adsorption (18).
This section presents a general description and performance data for
selected in-plant treatment processes that are currently used or that may be
applicable to treat wastewaters from the OCPSF industry. General descriptions
of the treatment technologies are based largely upon material found in the EPA
Treatability Manual, most recently revised in February 1983 (EPA-600/2-82-
001a). Performance data specific to various technologies are derived from
four sources. The first source is OCPSF data compiled from responses to the
1983 OCPSF Section 308 Questionnaire, responses to the Supplemental Question-
naire sent to 84 facilities, and data collected by EPA in several sampling
studies previously detailed in Section V. The second source is data obtained
from other point source categories found in EPA technical development
documents and the Treatability Manual. The third source is data submitted as
part of public comments on the proposal and NOAs. Technical literature serves
as the final source of performance data.
2. Chemical Oxidation (Cyanide Destruction)
Oxidation is a chemical reaction process in which one or more electrons
are transferred from the chemical being oxidized to the chemical initiating
the transfer (the oxidizing agent). The primary function performed by oxida-
tion is detoxification. For instance, oxidants are used to convert cyanide to
VII-13

the less toxic cyanate or completely to carbon dioxide and nitrogen. Oxida-
tion has also been used for the removal of phenol and organic residues in
wastewaters and potable water. Oxidation can also be used to assure complete
precipitation, as in the oxidation of iron from the ferrous (Fe +2) to the
ferric (Fe +3) form where the more oxidized material has a lower solubility
under the reaction conditions. Cyanide destruction (the oxidation of cyanide
to carbon dioxide and nitrogen) is a form of chemical oxidation and will be
used to illustrate the oxidation process, which is discussed in detail below.
Cyanide Destruction. Chlorine in elemental or hypochlorite salt form is
a strong oxidizing agent in aqueous solution, and is used in industrial waste
treatment facilities primarily to oxidize cyanide. Chemical oxidation equip-
ment often consists of an equalization tank followed by two reaction tanks,
although the reaction can be carried out in a single tank. The cyanide alka-
line chlorination process uses chlorine and a caustic to oxidize cyanides to
cyanates and ultimately to carbon dioxide and nitrogen. The oxidation
reaction between chlorine and cyanide is believed to proceed in two steps, as
follows:
(I) CN- + Cl 2 = CNCI + Ci-
(2) CNCI + 2OH- = CNO- + Cl- + H20
The cyanates can be further decomposed into nitrogen and carbon dioxide by
excess chlorination:
(3) 2CNO- + 4OH-+ 3Ci 2 = 6Ci- + 2C02 + N 2 + 2H20
According to the Section 308 Questionnaire data base, 30 OCPSF plants use
chemical oxidation as an in-plant treatment technology; of these, ii plants
use chemical oxidation for cyanide destruction. Performance data for chemical
oxidation are not available for the OCPSF industry. However, data for cyanide
destruction from the metal finishing industry are available, and can be
applied to the OCPSF industry as discussed in detail later in this section and
in Tables VII-2 and VII-3.
Vll-14

TABLE VII-2. OXIDATION OF CYANIDE WASTES WITH OZONE
Plant #30022 (mg/l)
Day 1 Day 2 Day 3
Removal Removal Removal Efficiency Efficiency Efficiency
Parameter In Out (%) In Out (%) In Out (%)
Cyanide, Total 1.4 .113 92 .30 .03 87 2.4 .096 96 H
I Cyanide, Amenable 1.4 .II0 92 .30 .039 87 2.389 .096 96
Source: Development Document for Effluent Limitations Guidelines New Source Performance Standards for the Metal Finishing Point Source Category, June 1983.

TABLE VII-3.
PERFORMANCE DATA FOR TOTAL CYANIDE OXIDATION USING CHLORINATION
Adjusted Average Total CN
Plant ID Effluent Concentration (mg/l)
12065 0.14
21051 0.0
38051 0.0
06075 0.039
36623 0.103
19050 0.031
20079 17.54
05021 0.035
20078 0.083
20080 0.949
15070 0.323
33073 0.707
09026 0.119
31021 0.708
33024 0.204
Source: Development Document for Effluent Limitations Guidelines
New Source Performance Standards for the Metal Finishing
Point Source Category, June 1983.
VII-16

As shown in Table VII-2, removal efficiency for plant #30022 using ozone
as an oxidant varies between 87 and 96 percent. The oxidation of cyanide
using ozone results in high capital and energy costs, and its efficiency is
limited when treating wastewaters containing more than one pollutant. Cyanide
can also be destroyed using hydrogen peroxide, but this results in high energy
costs because the wastewater must be heated prior to treatment. Furthermore,
peroxide only partially oxidizes cyanide to cyanate, and the addition of a
formaldehyde catalyst results in a higher strength (BOD s level) wastewater.
Results of cyanide oxidation using chlorination from a number of metal
finishing plants can be seen in Table VII-3. Average effluent cyanide
concentrations range from 0.0 (plant #21051) to 17.54 mg/1 (plant #20079).
EPA indicated in its December 8, 1986, Notice that it was considering
using the performance data for cyanide destruction from the metal finishing
industry to develop cyanide limitations and standards. These data are based
on alkaline chlorination (a type of chemical oxidation). Public comments on
this notice suggested that EPA should transfer cyanide destruction performance
data from the pharmaceutical manufacturing industry rather than from the metal
finishing industry because of the similarity in wastewater characteristics
shared by the OCPSF and pharmaceutical categories. EPA has evaluated the
pharmaceutical cyanide destruction performance data and has rejected transfer
of these data for use in the development of OCPSF cyanide limitations because
the cyanide destruction performance data from the pharmaceutical industry are
from a cyanide hydrolysis system that utilizes high temperatures and pressures
to hydrolyze free cyanide; this particular type of cyanide destruction tech-
nology has not yet been demonstrated to be effective on OCPSF cyanide-bearing
wastewater. EPA believes that the cyanide destruction by alkaline chlor-
ination data from the metal finishing industry are more appropriate for
transfer to the OCPSF industry since this technology is used on cyanide waste
streams in the OCPSF industry.
Another significant issue raised concerning the use of alkaline
chlorination technology in the OCPSF industry was the contention that while
this technology may effectively reduce concentrations of free cyanide in OCPSF
wastewaters, it cannot reduce concentrations of metal-complexed cyanides.
VII-17

Industry commenters have stated that the limitations and standards should be
for amenable cyanide only. EPA has evaluated the expected amount of cyanide
complexing resulting from the presence of certain transition metals (i.e.,
nickel, copper, silver, and cobalt in OCPSF cyanide-bearing waste streams),
and has concluded that only cyanide complexed by copper, silver, or nickel
could present a problem for treatment by alkaline chlorination. However,
silver is found at such low levels in the process wastewater of so few
product/processes that cyanide complexing would not present a problem, and
only a limited number of product/process waste streams would contain combina-
tions of either copper and cyanide (four sources), or nickel and cyanide (two
sources). For these six product/process sources, a potential for cyanide
complexing is present. However, no data have been submitted to demonstrate
that the actual levels of complexing interfere with the ability of the plant
to meet the total cyanide limitations. Thus, EPA believes that limitations and
standards controlling total cyanide are appropriate for all dischargers
subject to this regulation. A discussion identifying the sources of cyanide
and the product/processes with a potential for complex formation with nickel
and copper are contained in Section V of this document.
3. Chemical Precipitation
Chemical precipitation is a principal technology used to remove metals
from OCPSF wastewaters. Most metals are relatively insoluble as hydroxides,
sulfides, or carbonates, and can be precipitated in one of these forms. The
sludge formed is then separated from solution by physical means such as sedi-
mentation or filtration. Hydroxide precipitation is the conventional method
of removing metals from wastewater. Most commonly, caustic soda (NaOH) or
lime (Ca(OH) 2) is added to the wastewater to adjust the pH to the point where
metal hydroxides exhibit minimum solubilities and are thus precipitated.
Sulfide precipitation has also been demonstrated to be an alternative to
hydroxide precipitation for removing metals from certain wastewaters.
Sulfide, in the form of hydrogen sulfide, sodium sulfide, or ferrous sulfide,
is added to the wastewater to precipitate metal ions as insoluble metal
sulfides. Carbonate precipitation, while not used as frequently as hydroxide
VII-18

or sulfide precipitation, isanother method of removing metals from waste-
water. A carbonate reagent such as calcium carbonate is added to the waste-
water to precipitate metal carbonates. The solubility of metal hydroxides and
sulfides as a function of pH is shown in Figure VII-I. The solubility of most
metal carbonates is between hydroxide and sulfide solubilities.
Chemical precipitation has proven to be an effective technique for
removing many industrial wastewater pollutants. It operates at ambient
conditions and is well suited to automatic control. Hydroxide precipitation
has been used to remove metal ions such as antimony, arsenic, chromium,
copper, lead, mercury, nickel, and zinc; Sulfide precipitation has mainly
been used to remove mercury, lead, and silver from wastewater, with less
frequent use to remove other metal ions. Carbonate precipitation has been
used to remove antimony and lead from wastewater. To achieve maximum
pollutant removals, chemical precipitation should be carried out in four
phases: I) addition of the chemical to the wastewater; 2) rapid (fiash)
mixing to distribute the chemical homogeneously into the wastewater; 3) slow
stirring to promote particle growth by various coagulation mechanisms
(flocculation); and 4) clarification (or sedimentation or filtration) to
remove the flocculated solid particles.
The use o f c h e m i c a l p r e c i p i t a t i o n t e c h n o l o g y as w e l l as the a v a i l a b i l i t y
o f p e r f o r m a n c e d a t a may be l i m i t e d f o r s e v e r a l r e a s o n s . F i r s t , t r e a t a b l e raw
was t e c o n c e n t r a t i o n s Of p r o d u c t / p r o c e s s s o u r c e s o f p r i o r i t y p o l l u t a n t m e t a l s
a r e no t p r e v a l e n t t h r o u g h o u t the i n d u s t r y . F u r t h e r m o r e , p l a n t s t h a t g e n e r a t e
p r o c e s s s o u r c e s o f m e t a l s and p l a n t s t h a t u t i l i z e i n - p l a n t c h e m i c a l p r e c i p i -
t a t i o n u n i t o p e r a t i o n s a l s o t end to r e l y on c o - d i l u t i o n o f m e t a l - b e a r i n g
v a s t e s t r e a m s by n o n - m e t a l - b e a r i n g p r o c e s s w a s t e w a t e r as w e l l as i n c i d e n t a l
m e t a l r emova l s i n e n d - o f - p i p e t r e a t m e n t s y s t e m s . F i f t y OCPSF p l a n t s in t he
S e c t i o n 308 Q u e s t i o n n a i r e d a t a base r e p o r t u s i n g c h e m i c a l p r e c i p i t a t i o n as an
i n - p l a n t t r e a t m e n t t e c h n o l o g y ; however , v e r y few f a c i l i t i e s r e p o r t e d i n - p l a n t
c h e m i c a l p r e c i p i t a t i o n p e r f o r m a n c e d a t a .
Second, s u l f i d e p r e c i p i t a t i o n t e c h n o l o g y may g e n e r a t e t o x i c hydrogen
s u l f i d e and may r e s u l t in d i s c h a r g e s o f w a s t e w a t e r s c o n t a i n i n g r e s i d u a l l e v e l s
o f s u l f i d e . The g e n e r a t i o n of t o x i c hydrogen s u l f i d e can be c o n t r o l l e d by
VII-19

10 2 ~. \ \ ~ / / "
Pb (CH) 2 / C r (OH)3
1o 0 \ Ag (CH)
'~ 10 .2
N\\~. \ V \ \ / .Ni (CH) 2
Cd (CH) 2
o ._m
N==
o c
._o l,aE 4dP
¢ o(J
10 .4
10"6
10-8
.
\ \
~
ZnS
CdS
S
10-1o
10-12
0 I i
1
i !
2 I 3
I 4
I 5
I 6
: 7
', 8
I 9
I 10
I 11
I 12
I 13
I 14
F i g u r e V I I - l : S o l u b i l i t y as a
o f M e t a l F u n c t i o n
H y d r o x i d e s o f p H
a n d S u l f i d e s
Source: Treatability Manual. 1981.
VII 20

maintaining the pH of the solution between 8 and 9.5. The discharge of waste-
waters containing sulfide can be controlled by carefully monitoring the amount
of sulfide added.
Third, in some instances, chemical precipitation may be limited by inter-
ference of chelating agents and complexed metal ions. Because of the varying
stabilities Of metal complexes and the wide variety of organic ligands in
OCPSF wastewaters, each plant with highly stable complexes has adapted or
should adapt its treatment system to control the concentrations of the metals
present in its process wastewater. Thus, control options for complexed
metals, and the degree to Which control is necessary or cost-effective, are
unique to individual plants.
Several of the strategies employed by the OCPSF industry for treating
complexed metals in process wastewater are as follows:
Destabilize the complex by chemically reducing the metal's valence to zero. The released non-ionic metal is insoluble and can be captured via agglomeration with other solids that are being separated from the wastewater. Reductive destablllzatlon is also effected by electro- plating, in which case the metal is captured on the cathode.
Destabilize the complex by degrading the organic ligand. The released metal is then captured ~s an insoluble salt by subsequent addition of a reagent (e.g., llme, caustic, or sodium sulfide). In special cases, ion exchange could be used to capture the metal ion.
C a p t u r e t he m e t a l d i r e c t l y from the complex t h r o u g h t he a d d i t i o n of a r e a g e n t ( e . g . , sodium s u l f i d e to a coppe r complex) t h a t forms an exceedingly insoluble salt of the metal.
C o n c e n t r a t e t he w a s t e w a t e r ( e . g . , in an e v a p o r a t o r ) beyond t he t y p i -c a l l y l i m i t e d s o l u b i l i t y o f t he m e t a l - d y e complex , so t h a t i t and o t h e r s o l i d s s e p a r a t e as a s l u d g e .
Use carbon adsorption technology to capture the complexed metal from the wastewater via the organic ligand, which will adsorb on the carbon as if it were not complexed.
Specific examples of the abovementioned precipitation technologies are
detailed below:
• Plant 1647. Complexed copper (cuprous, +2) in a dyestuff process wastewater could not be precipitated effectively in a plant's combined
VII-21

wastewater by lime addition. The segregated wastewater from the dyestuff process was pretreated with sodium borohydride. Although relatively expensive, the pretreatment destabilized the complex by reducing the metal ion to copper (0), which was no longer amenable to complexation by the organic ligand. Since copper (0) is insoluble, the plant was then able to effectively remove the metal from the combined wastewater via agglomeration with other solids precipitated by the lime addition.
Plant 1593. Copper (+2) and trivalent chromium (+3) are complexed with organic ligands in metallized dyes manufactured at the plant. The product is captured as a presscake on a plate-and-frame filter. The filtrate, together with wastewater from floor drains and other processes, is segregated into dilute and concentrated wastewater. Concentrated wastewater is concentrated still further in an evaporator, where most of the complexed metals separate as a residue which is sent to a surface impoundment. Condensed overhead from the evaporator and the dilute wastewater from a surge lagoon (flow equalization), neither of which now contains concentrations of complexed metals above their toxic thresholds, are combined as influent to a powdered activated carbon (PAC) biological treatment system.
Prior to segregating the dilute and concentrated wastewaters, the combined process wastewater flow had to be pretreated with activated carbon columns to protect the biota from the toxic effects of metals released after complexing organic ligands had been biodegraded. Since most of the combined flow was dilute wastewater that did not contain complexed metals at toxic levels, the treatment system was modified to segregate the concentrated wastewater for pretreatment to eliminate the carbon column. Substantial operating cost savings were achieved by these modifications.
Plant 1572. Cadmium (+2) chelated with an unknown organic ligand is used as a catalyst in a reactor. Reactor washout is treated with sodium hydrosulfide to form a cadmium sulfide precipitate directly from the complexed cadmium. The solids are captured by centri- fugation, and the centrifugate is passed through a rapid sand filter to capture any fines.. The solids from the centrifuge are saved and are available to the plant as a cadmium reclaiming option with the catalyst supplier.
Plant 1769. Two organometallic products, tetraethyl lead (TEL) and tetramethyl lead (TML), are produced at this plant. Although the chemical bonding in organometallics differs from the metallized dye complexes discussed previously, the treatment technology is the same in principle. After adjusting the wastewater to a pH of 8 to I0 with dilute sulfuric acid, sodium borohydride is added to reduce the ethyl groups to ethane by hydride transfer. The released lead (+4) then reacts with water to precipitate lead dioxide, which is captured in a clarifier. The lead dioxide is recycled to refiners, which regenerate the lead for sale to the market.
Vli-22

Plant 2447. This plant manufactures oil-soluble dialkyl dithio- carbamates and water-soluble dithiocarbamates of antimony, cadmium, nickel, lead, and zinc. The metals in this plant's wastewater are not present as stable complexes but as ~ salts of organic acids. This example is given only to illustrate the wide variety of treatment strategies used by the OCPSF industry to control metals.
Since metal dithiocarbamates have low solubility in water, a precipitating reagent is readily available that is effective for con- trolling these metals in the wastewater. The wastewater is generated in batches as washout from mixing tanks and reactors, and is collected in a storage tank. Depending on the characteristics of the batch, the plant will either incinerate the waste, or route it to the wastewater treatment system. Treatment consists of adding sodium dithiocarbamate to precipitate the metals, and a coagulant (ferrous sulfate) to aid settling of the solids in a clarifier.
Wastewaters from the OCPSF industries generally do not contain high con-
centrations of metal ions. Rayon and certain acrylic fibers manufacturing,
however, generate elevated levels of zinc in wastewaters. Other industrial
processes may also have metals in their wastewaters due to. use of metals in
chemical processing and as trace contaminants from raw materials and
equipment.
In the December 8, 1986, Federal Register Notice of Availability, the
Agency proposed to establish limitations for metals from OCPSF plants with and
without end-of-pipe biological treatment in-place for BAT and PSES based upon
the use of hydroxide precipitation data from several metals industries. For
OCPSF waste streams with complexed metals, EPA proposed the use of sulfide
precipitation to achieve the same limitations.
Industry commenters strongly criticized several aspects of EPA's proposed
approach. First, they argued that most priority pollutant metals are not
present in significant quantities in OCPSF wastewaters. They criticized the
data base upon which EPA had estimated loadings for these pollutants. They
argued that these pollutants resulted not from OCPSFprocesses, many of which
do not use metals, but rather from non-process wastewaters (e:g., zinc and
chromium used as corrosion inhibitors and often contained~in cooling water
blowdown) or due to their presence in intake waters. The commenters concluded
that EPA should regulate only those metals present in OCPSF process waste-
waters as a result of the process use of the metals, applying the limits to
those wastewaters only.
Vli-23

To address these comments, EPA has conducted a detailed analysis of the
process wastewater sources of metals in the 0CPSF industry. In response to
criticism that EPA has relied too heavily on limited Master Process File
metals data, EPA reviewed the responses to the 1983 Section 308 Questionnaire
to examine which metals were used as catalysts in particular 0CPSF product/
processes, or were for other reasons likely to be present in the effluent from
these processes. When necessary, EPA contacted plant personnel for additional
information. The results of EPA's analysis, together with supporting documen-
tation, are set forth in Section V of this document.
Based upon this analysis, EPA has concluded that chromium, copper, lead,
nickel, and zinc are discharged from OCPSF process wastewaters at frequencies
and levels that warrant national control. However, EPA agrees that many 0CPSF
wastewaters do not contain these pollutants or contain them only at insignif-
icant levels. At most plants, process wastewater flows containing these
metals constitute only a small percentage of the total plant 0CPSF process
wastewater flow. As a result, end-of-pipe data obtained by EPA often do not
reflect treatment but rather reflect the dilution of metal-bearing process
wastewater by nonmetal-bearing wastewater. Thus, these data are unreliable
for the purpose of setting effluent limitations reflecting the use of best
available technology. Consistent with the comments, EPA has decided to focus
its regulations on metal-bearing process wastewaters only.
The concentration limitations are based upon the use of hydroxide
precipitation technology, which is the standard metals technology that forms
the basis for virtually all of EPA's BAT metals limitations for metal-bearing
wastewaters. Because very little OCPSF data on the effectiveness of hydroxide
precipitation technology are available, EPA has decided to transfer data for
this technology from the metal finishing industry point source category. A
comparison of the metals raw waste data from the metal finishing industry
data base with the validated product/process 0CPSF raw waste data indicates
that the concentrations of the metals of concern are generally within an
acceptable range of concentrations found at metal finishing plants, except for
lead. Table VII-4 presents this comparison of available OCPSF and metal
finishing raw waste metals concentrations. With respect to lead, some OCPSF
plants' raw waste concentrations exceed the range of metal finishing raw waste
Vli-24

TABLE Vll-4. COMPARISON OF OCPSF AND METAL FINISHING
RAW WASTE METALS AND CYANIDE CONCENTRATIONS
Metal Finishing Range of Effluent Long-
Range of OCPSF Metal Finishing Term Average Raw Wast~ Concen- Raw Waste Concentration
Parameter trations- (mg/l) Concentrations (mg/l) (mg/l)
Total Chromium (119) 0.200-0.799 0.650-393.000 0.572
Total Copper (120) 0.100-14.500 o.88o- Io8 .0oo . . . . . o.815
Total Cyanide (121) 0.140- 5200.000 0. 045-1680. 000 0. 180
Total Lead (122) 50.060-218.9002 0. 052-9. 701 0. 197 r
Total Nickel (124) 0.270-4.000 1.070-167~000 0.942
Total Zinc (128) 3 0.400-20.000 0.630-175.000 0.549
IOCPSF raw w a s t e c o n c e n t r a t i o n d a t a a r e l i m i t e d to d a t a f rom t he M a s t e r P r o c e s s F i l e f o r o n l y p r o d u c t / p r o c e s s e s t h a t a r e v a l i d a t e d p r o c e s s s o u r c e s o f metals.
20CPSF raw waste concentration data for lead are from two validated product/ processes that occur at the same plant. These values Compare to the raw waste concentrations for a lead battery manufacturing facility (identified as plant #672 in the battery manufacturing industry study). The lead battery plant raw waste concentration range was 2.21 to 295 mg/l for lead; its effluent long-term average concentration (after lime/hydroxide precipitation) was 0.131 mg/l. The effluent data ranged from 0.01 to 0.81 mg/l.
,. 't
3Excludes raw waste zinc concentrations from rayon and acrylic fiber m a n u f a c t u r e r s .
VII-25

concentrations. A comparison was made between the available OCPSF raw waste
concentrations and the data from the lead battery subcategory of the battery
manufacturing point source category. This comparison~ as noted in Table
VII-4, shows that the battery manufacturing lead raw waste concentrations
encompass the range of OCPSF raw waste concentrationmo Since hydroxide
precipitation achieves lead effluent concentrations at battery manufacturing
facilities that are as good as or better than those demonstrated by metal
finishing plants, EPA believes that transfer of metel finishing lead data is
appropriate.
In addition, the metal finishing wastewater matrices contain organic
compounds that are used as cleaning solvent~ and plating bath additives. Some
of these compounds serve as complexing agents, and their presence is reflected
in the metal finishing industry data base. This data base contains hydroxide
precipitation performance results from plants with waste streams from certain
operations (electroless plating, immersion plating, or printed circuit board
manufacturing) containing complexing agents. This is important because the
data base reflects both treatment of waste streams containing complexing
agents and segregation of these waste streams prior to treatment.
The transfer of technology and limitations from the metal finishing
industry is further supported by the theory of precipitation. Given suffi-
cient retention time and the proper pH (which is frequently achieved by the
addition of a lime hydroxide), and barring the binding up of metals in unusual
organic complexes (see discussion below), a metal exceeding its solubility
level in water can be removed to a particular concentration (i.e., the
effluent can be treated to a level approaching solubility for each constituent
metal). This is a physical/chemical phenomenon that is relatively independent
of the type of wastewater, barring the presence of complexing agents.
Some product/processes do have wastewaters that contain organic compounds
that bind up the metals in stable complexes that are not amenable to optimal
settling through the use of lime. EPA asked for comments in the December 1986
Notice on the use of sulfide precipitation in these situations. Industry
commenters argued that the effectiveness of this technology has not been
demonstrated for highly stable, metallo-organic chemicals. EPA agrees.
Vli-26

Strongly complexed priority pollutant metals are used or created, for
instance, in the manufacture of metal complexed dyestuffs (metallized dyes) or
metallized organic pigments. The most common priority pollutant metals found
in these products are trivalent chromium and copper. The degree of complexlng
of these metals may vary among different product/processes. Consequently,
each plant may need to use a different set of unique technologies to remove
these metals. Thus, metals limits are not set by this regulation and must be
established by permit writers on a case-by-case basis for certain product/
processes containing complexed metals. These product/processes are listed in
Appendix B to the regulation and in Table X-5.
The list in Table X-5 has been compiled based upon the analysis
summarized in Section V of this document. EPA has concluded that all other
metal-bearing process wastewaters (whether listed in Table X-5 or established
as metal-bearing by a permit writer) can be treated using hydroxide
precipitation to the levels set forth in the regulation.
As noted previously, since certain manufacturers of rayon and acrylic
fibers have significantly higher raw waste zinc concentrations than any other
OCPSF process wastewaters, the lime precipitation performance data received
from the subject facilities are only applicable to certain types of processes.
Table VII-5 presents a summary of zinc raw waste concentration data and lime
precipitation performance data from three rayon facilities, as well as one
acrylic fibers plant that uses a zinc chloride/solvent process. Acrylic
fibers facilities using the zinc chloride/solvent process have been combined
with rayon facilities for the purpose of establishing BAT zinc limitations
because ,of their high raw waste zinc concentrations. By comparing the raw
waste concentrations and resulting effluent concentrations for zinc in Tables
VII-4 and VII-5, the fairly distinct differences in the two data sets are
obvious.
4. Chemical Reduction (Chromium Reduction)
R e d u c t i o n i s a chemica l r e a c t i o n p r o c e s s in which one or more e l e c t r o n s
a r e t r a n s f e r r e d to the chemica l be ing reduced from the chemica l i n i t i a t i n g the
t r a n s f e r ( t h e r e d u c i n g a g e n t ) . The major a p p l i c a t i o n o f chemica l r e d u c t i o n
VII-27

P l a n t No. Plant Type
63 Rayon
387 Rayon
1012 Acrylic Fibers
1774 Rayon
TABLE VII-5. RAW WASTE AND TREATED EFFLUENT ZINC CONCENTRATIONS FROM RAYON
AND ACRYLIC FIBERS MANUFACTURING
Average Average Inf].uent Zinc No. of Effluent Zinc Concentration of Influent Concentration
(mg/l) Observations (mg/l)
143.471 365 3.847
13;5. 257 354 2.198
287. 686 363 2.291
15.570 346 2.409
No. of Effluent
Observations
253
258
358
346
VII-28

i n v o l v e s the t r e a t m e n t of chromium was t e s . To i l l u s t r a t e the r e d u c t i o n
p r o c e s s , the c o n v e r s i o n of h e x a v a l e n t chromium to t r i v a l e n t chromium (chromium
r e d u c t i o n ) i s d i s c u s s e d below.
Chromium R e d u c t i o n . A common chemica l used in i n d u s t r i a l p l a n t s f o r the
r e d u c t i o n of chromium i s s u l f u r d i o x i d e . Chemical r e d u c t i o n equipment u s u a l l y
c o n s i s t s of one r e a c t i o n tank where gaseous s u l f u r d i o x i d e i s mixed wi th the
w a s t e w a t e r . The r e d u c t i o n occu r s when s u l f u r o u s a c i d , produced th rough the
r e a c t i o n of s u l f u r d i o x i d e and wa te r , r e a c t s wi th chromic a c i d as f o l l o w s :
(i) 3SO 2 + 3H20 = 3H2SO 3
(2) 3H2SO 3 + 2H2CrO 4 = Cr2(S04) 3 + 5H20
According to the Section 308 0uestionnaire data base, ii OCPSF plants use
chromium reduction as an in-plant treatment technology.
5. Gas Stripping (Air and Steam)
Stripping, in general, refers to the removal of relatively volatile com-
ponents from a wastewater by the passage of air, steam, or other gas through
the liquid. The stripped volatiles are usually processed further by recovery
or incineration.
Stripping processes differ according to the stripping medium chosen for
the treatment system. Air and steam are the most common media, with inert
gases also used. Air and steam stripping are described below.
Air Stripping. Air stripping is essentially a gas transfer process in
which a liquid containing dissolved gases is brought into contact with air and
an exchange of gases takes place between the air and the solution. In
general, the application of air stripping depends on the environmental impact
of the resulting air emissions. If sufficiently low concentrations are
involved, the gaseous compound can be emitted directly to the air. Otherwise,
air pollution control devices may be necessary.
VII-29

The exchange of g a s e s t akes p l a c e in the s t r i p p i n g tower . The tower
c o n s i s t s o f a v e r t i c a l s h e l l f i l l e d wi th pack ing m a t e r i a l to i n c r e a s e the
s u r f a c e a r e a f o r g a s - l i q u i d c o n t a c t , and fans to draw a i r th rough the tower .
The towers a r e of two b a s i c t y p e s - - c o u n t e r c u r r e n t towers and c r o s s f l o w tower s .
In c o u n t e r c u r r e n t t ower s , the e n t i r e a i r f l o w e n t e r s a t the bot tom of the
tower , wh i l e the wa te r e n t e r s the top of the tower and f a l l s to the bo t tom.
In c r o s s f l o w to w er s , the a i r i s p u l l e d through the s i d e s of the tower a long
i t s e n t i r e h e i g h t , w h i l e wa te r f low p r o c e e d s down the tower .
The removal of pollutants by air stripping is adversely affected by low
temperatures, because the solubility of gases in water increases as
temperature decreases.
Steam stripping. Steam stripping is essentially a fractional
distillation of volatile components from a wastewater stream. The volatile
component may be a gas or an organic compound that is soluble in the waste-
water stream. More recently, this unit operation has been applied to the
removal of water immiscible compounds (chlorinated hydrocarbons), which must
be reduced to trace level~ because of their toxicity.
Steam stripping is usually conducted as a continuous operation in a
packed tower or conventional fractionating distillation column (bubble cap or
sieve tray) with more than one stage of vapor/liquid contact. The preheated
wastewater from the last exchanger enters near the top of the distillation
column and then flows by gravity countercurrent to superheated steam and
organic vapors (or gas) rising up from the bottom of the column. As the
wastewater passes down through the column, it contacts the vapors rising from
the bottom of the column. This contact progressively reduces the concen-
trations of volatile organic compounds or gases in the wastewater as it
approaches the bottom of the column. At the bottom of the column, the waste-
water is heated by the incoming steam, which also reduces the concentrations
of volatile components to their final level. Much of the heat in the
wastewater discharged from the bottom of the column can then be recovered by
preheating the feed to the column.
VII-30

Reflux (condensing a portion of the vapors from the top of the column and
returning it to the column) may be practiced if it is desired to alter the
composition of the vapor stream that is derived from the stripping column
(e.g., increase the concentration of the stripped material for recovery
purposeS). There also may be advantages to introducing the feed to a tray
below the top tray when reflux is used. Introducing the feed at a lower tray
(while still using the same number of trays in the stripper) will have the
effect of either reducing steam requirements, as a result of the need for less
reflux, or yielding a vapor stream richer in the volatile components. The
combination of using reflux and introducing the feed at a lower tray will
increase the concentration of the volatile organic components in the overhead
(vapor phase) beyond that obtainable by reflux alone and increase the poten-
tial f o r r e c o v e r y .
Stripping of the organic (volatiles) constituents of the wastewater
stream occurs because the organic volatiles tend to vaporize into the steam
until its concentration in the vapor and liquid phases (within the stripper)
are in equilibrium. The height of the column and the amount of packing
material and/or the number of metal trays along with steam pressure in the '
column generally determine the amounts of volatiles that can be removed and
the effluent pollutant levels that can be attained by the stripper. After the
volatile pollutant is extraeted from the wastewater into the superheated
steam, the steam is condensed to form two layers of generally immiscible
liquids--the aqueous and volatile layers. The aqueous layer is generally
recycled back to the steam stripper influent feed stream because it may still
contain low levels of the volatile. The volatile layer may be recycled to the
process, incinerated on-site, or contract hauled (for incineration,
reclaiming, or further treatment off-site) depending on the specific plant's
requirements.
Steam stripping is an energy-intensive technology in which heat energy
(boiler capacity) is required to both preheat the wastewater and to generate
the superheated steam needed to extract the volatiles from wastewater. In
addition, some waste streams may require pretreatment such as solids removai
(e.g., filtration) prior to stripping because accumulation of solids within
the column will prevent efficient contact between the steam and wastewater
VII-31

phases. Periodic cleaning of the column and its packing materials or trays is
a necessary part of routine steam stripper maintenance to assure that low
effluent levels are consistently achieved.
Steam strippers are designed to remove individual volatile pollutants
based on a ratio (Henry's Law Constant) of their aqueous solubility (tendency
to stay in solution) to vapor pressure (tendency to volatilize). The column
height and diameter, amount of packing or number of trays, the operating steam
pressure, and temperature of the heated feed (wastewater) are varied according
to the strippability (using Henry's Law Constant) of the volatile pollutants
to be stripped. Volatiles with lower Henry's Law Constants require greater
columnheight, more trays or packing material, greater steam pressure and
temperature, more frequent cleaning, and generally more careful operation than
do volatiles with higher strippability (7-4). Although the degree to which a
compound is stripped can depend to some extent upon the wastewater matrix, the
basis for the design and operation of steam strippers is such that matrix
differences are taken into account for the volatile compounds the Agency has
evaluated.
Since Henry's Law Constants were such important design parameters, the
Agency initially proposed that, for consolidation purposes, toxic pollutants
could be grouped into three general ranges of Henry's Law Constants termed
high, medium, and low; these groups are presented in Table VII-6. The pollu-
tants in the low Henry's Law Constant group were determined to require
treatment other than steam stripping (i.e., carbon adsorption or in-plant
biological treatment). The remaining groups were then used in the development
of steam stripping cost curves and in the transfer of steam stripping perfor-
mance data to toxic pollutants without performance data, depending on whether
they fell within the high or medium grouping. For the purposes of this docu-
ment, these groupings are designated "strippability" groups.
According to the Section 308 Ouestionnaire data base, eight OCPSF plants
report using air stripping and 82 report using steam stripping as an in-plant
treatment technology. Steam stripping performance data collected during the
EPA 12-Plant Study or submitted by industry for selected volatile organic
compounds are presented in Table VII-7. The data indicate that high removal
VII-32

High (Hi*)--2 x 10² tO 10 -1
Benzene (0.19) Carbon T e t r a c h l o r i d e (1 .0)
Chlorobenzene (0.17)
1 ,1 ,1 -T r i ch lo roe thane (0.15)
Chloroethane (0.21)
1,1-Dieh loroe thane (0.62)
Chloroform (0.14)
< Chloromethane (1.67) P~ P-d
! Vinyl Chlor ide (3.4) t ~ 1 ,1 -Dieh loroe thene (7.92)
1 ,2-Trans-Dich loroe thene (2.79)
T r i ch lo roe thene (0.379)
Te t r ach lo roe thene (0.638)
Hexachloro-1, 3-Butadiene (1.07)
Hexachlorocyclopentadiene (0.667)
Bromomethane (8.21)
Bromodichloromethane (0.I00)
Diehlorodifluoromethane (124.2)
Trichlorofluoromethane (4.58)
1,3-Dichlorobenzene (0.150)
TABLE VII-6.
HENRY'S LAW CONSTANT __(H GROUPINGSi )
Medium (Hi*)--lO -I to 10 -3 LOW (Hi*)--lO -3 to 10 -8
Acenaphthene (0.0079) Bis (2 -Chloroe thy l ) Ether (5.4 x 10 -4 )
Aerolein (0.004) 2-Chloroe thyl Vinyl Ether (1.04 x 10 -4 )
A e r y l o n i t r i l e (0.0026) Bis (2-Chloroethoxy) Methane (1.17 x 10 -s )
1 ,2-Dichloroethane (0.046) Nitrobenzene (5.46 x 10 -4 )
Hexachloroethane (0.046) 2 , 4 - D i n i t r o t o l u e n e (1.87 x 10 -4 )
1 ,1 ,2 -Tr i eh lo roe thane (0.032) 2 , 6 - D i n i t r o t o l u e n e (3.29 x 10 -4 )
1 ,1 ,2 ,2 -Te t r ach lo roe thane (0.017) Phenol (1.89 x 10 -5 )
Methylene Chlor ide (0.085) 2-Chlorophenol (4.29 x 10 -4)
1,2-Dichloropropane (0.096) 2 ,4-Dichlorophenol (1.17 x 10 -4 )
1,3-Dichloropropene (0.055) 2 ,4 ,6 -Tr i eh lo ropheno l (1.67 x 10 -4 )
Dibromochloromethane (0.041) Pentachlorophenol (1.17 x 10 -4 )
Tribromomethane (0.023) 2-Nitrophenol (3.15 x 10 -4 )
Bis(Chloromethyl)Ether (0.00875) 2 ,4 -Din i t rophenol (2.69 x 10 -s)
Bis (2-Chloro isopropyl ) Ether 2,4-Dimethylphenol (7.08 x 10 -4) (0.00458)
4-Chlorophenyl Phenyl Ether P-Chloro-M-Cresol (1.04 x 10 -4 ) (0.00912)
4-Bromophenyl Phenyl Ether Dimethyl Ph tha la t e (8.96 x 10 -S) (0.00417)
1,2-Dichlorobenzene (0.080) Die thyl Ph tha l a t e (5 x 10 -5 )
1 ,2 ,4-Tr ichlorobenzene (0.096) Di-n-Butyl Ph tha la te (1.17 x 10 -S)
Hexachlorobenzene (0.028) Di-n-Octyl Ph tha la t e (7.08 x 10 -4 )
4-Nitrophenol (0.0010) B i s (2 -E thy lhexy l ) Ph tha l a t e (1.25 x 10 -5 )

TABLE VII-6. HENRY'S LAW CONSTANT (Hi) GROUPINGS
High (HI*)--2 x 10² to i0 -l
1,4-Dichlorobenzene (0.125)
Ethylbenzene (0.275)
Toluene (0.277)
f
(Continued)
Medium (Hi*)--lO -I to 10 -3
4,6-Dinitro-o-Cresol (0.0017)
Acenaphthylene (0.0604)
Anthracene (0.0036)
Benzo (k) Vluoranthene (0.0016)
Fluorene (0.00267)
Naphthalene (O.O191)
Phenanthrene (0.0094)
Dimethyl Nitrosoamine (0.0014)
Diphenyl Nitrosoamine (0.0275)
Low (Hi*)--lO -3 to 10 -8
Butyl Benzyl Phthalate (3.46 x 10 -4 )
Benzo (a) Anthracene (4.17 x 10 -5 )
Benzo (b) Fluoranthene (5.08 x 10 -4 )
Benzo (ghi) Perylene (6 x lO -6)
Benzo (a) Pyrene (2.04 x I0 -s)
Chrysene (4.38 x lO -5)
Di-Benzo (a,h) Anthracene (3.04 x lO -6)
Fluoranthene (2.71 x l0 -4) Indeno(l,2,3-(d) Pyrene (2.89 x l0 -6)
Pyrene (2.12 x lO -4)
Di-n-Propyl Nitrosoamine (2.62 x 10 -4 )
Benzidine (1.25 x lO -5)
3,3-Dichlorobenzidine (3.33 x I0 -~)
1,2-Diphenylhydrazine (1.41 x 10⁻⁷)
*H i is expressed as the ratio of mass per unit volume in air to mass per unit volume in water (mg/m3/mg/m3).

T~. VII-7. $'IFAM SIRIPPING P~I~t~I~E [~TA
I n f l u e n t ( ~ ) m~f l~ t (ppb) Remmral Arithmetic No. Arithmetic No. Efficiency
Pollutant Plant Mean Min. Max. -Points Mean Min. Max. Points ~L ÷ (~)
mmzene (4) 0415" 35,200 22,300 48,100 2 38.8 10 80 4 10 >99 0415"* 321,667 274,000 412,000 3 200.3 134 329 3 i0 >99 2680 92,159 34,693 147 ~212 10 10 10 10 l0 10 >99 1494 819,9(~ 239 2,008,310 14 44.8 10 171 13 10 >99
G~loroethane (16) 415T 20,393 690 42,000 15 50.0 50 50 15 50 >99 913 18,292 50 47,700 6 50.0 50 50 14 50 >99
Chloroform (23) 415T 399,263 7,330 1,088,000 15 10.5 10 16 15 10 >99 913 118,667 28,700 200,000 6 129.2 10 290 14 10 >99
Methyl (~doride(45) 725 103,209 9,440 1,290,000 15 923.1 50 6,070 13 50 >99 i, l-Dichloroethane (13) 913 8,483 3,400 13,900 6 10.0 l0 I0 14 10 >99 i, 2-Dichloroethane (10) 415T 9,614,773 2,339,900 23,476,000 15 56.1 I0 374 15 I0 >99
913 259,500 172,000 327,000 6 73.3 I0 487 14 10 >99 I, l-Dichloroethylene (29) 415T 4,358 200 10,800 15 10.2 I0 13 15 10 >99
! 913 5,970 2,900 12,300 6 10.0 10 10 14 10 >99 Trans-l, 2-Dichloro- 415T 13,684 4,860 43,000 15 14.1 I0 57 15 10 >99 methylene (30) 913 36,917 14,100 70,300 6 I0.0 i0 I0 14 10 >99
Methyla~e Chloride (44) 415T 2,107 198 12,100 15 10.5 l0 18 15 10 >99 913 3,398 200 10,400 6 10.0 i0 l0 14 10 >99 725 1,306 i0 5,100 15 217.3 I0 1,120 13 10 >83
i, i, l-Trichloroethane (Ii) 913 18,417 11,900 35,000 6 I0.0 I0 i0 14 10 >99 Toluene (86) 415" 3,400 2,570 4,230 2 22.3 I0 47 4 10 99
415"* 22,600 19,300 29,000 3 12.0 I0 16 3 10 >99 TetraeAloroethylene (85) 913 55,083 10,800 241,000 6 18.4 I0 107 14 10 >99 I, I, 2-Trichloroetha~ (14) 415T 6,811 220 14,500 8 I0.0 I0 I0 15 10 >99
913 18,686 416 26,400 6 I1.2 I0 26 14 10 >99 Trichloroethylene (87) 415 1,862 59 10,300 15 16.1 I0 85 15 10 >99
913 32,583 - 22,900 52,700 6 I0.0 I0 I0 14 10 >99 Vinyl Chloride (88) 725 1,085,200 410,000 2,230,000 15 37,944.2 50 336,000 13 50 >96
913 1,767 50 3,500 6 50.0 50 50 14 50 >97
*Steam Stripper No. 2 at Plant 415. **Steam Stripper No. 3 at Plant 415. +AML is the analytical minimum level.

efficiencies (e.g., most plant-pollutant combinations are over 99~) can be
achieved for these volatile organic compounds. It should also be recognized
that most treatment systems consist of several unit processes and that addi-
tional removal of organic: compounds will likely occur, especially in systems
with biological treatment units.
Nitrobenzene performance data from two plants in the OCPSF industry that
employed steam stripping followed by activated carbon are presented in Table
VII-8. The data indicate that a high removal efficiency (e.g., approximately
99~) can be obtained for this semi-volatile organic compound by using these
two processes. However, the data shown in Table VII-9 also indicate that com-
petitive adsorption may be occurring among nitrobenzene, the dinitrotoluenes
(2,4- and 2,6-dinitrotoluene), and the nitrophenols (2- and 4-nitrophenol and
2,4-dinitrophenol) which seem to favor adsorption of nitrophenols over nitro-
benzene because of their more attractive chemical affinity to the carbon. The
nitrotoluene data are not available because matrix interferences prevented
quantitation with the analytical methods that had been used.
6. Solvent Extraction
Solvent extraction, also referred to as liquid-liquid extraction, involves
the separation of the constituents of a liquid solution by contact with
another immiscible liquid for which the impurities have a high affinity. The
separation can be based either on physical differences that affect differen-
tial solubility between solvents or on a definite chemical reaction.
The end result of solvent extraction is to separate the original solution
into two streams--a treated stream and a recovered solute stream (which may
contain small amounts of water and solvent). Solvent extraction may thus be
considered a recovery process since the solute chemicals are generally
recovered for reuse, resale, or further treatment and disposal. A process for
extracting a solute from solution will typically include three basic steps:
i) the actual extraction, 2) solvent recovery from the treated stream, and
3) solute removal from the extracting solvent. The process may be operated
continuously.
VII-36

Plant No. Pollutant
2680 Nitrobenzene
500 Nitrohenzene
H
! ~0
TABLE VII-8. STEAM STRIPPING AND ACTIVATED CARBON PERFORMANCE DATA
Influent (ppb) Effluent (ppb) Nominal Removal Arithmetic
Mean Min. Max. No.
Points Arithmetic
Mean Min. Max. No. Points
Detection Limit
Efficiency(Z)
190,386 87,000 330,000 I0 712.6 135 4900 i0 14 >99
2,848,229 14 5,460,000 35 520.3 14 9800 37 14 >99

FOR
TABLE VII-9. DAILY ACTIVATED CARBON PERFORMANCE DATA
NITROBENZENE, NITROPHENOLS, AND 4,6-DINITRO-O-CRESOL
PLANT NO. 2680T
Sampling Date
Nitrobenzene Influent Effluent
2-Nitrophenol Influent Effluent
4-Nitrophenol Influent Effluent
2,4-Dinitrophenol Influent Effluent
4,6-Dinitro-O-Cresol Influent Effluent
3/25/84 330,000 374 3,549 ND 6,603 ND 58,155 1,059 11,374 ND
3/26/84 190,000 150 2,900 ND 4,900 ND 29,500 ND 10,200 ND
3/27/84 267,160 143 2,400 5,000 - 28,700 - 10,400 -
3/28/84 309,920 330 1,400 ND 4,800 ND 30,700 1,761 9,600 ND
)==4 H ) L~ OO
3/29/84
4/01/84
4/02/84
106,995
144,860
139,530
372
140
4,900
1,475
1,740
3,719
ND
ND
ND
6,350
2,160
6,531
ND
ND
ND
37,000
56,517
30,000
237
ND
ND
11,400
9,788
10,595
ND
ND
ND
4/03/84 87,000 135 2 408 ND 1 790 ND 20,000 ND 8,713 ND
4/04/84 139,340 331 2,663 ND 1,800 ND 27,000 ND 8,885 ND
4/05/84 189,054 251 2,363 ND 1 900 ND 30,900 ND 7,622 ND

Solvent e x t r a c t i o n i s p r e s e n t l y app l ied in two main a reas : 1) the
recovery of phenol from aqueous wastes , and 2) the recovery of ha logena ted
hydrocarbon s o l v e n t s from organ ic s o l u t i o n s con t a in ing o the r w a t e r - s o l u b l e
components.
Although effective in recovering solvents and other organic compounds for
recycle and reuse, solvent extraction is not a widespread wastewater treatment
technology because effluent concentration levels that are acceptable for
recycle and reuse are generally too high for wastewater discharge. According
to the Section 308 Questionnaire data base, 29 OCPSF plants use solvent
extraction as an in-plant control or a raw material reclamation technology.
Performance data are summarized for petroleum refining and organic chemical
manufacturing plants in Volume III of the Treatability Manual. The data show
a wide variation in removal efficiency, varying from 12 to 99 percent. Most
volatile organics are removed with greater than 90 percent efficiency, but
base/neutrals show removal efficiencies generally below 75 percent.
7. Ion Exchange
Ion exchange involves the process of removing anions and cations from
wastewater. Wastewater is brought in contact with a resin that exchanges the
ions in the wastewater with a set of substitute ions. The process has four
operations carried out in a complete cycle: service, backwash, regeneration,
and rinse. The wastewater is passed through the resin until the available ex-
change sites are filled and the contaminant appears in the effluent (break-
through point). When this point is reached, the service cycle is stopped and
the resin bed is backwashed with water in a reverse direction to that Of the
service cycle. Next, the exchanger is regenerated (converted to original
form) by contacting the resin with a sufficiently concentrated solution of the
substitute ion. Finally, the bed is rinsed to remove excess regeneration
solution prior to the next service step.
Ion exchange is used in several ways. in industrial wastewaters, ion
exchange may be used to remove ammonia, arsenic, chromium, and nickel. It is
commonly used to recover rinse water and process chemicals, or to reduce salt
concentrations in incoming water sources.
VII-39

According to the Section 308 Questionnaire data base; only seven OCPSF
plants use ion exchange as an in-plant treatment technology. Based on the
limited number of OCPSF plants employing ion exchange and the absence of OCPSF
ion exchange performance data, ion exchange was not considered as a BAT or
PSES candidate technology. Performance data for ion exchange systems in the
metal finishing industry are presented in Table VII-lO. Although removal
efficiencies are greater for the electroplating and printing circuit board
plants (e.g., 91 to greater than 99%) than for plant ~11065 (e.g., zero
removal to greater than 99%), the influent pollutant concentrations are also
much greater.
8. Carbon Adsorption
Activated carbon adsorption is a proven technology primarily used for the
removal of organic chemical contaminants from individual process waste
streams. Carbon has a very large surface area per unit mass and removes
pollutants through adsorption and physical separation mechanisms. In addition
to removal of many organic chemicals, activated carbon achieves limited
removal of other pollutants such as BOD s and metals. Carbon used in a fixed
column, as opposed to being directly applied in granular or powdered form to a
waste stream~ may also act as a filtration unit.
Activated carbon can be used as an in-plant treatment technology in order
to protect downstream treatment units such as biological systems from high
concentrations of toxic pollutants that could adversely affect system
performance. In-plant activated carbon treatment also enables removal of
pollutants from low volume waste streams before the waste streams mix with and
contaminate much larger volumes of wastewater, which would be more difficult
and costly to treat.
According to the Section 308 0uestionnaire data base, 18 OCPSF plants are
known to use activated carbon as an in-plant treatment technology. Although
performance data for a specific individual in-plant carbon adsorption unit
prior to biological treatment were not available, the Agency collected
performance data from a carbon adsorption unit following steam stripping at an
OCPSF facility for which the carbon adsorption unit treated a separate process
VII-40

TABLE VII-10. TYPICAL I0N ID~[}IAN[~ ~ DATA i
Electroplating Plant Printed Circuit Board Plant Prior To After Removal Prior To After Removal Purifi- Purifi- Efficiency Purifi- Purifi- Efficiency
Parameter cation cation (Z) cation cation (Z)
Zinc (Zn) 14.8 0.40 97 - -Cadmium (Od)+ 3 5.7 0.00 100 -Chromium (Cr6) 3.1 0.01 I00 -{hromium (Cr ~ ) 7.1 0.01 100 -Copper (Cu) 4.5 0.09 98 43.0 O. i0 I00 Iron (Fe) 7.4 0.01 I00 - -Nickel (Ni) 6.2 0.00 100 1.60 0.01 99 Silver (Ag) 1.5 0.00 100 9.10 0.01 100 Tin (Sn) 1.7 0.00 100 1.10 0.10 91 Oyanide ( ~ ) 9.8 0.04 100 3.40 0.09 97
(I'k0 4.4 0.00 100 -~ Aluminum (AI) 5.6 0.20 96 - -Sulfate ($04) - = 210.00 2.00 99 I ~ (Pb) - - 1.70 0.01 99 Gold (Au) - - 2.30 0.I0 96
Plant #11065, ~ l e h was visited and sampled, employs an ion exchange unit to remove metals from rinsewater. The results of the sampling are displayed below.
P O ~ ~ 0 N (rag/l) Plant #11065
Dayl ~2 Re~val Removal
Input To Effluent From Efflcicmcy Input To Effluent From Efficiency Parameter Ion Exchange Ion Exe/mnge (Z) Ion Exchange Ion Exeharge (z)
TSS 6.0 4.0 33 1.0 1.0 0 Ou 52.080 0.118 I00 189.3 0.20 100 Ni O. 095 0.003 97 0.017 0.003 82 Cr, Total 0.043 0.051 0 0.026 0.006 77 Cd 0.005 0.005 0 0.005 0.005 0 Pb 0.O10 0.011 0 0.010 0.010 0
Source: Development Document for Effluent Limitations Guidelines New Source Perfommnce Standards for the Metal Finishing Point Source Category, June 1983.
1Concentrations in rag/1.
VII-41

waste stream prior to discharge. This unit was sampled during the EPA
12-Plant Study. This plant manufactures only interrelated products whose
similar waste streams are combined and sent to a physical/chemical treatment
system consisting of steam stripping followed by activated carbon. The toxic
pollutants associated with these waste streams are removed by either steam
stripping or activated carbon, or a combination of both.
The Agency has decided to use this available performance data from the
end-of-pipe carbon adsorption unit as the basis for establishing BAT limits
for four pollutants (2-nitrophenol, 4-nitrophenol, 2,4-dinitrophenol , and
4,6-dinitro-o-cresol), and the combination of steam stripping and activated
carbon adsorption for nitrobenzene. Table VII-If presents the performance
data for the carbon adsorption unit at this plant. These data show very good
removals (greater than 99~) for the carbon adsorption unit for 4,6-dinitro-
o-cresol, 2-nitrophenol, 4-nitrophenol, and 2,4-dinitrophenol. However, the
concentration data indicate that for 2,4-dinitrophenol and nitrobenzene the
carbon adsorption unit is experiencing competitive adsorption phenomena. As
shown in Table VII-9, this condition exists when a matrix contains adsorbable
compounds in solution that are being selectively adsorbed and desorbed.
9. Distillation
Distillation is a unit process usually employed to separate volatile
components of a waste stream or to purify liquid organic product streams. The
process involves boiling a liquid solution and collecting and condensing the
vapor, thus separating the components of the solution. The vapor is collected
in a vessel where it is condensed, resulting in a separation of materials in
the feed stream into two streams of different composition.
The distillation process is used to recover solvents and chemicals from
industrial wastes that otherwise would be destroyed by waste treatment.
Although effective in recovering solvents and other organic compounds for
recycle and reuse, distillation is not a widespread wastewater treatment tech-
nology because effluent levels that are acceptable for recycle and reuse are
generally too high for wastewater discharge. According to the Section 308
Questionnaire, 72 OCPSF plants use distillation as an in-plant control and/or
secondary product or raw material reclamation technology.
VII-42

' r . ,~t ~'. VII-11. C.,ARBflN ~ C l N ~ I~TA
PL tr #26B0r
InZtuent ~.~Duent Arithmetic No. Arithmetic I•To• Det. Removal
Pollutant (vg/i)
Mean Min. Max. Points Mean Mill. MaX. Points T.]m] t S R ffzLciency (z)
2-Ni t ~ l
4-Nitrophenol
2,4-Oinitro~l
4,6-Dinitro-o-Cresol
2,462
4,183
34,847
9,858
1,400
1,790
20,000
7,622
3,719
6,603
58,155
ll,ZK)0
I0
I0
i0
i0
20.0
50.0
373.0
24.0
20
50
50
24
1,761
9
9
9
9
~
~
~
~
> ~
> ~
>
> ~
LO

No performance data are available for distillation as a wastewater
control technology.
i0. Filtration
Filtration is a proven technology for achieving the removal of suspended
solids from wastewaters. The removal is accomplished by the passage of water
through a physically restrictive medium (e.g., sand, coal, garnet, or diato-
maceous earth) with resulting entrapment of suspended particulate matter by a
complex process involving one or more removal mechanisms, such as straining,
sedimentation, interception, impaction, and adsorption. In-plant filtration
can serve to remove suspended solids and subsequently improve the performance
of downstream treatment units that may be adversely affected by larger parti-
cles in the waste stream. In addition, filtration units can serve to collect
solids with reclamation value from specific waste streams.
According to the Section 308 Questionnaire data base, 54 OCPSF plants use
filtration as an in-plant treatment technology. Performance data for filtra-
tion as an in-plant technology were not available in the 0CPSF industry; how-
ever, performance data for hydroxide precipitation plus in-plant filtration
from the metal finishing point source category for TSS and selected metals are
presented in Table VII-12, along with the hydroxide precipitation performance
data from metal finishing for comparison purposes.
ii. Reverse Osmosis
Reverse osmosis is a pressure-driven membrane process that separates a
wastewater stream into a purified "permeate" stream and a residual "concen-
trate" stream by selective permeation of water through a semipermeable
membrane. This occurs by developing a pressure gradient large enough to
overcome the osmotic pressure of the ions within the waste stream. This
process generates a permeate of relatively pure water, which can be recycled
or disposed, and a concentrate stream containing most of the pollutants
originally present, which can be treated further, reprocessed, or recycled.
Reverse osmosis systems generally require extensive pretreatment (pH
adjustment, filtration, chemical precipitation, activated carbon adsorption)
of the wastewater stream to prevent rapid fouling or deterioration of the
membrane surface.
VII-44

TABLE VII -12 . PERFORMANCE DATA FROM HYDROXIDE PRECIPITATION AND
HYDROXIDE PRECIPITATION PLUS FILTRATION FOR METAL FINISHING FACILITIES
Hydroxide Precipitation Hydroxide Precipitation only Plus Filtration
P a r a m e t e r (mg/l) (mg/l)
Total Suspended Solids 16.8 12.8
Chromium, Total 0.572 0.319
Copper 0.815 0.367
Lead 0.051 0.031
Nickel 0.942 0.459
Zinc 0.549 0.247
Source : Development Document f o r E f f l u e n t L i m i t a t i o n s G u i d e l i n e s New Source Pe r fo rmance S t a n d a r d s f'br the Metal F i n i s h i n g Po in t Source C a t e g o r y , June 1983.
VII-45

Reverse osmosis has been used in industry for the recovery and recycle of
chemicals. Metals and other reusable materials can easily be separated from a
waste stream. Although reverse osmosis is slightly more effective than chemi-
cal precipitation for metals removal, it is very expensive and appropriate
only for low volume waste streams high indissolved solids.
12. Ultrafiltration
Ultrafiltration is a physical unit process, similar to reverse osmosis,
that is used to segregate dissolved or suspended solids from a liquid stream
through the use of semipermeable polymeric membranes. The membrane of an
ultrafilter forms a molecular screen that separates molecular particles based
on their differences in size, shape, and chemical structure. A hydrostatic
pressure is applied to the upstream side of a membrane unit, which acts as a
filter, passing small particles such as salts while blocking larger emulsified
and suspended matter. Ultrafiltration differs from reverse osmosis in the
size of contaminants passed. Ultrafiltration generally retains particulates
and materials with a molecular weight greater than 500, while reverse osmosis
membranes generally pass only materials with a molecular weight below I00.
Ultrafiltration has been used in oil/water separation and for the removal
of macromolecules such as proteins, enzymes, starches, and other organic
polymers. Ultrafiltration is presently not a widely used process but has
potential application to OCPSF wastewater treatment. Summary performance data
are available from EPA's 'Volume III Treatability Manual for the aluminum
forming, automobile and other laundries, rubber manufacturing, and timber
products processing industries and are presented in Table VII-13. The data
show a wide variation in removal efficiencies and effluent levels. An experi-
mental combined ultrafiltration and carbon adsorption system does show
promise. This system consists of powdered activated carbon suspended in
wastewater. The mixture is then pumped through 20 ultrafilter modules
arranged in two parallel trains. Heavy metal removal data for this system are
presented in Table VII-13.
VII-46

TABLE VII-13. ULTRAFILTRATION PERFORMANCE DATA FOR METALS IN LAUNDRY WASTEWATER-OPA LOCKA, FLORIDA
Parameter (mg/1) Raw Supernatant Permeate
Zinc 0.52 <0.20 <0.20
Copper 0.51 0.14 0.06
Lead 0.4 0.I 0.01
Chromium ( t o t a l ) 0.i <0.01 <0.01
Cadmium 0.03 <0.02 <0.02
Source: Van Gils, G. and M. Pirbazari. August 1986. Development of a Combined Ultrafiltration and Carbon Adsorption System for Industrial Wastewater Reuse and Priority Pollutant Removal. Environmental Progress 5(3):167-170.
Vli-47

13. R e s i n A d s o r p t i c m
Res in a d s o r p t i o n i s a p r o c e s s t h a t may be used to e x t r a c t and , i n some
c a s e s , r e c o v e r d i s s o l v e d o r g a n i c s o l u t e s from aqueous w a s t e s . Waste t r e a t m e n t
by r e s i n a d s o r p t i o n i n v o l v e s two b a s i c s t e p s : 1) c o n t a c t i n g t he l i q u i d was te
s t r e a m w i t h the r e s i n , a l l o w i n g the r e s i n to a d s o r b the s o l u t e s from the
s o l u t i o n , and 2) s u b s e q u e n t l y r e g e n e r a t i n g the r e s i n by r emoving the a d s o r b e d
c h e m i c a l s , o f t e n a c c o m p l i s h e d by s i m p l y wash ing w i t h t he p r o p e r s o l v e n t .
Re s in a d s o r p t i o n i s s i m i l a r in n a t u r e to a c t i v a t e d ca rbon a d s o r p t i o n ; t he most
s i g n i f i c a n t d i f f e r e n c e b e i n g t h a t r e s i n s a r e c h e m i c a l l y r e g e n e r a t e d w h i l e
ca rbon i s u s u a l l y t h e r m a l l y r e g e n e r a t e d , e l i m i n a t i n g t he p o s s i b i l i t y o f m a t e r -
i a l r e c o v e r y . R e s i n s g e n e r a l l y have a lower a d s o r p t i v e c a p a c i t y than c a r b o n ,
and a r e no t l i k e l y to be c o m p e t i t i v e w i t h ca rbon f o r t he t r e a t m e n t o f h i g h
volume was te s t r e a m s c o n t a i n i n g mode ra t e or h i g h c o n c e n t r a t i o n s o f mixed
w a s t e s w i t h no r e c o v e r y v a l u e .
C u r r e n t a p p l i c a t i o n s o f r e s i n a d s o r p t i o n i n c l u d e remova l o f coppe r and
chromium bo th as s a l t s and o r g a n i c c h e l a t e s , r emoval o f c o l o r a s s o c i a t e d w i t h
m e t a l complexes and o r g a n i c s , and the r e c o v e r y of p h e n o l from a was t e s t r e a m .
A c c o r d i n g to the S e c t i o n 308 Q u e s t i o n n a i r e d a t a base , no p l a n t s r e p o r t e d u s i n g
r e s i n a d s o r p t i o n . No d a t a a r e a v a i l a b l e from o t h e r i n d u s t r i e s .
14. In-Plant Biological Treatment
For certain segregated waste streams and pollutants, in-plant biological
treatment is an effective and less costly alternative to carbon adsorption for
control of toxic organic pollutants, especially those which are effectively
absorbed into the sludge and are relatively biodegradable. In-plant
biological treatment may require longer detention times and certain species of
acclimated biomass to be effective as compared to end-of-pipe biological
treatment that is predominantly designated to treat BOD s. EPA has determined
that in-plant biological treatment with an acclimated biomass is as effective
as activated carbon adsorption for removing priority pollutants such as
polynuclear aromatics (PNAs) like naphthalene, anthracene, and pyrene; phenol;
and 2,4-dimethylphenol as shown in the sampling data collected at plant #1293
of the 12-Plant Sampling Study, which are presented later in this section.
Plant #1293 is a coal tar facility with flows of less than 50,000 gallons per
VII-48

day (gpd), which generates the highest raw waste concentrations of these toxic
pollutants. Its treatment system consists of equalization, extended above-
ground aerated lagoon, and secondary clarification prior to discharge to a
POTW. This treatment system reduces the concentrations of all the above-
mentioned toxic pollutants to their respective analytical minimum levels.
After reviewing the performance data from this plant, the Agency deter-
mined that other relatively biodegradable toxic pollutants could also be
controlled by this type of dedicated biological treatment system (i.e., with a
minimum amount of dilution with other process wastewaters). This determina-
tion was made after review of performance data from selected end-of-plpe
biological treatment systems (plant #948 and #2536) receiving wastewaters
whose main toxic pollutant constituents included the following: acrylo-
nltrile, bis (2-ethylhexyl) phthalate, di-N-butyl phthalate, diethyl
phthalate, and dimethyl phthalate.
The Agency has determined that these data are appropriate for use in
characterizing the performance of In-plant biological treatment based upon the
waste stream characteristics of the influent to the treatment systems. The
selected plants generate major sources of these pollutants.
According to the Section 308 Questionnaire data base, 33 OCPSF plants
report using some form of biological treatment prior to discharge to an end-
of-pipe treatment system (direct dischargers) or POTV (indirect dischargers).
Table VII-14 presents the performance data for the three plants chosen by the
Agency to represent the performance of in-plant biological treatment.
D. END-OF-PIPE TREATMENT TECHNOLOGIES
I . Introduction
End-of-pipe treatment systems in the OCPSF industry often consist of
primary, secondary, and polishing or tertiary unit operations. In primary
treatment, physical operations are used to remove floating and settleable
solids found in wastewater. In secondary treatment, biological and chemical
processes are used to remove most of the organic matter. In polishing or
tertiary treatment, additional combinations of unit operations and processes
VII-49

VII-14. P I ~ D~TA B~qT.q FOR IN-PL~ BIOI~CAL S l ~
Influent (I~) ~nuent (ppb) Plant Arithmetic No. of Arithmetic No. of Analytical Removal
Pollutant Number Mean Min. Max. Points Mean Min. Max. Points Minimn F.fficiency Level
Acenaphtene 1293 876 513 1,516 13 10.0 10 10 15 10 >98
Acrylonitrile 2536 209,882 43,4% 414,785 15 50.0 50 50 15 50 >99
2,4-Dimethylphenol 1293 29,868 16,2_16 73,537 14 10.0 10 10 15 10 >99
Fluoranthe{~ 1293 1,572 988 2 141 14 11.5 10 27 15 10 >99
Na~thale{~ 1293 20,964 ii, 227 37 145 14 10.0 10 10 15 10 >99
Phenol 1293 836,293 698,564 978 672 13 10.0 10 10 15 10 >99
Bis(2-Ethyl Bexyl)PhthM~te %8 1,097 Ii I i 740 34 43.3 10 185 33 10 > %
lli-N-Butyl Phtl~l~ te 948 377 19 2.000 34 13.0 10 57 33 10 >%
Diethyl Phth~late 948 1,220 14 15.000 34 23.5 10 175 33 10 >98
Dimethyl Phthalate 948 134 10 625 25 I0.0 10 10 22 10 >92
B e n z o ( a ) A n ~ 1293 308 10 614 13 10.0 10 10 15 10 > %
Benzo(a)Pyrene 1293 166 10 426 13 10.3 10 15 15 10 >93
3,~fl~ranthe~ 1293 173 10 374 13 10.2 10 14 15 10 >94
Bem~(k) Fluor~tb~e 1293 146 10 352 13 10.0 10 10 15 10 >93
( ~ 1293 266 10 677 13 10.0 10 10 15 10 > %
Ace~thy~ 1293 472 191 699 13 10.0 10 10 15 10 >9?
Anthracene 1293 694 418 943 14 10.0 10 10 15 10 >98
PRuoreme 1293 1,232 678 1,873 13 10.0 10 10 15 10 >99
l~enanthre~ 1293 3,285 2,035 4,711 14 10.0 10 10 15 10 >99
Pyre~ 1293 1,023 641 1,438 14 10.3 10 15 15 10 >98

are used to remove o the r c o n s t i t u e n t s tha t are not removed by primary or
secondary t r ea tmen t . Many t echno log ies have proven e f f e c t i v e in removing
S p e c i f i c p o l l u t a n t s from the wastewaters produced by OCPSF p l a n t s . The s e l e c -
t ion of a s p e c i f i c end -o f -p ipe t rea tment scheme depends on the na tu re of the
p o l l u t a n t to be removed and on eng inee r ing and cost c o n s i d e r a t i o n s . Data on
the frequency of a p p l i c a t i o n of s p e c i f i c pr imary, secondary, and p o l i s h i n g or
t e r t i a r y end -o f -p ipe t rea tment t echno log ies are p resen ted in Tables VII-15,
VII-16, and VI i i17 , r e s p e c t i v e l y . Primary t rea tment t e chno log i e s used by the
OCPSF p l an t s to remove f l o a t i n g and s e t t l e a b l e s o l i d s , to p r o t e c t the b io log -
i c a l segment of the system from shock load ings , and to a s su re the e f f i c i e n c y
of b i o l o g i c a l t rea tment inc lude n e u t r a l i z a t i o n (365 p l a n t s ) , e q u a l i z a t i o n
(297), primary c l a r i f i c a t i o n (144), and n u t r i e n t a d d i t i o n (114). Secondary
t rea tment t echno log ie s used by OCPSF p lan t s to remove organ ic mat te r i nc lude
secondary c l a r i f i c a t i o n (174 p l a n t s ) , a c t i v a t e d s ludge (143), and a e r a t e d
lagoons (89). P o l i s h i n g or t e r t i a r y t rea tment t echno log ies used to remove
c e r t a i n c o n s t i t u e n t s not s u f f i c i e n t l y removed by the primary and secondary
systems inc lude p o l i s h i n g ponds (64 p l a n t s ) , f i l t r a t i o n (41), and carbon
adso rp t ion (21).
2. Primary Treatment Technologies
Although the f i n a l BPT, BAT, and PSES e f f l u e n t l i m i t a t i o n s g u i d e l i n e s are
not based on these primary t rea tment technologies~ many OCPSF f a c i l i t i e s u t i -
l i z e one or some combination of these t echno log ies to enhance the performance
of subsequent t rea tment s t eps ( e . g . , b i o l o g i c a l ) . The Agency encourages the
use of any of the primary t rea tment t echno log ies d i scussed to improve the
removal e f f i c i e n c y of the o v e r a l l t rea tment system.
a. E q u a l i z a t i o n
E q u a l i z a t i o n invo lves the process of dampening flow and p o l l u t a n t
c o n c e n t r a t i o n v a r i a t i o n of wastewater before subsequent downstream t r ea tmen t .
By reduc ing the v a r i a b i l i t y of the raw waste load ing , e q u a l i z a t i o n can
s i g n i f i c a n t l y improve the performance of downstream t rea tment processes tha t
are more e f f i c f e n t i f opera ted at or near uniform h y d r a u l i c , o rgan ic , and
s o l i d s load ing r a t e s and tha t reduce e f f l u e n t v a r i a b i l i t y a s s o c i a t e d with s lug
VII-51

'r.,~T R VII-I_5.
3~T 'T'HR. (X:2X:3F)]43LIS'J3:~
Treatmmt Technology
Direct
# of Full-Pesp # of Part A Plants With Plants With
Tech. Tech.
Indirect
# of Full-Resp # of Part A Plants With Plants With
Tech. Tech.
Other Discharge
# of Full-Resp # of Part A Plants With Plants With
Tech. Tech.
Total
# of Plants With Technology
Equalization 147 30 87 27 4 2 297
Nmtmiization 144 36 134 41 5 5 365
Screening 19 9 12 8 0 I 49
Grit P~moval 14 8 i0 9 0 0 41
Oil Skimming 43 19 25 24 0 0 iii
Oil S~ ration 38 13 22 ii 1 1 86 bo
API Separati~ 32 8 14 4 0 0 58
Dissolved Air 14 5 5 6 0 1 31 Flotation (DAF)
Primary Clarification 60 18 52 i0 2 2 144
Coagulation 21 6 I0 5 0 0 42
Flocculation 27 Ii 15 Ii 1 1 66
Nutrient /kldi tion ~ 83 20 6 3 1 1 114
~Nutrient addition is discussed with secar~ry treatment technologies.

VII-16. ~ OF ~ ~ ~ I _ O C m ~ -
]~1~E OC~ ~
Direct Indirect Other ms m m
# of ~]]-aesp # of Part A #of Full~ # of Part A # of Full-Resp # of Part A Plants With Plants With Plants With Plants With Plants With Plants With # .of Plants With
Treatmmnt Technology Tech. Tech. Tech. Tech. Teeh. Teeh. Technology
Activated Sludge 102 27 8 5 0 1 143
Aerated Lagoon 55 14 14 4 1 1 89
/~robic Lago~ 13 4 3 4 0 0 24
Anaerobic Lagoon 7 1 4 0 0 0 12
& t~
Rotating Biological -Qmtactors
T r i ~ . Filters
7
7
1
2
0
1
0
2
0
O
0
0
8
12
Oxidati(m Ditch ~ 1 1 -0 0 0 0 2
Pure Oxygen Activated ~ Slud~
7 0 O 1 0 0 8
Second Stage of an Indicated. Biological System
12 5 1 2 0 1 21
Powdered Activated. Carbon Addition a
7 0 0 0 0 0 7
Se~ry Clarification
127 24 14 6 1 2 174
~ll~r~ tedmologies am diseuss~ with activated sludge.
2Po~er~ activated carbon addition disoass~t in section on Operat~g, Managing, and Ur~-~_ ir~ Biological Treatment Systems.

T~R[ P, VII-17.
IN THE OCPSF ~
Direct Indirect Other Discharge Total
# of Full-Resp # of Part A # of Full-Resp # of Part A # of Full-Resp # of Part A Plants With Plants With Plants %/ith Plants With Plants With Plants With # of Plants With
Treanmmt Technology Tech. Tech. Tech. Tech. Tech. Tech. Technology
Polishing Pond 47 ]2 2 2 0 1 64
Filtration 31 6 i I 2 0 41
Carbon Adsorp ti~n 17 2 1 i 0 0 21
Second Stage of an Indicated Tertiary System
2 1 0 0 0 0 3

raw waste loadings. Equalization is accomplished in a holding tank manufac-
tured from steel or concrete, or in an unlined or lined pond. The retention
time of the tank or pond should be sufficiently long to dilute the effects of
any highly concentrated continuous flow or batch discharges on treatment plant
performance.
Equalization is reliable from both equipment and process standpoints, and
is used to increase the reliability of the flow-sensitive treatment processes
that follow by reducing the variability of flow and pollutant concentrations.
Equalization is a common treatment technology to the OCPSF industry. Accor-
ding to the Section 308 Questionnaire data base, 297 OCPSF plants use
equalization as a primary treatment technology.
b. N e u t r a l i z a t i o n
N e u t r a l i z a t i o n i n v o l v e s the p r o c e s s of a d j u s t i n g e i t h e r an a c i d i c or a
b a s i c was te s t r e a m c l o s e r to a n e u t r a l pH. N e u t r a l i z a t i o n may be accompl i shed
in e i t h e r a c o l l e c t i o n tank , r a p i d mix tank , or an e q u a l i z a t i o n tank by mixing
a c i d i c and a l k a l i n e w a s t e s , or by the a d d i t i o n of c h e m i c a l s . A l k a l i n e w a s t e -
w a t e r s a r e t y p i c a l l y n e u t r a l i z e d by add ing s u l f u r i c or h y d r o c h l o r i c a c i d , or
compressed carbon d i o x i d e . A c i d i c w a s t e w a t e r s may be n e u t r a l i z e d wi th
l i m e s t o n e or l ime s l u r r i e s , soda ash , or c a u s t i c soda. T h e s e l e c t i o n of
n e u t r a l i z i n g a g e n t s depends upon c o s t , a v a i l a b i l i t y , ea se of use , r e a c t i o n
b y - p r o d u c t s , r e a c t i o n r a t e s , and q u a n t i t i e s of s l u d g e formed. The most
commonly used c h e m i c a l s a r e l ime ( t o r a i s e the pH) and s u l f u r i c a c i d ( t o lower
the pH).
Neutralization of an excessively acidic or basic waste stream is
necessary in a variety of situations, including 1) the precipitation of
dissolved heavy metals; 2) the prevention of metal corrosion and damage to
other construction materials; 3) preliminary treatment allowing effective
operation of the biological treatment process; 4) the providing of neutral pH
water for recycle uses; and 5)the reduction of detrimental effects in the
receiving water.
VII-55

Neutralization is highly reliable with proper monitoring, control, and
proper pretreatment to control interfering substances. Neutralization is a
common treatment technology to the OCPSF industry; according to the Section
308 Questionnaire data base, 365 OCPSF plants neutralize their wastewaters.
c. Screening
Screening is the process of removing coarse and/or gross solids from
wastewater before subsequent downstream treatment, and is usually accomplished
by passing wastewater through drum- or disk~type screens. Typically, coarse
screens are stainless steel or nonferrous wire mesh with openings from 6 to
20 mm. Fine screens have openings that are less than 6 mm. Solids are raised
above the liquid level by rotation of the screen and are backflushed into
receiving troughs by high-pressure jets.
Screening has proven to be a very reliable process when properly designed
and maintained. According to the Section 308 Questionnaire data base,
49 0CPSF plants use screening as a primary treatment technology.
d. Grit Removal
Grit removal is achieved in specially designed chambers. Grit consists
of sand, gravel, cinders, or other heavy solid materials that have subsiding
velocities or specific gravities substantially greater than those of the
organic putrescible solids in wastewater. Grit chambers are used to protect
moving mechanical equipment from abrasion; to reduce formation of heavy de-
posits in pipelines, channels, and conduits; and to reduce the frequency of
digester cleaning that may be required as a result of excessive accumulations
of grit in such units.
Normally, grit chambers are designed to remove all grit particles with a
0.21 mm diameter, although many chambers have been designed to remove grit
particles with a 0.15 mm diameter. According to the Section 308 0uestionnaire
data base, 410CPSF plants use grit removal as a primary treatment process.
e. Oil Separation (Oil Skimming, API Separation)
Oil separation techniques are used to remove oils and grease from waste-
water. Oil may exist as free or emulsified oil. The separation of free oils
VII-56

and grease is accomplished by gravity, and normally involves retaining the
oily waste in a holding tank and allowing oils and other materials less dense
than water to float to the surface. This oily top layer is skimmed off the
wastewater surface by a mechanism such as a rotating drum-type or a belt-type
skimmer. Emulsified oil, after it has gone through a "breaking" step
involving chemical or thermal processes to generate free oil, can also be
separated using a skimming system.
Oil s e p a r a t i o n i s used th roughout the OCPSF i n d u s t r y to r e c o v e r o i l f o r
use as a f u e l supplement or f o r r e c y c l e , or to r educe the c o n c e n t r a t i o n of
o i l s , which r e duc e s any d e l e t e r i o u s e f f e c t s on subsequen t t r e a t m e n t or
r e c e i v i n g w a t e r s . In the OCPSF i n d u s t r y , o i l s e p a r a t i o n a l s o removes many
t o x i c o r g a n i c c h e m i c a l s ( t y p i c a l l y l a r g e n o n - p o l a r m o l e c u l e s ) t h a t tend to
c o n c e n t r a t e in o i l s and g r e a s e . However, s i n c e the removal of t h e s e t o x i c
p o l l u t a n t s i s i n c i d e n t a l to o i l s e p a r a t i o n / r e m o v a l , t h i s t r e a t m e n t p r o c e s s was
not used as the t e c h n o l o g y b a s i s fo r t h i s f i n a l r e g u l a t i o n . S t i l l , the Agency
encou rages i t s use to improve the pe r fo rmance of the o v e r a l l t r e a t m e n t sys tem
f o r removing unwanted f l o a t i n g o i l s and g r e a s e s .
According to the Section 308 Questionnaire data base, 86 OCPSF plants use
oil separation; 58 use API separation (a common gravity oil separation based
upon design standards published by the American Petroleum Institute); and
Iii practice oil skimming as a preliminary treatment technology. No OCPSF
performance data are available; however, data from the iron and steel manufac-
turing and electrical and electronic components industries are presented in
Volume III of the EPA Treatability Manual. The data show generally high
removal efficiencies for metals and toxic organics.
f. Flotation
Flotation is a process by which suspended solids, free and emulsified
oils, and grease are separated from wastewater by releasing gas bubbles into
the wastewater. The gas bubbles attach to the solids, increasing their
buoyancy and causing them to float. A surface layer of sludge forms, and is
usually continuously skimmed for disposal. Flotation may be performed in
several ways, including foam (froth), dispersed air, dissolved air, vacuum
VII-57

flotation, and flotation with chemical addition. The principal difference
between these variations is the method of gas bubbles generation.
Flotation is used primarily in the treatment of wastewater streams that
carry heavy loads of finely divided suspended solids or oil. Solids having a
specific gravity only slightly greater than water, which would require abnor-
mally "long sedimentation times, may be removed in much less time by flotation.
Thus, it is often an integral part of standard clarification.
According to the Section 308 0uestionnaire data base, 310CPSF plants
used dissolved air flotation as a primary treatment technology. No OCPSF
performance data are available. The Volume III EPA Treatability Manual
presents performance data from textile mills, pulp and paper mills, auto and
other laundries, and petroleum refineries. The data show a median removal
efficiency of 61 percent for BOD 5 and a median effluent concentration of
250 mg/l. Toxic removal efficlencies show large variations.
g. Clarification (settling, sedimentation)
Clarification is a physical proqess used to remove suspended solids from
wastewater by gravity settling. Settling tanks, clarifiers, and sedimentation
ponds or basins are designed to let wastewater flow slowly and quiescently,
providing an adequate reteption time to permit most solids more dense than
water to settle to the bottom. The settling solids form a sludge at the
bottom of the tank or basin. This sludge is usually pumped out continuously
or intermittently from settling tanks or clarifiers, or scraped out period-
ically from sedimentation ponds or basins.
Settling is used alone or as part of a more complex treatment process.
It is usually the first process applied to wastewaters containing high
concentrations of settleab]e suspended solids. Settling is also often used in
conjunction with other treatment processes such as removal of biomass after
biological treatment or removal of metal precipitates after chemical
precipitation. Clarifiers, in conjunction with chemical addition, are used to
remove materials such as dissolved solids that are not removed by simple
sedimentation (chemically ~ssisted clarifiers are discussed later in this
section under polishing and tertiary treatment).
VII-58

Clarification (or sedimentation or settling) is a common primary
treatment technology in the OCPSF industry; according to the Section 308
Questionnaire data base, 144 OCPSF plants use primary clarification.
h. Coagulation and Flocculation
Chemical coagulation and flocculation are terms often used interchange-
ably to describe the physiochemical process of suspended particle aggregation
resulting from chemical additions to wastewater. Technically, coagulation
involves the reduction of electrostatic surface charges and the formation of
complex hydrous oxides. Coagulation is essentially instantaneous in that the
only time required is that necessary for dispersing the chemicals in solution.
Flocculation is the time-dependent physical process of the aggregation of
wastewater solids into particles large enough to be separated by sedimenta-
tion.
The purpose of coagulation is to overcome electrostatic repulsive surface
forces and cause small particles to agglomerate into larger particles, so that
gravitational and inertial forces will predominate and affect the settling of
the particles. The process can be grouped into two sequential mechanisms:
@ Chemically induced destabilization of the repulsive surface-related ~ forces, thus allowing particles to stick together when contact between particles is made.
Chemical bridging and physical enmeshment between the non-repelling particles, thus allowing for the formation of large particles.
There are three different types of coagulants: inorganic electrolytes,
natural organic polymers, and synthetic polyelectrolytes.
Inorganic electrolytes are salts or multivalent ions such as alum
(aluminum sulfate), lime, ferric chloride, and ferrous sulfate. The
inorganic coagulants act by neutralizing the charged double layer of colloidal
particles and by precipitation reactions. Alum is typically added to the
waste stream as a solution. At an alkaline pH and upon mixing, the alum
hydrolyzes and forms fluffy gelatinous precipitates of aluminum hydroxide.
These precipitates, partially as a result of their large surface area, act to
Vli-59

enmesh small particles and thereby create large particles. Lime and ion
salts, as well as alum, are used as flocculants primarily because of this
tendency to form large fluffy precipitates of "floc" particles.
Natural organic polTmers derived from starch, vegetable materials, or
monogalactose act to agglomerate colloidal particles through hydrogen bonding
and electrostatic forces. These are often used as coagulant aids to enhance
the efficiency of inorganic coagulants.
S y n t h e t i c p o l T e l e c t r o l ~ t e s are polymers tha t i n c o r p o r a t e i o n i c or o the r
f u n c t i o n a l groups along the carbon chain in the molecule . The f u n c t i o n a l
groups can be either anionic (attract positively charged species), cationic
(attract negatively charged species), or neutral. Polyelectrolytes function
by electrostatic bonding and the formation of physical bridges between
particles, thereby causing them to agglomerate. These are also most often
used as coagulant aids to improve floc formation.
The coagulation/flocculation and sedimentation process entails the
following steps:
Addition of the coagulating agent to the liquid
Rapid mixing to dispense the coagulating agent throughout the liquid
Slow and gentle mixing to allow for contact between small particles and agglomeration into larger particles.
Coagulation and flocculation are used for the clarification of industrial
wastes containing colloidal and suspended solids. Coagulants are most
commonly added upstream of sedimentation ponds, clarifiers, or filter units to
increase the efficiency of solids separation. This practice has also been
shown to improve dissolved metal removal as a result of the formation of
denser, rapidly settling flocs, which appear to be more effective in absorbing
and adsorbing fine metal hydroxide precipitates. Coagulation may also be used
to remove emulsified oil from industrial wastewaters. Emulsified oil and
grease is aggregated by chemical addition through the processes of coagulation
and/or acidification in conjunction with flocculation. Performance data for
VII-60

coagulation/flocculation units are presented in the context of TSS and metals
removal in the section on chemical precipitation.
According to the Section 308 Questionnaire data base, 42 OCPSF plants
utilize coagulation and 66 OCPSF plants utilize flocculation as part of their
preliminary treatment systems.
3. Secondary Treatment Technologies
a. Activated Sludge
The activated sludge process is a biological treatment process primarily
used for the removal of organic material from wastewater. It is characterized
by a suspension of aerobic and facultative microorganisms maintained in a
relatively homogenous state by mixing or by the turbulence induced by aera-
tion. These microorganisms oxidize soluble organics and agglomerate colloidal
and particulate solids in the presence of dissolved molecular oxygen. The
process can be preceded by sedimentation to remove larger and heavier solid
particles if needed. The mixture of microorganisms, agglomerated particles,
and wastewaters (referred to as mixed liquor) is aerated in an aeration basin.
The aeration step is followed by sedimentation to separate biological sludge
from treated wastewater. The major portion of the microorganisms and solids
removed by sedimentation are recycled to the aeration basins to be recombined
with incoming wastewater, while the excess, which constitutes the waste
sludge, is sent to sludge disposal facilities.
The activated sludge biomass is made up of bacteria, fungi, protozoa, and
rotifers. The bacteria are the most important group of microorganisms as they
are responsible for stabilization of the organic matter and formation of the
biological floc. The function of the biomass is to convert the soluble
organic compounds to cellular material. This conversion Consists of transfer
of organic matter (also referred to as substrate or food) through the cell
wall into the cytoplasm, oxidation of substrate to produce energy, and
synthesis of protein and other cellular components from the substrate. Some
of the cellular material undergoes auto-oxidation (self-oxidation or
endogenous respiration) in the aeration basin, the remainder forming net
growth or excess sludge. In addition to the direct removal of dissolved
VII-61
7 ~

organics by biosorption, the biomass can also remove suspended matter and
colloidal matter. The suspended matter is removed by enmeshment in the
biological floc. The colloidal material is removed by physiochemical
adsorption on the biological floc. Volatile compounds may be driven off to a
certain extent in the aeration process. Metals are also partially removed,
and accumulate in the sludge.
The effectiveness of the activated sludge process is governed by several
design and operation variables. The key variables are organic loading, sludge
retention time, hydraulic or aeration detention time, oxygen requirements, and
the biokinetic rate constant (K). The organic loading is described as the
food-to-microorganism (F/M) ratio, or the kilograms of BOD s applied daily to
the system per kilogram of mixed liquor suspended solids (MLSS). The MLSS in
the aeration tank is determined by the rate and concentration of activated
sludge returned to the tank. The organic loading (F/M ratio) affects the BOD s
removal, oxygen requirements, blomass production, and the settleability of the
biomass. The sludge retention time (SRT) or sludge age is a measure of the
average retention time of solids in the activated sludge system. Sludge
retention time is important in the operation of an activated sludge system as
it must be maintained at a level that is greater than the maximum generation
time of microorganisms in the system. If adequate sludge retention time is
not maintained, the bacteria are washed from the system faster than they can
reproduce themselves and the process fails. The SRT also affects the degree
of treatment and production of waste sludge. A high SRT results in carrying a
high quantity of solids in the system and obtaining a higher degree of treat-
ment and also results in the production of less waste sludge. The hydraulic
detention time is used to determine the size of the aeration tank and should
be determined by use of F/M ratio, SRT, and MLSS. The biokinetic rate
constant (or K-rate) determines the speed of the biochemical oxygen demand
reaction and generally ranges from 0.I to 0.5 days -I for municipal waste-
waters. The value of K for any given organic compound is temperature-
dependent; because microorganisms are more active at higher temperatures, the
value of K increases with increasing temperatures (7-5). Oxygen requirements
are based on the amount required for BOD 5 synthesis and the amount required
for endogenous respiration. The design parameters will vary with the type of
wastewater to be treated and are usually determined in a treatability study.
VII-62

The oxygen requirement to satisfy BOD 5 synthesis is established by the
characteristics of the wastewater. The oxygen requirement to satisfy
endogenous respiration is established by the total solids maintained in the
system and their characteristics. A detailed discussion Of typical design
parameters used in the OCPSF industry and how these parameters are used in the
Agency's compliance cost estimates are presented in Section VIII.
Modifications of the activated sludge process are common, as the process
is extremely versatile and can be adapted for a wide variety of organically
contaminated wastewaters. The typical modification may represent a variation
in one or more of the keydesign parameters, including the F/M loading, aera-
tion location and type, sludge return, and contact basin configuration. The
modifications in practice have been identified by the major characteristics
that distinguish the particular configuration. The characteristic types and
modifications are briefly described as follows:
• Conventional. The aeration tanks are long and narrow, with plug flow (i.e., little forward or backwards mixing).
• Complete Mix. The a e r a t i o n tanks a r e s h o r t e r and w ide r , and the a e r a t o r s , d i f f u s e r s , and e n t r y p o i n t s of the i n f l u e n t and r e t u r n s l u d g e a r e a r r a n g e d so t h a t the w a s t e w a t e r mixes c o m p l e t e l y .
• Tapered Aeration. A modification of the conventional process in which the diffusers are arranged to supply more air to the influent end of the tank, where the oxygen demand is highest.
Step Aeration. A modification of the conventional process in which the wastewater is introduced to the aeration tank at several points, lowering the peak oxygen demand.
High Rate Activated Sludge. A modification of conventional or tapered aeration in which the aeration times are shorter, the pollutants loading s are higher per unit mass of microorganisms in the tank. The rate of BOD 5 removal for this process is higher than that of conven- tional activated sludge processes, but the total removals are lower.
Pure Oxygen. An activated sludge variation in which pure oxygen instead of air is added to the aeration tanks, the tanks are covered, and the oxygen-containing off-gas is recycled. Compared to normal air aeration, pure oxygen aeration requires a smaller aeration tank volume and treats high-strength wastewaters and widely fluctuating organic loadings more effectively.
Extended Aeration. A variation of complete mix in which low organic loadings and long aeration times permit more complete wastewater degradation and partial aerobic digestion of the microorganisms.
Vli-63

8 Contact Stabilization. An activated sludge modification using two aeration stages. In the first, wastewater is aerated with the return sludge in the contact tank for 30 to 90 minutes, allowing finely suspended colloidal and dissolved organics to absorb to the activated sludge. The solids are settled out in a clarifier and then aerated in the sludge aeration (stabilization) tank for 3 to 6 hours before flowing into the first aeration tank.
Oxidation Ditch Activated Sludge. An extended aeration process in w ~ aeration and mixing are provided by brush rotors placed across a race track-shaped basin. Waste enters the ditch at one end, is aerated by the rotors, andcirculates.
Activated sludge is the most common end-of-pipe biological treatment
employed in the OCPSF industry. According to the Section 308 Questionnaire
data base, 143 OCPSF plants reported using activated sludge, 2 plants reported
using an oxidation ditch, and 8 plants reported using pure oxygen activated
sludge. Performance data for BOD s and TSS removal are from the OCPSF Master
Analysis File and are presented in Table VII-18. The data show that activated
sludge treatment results in a median removal efficiency of 96 percent for BOD s
and 81 percent for TSS. For those plants meeting the BPT performance edit of
95 percent removal of B0D 5 or having an effluent BOD 5 concentration no greater
than 40 mg/1, the BOD s median removal efficiency is 98 percent and the TSS
median removal efficiency is 82 percent. (A detailed discussion of EPA's BPT
data editing criteria is presented later in this section.)
b. Lagoons
A body of wastewater contained in an earthen dike and designed for
biological treatment is termed a lagoon or stabilization pond or oxidation
pond. While in the lagoon, the wastewater is biologically treated to reduce
the degradable organics and also reduce suspended solids by sedimentation.
The biological process taking place in the lagoon can be either aerobic or
anaerobic, depending on the design of the lagoon. Because of their low
construction and operating costs, lagoons offer a financial advantage over
other treatment methods and for this reason have become popular where
sufficient land area is available at reasonable cost.
Lagoons are used in industrial wastewater treatment for stabilization of
suspended, dissolved, and colloidal organics either as a main biological
VII-64

TABLE VII-18. A(zrIVATED SLUDGE PERFORMANCE DATA FOR BOD s AND TSS
Statistics Effluent Flow (mgd)
Influent BODs(mg/l)
Effluent BODs(mg/l )
Z Removal BOD s
Influent TSS(mg/I)
Effluent TSS(mg/I)
Z Removal TSS
Type = Activated Sludge Tech Edit = W/O Performance Edit*
Mean
Median
Minimum
Maximum
# OBS/Pairs.
1.5400
0.7155
0.0041
13.8000
66
1232
664
79
9420
49
139
30
3
5303
68
93.8
96.3
31.3
99.8
49
509
280
24
3664
39
84
52
3
737
66
67.2
81.1
-29.3
98.7
39
<: D-d t-d I O~ t.n Mean
Median
Minimum
Maximum
# OBS/Pairs
Type
1.6841
0.7640
0.0099
13.8000
40
= A c t i v a t e d
970
510
79
3176
33
Sludge Tech
22
21
3
65
41
E d i t = With
96.5
97.5
84.8
99.8
33
P e r f o r m a n c e
429
214
24
3664
28
E d i t *
37
33
9
92
41
72.0
82.2
-28.3
98.7
28
*Performance edit was either 95% BOD 5 removal or effluent BOD 5 concentration no greater than 40 mg/l and effluent TSS concentration no greater than I00 mg/l.

treatment process or as a polishing treatment process following other
biological treatment systems. Aerobic, facultative, and aerated lagoons are
generally used for industrial wastewater of low and medium organic strength.
High strength wastewaters are often treated by a series of ponds; the first
one will be virtually all anaerobic, the next facultative, and the last
aerobic.
The performance of lagoons in removing degradable organics depends upon
detention time, temperature, and the nature of waste. Aerated lagoons gener-
ally provide a high degree of BOD 5 reduction more consistently than the
aerobic and facultative lagoons. Typical problems associated with lagoons are
excessive algae growth, offensive odors from anaerobic ponds if sulfates are
present and the pond is not covered, and seasonal variations of effluent
quality.
There are four major classes of lagoons that are based on the nature of
biological activity.
Aerobic Lagoons. Aerobic lagoons are shallow ponds that contain
dissolved oxygen (DO) throughout their liquid volume at all times. These
lagoons may be lined with concrete or an impervious flexible lining, depending
on soil conditions and wastewater characteristics. Aerobic bacterial
oxidation and algal photosynthesis are the principal biological processes.
Aerobic lagoons are best suited to treating soluble organics in wastewater
relatively free of suspended solids. Thus, they are often used to provide
additional treatment of effluents from anaerobic ponds and other partial
treatment processes.
Aerobic lagoons depend on algal photosynthesis, natural reaeration,
adequate mixing, good inlet-outlet design, and a minimum annual air temper-
ature above about 5°C (41°F), for a major portion of the required DO. Without
any one of these conditions, an aerobic pond may develop anaerobic conditions
or be ineffective or both. Because light penetration decreases rapidly with
increasing depth, aerobic pond depths are restricted to 0.2 to 0.3 m (0.6 to
1.0 ft) to maintain active algae growth from top to bottom. In order to
achieve effective pollutant: removals with aerobic lagoons, some means of
Vli-66

removing a l g a e ( c o a g u l a t i o n , f i l t r a t i o n , m u l t i p l e - c e l l d e s i g n ) i s somet imes
n e c e s s a r y .
Ana e rob i c Lagoons . Anae rob i c l agoons a r e r e l a t i v e l y deep ponds (up to
6 m e t e r s ) w i t h s t e e p s i d e w a l l s in which a n a e r o b i c c o n d i t i o n s a r e m a i n t a i n e d
by k e e p i n g o r g a n i c l o a d i n g so h i g h t h a t c o m p l e t e d e o x y g e n a t i o n i s p r e v a l e n t .
Some o x y g e n a t i o n i s p o s s i b l e in a s h a l l o w s u r f a c e zone . I f f l o a t i n g m a t e r i a l s
in t he was t e form an i m p e r v i o u s s u r f a c e l a y e r , c o m p l e t e a n a e r o b i c c o n d i t i o n s
w i l l d e v e l o p . T r e a t m e n t o r s t a b i l i z a t i o n r e s u l t s from a n a e r o b i c d i g e s t i o n of
o r g a n i c w a s t e s by a c i d - f o r m i n g b a c t e r i a t h a t b r eak down o r g a n i c s . The
r e s u l t a n t a c i d s a r e t hen c o n v e r t e d to ca rbon d i o x i d e , me thane , and o t h e r end
p r o d u c t s . A n a e r o b i c l a g o o n s a r e c a p a b l e o f p r o v i d i n g t r e a t m e n t o f h i g h
s t r e n g t h w a s t e w a t e r s and a r e r e s i s t a n t to shock l o a d s . These l a g o o n s a r e
somet imes used to d i g e s t t he was te s l u d g e from an a c t i v a t e d s l u d g e p l a n t .
I n t he t y p i c a l a n a e r o b i c l agoon , raw w a s t e w a t e r e n t e r s n e a r the bo t tom of
the pond ( o f t e n a t t he c e n t e r ) and mixes w i t h the a c t i v e m i c r o b i a l mass in the
s l u d g e b l a n k e t , which can be as much as 2 m e t e r s (6 f e e t ) deep . The d i s c h a r g e
i s l o c a t e d n e a r one of the s i d e s o f t he pond, submerged below the l i q u i d
s u r f a c e . Excess s l u d g e i s washed ou t w i t h the e f f l u e n t and r e c i r c u l a t i o n of
was t e s l u d g e i s no t r e q u i r e d .
Ana e rob i c l a g o o n s a r e c u s t o m a r i l y c o n t a i n e d w i t h i n e a r t h e n d i k e s .
Depending on soil and wastewater characteristics, lining with various
impervious materials, such as rubber, plastic, or clay may be necessary. Pond
geometry may vary, but surface area-to-volume ratios are minimized to enhance
heat retention.
F a c u l t a t i v e Lagoons . F a c u l t a t i v e l a g o o n s a r e i n t e r m e d i a t e d e p t h ponds o f
1 to 2 .5 m (3 to 8 f e e t ) in which the w a s t e w a t e r i s s t r a t i f i e d i n t o t h r e e
z o n e s . These zones c o n s i s t o f an a n a e r o b i c bo t tom l a y e r , an a e r o b i c s u r f a c e
l a y e r , and an i n t e r m e d i a t e zone. S t r a t i f i c a t i o n i s a r e s u l t o f s o l i d s
s e t t l i n g and t e m p e r a t u r e - w a t e r d e n s i t y v a r i a t i o n s . Oxygen in the s u r f a c e
s t a b i l i z a t i o n zone i s p r o v i d e d by r e a e r a t i o n and p h o t o s y n t h e s i s . The p h o t o -
s y n t h e t i c a c t i v i t y a t t he l agoon s u r f a c e p r o d u c e s oxygen d i u r n a l l y , i n c r e a s i n g
the DO c o n t e n t d u r i n g d a y l i g h t h o u r s , and d e c r e a s i n g i t d u r i n g the n i g h t . I n
Vli-67

general, the aerobic surface layer serves to reduce odors while providing
treatment of soluble organic by-products of the anaerobic processes operating
at the bottom. Sludge at the bottom of facultative lagoons will undergo
anaerobic digestion, producing carbon dioxide and methane.
Facultative lagoons are customarily contained within earthen dikes.
Depending on soil and wastewater characteristics, lining the lagoon with vari-
ous impervious materials, such asrubber, plastic, or clay, may be necessary.
Aerated Lagoons. Aerated lagoons are medium-depth basins of 2.5 to 5 m
(8 to 15 ft) in which oxygenation is accomplished by mechanical or diffused
aeration units and from induced surface aeration. Surface aerators may be
high speed, small diameter or low speed, large diameter impeller devices,
either flxed-mounted on piers or float-mounted on pontoons. Diffused aerators
may be plastic pipe with regularly spaced holes, static mixers, helical
diffusers, or other types. Aerated lagoons can be either aerobic or fac-
ultative. Aerobic ponds are designed to maintain complete mixing. Thus, all
solids are in suspension and separate sludge settling and disposal facilities
are required to separate the solids from the treated wastewater.
According to the Section 308 Ouestionnaire data base, lagoons are a
common secondary treatment technology in the OCPSF industry; 89 plants
reported using aerated lagoons, 24 plants reported using aerobic lagoons, and
12 plants reported using anaerobic lagoons. Performance data for BOD s and TSS
removal from these lagoon systems were obtained from the OCPSF Master Analysis
File and are presented in Table VII-19. The data show that lagoon treatment
results in a median removal efficiency of 89 percent for BOD s and 66 percent
for TSS, when all plants using only this secondary treatment process are
considered. For those plants meeting the BPT performance edit, the median
BOD 5 removal efficiency is 90 percent and the median TSS removal efficiency is
75 percent.
c. Attached Growth Biological Systems
Attached growth biological treatment systems are used to biodegrade the
organic components of a wastewater. In these systems, the biomass adheres to
VII-68

TABLE VII-19. LAGOON PERFORMANCE DATA FOR BOD s AND TSS
Statistics Effluent F10w (mgd)
Influent Effluent BODs(mg/l) BODs(mg/l)
% Removal BOD S
Influent TSS(mg/I)
Effluent TSS(mg/I)
% Removal TSS
Type = Lagoons Tech Edit = W/O Performance Edit*
Mean
Median
Minimum
Maximum
# OBS/Pairs
1.9970
0.4915
0.0058
16.0624
30
775
447
71
2442
16
181
27
5
2940
29
73.6
89.2
-26.3
99.0
16
1565
237
23
6103
13
164
58
3
2051
29
16.9
66.4
-456.1
98.2
13
I C~ ~O
Mean
Median
Minimum
Maximum
# OBS/Pairs
Type
2.5501
0.4915
0.0058
16.0624
18
= Lagoons Tech Edit = With Performance Edit*
446 21 87.6 Ii00
193 22 89.9 165.
71 5 73.3 23
1947 35 98.8 3549
8 18 8 6
38
27
3
97
18
51.5
74.6
-30.4
97.9
6
*Performance edit was either 95% BOD 5 removal or effluent BOD 5 concentration no greater than 40 mg/l and effluent TSS concentration no greater than I00 mg/l.

the surfaces of rigid supporting media. As wastewater contacts the supporting
medium, a thin-film biological slime develops and coats the surfaces. As this
film (consisting primarily of bacteria, protozoa, and fungi) grows, the slime
periodically breaks off the medium and is replaced with new growth. This
phenomenon of losing the slime layer is called sloughing and is primarily a
function of the organic and hydraulic loadings on the system. The effluent
from the system is usually passed to a clarifier to settle and remove the
agglomerated solids. Attached growth biological treatment systems are appli-
cable to industrial wastewaters amenable to aerobic biological treatment in
conjunction with suitable pre- and post-treatment. The process is effective
for the removal of suspended or colloidal materials, but less effective for
the removal of soluble organics. The two major types of attached growth
biological treatment processes used in the OCPSF industry are trickling
filters and rotating biologic contactors. These processes are described
below:
Trickling Filters. The physical unit of a trickling filter consists of a
suitable structure packed with an inert medium (usually rock, wood, or
plastic) on which a biological mass is grown. The wastewater is distributed
by either a fixed-spray nozzle system or a rotating distribution system over
the upper surface of the medium and as it flows through the medium covered
with biological slime, both dissolved and suspended organic matter are removed
by adsorption. The adsorbed matter is oxidized by the organisms in the slime
during their metabolic processes. Air flows through the filter by convection,
thereby providing the oxygen needed to maintain aerobic conditions. Most
trickling filters are classified as either low- or high-rate, depending on the
organic and hydraulic loading. A low-rate filter generally has a media bed
depth of 1.5 to 3 meters (5 to I0 feet) and does not use recirculation.
High-rate filter media bed depths can vary from 1 to 9 meters (3 to 30 feet)
and require recirculation. The recirculation of effluent in high-rate filters
is necessary for effective sloughing control. Otherwise, media clogging and
anaerobic conditions could develop as a consequence of the high organic
loading rates employed.
Rotating Biological Contactors. The most common types of rotating
biological contactors consist of a plastic disk or corrugated plastic medium
VII-70

mounted on horizontal shafts. The medium slowly rotates in wastewater (with
40 to 50Z of its surface immersed) as the wastewater flows past. During rota-
tion, the medium picks up a thin layer of wastewater, which flows over its
surface absorbing oxygen from the air. A biological mass growing on the i
medium surface adsorbs and coagulates organic pollutants from the wastewater.
The biological mass biodegrades the organi c matter. Excess microorganisms and
other solids are continuously removed from the film on the disk by shearing
forces created by the rotation of the disk in the wastewater. This rotation
also mixes the wastewater, keeping sloughed solids in suspension until they
are removed by final clarification.
According to the Sect ion 308 Ques t ionna i re da ta base, 8 P l an t s r epor t
using rotating biological contactors and 12 plants report using trickling
filters as a secondary treatment technology. Performance data for BOD s and
TSS removal are from the OCPSF Master Analysis File and are presented in Table
VII-20. The data show that attached growth biological treatment results in a
median removal efficiency of 92 percent for BOD s and 70 percent for TSS, when
all plants using only this secondary treatment process are considered. For
those plants meeting the BPT performance edits, the median BOD 5 removal
efficiency is 92 percent and the median TSS removal efficiency is 70 percent.
d. Secondary Clarification
The function of secondary clarifiers varies with the method of biological
treatment utilized. Clarifiers in an activated sludge system serve a dual
purpose. In addition to providing a clarified effluent, they must also
provide a concentrated source of return sludge for process control. Adequate
area and depth must be provided to allow this compaction to occur while
avoiding rejection of solids into the tank effluent (7-6). Secondary clari-
fiers in activated sludge systems are also sensitive to sudden changes in flow
rates. Therefore, the use of multispeed pumps for in-plant wastewater lift
stations is strongly recommended where adequate flow equalization is not
provided (7-7).
Clarifiers in activated sludge systems must be designed not only for
hydraulic overflow rates, but also for solids loading rates. This isdue
VII-71

Statistics
Mean
Median
Minimum
Maximum
# OBS/Pairs
<
I
bo Mean
Median
Minimum
Maximum
# OBS/Pairs
*Performance and effluent
TABLE VII-20. ATTACHED GROWTH TREATMENT SYSTEMS PERFORMANCE DATA FOR BOD 5 AND TSS
Effluent Influent Effluent % Removal Influent Effluent Flow (mgd) BODs(mg/l ) BODs(mg/l ) BOD s TSS(mg/I) TSS(mg/I)
Type = Attached Growth Tech Edit = W/O Performance Edit*
0.43069 395 254 92.2 767 49
0.44250 167 42 92.2 767 33
0.00365 145 12 91.7 50 15
1.07300 872 921 92.8 1483 I00
5 3 4 2 2 3
Type = Attached Growth Tech Edit = With Performance Edit*
0.826 145 16 91.7 50 15
0.826 145 16 91.7 50 15
0.579 145 12 91.7 50 15
1.073 145 20 91.7 50 15
2 i 2 I I i
edit was either 95% BOD s removal or effluent BOD s concentration no greater TSS concentration no greater than IO0 mg/l.
% Removal TSS
70
70
70
70
i
70
70
70
70
i
than 40 mg/l

mainly to the need for both clarification and thickening in activated sludge
clarifiers to provide both a well clarified effluent and a concentrated return
sludge (7-6).
When the MLSS c o n c e n t r a t i o n is l e s s than about 3,000 mg/1, the c l a r i f i e r
s i z e w i l l normally be governed by h y d r a u l i c overf low r a t e s . At h igher MLSS
va lues , the a b i l i t y of the c l a r i f i e r to th icken s o l i d s becomes the governing
f a c t o r . There fo re , s o l i d s load ing r a t e s become more c r i t i c a l in de te rmin ing
tank s i z e . Design s i z e should be computed for both average and peak condi -
t ions to ensure s a t i s f a c t o r y e f f l u e n t q u a l i t y at a l l times (7 -6) .
Depth of clarifiers in activated sludge systems is extremely important.
The depth must be sufficient to permit the development of a sludge blanket,
especially under conditions when the sludge may be bulking. At the same time,
the interface of the sludge blanket and the clarified wastewater should be
well below the effluent weirs (7-6).
For long rectangular tanks, it is common practice to locate the sludge
withdrawal hopper about 113~to 1/2 the distance to the end of the tank to
reduce the effects of density currents (7-6, 7-7).
Typical design parameters for clarifiers in activated sludge systems
treating typical domestic wastewaters are also presented in Table VIIh21. The
design of these clarifiers should be based upon an evaluation of average and
peak overflow rates and solids loadings. That combination of parameters that
yields the largest surface area should be used (7-6).
Clarifiers following trickling filters must effectively separate
biological solids sloughed from the filter media. The design of clarifiers
following trickling filters is based on hydraulic overflow rates similar to
the method used for primary clarifiers. Design overflow rates must include
recirculated flow where clarified secondary effluent is used for recir-
culation. Because the influent SS concentrations are low, tank solids
loadings need not be considered. Typical design parameters for clarifiers
following trickling filters are also presented in Table VII-21 (7-6).
VII-73

TABLE Vll-21. TYPICAL DESIGN PARAMETERS FOR SECONDARY CLARIFIERS
TREATING DOMESTIC WASTEWATER
Overflow Rate Solids Loading i Depth Type of Treatment (gpd/sq ft) (ib solids/day/sq ft) ft
Average Peak Average Peak
Settling Following Trickling Filtration 400-600 1,O00-1,200 10-12
Settling Following Air- Activated Sludge (Excluding Extended Aeration) 400-800 1,000-1,200 20-30 <50 12-15
Settling Following Extended Aeration 200-,400 800 20-30 <50 12-15
Settling Following 0xygen-Activated Sludge with Primary Settling 400-800 1,000-1,200 25-35 <50 12-]5
iAllowable solids loadings are generally governed by sludge settling characteristics associated with cold weather operations.
Source: Process Design Manual for Upgrading Existing Wastewater Treatment Plants, EPA 625/i-71-004a, October 1974.
VII-74

e. Opera t ing , Managing, and Upgrading B i o l o g i c a l Treatment Systems
This s e c t i o n i d e n t i f i e s methods by which b i o l o g i c a l t rea tment systems in
the OCPSF i n d u s t r y may modify t h e i r e x i s t i n g f a c i l i t i e s in order to upgrade or
improve performance. Most of the upgrades d i scussed p e r t a i n to a c t i v a t e d
s ludge and a e r a t ed lagoon systems, s ince these are the b i o l o g i c a l t rea tment
systems most commonly used in the OCPSF i n d u s t r y and the systems most amenable
to o p e r a t i o n a l and des ign m o d i f i c a t i o n s . Approaches to upgrading b i o l o g i c a l
t rea tment u n i t s i nc lude adding un i t t rea tment p rocesses , modifying the des ign
and o p e r a t i o n a l parameters of e x i s t i n g u n i t s , a c c l i m a t i n g e x i s t i n g b a c t e r i a to
c e r t a i n t o x i c a n t s or us ing bioaugmentat ion ( the a d d i t i o n of acc l ima ted types
of b a c t e r i a bred to remain a c t i v e under a v a r i e t y of adverse c o n d i t i o n s ) ,
p a r t i c l e s i z e r e d u c t i o n , n u t r i e n t a d d i t i o n , and the a d d i t i o n of powdered
a c t i v a t e d carbon (PAC) to a e r a t i o n u n i t s .
In some cases, the only means of improving the performance of a
biological treatment system is to add additional unit treatment processes.
Aeration basins and clarifiers are sometimes added to accommodate higher waste
loads or to address inadequacies in the original treatment plant design. The
addition of primary unit treatment such as equalization improves system
performance by diluting slugs of concentrated wastes, minimizing routine
variations in influent wastewater flow and pollutant concentration, and
removing suspended particles. Preaeration basins are often added to raise
wastewater DO levels and improve the treatability and settling characteristics
of the wastes. Postaeration basins are added to systems to raise the DO in
treatment plant effluent before it flows into receiving streams. Microscreen
and filtration units can be added to improve suspended solids removal prior to
effluent discharge. In summary, there are a number of unit processes
available that can be added to a facility, provided that land is available, to
address specific treatment problems.
Upgrading existing bioreactor f a c i l i t i e s can include adding chemical and
physical treatments such as the addition of polyelectrolytes to c la r i f i e r s to
improve solids settling or the installation of a surface skimmer to a pre-
treatment unit to accomplish oil and scum removal. Operational changes
affecting the quantity and species of microorganisms in a system, however, are
Vli-75

often the most significant with regard to improving the removal of pollutants
and increasing a treatment system's capacity to handle large raw waste loads.
Experience at some facilities indicates that operation of an activated sludge
plant to maintain a stable mixed liquor fauna (i.e., maintain a specific
distribution of bacterial species), rather than operation based on a constant
aeration rate or MLSS concentration, yields more consistent treatment of BOD 5
and priority pollutants (7-8). Thus, operational changes and unit treatment
modificationsshould be planned giving appropriate consideration to this
approach. Many of the concepts for improving the performance of biological
units discussed below are presented in the context of activated sludge and
aerated lagoon systems; however, in many cases they also apply to other types
of biological units, such as fixed film reactors.
As previously discussed, flow equalization is important in improving the
treatability of a waste stream by minimizing variations in wastewater
characteristics, such as temperature, pH, and pollutant concentrations. One
facility in the OCPSF industry improved the equalization of its wastewater by
removing several feet of sedimentation from a primary clarifier, thus
increasing the wastewater detention time. This plant also added heat
exchangers upstream of the treatment units to lower the wastewater temperature
and provide a more uniform wastewater temperature year round.
Modifications to the operations of activated sludge units include
changing influent flow patterns; altering the division, mixing, and aeration
characteristics of the tanks; and recycling sludge from the secondary
clarifier to one or more locations in the treatment train. Step aeration,
introducing primary effluent at several locations in the aeration basin, can
be used to upgrade the performance of a plant with high pollutant loadings
(7-9). Distribution of the waste equalizes the loading in the aeration basin
and enables the microorganisms to function more efficiently.
In situations where a treatment system needs to be modified to handle an
increased waste load, a conventional single tank activated sludge process can
be converted into a two-stage contact stabilization process. The main advan-
tage of contact stabilization is that it operates with a much shorter
hydraulic retention time and hence enables the facility to treat a larger
VII-76

was te l o a d . I n o t h e r s i t u a t i o n s where oxygen r e q u i r e m e n t s a r e no t b e i n g met
and t he f a c i l i t y has e x t r a c a p a c i t y , oxygen s u p p l y can be improved by c r e a t i n g
a complete mix activated sludge system from a contact stabilization or
conventional activated sludge unit. Another approach to improving oxygen
supply is to convert a standard air supplied aeration system to a pure oxygen
system.
Pure oxygen systems are recommended for situations where wide fluctua-
tions occur in the organic loading to a plant and for strong industrial waste-
water. Since they are more efficient than conventional aeration systems, they
can be used to increase the treatment capacity of existing plants. A means of
further improving a pure oxygen or air supplied aeration system is to use
diffusers that produce smaller diameter bubbles (and hence increase the
surface area to bubble volume ratio), and to increase the contact time between
the bubble and the wastewater.
In some treatment train configurations, it is possible to create a second
biological treatment unit by recycling sludge from a secondary clarifier to a
preaeration unit. As presented in the discussion of summer/winter issues,
this was done by plant #2394 in the OCPSF industry to improve the performance
of its treatment plant during cold weather. An additional benefit of
recycling sludge in this manner is that there is usually a decrease in the
total sludge volume generated. Plant #2394 used 100 percent recycle and hence
had no waste sludge during winter months.
Fixed film biological treatment units sometimes have problems associated
with waste distribution and waste loading. Low flows in trickling filter
plants may result in poor distribution of wastewater over the filter media.
Recirculation of part of the treatment plant effluent will increase the flow
through the plant and improve the motion of the distribution arm. An approach
to increasing the capacity or improving the performance of some trickling
filter plants is to replace traditional filter media usually consisting of
stones with synthetic media designed to have a much larger surface area.
Efficient operation of a bioreactor is dependent on maintaining viable
populations of bacteria. Organic priority pollutant removal is often
VII-77

problematic as the pollutants often inhibit the growth of organisms respon-
sible for their degradation (7-10). To efficiently deg#ade these organics,
the inhibitory levels should be determined and should not be exceeded in plant
operations. In addition, bacteria can be acclimated to certain toxicants by
subjecting the activated sludge to an acclimation program or by using
"pre-acclimated" bacteria, the latter process being called bioaugmentation.
Bioaugmentation has also been used to supplement plants in cold weather with
specialized bacteria that maintain high levels of biodegradation activity at
wastewater temperatures as low as 40°F. In addition, bioaugmentation has been
proven to improve oxygen transfer, reduce sludge generation, and improve
sludge settling characteristics. Furthermore, bioaugmentation will greatly
reduce the time needed for recovery from a shock loading. Preserved bacteria
can be added to a biological treatment system as needed to maintain existing
populations and to increase biodegradation capabilities in the event of a
chemical upset.
The efficiency of a biological system can be improved by reducing the
particle size of solids in the influent through pretreatment with coagulation/
flocculation, sedimentation, or other processes. Rates of adsorption,
diffusion, and biochemical reaction are all enhanced by smaller particle size.
Particles smaller than 1 x l0 -6 meter in diameter can be biochemically
degraded at a much fastem rate than larger particles (7-i1). This is due to
the increase in surface area to mass ratio as particle size decreases. Higher
quality secondary effluent from the biological treatment unit will result in
subsequent improvements in the performance of downstream units such as filtra-
tion and activated carbon units.
Secondary clarification systems can also be modified or operated
differently in order to upgrade or improve TSS effluent performance. An
Agency study of full-scale municipal treatment systems shows that rectangular
clarifier modifications such as reaction baffles and other flow-modifying
structures at clarifier inlets resulted in a 13.8 percent reduction in
effluent TSS. Also, the additional installation of a stop-gate in a channel
upstream of the aeration basins to reduce large flow transients to a rectang-
ular secondary clarifier resulted in 31.5 percent lower effluent TSS levels
than the unmodified clarifier without the stop-gate. In another case, this
VII-78

s t u d y a l s o shows t h a t s l o w i n g the r o t a t i o n a l speed o f h y d r a u l i c s l u d g e remova l
mechanisms in c i r c u l a r c l a r i f i e r s to 56 p e r c e n t o f i t s d e s i g n speed r e d u c e d
e f f l u e n t TSS by 10 .5 p e r c e n t . A l so , t he a d d i t i o n a l i n s t a l l a t i o n o f a
c y l i n d r i c a l r i n g b a f f l e / f l o c c u l a t i o n chamber in s e c o n d a r y c l a r i f i e r s r e s u l t e d
in 38 .5 p e r c e n t lower e f f l u e n t TSS l e v e l s than the u n m o d i f i e d s e c o n d a r y
c l a r i f i e r ( 7 - 7 ) .
For a b i o l o g i c a l s y s t e m to f u n c t i o n p r o p e r l y , n u t r i e n t s such as o r g a n i c
c a r b o n , n i t r o g e n , and p h o s p h o r u s must be a v a i l a b l e in a d e q u a t e amoun t s . While
d o m e s t i c w a s t e w a t e r s u s u a l l y have an e x c e s s o f n u t r i e n t s , i n d u s t r i a l w a s t e -
w a t e r s a r e somet imes d e f i c i e n t . I f a d e f i c i e n c y i s i d e n t i f i e d , t he p e r f o r -
mance o f an i n d u s t r i a l w a s t e w a t e r t r e a t m e n t p l a n t can be improved t h r o u g h
n u t r i e n t a d d i t i o n . A c c o r d i n g to the S e c t i o n 308 Q u e s t i o n n a i r e d a t a ba se ,
114 OCPSF p l a n t s u t i l i z e n u t r i e n t a d d i t i o n p r i o r to b i o l o g i c a l t r e a t m e n t .
Removal o f o r g a n i c s can be enhanced by mix ing powdered a c t i v a t e d c a r b o n
(PAC) in t he a e r a t i o n b a s i n o f a b i o l o g i c a l t r e a t m e n t s y s t e m ( 7 - 1 2 ) . PAC
improves t r e a t m e n t i n the a c t i v a t e d s l u d g e p r o c e s s b e c a u s e o f i t s a d s o r p t i v e
and p h y s i c a l p r o p e r t i e s . L i g h t e r we igh t o r g a n i c s , such as p h e n o l s , a p p e a r to
a d s o r b r e v e r s i b l y on t he ca rbon . Use of PAC can dampen the shock e f f e c t s o f
c o n c e n t r a t e d s l u g s o f i n h i b i t i n g o r g a n i c s on the b a c t e r i a c u l t u r e , as the
o r g a n i c s w i l l i n i t i a l l y a d s o r b on t he ca rbon . The PAC can be b i o r e g e n e r a t e d
as t h e s e l i g h t e r w e i g h t o r g a n i c s p e c i e s d e s o r b from the PAC and a r e d e g r a d e d .
H e a v i e r o r g a n i c s , such as t he r e s i d u a l m e t a b o l i c end p r o d u c t s , a p p e a r to
a d s o r b i r r e v e r s i b l y on t he PAC. PAC a l s o h e l p s to remove p o l l u t a n t s by
e x t e n d i n g t he c o n t a c t t ime be tween the p o l l u t a n t and t he b i o m a s s . When
a d s o r b e d by t he ca rbon , p o l l u t a n t s s e t t l e i n t o the s l u d g e and c o n t a c t t ime
w i t h the b iomass i s e x t e n d e d from hou r s to days . The was t e s l u d g e t h a t
c o n t a i n s powdered ca rbon i s removed from the a c t i v a t e d s l u d g e s y s t e m ,
d e w a t e r e d , and e i t h e r d i s p o s e d o f o r r e g e n e r a t e d . The r e g e n e r a t e d c a r b o n may
r e q u i r e an a c i d wash to remove m e t a l s as w e l l as o t h e r i n o r g a n i c m a t e r i a l s to
improve the a d s o r p t i o n c a p a c i t y .
e . Summer/Winter
In comment ing on t he 1983 p r o p o s a l and s u b s e q u e n t n o t i c e s , many commen-
t e r s a s s e r t e d t h a t EPA i n c o r r e c t l y e v a l u a t e d the e f f e c t o f t e m p e r a t u r e on
Vli-79

o l o l o g i c a l treatment systems and incorrectly concluded that tempera tu=e ~ .v~
important in the context of effluent limitations guidelines. They claimed
that one element of this incorrect analysis was EPA's deletion of nine plants
from the data base simply because they had been issued "Best Professional
Judgement" NPDES permits with separate compliance standards for summer and
winter months. They claim that this is an arbitrary decision that virtually
ensures that the effect of temperature will not be considered in estimating
effluent variability.
EPA has studied the effects of temperature variations on biological
treatment system performance in the OCPSF industry and disagrees with these
comments. With regard to operations in warm climates, the Agency believes
that warmer than average temperatures do not have any significant effect on
biological treatment efficiency or variability. However, algae blooms in
ponds can be a wastewater treatment problem in ponds located in warm climates.
Nonetheless, polishing ponds are not part of the technology basis for BPT
limitations. Also, EPA was not able to associate algae bloom problems wlth
any elements of biological treatment (aerated lagoons, clarification, equali-
zation basins, etc.). Consequently, EPA believes that algae growth problems
in warm climates are not relevant to the promulgated BPT regulations.
In order to evaluate winter performance of biological treatment systems,
EPA has analyzed B0D 5 removal efficiency, BOD 5 effluent concentration, and
operational changes for 21 plants reporting daily data and other plants
located in various parts of the country. These analyses indicated that there
is a slight reduction in aw~rage BOD s removal efficiency and a small increase
in average effluent BOD 5 concentrations during winter months for some plants.
HoWever, other plants were able to maintain a BOD 5 removal efficiency of
95 percent or greater and effluent BOD 5 concentrations characteristic of good
operation during the entire year. The analysis also suggests that the plants
with lower efficiencies are affected as much by inefficient operation
practices as by winter temperature considerations. A discussion of
inefficient operating practices used by some plants as well as practices
employed by plants achieving superior all year performance is presented below.
The adoption of practices used by plants with higher winter efficiencies
should result in improved winter effluent quality.
VII-80

EPA has determined that temperature effects can be mitigated by opera-
tlonal and technological changes so that compliance with BPT limitations using
biological treatment is possible for all OCPSF plants with well-designed and
well-operated biological systems. As also discussed below, the potential
effects of winter operations are included in the plant-specific factors that
affect derivation of the variability factors used to establish effluent
limitations guidelines. In addition, EPA has developed costs for plants that
need to upgrade their wlnter-time biological treatment operation to comply
with the promulgated BPT limitations.
: Regarding the deletion of nine summer/winterplants' data from the data
base, the Agency notes that because these plants were subject to meeting two
different sets of permit limits, they had no incentive to attempt to achieve
~niform limitations throughout the year. Not suprisingly then, the daily data
from these plants exhibit a two-tier pattern. These data can be characterized
by-two means, and the variability of these data over a 12-month period is
fundamentally different from the data from plants required to meet only one
bet of permit limits. Consequently, the data generated during these periods
are not representative of veil-operated biological treatment, which as noted
above, is capable of uniform treatment throughout the year as demonstrated by
number of plants. Another problem with daily data from these plants is that
during certain periods of the spring and fall, these plants may be able to
Operate their treatment plants at less than full efficiency because they are
required to meet the less stringent set of permit limits.
In summary, the Agency believes that it has accounted adequately for the
effect of temperature changes on biological treatment performance in its .
variability analysis by including in the variability data base a number of
well-designed and well-operated plants from climates with significant tempera-
ture variation. The inclusion of data from plants with summer/winter permits
would result in an overestimate of the variability of biological treatment
operations in the OCPSF categories.
The detailed analyses described below are based on two sets of data that
were analyzed in order to determine the effect of temperature on the treatment
of BOD 5 and TSS. The first set included the OCPSF daily data base, which
VII-81

contained daily data from 69 plants. Of these, 48 were excluded from the
final BPT daily data base analysis for a variety of reasons, including greater
than 25 percent non-process wastewater dilution, summer/winter NPDES permit
limits, changes in treatment system during sampling, non-representative
treatment, and effluent data after post-biological tertiary treatment. As a
result, daily data from 21 plants formed the basis of the variability
component of the BPT limits and were included in the summer/winter analysis.
These 21 plants are #s 387, 444, 525, 682, 741, 908, 970, 1012, 1062, 1149,
1267, 1407, 16479 1973, 1977, 2181, 2430, 2445, 2592, 2626, and 2695. The
second data set includes 131 plant responses to a Section 308 Survey question
regarding average winter and average summer performance and operating para-
meters that were gathered to highlight practices used to accommodate cold
weather conditions.
The principal parameters evaluated for correlation with temperature were
average effluent BOD 5 and TSS concentration, and BOD 5 removal efficiency. In
addition, two plants that had made operational changes to increase winter
efficiency were also evaluated.
BOD5 Removal Efficiency. Of the 21 plants with long-term daily data,
14 had sufficient BOD 5 influent and effluent data (total BOD s values were
used) to enable the calculation of BOD s monthly removal efficiencies. Six
plants (#s 387, 444, I149, 1267, 2626, and 2695) were not used because they
had no BOD s influent values, and plant #908 was eliminated because its
geographic location in Puerto Rico made any seasonal distinctions meaningless.
The plants that were used had a minimum of three influent and effluent
values each month; if there were time periods where fewer values were avail-
able, these specific time periods were excluded from the analysis (Plant 1062
had only one influent measurement between 1-i-79 and 7-31-79 and plant 2592
had no influent sampling between 12-i-79 and 7-9-80). For each plant where
sampling occurred over a period exceeding 1 year, values for the same month
but different years were averaged together.
The monthly efficiencies were derived by use of the formula
VII-82

~verage BOD effluent for the month] I, Fraction removed = 1 - !
~verage BOD influent for the monthJ ~
"The result of the efficiency analysis is presented in Table VII-22.
As can be s e e n , t h e a n n u a l a v e r a g e BOD 5 removal e f f i c i e n c y i s 95 p e r c e n t .
Seven o f the f o u r t e e n p l a n t s (#s 682, 970, 1062, 1647, 1977, 2181, and 2430)
had g r e a t e r than 95 p e r c e n t removal o f BOD 5 t h r o u g h o u t t he y e a r . I f t he
w i n t e r months a r e d e f i n e d to be J a n u a r y - F e b r u a r y - M a r c h and t he summer months
a r e d e f i n e d to be J u n e - J u l y - A u g u s t , two p l a n t s had remova l e f f i c i e n c i e s in t h e
w i n t e r months t h a t were g r e a t e r than or e q u a l t o ' t h o s e in the summer months .
P l a n t 1062 had 97 p e r c e n t removal e f f i c i e n c y in bo th t he w i n t e r and summer
months , and P l a n t 2430 had 99 p e r c e n t removal e f f i c i e n c y in t he w i n t e r months
and 98 percent removal efficiency in the summer. Inaddition, five plants
(#s 682, 970, 1647, 1977 .and 2181) had average winter removal'efflclencies
within 1 percent of their average summer removal efficiencles.
The 14 plants are located in three different geographical regions. Plant
data were analyzed by region, with subset I including data from the flve
plants located in the n@rth (W-V, IL, RI, IA, IN), subset II including data
from the six plants located in the south (TX, GA, LA, SC), and subset III
including data from the three plants located in the:middle~latltudes (VA, NC).
These results are presented in Tables VII-23, VII-24, and VII-25. Monthly
average removal efflclencies for each plant were obtained, and these were
combined into an overall monthly average for each subset. Plants located in
the northern region had the highest average removal efficiency (northern
plants - 98 percent; southern plants - 95 percent; middle latitude - 89
percent). In the northern region, four of the five plants (682, 1062, 1647,
and 2181) had removal efficiencies greater than 95 percent throughout the ~
IAlthough it was also possible to obtain monthly efficiencies by calculating daily efficiencies and-averaging them for each month, such a method would have resulted in elimination of many data points when only influent or efflu- ent values, not both, were available for a specific ~ay. Also, because retention times are generally greater than 1 day, and because wastewaters are mixed during treatment, an effluent value cannot necessarily be correlated with an influent value for that same day or for any other particular time.
VII-83

TABLE V1| -22 : NONTHLY BOOS REMOVAL EFFICIENCY . . . . . . . . . . . . . . . . . . . . . . . . . . . . . . . . . . . . . . . . . . . . . .
Nonth Ptant Nonthty
525 682 741 970 1012 1062 1407 1647 1973 1977 2181 2430 2445 Z592 Average . . . . . . . . . . . . . . . . . . . . . . . . . . . . . . . . . . . . . . . . . . . . . . . . . . . . . . . . . . . . . . . . . . . . . . . . . . . . . . . . . . . . . . . . . . . . . . . . . . . . . . . . . . . . . . . . . . . . . . . . . . . . . . . . . . . . . . . . . . . . . . . . . . . . . . . .
January 0.8? 0.98 0.93 0.96 0.54 0.99 0.92 0.98 0.88 0.97 0.98 0.99 0.88 0.93 0.91
February 0.87 0.99 0.95 0.96 0.55 0.99 0.95 0.97 0.90 0.97 0.99 0.99 0.96 0.94 0.93
Narch 0.99 0.99 0.97 0.97 0.74 0.99 0.94 0.96 0.88 0.96 0.99 0.99 0.98 0.98 0.95
Apri t 0.89 0.99 0.96 0.97 0.80 0.98 0.95 0.98 0.89 0.98 0.98 0.98 0.98 0.98 0.95
Nay 0.93 0.99 0.98 0.97 0.70 0.99 0.96 0.99 0.89 0.98 0.99 0.99 0.96 0.98 0.95
June 0.95 0.99 0.97 0.97 0.70 0.97 0.97 0.84 0.97 0.98 0.98 0.97 0.98 0.94
JuLy 0.95 0.99 0.97 0.97" 0.88 0.99 0.96 0.98 0.96 0.9T 1.00 0.99 0.97 0.98 0.97
August 0.91 0.99 0.98 0.98 0.69 0.99 0.93 0.98 0.95 0.98 1.00 0.97 0.98 0.98 0.95
September 0.89 0.99 0.97 0.97 0.91 0.98 0.97 0.99 0.96 0.97 0.98 0.97 0.98 0.98 0.97
.< October 0.95 0.99 0.93 0.98 0.90 0.99 0.97 0.99 0.97 0.96 0.98 0.99 0.99 0.99 0.97
November 0.89 0.99 0.95 0.97 0.8Z 0.99 0.97 0.99 0.98 0.96 0.97 0.98 0.98 0.99 0.96 I December 0.90 0.99 0.98 0.97 0.75 0.99 0.95 0.99 0.97 0.97 1.00 0.99 0.96 0.95
oo
Ptant Average 0.92 0.99 0.96 0.97 0.75 0.99 0.95 0.98 0.92 0.97 0.99 0.98 0.97 0.97 0.95

TABLE VII-23 : MONTHLY BOO5 EFFICIENCY BY REGION
Subset I (Northern--MV, IA, IL, IN, RI) . . . . . . . . . . . . . . . . . . . . . . . . . . . . . . . . . . . . . . . . . . . . . . . .
t - - I
I
oo
-
Month
682 . . . . . . . . . . . . . . . . . . . . . . . . . .
January 0.98 February 0.99 March 0.99 Apri t 0.99 May 0.99 June 0.99 Jury 0.99 August 0.99 September 0.99 October 0.99 November 0.99 December 0.99
ptant 1062 1647 2181 2445
. . . . . . . . . . . . . . . . . . . . . . . . . . . . . . . . . . . . . . . . . . . . . . .
0.99 0.98 0.98 0.88 0.99 0.97 0.99 0.96 0.99 0.96 0.99 0.98 0.98 0.98 0.98 0.98 0.99 0.99 0.99 0.96
0.97 0.98 0.97 0.99 0.98 1.00 0.97 0.99 0,98 1.00 0.98 0.98 0.99 0.98 0.98 0.99 0.99 0.98 0.99 0.99 0.99 0.97 0.98 0.99 0.99 1.00 0.96
Monthty Average
0.96 0.98 0.98 0.98 0.98 0.98 0.99 0.99 0.98 0.99 0.98 0.99
Ptant Average 0.99 0.99 0.98 0.99 0.97 0.98
)

TABLE VI I -24 : MONTHLY BOO5 EFFICIENCY BY REGION
Subset I I (Southern--GA, LA, SC, TX) . . . . . . . . . . . . . . . . . . . . . . . . . . . . . . . . . . . . . . . . . . . . . . . .
Month p lant Monthly
525 741 1973 1977 2430 2592 Average . . . . . . . . . . . . . . . . . . . . . . . . . . . . . . . . . . . . . . . . . . . . . . . . . . . . . . . . . . . . . . . . . . . . . . . . . . . . . . . . . . . . . .
January 0.87 0.93 0.88 0.97 0.99 0.93 0.93
February 0.87 0.95 0.90 0.97 0.99 0.94 0.94
March 0.99 0.97 0.88 0.96 0.99 0.98 0.96
Apri I 0.89 0.96 0.89 0.98 0.98 0.98 0.95
May 0.93 0.98 0.89 0.98 0.99 0.98 0.96
June 0.95 0.97 0.84 0.97 0.98 0.98 0.95
JuLy 0.95 0.97 0.96 0.97 0.99 0.98 0.97
August 0.91 0.98 0.95 0.98 0.97 0.98 0.96
September 0.89 0.97 0.96 0.97 0.97 0.98 0.96
October 0.95 0.93 0.97 0.96 0.99 0.99 0.96
November 0.89 0.95 0.98 0.96 0.98 0.99 0.96
December 0.90 0.98 0.97 0.97 0.99 0.96F~
I O0 Ptant Average 0.92 0.96 0.92 0.97 0.98 0.97 0.95 C~

TABLE VI I -25 : HONTHLY BOO5 EFFICIENCY BY REGION
Subset I l l (H idd le- la t i tude--VAo NC) . . . . . . . . . . . . . . . . . . . . . . . . . . . . . . . . . . . . . . . . . . . . . . . .
Nonth p lant Monthly 970 1012 1407 Average
. . . ~ . . . . . . . . . . . . . . . . . . . . . . . . . . . . . . . . . . . . . . . . . . . . . . . . . . . . . . .
January
February
March
Aprit
Nay
June July
August September
October
Noverrdoer
December
Plant Average
0.96 0.54 0.92 0.81 0.96 0.55 0.95 0.8Z 0.97 0.74 0.94 0.88 0.97 0.80 0.95 0.91 0.97 0.70 0.96 0.88 0.97 0.70 0.97 0.88 0.97 0.88 0.96 0.94 0.98 0.69 0.93 0.86 0.97 0.91 0.97 0.95 0.98 0.90 0.97 0.95 0.97 0.87 0.97 0.93 0.97 0.75 0.95 0.89
0.97 0.75 0.95 0.89
H
I
oo

year. In the southern region, only two of the six plants (1977 and 2430) had
greater than 95 percent removal efficiencies throughout the year; in the
middle latitudes, one out of the three plants (970) had greater than 95
percept removal efficiency. This analysis shows that removal efficiency was
affected primarily by nonclimate-related factors.
A similar analysis was performed using the data base derived from plants
that responded to the OCPSF 308 0uestionnaire on summer/winter operations.
0uestion C-12 of the questionnaire asked each respondent to select a 3-month
period in the summer and a 3-month period in the winter of the same year. The
summer period was generally selected as June-July-August or July-August-
September, although a few respondents selected May-June-July. The winter
period was generally selected as January-February-March, although some
respondents selected various other 3-month periods from October through
February. For these two periods, the respondent was to provide summary data
for a variety of parameters, including average daily total BOD 5 influent and
effluent concentrations, TSS influent and effluent concentrations, MLSS con-
centration, mixed liquor volatile suspended solids (MLVSS) concentration, and
food to microorganism ratio (F/M). Plants were included in the analysis if
there were both influent and effluent total BOD 5 values so that a BOD 5 removal
efficiency could be calculated. Of all plants for which information was
available from Ouestion C-12, 131 had sufficient information to enable the
calculation of BOD S removal efficiency. When estimated values were given,
they were used. For the four plants using recycled waste streams (296, 2551,
1617, 2430), only the initial influent and final effluent values were used;
although this might result in artificially high efficiencies, it represented
the only logical approach. Two plants (1038 and 1389) had two different sets
of values, so each set was used. Two plants (227 and 909) had influent data
from one biological treatment system andeffluent data from another, and were
not used in the analysis.
VII-88

The results of the analysis are as follows:
Plant Category N Avg
Efficiency
Summer S t d ' Dew
-Ef
Winter Avg
ficiency Std Dev
A l l P l a n t s S o u t h e r n P l a n t s N o r t h e r n P l a n t s Middle L a t i t u d e
P l a n t s
131 52 46 33
0 .89 0 .91 0 .86 0 .89
0 .31 0 .14 0 .48 0 .18
0 .86 0 .86 0 .85 0 .87
0 .25 0 .21 0 .32 0 .19
Southern plants were located in Alabama, Florida, Georgia, Louisiana,
Mississippi, South Carolina, and Texas. Northern plants were located in
Connecticut, Iowa, Illinois, Indiana, Michigan, New Jersey, New York, Ohio,
Pennsylvania, Rhode Island, and West Virginia. Middle latitude plants were
located in Arkansas, Delaware, Kentucky, Maryland, North Carolina, Oregon,
Tennessee, Virginia, and Washington.
These r e s u l t s a r e c o n s i s t e n t w i t h the r e s u l t s o f t he 1 4 - p l a n t d a i l y d a t a
a n a l y s i s d i s c u s s e d p r e v i o u s l y . The BOD 5 removal e f f i c i e n e i e s f o r a l l p l a n t s
a r e 3 p e r c e n t l e s s d u r i n g the w i n t e r p e r i o d than t he summer p e r i o d (86% vs .
89%). The r e g i o n a l removal e f f i c i e n c i e s a r e i to 5 p e r c e n t l e s s i n the w i n t e r
p e r i o d than in t he summer p e r i o d . The g r e a t e s t r e g i o n a l v a r i a t i o n in
e f f i c i e n c y o c c u r s in the s o u t h . The s t a n d a r d d e v i a t i o n of the e f f i c i e n c y i s
l a r g e r e l a t i v e to t he e f f i c i e n c y d i f f e r e n c e w i t h i n each c a t e g o r y , r e f l e c t i n g
the l a r g e v a r i a t i o n s among p l a n t s w i t h i n the same c a t e g o r y . These r e s u l t s
t end to i n d i c a t e t h a t w h i l e n o r t h e r n and m i d d l e l a t i t u d e p l a n t s would have
l a r g e r swings in t e m p e r a t u r e g o i n g from s e a s o n to s e a s o n , t h e s e swings have
been compensa t ed f o r t h r o u g h o p e r a t i o n and p r o c e s s m o d i f i c a t i o n s as i n d i c a t e d
by t he s i m i l a r summer and w i n t e r removal e f f i c i e n c i e s (86% vs . 85%). The
l a r g e r d i f f e r e n c e be tween summer and w i n t e r removal e f f i c i e n c i e s f o r s o u t h e r n
p l a n t s (91% vs . 86%) i n d i c a t e t h a t t h e s e f a c i l i t i e s have no t ~ d e q u a t e l y
a d d r e s s e d t he s m a l l e r t e m p e r a t u r e swings by o p e r a t i o n a l and p r o c e s s m o d i f i c a -
t i o n s .
VII-89

These findings support several conclusions. There may be differences
between efficiencles attainable in summer and in winter, but these differences
are nonetheless small. The large standard deviations obtained reflect differ-
ences in operating practices among plants. Plants that operate efficiently do
so year-round, and have been able to minimize or at least partially compensate
for temperature effects through equipment and operational treatment system
adjustments. In addition, plants located in the colder northern climate show
minimal efficiency differences between winter and summer months, which
provides further evidence that temperature effects are minimal. The daily
data assessment also indicates minimal efficiency variations during the spring
and autumn months, when temperature fluctuations would tend to be greatest;
this result casts doubt on the theory that f!uctuations~ rather than continued
cold, would reduce BOD 5 removal efficiency by preventing the formation of a
stable microbial population.
Average Effluent BOD s and TS_SS
The effect of temperature on effluent BOD 5 and TSS levels was evaluated
previously in the July 1985 document entitled "Selected Summary of Information
in Support of the OCPSF Point Source Category Notice of Availability of New
Information." EPA calculated rank correlation by subcategory for BOD 5 efflu-
ent and TSS effluent versus heating degree days, a measure typically used by
power companies to estimate heating bills. The results of the analysis were
consistent with the assumption that temperature is not a factor. With the
exception of effluent TSS for specialty chemicals, all calculated rank
correlations were not significant. In the case of specialty chemicals, the
correlation was positive and significant. However, the positive correlation
implies that TSS increases as temperature decreases. Since engineering
considerations dictate that TSS should not decrease as temperature increases,
this result is considered spurious.
A new analysis was conducted, employing 6ata ft¢,m 20 of the 21 plants in
the data base used for the calculation of BPT variability factors. The only
plant not used was #908, because of its location in Puerto Rico. BOD s and TSS
effluent averages were compared to months rather than heating degree days (see
Tables VII-26 and VII-27). The annual average BCD 5 and TSS effluent concen-
trations are 22 mg/1 and 31 mg/1, respectively. Seven of the 20 plants (525,
Vll-90

TABLE V I I - 2 6 : AVERAGE EFFLUENT BOO BY MONTH . . . . . . . . . . . . . . . . . . . . . . . . . . . . . . . . . . . . . . . . . . . .
Month p lant Monthly
387 444 525 682 741 970 1012 1062 1149 1267 1407 1647 197"3 1977 2181 2430 2445 2592 2626 2695 Average
January 22.77 23.~ 9.58 16.80 206.43 17.~ 35.02 9.61 29.14 37.69 30.85 15.05 10.00 61.498 8.909 4.229 93.176 78,275 13.632 24.907 37.42
February 13.83 38.50 7.39 13.~ 105.83 17o19 31.83 7.81 36.25 18.27 28.65 8.25 75.154 5.071 4.800 28.718 58,5~ 8.~7 73.610 28,03
March 13.42 11.25 10.67 12.37 ~.08 13.35 19.94 8.56 38.96 25.31 24.93 43.57 8.93 75".913 4.000 5.826 16.661 19,147 9.861 25.755 ?3,42
April 6,93 9.07 10.62 11.62 83.85 11.21 12.40 9.58 22.22 22.40 17.92 14.33 7.92 37.503 8.667 9.870 12.477 23.027 8,653 22.456 18,14
May 28.31 20.90 5.51 7.56 49.00 13.96 19.20 9.51 35.47 20.39 13.92 8.42 6.92 48,430 4.111 5.466 22.138 20.619 11.517 15.838 18,36
June 15,00 10.42 6.51 5.47 67.92 13.24 26.47 11.95 41.86 15.33 13.39 28.64 ~7.43 47.453 4.538 6.483 17.510 15.714 8.566 8.713 18.63
Ju ly 11.13 12.13 5.03 7.33 90.57 10.44 12.90 11.77 52.70 17.14 15.15 11,55 4.58 50.094 1.000 4.481 15.777 19.200 8.474 6.676 18.41
August 18.67 8.00 5.47 9.79 63.92 11.62 24.74 12.87 30.19 27.81 28.50 13,58 5.86 42.551 1.000 6.390 16.687 16.103 8.700 38,219 19.53
September 12.09 14.00 3.41 7.62 57.14 12.42 7.00 8.00 49.77 21.13 14.73 10,90 4.00 52.213 1.250 12.193 20,913 16.333 10.583 12.308 17.38
October 6.27 14.77 5.73 6.76 212.23 12.44 10.94 7.74 20.25 24.41 13.00 14.45 3.00 78.644 4.200 5.645 7.810 16.107 12.248 18.324 24.75
Novenber 8.33 11.17 16.13 8.18 115.46 13.44 12.13 9.36 28.82 26.26 16.00 11.76 3.87 85.987 4.625 6.290 10.300 15.857 22.490 18.495 22.25
December 9.50 13.50 13.81 8.08 30.69 13.00 26.61 6.29 30.45 20.08 10.94 3.62 56.445 2.000 4.252 19.474 39,143 14.410 11,113 17.55
P~ P~ Plant !
~0 Average 13.85 15.62 8.32 9.62 96.93 13.28 19.93 9.42 34.67 ?3,79 18.85 17.65 6.20 59.32 4.11 6.33 ?3 ,47 28.18 11.51 18.87 21.99

TABLE V 1 | - 2 7 : AVERAGE EFFLUENT TSS BY MONTH . . . . . . . . . . . . . . . . . . . . . . . . . . . . . . . . . . . . . . . . . . . .
Month p| ant Nonth [ y
387 444 525 682 970 1012 1062 1149 1267 1407 1647 1973 1977 2181 2430 2445 2592 2626 2695 Average . . . . . . . . . . . . . . . . . . . . . . . . . . . . . . . . . . . . . . . . . . . . . . . . . . . . . . . . . . . . . . . . . . . . . . . . . . . . . . . . . . . . . . . . . . . . . . . . . . . . . . . . . . . . . . . . . . . . . . . . . . . . . . . . . . . . . . . . . . . . . . . . . . . . . . . . . . . . . . . . . . . . . . . . . . . .
January 22.31 55.07 19.77 58.81 41.08 8.19 57.91 61.75 34.43 15.31 36.89 11.50 49.18 33.74 4.19 91.58 67.87 18.32 13.92 36.94
February 23.75 16.47 22.92 53.74 43.41 6.86 26.38 61.30 9.82 171.44 13.37 70.89 12.07 3.79 71.86 68.88 14.00 16.30 39.29
March 29.50 11.08 39.62 45.77 55.23 5.81 17.77 47.82 24.39 21.21 228.16 10.78 49.90 14.42 4.39 48.74 34.91 14.45 11.38 37.65
April 2.46 21.92 56.69 37.34 53.40 6.60 14.14 38.24 24.08 21.25 30.43 9.48 40.86 10.20 8.50 35.27 56.94 14.60 I0,49 26.99
May 34.08 22.36 18.69 28.29 51.37 9.55 26.11 52.30 16.39 7.25 37.45 7.37 45.24 12.55 9.97 42.71 72.60 20.94 6.38 27.45
June 21.33 20.08 24.39 22.45 35.90 11.90 18.67 72.27 27.23 10.69 91.77 9.90 15.58 23.80 7.00 51.67 67.32 14.93 12.63 29.45
July 12.67 30.43 16.31 25.43 24.87 6.71 10.18 69.59 22.23 12.31 23.52 9.81 20.93 15.42 4.52 44.81 58.36 12.00 6.90 22.47
August 9.92 24.77 20.21 38.57 17.72 12.81 10.87 87.71 22.92 14.10 23.55 8.00 13.67 22.61 9.87 66.77 32.61 16.13 15.58 24.65
September 25.77 34.23 25.15 26.56 16.57 6.63 16.50 80.72 25.92 10.39 25.03 6.60 32.21 49_70 9.23 !!9.30 24.00 18.47 35.76 30.99
October 14.69 33.69 22.39 25.71 18.31 5.45 20.74 57.23 23.77 13.58 36.07 10.30 126.38 33.81 6.42 41.10 49.23 22.39 26.26 30.92
November 8.69 22.31 34.25 27.25 40.27 5.70 10.36 57.80 18.33 13.67 20.37 11.67 79.73 32.97 13.63 77.27 27.29 34.67 6.00 28.54
Oecember 21.00 18.69 64.77 29.92 28.18 6.65 3.86 57.72 19.54 30.00 12.43 2 2 . 6 1 27.97 6.90 100.74 110.15 20.84 5.90 32.66
Plant
,--4 Average 20.51 25.93 30.43 34.99 35.53 7.74 19.46 62.04 23.97 14.09 62.89 10.10 47.26 24.10 7.37 65.98 55.85 18.48 13,96 30.67
I ~O t~o

682, 970, 1062, 1973, 2181, and 2430) have monthly average BOD 5 effluent
concentrations less than 22 mg/l throughout the year, while four of the
20 plants (387, 1012, 1407, and 2626) have monthly average BOD s effluent
concentrations less than 37 mg/l throughout the year. Also, if winter months
are defined as January-February-March and summer months are defined as
June-July-August, three plants (1062, 1149, and 2430) have lower average BOD 5
effluent concentrations for the winter months than for the summer months. In
addition, two plants (387 and 2626) have average BOD 5 effluent concentrations
for the winter within 3 mg/l of the summer average BOD 5 effluent concentra-
tions, while four plants (444, 1973, 2626, and 2695) have average TSS effluent
concentrations for the winter months within 3 mg/l of the summer average TSS
effluent concentrations.
Another analysis was performed comparing each plant's average BOD 5 and
TSS effluent concentrations In the winter and summer months to Its annual
average BOD 5 and TSS effluent targets that provide the basis for BPT effluent
limitations. These annual compliance targets are presented in Appendix VII-A
of this document. Eight of the 20 plants (525, 682, 1062, 1407, 1647, 1973,
2181, and 2430) had both winter and summer average BOD 5 effluent concentra-
tions below their annual average BOD 5 effluent compliance targets, while eight
plants (387, 444, 525, If~12, 1407, 1973, 2181, and 2626) had both summer and
winter average TSS effluent concentrations below their annual average TSS
effluent compliance targets.
The plants were then divided into geographical regions and the same
analyses performed. Subset I consisted of six northern plants from West
Virginia, Illinois, Rhode Island, Iowa, and Indiana; subset II consisted of
I0 southern plants from Texas, Georgia, Louisiana, and South Carolina; and
subset III consisted of four middle latitude plants from Virginia and North
Carolina (see Tables VII-28, VII-29, VII-30, VII-31, VII-32, and VII-33). The
annual average BOD 5 effluent concentrations were 13 mg/l, 30 mg/l, and 16 mg/l
for the northern, southern, and middle latitude plants, respectively; annual
average TSS effluent concentrations were 38 mg/l, 31 mg/l, and 19 mg/l for the
northern, southern, and middle latitude plants, respectively. Approximately
66 percent, 70 percent, and 50 percent of the plants in the northern,
southern, and middle latitude regions, respectively, have annual average BOD 5
Vli-93

TABLE V I I - 2 8 : MONTHLY EFFLUENT BOO5 BY REGION
Subset I (Northern--WV, IL , RI, ]A, IN) . . . . . . . . . . . . . . . . . . . . . . . . . . . . . . . . . . . . . . . . . . . . . .
Month Plant Monthly
682 1062 1647 2181 2445 2626 Average . . . . . . . . . . . . . . . . . . . . . . . . . . . . . . . . . . . . . . . . . . . . . . . . . . . . . . . . . . . . . . . . . . . . . . . . . . . . . . . . . . . . . .
January 16.80 9.61 15.05 8.91 93.18 13.63 26.20
February 13.88 7.81 28.65 5.07 28.72 9.00 15.52
March 12.37 8.56 43.57 4.00 16.66 9.86 15.84
April 1!.62 9.58 14.33 8.67 12.48 8.65 10.89
May 7.56 9.51 8.42 4.11 22.14 11.52 10.54
June 5.47 11.95 28.64 4.54 17.51 8.57 12.78
July 7.33 11.77 11.55 1.00 15.78 8.47 9.32
August 9.79 12.87 13.58 1.00 16,69 8.70 i0.44
September 7.62 8.00 10.90 1.25 20,91 10.58 9.88
October 6.76 7.74 14.45 4.20 7.81 12.25 8.87
Noven~)er 8.18 9.36 11.76 4.63 10.30 22.49 11.12
December 8.08 6.29 10.94 2.00 19.47 14.41 10.20 !
¢- Plant Average 9.62 9.42 17.65 4.11 23.47 11.51 12.63

TABLE V11 -29 : MONTHLY EFFLUENT BOD5 BY REGION Subset I I (Southern--TX, GA, LA, SC)
Month Plant Monthly 444 525 741 1149 1267 1973 1977 2430 2592 2695 Average
January 23.73 9.58 206.43 29.14 37.69 10.00 61.50 4.23 78.28 24.91 48.55
February 38.50 7.39 105 .83 36.25 8.25 75.15 4.80 58.58 23.61 39.82 March 11.25 10.67 80.08 38.96 25.31 8.93 75.91 5.83 19.15 25.76 30.18 Apr i l 9.07 10.62 83.85 22.22 22.40 7.92 37.50 9.87 23.03 22.46 24.89 May 20.90 5.51 49.00 35.47 20.39 6.92 48.43 5.46 20.62 15.84 22.85 June 10.42 6.51 67.92 41.86 15.33 7.43 47.45 6.48 15.71 8.71 22.78 duty 12.13 5.03 90.57 52.70 17.14 4.58 50.09 4.48 19.20 6.68 26.26 August 8.00 5.47 63.92 30.19 27.81 5.86 42.55 6.39 16.10 38.22 24.45 September 14.00 3.41 57.14 49.77 21.13 4.00 5 2 . 2 1 12.19 16.33 12.31 24.25 October 14.77 5.73 212.23 20.25 24.41 3.00 78.64 5.65 1 6 . 1 1 18.32 39.91 November 11.17 16.13 115.46 28.82 26.26 3.87 85.99 6.29 15.86 18.50 32.83
t ~ December 13.50 1 3 . 8 1 30.69 30.45 3.62 56.45 4.25 39.14 11.11 22.56 t '~
!
Plant Average 15.62 8.32 96.93 34.67 23.79 6.20 59.32 6.33 28.18 18.87 29.95

TABLE VI I -30 : MONTHLY EFFLUENT BOO5 BY REGION
Subset I l l (M idd te_ ta t i tude- -VA, NC)
Month Plant Monthty
387 970 1012 1407 Average
January 22.77 17.04 35.02 30.85 26.42
February 13.83 17.19 31.83 18.27 20.28
March 13.42 13.35 19.94 24.93 17.91
Apr,[ 6.93 11.21 12.40 17.92 12.11
May 28.31 13.96 19.20 13.92 18.85
June 15.00 13.24 26.47 13.39 17.02
Jury 11.13 10.44 12.90 15.15 12.41
August 18.67 11.62 24.74 28.50 ~n o~v.88
September 12.09 12.42 7.00 14.23 11.43
October 6.27 12.44 10.94 13.00 10.66
November 8.33 13.44 12.13 16.00 12.48
December 9.50 13.00 26.61 20.08 17.30
! ~D
Ptant Average 13.85 13.28 19.93 18.85 16.48 O~

TABLE VI I -31 : MONTHLY EFFLUENT TSS BY REGION
Subset I (Northern--IN, IL, RI, IA, IN)
Month
682 . . . . . . . . . . . . . . . . . . . . . . . . . . . . . . . . . . . . . . . . . . . . . . . .
1062
Ptant
1647 2181 2445 2626 #onthty Average
I - - I t ~
! ~ D "-4
January February March Aprit May June Jury August September October November December
58.81 53.74 45.77 37.34 28.29 22.45 25.43 38.57 26.56 25.71 27.25 29.92
5 7 . 9 1 26.38 17.77 1 4 . 1 4 2 6 . 1 1 18.67 10.18 10.87 1 6 . 5 0 20.74 1 0 . 3 6 3.86
36.89 171.44 228.16 30.43 37.45 91.77 23.52 23.55 25.03 36.07 20.37 30.00
33.74 12.07 14.42 10.20 12.55 23.80 15.42 22.61 49.70 33.81 32.97 27.97
91.58 71.86 48.74 35.27
42.71 51.67 44.81 66.77
119.30 41.10 77.27
100.74
18.32 14.00 14.45 14.60
20.94 14.93 12.00 16.13 18.47 22.39 34.67 20.84
49.54 58.25 61.55 23.66
28.01 37.21 21.89 29.75 42.59 29.97 33.81 35.55
Ptent Average 34.99 1 9 . 4 6 62.89 24.10 65.98 18.48 37.65

TABLE V I I - 3 2 : MONTHLY EFFLUENT TSS BY REGION
Sub~et I I (Southern--TX, GA, LA, SC) . . . . . . . . . . . . . . . . . . . . . . . . . . . . . . . . . . . . . . . . . . . . .
Month
444 525 1149 1267
plant
1973 1977 2430 2592 2695
Monthly
Average
January
February
March
55.07
16.47
11.08
19.77
22.92
39.62
61.75
61.30
47.82
34.43
24.39
11.50
13.37
10.78
49.18
70.89
49.90
4.19
3.79
4.39
67.87
68.88
34.91
13.92
16.30
11.38
35.30
34.24
26.03
April
May
June
21.92
22.36
20.08
56.69
18.69
24.39
38.24
52.30
72.27
24.08
16.39
27.23
9.48
7.37
9.90
40.86
4~.24
15.58
8.50
9.97
7.00
56.94
72.60
67.32
10.49
6.38
12.63
29.69
27.92
28.49
July
August
September
October
30.43
24.77
34.23
33.69
16.31
20.21
25.15
22.39
69.59
87.71
80.72
57.23
22.23
22.92
25.92
23.77
9.81
8.00
6.60
10.30
20.93
13.67
32.21
126.38
4.52
9.87
9.23
6.42
58,36
32.61
24.00
49.23
6.90
15.58
35.76
26.26
26.56
26.15
30.43
39.52
November 22.31 34.25 57.80 18.33 11.67 79.73 13.63 27.29 6.00 30.11
F~ December 18.69 64.77 57.72 12.43 22.61 6.90 110.15 5.90 37.40
i ~43 oo
Plant Average 25.93 30.43 62.04 23.97 10.10 47.26 7.37 55.85 13,96 30,99

TABLE V11-33 : HONTHLY EFFLUENT TSS BY REGION Subset I f ! (Middle_lat|tude--VA, NC)
. . . . . . . . . . . . . . . . . . . . . . . . . . . . . . . . . . . . . . . . . . . . .
Nonth Plant Nonthly 387 970 1012 1407 Average
. . . . . . . . . . . . . . . . . . . . . . . . . . . . . . . . . . . . . . . . . . . . . . . . . . . . . . . . . . . . . . . . . . . .
January 22.31 41.08 8.19 15.31 21.72 February 23.75 43.41 6.86 9.82 20.96
March 29.50 55.23 5,81 21.21 27.94 Apr i l 22.46 53.40 6,60 21.25 25.93 May 34.08 51.37 9,55 7.25 25.56 June 21.33 35.90 11.90 10.69 19.96 July 12.67 24.87 6,71 12.31 14.14 August 9.92 17.72 1 2 . 8 1 14.10 13.64 September 25.~ 16.57 6.63 10.39 14.84
October 14.69 18.31 5,45 13.58 13.01
November 8.69 40.27 5.70 13.67 17.08 k-4 December 21.00 28.18 6.65 19.54 18.84
! ~O
~JO PLant Average 20.51 35.53 7.74 14.09 19,47

c o n c e n t r a t i o n s l e s s than the r e g i o n a l annua l a v e r a g e BOD 5 e f f l u e n t c o n c e n t r a -
t i o n ; a p p r o x i m a t e l y 66 p e r c e n t , 66 p e r c e n t , and 50 p e r c e n t o f t he p l a n t s in
the n o r t h e r n , s o u t h e r n , and midd le l a t i t u d e r e g i o n s , r e s p e c t i v e l y , have a n n u a l
a v e r a g e TSS e f f l u e n t c o n c e n t r a t i o n s below the r e g i o n a l a n n u a l a v e r a g e TSS
e f f l u e n t c o n c e n t r a t i o n s .
Additional Parameters
Evaluating other parameters using the 21-plant daily data base was not
possible since BODs, TSS, and flow were the only parameters monitored. The
Question C-12 data base provides average summer and winter values for MLSS,
MLVSS, and F/M. For all plants used in the previous C-12 data analysis for
BOD 5 efficiency and for which values for MLSS, MLVSS, or F/M were available
for both summer and winter periods, average values for MLSS, MLVSS, and F/M
were determined.
Several editing rules were used. If estimates were given, they were
used. For Plant #1340, two different biological treatment processes had the
same BOD s values, but had two different sets of MLSS, MLVSS, and F/M values.
Both sets were used. For Plant #296, which recycled waste streams, the MLSS,
MLVSS, and F/M values for each recycled stream were used. For Plants #1389
and #1038, where two sets of BOD 5 values were used, two sets of MLSS, MLVSS,
and F/M values were also used.
Based on these rules, average MLSS, MLVSS, and F/M values are as follows:
MLSS (mg/l) MLVSS (mg/l) F/M
Summer Winter Summer Winter Summer Winter 4634 4950 3003 3444 1.024 0.863
An attempt was made to correlate the summer and winter values for MLSS,
MLVSS, and F/M to the summer and winter values for BOD 5 removal efficiency.
This exercise yielded no conclusive results; the analysis found some plants
with poor winter performance to have higher MLSS concentrations and lower F/M
ratios (which should help to compensate for lower temperatures), while other
poor winter performers had the opposite trend in operating conditions. There
also appeared to be no correlation between plant location (northern or
Vll-lO0

southern) and seasonal ope ra t ing parameters . This e x e r c i s e a l so found p lan t s
in northern climates achieving high year-round performance with very little
variation in seasonal MLSS, MLVSS, and F/M values. Therefore, it seems that
good plant performance is a function of a combination of factors (including
system design, operating parameters, and operating procedures) whose separate
contributions cannot be readily determined based on the level of information
gathered in this segment of the Section 308 Questionnaire.
Operational Changes
Two plants (948 and 2394) were identified as having made operational or
process changes in an effort to improve efficiency and provide at least
partial compensation for temperat'ure.
Plant #948, which has a warm process effluent, has instituted several
operational changes in winter months to improve the performance of its
biological treatment system. First, it turns off some of its cooling towers
to compensate for greater heat loss during winter months. The facility also
decreases the number of aerators by 5 percent since there is significant heat
loss during the aeration process. The MLSS level and sludge age are increased
by decreasing the sludge wastage rate. These measures increase the sludge's
capacity to oxidize and metabolically assimilate organic material. A disad-
vantage of the increased sludge age is that sludge settling characteristics
are adversely affected. The plant largely compensates for this by increasing
the polyelectrolyte dosage to the influent to the clarifier in the winter.
A second facility, Plant #2394, has also instituted process modifications
to improve the performance of its activated sludge system in the winter. In
the summer,,the plant uses a preaeration basin followed by a single stage
activated sludge unit and secondary clarifiers. In the summer, sludge from
the clarifiers is recycled to the activated sludge unit. In the winter,
sludge from the clarifiers is recycled to the preaeration unit, thus con-
verting it,into a second biological unit. In summary, the installation of
additional piping to allow flexibility in the sludge recycle point allows the
plant to have a one-stage biological treatment system in the summer and a
two-stage system in the winter.
VII-IOI

Data are not available for Plant #948 to correlate its operational
changes with removal efficiency. Monthly monitoring data are available for
Plant #2394, although the plant was excluded from the 21-plant data base for
calculating BPT variability factors because the treatment system was modified
during the period of record and the effluent data were collected after terti-
ary treatment. Monthly BOD s influent and effluent levels (IBOD 5 and EBODs),
TSS effluent levels (ETSS), and removal efficiencies for Plant #2394 are
presented in Table VII-34 for the period December 1981 to March 1984. The
results are inconclusive. They show reduced efficiency during the months of
January and February. They also show an efficiency increase of 19 percent
between January 1982 and January 1983, and an increase of 13 percent between
February 1982 and February 1983. The efficiency for January 1984 then drops
by 7 percent from the preceding January, but the February 1984 efficiency of
95 percent is the same as the efficiency of the preceding February. The sharp
efficiency increese between 'winter 1982 and winter 1983 suggests the effec-
tiveness of the operational changes, but the reasons for the decrease between
January 1983 and January 1984 cannot be determined from the available data.
It is not known if production changes occurred during that period.
Conclusion
Results of the BOD s removal efficiency, BOD s effluent, and operational
changes analyses performed above show a slight reduction in efficiency at some
plants during the months of Januar3rand February. Efficiencies vary widely
among plants, and many plants have attained efficiencies of 95 percent or
greater for all months of the year. This suggests that the plants with lower
efficiencies are affected as much by inefficient operating practices as by
winter temperature considerations. Adoption of certain practices used by
plants with higher winter efficiencies by these plants should result in
improved winter efficiency.
Technologies and operating techniques exist that, if properly applied,
can compensate for temperature. Plants operating in cold weather conditions
should recognize that excessive storage prior to treatment may reduce the
temperature of the biotreatment system. Cold weather operation may require
insulation of treatment units, covering of open tanks, and tracing of chemical
VII-f02

TABLE Vli-34. MONTHLY DATA FOR PLANT #2394
1981 December
1982 January February March April May June July August September October November December
1983 January February March April May June July August September October November December
1984 January February March
Average Influent
BOD_ (mg/~)
396
311 475 484 468 364 416 350 608 427 570 530 521
377 457 420 387e 404 436 332 474 364 415 388 351
295 397 354
Average Effluent
BOD. (mg/~)
59
76 84 38 9 5 5 2 2 3 9 9
14
20 21 13 8 5 4 3 3 3 4 8 Ii
35 21 15
Average BOD 5 Effluent Removal
TSS (mg/l)
Efficiency(z)
26 0.85
20 0.76 20 0.82 22 0.92 24 0.98 14 0.99
. 19 0.99 13 0.99 8 1.00 7 0.99 8 0.98 I0 0.98 15 0.97
15 0.95 14 0.95 14 0.97 22 0.98 17 0.99 17 0.99 13 0.99 8 0.99 I0 0.99 13 0.99 21 0.98 15 0.97
24 0.88 25 0.95 26 0.96
V I I - I 0 3

feed lines. Insulation may include installing tanks in the ground rather than
aboveground, using soil around the walls of aboveground units, or enclosing
treatment units. During colder periods, maintenance of higher MLSS concen-
trations and suitable, reduced F/M may be necessary. Plant-specific
techniques, such as those used at Plants #948 and #2394, should also be
applied.
Another case study, cited in vendor literature, discusses cold weather
modifications for a biological treatment system at a West Virginia polyester
resin manufacturer. During the winter, the plant uses its equalization basin
for biological contact stabilization before the wastewater enters the
biological aeration basin. The plant replaced some of its aerators with
mechanical aerators especially designed for cold weather operation and added
similar aerators to the equalization basin for winter use. The new aerators
designed specifically for winter conditions provide "aeration, mixing, and 02
transfer without the temperature loss of conventional aerators during cold
weather." The West Virginia facility now achieves "a 99 percent BOD removal,
with influent BOD at 2,500 mg/l and effluent at 20 mg/1--even in the winter."
Part of the improvement in effluent quality was attributed to warmer basin
temperature (7-13).
Two other points should be made. First, temperature is only one of many
factors that impacts wastewater treatment performance. Waste load variations,
biomass acclimation, flow variations, waste treatability, and temperature of
the wastewater as well as adequacy of treatment system design and operation
must all be considered. The interaction among these factors makes it diffi-
cult to isolate any one factor separately. Temperature considerations must be
viewed as specific to a given site in the context of these factors, rather
than as specific to a given geographic area.
Secondly, EPA has taken the cost of improving winter efficiency into
account by using the minimum State temperature in the K-rate equation for
estimating costs for full-scale and second-stage biological systems and by
adding a cost factor for biological upgrades. The cost factor ranges from
1.0 to 2.0 and is also based upon a Starers minimum average ambient
temperature. Both State minimum temperature and the biological upgrade cost
factor are discussed in more ,detail in Section VIII.
VII-104

4. Polishing and Tertiary Treatment Technologies
Polishing technologies consist of polishing ponds, filtration, and
chemically assisted clarification (CAC). Tertiary treatment includes only
activated carbon treatment.
a. Polishing Ponds
Polishing ponds are bodies of vastewater, generally limited to 2 to
3 feet in depth, used for the removal of residual suspended solids by
sedimentation. They are usually used as a tertiary treatment step following
biological treatment. Depending on the nature of the pollutant to be removed
and the degree of removal required, the polishing treatment system can consist
of one unit operation or multiple unit operations in series.
According to the Section 308 Questionnaire data base, 64 OCPSF plants
reported using polishing ponds as an end-of-pipe treatment. Originally, 18 of
these 64 plants were used to establish treatment performance limits for BPT
Option II. However, following the December 9, 1986, Federal Register Notice
of Availability, the Agency carefully reviewed the BPT data base identifying
plants that reported having polishing ponds, and evaluated the data that they
provided. The 18 plants used to calculate BPT Option II effluent limitations
met the preliminary BPT effluent criteria, which was 95 percent removal of
BOD 5 across the treatment system or an effluent BOD s concentration equal to or
less than 50 mgll and an effluent TSS concentration equal to or less than
100 mgll.
The Agency reviewed the information provided in response to the Section
308 ,Questionnaires and contacted permit writers In the Regions and/or States
in which the facilities were located. The results of this effort identified
16 of the 18 plants as not containing BPT Option II treatment systems. Only
two plants are actually using their ponds as a final polishing step to remove
suspended solids and BOD s from the effluent produced by a biological system
operating at a BPT Option I level. A summary of the results of this evalu-
ation is given in Table VII-35. K description of the 16 plants without the
BPT Option II technology follows. Seven of the 16 plants combine treated
wastewater from the biological treatment system with other wastewaters in a
VII-f05

TABLE VII-35. MATRIX OF 18 PLANTS WITH POLISHING
PONDS USED AS BASIS FOR BPT OPTION II LIMITATIONS
Plant ID
157
267
284
384
50O
811
866
948
990
1020
1061
1438
1695
1698
1717
2471
2528
4017
TOTAL
Pond Serves as
Equalization Basin
X
X
X
X
X
X
X
7
Pond Pond Pond Pond Serves as Serves as Known to Serves as Secondary Reaeration Have Algae a Final Clarifier Basin Problem Polish
X
X
X
X
X
X
X
X
X
X
7 I I 2
VII-106

final pond. Since these ponds mix different wastewaters, they achieve some
dilution of treated process wastewater prior to discharge. Because the actual
removal of the pollutants through biodegradation or settling cannot be
demonstrated, these ponds cannot be characterized as polishing ponds. Another
plant uses a "polishing pond" as a reaeration basin to increase the level of
dissolved oxygen (DO) in its effluent and to prevent a depressed oxygen level
from occurring in the receiving stream. Finally, one plant is known to have
an algae problem associated with its pond operation during the summer months,
that indicates that this plant may not be meeting the BPT Option II criteria
during part of the year.
As f o r the r ema in ing 30 p l a n t s t h a t r e p o r t e d hav ing p o l i s h i n g ponds t h a t
were not used to form the b a s i s f o r the BPT Option I I l i m i t s , f o u r p l a n t s t h a t
r e p o r t e d e f f l u e n t BODs, TSS, and flow d a t a d id not meet the BPT Option I I
c r i t e r i a . F i f t e e n p l a n t s d id not r e p o r t any BOD 5 or TSS d a t a ; seven of t he se
15 p l a n t s use t h e i r ponds as a s econda ry c l a r i f i c a t i o n s t e p , and s i x p l a n t s
use t h e i r ponds as a f i n a l mixing s t e p . The r ema in ing 11 p l a n t s were not used
because t h r e e p l a n t s have BPT Option I I I t r e a t m e n t ( f i l t r a t i o n ) ; one p l a n t
r e c y c l e s w a t e r back to i t s p r o d u c t i o n p r o c e s s e s from the pond; one p l a n t i s an
indirect discharger; two plants discharge from their polishing ponds into
subsequent treatment stages; and four plants do not use biological treatment.
Based on the above information, the Agency concluded that the use of polishing
ponds to provide additional removal of conventional pollutants (BOD S and TSS)
beyond that achievable by well-designed and well-operated biological treatment
(Option I) is not successfully demonstrated in the OCPSF industry.
b. Filtration
F i l t r a t i o n i s an e s t a b l i s h e d u n i t o p e r a t i o n f o r a c h i e v i n g the removal of
suspended s o l i d s from w a s t e w a t e r s . The removal i s accompl i shed by the passage
of wa te r th rough a p h y s i c a l l y r e s t r i c t i v e medium ( e . g . , sand, c o a l , g a r n e t , or
d i a tomaceous e a r t h ) wi th r e s u l t i n g en t rapment of suspended p a r t i c u l a t e m a t t e r
by a complex p r o c e s s i n v o l v i n g one or more removal mechanisms, such as
s t r a i n i n g , s e d i m e n t a t i o n , i n t e r c e p t i o n , impac t i on , and a d s o r p t i o n . Cont inued
f i l t r a t i o n r e d u c e s the p o r o s i t y of the bed as p a r t i c u l a t e m a t t e r removed from
the w a s t e w a t e r a c c u m u l a t e s on the s u r f a c e of the g r a i n s of the media and in
Vll-107

the pore spaces between grains. This reduces the filtration rate and
increases the head loss across the filter bed. The solids must be removed by
"backwashing" when the head loss increases to a limiting value. Backwashing
involves forcing wash water through the filter bed in the reverse direction of
the original fluid flow so that the solids are dislodged from the granular
particles and are discharged in the spent wash water. When backwashing is
completed, the filter is returned to service.
Filtration is an established wastewater treatment technology currently in
full-scale use for industrial waste treatment. Filtration has several
applications: i) pretreatment to remove suspended solids prior to processes
such as activated carbon adsorption, steam stripping, ion exchange, and
chemical oxidation; 2) removal of residual biological floc from settled
treatment process effluents; 3) removal of residual chemically coagulated floc
from physical/chemical treatment process effluents; and 4) removal of oll from
oil separation and dissolved air flotation effluents.
According to the Section 308 Questionnaire data base, 410CPSF plants use
filtration as a polishing technology. EPA evaluated BPT Option IIl (bio-
logical treatment plus multimedia filtration) technology to determine if this
option could achieve, inca practicable manner, additional conventional pollu-
tant removal beyond that achievable by well-designed, well-operated biological
treatment with secondary clarification. Eleven plants in the BPT data base
use BPT Option III technology and meet the final BPT editing criteria. Thus,
this option would require EPA to regulate all seven subcategories based upon a
very small data set. As shown in Table VII-36, the median effluent TSS
concentration value for these plants is 32 mg/l. Even if three additional
plants are included in this data base because they use Option I treatment plus
either ponds or activated carbon followed by'filters, the resulting median TSS
value is 34 mg/1. These results, when compared to the performance of
clarification only following biological treatment (median value of 30 mg/1),
clearly show that the efficiency of filtration following good biological
treatment and clarification is not demonstrated for this industry. Moreover,
on the average, OCPSF plants with more than Option I treatment in EPA's data
base (biological treatment plus filtration) have not demonstrated significant
BOD~ removal beyond that achievable by Option I treatment alone. The median
Vll-108

TABLE VII-36. OPTION III OCPSF PLANTS WITH BIOLOGICAL TREATMENT
PLUS FILTRATION TECHNOLOGY THAT PASS THE BPT EDITING CRITERIA
Plant ID
2551
1943
102
2536
883
2376
1343
2328
909
1148
844
Median value
Effluent TSS (mg/l)
9
16
18
18
27
32
36
37
41
46
54
32
Effluent BOD 5 (mg/l)
II
22
7
3
20
27
8
19
21
37
5
19
VII-f09

BODs c o n c e n t r a t i o n v a l u e f o r t h e s e p l a n t s i s 19 mg/1 compared to a median
v a l u e o f 23 mg/1 BOD 5 f o r tlhe p l a n t s w i t h Op t ion I t e c h n o l o g y in p l a c e which
meet t he 95 p e r c e n t / 4 0 mg/1 BOD s e d i t i n g c r i t e r i a . T h e r e f o r e , EPA does no t
b e l i e v e t h a t t he d a t a s u p p o r t any f i r m e s t i m a t e o f i n c r e m e n t a l p o l l u t a n t
removal b e n e f i t s and i n c r e m e n t a l c o s t s f o r BPT Op t ion I I I .
One commenter suggested that, in light of the apparent poor incremental
performance of filters in the OCPSF industry, EPA should transfer data from
non-OCPSF filtration operations, specifically from domestic sewage treatment.
EPA has evaluated the additional removal achievable by multimedia filtration
on the effluent from the biological treatment of domestic sewage. Data found
in EPA's "Process Design Manual for Suspended Solids Removal" (EPA 625/1-
75-003, January 1975) indicates that multimedia filtration achieves a median
of 62 percent removal of TSS from biological treatment effluent TSS levels of
25 mg/1 or less.
The Agency also considered transferring multimedia filtration performance
data from the pharmaceutical manufacturing point source category for use in
the development of BPT Option III (biological treatment plus filtration)
limitations. Daily data across multimedia filtration systems at three
pharmaceutical plants demonstrated that effluent concentrations of TSS from
advanced biological treatment in that industry could be reduced by 50 percent
over a 15 to 100 mg/1 influent concentration range by multimedia filtration
(no removal of BOD s across multimedia filtration was demonstrated). This
concentration range covers the range of performance of OCPSF plants that meet
the Agency's Option I 95 percent/40 mg/1 (BODs) and 100 mg/l (TSS) editing
criteria to define well-designed and well-operated biological treatment.
However, the OCPSF industry filtration data do not indicate any
substantial TSS or BOD s removal beyond that achieved by Option I technology.
This indicates that differences in the biological solids in the OCPSF industry
may be responsible for the lack of filtration effectiveness. For example, if
the OCPSF biological floc (solids) were to break into smaller sized or
colloidal particles, they could pass through the filter substantially
untreated. While EPA cannot be certain whether this occurs, the data indicate
VII-110

that filters in this industry are not as effective in removing OCPSF waste-
water solids as they may be for domestic sewage or certain other industry
wastewater solids. EPA does not believe that the appropriateness of
transferring data from these other wastewaters to the OCPSF industry is
demonstrated.
c. Chemically Assisted Clarification (CAC)
Coagulants are added to clarifiers (chemically assisted clarifiers) to
enhance liquid-solid separation, permitting solids denser than water to settle
to the bottom and materials less dense than water (including oil and grease)
to flow to the surface. Settled solids form a sludge at the bottom of the
clarifier, which can be pumped out continuously or intermittently. Oil and
grease and other floating materials may be skimmed off the surface.
Chemically assisted clarification may be used alone or as part of a more
complex treatment process. It may also be used as:
The first process applied to wastewater containing high levels of settleable suspended solids.
The second stage of most biological treatment processes to remove the settleable materials, including microorganisms, from the wastewater; the microorganisms can then be either recycled to the biological reactor or discharged to the plant's sludge handling facilities.
The final stage of most chemical precipitation (coagulation/ flocculation) processes to remove the inorganic flocs from the wastewater.
As discussed in Section VIII, chemically assisted clarification was a
component of the model wastewater treatment technology for estimating the BPT
engineering costs of compliance. First, when biological treatment was in
place (with or without secondary clarification), an additional chemically
assisted clarification unit operation was costed if the reported TSS effluent
concentmation was more than 3 mg/1 above the plant's long-term average
compliance target. Second, for plants that do not need biological treatment
to comply with their BOD s compliance targets, chemically assisted clarifi-
cation unit operations were costed if the reported TSS effluent concentrations
were more than 3 mg/1 above the long-term average compliance target.
VII-lll

Although chemical addition was not frequently reported by plants in the
OCPSF industry, chemically assisted clarification is a proven technology for
the removal of BOD s and TSS in a variety of industrial categories, partic-
ularly in the pulp and paper industry. Case studies of full-, pilot-, and
laboratory-scale chemically assisted clarification systems in the pulp and
paper industry as well as other industrial point source categories are
discussed in the following sections.
Full-Scale Systems
Several full-scale, chemically assisted clarification systems have been
constructed in the pulp, paper, and paperboard industry and in other indus-
trial point source categories. Data on the capability of full-scale systems
to remove conventional pollutants are presented below.
Recent experience with full-scale, alum-assisted clarification of
biologically treated kraft mill effluent suggests that final effluent levels
of 15 mg/1 each of BOD 5 and TSS can be achieved. The desired alum dosage to
attain these levels can be expected to vary depending on the chemistry of the
wastewater to be treated. The optimum chemical dosage is dependent on pH.
Chemical clarification following activated sludge treatment is currently
being employed at a groundwood (chemi-mechanical) mill. According to data
provided by mill personnel, alum is added at a dosage of about 150 mg/1 to
bring the pH to an optimum level of 6.1. Polyelectrolyte is also added at a
rate of 0.9 to 1.0 mg/1 to :improve flocculation.
Neutralization using NaOH is practiced prior to final discharge to bring
the pH within acceptable discharge l imits . The chemical/biological solids are
recycled through the activated sludge system with no observed adverse effects
on biological organisms. Average reported results for 12 months of sampling
data (as supplied by mill personnel) show a raw wastewater to final effluent
BOD 5 reduction of 426 to 12 mg/l, and TSS reduction of 186 to 12 mg/l.
VII-If2

Treatment system performance a t the mi l l was eva lua t ed as par t of a s tudy
conducted for the EPA (7-14) . Data ob ta ined over 22 months show average f i n a l
e f f l u e n t BOD 5 and TSS c o n c e n t r a t i o n s of 13 and 11 mg/1, r e s p e c t i v e l y . As par t
of this study, four full-scale chemically assisted clarification systems in
other industries were evaluated. Alum coagulation at a canned soup and juice
plant reduced final effluent BOD s concentrations from 20 to Ii mg/l, and TS$
levels from 65 to 22 mg/l. Twenty-five mg/l Of alum plus 0.5 mg/l of poly-
electrolyte are added to the biologically treated wastewater to achieve these
final effluent levels. Treatment plant performance was evaluated at a winery
where biological treatment followed by chemically assisted clarification was
installed. Final effluent levels of 39.6 mg/l BOD s and 15.2 mg/l TSS from a
raw wastewater of 2,368 mg/l BOD s and 4,069 mg/l TSS were achieved. The
Influent wastewater concentrations to the clarification process were not
reported. The chemical dosage was I0 to 15 mg/l of polymer (7-14~. A
detailed summary of the results of the study of full-scale systems is pre-
sented in Table VII-37 (7-14).
In October 1979, ope ra t i on of a f u l l - s c a l e chemica l ly a s s i s t e d
c l a r i f i c a t i o n system t r e a t i n g e f f l u e n t from an ae r a t ed s t a b i l i z a t i o n bas in at
a n o r t h e a s t e r n bleached k r a f t m i l l began. This p lan t was des igned and
c o n s t r u c t e d a f t e r complet ion of ex t ens ive p i l o t - s c a l e s t u d i e s . The purpose of
the p i l o t p lan t was to demonstra te tha t proposed water q u a l i t y l i m i t a t i o n s
could be met through the use of chemica l ly a s s i s t e d c l a r i f i c a t i o n . Af te r
demons t ra t ing tha t i t was pos s ib l e to meet the proposed l e v e l s , s t u d i e s were
conducted to op t imize chemical dosages. The t e s t i n g conducted showed tha t the
alum dosage could be reduced s i g n i f i c a n t l y by the a d d i t i o n of ac id for pH
c o n t r o l , whi le s t i l l a t t a i n i n g s u b s t a n t i a l TSS removal. In the p i l o t - s c a l e
s tudy , i t was shown tha t t o t a l a l k a l i n i t y , a measure of a sys t em ' s b u f f e r i n g
c a p a c i t y , was a r e l i a b l e i n d i c a t o r of wastewater v a r i a t i o n s and t r e a t a b i l i t y .
Through t h i s s tudy, a d i r e c t r e l a t i o n s h i p between t o t a l a l k a l i n i t y and alum
demand was shown. High a l k a l i n i t y (up to 500 mg/1) caused by the d i s cha rge of
b lack l i q u o r or l ime mud x e s u l t s in high alum demands. There fo re , a sub-
s t a n t i a l po r t i on of alum dosage can be used as an expensive and i n e f f e c t i v e
means of reduc ing a l k a l i n i t y (pH) to the e f f e c t i v e pH point (5 to 6) for
optimum c o a g u l a t i o n . The use of ac id to a s s i s t in pH op t im iza t i on can mean
s u b s t a n t i a l cost savings and r educ t i on in the alum dosage r a t e r equ i r ed to
VII-ll3

Table VI I -37. S u m m a r y of C h e m i c a l l y Assisted Clar i f icat ion
T e c h n o l o g y P e r f o r m a n c e Data
Maximum ~0 Surfaca O~e~ Added and NPOES Permit Ave, lee of Pe,lod Clanflet Max,mum Day C o n s e t u l ~ Recent Removall flow Italic, De . . . . A~uramOeO . . . . . . . . Pe . . . .
Malof Indu$tlgd Sub I n f l ~ t Effluent C~arlher Eifluent OayI ~ l ~ l / ~ r o u ClaMflet i nd Detention Bate Ma ay Plant Influent Industmll Plant i nd category Oe~cnptlon of CLanhar Effluent Time AwtllBe j j ! Categmy L~c|lion . . . . . . . . . . Bi . . . . . . . . . . . . . . . . . BOOs ] TS$ J BOO 3 J TSS BOO31 TSS BOO S I TSS BOO I TSS BOO B TSS Flow BOOs I TSS
r ,= ,r,~ Pape, B 12 G*o~nd',~,~o~ Ae,al~l Stal~.Zah~ Barn Av.~age i Av'a,a~e Avemage Ba~ed on I Based ~1 12 Based on anuual a~-~age Fo, annual ~ ,ow A6m 30 Day I
1 ~,~ ol 12 ot 12 of 13 n~lh~ 12 mo~,hs I rn~ths O~ -Sase~ ~ ~an Of 30 ol I 6 MGO ~ 9a~ avenge MGD I~ " ~ o11 , ,e , ,~ ~, ,2 nl~llb~
Cl~n, Mect, 2 I~ 8003 10001 u It O ~ h$ of I tl~ hS ~ t h S OI I ol dal~ data o1 da~ oa~ data con~cul,ve day ~ e s d~ay'sQ 11 Sd~a 275 Ib O ~,~ge 12 ntonms I ot da#y dat~ H'~ltaul~dete.,l~, ,.~ da,Iy data I ol damly Ida@ dala data J N O 87% B .... ~MOD lda'a I I F= max day how Otde~ No 74 6~ of IB J uf daay dala
of 2 8 MOO 641 NPDESNo monlhs I I N,,,~n ~d r, ho~.~,,,,. J J
J 12957 1407 J ]728 5044 15026 2013 2503 J gal. day,sol B C A O 0 ~ I ol d~lly
l elfec.~ i July 75 data I l Ib?day Ib day Ib,day I Ib/~y
Avera~M~ ul A~'(Y,I~4~ Average lA~t~'~ Fcw a n ~ ~ a g e Alum Average Fna~ how of 7 ~ - I . . . . . ,oiO mo~ms I of 1O of 10 ol TO months 10 months mo~th~ ol mo~ths~% j /5% how of 1 9 MGD 150 mg t 22m9~ i
da~ I months m,~J~ths ol da~'y data Of ~v J~V ~ la 432 gal,dayl~q It average Max ,~y ] ~ , Day A~=ge I N O , ~,,.. ol ,~,,~ data dala of dady J ol dady I data I Based on mean ot 30 con FOl m, tx day dOw l~yrr, er O S F~J0 to O ~00 b O ol IO [
scout,re da~ a,~ages of 2 5 MGD -'~M rag, 1 avelage 30 mg I I~o,~, mombe of
-I ~ _4, A.-,~ =Dato,
id=, i~, . ] ~,3~ ,~03 ~ 7 i ~ 9 I
g~i,day,sq h i davy data I
Ib day Ibcday ] It) day Ib.day Ib,da¥ Ib,day Ib day J Ib,day J i
Synlhel~ FIDe( Oaoon ar~ Achvaled s~uOge lexter~ed Dala nol p~o~mded I Ave,age ol A~age ol Oala nol ~ov,ded Oala nol pro~ed Data not avadab~e tm Fc~ average pe~ ~r,~ only Dady I Daily Data no1 i~ov~el/ I Ma, lu laCl~ elhlyef~e g~y¢ol ae~a l~ F M O 05 Io 0 I Ib 4 quar~edy I 4 quadetly i cab:ulai~ons II~ ca.c~,c O ~O a~efage I a~.~ge J
< BOO S al~o~*d Ib MLSS I J ~,e~8,ges ~ av'~a(ge~ j 2 097 MGD mg I Average
I I ""~ I . , , . 2209al 'O,sq t t 7 3 m g lcbem~cals chemicals I
J ~ours detent~o NPDES No NC00B(~o63 J M~SS ~ , , I I . . , ~ ,D I ~ D 31 Dec 73 Io lI I I 31 Dec 76
I I I I Ave max flow 2 5 J I
4>" I - - ~ I
TI
I ~ I - I + t-MGD I
I l
i I
I
For S,te r~'¢stem: Hvd,aul~ delenho~ t , ~ ~0 Data not O¢~v,ded Ave,age of i AvefaDe of 4 Data n~l p f o v l ~ Data not prov~¢d Data not avadabte im FO~ a~rage pe.,~J NoDe added Oad~ ]Dally Oala not ~ ' ~ e d hou,s at 2 MGD ' 4 quarterly quarterly I maximum maMimum
j Cakulat~s j 167 MGD N,t~ogen and phosphorous i I averages I averages
WllhOUt without
° ° ~ I I ....... t . . . . . . . . I I ,,~ 9,,,'D,~ B ] i7 hours ~tenl~
t I '3, 'b B I r ~ a ' ~ D I I" I o . y ,~ , . !e I i ~ e s fdl~ IoBow'ed by aerated ave~aOe ~ a g e bdCk up data j to~ calcmat~ ~ 43MGD 35 ! had no leco~d ; 49 n~, I TSS ,~efaqe a~raqe Numbe~ p~ov~l~'d r=o
l a ( j ~ wdh B days ~elenpon J u ~ '75 IOI June '75 J h~r$ delent~ ol when I Dady rr~x~gm - I Number J Numbel backup data provided with sub ~Jdate slal~ ae~at~ May '76 to May '7B J t .:rn~ chem,cMs ~i 30m 3 I TSS p~ov=ded Jpr~ed 18" dlamete~ ~ 12 feet long 20 m*g/I I~r~, Dmg,I 2 2 m ~ I o/not Dwly a~rage no back no backup
Can~ ~o~ o 2 s t ~ e trawls.9 l~le, Annua~ Annual I F~u,~ ~ w,tho~t Data not ~ov,ded )~ta not p f ~ NO l:,z~ckup data Nm~=d 5~ 9al day sq fi Campbell ~ 4 3 MGOI473 mg I ~ mQ I average
~ . . . . . . . I " . . . . I . . . . . . I . . . . . . I i ]0 mg/I BOO B up data I data provided dala up data average j average Alum can be ~Oally maximum p r ~ e d prov~d J p~Kled J June 75 " June 25 I ad~ a, 179~ 4 BOO s I
l I '° ~aY 7B j ,oMay 7B I lagoo~ efBuefll NO H221 kO ]
I iI ~ I Pcav~ adbe,d
I I ao, t~lore
I I I I I :la.h~s 0 5 J t
I I I I I :mg' l 1 I ]
W,~ Making Acl,vamd sludge Average of I A~mge Average ol ben~ bc~n Data abet ~st aera )ala not avada~ Average ol pe*~l hO~, Ap~,l AI av~age flow Polymer at 10 Pfcxess Sea.on 0177 !2~ m9,l 121"o,9'18 9 Ib BOO 1000 cu h ~ Ir~ oi ~r~ Apt" 26 1976 to July 31 ~*~ and ch~,nah~ 26 ~9761o July31 1976 OlTMGD 15 mg ~ 3a,ly ave,age MGD I
M - 0 0 ? Al~d 2'5 born 1976 ~ mg I I 140 9a~ O sh,fl TeM,ng be~,J 30 m 9 f BOO Average ol I.~r~Jd Ap~,I 2~ 1376 to July 31 MLSS - ~ mg I 376 Io J Ap.I 2~ 38 6 m 9 I B 2 m 9 Io~ perked April 96 N A I ~ 6 % 11S hC*Jr~$ ~or ~op~ Dady maxmmum B 1976 Dc,em~nT~e : 8 days July 31 I 1916 to J Data ahe~ post ~926 to July 31. 1976 l dOC~De ' ~ mD,I BOD B CautIOlt - dO~s not indud~ Ihe I~e$$1n 9 el 0176MGD 1976 i Judy 31 and chlc~mahon I Oa,ly aveMge ~ason wh~h i$ the season of hlDhes~ Phosph~o{l~ and ndr(~jen i~97 B I I m 9 I TSS I~dlng I I added 9 ~ , ~ i ,.o0s ~9 , I I D~,y I i
I [ I ] 50 n,g I TSS l ]

e f f e c t c o a g u l a t i o n . In one i n s t a n c e , use of c o n c e n t r a t e d s u l f u r i c a c i d f o r pH
r e d u c t i o n d e c r e a s e d alum demand by 45 p e r c e n t . Acid a d d i t i o n was a l s o
effective in reducing alum dosage for wastewaters with low alkalinity
(approximately 175 mg/l) (7-15).
Table Vli-38 summarizes effluent quality of the full-scale system since
startup; this system has been operated at an approximate alum dosage rate of
350 mg/l without acid addition. Recent correspondence with a mill represen-
tative indicated that, with acid addition, this dosage rate could be reduced
to 150 mg/l (7-16). However, this lower dosage rate has not been confirmed by
long-term operation.
Scott et al. (7-17) reported on a cellulose mill located on the shore of
Lake Baikal in the USSR. The mill currently produces 200,000 kkg (220,000
tons) of tire cord cellulose and II,000 kkg (12,100 tons) of kraft pulp per
year. Average water usageis 1,000 kl/kkg (240 kgal/t). The mill has strong
and weak wastewater collection and treatment systems. The average BOD s for
the weak wastewater system is i00 mg/l, while the strong wastewater BOD s is
400 mg/l. Only 20 percent of the total wastewater flow is included in the
strong wastewater system. Each stream receives preliminary treatment con-
Sisting of neutralization of pH to 7.0, nutrient addition, and aerated
equalization. Effluent from equalization is discharged to separate aeration
and clarification basins. These basins provide biological treatment using a
conventional activated sludge operation. Aeration is followed by secondary
clarification. Suspended solids are settled, and 50 percent of the sludge is
returned to the aeration process. Waste sludge is discharged to lagoons. The
s e p a r a t e s t r eams a r e combined a f t e r c l a r i f i c a t i o n and a r e t r e a t e d f o r c o l o r
and suspended s o l i d s removal in r e a c t o r c l a r i f i e r s wi th 250 to 300 mg/1 of
alum and 1 to 2 mg/1 of p o l y a c r y l a m i d e f l o c c u l a n t , a n o n i o n i c polyme r . The
c l a r i f i e r s have an o v e r f l o w r a t e of a p p r o x i m a t e l y 20.4 m3 per day/m 2
(500 g p d / f t 2 ) .
Chemical clarification overflow is discharged to a sand filtration
system. The sand beds are 2.9 m (9.6 ft) deep with the media arranged in five
layers (7-18). The sand size varies from 1.3 mm (0.05 in) at the top to 33 mm
(1.3 in) at the bottom. The filter is loaded at O.11 m 3 per minute/m 2
VII-II5

TABLE VII-38. FINAL EFFLUENT QUALITY OF A CHEMICALLY ASSISTED
CLARIFICATION SYSTEM TREATING BLEACHED KRAFT WASTEWATER
BOD 5 (mg/l) TSS (m~/l) Average Average
Date for Month Maximum Day for Month Maximum Day
September 1979 Ii 21 87 254
October 1979 8 12 40 92
November 1979 9 18 28 47
December 1979 21 83 21 56
January 1980 8 16 28 36
February 1980 7 14 31 68
March 1980 13 46 44 113
April 1980 9 16 32 96
May 1980 ii 22 38 80
VII-ll6

(2.7 gpm/ft2). Effluent from sand: filtration flows to a settling basin and
then to an aeration basin; both basins are operated in series and provide a
7-hour detention time.
The effluent quality attained is as follows:
Parameter Raw Waste Final Effluent
BOD s (mg/l) 300 2 Suspended Solids (mg/l) 60 5 pH -- 6.8 - 7.0
Individual treatment units are not monitored for specific pollutant
parameters.
P i l o t - a n d Laboratory-Scale Systems
Several labora tory- and p i l o t - s c a l e s tudies of the app l ica t ion of
chemically assisted clarification have been conducted. Available data on this
technology to remove conventional pollutants based on laboratory- and pilot-
scale studies are presented below.
As part of a study O f various solids reduction techniques, Great Southern
Paper Co. supported a pilot-scale study of chemically assisted clarification
(7-19). Great Southern operates an integrated unbleached kraft mill.
Treatment consists of primary clarification and aerated stabilization followed
by a holding pond. The average suspended Solids in the discharge from the
holding pond were 65 mg/1 for the period January I, 1973, to December 31,
1974. In tests on this wastewater, 70 to i00 mg/1 of alum at a pH of 4.5
provided optimum dosages; the removals after 24 hours of settling ranged from
83 to 86 percent. Influent TSS of the sample tested was 78 mg/1. Effluent
TSS concentrations ranged from II to 13 mg/1.
In a recent EPA-sponsored laboratory study, alum, ferric chloride, and
lime in combination with five polymers were evaluated in further treatment of
biological effluents from four pulp and paper mills (7-20). Of the three
chemical coagulants, alum provided the most consistent flocculation at minimum
dosages, while lime was the least effective of the three. However, the study
VII-f17

provides the optimum chemical dosage for removal of TSS from biologically
treated effluents. These inconclusive findings are the result of a number of
factors, including the lack of determination of optimum pH to effect removal
of TSS; the lack of consideration of higher chemical dosages when performing
laboratory tests even though data for some mills indicated that better removal
of TSS was possible with higher chemical dosage (a dosage of 240 mg/1 was the
maximum considered for alum and ferric chloride, while 200 mg/1 was the
maximum dosage used for lime); the testing of effluent from one mill where the
TSS concentration was 4 mg/1 prior to the addition of chemicals; and the elim-
ination of data based simply on a visual determination of proper flocculation
characteristics.
Laboratory data on alum dosage rates for chemically assisted
clarification have been submitted to the Agency in comments on the pulp,
paper, and paperboard contractor's draft report (7-21). Data submitted for
bleached and unbleached kraft pulp and paper wastewaters indicate that
significant removals of suspended solids occur at alum dosages in the range of
I00 to 350 mg/1 (7-22, 7-23, 7-24). For wastewaters resulting from the
manufacture of dissolving sulfite pulp, effluent BOD 5 and TSS data were
submitted for dosage rates of 250 mg/1; however, it was stated that dosages
required to achieve an effluent TSS concentration on the order of 15 mg/l
would be in the range of 250 to 500 mg/1 (7-25). During the pulp, paper, and
paperboard rulemaking, NCASI assembled jar test data for several process types
and submitted it to the Agency (7-26). Data for chemical pulping subcategories
indicated that alum dosages in the range of 50 to 700 mg/1 will effect
significant removals of TSS. The average dosage rate for all chemical pulping
wastewaters was 282 mg/1. Data sub,nitted for the groundwood, deink, and
nonintegrated-fine papers subcategories indicate that dosages in the range of
i00 to 200 mg/1 will significantly reduce effluent TSS.
Data on the frequency of this technology are not available for the OCPSF
industry although data on the frequency of other similar technologies
(coagulation, flocculation, clarification, chemical precipitation) have been
previously presented. However, based upon the above information and upon the
general performance of clarifiers in treating TSS, EPA has concluded that
chemically assisted clarification can treat TSS in non-end-of-pipe biological
plants to meet the BPT TSS limits.
VII-ll8

d. Activated Carbon Adsorption
Activated carbon adsorption is a physical separation process in which
organic and inorganic materials are removed from wastewater by sorption or the
attraction and accumulation of one substance on the surface of another. There
are essentiaIly three consecutive steps in the sorptlon of dissolved materials
in wastewater by activated carbon. The first step is the transport of the
solute through a surface film to the'exterior of the carbon. The second step
is the diffusion of solute within the pores of the activated carbon. The
third and final step is sorption of the solute on the interior surface bound-
ing the pore and capillary spaces of the activatedcarbon. While the primary
removal mechanism is adsorption, biological degradation and filtration also
may reduce the organics in the solution.
Activated carbon is considered to be a non-polar sorbent and tends to
sorb the least polar and least soluble organic compounds; it Will sorb most,
but not all, organic compounds. As activated carbon adsorbs organics from
wastewater, the carbon pores eventually become saturated and the exhausted
carbon must be regenerated for reuse or replaced with fresh carbon. The
adsorptive capacity of the carbon can be restored by chemical or thermal
regeneration.
There are two forms of activated carbon in common use--granular and
powdered. Granular carbon is generally preferred for most wastewater applica-
tions because it can be readily regenerated. The two forms of carbon used and
different process configuratlonsare described below.
Granular Activated Carbon. Granular carbon is about 0.I to i mm in
diameter and is contacted with wastewater in columns or beds. The water to be
treated is either filtered down (downflow) or forced up (upflow) through the
carbon column or bed. Additional design configurations of carbon contact
columns include gravity or pressure flow, fixed or moving beds, and single
(parallel) or multi-stage (series) arrangements. In a typical downflow
countercurrent operation, two columns are operated in series with a common
spare column. When breakthrough occurs for the second column (i.e., the
concentration of a target pollutant in the effluent is higher than the
VII-If9

desired concentration), the exhausted column is removed from service for
regeneration of the carbon. The partially exhausted second column becomes
the lead column, and the fresh spare column is added as a second column in the
series. When breakthrough is again reached, the cycle is repeated. The fixed
bed downflow operation, in addition to adsorption, provides filtration but
may require frequent backwashing. In an upflow configuration, the exhausted
carbon is removed at the bottom of the column, and virgin or regenerated
carbon is added at the top, thereby providing countercurrent contact in a
single vessel.
Powdered Activated Carbon. Powdered carbon is about 50 to 70 microns in
diameter and is usually mixed with the wastewater to be treated. This
"slurry" of carbon and wastewater is then agitated to allow proper contact.
Finally, the spent carbon carrying the adsorbed impurities is settled out or
filtered. In practice, a multi-stage, countercurrent process is commonly used
to make the most efficient use of the carbon's capacity.
Carbon adsorption systems have been demonstrated as practical and
economical for the reduction of dissolved organic and toxic pollutants from
industrial wastewaters. Activated carbon can be used to remove chemical
oxygen demand (COD), biochemical oxygen demand (BOD), and related parameters;
to remove toxic and refractory organics; to remove and recover certain
organics; and to remove selected inorganic chemicals from industrial waste-
water. Compounds that are readily removed by activated carbon include
aromatics, phenolics, chlorinated hydrocarbons, surfactants, organic dyes,
organic acids, higher molecular weight alcohols, and amines. Activated carbon
can also be used to remove selected inorganic chemicals, such as cyanide,
chromium, and mercury. A summary of classes of organic compounds adsorbed on
carbon are presented in Table VII-39, and a summary of carbon adsorption
capacities (the milligram of compound adsorbed per gram of carbon) is
presented for powdered carbon in Table VII-40.
The major benefits of carbon treatment involve its applicability to a
wide variety of organics and its high removal efficiencies. The system is
compact, and recovery of adsorbed materials is sometimes practical. The
limitations of the process include ineffective removal of low molecular weight
Vli-120

TABLE VII-39. CLASSES OF ORGANIC COMPOUNDS ADSORBED ON CARBON
Organic Chemical Class
Aromatic Hydrocarbons
Polynuclear Aromatics
Chlorinated Aromatics
Phenolics
Chlorinated Phenolics
High Molecular Weight Al iphat ic and Branch Chain Hydrocarbons*
Chlorinated Al ipha t ic Hydrocarbons
High Molecular Weight Aliphatic Acids and Aromatic Acids*
High Molecular Weight Aliphatic Amines and Aromatic Amines*
High Molecular Weight Ketones, Esters, Ethers, .and Alcohols*
Surfactants
Soluble Organic Dyes
Examples of Chemical Class
benzene, toluene, xylene
naphthalene, anthracenes , biphenyls
chlorobenzene, polychlor inated biphenyls, a ld r in , endrin, toxaphene, DDT
phenol, cresol, resorcenol, and poly?henyls
t r ich lorophenol , pentachlorophenol
gasoline, kerosene
1 ,1 ,1 - t r i ch lo roe thane , t r i ch lo roe thy lene , carbon t e t r ach lo r ide , perchloroethylene
tar acids, benzoic acid
aniline~ toluene diamine
hydroquinone, polyethylene glycol
alkyl benzene sulfonates
methylene blue, Indigo carmine
*High Molecular Weight includes compounds in the range of 4 to 20 carbon atoms
Vll-121

TABLE VII-40. SUMMARY OF CARBON ADSORPTION CAPACITIES
Compound
bis (2-Ethy lhexyl ) phtha la te
Butylbenzyl phthala te Heptachlor Heptachlor epoxide Endosulfan s u l f a t e
Endrin Fluoranthene Aldrin PCB-1232 beta-Endosulfan
Dieldr in Hexachlorobenzene Anthracene 4-Nitrobiphenyl
Fluorene DDT 2-Acetylaminofluorene alpha-BHC Anethole*
3,3-Dichlorobenzidine 2-Chloronaphthalene Phenylmereuric Acetate Hexachlorobutadiene gamma-BHC ( l indane)
p-Nonylphenol 4-Dimethylaminoazobenzene Chlordane PCB-1221 DDE
Acridine yellow* Benzidine dihydrochlor ide beta-BHC N-Butylphthalate N-Nitrosodiphenylamine
Adsorption a Capacity (mg/g)
11,300 1,520 1,220 1,038
686
666 664 651 630 615
606 450 376 370
330 322 318 303 300
300 280 270 258 256
250 249 245 242 232
230 220 220 220 220
Adsorption a Compound Capacity (mg/g)
Phenanthrene, 215 Dimethylphenylcarbinol* 210 4-Aminobiphenyl 200 beta-Naphthol* 200 alpha-Endosulfan 194 Acenaphthene 190 4,4' Methylene-bis-
(2-chloroaniline) 190 Benzo(k)fluoranthene 181 Acridine orange 180 alpha-Naphthol 180
4,6-Dinitro-o-cresol 169 alpha-Naphthylamine 160 2,4-Dichlorophenol 157 1,2,4-Trichlorobenzene 157 2,4,6-Trichlorophenol 155
beta-Naphthylamine 150 Pentachlorophenol 150 2,4-Dinitrotoluene 146 2,6-Dinitrotoluene 145 4-Bromophenyl phenyl ether 144
p-Ni t roan i l ine* 140 1,1-Diphenylhydrazine 135 Naphthalene 132 1-Chloro-2-nitrobenzene 130 1,2-Dichlorobenzene 129
p-Chlorometacresol 124 1,4-Dichlorobenzene 121 Benzothiazole* 120 Diphenylamine 120 Guanine* 120
Styrene 120 1,3-Dichlorobenzene 118 Acenaphthylene 115 4-Chlorophenyl phenyl ether III Diethyl phthalate ii0
VII-122

TABLE VII-40. SUMMARY OF CARBON ADSORPTION CAPACITIES (Continued)
Compound
2-Nitrophenol Dimethyl phthalate Hexachloroethane Chlorobenzene p-Xylene
2,4-Dimethylphenol 4-Nitrophenol Acetophenone 1,2,3,4-Tetrahydro-
naphthalene Adenine*
Dlbenzo(a,h)anthracene Nitrobenzene 3,4-Benzofluoranthene 1,2-Dibromo-3-chloro-
propane
Ethylbenzene 2-Chlorophenol Tetrachloroethene o-Anisidine* 5 Bromouracil
Benzo(a)pyrene 2,4-DinitrophenolIsophorone Trtchloroethene Thymine*
Toluene 5-Chlorouracil* N-Nitrosodi-n-propylamine bis(2-Chloroisopropyl)
ether Phenol
Adsorption" Capacity (mg/g)
99 97 97 91 85
78 76 74
74 7.1
69 68 57
53
53 51 51 50 44
34 33 32 28 27
26 25 24
24 21
Adsorption a Compound Capacity (mg/g)
Bromoform 20 Carbon tetrachloride 11 bis(2-Chloroethoxy)
methane i i Uracil* II Benzo(ghi)perylene i i
l,l,2,2-Tetrachloroethane II 1,2-Dichloropropene 8.2 Dichlorobromomethane 7.9 Cyclohexanone* 6.2 1,2-Dichloropropane 5.9
l,l,2-Trichloroethane 5.8 Trichlorofluoromethane 5.6 5-Fluorouracil* 5.5 l,l-Dichloroethylene 4.9 Dibromochloromethane 4.8
2-Chloroethyl vinyl ether 3.9
1,2-Dichloroethane 3.6 1,2-trans-Dichloroethene 3.1 Chloroform 2.6 1,1,1-Trichloroethane 2.5
l,l-Dichloroethane 1'.8 Acrylonitrile 1.4 Methylene chloride 1.3 Acrolein 1.2 Cytosine* i.i
Benzene 1.0 Ethylenediaminetetra-
acetic acid 0.86 Benzoic acid 0.76 Chloroethane 0.59 N-Dimethylnitrosamine 6.8 x 10-'5
Vli-123

TABLE VII-40. SUMMARY OF CARBON ADSORPTION CAPACITIES (Continued)
NOT ADSORBED
Acetone cyanohydrin Adipic acid Butylamine Choline chlor ide Cyclohexylamine Diethylene glycol Ethanol Hexamethylenediamine Hydroquinone Morpholine Triethanolamine
*Compounds prepared in "mineralized" d i s t i l l e d water containing the following composition:
Ion Conc. (mg/l) Ion Conc. (mg/l)
Na+ 92 PO4 I0 K+ 12.6 S04 I00 Ca++ i00 C1- 177 Mg++ 25.3 Alkalinity 200
aAdsorption capacities are calculated for an equilibrium concentration of 1.0 mg/1 at neutral pH.
Source: "Carbon Adsorption Isotherms for Toxic Organics." MERL, April 1980. PB 80 197 320.
VII-124

or h i g h l y s o l u b l e o r g a n i c s , low t o l e r a n c e f o r suspended s o l i d s in the w a s t e -
w a t e r , and r e l a t i v e l y h igh c a p i t a l and o p e r a t i n g c o s t s . P r e l i m i n a r y t r e a t m e n t
to r educe suspended s o l i d s and to remove o i l and g r e a s e w i l l o f t e n improve the
e f f e c t i v e n e s s of the a c t i v a t e d carbon sys tem.
T r e a t a b i l i t y t e s t s should be per formed on s p e c i f i c was te s t r e ams to
d e t e r m i n e a c t u a l pe r fo rmance of an a c t i v a t e d carbon u n i t . The d e g r e e of
removal of d i f f e r e n t o r g a n i c compounds v a r i e s depending on the n a t u r e of the
a d s o r b a t e , the pH of the s o l u t i o n , the t e m p e r a t u r e of the s o l u t i o n , and the
w a s t e w a t e r c h a r a c t e r i s t i c s . I f the w a s t e w a t e r c o n t a i n s more than one o r g a n i c
compound, t h e s e compounds may m u t u a l l y enhance a d s o r p t i o n , may a c t r e l a t i v e l y
i n d e p e n d e n t l y , or may i n t e r f e r e wi th one a n o t h e r .
According to the Section 308 0uestionnaire data base, 210CPSF plants
reported using carbon adsorption as a tertiary treatment technology. Table
VII-41 presents tertiary activated carbon performance data for an 0CPSF plant
sampled during the EPA 12-Plant Study.
E. Total Treatment System Performance
i. Introduction
The last two sections presented descriptions and performance data for
those in-plant and end-of-pipe treatment technologies currently used or avail-
able for the reduction and removal of conventional, nonconventional, and
priority ~pollutants discharged by the OCPSF industry. The performance data
presented were primarily for those pollutants that the technologies were
primarily designed to remove. For example, BOD 5 and TSS data were presented
for activated sludge; metals data were presented for chemical precipitation; l
and volatile priority pollutant data were presented for steam stripping.
This section discusses the removal of pollutants from all treatment
technologies by presenting the performance of total treatment systems. The
treatment systems studied are those used to promulgate the BPT and BAT
effluent limitations. In addition6 the performances of those treatment
systems within the OCPSF industry that do not use biological treatment are
also presented.
VII-125

TABLE VII-41. END-OF-PIPE CARBON ADSORPTION PERFORMANCE
DATA FROM PLANT NO. 3033
Pollutant Name
Bis(2-chloroethyl)ether (18)
1,2-Dichloropropane (32)
2,4-Dimethylphenol (34)
Methylene Chloride (44)
Phenol (65)
Bis(2-ethylexyl)Phthalate (66)
Average Influent Concentration
to Activated Carbon (ug/l)
13.64
10.46
13.92
12.21
11.42
14.31
Average Effluent Concentration from Activated Carbon
(ug/l)
I0.00 (ND)
I0.00 (ND)
I0.00 (ND)
11.46
i0.00 (ND)
13.00
VII-126

2. BPT Treatment Systems
EPA has promulgated concentration-based BPT effluent limitations based on
selected biological end-of-plpe technologies that are designed primarily to
address the conventional pollutants BOD 5 and TSS. These are supplemented by
those in-plant controls and technologies that are commonly used to assure the
proper and efficient operation of the end-of-pipe technologies, such as steam
stripping, activated carbon, chemical precipitation, cyanide destruction, and
in-plant biological treatment. Activated sludge and aerated lagoons are the
primary examples of such biological treatment.
The performance of BPT treatment systems is represented by the long-term
BOD~ and TSS averages for each subcategory and the overall maximum monthly and
daily maximum variability factors presented in the limitations development
part of this section.
3. Nonbiological Treatment Systems
Approximately 84 plants rely exclusively upon end-of-pipe physical/
chemical treatment or did not report any in-place treatment at all. These
facilities must comply with the BPT effluent limitations guidelines based on
biological treatment system performance. Some of these plants generate low
levels of BOD 5, thus finding physical/chemical treatment more effective in
reducing TSS loadings. Without nutrient addition, biological systems
generally cannot function unless influent BOD 5 is high enough to sustain their
biota. Other plants have determined, based on an analysis of the types and
volumes of pollutants that they discharge, that physical/chemical treatment is
more economical, easier to operate, or otherwise more appropriate. Some of
these plants can control conventional pollutants effectively without using the
biological component of the BPT Option I technologies. However, other plants
seem to rely on dilution of process wastewater prior to discharge rather than
the appropriate Option I treatment. A listing of available BOD 5 and TSS
effluent data and in-place controls reported by those plants with nonbiolog-
ical treatment systems is presented in Table VII-42. Forty-one of the
physical/chemical treatment only plants reported discharge BOD 5 concentration
data, and 46 provided TSS concentration data. After adjusting the reported
wastewater concentration data for non-process wastewater dilution, 29 percent
VII-127

TABLE VII-42. TREATMENT TECHNOLOGIES FOR DIRECT NONBIOLOGICAL PLANTS*
Plant Effluent BOD 5 Effluent TSS ID (mg/l) (mg/l)
76 -- --
87 929 4,4
105
114 15 8!)
155 - 282
159 429
225 96 46
259 350
260 20 8
294 57 119
373 62 155
447 23,628 22,898
451 - -
502 93 38
536 31 1
Type of Controls Reported
Neutralization
Equalization, neutralization, primary clarification, carbon adsorption
Stream stripping, neutralization, primary clarification
Filtration
Neutralization, API separation, dissolved air flotation
Filtration, chemical precipitation, steam stripping, equalization, coagulation, neutralization, oil separation, primary clarification, filtration, carbon adsorp- tion, second stage of an indicated treatment unit
Steam stripping, distillation, equaliza- tion, settling pond, neutralization, screening, oil skimming
Filtration, coagulation, API separation, surface impoundment
Cooling tower, API separation
Reuse for steam, coagulation, flocculation, neutralization, oil separation, primary clarification
Neutralization, oil separation, oil skimming
Neutralization, filtration
Chemical precipitation, primary clarifi- cation, flocculation
Water scrub, neutralization
Neutralization
VII-128

TABLE VII-42. TREATMENT TECHNOLOGIES FOR DIRECT NONBIOLOGICAL PLANTS*
(Continued)
Plant Effluent BODs Effluent TSS ID (mg/l) (mg/l) Type of Controls Reported
569 Steam s t r ipp ing , primary c l a r i f i c a t i o n
614 Distillation, equalization, acidification/ aera t ion , n e u t r a l i z a t i o n , f i l t r a t i o n , equa l iza t ion
657 16 17 Collec t ion basin, n e u t r a l i z a t i o n , o i l separat ion
663 7 47 Equal izat ion, f l occu la t i on , n e u t r a l i z a t i o n , dissolved a i r f l o t a t i o n , mechanical skim- ming, spray cooling, pol i sh ing pond
669 56 42 F i l t r a t i o n , steam s t r ipp ing , n e u t r a l i z a - t ion, o i l skimming, dissolved a i r f l o t a - t ion , a i r s t r ipp ing
709 91 98 Se t t l i ng pond, n e u t r a l i z a t i o n , API separ- a t ion , f i l t r a t i o n , carbon adsorpt ion
727 84 108 Equal izat ion, f l occu la t i on , chemical pre- c i p i t a t i o n , g r i t removal, o i l skimming, c l a r i f i c a t i o n , a i r s t r ipp ing , n e u t r a l i z a t i o n , pol ish ing pond
775 - 6 Chemical p r e c i p i t a t i o n , n e u t r a l i z a t i o n , primary c l a r i f i c a t i o n
814 Carbon adsorpt ion, n e u t r a l i z a t i o n , o i l skimming, o i l separa t ion , API separa t ion , coagulat ion, f l occu la t ion
819 - 128 Chemical p r e c i p i t a t i o n , equa l i za t ion , neu-t r a l i z a t i o n , o i l separa t ion , carbon adsorp- t ion
859 225 4,369 Equal izat ion, n e u t r a l i z a t i o n , primary c l a r i f i c a t i o n
876 90 76 Formaldehyde treatment, carbon absorption, equalization, neutralization, primary clarification
VII-129

TABLE VII-42. TREATMENT TECHNOLOGIES FOR DIRECT NONBIOLOGICAL PLANTS"
(Continued)
Plant Effluent BOD 5 Effluent TSS ID (mg/l) (mg/l) Type of Controls Reported
877 - - Dissolved air flotation
913 4 54 Chemical oxidation, steam stripping, equal- ization, phase separation, neutralization
938 - 27 Steam stripping, equalization, floccula-tion, hypochlorite addition, filtration, neutralization, primary clarification, settling pond
942 71 66 Steam stripping, neutralization, oil skim- ming, primary clarification
962 17 25 Equalization, primary clarification
991 - - Solvent decantation
992 - - Distillation, equalization, neutralization
1249 - - Equalization, neutralization
1439 302 1,463 Settling, solvent extraction, equalization, neutralization, steam stripping
1532 llO Steam stripping, mercury treatment, neu-tralization, carbon adsorption
1569 18 44 Distillation, equalization, neutralization, primary clarification, blending and air stripping, filtration
i618 4 II Oil skimming
1688 142 46 Steam stripping, equalization, floccula-tion, neutralization, primary clarification
1774 8 5 Equalization, flocculation, neutralization, primary clarification, filtration
Vll-130

TABLE VII-42. t
TREATMENT TECHNOLOGIES FOR DIRECT NONBIOLOGICAL.PLANTS (Continued)
Plant ID
Effluent BOD 5 (mg/1)
Effluent TSS (mg/1) Type,of Controls Reported
1776 - i00 Steam stripping, grit removal, oil skim- ming, neutralization
1785 Chemical precipitation, chromium reduction, steam stripping, ion exchange, carbon ad- sorption, equalization, neutralization
1794 Oil skimming, API separation
1839 Steam str ipping, gravity se t t l i ng
2030 Chemical precipitation, chromium reduction, air stripping, neutralization, flocculation
2055 168 Steam stripping, coagulation, recycle basin, clarification, pond
flocculation, polishing
2062 Chemical precipitation, steam stripping, carbon adsorption, coagulation, floccula-tion, neutralization, pH adjustment
2073 6 40 HDPE skimmer, polishing pond, pH adjustment
2090 862 5O Distillation, grit removal
equalization, neutralization,
2206 Oil skimming, oil separation
2268 264 Equalization, sedimentation, tion, filtration
neutraliza-
2345 50 29 Steam stripping, solvent extraction, floc-culation, redox reactor, redox towers, neutralization, polishing pond, noncontact coolers
2400 5,640 1,175 Solvent extraction, distillation
2419 Equalization, neutralization, dissolved air flotation
oil skimming,
2527 Oil skimming, aerobic spray field
VII-131

TABLE VII-42. TREATMENT TECHNOLOGIES FOR DIRECT NONBIOLOGICAL
(Continued) PLANTS"
Plant ID
Effluent BOD~ (mg/l)
Effluent TSS (mg/l) Type of Controls Reported
2531 639 145 Equalization, flocculation, neutralization, primary clarification, carbon adsorption
2533 - 31 Equalization, screening
2590 16 13 Sulfur recovery, single stage flash, equalization, stormwater impoundment, neu-tralization, oil separation, filtration, carbon adsorption
2606 - - Neutralization
2647 47 51 Filtration, distillation
2668 939 5,866 Steam stripping, distillation
2680 48 26 Decant sump, equalization, steam stripping, neutralization, carbon adsorption
2735 8 21 Pellet skimming, neutralization, oil skimming, dissolved air flotation, clarification
2767 16 31 Neutralization
2770 140 17 Distillation, equalization, neutralization, oil skimming, primary clarification
2771 - 13 Equalization, clarification
neutralization, primary
2786 80 55 Filtration, chemical precipitation, air stripping, steam stripping, equalization, neutralization, oil skimming, oil separation, API separation, dissolved air flotation, polishing pond, (nutrient addition prior to a septic tank for part of the plant flow)
4010 - 176 Depolymerization, distillation, pH adjust- ment, neutralization, centrifugation
*Plants 33, 180, 412, 446, 601, 611, 664, 956, 1033, 1327, 1593, 1670, 1986, 2047, and 2660 report no in-place treatment technology.
VII-132

of t h e p h y s i c a l / c h e m i c a l t r e a t m e n t p l a n t s were d e t e r m i n e d to r e q u i r e no
f u r t h e r t r e a t m e n t to comply w i t h the i n d i v i d u a l p l a n t BPT O p t i o n I BOD 5 l o n g -
te rm a v e r a g e e f f l u e n t c o m p l i a n c e t a r g e t s ( d i s c u s s e d l a t e r in t h i s s e c t i o n and
in S e c t i o n V I I I ) . For a n o t h e r 69 p e r c e n t o f t he p l a n t s , t he e n g i n e e r i n g c o s t s
o f c o m p l i a n c e were based on a c t i v a t e d s l u d g e t r e a t m e n t s y s t e m s b e c a u s e t h e i r
d i s c h a r g e BOD 5 c o n c e n t r a t i o n s ( a f t e r c o r r e c t i o n f o r n o n - p r o c e s s w a s t e w a t e r
d i l u t i o n ) r anged from 15 to 23 ,600 mg/1 above t h e i r i n d i v i d u a l p l a n t BPT
O p t i o n I BOD S l o n g - t e r m a v e r a g e e f f l u e n t c o m p l i a n c e t a r g e t s . The r e m a i n i n g
2 p e r c e n t o f t he p l a n t s were c o s t e d f o r c o n t r a c t h a u l i n g b e c a u s e t h e i r
w a s t e w a t e r f lows were l e s s than 500 g a l l o n s per day ( g p d ) .
In the case of TSS, 38 percent of the 46 physical/chemical treatment only
plants that reported TSS data were determined to require no further treatment
to comply with the individual plant BPT Option I TSS long-term average efflu-
ent compliance targets. For 49 percent of the plants, the engineering,costs
of TSS compliance were associated with the activated sludge treatment~system
costed for BOD5 control. For another 7 percent of the plants, the ~4ngineering
costs of TSS compliance were based on chemically assisted clarification
treatment systems; for 4 percent of the plants, costs were based on copper
sulfate addition to polishing ponds; and for 2 percent, on contract hauling
because the wastewater flows were less than 500 gpd.
C u r r e n t l y , 14 p l a n t s do no t r e p o r t any i n - p l a c e t r e a t m e n t a t a l l ; o f
t h e s e , two p l a n t s r e p o r t e d BOD S and TSS c o n c e n t r a t i o n s . One p l a n t would
r e q u i r e n o t r e a t m e n t and the o t h e r p l a n t would r e q u i r e b i o l o g i c a l t r e a t m e n t to
comply w i t h t h e i r r e s p e c t i v e BPT c o m p l i a n c e t a r g e t s .
The Agency did not establish alternative limitations for facilities that
do not utilize or install biological treatment systems to comply with the BPT
effluent limitations. Some industry commenters criticized the Agency for not
exempting or establishing alternative BOD 5 limitations for stand-alone
"chlorosolvent" manufactures. They claim that "chlorosolvent" wastewaters
cannot sustain a biomass and should not be subject to limitations based on
biological treatment, but did not provide supporting data. The Agency
identified only three stand-alone "chlorosolvent" facilities (plants 569, 913,
and 2062) using the commenters definition of "chlorosolvents" as chlorinated
VII-133

C1 and C2 hydrocarbons. These three plants use only physical/chemical
controls to achieve their current discharge levels. However, of these three
plants, only plant 913 reported BOD 5 data that provided a long-term average of
4 mg/1 BOD 5. Since this is significantly below the plant's BPT long-term
effluent compliance target of 21 mg/1 BODs, the Agency concluded that plant
913 would comply with the BOD 5 effluent limitations without the use of
biological treatment. The only other identified stand-alone chlorinated
organics plant that did not use biological treatment was plant 1569, a manu-
facturer of chlorinated benzenes. This plant reported a long-term average
BOD S discharge concentration of 18 mg/1, a level already below its BPT long-
term effluent compliance target of 27 mg/l BOD s. The Agency also identified
three other manufacturers that produced "chlorosolvents" along with other
products (plants 1532, 2770, and 2786); they reported long-term average BOD s
discharge concentrations of llO, 140, and 80 mg/1, respectively--sufficient
levels to sustain biota. In fact, the Agency identified 13 OCPSF plants that
utilize biological treatment systems with reported influent BOD S concentration
less than 125 mg/1. The influent concentrations for seven of these plants
range from 60 to 80 mg/1 BOD s. Furthermore, another plant (725) sampled by
EPA has an activated sludge system that treats wastewater with a 37 mg/l BOD 5
average influent concentration. The product mix at this facility included
tetrachloroethylene and chlorinated paraffins.
The nonbiological wastewater treatment performance information for OCPSF
plants that reported influent and effluent BOD s and/or TSS data is listed in
Table VII-43. As shown, the ranges of BOD s and TSS percent removals are 27 to
98 percent and 0 to 91 percent, respectively. Some of these systems include
clarification treatment, but in combination with other physical/chemical
wastewater treatment unit operations.
in an effort to identify performance data for physical/chemical
clarification treatment systems treating BOD s and TSS, the Agency was able to
obtain influent and effluent BOD s and TSS data for clarification systems at
pulp, paper, and paperboard mills. Table VII-44 presents performance data for
clarification systems at 27 mills, and the d~ta show that clarification
systems can obtain significant removals of both TSS and BOD 5 as well as
reducing TSS levels in raw wastewaters to levels comparable to BPT Option I
VII-134

TABLE Vli-43. PERFORMANCE OF OCPSF NONBIOLOGICAL WASTEWATER TREATMENT SYSTEMS
Reported Reported Pollutant Influent Effluent % In-Place
Plant ID Parameter (mg/l) (mg/l) Removal Treatment*
657 BOD. 22 16 27 Collection basin, TSS ~ 47 17 64 neutralization, oil
separation
669 BOD s 2804 56 98 Filtration, steam TSS 451 42 91 stripping, neutralization,
oil skimming, dissolved air flotation, air stripping
938 ,BOD 5 . . . . . . Steam stripping, equaliza i TSS 226 27 88 tion, flocculation,
hypochlorite addition, filtration, neutralization, primary clarification, settling pond
1688 BOD 5 -- 142 -- Steam stripping,, equaliza- TSS 235 46 80 tion , flocculation,
neutralization, primary clarification
1776 BOD 5 . . . . . . Steam stripping, grit , TSS i00 i00 0 removal, oil skimming,
neutralization
2055 BOD 5 237 168 29 Steam s t r i p p i n g , coagula-TSS . . . . . . t i on , f l o c c u l a t i o n , r e c y c l e
basin, secondary clarifi- cation, polishing pond
*Individual plants may treat all process wastewater or a portion of the process wastewater by the reported treatment unit operations. Reported influent data may not precede all listed unit operations.
VII-135

VII--44. BOD_ ~ TSS l~IL-Ti0t~ BY OARIFICATION
AT ~ 1RLP, PAP~, .4ND P ~ MllJ.q
BOB TSS Inflt~ent g A ~ t I ~ f l t ~ t Effluent
Mill No. Su~ateg~n/ Type
Clarif icat ion Caneentratim
(~/ i ) ~ t r a t i o n
(rag/l) %
Reduction C ~ a ~ t r a t i ~
(rag/l) Concentration
(rag/l)
Z
l~duction Data Souroe
140026 SF-Misc. Pmmv 416 275 34 I, 149 188 84 1977 308 Sui'vey 140027 SF-Misc. Pr~ary 51_5 317 38 1,865 114 94 1977 308 Survey 14008 Deink-F Pr~m~ 634 405 36 1,645 378 77 1977 308 Survey 140021 Deink-T Prin~y 747 286 62 1,937 67 97 1981 Long-Tern Sampling 140025 Deink-T Primary 575 260 55 2,583 224 91 !977 _kOB 9arvey 080041 NI-Fine Primly 137 36.9 73 344 51.5 85 Supplemmtal Data 100005 Tis fwp Privy 305 171 44 2,313 173 92 Supplemental Data
Seo~da~ 120 73 39 171 45.7 73 Supplemental Data 030044 In t . Misc. 327 200 39 641 162 75 Supplemmtal Data
< e-4 08O346 NI-~Fine Primary 222 116 48 521 43.7 92 Supplmmtal Data F4 I O4O3O9 PG-S Privy 675 530 21 358 112 69 Supplemental Data
LO 030051 AIk-F Prima~y 658 525 20 348 124 64 Supplemntal Data 030027 AIk-F Primary 355 255 28 531 146 73 Supplemental Data 080027 NI-F Primary 379 155 59 1,062 175 84 Supplmmtal Data
Secondary 54 31 42 193 17.2 91 Supplm~ntal Dam 040010 PG-S Prmary 104 29.8 71 253 20.4 92 Supplemental Data O9OO08 NI-T Primry 142 39.5 72 613 13 98 Supplemental Data 09O022 NI-T mmry 188 45.7 76 510 42 92 Supg] _men_ tal Data 140019 Deink-F er~a~y 648 403 38 3,753 391 90 Supplemental Data 030005 ~t-BK Primary 31_5 344 0 431 76.1 82 Supplemental Data 01.5001 UBK&SC Primary 224 203.9 9 499 104.7 79 Supplemental Data IOfWY24 NI-Misc. Prlmm-y 34.2 7.4 78 169 10.7 94 Verification Study I(]CX]67 Nl--Misc. Prim~ 31.9 12.3 61 903 5.3 99 Verification Study 040013 PG--S Primly 222 156 30 468 93.4 80 Verification Study
Seconda~ 170 I_54 9 119 86 28 Verification Study I0[W355 O9OO22
NI -F&W,/ NI-T
Pr~a~ Primary
37.9 182
24.2 49.5
36 73
145 464
60.4 37.3
58 92
Verification Study Verification Study
100005 TFWP 336 174 48 3,785 366 90 Verification Study 110043 PBF~ er~a~ 914 594 35 3,198 131 96 Verification Study 030047 BCTBK er~mV 479 295 38 I, 160 138 88 Verification Study
Secon~ry 61.6 41.1 33 78.7 38.8 51 Verification Study

long-term average levels in a wastewater matrix containing low BOD s levels.
In addition, for these plants BOD 5 effluent values are also comparable to BPT
Option I long-term average levels.
Based on the discussion and the performance data presented above, the
Agency concludes that:
There a r e a l i m i t e d number of OCPSF p l a n t s wi th e i t h e r no t r e a t m e n t or p h y s i c a l / c h e m i c a l t r e a t m e n t i n - p l a c e (which have BODs and TSS e f f l u e n t d a t a ) t h a t a r e not in compl iance wi th the BODs and TSS BPT l o n g - t e r m ave r a ge e f f l u e n t compl iance t a r g e t s and have not had BPT compl iance c o s t s e s t i m a t e d based on b i o l o g i c a l t r e a t m e n t .
• There are a limited number of OCPSF plants with either no treatment or physical/chemical treatment in-place (which have BOD s and TSS effluent data) that are in compliance with BOD. but not in compliance with TSS BPT Option I long-term average effluent compliance targets.
BPT Option I long-term averages for BOD s and TSS, which are based on the performance of biological treatment, can be attained by physical/ chemical treatment systems either In-place or used by the Agency to estimate BPT compliance costs (i.e., chemically assisted clarifica- tion).
Furthermore, compliance with BAT toxic pollutant effluent limitations
guidelines based on installation of physical/chemical or biological treatment
or improvements in the design and operation of In-place treatment would also
result in incidental reductions of conventional pollutants.
For these reasons, the Agency has decided not to establish a separate set
of BPT effluent limitations for OCPSF plants that do not require biological
treatment to comply with BPT.
4. BAT Trea tment Systems
The Agency promulga ted BAT l i m i t a t i o n s f o r two s u b c a t e g o r i e s t h a t were
l a r g e l y d e t e r m i n e d by raw waste c h a r a c t e r i s t i c s . F i r s t , t h e e n d - o f - p i p e
b i o l o g i c a l t r e a t m e n t s u b c a t e g o r y i n c l u d e s p l a n t s t h a t have or w i l l i n s t a l l
b i o l o g i c a l t r e a t m e n t to comply wi th BPT l i m i t s . Second, the n o n - e n d - o f - p i p e
b i o l o g i c a l t r e a t m e n t s u b c a t e g o r y i n c l u d e s p l a n t s t h a t e i t h e r g e n e r a t e such low
l e v e l s of BODs t h a t they do not need b i o l o g i c a l t r e a t m e n t or choose to use
VII-137

physical/chemical treatment alone to comply with the BPT limitations for BOD s.
The BAT limitations are based on the performance of the biological treatment
component plus in-plant control technologies that remove priority pollutants
prior to discharge to the end-of-pipe treatment system. These in-plant
technologies include steam stripping to remove volatile and semivolatile
priority pollutants, activated carbon for various base/neutral priority
pollutants, chemical precipitation for metals, cyanide destruction for
cyanide, and in-plant biological treatment for removal of polynuclear aromatic
(PNA) and other biodegradable priority pollutants. Table VII-45 presents a
list of the regulated BAT toxic pollutants and the technology basis for the
final BAT Subcategory One and Two effluent limitations for each. Tables
VII-46 and VII-47 present a summary of the long-term weighted average effluent
concentrations for the final BAT toxic pollutant data base for BAT Subcategory
One and Subcategory Two. The minimum, maximum, and median of the plant's
weighted average effluent concentrations were calculated for each pollutant to
display the performance of well-operated treatment systems in the OCPSF
industry.
F. WASTEWATER DISPOSAL
i. Introduction
The method of t r e a t m e n t f o r d i r e c t and i n d i r e c t d i s c h a r g e r s was d i s c u s s e d
in S e c t i o n s C and D. In t h i s s e c t i o n the t r e a t m e n t p r o c e s s e s and d i s p o s a l
methods a s s o c i a t e d wi th ze ro or a l t e r n a t e d i s c h a r g e in the OCPSF i n d u s t r y a re
d e s c r i b e d . Zero or a l t e r n a t e d i s c h a r g e a t the OCPSF p l a n t i s d e f i n e d as no
d i s c h a r g e of con t amina t ed p r o c e s s w a s t e w a t e r to e i t h e r s u r f a c e wa te r b o d i e s or
to POTWs. Table VI I -48 p r e s e n t s the f r e q u e n c y of was te s t r eam f i n a l d i s c h a r g e
and d i s p o s a l t e c h n i q u e s . This s e c t i o n d e s c r i b e s deep w e l l i n j e c t i o n (56 OCPSF
p l a n t s ) , c o n t r a c t h a u l i n g (128 p l a n t s ) , i n c i n e r a t i o n (93 p l a n t s ) , e v a p o r a t i o n
(29 p l a n t s ) , s u r f a c e impoundment (25 p l a n t s ) , and land a p p l i c a t i o n (19 p l a n t s ) .
2. Deep Well Injection
Deep well injection is a process used for the ultimate disposal of
wastes. The wastes are disposed by injecting them into wells at depths of up
to 12,000 ft. The wastes must be placed in a geological formation that
prevents the migration of the wastes to the surface or to groundwater
Vli-138

TABLE VII-45. LIST OF REGULATED TOXIC POLLUTANTS AND THE TECHNOLOGY BASIS
FOR BAT SUBCATEGORY ONE AND TWO EFFLUENT LIMITATIONS
BAT Subcategory One
Poll't. End-of-Pipe BAT No. Pollutant Name Biological Treatment Plus Subcategory Two
1 Acenaphthene In-Plant Biological In-Plant Biological
3 Acrylonitrile In-Plant Biological In-Plant Biological
4 Benzene Steam Stripplng Steam Stripping
6 Carbon Tetrachloride Steam Stripplng Steam Stripping*
7 Chlorobenzene Steam Stripplng Steam Stripping*
8 1,2,4-Trichlorobenzene Steam Stripplng Steam Stripping*
9 Hexachlorobenzene Steam Stripplng Steam Stripping
I0 1,2-Dichloroethane Steam Stripplng Steam Stripping*
II l,l,l-Trichloroethane Steam Stripplng Steam Stripping
12 Hexachloroethane Steam Stripping Steam Stripping*
13 l,l-Dlchloroethane Steam Stripping** Steam Stripping
14 l,l,2-Trichloroethane Steam Stripping Steam Stripping
16 Chloroethane Steam Stripping Steam Stripping
23 Chloroform Steam Stripping Steam Stripping
24 2-Chlorophenol (Biological Only) Reserved
25 1,2-Dichlorobenzene Steam Stripping Steam Stripping*
26 1,3-Dichlorobenzene Steam Stripping Steam Stripping*
27 1,4-Dichlorobenzene Steam Stripping Steam Stripping*
29 l,l-Dichloroethylene Steam Stripping Steam Stripping
30 1,2-Trans-Dichloroethylene Steam Stripping Steam Stripping
31 2,4-Dichlorophenol (Biological Only) Reserved
32 1,2-Dichloropropane Steam Stripping Steam Stripping*
33 1,3-Dichloropropene Steam Stripping Steam Stripping*
34 2,4-Dimethylphenol In-Plant Biological In-Plant Biological
35 2,4-Dinitrotoluene (Biological Only) Reserved
36 2,6-Dinitrotoluene (Biological Only) Reserved
38 Ethylbenzene Steam Stripping Steam Stripping*
VII-139

TABLE VII-45. LIST OF REGULATED TOXIC POLLUTANTS AND THE TECHNOLOGY BASIS
FOR BAT SUBCATEGORYONE AND TWO EFFLUENT LIMITATIONS (Continued)
BAT Subcategory One
Poll't. End-of-Pipe No. Pollutant Name Biological Treatment Plus
39 Fluoranthene In-Plant Biological
42 Bis(2-Chloroisopropyl)Ether Steam Stripping
44 Methylene Chloride
45 Methyl Chloride
52 Hexachlorobutadiene
55 Naphthalene
56 Nitrobenzene
57 2-Nitrophenol
58 4-Nitrophenol
59 2,4-Dinitrophenol
60 4,6-Dinitro-o-Cresol
65 Phenol
66 Bis(2-Ethylhexyl)Phthalate
68 Di-N-butyl Phthalate
70 Diethyl Phthalate
71 Dimethyl Phthalate
72 Benzo(a)Anthrancene
73 Benzo(a)Pyrene
74 3,4-Benzofluoranthene
75 Benzo(k)Fluoranthene
76 Chrysene
77 Acenaphthylene
78 Anthracene
80 Fluorene
81 Phenanthrene
Steam S t r i p p i n g
Steam S t r i p p i n g
Steam S t r i p p i n g
I n - P l a n t B i o l o g i c a l
Steam S t r i p p i n g and A c t i v a t e d Carbon
A c t i v a t e d Carbon
A c t i v a t e d Carbon
A c t i v a t e d Carbon
A c t i v a t e d Carbon**
I n - P l a n t B i o l o g i c a l
In-Plant Biological
In-Plant Biological
In-Plant Biological
In-Plant Biological
In-Plant Biological
In-Plant Biological
In-Plant Biological
In-Plant Biological
In-Plant Biological
In-Plant Biological
In-Plant Biological
In-Plant Biological
In-Plant Biological
BAT Subcategory Two
In-Plant Biological
Steam Stripping*
Steam Stripping
Steam Stripping
Steam Stripping*
In-Plant Biological
Steam Stripping and Activated Carbon
Activated Carbon
Activated Carbon
Activated Carbon
Activated Carbon
In-Plant Biological
In-Plant Biological
In-Plant Biological
In-Plant Biological
In-Plant Biological
In-Plant Biological
In-Plant Biological
In-Plant Biological
In-Plant Biological
In-Plant Biological
In-Plant Biological
In-Plant Biological
In-Plant Biological
In-Plant Biological
Vll-140

TABLE VII-45. LIST OF REGULATED TOXIC POLLUTANTS AND THE TECHNOLOGY BASIS
FOR BAT SUBCATEGORY ONE AND TWO EFFLUENT LIMITATIONS (Continued)
BAT Subcategory One
Poll't. End-of-Pipe BAT No. P o l l u t a n t Name Biological Treatment Plus Subcategory Two
84 Pyrene In -P lan t B io log i ca l In -P lan t B i o l o g i c a l
85 Tetrachloroethylene Steam S t r ipp ing Steam S t r ipp ing
86 Toluene Steam S t r ipp ing Steam S t r ipp ing
87 Trichloroethylene Steam St r ipp ing Steam S t r ipp ing
88 Vinyl Chloride Steam St r ipp ing Steam S t r ipp ing
119 Total Chromium Hydroxide P r e c i p i - Hydroxide P r e c i p i - t a t ion*** t a t ion***
120 Total Copper Hydroxide P r e c i p i - Hydroxide P r e c i p i - t a t ion*** t a t ion***
121 Total Cyanide Alka l ine Chlo r i - Alkaline Chlori- nat ion*** nation***
122 Total Lead Hydroxide P r e c i p i - Hydroxide P r e c i p i - t a t ion*** t a t ion***
124 Total Nickel Hydroxide P r e c i p i - Hydroxide P r e c i p i - t a t ion*** t a t ion***
128 Total Zinc Hydroxide P r e c i p i - Hydroxide P r e c i p i - t a t ion*** t a t ion***
*Steam s t r i p p i n g performance data t r a n s f e r r e d based on Henry's Law Constant groupings .
% **Transfer red from Subcategory Two.
***Metals and cyanide l i m i t a t i o n s based on hydroxide p r e c i p i t a t i o n and a l k a l i n e ch lo r ina t ion~ r e s p e c t i v e l y , only apply at the process source.
V l l - 1 4 1 ..~

TABLE VII-46. SU~4ARY OF THE ~ ~ 1 14gI(~l!D AVERAGE ~ O3N~TIONS PGR THE
FINAL BAT TOXIC P O ~ DATA BASE ~ BAT SUBCA~Y ONE
Median of Minimum of Max'imm~ of Est. long- Est. Long- Est. Umg-
PoLlutant NLmber of Term Means Term Means Term Mem~ N~ber Pollutant Name Plants (ppb) (ppb) (ppb)
I Acenaphthene 3 I0.000 i0.000 13.00 3 Acrylonl trile 5 50.000 50.000 122.67 4 Benzene 17 I0.000 I0.00 16.62 6 Carbon Tetrachloride 3 I0.000 I0.00 I0.00 7 Chlorobenzene 2 I0.000 I0.00 i0.00 8 i, 2,4-Trichlorobenzene 3 42.909 I0.00 69.46 9 Hexachlorobenzene 1 i0.000 I0.00 I0.00 I0 i, 2-Dichloroethane 9 25.625 I0.00 1228.33 ii I, 1, l-Trichloroethane 2 i0.000 I0.00 I0.00 12 Hexachloroethane 2 I0.000 I0.00 I0.00 14 I, i, 2-Trichloroethane 3 i0.000 i0.00 I0.00 16 Chloroethane 4 50.000 50.00 50.00 23 Chloroform 8 12.208 I0.00 43.00 24 2-Ehlorophenol 3 i0.000 I0.00 93.30 25 I, 2-Dichlorobenzene 7 47.946 i0.00 88.20 26 I,3-Dichlorobenzene 1 24.800 24.80 24.80 27 1 4-Dichlorobenzene 1 lO.O00 I0.00 I0.00 29 1 1-Dichloroethylene 5 i0.000 I0.00 11.60 3O 1 2-Trans-dichloroethylene 3 I0.000 I0.00 77.67 31 2 4-Dichlorophenol 3 17.429 i0.00 21.62 32 1 2-Dichloropropropane 6 121.500 13.19 923.00 33 i , 3-Dichloropropene 3 23.000 10.25 63.33 34 2 4-Dimethylphenol 4 I0.794 i0.00 13.47 35 2,4-Dini trotoluene 2 58.833 I0.00 107.67 36 2 6-Dinitrotoluene 2 132.667 i0.00 255.33 38 Ethylbermene 14 I0.000 lO. 00 10.00 39 Fluoranthene 3 ii. 533 lO. 13 12.27 42 Bis (2-Chloroisopropyl)Ether 1 156.667 156.67 156.67 44 Methylene Ch] oride 8 22.956 I0.00 206.67 45 Methyl Chloride 1 50.000 50.00 50.00 52 Hexachlorobutadiene " 2 I0.000 i0.00 I0.00
VII-142

TABLE VII-46. SU~M~Y OF TrE LONG-T~,M WEI~ AV~(~ ~ ~ O N S FOR THE
FINAL BAT TOXIC P O L L ~ DATA BASE F(]R BAT ~ Y O~E (Continued)
Median of Minimum of Maximum of Est. tong- Est. Umg- Est. U~-
Pollutant N~nber of Term Means Term Means Term Ms~s Number PoLlutant Name Plants (ppb) (ppb) (mb)
55 Naphthalene 10 I0.O00 I0.O0 10.21 56 Nitrobenzene 4 14.000 14.00 149.67 57 2-Nitrophenol 2 27.525 20.00 35.05 58 4-Nitrophenol 3 50.000 50.00 145.00 59 2,4-Dini trophenol 3 50.0O0 50.00 105.35 65 Phenol 22 10.363 10.o0 120.00 66 Bis ( 2-Ethylhexyl )Phi/relate 2 47.133 43.45 50.81 68 Di-N-Butyl Phth~lAte 2 17.606 13.09 22.12 70 Diethyl Pht~lmte 2 42.500 23.67 61.33 71 Dimethyl Phtb~l~te 2 10.000 I0.O0 10.00 72 Belzo(a)Anthracene 2 I0.000 I0.00 10.00 73 ~o(a)Pyrene 1 i0.333 10.33 10.33 74 3,4-Benzofluoranthene 1 10.267 10.27 10.27 75 Benzo(K)Fluoranthene 1 I0.000 I0.00 I0.O0 76 ChtTsene 3 i0.000 I0.O0 I0.O0 77 Acenaphthylene 3 I0.000 I0.O0 13.O0 78 Anthracene 3 i0.000 i0.00 10.O0 80 Fluorene 3 I0.0O0 I0.O0 10.O0 81 Phenanthrene 6 I0.000 i0.00 17.92 84 Pyrene 3 11.333 10.33 16.00 85 Tet rachloroethylene 3 10.423 i0.00 2.27.00 86 Toluene 24 I0.0O0 10.00 102.67 87 Trichloroethylene 4 I0.000 I0.O0 16.00 88 Vinyl Chloride 3 50.000 50.00 174.00
VII-143

TABLE VII-47. StaY OF THE I~IIRM WEI(~ AV~ EFFU~ (I~ONS FOR THE
FINAL BAT RDXIC POI/IITANr DATA BASE FOR BAT SUBC~Y
Median of Minimtm of Maximtm~ of Est. Long- Est. ~- Est. ho~-
Pollutant Nunber of Term Means Term Means Term Means Number Pollutant Name Plants (ppb) (ppb) (ppb)
1 Acenaphthene I I0.000 10.000 10.00 3 Acrylonitrile I 50.000 50.000 50.00 4 Benzene 4 28.576 I0.00 200.33 6 Carbon Tetmchloride - 64.500 64.50 64.50 7 (~lombenzene - 64.500 64.50 64.50 8 1,2,4-Trichlorobenzene - 64.722 64.72 64.72 9 Hexachlorobenzene - 64.722 64.72 64.72 10 i, 2-Dlchloroedlane 2 64.722 62.77 66.67 ii I, I, l-Trlchloroethane I I0.000 I0.00 i0.00 12 Hexachloroethane - 64.722 64.72 64.72 13 I, l-Dichloroethane 1 I0.000 I0.00 I0.00 14 1,1,2-Trichloroethane 2 10.293 10.00 10.59 16 Chioroethane 2 50.000 50.00 50.00 23 Chloroform 2 44.108 II. 81 76.41 25 i, 2-Dlchlorobenzene - 64.722 64.72 64.72 26 1,3-Dlchlorobe~zene - 64.500 64.50 64.50 27 I , 4-Dichlorobeizene - 64.500 64.50 64.50 29 i, l-Dlchloroethylene 2 I0.052 i0.00 i0.i0 30 I, 2-Trans-dichloroe thylene 2 11.052 10.00 12. I0 32 1,2-Dichloropropane - 64.722 64.72 64.72 33 i, 3-Dichloropropene - 64.722 64.72 64.72 34 2,4-Dimethylphenol I I0.000 10.00 I0.00 38 EH1ylhmnzene - 64.500 64.50 64.50 39 Fluoranthene 1 11.533 ii. 53 11.53 42 Bis ( 2-£hloroisopropyl ) Ether - 64.722 64.72 64.72 44 Methylene Chloride 3 10.800 I0.00 30.33 45 Methyl Chloride i 50.000 50.00 50.00 52 Hexachlorobutadiene - 64.500 64.50 64.50
VII-144

TABLE VII-47. S~Y OF TfE LON~T~ ~EI(~ AV~ EFF~ (X~ONS P~ THE
FINAL BAT TOXIC POl/~ DATA BASE FOR BAT S ~ Y T~O (Continued)
Median of Min~ of Maximum of Est. Long- Est. U~- Zst. Long-
Pollutant Number of Term Means Term Means Term Means Pollutant Name Plants (ppb) (ppb) (ppb)
55 Naphthalene 1 10.000 10.00 10.00 56 Nitrobcnzcne 2 948.675 712.60 1184.75 57 2-Nitrophenol 1 20.000 20.00 20.00 58 4-Nitropha~ol I 50.000 50.00 50.00 59 2,4-Dinltrophmol 1 373.000 373.00 373.00 60 4, 6-Dlnltro-O-~l 1 24.000 24.00 24.00 65 Phenol 1 10.000 IO.00 10.00 66 Bis (2-Ethy]he~l)Phtbal-te 1 43.455 43.45 43.45 68 DI-N-Butyl Phtb-late i 13.091 13.09 13.09 70 Diethyl Phtb-l-te 1 23.667 23.67 23.67 71 Dimethyl Phtb-l-te 1 10.000 10.00 10.00 72 Benzo(a)Anthracem 1 10.000 10.00 10.00 73 Benzo(a)Pyre~ 1 i0.333 I0.33 10.33 74 3,4-Benzofhmranthene 1 10.267 10.27 10.27 75 Benzo(k)Fluoranthene 1 I0.000 IO.OO 10.00 76 Chrysene 1 I0.000 IO.OO 10.00 77 Aomaphthylme 1 10.000 10.00 10.00 78 Anthracene 1 i0.000 10.OO 10.00 80 Fluorene 1 IO.0OO IO.OO 10.00 81 Phenanthrene 1 I0.000 10.OO 10.00 84 15,rene 1 10.333 10.33 10.33 85 Tetrachloroethylene 1 18.429 18.43 18.43 86 Toluene 2 12.418 10.951 13.88 87 Trichloroethylene 2 11.586 10.00 13.17 88 Vinyl Chloride 2 64.500 50.OO 79.00
VII-145

TABLE VII-48. FREQUENCY OF WASTE STREAM FINAL DISCHARGE
AND DISPOSAL TECHNIQUES
No. of Plants No. of Plants Total No. Disposal Technique (Full Response) (Part A) of Plants
Direct Discharge to Surface Water 250 54 304
Discharge to Publicly 287 106 393 Owned Treatment Works
Discharge to Privately Owned 6 35 41 Off-Site Treatment Facilities
Deep Well Injection 32 24 56
Contract Hauling 82 46 128
Incineration 63 30 93
Land Application 0 19 19
Evaporation 13 16 29
Surface Impoundment 8 17 25
Recycle 36 0 36
NOTE: Combined direct and indirect discharges have been counted with the direct dischargers; otherwise, remaining disposal techniques can be double-counted for applicable plants.
• Vli-146

s u p p l i e s . The most s u i t a b l e s i t e f o r deep w e l l i n j e c t i o n i s a po rous zone of
r e l a t i v e l y low to m o d e r a t e p r e s s u r e t h a t i s s e a l e d above and below by unbroken
impermeab le s t r a t a . L i m e s t o n e s , s a n d s t o n e s , and d o l o / n i t e s a r e among the r o c k
t y p e s most f r e q u e n t l y used because of t h e i r r e l a t i v e l y h i g h p o r o s i t y . The
f o r m a t i o n chosen must have s u f f i c i e n t volume to c o n t a i n the was te w i t h o u t
r e s u l t i n g in an i n c r e a s e in the h y d r a u l i c p r e s s u r e , which cou ld l e a d to a
c r a c k in the c o n f i n i n g rock l a y e r s .
The most s i g n i f i c a n t h i n d r a n c e to the a p p l i c a t i o n of deep w e l l i n j e c t i o n
i s t he p o t e n t i a l f o r g r o u n d w a t e r and s u r f a c e wa te r c o n t a m i n a t i o n ~ C a r e f u l
c o n t r o l o f the p r o c e s s i s n e c e s s a r y to p r e v e n t any c o n t a m i n a t i o n , and -?
i n j e c t i o n s h o u l d o n l y be used in c e r t a i n g e o g r a p h i c a l l y a c c e p t a b l e a r e a s . T h e
p r o c e s s i s a l s o l i m i t e d to was te s t r e a m s w i t h low l e v e l s of su spended s o l i d s
to p r e v e n t p l u g g i n g of the w e l l s c r e e n which can cause u n s t a b l e o p e r a t i o n .
P r e t r e a t m e n t such as f i l t r a t i o n can p r e v e n t c l o g g i n g of the s c r e e n and the
d i s p o s a l a q u i f e r . Ano the r p r a c t i c a l l i m i t a t i o n i s t h a t was te s t r e a m s t o be
i n j e c t e d s h o u l d have a pH v a l u e be tween 6 .5 and 8 .0 to p r e v e n t equ ipment :
c o r r o s i o n . In g e n e r a l , a l l s t r e a m s s u b j e c t to deep w e l l i n j e c t i o n a r e t r e a t e d
t h r o u g h e q u a l i z a t i o n , n e u t r a l i z a t i o n , and f i l t r a t i o n b e f o r e d i s p o s a l . D e e p
w e l l i n j e c t i o n may be p a r t i c u l a r l y a t t r a c t i v e fo r d i s p o s a l o f i n h i b i t o r y or
t o x i c organic waste streams.
A c c o r d i n g to t he S e c t i o n 308 Q u e s t i o n n a i r e d a t a ba se , 56 OCPSF p l a n t s use
deep w e l l i n j e c t i o n as a means fo r u l t i m a t e d i s p o s a l f o r a l l o r a p o r t i o n o f
t h e i r w a s t e s . .
3. O f f - S i t e T r e a t m e n t / C o n t r a c t Hau l i ng
O f f - s i t e t r e a t m e n t r e f e r s to w a s t e w a t e r t r e a t m e n t a t a s i t e o t h e r t h a n
the g e n e r a t i o n s i t e . O f f - s i t e t r e a t m e n t may occu r a t a c o o p e r a t i v e or
p r i v a t e l y owned c e n t r a l i z e d f a c i l i t y . Of ten a c o n t r a c t h a u l e r / d i s p o s e r i s
pa id to p i c k up the w a s t e s a t t he g e n e r a t i o n s i t e and to h a u l them to the
t r e a t m e n t f a c i l i t y . The h a u l i n g may be a c c o m p l i s h e d by t r u c k , r a i l , or b a r g e .
VII-147

Off-site treatment/contract hauling is usually limited to low volume
wastes, many of which may require specialized treatment technologies for
proper disposal. Generators: of these wastes often find it more economical to
treat the wastes at off-site facilities than to install their own treatment
system. Sometimes, adjacent plants find it more feasible to install a
centralized facility to handle all wastes from their sites. The costs usually
are shared by the participants on a prorated basis.
According to the Section 308 questionnaire data base, 128 plants use con-
tract hauling and off-site treatment as a final disposal technique for part or
all of their wastes.
4. Incineration
Incineration is a frequently used zero discharge method in the OCPSF
industry. The process involves the oxidation of solid, liquid, or gaseous
combustible wastes primarily to carbon dioxide, water, and ash. Depending
upon the heat value of the material being incinerated, incinerators may or may
not require auxiliary fuel. The gaseous combustion or composition products
may require scrubbing, particulate removal, or another treatment to capture
materials that cannot be discharged to the atmosphere. This treatment may
generate a waste stream {hat ultimately will require some degree of treatment.
Residue left after oxidation will also require some means of disposal.
Incineration is usually used for the ultimate disposal of flammable
liquids, tars, solids, and hazardous waste materials of low volume that are
not amenable to the usual end-of-pipe treatment technologies. To achieve
efficient destruction of the waste materials by incineration, accurate and
reliable information on the physical and chemical characteristics of the waste
must be acquired in order to determine appropriate operating conditions for
the process (e.g., feed rates, residence time, and temperature) and the
required destruction efficiency.
Vli-148

According to the Section 308 Questionnaire data base, 93 OCPSF plants use
incineration as an ultimate disposal technique.
5. Evaporation
Evaporation is a concentration process involving removal of water from a
solution by vaporization to produce a concentrated residual solution. The
energy source may be synthetic (steam, hot gases, and electricity) or natural
(solar and geothermal). Evaporation equipment can range f~om simple open
tanks or impoundments to sophisticated multi-effectevaporators capable of
handling large volumes of liquid. The evaporation process is designed on the
basis of the quantity of water to be evaporated, the quantity of heatrequired
to evaporate water from solution, and the heat transfer rate~ The process
offers the possibility of total wastewater elimination with Only the remaining
concentrated solution requiring disposal and als0 offers the possibility of
recovery and recycle of useful chemicals from wastewater.
According to the Section 308 Questionnaire date base, 29 OCPSF plants use
evaporation as a final disposal technique.
6. Surface Impoundment
Impoundment generally refers to wastewater storage in large ponds.
Alternate or zero discharge from these facilities relies on the natural losses
by evaporation, percolation into the ground, or a combination thereof.
Evaporation is generally feasible if precipitation, temperature, humidity, and
wind velocity combine to cause a net loss of liquid in the pond. Surface
impoundments ar~ usually of shallow depth and large surface area to encourage
evaporation. If a net loss does not exist, recirculating sprays, heat, or
aeration can be used to enhance the evaporation rate to provide a net loss.
The rate of percolation of water into the ground is dependent on the subsoil
conditions of the area of pond construction. Since there is a great potential
for contamination of the shallow aquifer from percolation, impoundment ponds
are frequently lined or sealed to avoid percolation and thereby make the
basins into evaporation ponds. Solids that accumulate over a period of time
in these sealed ponds will eventually require removal. Land area requirements
are a major factor limiting the amount of wastewater disposed of by this
method.
VII-149

According to the Sec t i on 308 Q u e s t i o n n a i r e da t a base, 25 OCPSF p l a n t s
r e p o r t u s ing s u r f a c e impoundments as a f i n a l d i s p o s a l t e c h n i q u e .
7. Land Application
Land treatment is the direct application of wastewater onto land with
treatment being provided by natural processes (chemical, physical, and
biological) as the effluent moves through a vegetative cover or the soil.
Land application greatly reduces or eliminates BOD 5 and suspended solids,
results in some nutrient removal, may result in some heavy metal removal, and
can recharge groundwater. A portion of the wastewater is lost to the atmo-
sphere through evapotranspiration, part to surface water by overland flow, and
the remainder percolates to the groundwater system.
Land disposal of industrial wastewaters must be compatible with land use
and take into consideration the potential for environmental pollution, damage
to crops, and entrance into the human food chain. To protect soil fertility
and the food chain during land disposal, it is necessary to determine the
capacity of soils to remove nitrogen, the potential toxicity of organic and
inorganic contaminants to p].ant life and soil, and the deleterious effects of
dissolved salts, including sodium, on plants and soil.
According to the Section 308 0uestionnaire data base, 19 OCPSF plants
report using land application as a final disposal technique.
G. SLUDGE TREATMENT AND DISPOSAL
Solid residues (sludge) are generated by many wastewater treatment
processes discussed in previous sections of this chapter. Sludge is generated
primarily in biological treatment, chemical precipitation (coagulation/
flocculation), and chemically assisted clarifiers. Sludge must be treated to
reduce its volume and to render it inoffensive before it can be disposed.
Sludge treatment alternatives include thickening, stabilization, conditioning,
and dewatering. Disposal options include combustion and disposal to land.
The frequency of these treatment and disposal alternatives, according to the
Section 308 Quesionnaire data base, is presented in Table VII-49.
VII-150

w_.~T ~. VII-49. ~ 0 F SI/DGE K~]X/N3, ~ ] I ~ , .kND IXSK)SAL ~ ( T J E S
Direct Indirect Other Discharge Total
Treatment Technology
# of Full-l~ Plants With Teeh.
# of Part A Plants With
Tech.
# of Full-~ Plants With
Tee_h.
# of Part A Plants With
Tech.
# of ~,]]-Resp # of Part A Plants With Plants With
Teeh. Teeh. # of Plants With
Technology
• 0 23 1 10 0 2 36
Centr i f i~ t ion 2 1 0 1 0 0 4
Fil trat ion 1 2 0 1 0 0 4
I
Digestion
0n-Site Iandfi l l
0
8
13.
11
0
1
8
1
O
0 ..
1
0
22
21
Incineration 2 12 1 0 0 0 15
Contract g~,,1 irg 6 6 4 2 0 0 18
Off-Site Landfill 5 12 4 25 0 4 50
Dissolved Air Flotation (mF) U h i ~
- 0 18 0 30 0 2 50

Sludge thickening is the first step in removing water from sludges to
reduce their volume. It is generally accomplished by physical means,
including gravity settling, flotation, and centrifugation. The principal
purposes of stabilization are to make the sludge less odorous and putrescible,
and to reduce the pathogenic organism content. The technologies available for
sludge stabilization include chlorine oxidation, lime stabilization, heat
treatment, anaerobic digestion, and aerobic digestion. Conditioning involves
the biological, chemical, or physical treatment of a sludge to enhance
subsequent dewatering techniques. The two most common methods used to
condition sludge are thermal and chemical conditioning. Dewatering, the
removal of water from solids to achieve a volume reduction greater than that
achieved by thickening, is desirable to prepare sludge for disposal and to
reduce the sludge volume and mass to achieve lower transportation and disposal
costs. Some common dewatering methods include vacuum filtration, filter
press, belt filter, centrifuge, thermal, drying beds, and lagoons. Combustion
serves as a means for the ultimate disposal of organic constituents found in
sludge. Some common equipment and methods used to incinerate sludge include
fluidized bed reactors, multiple hearth furnaces, atomized spray combustion,
flash drying incineration, and wet air oxidation. Environmental impacts of
combustion may include discharges to the atmosphere (particles and other toxic
or noxious emissions), surface waters (scrubbing water), and land (ash).
Disposal of sludge to land may include the application of the sludge (usually
biological treatment sludge) on land as a soil conditioner and as a source of
fertilizer for plants, or the stockpiling of sludge in landfills or permanent
lagoons. In selecting a land disposal site, consideration must be given to
guard against pollution of groundwater or surface water supplies.
According to the Section 308 0uestionnaire data base, 116 plants report
treating their sludge by thickening or dewatering (26 by thickening, 4 by
centrifugation, 4 by filtration, 22 by digestion, and 50 by dissolved air
flotation). Of the 104 plants reporting sludge disposal methods, 21 use
on-site landfills, 15 employ incineration, 18 use contract hauling, and 50
dispose of sludge at off-site landfills.
VII-152

H. LIMITATIONS DEVELOPMENT
This section describes the methodology usedto develop BPT, BAT, and PSES
effluent limitations and standards and includes discussions of data editing
criteria, derivation of long-term averages, and derivation of "Maximum for
Monthly Average" and "Maximum for Any One Day" variability factors.
I. BPT Effluent Limitations
As discussed in Section VI, the Agency decided to control BOD S and TSS
under BPT. This section discusses the data editing rules and methodology used
to derive the final BPT effluent limitations guidelines for BOD 5 and TSS.
a. Data Editing Criteria
Two sets of data editing rules were developed for BPT; one set was used
to edit the data base, which was utilized to calculate the long-term averages
(LTA) BOD 5 and TSS values for each subcategory, while the second set was used
to edit the BPT daily data base, which was utilized to derive variability
factors.
b. LTA Data Editing
The two major forms of data editing performed on the LTA data base
obtained through the 1983 Section 308 Questionnaire were the dilution adjust-
ment assessments made for each full-response, direct discharge OCPSF facility
which submitted B0D 5 or TSS influent and/or effluent data and a BPT perform-
ance edit.
Dilution Adjustment - Since the limitations apply to all process
wastewater as defined in Section V, the Agency grouped all volumes of process
and non-process wastewater for the purpose of adjusting reported plant-level
BOD 5 and TSS concentrations for dilution by nonprocess wastewater. This also
permitted the Agency to estimate engineering costs of compliance based on the
proper process wastewater flows and conventional pollutant concentrations.
For example, if BOD s was reported as 28 mg/1 at the final effluent sampling
location with 1 MGD of process wastewater flow that was combined with 9 MGD of
uncontaminated nonprocess cooling water flow, then the B0D S concentration in
VII-153

the process wastewater alone was actually 280 mg/l before dilution. This
conservatively assumes that the cooling water flow is free of BOD S and TSS.
However, in the AgEncy's judgment, many of the sources and flows reported
as nonprocess wastewater by plants in their respective Section 308 Question-
naires are contaminated by process sources of BOD S and TSS. Table VII-50
presents a list of the miscellaneous wastewaters reported in the Section 308
Questionnaires as nonprocess, which EPA has determined to be either contam-
inated (and therefore process wastewater) or uncontaminated with conventional
pollutants. The Agency reviewed this list after receiving public comments oll
both NOAs criticizing some of its assignments and determined that, in general,
its assignments were correct.
Since the limitations apply to process wastewater (which includes
"contaminated nonprocess" wastewater) only, the relative contributions of
process wastewater versus "uncontaminated nonprocess" wastewater were deter-
mined at the influent and effluent sample sites. These data were used to
calculate plant-by-plant "dilution factors" for use in adjusting pollutant
concentrations at influent and effluent sampling locations as appropriate.
The general procedure for determining sample-site dilution factors and
adjusting BOD s and TSS values was as follows:
Sum uncontaminated nonprocess wastewater flows for an individual plant (e.g., Plant No. 61 uncontaminated nonprocess wastewater flow = 0.280 MGD)
Sum process wastewater flow for an individual plant (e.g., Plant No. 61 process wastewater flow = 0.02 MGD)
Divide the sum of uncontaminated nonprocess wastewater flows by the total process wastewater flow to determine dilution factor (e.g., for Plant No. 61, 0.280 MGD/ 0.02 MGD = 14.0)
Apply the sample-site dilution factor (plus i) by multiplying by the reported BOD. or TSS value to be adjusted (e.g., for Plant No. 61, 196 mg/l effluent BOD s x (14.0 + l) = 2,940 mg/1 effluent BOD s.
VII-154

TABLE VII-50. CONTAMINATED AND UNCONTAMINATED MISCELLANEOUS "NONPROCESS" WASTEWATERS
REPORTED IN THE 1983 SECTION 308 QUESTIONNAIRE
Contaminated "Nonprocess" Wastewaters (therefore designated as
process wastewater)
Air Pollution Control Wastewater (B5)
Sanitary (receiving biological treat-ment) (B4)
Boiler Blowdown
Sanitary (indirect discharge)
Steam Condensate
Vacuum Pump Seal Water
Wastewater Stripper Discharge
Bi from Vertac
Boiler Feedwater Lime
Softener Blowdown
Contaminated Water Offsite
Condensate
Storage, Lans, Shops
Laboratory Waste
Steam Jet Condensate
Water Softener Backwashing
Miscellaneous Lab Wastewater
Raw Water Clarification
Landfill Leachate
Water Treatment
~Technical Center
Scrubber Water
Utility Streams
Washdown N-P Equipment
Contact Cooling Water
Vacuum Steam Jet Blowdown
Densator Blowdown
Bottom Ash-Quench Water
Demineralizer Washwater
Uncontaminated Nonprocess wastewaters
Non-Contact Cooling Water (BI)
Sanitary (no biological treatment, direct discharge) (B4)
Cooling Tower Blowdown (B2)
Stormwater Site Runoff (B3).
Deionized Water Regeneration
Miscellaneous Wastewater (conditional)
Softening Regeneration
Ion Exchange Regeneration
River Water intake
Make-up Water
Fire Water Make-up
Tank Dike Water
Demineraiizer Regenerant
Dilution Water
Condensate Losses
Shipping Drains
Water Treatment Blowdown j
Cooling Tower Overflow
Chilled Water Sump Overflow
Air Compressor and Conditioning Blow
Firewall Drainings
Other N0n-contact Cooling
Miscellaneous Leaks and Drains
Boiler House Softeners
Fire Pond Overflow
Boiler Regeneration Backwash
Groundwater (Purge)
Firewater Discharge
Freeze Protection Water
VII-!55

TABLE VII-50. CONTAMINATED AND UNCONTAMINATED MISCELLANEOUS "NONPROCESS" WASTEWATERS
REPORTED IN THE 1983 SECTION 308 QUESTIONNAIRE (Continued)
Contaminated "Nonprocess" Wastewaters (therefore designated as
process wastewater)
Water Softening Backwash
Lab Drains
Closed Loop Equipment Overflow
Filter Backwash
Demineralizer Wastewater
Laboratory Offices
Demineralizer Blowdown
Utility Clarlfier Blowdown
Steam Generation
RO Rejection Water
Power House Blowdown
Inert Gas Gen, Blowdown
Contaminated Groundwater
Potable Water Treatment
Unit Washes
Non-Contact Floor Cleaning
Slop Water from Dist. Facilities
Laboratory and Vacuum Truck
Ion Bed Regeneration
Tankcar Washing (HCN)
Film Wastewater
Generator Blowdown
Air Sluice Water
Research and Development
Ouality Control
Steam Desuperheating
Pilot Plant
Other Company Off-site Waste
Ion Exchange Resin Rinse
U n c o n t a m i n a t e d Nonproces s ~ a s t e w a t e r s
H 2 and CO Generation
Demineralizer Spent Regenerants
Lime Softening of Process
Miscellaneous Service Water
Recirculating Cooling System
HVAC Blowdown Lab Utility
Condenser Water Backwash
Deonfler Regenerant
Raw Water Filter Backwash
Distribution
VII-156

TABLE Vll-50. CONTAMINATED AND UNCONTAMINATED MISCELLANEOUS "NONPROCESS" WASTEWATERS
REPORTED IN THE 1983 SECTION 308 QUESTIONNAIRE (Continued)
Contaminated "Nonprocess" Wastewaters Uncontaminated Nonprocess Wastewaters (therefore designated as
process wastewater)
Iron Filter Backwash
Area Washdown
Vacuum Pump Wastewater
Garment Laundry
Hydraulic Leaks
Grinder Lubricant
Utility Area Process
Contact Rainwater
Alum Water Treatment
Incinerator H20
Product Wash
Backflush from Demineralizer
Water Clarifier Blowdown
Water Treatment Filter Wash
Equipment Cooling H20
Belt Filter Wash
Ejector
OCPSF Flow from Another Plant
, Vli-157

Plant-specific dilution factor calculations and adjustments are
summarized in Appendix VII-B.
BPT Performance Edits - As stated earlier in Section VII, the Agency has
chosen BPT Option I (which is based on the performance of biological treatment
only) as the technology basis for the final BPT effluent limitations. After
selecting the technology basis, the Agency developed the associated limita-
tions based on the "average-of-the-best" plants that use the BPT Option I
technology. A performance criterion was developed to segregate the better
designed and operated plants from the inadequate performers. This was done to
ensure that the plant data relied upon to develop BPT limitations reflected
the average of the best existing performers. Since the data base also
included plants that are inadequate performers, it is necessary to develop
appropriate criteria for differentiating poor from good plant performance.
The BOD s criteria used for the March 21, 1983 Proposal, the July 17, 1985 and
the December 8, 1986 Federal Register NOAs was to include in the data base any
plants with a biological treatment system that, on the average i) discharged
50 mg/l or less B0D 5 after treatment, or 2) removed 95 percent or more of the
BOD s that entered the end-of-pipe treatment system.
The Agency has received two diametrically opposed sets of comments on the
proposed data editing criteria used to develop BPT limitations. EPA proposed
to select plants for analysis in developing limitations only if the plants
achieve at least a 95 percent removal efficiency for BOD s or a long-term
average effluent BOD 5 concentration below 50 mg/1. On one hand, many industry
commenters argued that these criteria were too stringent, were based upon data
collected after 1977 from plants that had already achieved compliance with BPT
permits and thus raised the standard of performance above what it would have
been had the regulation been promulgated in a timely manner, and had the
effect of excluding from the BPT data base some well-designed, well-operated
plants. An environmental interest group argued, in contrast, that the
criteria were not stringent enough, in that they resulted in the inclusion of
the majority of plants in the data base used to develop effluent limitations.
VII-158

The data collected by EPA for the BPT regulation were indeed, as industry
commenters have noted, based largely on post-1977 data. EPA had originally
collected data in the early and mid-1970s that reflected OCPSF pollutant
control practices at that time. As a result of industry challenges to EPA's
ensuing promulgation of BPT (and other) limitations for the OCPSF industry,
EPA began a new regulatory development program, which included a new series of
data-gathering efforts (see Section I of this document). Industry commenters
are correct in noting that the data are thus taken to a large extent from
OCPSF plants that had already been issued BPT permits that required compliance
by July 1977 with BPT limitations established by the permit writers on a
case-by-case basis. It is thus fair to conclude that the performance of at
least some of these plants was better when EPA collected the data for the new
rulemaking effort than it had been in the mid-1970s when the original BPT
regulations were promulgated.
EPA does not believe that the use of post-1977 data is improper. First,
the Clean Water Act provides for the periodic revision of BPT regulations when
appropriate. Thus it is within EPA's authority to write BPT regulations after
'1977 and to base them on the best information available at the time. More-
over, it is not unfair to the industry. The final BPT regulations are based
on the same technology that was used to effectively control BOD S and TSS in
the 1970s--biological treatment preceded by appropriate process controls and
in-plant treatment to ensure effective, consistent control in the biological
system, and followed by secondary clarification as necessary to ensure
adequate control of solids. The resulting effluent limitations are not neces-
sarily more (or less) stringent than they would have been if based on pre-1977
data. Many of the plants that satisfy the final data editing criteria
discussed below, and thus are included in the BPT data base, would not have
satisfied those criteria in the mid-1970s. The improved performance wrought
by the issuance of and compliance with BPT permits in the 1970's has resulted
in EPA's ability in 1987 to use data from a larger number of plants to develop
the BPT limitations. Approximately 72 percent of the plants for which data
were obtained pass the final BOD 5 editing criteria (95 percent/40 mg/1 for
biological only treatment); the editing criteria have excluded other plants
that, despite having BPT-type technology in-place, were determined not to meet
the performance criteria used to establish the data base for support of BPT
VII-159

limitations. EPA concludes that the use of post-1977 data has resulted in a
good quality but not unrealistic BPT data base.
EPA has modified the BOD 5 editing criteria to make them slightly more
stringent. However, it must be noted that EPA does not consider the selection
of editing criteria to be a strict numerical exercise based upon exclusion of
data greater than a median or any other such measure. EPA specifically
disagrees with the comment that data reflecting BPT performance must
necessarily constitute performance levels better than a median. The criteria
represent in numerical terms what is essentially an exercise of the Agency's
judgment, informed in part by industry data, as to the general range of
performance that should be attained by the range of diverse OCPSF plants
operating well-designed biological systems properly. The numerical analyses
discussed below should thus be regarded as an analytical tool that assisted
EPA in exercising its judgment.
The data to which the criteria have been applied reflect the performance
of plants that have been issued BPT permits requiring compliance with BPT
permit limits. It is not unreasonable to expect, therefore, that the class of
facilities identified as the "best" performers in the industry is considerably
larger than it would have been had the data been collected in the mid-1970s.
This result is consistent with the purpose and intent of the NPDES program:
to require those plants performing below the level of the best performers to
improve their performance Moreover, it should be noted that while the major-
ity of OCPSF plants pass the initial screening criteria, a majority of OCPSF
plants (approximately 70 percent) will nonetheless need to upgrade their
treatment systems' performance to comply with the BPT effluent limitations
guidelines, based upon the reported effluent data (for 1980), and the long-
term average targets for BOD s and TSS. The fact that a majority of plants
will need to upgrade years after they received their initial BPT permits
indicates that the result of the adoption of the data base used to develop the
limitations is appropriately judged the best practicable treatment.
The editing criteria were applied to the "308" survey data, composed of
annual average BOD s and TSS data from plants in the OCPSF industry. The
purpose of the editing criteria was to establish a minimum level of treatment
VII-160

pe r fo rmance a c c e p t a b l e f o r admiss ion of a p l a n t ' s d a t a i n t o the d a t a base t h a t
would be used to d e t e r m i n e BPT l i m i t a t i o n s . F i r s t , on ly d a t a from p l a n t s wi th
s u i t a b l e t r e a t m e n t ( i . e . , b i o l o g i c a l t r e a t m e n t ) were c o n s i d e r e d f o r i n c l u s i o n
in the d a t a base . For t h e s e p l a n t s , the use of both a p e r c e n t removal
c r i t e r i o n and an a v e r a g e e f f l u e n t c o n c e n t r a t i o n c r i t e r i o n f o r BOD 5 i s
a p p r o p r i a t e , s i n c e w e l l - o p e r a t e d t r e a t m e n t can a c h i e v e e i t h e r s u b s t a n t i a l
removals a n d / o r low e f f l u e n t l e v e l s . In a d d i t i o n , use of on ly a p e r c e n t
removal c r i t e r i o n would e xc l ude d a t a from p l a n t s t h a t s u b m i t t e d u s a b l e d a t a
but d id not r e p o r t i n f l u e n t d a t a . The use of an e f f l u e n t l e v e l c r i t e r i o n
a l lowed the use of d a t a from such p l a n t s in e s t i m a t i n g the r e g r e s s i o n
e q u a t i o n .
Fo l lowing rev iew of the d a t a base , EPA c o n t i n u e s to b e l i e v e t h a t
95 p e r c e n t BOD 5 removal i s an a p p r o p r i a t e e d i t i n g c r i t e r i o n . Over h a l f the
p l a n t s in the "308" s u r v e y d a t a t h a t r e p o r t e d both i n f l u e n t and e f f l u e n t BOD 5
a c h i e v e b e t t e r than 95 p e r c e n t removal . The median removal f o r t h e s e p l a n t s
i s 95.8 p e r c e n t , which r e f l e c t s good removal from an e n g i n e e r i n g po in t of
view.
The Agency also continues to believe that a cut-off for average effluent
BOD 5 concentration is necessary to establish an acceptable standard of
performance in addition to percent removal. In order to establish a cutoff
value for the final regulation and respond to various comments, the Agency
re-examined the "308" survey data. There are data from a total of 99 full
response direct discharging plants with end-of-pipe biological treatment only
(the selected BPT technology, as discussed below) that reported average
effluent BOD 5 and a full range of information regarding production at the
plant. All of these data were used in the evaluation of the BOD 5 cutoff, even
in cases of plants that did not report influent values and for which removal
efficiencies could therefore not be estimated. The median BOD 5 average
effluent for these 99 plants is 29 mg/l. There is no engineering or statis-
tical theory that would support the use of the median effluent concentration
as a cutoff for developing a regulatory data base. In fact, there are many
plants that, in the Agency's best judgment, achieve excellent treatment and
have average effluent values greater than the overall median of 29. There are
many reasonable explanations for differences in average effluent levels at
VII-161

well operated plants. Differences in a plant's BPT permit limitations coupled
with individual company waste management practices and wastewater treatment
system design and operation practices, in addition to the type of products and
processes at each plant, contribute to differences in average effluent levels
achieved. To obtain insight into differences in BOD s values among different
subcategories, the data were grouped into different subsets based on
subcategory production at each plant. The results of this analysis are
summarized in Parts A and B of Table VII-51.
The Agency grouped the data two different ways for analysis. Thus, the
data were assigned by plant into two different groupings, each with different
subgroups, and the medians of the average BOD 5 effluent values in each sub-
group were determined. The first grouping placed plants into three subgroups
(plastics, organics, and mixed) and the second into five subgroups (fibers/
rayon, thermoplastics, thermosets, organics, and mixed). All plants
considered in the analysis had biological treatment only in place. The
assignment of a plant to a subgroup was determined by the predominant
production at the plant (i.e., whether a plant had 95% or more of its
production in the subgroup). For instance, if a plant has 95 percent or more
plastics production, it was placed in the plastics subgroup. Those plants not
containing 95 percent or more of a subgroup production were classified as
mixed.
The largest subset median average effluent BOD 5 in both groupings is
42.5 mg/1, which suggests that the proposed 50 mg/l criterion is high.
In the absence of a theoretical engineering or statistical solution that
would determine what value should be used in a regulatory context, the Agency
examined some reasonable alternatives suggested by the results displayed in
Parts A and B of Table VII-51. The Agency considered using different editing
criteria for different product subgroups, such as those listed in Part A of
Table VII-51, but decided to use a single criterion to define the final data
base.
VII-162

TABLE VII-51. SUMMARY STATISTICS FOR DETERMINATION
OF BPT BOD 5 EDITING CRITERIA BY GROUPS
Median of Plant Number of Average Effluent
Subset Plant Averages BOD 5 (mg/l)
A. Summary of Groups for Three Groupings
Plastics Organics Mixed (all remaining plants)
30 42 27
20.5 42.5 35
All Plants 99 29
B. Summary of Groups for the Five Groupings
Rayon/Fibers 7 14 Thermoplastics 17 18 Thermosets 3 32 Organics 42 42.5 Mixed (all remaining plants) 30 35.5
All plants 99 29
VII-163

An important reason for using a single edit criterion for all subcate-
gories is that this facilitates setting an edit criterion for the group of
plants that do not fall primarily into a single subcategory. These mixed
plants comprise a significant segment of the industry; thus, regulations must
be based on data from this segment as well. Editing criteria that are
subcategory-specific cannot be applied to mixed plants. The Agency did,
however, examine BOD s levels by subgroups to gain insight into what uniform
editing criterion would be appropriate.
For the subgroups exhibiting relatively high BOD s levels (organics and
m~xed plants), EPA determined that a 40 mg/l BOD s edit would be appropriate.
This value is between the median for these two subgroups. Given the fact that
plants with substantial organics production tend to have fairly high influent
BOD 5 levels or complex, sometimes difficult to biodegrade wastewaters, EPA
believes that a more stringent edit would not be appropriate for these two
groups. However, EPA believes that a less stringent edit would be inappro-
priate, since many plants in these subgroups meet the 40 mg/l criterion.
The other subgroups have median values below 40 mg/l, and EPA examined
them closely to determine whether they should be subject to more stringent
edits than the organics and mixed subgroups. EPA concluded that they should
not for the reasons discussed below.
The thermosets subgroup contains three plants, whose average effluent
BOD 5 levels are approximately 15, 32, and 34 mg/l, respectively. EPA believes
all three should be retained in the data base. This is particularly important
because a major source of wastewater at the plant with the lowest value is
only melamine resin production; several other types of resins fall under the
thermoset classification. Thus, including all three plants' data provides
improved'coverage of thermoset operations in the data base. An edit of
30 mg/l arbitrarily excludes data from the two plants whose performance
slightly exceeds 30 mg/l and would result in melamine resin production being
the predominant thermoset production represented in the data base.
VII-164

The average BOD 5 effluent values for rayon/fibers and thermoplastics are
lower than the average values for thermosets, organics, and mixed. The Agency
evaluated the effects of these subgroups by uniformly editing the industry
data base at 30, 35, 40, and 50 mg/l, using the BPT regression approach to
calculating subcategory long-term average values. The long-term averages
calculated for rayon/fibers and thermoplastics are relatively insensitive to
the use Of the 30, 35, 40, and 50 mg/l edited data bases. That is, the
long-term averages are roughly the same regardless of which of these edits is
used.
After considering the effect of the various editing criteria on the
different subgroups discussed above, EPA has concluded that a 95 percent/
40 mg/i BOD s editing criterion is most appropriate. Moreover, in defining
BPT-level performance, this criterion results in a data base that provides
adequate coverage of the industry.
As discussed previously, the Agency also saw a need to edit the data base
for TSS performance. Some commenters recommended additional editing for TSS,
and the Agency agrees that this is justified. The Agency is using two edits
for the TSS data. The primary edit is that the data must be from a plant that
meets the BOD S edit (i.e., achieves either 95 percent removal of BOD s or
40 mg/1). Second is an additional requirement that the average effluent TSS
must be I00 mg/1 or less. As a result of this edit, TSS data from 61 plants
are retained for analysis.
In a well-designed, well-operated biological treatment system, achievable
effluent TSS concentration levels are related to achievable effluent BOD 5
levels and, in fact, often are approximately proportional toBOD s. This is
reflected in the OCPSF data base for those plants that meet the BOD 5 perfor-
mance editing criteria (provided that they also exhibit proper clarifier
performance, as discussed below). By using TSS data only from plants that
have good BOD s treatment, the Agency is thus establishing an effective initial
edit for TSS removal by the biological system. However, as BOD 5 is treated
through biological treatment, additional TSS may be generated in the form of
biological solids. Thus, some plants may need to add post-biological
secondary clarifiers to ensure that such biological solids are appropriately
treated.
VII-165

Thus, while the 95/40 BOD s editing ensures good BOD 5 treatment and a
basic level of TSS removal, ]plants meeting this BOD 5 editing level will not
necessarily meet a TSS level suitable for inclusion in the data base used to
set TSS limitations. To ensure that the TSS data base for setting limitations
reflects proper control, EPA proposed in the December 8, 1986, Notice to
include only data reflecting a long-term average TSS concentration of less
than or equal to i00 mg/1.
The December 1986 Notice requested comment on the use of the 100 mg/1 TSS
editing criterion and, as an alternative, use of 55 mg/1 TSS concentration as
the editing criterion along with setting the TSS limitations based upon the
relationship between BOD s and TSS. Some commenters criticized both the I00
mg/1 and 55 mg/l as overly stringent, and asserted that such additional TSS
edits were unnecessary since the BOD 5 edit was sufficient to assure that TSS
was adequately controlled. These commenters, while agreeing that there was a
relationship between BOD 5 and TSS, also recommended a slightly different
methodological approach for analyzing the BODs/TSS relationship.
The Agency disagrees with the commenters who argued in effect that all
TSS data from plants that meet the BOD 5 criteria be included in the data base
for setting TSS limitations. The Agency has examined the data and has
concluded that an additional TSS edit is required at a level of i00 mg/l.
Support for this is evident in the reasonably consistent BOD 5 and TSS
relationship for plants in the data set that results from the 95/40 BOD 5 edit,
for TSS values of 100 mg/1 or less. For TSS values above I00 mg/1, there is a
marked change in the pattern of the BODs/TSS relationship. Below I00 mg/1
TSS, the pattern in the BODs/TSS data shown in Figure VII-2 is characterized
by a homoscedastic or reasonably constant dispersion pattern along the range
of the data. Above the 100 mg/1 TSS value, there is a marked spread in the
dispersion pattern of the TSS data. The Agency believes that this change in
dispersion (referred to as heteroscedastic) reflects insufficient control of
TSS in some of the treatment systems. The Agency has concluded that the
i00 mg/1 TSS edit provides a ceasonable measure of additional control of TSS
required in good biological treatment systems that have met the BOD5 edit
c r i t e r i o n .
VII-166

PLANT AVERAGE TSS EFFLUENT in mg/1
300
+
250
200 +
<~ P - I
H !
i , . -=
O ~
t50
i00
50
+ + + +
+ # + . + + + + ~ + +÷ .=.+ +-
+ ++
+
,+++ +
+ +
+ +
+ +
+
+
TSS=iO0 mg/1
TSS=60 mg/1
0 i ~ l I i i l i i iI
50
l i ' i ' l i l , i -e i s
tO0
i a . .
a I s I e ,.
a I
t50
e a ! r I • I e I a | e
200
e a | a a I ! I I
250
PLANT AVERAGE BOD5 EFFLUENT in mg/1
Figure V I I - 2 • Plot of Average T S S E f f l u e n t Versus B O D 5 Ef f luent
for Plants W i t h Biological On ly T r e a t m e n t w i t h >i= 9 5 % BOD 5 Remova l o r B O D 5 Ef f luent ~<= 40 m g / I

The Agency considered a more stringent TSS editing criterion of 60 mg/l,
rather than i00 mg/1. The Agency's analysis demonstrated that this is not
appropriate. Most fundamentally, this criterion would result in the exclusion
of plants that EPA believes are well-designed and well-operated plants.
Moreover, the relationship between BOD s and TSS is well defined for plants
with TSS less than I00 mg/1 and BOD s meeting the 95%/40 mg/l criteria.
The Agency gave serious consideration to the statistical method
recommended by a commenter for the analysis of the BODs/TSS relationship.
This commenter recommended a linear regression relationship between the
untransformed (not converted to logarithms) BOD s and TSS data. The Agency has
retained the use of a linear regression relationship between the natural
logarithms of the BOD s and TSS data. The logarithmic appproach is similar to
that recommended by the commenter~ but resulted in a somewhat better fit to
the data.
In response to comments, the Agency also considered an editing criterion
based on secondary clarlfler design criteria (i.e., clarifier overflow rates
and solids loadings rates). While the Agency agrees that using these design
criteria, if available, may have provided an appropriate editing criterion,
very little data were supplied by industry in response to the Agency's request
for data regarding these design criteria or were otherwise contained in the
record.
Daily Data Base Editing
Prior to the calculation of BPT variability factors, the BPT daily data
base was reviewed to determine if each plant's BOD s and TSS data were
representative of the BPT technology performance.
The BPT daily data base contains daily data from 69 plants. The sources
of the data were the Supplemental Questionnaire, public comment data from
plants and the State of South Carolina, and data obtained during the EPA
12-Plant Study. The daily data, which included flow, BODs, and TSS, were
entered on a computer data base. The sampling site for each parameter was
identified by a treatment code that was entered along with the data. The
VII-168

t r e a t m e n t code a l l o w e d s p e c i f i c i d e n t i f i c a t i o n of t he s a m p l i n g s i t e w i t h i n t he
t r e a t m e n t p l a n t . For example , e f f l u e n t d a t a were i d e n t i f i e d as sampled a f t e r
t he s e c o n d a r y c l a r i f i e r , a f t e r a p o l i s h i n g pond, a f t e r t e r t i a r y f i l t r a t i o n , a t
f i n a l d i s c h a r g e , e t c .
A f t e r t he d a t a base was e s t a b l i s h e d , t he d a t a a t each s a m p l i n g s i t e
were compared w i t h t he t r e a t m e n t sy s t em d iag rams o b t a i n e d in the 1983 S e c t i o n
308 Q u e s t i o n n a i r e . The compar i son s e r v e d to v e r i f y t h a t t he d a t a c o r r e s p o n d e d
to the s a m p l i n g s i t e s i n d i c a t e d on the d i a g r a m s , and to d e t e r m i n e i f t he d a t a
were r e p r e s e n t a t i v e o f t he p e r f o r m a n c e o f OCPSF was t e t r e a t m e n t s y s t e m s . Non-
r e p r e s e n t a t i v e d a t a were t h o s e d a t a from e f f l u e n t s a m p l i n g s i t e s where the
t r e a t m e n t p l a n t e f f l u e n t was d i l u t e d (>25 p e r c e n t ) w i t h u n c o n t a m i n a t e d
non-process waste streams prior to sampling; treatment systems where a
significant portion of the wastewater treated by the treatment system
(>25 percent) was uncontaminated non-process or non-OCPSF wastewater;
treatment systems where side streams of wastewaters entered the treatment
system midway through the process, and no data were available for these waste
streams; and treatment systems where the Influent sampling site did not
include all wastewaters entering the head of the treatment system (e.g., data
for a single process waste stream rather than all of the Influent waste
streams).
E x a m i n a t i o n of t h e d a t a available for each p l a n t and t he t r e a t m e n t s y s t e m
d iag rams p r o v i d e d t he b a s i s f o r e x c l u s i o n o f some o f the p l a n t s from f u r t h e r
a n a l y s i s . The c r i t e r i a used were:
Performance based on more than BPT Option I controls
Data no t r e p r e s e n t a t i v e o f t he p e r f o r m a n c e of the p l a n t ' s t r e a t m e n t system
o T r e a t m e n t s y s t e m s no t r e p r e s e n t a t i v e o f t he t r e a t m e n t t e c h n o l o g y n o r m a l l y used in the OCPSF i n d u s t r y ( e . g . , e f f l u e n t d a t a d i d no t r e p r e s e n t one w a s t e w a t e r t r e a t m e n t s y s t e m , such as m u l t i p l e e n d - o f - p i p e t r e a t m e n t s y s t e m s )
Insufficient data due to .infrequent sampling (less than once per week while operating) or omission of one or more parameters from testing (BODs, TSS, or flow)
Treatment plant performance below that expected from the treatment technology in operation (i.e., fail to meet the editing criteria of 95/40 for BOD 5 and I00 mg/1 for TSS).
VII-169

Of the plants excluded from the data base, most were excluded for two or more
reasons. Other editing rules for plants retained in the data base included:
Use of the most recent 12 months of all reported daily data when more than 1 year of data was available. This allowed the Agency to use the data from treatment systems with the most recent treatment system improvements.
When historical reported long-term average and Section 308 Supplemen- tal Questionnaire daily data were both available for a plant, the Supplemental daily data were used to calculate the long-term average because they provided a reproducible basis for calculating the averages.
• When daily BOD 5 or TSS values were received or calculated [concentration = C*(mass + flow)] in decimal form, they were rounded to the nearest milligram per liter.
Plots of concentration versus time and other analyses revealed that most
observations clustered around the mean with excursions far above or below the
mean. In the case of influent data, the excursions were believed to be
related to production factors such as processing unit startups and shutdowns,
accidental spills, etc. Effluent excursions, particularly those of several
days duration, were believed I:o be related to seasonal trends, upsets of the
treatment system, and pKoduction factors. Verification of the cause of the
excursions and of the apparent outliers in the data bases was deemed necessary
in order to supplement the analysis of the data with engineering judgment and
plant performance information. Each plant was contacted and asked to respond
to a series of questions regarding their treatment system, its performance,
and the data submitted. The plants were asked about seasonal effects on
treatment system performance and compensatory operational adjustments, winter
and summer NPDES permit limits, operation problems (slug loads, sludge
bulking, plant upsets, etc.), production changes and time of operation, plant
shutdowns, and flow metering locations. Data observations that were two
standard deviations above and below the mean were identified, and the plants
were asked to provide the cause of each excursion. The results of this effort
are described below.
Vll-170

The plant contacts and analysis of the data that were identified as being
more than two standard deviations above and below the mean revealed some of
the strengths and weaknesses of treatment in the industry. Plants within the
OCPSF Industry, regardless of products manufactured at an individual plant,
experience common treatment system problems. Daily data compiled over at
least a year show operational trends and problems, plant upsets, and seasonal
trends that would not be apparent for plants sampled less than daily.
Equalization and diversion basins are commonly used to reduce the effects of
slug loads on the treatment system and to prevent upsets. Influent data
o b t a i n e d b e f o r e e q u a l i z a t i o n or d i v e r s i o n may show h i g h s t r e n g t h w a s t e s , but
t he e f f l u e n t may no t because o f e q u a l i z a t i o n and d i v e r s i o n . S e a s o n a l e f f e c t s
t end to be more p ronounced in s o u t h e r n c l i m a t e s because t r e a t m e n t s y s t e m s
t h e r e g e n e r a l l y may no t be d e s i g n e d f o r c o l d w e a t h e r . O p e r a t i o n a l t e c h n i q u e s
to compensa t e f o r r e d u c e d e f f i c i e n c y a r e s i m i l a r and s h o u l d be p r a c t i c e d
i n d u s t r y - w i d e whenever needed or i f p o s s i b l e w i t h the e x i s t i n g t r e a t m e n t
system.
While common o p e r a t i o n a l p rob lems a p p e a r to be c o n s i s t e n t a c r o s s the
i n d u s t r y , r e s p o n s i v e t r e a t m e n t sy s t em d e s i g n and o p e r a t i o n changes a r e no t
f u l l y documented w i t h i n the d a t a base . For example , some t r e a t m e n t s y s t e m s
i n c o r p o r a t i n g s i m i l a r u n i t o p e r a t i o n s p roduced s u b s t a n t i a l l y d i f f e r e n t
e f f l u e n t q u a l i t y . The r e a s o n s f o r t h i s may i n c l u d e s t r e n g t h and type of raw
w a s t e s , c a p a c i t y o f t he t r e a t m e n t sys t em ( u n d e r - or o v e r l o a d e d ) , knowledge and
s k i l l o f o p e r a t i n g p e r s o n n e l , and d e s i g n f a c t o r s . While the raw was te type
can be c a t e g o r i z e d somewhat by d i v i d i n g t he OCPSF i n d u s t r y i n t o s u b c a t e g o r i e s ,
t he d e g r e e to which the o t h e r f a c t o r s a f f e c t p l a n t p e r f o r m a n c e may no t be
r e a d i l y a p p a r e n t in the d a t a . For example , the d a i l y d a t a may no t show
s e a s o n a l t r e n d s because o f p l a n t d e s i g n or o p e r a t i o n a l a d j u s t m e n t s which
a d e q u a t e l y compensa t e f o r c o l d w e a t h e r .
Sampling and analytical techniques are another potential problem area of
the~data base, particularly for the BOD 5 data. The OCPSF industry manufac-
tures and uses a multitude of toxic substances that can affect a bioassay such
as the BOD s test. Also, certain facilities sometimes collect unrefrigerated
BOD s composite samples which will affect the results of the analysis.
However, since the majority of the effluent data were collected for NPDES
VII-171

permit compliance and approwmd analytical methodologies (such as standard
methods or EPA's test method) and QA/QC procedures are stipulated in each
facility's NPDES permit, it was assumed that the effluent data utilized were
collected and analyzed in an acceptable manner.
Table VII-52 presents a summary of the plants that were excluded from the
BPT daily data base and the reasons for the exclusion. Appendix VII-C
presents a plant-by-plant accounting of all 69 BPT daily data plants and
provides detailed explanations of each plant's inclusion or exclusion.
Based on the BPT daily data base editing, daily data from a total of
21 plants remain to calculate BOD 5 variability factors and 20 plants remain to
calculate TSS variability factors (one plant does not meet the TSS editing
criterion). For these plants, all reported daily data from the most recent
12 months of sampling were included in the calculation of variability factors
because the Agency could not obtain sufficient information through plant
contacts and followup efforts to provide an adequate basis for deleting any
specific daily data points.
Derivation of Subcategory BOD 5 and TSS Long-Term Averages (LTAs)
As presented previously in Section IV, the Agency's final revised
subcategorization approach also included a methodology for calculation of BPT
BOD s and TSS LTAs for each subcategory, which are used together with vari-
ability factors to derive facility subcategorical daily and monthly maximum
limitations. Recall from Section IV that the final subcategorization model is
given by:
7 in(BODi) = a + T wijT j + B.I4 i + D.Ibi + e i .
j=l
To estimate the average in(BODi) corresponding to a set of the independent
variables wij, I4i, and Ibi, the random error term e i is deleted. The
estimates of the coefficients a, Tj, B, and D are used with the values of the
independent variables to obtain the estimate.
VII-172

Table VII-52. Rationale for Exclusion of Daily Data Plants from Data Base
Insufficient Changq Combined Missing Information
>25% Non- infrequent in Treatment Sampling Data Influent or Non- Periods for Technical Did Not process Sampling Summer/ System from Parallel Effluent Data representative Effluent Data of Production Assessment Meet the
Plant Wastewater or <1 Winter NPDES During Period Treatment (BOD, TSS, Treatment After Tertiary Shutdown of Treatment 95/40/100 BPT Number Dilution Year of Data Permit Limits of Record Systems or Flow) System Treatment or Cutbacks System Editing Rule
296 659 ~ 2 866
11~ 1343 1438 1446 14~ O
1609 1617 17~ 2222 2227
• • i<~ P~ k~ ~13
I ~76p.= 2394
(.O 2528 2536 2631 2693 ~16 3O33 i •
g Q •
O
O
913 9O9 942
1~3 15.22 1650
Q •
2110i • • Q •5OO
2315 i
i
2474 i
L 2~1 268O
i
2~0 1349i
1695 17~
i

The LTA BODs f o r s u b c a t e g o r y k i s based on a p l a n t t h a t has 100 p e r c e n t
o f i t s OCPSF p r o d u c t i o n in s u b c a t e g o r y k. T h e r e f o r e , to o b t a i n the LTA BOD s
f o r s u b c a t e g o r y k, s e t
Wij = 1, j=k O, j ~ k .
Also, because the subcategorical LTA BOD s is based on a plant that satisfies
the BOD s 95/40 criterion (set I4i=l) and that has biological only treatment
(set Ibi=l), it follows that the BOD s LTA for subcategory k is given by
BOD s LTA k = exp [a + Tk + ~ + i l l ,
where a, Tk, ~' and i are estimates of the model parameters given in Appendix
IV-A, Exhibit i. The estimates are derived from the data base of 157 full-
response, direct discharge OCPSF facilities that have at least biological
treatment in place, and that provided BOD s effluent and subcategorical produc-
tion data. The parameter estimates are restated below and the subcategorical
LTAs for BOD s are given in Table VII-53.
Parameter Estimate
a+Tl: Thermoplastics 4.27270510 a+T2: Thermosets 5.22885710 a+T3: Rayon 4.32746980 a+T4: Other Fibers 4.03782486 a+T5: Commodity Organics 4.49784137 a+T6: Bulk Organics 4.66262711 a+T7: Specialty Organics 4.92138427
B: Performance Shift -1.94453768 C: Treatment Shift 0.41834828
The subcategory LTAs for TSS are based on the final subcategorization
regression model for TSS, which was presented in Section IV as:
in (TSSi) = a + b [in(BODi)] + e i .
VII-174

The estimates of the regression parameters a and b are derived from the
610CPSF plants that have at least biological treatment in place, meet the
95140 editing criteria for BODs, and have TSS effluent concentrations of at
most 100 mg/l. The estimates of parameters a and b are presented in Appendix
IV-A, Exhibit 2, and they are:
a = 1.84996248
and
= 0.52810227.
Now, t h i s model i s used to p r o v i d e s u b c a t e g o r i c a l TSS LTAs c o r r e s p o n d i n g to
the s u b c a t e g o r i c a l BOD 5 LTAs. Again, e i i s s e t to ze ro in the model , and
TSS LTA k = exp (a + b [In(BOD 5 LTAk) ]
for k=l, 2, ..., 7. The calculated TSS LTA values are given in Table VII-54.
These s u b c a t e g o r i c a l B0D 5 and TSS LTAs a l l o w the d e t e r m i n a t i o n o f
p l a n t - s p e c i f i c B0D 5 and TSS LTAs, even f o r a p l a n t t h a t has p r o d u c t i o n in more
than one s u b c a t e g o r y . These p l a n t - s p e c i f i c LTAs a r e then used w i th v a r i a b i l i t y
f a c t o r s to d e r i v e the e f f l u e n t l i m i t a t i o n s g u i d e l i n e s p r e s e n t e d in S e c t i o n IX.
In particular, for a~specific plant, let wj be the proportion of that
plant's production in subcategory j. The plant-specific LTAs are given by:
7 Plant BOD 5 LTA = r wj(BOD 5 LTAj)
j=l
and
7 Plant TSS LTA = Z wj(TSS LTAj),
j--1
where BOD s LTAj and TSS LTAj are the BOD 5 and TSS long-term averages presented
in Tables VII-53 and VII-54, respectively. This approach is analogous to the
building-block approach typically used by permit writers.
VII-175

TABLE VII-53. BPT SUBCATEGORY LONG-TERM AVERAGES (LTAs) FOR BOD s
Subcategory BOD s LTA (mg/l)
Thermoplastics 16
Thermosets 41
Rayon 16
Other Fibers 12
Commodity Organics 20
Bulk Organics 23
Specialty Organics 30
TABLE VII-54. BPT SUBCATEGORY LONG-TERM AVERAGES (LTAs) FOR TSS
Subcategory TSS LTA (mg/l)
Thermoplastics 27
Thermosets 45
Rayon 27
Other Fibers 24
Commodity Organics 31
Bulk Organics 33
Specialty Organics 38
VII-176

Calculation of BPT Variability Factors
After establishing a final BPT daily data base, data from 21 plants for
HOD 5 and 20 plants for TSS were retained to calculate variability factors
using the statistical methodology shown in Appendix VII-D. These statistical
methods assume a lognormal distribution~ hypothesis tests investigating this
assumption are discussed in Appendix VII-E. The Agency has been using the
95th percentile average "Maximum for Monthly Average" and the 99th percentile
average "Maximum for Any One Day" variability factors for HOD s and TSS,
regardless of the subcategory mix of each plant. However, many industry
commenters argued that effluent variability was subcategory-specific and
should be taken Into account In variability factor calculations. In response
to these comments, the Agency performed an alternative variability factor
analysis which calculated production proportion-weighted variability f a c t o r s
by category (plastics or organics) and subcategory for the 21 daily data
plants for BOD s and the 20 plants for TSS. Table VII-55 presents the results
of this analysis which compares overall average variability factors with the
subcategory production proportion-weighted variability factors. This
comparison shows that subcategory-specific variability factors are not
substantially different from the overall average variability factors. This
would be expected since subcategory differences would be reflected more in the
long-term average values, while variability factors are dependent.on treatment
system performance which is fairly consistent given that all plants use
biological treatment and perform well (i.e., after the 95/40/100 editing
rule). Based on the results of this alternative subcategory weighted
variability factor analysis, the Agency has decided to retain its approach of
calculating overall average variability factors and applying them to all OCPSF
f a c i l i t i e s .
Individual plant variability factors are listed in Tables VII-56 and
VII-57 for HOD 5 and TSS, respectively. As shown in the tables, the average
HOD s Maximum for Monthly Average and Maximum for Any One Day variability
factors are 1.47 and 3.97, respectively. The average TSS Maximum for Monthly
Average and Maximum for Any One Day variability factors are 1.48 and 4.79,
respectively.
VII-177

TABLE Vli-55. OVERALL AVERAGE VERSUS PRODUCTION-
PROPORTION-WEIGHTED VARIABILITY FACTORS
Subcategory Daily BOD s VF
Daily TSS VF
Monthly BOD 5 VF
Monthly TSS VF
BOD. Sum of Production
Weights
TSS Sum of Production
Weights
Thermoplastics Thermosets Rayon Other Fibers Commodity Organics Bulk Organics Specialty Organics
3.823 3.891 4.143 3.899 3.935 4.331 3.890
5.017 4.145 4.373 3.680 4.750 4.599 5.827
1.422 1.578 1.536 1.473 1.421 1.531 1.496
1.486 1.447 1.426 1.371 1.492 1.453 1.601
6.172 0.504 1.000 3.025 3.269 3.741 3.290
6.172 0.504 1.000 3.025 3.269 2.741 3.290
Plastics Organics
3.878 4.064
4.538 5.086
1.455 1.485
1.446 1.519
10.701 10.299
10.701 9.299
Overall 3.969 4.793 1.469 1.480 21 20 <
l
~O

TABLE VII-56. BOD. VARIABILITY FACTORS FOR BIOLOGICAL ONLY SYSTEMS
(EFFL~INT BOD S ~ 40 MG/L OR BOD S PERCENT REMOVAL ~ 95%)
Plant Number
BOD s Percent Removal
BOD_ Mean E~fluent
Concentration (mg/l)
BOD_ Median E~fluent
Concentration (mg/l)
Number of Observations
Daily Variability
Factor
Monthly Variability
Factor
387 14 12 160 4.14 1.54
444 w 16 12 154 3 • 90 1.44
525 95 8 6 203 3.51 1.49
682 99 9 7 207 3.34 1.43
741 96 98 77 156 4.50 1.65
I
-4 %0
908
970
98
9 7
53
13
26
13
96
155
6.55
3.11
1.73
1.23
1012 77 20 14 357 4.35 1.62
1062 99 9 8 261 3.29 1.31
1149 32 30 160 2.89 1.22
1267 24 22 84 3.04 1.33
1407 97 13 12 48 3.76 1.41
1647 98 21 13 359 4.30 1.61

TABLE VII-56. BOD_ VARIABILITY FACTORS FOR BIOLOGICAL ONLY SYSTEMS
(EFFL~/qT BOD < 40 MG/L OR BOD PERCENT REMOVAL > 95%) s - (Continue s)d
Plant Number
BOD 5 Percent Removal
BOD_ Mean Effluent
Concentration (mg/L)
BOD. Median Effluent
Concentration (mg/l)
Number of Observations
Daily Variability
Factor
1973 93 6 ';5 157 2.97
1977 99 13 ii 153 3.12
2181 99 4 2 124 6.12
2430 98 6 5 366 3.04
I
~o o
2445
2592
96
98
24
23
16
16
347
154
4.43
4.25
2626 12 I0 363 4.25
2695 19 16 143 4.48
Average BOD 5 Variability Factors: 3.97
Monthly Variability
Factor
1.48
1.29
1.68
1.28
1.72
1.57
1.34
1.50
1.47

TABLE VII-57. TSS VARIABILITY FACTORS FOR BIOLOGICAL ONLY SYSTEMS
(EFFLUENT BOD s ~ 40 HG/L OR BOD 5 PERCENT REMOVAL ~ 95% AND TSS i00 HG/L)
Plant Number
387
444
525
682
908 )-4 I
970 CO
1012
1062
1149
1267
1407
1647
1973
TSS Percent Removal
-
-
-
45
87
-
-
99.6
-
-
(-2)
84
76
TSS Mean Effluent
Concentration (mg/l)
20
26
30
28
43
30
8
14
60
24
18
86
i0
TSS Median Effluent
Concentration (mg/l)
17
20
25
24
31
26
7
6
56
20
13
28
8
Daily Number of Variability
Observations Factor
158 4.37
159 4.98
155 4.97
361 3.95
99 4.75
362 2.79
366 3.35
260 6.95 •
363 2.67
130 2.70
48 5.66
366 7.43
347 5.15
Monthly Variability
Factor
1.43
1.49
1.48
1.38
1.46
1.40
1.31
1.63
1.21
1.25
1.55
1.84
1.40

TABLE VII-57. TSS VARIABILITY FACTORS FOR BIOLOGICAL ONLY SYSTEMS
(EFFLUENT BOD s ~ 40 MG/L OR BOD 5 PERCENT REMOVAL ~ 95% AND TSS ~ I00 MG/L) (Continued)
Plant Number
TSS Percent Removal
TSS Mean Effluent
Concentration (mg/1)
TSS Median Effluent
Concentration (mg/1)
Number of Observations
Daily Variability
Factor
Monthly Variability
Factor
1977 26 9 154 8.48 2.04
2181 92 24 15 366 5.07 1.56
2430 92 7 6 366 4.80 1.46
b-d b-d
i b-J
2445
2592
2626
29
82
99
66
52
18
49
36
16
365
135
366
4.08
4.89
3.93
1.49
1.41
1.35
2695 97 14 I0 146 4.87 1.47
Average TSS Variability Factors: 4.79 1.48

2. BAT E f f l u e n t L imi t a t i ons
As d i scussed in Sec t ion VI, the Agency has dec ided to c o n t r o l 63 tox ic
p o l l u t a n t s under BAT Subcategory One (End-of-Pipe B i o l o g i c a l P l a n t s ) and 59
tox ic p o l l u t a n t s under BAT Subcategory Two (non-End-0f-Pipe B i o l o g i c a l
P l a n t s ) . This s e c t i o n d i s cus se s the da ta e d i t i n g r u l e s and methodology used
to d e r i v e the tox ic p o l l u t a n t long- te rm averages and v a r i a b i l i t y f a c t o r s tha t
provide the bas i s of the f i n a l BAT e f f l u e n t l i m i t a t i o n s g u i d e l i n e s for both
s u b c a t e g o r i e s .
a. BAT Data Editin~ Rules
The BAT toxic pollutant data base has basically two sources of data:
i) data collected during EPA sampling studies, and 2) data submitted by
industry either in response to Section 308 Questionnaire requests or as a
result of submissions during the public comment periods for ~ the March 21,
1983, Proposal, the July 17, 1985, Federal Register Notice of Availability, or
the December 8, 1986, Federal Re~ister Notice of Availability. Table VII-58
presents a summary of the BAT toxic pollutant data sources as organized into
four sets for review and editing purposes.
In g e n e r a l , the Agency's BAT tox ic p o l l u t a n t d a t a base e d i t i n g c r i t e r i a
were as fo l lows :
Analytical methodology had to be EPA-approved (or equivalent) and have adequate supporting QA/QC documentation.
It was not necessary to have influent-effluent data pairs for the same day, because many treatment systems have a wastewater retention time of more than 24 hours.
Since most of the effluent data have values of ND, the average influent concentration for a compound had to be at least i0 times the analytical minimum level (ML) for the difference to be meaningful and qualify effluent concentrations for calculation of effluent limits. For in-plant control effluent data for steam stripping and activated carbon, the average influent concentration for a compound had to be at least 1.0 ppm.
Exclude data for effluent that has been diluted more than 25 percent after treatment, but before final discharge. NPDES monitoring data often reflects such dilution, which may be discerned by reference to the wastewater flow diagram in a plant's response to the 1983 Section 308 Questionnaire. Appendix VII-G characterizes the problems associated with dilution of NPDES application Form 2C data.
VII-IS3

TABLE VII-58. PRIORITY POLLUTANT (PRIPOL) DATA SOURCES FOR THE FINAL OCPSF RULE
EPA Sampling Programs
I.I 37 Plant Verification Study, 1978-80 Data Set 1 1.2 Five Plant Study, 1980-81 (EPA/CMA Study)
2.0 Twelve Plant Study, 1983-84 Data Set 2
OCPSF Proposal, 48 FR 11828 (March 21, 1983) Data Set 3
3.1 Data attached to 28 public comments
1983 Supplemental "308" Questionnaire* (sent to selected plants only)
3.2 Data submitted by 74 selected plants
NOA (Proposal Revision i), 50 FR 29068 (July 17, 1985) Data Set 4
4.1 Data attached to comments, or requested by EPA as an extension of the attached data**
4.2 Requested from commenters, because the comment implied that supporting data were available**
NOA (Proposal Revision 2), 51FR 44082 (Dec. 8, 1986)
4.3 Data attached to comments from 5 commenters
"1983 308 Questionnaire - Priority pollutant data submitted in response to questions C13-C16 of the general questionnaire were average concentration values instead of daily concentration values. This precluded the use of the data for statistical calculation of effluent limitations.
**Data from a total of 21 plants were reviewed for data sets 4.1 and 4.2.
VII-184

• Cyanide should be considered as having an analytfcal minimum level of 0.02 mg/1, and subject to the four criteria listed above.
For data submitted by industry, exclude total phenols data, which become meaningless with the specific measurement of phenol (priority pollutant 65). The total phenol parameter represents a colorometric response to the 4-Aminoantipyrine (4-AAP) reagent, which is non- specific and characteristic of a host of both phenolic and non- phenolic organic chemicals.
Data not representative of BAT technology performance were eliminated from the data base. Examples of reasons for not being representative of BAT technology performance include process spills; treatment system upsets; equipment malfunctions; performance not up to design specifi- cations; past historical performance; or performance exhibited by other plants in the data base with BAT technology in place.
Exclude data for pollutants that could not be validated as present based on the product/processes and the related process chemistry associated with each product/process. Examples include phthalate esters found because of sample contamination by the automatic sampler tubing and methylene chloride found because of sample contamination in the laboratory (methylene chloride is a common extraction solvent used in GC/MS methods).
• Data for pollutants that do not satisfy the I0 times ML editing criteria at the influent to the end-of-pipe treatment sampling site, because their original raw waste concentrations had been reduced previously by an in-plant control technology, were retained when sufficient information (i.e., verification, 12-Plant Sampling Reports, or Section 308 Questionnaire) was available to validate the in-plant control's presence.
In addition to the detailed editing criteria presented above, more
general editing criteria involved:
Deletion of presampling grab samples collected prior to the EPA 12 Plant Sampling Study
Choosing the appropriate sampling sites for the treatment system of interest( e.g., influent to and effluent from steam stripper for BAT Subcategory Two data base)
Deletion of not quantifiable (NQ) values discussed above
Averaging of replicate and duplicate samples or analyses at a sampling site by day and, if appropriate, then across multiple laboratories. All data points in decimal form as a result of replicate and duplicate averaging were rounded to the nearest whole number (in ppb)
VII-185

Deletion of zero dischargers and plants without appropriate BAT or PSES treatment systems (e.g., indirect dischargers without appropriate in-plant controls such as steam stripping, and direct dischargers without end-of-pipe biological treatment or in-plant controls). ]Plants 1904V; 2680V/2680T from the BAT Subcategory One data base; 722V, I194V9 2474V, 2327V, 2666V]
Deletion of plants with more than the recommended BAT treatment technology. ]Plant 2680V from the BAT Subcategory Two data base]
Deletion of plants without a combined raw waste sampling point, or if only product/process sampling data were collected at a plant. ]Plants 430V, 1563V]
Deletion of organic toxic pollutant data from six plants for which blind spike GC/CD analytical methods were utilized. ]Plants 1869V, 250V, 387V, 2666V, 1569V, 1904V]
Deletion of plant/pollutant combinations for which no effluent data exist [1785V]
Deletion of plant/po]Llutant combinations when all influent values were not detected (ND) (except for the overrides discussed above for pollutants that do not satisfy the lO times ML editing criteria)
All values reported by the analytical laboratory at less than the analytical minimum level were set equal to the analytical minimum level
Deletion of combined pollutant analytical results (e.g., anthracene and phenanthrene reported as a combined total concentration)
Use of only laboratory-composited volatile grab samples as required by the analytical protocols instead of individual grab or automatic composite sample analyses
Deletion of plant/pollutant combinations based on BAT Option III technology (i.e., in-plant controls, end-of-pipe biological treatment, and end-of-pipe activated carbon). ]Plant 1494V, benzene]
Deletion of plants which will be regulated under another point source category. [Plant I099V under the Petroleum Refining Point Source Category].
In addition to the editing criteria mentioned above, the Agency also
established another set of editing criteria in reviewing priority pollutant
metals data:
Excluded data on priority pollutant metals from non-process sources, such as non-contact cooling water blowdown and ancillary sources. An example of an ancillary source is caustic, which commonly assays for low levels of Cr(ll�), Cu(120), Ni(124), and sometimes Hg(123).
VII-186

Excluded end-of-pipe (NPDES) data, as well as data from other sampling points, that do not represent the direct effluent from technology that is specifically for the control of metals. In general, NPDES monitor- ing data do not directly reflect the reduction of priority pollutant metal concentrations by such technology. Rather, the data reflect dilution (by process wastewater and non-contact cooling water) and/or absorption into biomass (if biological treatment of the process waste- water is employed). Both dilution and biomass absorption of priority pollutant metals are plant-specific factors that vary widely through- out OCPSF wastewater collection and treatment systems.
Exclude complexed priority pollutant metal data, unless it is the direct effluent from technology that is specifically for the control of complexed priority pollutant metals. This edit is generally appli- cable to priority pollutant metals (e.g., chromium+3 and copper+2) that have been very strongly complexed with organic dyes or chelating compounds, so that the metal remains in solution and is unresponsive to precipitation with usual reagents (lime or caustic).
Exclude data that represent the direct effluent from technology specifically for the control of metals, if there is no corresponding influent data with which to evaluate the effectiveness of the technology.
The Agency's editing procedure differed somewhat for each data source.
The data from the EPA sampling programs were edited Using a combination of
computer analysis and manual analysis by Agency personnel. This was done
because all sampling data had previously been encoded. Data submitted by
industry were first reviewed to determine if the data submitted warranted
encoding for further study, lending itself to manual editing rather than
computer analysis. However, all manual editing that could be validated by
computer analysis (e.g., the i0 x ML/I.O ppm edit) was performed. Based On
this analysis, data from industry sources for a total of 17 plants were
retained for use in calculation of final BAT effluent limitations. Table
VI}-59 presents a summary of the data retained for each plant and how it was
utilized.
Table VII-60 presents a detailed explanation of the data excluded from
the limitations analysis based on the BAT performance editing criterion.
Based on this analysis, data from a total of 36 plants (plus six plant'
overlaps due to resampling) for Subcategory One and i0 plants for Subcategory
Two (with nine plant overlaps with Subcategory One) from Agency studies and
public comments were retained for the limitations analysis and are presented
in Table VII-61 for BAT Subcategory One and Table VII-62 for BAT Subcategory
Two.
Vli-187

Plant ID
63
387
500
682
1012
1650
1753
2227
1617
2445
2693
267
399
415
913
1769
1774
TABLE VII-59. DATA RETAINED FROM DATA SETS 3 AND 4 FOLLOWING
BAT TOXIC POLLUTANT EDITING CRITERIA
Data Pollutants Set
Zinc 3
Zinc 3
Nitrobenzene 3
Toluene 3
Zinc 3
Benzene, Naphthalene, Phenanthrene, 3 Toluene
Ethylbenzene 3
1,2-4-Trichlorobenzene, 1,2-Dichloroben- 3 zene, Nitrobenzene
Toluene 3
Methylene Chloride, Phenol 3
Chloroform, Methylene Chloride 3
Methylene Chloride 4
Zinc 4
Benzene, Toluene 4
1,2-Dichloroethane, l,l,l-Trichloroethane, 4 l,l,2-Trichlorethane, Chloroethane, Chloro- form, l,l-Dichloroethane, 1,2-Trans-Dichloroethylene, 1,l-Dichloroethylene, Methylene Chloride, Tetrachloroethylene, Trichioroethylene, Vinyl Chloride
Chlorobenzene,, Chloroethane, 1,2-Dichlorobenzene, 2,4-Dinitrotoluene, 2,6-Dinitrotoluene, Nitrobenzene, Phenol
Zinc 4
BAT Subcategory Data Base
One and Two
One and Two
Two Only
One Only
One and Two
One Only
One Only
One Only
One Only
One Only
One Only
One Only
One and Two
Two Only
Two Only
One Only
One and Two
VII-188

TABLE Vll-60. EXPLANATION OF BAT TOXIC POLLUTANT DATA
BASE PERFORMANCE EDITS
Plant ID Pollutant Name
267F 2,4,6-Trichlorophenol
525V Chlorobenzene
I
kO 1494T Benzene (only Subcategory I data),
Chlorobenzene, 1,2-Dichlorobenzene, 2,4-Dinitrotoluene, 2,6-Dinitrotoluene, Methylene Chloride, Nitrobenzene, 2-Nitrophenol, Phenol, Toluene
415T Bis(2-chloroisopropyl)Ether
Explanation
This pollutant should be treated in-plant with activated carbon prior to discharge to the end-of-pipe biological system. This plant pretreats its phenolic wastewaters with a trickling filter that is adequate for phenol but not for 2,4,6-trichlorophenol.
This pollutant should be (but was not) treated in-plant with steam stripping prior to discharge to the end-of-pipe biological system; also, compared to data from plants retained in the data base treating chlorobenzene with only biological treatment and having similar raw waste concentrations, this plant's treatment system performance for this pollutant was considered inadequate.
This plant experienced a polyols spill during the sampling period which saturated the end-of-pipe activated carbon columns. These columns are used as an integral segment of the treatment system rather than a polishing step. Therefore, because the listed pollutants were basically passing through the activated carbon system untreated, this plant's treatment system performance was considered inadequate.
This p o l l u t a n t should be t r e a t e d i n - p l a n t with steam s t r i p p i n g p r i o r to d i scha rge to the e n d - o f - p i p e b i o l o g i c a l system; a l so , compared to data from p l a n t s r e t a i n e d in the da ta base t r e a t i n g b i s ( 2 - c h l o r o i s o p r o p y l ) e t h e r with only b i o l o g i c a l t r ea tmen t and having s i m i l a r raw waste c o n c e n t r a t i o n s , t h i s p l a n t ' s t rea tment system performance for t h i s p o l l u t a n t was cons ide red inadequate .

TABLE VII-60. EXPLANATION OF BAT TOXIC POLLUTANT DATA
BASE PERFORMANCE EDITS (Continued)
Plant ID Pollutant Name Explanation
2313T Benzene, Chlorobenzene, 1 ,2 -Dich loro- This p lan t experienced a malfunct ion of i t s i n - p l a n t ethane~ 2 ,4 ,6 -Tr i ch lo ropheno l , Chloroform, chemical ox ida t ion uni t dur ing the sampling period which 3 ,3 ' -D ich lo robenz id ine , Toluene caused high concen t ra t ions of 3 , 3 ' - d i c h l o r o b e n z i d i n e to be
d ischarged to the end-of-p ipe b i o l o g i c a l system; t h i s may have caused an upset of b i o l o g i c a l a c t i v i t y which was evidenced by the low removals of the listed pollutants through biological treatment, or compared to other biological treatment systems treating similar raw waste concentrations. Also, certain pollutants (2,4,6-trichlorophenol, 3,3'-dichlorobenzidine) must be treated in-plant prior to discharge to an end-of-pipe biological
H I system to obtain adequate treatment. Therefore, the Agency
considers this plant's treatment system performance for the listed O pollutants to be inadequate.
725T Methylene Chlor ide , Methyl Chlor ide and Data for these pollutants from this plant were deleted because Vinyl Chlor ide (Subcategory Two Steam steam stripper performance for these 2 days was considered St r ippe r Data for 5/29/83, 6/02/83) inadequate; the maximum design effluent concentration for this
steam stripper should be i0 mg/l for vinyl chloride which is based on a NIOSH air regulation. This maximum was exceeded on both these days; therefore, the Agency considers this plant's steam stripper performance for the listed pollutants to be inadequate for these 2 days.
Note: Plants with V-suffix are verification study plants, plants with F-suffix are EPA/CMA 5-Plant Study plants, and plants with T-suffix are EPA 12-Plant Study plants.

TABLE VII-61. PLANT AND POLLUTANT DATA RETAINED IN BAT ORGANIC TOXIC POLLUTANT
DATA BASE FOR BAT SUBCATEGORY ONE LIMITATIONS
Plant ID Data Set Pollutant # Pollutant Name
2394
2536
725
3033
384
415
7 25 27 38 57 58 59 65 86
Chlorobenzene 1,2-Dichlorobenzene 1,4-Dichlorobenzene Ethylbenzene 2-Nitrophenol 4-Nitrophenol 2,4-Dinitrophenol Phenol Toluene
3 38 65
Acrylonitrile Ethylbenzene Phenol
6 9 12 23 44 45 52 85 88
Carbon Tetrachloride Hexachlorobenzene Hexachloroethane Chloroform Methylene Chloride Chloromethane Hexachlorobutadiene Tetrachloroethylene Vinyl Chloride
I0 32 34 55 65 85
1,2-Dichloroethane 1,2-Dichloropropane 2,4-Dimethylphenol Naphthalene Phenol Tetrachloroethylene
1 4 38 55 65 76 86
Benzene Ethylbenzene Naphthalene Phenol Chrysene Toluene
1 I0 14 16 23 29 30 32 44 87
1,2-Dichloroethane l,l,2-Trichloroethane Chloroethane Chloroform 1,1,-Dichloroethylene 1,2-Trans-dichloroethylene 1,2-Dichloropropane Methylene Chloride Trichloroethylene
VII-191

TABLE VII-61. PLANT AND POLLUTANT DATA RETAINED IN BAT ORGANIC TOXIC POLLUTANT
DATA BASE FOR BAT SUBCATEGORY ONE LIMITATIONS (Continued)
Plant ID Data Set Pollutant # Pollutant Name
1293
2313
2631
2481
1 Acenaphthene 4 Benzene
34 2,4-Dimethylphenol 39 Fluoranthene 55 Naphthalene 65 Phenol 72 Benzo(a)Anthracene 73 Benzo(a)Pyrene 74 3,4-Benzofluoranthene 75 Benzo(k)Fluoranthene 76 Chrysene 77 Acenaphthylene 78 Anthracene 80 Fluorene 81 Phenanthrene 84 Pyrene 86 Toluene
8 1,2,4-Trichlorobenzene 24 2-Chlorophenol 25 1,2-Dichlorobenzene 26 1,3-Dichlorobenzene 31 2,4-Dichlorophenol 58 4-Nitrophenol 81 Phenanthrene
4 Benzene 1.0 1,2-Dichloroethane ].4 l,l,2-Trichloroethane 16 Chloroethane 23 Chloroform 29 l,l-Dichloroethylene 30 1,2-Trans-dichloroethylene 32 1,2-Dichloropropane 33 1,3-Dichloropropene 38 Ethylbenzene 44 Methylene Chloride 86 Toluene 87 Trichloroethylene
4 Benzene 56 Nitrobenzene 59 2,4-Dinitrophenol
VII-192

TABLE Vll-61. PLANT AND POLLUTANT DATA RETAINED IN BAT ORGANIC TOXIC POLLUTANT
DATA BASE FOR BAT SUBCATEGORY ONE LIMITATIONS
Plant ID
948
267
12
2221
2711
725
444
Data Set
3 4 I0 29 38 65 66 68 70 71 86
8 25 31 65
1 4 34 38 55 65 86
38 65 86
. 65 86
6 I0 12 23 30 52 85 88
4 86
(Continued)
Pollutant # Pollutant Name
Acrylonitrile Benzene 1,2-Dichloroethane l,l-Dichloroethylene Ethylbenzene Phenol Bis-(2-Ethylhexyl)Phthalate Di-N-Butyl Phthalate Diethyl Phthalate Dimethyl Phthalate Toluene
1,2-4-Trichlorobenzene 1,2-Dichlorobenzene 2,4-Dichlorophenol Phenol
Acenaphthene Benzene 2,4-Dimethylphenol Ethylbenzene Naphthalene Phenol Toluene
Ethylbenzene Phenol Toluene
Phenol Toluene
Carbon T e t r a c h l o r i d e 1 ,2-Dich loroe thane Hexachloroethane Chloroform 1 , 2 - T r a n s - d i c h l o r o e t h y l e n e Hexachchlorobutadiene Te t r ach lo roe thy l ene Vinyl Chloride
Benzene Toluene
VII-193

TABLE VII-61. PLANT AND POLLUTANT DATA RETAINED IN BAT ORGANIC TOXIC POLLUTANT
DATA BASE FOR BAT SUBCATEGORY ONE LIMITATIONS (Continued)
Plant ID Data Set Pollutant # Pollutant Name
695 3 4 Benzene 6 Carbon Tetrachloride
I0 1,2-Dichloroethane 23 Choloroform 24 2-Chlorophenol 25 1,2-Dichlorobenzene 29 l,l-Dichloroethylene 32 1,2-Dichloropropane 38 Ethylbenzene 42 Bis-(2-Chloroisopropyl) Ether 44 Methylene Chloride 55 Naphthalene 65 Phenol 86 Toluene
1650 3 4 Benzene 38 Ethylbenzene 55 Naphthalene 65 Phenol 77 Acenaphthylene 80 Fluorene 81 Phenanthrene 86 Toluene
948 3 3 Acrylonitrile 65 Phenol 66 Bis-(2-Ethylhexyl) Phthalate 68 Di-N-Butyl Phthalate 70 Diethyl Phthalate 71 Dimethyl Phthalate
2430 3 4 Benzene 55 Naphthalene 65 Phenol 86 Toluene
1349 3 3 Acrylonitrile 88 Vinyl Chloride
VII-194

TABLE VII-61. • ,
PLANT AND POLLUTANT DATA RETAINED IN BAT ORGANIC TOXIC POLLUTANT DATA BASE FOR BAT SUBCATEGORY ONE LIMITATIONS
( C o n t i n u e d )
Plant ID Data S e t Pollutant # Pollutant Name
1494 3 25 1,2-Dichlorobenzene 35 2,4-Dinitrotoluene 36 2,6-Dinitrotoluene 44 Methylene Chloride 56 Nitrobenzene 57 2-Nitrophenol 58 4-Nitrophenol 59 2,4-Dinitrophenol 65 Phenol 86 Toluene
883 3 3 Acrylonitrile 38 Ethylbenzene
659 3 38 Ethylbenzene
1609 3 4 Benzene 23 Chloroform 24 2-Chlorophenol
- 31 2,4-Dichlorophenol 65 Phenol 86 Toluene 87 Trichloroethylene
851 3 4 Benzene 38 Ethylbenzene 39 Fluoranthene 55 Naphthalene 78 Anthracene 80 Fluorene 81 Phenanthrene 84 Pyrene 86 Toluene
1890 3 86 Toluene
1890" 3 65 Phenol 86 Toluene
VII-195

TABLE VII-61. PLANT AND POLLUTANT DATA RETAINED IN BAT ORGANIC TOXIC POLLUTANT
DATA BASE FOR BAT SUBCATEGORY ONE LIMITATIONS (Continued)
Plant ID Data Set Pollutant # Pollutant Name
2631 3 4 Benzene l0 1,2-Dichloroethane ii 1,1,l-Trichloroethane 14 l,l,2-Trichloroethane 16 Chloroethane 23 Chloroform 29 l,l-Dichloroethylene 32 1,2-Dichloropropane 33 1,3-Dichloropropene 38 Ethylbenzene 55 Naphthalene 65 Phenol 86 Toluene
4051 3 4 Benzene I0 1,2-Dichloroethane 32 1,2-Dichloropropane 33 1,3-Dichloropropene 86 Toluene 87 Trichloroethylene
296 3 4 Benzene i0 1,2-Dichloroethane II l,l,l-Trichloroethane 65 Phenol 86 Toluene
306 3 1 Acenaphthene 4 Benzene
34 2,4-Dimethylphenol 39 Fluoranthene 65 Phenol 72 Benzo(a)Anthracene 76 Chrysene 77 Acenaphthylene 78 Anthracene 81 Phenanthrene 84 Pyrene 86 Toluene
267 4 44 Methylene Chloride
682 4 86 Toluene
VII-196

TABLE Vll-61. PLANT AND POLLUTANT DATA RETAINED IN BAT ORGANIC TOXIC POLLUTANT
DATA BASE FOR BAT SUBCATEGORY ONE LIMITATIONS (Con t inued)
Plant ID Data Set Pollutant # P o l l u t a n t Name
1617 86 Toluene
1650 4 Benzene 55 Naphthalene 81 Phenanthrene 86 Toluene
1753 38 Ethylbenzene
1769 7 Chlorobenzene 16 Chloroethane 25 1,2-Dichlorobenzene 35 2,4-Dinltrotoluene 36 2,6-Dinitrotoluene 56 Nitrobenzene 65 Phenol
2227 4 8 1,2-4-Trichlorobenzene 25 1,2-Dichlorobenzene 56 Nitrobenzene
2445 4 44 Methylene Chloride 65 Phenol
2693 4 23 Chloroform 44 Methylene Cloride
Note: * d e n o t e s a p l a n t which had two d i f f e r e n t t r e a t m e n t sys tems in the d a t a base Data Set 1 d e n o t e s 12 -P l an t S tudy. Data Set 2 d e n o t e s 5 - P l a n t S tudy. Data Set 3 d e n o t e s V e r i f i c a t i o n Study. Data Set 4 d e n o t e s p u b l i c comments and s u p p l e m e n t a l q u e s t i o n n a i r e d a t a .
VII-197

TABLE VII-62. PLANT AND POLLUTANT DATA RETAINED IN BAT ORGANIC TOXIC POLLUTANT
DATA BASE FOR BAT SUBCATEGORY TWO LIMITATIONS
Plant ID Data Set Pollutant # Pollutant Name
725 44 Methylene Chloride 45 Chloromethane 88 Vinyl Chloride
1494 Benzene
415 10 1,2-Dichloroetheane 1.4 1,12-Trichloroethane 1.6 Chloroethane 2.3 Chloroform 29 l,l-Dichloroethylene 3,0 1,2-Trans-Dichloroethylene 44 Methylene Chloride 87 Trichloroethylene
2680 4 Benzene
415 4 Benzene 86 Toluene
913 I0 1,2-Dichloroethane ii l,l,l-Trichloroethane 13 l,l-Dichloroethane 14 l,l,2-Trichloroethane 16 Chloroethane 23 Chloroform 29 1,l-Dichloroethylene 30 1,2-Trans-Dichloroethylene 44 Methylene Chloride 85 Tetrachloroethylene 87 Trichloroethylene 88 Vinyl Chloride
2680 56 Nitrobenzene 57 2-Nitrophenol 58 4-Nitrophenol 5!} 2,4-Dinitrophenol 60 4,6-Dinitro-o-Cresol
500 56 N i t r o b e n z e n e
948 66 Bis-(2-Ethylhexyl) Phthalate 68 Di-n-Butyl Phthalate 70 Diethyl Phthalate 71[ Dimethyl Phthalate
VII-199

TABLE VII-62. PLANT AND POLLUTANT DATA RETAINED IN BAT ORGANIC TOXIC POLLUTANT
DATA BASE FOR BAT SUBCATEGORY TWO LIMITATIONS (Continued)
Plant ID Data Set Pollutant # Pollutant Name
2536 1 3 Acrylonitrile
1293 1 1 Acenaphthene 34 2,4-Dimethylphenol 39 Fluoranthene 55 Naphthalene 65 Phenol 72 Benzo(a)Anthracene 73 Benzo(a)Pyrene 74 3,4-Benzofluoranthene 75 Benzo(k)Fluoranthene 76 Chrysene 77 Acenaphthylene 78 Anthracene 80 Fluorene 81 Phenanthrene 84 Pyrene
N o t e : Data Set 1 denotes 12-Plant Study. Data Set 2 denotes 5-Plant Study. Data Set 3 denotes public comments and supplemental questionnaire data.
VII-200

One industry commenter questioned the validity of treating pollutant data
from one plant in two different sampling projects independently. It should be
noted that the six plant overlaps occur because these plants were either
sampled in separate Agency studies or the Agency received data submitted by
commenters in addition to its sampling studies. EPA has treated these over-
lapping plant data sets separately for limitations calculations purposes
because of general changes in a plant's production levels and product mix, and
changes in a plant's treatment system or treatment system operation in the
time period between sampling studies. Using the plant data in this manner did
not significantly affect most of the pollutants being regulated.
EPA reviewed its files on these six plants relating to circumstances at
the plants during the sampling episodes. Plant 725 upgraded a steam bath to a
steam stripper by adding trays between sampling episodes. Plant 2631 had two
processes in operation during the first sampling event and three on the
second. EPA, accordingly, maintains that the 4 data sets associated with
these 2 plants be treated separately because of the referent known changes.
For the remaining four plants, EPA combined the corresponding eight data
subsets into four to yield a single data set for each of the four plants. EPA
then recomputed all of th~ end-of-pipe BAT toxic limitations to perform a
comparative analysis of these results to those for the EPA methodology for
calculating daily maximum limitations for all of the 55 organic pollutants
derived by this analysis.
The findings were that ii of the 55 daily limitations changed value, but
for seven of the Ii changes the shifts were only 5 percent or less. For the
four limitations that showed larger changes, two increased and two decreased.
EPA maintains that the general rationale for treating these six plants as
12 separate entities is appropriate and that there is no bias introduced by
this approach.
VII-200

b. Derivation of BAT Toxic Pollutant LTAs
Table VII-63 presents a summary of the plants retained in the BAT toxic
pollutant data base for BAT Subcategory One and Two, and the in-plant and
end-of-pipe technologies In-place at each plant based on the 1983 Section 308
Questionnaire for industry-supplied data and on field sampling reports for EPA
data. The table shows that the technology basis for the data to be used for
BAT Subcategory One is mainly end-of-pipe biological treatment (in the form of
activated sludge) preceded in many cases by some form of in-plant control.
These In-plant controls are sometimes in the form of highly efficient tech-
nologies such as activated carbon or steam stripping, or are a more gross form
of control used more for product recovery (e.g., distillation), but nonethe-
less contributing to a reduction or equalization of raw waste concentrations
discharged to the end-of-pipe biological treatment system. The technology
basis for the BAT Subcategory Two toxic pollutant data base is based on
performance data from in-plant controls such as steam stripping, activated
carbon, and in-plant biological treatment.
For each pollutant at each plant from each of the four data sets, an
estimated long-term average (LTA) effluent concentration was calculated. The
nondetected values at a plant were assigned an analytical minimum level value
using the minimum levels associated with EPA analytical methods 1624 and 1625.
The estimated long-term average was computed using a method that assigned
nondetected values a relative weight in accordance with the frequency with
which nondetected values for the pollutant were found in the daily data plants
as defined in Appendix VIII-C.
The estimated long-term average, m, for a plant-pollutant combination is
as follows:
n
r. X i i=l
Mj = pD + (I - p) n
VII-201

Plant I.D.
2394
2536
725
3033
384
415
1293
2313
2680
2481
948
267
12
2221
2711
444
TABLE VII-63o TREATMENT TECHNOLOGIES FOR PLANTS IN THE
FINAL BAT TOXIC POLLUTANT DATA BASE
Treatment Technology
Steam stripping, distillation, chemical oxidation, thio-sulfate waste reuse, sewer segregation, phase separation, EQ, NEU, GRSP, ASL, SCLAR, POL, PAER
Gravity separation, EO, NEU, SCR, CLAR, ASL, SCLAR, FILT
Steam stripping, API separator, EQ, NEU, FLOCC, CLAR, ASL, SCLAR, FILT, CHLOR, SLDTH, SLDFILT
NEU, SCSP, NUDADD, ALA, SSIBS, SETTLING LAGOON, POL, FILT, CAD, SSITS, POLISH BAGFILTERS
EQ, NEU, API, ASL, SCLAR, POL
Air stripping, steam stripping, carbon adsorption, distil- lation, retention impoundment, oil separation, API separation, E0, NEU, CLAR, NUDADD, MULTISTAGE POASL, SCLAR
Primary settling, oil removal, EQ, BIOLOGICAL DIGESTION, CLAR
Chemical precipitation, steam stripping, solvent extraction, distillation, chemical oxidation, filtration, equalization, E0, NEU, CLAR, NUDADD, ASL, PACA, SCLAR
Decant sump, E0, NEU, SS, CAD
Carbon adsorption, E0, NE, SCR, CLAR, PLOCC, ASL, SCLAR
NEU, ASL, SCLAR, POL
Steam stripping, NEU, SCR, OLSK, OLS, CLAR, NUDADD, TF, ASL, SCLAR, POL
Solvent extraction, decantation, EQ, NEU, OLS, API, NUDADD, ASL, SCLAR
Solvent extraction, carbon adsorption, distillation, EQ, GR, ASL, SCLAR
EQ, ARL, ANL, SCLAR
EQ, NEU, ASL, SCLAR, DAF
VII-202

Plant I.D.
695
2430
1349
1494
883
659
1609
851
1890
1890"
2631
4051
296
306
63
387
TABLE VII-63. TREATMENT TECHNOLOGIES FOR PLANTS IN THE
FINAL BAT TOXIC POLLUTANT DATA BASE (Continued)
Treatment Technology
Chemical precipitation, steam stripping, chemical oxidation, filtration, separation, catalyst recovery, EO, NEU, OLSK, OLS, DAF, CLAR, FLOCC, NUDADD, ALA, SCLAR
EQ, NEU, 0LS, DAF, FLOCC, NUDADD, TF, POASL, SCLAR
Steam stripping, E0, NEU, CLAR, COAG, FLOCC, NUDADD, ASL, SCLAR, POL
Steam stripping, solvent extraction, E0, NEU, CLAR, ASL, SCLAR, CAD
EO, ASL, SCLAR, POL, FILT
EO, NEU, SCR, DAF, COAG, FLOCC, ALA, SCLAR
EO, NEU, CLAR, ASL, SCLAR
EO, API, NUDADD, ASL, TF, SCLAR
Septic tank, API separator, gravity separation, ion exchange, steam stripping, GR, API, EO, NEU, API, NUDADD, ALA, TF, FSA, SCLAR, FILT, CHLORINE ADDITION
Septic tank, API separator, EO, NEU, NUDADD, ASL, SCLAR, FILT, AERATION
Steam stripping, solvent extraction, EQ, NEU, API, CLAR, ASL, SCLAR
API, ALA, DAF
Steam stripping, ion exchange, distillation, decantation, org. recovery, EO, NEU, GR, OLSK, CLAR, ALA, POASL, SCLAR
Steam stripping, EO, NEU, OLS, FLOCC, NUDADD, ASL, SCLAR, FILT
Distillation, chemical precipitation, evaporation, EO, CLAR, ARL, ASL, SCLAR, CHLOR
Filtration, crystallization, evaporation, EO, NEU, SCR, CLAR, NUDADD, POLISHING BASIN, ASL, SCLAR
VII-203

TABLE Vli-63. TREATMENT TECHNOLOGIES FOR PLANTS IN THE
FINAL BAT TOXIC POLLUTANT DATA BASE (Continued)
Plant I.D. Treatment Technology
500 Steam stripping, carbon adsorption, spill containment, NEU, CLAIR, ASL, SCLAR, POL, pH ADJUSTMENT
682 Settling, flotation, E0, NEU, SCR, CLAR, COAG, SETTLING, FLOTATION, MIXING, SURFACE BAFFLES, ASL, SCLAR, DEAERATION
913 Steam stripping, chemical oxidation, phase separation, EQ, NEU
1012 E0, SEDIM, CP, RBC, TF, SCLAR, SEDIM
1617 Distillation, EO, COAG, SAND BED FILTRATION, TF, SCLAR, POL
1650 NEU, SCR, OLSK, OLS, API, ARLI, ARL2, ARL3, ARL4, ARL5, ARL6, ANL
1753 EQ, NEU, CL~, NUDADD, POLADD, CP, POASL, SCLAR
1769 Chemical precipitation, NEU, CLAIR, NUDADD, FLOCC, ASL, PACA, SCLAR, POL
1774 EQ, NEU, CLAIR, FLOCC, FILT
2227 E0, NEU, CL~, FLOCC, NUDADD, ASL, SCLAR
2445 Dissolved a~r flotation, EO, NEU, SCR, API, CLAR, NUDADD, POASL, SCLAR
2693 Chemical precipitation, steam stripping filtration, EO, NEU, NUDADD, ASL, SCLAR
Note: The order in which these treatment technologies are listed does not necessarily indicate that they are in series, since certain plants employ multiple treatment systems to treat segregated waste streams.
*Two separate treatment systems were sampled at the same plant during the same sampling study.
Vli-204

TABLE VII-63. TREATMENT TECHNOLOGIES FOR PLANTS IN THE
FINAL BAT TOXIC POLLUTANT DATA BASE (Continued)
Key:
CND - C y a n i d e D e s t r u c t i o n C P . - C h e m i c a l P r e c i p i t a t i o n CHRRED - Chromium R e d u c t i o n AS - A i r S t r i p p i n g SS - Steam S t r i p p i n g DISTL - D i s t i l l a t i o n EO - E q u a l i z a t i o n NEU - N e u t r a l i z a t i o n SCR Screening -
GR - Grit Removal OLSK Oil Skimming -
OLS Oil Separation -
API API Separation -
DAF - Dissolved Air Flotation CLAIR - Primary Clarification COAG - Coagulation FLOCC - Flocculation NUDADD - Nutrient Addition ASL - Activated Sludge ALA - Aerated Lagoon ARL - Aerobic Lagoon ANL - Anaerobic Lagoon RBC Rotating Biological Contractor -
TF - Trickling Filters POASL - Pure Oxygen Activated Sludge SSIBS - Second Stage of Indicated Biological System PACA - Powdered Activated Carbon Addition SCLAR - Secondary Clarification POL Polishing Pond -
FILT - Filtration CAD - Carbon Adsorption SSITS Second Stage of Indicated Tertiary System -
GRSP Gravity Separation -
PAER - Post Aeration CHLOR - Chlorination FSA Ferrus Sulfide Addition -
SLDTH Sludge Thickening -
SLDFILT - Sludge Filtering AER - Aeration SEDIM Sedimentation -
POLADD - Polymer Addition
N o t e s :
Upper Case : E n d - o f - P i p e T r e a t m e n t Lower Case: I n - P l a n t C o n t r o l
VII-205

where M i s the estimated long-term average at plant j; D is the analytical 3
minimum level; n is the number of concentration values where X i is detected at
or above the minimum level at plant j; and p is the proportion of nondetected
values reported from all the daily data base plants. That is, p equals the
total number of reported nondetected values from all daily data plants for a
particular pollutant divided by the total number of values reported from all
daily data plants for a particular pollutant. For plant-pollutant combina-
tions with all nondetected values, the long-term average, m, equals the
analytical minimum level. For plant-pollutant combinations where all values
are detected, the long-term average is the arithmetic mean of all values.
Pollutant group values for p were used when pollutant-specific estimates were
not available.
c. Steam Stripping Long-Term Averages
EPA is regulating 28 volatile organic pollutants based on steam stripping
technology. EPA had data on 15 of these pollutants, which were used to deter-
mine limitations using the same methodology used to determine other BAT
organic pollutant limitations. For 13 volatile organic pollutants controlled
by steam stripping, EPA lacked sufficient data to calculate estimated long-
term averages directly from data relating to these pollutants. Instead, EPA
concluded that these pollutants may be treated to levels equivalent, based
upon Henry's Law Constants, to those achieved for the 15 pollutants for which
there were data. Dividing the 15 pollutants into "high" and "medium"
strippability subgroups, EPA developed a long-term average for each subgroup
and applied these to the 13 pollutants for which data were lacking (six
pollutants in the high subgroup and seven in the medium subgroup). The
long-term average for pollutants with no data in each subgroup was determined
by the highest of the long-term averages within each subgroup based upon the
15 pollutants for which the Agency had data. This approach tends to be
somewhat conservative but in the Agency's judgment not unreasonable in light
of the uncertainty that would be associated with achieving a lower long-term
average for the pollutants for which data are unavailable. The high
strippability long-term average thus derived is 64.5 ~g/l, while the medium
strippability long-term average is slightly higher, 64.7 ug/l.
VII-206

While it may appear anomalous that the high strippable subgroup yields
just a slightly lower long-term average effluent concentration, EPA believes
that this is not the case. First, in the context of the maximum levels
entering the steam strippers within the two subgroups (12,000 BE/1 to over
23 million ~g/1), the differences between these two long-term averages is
negligible and essentially reflect the same level of long-term control from an
engineering viewpoint. Second, the "high" and "medium" strippable compounds
behave comparably in steam strippers, in the sense that roughly the same low
effluent levels can be achieved with properly designed and operated steam
strippers. In other words, it is possible to mitigate small differences in
theoretical strippability among compounds in these groups with different
design and operating techniques. The small differences in long-term average
performance seen in the data reflect, in EPA's judgment, no real differences
in strippability among pollutants but rather the difference in steam stripper
operations among the plants from which the data were taken. Indeed, one could
reasonably collapse the two subgroups into one group and develop a single
long-term average for the 13 pollutants for which EPA lacks data. While such
an approach might be technically defensible, EPA decided it would be most
reasonable to retain the distinction between "high" and "medium" subgroups,
which remains a valid and important distinction for the purpose of transfer-
ring variability factors, as discussed below.
Table VII-64 presents the long-term average values for each organic
pollutant, calculated by taking the median of the plant estimated averages for
those pollutants regulated under BAT Subcategory One and Two. The BAT
Subcategory One median of long-term average values for l,l-dichloroethane and
4,6-dinitro-o-cresol have been transferred from BAT Subcategory Two. Since
the in-plant steam stripping and activated carbon units attain effluent levels
equal to the analytical minimum level, theaddition of end-of-pipe biological
treatment for BAT Subcategory Two will not produce a measurable lower effluent
concentration.
d. Calculation of Daily Maximum and Maximum Monthly Average Variability Factors.
After determining estimated long-term average values for each pollutant,
EPA developed two variability factors for each pollutant~-a 99th percentile
Vli-207

TABLE VII-64. BAT TOXIC POLLUTANT MEDIAN OF ESTIMATED LONG-TERM
AVERAGES FOR BAT SUBCATEGORY ONE AND TWO
Subcategory One Subcategory Two Median of Median of Estimated Estimated
Pollutant Minimum Number Long-Term Number Long-Term Number Pollutant Name Level of Plants Means of Plants Means
1 Acenaphthene I0 3 I0.0 1 i0.00
3 Acrylonitrile 50 5 50.0 I 50.00
4 Benzene I0 17 I0.0 4 28.5761
6 Carbon Tetrachloride i0 3 I0.0 - 64.5000*
7 Chlorobenzene I0 2 I0.0 - 64.5000*
8 1,2,4-Trichlorobenzene I0 3 42.909 - 64.7218"
9 Hexachlorobenzene i0 1 I0.0 - 64.7218"
I0 1,2-Dichloroethane I0 9 25.625 2 64.7218
ii l,l,l-Trichloroethane I0 2 I0.0 I i0.0
12 Hexachloroethane i0 2 I0.0 - 64.7218"
13 l,l-Dichloroethane I0 - (10.0)** 1 i0.00
14 l,l,2-Trichloroethane I0 3 I0.0 2 10.2931
16 Chloroethane 50 4 50.0 2 50.00
23 Chloroform I0 8 12.208 2 44.1081
24 2-Chlorophenol I0 3 10.0 - -
25 1,2-Dichlorobenzene I0 7 47.946 - 64.7218"
26 1,3-Dichlorobenzene I0 1 24.80 - 64.5000*
27 1,4-Dichlorobenzene i0 i I0.0 - 64.5000*
29 1,l-Dichloroethylene I0 5 10.0 2 10.0517
30 Trans-l,2-Dichloroethylene i0 3 I0.0 2 11.0517
31 2,4-Dichlorophenol I0 3 17.429 - -
32 1,2-Dichloropropane 10 6 121.50 - 64.7218"
33 1,3-Dichloropropene I0 3 23.00 - 64.7218"
34 2,4-Dimethyl Phenol I0 4 10.794 I I0.00
35 2,4-Dinitrotoluene i0 2 58.833 - -
36 2,6-Dinitrotoluene 10 2 132.667 - -
VII-208

TABLE VII-64. BAT TOXIC POLLUTANT MEDIAN OF ESTIMATED LONG-TERM
AVERAGES FOR BAT SUBCATEGORY ONE AND TWO (Continued)
S u b c a t e g o r y One S u b c a t e g o r y Two Median o f Median of E s t i m a t e d E s t i m a t e d
P o l l u t a n t Minimum Number Long-Term Number Long-Term Number P o l l u t a n t Name Leve l o f P l a n t s Means o f P l a n t s Means
38 Ethyl benzene i0 14 I0.0 - 64.5000*
39 Fluoranthene I0 3 11.533 1 11.5333
42 Bis-(2-Chlorolsopropyl) i0 1 156.667 - 64.7218" Ether
44 Methylene Chloride i0 8 22.956 3 10.800
45 Methyl Chloride 50 1 50.0 1 50.00
52 Hexachlorobutadlene I0 2 i0.0 - 64.5000*
55 Naphthalene I0 I0 i0.0 1 I0.0
56 Nitrobenzene 14 4 14.0 948.6752
57 2-Nitrophenol 20 2 27.525 1 20.00
58 4-Nltrophenol 50 3 50.00 1 50.00
59 2,4-Dinltr0Phenol 50 3 50.0 1 373.00
60 4,6-Dinltro-O-Cresol 24 - (24.0)** 1 24.00
65 Phenol i0 22 10.363 1 I0.0
66 Bis(2-Ethylhexyl)Phthalate i0 2 47.133 1 43.4545
68 Di-n-Butyl Phthalate 10 2 17.606 1 13.0909
70 Diethyl Phthalate i0 2 42.50 1 23.6667
71 Dimethyl-Phthalate I0 2 i0.0 1 10.00
72 Benzo(a)Anthracene I0 2 i0.0 1 10.00
73 Benzo(a)Pyrene 10 1 10.333 1 10.333
74 3,4-Benzofluoranthene i0 1 I0.267 1 10.2667
75 Benzo (k) Fluoranthene I0 1 i0.00 1 10.00
76 Chyrsene i0 3 I0.0 1 10.00
77 Acenaphthylene I0 3 I0.0 1 10.00
78 Anthracene i0 3 i0.0 1 10.00
80 Fluorene I0 3 i0.0 1 10.00
81 Phenanthrene I0 6 10.O 1 10.00
Vli-209

TABLE VII-64. BAT TOXIC POLLUTANT MEDIAN OF ESTIMATED LONG-TERM
AVERAGES FOR BAT SUBCATEGORY ONE AND TWO (Continued)
Subcategory One Subcategory Two Median of Median of Estimated Estimated
Pollutant Minimum Number Long-Term Number Long-Term Number Pollutant Name Level of Plants Means of Plants Means
84 Pyrene I0 3 11.333 1 10.3333
85 Tetraehloroethylene I0 3 10.4231 1 18.4286
86 Toluene i0 24 i0.00 2 12.4177
87 Trichloroethylene I0 4 I0.00 2 11.5862
88 Vinyl Chloride 50 3 50.0 2 64.5000
Note: All units in ~g/l or ppb.
*Transferred median of long-term means by strippability groupings.
**Transferred from BAT Subcategory Two.
VII-210

Maximum for Any One Day variability factor (VFI) and a 95th percentile Maximum
for Monthly Average variability factor (VF4). These, were developed by fitting
a s t a t i s t i c a l d i s t r i b u t i o n to the d a i l y da ta for each p o l l u t a n t at each p l an t ;
e s t i m a t i n g a 99th p e r c e n t i l e and a m e a n o f the d a i l y da ta d i s t r i b u t i o n s for
each p o l l u t a n t at each p l an t ; e s t i m a t i n g a .95 th p e r c e n t i l e and a mean of the
d i s t r i b u t i o n of 4-day monthly ave rages for each p o l l u t a n t a t each p l an t ;
dividing the 99th and 95th percentiles by the respective means of daily and
4-day average distributions to determine plant-specific variability factors.; .
and averaging variability factors across all plants to determinea VFland VF4.
for each pollutant. All plant-pollutant combinations for which variability
factors were calculated have at least seven effluent concentration values
(including NDs) with at least three values at or above the~minimum level; "-. .
For certain pollutants, the amount of daiiy data was limited 'and
individual pollutant variability factors could not be calculated. F0rsuch
pollutants regulated in BAT Subcategory One, variability factors were imputed
from the variability factors for groups of pollutants expected to exhibit
comparable treatment variability based upon comparison of chemical structure
and characteristics. The priority pollutants were grouped, as ~shown in Table
VII-65, by generic classification based on a similarity'o~ functi0nal group or
structure (isomers, homologs, analogs, etc.). As a consequence of these
similarities, members of each group share precursors, and/or have a common
response to generic process chemistry (7-27) and, in the Agency's judgment,
would be expected to exhibit similar characteristics in wastewater treatment
unit operations. Each pollutant in each chemical group without a variability
factor was then assigned a VFI and VF4 equal to the average of the VFIs and
VF4s of any pollutants in the same group. However, there are six pollutants
without individual variability factors that are also in pollutant variability
groups without an average variability factor. An overall average variability
factor based on all individu~l pollutant variability factors was transferred
to these pollutants [acrylonitrile, 2,4-dinitrotoluene, 2,6-dinitrotoluene,
bis(2-chloroisopropyl) ether, hexachlorobutadiene, and nitrobenzene]. In the
case of acrylonitrile and hexachlorobutadiene, the reason for not having
individual variability factors was not lack of sufficient daily data but that
all or nearly all values for these pollutants were not detected.
VII-211

TABLE VII-65. PRIORITY POLLUTANTS BY CHEMICAL GROUPS
I. Halo~enated Methanes (Cls)
46 Methyl bromide 45 Methyl chloride 44 Methylene chloride (dichloromethane) 47 Bromoform (tribromomethane) 23 Chloroform (trichloromethane) 48 Bromodichloromethane 51 Dibromochloromethane 50 Dichlorodifluoromethane 49 Trichlorofluormethane 6 Carbon tetrachloride (tetrachloromethane)
2. Chlorinated C2s
16 Chloroethane (ethyl chloride) 88 Chloroethylene (vinyl chloride) I0 1,2-Dichloroethane (ethylene dichloride) 13 1,l-Dichloroethane 30 1,2-trans-Dichloroethylene 29 l,l-Dichloroehtylene (vinylidene chloride) 14 1,1,2-Trichloroethane Ii l,l,l-Trichlorethane (methyl chloroform) 87 Trichloroethylene 85 Tetrachloroethylene 15 1,1,2,2-Tetrachloroethane 12 Hexachloroethane
3. Chlorinated C3s
32 1,2-Dichloropropane 33 1,3-Dichloropropylene
4. Chlorinated C4
52 Hexachlorobutadiene
5. Chlorinated C5
53 Hexachlorocylopentadiene
6. Chloroalkyl Ethers
17 bis(chloromethyl)ether 18 bis(2-chloroethyl)ether 42 bis(2-chloroisopropyl)ether 19 2-chloroethylvinyl ether 43 bis(2-chloroethoxy) methane
VII-212

TABLE VII-65. PRIORITY POLLUTANTS BY CHEMICAL GROUPS
(Continued)
7. Metals
114 Antimony 115 Arsenic 117 Beryllium 118 Cadmium 119 Chromium 120 Copper 122 Lead 123 Mercury 124 Nickel 125 Selenium 126 Silver 127 Thallium 128 Zinc
8. Pesticides
89 Aldrin 90 Dieldrin 91 Chlordane 95 alpha-Endosulfan 98 Endrin 99 Endrin aldehyde
I00 Heptachlor I01 Heptachlor epoxide 102 alpha-BHC 103 beta-BHC 104 gamma-BHC (Lindane) 105 delta-BHC 92 4,4'-DDT 93 4,4'-DDE (p,p'-DDx) 94 4,4'-DDD (p,p'-TDE)
113 Toxaphene
9. Nitrosamines
61 N-Nitrosodimethyl amine 62 N-Nitrosodiphenyl amine 63 N-Nitrosodi-n-propyl amine
i0. Miscellaneous
2 Acrolein 3 Acrylonitrile
54 Isophorone 121 Cyanide
VII-213

TABLE VII-65. PRIORITY POLLUTANTs BY CHEMICAL GROUPS
(Continued)
11. Aromatics
4 Benzene 86 Toluene 38 Ethylbenzene
12. Polyaromatics
55 Naphthalene i Acenanaphthene
77 Acenaphthylene 78 Anthracene 72 Benzo(a)anthracene (1,2-benzantharacene) 73 Benzo(a)pyrene (e,4-benzopyrene) 74 3,4-Benzofluorantehne 75 Benzo(k)fluorantehene (ll,12-benzofluoranthene) 76 Chrysene 79 Benzo(ghi)perylene (l,l,2-benzoperylene) 82 Dibenzo(a,h)anthracene (1,2,5,6-dibenzanthracene) 80 Fluorene 39 Fluoranthene 83 Indeno(l,2,3-cd)pyrene (2,3-o-Phenylene pyrene) 81 Phenanthrene 84 Pyrene
13. Chloroaromatics
7 Chlorobenzene 25 o-Dichlorobenzene 27 p-Dichlorobenzene 26 m-Dichlorobenzene 8 1,2,4-Trichlorobenzene 9 Hexachlorobenzene
14. Chlorinated Polyaromatic
20 2-Chloronaphthalene
15. Polychlorinated Biphenyl_s
106-112 Seven listed
16. Phthalate Esters
66 bis(2-Ethylhexyl) 67 Butylbenzyl 68 Di-n-butyl 69 Di-n-octyl 70 Diethyl 71 Dimethyl
VII-214

TABLE VII-65. PRIORITY POLLUTANTS BY CHEMICAL GROUPS
(Continued)
17. Nitroaromatics
56 Nitrobenzene 35 2,4-Dinitrotoluene 36 2,6-Dinitrotoluene
18. Benzidines
5 Benzidine 28 3,3'-Dichlorobenzidine 37 1,2-Diphenylhydrazine
19. Phenols
65 Phenol 34 2,4-Dimethylphenol
20. Nitrophenols
57 2-Nitrophenol 58 4-Nitrophenol 59 2,4-Dinitropheno~ 60 4,6-Dinitro-o-cresol
21. Chlorophenols
24 2-Chlorophenol 22 4-Chloro-m-cresol 31 2,4-Dichlorophenol 21 2,4,6-Trichlorophenol 64 Pentachlorophenol
22. 144 TCDD (2,3,7,8-Tetrachloro-dibenzo-p-dioxin)
23. Haloaryl Ethers
40 4-Chlorophenylphenyl ether 41 4-Bromophynylphynyl ether
Priority pollutant numbers refer to a published alphabetical listing of the priority pollutants.
Source: Wise, H.E., and P.O. Fahrenthold (1981). Occurrence and Predictability of Priority Pollutants in Wastewaters of the Organic Chemicals and Plastics/Synthetlc Fibers Industrial Categories, USEPA 1981.
VII~215

For pollutants regulated in Subcategory Two (non-end-of-pipe biological),
a different methodology was employed to transfer variability factors to
pollutants without individual variability factors. In this case, transfer was
accomplished not by pollutant group, but instead by the in-plant control
technology. Therefore, variability factors were transferred among the
pollutants treated by steam stripping, activated carbon, and in-plant
biological treatment. The Agency further subdivided the pollutants controlled
by steam stripping into high and medium strippability groups (based on Henry's
Law Constants). As discussed previously in this section, Henry's Law Constant
is an important criterion in the design of steam strippers and is therefore an
appropriate factor for the transfer of variability factors. Further sub-
division of the pollutants controlled by in-plant biological treatment was not
considered necessary since all pollutants were determined to be effectively
biodegraded; transfer of variability factors by adsorpability groups for
pollutants controlled by activated carbon was based on using the variability
factor for 2,4-dinitrophenol (low adsorpability) for the other three pollu-
tants controlled by activated carbon.
For certain pollutants controlled by in-plant biological treatment, the
transferred variability factors for in-plant biological treatment systems are
lower than the variability factors used for end-of-pipe BAT Subcategory One.
This results because BAT Subcategory One variability factors are: i) in
general, calculated using a different data base; and 2) transferred using the
pollutant variability groups (presented in Table VII-65) rather than across
the technology (as BAT Subcategory Two variability factors are transferred).
Based on these differences, pollutants controlled by in-plant biological
systems which require transferred variability factors will receive variability
factors based on data from three phthalate esters [bis(2-ethylhexyl)
phthalate, di-n-butyl phthalate, and diethylphthalate]; this occurs because
all other pollutants controlled by in-plant biological systems have all daily
data equal to the analytical minimum level. The Agency believes that, in
addition to the reasons mentioned above, the larger end-of-pipe biological
systems have higher variability factors because they receive more commingled
waste streams with a larger number of organic pollutants; thus, they may be
more susceptible to daily fluctuations in performance.
VII-216

Based on the reasons mentioned above, the Agency has decided to retain
the methgdology used to transfer in-plant biological system variability
factors. EPA feels that it would be inconsistent to transfer a higher
variability factor to pollutants whose In-plant biological system reduces high
raw waste concentrations (higher than end-of-pipe biological raw waste
concentrations) to the analytical minimum level solely on the basis of
chemical structure. (It should be noted that the transferred end-of-pipe
biological system variability factor for all polynuclear aromatics would be
based on one plant-pollutant combination.)
In response to comments on the statistical aspects of the proposed
limitations development, several statistical techniques were investigated for
deriving limitations. This investigation found that a modification of the
delta-lognormal procedures provides a reasonable approximation of the under-
lying empirical toxic pollutant data. The delta-lognormal distribution
assumes that data are a mixture of positive lognormally distributed values and
zero values. Consequently, zero concentration values are modeled by a point
distribution; positive concentration values follow a lognormal distribution;
and the mixture of these values forms the delta-lognormal distribution. The
statistical methodology used for testing the assumption of lognormality is
found in Appendix VII-E, previously referenced in the BPT Section; the results
of these hypothesis tests are also included in this Appendix.
This method provides a reasonable approach f o r combining quantitative
concentration values with information expressed only as a nondetect, which is
more qualitative in nature. For the determination of variability factors, the
delta-lognormal procedure was modified by placing the point distribution at
th# analytical minimum level. The details of this modification of the delta
distribution are presented in Appendix VII-F. This approach is somewhat
conservative since values reported as nondetect may actually be any value
between zero and the minimum level. The detection limit used for each pollu-
tant was the analytical minimum level in EPA analytical methods 1624 and 1625.
Assigning a minimum level to nondetected values in calculating both variability
factors and long-term averages for this data base tends to result in slightly
higher limitations than would be derived if lower values were assumed. If the
point distribution were set to a value below the analytical minimum level,
VII-211

then the v a r i a b i l i t y component of the l i m i t a t i o n would i n c r e a s e and the
component c o r r e s p o n d i n g to the mean would d e c r e a s e . The ne t e f f e c t (mean
t imes v a r i a b i l i t y f a c t o r ) would g e n e r a l l y r e s u l t in lower l i m i t a t i o n s . In the
absence of e s t a b l i s h i n g a f i r m e s t i m a t e of the d i s t r i b u t i o n of d a t a below the
a n a l y t i c a l minimum leve l s : , the Agency conc luded t h a t i t would be more
e q u i t a b l e to use the a n a l y t i c a l minimum l e v e l to model the po in t d i s t r i b u t i o n
in the m o d i f i c a t i o n to the d e l t a - l o g n o r m a l s t a t i s t i c a l p r o c e d u r e s .
Comments were also received regarding the use of the average variability
factor for transfer to pollutants without individual variability factors for
BAT Subcategory One within each of the 23 pollutant groups. Commenters stated
that the source of data for many of the pollutants was the 3-day Verification
sampling program, and that: transfer of an average variability factor to an LTA
based only on data from a 3-day sampling program did not adequately address
the effluent variability of a pollutant. To address this comment, the Agency
examined its edited BAT toxic pollutant data base and determined that the
predominant reason for a pollutant not having an individual variability factor
was not lack of sufficient daily data but that all or nearly all values for
that pollutant were not detected. Therefore, the Agency has decided to retain
the use of an overall average variability factor for each pollutant group to
transfer variability factors to all pollutants within the group without an
individual variability factor.
The Agency also notes the exclusion of two plants (2227P and 500P) from
the variability factor calculations even though they were retained for
calculation of long-term averages. For plant 2227P, EPA examined the
end-of-pipe biological treatment performance data submitted by the plant
(which consisted of data for 1,2,4-trichlorobenzene, 1,2-dichlorobenzene, and
nitrobenzene over a 1-year period) and observed a 2-month period when effluent
concentrations of these pollutants were considerably higher than the remaining
lO-month period; during this period of higher effluent concentrations, the
corresponding raw waste concentrations were consistent with the remaining
I0 months of raw waste concentration data. Based on this inconsistent
performance, the Agency has concluded that this plant did not have good enough
control of variability to be used to develop variability factors. Thus, the
Agency has excluded this plant from variability factor calculations. However,
VII-218

the overall long-term performance is good and consistent with that achieved by
othe~ good performers. Therefore, this plant's data has been retained for
long-term average calculations.
For plant 500P, the Agency examined the steam stripping and carbon
adsorption performance data submitted by the plant (which consisted of data
for nitrobenzene over a 3-month period) and believes the data exhibit both
competitive adsorption effects and column breakthrough. Competitive
adsorption exists when a matrix contains adsorbable compounds in solution
which are being selectively adsorbed and desorbed. A review of the data
indicates that while the plant's long-term performance demonstrates
significant removals of pollutants, it is not consistent, thus much more
variable than that of another plant using similar treatment and achieving
comparable long-term average concentrations. Therefore, the Agency has
excluded this plant from variability factor calculations but has retained the
data for long-term average calculations.
Table VII-66 presents the individual pollutant variability factors for
BAT Subcategory One summarized by pollutant group including the pollutants for
which the overall average variability factor has been transferred. Table
VII-67 presents the individual pollutant variability factors for BAT Sub-
category Two summarized by In-plant control technology and strlppability and
adsorpabillty groups for steam stripping and activated carbon, respectively.
3. BAT and PSES Metals and Cyanide Limitations
Raw wastewaters generated by certain OCPSF facilities contain relatively
high concentrations of metals and total cyanide. Based on a detailed analysis
(as discussed in Sections V and Vl of this document), the Agency has decided
to regulate the following six pollutants under BAT and PSES:
• Total chromium
• Total copper
• Total lead
• Total nickel
• Total zinc
• Total cyanide.
Vli-219

TABLE VII-66. INDIVIDUAL TOXIC POLLUTANT VARIABILITY FACTORS
FOR BAT SUBCATEGORY ONE
Pollutant Number Pollutant Name Daily VF Monthly VF
Imputed Varia- billty Factor?
Pollutant Class = 1
6 23 44 45
Carbon Tetrachloride Chloroform Methylene Chloride Methyl Chloride
3.79125 3.71334 3.86915 3.79125
1.71212 1.69050 1.73374 1.71212
Yes
Yes
Pollutant Class = 2
I0 II 12 14 16 29 30 85 87 88
1,2-Dichloroethane l,l,l-Trichloroethane Hexachloroethane l,l,2-Trichloroethane Chloroethane l,l-Dichloroethylene 1,2-Trans-dichloroethylene Tetrachloroethylene ~ Trichloroethylene Vinyl Chloride
8.22387 5.34808 5.34808 5.34808 5.34808 2.47230 5.34808 5.34808 5.34808 5.34808
2.61524 2.07532 2.07532 2.07532 2.07532 1.53541 2.07532 2.07532 2.07532 2.07532
Yes Yes Yes Yes
Yes Yes Yes Yes
Pollutant Class = 3
32 33
1,2-Dichloropropane 1,3-Dichloropropene
1.88783 1.88783
1.25869 1.25869 Yes
Pollutant Class = 4
52 Hexachlorobutadiene 4.83045 1.91724 Yes
Pollutant Class = 6
42 Bis-(2-Chloroisopropyl) Ether 4.83045 1.91724 Yes
Pollutant Class = I0
3 Acrylonitrile 4.83045 1.91724 Yes
Pollutant Class = ii
4 38 86
Benzene Ethylbenzene Toluene
13.5252 10.7379 7.9506
3.63645 3.10513 2.57382
Yes
Vli-220

TABLE VII-66. INDIVIDUAL TOXIC POLLUTANT VARIABILITY FACTORS
FOR BAT SUBCATEGORY ONE (Continued)
Pollutant Imputed Varia-Number Pollutant Name Daily VF Monthly VF b i l i t y Factor?
Pollutant Class = 12
1 Acenaphthene 5.89125 2.1563 Yes 39 Fluoranthene 5.89125 2.1563 Yes 55 Naphthalene 5.89125 2.1563 Yes 72 Benzo(a)Anthracene 5.89125 2.1563 Yes 73 Benzo(a)Pyrene 5.89125 2.1563 Yes 74 3,4-Benzofluoranthene 5.89125 2.1563 Yes 75 Benzo(k)Fluoranthene 5.89125 2.1563 Yes 76 Chrysene 5.89125 2.1563 Yes 77 Acenaphthylene 5.89125 2.1563 Yes 78 Anthracene 5.89125 2.1563 Yes 80 Fluorene 5.89125 2.1563 Yes 81 Phenanthrene 5.89125 2.1563 84 Pyrene 5.89125 2.1563 Yes
Pollutant Class = 13
7 Chlorobenzene 2.79155 1.46787 Yes 8 1,2,4-Trichlorobenzene 3.25317 1.58318 9 Hexachlorobenzene 2.79155 1.46787 Yes
25 1,2-Dichlorobenzene 3.38091 1.59720 26 1,3-Dichlorobenzene 1.74057 1.22323 27 1,4-Dichlorobenzene 2.79155 1.46787 Yes
Pollutant Class = 16
66 Bis-(2-Ethylhexyl) Phthalate 5.91768 2.17027 68 Di-n-Butyl Phthalate 3.23768 1.51824 70 Diethyl Phthalate 4.75961 1.89895 71 Dimethyl Phthalate 4.63833 1.86249 Yes
Pollutant Class = 17
35 2,4-Dinitrotoluene 4.83045 1.91724 Yes 36 2,6-Dinitrotoluene 4.83045 1.91724 Yes 56 Nitrobenzene 4.83045 1.91724 Yes
VII-221

TABLE VII-66. INDIVIDUAL TOXIC POLLUTANT VARIABILITY FACTORS
FOR BAT SUBCATEGORY ONE (Continued)
Pollutant Imputed Varia- Number Pollutant Name Daily VF Monthly VF bility Factor?
Pollutant Class = 19
34 2,4-Dimethylphenol 3.25650 1.59976 65 Phenol 2.49705 1.40602
Pollutant Class = 20
57 2-Nitrophenol 2.49725 1.4643 58 4-Nitrophenol 2.47783 1.4331 Yes 59 2,4-Dinitrophenol 2.45842 1.4019
Pollutant Class = 21
24 2-Chlorophenol 9.70575 3.05490 31 2,4-Dichlorophenol 6.37097 2.22674
Note: Average pollutant class variability factors used (except overall average variability factor used for pollutants 3, 35, 36, 42, 52, and 56) for imputations when no pollutant class variability factors are available.
VII-222

TABLE VII-67. INDIVIDUAL TOXIC POLLUTANT VARIABILITY FACTORS
FOR BAT SUBCATEGORY TWO
Pollutant Imputed Varia- Number Pollutant Name Daily VF Monthly VF bility Factor?
4 Benzene 4.65485 1.97430 II l,l,l-Trichloroethane 5.88383 2.18759 Yes 13 l,l-Dichloroethane 5.88383 2.18759 Yes 16 Chloroethane 5.88383 2.18759 Yes 23 Chloroform 7.36230 2.49394 29 l,l-Dichloroethylene 5.88383 2.18759 Yes 30 1,2-Trans-dichloroethylene 5.88383 2.18759 Yes 45 Methyl Chloride 5.88383 2.18759 Yes 85 Tetrachloroethylene 8.85657 2.78458 86 Toluene 5.88383 2.18759 Yes 87 Trichloroethylene 5.88383 2.18759 Yes 88 Vinyl Chloride 2.66160 1.49754
I0 1,2-Dichloroethane 8.8604 2.77681 14 l,l,2-Trichloroethane 12.2662 3.02524 Yes 44 Methylene Chloride 15.6720 3.27366
Note: Pollutant variability factors sorted by strippability group--mean of average variability factors within a strippability group used to impute variability factors when no variability factors available.
Pollutant Imputed Varia-Number Pollutant Name Daily VF Monthly VF bility Factor?
56 Nitrobezene 6.7477 2.35797 57 2-Nitrophenol 11.5023 3.23479 Yes 58 4-Nitrophenol 11.5023 3.23479 Yes 59 2,4-Dinitrophenol 11.5023 3.23479 60 4,6-Dinitro-o-Cresol 11.5023 3.23479 Yes
Note: Pollutant variability factors--variability factors for pollutant 59 used to impute variability factors for 57, 58, and 60.
VII-223

TABLE VII-67. INDIVIDUAL TOXIC POLLUTANT VARIABILITY FACTORS
FOR BAT SUBCATEGORY TWO (Continued)
Pollutant Imputed Varia- Number Pollutant Name Daily VF Monthly VF bility Factor?
1 Acenaphthene 4.63833 1.86249 Yes 3 Acrylonitrile 4.63833 1.86249 Yes
34 2,4-Dimethylphenol 4.63833 1.86249 Yes 39 Fluorantehene 4.63833 1.86249 Yes 55 Naphthalene 4.63833 1.86249 Yes 65 Phenol 4.63833 1.86249 Yes 66 Bis-(2-Ethylhexyl) Phthalate 5.91768 2.17027 68 Di-n-Butyl Phthalate 3.23768 1.51824 70 Diethyl Phthalate 4.75961 1.89895 71 Dimethyl Phthalate 4.63833 1.86249 Yes 72 Benzo(a)Anthracene 4.63833 1.86249 Yes 73 Benzo(a)Pyrene 4.63833 1.86249 Yes 74 3,4-Benzofluoranthene 4.63833 1.86249 Yes 75 Benzo(k)Fluoranthene 4.63833 1.86249 Yes 76 Chrysene 4.63833 1.86249 Yes 77 Acenaphthylene 4.63833 1.86249 Yes 78 Anthracene 4.63833 1.86249 Yes 80 Fluorene 4.63833 1.86249 Yes 81 Phenanthrene 4.63833 1.86249 Yes 84 Pyrene 4.63833 1.86249 Yes
Note: Pollutant variability factors--overall average variability factors used to impute variability factors when no variability factors available.
VII-224

The technology basis for control of these pollutants is hydroxide precipita-
tion for the metals and alkaline chlorination for cyanide. Although sulfide
precipitation was the basis for BAT and PSES compliance cost estimates, it was
not used as the technology basis for the limitations because the Agency's
final regulation does not include control of complexed sources of these
metals. This results in a slight overestimation of costs for compliance with
the metals limits for BAT and PSES levels of control.
Although the concentrations of these pollutants in certain samples of
untreated 0CPSF wastewater are relatively high, the metals fall within the
range of concentrations found in untreated wastewaters from metal processing
and finishing, such as those for the metal finishing and battery manufacturing
industries. Because no metals treatment performance data for OCPSF waste-
waters generated by the validated product/processes listed in Section V were
available, the Agency decided to transfer limitations from the metal finishing
point source category. Cyanide is found at levels in certain ocPsF waste
streams at higher concentrations than in metal finishing. Destruction of
cyanide by alkaline chlorination is demonstrated in the OCPSF industry; this
technology uses excess oxidizer (chlorine) and excess alkaline conditions, and
should be able to treat cyanide by adding sufficient detention time which has
been costed. Table VII-68 presents the long-term averages and daily and
monthly maximum variability factors for each pollutant.
The monthly maximum limitations for the metal finishing industry are
based on an assumed monitoring requirement of 10 samples per month and employ
the 99th percentile as a basis for the monthly maximum standard. For the
OCPSF standard, however, the monthly maximum standards are based on an assumed
monitoring requirement of four samples per month and they use the 95 percen-
tile as a basis. The above limitations have been adjusted accordingly to be
consistent with the other OCPSF BAT limitations by deriving 4-day variability
factors from the distributional parameters determined from the 10-day metal
finishing variability factors (see Appendix VII-F). The OCPSF daily and
monthly maximum limitations for each pollutant is the product of the respec-
tive long-term averages and respective 1-day and 4-day variability factors.
VII-225

TABLE VII-68. BAT SUBCATEGORY ONE AND TWO LONG-TERM AVERAGES AND VARIABILITY FACTORS FOR METALS AND TOTAL CYANIDE
Pollutant Number
119
120
121
122
124
128
Pollutant Name
Total Chromium
Total Copper
Total Cyanide
Total Lead
Total Nickel
Total Zinc
Long-Term Average (mg/l)
0.572
0.815
0.180
0.197
0.942
0.549
Maximum Monthly Maximum Daily Average VF VF
1.934 4.85
1.781 4.15
2.343 6.68
1.642 3.52
1.796 4.22
1.912 4.75
Vli-226

4. BAT Zinc Limitations for Plants Manufacturin~ Rayon by the Viscose Process andAcrylic Fibers by the Zinc Chloride/Solvent Process
Raw wastewaters generated~by the manufacture of rayon by the viscose
process and acrylic fibers by the~zinc chloride/solvent process exhibit high
concentrations of zinc with levels generally exceeding 100 mgll. Accordingly,
the Agency has decided to control zinc in the process wastewaters from these
product/processes by establishing separate BAT effluent limitations. Since
these wastewaters do not contaln~complexed sources of zinc that could inhibit
treatment by conventional methods, the Agency has selected hydroxide precipi-
tation as the basis for these process-speclfic BAT effluent limitations.
During the pub l i c comment per iods on the March 21, 1983, proposal and
Ju ly 17, 1985, NOA, i n d u s t r y commenters submit ted hydroxide p r e c i p i t a t i o n
performance da ta for four rayon p l an t s and one a c r y l i c f i b e r s p l a n t . These
da ta s e t s con ta ined i n f l u e n t and e f f l u e n t da ta for four p l a n t s ( t h r e e rayon,
one a c r y l i c f i b e r ) wi th over 200 i n f l u e n t / e f f l u e n t da ta p a i r s for each da ta
s e t . One rayon p lan t (399) was e l im ina t ed because only e f f l u e n t da ta were
submi t ted . Fol lowing a q u a l i t y assurance review, the e f f l u e n t c o n c e n t r a t i o n s
tha t exceeded 10 mg/1 or tha t e x h i b i t e d l e s s than 90 percen t removal of z inc
were d e l e t e d from these th ree da ta s e t s . For the performance da ta from the
a c r y l i c f i b e r s p lan t (1012), 1.4--p~rcent of the e f f l u e n t z inc c o n c e n t r a t i o n s
were d e l e t e d , whi le for the th ree remaining rayon p l an t s (63, 387, and 1774),
5 .9 , 0 .8 , and 63.6 percen t of the r e s p e c t i v e e f f l u e n t z inc c o n c e n t r a t i o n s were
d e l e t e d .
The Agency then investigated the data set for plant 1774 because of the
failure of 63.6 percent of the data to pass the editing criteria. Analysis of
the data revealed that the majority of the data failed the 90 percent removal
criteria. Further investigation revealed that the failure to achieve 90 per-
cent removal was not because of high effluent zinc concentrations but due to
low influent concentrations that are the result of a zinc recovery unit
upstream of the Influent sampling point. Based on these findings, the entire
performance data set for plant 1774 was deleted from further limitations
calculations.
VII-227

The d a t a s e t s f o r t he two r e m a i n i n g rayon p l a n t s and the one a c r y l i c
f i b e r s p l a n t were a n a l y z e d a c c o r d i n g to t he m e t h o d o l o g y f o r d e r i v i n g BAT
effluent limitations described in Appendix VII-F. Table VII-69 presents the
resulting long-term averages and variability factors for the remaining plants.
5. PSES Effluent Limitations
As presented earlier in Section Vl, the Agency has determined that
47 toxic pollutants pass through POTWs and will be controlled by PSES effluent
limitations. For these 47 toxic pollutants, PSES effluent limitations are
equal to BAT Subcategory Two effluent limitations.
VII-228

TABLE VII-69. BAT ZINC LONG-TERM AVERAGES AND VARIABILITY FACTORS FOR RAYON
(VISCOSE PROCESS) AND ACRYLIC (ZINC CHLORIDE/SOLVENT PROCESS) FIBERS PLANTS
Plant Long-Term Maximum Monthly Maximum Daily Number Average VF VF
(mgll)
63 1.739 1.79 4.19
387 2.114 1.41 2.50
1012 2.190 1.52 2.95
Median of LTA 2.114
Average VF 1.572 3.214
VII-229

SECTION Vll
REFERENCES
Cited References
7-1 U.S. Environmental P r o t e c t i o n Agency (USEPA). 1981. NPDES Best Management P r a c t i c e s Guidance Document. Of f ice of Water Enforcement and Permi ts .
7-2 U.S. Environmental Protection Agency (USEPA). 1983b. Development Document for Effluent Limitations Guidelines and Standards for the Organic Chemicals and Plastics and Synthetic Fibers Point Source Category. Volume I (BPT), Volume II (BAT), and Volume III (BAT). Effluent Guidelines Division. EPA 440/i-83/009b. February 1983.
7-3 Carrio, L.A., A.R. Lopez, P.J. Krashnoff, and J.J. Donnellon. 1985. Sludge reduction by in-plant process modification: New York City's experiences. J. Water Poll[. Control Fed. 57(2):116-121.
7-4 Shukla, H.M. and R.E. Hicks. 1983. "Process Design Manual for Stripping of Organics." Submitted by Water General Corporation to Industrial Environmental Research Laboratory.
7-5 Perry , Rowe, and Tchobanoglous, Environmental Eng inee r ing , p. 42-43.
7-6 Process Design Manual for Upgrading E x i s t i n g Vastewater Treatment P l a n t s , U.S. Environmental P r o t e c t i o n Agency Technology Trans fe r S e r i e s , EPA 625/1-71-004a, October 1974.
7-7 Bender, J . and R.M. Crosby. 1984. "Hydraul ic C h a r a c t e r i s t i c s of Ac t iva ted Sludge Secondary C l a r i f i e r s . " EPA-600/52-84-131, September 1984.
7-8 Poole, J.E.P. 1984. A study of the relationship between mixed liquor fauna and plant performance for a variety of activated sludge sewage treatment works. Water Res. (G.B.) 18:281-287.
7-9 Buhr, H.O., M.F. Goddard, T.E. Wilson, and W.A. Ambrose. 1984. full use of step feed capability. J. Water Poll. Control Fed. 56(4):325-330.
Making
7-10 Hickman, G.T. and J.T. Novak. 1984. Acclimation of activated sludge to pentachlorophenol. J. Water Poll. Control Fed. 56(4):364-369.
7-11 Levine, A.D., G. Tchobanoglous, and T. Asano. 1985. C h a r a c t e r i z a t i o n of the s i z e d i s t r i b u t i o n of contaminants in wastewater : t rea tment and reuse i m p l i c a t i o n s . J . Water P o l l . Control Fed. 57(7) :805-816.
7-12 Schul tz , J .R. and T.M. Keinath . 1984. t rea tment process mechanisms. J . Water 56(2):143-151.
Powdered a c t i v a t e d Po l l . Control Fed.
carbon
VII-230

SECTION Vll
REFERENCES (Continued)
Cited References (continued)
7-13 News, Volume 4, No. 31 Summer 1987. Aire-O 2 Chaska, Minnesota.
Aeration Industries, Inc~,
7-14 F i l t r a t i o n and Chemically Ass i s ted C l a r i f i c a t i o n of B i o l o g i c a l l y Treated Pulp and Paper Mill Indus t ry Wastewaters. Draft Report to the O.S. Environmental P ro t ec t i on Agency, Edward C. Jordan Co., Inc.~ 1979.
7-15 Rice, N., A.A. Kalinske,~and W.I. Advanced Wastewater Treatment for
Arnold. 1979. A P i l o t Study of the Ticonderoga Mil l , August 1977.
7-16 Personal Communication with Dana Dol lo f f , 26, 1980.
I n t e r n a t i o n a l Paper Co., June
7-17 Amberg, H.R., I. Gellman, and R.H. Scott. "The Status of Water Pollution Control in the Soviet Union," TAPPI, Vol. 58, No. II, November 1975.
7-18 Scott, R.H. 1978. "Sophisticated Treatment of Baikal pulp Mill in USSR," Pulp and Paper, Vol. 48, No. 4, April 1978.
7-19 Smith, O.D., R.M. Stein, and C.E. Adams, Jr. 1975. "How Mills Cope With Effluent Suspended Solids," Paper Trade Journal, VOI. 159, No. 17, July 1975.
7-20 Peterson, R.R. and J.L. Graham. 1979. CH2M Hill, Inc., Post Biological Solids Characterization and Removal from Pulp Mill Effluents. EPA 600/2-79-037.
7-21 "Preliminary Data Base for Review of BATEA Effluent Limitations Guidelines, NSPS, and Pretreatment Standards for'the Pulp, Paper, and Paperboard Point Source Category," Edward C. Jordan, Co., Inc., June 1979.
7-22 Amberg, H.R.. 1979. Crown Zellerbach Corp., Comments on E.C. Jordan's Draft Report, "Preliminary Data Base for Review of BATEA Effluent Limitations Guidelines, NSPS, and Pretreatment Standards for the Pulp, Paper, and Paperboard Point Source Category," September 1979.
7-23 Cashen, R.F. 1979. St. Regis Paper Co., Comments on E.C. Jordan's Draft Report, "Preliminary Data Base for Review of BATEA Effluent Limitations Guidelines, NSPS, and Pretreatment Standards for the Pulp, Paper, and Paperboard Point Source Category," September 1979.
7-24 Button, E.F. 1979. ITT Rayonier Inc., Comments on E.C. Jordan's Draft Report. "Preliminary Data Base for Review of BATEA Effluent Limitations Guidelines, NSPS, and Pretreatment Standards for the Pupp, Paper, and Paperboard Point Source Category." September 1979.
VII-231

Y
7-25
7-26
7-27
SECTION Vll
REFERENCES (Continued)
Cited References (Continued)
Barton, Curtis A.. 1979. The Proctor & Gamble Co., Comments on E.C. Jordan's Draft Report, "Preliminary Data Base for Review of BATEA Effluent Limitations Guidelines, NSPS, and Pretreatment Standards for the Pulp, Paper, and Paperboard Point Source Category," September 1979.
National Council of the Paper Industry for Air and Stream Improvement, Inc. (NCASI). 1980. "Summary of Data-Chemically Assisted Clarification of Biologically Treated Wastewaters," Presented in Meeting with U.S. EPA/ Edward C. Jordan Co., Portland, Maine, February 7, 1980.
Wise, H.E. and P.D. Fahrenthold. 1981. Occurrence and Predictability of Priority Pollutants in Wastewaters of the Organic Chemicals and Plastics/Synthetic Fibers Industrial Categories, Presented at the 181st American Chemical Society National Meeting, Atlanta, Georgia, March 29 - April 3, 1981.
Other References
Beardsley, M.L. and J.M. Coffey. 1985. Bioaugmentatlon: Optimizing biological wastewater treatment. Pollution Engineering 17(12):30.
Berger, B.B. 1983. Control of organic substances in water and wastewater. EPA-600/8-83-Oll, NTIS PB86 184744/AS.
Carter, K.B. 1985. Contract operations: Private contracts for public work. J. Water Poll. Control Fed. 57(7):750-755.
Eckenfelder, Jr., J.J., J. Patoczka, and A.T. Watkin. 1985. Wastewater treatment. Chem. Eng. 92:60-74.
Eischen, G.W. and J.D. Keenan. 1985. Monitoring aerated lagoon performance. J. Water Poll. Control Fed. 57(8):876-881.
Foess, G.W. and W.A. Ericson. 1980. Toxic control - the trend of the future. Water & Wastes Engineering (February 1980): 21-27.
Gaudy, Jr., Anthony F. and E.T. Gaudy. 1980. Microbiology for environmental engineers and scientists. New York: McGraw-Hill Book Company.
Johnson, T., F. Lenzo, and K. Sullivan. 1985. Raising Stripper Temperature Raises MEK Removal. Pollution Engineering 17(9):34.
Manross, R.C. 1985. Wastewater treatment plant instrumentation handbook. Water Research Lab., Cincinnati, Ohio. EPA/600/8-85-026, NTIS:PB86-108636/AS.
VII-232

SECTION Vll
REFERENCES (Continued)
Other References (Continued)
Metcalf & Eddy, Inc. 1979. Wastewater engineering: Treatment/ disposal/reuse. New York: McGraw-Hill Book Company.
Municipal Environmental Research Laboratory (MERL). 1980. Carbon Adsorption Isotherms for Toxic Organics. EPA-600/8-80-023. PB 80197320. April 1980.
Peters, R.W., Y/ Ku, and D. Bhattacharyya. Evaluation of recent treatment techniques for removal of heavy metals from industrial wastewaters. AIChE Symposium Series. 243:18.
Richards, S.R., C. Hastwell, and M. Davies. 1984. The comparative examination of 14 activated sludge-plants using enzymatic techniques. Water Poll. Control Fed. (G.B.) 83:300.
SAIC. 1985. Costing documentation and notice of new information report. Prepared for: Industrial Technology Division of the USEPA. June 12, 1985.
Seklzawa, T., K, Fujle, H. Kubota, T. Kasakura, and A. Mizuno. 1985. Air diffuser performance in activated sludge aeration tanks. J. Water Poll. Control Fed. 57(1):53-59.
U.S. Environmental Protection Agency (USEPA). 1974. Processing Design Manual for Upgrading Existing Wastewater Treatment Plants. PB-259 148, EPA 625/1-71-004a. October 1974.
U.S. Envlronmefital Protection Agency (USEPA). 1979. Summary Report, Control and Treatment Technology for the Metal Finishing Industry: Sulfide Precipitation. EPA 625/8-80-003.
U.S. Environmental Protection Agency (USEPA). 1980. Sources and Treatment of Wastewater in the Nonferrous Metals Industry. EPA 600/2-80d-074.
U.S. E n v i r o n m e n t a l P r o t e c t i o n Agency (USEPA). 1982. Development Document for Effluent Limitations, Guidelines, and Standards for the Battery Manufacturing Point Source Category. EPA 440/I-82-067b.
U.S. E n v i r o n m e n t a l P r o t e c t i o n Agency (USEPA). 1983a. Development Document f o r E f f l u e n t L i m i t a t i o n s G u i d e l i n e s New Source P e r f o r m a n c e S t a n d a r d s f o r t he Meta l F i n i s h i n g Source C a t e g o r y ,
U.S. E n v i r o n m e n t a l P r o t e c t i o n Agency (USEPA). 1983c. Treatability Manual. Office of Research and Development. EPA-600/2-82-001a. February 1983.
VII-233

SECTION VII
REFERENCES (Continued)
Other References (Continued)
Van Gils, G. and M. Dirbazari. 1986. Development of a Combined Ultrafiltration and Carbon Adsorption System for Industrial Wastewater Reuse and Priority Pollutant Manual. Environmental Progress 5(3):167-170, August 1986.
VII-234 ~U.$ GOV'E~N~E.h'T PRI.N'T]~GOFFIC'1~'1993 -715 "003/ 870.~3
Copyright © 2022 FDOKUMEN