Evaluation of Effluent Toxicity as an Indicator of Aquatic Life Condition in Effluent-Dominated...
15
Evaluation of Effluent Toxicity as an Indicator of Aquatic Life Condition in Effluent-Dominated Streams: A Pilot Study Jerry Diamond,* James Stribling, Marcus Bowersox, and Henry Latimer Tetra Tech, 400 Red Brook Boulevard, Suite 200, Owings Mills, Maryland 21117, USA (Received 16 January 2008; Accepted 10 May 2008) ABSTRACT The types and quality of data needed to determine relationships between chronic whole effluent toxicity (WET) test results and in-stream biological condition were evaluated using information collected over a 1.5-y period from 6 different sites across the United States. A data-quality-objectives approach was used that included several proposed measurement quality objectives (MQOs) that specified desired precision, bias, and sensitivity of methods used. The 6 facilities used in this study (4 eastern and 2 western United States) all had design effluent concentrations .60% of the stream flow. In addition to at least quarterly chronic Ceriodaphnia dubia, Pimephales promelas (fathead minnow), and Selenastrum capricornutum (green algae) WET tests, other tests were conducted to address MQOs, including splits, duplicates, and blind positive and negative controls. Macroinvertebrate, fish, and periphyton bioassessments were conducted at multiple locations upstream and downstream of each facility. The test acceptance criteria of the US Environmental Protection Agency (USEPA) were met for most WET tests; however, this study demonstrated the need to incorporate other MQOs (minimum and maximum percent significant difference and performance on blind samples) to ensure accurate interpretation of effluent toxicity. More false positives, higher toxicity, and more ‘‘failed’’ (noncompliant) tests were observed using no-observed-effect concentration (NOEC) as compared to the IC25 endpoint (concentration causing 25% decrease in organism response compared to controls). Algae tests often indicated the most effluent toxicity in this study; however, this test was most susceptible to false positives and high interlaboratory variability. Overall, WET test results exhibited few relationships with bioassessment results even when accounting for actual effluent dilution. In general, neither frequency of WET noncompliance nor magnitude of toxicity in tests were significantly related to differences in biological condition upstream and downstream of a discharge. Periphyton assessments were most able to discriminate small changes downstream of the effluent, followed by macroinvertebrates and fish. Although sampling methods were robust, more replicate samples collected upstream and downstream of each facility were needed to increase detection power. In general, macroinvertebrate and periphyton assessments together appeared to be sufficient to address project objectives. Keywords: Whole effluent toxicity Bioassessment Chronic toxicity Data quality objectives INTRODUCTION As part of the goal of the US Environmental Protection Agency (USEPA) to ensure that designated beneficial uses of the nation’s surface waters are met, whole effluent toxicity (WET) testing has been required in the National Pollutant Discharge Elimination System permits for many industrial and municipal dischargers. Such tests are used as 1 line of evidence, in addition to chemical and biological monitoring, to determine whether a permitted discharge or surface water meets water quality standards and is protective of aquatic life uses. Like chemical criteria that are based on toxicological responses of aquatic organisms to a chemical of interest, WET results are used because they are thought to indicate potential effects of a discharge on aquatic life condition (USEPA 1991). Given that WET tests are standardized (i.e., not site-specific) laboratory analyses that rely on responses of indicator species, the way in which WET test results are integrated in National Pollutant Discharge Elimination System permitting and the ways that WET compliance limits are derived have been controversial issues. The crux of this controversy lies in the difficulty in relating WET test results to effects on biological communities in a receiving stream. Indeed, the problem of relating any laboratory-based result to actual field community responses has been one of the most intriguing yet challenging questions in ecology (e.g., Cairns 1986; Chapman 1995; Ellis et al. 2002) and applied biology (Barbour et al. 1996; Waller et al. 1996; Ankley 1997; LaPoint and Waller 2000). While there have been several previous attempts to examine relationships between WET results and biological condition (Eagleson et al. 1990; USEPA 1991; Dickson et al. 1992, 1996), these studies used outdated test methods with unspecified data quality and generally targeted sites known to have acute toxicity issues (Marcus and McDonald 1992). Previous research by the authors (Diamond et al. 1999; Diamond and Daley 2000) examined this issue using WET and biological data compiled from over 90 sites across the United States that met strict quality control and other site selection criteria. Although some relationships between WET results and biological condition were observed in that study (predictably, when effluent flow dominated the downstream flow under normal flow conditions and when acute toxicity was evident), results were somewhat inconclusive because 1) few sites had all of the appropriate WET and bioassessment data needed for a rigorous statistical analysis, 2) WET test methods used in that study were still outdated in many cases, and 3) bioassessment methods and resulting data were not always of sufficient quality given more recent knowledge regarding the assessment of biological condition. * To whom correspondence may be addressed: [email protected] Published on the Web 7/2/2008. Integrated Environmental Assessment and Management — Volume 4, Number 4—pp. 456–470 456 Ó 2008 SETAC Case Study
-
Upload
independent -
Category
Documents
-
view
1 -
download
0
Transcript of Evaluation of Effluent Toxicity as an Indicator of Aquatic Life Condition in Effluent-Dominated...

Evaluation of Effluent Toxicity as an Indicator of Aquatic LifeCondition in Effluent-Dominated Streams: A Pilot StudyJerry Diamond,* James Stribling, Marcus Bowersox, and Henry Latimer
Tetra Tech, 400 Red Brook Boulevard, Suite 200, Owings Mills, Maryland 21117, USA
(Received 16 January 2008; Accepted 10 May 2008)
ABSTRACTThe types and quality of data needed to determine relationships between chronic whole effluent toxicity (WET) test results
and in-stream biological condition were evaluated using information collected over a 1.5-y period from 6 different sites
across the United States. A data-quality-objectives approach was used that included several proposed measurement quality
objectives (MQOs) that specified desired precision, bias, and sensitivity of methods used. The 6 facilities used in this study (4
eastern and 2 western United States) all had design effluent concentrations .60% of the stream flow. In addition to at least
quarterly chronic Ceriodaphnia dubia, Pimephales promelas (fathead minnow), and Selenastrum capricornutum (green
algae) WET tests, other tests were conducted to address MQOs, including splits, duplicates, and blind positive and negative
controls. Macroinvertebrate, fish, and periphyton bioassessments were conducted at multiple locations upstream and
downstream of each facility. The test acceptance criteria of the US Environmental Protection Agency (USEPA) were met for
most WET tests; however, this study demonstrated the need to incorporate other MQOs (minimum and maximum percent
significant difference and performance on blind samples) to ensure accurate interpretation of effluent toxicity. More false
positives, higher toxicity, and more ‘‘failed’’ (noncompliant) tests were observed using no-observed-effect concentration
(NOEC) as compared to the IC25 endpoint (concentration causing �25% decrease in organism response compared to
controls). Algae tests often indicated the most effluent toxicity in this study; however, this test was most susceptible to false
positives and high interlaboratory variability. Overall, WET test results exhibited few relationships with bioassessment results
even when accounting for actual effluent dilution. In general, neither frequency of WET noncompliance nor magnitude of
toxicity in tests were significantly related to differences in biological condition upstream and downstream of a discharge.
Periphyton assessments were most able to discriminate small changes downstream of the effluent, followed by
macroinvertebrates and fish. Although sampling methods were robust, more replicate samples collected upstream and
downstream of each facility were needed to increase detection power. In general, macroinvertebrate and periphyton
assessments together appeared to be sufficient to address project objectives.
Keywords: Whole effluent toxicity Bioassessment Chronic toxicity Data quality objectives
INTRODUCTIONAs part of the goal of the US Environmental Protection
Agency (USEPA) to ensure that designated beneficial uses ofthe nation’s surface waters are met, whole effluent toxicity(WET) testing has been required in the National PollutantDischarge Elimination System permits for many industrialand municipal dischargers. Such tests are used as 1 line ofevidence, in addition to chemical and biological monitoring,to determine whether a permitted discharge or surface watermeets water quality standards and is protective of aquatic lifeuses. Like chemical criteria that are based on toxicologicalresponses of aquatic organisms to a chemical of interest, WETresults are used because they are thought to indicate potentialeffects of a discharge on aquatic life condition (USEPA 1991).Given that WET tests are standardized (i.e., not site-specific)laboratory analyses that rely on responses of indicator species,the way in which WET test results are integrated in NationalPollutant Discharge Elimination System permitting and theways that WET compliance limits are derived have beencontroversial issues. The crux of this controversy lies in thedifficulty in relating WET test results to effects on biologicalcommunities in a receiving stream. Indeed, the problem of
relating any laboratory-based result to actual field community
responses has been one of the most intriguing yet challengingquestions in ecology (e.g., Cairns 1986; Chapman 1995; Ellis
et al. 2002) and applied biology (Barbour et al. 1996; Walleret al. 1996; Ankley 1997; LaPoint and Waller 2000).
While there have been several previous attempts toexamine relationships between WET results and biological
condition (Eagleson et al. 1990; USEPA 1991; Dickson et al.1992, 1996), these studies used outdated test methods with
unspecified data quality and generally targeted sites known tohave acute toxicity issues (Marcus and McDonald 1992).
Previous research by the authors (Diamond et al. 1999;Diamond and Daley 2000) examined this issue using WET
and biological data compiled from over 90 sites across theUnited States that met strict quality control and other site
selection criteria. Although some relationships between WETresults and biological condition were observed in that study(predictably, when effluent flow dominated the downstream
flow under normal flow conditions and when acute toxicitywas evident), results were somewhat inconclusive because 1)
few sites had all of the appropriate WET and bioassessmentdata needed for a rigorous statistical analysis, 2) WET test
methods used in that study were still outdated in many cases,and 3) bioassessment methods and resulting data were not
always of sufficient quality given more recent knowledgeregarding the assessment of biological condition.
* To whom correspondence may be addressed:[email protected]
Published on the Web 7/2/2008.
Integrated Environmental Assessment and Management — Volume 4, Number 4—pp. 456–470456 � 2008 SETAC
Case
Stu
dy

Given results of previous research, the authors concluded
that data collected using the most current and rigorousprotocols are necessary to better define relationships betweenWET and biological conditions in streams. This study wasdesigned using a data-quality-objectives (DQO) approach
(Diamond, Stribling, et al. 2002; USEPA 2006), whichincluded the evaluation of proposed measurement qualityobjectives (MQOs) that were identified on the basis oftechnical input from scientists in federal, state, and private
organizations. In developing MQOs, it became apparent thatseveral aspects of WET and biological assessment protocolslacked documented and accepted data quality parameters
with which reasonable DQOs and MQOs could be estab-lished (Diamond et al. 1996, Diamond, Stribling, et al. 2002).Based on this finding, a pilot case study was conducted, usingdata collected at a few sites to test suggested DQOs and
MQOs, prior to implementing a full study of the relationshipbetween WET test results and in-stream biological conditions.
The goal of the current study was to determine how acomprehensive study should be designed to adequately
address relationships between WET and in-stream biologicalcondition. The objectives of this study were 1) to evaluate theability of biological assessments and WET tests to meetproposed DQOs and MQOs, 2) to determine the appropriate
biological assemblages and evaluate the sampling protocols,and 3) to determine the minimum amount of WET andbiological assessment data needed to adequately addressproject DQOs. The results of this study are intended to
provide answers to technical design questions raised byresearchers regarding the relationship between WET and in-stream biological condition. The results of this study should
enable interested parties to determine the most appropriatedesign for a definitive study.
METHODS
Facilities
Six facilities (4 eastern and 2 western United States)
participated in this study, all having design effluent concen-trations .60% of the stream under base flow conditions(Table 1). Previous work by Diamond and Daley (2000)indicated that relationships between WET results and in situ
bioassessment condition were strongest in effluent-dominatedstreams. Criteria for inclusion were the following:
� Effluent discharges to a wadable freshwater receivingbody (so that standardized bioassessment methods couldbe applied at the site).� No point or nonpoint source discharges within 1 km
upstream and downstream of the discharge (to rule outother sources of stress as much as possible).� The effluent preferably makes up a substantial portion of
the stream flow under base flow conditions so thatdownstream effects, if observed, have a high likelihood ofbeing associated with the effluent.� The facility was able to measure or estimate instanta-
neous flow conditions (to calculate actual dilution at timeof WET testing).� The facility is already required to conduct some WET
testing to help defray study costs.
All these facilities routinely conduct some type of chronicWET testing. The 6 facilities were located in 5 different states(4 different USEPA regions), and effluent design flows rangedin size from 1.5 to 185 million gallons per day (MGD). Whilemonthly WET testing was desired to obtain representativeWET data for each facility, only 1 facility conducted WETtests monthly (in accordance with their permit condition).Most states require quarterly or less frequent WET testing inpermits.
DQOs
Data quality objectives are qualitative and quantitativestatements that clarify the intended use of the data, define thetype of data needed to support the decision, identify theconditions under which the data should be collected, andspecify tolerable limits on the probability of making a decisionerror due to uncertainty in the data (if applicable) (USEPA2006). Data quality objectives for WET testing and bioassess-ment included measures of accuracy, power, and representa-tiveness (Table 2). These DQOs were selected on the basis ofa literature review of quality control indicators used in WETtesting and bioassessments as well as comments from peerreviewers and the Methods and Data Comparability Board(http://acwi.gov/methods) during the design of this pilotstudy (Diamond, Stribling, et al. 2002).
Table 1. Summary of participating facilities including influent/effluent characteristics, treatment plant characteristics, aswell as previous toxicity and whole effluent toxicity (WET) test frequency. MGD ¼ millions of gallons per day; IWC ¼ in-
stream waste concentration under design low-flow conditions; Cd ¼ Ceriodaphnia dubia; Pp ¼ Pimephales promelas
Facilitycode
EPAregion
Type of facility(industry ormunicipal)
Design flow(MGD)
Design IWC(%)
Hydraulicretentiontime (h)a
Chronic toxicity in12 months previous
to projectWET
frequencyWET
species
1 8 Municipal 36.3 62.3 12 No Quarterly Cd; Pp
2 8 Municipal 185 98.6 12 No Monthly Cd; Pp
3 2 Municipal 2.5 93 87.6 Yesb (Cd) Quarterly Cd
4 3 Municipal 1.5 86.5 16 No Quarterlyc Cd; Pp
5 4 Municipal 6.2 97 Not reported Yes (Cd) Quarterly Cd
6 4 Industrial 3.0 100 Not reported No Quarterly Cd; Ppa Hydraulic retention time is the average time wastewater is within the treatment facility.b Reported toxicity was due to lab error; facility has apparently been in compliance.c Conducted only on permit renewal, every 5 years.
WET as an Indicator of Aquatic Life Condition—Integr Environ Assess Manag 4, 2008 457

MQOs
WET—For WET tests, MQOs include quantitative statistics
for test precision, bias, and sensitivity. Several MQOs for
WET tests are specified as test acceptability criteria (Table 3).
Where such criteria are lacking in the methods, criteria
suggested by researchers or USEPA were used. The latterinclude sensitivity MQOs such as percent minimum signifi-cant difference (PMSD) thresholds (Denton and Norberg-King 1996; USEPA 2000c, 2002) and precision MQOs suchas coefficient of variation (CV) criteria for monthly referencetoxicant test results (Moore et al. 2000; USEPA 2000a;
Table 2. Summary of data quality objectives (DQOs) used to evaluate whole effluent toxicity (WET) and biologicalassessment protocols in this study
DQO Bioassessment WET testing
Accuracy Frequency of metric agreement with assess-ment (based on chemical and physical data)of site impairment �85%
Endpoint generated in performance evaluation(PE) testing 630% of mean value deter-mined for sample. Determined through la-boratory participation in PE testing
Power Detect �15% change in metric and index va-lues 90% of the time with 90% confidence
Ability to detect a 25% decrease in organismresponse 90% of the time with 90% confi-dence
Representativeness Sampling methods provide data that representthe actual stream community
Results represent overall condition of effluentthroughout the year
Table 3. Measurement quality objectives for whole effluent toxicity (WET) tests
Test acceptabilitycriteria
Toxicity testmeasurement parameter
Measurementquality objectives
Intratest parameters
Yes Control survival (Ceriodaphnia dubia and Pimephales promelas)a �80%
Yes Mean individual fish weight after a 7-d perioda �0.25 mg dry weight
Yes C. dubia offspring per adult femalea �15 within 7 d; �60 % controlshave �3 broods within 7 d
Yes Selenastrum capricornutum mean cell density in controla .1 3 106 cells/ml
No Percent minimum significant difference (PMSD) for P. promelascontrol growth (intralaboratory)b
�35%
No PMSD for C. dubia chronic control reproductionb �37%
No PMSD for S. capriconutum control growthb �20%
Intertest variability
No Coefficient of variation (CV) for monthly reference toxicant testendpointsc
�35%
No Split testing of effluent sample; CV for endpointsc �35%
Intralaboratory variability
No Duplicate testing of effluent sample; % difference for endpoints �35%
False positives/false negatives
No Split testing of method blank or positive control between labs:CV of endpointsd
�35%
No Associated reference toxicant test yields endpoint of the long-term averaged
635%
No False-negative testing yields endpoints indicating toxicity ,100%
No False-positive testing yields endpoints indicating no toxicity �100%a Grothe et al. (1996); USEPA 2000a, 2002).b USEPA (2000c, 2002).c Grothe et al. (1996); Moore, et al. (2000); USEPA (2000a); Warren-Hicks et al. (2000).d Moore et al. (2000); USEPA (2000a).
458 Integr Environ Assess Manag 4, 2008—J Diamond et al.

Warren-Hicks et al. 2000). Bias MQOs were addressedthrough results of blind sample WET tests (positive andnegative controls) and split tests. Results of WET testsconducted by laboratories in this pilot were analyzed inrelation to the MQOs in Table 3.
Bioassessment—Field-based biological assessments are aseries of methodological steps combined into an applicationas a protocol. Therefore, MQOs are most appropriately
established for each step. Not all performance characteristicsare applicable to each step of the assessment process (Table4). For the biological assessments used in this study, the stepswere the following:
1) Field sampling2) Laboratory sorting and subsampling
3) Taxonomy
4) Enumeration5) Data entry
6) Metric calculation (i.e., data reduction)
Certain types of MQOs, such as precision, could be
addressed through quantitative criteria, while other MQOscould be addressed only qualitatively through quality controlprocedures. Quantitative MQOs were obtained from otherreported field studies (Emery and Thomas 2003; Stribling etal. 2003, 2008).
WET testing—Chronic WET tests were performed usingCeriodaphnia dubia, Pimephales promelas, and Selenastrumcapricornutum (currently Pseudokirchneriella subcapitatga).
Sample collection, holding times, and WET test proceduresfollowed current USEPA protocols (USEPA 2002). A total of6 laboratories conducted Ceriodaphnia and fathead minnowtests in this study, while 2 laboratories conducted the algalWET tests for all facilities. All laboratories routinely conduct
the type of tests for which they supplied data. Physicochem-ical data collected during a WET test (e.g., dissolved oxygen,temperature) were reviewed to ensure that these parametersdid not fall outside acceptable ranges set by the respectiveprotocol (USEPA 2002).
An important aspect of this study was the inclusion of blindsamples, duplicate testing, and split-sample testing for eacheffluent. Because of budget constraints, each of these analyseswas conducted once during the project and used to address
project MQOs, such as relative percent of false-positive/false-negative results and precision for each type of WET test. 2different blind tests were conducted in this study. False-
positive rate of WET test measurements was examinedthrough the use of the sample blank results. The blank
consisted of reconstituted moderately hard water (85 mg/Lhardness, 60 mg/L alkalinity) using the protocol in USEPA(2002) and deionized water (Barnstead E-Pure, 18 mohm
resistivity). A single batch of the blank sample was preparedand then split into 6 subsamples (1 for each facility), placed in
clean nalgene cubitainers, and then shipped overnight on iceto the respective laboratories. All facilities, with the exceptionof facility 3, were able to conduct testing using the blank
sample. False-negative rate was evaluated through the use of asecond blind sample, a positive control, consisting of a copper
sulfate solution (6.2 mg/L). Reagent-grade copper sulfate wasdissolved in deionized water, thoroughly mixed, and then
portioned out into nalgene bottles that were then shipped torespective labs. All facilities were able to conduct testingusing the positive control sample. To ensure consistency of
both blind sample tests, each facility was given instructions onhow to dilute each blind sample and prepare test concen-
trations. Precision of WET test measurements (both intra- andinterlaboratory) were evaluated by examining results ofduplicate and split tests, respectively.
Bioassessment Methods
Field sampling—Bioassessments were conducted at each
facility for fish, macroinvertebrate, and periphyton assemb-lages. Protocols for each type of bioassessment followed those
given in the USEPA’s protocols (Barbour et al. 1999). Streamsampling was performed within 3 km above the discharge andwithin 3 km below the edge of the chronic mixing zone or the
dilution point dictated by the facility’s compliance limit forWET testing. This was to ensure that downstream effects, if
they occur, were properly attributed to the effluent discharge.To supplement biological data, habitat assessment data and in-stream physicochemical data (pH, dissolved oxygen, temper-
ature, and conductivity) were collected simultaneously, usingthe USEPA’s protocols (Barbour et al. 1999).
Biological samples were taken at multiple points through-out a sample reach for each assemblage. For macroinverte-
Table 4. Summary of measurement quality objectives (MQOs) used to evaluate biological assessment protocols in this study
Protocol componentPerformance
characteristic addressed MQO
Field sampling Precision (intrateam and interteam) Metric value: ,15%
Metric score: ,5%
Index score: ,15%
Representativeness Sample produces data representing biota that over-all stream habitat has the capacity to support
Sorting and subsampling Accuracy (of aliquot) Relative percent difference (RPD) ,5% (for composi-tion metrics between aliquot and total sample);percent sorting efficiency for macroinvertebrates.90% PSE in �90% of the samples
Taxonomy Accuracy Standard identification protocol
Precision Percent taxonomic disagreement (PTD) ,12%
WET as an Indicator of Aquatic Life Condition—Integr Environ Assess Manag 4, 2008 459

brate and periphyton assessments, the sampling reach wasdefined as 30 times the wetted stream width, or a minimumof 150 m. For fish assessments, a stream reach was 12 timesthe wetted width. In this study, all facilities could be sampledupstream of the discharge with the exception of facility 6,which had no flow above the discharge point. At this facility,samples were taken from 2 reference streams within thesame ecoregion that previously have been used by thisfacility. At facility 5, 90-m reaches (the distance upstreamand downstream of the discharge) were used rather than alarger reach as proposed because of a dredging operationlocated downstream, which would have fallen within 2sampling sites given the desired reach length specifications.
Macroinvertebrates were sampled using a 0.3-m 595-lm-mesh D-frame net by kicking the substrate or jabbing the netinto all available in-stream habitats in the proportion thatthey occur (Barbour et al. 1999). Macroinvertebrate samplingwas performed in the summer at 3 locations above (or in areference reach for facility 6) and 3 locations below eachdischarge, each location separated by 15 to 25 m.
Fish sampling was conducted at least 1 d after macro-invertebrate sampling using backpack electroshockers and ateam of 4 to 5 samplers. Larger streams required 2 teams forfish sampling. An average of 8 person-hours were spentsampling each reach. Fish were identified in the field bytrained fish biologists. All fish assessments were made using 1pass of each reach (i.e., sampling was not replicated for thisassemblage because of logistical and budgetary constraints).Fish were enumerated and identified in the field. Voucherspecimens were taken back to the laboratory to verify fieldidentifications in a few cases.
Periphyton sampling was completed by scraping orbrushing periphyton from rocks, wood, or plants into awhite plastic pan (Barbour et al. 1999). Samples were thenrinsed, and approximately 250 mL of the sample werecollected and composited in each reach. The compositedsample was then poured into sample containers andhomogenized; 10 mL were removed from the fully mixedcomposited sample for chlorophyll a analysis, and another100 mL were removed and preserved with formalin solutionfor enumeration. Samples were transported to appropriatelabs for processing. Chlorophyll a samples were filteredwithin 24 h of collection and stored in airtight containers,48C prior to analysis. Periphyton samples were countedseparately as soft-body algae and diatoms. Soft-body algaewere identified to at least genus level, and diatoms wereidentified to species level.
Macroinvertebrate sample processing—Macroinvertebrateswere sorted and subsampled using protocols in Barbour etal. (1999). The target number of organisms for identificationwas 200 6 20% (160–240). Samples with less than 160organisms in the entire sample were noted as such.
Bias of invertebrate laboratory sorting and subsampling wasevaluated by characterizing percent sorting efficiency as givenby Stribling et al. (2008):
PSE2 ¼A
Aþ B1
� �3 100
where A represents the number of organisms originally foundand B1 represents the number of organisms found in externalQC.
Taxonomic precision was evaluated by calculating percenttaxonomic disagreement (PTD) between genus level taxo-
nomic results from 2 independent taxonomists using thefollowing equation:
PTD ¼ 1� Comppos
N
� �� �3 100
where Comppos is the number of agreements and N is the totalnumber of organisms in the larger of the 2 counts. The lowerthe PTD value, the more similar are sample taxonomic resultsand the greater the overall taxonomic precision.
Data Analysis
WET testing—The number and percentage of invalid tests(based on acceptance criteria and MQOs) was compiled foreach test type and all labs combined. Effluent test precisionwas analyzed by computing percent minimum significantdifferences (USEPA 2000c, 2002) for the C. dubia and P.promelas tests in the study.
Chronic WET test endpoints were calculated using 2different analysis approaches: 1) a hypothesis-testing (e.g.,analysis of variance) approach, which yields a no-observed-effect concentration (NOEC) and a lowest-observed-effectconcentration (LOEC), using the USEPA’s statistical protocol(USEPA 2002), and 2) linear interpolation, following USEPA(2000c), which identifies the effluent concentration thatyields a 25% reduction in response as compared to controls(e.g., a 25% decrease in growth), or the IC25. Given theprominence of both types of statistical endpoints in WETtesting, this study examined MQOs and other aspects of WETdata in light of both approaches. Statistics were calculatedusing the software ToxCalc� (Tidepool Software, McKinley-ville, CA, USA).
WET results were evaluated by assessing whether each testwas a ‘‘pass’’ or a ‘‘fail.’’ Pass/fail assessments were defined onthe basis of both design and actual effluent dilutionconditions for each test. Design effluent dilution is asteady-state condition based on low stream flow as indicatedin the facility’s permit. Actual effluent dilution was the ratioof effluent to receiving stream flow measured at the time oftesting. In each case, both NOEC and IC25 values forsurvival and sublethal endpoints (e.g., growth, reproduction)were compared with design or actual effluent dilution for afacility to determine whether a test was ranked as a ‘‘pass’’ or‘‘fail.’’ Both the frequency and the magnitude of ‘‘failed’’WET tests under design and actual dilution conditions weresubject to correlation analyses with biological data for eachfacility to determine relationships between WET and bio-logical data. Magnitude was addressed by converting NOECor IC25 values to toxicity units expressed as 100/NOEC orIC25.
Bioassessment analyses—Both multivariate and metricanalyses of bioassessment data were performed to evaluate1) the degree to which MQOs were met, 2) whether differenttypes of biological assessments yield similar and thereforeredundant results, and 3) whether both macroinvertebrateassessment protocols (i.e., sampling, sorting, and analysismethods) used in this project are similar in terms of theirresultant data quality and ability to meet desired DQOs andMQOs.
Similarity of species composition and biological metricsbetween samples within a reach and between reaches wasanalyzed using a variety of multivariate analyses. The degreeof similarity observed among upstream samples for a givenassemblage indicated the precision of the method and
460 Integr Environ Assess Manag 4, 2008—J Diamond et al.

identified the degree of difference needed to detect asignificant change in the assemblage downstream. The degreeof similarity between upstream and downstream samples for agiven facility indicated the degree of biological change in anassemblage. Further analyses were conducted to determinewhat type of change was observed and whether much or all ofthe change could be attributed to changes in flow or othernon–water quality factors between upstream and downstreamat a given site.
Percent abundance of fish, macroinvertebrate, or periph-yton taxa in each sample was used in separate ordinationanalyses using nonmetric multidimensional scaling (NMDS)to determine similarity among samples based on Bray–Curtissimilarity of taxonomic composition for each assemblage(McCune and Grace 2002). Multiple response permutationprocedure (MRPP) (McCune and Grace 2002) was used toexamine the heterogeneity within groups and differencesamong groups and to determine significance of results. Formacroinvertebrates, several common metrics used by thestates in which facilities were located were calculated usingthe Ecological Data Application System database for eachbenthic sample. These metrics included the best candidatemetrics as described in Barbour et al. (1999).
Similarity metric values were calculated using Euclideandistance (McCune and Grace 2002), and these similarities werecompared both among upstream sites above each facility (tocalculate precision) and between upstream and downstreamsites for each facility using NMDS and MRPP. Blocked MRPPtests were used to test the differences between paired up-stream–downstream samples for each method and betweenupstream samples alone for each method. Similar NMDS andMRPP comparisons of fish species composition and commonindex of biotic integrity metrics (Karr and Chu 1999) betweenupstream and downstream samples and among upstreamsamples only were also performed. For periphyton, total densityand taxa richness were calculated and compared betweenupstream and downstream samples and among upstreamsamples using the nonparametric Mann–Whitney U test. Otheralgal metrics used included percent tolerant taxa and percentsensitive taxa based on tables given in Barbour et al. (1999).
In addition to the previously described approach, we alsoexamined differences in combined metric values betweenupstream and downstream samples for a given facility basedon macroinvertebrate and fish samples to determine whetherchanges observed represent potential impairment for eitherassemblage. In addition, examination of metrics and particularspecies as well as physical habitat information were used tohelp identify whether observed changes in assemblagecharacteristics could be due to differences in flow or otherhabitat factors as opposed to water quality changes.
For both fish and macroinvertebrates, a suite of the metricscommonly used by many states (Barbour et al. 1999; Karr andChu 1999), was calculated, many of which are used by thestates in which facilities were located and address bothstructural and functional attributes. To allow the metrics to beaggregated to a single site score, metric values for each samplewere converted to a 100-point scale using the followingformula:
x 3100
Amax
where x is the calculated metric value and Amax is themaximum value for a metric observed among all samples for a
given facility. For metrics that increase in the presence ofstressors, the final value was derived as follows:
100� x 3100
Amax
� �
Overall site scores (xtot) were obtained by averaging the scaledmetric scores for a given assemblage and site.
Precision of field sampling was determined for each of the 3assemblages using the CV for sample data obtained fromduplicate reaches upstream of the outfall at each facility.Calculations were based on individual metric values as well asthe overall site score.
Relating WET and bioassessment results—Relationshipsbetween WETand biological assessment results were analyzedfor each WET test and biological assessment type comparison(9 comparisons in all—3 WET test types and 3 biologicalassessment types). As described previously, each WET testendpoint has a percent ‘‘fail’’ rate (i.e., effects were observedat test concentrations at or below the facility’s in-streamwaste concentration). These fail rates were compared witheach biological assessment metric ‘‘impaired’’ rate to deter-mine the extent of overlap. ‘‘Impaired’’ status was assigned ifNMDS and MRPP analyses indicated a significant change in ametric or species composition between upstream and down-stream samples and the change was ecologically meaningfulbased on metric analyses (e.g., a decrease in a pollution-sensitive metric downstream as compared to upstream). Inaddition, we examined the degree to which each WET testtype result was consistent with its ‘‘corresponding’’ biologicalassessment type: Selenastrum with periphyton biologicalassessment, Ceriodaphnia with macroinvertebrate assessment,and fathead minnow with the fish assessment. These analysesused the ‘‘fail’’ rate based on both design conditions and actualdilution conditions.
RESULTS
WET
Test acceptability criteria were met in nearly all tests in thisstudy. The few invalid tests were rerun in the same quarter oftesting, and rerun tests met method test acceptability criteria.Reference toxicant tests for each laboratory indicated com-pliance with WET protocols and toxicity endpoints that werewithin control limits. Effluent tests conducted by the 6facilities yielded some chronic toxicity to at least 1 of the 3test species (Figure 1). The S. capricornutum test yielded themost toxicity for 5 of the 6 facilities. The mean NOECendpoints were often lower (i.e., indicated greater toxicity)than the corresponding IC25 endpoint (Figure 1), indicatingthat in some cases the difference between control and effluentcorresponded to ,25% effect. Sublethal endpoints were oftenlower than endpoints based on survival in the case of C. dubiaand P. promelas tests.
Most tests exhibited satisfactory replication such that therecommended MQOs for PMSD were met by most labs(Table 5). This was particularly true for the P. promelas and S.capricornutum tests. The C. dubia tests displayed somewhathigher PMSDs with 8 out of a total of 34 tests (34%)exhibiting a PMSD greater than the MQO of 37% (Table 5).A relationship did not necessarily exist between the labs thatmet the MQO for intertest precision in reference toxicanttests and the MQOs for effluent test precision.
WET as an Indicator of Aquatic Life Condition—Integr Environ Assess Manag 4, 2008 461

Duplicate testing in each laboratory produced repeatable
test results. However, nearly all samples conducted in
duplicate testing by each facility were nontoxic to both C.dubia and P. promelas (NOECs and IC25s �100% effluent).
This study can not address whether similar replication of
results for these species tests is expected with effluents that
have more inherent toxicity. The S. capricornutum test was
subjected to duplicate testing for 2 facilities—1 with a toxic
effluent and 1 with a nontoxic effluent—and both sets of tests
exhibited fairly high agreement.
Out of the 12 chronic tests conducted in false-positive
testing, 1 C. dubia test, 2 P. promelas tests, and all (i.e., 2) S.capricornutum tests resulted in reported toxicity (Table 5).
The C. dubia and P. promelas false positives were based on
NOEC values only; no false positives were observed based on
IC25. The toxicity observed using the algae test and
reconstituted moderately hard water in this study was
unexpected.
False-negative testing (using a toxic blind sample) yielded
some false negatives, particularly for the C. dubia test (Table
5). Out of the 14 tests conducted in this analysis, there were 3
that reported no toxicity in the sample using the C. dubia test,
in which the toxic concentration was designed to be at the
high end of the test concentration series (75%–90% of the
sample). Examining both lethal and sublethal endpoints for
each test, no false negatives were observed based on either the
fish or the algae test, in which a toxic concentration was
designed to be in the midrange of the test concentration
Figure 1. Mean and range of sublethal no-observed-effect concentration (NOEC) and IC25 (concentration causing �25% decrease in organism responsecompared to controls) endpoint values observed for each facility over a year of testing.
462 Integr Environ Assess Manag 4, 2008—J Diamond et al.

series. For the C. dubia test, half the 6 labs reported thesample as nontoxic (NOEC or IC25 ¼ 100%), and half thelabs reported the sample as toxic (NOEC¼25%–50% or IC25¼ 30%–65%). If the C. dubia results observed in this projectare representative of WET labs in general, these analysesindicate the importance of test performance in affecting WETpass/fail interpretations for effluents that are toxic at a highereffluent concentration.
Split testing of effluent samples indicated disparate resultsin some cases (Table 5). The MQO for this analysis was a,35% difference in endpoints between laboratories for thesplit-sample tests, but this was not met in many of the tests,particularly for sublethal endpoints. The algae test resulted inthe poorest agreement between the 2 labs, and C. dubia hadthe best agreement (Table 5). Generally, IC25 values betweenlabs were within 50% of each other, while NOEC values wereoften within 60% of each other.
The variability in endpoint values reported in split testingcould translate to differences between passing and failing aWET test in some cases. Laboratory results for each facilitywere compared with the facility’s WET limit or triggerconcentration (based on design dilution in-stream) todetermine whether a given laboratory result would beassessed as a ‘‘pass’’ (in compliance) or a ‘‘fail’’ (not incompliance). The algal growth test generated the mostcontradictory results between laboratories (Figure 2). Forboth types of WET endpoints (IC25 or NOEC), 4 out of 6split tests yielded contradictory interpretations between thelaboratories. For the fish WET split tests, results lead tocontradictory interpretations half the time based on either theIC25 or the NOEC. The C. dubia WET test yielded the mostreproducible results in split-sample testing, with 1 out of 6facility tests yielding contradictory interpretations using IC25and 2 out of 6 yielding contradictory interpretations using theNOEC.
Both C. dubia and P. promelas survival endpoints resulted inpredominantly passing results for most facilities when basedon actual effluent dilution conditions (Figure 3). This wasespecially true when IC25 endpoints were used. Comparisonswith limits or trigger concentrations based on design effluentdilution produced more ‘‘failed’’ tests than when compared toactual dilution concentrations as expected. Sublethal end-points resulted in more ‘‘failed’’ tests than survival endpoints,using either IC25 or NOEC values, especially when comparedto limits based on design effluent dilution. Based on typicaldesign flow permit limits, facilities had proportionally thehighest ‘‘failed’’ test rate based on the Selenastrum test,followed by the P. promelas test and the C. dubia test(Diamond et al. 2006).
Bioassessments
No one type of biological assemblage appeared to be,consistently, the most sensitive in this study. All 3 types ofbioassessments exhibited effects at different sites, withperiphyton exhibiting effects at the most sites (Table 6).Precision estimates, based on upstream metric scores ormultivariate similarity, were highest for the macroinverte-brate bioassessment protocol, followed by periphyton andthen fish (range of CVs ¼ 2%–30%, 0.9%–7.2%, and 30%–55%, respectively).
Laboratory processing of macroinvertebrate samples metMQOs for sorting efficiency (accuracy) and taxonomicprecision (percent taxonomic disagreement) for 5 of the 6
facilities (PTD ¼ 1.8% and PSE ¼ 95.4%, respectively). Thelaboratory processing samples for 1 facility did not meet theMQOs initially but after corrective action did producesatisfactory data quality.
Figure 4 illustrates data for 2 algal metrics that differedsignificantly between upstream and downstream reaches atsome of these facilities. Similarity and ordination analysesindicated significant differences in algal species compositionbetween upstream and downstream reaches at 5 of the 6facilities (Table 6). Macroinvertebrate assemblage composi-tion was significantly altered downstream at 2 of the 6 sitesexamined (A statistic, p , 0.05; Table 6). Metrics that weremost indicative of downstream effects at these sites were totaltaxa, EPT taxa, and percent dominance. Fish composition wassignificantly altered downstream at only 1 of the 6 sites (Astatistic; p , 0.05, Table 6). Based on results of all bioassess-ments, 3 of the 6 sites exhibited adverse effects for 2 out ofthe 3 assemblages examined (Table 6), suggesting impairmentdownstream of these discharges.
Most facilities had similar habitat upstream and down-stream of the discharge as hoped, but habitat quantity orquality did vary for 1 arid west facility (facility 2), perhapsconfounding biological assessment results for that facility. Amore comprehensive study would need more careful selectionof sites to ensure that habitat changes (not caused by thedischarge) upstream and downstream are minimal or can beaccounted for through other means.
Relationships Between WET and Bioassessments
Based on all WET tests completed at each facility, thereappeared to be little or no relationship between thepercentage of ‘‘failed’’ tests and bioassessment results overall(Table 6; r¼�0.27, p¼ 0.64). For example, 4 facilities havingbetween 6.7% and 58.3% ‘‘failed’’ WET tests were allassociated with some form of periphyton ‘‘impairment’’downstream. Furthermore, the facility with the lowest WETpercent ‘‘failed’’ rate (6.7% for facility 6) was the only onethat exhibited significant changes in fish assemblage con-dition.
Little evidence was seen of relationships consideringspecific WET test types and analogous bioassessment assemb-lages as well (Figure 5). The WET test results for S.capricornutum appeared to be unrelated to observed changesin periphyton assemblage downstream of facilities (t¼ 0.67, p¼ 0.54). Facility 6, which reported no algal toxicity in WETtesting, exhibited a significant decrease in periphytoncondition compared to reference sites, while facility 5, whichreported high toxicity to S. capricornutum, exhibited nosignificant changes in periphyton assemblage condition.
Little evidence of relationships was also apparent based oneither macroinvertebrates or fish (Figure 5). Facility 2, whichhad a ‘‘failed’’ test rate of 50% for the P. promelas test (basedon NOECs), showed little change in the fish assemblageupstream and downstream, while facility 6, which failed 1 outof 5 fish tests, exhibited apparent impairment to the fishassemblage.
Magnitude of toxicity appeared to be somewhat correlatedto bioassessment results. Using actual effluent dilution at thetime of testing, facility 6 exhibited the most toxicity (16chronic toxicity units [TUc]) in terms of either C. dubia or P.promelas tests, while facilities 1 and 5 had TUcs all ,1.0. Thelatter 2 facilities exhibited no observed detrimental biologicalchanges downstream, and facility 6 exhibited significant
WET as an Indicator of Aquatic Life Condition—Integr Environ Assess Manag 4, 2008 463
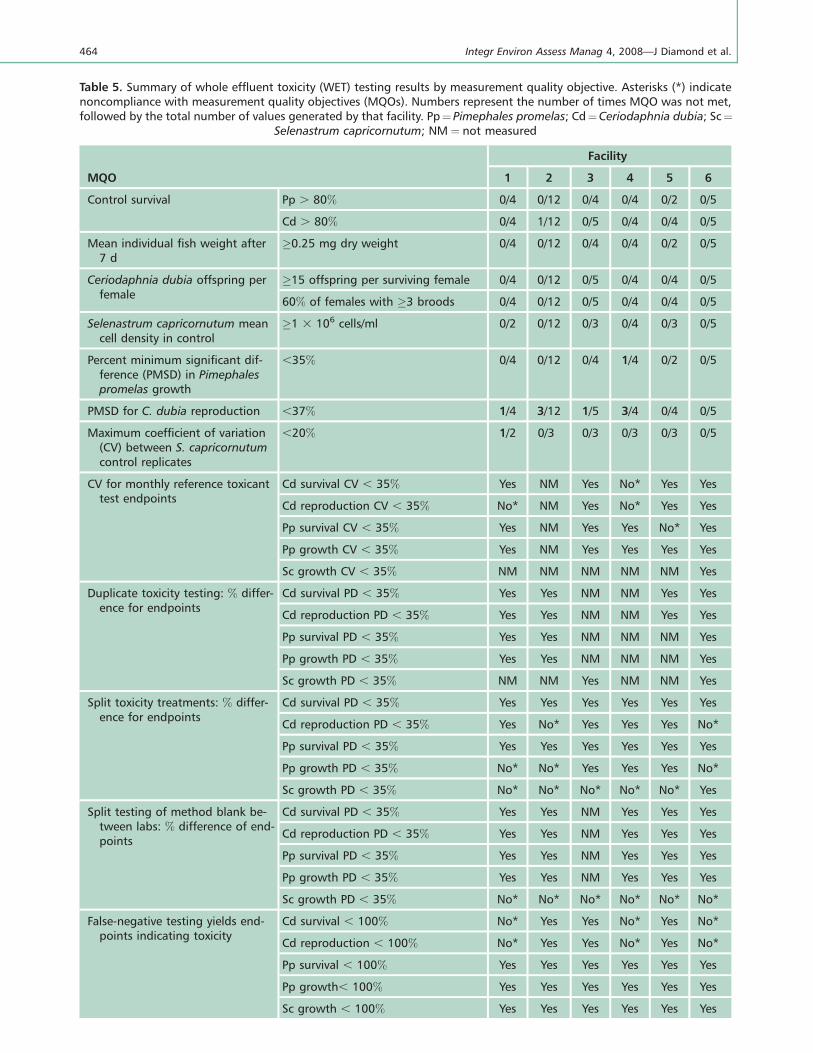
Table 5. Summary of whole effluent toxicity (WET) testing results by measurement quality objective. Asterisks (*) indicatenoncompliance with measurement quality objectives (MQOs). Numbers represent the number of times MQO was not met,followed by the total number of values generated by that facility. Pp¼ Pimephales promelas; Cd¼Ceriodaphnia dubia; Sc¼
Selenastrum capricornutum; NM¼ not measured
MQO
Facility
1 2 3 4 5 6
Control survival Pp . 80% 0/4 0/12 0/4 0/4 0/2 0/5
Cd . 80% 0/4 1/12 0/5 0/4 0/4 0/5
Mean individual fish weight after7 d
�0.25 mg dry weight 0/4 0/12 0/4 0/4 0/2 0/5
Ceriodaphnia dubia offspring perfemale
�15 offspring per surviving female 0/4 0/12 0/5 0/4 0/4 0/5
60% of females with �3 broods 0/4 0/12 0/5 0/4 0/4 0/5
Selenastrum capricornutum meancell density in control
�1 3 106 cells/ml 0/2 0/12 0/3 0/4 0/3 0/5
Percent minimum significant dif-ference (PMSD) in Pimephalespromelas growth
,35% 0/4 0/12 0/4 1/4 0/2 0/5
PMSD for C. dubia reproduction ,37% 1/4 3/12 1/5 3/4 0/4 0/5
Maximum coefficient of variation(CV) between S. capricornutumcontrol replicates
,20% 1/2 0/3 0/3 0/3 0/3 0/5
CV for monthly reference toxicanttest endpoints
Cd survival CV , 35% Yes NM Yes No* Yes Yes
Cd reproduction CV , 35% No* NM Yes No* Yes Yes
Pp survival CV , 35% Yes NM Yes Yes No* Yes
Pp growth CV , 35% Yes NM Yes Yes Yes Yes
Sc growth CV , 35% NM NM NM NM NM Yes
Duplicate toxicity testing: % differ-ence for endpoints
Cd survival PD , 35% Yes Yes NM NM Yes Yes
Cd reproduction PD , 35% Yes Yes NM NM Yes Yes
Pp survival PD , 35% Yes Yes NM NM NM Yes
Pp growth PD , 35% Yes Yes NM NM NM Yes
Sc growth PD , 35% NM NM Yes NM NM Yes
Split toxicity treatments: % differ-ence for endpoints
Cd survival PD , 35% Yes Yes Yes Yes Yes Yes
Cd reproduction PD , 35% Yes No* Yes Yes Yes No*
Pp survival PD , 35% Yes Yes Yes Yes Yes Yes
Pp growth PD , 35% No* No* Yes Yes Yes No*
Sc growth PD , 35% No* No* No* No* No* Yes
Split testing of method blank be-tween labs: % difference of end-points
Cd survival PD , 35% Yes Yes NM Yes Yes Yes
Cd reproduction PD , 35% Yes Yes NM Yes Yes Yes
Pp survival PD , 35% Yes Yes NM Yes Yes Yes
Pp growth PD , 35% Yes Yes NM Yes Yes Yes
Sc growth PD , 35% No* No* No* No* No* No*
False-negative testing yields end-points indicating toxicity
Cd survival , 100% No* Yes Yes No* Yes No*
Cd reproduction , 100% No* Yes Yes No* Yes No*
Pp survival , 100% Yes Yes Yes Yes Yes Yes
Pp growth, 100% Yes Yes Yes Yes Yes Yes
Sc growth , 100% Yes Yes Yes Yes Yes Yes
464 Integr Environ Assess Manag 4, 2008—J Diamond et al.

changes in 2 of the 3 assemblages. Examining magnitude in
terms of WET test type and the analogous biological
assemblage yielded mixed results in terms of significant
relationships. Facility 5 exhibited the highest toxicity to S.
capricornutum (based on actual effluent dilution [14.4 TUc]),
but detrimental changes were not observed downstream.
Facility 1 exhibited fairly high toxicity to C. dubia and P.promelas (2.5 and 2.4 TUc, respectively) but did not have
Figure 2. Comparison of split-test results in terms of test passing or failing permit limits, with respect to IC25 (concentration causing �25% decrease inorganism response compared to controls)and no-observed-effect concentration (NOEC) values reported by the laboratories for each type of test: Ceriodphniadubia, Pimephales promelas, and Selenastrum capricornutum.
Table 5. Continued
MQO
Facility
1 2 3 4 5 6
False-positive testing yields end-points indicating no toxicity
Cd survival , 100% Yes Yes NM Yes Yes Yes
Cd reproduction , 100% Yes Yes NM Yes Yes No*
Pp survival , 100% Yes Yes NM Yes Yes Yes
Pp growth, 100% Yes Yes NM No* Yes No*
Sc growth , 100% No* No* No* No* No* No*
Associated reference toxicant testyields endpoint of the long-term average
Cd survival 6 35% 2/12 NM 1/12 1/10 0/4 1/13
Cd reproduction 6 35% 6/12 NM 0/12 9/10 0/4 1/13
Pp survival 6 35% 1/12 NM 0/14 2/11 15/27 2/13
Pp growth 6 35% 1/12 NM 1/14 2/11 7/27 0/13
Sc growth 6 35% NM NM NM NM NM 2/7
WET as an Indicator of Aquatic Life Condition—Integr Environ Assess Manag 4, 2008 465

observed detrimental changes in either the macroinvertebrateor fish assemblages downstream.
Some relationships between WET and biological effectsmay have been observed at facilities 2 and 6. Facility 2,which had the highest observed toxicity to C. dubia in thisstudy (15 TUc), also exhibited a significant decrease in themacroinvertebrate index downstream. Facility 6, whichexhibited the highest toxicity to P. promelas in this study(15 TUc based on NOEC), had a significant decrease in thefish assemblage index downstream. However, both of thesefacilities had perhaps the most striking differences betweenupstream and downstream habitats, with facility 2 having adifference of about 70 cfs between upstream and down-stream and facility 6 having reference sites and no upstream.Thus, a full study would need to have much more intensivesampling upstream and downstream and a more thoroughunderstanding of reference condition for the downstreamsites being examined.
DISCUSSIONResults of this pilot study demonstrate the importance of
obtaining high-quality WET and bioassessment data prior tomaking compliance determinations for a permitted waste-water effluent discharge. Although only 6 wastewaterdischargers and their WET laboratories were involved in thisstudy, it appears that compliance with test acceptance
criteria, while necessary and important, is not sufficient for
evaluating laboratory performance and data quality forfreshwater chronic WET tests. Other quality control criteria
(many of which are recommended by USEPA [2000c] andGrothe et al. [1996]) are needed to ensure that correct test
interpretations are made. These other criteria (or MQOs as
termed in this study) include minimum and maximumpercent minimum significant difference (PMSD), minimum
accuracy thresholds as determined in routine testing of blind
negative and positive control samples, and recognition of test–test endpoint variability and varying test organism sensitivity,
as evidenced by reference toxicant test endpoint intertest
precision.
Many of the MQOs recommended in this study have beenpresented previously (Gulley et al. 2000; Shukla et al. 2000;
USEPA 2000c, 2002). The suggested alternative WET analysispresented in Chapman et al. (1996), for example (which
requires meeting PMSD criteria prior to use and comparison
with bioequivalence endpoints prior to interpretation; Shuklaet al. 2000), appears to be a useful start toward obtaining
higher-quality WET data. For example, for the C. dubia tests
conducted in this project, an MQO of PMSD ,50% wasfeasible (approximately 90% of all the tests conducted met
this MQO); however, caution should be used in accepting
such a PMSD for this test method. Other work hasdemonstrated that, using a larger sample of laboratories and
Figure 3. Comparison of test ‘‘failures’’ (i.e., noncompliance with whole effluent toxicity [WET] limit) based on design and actual flow conditions.
466 Integr Environ Assess Manag 4, 2008—J Diamond et al.

WET tests, 90% of the tests could achieve a PMSD �37%
(USEPA 2000c).
It appears likely that use of an analysis framework thatincludes performance criteria such as PMSD (Chapman et al.
1996; USEPA 2000c) would address some of the disparityobserved in this study in interpretations of WET results based
on either NOECs or IC25. Without such an analysis frame-work, this study suggests that interpretations of WET ‘‘pass’’
or ‘‘fail’’ are very dependent on which type of statisticalendpoint is used. Results of this study demonstrate that both
NOEC and IC25 can yield questionable assessments of WETfor a given sample if acceptable test variability is not
controlled via some form of defensible criteria. The greenalgae WET test (S. capricornutum) results appeared suspect in
this study because of a high false-positive rate and poor
agreement in split testing, yet these tests consistently met all
test acceptance criteria. While these results might be afunction of the laboratories involved in this study, further
evaluation of routine laboratory performance of the 4-dfreshwater algal WET test is warranted.
It should be emphasized that the bioassessment analyses
were based on changes in biological assemblages upstream anddownstream of a given facility. To the extent that upstream
sites are severely impaired because of other sources upstream,effects of an effluent on downstream sites would not be easily
distinguishable using this analysis (LaPoint and Waller 2000).As reference conditions were not sampled in this study
(except at facility 6), upstream biological condition, in anabsolute sense, could not be determined. This comparison
might be useful in a full study to determine the degree of
Figure 4. Comparison of percent tolerant or intolerant periphyton species observed in periphyton samples collected upstream and downstream of selectfacilities. Percent tolerant and sensitive algal taxa were determined based on Bahls (1993). Nonmetric Mann–Whitney U test was used to test differencesbetween the 2 groups.
Table 6. Summary of whole effluent toxicity (WET) and bioassessment results from the 6 facilities. þ¼ no detrimentalchange downstream; –¼ detrimental change observed downstream. Cd¼ Ceriodaphnia dubia; Pp¼ Pimephales promelas;
Sc ¼ Selenastrum capricornutum
Facility
Percent tests ‘‘failed’’a Bioassessment results
Cd Pp Sc TotalTotalalgaeb Periphyton
Macro-invertebrates Fish Total
1 25 25 100 40 20 – þ þ 1
2 25 50 100 44 37.5 – – þ 2
3 25 75 100 58.3 44.4 – þ þ 1
4 0 25 100 36.3 12.5 – – þ 2
5 0 0 100 33.3 0 þ þ þ 0
6 0 20 0 6.7 10.0 – þ – 2a ‘‘Failed’’ tests are those WET tests that reported endpoints not meeting the facility WET limit or trigger concentration under either designor actual flow conditions.
b Total percentage of only C. dubia and P. promelas tests that ‘‘failed.’’
WET as an Indicator of Aquatic Life Condition—Integr Environ Assess Manag 4, 2008 467

biological change that could be distinguished relative toupstream conditions (i.e., the sensitivity of the bioassessmentprotocol). In this study, most facilities had relatively goodquality upstream habitats and no known sources of toxicitywithin at least 3 km upstream of each facility. However, somefish metric results suggested only fair conditions upstream(e.g., facility 2) based on typical reference conditions for theregion, suggesting the need for more careful assessmentapproaches in a full study depending on the upstreamconditions. This study indicates that an upstream–down-stream biological assessment approach should incorporatereplicate samples in the design to improve confidence in theassessment of a discharge.
This study also highlighted several challenges in accuratelyassessing in situ biological effects of an effluent discharge.While lab processing and field replication generally metMQOs for periphyton and macroinvertebrate data, otherMQOs, such as calibrated indicators for the ecoregion ofinterest (Barbour et al. 1999) and adequate bioassessmentsensitivity, need further attention (Diamond et al. 1996).Indeed, many state programs have begun to characterize andrefine their bioassessment programs, which promises toimprove the rigor and sensitivity of these methods. Fishbioassessments were less precise in general than eitherperiphyton or macroinvertebrate assessments, and theyrequire more field effort. However, fish assessments in generalhave routinely proved to be extremely informative (Emeryand Thomas 2003; Yoder and DeShon 2003) and form thebackbone of many monitoring programs. Lower fish bioassess-ment performance in this study indicates the need for morereplicate samples at a given location and probably the use of
additional measures, such as fish condition or biomass, tomake this assemblage more sensitive (Yoder and DeShon2003). For the purposes of relating WET to in-streambiological condition, though, it appears that both macro-invertebrate and periphyton assessments at a site will addressimpacts that might occur to fish as well. Notwithstanding thepreliminary nature of these results, periphyton and macro-invertebrate assessments were more effective than fish inindicating an impact.
It is important to note that this pilot study was not designedto examine a broad range of discharge settings that exist in theUnited States. For example, most of the facilities examinedwere located on smaller streams (to ensure relatively loweffluent dilution most of the time) in suburban or semiruralareas. Results reported by Dyer and Wang (2002) and byDiamond, Bressler, et al. (2002) indicate a higher propensityof adverse effects downstream of wastewater treatment plantsin urban areas as compared to those located in rural areas.Thus, a full study should address a variety of discharge settings(e.g., urban, suburban, rural) to develop a better under-standing of relationships between WET results and in situbiological condition.
Many reasons may exist for observing a lack of relationshipbetween WET test and biological assessment results asidefrom quality control issues or data quality. Quarterly WETtesting as conducted by most of the facilities (and required inmost permits) may be too infrequent to provide representa-tive toxicity potential of a discharge. It would be useful tocompare results based on different monitoring frequencies todetermine the frequency below which uncertainty, in terms ofeffluent toxicity, exceeds resource management needs. Pre-
Figure 5. Box plots of the percent ‘‘failed’’whole effluent toxicity (WET) tests, by test type, as a function of the number of assemblage types showing some formof decrease in biological condition downstream of a facility. Cd¼Ceriodphnia dubia; Pp¼Pimephales promelas, Sc¼ Selenastrum capricornutum. The figure inthe lower right represents the relationship between total percent WET test ‘‘fails’’ and the number of biological assemblages showing detrimental effects.
468 Integr Environ Assess Manag 4, 2008—J Diamond et al.

sumably, this will depend on effluent variability for a facilityas measured by WET tests, which, in turn is dependent in parton laboratory performance as demonstrated in this pilot study.
In addition, as noted by USEPA (1991) and other sources(Waller et al. 1996; LaPoint and Waller 2000), WET testsmeasure toxicity in the water column. Effects on ecologicalresources may occur because of many other effluent-relatedcauses, such as excess nutrients (stimulating or changingperiphyton assemblages), bioaccumulative chemicals, highflows, or impacts resulting from sediment interactions witheffluents. None of these effects can be measured in WETtests. Therefore, some form of causal analysis or stressoridentification framework (e.g., USEPA 2000b) should be usedin conjunction with WET and bioassessment information tohelp determine whether effluent toxicity has caused or iscapable of causing downstream impairment.
This case study demonstrated ways in which WET resultscould be compared with biological condition, but the resultsobserved here should not be considered a definitive assess-ment of relationships between the 2 types of monitoring.Because this was a pilot study, it was not designed todetermine definitive relationships between WET results andbiological condition. Certain factors examined in this study,such as type of statistical endpoint (NOEC vs IC25),magnitude of toxicity versus frequency of WET limitexceedance, and use of design low flow versus actual effluentdilution in interpreting WET results, all had some influenceon relationships observed (or not) with in situ biologicalconditions. These factors should be examined in futurestudies to identify ways to more accurately interpret WETtest results.
Acknowledgments—Chad Barbour, Jonathan Bearr, and LeeYarbrough assisted in conducting and analyzing toxicitytests. Collin Hill, Adam Rettig, Carolina Gallardo, JessicaGarrish, and Chad Barbour assisted in field sampling andmacroinvertebrate sample processing. Scott Hall and SteveCanton provided additional toxicity testing and field sam-pling assistance. Lei Zheng provided analyses of periphytondata. The researchers are indebted to the cooperativeassistance of the staff of 6 anonymous treatment facilities.Tom LaPoint, Robin Autenrieth, Rodney Cruze, MichaelLewis, Scott Belanger, and Gary Chapman provided usefulinsights on study design and data analyses. This research wasfunded by Water Environment Research Foundation, grant03-ECO-2T.
REFERENCESAnkley G. 1997. Laboratory vs field measurement endpoints: A contaminated
sediment perspective. In: Ingersoll C, Dillon T, Biddinger G, editors. Ecological
risk assessment of contaminated sediments. Pensacola (FL): SETAC. p 115–
122.
Bahls L. 1993. Periphyton bioassessment methods for Montana streams. Helena
(MT): Montana Water Quality Bureau, Department of Health and Environ-
mental Science.
Barbour MT, Diamond JM, Yoder CO. 1996. Biological assessment strategies:
Applications and limitations. In: Grothe DR, Dickson KL, Reed-Judkins DK,
editors. Whole effluent toxicity testing: An evaluation of methods and
prediction of receiving system impacts, Pensacola (FL): SETAC. p 245–270.
Barbour MT, Gerritsen J, Snyder BD, Stribling JB. 1999. Rapid bioassessment
protocols for use in streams and wadeable rivers: Periphyton, benthic
macroinvertebrates and fish. 2nd ed. Washington DC: US Environmental
Protection Agency, Office of Water. EPA 841-B-99-002.
Cairns Jr J. 1986. What is meant by validation of predictions based on laboratory
toxicity tests? Hydrobiologia 137:271–278.
Chapman P. 1995. Extrapolating laboratory toxicity results to the field. Environ
Toxicol Chem 14:927–930.
Chapman G, Anderson B, Bailer AJ, Baird R, Berger R, Burton D, Denton D,
Goodfellow W, Heber M, McDonald L, Nurberg-King T, Ruffier P. 1996.
Methods and appropriate endpoints. In: Grothe DR, Dickson KL, Reed-Judkins
DK, editors. Whole effluent toxicity testing: An evaluation of methods and
prediction of receiving system impacts, Pensacola (FL): SETAC. p 51–82.
Denton D, Norberg-King T. 1996. Whole effluent toxicity statistics: A regulatory
perspective. In: Groethe DR, Dickson KL, Reed DK, editors. Whole effluent
toxicity testing: An evaluation of methods and predictability of receiving
system responses. Pensacola (FL): SETAC. p 83–102.
Diamond J, Bressler D, Serveiss V. 2002. Assessing relationships between human
land use and the decline of native mussels, fish, and macroinvertebrates in the
Clinch and Powell Rover Watershed, USA. Environ Toxicol Chem 21:1147–
1155.
Diamond J, Daley C. 2000. What is the relationship between whole effluent
toxicity results and biological condition? Environ Toxicol Chem 19:158–168.
Diamond J, Daley C, Moore T. 1999. Evaluating whole effluent toxicity testing as
an indicator of instream biological conditions. Alexandria (VA): Water
Environment Research Foundation. 95-HHE-1.
Diamond J, Stribling JB, Barbour MT. 1996. Characterizing and comparing
bioassessment approaches and their results: A perspective. J N Am Benthol
Soc 15:713–727.
Diamond J, Stribling J, Marino C. 2002. Study design: Comparing WET to
biological assessments. Alexandria (VA): Water Environment Research
Foundation. Project 00-ECO-5.
Dickson KL, Waller WT, Kennedy JH, Ammann LP. 1992. Assessing the relationship
between ambient toxicity and instream biological response. Environ Toxicol
Chem 11:1307–1322.
Dickson KL, Waller WT, Kennedy JH, Ammann LP, Guinn R, Norberg-King TJ. 1996.
Relationships between effluent toxicity, ambient toxicity, and receiving system
impacts: Trinity River dechlorination case study. In: Grothe DR, Dickson KL,
Reed-Judkins DK, editors. Whole effluent toxicity testing: An evaluation of
methods and prediction of receiving stream impacts. Pensacola (FL): SETAC. p
287–308.
Dyer S, Wang X. 2002. A comparison of stream biological responses to discharge
from wastewater treatment plants in high and low population density areas.
Environ Toxicol Chem 21:1065–1075.
Eagleson K, Lenat D, Ausley L, Winborne F. 1990. Comparison of measured
instream biological responses with responses predicted by Ceriodaphnia
chronic toxicity tests. Environ Toxicol Chem 9:1019–1028.
Ellis J, Cummings V, Hewitt J, Thrush S, Norkko A. 2002. Determining effects of
suspended sediment on condition of a suspension feeding bivalve (Atrina
zelandica): Results of a survey, a laboratory experiment and a field transplant
experiment. J Exp Mar Biol Ecol 267:147–174.
Emery E, Thomas J. 2003. A method for assessing outfall effects on great river fish
populations: The traveling zone approach. In: Simon T, editor. Biological
response signatures: Indicator patterns using aquatic communities. Boca
Raton (FL): CRC. p 157–164.
Groethe DR, Dickson KL, Reed-Judkins DK, editors. 1996. Whole effluent toxicity
testing: An evaluation of methods and prediction of receiving system impacts.
Pensacola (FL): SETAC.
Gulley J, Baird R, Markle P, Bottomley J. 2000. Effect-based interpretation of
toxicity test data using probability and comparison with alternative methods
of analysis. Environ Toxicol Chem 19:133–140.
Karr J, Chu E. 1999. Restoring life in running waters. Washington DC: Island.
La Point TW, Waller WT. 2000. Field assessments in conjunction with whole
effluent toxicity testing. Environ Toxicol Chem 19:14–24.
Marcus M, McDonald L. 1992. Evaluating the statistical bases for relating receiving
water impacts to effluent and ambient toxicities. Environ Toxicol Chem
11:1389–1402.
McCune BM, Grace JB. 2002. Analysis of ecological communities. Gleneden Beach
(OR): MjM Software Design.
Moore T, Canton S, Grimes M. 2000. Investigating the incidence of type 1 errors
for chronic whole effluent toxicity testing using Ceriodaphnia dubia. Environ
Toxicol Chem 19:118–122.
Shukla R, Wang Q, Fulk F, Deng C, Denton D. 2000. Bioequivalence approach for
whole effluent toxicity testing. Environ Toxicol Chem 19:169–174.
Stribling JB, Moulton II SR, Lester GL. 2003. Determining the quality of taxonomic
data. J N Am Benthol Soc 22:621–631.
WET as an Indicator of Aquatic Life Condition—Integr Environ Assess Manag 4, 2008 469

Stribling J, Jessup B, Feldman D. 2008. Precision of benthic macroinvertebrate
indicators of stream condition in Montana. J N Am Benthol Soc 27:58–67.
[USEPA] US Environmental Protection Agency. 1991. Technical support document for
water quality-based toxics control. Washington DC: USEPA. EPA-505/2-90-001.
[USEPA] US Environmental Protection Agency. 2002. Short-term methods for
estimating the chronic toxicity of effluents and receiving waters to freshwater
organisms. 4th ed. Washington DC: USEPA, Office ofWater. EPA-821-R-02-013.
[USEPA] US Environmental Protection Agency. 2000a. Preliminary report:
Interlaboratory variability study of EPA short-term chronic and acute whole
effluent toxicity test methods. Washington DC: USEPA, Office of Water. EPA-
821-R-00-028A.
[USEPA]USEnvironmental ProtectionAgency. 2000b. Stressor identification guidance
document. Washington DC: USEPA, Office of Water. EPA-822-B-00-025.
[USEPA] US Environmental Protection Agency. 2000c. Understanding and
accounting for method variability in whole effluent toxicity applications
under the NPDES program. Washington DC: USEPA, Office of Water. EPA 833-
R-00-003.
[USEPA] US Environmental Protection Agency. 2006. Guidance on systematic
planning using the data quality objectives process. Washington DC: USEPA.
EPA/240/B-06/001.
Waller T, Ammann L, Birge W, Dickson K, Dorn P, LeBlanc N, Mount D, Parkhurst B,
Preston HR, Schimmel S, Spacie A, Thursby G. 1996. Predicting instream
effects from WET tests. In: Grothe DR, Dickson KL, Reed-Judkins DK, editors.
Whole effluent toxicity testing: An evaluation of methods and prediction of
receiving system impacts. Pensacola (FL): SETAC. p 271–286.
Warren-Hicks W, Parkhurst B, Moore D, Teed R, Baird R, Berger R, Denton D, Pletl J.
2000. Assessment of whole effluent toxicity test variability: partitioning
sources of variability. Environ Toxicol Chem 19:94–104.
Yoder C, DeShon J. 2003. Using biological response signatures within a framework
of multiple indicators to assess and diagnose causes and sources of
impairments to aquatic assemblages in selected Ohio rivers and streams. In:
Simon T, editor. Biological response signatures: Indicator patterns using
aquatic communities. Boca Raton (FL): CRC. p 83–96.
470 Integr Environ Assess Manag 4, 2008—J Diamond et al.