Synthesis, Characterisation and Photocatalytic Activity ... - CORE
Upload
khangminh22Category
view
0download
0
materials
Review
Photocatalytic Technology for Palm Oil Mill Effluent (POME)Wastewater Treatment: Current Progress and Future Perspective
Wibawa Hendra Saputera 1,2,3,* , Aryan Fathoni Amri 1, Rahman Daiyan 4 and Dwiwahju Sasongko 1,3
�����������������
Citation: Saputera, W.H.; Amri, A.F.;
Daiyan, R.; Sasongko, D.
Photocatalytic Technology for Palm
Oil Mill Effluent (POME) Wastewater
Treatment: Current Progress and
Future Perspective. Materials 2021, 14,
2846. https://doi.org/10.3390/
ma14112846
Academic Editor: Juan M. Coronado
Received: 4 May 2021
Accepted: 24 May 2021
Published: 26 May 2021
Publisher’s Note: MDPI stays neutral
with regard to jurisdictional claims in
published maps and institutional affil-
iations.
Copyright: © 2021 by the authors.
Licensee MDPI, Basel, Switzerland.
This article is an open access article
distributed under the terms and
conditions of the Creative Commons
Attribution (CC BY) license (https://
creativecommons.org/licenses/by/
4.0/).
1 Research Group on Energy and Chemical Engineering Processing System, Department ofChemical Engineering, Faculty of Industrial Technology, Institut Teknologi Bandung, Jl. Ganesha No. 10,Bandung 40132, Indonesia; [email protected] (A.F.A.); [email protected] (D.S.)
2 Center for Catalysis and Reaction Engineering, Institut Teknologi Bandung, Jl. Ganesha No. 10,Bandung 40132, Indonesia
3 Research Center for New and Renewable Energy (PPEBT), Institut Teknologi Bandung, Jl. Ganesha No. 10,Bandung 40132, Indonesia
4 Particles and Catalysis Research Group, School of Chemical Engineering, Faculty of Engineering,The University of New South Wales, Sydney, NSW 2032, Australia; [email protected]
* Correspondence: [email protected]; Tel.: +62-82117686235
Abstract: The palm oil industry produces liquid waste called POME (palm oil mill effluent). POME isstated as one of the wastes that are difficult to handle because of its large production and ineffectivetreatment. It will disturb the ecosystem with a high organic matter content if the waste is disposeddirectly into the environment. The authorities have established policies and regulations in the POMEwaste quality standard before being discharged into the environment. However, at this time, thereare still many factories in Indonesia that have not been able to meet the standard of POME wastedisposal with the existing treatment technology. Currently, the POME treatment system is stillusing a conventional system known as an open pond system. Although this process can reducepollutants’ concentration, it will produce much sludge, requiring a large pond area and a longprocessing time. To overcome the inability of the conventional system to process POME is believedto be a challenge. Extensive effort is being invested in developing alternative technologies for thePOME waste treatment to reduce POME waste safely. Several technologies have been studied, suchas anaerobic processes, membrane technology, advanced oxidation processes (AOPs), membranetechnology, adsorption, steam reforming, and coagulation. Among other things, an AOP, namelyphotocatalytic technology, has the potential to treat POME waste. This paper provides informationon the feasibility of photocatalytic technology for treating POME waste. Although there are somechallenges in this technology’s large-scale application, this paper proposes several strategies anddirections to overcome these challenges.
Keywords: palm oil mill effluent; treatment technologies; photocatalytic degradation; photocatalyst;wastewater treatment
1. Introduction
Waste is a material produced from industrial or domestic (household) activities whoseexistence is often undesirable because it negatively impacts the environment. There arethree types of waste, including solid waste, liquid waste, and gas waste, which can beclassified into inorganic and organic waste. Based on the economic value, waste can beclassified into waste that has economic value and does not have economic value. Waste thathas economic value is waste that can be further processed to produce added-value products.Economic growth causes an increase in industrial activities and is a magnet for populationmovements increasing industrial and domestic waste. The increase of waste producedis proportional to an increase in a country’s gross domestic product (GDP). The sectorscontributing the most to Indonesia’s GDP include manufacturing, agriculture, forestry
Materials 2021, 14, 2846. https://doi.org/10.3390/ma14112846 https://www.mdpi.com/journal/materials
Materials 2021, 14, 2846 2 of 35
and fishery, wholesale and retail trade, construction, mining, and quarrying. Based onthe Indonesian statistical centers, forestry is the second largest contributor to GDP aftermanufacturing [1]. The forestry sector produces waste from three stage processes, includingpreharvest, harvest, and post-harvest processes. In Indonesia, one of the promising businesssectors in the forestry fields is the oil palm industry.
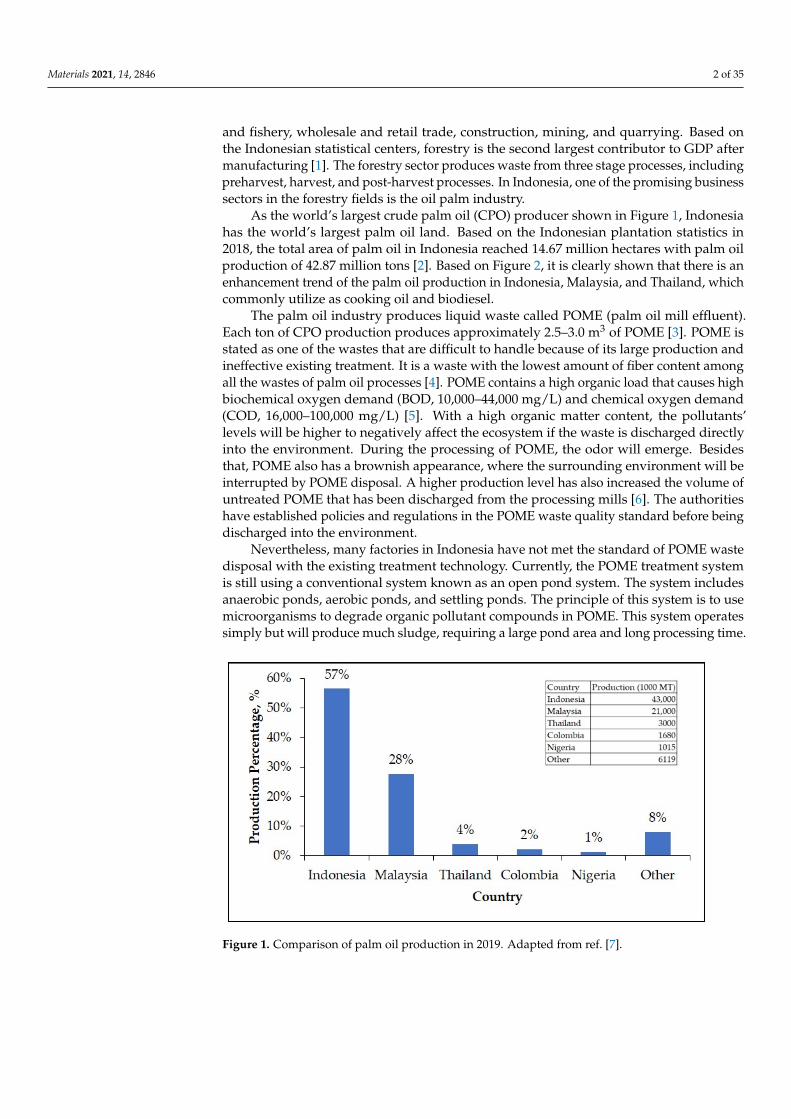
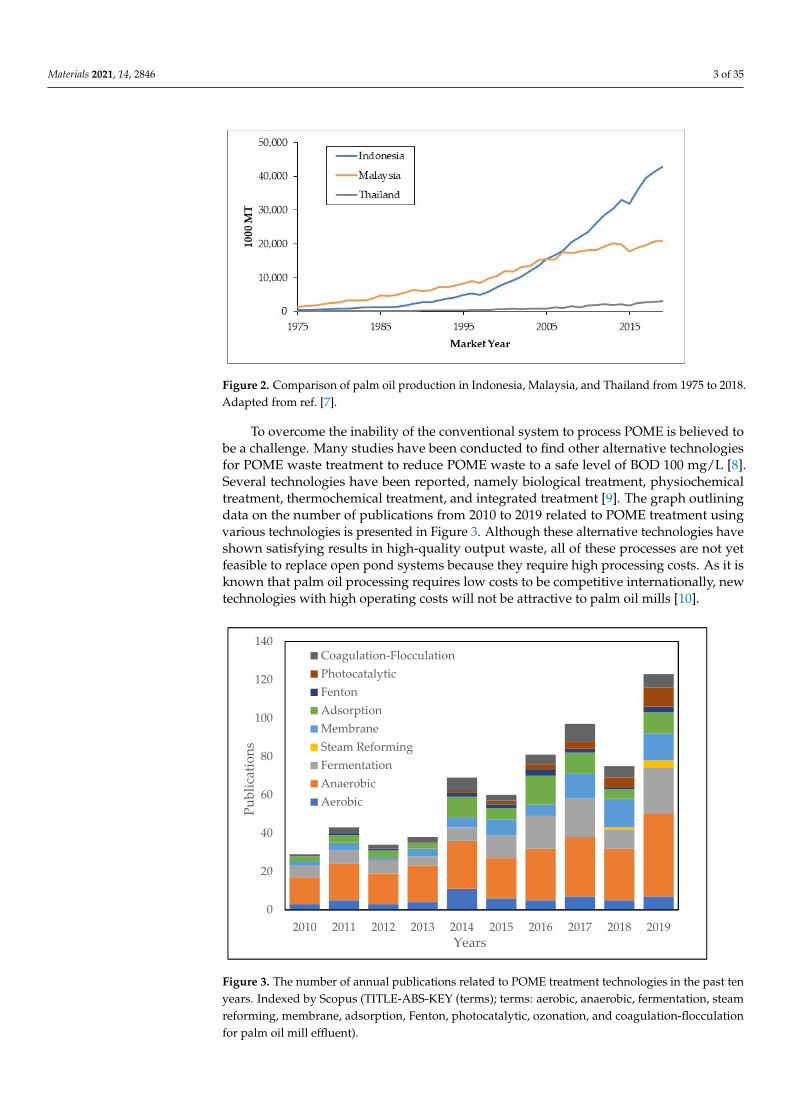
As the world’s largest crude palm oil (CPO) producer shown in Figure 1, Indonesiahas the world’s largest palm oil land. Based on the Indonesian plantation statistics in2018, the total area of palm oil in Indonesia reached 14.67 million hectares with palm oilproduction of 42.87 million tons [2]. Based on Figure 2, it is clearly shown that there is anenhancement trend of the palm oil production in Indonesia, Malaysia, and Thailand, whichcommonly utilize as cooking oil and biodiesel.
The palm oil industry produces liquid waste called POME (palm oil mill effluent).Each ton of CPO production produces approximately 2.5–3.0 m3 of POME [3]. POME isstated as one of the wastes that are difficult to handle because of its large production andineffective existing treatment. It is a waste with the lowest amount of fiber content amongall the wastes of palm oil processes [4]. POME contains a high organic load that causes highbiochemical oxygen demand (BOD, 10,000–44,000 mg/L) and chemical oxygen demand(COD, 16,000–100,000 mg/L) [5]. With a high organic matter content, the pollutants’levels will be higher to negatively affect the ecosystem if the waste is discharged directlyinto the environment. During the processing of POME, the odor will emerge. Besidesthat, POME also has a brownish appearance, where the surrounding environment will beinterrupted by POME disposal. A higher production level has also increased the volume ofuntreated POME that has been discharged from the processing mills [6]. The authoritieshave established policies and regulations in the POME waste quality standard before beingdischarged into the environment.
Nevertheless, many factories in Indonesia have not met the standard of POME wastedisposal with the existing treatment technology. Currently, the POME treatment systemis still using a conventional system known as an open pond system. The system includesanaerobic ponds, aerobic ponds, and settling ponds. The principle of this system is to usemicroorganisms to degrade organic pollutant compounds in POME. This system operatessimply but will produce much sludge, requiring a large pond area and long processing time.
Materials 2021, 14, x FOR PEER REVIEW 2 of 37
waste produced is proportional to an increase in a country’s gross domestic product (GDP). The sectors contributing the most to Indonesia’s GDP include manufacturing, ag-riculture, forestry and fishery, wholesale and retail trade, construction, mining, and quar-rying. Based on the Indonesian statistical centers, forestry is the second largest contributor to GDP after manufacturing [1]. The forestry sector produces waste from three stage pro-cesses, including preharvest, harvest, and post-harvest processes. In Indonesia, one of the promising business sectors in the forestry fields is the oil palm industry.
As the world’s largest crude palm oil (CPO) producer shown in Figure 1, Indonesia has the world’s largest palm oil land. Based on the Indonesian plantation statistics in 2018, the total area of palm oil in Indonesia reached 14.67 million hectares with palm oil pro-duction of 42.87 million tons [2]. Based on Figure 2, it is clearly shown that there is an enhancement trend of the palm oil production in Indonesia, Malaysia, and Thailand, which commonly utilize as cooking oil and biodiesel.
The palm oil industry produces liquid waste called POME (palm oil mill effluent). Each ton of CPO production produces approximately 2.5–3.0 m3 of POME [3]. POME is stated as one of the wastes that are difficult to handle because of its large production and ineffective existing treatment. It is a waste with the lowest amount of fiber content among all the wastes of palm oil processes [4]. POME contains a high organic load that causes high biochemical oxygen demand (BOD, 10,000–44,000 mg/L) and chemical oxygen de-mand (COD, 16,000–100,000 mg/L) [5]. With a high organic matter content, the pollutants’ levels will be higher to negatively affect the ecosystem if the waste is discharged directly into the environment. During the processing of POME, the odor will emerge. Besides that, POME also has a brownish appearance, where the surrounding environment will be in-terrupted by POME disposal. A higher production level has also increased the volume of untreated POME that has been discharged from the processing mills [6]. The authorities have established policies and regulations in the POME waste quality standard before be-ing discharged into the environment.
Nevertheless, many factories in Indonesia have not met the standard of POME waste disposal with the existing treatment technology. Currently, the POME treatment system is still using a conventional system known as an open pond system. The system includes anaerobic ponds, aerobic ponds, and settling ponds. The principle of this system is to use microorganisms to degrade organic pollutant compounds in POME. This system operates simply but will produce much sludge, requiring a large pond area and long processing time.
Figure 1. Comparison of palm oil production in 2019. Adapted from ref. [7]. Figure 1. Comparison of palm oil production in 2019. Adapted from ref. [7].
Materials 2021, 14, 2846 3 of 35Materials 2021, 14, x FOR PEER REVIEW 3 of 37
Figure 2. Comparison of palm oil production in Indonesia, Malaysia, and Thailand from 1975 to 2018. Adapted from ref. [7].
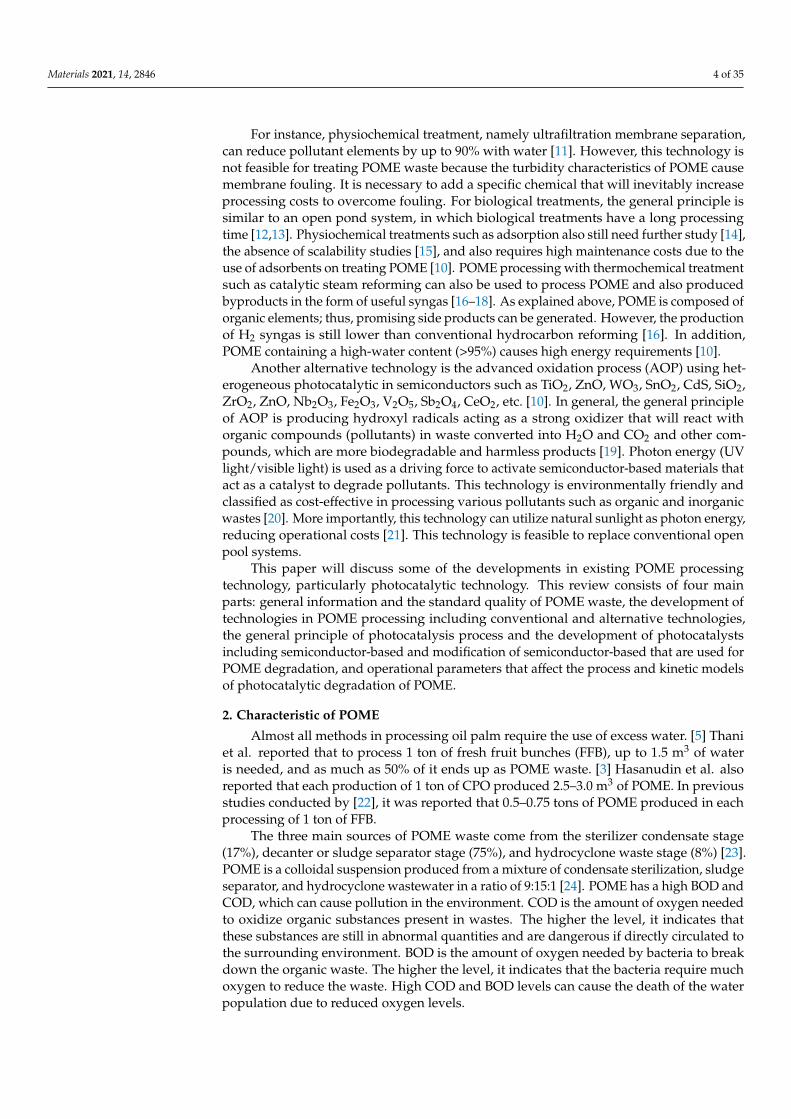
To overcome the inability of the conventional system to process POME is believed to be a challenge. Many studies have been conducted to find other alternative technologies for POME waste treatment to reduce POME waste to a safe level of BOD 100 mg/L [8]. Several technologies have been reported, namely biological treatment, physiochemical treatment, thermochemical treatment, and integrated treatment [9]. The graph outlining data on the number of publications from 2010 to 2019 related to POME treatment using various technologies is presented in Figure 3. Although these alternative technologies have shown satisfying results in high-quality output waste, all of these processes are not yet feasible to replace open pond systems because they require high processing costs. As it is known that palm oil processing requires low costs to be competitive internationally, new technologies with high operating costs will not be attractive to palm oil mills [10].
Figure 3. The number of annual publications related to POME treatment technologies in the past ten years. Indexed by Scopus (TITLE-ABS-KEY (terms); terms: aerobic, anaerobic, fermentation, steam reforming, membrane, adsorption, Fenton, photocatalytic, ozonation, and coagulation-floc-culation for palm oil mill effluent).
0
20
40
60
80
100
120
140
2019201820172016201520142013201220112010
Publ
icat
ions
Years
Coagulation-FlocculationPhotocatalyticFentonAdsorptionMembraneSteam ReformingFermentationAnaerobicAerobic
Figure 2. Comparison of palm oil production in Indonesia, Malaysia, and Thailand from 1975 to 2018.Adapted from ref. [7].
To overcome the inability of the conventional system to process POME is believed tobe a challenge. Many studies have been conducted to find other alternative technologiesfor POME waste treatment to reduce POME waste to a safe level of BOD 100 mg/L [8].Several technologies have been reported, namely biological treatment, physiochemicaltreatment, thermochemical treatment, and integrated treatment [9]. The graph outliningdata on the number of publications from 2010 to 2019 related to POME treatment usingvarious technologies is presented in Figure 3. Although these alternative technologies haveshown satisfying results in high-quality output waste, all of these processes are not yetfeasible to replace open pond systems because they require high processing costs. As it isknown that palm oil processing requires low costs to be competitive internationally, newtechnologies with high operating costs will not be attractive to palm oil mills [10].
Materials 2021, 14, x FOR PEER REVIEW 3 of 37
Figure 2. Comparison of palm oil production in Indonesia, Malaysia, and Thailand from 1975 to 2018. Adapted from ref. [7].
To overcome the inability of the conventional system to process POME is believed to be a challenge. Many studies have been conducted to find other alternative technologies for POME waste treatment to reduce POME waste to a safe level of BOD 100 mg/L [8]. Several technologies have been reported, namely biological treatment, physiochemical treatment, thermochemical treatment, and integrated treatment [9]. The graph outlining data on the number of publications from 2010 to 2019 related to POME treatment using various technologies is presented in Figure 3. Although these alternative technologies have shown satisfying results in high-quality output waste, all of these processes are not yet feasible to replace open pond systems because they require high processing costs. As it is known that palm oil processing requires low costs to be competitive internationally, new technologies with high operating costs will not be attractive to palm oil mills [10].
Figure 3. The number of annual publications related to POME treatment technologies in the past ten years. Indexed by Scopus (TITLE-ABS-KEY (terms); terms: aerobic, anaerobic, fermentation, steam reforming, membrane, adsorption, Fenton, photocatalytic, ozonation, and coagulation-floc-culation for palm oil mill effluent).
0
20
40
60
80
100
120
140
2019201820172016201520142013201220112010
Publ
icat
ions
Years
Coagulation-FlocculationPhotocatalyticFentonAdsorptionMembraneSteam ReformingFermentationAnaerobicAerobic
Figure 3. The number of annual publications related to POME treatment technologies in the past tenyears. Indexed by Scopus (TITLE-ABS-KEY (terms); terms: aerobic, anaerobic, fermentation, steamreforming, membrane, adsorption, Fenton, photocatalytic, ozonation, and coagulation-flocculationfor palm oil mill effluent).
Materials 2021, 14, 2846 4 of 35
For instance, physiochemical treatment, namely ultrafiltration membrane separation,can reduce pollutant elements by up to 90% with water [11]. However, this technology isnot feasible for treating POME waste because the turbidity characteristics of POME causemembrane fouling. It is necessary to add a specific chemical that will inevitably increaseprocessing costs to overcome fouling. For biological treatments, the general principle issimilar to an open pond system, in which biological treatments have a long processingtime [12,13]. Physiochemical treatments such as adsorption also still need further study [14],the absence of scalability studies [15], and also requires high maintenance costs due to theuse of adsorbents on treating POME [10]. POME processing with thermochemical treatmentsuch as catalytic steam reforming can also be used to process POME and also producedbyproducts in the form of useful syngas [16–18]. As explained above, POME is composed oforganic elements; thus, promising side products can be generated. However, the productionof H2 syngas is still lower than conventional hydrocarbon reforming [16]. In addition,POME containing a high-water content (>95%) causes high energy requirements [10].
Another alternative technology is the advanced oxidation process (AOP) using het-erogeneous photocatalytic in semiconductors such as TiO2, ZnO, WO3, SnO2, CdS, SiO2,ZrO2, ZnO, Nb2O3, Fe2O3, V2O5, Sb2O4, CeO2, etc. [10]. In general, the general principleof AOP is producing hydroxyl radicals acting as a strong oxidizer that will react withorganic compounds (pollutants) in waste converted into H2O and CO2 and other com-pounds, which are more biodegradable and harmless products [19]. Photon energy (UVlight/visible light) is used as a driving force to activate semiconductor-based materials thatact as a catalyst to degrade pollutants. This technology is environmentally friendly andclassified as cost-effective in processing various pollutants such as organic and inorganicwastes [20]. More importantly, this technology can utilize natural sunlight as photon energy,reducing operational costs [21]. This technology is feasible to replace conventional openpool systems.
This paper will discuss some of the developments in existing POME processingtechnology, particularly photocatalytic technology. This review consists of four mainparts: general information and the standard quality of POME waste, the development oftechnologies in POME processing including conventional and alternative technologies,the general principle of photocatalysis process and the development of photocatalystsincluding semiconductor-based and modification of semiconductor-based that are used forPOME degradation, and operational parameters that affect the process and kinetic modelsof photocatalytic degradation of POME.
2. Characteristic of POME
Almost all methods in processing oil palm require the use of excess water. [5] Thaniet al. reported that to process 1 ton of fresh fruit bunches (FFB), up to 1.5 m3 of wateris needed, and as much as 50% of it ends up as POME waste. [3] Hasanudin et al. alsoreported that each production of 1 ton of CPO produced 2.5–3.0 m3 of POME. In previousstudies conducted by [22], it was reported that 0.5–0.75 tons of POME produced in eachprocessing of 1 ton of FFB.
The three main sources of POME waste come from the sterilizer condensate stage(17%), decanter or sludge separator stage (75%), and hydrocyclone waste stage (8%) [23].POME is a colloidal suspension produced from a mixture of condensate sterilization, sludgeseparator, and hydrocyclone wastewater in a ratio of 9:15:1 [24]. POME has a high BOD andCOD, which can cause pollution in the environment. COD is the amount of oxygen neededto oxidize organic substances present in wastes. The higher the level, it indicates thatthese substances are still in abnormal quantities and are dangerous if directly circulated tothe surrounding environment. BOD is the amount of oxygen needed by bacteria to breakdown the organic waste. The higher the level, it indicates that the bacteria require muchoxygen to reduce the waste. High COD and BOD levels can cause the death of the waterpopulation due to reduced oxygen levels.
Materials 2021, 14, 2846 5 of 35
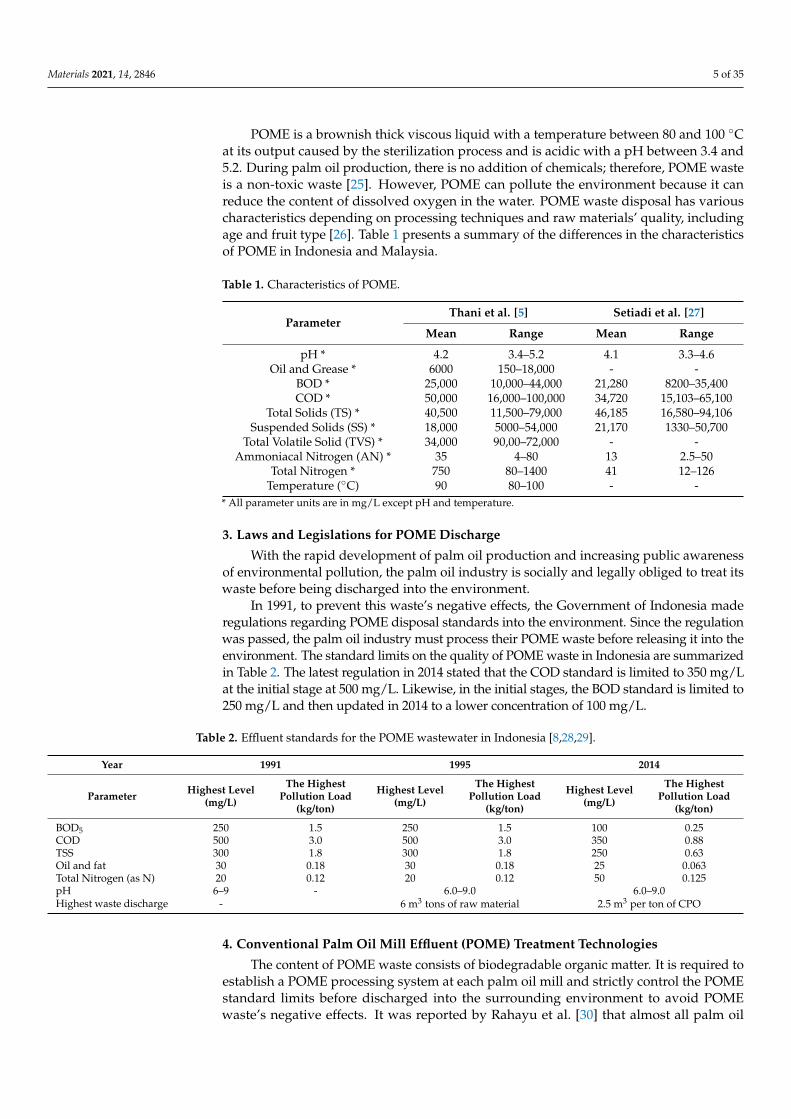
POME is a brownish thick viscous liquid with a temperature between 80 and 100 ◦Cat its output caused by the sterilization process and is acidic with a pH between 3.4 and5.2. During palm oil production, there is no addition of chemicals; therefore, POME wasteis a non-toxic waste [25]. However, POME can pollute the environment because it canreduce the content of dissolved oxygen in the water. POME waste disposal has variouscharacteristics depending on processing techniques and raw materials’ quality, includingage and fruit type [26]. Table 1 presents a summary of the differences in the characteristicsof POME in Indonesia and Malaysia.
Table 1. Characteristics of POME.
ParameterThani et al. [5] Setiadi et al. [27]
Mean Range Mean Range
pH * 4.2 3.4–5.2 4.1 3.3–4.6Oil and Grease * 6000 150–18,000 - -
BOD * 25,000 10,000–44,000 21,280 8200–35,400COD * 50,000 16,000–100,000 34,720 15,103–65,100
Total Solids (TS) * 40,500 11,500–79,000 46,185 16,580–94,106Suspended Solids (SS) * 18,000 5000–54,000 21,170 1330–50,700
Total Volatile Solid (TVS) * 34,000 90,00–72,000 - -Ammoniacal Nitrogen (AN) * 35 4–80 13 2.5–50
Total Nitrogen * 750 80–1400 41 12–126Temperature (◦C) 90 80–100 - -
* All parameter units are in mg/L except pH and temperature.
3. Laws and Legislations for POME Discharge
With the rapid development of palm oil production and increasing public awarenessof environmental pollution, the palm oil industry is socially and legally obliged to treat itswaste before being discharged into the environment.
In 1991, to prevent this waste’s negative effects, the Government of Indonesia maderegulations regarding POME disposal standards into the environment. Since the regulationwas passed, the palm oil industry must process their POME waste before releasing it into theenvironment. The standard limits on the quality of POME waste in Indonesia are summarizedin Table 2. The latest regulation in 2014 stated that the COD standard is limited to 350 mg/Lat the initial stage at 500 mg/L. Likewise, in the initial stages, the BOD standard is limited to250 mg/L and then updated in 2014 to a lower concentration of 100 mg/L.
Table 2. Effluent standards for the POME wastewater in Indonesia [8,28,29].
Year 1991 1995 2014
Parameter Highest Level(mg/L)
The HighestPollution Load
(kg/ton)
Highest Level(mg/L)
The HighestPollution Load
(kg/ton)
Highest Level(mg/L)
The HighestPollution Load
(kg/ton)
BOD5 250 1.5 250 1.5 100 0.25COD 500 3.0 500 3.0 350 0.88TSS 300 1.8 300 1.8 250 0.63Oil and fat 30 0.18 30 0.18 25 0.063Total Nitrogen (as N) 20 0.12 20 0.12 50 0.125pH 6–9 - 6.0–9.0 6.0–9.0Highest waste discharge - 6 m3 tons of raw material 2.5 m3 per ton of CPO
4. Conventional Palm Oil Mill Effluent (POME) Treatment Technologies
The content of POME waste consists of biodegradable organic matter. It is required toestablish a POME processing system at each palm oil mill and strictly control the POMEstandard limits before discharged into the surrounding environment to avoid POMEwaste’s negative effects. It was reported by Rahayu et al. [30] that almost all palm oil
Materials 2021, 14, 2846 6 of 35
mills in Indonesia use an open pond system in treating POME waste since the system hasadvantages from an economic point of view and the ease of operation.
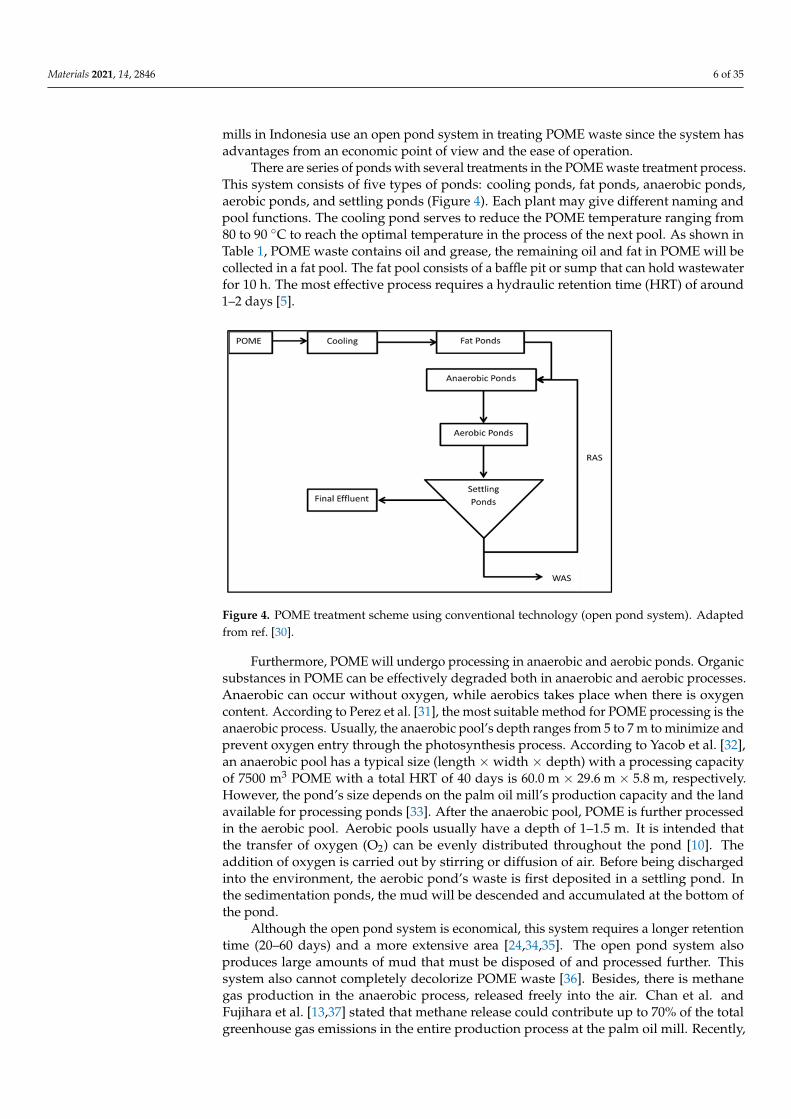
There are series of ponds with several treatments in the POME waste treatment process.This system consists of five types of ponds: cooling ponds, fat ponds, anaerobic ponds,aerobic ponds, and settling ponds (Figure 4). Each plant may give different naming andpool functions. The cooling pond serves to reduce the POME temperature ranging from80 to 90 ◦C to reach the optimal temperature in the process of the next pool. As shown inTable 1, POME waste contains oil and grease, the remaining oil and fat in POME will becollected in a fat pool. The fat pool consists of a baffle pit or sump that can hold wastewaterfor 10 h. The most effective process requires a hydraulic retention time (HRT) of around1–2 days [5].
Materials 2021, 14, x FOR PEER REVIEW 6 of 37
4. Conventional Palm Oil Mill Effluent (POME) Treatment Technologies The content of POME waste consists of biodegradable organic matter. It is required
to establish a POME processing system at each palm oil mill and strictly control the POME standard limits before discharged into the surrounding environment to avoid POME waste’s negative effects. It was reported by Rahayu et al. [30] that almost all palm oil mills in Indonesia use an open pond system in treating POME waste since the system has ad-vantages from an economic point of view and the ease of operation.
There are series of ponds with several treatments in the POME waste treatment pro-cess. This system consists of five types of ponds: cooling ponds, fat ponds, anaerobic ponds, aerobic ponds, and settling ponds (Figure 4). Each plant may give different naming and pool functions. The cooling pond serves to reduce the POME temperature ranging from 80 to 90 °C to reach the optimal temperature in the process of the next pool. As shown in Table 1, POME waste contains oil and grease, the remaining oil and fat in POME will be collected in a fat pool. The fat pool consists of a baffle pit or sump that can hold wastewater for 10 h. The most effective process requires a hydraulic retention time (HRT) of around 1–2 days [5].
Figure 4. POME treatment scheme using conventional technology (open pond system). Adapted from ref. [30].
Furthermore, POME will undergo processing in anaerobic and aerobic ponds. Or-ganic substances in POME can be effectively degraded both in anaerobic and aerobic pro-cesses. Anaerobic can occur without oxygen, while aerobics takes place when there is ox-ygen content. According to Perez et al. [31], the most suitable method for POME pro-cessing is the anaerobic process. Usually, the anaerobic pool’s depth ranges from 5 to 7 m to minimize and prevent oxygen entry through the photosynthesis process. According to Yacob et al. [32], an anaerobic pool has a typical size (length × width × depth) with a pro-cessing capacity of 7500 m3 POME with a total HRT of 40 days is 60.0 m × 29.6 m × 5.8 m, respectively. However, the pond’s size depends on the palm oil mill’s production capacity and the land available for processing ponds [33]. After the anaerobic pool, POME is fur-ther processed in the aerobic pool. Aerobic pools usually have a depth of 1–1.5 m. It is intended that the transfer of oxygen (O2) can be evenly distributed throughout the pond [10]. The addition of oxygen is carried out by stirring or diffusion of air. Before being dis-charged into the environment, the aerobic pond’s waste is first deposited in a settling pond. In the sedimentation ponds, the mud will be descended and accumulated at the bottom of the pond.
Although the open pond system is economical, this system requires a longer reten-tion time (20–60 days) and a more extensive area [24,34,35]. The open pond system also produces large amounts of mud that must be disposed of and processed further. This sys-tem also cannot completely decolorize POME waste [36]. Besides, there is methane gas production in the anaerobic process, released freely into the air. Chan et al. and Fujihara
Figure 4. POME treatment scheme using conventional technology (open pond system). Adaptedfrom ref. [30].
Furthermore, POME will undergo processing in anaerobic and aerobic ponds. Organicsubstances in POME can be effectively degraded both in anaerobic and aerobic processes.Anaerobic can occur without oxygen, while aerobics takes place when there is oxygencontent. According to Perez et al. [31], the most suitable method for POME processing is theanaerobic process. Usually, the anaerobic pool’s depth ranges from 5 to 7 m to minimize andprevent oxygen entry through the photosynthesis process. According to Yacob et al. [32],an anaerobic pool has a typical size (length × width × depth) with a processing capacityof 7500 m3 POME with a total HRT of 40 days is 60.0 m × 29.6 m × 5.8 m, respectively.However, the pond’s size depends on the palm oil mill’s production capacity and the landavailable for processing ponds [33]. After the anaerobic pool, POME is further processedin the aerobic pool. Aerobic pools usually have a depth of 1–1.5 m. It is intended thatthe transfer of oxygen (O2) can be evenly distributed throughout the pond [10]. Theaddition of oxygen is carried out by stirring or diffusion of air. Before being dischargedinto the environment, the aerobic pond’s waste is first deposited in a settling pond. Inthe sedimentation ponds, the mud will be descended and accumulated at the bottom ofthe pond.
Although the open pond system is economical, this system requires a longer retentiontime (20–60 days) and a more extensive area [24,34,35]. The open pond system alsoproduces large amounts of mud that must be disposed of and processed further. Thissystem also cannot completely decolorize POME waste [36]. Besides, there is methanegas production in the anaerobic process, released freely into the air. Chan et al. andFujihara et al. [13,37] stated that methane release could contribute up to 70% of the totalgreenhouse gas emissions in the entire production process at the palm oil mill. Recently,
Materials 2021, 14, 2846 7 of 35
technology in biogas can capture methane gas, reduce greenhouse gas emissions, producerenewable energy, and improve soil quality. However, the system is still too expensive to becommercialized [38]. Therefore, to overcome these issues, several alternative technologieshave been developed, which will be discussed in the following section.
5. Alternative Palm Oil Mill Effluent (POME) Treatment Technologies
Many researchers have developed other alternative technologies to treat POME wasteto overcome the open pool system’s weakness. These alternative technologies are devel-oped to treat POME waste to reach quality standards and environmentally safety andexpected to produce renewable energy. The last few years alternative technology hasbeen widely studied like membrane technology [39], adsorption [40,41], coagulation-flocculation [42,43], AOP [44,45], and various anaerobic and aerobic degradation [46,47].Although the research is still on a laboratory scale, the technology has shown more satisfy-ing results than conventional systems or open ponds. The advantages and disadvantagesof each technology will be explained in detail in the following section.
5.1. Biological Treatment
An open pond system is an economical and simple treatment method that can reducethe high pollution burden on POME [48]. Perez et al. [31] explained that the most suitablemethod for processing POME is a biological treatment, which is the anaerobic process.However, biological treatment using an open pool system has many weaknesses and canalso cause other sources of pollutants such as methane (CH4) and hydrogen sulfide (H2S).
Many researchers have developed this system to overcome its weaknesses, such asshortening HRT, minimizing the land used for processing, and taking advantage of newsources of pollutants generated in the anaerobic process. For instance, the use of pollutantssuch as methane gas (CH4) can be further utilized to generate electricity [49]. Additionally,sludge production in open pond systems can be used as a fertilizer source [50].
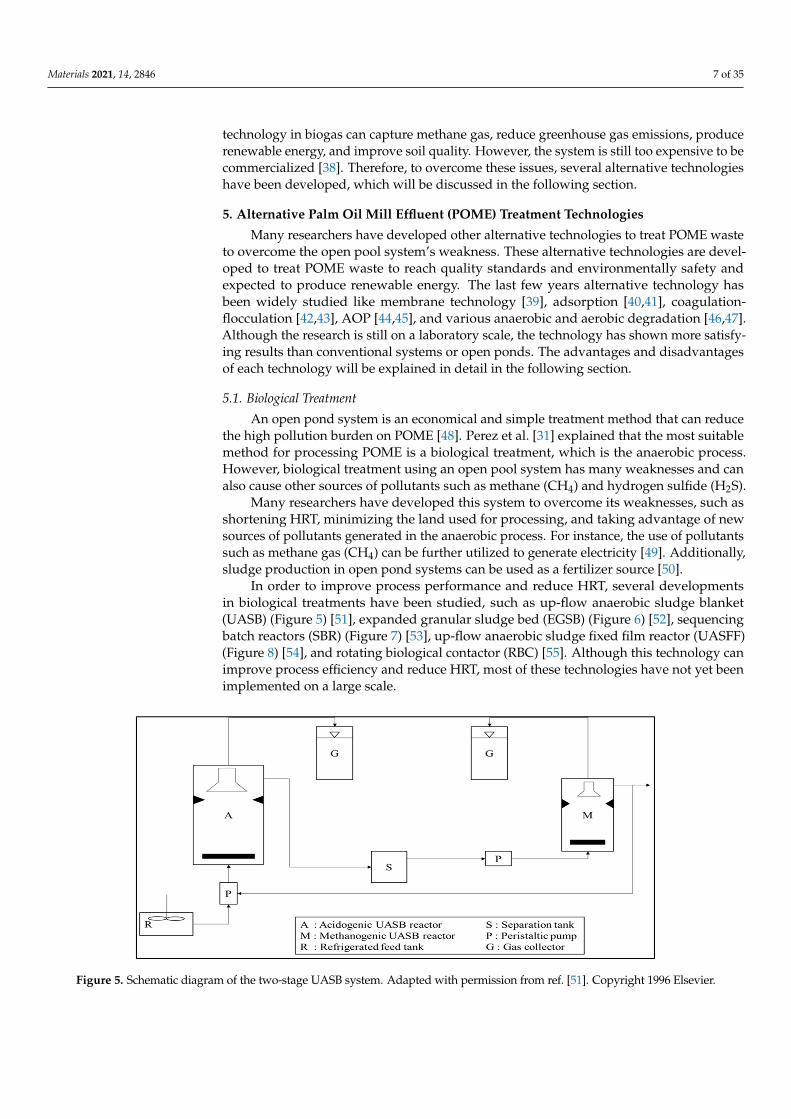
In order to improve process performance and reduce HRT, several developmentsin biological treatments have been studied, such as up-flow anaerobic sludge blanket(UASB) (Figure 5) [51], expanded granular sludge bed (EGSB) (Figure 6) [52], sequencingbatch reactors (SBR) (Figure 7) [53], up-flow anaerobic sludge fixed film reactor (UASFF)(Figure 8) [54], and rotating biological contactor (RBC) [55]. Although this technology canimprove process efficiency and reduce HRT, most of these technologies have not yet beenimplemented on a large scale.
Materials 2021, 14, x FOR PEER REVIEW 8 of 37
Figure 5. Schematic diagram of the two-stage UASB system. Adapted with permission from ref. [51]. Copyright 1996 Elsevier.
Figure 6. Schematic diagram of anaerobic EGSB reactor treating POME. Adapted with permission from ref. [52]. Copyright 2008 Elsevier.
Figure 7. Process steps of SBR in one basin. Adapted with permission from ref. [53]. Copyright 2010 Elsevier.
Figure 5. Schematic diagram of the two-stage UASB system. Adapted with permission from ref. [51]. Copyright 1996 Elsevier.

Materials 2021, 14, 2846 8 of 35
Materials 2021, 14, x FOR PEER REVIEW 8 of 37
Figure 5. Schematic diagram of the two-stage UASB system. Adapted with permission from ref. [51]. Copyright 1996 Elsevier.
Figure 6. Schematic diagram of anaerobic EGSB reactor treating POME. Adapted with permission from ref. [52]. Copyright 2008 Elsevier.
Figure 7. Process steps of SBR in one basin. Adapted with permission from ref. [53]. Copyright 2010 Elsevier.
Figure 6. Schematic diagram of anaerobic EGSB reactor treating POME. Adapted with permission from ref. [52]. Copyright2008 Elsevier.
Materials 2021, 14, x FOR PEER REVIEW 8 of 37
Figure 5. Schematic diagram of the two-stage UASB system. Adapted with permission from ref. [51]. Copyright 1996 Elsevier.
Figure 6. Schematic diagram of anaerobic EGSB reactor treating POME. Adapted with permission from ref. [52]. Copyright 2008 Elsevier.
Figure 7. Process steps of SBR in one basin. Adapted with permission from ref. [53]. Copyright 2010 Elsevier.
Figure 7. Process steps of SBR in one basin. Adapted with permission from ref. [53]. Copyright 2010 Elsevier.Materials 2021, 14, x FOR PEER REVIEW 9 of 37
Figure 8. Schematic diagram of the UASFF reactor. Adapted with permission from ref. [54]. Copy-right 2006 Elsevier.
5.2. Thermochemical Treatment Thermochemical treatment is one technique for converting wet biomass into useful
products such as syngas. Steam reforming is one example of this technology [17,18]. Syn-gas with hydrogen gas-rich was successfully produced from steam reforming of POME waste using a Ni-based catalyst [18]. The use of a catalyst can increase COD and BOD removal. It can also be increased by increasing liquid-hourly-space-velocity (LHSV). However, the increase in LHSV will cause carbon deposition on the catalyst’s surface, af-fecting lower H2 gas production. Energy consumption and clean energy income in steam reforming technology of POME waste to syngas must still be further analyzed to ensure such treatment’s feasibility.
In work by Cheng et al. [56], the syngas production rate of LaNiO3-catalyzed steam reforming from POME is optimized concerning the POME flow rate, catalyst weight, and particle size. With a net acidity, synthesized LaNiO3 catalyzes POME vapor formation by breaking down large compounds and making simpler intermediates into syngas. At a higher POME flow rate (0.05–0.09 mL/min), greater POME partial pressures encourage the steam formation and water–gas shift, which increases catalytic performance. Beyond the optimal flow rate (0.09 mL/min), the coke-forming Boudouard reaction worsens cata-lytic activity. Catalytic performance was boosted for a longer residence time at a higher catalyst weight (0.1–0.3 g); nonetheless, the agglomerated catalyst was reduced when cat-alyst weight >0.3 g. Finer LaNiO3 (particle size >74 μm) with greater surface area to vol-ume ratio exhibited better performance; however, ultrafine LaNiO3 (particle size <74 μm) had poor performance because of occluded pores. Figure 9 illustrates the POME steam reforming process’s flow diagram, showing that the entire reactor setup is basically a re-former equipped with a muffle furnace.
Figure 8. Schematic diagram of the UASFF reactor. Adapted with permission from ref. [54]. Copyright 2006 Elsevier.

Materials 2021, 14, 2846 9 of 35
POME also contains high levels of organic acids, carbohydrates, lipids, minerals, andproteins, which can function as growth nutrients for microorganisms which are suitablesubstrates for hydrogen production using two stage sequential dark and photo fermenta-tion. The yield of hydrogen from the first stage operation (dark-fermentation) was 0.78 mLH2/mL POME, then increased to 2.86 mL H2/mL POME after photo-fermentation underlight and COD removal also increased from dark-fermentation (57%) until after photo-fermentation (93%). However, high light intensity decreases the photosynthetic activity ofbacteria, causing a decrease in the yield of hydrogen. The low hydrogen yield is due toreduced nitrogenase activity, which is the only enzyme responsible for photo-fermentation.
5.2. Thermochemical Treatment
Thermochemical treatment is one technique for converting wet biomass into usefulproducts such as syngas. Steam reforming is one example of this technology [17,18].Syngas with hydrogen gas-rich was successfully produced from steam reforming of POMEwaste using a Ni-based catalyst [18]. The use of a catalyst can increase COD and BODremoval. It can also be increased by increasing liquid-hourly-space-velocity (LHSV).However, the increase in LHSV will cause carbon deposition on the catalyst’s surface,affecting lower H2 gas production. Energy consumption and clean energy income in steamreforming technology of POME waste to syngas must still be further analyzed to ensuresuch treatment’s feasibility.
In work by Cheng et al. [56], the syngas production rate of LaNiO3-catalyzed steamreforming from POME is optimized concerning the POME flow rate, catalyst weight, andparticle size. With a net acidity, synthesized LaNiO3 catalyzes POME vapor formationby breaking down large compounds and making simpler intermediates into syngas. At ahigher POME flow rate (0.05–0.09 mL/min), greater POME partial pressures encourage thesteam formation and water–gas shift, which increases catalytic performance. Beyond theoptimal flow rate (0.09 mL/min), the coke-forming Boudouard reaction worsens catalyticactivity. Catalytic performance was boosted for a longer residence time at a higher catalystweight (0.1–0.3 g); nonetheless, the agglomerated catalyst was reduced when catalystweight > 0.3 g. Finer LaNiO3 (particle size > 74 µm) with greater surface area to volumeratio exhibited better performance; however, ultrafine LaNiO3 (particle size < 74 µm)had poor performance because of occluded pores. Figure 9 illustrates the POME steamreforming process’s flow diagram, showing that the entire reactor setup is basically areformer equipped with a muffle furnace.
Materials 2021, 14, x FOR PEER REVIEW 10 of 37
Figure 9. Process flow diagram of POME steam reforming. Adapted with permission from ref. [16]. Copyright 2019 Elsevier.
Besides, POME can be converted into biogas as fuel for electricity generation. The utilization of solid (EFB) and liquid (POME) from the palm oil milling process for power plants is proposed by Aziz et al. [57]. The proposed system consists of EFB gasification, POME digestion, and additional ORC (organic Rankine cycle) modules (Figure 10). The cogeneration system, which produces electricity and heat, produces syngas and biogas from both modules. Additionally, excess and unused heat from the system is converted into electricity through additional ORC modules. The total power generated and the power plant’s efficiency were 8.3 MW and 30.4%, respectively.
Figure 10. Conceptual diagram of a small-scale integrated power plant for EFB and POME. Adapted with permission from ref. [57]. Copyright 2017 Elsevier.
5.3. Physiochemical Treatment Some physiochemical treatment has been developed for the POME waste treatment.
The physiochemical treatment has a broad scope, consisting of physical treatment and chemical treatment, including coagulation–flocculation [58], membrane technology [59], adsorption [15], and integrated technology [60].
The coagulation–flocculation process is generally used as a pretreatment method used in POME waste treatment to remove suspended solids and residual oil [58]. Inor-ganic coagulants such as aluminum sulfate (alum) are widely used in waste treatment.
Figure 9. Process flow diagram of POME steam reforming. Adapted with permission from ref. [16].Copyright 2019 Elsevier.
Materials 2021, 14, 2846 10 of 35
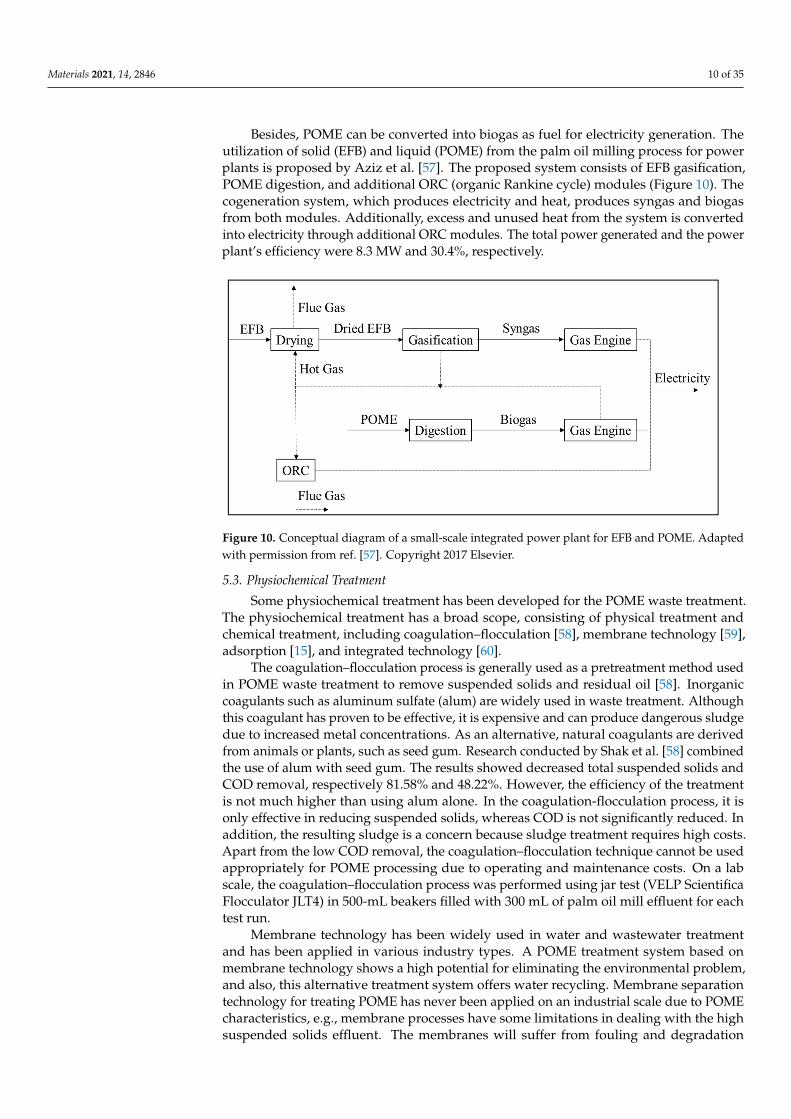
Besides, POME can be converted into biogas as fuel for electricity generation. Theutilization of solid (EFB) and liquid (POME) from the palm oil milling process for powerplants is proposed by Aziz et al. [57]. The proposed system consists of EFB gasification,POME digestion, and additional ORC (organic Rankine cycle) modules (Figure 10). Thecogeneration system, which produces electricity and heat, produces syngas and biogasfrom both modules. Additionally, excess and unused heat from the system is convertedinto electricity through additional ORC modules. The total power generated and the powerplant’s efficiency were 8.3 MW and 30.4%, respectively.
Materials 2021, 14, x FOR PEER REVIEW 10 of 37
Figure 9. Process flow diagram of POME steam reforming. Adapted with permission from ref. [16]. Copyright 2019 Elsevier.
Besides, POME can be converted into biogas as fuel for electricity generation. The utilization of solid (EFB) and liquid (POME) from the palm oil milling process for power plants is proposed by Aziz et al. [57]. The proposed system consists of EFB gasification, POME digestion, and additional ORC (organic Rankine cycle) modules (Figure 10). The cogeneration system, which produces electricity and heat, produces syngas and biogas from both modules. Additionally, excess and unused heat from the system is converted into electricity through additional ORC modules. The total power generated and the power plant’s efficiency were 8.3 MW and 30.4%, respectively.
Figure 10. Conceptual diagram of a small-scale integrated power plant for EFB and POME. Adapted with permission from ref. [57]. Copyright 2017 Elsevier.
5.3. Physiochemical Treatment Some physiochemical treatment has been developed for the POME waste treatment.
The physiochemical treatment has a broad scope, consisting of physical treatment and chemical treatment, including coagulation–flocculation [58], membrane technology [59], adsorption [15], and integrated technology [60].
The coagulation–flocculation process is generally used as a pretreatment method used in POME waste treatment to remove suspended solids and residual oil [58]. Inor-ganic coagulants such as aluminum sulfate (alum) are widely used in waste treatment.
Figure 10. Conceptual diagram of a small-scale integrated power plant for EFB and POME. Adaptedwith permission from ref. [57]. Copyright 2017 Elsevier.
5.3. Physiochemical Treatment
Some physiochemical treatment has been developed for the POME waste treatment.The physiochemical treatment has a broad scope, consisting of physical treatment andchemical treatment, including coagulation–flocculation [58], membrane technology [59],adsorption [15], and integrated technology [60].
The coagulation–flocculation process is generally used as a pretreatment method usedin POME waste treatment to remove suspended solids and residual oil [58]. Inorganiccoagulants such as aluminum sulfate (alum) are widely used in waste treatment. Althoughthis coagulant has proven to be effective, it is expensive and can produce dangerous sludgedue to increased metal concentrations. As an alternative, natural coagulants are derivedfrom animals or plants, such as seed gum. Research conducted by Shak et al. [58] combinedthe use of alum with seed gum. The results showed decreased total suspended solids andCOD removal, respectively 81.58% and 48.22%. However, the efficiency of the treatmentis not much higher than using alum alone. In the coagulation-flocculation process, it isonly effective in reducing suspended solids, whereas COD is not significantly reduced. Inaddition, the resulting sludge is a concern because sludge treatment requires high costs.Apart from the low COD removal, the coagulation–flocculation technique cannot be usedappropriately for POME processing due to operating and maintenance costs. On a labscale, the coagulation–flocculation process was performed using jar test (VELP ScientificaFlocculator JLT4) in 500-mL beakers filled with 300 mL of palm oil mill effluent for eachtest run.
Membrane technology has been widely used in water and wastewater treatmentand has been applied in various industry types. A POME treatment system based onmembrane technology shows a high potential for eliminating the environmental problem,and also, this alternative treatment system offers water recycling. Membrane separationtechnology for treating POME has never been applied on an industrial scale due to POMEcharacteristics, e.g., membrane processes have some limitations in dealing with the highsuspended solids effluent. The membranes will suffer from fouling and degradation
Materials 2021, 14, 2846 11 of 35
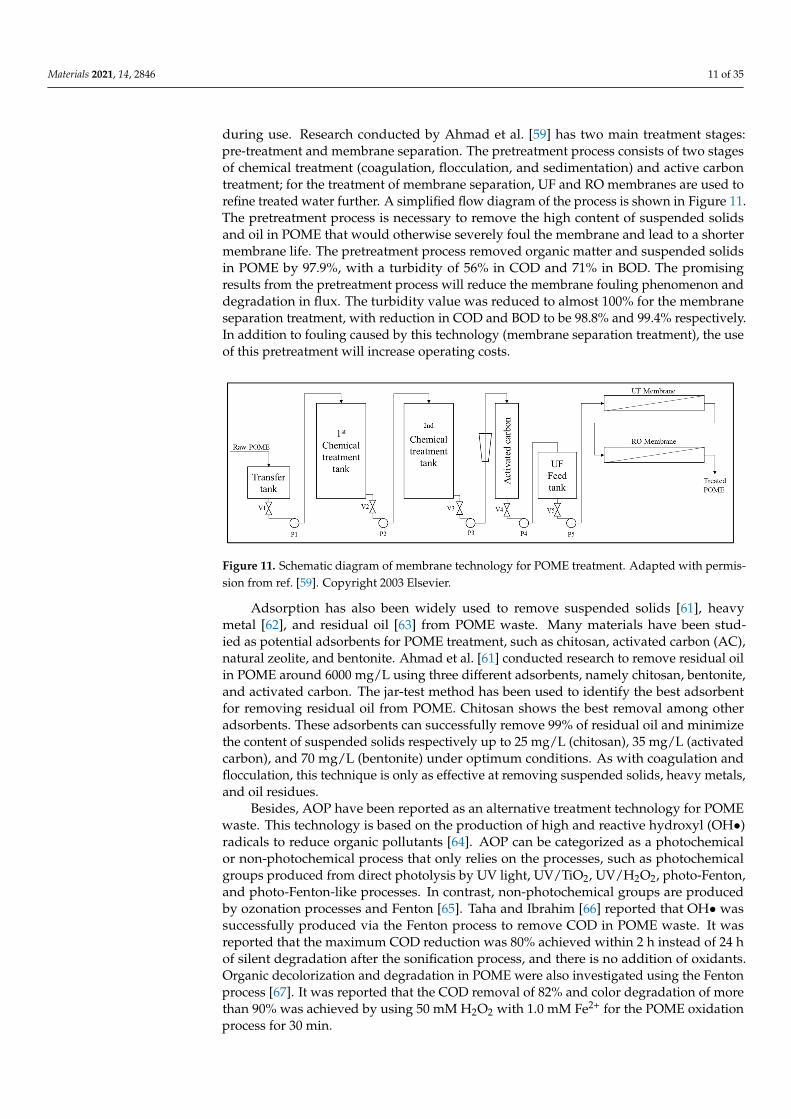
during use. Research conducted by Ahmad et al. [59] has two main treatment stages:pre-treatment and membrane separation. The pretreatment process consists of two stagesof chemical treatment (coagulation, flocculation, and sedimentation) and active carbontreatment; for the treatment of membrane separation, UF and RO membranes are used torefine treated water further. A simplified flow diagram of the process is shown in Figure 11.The pretreatment process is necessary to remove the high content of suspended solidsand oil in POME that would otherwise severely foul the membrane and lead to a shortermembrane life. The pretreatment process removed organic matter and suspended solidsin POME by 97.9%, with a turbidity of 56% in COD and 71% in BOD. The promisingresults from the pretreatment process will reduce the membrane fouling phenomenon anddegradation in flux. The turbidity value was reduced to almost 100% for the membraneseparation treatment, with reduction in COD and BOD to be 98.8% and 99.4% respectively.In addition to fouling caused by this technology (membrane separation treatment), the useof this pretreatment will increase operating costs.
Materials 2021, 14, x FOR PEER REVIEW 11 of 37
Although this coagulant has proven to be effective, it is expensive and can produce dan-gerous sludge due to increased metal concentrations. As an alternative, natural coagulants are derived from animals or plants, such as seed gum. Research conducted by Shak et al. [58] combined the use of alum with seed gum. The results showed decreased total sus-pended solids and COD removal, respectively 81.58% and 48.22%. However, the effi-ciency of the treatment is not much higher than using alum alone. In the coagulation-flocculation process, it is only effective in reducing suspended solids, whereas COD is not significantly reduced. In addition, the resulting sludge is a concern because sludge treat-ment requires high costs. Apart from the low COD removal, the coagulation–flocculation technique cannot be used appropriately for POME processing due to operating and maintenance costs. On a lab scale, the coagulation–flocculation process was performed using jar test (VELP Scientifica Flocculator JLT4) in 500-mL beakers filled with 300 mL of palm oil mill effluent for each test run.
Membrane technology has been widely used in water and wastewater treatment and has been applied in various industry types. A POME treatment system based on mem-brane technology shows a high potential for eliminating the environmental problem, and also, this alternative treatment system offers water recycling. Membrane separation tech-nology for treating POME has never been applied on an industrial scale due to POME characteristics, e.g., membrane processes have some limitations in dealing with the high suspended solids effluent. The membranes will suffer from fouling and degradation dur-ing use. Research conducted by Ahmad et al. [59] has two main treatment stages: pre-treatment and membrane separation. The pretreatment process consists of two stages of chemical treatment (coagulation, flocculation, and sedimentation) and active carbon treat-ment; for the treatment of membrane separation, UF and RO membranes are used to refine treated water further. A simplified flow diagram of the process is shown in Figure 11. The pretreatment process is necessary to remove the high content of suspended solids and oil in POME that would otherwise severely foul the membrane and lead to a shorter mem-brane life. The pretreatment process removed organic matter and suspended solids in POME by 97.9%, with a turbidity of 56% in COD and 71% in BOD. The promising results from the pretreatment process will reduce the membrane fouling phenomenon and deg-radation in flux. The turbidity value was reduced to almost 100% for the membrane sep-aration treatment, with reduction in COD and BOD to be 98.8% and 99.4% respectively. In addition to fouling caused by this technology (membrane separation treatment), the use of this pretreatment will increase operating costs.
Figure 11. Schematic diagram of membrane technology for POME treatment. Adapted with per-mission from ref. [59]. Copyright 2003 Elsevier.
Adsorption has also been widely used to remove suspended solids [61], heavy metal [62], and residual oil [63] from POME waste. Many materials have been studied as poten-tial adsorbents for POME treatment, such as chitosan, activated carbon (AC), natural zeo-lite, and bentonite. Ahmad et al. [61] conducted research to remove residual oil in POME around 6000 mg/L using three different adsorbents, namely chitosan, bentonite, and acti-vated carbon. The jar-test method has been used to identify the best adsorbent for
Figure 11. Schematic diagram of membrane technology for POME treatment. Adapted with permis-sion from ref. [59]. Copyright 2003 Elsevier.
Adsorption has also been widely used to remove suspended solids [61], heavymetal [62], and residual oil [63] from POME waste. Many materials have been stud-ied as potential adsorbents for POME treatment, such as chitosan, activated carbon (AC),natural zeolite, and bentonite. Ahmad et al. [61] conducted research to remove residual oilin POME around 6000 mg/L using three different adsorbents, namely chitosan, bentonite,and activated carbon. The jar-test method has been used to identify the best adsorbentfor removing residual oil from POME. Chitosan shows the best removal among otheradsorbents. These adsorbents can successfully remove 99% of residual oil and minimizethe content of suspended solids respectively up to 25 mg/L (chitosan), 35 mg/L (activatedcarbon), and 70 mg/L (bentonite) under optimum conditions. As with coagulation andflocculation, this technique is only as effective at removing suspended solids, heavy metals,and oil residues.
Besides, AOP have been reported as an alternative treatment technology for POMEwaste. This technology is based on the production of high and reactive hydroxyl (OH•)radicals to reduce organic pollutants [64]. AOP can be categorized as a photochemicalor non-photochemical process that only relies on the processes, such as photochemicalgroups produced from direct photolysis by UV light, UV/TiO2, UV/H2O2, photo-Fenton,and photo-Fenton-like processes. In contrast, non-photochemical groups are producedby ozonation processes and Fenton [65]. Taha and Ibrahim [66] reported that OH• wassuccessfully produced via the Fenton process to remove COD in POME waste. It wasreported that the maximum COD reduction was 80% achieved within 2 h instead of 24 hof silent degradation after the sonification process, and there is no addition of oxidants.Organic decolorization and degradation in POME were also investigated using the Fentonprocess [67]. It was reported that the COD removal of 82% and color degradation of morethan 90% was achieved by using 50 mM H2O2 with 1.0 mM Fe2+ for the POME oxidationprocess for 30 min.

Materials 2021, 14, 2846 12 of 35
Moreover, Saeed et al. reported that the Fenton oxidation process could degradeorganic and inorganic compounds with a total COD removal of 85% under the acidicPOME at an approximate pH of 3 [68]. Photocatalytic reactions show high efficiency in themineralization of organic compounds and disinfection of pathogenic microorganisms inwastewater [69]. TiO2 is the most popular among the semiconductor catalysts because ithas low toxicity, high chemical stability, high activity, and low cost [70]. Many studies havebeen conducted on photocatalytic use of TiO2 to degrade organic pollutants [71,72].
5.4. Integration Treatment
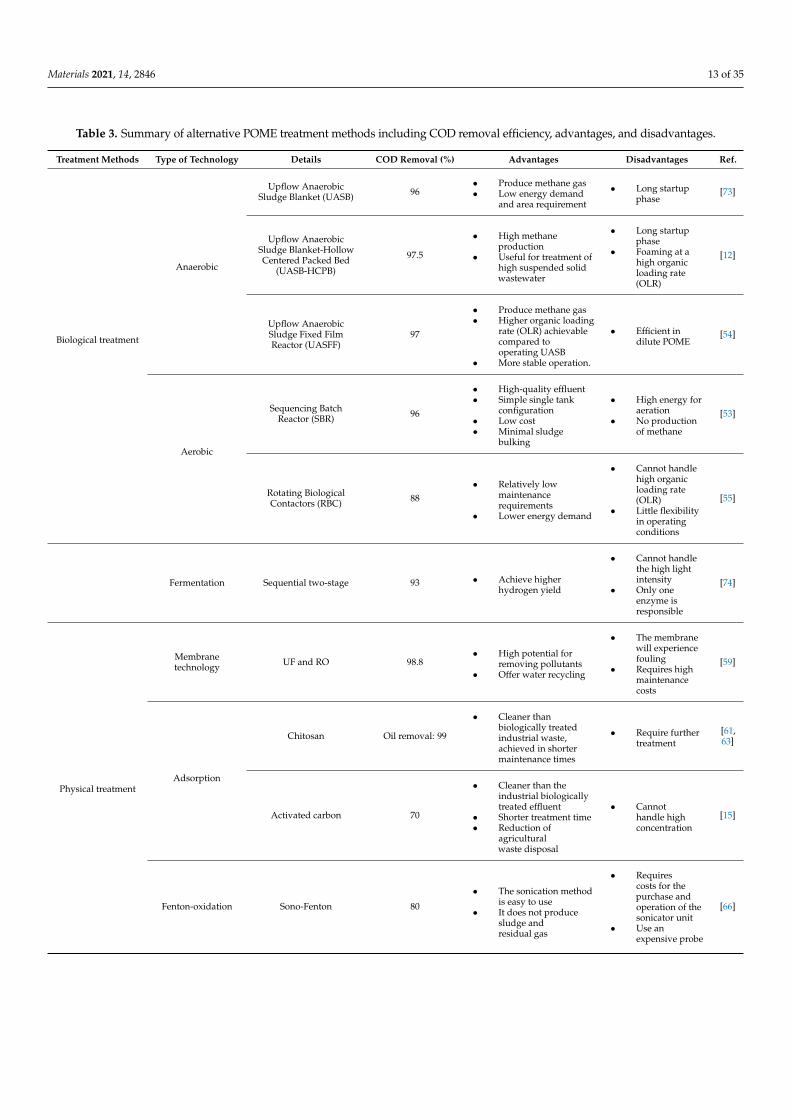
Some treatments combine biological treatments with physical treatments, such asmembrane technology [60]. The schematic diagram of the pilot plant for integrationtreatment is shown in Figure 12. This treatment’s initial stage is anaerobic and aerobictreatment using an EGSB reactor. About 43% of the organic material produced in POMEis converted into biogas, while the efficiency of COD removal in anaerobic and aerobicreactors is 93% and 22%, respectively. In addition to COD and BOD removal, suspendedsolids and residual oil also decrease. In the membrane processing unit, almost all suspendedsolids are captured by the membrane. The effluent produced at the end of high-qualityprocessing is very clear and can be used as boiler feedwater. However, the use of thistreatment requires high costs, bearing in mind there are two stages of care needed. Table 3summarizes comparisons of the technologies used for POME waste treatment.
Materials 2021, 14, x FOR PEER REVIEW 13 of 37
Figure 12. Schematic diagram of integration treatment for POME. Adapted with permission from ref. [60]. Copyright 2008 Elsevier.
Table 3. Summary of alternative POME treatment methods including COD removal efficiency, advantages, and disad-vantages.
Treatment Methods
Type of Technology Details
COD Removal
(%) Advantages Disadvantages Ref.
Biological treatment
Anaerobic
Upflow Anaerobic Sludge Blanket
(UASB) 96
• Produce methane gas • Low energy demand
and area requirement
• Long startup phase
[73]
Upflow Anaerobic Sludge Blanket-
Hollow Centered Packed Bed (UASB-
HCPB)
97.5
• High methane produc-tion
• Useful for treatment of high suspended solid wastewater
• Long startup phase
• Foaming at a high organic loading rate (OLR)
[12]
Upflow Anaerobic Sludge Fixed Film Reactor (UASFF)
97
• Produce methane gas • Higher organic loading
rate (OLR) achievable compared to operating UASB
• More stable operation.
• Efficient in dilute POME
[54]
Aerobic
Sequencing Batch Reactor (SBR)
96
• High-quality effluent • Simple single tank con-
figuration • Low cost • Minimal sludge bulking
• High energy for aeration
• No production of methane
[53]
Rotating Biological Contactors (RBC) 88
• Relatively low mainte-nance requirements
• Lower energy demand
• Cannot handle high organic loading rate (OLR)
• Little flexibility in operating condi-tions
[55]
Figure 12. Schematic diagram of integration treatment for POME. Adapted with permission fromref. [60]. Copyright 2008 Elsevier.
Materials 2021, 14, 2846 13 of 35
Table 3. Summary of alternative POME treatment methods including COD removal efficiency, advantages, and disadvantages.
Treatment Methods Type of Technology Details COD Removal (%) Advantages Disadvantages Ref.
Biological treatment
Anaerobic
Upflow AnaerobicSludge Blanket (UASB) 96
• Produce methane gas• Low energy demand
and area requirement
• Long startupphase
[73]
Upflow AnaerobicSludge Blanket-HollowCentered Packed Bed
(UASB-HCPB)
97.5
• High methaneproduction
• Useful for treatment ofhigh suspended solidwastewater
• Long startupphase
• Foaming at ahigh organicloading rate(OLR)
[12]
Upflow AnaerobicSludge Fixed FilmReactor (UASFF)
97
• Produce methane gas• Higher organic loading
rate (OLR) achievablecompared tooperating UASB
• More stable operation.
• Efficient indilute POME
[54]
Aerobic
Sequencing BatchReactor (SBR) 96
• High-quality effluent• Simple single tank
configuration• Low cost• Minimal sludge
bulking
• High energy foraeration
• No productionof methane
[53]
Rotating BiologicalContactors (RBC) 88
• Relatively lowmaintenancerequirements
• Lower energy demand
• Cannot handlehigh organicloading rate(OLR)
• Little flexibilityin operatingconditions
[55]
Fermentation Sequential two-stage 93 • Achieve higherhydrogen yield
• Cannot handlethe high lightintensity
• Only oneenzyme isresponsible
[74]
Physical treatment
Membranetechnology UF and RO 98.8
• High potential forremoving pollutants
• Offer water recycling
• The membranewill experiencefouling
• Requires highmaintenancecosts
[59]
Adsorption
Chitosan Oil removal: 99
• Cleaner thanbiologically treatedindustrial waste,achieved in shortermaintenance times
• Require furthertreatment
[61,63]
Activated carbon 70
• Cleaner than theindustrial biologicallytreated effluent
• Shorter treatment time• Reduction of
agriculturalwaste disposal
• Cannothandle highconcentration
[15]
Fenton-oxidation Sono-Fenton 80
• The sonication methodis easy to use
• It does not producesludge andresidual gas
• Requirescosts for thepurchase andoperation of thesonicator unit
• Use anexpensive probe
[66]

Materials 2021, 14, 2846 14 of 35
Table 3. Cont.
Treatment Methods Type of Technology Details COD Removal (%) Advantages Disadvantages Ref.
Chemical treatment Coagulation-flocculation Seed gum 48.2
• Environmentallyfriendly
• Low cost
• The high cost ofsludgetreatment
• Only effectivein Totalsuspendedsolids removal
[58]
Thermo-chemicaltreatment Steam reforming Catalytic steam
reforming 99• Syngas was
successfully generated• High COD and
BOD removal
• Carbondeposition onthe catalystsurface
• High energyconsumption.
[17,18]
Integrationtreatment
BiologicalMembrane EGSB-Membrane 93
• High-quality effluents• It can be used as boiler
feedwater
• Costlytreatmentmethods
[60]
6. Photocatalytic Technology for POME Treatment6.1. Mechanisms and Fundamentals of Photocatalytic Technology
Photocatalytic technology is a combination of photochemical processes and catalysts.Materials that can be used as photocatalysts have an energy band gap like the oxides formof most transition metals. The bandgap is the energy between the conduction band andthe valence band that produces a current carrier. The valence band is the energy levelfilled with electrons with a low energy state known as the highest occupied molecularorbital (HOMO). In contrast, the conduction band is an energy level that is not filledwith electrons and is called the lowest unoccupied molecular orbitals (LUMO). Supposethe photocatalyst is subjected to light source energy equal to or greater than the energybandgap. In that case, the light energy can promote electron excitation from the valenceband to the conduction band, producing positive holes in the valence band. As a resultof electrons’ transfer, conductivity is obtained and produces current when the electrodepotential is sufficient [75,76].
Based on the type of catalyst, the photocatalysis process is divided into homogeneousphotocatalysis and heterogeneous photocatalysis [77]. Homogeneous photocatalysis occursin the same phase between reactants and photocatalysts (generally in the liquid phase).Homogeneous photocatalysts commonly used are hydrogen peroxide (H2O2), ozone, or otheroxidants [78]. In contrast, heterogeneous photocatalysis occurs between two phases or more(generally, catalysts are present as solid phases). The most commonly used photocatalysts aresemiconductors-based transition metals oxides (TiO2, ZnO, WO3, CeO2, ZrO2, etc.) [79–83].
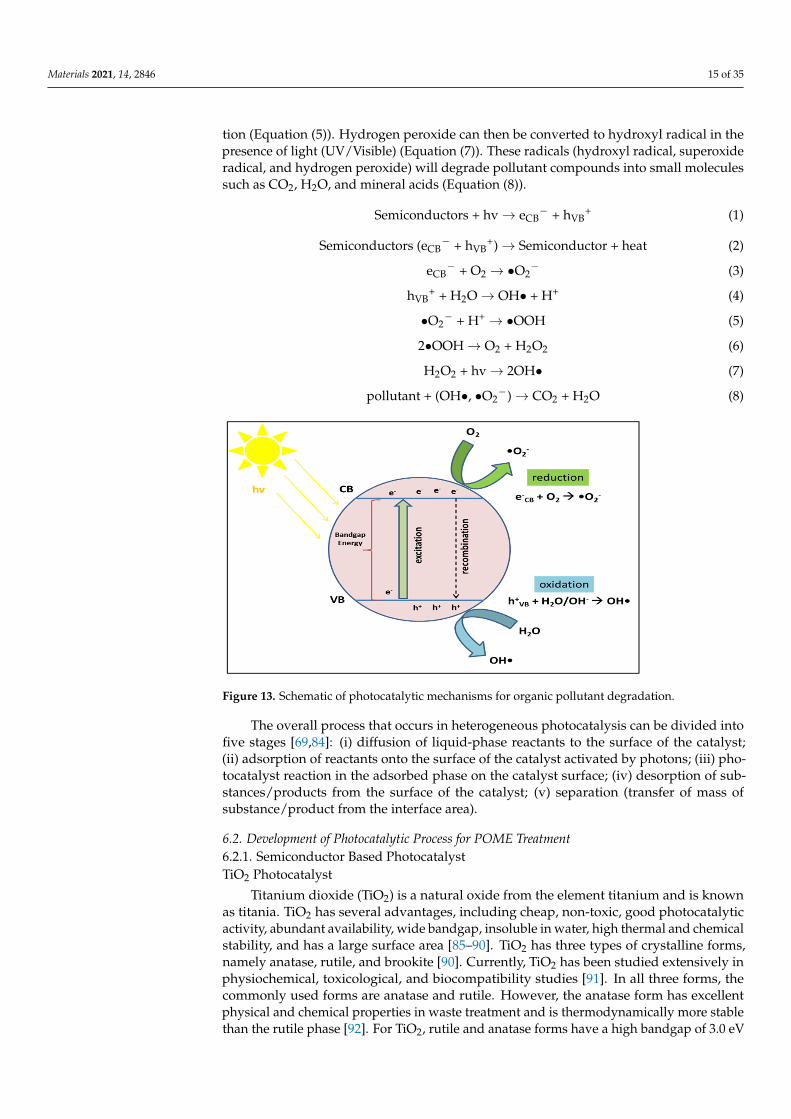
The schematic mechanism of the photocatalysis process can be illustrated in Figure 13.The heterogeneous photocatalysis process in semiconductor material begins with photoex-citation due to light hitting the semiconductor material. The light must have energy greaterthan or equal to the bandgap energy to transfer electrons from the valence band to theconduction band and produce a hole (h+) in the valence band called the electron–hole pair(Equation (1)). The redox process then occurs if there are compounds that are adsorbed onthe surface of the semiconductor. A suitable scavenger will take this electron–hole pair toprevent the recombination process (Equation (2)). The electron in the conduction band willreact with the electron acceptor, and the positive hole in the valence band will react with theelectron donor. Electron acceptors (usually O2) will be reduced to other compounds duringthe electron transfer process, while electron donors will undergo an oxidation process. Thereduction and oxidation process (redox) is utilized to suppress pollutants that contact thephotocatalyst’s surface. Both electrons and holes can produce reactive radicals that can beused in the process of pollutant degradation. Electrons will interact with air or oxygento produce superoxide radicals (•O2
−) (Equation (3)), while holes interact with watermolecules (H2O) to form hydroxyl radicals (OH•) (Equation (4)). Superoxide radicals canbe converted to hydrogen peroxide (Equation (6)) through hydroperoxyl radical forma-
Materials 2021, 14, 2846 15 of 35
tion (Equation (5)). Hydrogen peroxide can then be converted to hydroxyl radical in thepresence of light (UV/Visible) (Equation (7)). These radicals (hydroxyl radical, superoxideradical, and hydrogen peroxide) will degrade pollutant compounds into small moleculessuch as CO2, H2O, and mineral acids (Equation (8)).
Semiconductors + hv→ eCB− + hVB
+ (1)
Semiconductors (eCB− + hVB
+)→ Semiconductor + heat (2)
eCB− + O2 → •O2
− (3)
hVB+ + H2O→ OH• + H+ (4)
•O2− + H+ → •OOH (5)
2•OOH→ O2 + H2O2 (6)
H2O2 + hv→ 2OH• (7)
pollutant + (OH•, •O2−)→ CO2 + H2O (8)
Materials 2021, 14, x FOR PEER REVIEW 16 of 37
adsorption of reactants onto the surface of the catalyst activated by photons; (iii) photo-catalyst reaction in the adsorbed phase on the catalyst surface; (iv) desorption of sub-stances/products from the surface of the catalyst; (v) separation (transfer of mass of sub-stance/product from the interface area).
Figure 13. Schematic of photocatalytic mechanisms for organic pollutant degradation.
6.2. Development of Photocatalytic Process for POME Treatment 6.2.1. Semiconductor Based Photocatalyst TiO2 Photocatalyst
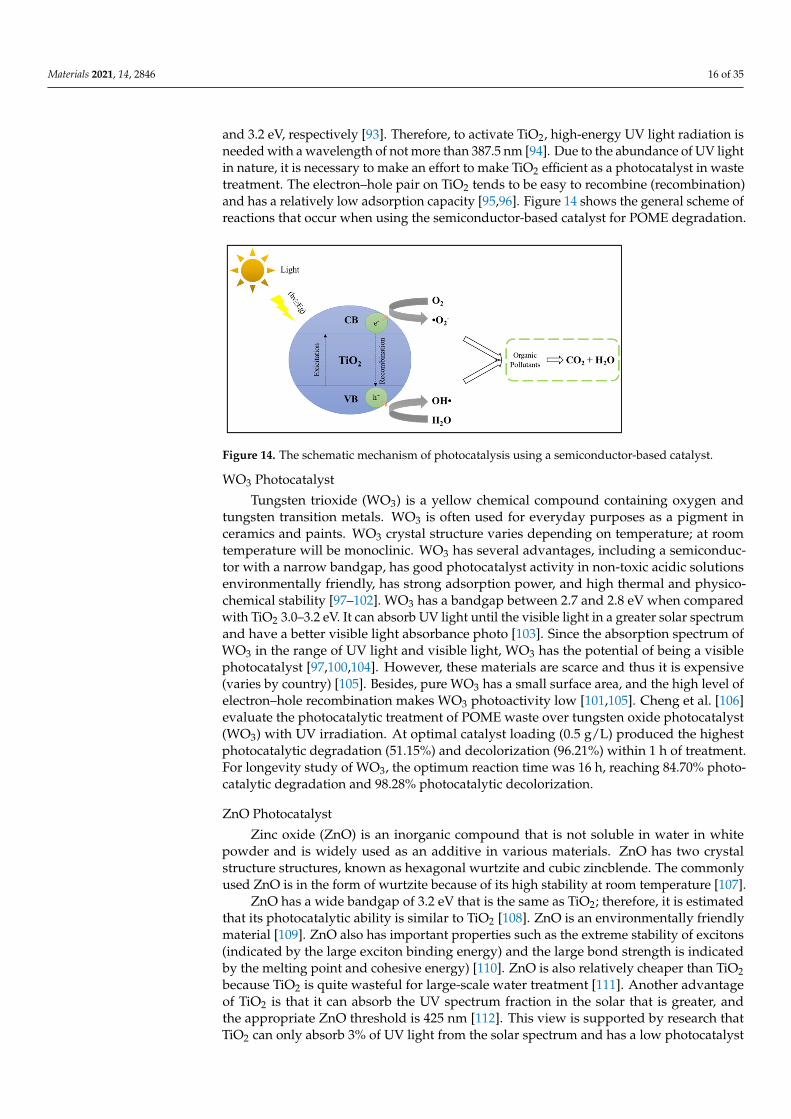
Titanium dioxide (TiO2) is a natural oxide from the element titanium and is known as titania. TiO2 has several advantages, including cheap, non-toxic, good photocatalytic activity, abundant availability, wide bandgap, insoluble in water, high thermal and chem-ical stability, and has a large surface area [85–90]. TiO2 has three types of crystalline forms, namely anatase, rutile, and brookite [90]. Currently, TiO2 has been studied extensively in physiochemical, toxicological, and biocompatibility studies [91]. In all three forms, the commonly used forms are anatase and rutile. However, the anatase form has excellent physical and chemical properties in waste treatment and is thermodynamically more sta-ble than the rutile phase [92]. For TiO2, rutile and anatase forms have a high bandgap of 3.0 eV and 3.2 eV, respectively [93]. Therefore, to activate TiO2, high-energy UV light ra-diation is needed with a wavelength of not more than 387.5 nm [94]. Due to the abundance of UV light in nature, it is necessary to make an effort to make TiO2 efficient as a photo-catalyst in waste treatment. The electron–hole pair on TiO2 tends to be easy to recombine (recombination) and has a relatively low adsorption capacity [95,96]. Figure 14 shows the general scheme of reactions that occur when using the semiconductor-based catalyst for POME degradation.
Figure 13. Schematic of photocatalytic mechanisms for organic pollutant degradation.
The overall process that occurs in heterogeneous photocatalysis can be divided intofive stages [69,84]: (i) diffusion of liquid-phase reactants to the surface of the catalyst;(ii) adsorption of reactants onto the surface of the catalyst activated by photons; (iii) pho-tocatalyst reaction in the adsorbed phase on the catalyst surface; (iv) desorption of sub-stances/products from the surface of the catalyst; (v) separation (transfer of mass ofsubstance/product from the interface area).
6.2. Development of Photocatalytic Process for POME Treatment6.2.1. Semiconductor Based PhotocatalystTiO2 Photocatalyst
Titanium dioxide (TiO2) is a natural oxide from the element titanium and is knownas titania. TiO2 has several advantages, including cheap, non-toxic, good photocatalyticactivity, abundant availability, wide bandgap, insoluble in water, high thermal and chemicalstability, and has a large surface area [85–90]. TiO2 has three types of crystalline forms,namely anatase, rutile, and brookite [90]. Currently, TiO2 has been studied extensively inphysiochemical, toxicological, and biocompatibility studies [91]. In all three forms, thecommonly used forms are anatase and rutile. However, the anatase form has excellentphysical and chemical properties in waste treatment and is thermodynamically more stablethan the rutile phase [92]. For TiO2, rutile and anatase forms have a high bandgap of 3.0 eV
Materials 2021, 14, 2846 16 of 35
and 3.2 eV, respectively [93]. Therefore, to activate TiO2, high-energy UV light radiation isneeded with a wavelength of not more than 387.5 nm [94]. Due to the abundance of UV lightin nature, it is necessary to make an effort to make TiO2 efficient as a photocatalyst in wastetreatment. The electron–hole pair on TiO2 tends to be easy to recombine (recombination)and has a relatively low adsorption capacity [95,96]. Figure 14 shows the general scheme ofreactions that occur when using the semiconductor-based catalyst for POME degradation.
Materials 2021, 14, x FOR PEER REVIEW 17 of 37
Figure 14. The schematic mechanism of photocatalysis using a semiconductor-based catalyst
WO3 Photocatalyst Tungsten trioxide (WO3) is a yellow chemical compound containing oxygen and
tungsten transition metals. WO3 is often used for everyday purposes as a pigment in ce-ramics and paints. WO3 crystal structure varies depending on temperature; at room tem-perature will be monoclinic. WO3 has several advantages, including a semiconductor with a narrow bandgap, has good photocatalyst activity in non-toxic acidic solutions environ-mentally friendly, has strong adsorption power, and high thermal and physicochemical stability [97–102]. WO3 has a bandgap between 2.7 and 2.8 eV when compared with TiO2 3.0–3.2 eV. It can absorb UV light until the visible light in a greater solar spectrum and have a better visible light absorbance photo [103]. Since the absorption spectrum of WO3 in the range of UV light and visible light , WO3 has the potential of being a visible photo-catalyst [97,100,104]. However, these materials are scarce and thus it is expensive (varies by country) [105]. Besides, pure WO3 has a small surface area, and the high level of elec-tron–hole recombination makes WO3 photoactivity low [101,105]. Cheng et al. [106] eval-uate the photocatalytic treatment of POME waste over tungsten oxide photocatalyst (WO3) with UV irradiation. At optimal catalyst loading (0.5 g/L) produced the highest photocatalytic degradation (51.15%) and decolorization (96.21%) within 1 h of treatment. For longevity study of WO3, the optimum reaction time was 16 h, reaching 84.70% photo-catalytic degradation and 98.28% photocatalytic decolorization. ZnO Photocatalyst
Zinc oxide (ZnO) is an inorganic compound that is not soluble in water in white pow-der and is widely used as an additive in various materials. ZnO has two crystal structure structures, known as hexagonal wurtzite and cubic zincblende. The commonly used ZnO is in the form of wurtzite because of its high stability at room temperature [107].
ZnO has a wide bandgap of 3.2 eV that is the same as TiO2; therefore, it is estimated that its photocatalytic ability is similar to TiO2 [108]. ZnO is an environmentally friendly material [109]. ZnO also has important properties such as the extreme stability of excitons (indicated by the large exciton binding energy) and the large bond strength is indicated by the melting point and cohesive energy) [110]. ZnO is also relatively cheaper than TiO2 because TiO2 is quite wasteful for large-scale water treatment [111]. Another advantage of TiO2 is that it can absorb the UV spectrum fraction in the solar that is greater, and the appropriate ZnO threshold is 425 nm [112]. This view is supported by research that TiO2 can only absorb 3% of UV light from the solar spectrum and has a low photocatalyst effi-ciency [113]. ZnO’s weakness has a wide bandgap like TiO2, but ZnO is a photocorrosion material. A wide bandgap causes the limitation of absorption of light in the visible light region. This condition can cause low photocatalytic efficiency and result in rapid recom-bination [107]. Study by Ng et al. [114] reported that photocatalytic methods have been used to restore POME waste with ZnO photocatalysts with UV irradiation. The degrada-tion process increases consistently with photocatalyst loading until the optimal point is
Figure 14. The schematic mechanism of photocatalysis using a semiconductor-based catalyst.
WO3 Photocatalyst
Tungsten trioxide (WO3) is a yellow chemical compound containing oxygen andtungsten transition metals. WO3 is often used for everyday purposes as a pigment inceramics and paints. WO3 crystal structure varies depending on temperature; at roomtemperature will be monoclinic. WO3 has several advantages, including a semiconduc-tor with a narrow bandgap, has good photocatalyst activity in non-toxic acidic solutionsenvironmentally friendly, has strong adsorption power, and high thermal and physico-chemical stability [97–102]. WO3 has a bandgap between 2.7 and 2.8 eV when comparedwith TiO2 3.0–3.2 eV. It can absorb UV light until the visible light in a greater solar spectrumand have a better visible light absorbance photo [103]. Since the absorption spectrum ofWO3 in the range of UV light and visible light, WO3 has the potential of being a visiblephotocatalyst [97,100,104]. However, these materials are scarce and thus it is expensive(varies by country) [105]. Besides, pure WO3 has a small surface area, and the high level ofelectron–hole recombination makes WO3 photoactivity low [101,105]. Cheng et al. [106]evaluate the photocatalytic treatment of POME waste over tungsten oxide photocatalyst(WO3) with UV irradiation. At optimal catalyst loading (0.5 g/L) produced the highestphotocatalytic degradation (51.15%) and decolorization (96.21%) within 1 h of treatment.For longevity study of WO3, the optimum reaction time was 16 h, reaching 84.70% photo-catalytic degradation and 98.28% photocatalytic decolorization.
ZnO Photocatalyst
Zinc oxide (ZnO) is an inorganic compound that is not soluble in water in whitepowder and is widely used as an additive in various materials. ZnO has two crystalstructure structures, known as hexagonal wurtzite and cubic zincblende. The commonlyused ZnO is in the form of wurtzite because of its high stability at room temperature [107].
ZnO has a wide bandgap of 3.2 eV that is the same as TiO2; therefore, it is estimatedthat its photocatalytic ability is similar to TiO2 [108]. ZnO is an environmentally friendlymaterial [109]. ZnO also has important properties such as the extreme stability of excitons(indicated by the large exciton binding energy) and the large bond strength is indicatedby the melting point and cohesive energy) [110]. ZnO is also relatively cheaper than TiO2because TiO2 is quite wasteful for large-scale water treatment [111]. Another advantageof TiO2 is that it can absorb the UV spectrum fraction in the solar that is greater, andthe appropriate ZnO threshold is 425 nm [112]. This view is supported by research thatTiO2 can only absorb 3% of UV light from the solar spectrum and has a low photocatalyst

Materials 2021, 14, 2846 17 of 35
efficiency [113]. ZnO’s weakness has a wide bandgap like TiO2, but ZnO is a photocorrosionmaterial. A wide bandgap causes the limitation of absorption of light in the visiblelight region. This condition can cause low photocatalytic efficiency and result in rapidrecombination [107]. Study by Ng et al. [114] reported that photocatalytic methods havebeen used to restore POME waste with ZnO photocatalysts with UV irradiation. Thedegradation process increases consistently with photocatalyst loading until the optimalpoint is reached at the 1.0 g/L photocatalyst. Under these conditions, the ZnO systemachieved a degradation of 49.36%. Beyond 1.0 g/L, degradation has slightly decreasedwith photocatalyst loading due to the effect of light scattering from excess photocatalysts.Besides, a long-life study (22 h) showed a degradation of 74.12% for the ZnO system.
There are still many reports from previous photocatalytic works in the open litera-ture using different photocatalysts summarized in Table 4. Different photocatalysts willshow different results in POME waste due to the nature of both. Although, activators(UV light/visible light) also play a very important role in photocatalysis. For example,a material with a wide bandgap can only be activated by UV light. Therefore, the se-lection of photocatalysts and activators is very important to ensure the effectiveness oforganic degradation.
Table 4. Previous studies of photocatalytic technology for degradation of POME waste.
Photocatalyst Synthesis Method Light Source Degradation Rate Catalyst Loading Ref.
TiO2 nanoparticles(Degussa P25) n.a. (Commercial) UV B lamp
COD removal: 89% (5 h)TOD removal: 57% (5 h)Color reduction: 60% (5 h)
0.1 g/L [115]
Cu/TiO2 (Degussa P25) Impregnation UV lamp(1000 W) COD removal: 27% (1 h); >40% (7 h) 0.83 g/L
(20 wt % Cu/TiO2) [116]
TiO2 Sol-gel UV Fluorescent tube (20 W)COD removal: 97% (42 min)BOD removal: 95% (42 min)Decolorization: 92% (42 min)
0.01 g/L [117]
TiO2 commercial n.a. (Commercial) UV lamp(100 W)
COD removal: 52% (4 h)COD removal: 78% (20 h) 1.0 g/L [118]
TiO2 commercial n.a. (Commercial) UV lamp(100 W)
COD removal: 55% (4 h)BOD removal: 44% (4 h) 1.04 g/L [119]
TiO2 n.a. (Commercial) UV lamp(100 W)
COD removal: 52% (4 h); 80% (22 h) 1.0 g/L [114]ZnO COD removal: 49% (4 h); 74% (22 h)
TiO2 anatase n.a. (Commercial) Solar light COD removal: 88% (5 h) 0.1 g/L [120]
Pt/TiO2 Impregnation
UV lamp(100 W) COD removal: 90% (8 h)
1.0 g/L(0.5 wt % Pt/TiO2) [44]
Xenon lamp(100 W) COD removal: 11% (8 h)
Ag/TiO2 Impregnation
UV lamp(100 W) COD removal: 85% (8 h) 1.0 g/L
(0.5 wt % Ag/TiO2)[121]
Xenon lamp(100 W) COD removal: 60% (8 h) 1.0 g/L
(0.5 wt % Ag/TiO2)
Ag/TiO2 Impregnation Visible lamp (250 W) COD removal: 27% (8 h) 1.5 g/L(0.5 wt % Ag/TiO2) [45]
CaFe2O4Auto-combustion and
coprecipitation Xenon lamp (500 W) COD removal: 56% (8 h) 1.0 g/L [122]
CaFe2O4 Coprecipitation Xenon lamp (500 W) COD removal: 69% (8 h) 0.75 g/L [123]
WO3 commercial n.a. (Commercial) UV lamp(100 W)
COD removal: 51% (4 h); 85% (16 h)Decolorization: 96% (4 h); 98% (16 h) 0.5 g/L [106]
ZnO commercial n.a. (Commercial) Mercury lamp (100 W) COD removal: 50% (4 h); 75% (22 h) 1.0 g/L [124]
ZnO-PEG Precipitation UV lamp(15 W)
COD removal: 94%Decolorization: 84% 0.5 g/L [125]
ZnO Facile andsurfactant-free reflux Pen-ray UV-C (light intensity
5400 µW/cm2)COD removal: 96% (2 h) 1.0 g/L [126]
ZnO commercial n.a. (Commercial) COD removal: 69% (2 h)
Nb2O5/ZnO Surfactant-free chemicalsolution UV lamp COD removal: 92% (4 h)
Decolorization: 100% (30 min) 3 wt % Nb2O5/ZnO [127]
Materials 2021, 14, 2846 18 of 35
6.2.2. Modification and Doping of the Semiconductor Based Photocatalyst
The energy band in semiconductor photocatalyst is an important factor in photocat-alytic reactions. The range of light energy that photocatalysts can absorb depends on theenergy bandgap. The wider the bandgap of energy it will limit its use in visible light. Asexplained in Section 6.1, the basic principle of photocatalysis depends on electron–holeexcitation. The electrons in the valence band can be excited into the conduction band,and photon energy stimulation is needed. A wider bandgap of energy requires morephoton energy to excite the electron–hole. For example, the anatase type TiO2 band gapis 3.2 eV [128], which shows that electrons can only be excited by light with more energy,that is, UV light.
Of the various existing photocatalysts, TiO2 has become a photocatalyst that hasreceived much attention. Many researchers are making efforts to overcome the weaknessof TiO2 photocatalyst, which has been described in Section 6.2.1. These efforts are mod-ifying TiO2 photocatalysts to have a narrower energy band, a slow recombination rate,accelerating interfacial charge transfer. All these efforts aim to get better photocatalyticactivity. One method of photocatalyst modification is through doping. It can control thesemiconductor’s bandgap structure by adding a small number of impurity atoms (dopants).This section explains methods for modifying TiO2 by doping methods and their effects onphotocatalytic activity.
Doping
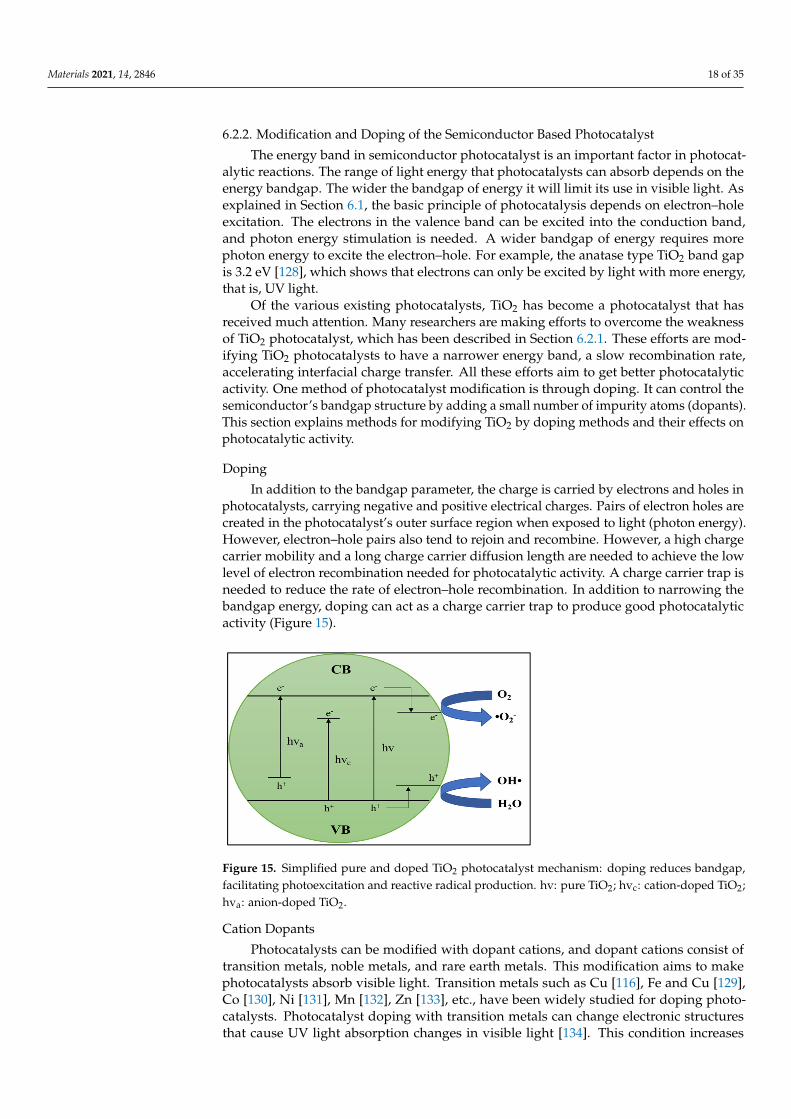
In addition to the bandgap parameter, the charge is carried by electrons and holes inphotocatalysts, carrying negative and positive electrical charges. Pairs of electron holes arecreated in the photocatalyst’s outer surface region when exposed to light (photon energy).However, electron–hole pairs also tend to rejoin and recombine. However, a high chargecarrier mobility and a long charge carrier diffusion length are needed to achieve the lowlevel of electron recombination needed for photocatalytic activity. A charge carrier trap isneeded to reduce the rate of electron–hole recombination. In addition to narrowing thebandgap energy, doping can act as a charge carrier trap to produce good photocatalyticactivity (Figure 15).
Materials 2021, 14, x FOR PEER REVIEW 19 of 37
(15 W) Decolorization: 84%
ZnO Facile and
surfactant-free reflux
Pen-ray UV-C (light intensity 5400 μW/cm2)
COD removal: 96% (2 h) 1.0 g/L [126]
ZnO commercial n.a. (Commercial)
COD removal: 69% (2 h)
Nb2O5/ZnO Surfactant-free
chemical solution
UV lamp COD removal: 92% (4 h) Decolorization: 100% (30 min) 3 wt % Nb2O5/ZnO [127]
6.2.2. Modification and Doping of the Semiconductor Based Photocatalyst The energy band in semiconductor photocatalyst is an important factor in photocata-
lytic reactions. The range of light energy that photocatalysts can absorb depends on the energy bandgap. The wider the bandgap of energy it will limit its use in visible light. As explained in Section 6.1, the basic principle of photocatalysis depends on electron–hole excitation. The electrons in the valence band can be excited into the conduction band, and photon energy stimulation is needed. A wider bandgap of energy requires more photon energy to excite the electron–hole. For example, the anatase type TiO2 band gap is 3.2 eV [128], which shows that electrons can only be excited by light with more energy, that is, UV light.
Of the various existing photocatalysts, TiO2 has become a photocatalyst that has re-ceived much attention. Many researchers are making efforts to overcome the weakness of TiO2 photocatalyst, which has been described in Section 6.2.1. These efforts are modifying TiO2 photocatalysts to have a narrower energy band, a slow recombination rate, acceler-ating interfacial charge transfer. All these efforts aim to get better photocatalytic activity. One method of photocatalyst modification is through doping. It can control the semicon-ductor’s bandgap structure by adding a small number of impurity atoms (dopants). This section explains methods for modifying TiO2 by doping methods and their effects on pho-tocatalytic activity.
Doping In addition to the bandgap parameter, the charge is carried by electrons and holes in
photocatalysts, carrying negative and positive electrical charges. Pairs of electron holes are created in the photocatalyst’s outer surface region when exposed to light (photon en-ergy). However, electron–hole pairs also tend to rejoin and recombine. However, a high charge carrier mobility and a long charge carrier diffusion length are needed to achieve the low level of electron recombination needed for photocatalytic activity. A charge carrier trap is needed to reduce the rate of electron–hole recombination. In addition to narrowing the bandgap energy, doping can act as a charge carrier trap to produce good photocata-lytic activity (Figure 15).
Figure 15. Simplified pure and doped TiO2 photocatalyst mechanism: doping reduces bandgap,facilitating photoexcitation and reactive radical production. hv: pure TiO2; hvc: cation-doped TiO2;hva: anion-doped TiO2.
Cation Dopants
Photocatalysts can be modified with dopant cations, and dopant cations consist oftransition metals, noble metals, and rare earth metals. This modification aims to makephotocatalysts absorb visible light. Transition metals such as Cu [116], Fe and Cu [129],Co [130], Ni [131], Mn [132], Zn [133], etc., have been widely studied for doping photo-catalysts. Photocatalyst doping with transition metals can change electronic structuresthat cause UV light absorption changes in visible light [134]. This condition increases

Materials 2021, 14, 2846 19 of 35
photocatalytic activity—for example, photocatalyst TiO2, which has Ti 3d and O 2p atomicorbitals. If doped with Fe, which has 3d atomic orbitals, it can shift the CB boundary andnarrow the photocatalyst energy bandgap, as presented in Figure 16. If the bandgap energyis narrower, it can shift absorption into visible light as the photocatalyst’s doped metalconcentration increases. Increased absorption in visible light may be due to the transfer ofelectrons from the metal ion orbitals to the CB photocatalyst. For instances, Ng et al. [116]reported that 20 wt % Cu/TiO2 exhibited two-folds enhancement of photocatalytic rate con-stant for POME degradation compared to 2 wt % Cu/TiO2, which was due to larger porediameter [116]. In addition, doping TiO2 with 0.5 wt % of Ag (0.5 wt % Ag/TiO2) exhibited3.5 and 8.6 times higher photocatalytic rate constant for POME degradation under UV andvisible light illumination, respectively. This enhancement can be attributed to the narrowerband gap energy of Ag/TiO2 and thus improved visible light absorption. In addition, Agmay have also enhanced the charge separation by rapidly-transferring the e− away fromthe positive h+ charge on the TiO2 surface, thus minimizing charge recombination [121].
Materials 2021, 14, x FOR PEER REVIEW 20 of 37
Figure 15. Simplified pure and doped TiO2 photocatalyst mechanism: doping reduces bandgap, facilitating photoexcitation and reactive radical production. hv: pure TiO2; hvc: cation-doped TiO2; hva: anion-doped TiO2.
Cation Dopants Photocatalysts can be modified with dopant cations, and dopant cations consist of
transition metals, noble metals, and rare earth metals. This modification aims to make photocatalysts absorb visible light. Transition metals such as Cu [116], Fe and Cu [129], Co [130], Ni [131], Mn [132], Zn [133], etc., have been widely studied for doping photo-catalysts. Photocatalyst doping with transition metals can change electronic structures that cause UV light absorption changes in visible light [134]. This condition increases pho-tocatalytic activity—for example, photocatalyst TiO2, which has Ti 3d and O 2p atomic orbitals. If doped with Fe, which has 3d atomic orbitals, it can shift the CB boundary and narrow the photocatalyst energy bandgap, as presented in Figure 16. If the bandgap en-ergy is narrower, it can shift absorption into visible light as the photocatalyst’s doped metal concentration increases. Increased absorption in visible light may be due to the transfer of electrons from the metal ion orbitals to the CB photocatalyst. For instances, Ng et al. [116] reported that 20 wt % Cu/TiO2 exhibited two-folds enhancement of photocata-lytic rate constant for POME degradation compared to 2 wt % Cu/TiO2, which was due to larger pore diameter [116]. In addition, doping TiO2 with 0.5 wt % of Ag (0.5 wt % Ag/TiO2) exhibited 3.5 and 8.6 times higher photocatalytic rate constant for POME degra-dation under UV and visible light illumination, respectively. This enhancement can be attributed to the narrower band gap energy of Ag/TiO2 and thus improved visible light absorption. In addition, Ag may have also enhanced the charge separation by rapidly-transferring the e− away from the positive h+ charge on the TiO2 surface, thus minimizing charge recombination [121].
Metal with redox potential can act as an electron trap to function as an electron ac-ceptor to hold electron–hole pairs’ recombination. On the other hand, electrons trapped in metals that have a high reduction potential can cause a reduction of some metals and consume electrons instead of moving them to the surface [135]. Transition metals with two or more oxidation states, such as Fe and Ce, with different ionic forms (Fe2+, Fe3+, and Fe4+ and Ce3+ and Ce4+) can also act electron–hole traps and inhibit the recombination of electron–hole pairs. However, electron holes’ recombination rate can increase with in-creasing metal concentrations because metal ions acting as electron traps and hole traps will then form various trap sites. Suppose there are many charge traps in the bulk of cat-alysts or on the surface surfaces. In that case, the mobility will be low, and possible to recombine electron–hole pairs before reaching the surface [136].
Figure 16. The schematic energy level of undoped TiO2 and iron-doped TiO2 (Fe-TiO2)
Anion Dopants
Figure 16. The schematic energy level of undoped TiO2 and iron-doped TiO2 (Fe-TiO2).
Metal with redox potential can act as an electron trap to function as an electronacceptor to hold electron–hole pairs’ recombination. On the other hand, electrons trappedin metals that have a high reduction potential can cause a reduction of some metals andconsume electrons instead of moving them to the surface [135]. Transition metals with twoor more oxidation states, such as Fe and Ce, with different ionic forms (Fe2+, Fe3+, andFe4+ and Ce3+ and Ce4+) can also act electron–hole traps and inhibit the recombinationof electron–hole pairs. However, electron holes’ recombination rate can increase withincreasing metal concentrations because metal ions acting as electron traps and hole trapswill then form various trap sites. Suppose there are many charge traps in the bulk ofcatalysts or on the surface surfaces. In that case, the mobility will be low, and possible torecombine electron–hole pairs before reaching the surface [136].
Anion Dopants
TiO2 can also be doped on O sites with anions such as nitrogen (N) [137], sulphur(S) [138], carbon (C) [139], and boron (B) [140]. The combination of p orbitals from dopantanions (N, S, C, and B) with O 2p orbitals increased the valence band (VB) and cannarrow the photocatalyst energy bandgap (Figure 17). Doping using nonmetallic carbon(C) can also be an electron trap from electrons produced by photoexcitation, reducingelectron–hole pairs’ recombination rate. Carbon (C) has a wide absorption spectrum areaof 400–800 nm to encourage a charge transfer from the inside of the photocatalyst to thesurface. Carbon doped TiO2 showed significant changes from the absorption edge withcalcination temperatures of 200, 300, 400, and 500 ◦C having absorption edges at 390, 400,410, and 450 nm. The absorption shifted slightly towards the visible region compared tocommercial TiO2 at 385 nm [141]. Kalantari et al. [142] reported that the energy of N doped
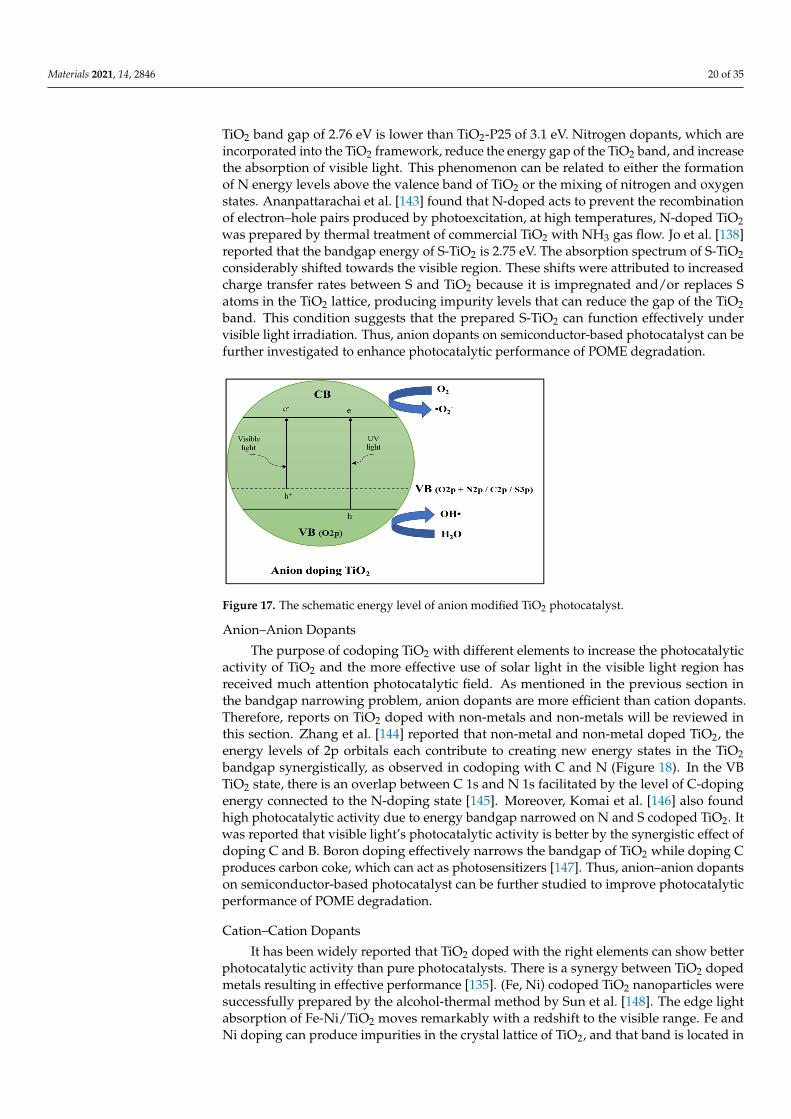
Materials 2021, 14, 2846 20 of 35
TiO2 band gap of 2.76 eV is lower than TiO2-P25 of 3.1 eV. Nitrogen dopants, which areincorporated into the TiO2 framework, reduce the energy gap of the TiO2 band, and increasethe absorption of visible light. This phenomenon can be related to either the formationof N energy levels above the valence band of TiO2 or the mixing of nitrogen and oxygenstates. Ananpattarachai et al. [143] found that N-doped acts to prevent the recombinationof electron–hole pairs produced by photoexcitation, at high temperatures, N-doped TiO2was prepared by thermal treatment of commercial TiO2 with NH3 gas flow. Jo et al. [138]reported that the bandgap energy of S-TiO2 is 2.75 eV. The absorption spectrum of S-TiO2considerably shifted towards the visible region. These shifts were attributed to increasedcharge transfer rates between S and TiO2 because it is impregnated and/or replaces Satoms in the TiO2 lattice, producing impurity levels that can reduce the gap of the TiO2band. This condition suggests that the prepared S-TiO2 can function effectively undervisible light irradiation. Thus, anion dopants on semiconductor-based photocatalyst can befurther investigated to enhance photocatalytic performance of POME degradation.
Materials 2021, 14, x FOR PEER REVIEW 21 of 37
TiO2 can also be doped on O sites with anions such as nitrogen (N) [137], sulphur (S) [138], carbon (C) [139], and boron (B) [140]. The combination of p orbitals from dopant anions (N, S, C, and B) with O 2p orbitals increased the valence band (VB) and can narrow the photocatalyst energy bandgap (Figure 17). Doping using nonmetallic carbon (C) can also be an electron trap from electrons produced by photoexcitation, reducing electron–hole pairs’ recombination rate. Carbon (C) has a wide absorption spectrum area of 400–800 nm to encourage a charge transfer from the inside of the photocatalyst to the surface. Carbon doped TiO2 showed significant changes from the absorption edge with calcination temperatures of 200, 300, 400, and 500 °C having absorption edges at 390, 400, 410, and 450 nm. The absorption shifted slightly towards the visible region compared to commer-cial TiO2 at 385 nm [141]. Kalantari et al. [142] reported that the energy of N doped TiO2 band gap of 2.76 eV is lower than TiO2-P25 of 3.1 eV. Nitrogen dopants, which are incor-porated into the TiO2 framework, reduce the energy gap of the TiO2 band, and increase the absorption of visible light. This phenomenon can be related to either the formation of N energy levels above the valence band of TiO2 or the mixing of nitrogen and oxygen states. Ananpattarachai et al. [143] found that N-doped acts to prevent the recombination of electron–hole pairs produced by photoexcitation, at high temperatures, N-doped TiO2 was prepared by thermal treatment of commercial TiO2 with NH3 gas flow. Jo et al. [138] reported that the bandgap energy of S-TiO2 is 2.75 eV. The absorption spectrum of S-TiO2 considerably shifted towards the visible region. These shifts were attributed to increased charge transfer rates between S and TiO2 because it is impregnated and/or replaces S at-oms in the TiO2 lattice, producing impurity levels that can reduce the gap of the TiO2 band. This condition suggests that the prepared S-TiO2 can function effectively under visible light irradiation. Thus, anion dopants on semiconductor-based photocatalyst can be fur-ther investigated to enhance photocatalytic performance of POME degradation.
Figure 17. The schematic energy level of anion modified TiO2 photocatalyst
Anion–Anion Dopants The purpose of codoping TiO2 with different elements to increase the photocatalytic
activity of TiO2 and the more effective use of solar light in the visible light region has received much attention photocatalytic field. As mentioned in the previous section in the bandgap narrowing problem, anion dopants are more efficient than cation dopants. Therefore, reports on TiO2 doped with non-metals and non-metals will be reviewed in this section. Zhang et al. [144] reported that non-metal and non-metal doped TiO2, the energy levels of 2p orbitals each contribute to creating new energy states in the TiO2 bandgap synergistically, as observed in codoping with C and N (Figure 18). In the VB TiO2 state, there is an overlap between C 1s and N 1s facilitated by the level of C-doping energy connected to the N-doping state [145]. Moreover, Komai et al. [146] also found high pho-tocatalytic activity due to energy bandgap narrowed on N and S codoped TiO2. It was reported that visible light’s photocatalytic activity is better by the synergistic effect of
Figure 17. The schematic energy level of anion modified TiO2 photocatalyst.
Anion–Anion Dopants
The purpose of codoping TiO2 with different elements to increase the photocatalyticactivity of TiO2 and the more effective use of solar light in the visible light region hasreceived much attention photocatalytic field. As mentioned in the previous section inthe bandgap narrowing problem, anion dopants are more efficient than cation dopants.Therefore, reports on TiO2 doped with non-metals and non-metals will be reviewed inthis section. Zhang et al. [144] reported that non-metal and non-metal doped TiO2, theenergy levels of 2p orbitals each contribute to creating new energy states in the TiO2bandgap synergistically, as observed in codoping with C and N (Figure 18). In the VBTiO2 state, there is an overlap between C 1s and N 1s facilitated by the level of C-dopingenergy connected to the N-doping state [145]. Moreover, Komai et al. [146] also foundhigh photocatalytic activity due to energy bandgap narrowed on N and S codoped TiO2. Itwas reported that visible light’s photocatalytic activity is better by the synergistic effect ofdoping C and B. Boron doping effectively narrows the bandgap of TiO2 while doping Cproduces carbon coke, which can act as photosensitizers [147]. Thus, anion–anion dopantson semiconductor-based photocatalyst can be further studied to improve photocatalyticperformance of POME degradation.
Cation–Cation Dopants
It has been widely reported that TiO2 doped with the right elements can show betterphotocatalytic activity than pure photocatalysts. There is a synergy between TiO2 dopedmetals resulting in effective performance [135]. (Fe, Ni) codoped TiO2 nanoparticles weresuccessfully prepared by the alcohol-thermal method by Sun et al. [148]. The edge lightabsorption of Fe-Ni/TiO2 moves remarkably with a redshift to the visible range. Fe andNi doping can produce impurities in the crystal lattice of TiO2, and that band is located in
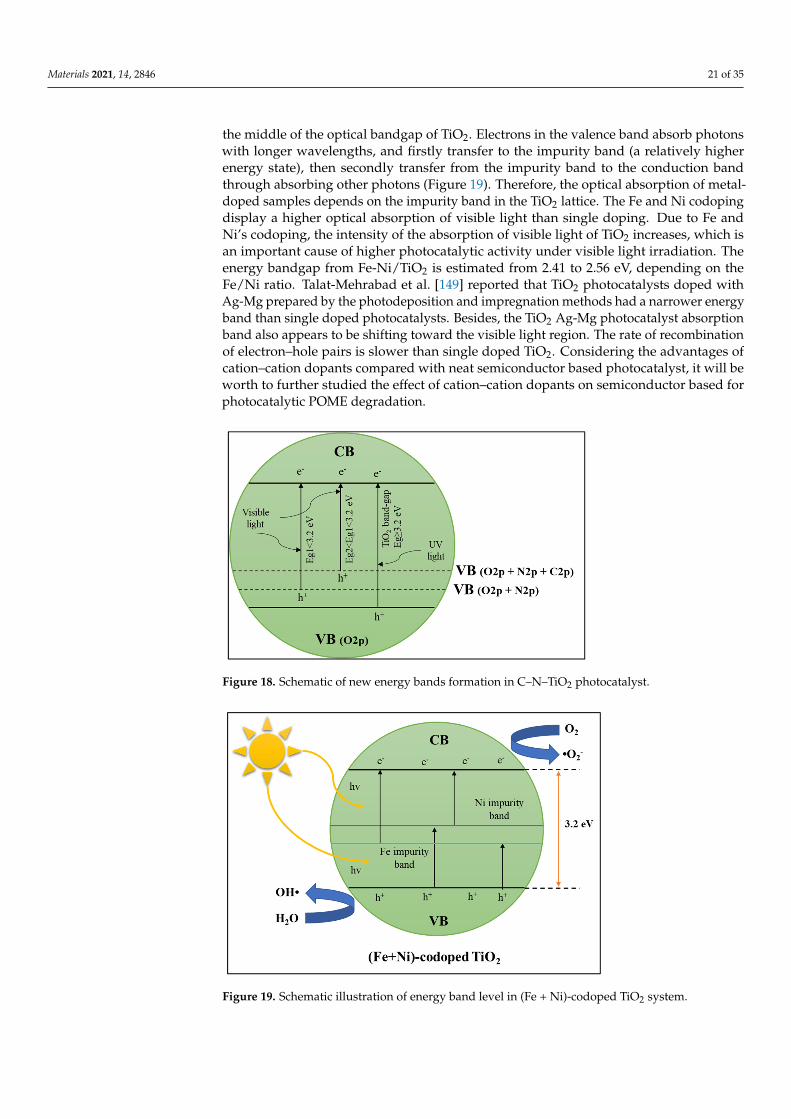
Materials 2021, 14, 2846 21 of 35
the middle of the optical bandgap of TiO2. Electrons in the valence band absorb photonswith longer wavelengths, and firstly transfer to the impurity band (a relatively higherenergy state), then secondly transfer from the impurity band to the conduction bandthrough absorbing other photons (Figure 19). Therefore, the optical absorption of metal-doped samples depends on the impurity band in the TiO2 lattice. The Fe and Ni codopingdisplay a higher optical absorption of visible light than single doping. Due to Fe andNi’s codoping, the intensity of the absorption of visible light of TiO2 increases, which isan important cause of higher photocatalytic activity under visible light irradiation. Theenergy bandgap from Fe-Ni/TiO2 is estimated from 2.41 to 2.56 eV, depending on theFe/Ni ratio. Talat-Mehrabad et al. [149] reported that TiO2 photocatalysts doped withAg-Mg prepared by the photodeposition and impregnation methods had a narrower energyband than single doped photocatalysts. Besides, the TiO2 Ag-Mg photocatalyst absorptionband also appears to be shifting toward the visible light region. The rate of recombinationof electron–hole pairs is slower than single doped TiO2. Considering the advantages ofcation–cation dopants compared with neat semiconductor based photocatalyst, it will beworth to further studied the effect of cation–cation dopants on semiconductor based forphotocatalytic POME degradation.
Materials 2021, 14, x FOR PEER REVIEW 22 of 37
doping C and B. Boron doping effectively narrows the bandgap of TiO2 while doping C produces carbon coke, which can act as photosensitizers [147]. Thus, anion–anion dopants on semiconductor-based photocatalyst can be further studied to improve photocatalytic performance of POME degradation.
Figure 18. Schematic of new energy bands formation in C–N–TiO2 photocatalyst
Cation–Cation Dopants It has been widely reported that TiO2 doped with the right elements can show better
photocatalytic activity than pure photocatalysts. There is a synergy between TiO2 doped metals resulting in effective performance [135]. (Fe, Ni) codoped TiO2 nanoparticles were successfully prepared by the alcohol-thermal method by Sun et al. [148]. The edge light absorption of Fe-Ni/TiO2 moves remarkably with a redshift to the visible range. Fe and Ni doping can produce impurities in the crystal lattice of TiO2, and that band is located in the middle of the optical bandgap of TiO2. Electrons in the valence band absorb photons with longer wavelengths, and firstly transfer to the impurity band (a relatively higher energy state), then secondly transfer from the impurity band to the conduction band through ab-sorbing other photons (Figure 19). Therefore, the optical absorption of metal-doped sam-ples depends on the impurity band in the TiO2 lattice. The Fe and Ni codoping display a higher optical absorption of visible light than single doping. Due to Fe and Ni’s codoping, the intensity of the absorption of visible light of TiO2 increases, which is an important cause of higher photocatalytic activity under visible light irradiation. The energy bandgap from Fe-Ni/TiO2 is estimated from 2.41 to 2.56 eV, depending on the Fe/Ni ratio. Talat-Mehrabad et al. [149] reported that TiO2 photocatalysts doped with Ag-Mg prepared by the photodeposition and impregnation methods had a narrower energy band than single doped photocatalysts. Besides, the TiO2 Ag-Mg photocatalyst absorption band also ap-pears to be shifting toward the visible light region. The rate of recombination of electron–hole pairs is slower than single doped TiO2. Considering the advantages of cation–cation dopants compared with neat semiconductor based photocatalyst, it will be worth to fur-ther studied the effect of cation–cation dopants on semiconductor based for photocatalytic POME degradation.
Figure 18. Schematic of new energy bands formation in C–N–TiO2 photocatalyst.Materials 2021, 14, x FOR PEER REVIEW 23 of 37
Figure 19. Schematic illustration of energy band level in (Fe + Ni)-codoped TiO2 system.
Cation–Anion Dopants As discussed in the previous section, anion dopants can narrow the bandgap energy
better than cation dopants, but anion dopants tend to form the center of recombination. While cation dopants have excellent performance in reducing electron recombination pairing, metal ions suffer from thermal stability problems. Therefore, codoping cations and anions on TiO2 are considered to overcome the weaknesses in doping TiO2 with single metals and non-metals. The electronic structure of TiO2 will change the effect of metal and non-metal ions by creating new doping levels in the bandgap [135]. The synergistic effect of doping between metals and non-metals will increase the excitation rate of electrons and holes and increase the photocatalytic activity of TiO2 in the visible light region.
Quan et al. [150] reported that Mn-doped TiO2 showed significant photocatalytic ac-tivity under irradiation of visible light compared to pure TiO2, and codoping Mn and N further enhanced this activity into TiO2. The Mn doping could narrow the TiO2 bandgap extending the absorption range of TiO2 to visible light and inhibits the recombination of electrons and photogeneration holes, which leads to a better increase in photocatalytic activity in the visible light region. Additionally, Mn-N-TiO2 shows the absorption of visi-ble light stronger than Mn-TiO2. The relatively strong absorption at 400–650 nm was at-tributed to the codoping of N and Mn elements into the lattice of TiO2. It is generally ac-cepted that doping N can form a narrow N 2p band isolated above the O 2p TiO2 valence band, reducing the gap of the TiO2 band and absorbing visible light. As illustrated in Fig-ure 20, Mn and N ions’ synergistic effect narrows the bandgap of TiO2, which forms a new closed state, respectively, in the conduction band and valence band.
Jaiswal et al. [151] reported that TiO2 doped with V and N had better visible light absorption efficiency than single V and N doped TiO2. This condition is caused by nar-rowing the bandgap effect of the simultaneous merging between V and N into TiO2. Be-sides, it was reported that La3+ doping could withstand the recombination rate of electron–hole pairs. In contrast, doping N could reduce the TiO2 bandgap and increase the effi-ciency of TiO2 absorption in the visible light region [152]. Gaikwad et al. [153] reported that codoping TiO2 with Fe and N narrowed the bandgap of TiO2 and showed increased absorption of visible light and showed increased photocatalytic activity. It was found that M, N codoped TiO2 specimens have higher photocatalytic capabilities than pure TiO2 and mono-doped TiO2 under visible light irradiation. Besides, bandgap and carrier mobility in VB, CB, and impurity levels (ILs) have a synergistic effect on the absorption of visible light and photocatalytic activity of doped TiO2. The impurity states between VB and CB increase the absorption of visible light. The concentration of N in the codoped specimen effectively affects IL states. The amount and mobility of IL carriers together influence the
Figure 19. Schematic illustration of energy band level in (Fe + Ni)-codoped TiO2 system.
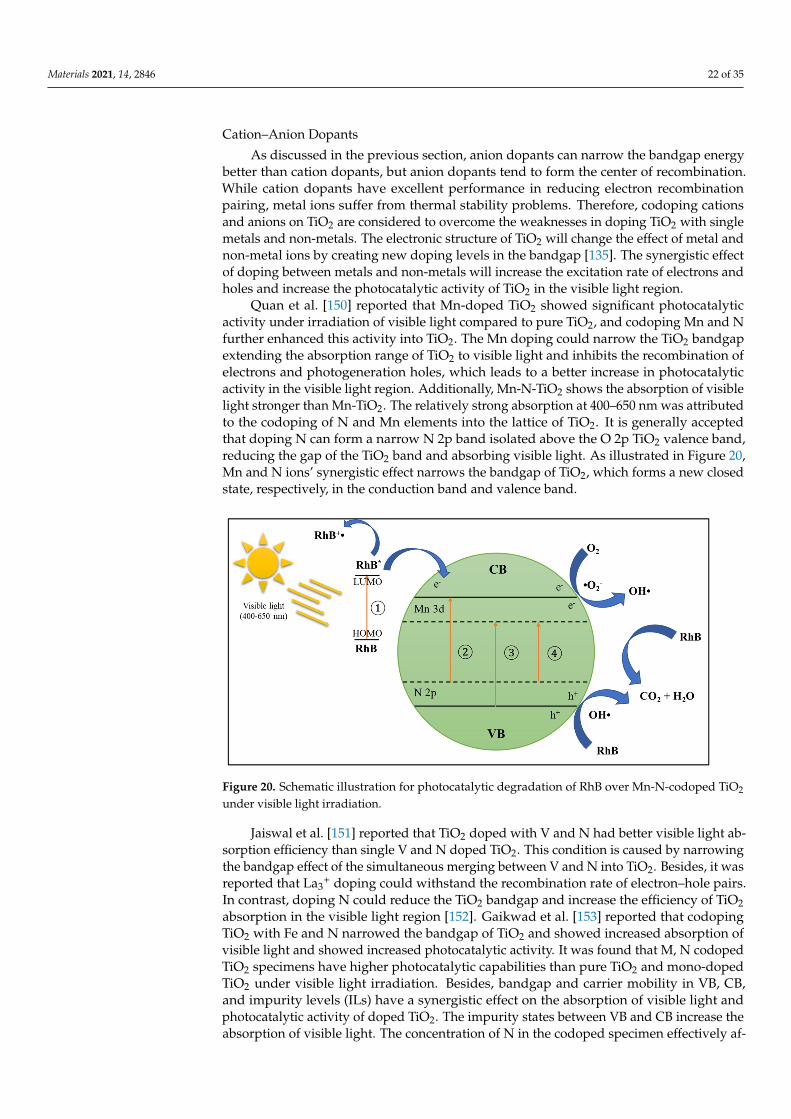
Materials 2021, 14, 2846 22 of 35
Cation–Anion Dopants
As discussed in the previous section, anion dopants can narrow the bandgap energybetter than cation dopants, but anion dopants tend to form the center of recombination.While cation dopants have excellent performance in reducing electron recombinationpairing, metal ions suffer from thermal stability problems. Therefore, codoping cationsand anions on TiO2 are considered to overcome the weaknesses in doping TiO2 with singlemetals and non-metals. The electronic structure of TiO2 will change the effect of metal andnon-metal ions by creating new doping levels in the bandgap [135]. The synergistic effectof doping between metals and non-metals will increase the excitation rate of electrons andholes and increase the photocatalytic activity of TiO2 in the visible light region.
Quan et al. [150] reported that Mn-doped TiO2 showed significant photocatalyticactivity under irradiation of visible light compared to pure TiO2, and codoping Mn and Nfurther enhanced this activity into TiO2. The Mn doping could narrow the TiO2 bandgapextending the absorption range of TiO2 to visible light and inhibits the recombination ofelectrons and photogeneration holes, which leads to a better increase in photocatalyticactivity in the visible light region. Additionally, Mn-N-TiO2 shows the absorption of visiblelight stronger than Mn-TiO2. The relatively strong absorption at 400–650 nm was attributedto the codoping of N and Mn elements into the lattice of TiO2. It is generally acceptedthat doping N can form a narrow N 2p band isolated above the O 2p TiO2 valence band,reducing the gap of the TiO2 band and absorbing visible light. As illustrated in Figure 20,Mn and N ions’ synergistic effect narrows the bandgap of TiO2, which forms a new closedstate, respectively, in the conduction band and valence band.
Materials 2021, 14, x FOR PEER REVIEW 24 of 37
photocatalytic activity of the catalyst under visible light. Thus, Mn, N codoping specimens showed better photocatalytic activity [154]. Considering the improvement of photocata-lytic performance for organic degradation (i.e., rhodamine blue) by adding cation–anion dopants on semiconductor, it is highly recommended to further observed the effect of cat-ion–anion dopants on photocatalytic POME degradation.
Figure 20. Schematic illustration for photocatalytic degradation of RhB over Mn-N-codoped TiO2 under visible light irradiation.
Other Semiconductors Dopants Combining TiO2 photocatalysts into hybrid forms with other semiconductors with
narrow bandgaps such as CdS, Cu2O, Bi2S3, and SnO2 are other strategies for modifying energy bands, inhibiting the rate of recombination of electron–hole pairs to increase pho-tocatalytic activity. The principle of dopants with other semiconductors is that narrow bandgap semiconductors absorb photon energy from visible light. Photogeneration elec-trons are then transferred from the narrow bandgap semiconductor CB to the CB TiO2. Electrons can only be transferred if the narrow band edge semiconductor CB edge is more negative than the CB TiO2 edge [135]. Bessekhouad et al. [155] reported that the higher the CB difference between two semiconductors, the higher the electron transfer driving force. CdS nanoparticles not only act as sensitizers but also reduce the rate of photogenerated charge carrier recombination. Besides, the results of photoactivity showed that TiO2 doped by CdS exhibited better photocatalytic performance [156]. Boumaza et al. [157] also reported that the azo Orange G dye was successfully degraded in the hetero-system x% Bi2S3/TiO2 under visible light. Loading TiO2 with Bi2S3 greatly enhances photoactivity due to the transfer of electrons from Bi2S3 to TiO2 by the synergy effect. This increased photo activity is caused by Bi2S3 dispersion, which effectively increases the reception of visible photons. SnO2 surface coupling to TiO2 acts as a trap for photogeneration electrons. It thereby decreases the rate of recombination of electron–hole pairs and further increases the photocatalytic activity of TiO2 under irradiation of visible light [158]. Cu2O@TiO2 na-noparticles showed increased photocatalytic degradation when compared to pure Cu2O nanocubes and TiO2 nanoparticles. The consequence of photoelectrochemical measure-ments shows that the composite heterojunction of p-Cu2O/n-TiO2 can facilitate the transfer of electrons across the heterojunction interface, advantageous for improving photocata-lytic performance. The experimental results show that Cu2O nanocubes extensively en-hance the TiO2 response, which shows higher activity compared to neat TiO2 [159]. In the case of POME treatment, Chin et al. [127] reported that 3 wt % Nb2O5/ZnO exhibited 3.7 and 1.4-folds enhancement of COD removal after 240 min and color removal after 30 min photocatalytic reaction durations, respectively. Taking into account the advantages of
Figure 20. Schematic illustration for photocatalytic degradation of RhB over Mn-N-codoped TiO2
under visible light irradiation.
Jaiswal et al. [151] reported that TiO2 doped with V and N had better visible light ab-sorption efficiency than single V and N doped TiO2. This condition is caused by narrowingthe bandgap effect of the simultaneous merging between V and N into TiO2. Besides, it wasreported that La3
+ doping could withstand the recombination rate of electron–hole pairs.In contrast, doping N could reduce the TiO2 bandgap and increase the efficiency of TiO2absorption in the visible light region [152]. Gaikwad et al. [153] reported that codopingTiO2 with Fe and N narrowed the bandgap of TiO2 and showed increased absorption ofvisible light and showed increased photocatalytic activity. It was found that M, N codopedTiO2 specimens have higher photocatalytic capabilities than pure TiO2 and mono-dopedTiO2 under visible light irradiation. Besides, bandgap and carrier mobility in VB, CB,and impurity levels (ILs) have a synergistic effect on the absorption of visible light andphotocatalytic activity of doped TiO2. The impurity states between VB and CB increase theabsorption of visible light. The concentration of N in the codoped specimen effectively af-
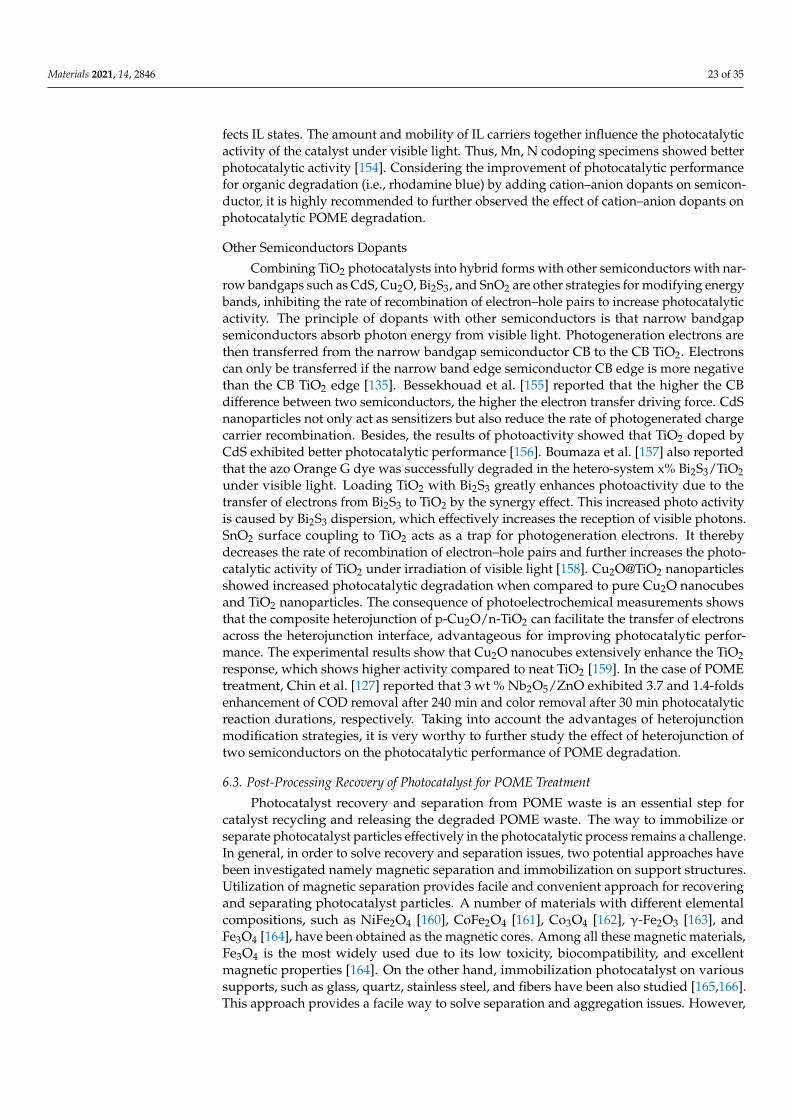
Materials 2021, 14, 2846 23 of 35
fects IL states. The amount and mobility of IL carriers together influence the photocatalyticactivity of the catalyst under visible light. Thus, Mn, N codoping specimens showed betterphotocatalytic activity [154]. Considering the improvement of photocatalytic performancefor organic degradation (i.e., rhodamine blue) by adding cation–anion dopants on semicon-ductor, it is highly recommended to further observed the effect of cation–anion dopants onphotocatalytic POME degradation.
Other Semiconductors Dopants
Combining TiO2 photocatalysts into hybrid forms with other semiconductors with nar-row bandgaps such as CdS, Cu2O, Bi2S3, and SnO2 are other strategies for modifying energybands, inhibiting the rate of recombination of electron–hole pairs to increase photocatalyticactivity. The principle of dopants with other semiconductors is that narrow bandgapsemiconductors absorb photon energy from visible light. Photogeneration electrons arethen transferred from the narrow bandgap semiconductor CB to the CB TiO2. Electronscan only be transferred if the narrow band edge semiconductor CB edge is more negativethan the CB TiO2 edge [135]. Bessekhouad et al. [155] reported that the higher the CBdifference between two semiconductors, the higher the electron transfer driving force. CdSnanoparticles not only act as sensitizers but also reduce the rate of photogenerated chargecarrier recombination. Besides, the results of photoactivity showed that TiO2 doped byCdS exhibited better photocatalytic performance [156]. Boumaza et al. [157] also reportedthat the azo Orange G dye was successfully degraded in the hetero-system x% Bi2S3/TiO2under visible light. Loading TiO2 with Bi2S3 greatly enhances photoactivity due to thetransfer of electrons from Bi2S3 to TiO2 by the synergy effect. This increased photo activityis caused by Bi2S3 dispersion, which effectively increases the reception of visible photons.SnO2 surface coupling to TiO2 acts as a trap for photogeneration electrons. It therebydecreases the rate of recombination of electron–hole pairs and further increases the photo-catalytic activity of TiO2 under irradiation of visible light [158]. Cu2O@TiO2 nanoparticlesshowed increased photocatalytic degradation when compared to pure Cu2O nanocubesand TiO2 nanoparticles. The consequence of photoelectrochemical measurements showsthat the composite heterojunction of p-Cu2O/n-TiO2 can facilitate the transfer of electronsacross the heterojunction interface, advantageous for improving photocatalytic perfor-mance. The experimental results show that Cu2O nanocubes extensively enhance the TiO2response, which shows higher activity compared to neat TiO2 [159]. In the case of POMEtreatment, Chin et al. [127] reported that 3 wt % Nb2O5/ZnO exhibited 3.7 and 1.4-foldsenhancement of COD removal after 240 min and color removal after 30 min photocatalyticreaction durations, respectively. Taking into account the advantages of heterojunctionmodification strategies, it is very worthy to further study the effect of heterojunction oftwo semiconductors on the photocatalytic performance of POME degradation.
6.3. Post-Processing Recovery of Photocatalyst for POME Treatment
Photocatalyst recovery and separation from POME waste is an essential step forcatalyst recycling and releasing the degraded POME waste. The way to immobilize orseparate photocatalyst particles effectively in the photocatalytic process remains a challenge.In general, in order to solve recovery and separation issues, two potential approaches havebeen investigated namely magnetic separation and immobilization on support structures.Utilization of magnetic separation provides facile and convenient approach for recoveringand separating photocatalyst particles. A number of materials with different elementalcompositions, such as NiFe2O4 [160], CoFe2O4 [161], Co3O4 [162], γ-Fe2O3 [163], andFe3O4 [164], have been obtained as the magnetic cores. Among all these magnetic materials,Fe3O4 is the most widely used due to its low toxicity, biocompatibility, and excellentmagnetic properties [164]. On the other hand, immobilization photocatalyst on varioussupports, such as glass, quartz, stainless steel, and fibers have been also studied [165,166].This approach provides a facile way to solve separation and aggregation issues. However,
Materials 2021, 14, 2846 24 of 35
this approach could reduce active surface area and volume ratio, decrease mass transfer rate,and hindrance in light absorption, thus photochemical reactivity becomes the main issues.
Therefore, few studies concerned on the development of other approaches to recoverand separate photocatalyst materials have been conducted including: (1) alkaline treatment(NaOH and NH4OH) [167], (2) thermal regeneration [168], (3) exposure to UV in aqueousmedia [169], (4) oxidation by H2O2/UV [167], (5) washing with deionized water [170],(6) refluxing in water at 100 ◦C with oxygen bubbling [171], (6) chemical coagulant (alu-minum chloride [172], chitosan [173], and ferric chloride [174]), and (7) ceramic membranemicrofiltration [175]. Miranda-Garcia et al. [167] reported that thermal and H2O2/UV aremore efficient recovery strategy compared to alkaline treatment due to TiO2 was partiallyremoved by alkaline treatment leading to the decrease of photocatalyst’s performance.Cui et al. [175] reported that ceramic membrane microfiltration could efficiently recoverTiO2 photocatalyst in a slurry reactor by achieving 99.9% recovery rate, realizing a continu-ous operation for wastewater treatment. This post-processing recovery strategies optioncan be further studied with respect to the application of photocatalytic POME degradationboth in lab scale and pilot scale applications.
7. Operational Parameters/Factors Affecting the Photocatalytic Degradation Process
In addition to the previously discussed factors of photocatalysts, effective POMEwaste treatment or the photocatalytic system’s efficiency is greatly influenced by severaloperating parameters or factors that control the photocatalytic kinetics. This section willdiscuss several of these operating parameters that affect the photocatalytic activity and theperformance of TiO2 photocatalysts in POME waste treatment.
7.1. Catalyst Loading
The concentration of TiO2 in the photocatalytic system in POME waste treatmentaffects the rate of heterogeneous photocatalytic reactions. The concentration of TiO2 directlyaffects the rate of photocatalytic reactions [176]. Initially, the effect of TiO2 concentrationis linear to some extent. However, when the concentration of TiO2 increases above thesaturation limit (different concentration of TiO2 causes turbidity of the solution), there willbe a corresponding radial decrease in the coefficient of light absorption (photon energy)and subsequently causes a decrease in the surface area exposed to light irradiation and willreduce the efficiency of the photocatalytic process. Therefore, each photocatalytic processmust be operated below the saturation level of the TiO2 concentration to avoid excessphotocatalysts and ensure efficient absorption of light (photon energy) [69]. Several studieswere conducted to examine TiO2 concentration on process efficiency [176,177]. However,the effect cannot be found, and a direct connection cannot be made. Additionally, it isreported that optimal photocatalyst loading for photomineralization and photodisinfectioncan vary [69]. Based on the Table 4, it can be seen that the optimum catalyst loading forphotocatalytic POME treatment is in the interval between 0.1 and 1.5 g/L.
7.2. pH
One important parameter in a heterogeneous photocatalytic system is pH. Theseparameters determine the nature of the charge on the photocatalyst’s surface, the photocat-alyst’s aggregate size, the conduction band’s position, and the valence [69]. Many attemptsto research and study the effect of pH on photocatalytic activity, one of which uses the pointof zero charges (PZC) of TiO2. PZC is a pH value where the surface charge component isequal to zero under given conditions of temperature, applied pressure, and soil solutioncomposition [159] (PZC = 6–8 depending on TiO2 sample) [178]. Suppose pH < (PZC)TiO2,the photocatalyst’s surface charge is positive and is gradually given electrons by organiccompounds adsorbed to the TiO2-activated photon to undergo different photocatalyticreactions. Suppose pH > (PZC)TiO2, the surface of the catalyst will be negatively chargedand reject anions in water [69]. Based on the water equilibrium equation, the followingreaction equation is obtained:
Materials 2021, 14, 2846 25 of 35
At pH < PZC: TiOH + H+ TiOH2+ (9)
At pH > PZC: TiOH + OH− TiO− + H2O (10)
7.3. Temperature
Chong et al. and Gaya et al. [69,176] stated that an increase in temperature in thephotocatalytic reaction (>80 ◦C) would cause an increase in the recombination of electron–hole pairs and inhibit the adsorption of organic compounds on the TiO2 surface leading toa decrease in photocatalytic activity. This statement is in accordance with the Arrheniusequation, where Kapp’s clear first-order rate constant must increase linearly with exp(−1/T). Conversely, at temperatures below 80 ◦C, adsorption is an exothermic event thatoccurs spontaneously, and the adsorption of the final reaction product will increase. Thisfinding is also supported by Malato et al. [179], which in the temperature range of 20–80 ◦Cit has activation energy that is often very small (several kJ/mol) where the activation energyis zero. However, the activation energy at temperatures below 0 ◦C increases. Furthermore,desorption of the final product becomes rate-limiting. Therefore, the optimum temperaturegenerally consists of between 20 and 80 ◦C.
7.4. Size and Structure of the Photocatalyst
Photocatalytic activity is also influenced by the structure and size of the crystals,especially in the form of nano. For example, TiO2 structurally has three crystalline phases:anatase, rutile, and brookite. However, among these three types of structures, only anataseand rutile are quite stable. Different types of structures certainly affect the difference indensity (3.9 g/cc for anatase and 4.2 g/cc for rutile), and of course, this can affect thesurface area and active side of the TiO2. In addition, the crystal structure turns out to resultin differences in the energy level of the electronic band structure (bandgap energy). Theamount of bandgap energy (Eg) between anatase and rutile will differ if Ti and O atoms’arrangement in TiO2 crystals is different. The anatase structure has an energy gap of 3.2 eVand rutile has an energy gap of 3.0 eV [93].
Saquib et al. [180] shows that photocatalytic activity also depends on the type ofpollutant model. In the study, it was found that Degussa P-25 TiO2 showed better pho-tocatalytic activity for degradation of Acid Orange 8 dyes and a large number of organiccompounds than other TiO2 catalysts, namely Hombikat UV100 (100% anatase) and PC500(100% anatase, 100% inorganic chemicals (Millennium)). This finding can be explained bythe fact that Degussa P25 is a mixture of 25% rutile and 75% anatase. This research result issupported by Ohno et al. [181] and Muggli et al. [182], that the mixture of anatase (70–75%)and rutile (30–25%) is more active than pure anatase. On the other hand, the UV 100 Hom-bikat photocatalyst was better for the degradation of benzidine and 1,2-diphenylhydrazine,as shown in a recent study reported by Muneer et al. [183].
The size of the photocatalyst crystal also plays an important role in photocatalyticefficiency. Ma et al. [184] showed that doping inhibited the transformation of the anatasephase into rutile and inhibited the growth of crystallites. In addition, doping can expandthe absorption area to the visible light region. Crystal size can be calculated using theScherrer equation as shown in Equation (11):
L =K λ
β cos θ(11)
where λ is the wavelength of X-rays in nanometers (nm), β is the peak width of the diffractionpeak profile at half the maximum height resulting from the size of small crystals in radians,and K is the constant associated with the shape of the crystal, usually taken as 0.9 [185].
7.5. Dissolved Oxygen (DO)
Dissolved oxygen (DO) has an essential role in the photocatalytic reaction. It is wellknown that DO can act as an electron acceptor to eliminate photogeneration recombinationof electron–hole pairs and photocatalysts with better electron and hole separation. This

Materials 2021, 14, 2846 26 of 35
condition allows more efficient channeling of charge carriers into useful reduction andoxidation reactions [186]. Moreover, the existence of oxygen could facilitate the formationof hydroxyl and superoxide radicals which act as reactive species for POME degradation.
Gerischer et al. [187] reported that suppose molecular oxygen is used as an electronacceptor to trap and remove electrons from a titanium particle’s surface to minimize free-electron buildup. The oxygen reaction adsorbed with photogeneration electrons on thetitanium catalyst surface is relatively slow and maybe a step in controlling the rate ofphotocatalytic oxidation reactions.
Therefore, increasing the rate of charge transfer from titanium to molecular oxygen willincrease photocatalytic efficiency for photo-oxidation of organic substrates. If the oxygenabsorbed exceeds the electrons’ photogeneration on the surface, the electron transfer rateto molecular oxygen will be maximized. However, titanium’s type and characteristics areinfluenced by electron–hole generation efficiency, recombination, and the charge of transferreaction rates [188].
7.6. Light Wavelength
The photochemical effect of light sources with different wavelength emissions willhave considerable consequences on the rate of photocatalytic reactions depending on thetype of photocatalyst used (crystalline phase and anatase–rutile composition). For example,Degussa P-25 TiO2 has an anatase crystal ratio of 70/80: 20/30, and the wavelength of thelight is less than 380 nm enough for photonic activation [84,189]. The TiO2 rutile crystallinephase has a smaller energy bandgap of around 3.02 eV than the TiO2 anatase of 3.2 eV [93].Therefore, rutile TiO2 can be activated with wavelengths of light up to 400 nm, dependingon the bandgap threshold for the type of rutile TiO2 used.
The electromagnetic spectrum can be classified into UV-A, UV-B, and UV-C accordingto the wavelength emitted for UV radiation. UV-A has a wavelength range between 315 and400 nm (3.10–3.94 eV), while UV-B has a wavelength range of 280–315 nm (3.94–4.43 eV),and UV-C has a wavelength range of 100–280 nm (4.43–12.4 eV) [190].
7.7. Light Intensity
Light intensity is one of several parameters that affect the rate of photocatalytic reac-tions for organic compounds degradation. Fujishima et al. [191] shows that photocatalyticreactions are not too dependent on the intensity of light, where some photons have onlyenough energy to induce reactions on the surface. To achieve high photocatalytic reactionrates, especially in wastewater treatment, relatively high light intensities are needed toadequately cover each active side of TiO2 with the required energy.
Ollis et al. [192] show that the effects of light intensity on photocatalytic efficiency canbe categorized into three groups: (1) at low light intensities (0–20 mW/cm2), the rate ofincrease in linear reactions with an increase in light intensity due to the formation of moredominant electron holes and recombination of electron holes is ignored; (2) at mediumlight intensity (about 25 mW/cm2), the rate of reaction depends on the square root of thelight intensity because at this stage, the electron–hole and recombination holes compete;(3) at high light intensity, the rate of reaction does not depend on the intensity of the light.With increasing light intensity, the number of activation sites remains the same so that thereaction rate only reaches a certain level even when the light intensity continues to increase.
This finding is supported by Reutergådh et al. [193] showing that the reaction rateincreases around 2.2 times when the light intensity doubles. Under higher lighting intensity,the increase of reaction rate is much lower. This condition may result from the factthat low-intensity reactions involving the formation of dominant electron–hole pairs andrecombination of electron–hole pairs can be ignored. However, on increasing the intensityof light, the separation of electron pairs competes with recombination, causing a smallereffect on the reaction rate. For TiO2 photocatalysis, the relationship of light intensityversus reaction rate is near linear. The intensity of UV light applied in the experiment(0–20 mW/cm2) corresponds to weak lighting. Based on the Table 4, it can be seen that by

Materials 2021, 14, 2846 27 of 35
varying light intensity and wavelength, it affects the degradation rate (i.e., COD and BODremoval and decolorization) of POME waste.
8. Kinetic of Photocatalytic POME Degradation
It is widely believed that the kinetics of the photocatalytic reaction following theLangmuir–Hinshelwood (L–H) equation is seen in the following formula:
r = −dCdt
=k·K·C
1 + K·C (12)
where k is the reaction rate constant, K is the reactant adsorption constant, and C is thereactant concentration each time. To calculate the reaction rate in a heterogeneous system,it takes the value of the reactant adsorption constant (K) on the catalyst’s surface. Since noexperiments were carried out to calculate the K value in this study, the calculations werecarried out with a homogeneous system approach.
The equation for the reaction rate is:
r = −dCdt
= k·Cn (13)
where k is the reaction rate constant and n is the reaction order. The reaction order andreaction rate constants are determined by integrating the reaction rate equation into alinear equation.
The equation can be written as follows:
Zero Order (n = 0) : C0 −C = kt (14)
First Order (n = 1) : ln(
C0
C
)= kt (15)
where C0 = initial reactant concentration, C = reactant concentration at time t, and t = time.By plotting the left term concerning time (t) of the two equations, the reaction order canbe determined, while the value of k is obtained from the slope of the resulting curve.Ng and Cheng report the kinetics of the photocatalytic degradation of POME over UV-responsive TiO2 photocatalysts. It was found that the degradation kinetics of POMEfollowed a 1st order reaction with specific reaction rates (k) ranging from 0.70 × 10⁻³ to2.90 × 10−3 min−1. Figure 21 shows the resulting modeling exercise. As a substitute forexcellent linearity, it can be concluded that the decomposition of organic matter in POMEdoes follow the first-order reaction.
Materials 2021, 14, x FOR PEER REVIEW 29 of 37
be determined, while the value of k is obtained from the slope of the resulting curve. Ng and Cheng report the kinetics of the photocatalytic degradation of POME over UV-re-sponsive TiO2 photocatalysts. It was found that the degradation kinetics of POME fol-lowed a 1st order reaction with specific reaction rates (k) ranging from 0.70 × 10⁻³ to 2.90 × 10⁻³ min−1. Figure 21 shows the resulting modeling exercise. As a substitute for excellent linearity, it can be concluded that the decomposition of organic matter in POME does fol-low the first-order reaction.
Figure 21. Reaction kinetic plots for photocatalytic degradation of POME. Reproduced from ref. [118] with permission from The Royal Society of Chemistry.
9. Conclusion and Future Perspective Palm oil industry waste (POME) has a high COD and BOD, which can cause envi-
ronmental pollution and the death of life in water due to reduced oxygen levels. POME waste treatment using conventional technology such as an open pond system currently cannot completely decolorize POME waste. Besides, methane gas production released freely into the air can contribute up to 70% of total greenhouse gas emissions [30]. Various alternative POME treatment technologies have been carried out, although these technol-ogies show a positive trend in dealing with POME waste. However, their high costs deter the deployment of these technologies for large-scale applications. In this regard, photo-catalytic technologies may be an economically feasible alternative. The application of pho-tocatalytic technology to convert palm oil industry (POME) waste has shown good poten-tial on a laboratory scale [49,117,120,121,125–127]. Photocatalytic technology using either UV light or the sun is increasingly becoming a hot topic in research because it shows high efficiency in the mineralization of organic compounds and disinfection of pathogenic mi-croorganisms in wastewater. A review of several studies of photocatalytic technology in POME waste treatment is summarized in Table 4.
However, the application of photocatalytic technology for POME waste treatment is limited by several key technical issues that need to be further investigated. The first con-sideration is whether the photocatalytic process in POME waste requires pretreatment or can be directly applied. It has been previously discussed that POME waste output has a high temperature (80–100 °C), while an increase in temperature in a photocatalytic reac-tion (>80 °C) will cause a decrease in photocatalytic activity. In addition, POME waste contains suspended solids, so preliminary treatment is needed to remove the solid sus-pension. This measure, of course, will require additional costs if applied on a large scale.
Several major technical obstacles ranging from catalyst development to process opti-mization must be overcome to promote photocatalytic technology feasibility in POME waste treatment soon. These include (i) developing photocatalysts for high photocatalytic efficiency that can utilize visible light or even a wider solar spectrum; (ii) the development
Figure 21. Reaction kinetic plots for photocatalytic degradation of POME. Reproduced from ref. [118]with permission from The Royal Society of Chemistry.
Materials 2021, 14, 2846 28 of 35
9. Conclusions and Future Perspective
Palm oil industry waste (POME) has a high COD and BOD, which can cause environ-mental pollution and the death of life in water due to reduced oxygen levels. POME wastetreatment using conventional technology such as an open pond system currently cannotcompletely decolorize POME waste. Besides, methane gas production released freely intothe air can contribute up to 70% of total greenhouse gas emissions [30]. Various alternativePOME treatment technologies have been carried out, although these technologies showa positive trend in dealing with POME waste. However, their high costs deter the de-ployment of these technologies for large-scale applications. In this regard, photocatalytictechnologies may be an economically feasible alternative. The application of photocatalytictechnology to convert palm oil industry (POME) waste has shown good potential on alaboratory scale [49,117,120,121,125–127]. Photocatalytic technology using either UV lightor the sun is increasingly becoming a hot topic in research because it shows high efficiencyin the mineralization of organic compounds and disinfection of pathogenic microorganismsin wastewater. A review of several studies of photocatalytic technology in POME wastetreatment is summarized in Table 4.
However, the application of photocatalytic technology for POME waste treatmentis limited by several key technical issues that need to be further investigated. The firstconsideration is whether the photocatalytic process in POME waste requires pretreatmentor can be directly applied. It has been previously discussed that POME waste output has ahigh temperature (80–100 ◦C), while an increase in temperature in a photocatalytic reaction(>80 ◦C) will cause a decrease in photocatalytic activity. In addition, POME waste containssuspended solids, so preliminary treatment is needed to remove the solid suspension. Thismeasure, of course, will require additional costs if applied on a large scale.
Several major technical obstacles ranging from catalyst development to process op-timization must be overcome to promote photocatalytic technology feasibility in POMEwaste treatment soon. These include (i) developing photocatalysts for high photocatalyticefficiency that can utilize visible light or even a wider solar spectrum; (ii) the develop-ment of scalable photocatalyst synthesis methods in order to obtain the correct structureand size of the photocatalyst to increase photocatalytic efficiency; (iii) optimization inthe parameters of photocatalytic operations needs to be investigated more fully based onthe characteristics of POME waste. Currently, various efforts are being made to improvephotocatalysts to work effectively, such as modification of the catalyst by doping to changethe structure of the catalyst and energy bandgap. With photocatalysts powered by visiblelight or solar energy, we believe that photocatalysts can bridge the gap between lab-scaleand large-scale production in POME waste’s photocatalytic treatment.
Overall, this review provides readers an overall idea about photocatalytic technologyto reduce POME waste’s organic pollutants. With this systematic review text, the reader’sneeds will be fulfilled properly, especially those new in photocatalytic technology forPOME processing.
Author Contributions: Conceptualization, W.H.S. and D.S.; methodology, W.H.S. and A.F.A.; formalanalysis, A.F.A.; investigation, A.F.A.; resources, W.H.S. and A.F.A.; writing—original draft prepara-tion, W.H.S. and A.F.A.; writing—review and editing, W.H.S., A.F.A., R.D., and D.S.; visualization,A.F.A.; supervision, W.H.S. and D.S.; project administration, W.H.S.; funding acquisition, W.H.S. andD.S. All authors have read and agreed to the published version of the manuscript.
Funding: This research was funded by Asahi Glass Foundation 2020, grant number FTI-PN-5.01.2020and Penelitian Dasar Unggulan Perguruan Tinggi Kemenristek/BRIN 2021.
Institutional Review Board Statement: Not applicable.
Informed Consent Statement: Not applicable.
Data Availability Statement: No new data were created or analyzed in this study. Data sharing isnot applicable to this article.
Materials 2021, 14, 2846 29 of 35
Acknowledgments: The authors acknowledge the support from Design Method and Process ControlLaboratory, Department of Chemical Engineering, Institut Teknologi Bandung.
Conflicts of Interest: The authors declare no conflict of interest.
References1. BPS-Statistics Indonesia. Environment Statistics of Indonesia; 0216-6224; BPS-Statistics Indonesia: Jakarta, Indonesia, 2018; pp. 1–224.2. Directorate General of Estate Crops. Tree Crop Estate Statistics of Indonesia 2017–2019; Directorate General of Estate Crops: Jakarta,
Indonesia, 2019; pp. 1–81.3. Hasanudin, U.; Sugiharto, R.; Haryanto, A.; Setiadi, T.; Fujie, K. Palm oil mill effluent treatment and utilization to ensure the
sustainability of palm oil industries. Water Sci. Technol. 2015, 72, 1089–1095. [CrossRef]4. Awalludin, M.F.; Sulaiman, O.; Hashim, R.; Nadhari, W.N.A.W. An overview of the oil palm industry in Malaysia and its waste
utilization through thermochemical conversion, specifically via liquefaction. Renew. Sustain. Energy Rev. 2015, 50, 1469–1484. [CrossRef]5. Thani, M.I.; Hussin, R.; Ibrahim, W.R.B.W.; Sulaiman, M.S. Industrial Processes and the Environment—Crude Palm Oil Industry;
Department of Environment, Ministry of Science: Putrajaya, Malayzia, 1999; Volume 3, pp. 1–90.6. Alhaji, M.H.; Sanaullah, K.; Salleh, S.F.; Baini, R.; Lim, S.F.; Rigit, A.R.H.; Said, K.A.M.; Khan, A. Photo-oxidation of pre-treated palm oil
mill Effluent using cylindrical column immobilized photoreactor. Process. Saf. Environ. Prot. 2018, 117, 180–189. [CrossRef]7. IndexMundi. Palm Oil Production by Country in 1000 MT—Country Rankings. Available online: https://www.indexmundi.
com/agriculture/?commodity=palm-oil&graph=production (accessed on 20 January 2020).8. FAO. Republic of Indonesia Government Regulation on the Implementation of Environmental Protection and Management; 22/2021; FAO:
Rome, Italy, 2014; pp. 1–483.9. Lee, Z.S.; Chin, S.Y.; Lim, J.W.; Witoon, T.; Cheng, C.K. Treatment technologies of palm oil mill effluent (POME) and olive mill
wastewater (OMW): A brief review. Environ. Technol. Innov. 2019, 15, 100377. [CrossRef]10. Ng, K.H.; Yuan, L.S.; Cheng, C.K.; Chen, K.; Fang, C. TiO2 and ZnO photocatalytic treatment of palm oil mill effluent (POME)
and feasibility of renewable energy generation: A short review. J. Clean. Prod. 2019, 233, 209–225. [CrossRef]11. Azmi, N.S.; Yunos, K.F.M. Wastewater Treatment of Palm Oil Mill Effluent (POME) by Ultrafiltration Membrane Separation
Technique Coupled with Adsorption Treatment as Pre-treatment. Agric. Agric. Sci. Procedia 2014, 2, 257–264. [CrossRef]12. Poh, P.E.; Chong, M.F. Upflow anaerobic sludge blanket-hollow centered packed bed (UASB-HCPB) reactor for thermophilic
palm oil mill effluent (POME) treatment. Biomass Bioenergy 2014, 67, 231–242. [CrossRef]13. Chan, Y.J.; Chong, M.F.; Law, C.L. Effects of Temperature on Aerobic Treatment of Anaerobically Digested Palm Oil Mill Effluent
(POME). Ind. Eng. Chem. Res. 2010, 49, 7093–7101. [CrossRef]14. Wahi, R.; Chuah Abdullah, L.; Nourouzi-Mobarekeh, M.; Ngaini, Z.; Choong Shean Yaw, T. Utilization of esterified sago bark
fibre waste for removal of oil from palm oil mill effluent. J. Environ. Chem. Eng. 2017, 5, 170–177. [CrossRef]15. Kaman, S.P.D.; Tan, I.A.W.; Lim, L.L.P. Palm oil mill effluent treatment using coconut shell—Based activated carbon: Adsorption
equilibrium and isotherm. Matec Web Conf. 2017, 87, 03009. [CrossRef]16. Cheng, Y.W.; Lee, Z.S.; Chong, C.C.; Khan, M.R.; Cheng, C.K.; Ng, K.H.; Hossain, S.S. Hydrogen-rich syngas production via
steam reforming of palm oil mill effluent (POME)—A thermodynamics analysis. Int. J. Hydrogen Energy 2019, 44, 20711–20724.[CrossRef]
17. Ng, K.H.; Cheng, Y.W.; Lee, Z.S.; Khan, M.R.; Lam, S.S.; Cheng, C.K. Experimental evaluation and empirical modelling of palmoil mill effluent steam reforming. Int. J. Hydrogen Energy 2018, 43, 15784–15793. [CrossRef]
18. Ng, K.H.; Cheng, Y.W.; Lee, Z.S.; Cheng, C.K. A study into syngas production from catalytic steam reforming of palm oil milleffluent (POME): A new treatment approach. Int. J. Hydrogen Energy 2019, 44, 20900–20913. [CrossRef]
19. Andreozzi, R.; Caprio, V.; Insola, A.; Marotta, R. Advanced oxidation processes (AOP) for water purification and recovery. Catal.Today 1999, 53, 51–59. [CrossRef]
20. Alhaji, M.H.; Sanaullah, K.; Lim, S.-F.; Khan, A.; Hipolito, C.N.; Abdullah, M.O.; Bhawani, S.A.; Jamil, T. Photocatalytic treatmenttechnology for palm oil mill effluent (POME)—A review. Process. Saf. Environ. Prot. 2016, 102, 673–686. [CrossRef]
21. Chang, H.T.; Wu, N.-M.; Zhu, F. A kinetic model for photocatalytic degradation of organic contaminants in a thin-film TiO2catalyst. Water Res. 2000, 34, 407–416. [CrossRef]
22. Yacob, S.; Shirai, Y.; Hassan, M.A.; Wakisaka, M.; Subash, S. Start-up operation of semi-commercial closed anaerobic digester forpalm oil mill effluent treatment. Process. Biochem. 2006, 41, 962–964. [CrossRef]
23. Prasertsan, S.; Prasertsan, P. Biomass residues from palm oil mills in Thailand: An overview on quantity and potential usage.Biomass Bioenergy 1996, 11, 387–395. [CrossRef]
24. Wu, T.Y.; Mohammad, A.W.; Jahim, J.M.; Anuar, N. Pollution control technologies for the treatment of palm oil mill effluent(POME) through end-of-pipe processes. J. Environ. Manag. 2010, 91, 1467–1490. [CrossRef]
25. Hassan, M.; Yacob, S.; Shirai, Y. Treatment of palm oil wastewaters. Handb. Ind. Hazard. Wastes Treat. 2004, 7, 719–736.26. Ng, W.J.; Goh, A.C.C.; Tay, J.H. Palm oil mill effluent (POME) treatment—An assessment of coagulants used to aid liquid-solid
separation. Biol. Wastes 1987, 21, 237–248. [CrossRef]27. Setiadi, T.; Husaini; Djajadiningrat, A. Palm oil mill effluent treatment by anaerobic baffled reactors: Recycle effects and biokinetic
parameters. Water Sci. Technol. 1996, 34, 59–66. [CrossRef]

Materials 2021, 14, 2846 30 of 35
28. FAO. Decree of the State Minister of Population and the Environment: Effluent Quality Standards for Existing Operations; KEP-03/MENKLH/II/1991; FAO: Rome, Italy, 1991; pp. 1–25.
29. FAO. Decree of the State Minister of Environmental Affairs: The Liquid Waste Quality Standard for Industrial Activities; KEP-51/MENLH/10/1995; FAO: Rome, Italy, 1995; pp. 1–49.
30. Rahayu, A.S.; Yuwono, H.; Rahardjo, S.; Hokermin, S.; Paramita, V. Konversi POME Menjadi Biogas: Pengembangan Proyek diIndonesia. 2015. Available online: https://winrock.org/wp-content/uploads/2016/05/CIRCLE-Handbook-INDO-compressed.pdf (accessed on 9 February 2020).
31. Perez, M.; Romero, L.I.; Sales, D. Organic Matter Degradation Kinetics in an Anaerobic Thermophilic Fluidised Bed Bioreactor.Anaerobe 2001, 7, 25–35. [CrossRef]
32. Yacob, S.; Hassan, M.; Shirai, Y.; Wakisaka, M.; Subash, S. Baseline Study of Methane Emission from Anaerobic Ponds of Palm OilMill Effluent Treatment. Sci. Total Environ. 2006, 366, 187–196. [CrossRef]
33. Poh, P.E.; Chong, M.F. Development of anaerobic digestion methods for palm oil mill effluent (POME) treatment. Bioresour.Technol. 2009, 100, 1–9. [CrossRef]
34. Loh, S.K.; Lai, M.E.; Ngatiman, M.; Weng Soon, L.; Choo, Y.; Zhang, Z.; Salimon, J. Zero discharge treatment technology of palmoil mill effluent. J. Oil Palm Res. 2013, 25, 273–281.
35. Choi, W.-H.; Shin, C.-H.; Son, S.-M.; Ghorpade, P.A.; Kim, J.-J.; Park, J.-Y. Anaerobic treatment of palm oil mill effluent usingcombined high-rate anaerobic reactors. Bioresour. Technol. 2013, 141, 138–144. [CrossRef]
36. Tamrin, K.F.; Zahrim, A.Y. Determination of optimum polymeric coagulant in palm oil mill effluent coagulation using multiple-objective optimisation on the basis of ratio analysis (MOORA). Environ. Sci. Pollut. Res. 2017, 24, 15863–15869. [CrossRef][PubMed]
37. Fujihira, T.; Seo, S.; Yamaguchi, T.; Hatamoto, M.; Tanikawa, D. High-rate Anaerobic Treatment System for Solid/Lipid-richWastewater using Anaerobic Baffled Reactor with Scum Recovery. Bioresour. Technol. 2018, 263. [CrossRef] [PubMed]
38. Hasanudin, U.; Haryanto, A. Palm oil mill effluent recycling system for sustainable palm oil industries. Asian J. Environ. Biotechnol.2018, 2, 52–62.
39. Ali Amat, N.A.; Tan, Y.H.; Lau, W.J.; Lai, G.S.; Ong, C.S.; Mokhtar, N.M.; Sani, N.A.A.; Ismail, A.F.; Goh, P.S.; Chong, K.C.; et al.Tackling colour issue of anaerobically-treated palm oil mill effluent using membrane technology. J. Water Process. Eng. 2015, 8,221–226. [CrossRef]
40. Bello, M.M.; Nourouzi, M.M.; Abdullah, L.C.; Choong, T.S.Y.; Koay, Y.S.; Keshani, S. POME is treated for removal of color frombiologically treated POME in fixed bed column: Applying wavelet neural network (WNN). J. Hazard. Mater. 2013, 262, 106–113.[CrossRef]
41. Mohammed, R.R.; Ketabchi, M.R.; McKay, G. Combined magnetic field and adsorption process for treatment of biologicallytreated palm oil mill effluent (POME). Chem. Eng. J. 2014, 243, 31–42. [CrossRef]
42. Bhatia, S.; Othman, Z.; Ahmad, A.L. Pretreatment of palm oil mill effluent (POME) using Moringa oleifera seeds as naturalcoagulant. J. Hazard. Mater. 2007, 145, 120–126. [CrossRef]
43. Poh, P.E.; Ong, W.Y.J.; Lau, E.V.; Chong, M.N. Investigation on micro-bubble flotation and coagulation for the treatment ofanaerobically treated palm oil mill effluent (POME). J. Environ. Chem. Eng. 2014, 2, 1174–1181. [CrossRef]
44. Cheng, C.K.; Rizauddin Derahman, M.; Khan, M.R. Evaluation of the photocatalytic degradation of pre-treated palm oil milleffluent (POME) over Pt-loaded titania. J. Environ. Chem. Eng. 2015, 3, 261–270. [CrossRef]
45. Ng, K.H.; Lee, C.H.; Khan, M.R.; Cheng, C.K. Photocatalytic degradation of recalcitrant POME waste by using silver dopedtitania: Photokinetics and scavenging studies. Chem. Eng. J. 2016, 286, 282–290. [CrossRef]
46. Vijayaraghavan, K.; Ahmad, D.; Ezani-Bin-Abdul-Aziz, M. Aerobic treatment of palm oil mill effluent. J. Environ. Manag. 2007,82, 24–31. [CrossRef]
47. Chan, Y.J.; Chong, M.F.; Law, C.L.; Hassell, D.G. A review on anaerobic–aerobic treatment of industrial and municipal wastewater.Chem. Eng. J. 2009, 155, 1–18. [CrossRef]
48. Bello, M.M.; Abdul Raman, A.A. Trend and current practices of palm oil mill effluent polishing: Application of advancedoxidation processes and their future perspectives. J. Environ. Manag. 2017, 198, 170–182. [CrossRef] [PubMed]
49. Iskandar, M.J.; Baharum, A.; Anuar, F.H.; Othaman, R. Palm oil industry in South East Asia and the effluent treatment technology—A review. Environ. Technol. Innov. 2018, 9, 169–185. [CrossRef]
50. Loh, S.K.; Lai, M.E.; Ngatiman, M. Vegetative growth enhancement of organic fertilizer from anaerobically-treated palm oil milleffluent (POME) supplemented with chicken manure in food-energy-water nexus challenge. Food Bioprod. Process. 2019, 117,95–104. [CrossRef]
51. Borja, R.; Banks, C.J.; Sánchez, E. Anaerobic treatment of palm oil mill effluent in a two-stage up-flow anaerobic sludge blanket(UASB) system. J. Biotechnol. 1996, 45, 125–135. [CrossRef]
52. Zhang, Y.; Yan, L.; Chi, L.; Long, X.; Mei, Z.; Zhang, Z. Startup and operation of anaerobic EGSB reactor treating palm oil milleffluent. J. Environ. Sci. 2008, 20, 658–663. [CrossRef]
53. Chan, Y.J.; Chong, M.F.; Law, C.L. Biological treatment of anaerobically digested palm oil mill effluent (POME) using a Lab-ScaleSequencing Batch Reactor (SBR). J. Environ. Manag. 2010, 91, 1738–1746. [CrossRef] [PubMed]
54. Najafpour, G.D.; Zinatizadeh, A.A.L.; Mohamed, A.R.; Hasnain Isa, M.; Nasrollahzadeh, H. High-rate anaerobic digestion ofpalm oil mill effluent in an upflow anaerobic sludge-fixed film bioreactor. Process. Biochem. 2006, 41, 370–379. [CrossRef]

Materials 2021, 14, 2846 31 of 35
55. Najafpour, G.; Yieng, H.A.; Younesi, H.; Zinatizadeh, A. Effect of organic loading on performance of rotating biological contactorsusing Palm Oil Mill effluents. Process. Biochem. 2005, 40, 2879–2884. [CrossRef]
56. Cheng, Y.W.; Ng, K.H.; Lam, S.S.; Lim, J.W.; Wongsakulphasatch, S.; Witoon, T.; Cheng, C.K. Syngas from catalytic steamreforming of palm oil mill effluent: An optimization study. Int. J. Hydrogen Energy 2019, 44, 9220–9236. [CrossRef]
57. Aziz, M.; Kurniawan, T.; Oda, T.; Kashiwagi, T. Advanced power generation using biomass wastes from palm oil mills. Appl.Therm. Eng. 2017, 114, 1378–1386. [CrossRef]
58. Shak, K.P.Y.; Wu, T.Y. Optimized use of alum together with unmodified Cassia obtusifolia seed gum as a coagulant aid intreatment of palm oil mill effluent under natural pH of wastewater. Ind. Crop. Prod. 2015, 76, 1169–1178. [CrossRef]
59. Latif Ahmad, A.; Ismail, S.; Bhatia, S. Water recycling from palm oil mill effluent (POME) using membrane technology. Desalination2003, 157, 87–95. [CrossRef]
60. Zhang, Y.; Yan, L.; Qiao, X.; Chi, L.; Niu, X.; Mei, Z.; Zhang, Z. Integration of biological method and membrane technology intreating palm oil mill effluent. J. Environ. Sci. 2008, 20, 558–564. [CrossRef]
61. Ahmad, A.L.; Sumathi, S.; Hameed, B.H. Residual oil and suspended solid removal using natural adsorbents chitosan, bentoniteand activated carbon: A comparative study. Chem. Eng. J. 2005, 108, 179–185. [CrossRef]
62. Shavandi, M.A.; Haddadian, Z.; Ismail, M.H.S.; Abdullah, N.; Abidin, Z.Z. Removal of Fe(III), Mn(II) and Zn(II) from palm oilmill effluent (POME) by natural zeolite. J. Taiwan Inst. Chem. Eng. 2012, 43, 750–759. [CrossRef]
63. Ahmad, A.L.; Sumathi, S.; Hameed, B.H. Adsorption of residue oil from palm oil mill effluent using powder and flake chitosan:Equilibrium and kinetic studies. Water Res. 2005, 39, 2483–2494. [CrossRef]
64. Chou, S.; Huang, C.; Huang, Y.-H. Effect of Fe2+ on catalytic oxidation in a fluidized bed reactor. Chemosphere 1999, 39, 1997–2006.[CrossRef]
65. Carra, I.; Sánchez Pérez, J.A.; Malato, S.; Autin, O.; Jefferson, B.; Jarvis, P. Performance of different advanced oxidation processesfor tertiary wastewater treatment to remove the pesticide acetamiprid. J. Chem. Technol. Biotechnol. 2016, 91, 72–81. [CrossRef]
66. Taha, M.R.; Ibrahim, A.H. Characterization of nano zero-valent iron (nZVI) and its application in sono-Fenton process to removeCOD in palm oil mill effluent. J. Environ. Chem. Eng. 2014, 2, 1–8. [CrossRef]
67. Kongnoo, A.; Suksaroj, T.; Intharapat, P.; Promtong, T.; Suksaroj, C. Decolorization and Organic Removal from Palm Oil MillEffluent by Fenton’s Process. Environ. Eng. Sci. 2012, 29, 855–859. [CrossRef]
68. Saeed, M.O.; Azizli, K.A.M.; Isa, M.H.; Ezechi, E.H. Treatment of POME using Fenton oxidation process: Removal efficiency,optimization, and acidity condition. Desalination Water Treat. 2016, 57, 23750–23759. [CrossRef]
69. Chong, M.N.; Jin, B.; Chow, C.W.K.; Saint, C. Recent developments in photocatalytic water treatment technology: A review. WaterRes. 2010, 44, 2997–3027. [CrossRef] [PubMed]
70. Zheng, X.; Shen, Z.-P.; Shi, L.; Cheng, R.; Yuan, D.-H. Photocatalytic Membrane Reactors (PMRs) in Water Treatment: Configura-tions and Influencing Factors. Catalysts 2017, 7, 224. [CrossRef]
71. Hamdy, M.S.; Saputera, W.H.; Groenen, E.J.; Mul, G. A novel TiO2 composite for photocatalytic wastewater treatment. J. Catal.2014, 310, 75–83. [CrossRef]
72. Saputera, W.H.; Scott, J.; Tahini, H.; Low, G.K.C.; Tan, X.; Smith, S.; Wang, D.-W.; Amal, R. Light, Catalyst, Activation: BoostingCatalytic Oxygen Activation Using a Light Pretreatment Approach. ACS Catal. 2017, 7, 3644–3653. [CrossRef]
73. Borja, R.; Banks, C.J. Anaerobic digestion of palm oil mill effluent using an up-flow anaerobic sludge blanket reactor. BiomassBioenergy 1994, 6, 381–389. [CrossRef]
74. Mishra, P.; Thakur, S.; Singh, L.; Ab Wahid, Z.; Sakinah, M. Enhanced hydrogen production from palm oil mill effluent using twostage sequential dark and photo fermentation. Int. J. Hydrogen Energy 2016, 41, 18431–18440. [CrossRef]
75. Scaife, D.E. Oxide semiconductors in photoelectrochemical conversion of solar energy. Sol. Energy 1980, 25, 41–54. [CrossRef]76. Koppenol, W.H.; Stanbury, D.M.; Bounds, P.L. Electrode potentials of partially reduced oxygen species, from dioxygen to water.
Free Radic. Biol. Med. 2010, 49, 317–322. [CrossRef]77. Oliveira, C.; Alves, A.; Madeira, L.M. Treatment of water networks (waters and deposits) contaminated with chlorfenvinphos by
oxidation with Fenton’s reagent. Chem. Eng. J. 2014, 241, 190–199. [CrossRef]78. Oller, I.; Malato, S.; Sánchez-Pérez, J.A. Combination of Advanced Oxidation Processes and biological treatments for wastewater
decontamination—A review. Sci. Total Environ. 2011, 409, 4141–4166. [CrossRef]79. Schneider, J.; Matsuoka, M.; Takeuchi, M.; Zhang, J.; Horiuchi, Y.; Anpo, M.; Bahnemann, D.W. Understanding TiO2 Photocatalysis:
Mechanisms and Materials. Chem. Rev. 2014, 114, 9919–9986. [CrossRef]80. Ong, C.B.; Ng, L.Y.; Mohammad, A.W. A review of ZnO nanoparticles as solar photocatalysts: Synthesis, mechanisms and
applications. Renew. Sustain. Energy Rev. 2018, 81, 536–551. [CrossRef]81. Szilágyi, I.M.; Fórizs, B.; Rosseler, O.; Szegedi, Á.; Németh, P.; Király, P.; Tárkányi, G.; Vajna, B.; Varga-Josepovits, K.; László, K.;
et al. WO3 photocatalysts: Influence of structure and composition. J. Catal. 2012, 294, 119–127. [CrossRef]82. Ma, R.; Zhang, S.; Wen, T.; Gu, P.; Li, L.; Zhao, G.; Niu, F.; Huang, Q.; Tang, Z.; Wang, X. A critical review on visible-light-response
CeO2-based photocatalysts with enhanced photooxidation of organic pollutants. Catal. Today 2019, 335, 20–30. [CrossRef]83. Basahel, S.; Ali, T.; Mokhtar, M.; Katabathini, N. Influence of crystal structure of nanosized ZrO2 on photocatalytic degradation of
methyl orange. Nanoscale Res. Lett. 2015, 10. [CrossRef]84. Herrmann, J.-M. Heterogeneous photocatalysis: Fundamentals and applications to the removal of various types of aqueous
pollutants. Catal. Today 1999, 53, 115–129. [CrossRef]
Materials 2021, 14, 2846 32 of 35
85. Saputera, W.H.; Mul, G.; Hamdy, M.S. Ti3+-containing titania: Synthesis tactics and photocatalytic performance. Catal. Today 2015,246, 60–66. [CrossRef]
86. Fu, W.; Yang, H.; Li, M.; Li, M.; Yang, N.; Zou, G. Anatase TiO2 nanolayer coating on cobalt ferrite nanoparticles for magneticphotocatalyst. Mater. Lett. 2005, 59, 3530–3534. [CrossRef]
87. Watson, S.; Beydoun, D.; Amal, R. Synthesis of a novel magnetic photocatalyst by direct deposition of nanosized TiO2 crystalsonto a magnetic core. J. Photochem. Photobiol. A Chem. 2002, 148, 303–313. [CrossRef]
88. Xu, M.-W.; Bao, S.-J.; Zhang, X.-G. Enhanced photocatalytic activity of magnetic TiO2 photocatalyst by silver deposition. Mater.Lett. 2005, 59, 2194–2198. [CrossRef]
89. Hendra Saputera, W.; Egiyawati, C.; Setyani-Putrie, A.; Fathoni Amri, A.; Rizkiana, J.; Sasongko, D. Titania Modified Silica fromSugarcane Bagasse Waste for Photocatalytic Wastewater Treatment. IOP Conf. Ser. Mater. Sci. Eng. 2021, 1143, 012073. [CrossRef]
90. Xu, J.; Li, L.; Yan, Y.; Wang, H.; Wang, X.; Fu, X.; Li, G. Synthesis and photoluminescence of well-dispersible anatase TiO2nanoparticles. J. Colloid Interface Sci. 2008, 318, 29–34. [CrossRef]
91. Rodríguez-González, V.; Terashima, C.; Fujishima, A. Applications of photocatalytic titanium dioxide-based nanomaterials insustainable agriculture. J. Photochem. Photobiol. C Photochem. Rev. 2019, 40, 49–67. [CrossRef]
92. Luttrell, T.; Halpegamage, S.; Tao, J.; Kramer, A.; Sutter, E.; Batzill, M. Why is anatase a better photocatalyst than rutile?—Modelstudies on epitaxial TiO2 films. Sci. Rep. 2014, 4, 4043. [CrossRef] [PubMed]
93. Zhu, T.; Gao, S.-P. The Stability, Electronic Structure, and Optical Property of TiO2 Polymorphs. J. Phys. Chem. C 2014, 118,11385–11396. [CrossRef]
94. Li, X.Z.; Li, F.B.; Yang, C.L.; Ge, W.K. Photocatalytic activity of WOx-TiO2 under visible light irradiation. J. Photochem. Photobiol. AChem. 2001, 141, 209–217. [CrossRef]
95. Pesci, F.M.; Wang, G.; Klug, D.R.; Li, Y.; Cowan, A.J. Efficient Suppression of Electron–Hole Recombination in Oxygen-DeficientHydrogen-Treated TiO2 Nanowires for Photoelectrochemical Water Splitting. J. Phys. Chem. C 2013, 117, 25837–25844. [CrossRef][PubMed]
96. Nam, Y.; Lim, J.H.; Ko, K.C.; Lee, J.Y. Photocatalytic activity of TiO2 nanoparticles: A theoretical aspect. J. Mater. Chem. A 2019, 7,13833–13859. [CrossRef]
97. Zheng, H.; Ou, J.Z.; Strano, M.S.; Kaner, R.B.; Mitchell, A.; Kalantar-zadeh, K. Nanostructured Tungsten Oxide—Properties,Synthesis, and Applications. Adv. Funct. Mater. 2011, 21, 2175–2196. [CrossRef]
98. Zhang, H.; Chen, G.; Bahnemann, D.W. Photoelectrocatalytic materials for environmental applications. J. Mater. Chem. 2009, 19,5089–5121. [CrossRef]
99. Monllor-Satoca, D.; Borja, L.; Rodes, A.; Gómez, R.; Salvador, P. Photoelectrochemical Behavior of Nanostructured WO3 Thin-FilmElectrodes: The Oxidation of Formic Acid. Chemphyschem. A Eur. J. Chem. Phys. Phys. Chem. 2006, 7, 2540–2551. [CrossRef]
100. Butler, M.A. Photoelectrolysis and physical properties of the semiconducting electrode WO2. J. Appl. Phys. 1977, 48, 1914–1920.[CrossRef]
101. Yamazaki, S.; Yamate, T.; Adachi, K. Photocatalytic activity of aqueous WO3 sol for the degradation of Orange II and 4-chlorophenol. Appl. Catal. A Gen. 2013, 454, 30–36. [CrossRef]
102. Fu, L.; Cai, W.; Wang, A.; Zheng, Y. Photocatalytic hydrogenation of nitrobenzene to aniline over tungsten oxide-silver nanowires.Mater. Lett. 2015, 142, 201–203. [CrossRef]
103. Morales, W.; Cason, M.; Aina, O.; de Tacconi, N.R.; Rajeshwar, K. Combustion Synthesis and Characterization of NanocrystallineWO3. J. Am. Chem. Soc. 2008, 130, 6318–6319. [CrossRef] [PubMed]
104. Santato, C.; Odziemkowski, M.; Ulmann, M.; Augustynski, J. Crystallographically Oriented Mesoporous WO3 Films: Synthesis,Characterization, and Applications. J. Am. Chem. Soc. 2001, 123, 10639–10649. [CrossRef]
105. Arutanti, O.; Nandiyanto, A.B.D.; Ogi, T.; Iskandar, F.; Kim, T.O.; Okuyama, K. Synthesis of composite WO3/TiO2 nanoparticlesby flame-assisted spray pyrolysis and their photocatalytic activity. J. Alloy. Compd. 2014, 591, 121–126. [CrossRef]
106. Cheng, Y.W.; Chang, Y.S.; Ng, K.H.; Wu, T.Y.; Cheng, C.K. Photocatalytic restoration of liquid effluent from oil palm agroindustryin Malaysia using tungsten oxides catalyst. J. Clean. Prod. 2017, 162, 205–219. [CrossRef]
107. Gomez-Solís, C.; Ballesteros, J.C.; Torres-Martínez, L.M.; Juárez-Ramírez, I.; Díaz Torres, L.A.; Elvira Zarazua-Morin, M.; Lee,S.W. Rapid synthesis of ZnO nano-corncobs from Nital solution and its application in the photodegradation of methyl orange. J.Photochem. Photobiol. A Chem. 2015, 298, 49–54. [CrossRef]
108. Lee, K.M.; Lai, C.W.; Ngai, K.S.; Juan, J.C. Recent developments of zinc oxide based photocatalyst in water treatment technology:A review. Water Res. 2016, 88, 428–448. [CrossRef]
109. Schmidt-Mende, L.; MacManus-Driscoll, J.L. ZnO—Nanostructures, defects, and devices. Mater. Today 2007, 10, 40–48. [CrossRef]110. Chen, Y.; Bagnall, D.M.; Koh, H.-j.; Park, K.-t.; Hiraga, K.; Zhu, Z.; Yao, T. Plasma assisted molecular beam epitaxy of ZnO on
c -plane sapphire: Growth and characterization. J. Appl. Phys. 1998, 84, 3912–3918. [CrossRef]111. Daneshvar, N.; Salari, D.; Khataee, A.R. Photocatalytic degradation of azo dye acid red 14 in water on ZnO as an alternative
catalyst to TiO2. J. Photochem. Photobiol. A Chem. 2004, 162, 317–322. [CrossRef]112. Behnajady, M.A.; Modirshahla, N.; Hamzavi, R. Kinetic study on photocatalytic degradation of C.I. Acid Yellow 23 by ZnO
photocatalyst. J. Hazard. Mater. 2006, 133, 226–232. [CrossRef]113. Ullah, R.; Dutta, J. Photocatalytic activities of ZnO nanoparticles synthesized by wet chemical techniques. In Proceedings of the
2006 International Conference on Emerging Technologies, Peshawar, Pakistan, 13–14 November 2006; pp. 353–357.
Materials 2021, 14, 2846 33 of 35
114. Ng, K.H.; Khan, M.R.; Ng, Y.H.; Hossain, S.S.; Cheng, C.K. Restoration of liquid effluent from oil palm agroindustry in Malaysiausing UV/TiO2 and UV/ZnO photocatalytic systems: A comparative study. J. Environ. Manag. 2017, 196, 674–680. [CrossRef]
115. Tan, Y.I.H.; Goh, P.; Lai, G.S.; Lau, W.J.; Ismail, A. Treatment of Aerobic Treated Palm Oil Mill Effluent (AT-POME) by using TiO2Photocatalytic Process. J. Teknol. 2014, 70. [CrossRef]
116. Ng, K.; Deraman, M.; Ang, C.; Chong, S.; Kong, Z.; Khan, M.; Cheng, C. Phototreatment of Palm Oil Mill Effluent (POME) overCu/TiO2 Photocatalyst. Bull. Chem. React. Eng. Catal. 2014, 9. [CrossRef]
117. Haji Alhaji, M.; Sanaullah, K.; Fong Lim, S.; Ragai Henry Rigit, A.; Hamza, A.; Khan, A. Modeling and optimization ofphotocatalytic treatment of pre-treated palm oil mill effluent (POME) in a UV/TiO2 system using response surface methodology(RSM). Cogent Eng. 2017, 4, 1382980. [CrossRef]
118. Ng, K.H.; Cheng, C.K. A novel photomineralization of POME over UV-responsive TiO2 photocatalyst: Kinetics of POMEdegradation and gaseous product formations. RSC Adv. 2015, 5, 53100–53110. [CrossRef]
119. Ng, K.H.; Cheng, C.K. Photocatalytic degradation of palm oil mill effluent over ultraviolet-responsive titania: Successiveassessments of significance factors and process optimization. J. Clean. Prod. 2017, 142, 2073–2083. [CrossRef]
120. Kanakaraju, D.; Ahmad, N.L.B.; Sedik, N.B.M.; Long, S.G.H.; Guan, T.M.; Ying, C.L. Performance of solar photocatalysis andphoto-fenton degradation of palm oil mill effluent. Malays. J. Anal. Sci. 2017, 21, 996–1007. [CrossRef]
121. Cheng, C.K.; Deraman, M.R.; Ng, K.H.; Khan, M.R. Preparation of titania doped argentum photocatalyst and its photoactivitytowards palm oil mill effluent degradation. J. Clean. Prod. 2016, 112, 1128–1135. [CrossRef]
122. Charles, A.; Cheng, C.K. Photocatalytic treatment of palm oil mill effluent by visible light-active calcium ferrite: Effects of catalystpreparation technique. J. Environ. Manag. 2019, 234, 404–411. [CrossRef] [PubMed]
123. Charles, A.; Khan, M.R.; Ng, K.H.; Wu, T.Y.; Lim, J.W.; Wongsakulphasatch, S.; Witoon, T.; Cheng, C.K. Facile synthesis ofCaFe2O4 for visible light driven treatment of polluting palm oil mill effluent: Photokinetic and scavenging study. Sci. TotalEnviron. 2019, 661, 522–530. [CrossRef] [PubMed]
124. Ng, K.H.; Cheng, C.K. Photo-polishing of POME into CH4-lean biogas over the UV-responsive ZnO photocatalyst. Chem. Eng. J.2016, 300, 127–138. [CrossRef]
125. Zainuri, N.Z.; Hairom, N.H.H.; Sidik, D.A.B.; Desa, A.L.; Misdan, N.; Yusof, N.; Mohammad, A.W. Palm oil mill secondaryeffluent (POMSE) treatment via photocatalysis process in presence of ZnO-PEG nanoparticles. J. Water Process. Eng. 2018, 26,10–16. [CrossRef]
126. Wong, K.-A.; Lam, S.-M.; Sin, J.-C. Wet chemically synthesized ZnO structures for photodegradation of pre-treated palm oil milleffluent and antibacterial activity. Ceram. Int. 2019, 45, 1868–1880. [CrossRef]
127. Chin, Y.-H.; Sin, J.-C.; Lam, S.-M. A facile route for fabrication of hierarchical porous Nb2O5/ZnO composites with enhancedphotocatalytic degradation of palm oil mill effluent. Mater. Lett. 2018, 216, 8–11. [CrossRef]
128. Madhusudan Reddy, K.; Manorama, S.V.; Ramachandra Reddy, A. Bandgap studies on anatase titanium dioxide nanoparticles.Mater. Chem. Phys. 2003, 78, 239–245. [CrossRef]
129. Ahadi, S.; Moalej, N.S.; Sheibani, S. Characteristics and photocatalytic behavior of Fe and Cu doped TiO2 prepared by combinedsol-gel and mechanical alloying. Solid State Sci. 2019, 96, 105975. [CrossRef]
130. Sadanandam, G.; Lalitha, K.; Kumari, V.D.; Shankar, M.V.; Subrahmanyam, M. Cobalt doped TiO2: A stable and efficientphotocatalyst for continuous hydrogen production from glycerol: Water mixtures under solar light irradiation. Int. J. HydrogenEnergy 2013, 38, 9655–9664. [CrossRef]
131. Barmeh, A.; Nilforoushan, M.R.; Otroj, S. Wetting and photocatalytic properties of Ni-doped TiO2 coating on glazed ceramic tilesunder visible light. Thin Solid Film. 2018, 666, 137–142. [CrossRef]
132. Binas, V.; Stefanopoulos, V.; Kiriakidis, G.; Papagiannakopoulos, P. Photocatalytic oxidation of gaseous benzene, toluene andxylene under UV and visible irradiation over Mn-doped TiO2 nanoparticles. J. Mater. 2019, 5, 56–65. [CrossRef]
133. Sanchez-Dominguez, M.; Morales-Mendoza, G.; Rodriguez-Vargas, M.J.; Ibarra-Malo, C.C.; Rodriguez-Rodriguez, A.A.; Vela-Gonzalez, A.V.; Perez-Garcia, S.A.; Gomez, R. Synthesis of Zn-doped TiO2 nanoparticles by the novel oil-in-water (O/W)microemulsion method and their use for the photocatalytic degradation of phenol. J. Environ. Chem. Eng. 2015, 3, 3037–3047.[CrossRef]
134. Teh, C.M.; Mohamed, A.R. Roles of titanium dioxide and ion-doped titanium dioxide on photocatalytic degradation of organicpollutants (phenolic compounds and dyes) in aqueous solutions: A review. J. Alloys Compd. 2011, 509, 1648–1660. [CrossRef]
135. Abdullah, H.; Khan, M.M.R.; Ong, H.R.; Yaakob, Z. Modified TiO2 photocatalyst for CO2 photocatalytic reduction: An overview.J. CO2 Util. 2017, 22, 15–32. [CrossRef]
136. Zhu, J.; Chen, F.; Zhang, J.; Chen, H.; Anpo, M. Fe3+-TiO2 photocatalysts prepared by combining sol–gel method with hydrother-mal treatment and their characterization. J. Photochem. Photobiol. A Chem. 2006, 180, 196–204. [CrossRef]
137. Zhou, F.; Song, H.; Wang, H.; Komarneni, S.; Yan, C. N-doped TiO2/sepiolite nanocomposites with enhanced visible-lightcatalysis: Role of N precursors. Appl. Clay Sci. 2018, 166, 9–17. [CrossRef]
138. Jo, W.-K.; Kang, H.-J. Aluminum sheet-based S-doped TiO2 for photocatalytic decomposition of toxic organic vapors. Chin. J.Catal. 2014, 35, 1189–1195. [CrossRef]
139. Matos, J.; Ocares-Riquelme, J.; Poon, P.S.; Montaña, R.; García, X.; Campos, K.; Hernández-Garrido, J.C.; Titirici, M.M. C-dopedanatase TiO2: Adsorption kinetics and photocatalytic degradation of methylene blue and phenol, and correlations with DFTestimations. J. Colloid Interface Sci. 2019, 547, 14–29. [CrossRef]
Materials 2021, 14, 2846 34 of 35
140. Zhang, C.; Liu, Y.; Zhou, J.; Jin, W.; Chen, W. Tunability of photo-catalytic selectivity of B-doped anatase TiO2 microspheres in thevisible light. Dye. Pigment. 2018, 156, 213–218. [CrossRef]
141. Pambudi, A.B.; Kurniawati, R.; Iryani, A.; Hartanto, D. Effect of calcination temperature in the synthesis of carbon doped TiO2without external carbon source. AIP Conf. Proc. 2018, 2049, 020074. [CrossRef]
142. Kalantari, K.; Kalbasi, M.; Sohrabi, M.; Royaee, S.J. Synthesis and characterization of N-doped TiO2 nanoparticles and theirapplication in photocatalytic oxidation of dibenzothiophene under visible light. Ceram. Int. 2016, 42, 14834–14842. [CrossRef]
143. Ananpattarachai, J.; Kajitvichyanukul, P.; Seraphin, S. Visible light absorption ability and photocatalytic oxidation activity ofvarious interstitial N-doped TiO2 prepared from different nitrogen dopants. J. Hazard. Mater. 2009, 168, 253–261. [CrossRef][PubMed]
144. Zhang, J.; Wu, Y.; Xing, M.; Leghari, S.A.K.; Sajjad, S. Development of modified N doped TiO2 photocatalyst with metals,nonmetals and metal oxides. Energy Environ. Sci. 2010, 3, 715–726. [CrossRef]
145. Cong, Y.; Chen, F.; Zhang, J.; Anpo, M. Carbon and Nitrogen-Codoped TiO2 with High Visible Light Photocatalytic Activity.Chem. Lett. Chem. Lett. 2006, 35, 800–801. [CrossRef]
146. Komai, Y.; Okitsu, K.; Nishimura, R.; Ohtsu, N.; Miyamoto, G.; Furuhara, T.; Semboshi, S.; Mizukoshi, Y.; Masahashi, N. Visiblelight response of nitrogen and sulfur co-doped TiO2 photocatalysts fabricated by anodic oxidation. Catal. Today 2011, 164, 399–403.[CrossRef]
147. Wu, Y.; Xing, M.; Zhang, J. Gel-hydrothermal synthesis of carbon and boron co-doped TiO2 and evaluating its photocatalyticactivity. J. Hazard. Mater. 2011, 192, 368–373. [CrossRef] [PubMed]
148. Sun, T.; Fan, J.; Liu, E.; Liu, L.; Wang, Y.; Dai, H.; Yang, Y.; Hou, W.; Hu, X.; Jiang, Z. Fe and Ni co-doped TiO2 nanoparticlesprepared by alcohol-thermal method: Application in hydrogen evolution by water splitting under visible light irradiation. PowderTechnol. 2012, 228, 210–218. [CrossRef]
149. Talat-Mehrabad, J.; Khosravi, M.; Modirshahla, N.; Behnajady, M.A. Synthesis, characterization, and photocatalytic activity ofco-doped Ag–, Mg–TiO2-P25 by photodeposition and impregnation methods. Desalination Water Treat. 2016, 57, 10451–10461.[CrossRef]
150. Quan, F.; Hu, Y.; Zhang, X.; Wei, C. Simple preparation of Mn-N-codoped TiO2 photocatalyst and the enhanced photocatalyticactivity under visible light irradiation. Appl. Surf. Sci. 2014, 320, 120–127. [CrossRef]
151. Jaiswal, R.; Patel, N.; Kothari, D.C.; Miotello, A. Improved visible light photocatalytic activity of TiO2 co-doped with Vanadiumand Nitrogen. Appl. Catal. B Environ. 2012, 126, 47–54. [CrossRef]
152. Wei, H.; Wu, Y.; Lun, N.; Zhao, F. Preparation and photocatalysis of TiO2 nanoparticles co-doped with nitrogen and lanthanum. J.Mater. Sci. 2004, 39, 1305–1308. [CrossRef]
153. Gaikwad, P.N.; Hankare, P.P.; Wandre, T.M.; Garadkar, K.M.; Sasikala, R. Photocatalytic performance of magnetically separableFe, N co-doped TiO2-cobalt ferrite nanocomposite. Mater. Sci. Eng. B 2016, 205, 40–45. [CrossRef]
154. Zhao, Y.F.; Li, C.; Lu, S.; Liu, R.X.; Hu, J.Y.; Gong, Y.Y.; Niu, L.Y. Electronic, optical and photocatalytic behavior of Mn, N dopedand co-doped TiO2: Experiment and simulation. J. Solid State Chem. 2016, 235, 160–168. [CrossRef]
155. Bessekhouad, Y.; Robert, D.; Weber, J.V. Bi2S3/TiO2 and CdS/TiO2 heterojunctions as an available configuration for photocatalyticdegradation of organic pollutant. J. Photochem. Photobiol. A Chem. 2004, 163, 569–580. [CrossRef]
156. Karimzadeh, S.; Bahrami, K. Role of L-cysteine and CdS as promoted agents in photocatalytic activity of TiO2 nanoparticles. J.Environ. Chem. Eng. 2019, 7, 103454. [CrossRef]
157. Boumaza, S.; Bellal, B.; Boudjemaa, A.; Trari, M. Photodegradation of orange G by the hetero-junction x%Bi2S3/TiO2 under solarlight. Sol. Energy 2016, 139, 444–451. [CrossRef]
158. Khan, R.; Kim, T.-J. Preparation and application of visible-light-responsive Ni-doped and SnO2-coupled TiO2 nanocompositephotocatalysts. J. Hazard. Mater. 2009, 163, 1179–1184. [CrossRef]
159. Kaviyarasan, K.; Vinoth, V.; Sivasankar, T.; Asiri, A.M.; Wu, J.J.; Anandan, S. Photocatalytic and photoelectrocatalytic performanceof sonochemically synthesized Cu2O@TiO2 heterojunction nanocomposites. Ultrason. Sonochem. 2019, 51, 223–229. [CrossRef][PubMed]
160. Ziarati-Saravani, A.; Nadimi, M.; Aroon, M.A.; Ebrahimian Pirbazari, A. Magnetic TiO2/NiFe2O4/reduced graphene oxidenanocomposite as a recyclable photocatalyst for photocatalytic removal of methylene blue under visible light. J. Alloys Compd.2019, 803, 291–306. [CrossRef]
161. Hafeez, H.Y.; Lakhera, S.K.; Narayanan, N.; Harish, S.; Hayakawa, Y.; Lee, B.-K.; Neppolian, B. Environmentally SustainableSynthesis of a CoFe2O4–TiO2/rGO Ternary Photocatalyst: A Highly Efficient and Stable Photocatalyst for High Production ofHydrogen (Solar Fuel). ACS Omega 2019, 4, 880–891. [CrossRef]
162. Chowdhury, M.; Kapinga, S.; Cummings, F.; Fester, V. Co3O4/TiO2 hetero-structure for methyl orange dye degradation. WaterSci. Technol. 2018, 79, 947–957. [CrossRef]
163. Nasirian, M.; Bustillo-Lecompte, C.F.; Mehrvar, M. Photocatalytic efficiency of Fe2O3/TiO2 for the degradation of typical dyes intextile industries: Effects of calcination temperature and UV-assisted thermal synthesis. J. Environ. Manag. 2017, 196, 487–498.[CrossRef] [PubMed]
164. Salamat, S.; Younesi, H.; Bahramifar, N. Synthesis of magnetic core–shell Fe3O4@TiO2 nanoparticles from electric arc furnace dustfor photocatalytic degradation of steel mill wastewater. RSC Adv. 2017, 7, 19391–19405. [CrossRef]
Materials 2021, 14, 2846 35 of 35
165. Choi, K.-J.; Hong, S. Preparation of TiO2 nanofibers immobilized on quartz substrate by electrospinning for photocatalyticdegradation of ranitidine. Res. Chem. Intermed. 2011, 38. [CrossRef]
166. Yao, S.; Li, J.; Shi, Z. Immobilization of TiO2 nanoparticles on activated carbon fiber and its photodegradation performance fororganic pollutants. Particuology 2010, 8, 272–278. [CrossRef]
167. Miranda-García, N.; Suárez, S.; Maldonado, M.I.; Malato, S.; Sánchez, B. Regeneration approaches for TiO2 immobilizedphotocatalyst used in the elimination of emerging contaminants in water. Catal. Today 2014, 230, 27–34. [CrossRef]
168. Carp, O.; Huisman, C.L.; Reller, A. Photoinduced reactivity of titanium dioxide. Prog. Solid State Chem. 2004, 32, 33–177.[CrossRef]
169. Wang, Y.; Zhang, X.; Liu, J.; Wang, Y.; Duan, D.; Fan, C. Facile regeneration and photocatalytic activity of CuO-modified silverbromide photocatalyst. Mater. Sci. Semicond. Process. 2015, 40, 613–620. [CrossRef]
170. Kabra, K.; Chaudhary, R.; Sawhney, R.L. Treatment of Hazardous Organic and Inorganic Compounds through Aqueous-PhasePhotocatalysis: A Review. Ind. Eng. Chem. Res. 2004, 43, 7683–7696. [CrossRef]
171. Pan, X.; Zhang, N.; Fu, X.; Xu, Y.-J. Selective oxidation of benzyl alcohol over TiO2 nanosheets with exposed {001} facets: Catalystdeactivation and regeneration. Appl. Catal. A Gen. 2013, 453, 181–187. [CrossRef]
172. Kagaya, S.; Shimizu, K.; Arai, R.; Hasegawa, K. Separation of titanium dioxide photocatalyst in its aqueous suspensions bycoagulation with basic aluminium chloride. Water Res. 1999, 33, 1753–1755. [CrossRef]
173. Divakaran, R.; Pillai, V.N.S. Mechanism of kaolinite and titanium dioxide flocculation using chitosan—Assistance by fulvic acids?Water Res. 2004, 38, 2135–2143. [CrossRef]
174. Wang, H.T.; Ye, Y.Y.; Qi, J.; Li, F.T.; Tang, Y.L. Removal of titanium dioxide nanoparticles by coagulation: Effects of coagulants,typical ions, alkalinity and natural organic matters. Water Sci. Technol. 2013, 68, 1137–1143. [CrossRef] [PubMed]
175. Cui, P.; Chen, Y.; Chen, G. Degradation of Low Concentration Methyl Orange in Aqueous Solution through Sonophotocatalysiswith Simultaneous Recovery of Photocatalyst by Ceramic Membrane Microfiltration. Ind. Eng. Chem. Res. 2011, 50, 3947–3954.[CrossRef]
176. Gaya, U.I.; Abdullah, A.H. Heterogeneous photocatalytic degradation of organic contaminants over titanium dioxide: A reviewof fundamentals, progress and problems. J. Photochem. Photobiol. C Photochem. Rev. 2008, 9, 1–12. [CrossRef]
177. Chong, M.N.; Lei, S.; Jin, B.; Saint, C.; Chow, C.W.K. Optimisation of an annular photoreactor process for degradation of CongoRed using a newly synthesized titania impregnated kaolinite nano-photocatalyst. Sep. Purif. Technol. 2009, 67, 355–363. [CrossRef]
178. Khedr, T.M.; El-Sheikh, S.M.; Ismail, A.A.; Kowalska, E.; Bahnemann, D.W. Photodegradation of Microcystin-LR Using VisibleLight-Activated C/N-co-Modified Mesoporous TiO2 Photocatalyst. Materials 2019, 12, 1027. [CrossRef]
179. Malato, S.; Fernández-Ibáñez, P.; Maldonado, M.I.; Blanco, J.; Gernjak, W. Decontamination and disinfection of water by solarphotocatalysis: Recent overview and trends. Catal. Today 2009, 147, 1–59. [CrossRef]
180. Saquib, M.; Muneer, M. Titanium dioxide mediated photocatalyzed degradation of a textile dye derivative, acid orange 8, inaqueous suspensions. Desalination 2003, 155, 255–263. [CrossRef]
181. Ohno, T.; Sarukawa, K.; Tokieda, K.; Matsumura, M. Morphology of a TiO2 Photocatalyst (Degussa, P-25) Consisting of Anataseand Rutile Crystalline Phases. J. Catal. 2001, 203, 82–86. [CrossRef]
182. Muggli, D.S.; Ding, L. Photocatalytic performance of sulfated TiO2 and Degussa P-25 TiO2 during oxidation of organics. Appl.Catal. B Environ. 2001, 32, 181–194. [CrossRef]
183. Muneer, M.; Singh, H.K.; Bahnemann, D. Semiconductor-mediated photocatalysed degradation of two selected priority organicpollutants, benzidine and 1,2-diphenylhydrazine, in aqueous suspension. Chemosphere 2002, 49, 193–203. [CrossRef]
184. Ma, Y.; Zhang, J.; Tian, B.; Chen, F.; Wang, L. Synthesis and characterization of thermally stable Sm,N co-doped TiO2 with highlyvisible light activity. J. Hazard. Mater. 2010, 182, 386–393. [CrossRef] [PubMed]
185. Monshi, A.; Foroughi, M.R.; Monshi, M. Modified Scherrer Equation to Estimate More Accurately Nano-Crystallite Size UsingXRD. World J. Nano Sci. Eng. 2012, 2, 154–160. [CrossRef]
186. Liang, H.-C.; Li, X.-Z.; Yang, Y.-H.; Sze, K.-H. Effects of dissolved oxygen, pH, and anions on the 2,3-dichlorophenol degradationby photocatalytic reaction with anodic TiO2 nanotube films. Chemosphere 2008, 73, 805–812. [CrossRef]
187. Gerischer, H.; Heller, A. The role of oxygen in photooxidation of organic molecules on semiconductor particles. J. Phys. Chem.1991, 95, 5261–5267. [CrossRef]
188. Almquist, C.B.; Biswas, P. A mechanistic approach to modeling the effect of dissolved oxygen in photo-oxidation reactions ontitanium dioxide in aqueous systems. Chem. Eng. Sci. 2001, 56, 3421–3430. [CrossRef]
189. Bahnemann, D. Photocatalytic water treatment: Solar energy applications. Sol. Energy 2004, 77, 445–459. [CrossRef]190. Rincón, A.-G.; Pulgarin, C. Use of coaxial photocatalytic reactor (CAPHORE) in the TiO2 photo-assisted treatment of mixed E.
coli and Bacillus sp. and bacterial community present in wastewater. Catal. Today 2005, 101, 331–344. [CrossRef]191. Fujishima, A.; Rao, T.N.; Tryk, D.A. Titanium dioxide photocatalysis. J. Photochem. Photobiol. C Photochem. Rev. 2000, 1, 1–21.
[CrossRef]192. Ollis, D.F.; Pelizzetti, E.; Serpone, N. Photocatalyzed destruction of water contaminants. Environ. Sci. Technol. 1991, 25, 1522–1529.
[CrossRef]193. Reutergådh, L.B.; Iangphasuk, M. Photocatalytic decolourization of reactive azo dye: A comparison between TiO2 and us
photocatalysis. Chemosphere 1997, 35, 585–596. [CrossRef]
Copyright © 2022 FDOKUMEN