Ti3+-containing titania: Synthesis tactics and photocatalytic performance
7
Catalysis Today 246 (2015) 60–66 Contents lists available at ScienceDirect Catalysis Today j o ur na l ho me page: www.elsevier.com/locate/cattod Ti 3+ -containing titania: Synthesis tactics and photocatalytic performance Wibawa H. Saputera a , Guido Mul a , Mohamed S. Hamdy a,b,∗ a Photocatalytic Synthesis Group, Faculty of Science and Technology, MESA + Institute of Nanotechnology, University of Twente, The Netherlands b Chemistry Department, Faculty of Science, Helwan University, Ain Helwan, 11719 Cairo, Egypt a r t i c l e i n f o Article history: Received 1 May 2014 Received in revised form 4 July 2014 Accepted 20 July 2014 Available online 29 August 2014 Keywords: Ti 3+ Hydrogenation TiO2 Photocatalysis Stability Pt photo-deposition a b s t r a c t Three different synthesis techniques were applied to prepare Ti 3+ -containing TiO 2 . The first is a self- doped technique in which TiO 2 was reduced in situ at 500 ◦ C by NO and CO gases to produce blue powder (blue titania). The second method is a calcination treatment of a physical mixture consisting of commer- cial TiO 2 Hombikat and Ti 2 O 3 at 600 ◦ C to produce a yellow powder (composite). The third technique is hydrogenation of different commercially available titania (Rutile, P25, and Hombikat) samples at ele- vated temperatures to produce yellowish white powders. The prepared samples were characterized by means of X-ray diffraction (XRD), nitrogen physisorption measurements, diffuse reflectance UV–Vis and Raman spectroscopy, electron paramagnetic resonance (EPR) spectroscopy, and scanning electron microscopy (SEM). The photocatalytic activity of the prepared materials was tested in the decolouriza- tion reaction of methyl orange (MO) under the illumination of ‘black light’ ( = 375 nm). The kinetic data of the photocatalytic reactions show that reduced titania samples exhibit higher photocatalytic activity than titania. Furthermore, the highest photocatalytic activity was obtained by hydrogenation of P25 at 500 ◦ C. Moreover, the photo-deposition of platinum nanoparticles on the prepared materials enhanced the photocatalytic performance significantly. Titania samples which were firstly platinized and then hydrogenated were much more active than samples which were hydrogenated first and then platinized. The stability of the Ti 3+ containing titania samples in aqueous conditions was found to be low, and needs to be improved to allow application in practice. © 2014 Elsevier B.V. All rights reserved. 1. Introduction Heterogeneous photocatalysis constitutes one of the most important and promising technologies for removal of organic pol- lutants from water and air [1]. TiO 2 is by far the most frequently applied photocatalyst [2], and has been used as an active photocata- lyst in several applications such as organic syntheses [3], hydrogen production [4], CO 2 reduction [5,6], air cleaning [7] and wastewater treatment in which organic compounds are totally converted into carbon dioxide [8–10]. The main drawback of TiO 2 is the wide band gap (3.2 eV), which limits its light response to the UV region [11]. Several attempts have been reported to shift the light absorption of TiO 2 towards the visible light region, such as doping with metal ions (Cr [12], V [13], Fe [14]), or N [15], or using dye sensitization techniques [16]. ∗ Corresponding author at: Chemistry Department, Faculty of Science, Helwan University, Ain Helwan, 11719 Cairo, Egypt. Tel.: +20 225552468; fax: +20 225552467. E-mail address: [email protected] (M.S. Hamdy). Reduced titania (TiO 2−x , where 0 < x < 1) has attracted a lot of interest because it shows a visible light response [17]. Different methods have been reported to prepare the reduced titania crys- tals, such as plasma or laser treatment [18,19], thermal treatment under vacuum or helium [20,21], bombardment with high energy particles (e.g., neutrons, or -rays) [22], in situ reduction by reduc- ing gases such as CO and/or NO [17], ozone treatment [23], using NaBH 4 as a reducing agent [24], or adding TiF 4 during the formation of TiO 2 nanoparticles [25]. Furthermore, thermal treatment of TiO 2 and Ti 2 O 3 resulted in a composite showing a photocatalytic response much higher than of the parent TiO 2 [26,27]. In addition, the hydrogenation of tita- nia at elevated temperatures to create Ti 3+ -sites was reported by Mao et al. [28]. After the report of Mao and co-workers, the hydro- genation of titania has attracted scientists to use this technique to produce reduced titania and study its performance in various photocatalytic applications [29–31]. In this study, three different techniques to prepare Ti 3+ - containing titania samples are compared for effectiveness in creating photocatalytically attractive composites, i.e. hydrogena- tion of commercial titania (P25, Hombikat and Rutile), self-doping http://dx.doi.org/10.1016/j.cattod.2014.07.049 0920-5861/© 2014 Elsevier B.V. All rights reserved.
-
Upload
independent -
Category
Documents
-
view
8 -
download
0
Transcript of Ti3+-containing titania: Synthesis tactics and photocatalytic performance
Tp
Wa
b
a
ARRAA
KTHTPSP
1
ilalptcgSoit
Uf
h0
Catalysis Today 246 (2015) 60–66
Contents lists available at ScienceDirect
Catalysis Today
j o ur na l ho me page: www.elsev ier .com/ locate /ca t tod
i3+-containing titania: Synthesis tactics and photocatalyticerformance
ibawa H. Saputeraa, Guido Mula, Mohamed S. Hamdya,b,∗
Photocatalytic Synthesis Group, Faculty of Science and Technology, MESA+ Institute of Nanotechnology, University of Twente, The NetherlandsChemistry Department, Faculty of Science, Helwan University, Ain Helwan, 11719 Cairo, Egypt
r t i c l e i n f o
rticle history:eceived 1 May 2014eceived in revised form 4 July 2014ccepted 20 July 2014vailable online 29 August 2014
eywords:i3+
ydrogenationiO2
hotocatalysistabilityt photo-deposition
a b s t r a c t
Three different synthesis techniques were applied to prepare Ti3+-containing TiO2. The first is a self-doped technique in which TiO2 was reduced in situ at 500 ◦C by NO and CO gases to produce blue powder(blue titania). The second method is a calcination treatment of a physical mixture consisting of commer-cial TiO2 Hombikat and Ti2O3 at 600 ◦C to produce a yellow powder (composite). The third technique ishydrogenation of different commercially available titania (Rutile, P25, and Hombikat) samples at ele-vated temperatures to produce yellowish white powders. The prepared samples were characterizedby means of X-ray diffraction (XRD), nitrogen physisorption measurements, diffuse reflectance UV–Visand Raman spectroscopy, electron paramagnetic resonance (EPR) spectroscopy, and scanning electronmicroscopy (SEM). The photocatalytic activity of the prepared materials was tested in the decolouriza-tion reaction of methyl orange (MO) under the illumination of ‘black light’ (� = 375 nm). The kinetic dataof the photocatalytic reactions show that reduced titania samples exhibit higher photocatalytic activitythan titania. Furthermore, the highest photocatalytic activity was obtained by hydrogenation of P25 at
◦
500 C. Moreover, the photo-deposition of platinum nanoparticles on the prepared materials enhancedthe photocatalytic performance significantly. Titania samples which were firstly platinized and thenhydrogenated were much more active than samples which were hydrogenated first and then platinized.The stability of the Ti3+ containing titania samples in aqueous conditions was found to be low, and needsto be improved to allow application in practice.. Introduction
Heterogeneous photocatalysis constitutes one of the mostmportant and promising technologies for removal of organic pol-utants from water and air [1]. TiO2 is by far the most frequentlypplied photocatalyst [2], and has been used as an active photocata-yst in several applications such as organic syntheses [3], hydrogenroduction [4], CO2 reduction [5,6], air cleaning [7] and wastewaterreatment in which organic compounds are totally converted intoarbon dioxide [8–10]. The main drawback of TiO2 is the wide bandap (3.2 eV), which limits its light response to the UV region [11].everal attempts have been reported to shift the light absorption
f TiO2 towards the visible light region, such as doping with metalons (Cr [12], V [13], Fe [14]), or N [15], or using dye sensitizationechniques [16].∗ Corresponding author at: Chemistry Department, Faculty of Science, Helwanniversity, Ain Helwan, 11719 Cairo, Egypt. Tel.: +20 225552468;
ax: +20 225552467.E-mail address: [email protected] (M.S. Hamdy).
ttp://dx.doi.org/10.1016/j.cattod.2014.07.049920-5861/© 2014 Elsevier B.V. All rights reserved.
© 2014 Elsevier B.V. All rights reserved.
Reduced titania (TiO2−x, where 0 < x < 1) has attracted a lot ofinterest because it shows a visible light response [17]. Differentmethods have been reported to prepare the reduced titania crys-tals, such as plasma or laser treatment [18,19], thermal treatmentunder vacuum or helium [20,21], bombardment with high energyparticles (e.g., neutrons, or �-rays) [22], in situ reduction by reduc-ing gases such as CO and/or NO [17], ozone treatment [23], usingNaBH4 as a reducing agent [24], or adding TiF4 during the formationof TiO2 nanoparticles [25].
Furthermore, thermal treatment of TiO2 and Ti2O3 resulted ina composite showing a photocatalytic response much higher thanof the parent TiO2 [26,27]. In addition, the hydrogenation of tita-nia at elevated temperatures to create Ti3+-sites was reported byMao et al. [28]. After the report of Mao and co-workers, the hydro-genation of titania has attracted scientists to use this techniqueto produce reduced titania and study its performance in variousphotocatalytic applications [29–31].
In this study, three different techniques to prepare Ti3+-containing titania samples are compared for effectiveness increating photocatalytically attractive composites, i.e. hydrogena-tion of commercial titania (P25, Hombikat and Rutile), self-doping
alysis
oado
2
2
t[[msrad
2
as(wwnrh24pHth
2
psisdflt
oeTgwh
2
Xpsb
uttTB
W.H. Saputera et al. / Cat
f titania, and preparation of a TiO2/Ti2O3 composite. The photocat-lytic performance of the prepared samples was compared in theecolorization of methyl orange as a model compound. The effectf Pt addition on the photocatalytic activity was also evaluated.
. Experimental
.1. Material synthesis
Three different techniques were applied to prepare Ti3+ con-aining titania. The first technique is the self-doping technique31], the second technique is calcination of a TiO2/Ti2O3 composite27], and the third technique the hydrogenation of different com-
ercial titania samples. The synthesis and characterization of theelf-doped materials and the composite TiO2/Ti2O3 samples wereeported recently [27,31]. In the following sections, the synthesisnd characterization of hydrogenated samples will be discussed inetail.
.1.1. Hydrogenation techniquesHydrogenation of commercial TiO2 samples was carried out in
tube furnace with H2 flow at different temperatures. In a typicalynthesis procedure, 1 g of Rutile TiO2 (99.5%, Sigma–Aldrich), P2599.9%, Evonic), or Hombikat UV-100 (99.9%, Sachtleben Chemie)as placed on a small holder and inserted into a 1.2 m quartz tubeith 10 cm internal diameter. The tube was placed in the tube fur-ace (Tamson Heraeus). Nitrogen gas was flowed for 30 min toemove air from the tube with a flow rate of 100 ml/min. Then,ydrogen gas was flowed into the quartz tube with a rate of0 ml/min, and the oven was heated to different temperatures of00, 500, 600 and 700 ◦C at 10 K/min, and maintained at these tem-eratures for 5 h. The samples obtained this way are labeled HR-x,P-x and HH-x, where H refers to hydrogenated, and R, P, or H refers
o Rutile, P25, or Hombikat, respectively, and x refers to the appliedeating temperature (from 400 to 700 ◦C) during hydrogenation.
.1.2. Photo-deposition of platinum2 wt.% of platinum was deposited on the different titania sam-
les by the photo-deposition technique. In a typical procedure, auspension of 200 mg of titania in 23.7 ml of water was introducednto a top illumination reactor, followed by 26.3 ml of a H2PtCl6olution (1 g/L), and 12 ml of methanol. The solution was then irra-iated with UV light (Carl ZEISS, HBO 50W) for 24 h using an airow of 20 ml/min. Finally, the residue was centrifuged, washed fewimes, and dried overnight at 100 ◦C.
The Hombikat sample was chosen to study whether the orderf the reduction and Pt modification process, respectively, has anffect on the resulting photocatalytic performance of Hombikat.wo samples were prepared: in the first sample, Hombikat hydro-enated at 600 ◦C was platinized as mentioned above (Pt-HH-600),hile in the second sample Hombikat was first platinized and thenydrogenated at 600 ◦C (H-Pt-H-600).
.2. Characterization
The crystal structure of the samples was determined in air by-ray diffraction using a Bruker D2 phaser instrument. The sam-les were ground and sieved to obtain a fine powder of particleizes <50 �m. Data were collected varying the angle of detectionetween 10◦ and 90◦, with a step size of 0.005◦.
Nitrogen physisorption measurements were carried out at 77 Ksing a Micromeritics Tristar system (ASAP 2400) to determine
he textural properties. Prior to the adsorption measurements,he samples were degassed at 573 K and 10−3 Pa for 24 h.he specific surface areas were calculated according to therunauer–Emmet–Teller (BET) method.Today 246 (2015) 60–66 61
Diffuse reflectance UV–Vis spectra were collected at ambienttemperature on an EVOLUTION 600 (ThermoScientific) spectrom-eter, using BaSO4 as reference. Spectra were recorded in thewavelength range of 200–800 nm.
Raman spectra were recorded using a Bruker Senterra RamanSpectrometer equipped with a N2 cooled CCD detector (213 K). Agreen 532 nm laser with an intensity of 2 mW was used for excita-tion. Spectra were acquired at a resolution of 9 cm−1, and 10 scanswere accumulated to generate each spectrum.
The presence of Ti3+ in various composites was also evaluatedusing EPR spectroscopy, using a Bruker Elexsys 680 instrument.The EPR measurement was conducted at 9.73 GHz (X-band). Themicrowave power was set at 2.526 mW, the modulation amplitudeat 5 G, and the temperature of measurement at 80 K.
The morphologies of the samples were investigated by scanningelectron microscopy (SEM), using a HR-SEM-LEO 1550 equippedwith NORAN EDS and WDS capabilities.
2.3. Catalytic activity
The photocatalytic activity of the prepared materials was testedin the decolourization reaction of methyl orange (MO). The appliedphoto-reactor was described earlier in detail [33]. In a typical reac-tion, 50 mg of the catalyst was introduced into a beaker containing50 ml of MO solution (20 mg/L). The suspension was ultra-sonicatedfor approximately 10 min and then placed into the reactor. The pHof the solution was measured to be 5.4. The solution was stirredfor 30 min in the dark at room temperature to allow for completeadsorption. Once this time had elapsed, a sample of the solution wastaken, and the remaining reaction solution irradiated with UV light.Additional samples were taken every 20 min, filtered through a 0.2-mm PTFE Millipore membrane filter to remove suspended catalystagglomerates, and finally analyzed using a UV–Vis spectrometer(EVOLUTION 600, Thermo Scientific) in the range between 250 and600 nm to determine the concentration of the dye. The reactionrate constant (ka) was then determined assuming quasi first orderkinetics using the following equation:
ln(
C0
C
)= kat
where C0 is the concentration of the dye in solution after adsorp-tion, C is the concentration at time t, and ka is the reaction rateconstant. All reactions were repeated at least two times with freshcatalyst. The standard deviation was estimated to be ±5%.
Catalyst stability was evaluated as follows: a catalyst compositewas filtered after use, washed several times with distilled water,and finally dried at 100 ◦C for 24 h in static air. Re-suspension infresh dye solution was followed by the steps indicate above for thefresh catalyst samples. Catalysts were used up to as much as threetimes.
An additional experiment was carried out to study the com-plete mineralization of MO, in which, 50 mg of catalyst was addedto 50 ml of methyl orange solution of 0.02 g/L. The suspensionwas sonicated for approximately 20 min. Then, the suspension wasinjected into a spiral reactor fitted with a UV black light tube (18 W,365 nm), peristaltic pump and modular controller. The conductiv-ity of CO2 was measured by using a conductivity probe 3540pH,and conductivity meter supplied by JENWAY.
3. Results and discussion
3.1. The morphology of the hydrogenated titania samples
From previous studies, the morphology of the parent titaniasamples can be summarized as follows: (a) Hombikat is a semi-crystalline mesoporous titania, consists of the anatase phase, and
62 W.H. Saputera et al. / Catalysis Today 246 (2015) 60–66
F tures,m ydrog
pc(a
tscpsTfoirit
phppmiiiRosfTaHt
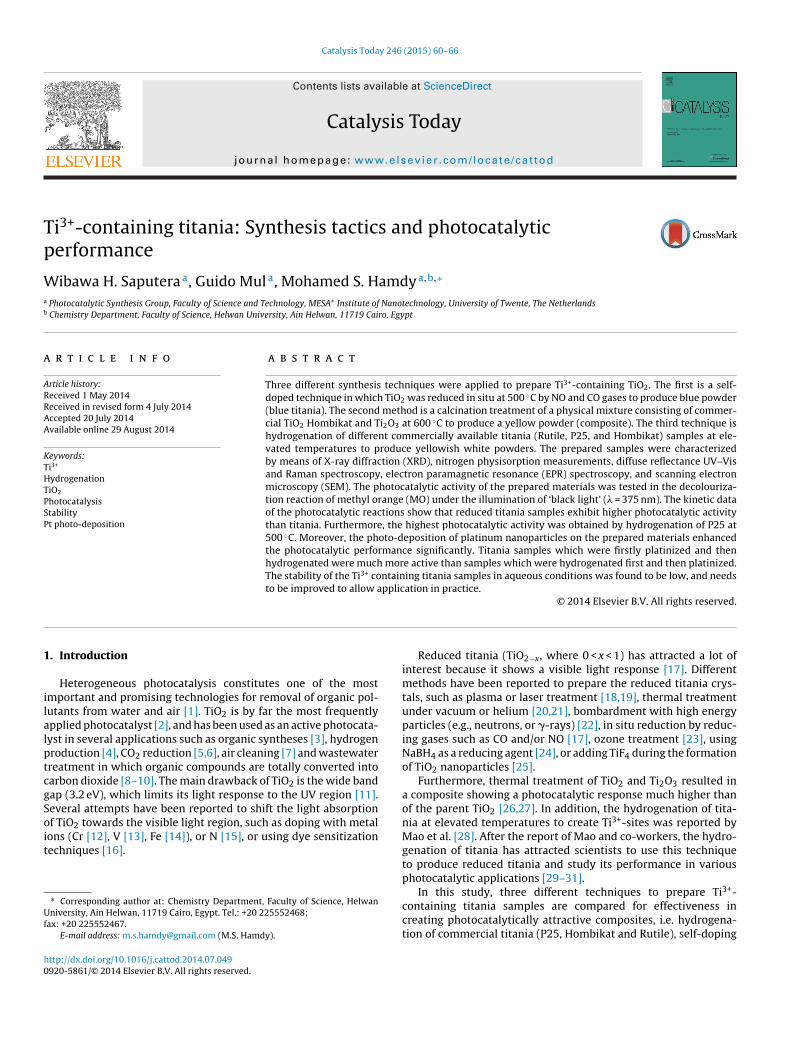
ig. 1. The color of the hydrogenated titania samples treated at different temperaiddle pictures show the hydrogenated P25 samples, and right pictures show the h
ossesses a high surface area (SBET > 250 m2/g), (b) Rutile is a highlyrystalline pure rutile phase titania with a small surface areaSBET < 5 m2/g), and (c) P25 is a crystalline titania with mixed phases,lmost 70% anatase and 30% rutile, with a surface area of 52 m2/g.
Upon hydrogenation, the physical and chemical properties ofhe titania samples had changed. The color of the hydrogenatedamples at different temperatures is demonstrated in Fig. 1. Theolor of hydrogenated Hombikat and Rutile changed from white toale yellow, dark yellow, yellowish gray and finally to gray for theamples hydrogenated at 400, 500, 600, and 700 ◦C, respectively.he color of the P25 sample was slightly changed to pale yellowor the sample hydrogenated at 400 ◦C and then off-white for thether hydrogenated samples at elevated temperatures. The changen the color of hydrogenated titania was also observed by otheresearchers [34,35] and it has been reported that the main reasons the creation of oxygen vacancies in the lattice associated withhe presence of Ti3+ atoms.
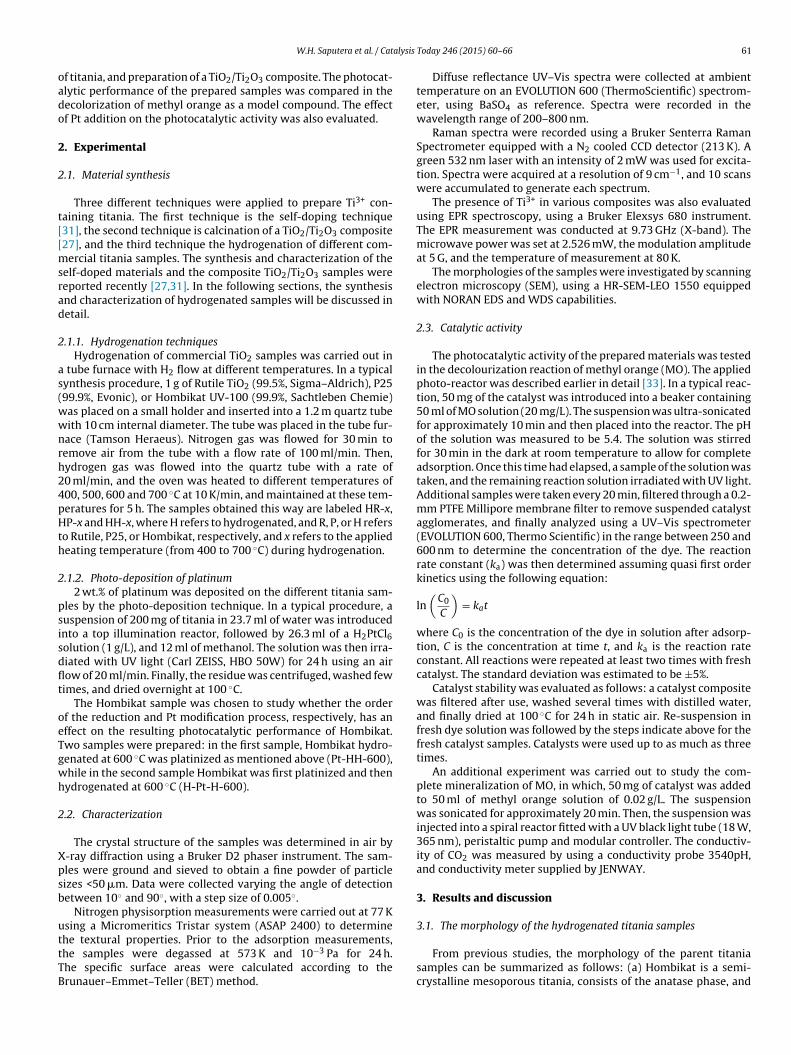
The changes in the degree of crystallization, and phase com-osition were investigated by XRD. In Fig. 2, the XRD patterns ofydrogenated P25 and Hombikat samples are compared to theatterns of commercial P25 and Hombikat, respectively. The XRDatterns of hydrogenated Rutile samples did not show significantorphology changes. However, hydrogenated P25 samples exhib-
ted a phase transformation at temperatures above 700 ◦C. Thentensity of the peak of the Rutile phase (at 26◦ 2�) was develop-ng as a function of increasing thermal treatment temperature. Theutile peak becomes dominant with finally a total disappearancef the anatase peak (at 24◦ 2�) at 700 ◦C. Hydrogenated Hombikatamples became more crystalline, however, phase transformationrom anatase to rutile was not observed for this titania sample.
he observed phase transformations of P25 and Hombikat are ingood agreement with the work of Rao [36] and Roy et al. [37].ence, the hydrogenation step – most likely – does not influence
he phase transformation of TiO2, and the main parameters of phase
20
Inte
nsit
y (
a.u
.)
30 40 50
2 theta (o)
60 70
HP
HP
HP
HP
P2
HP
Ru
80
P-600
P-5 50
P-500
P-4 00
5
P-700
util e
Fig. 2. The XRD patterns of hydrogenated P25 (left panel) and hydrog
from 400 till 700 ◦C. The left picture shows the hydrogenated Hombikat samples,enated Rutile samples.
transformations are temperature, titania synthesis method, andinitial phase composition [38].
The phase transformation of hydrogenated P25 and hydro-genated Hombikat was confirmed by Raman spectroscopy atambient conditions (Fig. 3). P25 showed the three bands associatedwith the presence of the anatase phase at 635, 512, and 395 cm−1,and in addition a small band around 439 cm−1 associated with thepresence of the rutile phase. Upon heating and hydrogenation, thecrystalline phase was stable up to 600 ◦C. However, at 700 ◦C, theanatase phase was disappearing and only the bands of the rutilephase (610 and 439 cm−1) can be observed, consistent with theXRD data. For the hydrogenated Hombikat samples, neither thepositions nor the intensities of the bands were changed, indicatingthat hydrogenated Hombikat samples consist only of the crystallineanatase phase.
The morphological structure of the hydrogenated samples vs.the non-hydrogenated commercial parent titania was investigatedby SEM (Fig. 4). Hombikat seems to show a morphology of low crys-tallinity, which turns after hydrogenation into a dense crystallinephase. However, the P25 sample did not seem to change dramat-ically after hydrogenation (sample HP-600). Neither the degree ofagglomeration nor the crystallization showed significant alteration.Results are consistent with XRD and Raman spectroscopy.
The optical absorption of the hydrogenated samples was investi-gated by UV–Vis spectroscopy. In Fig. 5, the Kubelka–Munk functionof the hydrogenated samples is compared with the parent titaniasamples. The absorption spectra of hydrogenated P25 (left panel)showed slight enhancement in the visible light region, as comparedto the parent P25. Moreover, the HP-700 sample exhibited a sig-nificant shift towards the visible light region, probably because
of the phase transformation from anatase to rutile. Moreover, inthe hydrogenated Hombikat samples, the visible light absorption(� larger than 400 nm) is enhanced as a function of the treat-ment temperature. HH-600 exhibited the biggest shift towards the20
Inte
ns
ity
(a.u
.)
30 440 50
2 theta (o)
60 70
HH
HH
HH
HH
)
H-
HH
0 80
H-700
H-6 00
H-55 0
H-50 0
com
H-4 00
enated Hombikat (right panel) compared to the parent titania.

W.H. Saputera et al. / Catalysis Today 246 (2015) 60–66 63
800
Inte
ns
ity
(a.u
.)
700 60
Ra
00 50 0
aman shift (cm
400 3
m-1)
P
HP-
HP-6
HP-7
00
P25
-50 0
600
700
800
Inte
nsit
y (
a.u
.)
0 70 0 60 0 500
Raman shift
0 40 0
(cm-1)
300
HH-70 0
HH-500
HH-600
Fig. 3. Raman spectra of the hydrogenated P25 (left panel) and of hydrogenated Hombikat (right panel).
Fig. 4. SEM micrographs of the Hombikat sample (upper left) compared to hydrogenated Hombikat HH-600 (upper right). The morphology of P25 (bottom left) is comparedtothe hydrogenated P25 HP-600 sample (bottom right).
350 40 0 45 0 500 55 0 60 0 65 0 70 0
P25
HP-500
HP -600
HP -700
Ku
belk
a-M
un
k (
a.u
.)
wavelength ( nm)
350 40 0 45 0 50 0 55 0 60 0 65 0 70 0
Ku
be
lka-M
un
k (
a.u
.)
wavelength (nm)
H-c om
HH-400
HH-500
HH-600
Fig. 5. UV–Vis diffuse reflectance spectra of the hydrogenated P25 samples compared to the parent samples (left panel), and hydrogenated Hombikat samples compared tothe parent samples (right panel).
64 W.H. Saputera et al. / Catalysis Today 246 (2015) 60–66
0 100 0 200 0 300 0 400 0 500 0
3300 3400 35 00 3600HP-70 0
HP-500
Inte
nsit
y (
a.u
.)
Magn etic field (Gauss)
P-500
F5
vtw
sscpFmhi5
tcspei
3d
3
iratptita5ni
--HR-600HP-600HH-600
HR-550HP-550HH-550
HR-500HP-500HH-500
HR-400HP-400HH-400
R-comP25
H-com
0 1 2 3 4 8 9 10
K x 10 0 (min-1
)
TTc
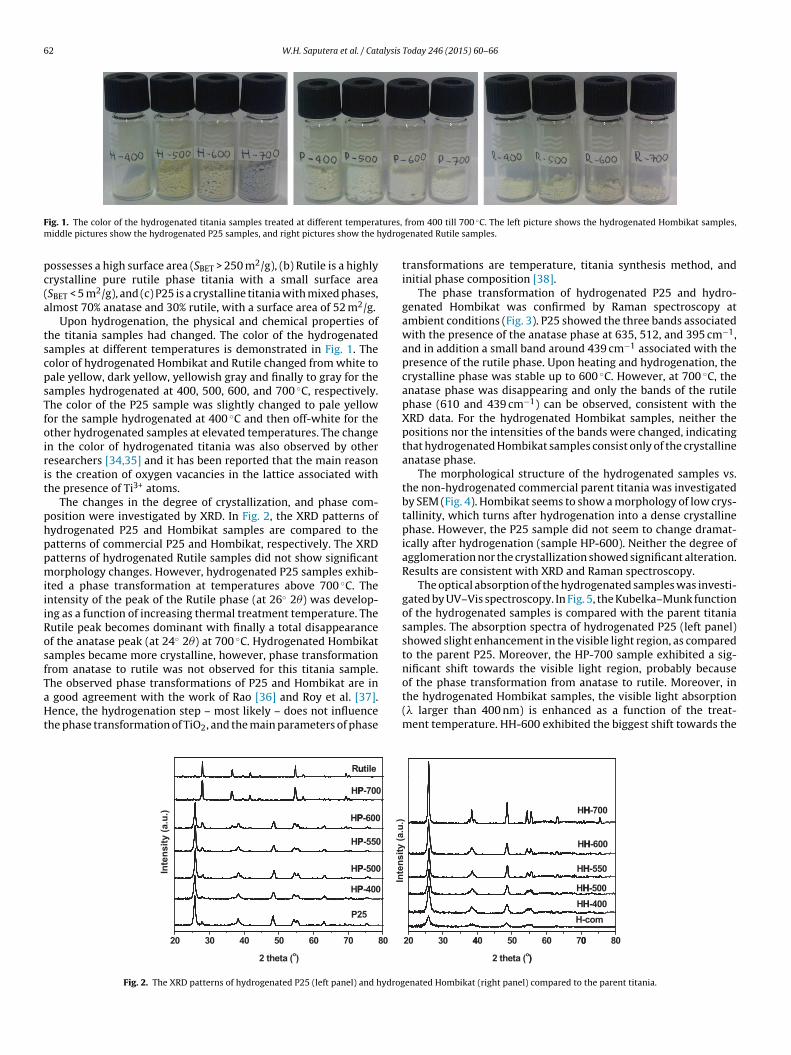
ig. 6. EPR spectrum of the thermally treated P25 at 500 ◦C without hydrogen (P-00), compared to the spectra of hydrogenated P25 samples; HP-500 and HP-700.
isible light region (from � = 400 nm to 700 nm), in agreement withhe increasing Ti3+ concentration in the samples. Similar behavioras reported by Xu et al. [39] and Li et al. [40].
EPR spectra were recorded to identify the presence of inter-titial Ti3+ or formation of oxygen vacancies in the hydrogenatedamples, which are difficult to distinguish. The EPR spectrum ofalcined P25 at 500 ◦C without hydrogen treatment (P-500) is com-ared to two hydrogenated P25 samples at 500 ◦C and at 700 ◦C inig. 6. The spectrum of P-500 did not show the presence of para-agnetic Ti3+ centers at g = 1.974 Gauss [41,42]. The spectra of the
ydrogenated samples show the paramagnetic Ti3+ centers, whichncrease in quantity as a function of increasing temperature from00 to 700 ◦C.
Based on the above indicated characterization results, it is clearhat hydrogenation at high temperature generates oxygen vacan-ies (Vo-Ti3+) in the framework of titania, independent of thetarting phase, i.e. rutile, anatase or a mixture of them, or its textureroperties i.e. surface area and type of porisity. The main prop-rties of the samples used in the current study are summarizedn Table 1.
.2. Photocatalytic performance in methyl orange (MO)ecomposition
.2.1. The performance of hydrogenated samplesThe photocatalytic performance of commercial titania samples,
.e. P25, Hombikat and Rutile was in agreement with previouslyeported data [43,44]. P25 outperformed the other commerciallyvailable titania catalysts, and exhibited the highest decolouriza-ion rate under 375 nm illumination. The explanation of the highererformance of P25 was reported earlier by Gray et al. [45], in whichhe co-existence of the two phases, Rutile and Anatase, plays anmportant role (antenna theory). Hydrogenating the commercialitania samples was found to dramatically enhance their photocat-
lytic performance. The performance of hydrogenated Rutile was–7 times higher than of the parent Rutile. Furthermore, there iso apparent optimum temperature for the hydrogenation process,.e. the sample hydrogenated at 400 ◦C exhibited almost the same
able 1he different preparation methods which were used to prepare the different Ti3+-containharacterization data.
Sample Synthesis method
Blue TiO2 In situ hydrothermal reduction by NO and CO
M-600 Hydrothermal treatment of TiO2/Ti2O3 mixture
HH-400–HH-600 Hydrogenation of commercial Hombikat at T = 400–600 ◦C
HP-400–HP-600 Hydrogenation of commercial P25 at T = 400–600 ◦C
HR-400–HR-600 Hydrogenation of commercial Rutile at T = 400–600 ◦C
Fig. 7. The first order constant (K) of the MO decolourization by using the differenthydrogenated samples under the illumination of black light.
performance as the sample hydrogenated at 600 ◦C. On the con-trary, the performance of hydrogenated Hombikat was increasingas a function of the hydrogenation temperature: HH-600 exhibited3 times higher activity than Hombikat. The performance of P25 wasalso greatly influenced by hydrogenation process. The performanceof hydrogenated P25 was increasing gradually to reach a maximumfor the sample hydrogenated at 500 ◦C, i.e. HP-500, and then theactivity decreased again. The photocatalytic performance of the HP-500 sample was 5 times higher than of the parent P25, and showsthe highest activity of all the samples applied in the study. Theactivity decrease for the samples hydrogenated at T > 500 is mostlikely caused by the extensive phase transformation from Anataseto Rutile. The 1st order rate constants of the hydrogenated samplesare presented in Fig. 7.
The hydrogenation of titania at elevated temperatures wasreported to improve the photocatalytic performance of titaniathrough creation of new energy levels (Ti3+) in the band gap oftitania, associated with oxygen vacancies [28]. It is important tonote that the catalysts in the present study were photo-excited by375 nm radiation, and that these vacancies are likely not neces-sary to create the photo-excited state. On the contrary, usually bulkdefects (oxygen vacancies) act as recombination centers of elec-trons and holes, reducing photocatalytic activity. However, we havepreviously discussed that reduction might predominantly result incatalytically active surface vacancies, which are responsible for ahigh oxygen reduction activity. In other words, the catalytic prop-erties of the surface defects are more relevant than the modifiedoptical properties of the obtained TiO2. The major role of the sur-face is also in agreement with the rapid deactivation of the catalysts,to be further discussed in Section 3.2.5, likely caused by oxida-
tion of the defects during the photocatalytic process. Oxidation ofbulk vacancies under the mild conditions of photocatalysis appearsmuch more difficult and less likely.ing titania samples, and the properties of the prepared samples as obtained from
Phase Morphology Surface area SBET (m2/g)
Anatase + Rutile Amorphous mesoporous 96Anatase + Rutile Crystalline microporous 54Anatase Crystalline microporous 156–45Anatase + Rutile Crystalline microporous 52–22Rutile Crystalline microporous n.a.

W.H. Saputera et al. / Catalysis Today 246 (2015) 60–66 65
0.0
0.5
1.0
1.5
2.0
2.5
3.0
3.5
Catalysts
HH
-60
0
Blu
e T
iO2
M-6
00
HR
-60
0
HP
-60
0
R-6
00
H-6
00
K x
10
0 m
in-1
P-6
00
Fra
3
hvtaphmp(
3
diat
tPmdgutatIlop
Fp
0 20 40 60 80 100 120
0
10
20
30
40
50
H-com HH -60 0 H-Pt-H-60 02
3
4
Min
era
lis
ati
on
ra
te (
mm
ol/
min
)
Catalysts
CO
2 d
ete
cte
d (
mm
ol)
Time (min.)
H-com
HH-60 0
H-Pt-H-60 0
ig. 8. A comparison between the first order rate constant of the MO decolourizationeaction by using the thermally treated titania samples, the hydrogenated samples,nd other Ti3+-containing titania samples.
.2.2. Comparison between the different synthesis techniquesIn order to confirm that the higher activity obtained for the
ydrogenated samples is due to the presence of surface oxygenacancies, the synthesis process reported in the experimental sec-ion was repeated with the same three commercial samples in thebsence of H2 gas. The comparison of oxidized and reduced sam-les presented in Fig. 8 shows that hydrogenated Hombikat andydrogenated P25 are more active than the oxidized samples, andoreover more active than the Ti3+-containing titania samples pre-
ared by other techniques, i.e. the blue titania and the compositeM-600).
.2.3. Effect of Pt additionIn our previous study [27], when Pt nanoparticles were photo-
eposited on the TiO2/Ti2O3 composite, a significant enhancementn the photocatalytic activity was observed. The activity of reducednd oxidized Hombikat in the absence and presence of Pt nanopar-icles is presented in Fig. 9.
The kinetic data show a great activity difference resulting fromhe order in which Pt was added to reduced Hombikat. The H-t-H-600 sample (reduction after Pt deposition) was 3–4 timesore active than the HH-600-Pt sample (reduction prior to Pt
eposition). To explain this difference, we assume that the oxy-en vacancies introduced by the hydrogen treatment are restoredpon the Pt photodeposition treatment in aqueous conditions. Con-rary, in the sample H-Pt-H-600, in which hydrogenation is appliedfter Pt deposition, the amount of Ti3+ present after catalyst syn-hesis is higher, consistent with the higher photocatalytic activity.
n addition, Pt is known to be a good hydrogen activation cata-yst, which might further contribute to the large concentration ofxygen vacancies obtained after the reduction at elevated tem-eratures. The recovery of oxygen vacancies upon illumination in0
2
4
6
8
10
12
H-P
t-H
-600
HH
-600
-Pt
HH
-600
K x
100 (
min
-1)
Cataysts
H-c
om
ig. 9. The effect of different modification synthesis tactics of Hombikat TiO2 on thehotocatalytic performance in the MO decolourization reaction.
Fig. 10. The amount of CO2 generated during the total mineralization of MO by usingH-com, HH-600 and H-Pt-H-600 samples. Inset: a comparison between the rates ofMO mineralization over the above mentioned catalysts.
aqueous conditions was proposed first by Anpo et al. [46,47], andconfirmed later by studies in our group [32].
3.2.4. Complete mineralization vs. decolorizationTo ensure that the catalytic behavior of the hydrogenated sam-
ples follows the same activity trend in the total mineralizationas well as in the decolourization of MO, the CO2 concentrationwas measured by the conductivity method [48,49]. Three catalystswere chosen for this experiment: H-Com, HH-600, and H-Pt-H-600. The amount of CO2 produced and the rate of mineralizationare presented in Fig. 10. It is clear that the photocatalytic activityof commercial Hombikat (H-com) is improved by hydrogenation(HH-600), and improved further by Pt addition (H-Pt-H-600), whichconfirms the photocatalytic trend as derived from the decolouriza-tion experiments.
3.2.5. Stability of the Ti3+-containing samplesObviously, the stability of Ti3+-containing titania is a mat-
ter of concern. The photoactivity of the samples was decreasingsharply after the first run (Fig. 11), with the exception of the Pt-M-600 sample, where deactivation was less pronounced. In general,the oxidation of surface oxygen vacancies is the main reason ofTi3+-containing titania samples to deactivate [46,47]. It should bementioned that since we operate in batch conditions, the deacti-
vation might (negatively) affect the calculated rate constants, andcontributes to the apparent first order behavior. More detailedstudies in a continuous reactor are needed to quantify the rate of1st 2nd 3rd -- 1st 2nd 3rd -- 1st 2nd 3rd
0
2
4
6
8
10
12
withou t Pt
with Pt
Self-dop edCompos ite
K x
100 (
min
-1)
Run s
Hydrogena ted
Fig. 11. The stability of the different Ti3+-containing titania samples with and with-out Pt co-catalyst.
66 W.H. Saputera et al. / Catalysis Today 246 (2015) 60–66
Table 2A comparison between the materials used in this study in terms of synthesis procedures and photocatalytic performance.
Technique Reacted phases Safety Photocatalytic performance inMO decolourization
Stability
Self-doping Flammable liquids burn at500 ◦C in air flow
Maximum caution shouldbe considered, NO and COgases are produced duringcombustion of flammableorganics
Poor Deactivated after first run
TiO2/Ti2O3 composite Solid state reaction at600 ◦C under staticconditions
– Better than self-doping sampleand hydrogenated Rutile, lessthan hydrogenated P25 andHombikat
The platinized samplemaintains activity up to thesecond run
be tagas
da
n
faawipH
4
RHgdepTaTo
A
(fai
R
[[[[
[[[
[
[[
[[[[
[[
[[[[
[[[[[
[[[[[
[[[[[[
[
Hydrogenation Solid sample heated atT = 400–700 in H2 gas flow
Caution shouldwith use of H2
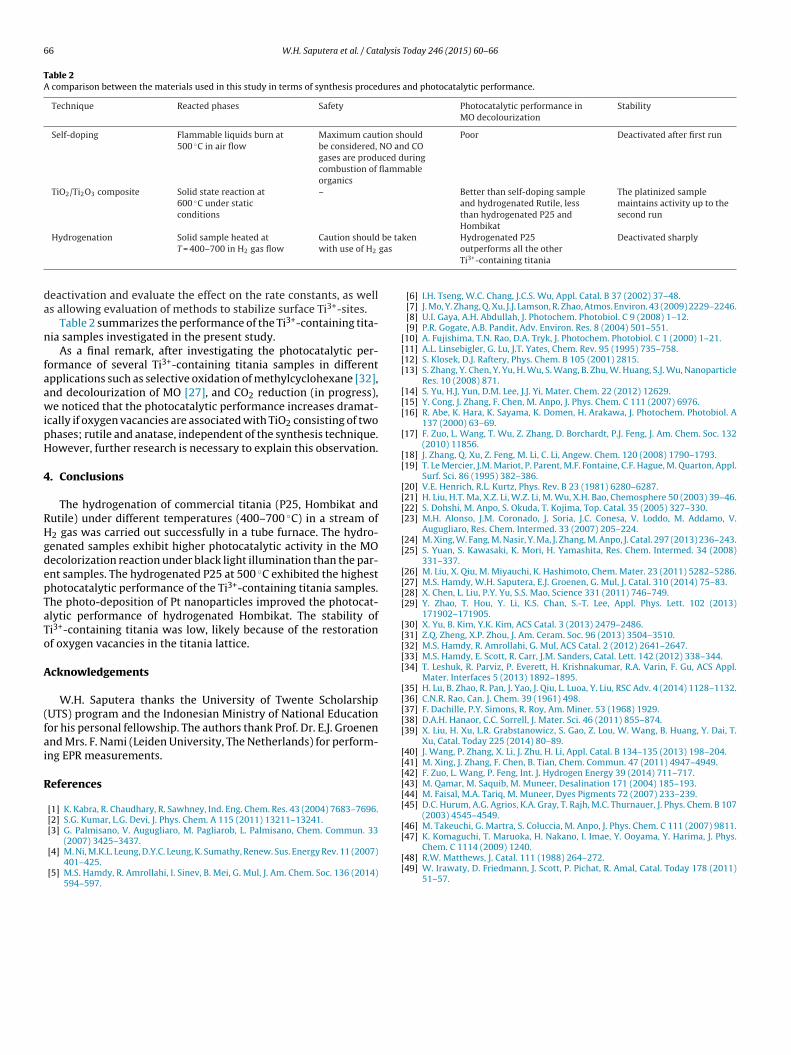
eactivation and evaluate the effect on the rate constants, as wells allowing evaluation of methods to stabilize surface Ti3+-sites.
Table 2 summarizes the performance of the Ti3+-containing tita-ia samples investigated in the present study.
As a final remark, after investigating the photocatalytic per-ormance of several Ti3+-containing titania samples in differentpplications such as selective oxidation of methylcyclohexane [32],nd decolourization of MO [27], and CO2 reduction (in progress),e noticed that the photocatalytic performance increases dramat-
cally if oxygen vacancies are associated with TiO2 consisting of twohases; rutile and anatase, independent of the synthesis technique.owever, further research is necessary to explain this observation.
. Conclusions
The hydrogenation of commercial titania (P25, Hombikat andutile) under different temperatures (400–700 ◦C) in a stream of2 gas was carried out successfully in a tube furnace. The hydro-enated samples exhibit higher photocatalytic activity in the MOecolorization reaction under black light illumination than the par-nt samples. The hydrogenated P25 at 500 ◦C exhibited the highesthotocatalytic performance of the Ti3+-containing titania samples.he photo-deposition of Pt nanoparticles improved the photocat-lytic performance of hydrogenated Hombikat. The stability ofi3+-containing titania was low, likely because of the restorationf oxygen vacancies in the titania lattice.
cknowledgements
W.H. Saputera thanks the University of Twente ScholarshipUTS) program and the Indonesian Ministry of National Educationor his personal fellowship. The authors thank Prof. Dr. E.J. Groenennd Mrs. F. Nami (Leiden University, The Netherlands) for perform-ng EPR measurements.
eferences
[1] K. Kabra, R. Chaudhary, R. Sawhney, Ind. Eng. Chem. Res. 43 (2004) 7683–7696.[2] S.G. Kumar, L.G. Devi, J. Phys. Chem. A 115 (2011) 13211–13241.[3] G. Palmisano, V. Augugliaro, M. Pagliarob, L. Palmisano, Chem. Commun. 33
(2007) 3425–3437.[4] M. Ni, M.K.L. Leung, D.Y.C. Leung, K. Sumathy, Renew. Sus. Energy Rev. 11 (2007)
401–425.[5] M.S. Hamdy, R. Amrollahi, I. Sinev, B. Mei, G. Mul, J. Am. Chem. Soc. 136 (2014)
594–597.
[
[[
ken Hydrogenated P25outperforms all the otherTi3+-containing titania
Deactivated sharply
[6] I.H. Tseng, W.C. Chang, J.C.S. Wu, Appl. Catal. B 37 (2002) 37–48.[7] J. Mo, Y. Zhang, Q. Xu, J.J. Lamson, R. Zhao, Atmos. Environ. 43 (2009) 2229–2246.[8] U.I. Gaya, A.H. Abdullah, J. Photochem. Photobiol. C 9 (2008) 1–12.[9] P.R. Gogate, A.B. Pandit, Adv. Environ. Res. 8 (2004) 501–551.10] A. Fujishima, T.N. Rao, D.A. Tryk, J. Photochem. Photobiol. C 1 (2000) 1–21.11] A.L. Linsebigler, G. Lu, J.T. Yates, Chem. Rev. 95 (1995) 735–758.12] S. Klosek, D.J. Raftery, Phys. Chem. B 105 (2001) 2815.13] S. Zhang, Y. Chen, Y. Yu, H. Wu, S. Wang, B. Zhu, W. Huang, S.J. Wu, Nanoparticle
Res. 10 (2008) 871.14] S. Yu, H.J. Yun, D.M. Lee, J.J. Yi, Mater. Chem. 22 (2012) 12629.15] Y. Cong, J. Zhang, F. Chen, M. Anpo, J. Phys. Chem. C 111 (2007) 6976.16] R. Abe, K. Hara, K. Sayama, K. Domen, H. Arakawa, J. Photochem. Photobiol. A
137 (2000) 63–69.17] F. Zuo, L. Wang, T. Wu, Z. Zhang, D. Borchardt, P.J. Feng, J. Am. Chem. Soc. 132
(2010) 11856.18] J. Zhang, Q. Xu, Z. Feng, M. Li, C. Li, Angew. Chem. 120 (2008) 1790–1793.19] T. Le Mercier, J.M. Mariot, P. Parent, M.F. Fontaine, C.F. Hague, M. Quarton, Appl.
Surf. Sci. 86 (1995) 382–386.20] V.E. Henrich, R.L. Kurtz, Phys. Rev. B 23 (1981) 6280–6287.21] H. Liu, H.T. Ma, X.Z. Li, W.Z. Li, M. Wu, X.H. Bao, Chemosphere 50 (2003) 39–46.22] S. Dohshi, M. Anpo, S. Okuda, T. Kojima, Top. Catal. 35 (2005) 327–330.23] M.H. Alonso, J.M. Coronado, J. Soria, J.C. Conesa, V. Loddo, M. Addamo, V.
Augugliaro, Res. Chem. Intermed. 33 (2007) 205–224.24] M. Xing, W. Fang, M. Nasir, Y. Ma, J. Zhang, M. Anpo, J. Catal. 297 (2013) 236–243.25] S. Yuan, S. Kawasaki, K. Mori, H. Yamashita, Res. Chem. Intermed. 34 (2008)
331–337.26] M. Liu, X. Qiu, M. Miyauchi, K. Hashimoto, Chem. Mater. 23 (2011) 5282–5286.27] M.S. Hamdy, W.H. Saputera, E.J. Groenen, G. Mul, J. Catal. 310 (2014) 75–83.28] X. Chen, L. Liu, P.Y. Yu, S.S. Mao, Science 331 (2011) 746–749.29] Y. Zhao, T. Hou, Y. Li, K.S. Chan, S.-T. Lee, Appl. Phys. Lett. 102 (2013)
171902–171905.30] X. Yu, B. Kim, Y.K. Kim, ACS Catal. 3 (2013) 2479–2486.31] Z.Q. Zheng, X.P. Zhou, J. Am. Ceram. Soc. 96 (2013) 3504–3510.32] M.S. Hamdy, R. Amrollahi, G. Mul, ACS Catal. 2 (2012) 2641–2647.33] M.S. Hamdy, E. Scott, R. Carr, J.M. Sanders, Catal. Lett. 142 (2012) 338–344.34] T. Leshuk, R. Parviz, P. Everett, H. Krishnakumar, R.A. Varin, F. Gu, ACS Appl.
Mater. Interfaces 5 (2013) 1892–1895.35] H. Lu, B. Zhao, R. Pan, J. Yao, J. Qiu, L. Luoa, Y. Liu, RSC Adv. 4 (2014) 1128–1132.36] C.N.R. Rao, Can. J. Chem. 39 (1961) 498.37] F. Dachille, P.Y. Simons, R. Roy, Am. Miner. 53 (1968) 1929.38] D.A.H. Hanaor, C.C. Sorrell, J. Mater. Sci. 46 (2011) 855–874.39] X. Liu, H. Xu, L.R. Grabstanowicz, S. Gao, Z. Lou, W. Wang, B. Huang, Y. Dai, T.
Xu, Catal. Today 225 (2014) 80–89.40] J. Wang, P. Zhang, X. Li, J. Zhu, H. Li, Appl. Catal. B 134–135 (2013) 198–204.41] M. Xing, J. Zhang, F. Chen, B. Tian, Chem. Commun. 47 (2011) 4947–4949.42] F. Zuo, L. Wang, P. Feng, Int. J. Hydrogen Energy 39 (2014) 711–717.43] M. Qamar, M. Saquib, M. Muneer, Desalination 171 (2004) 185–193.44] M. Faisal, M.A. Tariq, M. Muneer, Dyes Pigments 72 (2007) 233–239.45] D.C. Hurum, A.G. Agrios, K.A. Gray, T. Rajh, M.C. Thurnauer, J. Phys. Chem. B 107
(2003) 4545–4549.46] M. Takeuchi, G. Martra, S. Coluccia, M. Anpo, J. Phys. Chem. C 111 (2007) 9811.
47] K. Komaguchi, T. Maruoka, H. Nakano, I. Imae, Y. Ooyama, Y. Harima, J. Phys.Chem. C 1114 (2009) 1240.48] R.W. Matthews, J. Catal. 111 (1988) 264–272.49] W. Irawaty, D. Friedmann, J. Scott, P. Pichat, R. Amal, Catal. Today 178 (2011)
51–57.