Synthesis and photocatalytic activity of TiO2 Nanoparticles
47
OMICS Group Contact us at: [email protected] OMICS Group International through its Open Access Initiative is committed to make genuine and reliable contributions to the scientific community. OMICS Group hosts over 400 leading-edge peer reviewed Open Access Journals and organizes over 300 International Conferences annually all over the world. OMICS Publishing Group journals have over 3 million readers and the fame and success of the same can be attributed to the strong editorial board which contains over 30000 eminent personalities that ensure a rapid, quality and quick review process. OMICS Group signed an agreement with more than 1000 International Societies to make healthcare information Open Access.
Transcript of Synthesis and photocatalytic activity of TiO2 Nanoparticles

OMICS Group
Contact us at: [email protected]
OMICS Group International through its Open Access Initiative is committed to make
genuine and reliable contributions to the scientific community. OMICS Group hosts
over 400 leading-edge peer reviewed Open Access Journals and organizes over 300
International Conferences annually all over the world. OMICS Publishing Group
journals have over 3 million readers and the fame and success of the same can be
attributed to the strong editorial board which contains over 30000 eminent
personalities that ensure a rapid, quality and quick review process. OMICS Group
signed an agreement with more than 1000 International Societies to make healthcare
information Open Access.

OMICS Group welcomes submissions that are original and
technically so as to serve both the developing world and
developed countries in the best possible way.
OMICS Journals are poised in excellence by publishing high
quality research. OMICS Group follows an Editorial
Manager® System peer review process and boasts of a strong
and active editorial board.
Editors and reviewers are experts in their field and provide
anonymous, unbiased and detailed reviews of all submissions.
The journal gives the options of multiple language translations
for all the articles and all archived articles are available in
HTML, XML, PDF and audio formats. Also, all the published
articles are archived in repositories and indexing services like
DOAJ, CAS, Google Scholar, Scientific Commons, Index
Copernicus, EBSCO, HINARI and GALE.
For more details please visit our website: http://omicsonline.org/Submitmanuscript.php
OMICS Journals are welcoming Submissions
Synthesis and Applications of Nanoparticles of
Titanium Dioxide and Zinc Oxide
Majeed A. Shaheed and Falah H. Hussein Chemistry Department, Faculty of Science, Babylon University, Hilla, Iraq
Correspondence should be addressed to Falah H. Hussein; [email protected]

SPM XRD
Photocatalytic activity
ZnO Nanoparticles
TiO2 Nanoparticles
Combining effect
Adsorption
Characterizations
The work summary
1
Synthesis Applications
Work
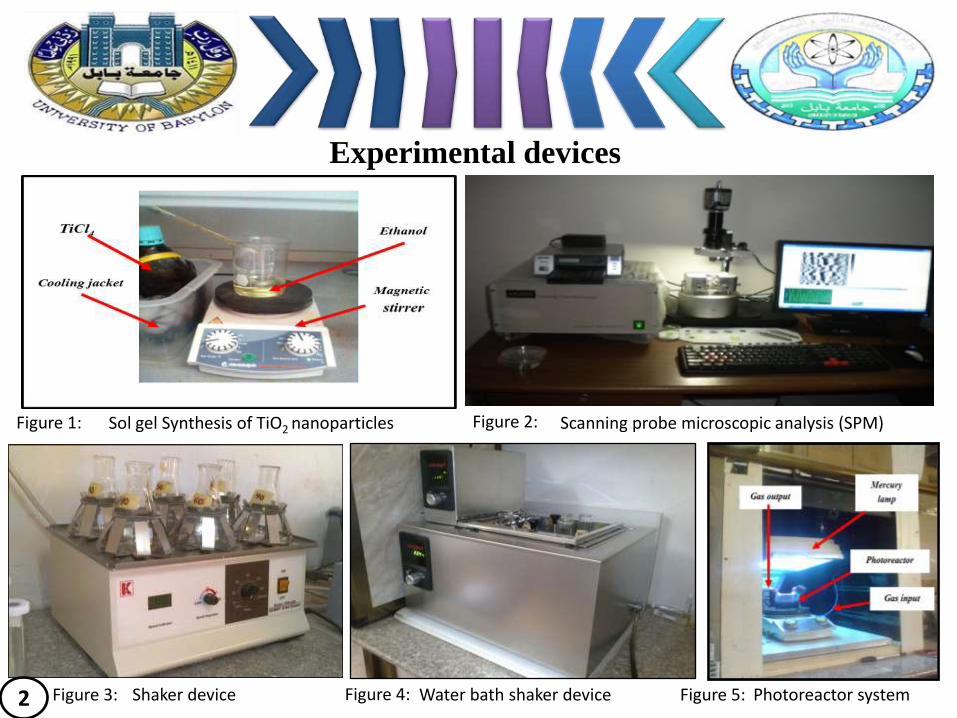
Experimental devices
Sol gel Synthesis of TiO2 nanoparticles Scanning probe microscopic analysis (SPM)
Shaker device Water bath shaker device Photoreactor system
Figure 1: Figure 2:
Figure 3: Figure 4: Figure 5: 2

First: Synthesis

Synthesis of TiO2 nanostructures by sol-gel method
3
Figure 6: Detailed schematic representation for experimental procedure.
Figure 7: Schematic diagram for experimental procedure.
3:10

Other route to Synthesis of TiO2 nanoparticles by sol gel.
4
Figure 8: Schematic diagram of experimental procedure for preparation of TiO2-NPs.

Synthesis of ZnO nanoparticles in the first route
5
Figure 9: Schematic diagram of experimental procedure for preparation of ZnO-NPs by using the first direct precipitation method.
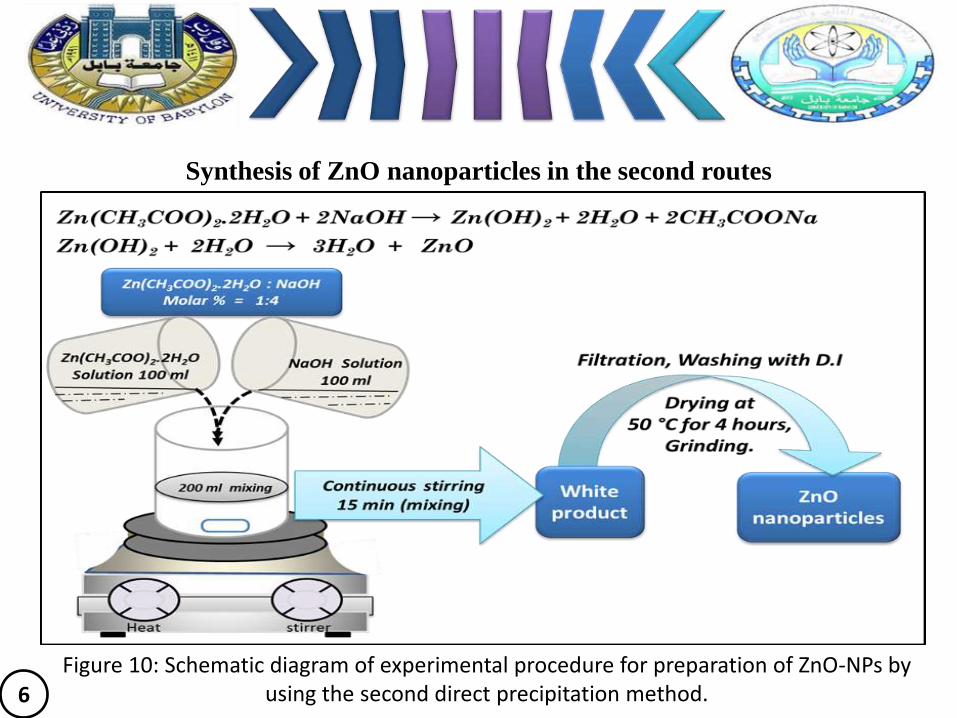
Synthesis of ZnO nanoparticles in the second routes
6 Figure 10: Schematic diagram of experimental procedure for preparation of ZnO-NPs by
using the second direct precipitation method.

Second : Characterizations
1-XRD
2-SPM
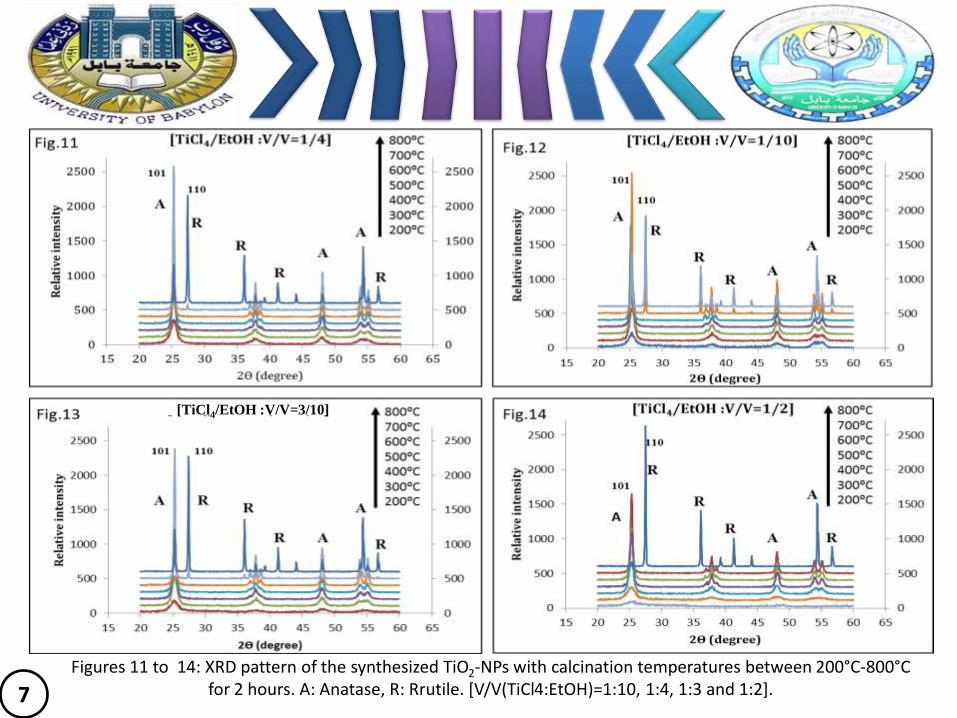
7 Figures 11 to 14: XRD pattern of the synthesized TiO2-NPs with calcination temperatures between 200°C-800°C
for 2 hours. A: Anatase, R: Rrutile. [V/V(TiCl4:EtOH)=1:10, 1:4, 1:3 and 1:2].
[TiCl4/EtOH :V/V=3/10]

8
0
50
100
150
200
250
300
350
0
50
100
150
200
250
300
350
10 15 20 25 30 35 40 45 50 55 60
Re
lati
ve in
ten
sity
2ϴ
Characterization of commercially and synthesized TiO2
TiO2 synthesized(TiCl4+Isopropanol)
TiO2 Hombikat
TiO2 synthesized(TiCl4+ETOH)
A
Figure 15: XRD patterns for the optimum TiO2-NPs produced from both sol gel method with reference TiO2 (Hombikat UV100).
Figure 16: The comparison of XRD patterns of the ZnO-NPs resulted by the precipitation method in two different routes with the reference ZnO (Merck).
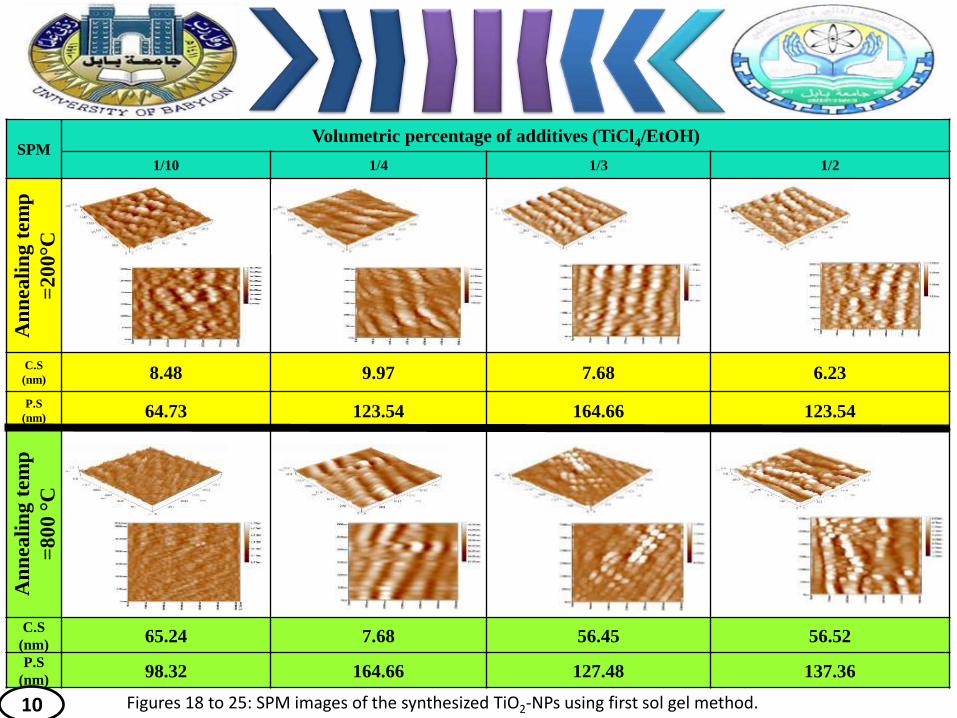
SPM Volumetric percentage of additives (TiCl4/EtOH)
1/10 1/4 1/3 1/2
An
nea
lin
g t
emp
=2
00°C
C.S
(nm) 8.48 9.97 7.68 6.23
P.S
(nm) 64.73 123.54 164.66 123.54
An
nea
lin
g t
emp
=8
00
°C
C.S
(nm) 65.24 7.68 56.45 56.52
P.S
(nm) 98.32 164.66 127.48 137.36
10 Figures 18 to 25: SPM images of the synthesized TiO2-NPs using first sol gel method.
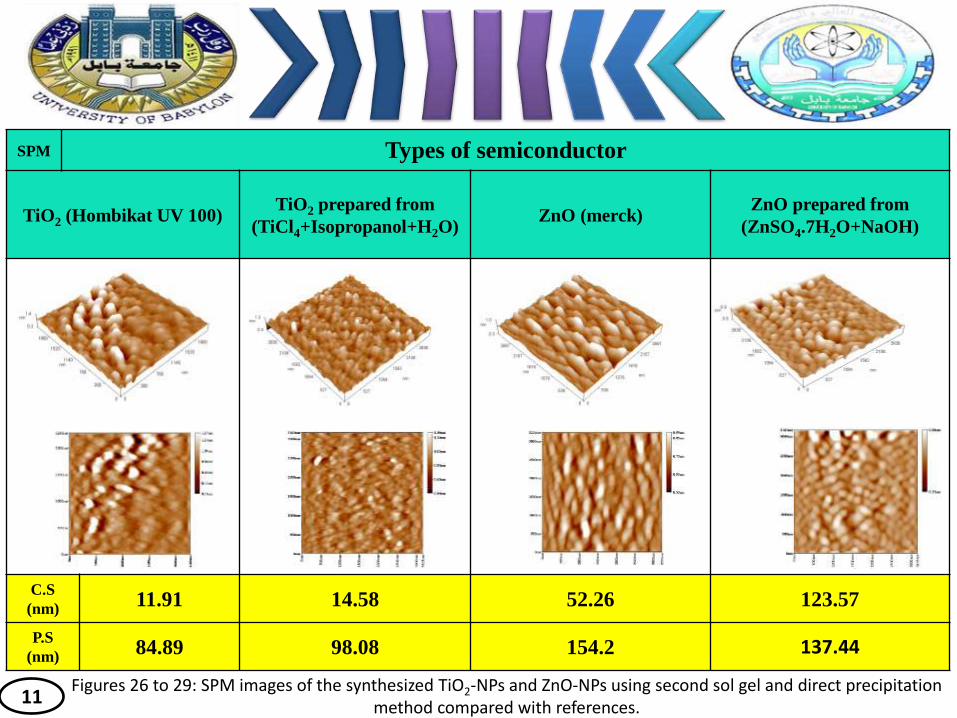
SPM Types of semiconductor
TiO2 (Hombikat UV 100) TiO2 prepared from
(TiCl4+Isopropanol+H2O) ZnO (merck)
ZnO prepared from
(ZnSO4.7H2O+NaOH)
C.S
(nm) 11.91 14.58 52.26 123.57
P.S
(nm) 84.89 98.08 154.2 137.44
Figures 26 to 29: SPM images of the synthesized TiO2-NPs and ZnO-NPs using second sol gel and direct precipitation method compared with references.
11
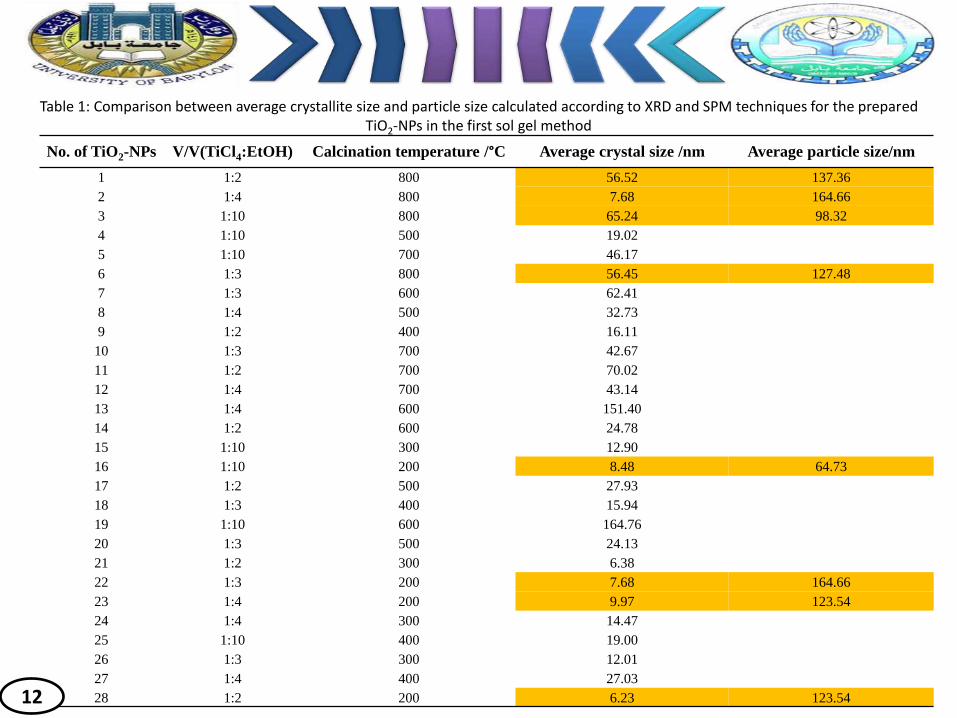
Table 1: Comparison between average crystallite size and particle size calculated according to XRD and SPM techniques for the prepared TiO2-NPs in the first sol gel method
No. of TiO2-NPs V/V(TiCl4:EtOH) Calcination temperature /°C Average crystal size /nm Average particle size/nm
1 1:2 800 56.52 137.36
2 1:4 800 7.68 164.66
3 1:10 800 65.24 98.32
4 1:10 500 19.02
5 1:10 700 46.17
6 1:3 800 56.45 127.48
7 1:3 600 62.41
8 1:4 500 32.73
9 1:2 400 16.11
10 1:3 700 42.67
11 1:2 700 70.02
12 1:4 700 43.14
13 1:4 600 151.40
14 1:2 600 24.78
15 1:10 300 12.90
16 1:10 200 8.48 64.73
17 1:2 500 27.93
18 1:3 400 15.94
19 1:10 600 164.76
20 1:3 500 24.13
21 1:2 300 6.38
22 1:3 200 7.68 164.66
23 1:4 200 9.97 123.54
24 1:4 300 14.47
25 1:10 400 19.00
26 1:3 300 12.01
27 1:4 400 27.03
28 1:2 200 6.23 123.54 12

Third : Applications
1-Adsorption
2-Photocatalytic Activity
3-Combining Effect

1-Adsorption

Calibration curve of dye in different absorption positions
14

0
10
20
30
40
50
60
70
80
90
100
0 10 20 30 40 50 60
Re
mo
val %
Adsorption time /min
Removal%(0.35g)
Removal%(0.30g)
Removal%(0.25g)
Removal%(0.20g)
Removal%(0.15g)
Removal%(0.1g)
Figure 38: Effect of dose on removal percentage of RB 5.
0
5
10
15
20
25
30
0 1 2 3 4 5 6 7 8 9
Qe
(m
g g-1
)
pH
Figure 39: Effect of pH on adsorption of RB 5 solution.
0
5
10
15
20
25
30
275 280 285 290 295 300 305
Qe
/ m
g g-1
Temperature /K
Figure 40: Effect of temperature on adsorption of RB 5 solution. 16

Figure 41: Adsorption isotherm of RB 5 dye in presence of TiO2-NPs.
0
1
2
3
4
5
6
0 5 10 15 20 25 30 35
Qe
/m
g g
-1
Ce /ppm
y = 0.0267x + 0.0226 R² = 0.9724
0
0.02
0.04
0.06
0.08
0.1
0.12
0.14
0.16
0.18
0 1 2 3 4 5 6
Ce/
qe
(g
L-1
)
Ce (mg L-1)
Langmuir isotherm
y = 1.2486x + 1.4893 R² = 0.9578
0
0.5
1
1.5
2
2.5
3
-0.75 -0.5 -0.25 0 0.25 0.5 0.75 1
log
qe
log Ce
Freundlich isotherm
Figure 42: Langmuir isotherm. Figure 43: Freundlich isotherm. 17
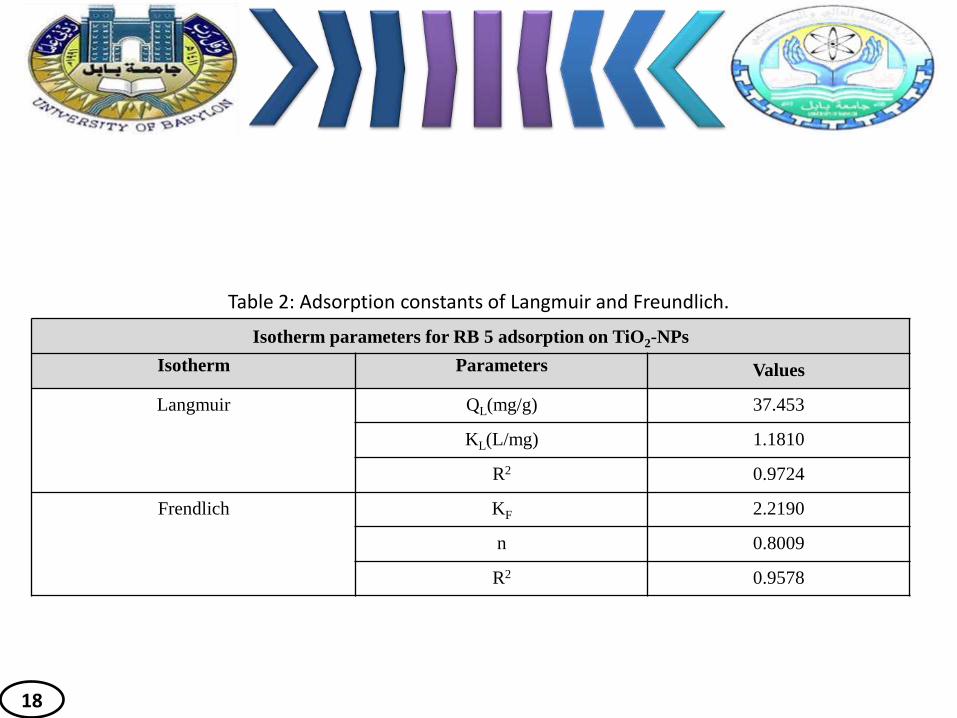
Isotherm parameters for RB 5 adsorption on TiO2-NPs
Values Parameters Isotherm
37.453 QL(mg/g) Langmuir
1.1810 KL(L/mg)
0.9724 R2
2.2190 KF Frendlich
0.8009 n
0.9578 R2
Table 2: Adsorption constants of Langmuir and Freundlich.
18
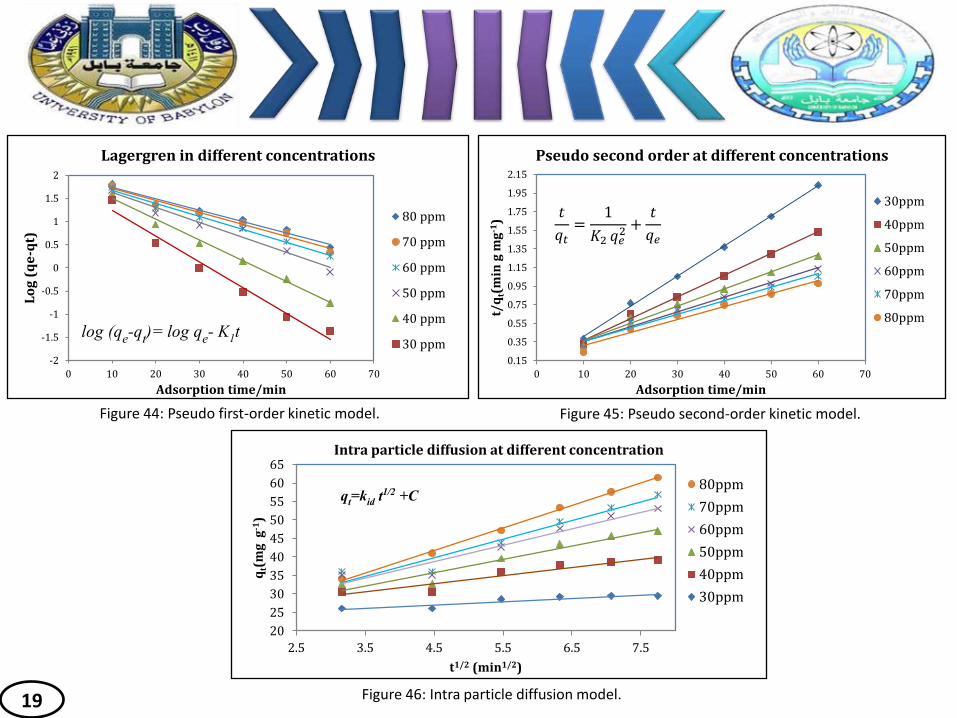
-2
-1.5
-1
-0.5
0
0.5
1
1.5
2
0 10 20 30 40 50 60 70
Lo
g (
qe
-qt)
Adsorption time/min
Lagergren in different concentrations
80 ppm
70 ppm
60 ppm
50 ppm
40 ppm
30 ppmlog (qe-qt)= log qe- K1t
0.15
0.35
0.55
0.75
0.95
1.15
1.35
1.55
1.75
1.95
2.15
0 10 20 30 40 50 60 70
t/q
t(m
in g
mg
-1)
Adsorption time/min
Pseudo second order at different concentrations
30ppm
40ppm
50ppm
60ppm
70ppm
80ppm
𝑡
𝑞𝑡=
1
𝐾2 𝑞𝑒2 +
𝑡
𝑞𝑒
20
25
30
35
40
45
50
55
60
65
2.5 3.5 4.5 5.5 6.5 7.5
qt(
mg
g-1
)
t1/2 (min1/2)
Intra particle diffusion at different concentration
80ppm
70ppm
60ppm
50ppm
40ppm
30ppm
qt=kid t1/2 +C
Figure 44: Pseudo first-order kinetic model. Figure 45: Pseudo second-order kinetic model.
Figure 46: Intra particle diffusion model. 19

20
Table 3: Adsorption parameters for RB 5 adsorption on TiO2-NPs.
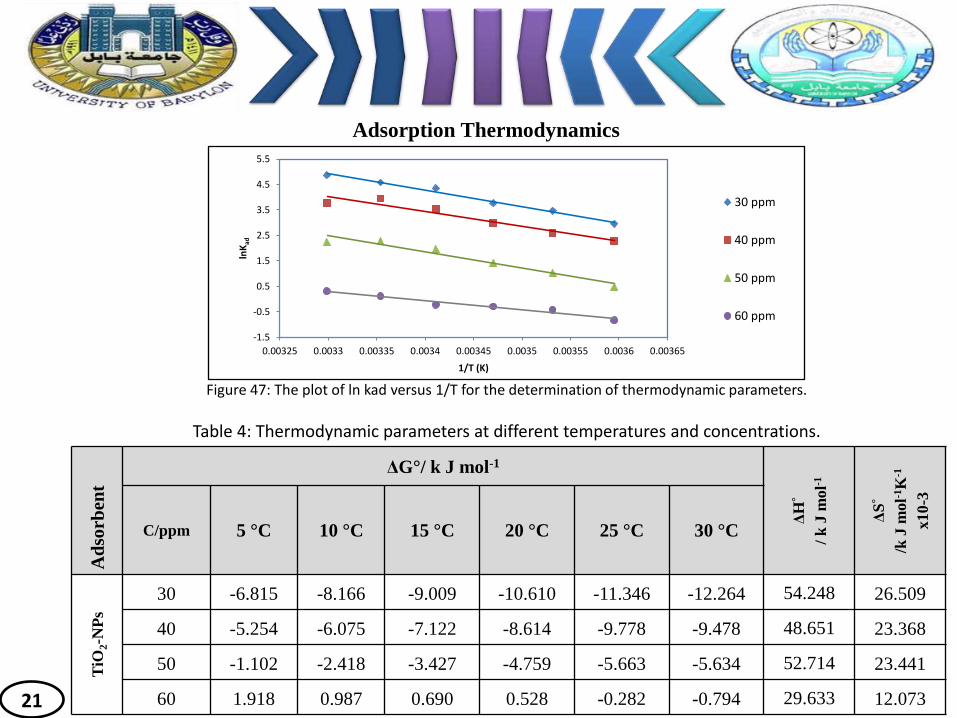
-1.5
-0.5
0.5
1.5
2.5
3.5
4.5
5.5
0.00325 0.0033 0.00335 0.0034 0.00345 0.0035 0.00355 0.0036 0.00365
lnK
ad
1/T (K)
30 ppm
40 ppm
50 ppm
60 ppm
21
Figure 47: The plot of ln kad versus 1/T for the determination of thermodynamic parameters.
Ad
sorb
ent
ΔG°/ k J mol-1
ΔH
°
/ k
J m
ol-1
ΔS
°
/k J
mol-1
K-1
x10
-3
C/ppm 5 °C 10 °C 15 °C 20 °C 25 °C 30 °C
TiO
2-N
Ps
30 -6.815 -8.166 -9.009 -10.610 -11.346 -12.264 54.248 26.509
40 -5.254 -6.075 -7.122 -8.614 -9.778 -9.478 48.651 23.368
50 -1.102 -2.418 -3.427 -4.759 -5.663 -5.634 52.714 23.441
60 1.918 0.987 0.690 0.528 -0.282 -0.794 29.633 12.073
Table 4: Thermodynamic parameters at different temperatures and concentrations.
Adsorption Thermodynamics

2-Photocatalytic Activity

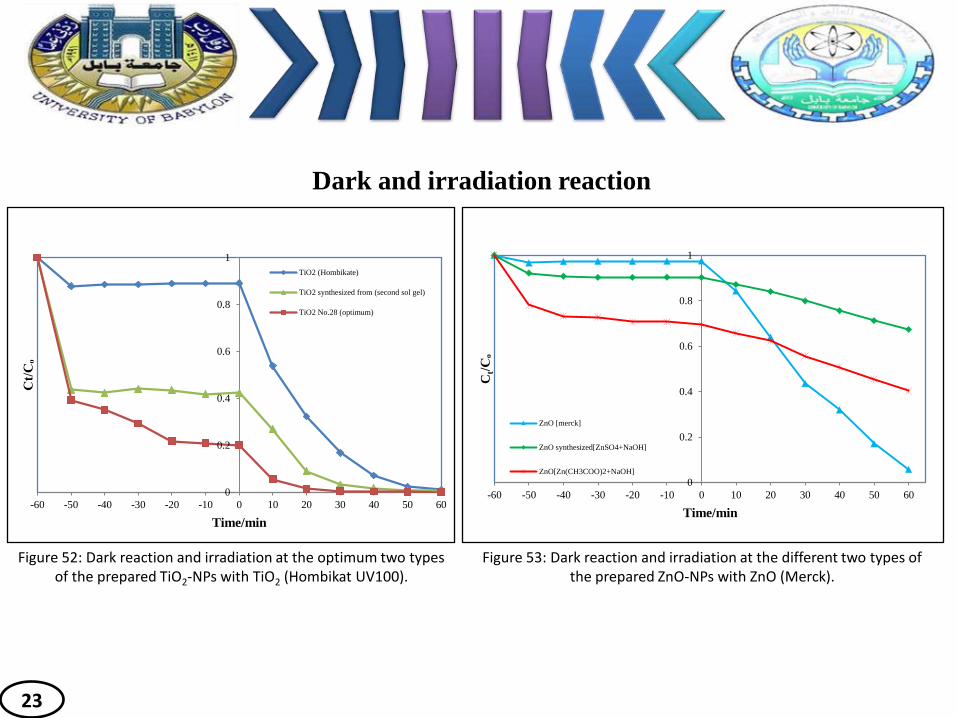
Dark and irradiation reaction
Figures 48 to 51: Dark reaction and irradiation at different types of the prepared TiO2-NPs. [V/V(TiCl4:EtOH)=1:10, 1:4, 1:3 and 1:2]. 22
[V/V: TiCl4/EtOH ]=3/10 [V/V: TiCl
4/EtOH ]=3/10
0
0.2
0.4
0.6
0.8
1
-60 -50 -40 -30 -20 -10 0 10 20 30 40 50 60
Ct/Cₒ
Time/min
TiO2 (Hombikate)
TiO2 synthesized from (second sol gel)
TiO2 No.28 (optimum)
Figure 52: Dark reaction and irradiation at the optimum two types of the prepared TiO2-NPs with TiO2 (Hombikat UV100).
0
0.2
0.4
0.6
0.8
1
-60 -50 -40 -30 -20 -10 0 10 20 30 40 50 60C
t/Cₒ
Time/min
ZnO [merck]
ZnO synthesized[ZnSO4+NaOH]
ZnO[Zn(CH3COO)2+NaOH]
Figure 53: Dark reaction and irradiation at the different two types of the prepared ZnO-NPs with ZnO (Merck).
Dark and irradiation reaction
23

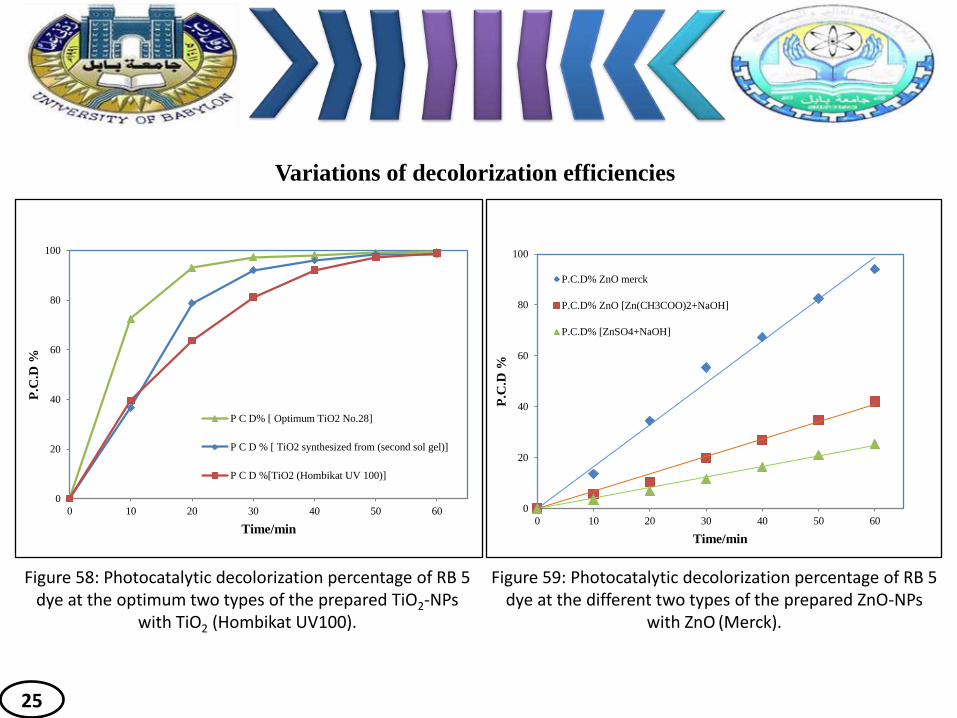
Variations of decolorization efficiencies
Figures 54 to 57: Photocatalytic decolorization percentage of RB 5 dye at different types of the prepared TiO2-NPs. [V/V(TiCl4:EtOH)=1:10, 1:4, 1:3 and 1:2]. 24
3/10
25
0
20
40
60
80
100
0 10 20 30 40 50 60
P.C
.D %
Time/min
P C D% [ Optimum TiO2 No.28]
P C D % [ TiO2 synthesized from (second sol gel)]
P C D %[TiO2 (Hombikat UV 100)]
Figure 58: Photocatalytic decolorization percentage of RB 5 dye at the optimum two types of the prepared TiO2-NPs
with TiO2 (Hombikat UV100).
0
20
40
60
80
100
0 10 20 30 40 50 60
P.C
.D %
Time/min
P.C.D% ZnO merck
P.C.D% ZnO [Zn(CH3COO)2+NaOH]
P.C.D% [ZnSO4+NaOH]
Figure 59: Photocatalytic decolorization percentage of RB 5 dye at the different two types of the prepared ZnO-NPs
with ZnO (Merck).
Variations of decolorization efficiencies
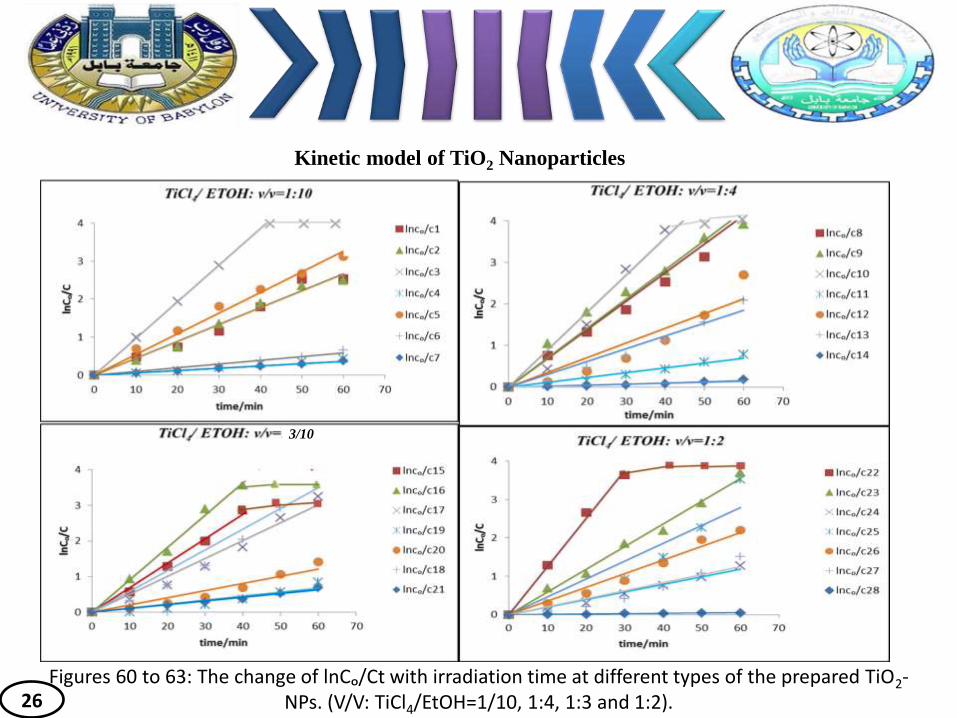
Figures 60 to 63: The change of lnCₒ/Ct with irradiation time at different types of the prepared TiO2-NPs. (V/V: TiCl4/EtOH=1/10, 1:4, 1:3 and 1:2). 26
Kinetic model of TiO2 Nanoparticles
3/10

0.0008 0.0024
0.0061 0.0069
0.0097 0.0106 0.0113 0.0116
0.0169 0.0203 0.0208
0.0307 0.0355 0.0356
0.0443 0.0444
0.0466 0.0502
0.0545 0.0582 0.0592
0.0686 0.0689
0.0706 0.0718
0.0804 0.0807
0.1253
0 0.02 0.04 0.06 0.08 0.1 0.12 0.14
TiO2(1)TiO2(2)TiO2(3)TiO2(4)TiO2(5)TiO2(6)TiO2(7)TiO2(8)TiO2(9)
TiO2(10)TiO2(11)TiO2(12)TiO2(13)TiO2(14)TiO2(15)TiO2(16)TiO2(17)TiO2(18)TiO2(19)TiO2(20)TiO2(21)TiO2(22)TiO2(23)TiO2(24)TiO2(25)TiO2(26)TiO2(27)TiO2(28)
Th
e p
rep
are
d T
iO2 b
y u
sin
g t
he
firs
t so
l g
el
met
ho
d
Rate constant (k/min-1)
The TiO2 (28) exhibited 156.625 times higher photocatalytic activity Than TiO2 (1)
28 Figure 66: The variations photocatalytic activity on different types of prepared TiO2-NPs in the
first sol gel method.
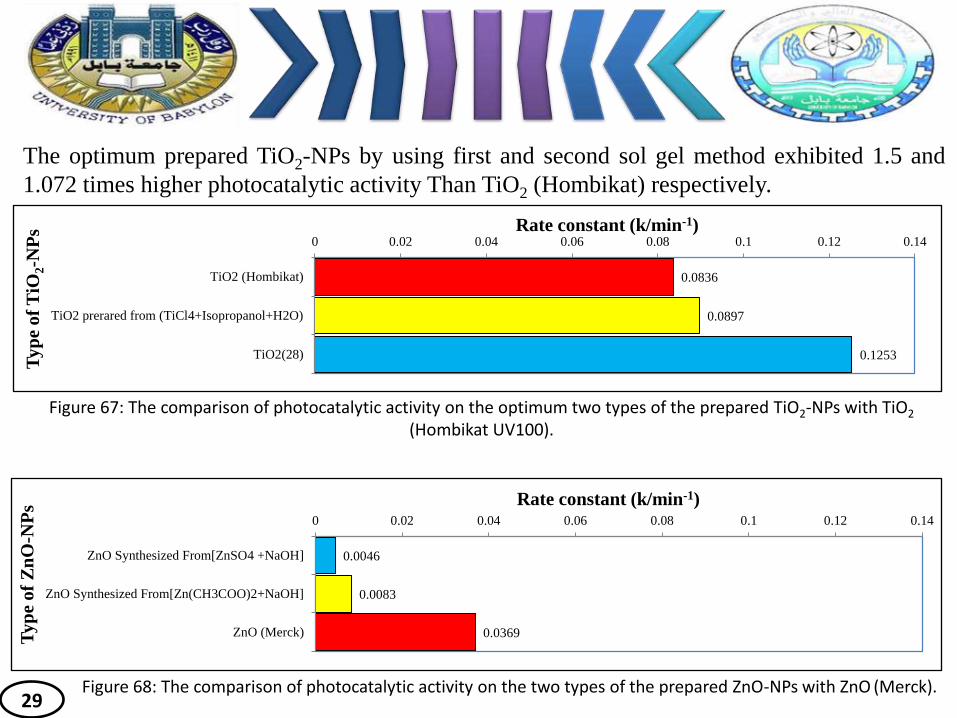
0.0836
0.0897
0.1253
0 0.02 0.04 0.06 0.08 0.1 0.12 0.14
TiO2 (Hombikat)
TiO2 prerared from (TiCl4+Isopropanol+H2O)
TiO2(28)
Rate constant (k/min-1)
Ty
pe
of
TiO
2-N
Ps
0.0046
0.0083
0.0369
0 0.02 0.04 0.06 0.08 0.1 0.12 0.14
ZnO Synthesized From[ZnSO4 +NaOH]
ZnO Synthesized From[Zn(CH3COO)2+NaOH]
ZnO (Merck)
Rate constant (k/min-1)
Ty
pe
of
Zn
O-N
Ps
The optimum prepared TiO2-NPs by using first and second sol gel method exhibited 1.5 and
1.072 times higher photocatalytic activity Than TiO2 (Hombikat) respectively.
29
Figure 67: The comparison of photocatalytic activity on the optimum two types of the prepared TiO2-NPs with TiO2 (Hombikat UV100).
Figure 68: The comparison of photocatalytic activity on the two types of the prepared ZnO-NPs with ZnO (Merck).
0%
20%
40%
60%
80%
100%
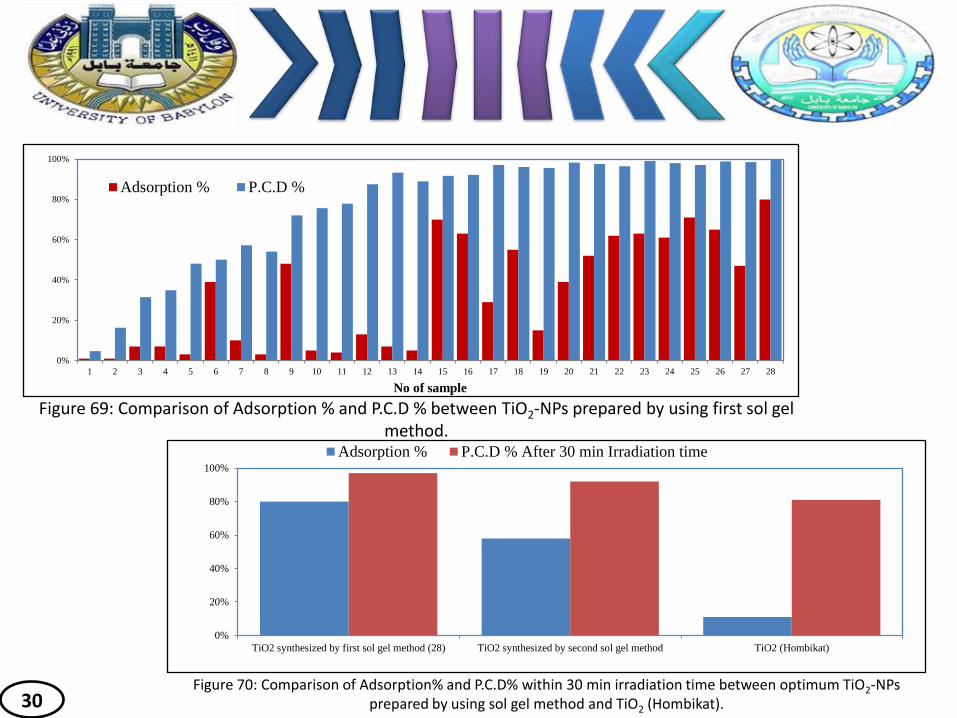
1 2 3 4 5 6 7 8 9 10 11 12 13 14 15 16 17 18 19 20 21 22 23 24 25 26 27 28
No of sample
Adsorption % P.C.D %
Figure 69: Comparison of Adsorption % and P.C.D % between TiO2-NPs prepared by using first sol gel method.
0%
20%
40%
60%
80%
100%
TiO2 synthesized by first sol gel method (28) TiO2 synthesized by second sol gel method TiO2 (Hombikat)
Adsorption % P.C.D % After 30 min Irradiation time
Figure 70: Comparison of Adsorption% and P.C.D% within 30 min irradiation time between optimum TiO2-NPs prepared by using sol gel method and TiO2 (Hombikat). 30

0%
10%
20%
30%
40%
50%
60%
70%
80%
90%
100%
ZnO synthesized from(ZnSO47H2O+NaOH) ZnO synthesized
from(Zn(OAC)2.2H2O+H2O)
ZnO (Merck)
Adsorption %
P.C.D %
Figure 71: Comparison of Adsorption% and P.C.D% between ZnO-NPs prepared by using direct precipitation method and ZnO (Merck).
31

3-Combining Effect
0
0.2
0.4
0.6
0.8
1
0 10 20 30 40 50 60 70
Ct/
Cₒ
Time/min
30ppm 1.29 mW/cm2
1.88 mW/cm2
2.42 mW/cm2
3.21 mW/cm2
4.09 mW/cm2
0
0.2
0.4
0.6
0.8
1
0 10 20 30 40 50 60 70
Ct/Cₒ
Time/min
50ppm 1.29 mW/cm2
1.88 mW/cm2
2.42 mW/cm2
3.21 mW/cm2
4.09 mW/cm2
0
0.2
0.4
0.6
0.8
1
0 10 20 30 40 50 60 70Ct/Cₒ
Time/min
40ppm 1.29 mW/cm2
2.42 mW/cm2
3.21 mW/cm2
4.09 mW/cm2
1.88 mW/cm2
0
0.2
0.4
0.6
0.8
1
0 10 20 30 40 50 60 70
Ct/
Cₒ
Time/min
60ppm 1.29 mW/cm2
1.88 mW/cm2
2.42 mW/cm2
3.21 mW/cm2
4.09 mW/cm2
0
0.2
0.4
0.6
0.8
1
0 10 20 30 40 50 60 70
Ct/
Cₒ
Time/min
70ppm 1.29 mW/cm2
1.88 mW/cm2
2.42 mW/cm2
3.21 mW/cm2
4.09 mW/cm2
0
0.2
0.4
0.6
0.8
1
0 10 20 30 40 50 60 70
Ct/
Cₒ
Time/min
80ppm
1.29 mW/cm2
1.88 mW/cm2
2.42 mW/cm2
3.21 mW/cm2
4.09 mW/cm2
32
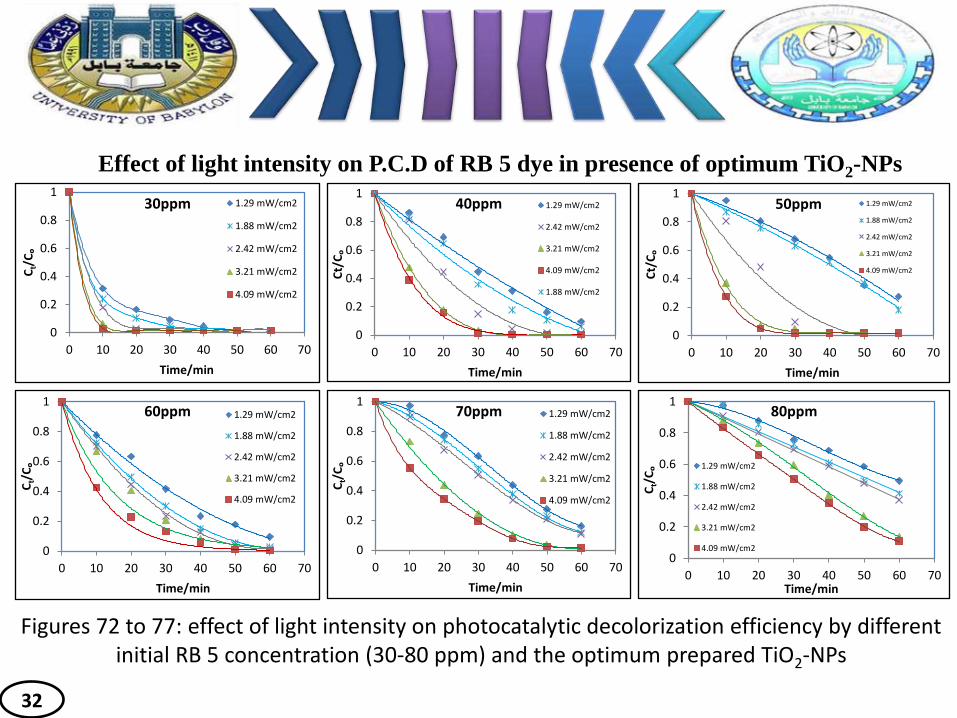
Effect of light intensity on P.C.D of RB 5 dye in presence of optimum TiO2-NPs
Figures 72 to 77: effect of light intensity on photocatalytic decolorization efficiency by different initial RB 5 concentration (30-80 ppm) and the optimum prepared TiO2-NPs
33
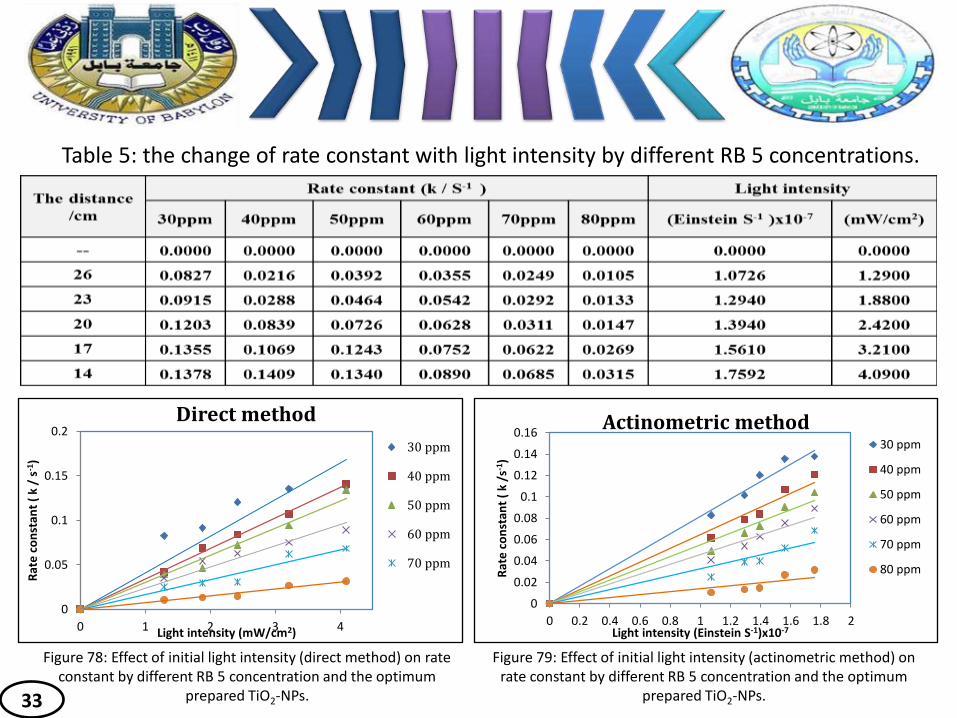
Table 5: the change of rate constant with light intensity by different RB 5 concentrations.
Figure 78: Effect of initial light intensity (direct method) on rate constant by different RB 5 concentration and the optimum
prepared TiO2-NPs.
Figure 79: Effect of initial light intensity (actinometric method) on rate constant by different RB 5 concentration and the optimum
prepared TiO2-NPs.
0
0.05
0.1
0.15
0.2
0 1 2 3 4
Rat
e c
on
stan
t (
k /
s-1)
Light intensity (mW/cm2)
Direct method
30 ppm
40 ppm
50 ppm
60 ppm
70 ppm
0
0.02
0.04
0.06
0.08
0.1
0.12
0.14
0.16
0 0.2 0.4 0.6 0.8 1 1.2 1.4 1.6 1.8 2
Rat
e c
on
stan
t (
k /s
-1)
Light intensity (Einstein S-1)x10-7
Actinometric method 30 ppm
40 ppm
50 ppm
60 ppm
70 ppm
80 ppm

34
1. The sol-gel method led to the formation of amorphous and crystalline TiO2 nanomaterials
by controlling the calcination temperature. It is possible to tailor the crystalline and
spectroscopic properties of TiO2-NPs.
2. A developed sol-gel technique revealed to be a good method for the preparation of TiO2-
NPs. Raising calcination temperatures led to increase in crystallite dimensions and
promoted phase transformation from anatase to rutile. Pure anatase TiO2-NPs was found
to be more active than rutile or a mixtures of them, in the photocatalytic decolorization of
RB 5 under UV (365 nm) light.
3. Among the prepared catalysts, the best synthesized TiO2-NPs showed the highest
adsorption (80.0%) and complete photocatalytic decolorization efficiency (100%) of RB
5. Moreover, it exhibited about 150 times higher photocatalytic activity than commercial
TiO2 (Hombikat). This catalyst has been synthesized in conditions [V/V =1:2
(TiCl4:EtOH) of additives and 200°C annealing temperature].
4. Unfortunately the synthesized ZnO-NPs have lower photocatalytic activity; however,
they have higher adsorption capacity than commercial ZnO (Merck).
Conclusions
35
5. On catalyst characterization, it was observed that the average crystallite size and the
average particle size of all catalysts were in the range between 6.23-164.76 and 84.89-
164.66 nm according to XRD and SPM, respectively. It was found that the synthesized
photocatalysts exhibited smaller spherical shaped particles, amorphous with higher
crystallinity and larger surface to volume ratio (S/V) and a spectacular electron transport
property having a remarkable photocatalytic activity in terms of the RB 5 decomposition.
6. Adsorption results demonstrated that the prepared TiO2-NPs was a promising adsorbent for
removal of RB 5 dye from aqueous solutions.
7. The Langmuir model fitted the experimental data in the presence of optimum catalyst
better than Frendlich model, indicating the adsorption tends to be monolayer adsorption.
8. The kinetic adsorption data indicated that the adsorption process in the presence of
optimum catalyst was controlled by pseudo-second order equation.
9. The higher removal efficiency of RB 5 in the presence of optimum synthesized TiO2-NPs
equals to 60% at the pH 6. This behavior could be explained on the basis of zero point
charge (ZPC).

36
10. The values of thermodynamic parameters indicate that the adsorption of RB 5 onto TiO2-
NPs was thermodynamically feasible and spontaneous.
11. The transformation from anatase to rutile occurred. Crystallites tend to agglomerate from
quantum dotes to bulk size particles with the progressive loss of activity of the catalysts.
12. The photocatalytic process for all prepared catalysts can be expressed by both, the
pseudo-first order reaction kinetics and the Langmuir-Hinshelwood kinetic model.
13. The phenomenon of increasing the photodecolorization efficiency of RB 5 with
decreasing the concentration of solution is due to the decrease in the concentration OH−
adsorbed on catalyst surface.
14. The controlled experimental photocatalytic reaction indicated that the presence of UV
light, oxygen, and catalyst are essential for the effective destruction of RB 5.
15. Photocatalytic activity results concluded that the photoefficiency of the synthesized
catalysts is not only related to its intrinsic properties but also to the activating nature of
the substrate to be decolorized.
16. TiO2-NPs catalysts appeared to be very promising material for the photocatalytic
degradation of several organic compounds under UV light.
17. Combining effect considering a pseudo-steady state approach was used for
description of the kinetics of the photocatalytic process dependence on the initial
concentration of the RB 5 and light intensity. The increase in the photon flux
results to the increase of number of electron-hole pair; hence, increase in the
kinetic rate constant, which is attributed to an increasing concentration of HO•
radicals accelerating the oxidation of the organic molecules.
18. From an applied point of view, photocatalytic oxidation processes using the
optimum TiO2-NPs appear to be a very useful technique for the detoxification of
water containing moderate organic contents, leading to mineralization of
pollutants.
37
References:
1) Majeed A. Shaheed and Falah H. Hussein, “Adsorption of Reactive Black 5 on
Synthesized Titanium Dioxide Nanoparticles: Equilibrium Isotherm and Kinetic
Studies”, Journal of Nanomaterials, , vol. 2014, Article ID 198561, pp. 11.
2) S. Mukherjee, F. Libisch, N. Large, O. Neumann, L. V. Brown, J. Cheng, J. B.
Lassiter, E. A. Carter, P. Nordlander, and N. J. Halas, “Hot electrons Do the
impossible: plasmon-induced dissociation of H2 on Au,” Journal of Nano Lett., vol. 13,
pp. 240–247, 2013.
3) G. Xin, H. Pan, D. Chen, Z. Zhang, and B. Wen, “Synthesis and photocatalytic
activity of N-doped TiO2 produced in a solid phase reaction,” Journal of Physics
and Chemistry of Solids, vol. 74, pp. 286–290, 2013.
4) B. Choudhury and A. Choudhury, “Tailoring luminescence properties of TiO2
nanoparticles by Mn doping,” Journal of Luminescence, vol. 136, pp. 339 –346, 2013.
5) P. K. Samanta and S. Mishra, “Solution phase synthesis of ZnO nanopencils and
their optical property,” Journal of Materials Letters, vol. 91, pp. 338 –340, 2013.
6) W. K. Tan, K. A. Razak, Z. Lockman, G. Kawamura, H. Muto, and A. Matsuda,
“Formation of highly crystallized ZnO nanostructures by hot-water treatment of etched
Zn foils, Journal of Materials Letters, vol. 91, pp. 111–114, 2013.
39

7) W. Li and T. Zeng, “Preparation of TiO2 anatase nanocrystals by TiCl4 hydrolysis
with additive H2SO4,” Journal of pone, vol. 6, no. 6, pp. 6, 2011.
8) B. Choudhury, B. Borah, and A. Choudhury, “Ce–Nd codoping effect on the
structural and optical properties of TiO2 nanoparticles,” Journal of Materials Science
and Engineering B, vol. 178, no. 4, pp. 239–247, 2013.
9) M. C. Mathpal, A. K. Tripathi, M. K. Singh, S. P. Gairola, S. N. Pandey, and A.
Agarwal, “Effect of annealing temperature on Raman spectra of TiO2 nanoparticles,”
Journal of Chemical Physics Letters, vol. 555, pp. 182–186, 2013.
10) A. Hoseinpur, J. V. Khaki, and M. S. Marashi, “Mechanochemical synthesis of
tungsten carbide nanoparticles by using WO3/Zn/C powder mixture,” Journal of
Materials Research Bulletin, vol. 48, pp. 399–403, 2013.
11) Y. G. Zhu, J. W. Eaton, and C. Li, “Titanium dioxide (TiO2) nanoparticles
preferentially induce cell death in transformed cells in a Bak/Bax-independent
fashion,” Journal of pone, vol. 7, no. 11, e50607, 2012.
12) A. D. Paola, M. Bellardita, and L. Palmisano, “Brookite, the least known TiO2
photocatalyst,” Journal of catalysts, vol. 3, pp. 36–73, 2013.
39

Chemical Sciences Related Journals
Journal of Thermodynamics & Catalysis
Journal of Plant Biochemistry & Physiology
Organic Chemistry: Current Research

Medicinal Chemistry & Computer Aided Drug Designing 3rd International Conference on Medicinal Chemistry &
Computer Aided Drug Designing
Chemical Sciences Related Conferences

OMICS Group Open Access Membership
OMICS publishing Group Open Access Membership
enables academic and research institutions, funders
and corporations to actively encourage open access in
scholarly communication and the dissemination of
research published by their authors.
For more details and benefits, click on the link below:
http://omicsonline.org/membership.php