Photocatalytic degradation of phenol by iodine doped tin oxide nanoparticles under UV and sunlight...
6
Photocatalytic degradation of phenol by iodine doped tin oxide nanoparticles under UV and sunlight irradiation Abdullah M. Al-Hamdi a , Mika Sillanpää a , Joydeep Dutta b,⇑ a Laboratory of Green Chemistry, Lappeenranta University of Technology, Sammonkatu 12, 50130 Mikkeli, Finland b Chair in Nanotechnology, Water Research Center, Sultan Qaboos University, P.O. Box 17, 123 Al-Khoudh, Oman article info Article history: Received 12 May 2014 Received in revised form 11 August 2014 Accepted 12 August 2014 Available online 20 August 2014 Keywords: Tin oxide Sol–gel process Nanoparticle Photocatalysis Phenol degradation Visible light abstract Iodine doped tin oxide (SnO 2 :I) nanoparticles were prepared by sol–gel synthesis and their photocatalytic activities with phenol as a test contaminant were studied. In the presence of the catalysts, phenol degradation under direct sunlight was comparable to what was achieved under laboratory conditions. Photocatalytic oxidation reactions were studied by varying the catalyst loading, light intensity, illumina- tion time, pH of the reactant and phenol concentration. Upon UV irradiation in the presence of SnO 2 :I nanoparticles, phenol degrades very rapidly within 30 min, forming carboxylic acid which turns the solution acidic. Phenol degradation rate with 1% iodine doped SnO 2 nanoparticles is at least an order of magnitude higher compared to the degradation achieved through undoped SnO 2 nanoparticles under similar illumination conditions. Ó 2014 Elsevier B.V. All rights reserved. 1. Introduction Phenols, bisphenols A, dyes, pharmaceuticals, parabens, endo- crine disrupting compounds, phthalates and benzoic acids are all severe environmental pollutants [1–3] that are introduced into the environment from chemical and pharmaceutical industries [4]. Advanced oxidative processes (AOPs) are one of the most effec- tive technologies suitable for the treatment of organic pollutants to harmless end products. The reactions are activated through the generation of very reactive species such as hydroxyl radicals. Sig- nificant progress has been made in recent years in synthesizing nanoparticles as environmental purification photocatalysts [5,6]. Many researchers reported that titanium dioxide (TiO 2 ), zinc oxide (ZnO) and tin dioxide (SnO 2 ) are the most active catalysts for the degradation of dyes, phenols and pesticides [7–11]. In addition, these semiconductors have been recognized as preferable materi- als for photocatalytic processes due to their photosensitivity, non-toxicity, low cost and high chemical stability [7,12,13]. Several studies have been carried out on the application of TiO 2 and ZnO for mineralization of organics [14–18]. A new class of activated iodine doped TiO 2 was found to enhance photocatalytic oxidation of phenol under UV and visible light illumination [19]. In another work, catalytic activity of iodine doped titanium dioxide was enhanced by modifying with tin dioxide [20]. The light response range and photo-efficiency of TiO 2 is limited because of its wide band gap [18,21]. It has been reported that TiO 2 doped with non-metals extends the absorption wavelengths from UV to visible region that enhances visible light photocatalytic activity [22,23]. TiO 2 nanoparticles and co-doped with iodine and fluorine showed better degradation of organic compounds under visible light irradiation [24]. It has been reported that iodine atoms prefer to be doped near TiO 2 surface due to strong I–O repulsion [25]. In iodine-doped TiO 2 nanoparticles, the recombination of e –h + pairs are inhibited since the doped I sites not only trap electrons, but also facilitates electron transfer to the surface adsorbed species, thus enhancing photocatalytic activity [26]. Continuous states con- sisting of 5p and/or 5s orbitals of I 5 and O 2p orbitals of the valence band are favorable for efficient trapping of holes at the I-induced states in TiO 2 nanoparticles. Tin oxide or stannic oxide (SnO 2 ) is considered as a promising semiconductor photocatalyst, which is usually n-type with tetrag- onal crystal structure and a band gap of around 3.6 eV [27], render- ing it transparent in the visible region up to the edge of the ultraviolet region of the solar spectra [28]. Inspite of large scale utilization of (SnO 2 ) powders in different applications, and many reports devoted to its preparation techniques, the investigation of the surface science of (SnO 2 ) indicated that tin dioxide is comparatively unexplored for photocatalytic applications [29]. As the rutile structure of TiO 2 matches the rutile phase of SnO 2 [30], http://dx.doi.org/10.1016/j.jallcom.2014.08.120 0925-8388/Ó 2014 Elsevier B.V. All rights reserved. ⇑ Corresponding author. Tel.: +968 2414 3266; fax: +968 24413532. E-mail address: [email protected] (J. Dutta). Journal of Alloys and Compounds 618 (2015) 366–371 Contents lists available at ScienceDirect Journal of Alloys and Compounds journal homepage: www.elsevier.com/locate/jalcom
Transcript of Photocatalytic degradation of phenol by iodine doped tin oxide nanoparticles under UV and sunlight...

Journal of Alloys and Compounds 618 (2015) 366–371
Contents lists available at ScienceDirect
Journal of Alloys and Compounds
journal homepage: www.elsevier .com/locate / ja lcom
Photocatalytic degradation of phenol by iodine doped tin oxidenanoparticles under UV and sunlight irradiation
http://dx.doi.org/10.1016/j.jallcom.2014.08.1200925-8388/� 2014 Elsevier B.V. All rights reserved.
⇑ Corresponding author. Tel.: +968 2414 3266; fax: +968 24413532.E-mail address: [email protected] (J. Dutta).
Abdullah M. Al-Hamdi a, Mika Sillanpää a, Joydeep Dutta b,⇑a Laboratory of Green Chemistry, Lappeenranta University of Technology, Sammonkatu 12, 50130 Mikkeli, Finlandb Chair in Nanotechnology, Water Research Center, Sultan Qaboos University, P.O. Box 17, 123 Al-Khoudh, Oman
a r t i c l e i n f o a b s t r a c t
Article history:Received 12 May 2014Received in revised form 11 August 2014Accepted 12 August 2014Available online 20 August 2014
Keywords:Tin oxideSol–gel processNanoparticlePhotocatalysisPhenol degradationVisible light
Iodine doped tin oxide (SnO2:I) nanoparticles were prepared by sol–gel synthesis and their photocatalyticactivities with phenol as a test contaminant were studied. In the presence of the catalysts, phenoldegradation under direct sunlight was comparable to what was achieved under laboratory conditions.Photocatalytic oxidation reactions were studied by varying the catalyst loading, light intensity, illumina-tion time, pH of the reactant and phenol concentration. Upon UV irradiation in the presence of SnO2:Inanoparticles, phenol degrades very rapidly within 30 min, forming carboxylic acid which turns thesolution acidic. Phenol degradation rate with 1% iodine doped SnO2 nanoparticles is at least an orderof magnitude higher compared to the degradation achieved through undoped SnO2 nanoparticles undersimilar illumination conditions.
� 2014 Elsevier B.V. All rights reserved.
1. Introduction
Phenols, bisphenols A, dyes, pharmaceuticals, parabens, endo-crine disrupting compounds, phthalates and benzoic acids are allsevere environmental pollutants [1–3] that are introduced intothe environment from chemical and pharmaceutical industries[4]. Advanced oxidative processes (AOPs) are one of the most effec-tive technologies suitable for the treatment of organic pollutants toharmless end products. The reactions are activated through thegeneration of very reactive species such as hydroxyl radicals. Sig-nificant progress has been made in recent years in synthesizingnanoparticles as environmental purification photocatalysts [5,6].Many researchers reported that titanium dioxide (TiO2), zinc oxide(ZnO) and tin dioxide (SnO2) are the most active catalysts for thedegradation of dyes, phenols and pesticides [7–11]. In addition,these semiconductors have been recognized as preferable materi-als for photocatalytic processes due to their photosensitivity,non-toxicity, low cost and high chemical stability [7,12,13].
Several studies have been carried out on the application of TiO2
and ZnO for mineralization of organics [14–18]. A new class ofactivated iodine doped TiO2 was found to enhance photocatalyticoxidation of phenol under UV and visible light illumination [19].In another work, catalytic activity of iodine doped titanium dioxide
was enhanced by modifying with tin dioxide [20]. The lightresponse range and photo-efficiency of TiO2 is limited because ofits wide band gap [18,21]. It has been reported that TiO2 dopedwith non-metals extends the absorption wavelengths from UV tovisible region that enhances visible light photocatalytic activity[22,23]. TiO2 nanoparticles and co-doped with iodine and fluorineshowed better degradation of organic compounds under visiblelight irradiation [24]. It has been reported that iodine atoms preferto be doped near TiO2 surface due to strong I–O repulsion [25]. Iniodine-doped TiO2 nanoparticles, the recombination of e�–h+ pairsare inhibited since the doped I sites not only trap electrons, butalso facilitates electron transfer to the surface adsorbed species,thus enhancing photocatalytic activity [26]. Continuous states con-sisting of 5p and/or 5s orbitals of I5 and O 2p orbitals of the valenceband are favorable for efficient trapping of holes at the I-inducedstates in TiO2 nanoparticles.
Tin oxide or stannic oxide (SnO2) is considered as a promisingsemiconductor photocatalyst, which is usually n-type with tetrag-onal crystal structure and a band gap of around 3.6 eV [27], render-ing it transparent in the visible region up to the edge of theultraviolet region of the solar spectra [28]. Inspite of large scaleutilization of (SnO2) powders in different applications, and manyreports devoted to its preparation techniques, the investigationof the surface science of (SnO2) indicated that tin dioxide iscomparatively unexplored for photocatalytic applications [29]. Asthe rutile structure of TiO2 matches the rutile phase of SnO2 [30],
A.M. Al-Hamdi et al. / Journal of Alloys and Compounds 618 (2015) 366–371 367
it should be possible to introduce iodine ions in SnO2 crystals in awet-chemical process.
Among various synthesis techniques, the sol–gel process for tinoxide preparation has numerous advantages [31,32]. Several stud-ies on doping of tin dioxide nanocrystals with different metalshave been reported in recent years [33,34]. Anionic or cationicdoping of wide band gap semiconductor photocatalysts has beenconducted to improve their visible light absorption characteristics[35,36]. The oxygen deficient crystal structure, SnO2�x, leads to anenhancement of catalytic activities of absorbed surface species[35]. The conduction band edge in n-type oxides like SnO2 are deepbelow vacuum level and are thus relatively easy to dope as it iscontrolled by the compensation of native defects. Doping occursby moving the Fermi energy to the band edge leading to the spon-taneous formation of compensation defects if the formation energyof the defect falls to zero at the Fermi energy. Upon doping SnO2
with iodine, the Fermi energy will be shifted towards the conduc-tion band, which would eventually lead to an efficient transfer ofphoto-induced electrons from the conduction band to the SnO2
surface [35–37].The goal of this study was to synthesize nanosized doped and
undoped tin dioxide particles by sol–gel process with differentiodine concentrations. Photocatalytic properties of SnO2:I nanopar-ticles were studied through the degradation and mineralization ofphenol in water upon illumination with UV light and upon directexposure to sunlight. This simple technique to synthesize iodinedoped tin dioxide nanoparticles could allow its wide-scale usefor the degradation of phenol and other toxic organic compounds.
2. Experimental
2.1. Materials
Analytical-grade tin (IV) chloride (SnCl4, Sigma Aldrich, Purity: 99.99%), iodine(I2, Sigma Aldrich, 99.9%), ethanol, (C2H5OH, ETAX Aa Merck Absolute), phenol(C6H5OH, Sigma Aldrich, Purity: 99.99%), p-Benzoquinone (O:C6H4:O, BDH, AnalaR99%), resorcinol (C6H4(OH)2, BDH, AnalaR 99%), acetic acid (C2H4O2, Sigma Aldrich,99.9%), benzoic acid (C6H5COOH, BDH, AnalaR 99%), sulfuric acid (H2SO4, SigmaAldrich, 99%), hydrochloric acid (HCl, Sigma Aldrich, 99%), sodium hydroxide pellets(NaOH, Sigma Aldrich, 99%), and methanol (CH4O, Sigma Aldrich, 99% HPLC grade),sodium chloride (NaCl, BDH, 99% AnalaR grade) were used in the experimentalstudies. Double deionized water from Ultra Clear Water SG was used for the prep-aration of all aqueous solutions.
2.2. Photocatalyst preparation
2.2.1. Synthesis of pure and doped-SnO2 nanoparticlesSnO2 nanoparticles containing different percentages of iodine ions in the start-
ing solution were synthesized by sol–gel technique by the following procedure:5.225 ml of SnCl4 mixed in 100 ml absolute ethanol, and used as precursor for syn-thesizing SnO2 nanoparticles. The mixture was continuously stirred for 2 h at roomtemperature, until a colorless solution was obtained. The solution was then con-densed in a round bottom flask kept at a constant temperature of 80 �C. A colorlesssolution of tin alkoxide was obtained after heating the mixture at 80 �C under vac-uum conditions [24]. For the synthesis of iodine doped tin dioxide nanoparticles,different concentrations of iodine were mixed and dissolved separately in ethanoland added to the precursor solution. A turbid colloidal solution of tin alkoxidewas obtained, after adding aqueous ammonia (25%) into the condensed solutionupon continuous stirring until a pH value of 8 was reached [24]. After refluxing,the resultant solution was poured into an open heated plate kept at 30 �C. Thistransparent colloidal suspension was left for about 5–6 days until it gelled com-pletely. The gel was then dried at 80 �C for 7 h. Finally, the obtained powder wasair-annealed at 200 �C for 7 h.
2.2.2. CharacterizationOptical absorption spectra were recorded in colloidal suspension in a double
beam spectrophotometer (Perkin Elmer, Lambda 45). To study the surface morphol-ogy of the prepared SnO2 and SnO2:I samples, scanning electron microscopy (SEM)was carried out with JEOL (Japan) (JSM-5600LY) working at 30 kV. The crystallinephase of the synthesized SnO2 and SnO2:I powder was analyzed by X-ray powderdiffraction (XRD) using a MiniFlex 600 diffractometer (Rikagu, Japan) with Cu Karadiation (wavelength = 1.54 Å). Diffractograms of powders were recorded in 2hscan configuration, in the 10–80� 2h range, with the data collected at steps of
0.02�. 200–300 mg of sample was degassed at 300 �C for 3 h under nitrogen (N2)flow followed by a six point N2 adsorption carried out at p/p0 of 1–5 in a Nova�
2200 analyzer. The surface area was determined by the Nova� 2200 analyzer soft-ware using the Brunauer–Emmett–Teller (B.E.T.) method.
2.3. Photocatalysis experiments
2.3.1. Photocatalytic reactorsThe photoreactor was a cylindrical Pyrex-glass container of 250 ml capacity,
50 mm internal diameter and 300 mm in height. 8 W medium pressure mercurylamp (Osaka, Japan) with an emission of about 80 W/m2 was used for irradiationof the samples and the reaction temperature was controlled at 25 �C by cooling withwater. A second photoreactor for the solar photocatalysis experiments was con-structed using a borosilicate glass container of 250 ml capacity, 100 mm internaldiameter and 200 mm in height where sunlight was directed axially at the centerof the reactor.
2.4. Experimental procedures
To investigate the effects of different dopants on the photocatalytic activity ofSnO2, oxidative photodegradation of phenol was chosen to evaluate the photocata-lytic activity of synthesized nanoparticles. The study of degradation of phenol inwater was carried out at 25 �C using the water-cooled cylindrical glass batch pho-toreactor. The experimental conditions were varied as follows: the amount of cat-alyst powder (photocatalyst) was kept constant at 0.065 g in 50 ml of the testcontaminant (aqueous phenol solution). 10 mg/l aqueous solution of phenol wasused to carry out photocatalytic experiments. Prior to each test, the mixture waskept in the dark for 30 min under constant magnetic stirring to ensure that theadsorption–desorption equilibrium was reached before illuminating the samples.At the end of the adsorption period (in dark conditions), prior to turning the lighton, reference samples were collected for analysis. The irradiation times varied from2 to 5 h. Aliquots of the suspensions were collected and removed from the reactorevery 15 or 30 min. At given time intervals, from the collected samples, photocata-lyst particles were removed first by centrifugation (4000 rpm, for 5 min) usingEppendorf Centrifuge (model 5810R) followed by filtration through a 0.2 lmMillipore filter.
2.5. Analytical methods
The change in phenol concentration in each photodegraded solution wasmonitored by two sets of measurements. The maximum absorbance of phenolwas measured at kmax = 270 nm in an ultraviolet–visible (UV–Vis) spectrometer(Perkin Elmer Lambda 45). Also, the total organic carbon was determined by a TotalOrganic Carbon Analyzer (TOC-VCPH Shimadzu) equipped with an auto sampler(ASI-V Shimadzu).
2.6. High performance liquid chromatography analysis (HPLC)
Phenol photodegradation products were analyzed using high performanceliquid chromatography (HPLC) which contained a P580 high-precision pump fromDionex (Germering, Germany), which fulfilled the requirement for a measureddelivery rate of the mobile phase. The injector was a Rheodyne (Cotati) 8125 valvefitted with a 20 lL loop. The analysis was carried out using a C18 column (5 lm)maintained at room temperature. After elution from the column, the eluent passedthrough a Dionex UVD 170S diode array detector set at 245 nm. The mobile phasefor the HPLC separation was prepared by mixing methanol with water 45:55 andthen adjusting the pH at 3.0 by adding sulphuric acid (H2SO4). The mobile phasewas degassed in an ultrasonic bath, and then passed through a Millipore filtrationapparatus (0.2 lm). Photodegraded Phenol and control samples were eluted at aflow rate of 0.5 ml/min.
2.7. Gas chromatography
Solid phase extraction (SPE) columns of chromabond C18 ec (octadecyl-modified silica), Macherey–Nagel) weighing 500 mg had a volume of 3 ml.Columns were first conditioned with three column volumes of methanol (CH3OH)and two column volumes of 0.01 M hydrochloric acid (HCl) [36]. For extracting thephenolic compounds from the degraded mixture, 200 mg NaCl was added forevery 1 ml of sample. HCl (1 M) was used to adjust pH to �2. 2.5 ml sample ofphenol was then pipetted to SPE column slowly at a flow rate of 0.5 ml/min. Sam-ples were washed twice with 500 lL of 0.01 M HCl and dried in vacuum for10 min. Elution was carried out with 3 � 500 lL of methanol. Gas chromatography(Agilent 6890 GC) coupled with mass spectrometry (GC/MS) was used for thedetermination of phenol concentration. The analysis was carried out using HP-5(Agilent, 5% phenyl methyl siloxane, capillary 30 m � 320 lm nominal) column.Injection mode was split less, and the volume was 1 lL. Injector and detectortemperatures were maintained at 300 �C. Helium was used as a carrier gas witha flow of 1.2 ml/min. Oven temperature was varied at 20 �C/min up to 260 �Cand thereafter at 15 �C/min to 300 �C.

Table 1Estimated crystallite size of different I doped SnO2 nano-particles from (1 10) peak using the Debye–Scherreranalysis.
Dopant Crystal size (nm)
Undoped 8.4SnO2:I (0.2%) 8.0SnO2:I (0.4%) 7.4SnO2:I (1%) 2.5
Fig. 2. Typical scanning electron micrograph of (a) undoped and (b) iodine dopedtin dioxide nanoparticles synthesized by sol–gel process.
368 A.M. Al-Hamdi et al. / Journal of Alloys and Compounds 618 (2015) 366–371
3. Results and discussion
3.1. Undoped and iodine doped SnO2 nanoparticles
Undoped and doped SnO2 nanoparticle samples were examinedby XRD as shown in Fig. 1. The XRD pattern of SnO2 samples showthe presence of (110), (101), (111), (211), (220), (002), (310),(112) and (301) respectively, matching with the standard XRD fileof SnO2 (JCPDS-#41-1445), regarded as an attributive indication ofrutile SnO2 structure [37–40]. The SnO2 crystallite sizes obtainedfrom the Debye Scherrer equation considering the most intensepeak (110) follows the well-known trend of crystallite size reduc-tion upon doping and was found to reduce from 8.4 nm forundoped SnO2 particles to 2.5 nm for the 1 wt.% SnO2:I samples.In Table 1 we have shown the crystallite sizes which were esti-mated from the broadening of (110) peak of XRD patterns. Thespecific surface area of undoped SnO2 particles from gas adsorptionstudies was found to be 28 m2 g�1, which increased to 50 m2 g�1
for the 1 wt.% iodine doped tin oxide samples, again indicating areduction of crystallite sizes upon doping.
Typical electron micrographs (SEM) of the photocatalysts areshown in Fig. 2. It is also clear from Fig. 2(a) and (b) that uponiodine doping the average grain size decreases in agreement withwhat we observed from the estimation of crystallite size fromXRD studies (Table 1). In order to get a better insight, we carriedout high resolution HRTEM as shown in Fig. 3 where the crystallitesize is clearly seen to reduce in size upon doping, agreeing wellwith the earlier observations made from the SEM and XRD analysis.
3.2. Photocatalytic degradation of phenol
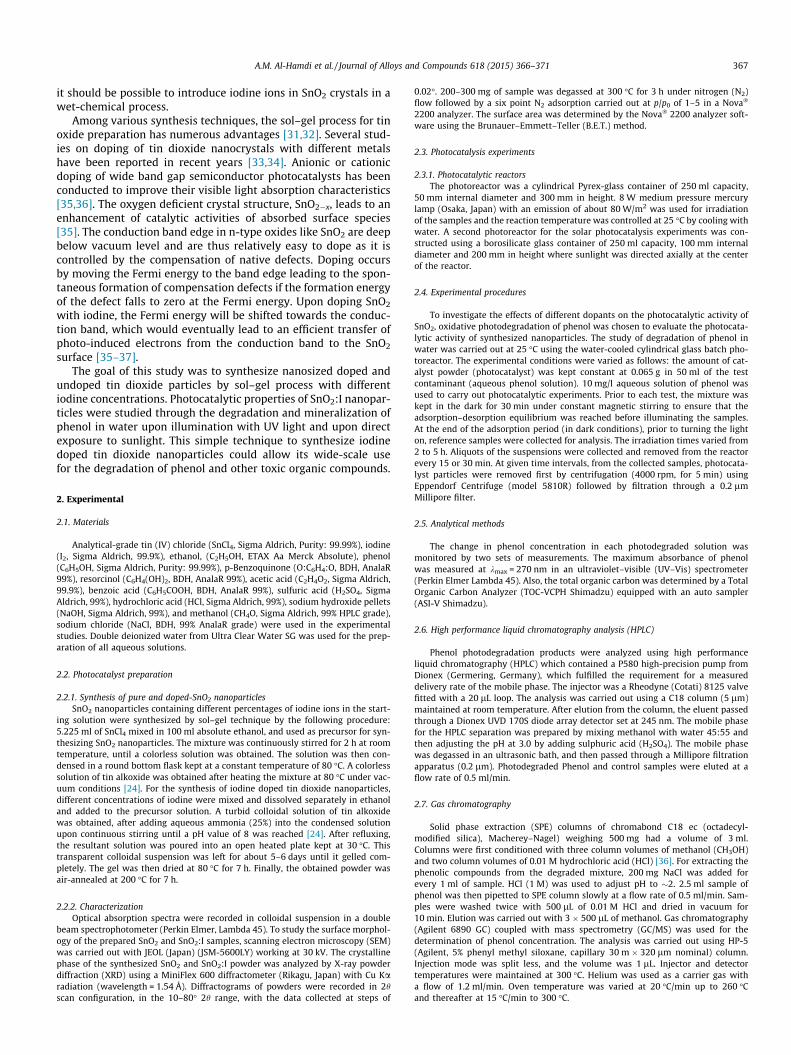
During the photocatalysis experiments, the clear solutionsbefore and after different irradiation times were analyzed by HPLC.It was found as shown in Fig. 4, that phenol was effectivelydegraded upon solar irradiation for 3 h, with the emergence offragments observed in HPLC. The main intermediate such asp-benzoquinone appeared at 16 min retention time and is clearlyvisible in the HPLC results. According to the substitution rules,OH radicals attack the phenol molecule with higher probabilityin 1 and 4 positions versus OH group of the aromatic ring. Theexistence of aliphatic intermediates in the reaction mixture wasalso checked and was found to appear after 6 min retention time,which suggest that the structure of benzene ring was destroyedto form carboxylic acid intermediates through photochemicaloxidation by SnO2:I nanoparticles. As it can be observed in Fig. 4,
Fig. 1. X-ray diffraction (XRD) patterns of typical samples undoped, 0.2 wt.%,0.4 wt.% and 1.0 wt.% iodine doped tin dioxide particles synthesized by sol–gelprocess.
Fig. 3. Typical high resolution transmission electron micrograph of SnO2 nanopar-ticles synthesized by sol–gel process (a) undoped (b) 1% iodine doped.
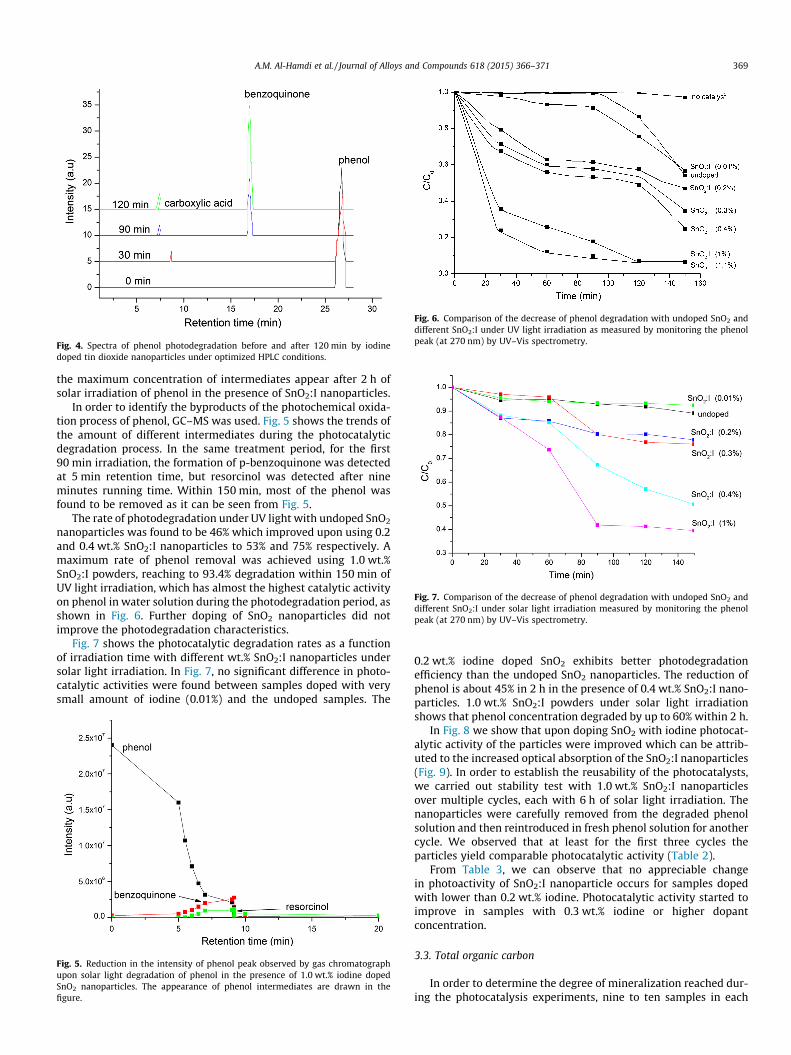
Fig. 4. Spectra of phenol photodegradation before and after 120 min by iodinedoped tin dioxide nanoparticles under optimized HPLC conditions.
Fig. 6. Comparison of the decrease of phenol degradation with undoped SnO2 anddifferent SnO2:I under UV light irradiation as measured by monitoring the phenolpeak (at 270 nm) by UV–Vis spectrometry.
Fig. 7. Comparison of the decrease of phenol degradation with undoped SnO2 anddifferent SnO2:I under solar light irradiation measured by monitoring the phenolpeak (at 270 nm) by UV–Vis spectrometry.
A.M. Al-Hamdi et al. / Journal of Alloys and Compounds 618 (2015) 366–371 369
the maximum concentration of intermediates appear after 2 h ofsolar irradiation of phenol in the presence of SnO2:I nanoparticles.
In order to identify the byproducts of the photochemical oxida-tion process of phenol, GC–MS was used. Fig. 5 shows the trends ofthe amount of different intermediates during the photocatalyticdegradation process. In the same treatment period, for the first90 min irradiation, the formation of p-benzoquinone was detectedat 5 min retention time, but resorcinol was detected after nineminutes running time. Within 150 min, most of the phenol wasfound to be removed as it can be seen from Fig. 5.
The rate of photodegradation under UV light with undoped SnO2
nanoparticles was found to be 46% which improved upon using 0.2and 0.4 wt.% SnO2:I nanoparticles to 53% and 75% respectively. Amaximum rate of phenol removal was achieved using 1.0 wt.%SnO2:I powders, reaching to 93.4% degradation within 150 min ofUV light irradiation, which has almost the highest catalytic activityon phenol in water solution during the photodegradation period, asshown in Fig. 6. Further doping of SnO2 nanoparticles did notimprove the photodegradation characteristics.
Fig. 7 shows the photocatalytic degradation rates as a functionof irradiation time with different wt.% SnO2:I nanoparticles undersolar light irradiation. In Fig. 7, no significant difference in photo-catalytic activities were found between samples doped with verysmall amount of iodine (0.01%) and the undoped samples. The
Fig. 5. Reduction in the intensity of phenol peak observed by gas chromatographupon solar light degradation of phenol in the presence of 1.0 wt.% iodine dopedSnO2 nanoparticles. The appearance of phenol intermediates are drawn in thefigure.
0.2 wt.% iodine doped SnO2 exhibits better photodegradationefficiency than the undoped SnO2 nanoparticles. The reduction ofphenol is about 45% in 2 h in the presence of 0.4 wt.% SnO2:I nano-particles. 1.0 wt.% SnO2:I powders under solar light irradiationshows that phenol concentration degraded by up to 60% within 2 h.
In Fig. 8 we show that upon doping SnO2 with iodine photocat-alytic activity of the particles were improved which can be attrib-uted to the increased optical absorption of the SnO2:I nanoparticles(Fig. 9). In order to establish the reusability of the photocatalysts,we carried out stability test with 1.0 wt.% SnO2:I nanoparticlesover multiple cycles, each with 6 h of solar light irradiation. Thenanoparticles were carefully removed from the degraded phenolsolution and then reintroduced in fresh phenol solution for anothercycle. We observed that at least for the first three cycles theparticles yield comparable photocatalytic activity (Table 2).
From Table 3, we can observe that no appreciable changein photoactivity of SnO2:I nanoparticle occurs for samples dopedwith lower than 0.2 wt.% iodine. Photocatalytic activity started toimprove in samples with 0.3 wt.% iodine or higher dopantconcentration.
3.3. Total organic carbon
In order to determine the degree of mineralization reached dur-ing the photocatalysis experiments, nine to ten samples in each

Fig. 8. UV–Vis spectra of phenol obtained at different times during the photoir-radiation with AM 1.5 solar light at 0 min (control), 45 min, 90 min, 120 min and150 min, respectively.
Fig. 9. Typical optical absorption of undoped SnO2, 1.0 wt.% I doped SnO2, driedsamples collected from a suspension in aqueous media.
Table 2Degradation of phenol by 1 wt.% I-doped SnO2 for 6 h during each cycle (note: freshphenol sample was added after every 6 h).
Cycle number 1 2 3 4 5
Phenol degradation (%) 64.14 63.83 63.57 51.25 33.04
Table 3Kinetic parameters of phenol degradation by SnO2:I nano-particle powders.
Iodine content (%) Rate constant (min�1)
0.00 0.0040.01 0.0040.2 0.0040.3 0.0050.4 0.0071.0 0.0111.1 0.009
Fig. 10. Total organic carbon (TOC) removal from phenol solutions during 2 h ofphotocatalytic degradation by different SnO2:I under UV light irradiation asmeasured by monitoring the phenol peak (at 270 nm) in UV–Vis spectrometry.
Fig. 11. pH changes as a function of time for 1 wt.% I:SnO2 nanoparticle powders.
370 A.M. Al-Hamdi et al. / Journal of Alloys and Compounds 618 (2015) 366–371
test were collected at a time interval of 15 min during 150 min ofphoto-irradiation and then analyzed for TOC concentration. Nochange in TOC was observed when the UV irradiation was carriedout without any photocatalyst. The maximum TOC mineralizationafter 120 min UV irradiation was observed to occur when 1.1 wt.%SnO2:I samples were used (83% degradation), while only 12% TOCmineralization was achieved with undoped SnO2 upon irradiationfor 120 min. 92%, mineralization was observed after 150 min ofUV irradiation with 1.1 wt.% SnO2:I catalysts, compared to only33% TOC mineralization observed with the undoped catalyst(Fig. 10). 67% of TOC removal was achieved in the presence of0.4 wt.% SnO2:I within 150 min of UV irradiation, while 48% of phe-nol mineralization was observed in the presence of 0.3 wt.% SnO2:I
during the same period. The reduction in TOC generally followedthe same trend observed in the phenol removal as discussed earlier(using UV–Vis spectroscopy).
The pH of phenol concentrations during degradation initiallydecreased, but then increased to values equal to or slightly higherthan the initial pH (Fig. 11). Binary hydroxyl compounds catechol,benzoquinone, hydroquinone are formed during photocatalyticdegradation of phenol. The �OH radical formed by redox reactionoxidizes the conjugate structure of the phenyl ring yieldingcarboxylic acids formed via ring cleavage to give malonic acid, thenshort-chain organic acids such as, maleic, oxalic, acetic and formicacids. Finally upon continuous oxidation the carboxylic acids areconverted to carbon dioxide (CO2) and water (H2O). It has beenreported that the initial pH of aqueous phenol solution (5.5–6.0)

A.M. Al-Hamdi et al. / Journal of Alloys and Compounds 618 (2015) 366–371 371
decrease to 3.5 upon continued photo-irradiation [41]. pKa of phe-nol is around 9 and thus an aqueous solution is mildly acidic asobserved from the pH of the starting solution (pH � 5.7) as shownin Fig. 11. Upon UV irradiation in the presence of SnO2:I nanopar-ticles, phenol degrades very rapidly within 30 min (Fig. 6), with theappearance of carboxylic acid as observed in the HPLC measure-ments (Fig. 4). The expected carboxylic acid byproducts arestrongly acidic (pKa � 3–5) and thus the pH of the phenolicsolution decreases to 4.35 upon light irradiation for 30 min in thepresence of SnO2:I nanoparticles. Upon subsequent removal of car-boxylic acids to CO2 and water by mineralization, the solution getsless acidic as is observed in Fig. 11 [42].
In an earlier work we have reported the rare earth doped tindioxide nanoparticles and their effect on photocatalysis. Halideatoms like fluorine, chlorine and bromine are extensively studiedfor application as dopants of metal oxides like SnO2, but iodine isrelatively new and has not been studied in detail. The goal of thiswork was to find an optimum condition for the synthesis of iodinedoped tin oxide nanoparticles which can improve photocatalyticdegradation. From our earlier report (rare-earth doped tin dioxidenanoparticles) [43], we find that iodine doping indeed improvesthe photocatalytic behavior of tin dioxide.
4. Conclusions
The addition of iodine to tin dioxide improved the photocata-lytic performance of nanoparticle powders. Based on the dopingtechnique used here, it was found that performance of the nano-particles was optimized using 1.0 wt.% SnO2:I. At the higher iodinedoping levels no appreciable improvement in phenol degradationwas found. Introducing iodine atoms enhances pollutant degrada-tion by changing the concentration of oxygen vacancies in the SnO2
crystal lattice. Improvement of these simple techniques to utilizesolar radiation more efficiently could provide more economic solu-tions for the degradation of organic compounds like phenol fromwater.
Acknowledgements
Authors would like to thank partial financial support from theChair in Nanotechnology programme of the Research Council ofOman and the College of Science for giving this opportunity tocarry out the research at Sultan Qaboos University.
References
[1] S.H. Swan, Environ. Res. 108 (2008) 177–184.[2] S. Anandan, Mater. Sci. Forum 712 (2012) 1–24.
[3] S. Kaneco, M.A. Rahman, T. Suzuki, H. Katsumata, K. Ohta, J. Photochem.Photobiol. A 163 (2004) 419–424.
[4] J. Michalowicz, W. Duda, Pol. J. Environ. Stud. 3 (2007) 347–362.[5] N. Chantarat, Y.W. Chen, S.H. Hsu, C.C. Lin, M.C. Chiang, S.Y. Chen, J. Solid State
Sci. Technol. 2 (2013) Q131–Q135.[6] T. Bora, J. Dutta, J. Nanosci. Nanotechnol. 14 (2014) 613–626.[7] H. Jiang, Q. Wang, S. Zang, J. Li, X. Wang, J. Alloys Comp. 600 (2014) 34–42.[8] S. Ahmed, M.G. Rasul, W. Martens, R. Brown, M.A. Hashib, Water Air Soil Poll.
215 (2011) 3–29.[9] L. Zhang, J. Liu, C. Tang, J. Lv, H. Zhong, Y. Zhao, X. Wang, Appl. Clay Sci. 51
(2011) 68–73.[10] V. Kruefu, H. Ninsonti, N. Wetchakun, B. Inceesungvorn, P. Pookmanee, S.
Phanichphant, Eng. J. 16 (2012) 90–99.[11] S. Senthilkumaar, K. Porkodi, R. Vidyalakshmi, J. Photochem. Photobiol. A 170
(2005) 225–232.[12] D. Liang, C. Cui, H. Hu, Y. Wang, S. Xu, B. Ying, P. Li, B. Lu, H. Shen, J. Alloys.
Comp. 582 (2014) 236–240.[13] U. Diebold, Surf. Sci. Rep. 48 (2003) 53–229.[14] C.M. Teh, A.R. Mohamed, J. Alloys Comp. 509 (2011) 1648–1660.[15] C. Karunakaran, R. Dhanalakshmi, Int. J. Chem. Kinet. 41 (2009) 275–283.[16] N. Philippidis, S. Sotiropoulos, A. Efstathiou, I. Poulios, J. Photochem. Photobiol.
A 204 (2009) 129–136.[17] R. Ullah, J. Dutta, J. Hazard. Mater. 156 (2008) 194–200.[18] S.K. Kansal, S. Sood, A. Umar, S.K. Mehta, J. Alloys Comp. 581 (2013) 392–397.[19] X. Hong, Z. Wang, W. Cai, F. Lu, J. Zhang, Y. Yang, N. Ma, Y. Liu, Chem. Mater. 17
(2005) 1548–1552.[20] Z. He, C. Wang, H. Wang, F. Hong, X. Xu, J. Chen, S. Song, J. Hazard. Mater. 189
(2011) 595–602.[21] R. Pan, Y. Wu, Z. Li, Z. Fang, Appl. Surf. Sci. 292 (2014) 886–891.[22] Y.F. Tu, S.Y. Huang, J.P. Sang, X.W. Zou, J. Alloys Comp. 482 (2009) 382–387.[23] S. In, A. Orlov, R. Berg, F. Garcia, S. Pedrosa-Jimenez, M.S. Tikhov, D.S. Wright,
R.M. Lambert, J. Am. Chem. Soc. 129 (2007) 13790–13791.[24] C. Wen, Y.J. Zhu, T. Kanbara, H.Z. Zhu, C.F. Xiao, Desalination 249 (2009) 621–
625.[25] G. Liu, C. Sun, X. Yan, L. Cheng, Z. Chen, X. Wang, L. Wang, S.C. Smith, G.Q. Lu,
H.M. Cheng, J. Mater. Chem. 19 (2009) 2822–2829.[26] S. Tojo, T. Tachikawa, M. Fujitsuka, T. Majima, J. Phys. Chem. C 112 (2008)
14948–14954.[27] Z. Zhu, J. Zhou, H. Liu, Z. He, X. Wang, J. Nanomater. Mol. Nanotechnol. 1 (2)
(2012) 1–5.[28] Q.R. Zhao, Trans. Nonferrous Met. Soc. China 19 (2009) 1227–1231.[29] M. Batzill, U. Diebold, Prog. Surf. Sci. 79 (2005) 47–154.[30] D.Y. Torres, R.C. Perez, G.T. Delgado, O.Z. Angel, J. Mater. Sci. 22 (2011) 684–
689.[31] K. Vijayarangamuthu, S. Rath, J. Alloys Comp. 610 (2014) 706–712.[32] Y.C. Zhang, Z.N. Du, K.W. Li, M. Zhang, D.D. Dionysiou, J. Appl. Mater. Interfaces
3 (2011) 1528–1537.[33] A.K. Sinha, M. Pradhan, S. Sarkar, T. Pal, Environ. Sci. Technol. 47 (2013) 2339–
2345.[34] A.A. Zhukova, M.N. Rumyantseva, V.B. Zaytsev, A.V. Zaytseva, A.M. Abakumov,
A.M. Gaskov, J. Alloys Comp. 565 (2013) 6–10.[35] K.S. Yoo, N.W. Cho, H.S. Song, H.J. Jung, Sensor. Actuat. B. – Chem. 25 (1995)
474–477.[36] S.H. Vilhunen, M.E.T. Sillanpää, J. Hazard. Mater. 161 (2009) 1530–1534.[37] A. Das, V. Bonu, A.K. Prasad, D. Panda, S. Dhara, A.K. Tyagi, J. Mater. Chem. C 2
(2014) 164–171.[38] K. Melghit, K. Bouziane, Mater. Sci. Eng. B 128 (2006) 58–62.[39] K. Melghit, K. Bouziane, J. Am. Ceram. Soc. 90 (2007) 2420–2423.[40] R. Liu, Y. Huang, A. Xiao, H. Liu, J. Alloys Comp. 503 (2010) 103–110.[41] A. Mills, S. Morris, R. Davies, J. Photochem. Photobiol. A 70 (1993) 183–191.[42] Y. Feng, Y. Cui, B. Logan, Z. Liu, Chemosphere 70 (2008) 1629–1636.[43] A. Al-Hamdi, M. Sillanpää, J. Dutta, J. Mater. Sci. 49 (2014) 5151–5159.