Individual astringency responsiveness affects the acceptance of phenol-rich foods
10
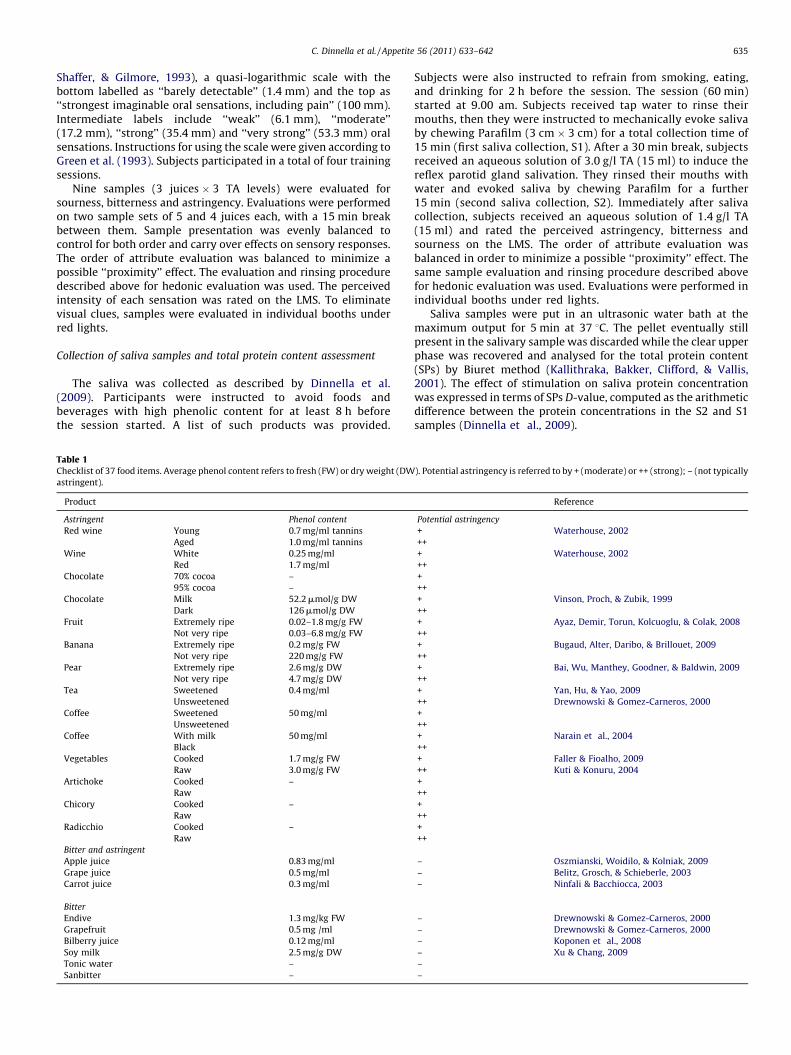
Research report Individual astringency responsiveness affects the acceptance of phenol-rich foods Caterina Dinnella a , Annamaria Recchia a , Hely Tuorila b , Erminio Monteleone a, * a Department of Agricultural Biotechnology, University of Florence, Via Donizetti 6, Firenze, 51144, Italy b Department of Food and Environment Sciences, University of Helsinki, Finland Introduction Vegetable and fruit consumption decreases the risk of chronic diseases and several dietary guidelines (Dietary Guidelines for Americans, 2005; INRAN, 2003) encourage the consumption of plant-derived foods and beverages. Phenolic compounds are found in a wide variety of fruit and vegetables. Their presence in human food is of nutritional interest since they may be responsible for beneficial as well as detrimental effects on health (Halliwell, Rafter, & Jenner, 2005). Phenolic compounds can be divided into fifteen classes depending on their chemical structure. Flavonoids constitute the largest and most diverse family of phenolic compounds. Their strong radical scavenging activity probably accounts for their role in preventing diseases related to oxidative stress, such as coronary heart disease and various forms of cancer (Arts & Hollman, 2005). Tannins constitute a complex group of flavonoid-based polymers capable of binding and eventually precipitating proteins. The antioxidant activity has been demonstrated for tannins, but harmful effects have also been reported for these compounds, such as inhibition of digestive enzymes, lowering of dietary protein digestibility, depressed growth in rats, altered food consumption, and acute hepatotoxic- ity (Mueller-Harvey, 2006). Oral sensations experienced when eating involve many different sensory pathways: taste (salty, sweet, sour, bitter and umami), retronasal olfaction and somatosensory pathways re- sponsible for temperature, mouthfeel/texture and chemesthetic (burning, cooling and astringent) sensations. Food product selection and consumption strongly depends on the product’s sensory properties and on the intensity of experienced sensations (Duffy, 2007; Mattes, 2006). Sensory properties of flavonoids and tannins can be summa- rized by two main descriptors: bitter and astringent, both eliciting negative consumer reactions when perceived at high intensities (Jaeger, Axten, & Wohlers, 2009; Lesschaeve & Noble, 2005). Human beings long sensitized to the bitter taste of plant toxins consider excessive bitterness the principal reason for food rejection (Drewnowski & Gomez-Carneros, 2000). The tactile sensation of astringency on the human palate has been defined as a complex group of sensations involving dryness of the oral surface and tightening and puckering sensations of the mucosa and muscles around the mouth (Lee & Lawless, 1991). Astringency Appetite 56 (2011) 633–642 ARTICLE INFO Article history: Received 27 September 2010 Received in revised form 15 February 2011 Accepted 18 February 2011 Available online 25 February 2011 Keywords: Sensory evaluation Salivary characteristics Food preference Food familiarity Food choice ABSTRACT Sensory responses greatly vary between individuals, and individual sensory experiences influence eating behaviour. Three groups responding differently to phenolic astringent stimuli (Low Responding, LR, n = 20, Medium Responding, MR, n = 37 and High Responding, HR, n = 20) were identified from a population of 77 subjects, based on the maintenance vs fluctuation of salivary characteristics after repeated stimulation of the masticatory and taste/somatosensory systems. The effect of LR, MR and HR status on perceived astringency and liking for phenol-containing apple, grape and carrot juices spiked with increasing tannic acid (TA) concentrations was examined. TA induced a greater increase of perceived astringency in HR, compared to MR and LR subjects. A decrease in liking for spiked juices was found in HR and to a lesser extent in MR and LR subjects. No significant differences were found comparing MR and LR groups for both astringency intensity and liking data. Liking for and familiarity with 37 food items, as well as preference for 14 phenol-rich foods and beverages, each paired with a less astringent counter-product, were also examined. An internal preference map was computed on liking scores and product subgroups were identified. An effect of LR/HR status was found for two food subgroups consisting of coffee without sugar, tea without sugar, raw chicory and milk chocolate, tea with sugar, coffee with sugar. LR subjects rated the products with the most astringency higher and those with the least astringency lower than did HR subjects. LR subjects also rated their familiarity with highly astringent products higher than did HR subjects. Thus, individual differences related to the physiological salivatory response to oral stimulations affect responses to astringent stimuli and can influence the overall acceptability of phenol-rich food items. ß 2011 Elsevier Ltd. All rights reserved. * Corresponding author. E-mail address: erminio.monteleone@unifi.it (E. Monteleone). Contents lists available at ScienceDirect Appetite journal homepage: www.elsevier.com/locate/appet 0195-6663/$ – see front matter ß 2011 Elsevier Ltd. All rights reserved. doi:10.1016/j.appet.2011.02.017
Transcript of Individual astringency responsiveness affects the acceptance of phenol-rich foods
Appetite 56 (2011) 633–642
Contents lists available at ScienceDirect
Appetite
journal homepage: www.e lsev ier .com/ locate /appet
Research report
Individual astringency responsiveness affects the acceptance of phenol-rich foods
Caterina Dinnella a, Annamaria Recchia a, Hely Tuorila b, Erminio Monteleone a,*a Department of Agricultural Biotechnology, University of Florence, Via Donizetti 6, Firenze, 51144, Italyb Department of Food and Environment Sciences, University of Helsinki, Finland
A R T I C L E I N F O
Article history:
Received 27 September 2010
Received in revised form 15 February 2011
Accepted 18 February 2011
Available online 25 February 2011
Keywords:
Sensory evaluation
Salivary characteristics
Food preference
Food familiarity
Food choice
A B S T R A C T
Sensory responses greatly vary between individuals, and individual sensory experiences influence eating
behaviour. Three groups responding differently to phenolic astringent stimuli (Low Responding, LR,
n = 20, Medium Responding, MR, n = 37 and High Responding, HR, n = 20) were identified from a
population of 77 subjects, based on the maintenance vs fluctuation of salivary characteristics after
repeated stimulation of the masticatory and taste/somatosensory systems. The effect of LR, MR and HR
status on perceived astringency and liking for phenol-containing apple, grape and carrot juices spiked
with increasing tannic acid (TA) concentrations was examined. TA induced a greater increase of
perceived astringency in HR, compared to MR and LR subjects. A decrease in liking for spiked juices was
found in HR and to a lesser extent in MR and LR subjects. No significant differences were found
comparing MR and LR groups for both astringency intensity and liking data. Liking for and familiarity
with 37 food items, as well as preference for 14 phenol-rich foods and beverages, each paired with a less
astringent counter-product, were also examined. An internal preference map was computed on liking
scores and product subgroups were identified. An effect of LR/HR status was found for two food
subgroups consisting of coffee without sugar, tea without sugar, raw chicory and milk chocolate, tea with
sugar, coffee with sugar. LR subjects rated the products with the most astringency higher and those with
the least astringency lower than did HR subjects. LR subjects also rated their familiarity with highly
astringent products higher than did HR subjects. Thus, individual differences related to the physiological
salivatory response to oral stimulations affect responses to astringent stimuli and can influence the
overall acceptability of phenol-rich food items.
� 2011 Elsevier Ltd. All rights reserved.
Introduction
Vegetable and fruit consumption decreases the risk of chronicdiseases and several dietary guidelines (Dietary Guidelines forAmericans, 2005; INRAN, 2003) encourage the consumption ofplant-derived foods and beverages. Phenolic compounds arefound in a wide variety of fruit and vegetables. Their presence inhuman food is of nutritional interest since they may beresponsible for beneficial as well as detrimental effects on health(Halliwell, Rafter, & Jenner, 2005). Phenolic compounds can bedivided into fifteen classes depending on their chemical structure.Flavonoids constitute the largest and most diverse family ofphenolic compounds. Their strong radical scavenging activityprobably accounts for their role in preventing diseases related tooxidative stress, such as coronary heart disease and various formsof cancer (Arts & Hollman, 2005). Tannins constitute a complexgroup of flavonoid-based polymers capable of binding andeventually precipitating proteins. The antioxidant activity hasbeen demonstrated for tannins, but harmful effects have also been
* Corresponding author.
E-mail address: [email protected] (E. Monteleone).
0195-6663/$ – see front matter � 2011 Elsevier Ltd. All rights reserved.
doi:10.1016/j.appet.2011.02.017
reported for these compounds, such as inhibition of digestiveenzymes, lowering of dietary protein digestibility, depressedgrowth in rats, altered food consumption, and acute hepatotoxic-ity (Mueller-Harvey, 2006).
Oral sensations experienced when eating involve manydifferent sensory pathways: taste (salty, sweet, sour, bitter andumami), retronasal olfaction and somatosensory pathways re-sponsible for temperature, mouthfeel/texture and chemesthetic(burning, cooling and astringent) sensations. Food productselection and consumption strongly depends on the product’ssensory properties and on the intensity of experienced sensations(Duffy, 2007; Mattes, 2006).
Sensory properties of flavonoids and tannins can be summa-rized by two main descriptors: bitter and astringent, both elicitingnegative consumer reactions when perceived at high intensities(Jaeger, Axten, & Wohlers, 2009; Lesschaeve & Noble, 2005).Human beings long sensitized to the bitter taste of plant toxinsconsider excessive bitterness the principal reason for foodrejection (Drewnowski & Gomez-Carneros, 2000). The tactilesensation of astringency on the human palate has been defined as acomplex group of sensations involving dryness of the oral surfaceand tightening and puckering sensations of the mucosa andmuscles around the mouth (Lee & Lawless, 1991). Astringency
C. Dinnella et al. / Appetite 56 (2011) 633–642634
arises from the interaction of dietary tannins with lubricatingsalivary proteins (Dinnella, Recchia, Vincenzi, Tuorila, & Monte-leone, 2010; Nayak & Carpenter, 2008). It has been proposed thatthe sensation of astringency represents a warning cue todiscourage animals from ingesting foods too high in tannins andthus protecting them from their potential harmful anti-nutritionaleffects (Shimada, 2006).
Responsiveness to tastes varies across individuals dependingon several factors such as gender, age, hormonal status andmedications (Duffy, 2007; Pangborn, 1981). Genetic factors canexplain individual differences in psychophysical responses tooral sensations (Reed, Tanaka, & McDaniel, 2006). Geneticstudies of the sense of taste have revealed the existence ofmultiple receptor genes for bitterness induced by thioureacompounds (phenylthiocarbamide – PTC, 6-n-propylthiouracil –PROP) (Reed, Nanthakumar, North, Bell, & Bartoshuk, 1999).PTC/PROP taster status may influence ingestive behaviours byaffecting the acquisition of food preference (Keller, Steinman,Nurse, & Tepper, 2002) and liking for bitter vegetable foods andbeverages (Dinehart, Hayes, Bartoshuk, Lanier, & Duffy, 2006;Drewnowski & Gomez-Carneros, 2000; Duffy & Bartoshuk, 2000;Kaminski, Henderson, & Drewnowski, 2000; Yeomans, Prescott,& Gould, 2009). Inherited sweet taste preference has beendemonstrated (Keskitalo et al., 2007). Based on the relationbetween perceived sweetness intensity and hedonic response,subgroups of sweet likers and dislikers have been identified(Looy & Weingarten, 1991; Pangborn, 1970). The ability toperceive the thermal taste (a phantom taste evoked by tonguethermal stimulation) (Cruz & Green, 2000) was associated withrelatively higher responsiveness to 5 prototypical taste stimuli(Green & George, 2004) and it is considered as a further markerof individual sensitivity variation to oral sensations.
Individual variation of saliva characteristics modulates thesensitivity to astringency induced by phenolic stimuli (Condelli,Dinnella, Cerone, Monteleone, & Bertuccioli, 2006; Fischer,Boulton, & Noble, 1994; Horne, Hayes, & Lawless, 2002). Twogroups of subjects, Low Responding (LR) and High Responding(HR) to phenolic astringent stimuli have been identified basedon their ability to maintain constant salivary characteristicsafter repeated oral stimulation (Dinnella, Recchia, Fia, Bertuc-cioli, & Monteleone, 2009). A nearly constant salivary proteinconcentration and profile after both masticatory and taste/somatosensory system stimulation characterized the group withlower sensitivity to astringency (LR), while a strong depletion ofglycosylated salivary proteins was found in the more sensitivegroup (HR) (Dinnella et al., 2010). Physiological differencesin protein secretory pathways as well as morphologicalcharacteristics of the parotid glands can explain thedifferent behaviour of LR and HR groups after protracted oralstimulation.
The pronounced variation in sensory perceptions, due to thephysiologically different salivary responses, may lead to differenthedonic responses during exposures to foods and beveragescontaining phenolic compounds. The present work thereforeinvestigates the effect of LR/HR status on the acceptance ofphenol-containing foods.
Materials and methods
Overview
The experimental plan consisted of the following stages:
1. D
evelopment of a questionnaire tracking the choice of,preference for, and familiarity with phenol-rich food items.2. D
evelopment of fruit and vegetable stimuli with increasingphenolic content providing different levels of perceivedastringency within a similar intensity range.3. S
election of LR (n = 20), MR (n = 37) and HR (n = 20) groups froma population of 77 subjects based on salivary proteincharacteristics after repeated oral stimulation.4. E
valuation of LR, MR and HR status effect on liking for juices atdifferent astringency levels.5. T
raining to recognize sourness, bitterness and astringencyintensities, and their subsequent ratings in juice samples.Subjects
Seventy-seven subjects, 33 males and 44 females, aged from 21to 33 years were recruited from the University of Florencestudents. The subjects had no history of disorders in oralperception. They were paid for their participation in the study.The Ethic Committee of the Department of Agricultural Biotech-nology, University of Florence approved the protocol. Writteninformed consent was obtained from each subject after thedescription of the experiment.
Collection of liking and perceived intensity data
Stimuli
Three branded products purchased at a local retailer were used:apple (A), grape (G) and carrot (C) juices. Tannic acid (TA, Sigma–Aldrich) was used to modify the phenolic content of the juices.Three levels of TA concentration were considered for each juice(TA0, TA1, TA2). TA0 refers to pure juices; TA1 to 1.0 g/l TA in appleand carrot juices, and 1.5 g/l TA in grape juices, TA2 refers to 1.5 g/lin apple and carrot juices and to 2.0 g/l TA in grape juice. TAconcentrations were chosen in pilot tests by experiencedlaboratory personnel to provide three approximately similarastringency levels for all juices.
Collection of liking data
Two sample sets were prepared. The first set was composed ofthe three different pure juices (TA0). The order of the juicepresentation was randomized across subjects. The second set wascomposed of three subsets each consisting of the same juice at twoTA levels (TA1 and TA2; 6 samples in total). The order of the subsetpresentation was randomized across subjects within and betweenpairs. Stimuli (15 ml each) were presented at room temperature in35 ml-plastic cups labelled with three-digit code numbers.Subjects were asked to hold the whole sample in their mouthfor 10 s, spit it out, wait for a further 20 s and rate the overall likingon a 9-point hedonic scale (Peryam & Pilgrim, 1957). This fullyanchored 9-point category scale ranges from 1 (‘‘dislike extreme-ly’’) to 9 (‘‘like extremely’’), with a neutral point at 5 (‘‘neither likenor dislike’’). After each sample, subjects rinsed their mouths withdistilled water for 40 s, had some plain crackers for 40 s and finallyrinsed their mouths with water for a further 40 s. Between subsets,subjects rinsed for 60 s. Evaluations were performed in individualbooths under white lights.
Collection of perceived intensity data
Prior to intensity evaluations, subjects were trained torecognize and rate the perceived intensity of sourness, bitternessand astringency using the following standard (Sigma–Aldrich)aqueous solutions: citric acid: 0.25, 0.38, 0.50 g/l (sour); quininemonohydrochloride dihydrate: 0.025, 0.037, 0.050 g/l (bitter);aluminium potassium sulphate: 0.3, 0.6, 0.9 g/l (astringent).During training sessions the subjects rated the perceived intensi-ties on a Labelled Magnitude Scale (LMS, 100 mm line) (Green,
C. Dinnella et al. / Appetite 56 (2011) 633–642 635
Shaffer, & Gilmore, 1993), a quasi-logarithmic scale with thebottom labelled as ‘‘barely detectable’’ (1.4 mm) and the top as‘‘strongest imaginable oral sensations, including pain’’ (100 mm).Intermediate labels include ‘‘weak’’ (6.1 mm), ‘‘moderate’’(17.2 mm), ‘‘strong’’ (35.4 mm) and ‘‘very strong’’ (53.3 mm) oralsensations. Instructions for using the scale were given according toGreen et al. (1993). Subjects participated in a total of four trainingsessions.
Nine samples (3 juices � 3 TA levels) were evaluated forsourness, bitterness and astringency. Evaluations were performedon two sample sets of 5 and 4 juices each, with a 15 min breakbetween them. Sample presentation was evenly balanced tocontrol for both order and carry over effects on sensory responses.The order of attribute evaluation was balanced to minimize apossible ‘‘proximity’’ effect. The evaluation and rinsing proceduredescribed above for hedonic evaluation was used. The perceivedintensity of each sensation was rated on the LMS. To eliminatevisual clues, samples were evaluated in individual booths underred lights.
Collection of saliva samples and total protein content assessment
The saliva was collected as described by Dinnella et al.(2009). Participants were instructed to avoid foods andbeverages with high phenolic content for at least 8 h beforethe session started. A list of such products was provided.
Table 1Checklist of 37 food items. Average phenol content refers to fresh (FW) or dry weight (DW
astringent).
Product
Astringent Phenol content
Red wine Young
Aged
0.7 mg/ml tannins
1.0 mg/ml tannins
Wine White
Red
0.25 mg/ml
1.7 mg/ml
Chocolate 70% cocoa
95% cocoa
–
–
Chocolate Milk
Dark
52.2 mmol/g DW
126 mmol/g DW
Fruit Extremely ripe
Not very ripe
0.02–1.8 mg/g FW
0.03–6.8 mg/g FW
Banana Extremely ripe
Not very ripe
0.2 mg/g FW
220 mg/g FW
Pear Extremely ripe
Not very ripe
2.6 mg/g DW
4.7 mg/g DW
Tea Sweetened
Unsweetened
0.4 mg/ml
Coffee Sweetened
Unsweetened
50 mg/ml
Coffee With milk
Black
50 mg/ml
Vegetables Cooked
Raw
1.7 mg/g FW
3.0 mg/g FW
Artichoke Cooked
Raw
–
Chicory Cooked
Raw
–
Radicchio Cooked
Raw
–
Bitter and astringent
Apple juice 0.83 mg/ml
Grape juice 0.5 mg/ml
Carrot juice 0.3 mg/ml
Bitter
Endive 1.3 mg/kg FW
Grapefruit 0.5 mg /ml
Bilberry juice 0.12 mg/ml
Soy milk 2.5 mg/g DW
Tonic water –
Sanbitter –
Subjects were also instructed to refrain from smoking, eating,and drinking for 2 h before the session. The session (60 min)started at 9.00 am. Subjects received tap water to rinse theirmouths, then they were instructed to mechanically evoke salivaby chewing Parafilm (3 cm � 3 cm) for a total collection time of15 min (first saliva collection, S1). After a 30 min break, subjectsreceived an aqueous solution of 3.0 g/l TA (15 ml) to induce thereflex parotid gland salivation. They rinsed their mouths withwater and evoked saliva by chewing Parafilm for a further15 min (second saliva collection, S2). Immediately after salivacollection, subjects received an aqueous solution of 1.4 g/l TA(15 ml) and rated the perceived astringency, bitterness andsourness on the LMS. The order of attribute evaluation wasbalanced in order to minimize a possible ‘‘proximity’’ effect. Thesame sample evaluation and rinsing procedure described abovefor hedonic evaluation was used. Evaluations were performed inindividual booths under red lights.
Saliva samples were put in an ultrasonic water bath at themaximum output for 5 min at 37 8C. The pellet eventually stillpresent in the salivary sample was discarded while the clear upperphase was recovered and analysed for the total protein content(SPs) by Biuret method (Kallithraka, Bakker, Clifford, & Vallis,2001). The effect of stimulation on saliva protein concentrationwas expressed in terms of SPs D-value, computed as the arithmeticdifference between the protein concentrations in the S2 and S1samples (Dinnella et al., 2009).
). Potential astringency is referred to by + (moderate) or ++ (strong); – (not typically
Reference
Potential astringency
+
++
Waterhouse, 2002
+
++
Waterhouse, 2002
+
++
+
++
Vinson, Proch, & Zubik, 1999
+
++
Ayaz, Demir, Torun, Kolcuoglu, & Colak, 2008
+
++
Bugaud, Alter, Daribo, & Brillouet, 2009
+
++
Bai, Wu, Manthey, Goodner, & Baldwin, 2009
+
++
Yan, Hu, & Yao, 2009
Drewnowski & Gomez-Carneros, 2000
+
++
+
++
Narain et al., 2004
+
++
Faller & Fioalho, 2009
Kuti & Konuru, 2004
+
++
+
++
+
++
– Oszmianski, Woidilo, & Kolniak, 2009
– Belitz, Grosch, & Schieberle, 2003
– Ninfali & Bacchiocca, 2003
– Drewnowski & Gomez-Carneros, 2000
– Drewnowski & Gomez-Carneros, 2000
– Koponen et al., 2008
– Xu & Chang, 2009
–
–
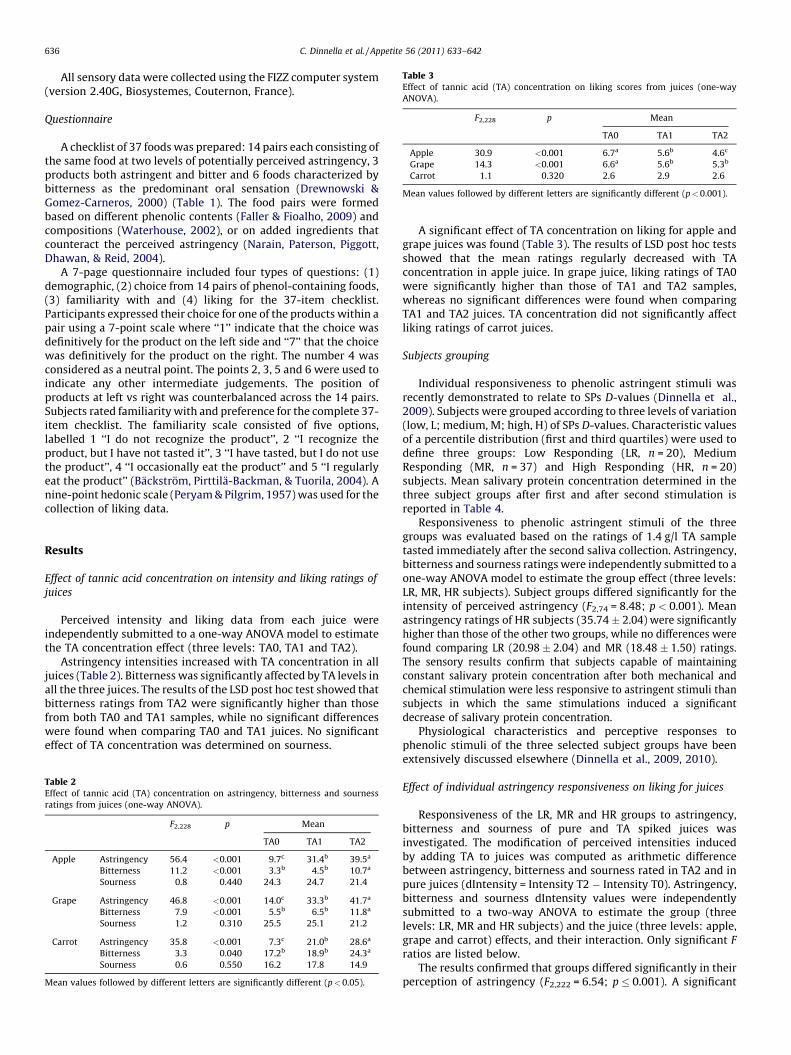
Table 3Effect of tannic acid (TA) concentration on liking scores from juices (one-way
ANOVA).
F2,228 p Mean
TA0 TA1 TA2
Apple 30.9 <0.001 6.7a 5.6b 4.6c
Grape 14.3 <0.001 6.6a 5.6b 5.3b
Carrot 1.1 0.320 2.6 2.9 2.6
Mean values followed by different letters are significantly different (p<0.001).
C. Dinnella et al. / Appetite 56 (2011) 633–642636
All sensory data were collected using the FIZZ computer system(version 2.40G, Biosystemes, Couternon, France).
Questionnaire
A checklist of 37 foods was prepared: 14 pairs each consisting ofthe same food at two levels of potentially perceived astringency, 3products both astringent and bitter and 6 foods characterized bybitterness as the predominant oral sensation (Drewnowski &Gomez-Carneros, 2000) (Table 1). The food pairs were formedbased on different phenolic contents (Faller & Fioalho, 2009) andcompositions (Waterhouse, 2002), or on added ingredients thatcounteract the perceived astringency (Narain, Paterson, Piggott,Dhawan, & Reid, 2004).
A 7-page questionnaire included four types of questions: (1)demographic, (2) choice from 14 pairs of phenol-containing foods,(3) familiarity with and (4) liking for the 37-item checklist.Participants expressed their choice for one of the products within apair using a 7-point scale where ‘‘1’’ indicate that the choice wasdefinitively for the product on the left side and ‘‘7’’ that the choicewas definitively for the product on the right. The number 4 wasconsidered as a neutral point. The points 2, 3, 5 and 6 were used toindicate any other intermediate judgements. The position ofproducts at left vs right was counterbalanced across the 14 pairs.Subjects rated familiarity with and preference for the complete 37-item checklist. The familiarity scale consisted of five options,labelled 1 ‘‘I do not recognize the product’’, 2 ‘‘I recognize theproduct, but I have not tasted it’’, 3 ‘‘I have tasted, but I do not usethe product’’, 4 ‘‘I occasionally eat the product’’ and 5 ‘‘I regularlyeat the product’’ (Backstrom, Pirttila-Backman, & Tuorila, 2004). Anine-point hedonic scale (Peryam & Pilgrim, 1957) was used for thecollection of liking data.
Results
Effect of tannic acid concentration on intensity and liking ratings of
juices
Perceived intensity and liking data from each juice wereindependently submitted to a one-way ANOVA model to estimatethe TA concentration effect (three levels: TA0, TA1 and TA2).
Astringency intensities increased with TA concentration in alljuices (Table 2). Bitterness was significantly affected by TA levels inall the three juices. The results of the LSD post hoc test showed thatbitterness ratings from TA2 were significantly higher than thosefrom both TA0 and TA1 samples, while no significant differenceswere found when comparing TA0 and TA1 juices. No significanteffect of TA concentration was determined on sourness.
Table 2Effect of tannic acid (TA) concentration on astringency, bitterness and sourness
ratings from juices (one-way ANOVA).
F2,228 p Mean
TA0 TA1 TA2
Apple Astringency 56.4 <0.001 9.7c 31.4b 39.5a
Bitterness 11.2 <0.001 3.3b 4.5b 10.7a
Sourness 0.8 0.440 24.3 24.7 21.4
Grape Astringency 46.8 <0.001 14.0c 33.3b 41.7a
Bitterness 7.9 <0.001 5.5b 6.5b 11.8a
Sourness 1.2 0.310 25.5 25.1 21.2
Carrot Astringency 35.8 <0.001 7.3c 21.0b 28.6a
Bitterness 3.3 0.040 17.2b 18.9b 24.3a
Sourness 0.6 0.550 16.2 17.8 14.9
Mean values followed by different letters are significantly different (p<0.05).
A significant effect of TA concentration on liking for apple andgrape juices was found (Table 3). The results of LSD post hoc testsshowed that the mean ratings regularly decreased with TAconcentration in apple juice. In grape juice, liking ratings of TA0were significantly higher than those of TA1 and TA2 samples,whereas no significant differences were found when comparingTA1 and TA2 juices. TA concentration did not significantly affectliking ratings of carrot juices.
Subjects grouping
Individual responsiveness to phenolic astringent stimuli wasrecently demonstrated to relate to SPs D-values (Dinnella et al.,2009). Subjects were grouped according to three levels of variation(low, L; medium, M; high, H) of SPs D-values. Characteristic valuesof a percentile distribution (first and third quartiles) were used todefine three groups: Low Responding (LR, n = 20), MediumResponding (MR, n = 37) and High Responding (HR, n = 20)subjects. Mean salivary protein concentration determined in thethree subject groups after first and after second stimulation isreported in Table 4.
Responsiveness to phenolic astringent stimuli of the threegroups was evaluated based on the ratings of 1.4 g/l TA sampletasted immediately after the second saliva collection. Astringency,bitterness and sourness ratings were independently submitted to aone-way ANOVA model to estimate the group effect (three levels:LR, MR, HR subjects). Subject groups differed significantly for theintensity of perceived astringency (F2,74 = 8.48; p < 0.001). Meanastringency ratings of HR subjects (35.74 � 2.04) were significantlyhigher than those of the other two groups, while no differences werefound comparing LR (20.98 � 2.04) and MR (18.48 � 1.50) ratings.The sensory results confirm that subjects capable of maintainingconstant salivary protein concentration after both mechanical andchemical stimulation were less responsive to astringent stimuli thansubjects in which the same stimulations induced a significantdecrease of salivary protein concentration.
Physiological characteristics and perceptive responses tophenolic stimuli of the three selected subject groups have beenextensively discussed elsewhere (Dinnella et al., 2009, 2010).
Effect of individual astringency responsiveness on liking for juices
Responsiveness of the LR, MR and HR groups to astringency,bitterness and sourness of pure and TA spiked juices wasinvestigated. The modification of perceived intensities inducedby adding TA to juices was computed as arithmetic differencebetween astringency, bitterness and sourness rated in TA2 and inpure juices (dIntensity = Intensity T2 � Intensity T0). Astringency,bitterness and sourness dIntensity values were independentlysubmitted to a two-way ANOVA to estimate the group (threelevels: LR, MR and HR subjects) and the juice (three levels: apple,grape and carrot) effects, and their interaction. Only significant F
ratios are listed below.The results confirmed that groups differed significantly in their
perception of astringency (F2,222 = 6.54; p � 0.001). A significant
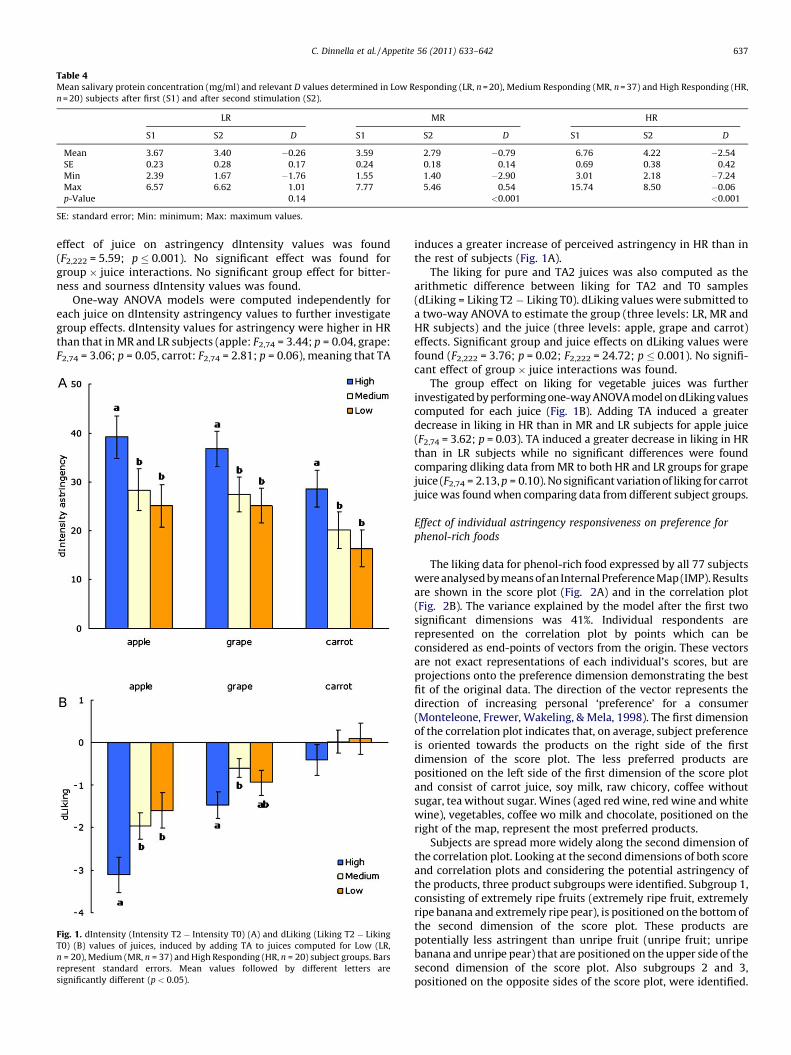
Table 4Mean salivary protein concentration (mg/ml) and relevant D values determined in Low Responding (LR, n = 20), Medium Responding (MR, n = 37) and High Responding (HR,
n = 20) subjects after first (S1) and after second stimulation (S2).
LR MR HR
S1 S2 D S1 S2 D S1 S2 D
Mean 3.67 3.40 �0.26 3.59 2.79 �0.79 6.76 4.22 �2.54
SE 0.23 0.28 0.17 0.24 0.18 0.14 0.69 0.38 0.42
Min 2.39 1.67 �1.76 1.55 1.40 �2.90 3.01 2.18 �7.24
Max 6.57 6.62 1.01 7.77 5.46 0.54 15.74 8.50 �0.06
p-Value 0.14 <0.001 <0.001
SE: standard error; Min: minimum; Max: maximum values.
C. Dinnella et al. / Appetite 56 (2011) 633–642 637
effect of juice on astringency dIntensity values was found(F2,222 = 5.59; p � 0.001). No significant effect was found forgroup � juice interactions. No significant group effect for bitter-ness and sourness dIntensity values was found.
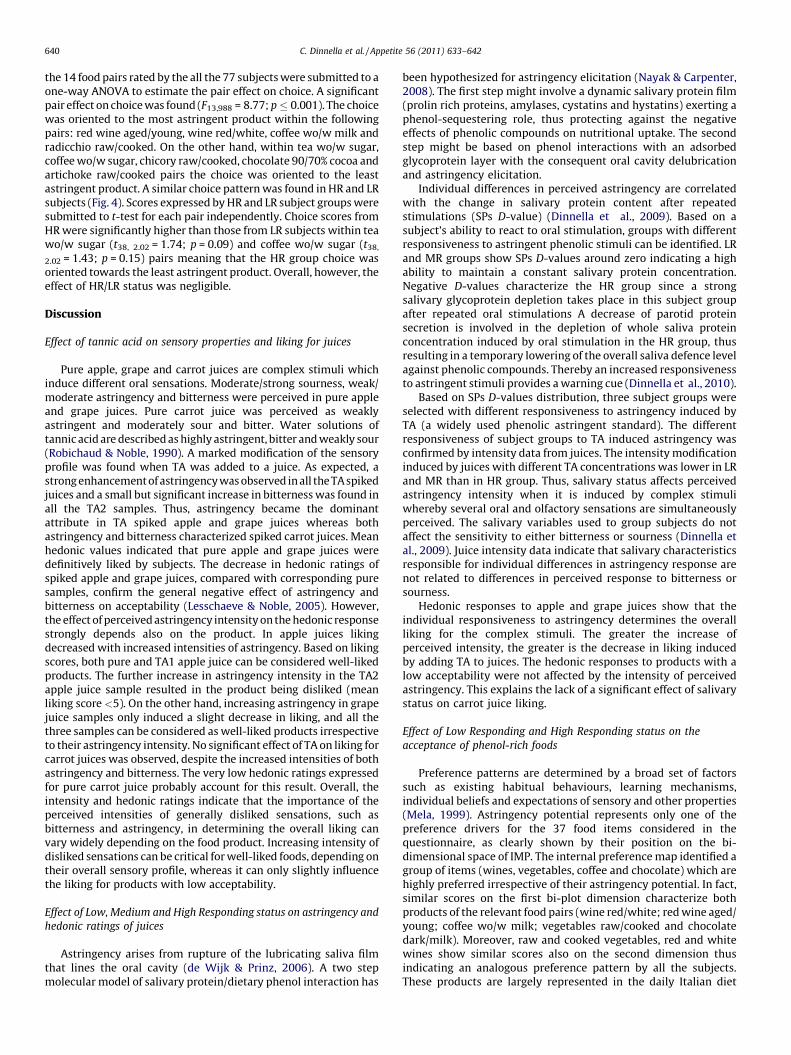
One-way ANOVA models were computed independently foreach juice on dIntensity astringency values to further investigategroup effects. dIntensity values for astringency were higher in HRthan that in MR and LR subjects (apple: F2,74 = 3.44; p = 0.04, grape:F2,74 = 3.06; p = 0.05, carrot: F2,74 = 2.81; p = 0.06), meaning that TA[()TD$FIG]
Fig. 1. dIntensity (Intensity T2 � Intensity T0) (A) and dLiking (Liking T2 � Liking
T0) (B) values of juices, induced by adding TA to juices computed for Low (LR,
n = 20), Medium (MR, n = 37) and High Responding (HR, n = 20) subject groups. Bars
represent standard errors. Mean values followed by different letters are
significantly different (p < 0.05).
induces a greater increase of perceived astringency in HR than inthe rest of subjects (Fig. 1A).
The liking for pure and TA2 juices was also computed as thearithmetic difference between liking for TA2 and T0 samples(dLiking = Liking T2 � Liking T0). dLiking values were submitted toa two-way ANOVA to estimate the group (three levels: LR, MR andHR subjects) and the juice (three levels: apple, grape and carrot)effects. Significant group and juice effects on dLiking values werefound (F2,222 = 3.76; p = 0.02; F2,222 = 24.72; p � 0.001). No signifi-cant effect of group � juice interactions was found.
The group effect on liking for vegetable juices was furtherinvestigated by performing one-way ANOVA model on dLiking valuescomputed for each juice (Fig. 1B). Adding TA induced a greaterdecrease in liking in HR than in MR and LR subjects for apple juice(F2,74 = 3.62; p = 0.03). TA induced a greater decrease in liking in HRthan in LR subjects while no significant differences were foundcomparing dliking data from MR to both HR and LR groups for grapejuice (F2,74 = 2.13, p = 0.10). No significant variation of liking for carrotjuice was found when comparing data from different subject groups.
Effect of individual astringency responsiveness on preference for
phenol-rich foods
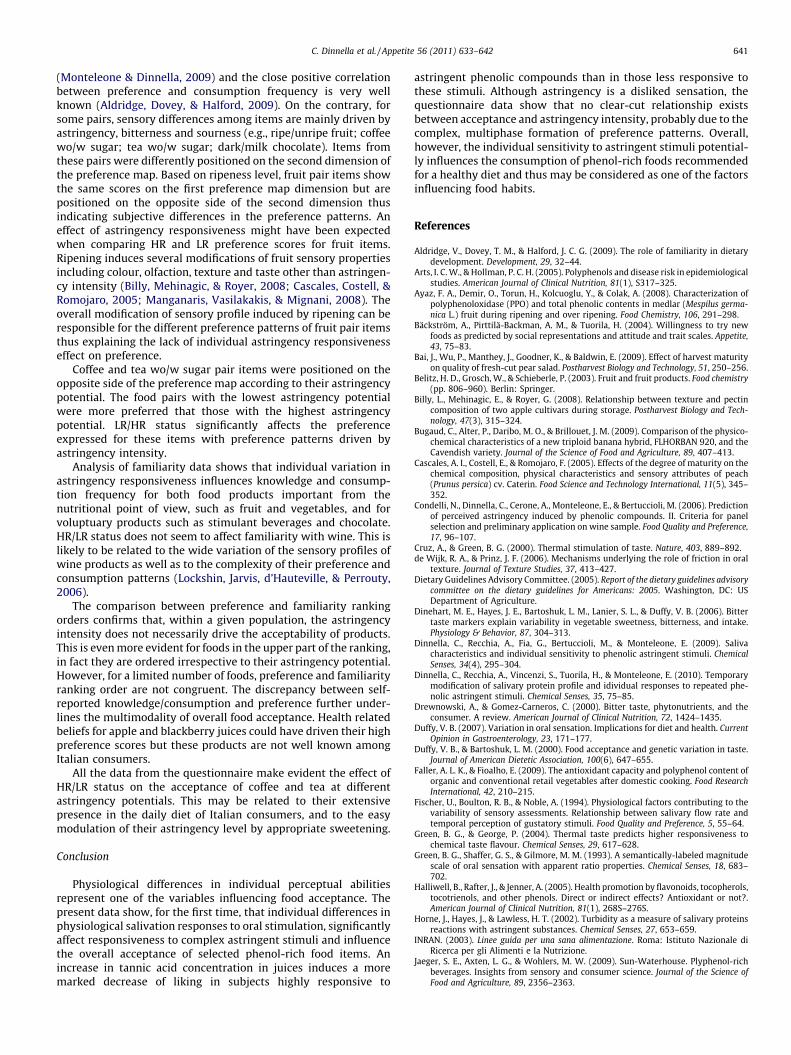
The liking data for phenol-rich food expressed by all 77 subjectswere analysed by means of an Internal Preference Map (IMP). Resultsare shown in the score plot (Fig. 2A) and in the correlation plot(Fig. 2B). The variance explained by the model after the first twosignificant dimensions was 41%. Individual respondents arerepresented on the correlation plot by points which can beconsidered as end-points of vectors from the origin. These vectorsare not exact representations of each individual’s scores, but areprojections onto the preference dimension demonstrating the bestfit of the original data. The direction of the vector represents thedirection of increasing personal ‘preference’ for a consumer(Monteleone, Frewer, Wakeling, & Mela, 1998). The first dimensionof the correlation plot indicates that, on average, subject preferenceis oriented towards the products on the right side of the firstdimension of the score plot. The less preferred products arepositioned on the left side of the first dimension of the score plotand consist of carrot juice, soy milk, raw chicory, coffee withoutsugar, tea without sugar. Wines (aged red wine, red wine and whitewine), vegetables, coffee wo milk and chocolate, positioned on theright of the map, represent the most preferred products.
Subjects are spread more widely along the second dimension ofthe correlation plot. Looking at the second dimensions of both scoreand correlation plots and considering the potential astringency ofthe products, three product subgroups were identified. Subgroup 1,consisting of extremely ripe fruits (extremely ripe fruit, extremelyripe banana and extremely ripe pear), is positioned on the bottom ofthe second dimension of the score plot. These products arepotentially less astringent than unripe fruit (unripe fruit; unripebanana and unripe pear) that are positioned on the upper side of thesecond dimension of the score plot. Also subgroups 2 and 3,positioned on the opposite sides of the score plot, were identified.
[()TD$FIG]
Fig. 2. Internal preference map computed on preference scores for 37 food products from 77 subjects (A) and subject score plot (B).
C. Dinnella et al. / Appetite 56 (2011) 633–642638
Subgroup 2 (coffee wo sugar, tea wo sugar and raw chicory) ispositioned on the upper left of the score plot. These products arecharacterized by a high potential astringency. Subgroup 3 (milkchocolate, tea w sugar and coffee w sugar) is positioned on the lowerright of the bi-dimensional product space. These products arecharacterized by a low potential astringency.
Sensory data from both TA model solution and juice evaluationclearly showed that the perceptions of the MR group are notsignificantly different from those of LR group. Thus, only the twoextreme subject groups (HR and LR) were considered inquestionnaire data analysis.
The effect of HR and LR status on food subgroup preferencewas investigated. A 2-way ANOVA model was performed on
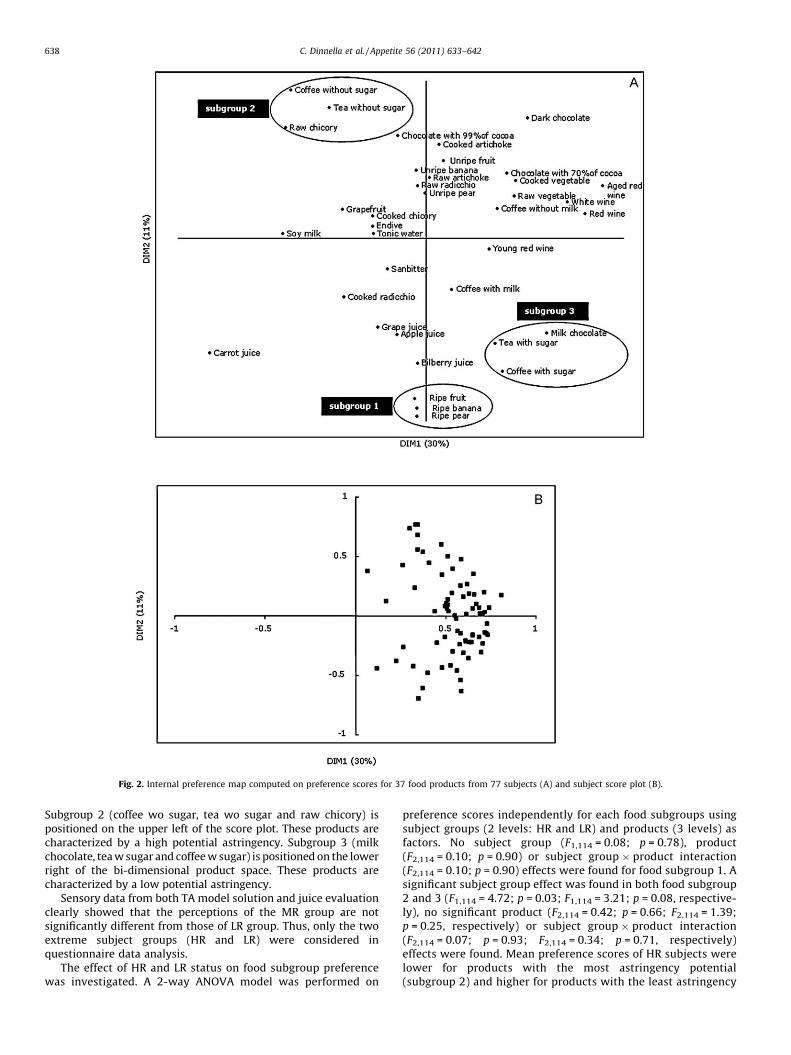
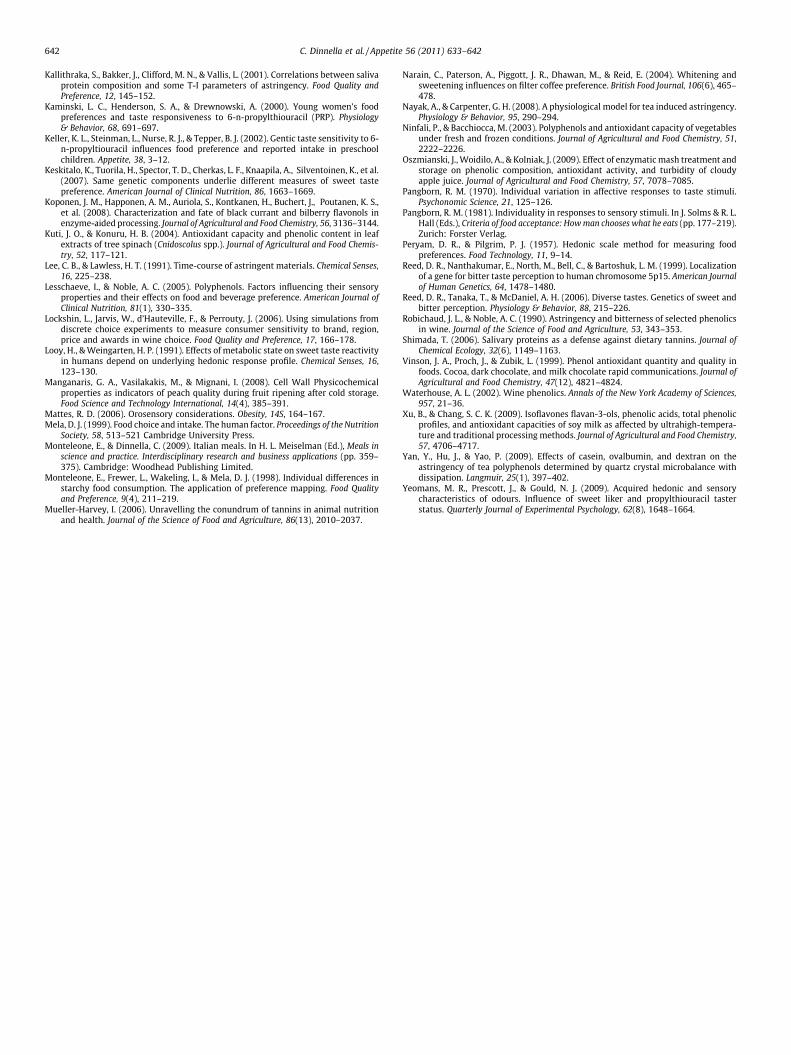
preference scores independently for each food subgroups usingsubject groups (2 levels: HR and LR) and products (3 levels) asfactors. No subject group (F1,114 = 0.08; p = 0.78), product(F2,114 = 0.10; p = 0.90) or subject group � product interaction(F2,114 = 0.10; p = 0.90) effects were found for food subgroup 1. Asignificant subject group effect was found in both food subgroup2 and 3 (F1,114 = 4.72; p = 0.03; F1,114 = 3.21; p = 0.08, respective-ly), no significant product (F2,114 = 0.42; p = 0.66; F2,114 = 1.39;p = 0.25, respectively) or subject group � product interaction(F2,114 = 0.07; p = 0.93; F2,114 = 0.34; p = 0.71, respectively)effects were found. Mean preference scores of HR subjects werelower for products with the most astringency potential(subgroup 2) and higher for products with the least astringency

[()TD$FIG]
Fig. 3. Preference scores for food subgroups rated by Low Responding (LR, n = 20)
and High Responding (HR, n = 20) subject groups. Subgroup 1 (low astringency
potential): extremely ripe fruit, extremely ripe banana, extremely ripe pear;
subgroup 2 (high astringency potential): coffee wo sugar, tea wo sugar, raw chicory;
subgroup 3 (low astringency potential): milk chocolate, tea w sugar, coffee w sugar.
Bars represent standard errors. *p � 0.10.
Table 5Pearson chi-square (x2) computed on the number of subjects familiar (F) and
unfamiliar (UF) with five astringent food groups identified in High Responding and
Low Responding subject groups.
Astringent food group HR LR x2 p
F UF F UF
Coffee/tea
Tea wo sugar 2 18 6 14
Coffee wo sugar 3 17 6 14
Black coffee 13 7 14 6
Tot 18 42 26 34 2.30 0.13
Chocolate
Dark chocolate 4 16 8 12
Chocolate 99%cocoa 1 19 3 17
Chocolate 70%cocoa 2 18 9 11
Tot 7 53 20 40 8.08 0.00
Vegetables
Raw artichoke 2 18 4 16
Raw radicchio 4 16 7 13
Raw chicory 0 20 1 19
Raw vegetables 11 9 14 6
Tot 17 63 26 54 2.60 0.10
Fruit
Unripe banana 3 17 5 15
Unripe pear 3 17 3 17
Unripe fruit 4 16 9 11
Tot 10 50 17 43 2.30 0.12
Wine
Aged red wine 8 12 6 14
Red wine 13 7 10 10
Tot 21 19 16 24 1.23 0.26
F: self-reported familiarity score = 5; UF: self-reported familiarity score�4.
[()TD$FIG]
Fig. 4. Choice scores for food pairs rated by Low Responding (LR, n = 20) and High
Responding (HR, n = 20) subject groups. Scores <4 indicate choice for the most
astringent product in the pair. Scores >4 indicate choice for the least astringent
product in the pair. Bars represent standard errors. *p � 0.15.
C. Dinnella et al. / Appetite 56 (2011) 633–642 639
potential (subgroup 3) compared with those of the LR subjects(Fig. 3).
Relationship between preference and familiarity
Scores on the first dimension of the preference map and ranksum of familiarity scores were ordered by ranking for the 77subjects. A significant linear correlation was found between thesedata sets (r = 0.86; p � 0.001). The scores ranking order wascongruent with the familiarity ranking order particularly for themost preferred food items. However, this relationship was notfound in a few cases. Coffee without sugar, tea without sugar,cooked radicchio and extremely ripe fruit resulted more familiarthan preferred, whereas grape, apple and bilberry juices were lessfamiliar than preferred. Preference and familiarity ranks show thatseveral food items, belonging to the same pair, were rankedregardless of their astringency potential. Coffee w/wo sugar andtea w/wo sugar were ranked according to their potentialastringency; the most astringent being much less preferred andfamiliar than the least astringent product.
Astringency responsiveness and familiarity with phenol-rich foods
The effect of individual responsiveness to astringent stimuli onfamiliarity was investigated by comparing the scores expressed forthe most astringent products of the 14 food pair items by HR and LRsubjects. Kruskal–Wallis one-way ANOVA indicates that LRsubjects tended to rate familiarity with the most astringentproducts of the 14 food pair items higher than did HR subjects(x2 = 2.85; p = 0.09, rank sum 81,604 and 75,476, respectively). Theeffect of HR/LR status on familiarity was further investigated byconsidering the number of regular consumers of highly astringentproducts. The self-reported familiarity score of 5 separated regularconsumers (F) from the rest of subjects (UF, self reportedfamiliarity score �4). Five homogeneous astringent food sub-groups were considered (coffee/tea: coffee wo sugar, tea wo sugar,coffee wo milk; chocolate: dark, 70% and 90% cocoa; vegetables:raw artichoke, raw radicchio, raw chicory, raw vegetables; fruit:not perfectly ripe pear, not perfectly ripe banana, not perfectly ripefruit; wine: aged red and red). Chi-square was computed on thenumber of F and UF subjects found in HR and LR groupsindependently for each food subgroup (Table 5). The number ofregular consumers of highly astringent coffee/tea, chocolate,vegetables and fruit tend to be greater in the LR than in the HRgroup. Individual responsiveness to astringent stimuli was notassociated with the number of regular consumers of red wine.
Astringency responsiveness and the choice of phenol-rich foods
Before data analysis, pairs were ordered so that ratings less than 4always indicate a choice for the product with the most astringencypotential while ratings higher than 4 indicate a choice for theproduct with the least potential astringency. Mean choice scores for
C. Dinnella et al. / Appetite 56 (2011) 633–642640
the 14 food pairs rated by the all the 77 subjects were submitted to aone-way ANOVA to estimate the pair effect on choice. A significantpair effect on choice was found (F13,988 = 8.77; p� 0.001). The choicewas oriented to the most astringent product within the followingpairs: red wine aged/young, wine red/white, coffee wo/w milk andradicchio raw/cooked. On the other hand, within tea wo/w sugar,coffee wo/w sugar, chicory raw/cooked, chocolate 90/70% cocoa andartichoke raw/cooked pairs the choice was oriented to the leastastringent product. A similar choice pattern was found in HR and LRsubjects (Fig. 4). Scores expressed by HR and LR subject groups weresubmitted to t-test for each pair independently. Choice scores fromHR were significantly higher than those from LR subjects within teawo/w sugar (t38, 2.02 = 1.74; p = 0.09) and coffee wo/w sugar (t38,
2.02 = 1.43; p = 0.15) pairs meaning that the HR group choice wasoriented towards the least astringent product. Overall, however, theeffect of HR/LR status was negligible.
Discussion
Effect of tannic acid on sensory properties and liking for juices
Pure apple, grape and carrot juices are complex stimuli whichinduce different oral sensations. Moderate/strong sourness, weak/moderate astringency and bitterness were perceived in pure appleand grape juices. Pure carrot juice was perceived as weaklyastringent and moderately sour and bitter. Water solutions oftannic acid are described as highly astringent, bitter and weakly sour(Robichaud & Noble, 1990). A marked modification of the sensoryprofile was found when TA was added to a juice. As expected, astrong enhancement of astringency was observed in all the TA spikedjuices and a small but significant increase in bitterness was found inall the TA2 samples. Thus, astringency became the dominantattribute in TA spiked apple and grape juices whereas bothastringency and bitterness characterized spiked carrot juices. Meanhedonic values indicated that pure apple and grape juices weredefinitively liked by subjects. The decrease in hedonic ratings ofspiked apple and grape juices, compared with corresponding puresamples, confirm the general negative effect of astringency andbitterness on acceptability (Lesschaeve & Noble, 2005). However,the effect of perceived astringency intensity on the hedonic responsestrongly depends also on the product. In apple juices likingdecreased with increased intensities of astringency. Based on likingscores, both pure and TA1 apple juice can be considered well-likedproducts. The further increase in astringency intensity in the TA2apple juice sample resulted in the product being disliked (meanliking score <5). On the other hand, increasing astringency in grapejuice samples only induced a slight decrease in liking, and all thethree samples can be considered as well-liked products irrespectiveto their astringency intensity. No significant effect of TA on liking forcarrot juices was observed, despite the increased intensities of bothastringency and bitterness. The very low hedonic ratings expressedfor pure carrot juice probably account for this result. Overall, theintensity and hedonic ratings indicate that the importance of theperceived intensities of generally disliked sensations, such asbitterness and astringency, in determining the overall liking canvary widely depending on the food product. Increasing intensity ofdisliked sensations can be critical for well-liked foods, depending ontheir overall sensory profile, whereas it can only slightly influencethe liking for products with low acceptability.
Effect of Low, Medium and High Responding status on astringency and
hedonic ratings of juices
Astringency arises from rupture of the lubricating saliva filmthat lines the oral cavity (de Wijk & Prinz, 2006). A two stepmolecular model of salivary protein/dietary phenol interaction has
been hypothesized for astringency elicitation (Nayak & Carpenter,2008). The first step might involve a dynamic salivary protein film(prolin rich proteins, amylases, cystatins and hystatins) exerting aphenol-sequestering role, thus protecting against the negativeeffects of phenolic compounds on nutritional uptake. The secondstep might be based on phenol interactions with an adsorbedglycoprotein layer with the consequent oral cavity delubricationand astringency elicitation.
Individual differences in perceived astringency are correlatedwith the change in salivary protein content after repeatedstimulations (SPs D-value) (Dinnella et al., 2009). Based on asubject’s ability to react to oral stimulation, groups with differentresponsiveness to astringent phenolic stimuli can be identified. LRand MR groups show SPs D-values around zero indicating a highability to maintain a constant salivary protein concentration.Negative D-values characterize the HR group since a strongsalivary glycoprotein depletion takes place in this subject groupafter repeated oral stimulations A decrease of parotid proteinsecretion is involved in the depletion of whole saliva proteinconcentration induced by oral stimulation in the HR group, thusresulting in a temporary lowering of the overall saliva defence levelagainst phenolic compounds. Thereby an increased responsivenessto astringent stimuli provides a warning cue (Dinnella et al., 2010).
Based on SPs D-values distribution, three subject groups wereselected with different responsiveness to astringency induced byTA (a widely used phenolic astringent standard). The differentresponsiveness of subject groups to TA induced astringency wasconfirmed by intensity data from juices. The intensity modificationinduced by juices with different TA concentrations was lower in LRand MR than in HR group. Thus, salivary status affects perceivedastringency intensity when it is induced by complex stimuliwhereby several oral and olfactory sensations are simultaneouslyperceived. The salivary variables used to group subjects do notaffect the sensitivity to either bitterness or sourness (Dinnella etal., 2009). Juice intensity data indicate that salivary characteristicsresponsible for individual differences in astringency response arenot related to differences in perceived response to bitterness orsourness.
Hedonic responses to apple and grape juices show that theindividual responsiveness to astringency determines the overallliking for the complex stimuli. The greater the increase ofperceived intensity, the greater is the decrease in liking inducedby adding TA to juices. The hedonic responses to products with alow acceptability were not affected by the intensity of perceivedastringency. This explains the lack of a significant effect of salivarystatus on carrot juice liking.
Effect of Low Responding and High Responding status on the
acceptance of phenol-rich foods
Preference patterns are determined by a broad set of factorssuch as existing habitual behaviours, learning mechanisms,individual beliefs and expectations of sensory and other properties(Mela, 1999). Astringency potential represents only one of thepreference drivers for the 37 food items considered in thequestionnaire, as clearly shown by their position on the bi-dimensional space of IMP. The internal preference map identified agroup of items (wines, vegetables, coffee and chocolate) which arehighly preferred irrespective of their astringency potential. In fact,similar scores on the first bi-plot dimension characterize bothproducts of the relevant food pairs (wine red/white; red wine aged/young; coffee wo/w milk; vegetables raw/cooked and chocolatedark/milk). Moreover, raw and cooked vegetables, red and whitewines show similar scores also on the second dimension thusindicating an analogous preference pattern by all the subjects.These products are largely represented in the daily Italian diet
C. Dinnella et al. / Appetite 56 (2011) 633–642 641
(Monteleone & Dinnella, 2009) and the close positive correlationbetween preference and consumption frequency is very wellknown (Aldridge, Dovey, & Halford, 2009). On the contrary, forsome pairs, sensory differences among items are mainly driven byastringency, bitterness and sourness (e.g., ripe/unripe fruit; coffeewo/w sugar; tea wo/w sugar; dark/milk chocolate). Items fromthese pairs were differently positioned on the second dimension ofthe preference map. Based on ripeness level, fruit pair items showthe same scores on the first preference map dimension but arepositioned on the opposite side of the second dimension thusindicating subjective differences in the preference patterns. Aneffect of astringency responsiveness might have been expectedwhen comparing HR and LR preference scores for fruit items.Ripening induces several modifications of fruit sensory propertiesincluding colour, olfaction, texture and taste other than astringen-cy intensity (Billy, Mehinagic, & Royer, 2008; Cascales, Costell, &Romojaro, 2005; Manganaris, Vasilakakis, & Mignani, 2008). Theoverall modification of sensory profile induced by ripening can beresponsible for the different preference patterns of fruit pair itemsthus explaining the lack of individual astringency responsivenesseffect on preference.
Coffee and tea wo/w sugar pair items were positioned on theopposite side of the preference map according to their astringencypotential. The food pairs with the lowest astringency potentialwere more preferred that those with the highest astringencypotential. LR/HR status significantly affects the preferenceexpressed for these items with preference patterns driven byastringency intensity.
Analysis of familiarity data shows that individual variation inastringency responsiveness influences knowledge and consump-tion frequency for both food products important from thenutritional point of view, such as fruit and vegetables, and forvoluptuary products such as stimulant beverages and chocolate.HR/LR status does not seem to affect familiarity with wine. This islikely to be related to the wide variation of the sensory profiles ofwine products as well as to the complexity of their preference andconsumption patterns (Lockshin, Jarvis, d’Hauteville, & Perrouty,2006).
The comparison between preference and familiarity rankingorders confirms that, within a given population, the astringencyintensity does not necessarily drive the acceptability of products.This is even more evident for foods in the upper part of the ranking,in fact they are ordered irrespective to their astringency potential.However, for a limited number of foods, preference and familiarityranking order are not congruent. The discrepancy between self-reported knowledge/consumption and preference further under-lines the multimodality of overall food acceptance. Health relatedbeliefs for apple and blackberry juices could have driven their highpreference scores but these products are not well known amongItalian consumers.
All the data from the questionnaire make evident the effect ofHR/LR status on the acceptance of coffee and tea at differentastringency potentials. This may be related to their extensivepresence in the daily diet of Italian consumers, and to the easymodulation of their astringency level by appropriate sweetening.
Conclusion
Physiological differences in individual perceptual abilitiesrepresent one of the variables influencing food acceptance. Thepresent data show, for the first time, that individual differences inphysiological salivation responses to oral stimulation, significantlyaffect responsiveness to complex astringent stimuli and influencethe overall acceptance of selected phenol-rich food items. Anincrease in tannic acid concentration in juices induces a moremarked decrease of liking in subjects highly responsive to
astringent phenolic compounds than in those less responsive tothese stimuli. Although astringency is a disliked sensation, thequestionnaire data show that no clear-cut relationship existsbetween acceptance and astringency intensity, probably due to thecomplex, multiphase formation of preference patterns. Overall,however, the individual sensitivity to astringent stimuli potential-ly influences the consumption of phenol-rich foods recommendedfor a healthy diet and thus may be considered as one of the factorsinfluencing food habits.
References
Aldridge, V., Dovey, T. M., & Halford, J. C. G. (2009). The role of familiarity in dietarydevelopment. Development, 29, 32–44.
Arts, I. C. W., & Hollman, P. C. H. (2005). Polyphenols and disease risk in epidemiologicalstudies. American Journal of Clinical Nutrition, 81(1), S317–325.
Ayaz, F. A., Demir, O., Torun, H., Kolcuoglu, Y., & Colak, A. (2008). Characterization ofpolyphenoloxidase (PPO) and total phenolic contents in medlar (Mespilus germa-nica L.) fruit during ripening and over ripening. Food Chemistry, 106, 291–298.
Backstrom, A., Pirttila-Backman, A. M., & Tuorila, H. (2004). Willingness to try newfoods as predicted by social representations and attitude and trait scales. Appetite,43, 75–83.
Bai, J., Wu, P., Manthey, J., Goodner, K., & Baldwin, E. (2009). Effect of harvest maturityon quality of fresh-cut pear salad. Postharvest Biology and Technology, 51, 250–256.
Belitz, H. D., Grosch, W., & Schieberle, P. (2003). Fruit and fruit products. Food chemistry(pp. 806–960). Berlin: Springer.
Billy, L., Mehinagic, E., & Royer, G. (2008). Relationship between texture and pectincomposition of two apple cultivars during storage. Postharvest Biology and Tech-nology, 47(3), 315–324.
Bugaud, C., Alter, P., Daribo, M. O., & Brillouet, J. M. (2009). Comparison of the physico-chemical characteristics of a new triploid banana hybrid, FLHORBAN 920, and theCavendish variety. Journal of the Science of Food and Agriculture, 89, 407–413.
Cascales, A. I., Costell, E., & Romojaro, F. (2005). Effects of the degree of maturity on thechemical composition, physical characteristics and sensory attributes of peach(Prunus persica) cv. Caterin. Food Science and Technology International, 11(5), 345–352.
Condelli, N., Dinnella, C., Cerone, A., Monteleone, E., & Bertuccioli, M. (2006). Predictionof perceived astringency induced by phenolic compounds. II. Criteria for panelselection and preliminary application on wine sample. Food Quality and Preference,17, 96–107.
Cruz, A., & Green, B. G. (2000). Thermal stimulation of taste. Nature, 403, 889–892.de Wijk, R. A., & Prinz, J. F. (2006). Mechanisms underlying the role of friction in oral
texture. Journal of Texture Studies, 37, 413–427.Dietary Guidelines Advisory Committee. (2005). Report of the dietary guidelines advisory
committee on the dietary guidelines for Americans: 2005. Washington, DC: USDepartment of Agriculture.
Dinehart, M. E., Hayes, J. E., Bartoshuk, L. M., Lanier, S. L., & Duffy, V. B. (2006). Bittertaste markers explain variability in vegetable sweetness, bitterness, and intake.Physiology & Behavior, 87, 304–313.
Dinnella, C., Recchia, A., Fia, G., Bertuccioli, M., & Monteleone, E. (2009). Salivacharacteristics and individual sensitivity to phenolic astringent stimuli. ChemicalSenses, 34(4), 295–304.
Dinnella, C., Recchia, A., Vincenzi, S., Tuorila, H., & Monteleone, E. (2010). Temporarymodification of salivary protein profile and idividual responses to repeated phe-nolic astringent stimuli. Chemical Senses, 35, 75–85.
Drewnowski, A., & Gomez-Carneros, C. (2000). Bitter taste, phytonutrients, and theconsumer. A review. American Journal of Clinical Nutrition, 72, 1424–1435.
Duffy, V. B. (2007). Variation in oral sensation. Implications for diet and health. CurrentOpinion in Gastroenterology, 23, 171–177.
Duffy, V. B., & Bartoshuk, L. M. (2000). Food acceptance and genetic variation in taste.Journal of American Dietetic Association, 100(6), 647–655.
Faller, A. L. K., & Fioalho, E. (2009). The antioxidant capacity and polyphenol content oforganic and conventional retail vegetables after domestic cooking. Food ResearchInternational, 42, 210–215.
Fischer, U., Boulton, R. B., & Noble, A. (1994). Physiological factors contributing to thevariability of sensory assessments. Relationship between salivary flow rate andtemporal perception of gustatory stimuli. Food Quality and Preference, 5, 55–64.
Green, B. G., & George, P. (2004). Thermal taste predicts higher responsiveness tochemical taste flavour. Chemical Senses, 29, 617–628.
Green, B. G., Shaffer, G. S., & Gilmore, M. M. (1993). A semantically-labeled magnitudescale of oral sensation with apparent ratio properties. Chemical Senses, 18, 683–702.
Halliwell, B., Rafter, J., & Jenner, A. (2005). Health promotion by flavonoids, tocopherols,tocotrienols, and other phenols. Direct or indirect effects? Antioxidant or not?.American Journal of Clinical Nutrition, 81(1), 268S–276S.
Horne, J., Hayes, J., & Lawless, H. T. (2002). Turbidity as a measure of salivary proteinsreactions with astringent substances. Chemical Senses, 27, 653–659.
INRAN. (2003). Linee guida per una sana alimentazione. Roma: Istituto Nazionale diRicerca per gli Alimenti e la Nutrizione.
Jaeger, S. E., Axten, L. G., & Wohlers, M. W. (2009). Sun-Waterhouse. Plyphenol-richbeverages. Insights from sensory and consumer science. Journal of the Science ofFood and Agriculture, 89, 2356–2363.
C. Dinnella et al. / Appetite 56 (2011) 633–642642
Kallithraka, S., Bakker, J., Clifford, M. N., & Vallis, L. (2001). Correlations between salivaprotein composition and some T-I parameters of astringency. Food Quality andPreference, 12, 145–152.
Kaminski, L. C., Henderson, S. A., & Drewnowski, A. (2000). Young women’s foodpreferences and taste responsiveness to 6-n-propylthiouracil (PRP). Physiology& Behavior, 68, 691–697.
Keller, K. L., Steinman, L., Nurse, R. J., & Tepper, B. J. (2002). Gentic taste sensitivity to 6-n-propyltiouracil influences food preference and reported intake in preschoolchildren. Appetite, 38, 3–12.
Keskitalo, K., Tuorila, H., Spector, T. D., Cherkas, L. F., Knaapila, A., Silventoinen, K., et al.(2007). Same genetic components underlie different measures of sweet tastepreference. American Journal of Clinical Nutrition, 86, 1663–1669.
Koponen, J. M., Happonen, A. M., Auriola, S., Kontkanen, H., Buchert, J., Poutanen, K. S.,et al. (2008). Characterization and fate of black currant and bilberry flavonols inenzyme-aided processing. Journal of Agricultural and Food Chemistry, 56, 3136–3144.
Kuti, J. O., & Konuru, H. B. (2004). Antioxidant capacity and phenolic content in leafextracts of tree spinach (Cnidoscolus spp.). Journal of Agricultural and Food Chemis-try, 52, 117–121.
Lee, C. B., & Lawless, H. T. (1991). Time-course of astringent materials. Chemical Senses,16, 225–238.
Lesschaeve, I., & Noble, A. C. (2005). Polyphenols. Factors influencing their sensoryproperties and their effects on food and beverage preference. American Journal ofClinical Nutrition, 81(1), 330–335.
Lockshin, L., Jarvis, W., d’Hauteville, F., & Perrouty, J. (2006). Using simulations fromdiscrete choice experiments to measure consumer sensitivity to brand, region,price and awards in wine choice. Food Quality and Preference, 17, 166–178.
Looy, H., & Weingarten, H. P. (1991). Effects of metabolic state on sweet taste reactivityin humans depend on underlying hedonic response profile. Chemical Senses, 16,123–130.
Manganaris, G. A., Vasilakakis, M., & Mignani, I. (2008). Cell Wall Physicochemicalproperties as indicators of peach quality during fruit ripening after cold storage.Food Science and Technology International, 14(4), 385–391.
Mattes, R. D. (2006). Orosensory considerations. Obesity, 14S, 164–167.Mela, D. J. (1999). Food choice and intake. The human factor. Proceedings of the Nutrition
Society, 58, 513–521 Cambridge University Press.Monteleone, E., & Dinnella, C. (2009). Italian meals. In H. L. Meiselman (Ed.), Meals in
science and practice. Interdisciplinary research and business applications (pp. 359–375). Cambridge: Woodhead Publishing Limited.
Monteleone, E., Frewer, L., Wakeling, I., & Mela, D. J. (1998). Individual differences instarchy food consumption. The application of preference mapping. Food Qualityand Preference, 9(4), 211–219.
Mueller-Harvey, I. (2006). Unravelling the conundrum of tannins in animal nutritionand health. Journal of the Science of Food and Agriculture, 86(13), 2010–2037.
Narain, C., Paterson, A., Piggott, J. R., Dhawan, M., & Reid, E. (2004). Whitening andsweetening influences on filter coffee preference. British Food Journal, 106(6), 465–478.
Nayak, A., & Carpenter, G. H. (2008). A physiological model for tea induced astringency.Physiology & Behavior, 95, 290–294.
Ninfali, P., & Bacchiocca, M. (2003). Polyphenols and antioxidant capacity of vegetablesunder fresh and frozen conditions. Journal of Agricultural and Food Chemistry, 51,2222–2226.
Oszmianski, J., Woidilo, A., & Kolniak, J. (2009). Effect of enzymatic mash treatment andstorage on phenolic composition, antioxidant activity, and turbidity of cloudyapple juice. Journal of Agricultural and Food Chemistry, 57, 7078–7085.
Pangborn, R. M. (1970). Individual variation in affective responses to taste stimuli.Psychonomic Science, 21, 125–126.
Pangborn, R. M. (1981). Individuality in responses to sensory stimuli. In J. Solms & R. L.Hall (Eds.), Criteria of food acceptance: How man chooses what he eats (pp. 177–219).Zurich: Forster Verlag.
Peryam, D. R., & Pilgrim, P. J. (1957). Hedonic scale method for measuring foodpreferences. Food Technology, 11, 9–14.
Reed, D. R., Nanthakumar, E., North, M., Bell, C., & Bartoshuk, L. M. (1999). Localizationof a gene for bitter taste perception to human chromosome 5p15. American Journalof Human Genetics, 64, 1478–1480.
Reed, D. R., Tanaka, T., & McDaniel, A. H. (2006). Diverse tastes. Genetics of sweet andbitter perception. Physiology & Behavior, 88, 215–226.
Robichaud, J. L., & Noble, A. C. (1990). Astringency and bitterness of selected phenolicsin wine. Journal of the Science of Food and Agriculture, 53, 343–353.
Shimada, T. (2006). Salivary proteins as a defense against dietary tannins. Journal ofChemical Ecology, 32(6), 1149–1163.
Vinson, J. A., Proch, J., & Zubik, L. (1999). Phenol antioxidant quantity and quality infoods. Cocoa, dark chocolate, and milk chocolate rapid communications. Journal ofAgricultural and Food Chemistry, 47(12), 4821–4824.
Waterhouse, A. L. (2002). Wine phenolics. Annals of the New York Academy of Sciences,957, 21–36.
Xu, B., & Chang, S. C. K. (2009). Isoflavones flavan-3-ols, phenolic acids, total phenolicprofiles, and antioxidant capacities of soy milk as affected by ultrahigh-tempera-ture and traditional processing methods. Journal of Agricultural and Food Chemistry,57, 4706–4717.
Yan, Y., Hu, J., & Yao, P. (2009). Effects of casein, ovalbumin, and dextran on theastringency of tea polyphenols determined by quartz crystal microbalance withdissipation. Langmuir, 25(1), 397–402.
Yeomans, M. R., Prescott, J., & Gould, N. J. (2009). Acquired hedonic and sensorycharacteristics of odours. Influence of sweet liker and propylthiouracil tasterstatus. Quarterly Journal of Experimental Psychology, 62(8), 1648–1664.