
Synthesis, Features and Solar-Light-Driven Photocatalytic Activity of TiO2 Nanotube Arrays Loaded...
9
Delivered by Publishing Technology to: Inha University IP: 165.246.66.35 On: Fri, 28 Mar 2014 11:40:41 Copyright: American Scientific Publishers Copyright © 2014 American Scientific Publishers All rights reserved Printed in the United States of America Article Journal of Nanoscience and Nanotechnology Vol. 14, 7001–7009, 2014 www.aspbs.com/jnn Synthesis, Features and Solar-Light-Driven Photocatalytic Activity of TiO 2 Nanotube Arrays Loaded with SnO 2 Lan Ching Sim 1 , Kai Wern Ng 1 , Shaliza Ibrahim 1 , and Pichiah Saravanan 1 2 ∗ 1 Faculty of Engineering, Environmental Laboratory, Department of Civil Engineering, University of Malaya, 50603 Kuala Lumpur, Malaysia 2 Centre for Research in Nanotechnology and Catalysis, University of Malaya, 50603 Kuala Lumpur, Malaysia In the present study TiO 2 nanotube arrays (TNTs) were loaded with a post-transition metal oxide particles namely SnO 2 via incipient wet impregnation method by varying its concentration (1.59 wt%, 2.25 wt% and 2.84 wt%). The photocatalytic activity of the prepared photocatalyst was evaluated for the degradation of methylene blue (MB) in presence of natural solar light irradiation. The mor- phological analyses revealed that the prepared TNTs had average inner diameter of 109 nm, wall thickness of 15 nm and tube length of 7–10 m, respectively, while the crystalline phase and raman spectra confirmed the 100% anatase mineral form of TiO 2 . Further, the presence of SnO 2 in TNTs was confirmed by high resolution transmission electron microscopy (HRTEM) and X-ray photoelec- tron spectroscopy (XPS). The visible light absorption properties of TNTs improved drastically with increasing SnO 2 loadings. The coupling effect of SnO 2 and TiO 2 significantly enhanced degradation efficiency of MB. An 84% degradation of MB was achieved in 6 h of irradiation under clear sky condition. Keywords: TiO 2 Nanotube Arrays, SnO 2 , Solar Light, Methylene Blue, Photodegradation. 1. INTRODUCTION TiO 2 is one of the most promising photocatalysts because of its high photocatalytic activity, stability, low cost and non toxic nature. 1–3 Among TiO 2 materials, self- organized and vertically oriented TNTs are of great interest due to their: (i) high surface-to-volume ratios, high surface area (ii) good charge transport properties and (iii) size dependent properties. These nanotubes are most widely used in the quantum dots-sensitized solar cells, carbon dioxide (CO 2 ) reduction, dye degradation, dye-sensitized solar cells, photoelectrolysis and various biomedical applications. 4–11 However, the photocatalytic activity is limited by its visible light utilization and high recombination rate of photogenerated electron–hole pairs due to its wide band gap (3.2 eV for anatase and 3.0 eV for rutile). They can be excited only with UV light irradiation (< 380 nm), which covers ∼ 5% of the total solar spectrum. 12 The ∗ Author to whom correspondence should be addressed. researchers improved the photocatalytic activity of TiO 2 in the visible light region by doping with metals (Cu, Pt, Fe, Pd, Ag, Ni) 7 8 13–16 and non-metal elements such as nitrogen (N), 17–19 boron (B), 20 sulphur (S) 21 and car- bon (C) 22 23 on its surface. The another alternative is to combine TiO 2 with semiconductors such as SnO 2 , 24 25 NiO, 26 27 In 2 O 3 , 28 WO 3 , 29 Co 3 O 4 , 30 Fe 2 O 15 3 and Cu 2 O. 31 The addition/inclusion of such semiconductors can facil- itate charge separation and extend the photo-responding range to the visible region. 25 32 33 Among those semiconductors, SnO 2 is most suitable to couple with TiO 2 due to its conduction band (E CB = 0V vs. NHE at pH 7) is lower than that of TiO 2 (E CB =−05V vs. NHE at pH 7). 33 The coupling allows the photoex- cited electron transfer from TiO 2 to conduction band of SnO 2 , leaving behind a positive hole on TiO 2 and thereby hinder charge recombination and improve photocatalytic efficiency. Vinodgopal and Kamat (1995) demonstrated the principle of charge separation in a SnO 2 /TiO 2 coupled semiconductor. 33 In addition, they also reported the elec- trochemically assisted photocatalytic experiments using J. Nanosci. Nanotechnol. 2014, Vol. 14, No. 9 1533-4880/2014/14/7001/009 doi:10.1166/jnn.2014.8931 7001
Transcript of Synthesis, Features and Solar-Light-Driven Photocatalytic Activity of TiO2 Nanotube Arrays Loaded...

Delivered by Publishing Technology to: Inha UniversityIP: 165.246.66.35 On: Fri, 28 Mar 2014 11:40:41
Copyright: American Scientific Publishers
Copyright © 2014 American Scientific PublishersAll rights reservedPrinted in the United States of America
ArticleJournal of
Nanoscience and NanotechnologyVol. 14, 7001–7009, 2014
www.aspbs.com/jnn
Synthesis, Features and Solar-Light-Driven
Photocatalytic Activity of TiO2 Nanotube
Arrays Loaded with SnO2
Lan Ching Sim1, Kai Wern Ng1, Shaliza Ibrahim1, and Pichiah Saravanan1�2�∗1Faculty of Engineering, Environmental Laboratory, Department of Civil Engineering,
University of Malaya, 50603 Kuala Lumpur, Malaysia2Centre for Research in Nanotechnology and Catalysis, University of Malaya, 50603 Kuala Lumpur, Malaysia
In the present study TiO2 nanotube arrays (TNTs) were loaded with a post-transition metal oxideparticles namely SnO2 via incipient wet impregnation method by varying its concentration (1.59 wt%,2.25 wt% and 2.84 wt%). The photocatalytic activity of the prepared photocatalyst was evaluatedfor the degradation of methylene blue (MB) in presence of natural solar light irradiation. The mor-phological analyses revealed that the prepared TNTs had average inner diameter of 109 nm, wallthickness of 15 nm and tube length of 7–10 �m, respectively, while the crystalline phase and ramanspectra confirmed the 100% anatase mineral form of TiO2. Further, the presence of SnO2 in TNTswas confirmed by high resolution transmission electron microscopy (HRTEM) and X-ray photoelec-tron spectroscopy (XPS). The visible light absorption properties of TNTs improved drastically withincreasing SnO2 loadings. The coupling effect of SnO2 and TiO2 significantly enhanced degradationefficiency of MB. An 84% degradation of MB was achieved in 6 h of irradiation under clear skycondition.
Keywords: TiO2 Nanotube Arrays, SnO2, Solar Light, Methylene Blue, Photodegradation.
1. INTRODUCTIONTiO2 is one of the most promising photocatalysts because
of its high photocatalytic activity, stability, low cost
and non toxic nature.1–3 Among TiO2 materials, self-
organized and vertically oriented TNTs are of great
interest due to their: (i) high surface-to-volume ratios,
high surface area (ii) good charge transport properties
and (iii) size dependent properties. These nanotubes are
most widely used in the quantum dots-sensitized solar
cells, carbon dioxide (CO2) reduction, dye degradation,
dye-sensitized solar cells, photoelectrolysis and various
biomedical applications.4–11
However, the photocatalytic activity is limited by its
visible light utilization and high recombination rate of
photogenerated electron–hole pairs due to its wide band
gap (3.2 eV for anatase and 3.0 eV for rutile). They can
be excited only with UV light irradiation (� < 380 nm),
which covers ∼5% of the total solar spectrum.12 The
∗Author to whom correspondence should be addressed.
researchers improved the photocatalytic activity of TiO2
in the visible light region by doping with metals (Cu,
Pt, Fe, Pd, Ag, Ni)7�8�13–16 and non-metal elements such
as nitrogen (N),17–19 boron (B),20 sulphur (S)21 and car-
bon (C)22�23 on its surface. The another alternative is to
combine TiO2 with semiconductors such as SnO2,24�25
NiO,26�27 In2O3,28 WO3,
29 Co3O4,30 Fe2O
153 and Cu2O.
31
The addition/inclusion of such semiconductors can facil-
itate charge separation and extend the photo-responding
range to the visible region.25�32�33
Among those semiconductors, SnO2 is most suitable to
couple with TiO2 due to its conduction band (ECB = 0 V
vs. NHE at pH 7) is lower than that of TiO2 (ECB =−0�5 Vvs. NHE at pH 7).33 The coupling allows the photoex-
cited electron transfer from TiO2 to conduction band of
SnO2, leaving behind a positive hole on TiO2 and thereby
hinder charge recombination and improve photocatalytic
efficiency. Vinodgopal and Kamat (1995) demonstrated the
principle of charge separation in a SnO2/TiO2 coupled
semiconductor.33 In addition, they also reported the elec-
trochemically assisted photocatalytic experiments using
J. Nanosci. Nanotechnol. 2014, Vol. 14, No. 9 1533-4880/2014/14/7001/009 doi:10.1166/jnn.2014.8931 7001

Delivered by Publishing Technology to: Inha UniversityIP: 165.246.66.35 On: Fri, 28 Mar 2014 11:40:41
Copyright: American Scientific Publishers
Synthesis, Features and Solar-Light-Driven Photocatalytic Activity of TiO2 Nanotube Arrays Loaded with SnO2 Sim et al.
coupled SnO2/TiO2 semiconductor thin films in the degra-
dation of textile dye effluent. Hou et al. (2007) prepared
SnO2/TiO2 composite in hydrothermal condition with
proper amount of SnO2 loading that showed an increase
of photocatalytic activity for degradation of methylene
blue.25 A bicomponent TiO2–SnO2 nanofiber photocatalyst
prepared via electrospinning showed enhanced photocat-
alytic activity for the oxidation of RhB dye compared to
pure TiO2 under UV light.34 The studies on the natural
solar-light-driven photocatalytic activity are still limited,
although very few studies on SnO2/TNTs catalysts have
been reported. Most of them are widely used for lithium
storage.35�36 In recent years, self organized and vertically
oriented TNTs have been the focus of research8�15�21 due to
their easy recovery and large surface area available for the
photo reaction. Most suitably SnO2 could be the promising
materials for such surface functionalization.
The present finding emphasize on preparing TNTs with
varied weight percentage of SnO2 via simple incipient wet
impregnation method for higher visible light harvesting
from solar spectrum. The photocatalytic activity of the
SnO2/TNTs and pure TNTs were evaluated by degrading
methylene blue (MB) dye under natural solar-light irradia-
tion. The loading of nanosized SnO2 into TNTs possesses
the following advantages:
(1) the presence of Sn4+ species and surface defects
extend the photo-responding range.
(2) SnO2 nanoparticles play as an electron collector
to facilitate rapid separation of photogenerated charges
before recombination.
(3) aligned TNTs with a self-organized and self-supported
array structure lead to high physical stability.
2. EXPERIMENTAL DETAILS2.1. Preparation of SnO2/TNTsAll the chemical reagents were of analytical purity
and purchased from Sigma-Aldrich Chemical Co. Self-
organized TNTs layers were prepared directly on Ti foils
(99.7%, Sigma-Aldrich) via electrochemical anodic oxi-
dation in ethylene glycol (anhydrous, 99.8%) electrolyte
containing 0.3 M ammonium fluoride (NH4F, 98%) and
2 vol% water (H2O) with graphite rod as the counter elec-
trode under 50 V for 3 h. Ti foils (20 mm× 30 mm×0�25 mm) were ultrasonically cleaned with acetone and
ethanol prior to anodization. The anodized samples were
rinsed thoroughly with DI water and then annealed at
450 �C for 1 h. The annealed samples were sonicated
with ethanol for 30 min to remove the bundled impuri-
ties on top openings of the pores of the nanotubes. The
loading of SnO2 onto TNTs were achieved by incipi-
ent wet impregnation method. The preparation steps fol-
lowed were: The prepared TNTs samples were immersed
overnight in SnCl4 · 5H2O aqueous solution. The molar
concentration of SnCl4 ·5H2O aqueous solution was varied
in a range of 0.5–2.5 M. This resulted in different concen-
tration of SnO2/TNTs namely 1.59 Sn, 2.25 Sn and 2.84
Sn, respectively. The prepared samples were annealed at
450 �C for 2 h with the heating rate of 10 �C min−1 to
induce crystallization. Similarly, a pure TNTs sample was
prepared for comparison.
2.2. Characterization of SnO2/TNTsThe morphologies and composition of the samples
were examined using a field emission scanning elec-
tron microscope (FESEM, Auriga, Zeiss) equipped with
an EDS (energy dispersive X-ray spectroscopy) detec-
tor. The images were taken at an accelerating voltage of
20 kV. High resolution transmission electron microscope
(HRTEM, Tecnai 20, Philips) images were obtained at
200 kV. The crystalline phase was identified using X-ray
diffractometer (XRD, D8 Advance, Bruker). The target
used in the diffractometer is copper (Cu K� radiation, �=1�54 Å). The surface chemical composition of the sam-
ples was analyzed by X-ray photoelectron spectroscopy
(XPS, Axis Ultra DLD, Kratos) with Al K� radiation
source. The binding energies were normalized to the sig-
nal for adventitious carbon at 284.6 eV. Light absorption
properties were performed using UV-vis-NIR spectropho-
tometer (Lambda 750, Perkin Elmer) with a wavelength
range of 200–800 nm. Raman spectroscopy was recorded
on Raman spectrometer (RamanMicro 200, Perkin Elmer)
with Raman shift range of 100–700 cm−1.
2.3. Photocatalytic Degradation ofMethylene Blue (MB)
The solar-light-driven photocatalytic activity of SnO2/
TNTs was evaluated by adopting methylene blue (MB) as
model pollutant under solar light irradiation. The degra-
dation of MB was carried out in a 1000 mL beaker with
the working volume of 200 mL of MB solution (1�56×10−5 M). The prepared samples were loaded in MB solu-
tion with only one side faced to solar light irradiation.
Prior to the photocatalytic experiment, the dark reaction
was carried out for 30 min to achieve the adsorption
equilibrium. The samples were collected at regular time
interval and analyzed for residual MB concentration with
visible spectrometer (Spectroquant® Pharo 100, Merck) at
�max = 664 nm. The drawn samples were dropped back
into the beaker after the measurement to allow further
degradation. The experiment was carried out at clear sky
condition at University of Malaya, Kuala Lumpur (latitude
101� 39′ E and longitude 3� 7′ N) between 11.00 am and
5.00 pm in the months of May (2012). Solar light inten-
sity was measured using LT Lutron LX-101 Lux meter
of 1000×100 l× and the average light intensity over the
duration of clear sky weather condition is found to be 97
220 lux (For solar light (AM 1.5), 100 mW/cm2 corre-
sponds to approximately 120 000 lux).37
7002 J. Nanosci. Nanotechnol. 14, 7001–7009, 2014

Delivered by Publishing Technology to: Inha UniversityIP: 165.246.66.35 On: Fri, 28 Mar 2014 11:40:41
Copyright: American Scientific Publishers
Sim et al. Synthesis, Features and Solar-Light-Driven Photocatalytic Activity of TiO2 Nanotube Arrays Loaded with SnO2
3. RESULTS AND DISCUSSION3.1. Structural and Morphological CharacterizationFigures 1(A) and (B) show the surface and cross-sectional
FESEM image of synthesized TNTs. The top surface
image (Fig. 1(B)) shows that TNTs are well attached to
each other and one-dimensional vertically oriented. The
average inner diameter of these nanotubes is 109 nm,
nanotube wall thickness is 15 nm and the tube length is in
the range of 7–10 �m. The top view image of SnO2/TNTs
is shown in Figure 1(D). It is apparent that the mor-
phological structure of TNTs was not affected by SnO2
loading. Further, SnO2/TNTs sample did not show signif-
icant morphological changes with increasing SnO2 con-
centration (data not shown). The energy-dispersive X-ray
spectroscopy (EDS) analysis (Fig. 1(C)) confirms the pres-
ence of Sn, Ti and O. The uniformity of SnO2 disper-
sion was obtained via EDS analysis over different spots
on the nanotubes cross section area with very reproducible
peaks obtained, especially for Sn. Figure 2(A) shows that
average crystallite size of SnO2 nanoparticles less than
5 nm were distributed in TNTs surface. Direct evidence
of crystalline nature of TiO2 and SnO2 was observed and
is shown in Figures 2(A) (inset) and (B), respectively.
Two lattice planes with spacing of 0.35 nm and 0.33 nm,
Figure 1. FESEM images of sample (A) cross-sectional view of pure TNTs, (B) top view of TNTs, (C) EDX of 1.59 Sn and (D) top view of 1.59 Sn.
corresponding to the (101) plane of anatase TiO2 and (110)
plane of SnO2 was also observed clearly.38�39
Figure 3(A) shows the XRD pattern for TNTs and
SnO2/TNTs. The diffraction peaks of all prepared samples
are mainly ascribed to the peaks of TiO2 anatase phase
and Ti substrate. The Ti peak belongs to Ti foil substrate
underneath the oxide nanostructure layer. No peak cor-
responding to TiO2 rutile phase and SnO2 was detected.
There has been virtually no phase change in TiO2 after
the loading of SnO2 nanoparticles. The evident peaks of
tetragonal TiO2 anatase phase (JCPDS no. 21-1272) are
found at 25.3�, 36.9�, 37.8�, 48.0�, 53.9�, 55.1�, 62.7�,68.8� and 75.0�, corresponding to (1 0 1), (1 0 3), (0 0 4),
(2 0 0), (1 0 5), (2 1 1), (2 0 4), (1 1 6) and (2 1 5)
crystal planes, respectively. The crystalline phase of SnO2
could not be detected by XRD when TNTs were loaded
with different concentration of SnO2. It indicates that Sn
cations (0.69 Å) are well substituted into the Ti cations
(0.68 Å) in anatase TiO2 lattice due to their similar ionic
radii.40 In addition, this could be due to the presence of
SnO2 in low concentration and it is uniformly small and
well dispersed on TiO2 surface. Similar such observations
were reported by Sakthivel et al. (2004)41 and Ku et al.
(2011).42 The lattice parameters and crystallite size of all
J. Nanosci. Nanotechnol. 14, 7001–7009, 2014 7003

Delivered by Publishing Technology to: Inha UniversityIP: 165.246.66.35 On: Fri, 28 Mar 2014 11:40:41
Copyright: American Scientific Publishers
Synthesis, Features and Solar-Light-Driven Photocatalytic Activity of TiO2 Nanotube Arrays Loaded with SnO2 Sim et al.
Figure 2. (A) HRTEM image of single TNT loaded with SnO2 (B) HRTEM image of the circle area in (A). Inset shows the HRTEM image of pure
TNTs.
samples are calculated using the formula stated below and
are summarized in Table I. The average crystallite sizes of
TiO2 anatase were calculated using Scherrer equation:
D = K�
� cos�(1)
where � is the full width half maximum (FWHM) for the
2� peak, K is the shape factor taken as 0.89 for calcula-
tions, � is the wavelength of X-ray (0.154 nm), and � is
the diffraction angle. The lattice parameters were measured
using (1 0 1) and (2 0 0) in anatase crystal planes by using
Bragg’s equations:
dh k l =�
2 sin �(2)
Formula for tetragonal system:
d−2h k l = h2a−2+k2b−2+ l2c−2 (3)
Figure 3. (A) X-ray diffraction pattern of photocatalysts ((a): TNTs; (b): 1.59 Sn; (c): 2.84 Sn). (B) enlarged region of 2 theta in a range of 24.8–26�.
Table I. Lattice parameters for TNTs and SnO2/TNTs samples.
Sample Crystallite size (nm)a Cell parameters a= b, c (Å)b
TNTs 34.50 3.7868, 9.5102
1.59 Sn 33.35 3.7863, 9.4308
2.84 Sn 25.00 3.7764, 9.3196
Notes: aMeasured by Scherrer’s equation; bEstimated according to Eqs. (2) and (3).
where dh k l is the distance between crystal planes of
(h k l), � is the X-ray wavelength, � is the diffraction angle
of crystal plane (h k l), h k l is the crystal index and a, band c are lattice parameters (in anatase form, a= b �= c).As depicted in Table I, the lattice parameters and crys-
tallite size of all samples decrease with increasing SnO2
concentration. It can also be observed from Figure 3(B)
that there is a shift of the (1 0 1) peak towards higher
angles with increase in SnO2 concentration, resulting in
changes in the lattice parameters. In addition, the decrease
in the (1 0 1) anatase peak intensity of SnO2/TNTs in
7004 J. Nanosci. Nanotechnol. 14, 7001–7009, 2014

Delivered by Publishing Technology to: Inha UniversityIP: 165.246.66.35 On: Fri, 28 Mar 2014 11:40:41
Copyright: American Scientific Publishers
Sim et al. Synthesis, Features and Solar-Light-Driven Photocatalytic Activity of TiO2 Nanotube Arrays Loaded with SnO2
Figure 4. UV-visible absorption spectra of pure TNTs and SnO2/TNTs.
Inset shows the enlarged region of wavelength in a range of 340–700 nm.
contrast of pure TNTs indicate that the crystallinity of
TiO2 is reduced by SnO2 loading. It is feasible for Sn4+ to
substitute for Ti4+ since the ionic radius of Sn4+ (0.69 Å)
is similar to ionic radius of Ti4+ (0.68 Å). The interca-
lated SnO2 cause structural strain and disorder in the TiO2
crystalline lattice structure.43 Hence, the crystal growth of
TiO2 is inhibited and the crystallite size of TiO2 decreases.
3.2. UV-Vis Diffuse Reflectance SpectraThe challenge in improving the properties of TiO2 is to
shift the absorption spectrum into the visible region to
enable more efficient solar light harvesting. The diffuse
reflectance spectra (DRS) of SnO2/TNTs and pure TNTs
samples are depicted in Figure 4. It can be seen that
1.59 Sn did not show a significant red-shifted absorption
edge towards visible region due to its marginal increase of
Sn concentration compared to that of TNTs. Meanwhile,
the further increasing Sn concentration up to 2.25 wt%
and 2.84 wt% results in a drastic shift towards the visible
region. It is known that the doping energy level of Sn4+
is located at 0.4 eV below the TiO2 conduction band.44
Hence, the visible light absorption of SnO2/TNTs can be
attributed to the charge-transfer transitions between Sn4+
electrons and the TiO2 conduction band.45 In addition, the
presence of Ti3+ species which is observed by XPS on
SnO2/TNTs (Fig. 6(D)) can induce oxygen vacancy states
between the valence and conduction band, which could
also contribute to the visible response46 and electron–hole
pairs separation.47 The obtained band gap energy through
Tauc plot (figure not shown) are 3.09 eV, 3.05 eV and
2.97 eV for TNTs, 1.59 Sn and 2.25 Sn, respectively. The
Tauc plot is a plot of (F (R) ·h�)1/2 against h�, where F (R)is the Kubelka-Munck function derived from F R= 1−R2/2R equation, R is diffuse reflectance, and h� is the
photon energy. The band gap energies can be determined
Figure 5. Raman spectra of (a) 1.59 Sn (b) pure TNTs. Insets show
the enlarged region of Raman shift in a range of 100–200 cm−1 and
350–650 cm−1.
by extrapolating the maximum slope of the curve to the
photon energy axis (x-axis).
3.3. Raman Shift SpectraFigure 5 depicts the Raman shift spectra of the pre-
pared samples. The Raman peaks for both pure TNTs
and SnO2/TNTs at 144, 197, 399, 519 and 639 cm−1
are assigned to Eg1, Eg2, B1g1, A1g B1g2 and Eg3
active modes of the anatase phase, respectively.48 This
result is consistent with crystallographic patterns and
confirms the formation of a bulk anatase phase after
annealing treatment. No peaks related to SnO2 or other
oxidation state of Sn was detected in the spectra of
SnO2/TNTs samples. This specifies the high dispersion
of SnO2 on TiO2 surface,49 which corresponds to the
XRD results. The SnO2/TNTs sample shows that Eg mode
of anatase (144 cm−1) (Fig. 5) decreases in intensity,
becomes broader and red shifted to higher frequency
region. Besides, few broader peaks also can be observed
at 399, 519 and 639 cm−1 in SnO2/TNTs sample. This
phenomenon is due to the breakdown of long-range trans-
lational crystal symmetry which is caused by the Sn4+
substitution defects.50
3.4. XPS AnalysisHigh-resolution XPS was performed to determine the
chemical composition and the oxidation state for SnO2/
TNTs samples. The fully scanned XPS spectra (Fig. 6(A))
indicate that Ti, O, C and Sn elements exist in SnO2/TNTs
samples. XPS of Sn 3d, O 1s and Ti 2p core levels of
the SnO2/TNTs exist as: (1) Ti 2p region (450–470 eV);
(2) Sn 3d region (480–500 eV); and (3) O 1s region
(520–540 eV). Peak fitting to the spectra was applied
using Gaussian-Lorentzian peak shape after subtraction
J. Nanosci. Nanotechnol. 14, 7001–7009, 2014 7005

Delivered by Publishing Technology to: Inha UniversityIP: 165.246.66.35 On: Fri, 28 Mar 2014 11:40:41
Copyright: American Scientific Publishers
Synthesis, Features and Solar-Light-Driven Photocatalytic Activity of TiO2 Nanotube Arrays Loaded with SnO2 Sim et al.
Figure 6. XPS spectra of 1.59 Sn (A) fully scanned spectra (B) O 1s peak (C) Sn 3d peak (D) Ti 2p peak. Inset in (D) shows the enlarged region of
binding energy in a range of 450–470 eV.
of Shirley background. The C element can be ascribed
to the adventitious carbon based contaminant from the
XPS instrument and the binding energy of C 1s peak at
284.6 eV is used as internal charge correction. As shown
in Figure 6(B), high-resolution XPS of O 1s core level
can be fitted to three kinds of chemical states. The peaks
at 529.9, 531.3 and 532.8 eV can be assigned to crystal
lattice oxygen of Ti–O, Sn–O and adsorbed water, respec-
tively. As shown in Figure 6(C), the Sn 3d5/2 peak is found
at 486.1 eV and the Sn 3d3/2 peak is located at 494.5 eV.
The splitting of Sn 3d doublet at 8.41 eV confirmed the
valence state of Sn is +4.
As shown in Figure 6(D), there are two peaks observed
at 458.1 eV (Ti 2p3/2) and 463.9 eV (Ti 2p1/2), both cor-
respond to Ti4+. The nonstoichiometric nature of TiO2
(Ti4+) surface was proved by the presence of TiO (Ti2+)and Ti2O3 (Ti3+) peaks. The presence of Ti2+ can be
detected at peak 460 eV. The two shoulder like peaks in
the lower binding energy on Ti 2p3/2 (456.9 eV) and Ti
2p1/2 (462.2 eV) are assigned to Ti3+ which are generated
from the substitution of Ti4+ (0.68 Å) by Sn4+ (0.69 Å)
with similar ionic radii, leading to stoichiometry changes
in TiO2 lattice. Interestingly, the binding energies for Ti
2p3/2 and Ti 2p1/2 shifted towards lower side with the sub-
stitution of Sn4+ compared to pure TNTs (Fig. 6(D)). This
phenomenon can be correlated to the existence of Ti with
lower valence (Ti2+, Ti3+) due to formation of oxygen
vacancies after SnO2 loading.51 These XPS results also
in agreement with XRD results (Fig. 3(B)) which show
SnO2/TNTs samples shift to higher angle compared to that
of TNTs. Both results confirm that SnO2 is successfully
loaded in TiO2 lattice in substitution mode and accompa-
nied by oxygen vacancy formation.
3.5. Photocatalytic Activity SnO2/TNTsMethylene blue (MB) was used as the model pollutant
to evaluate the photocatalytic activity of the SnO2/TNTs.
Figure 7(B) shows the solar-light-driven photocatalytic
activity for the degradation of MB over all prepared pho-
tocatalysts at clear sky condition. The initial concentration
(C0) is the MB concentration after adsorption–desorption
equilibrium. Regardless of SnO2 concentration, 40.1 to
40.7% of the dye were removed under dark condition for
30 min before exposure to solar irradiation. Since the pho-
tocatalytic principles also depend on the surface phenom-
ena, this good adsorption property can further enhance the
photodegradation in the presence of light source.
The photocatalytic reactions for all samples followed
pseudo first-order reaction kinetics, which is expressed by
equation:
ln
(C0
C
)= kt (4)
where k is the first-order reaction constant, C0 and C are
the initial and the reaction concentrations of the MB dye,
respectively. The kinetic plot and photocatalytic results are
given in Figure 7(A) and Table II, respectively. Regardless
7006 J. Nanosci. Nanotechnol. 14, 7001–7009, 2014
Delivered by Publishing Technology to: Inha UniversityIP: 165.246.66.35 On: Fri, 28 Mar 2014 11:40:41
Copyright: American Scientific Publishers
Sim et al. Synthesis, Features and Solar-Light-Driven Photocatalytic Activity of TiO2 Nanotube Arrays Loaded with SnO2
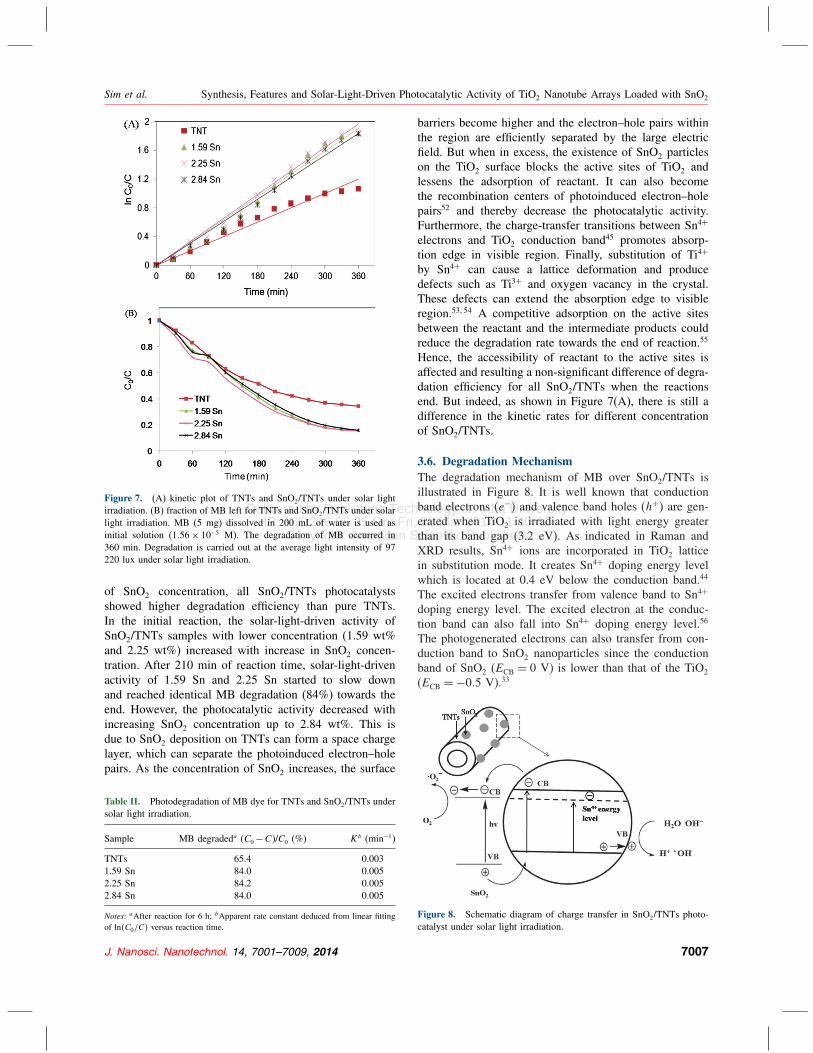
Figure 7. (A) kinetic plot of TNTs and SnO2/TNTs under solar light
irradiation. (B) fraction of MB left for TNTs and SnO2/TNTs under solar
light irradiation. MB (5 mg) dissolved in 200 mL of water is used as
initial solution (1�56× 10−5 M). The degradation of MB occurred in
360 min. Degradation is carried out at the average light intensity of 97
220 lux under solar light irradiation.
of SnO2 concentration, all SnO2/TNTs photocatalysts
showed higher degradation efficiency than pure TNTs.
In the initial reaction, the solar-light-driven activity of
SnO2/TNTs samples with lower concentration (1.59 wt%
and 2.25 wt%) increased with increase in SnO2 concen-
tration. After 210 min of reaction time, solar-light-driven
activity of 1.59 Sn and 2.25 Sn started to slow down
and reached identical MB degradation (84%) towards the
end. However, the photocatalytic activity decreased with
increasing SnO2 concentration up to 2.84 wt%. This is
due to SnO2 deposition on TNTs can form a space charge
layer, which can separate the photoinduced electron–hole
pairs. As the concentration of SnO2 increases, the surface
Table II. Photodegradation of MB dye for TNTs and SnO2/TNTs under
solar light irradiation.
Sample MB degradeda (C0 −C)/C0 (%) Kb (min−1)
TNTs 65.4 0.003
1.59 Sn 84.0 0.005
2.25 Sn 84.2 0.005
2.84 Sn 84.0 0.005
Notes: aAfter reaction for 6 h; bApparent rate constant deduced from linear fitting
of lnC0/C versus reaction time.
barriers become higher and the electron–hole pairs within
the region are efficiently separated by the large electric
field. But when in excess, the existence of SnO2 particles
on the TiO2 surface blocks the active sites of TiO2 and
lessens the adsorption of reactant. It can also become
the recombination centers of photoinduced electron–hole
pairs52 and thereby decrease the photocatalytic activity.
Furthermore, the charge-transfer transitions between Sn4+
electrons and TiO2 conduction band45 promotes absorp-
tion edge in visible region. Finally, substitution of Ti4+
by Sn4+ can cause a lattice deformation and produce
defects such as Ti3+ and oxygen vacancy in the crystal.
These defects can extend the absorption edge to visible
region.53�54 A competitive adsorption on the active sites
between the reactant and the intermediate products could
reduce the degradation rate towards the end of reaction.55
Hence, the accessibility of reactant to the active sites is
affected and resulting a non-significant difference of degra-
dation efficiency for all SnO2/TNTs when the reactions
end. But indeed, as shown in Figure 7(A), there is still a
difference in the kinetic rates for different concentration
of SnO2/TNTs.
3.6. Degradation MechanismThe degradation mechanism of MB over SnO2/TNTs is
illustrated in Figure 8. It is well known that conduction
band electrons (e−) and valence band holes (h+) are gen-
erated when TiO2 is irradiated with light energy greater
than its band gap (3.2 eV). As indicated in Raman and
XRD results, Sn4+ ions are incorporated in TiO2 lattice
in substitution mode. It creates Sn4+ doping energy level
which is located at 0.4 eV below the conduction band.44
The excited electrons transfer from valence band to Sn4+
doping energy level. The excited electron at the conduc-
tion band can also fall into Sn4+ doping energy level.56
The photogenerated electrons can also transfer from con-
duction band to SnO2 nanoparticles since the conduction
band of SnO2 (ECB = 0 V) is lower than that of the TiO2
(ECB =−0�5 V).33
Figure 8. Schematic diagram of charge transfer in SnO2/TNTs photo-
catalyst under solar light irradiation.
J. Nanosci. Nanotechnol. 14, 7001–7009, 2014 7007

Delivered by Publishing Technology to: Inha UniversityIP: 165.246.66.35 On: Fri, 28 Mar 2014 11:40:41
Copyright: American Scientific Publishers
Synthesis, Features and Solar-Light-Driven Photocatalytic Activity of TiO2 Nanotube Arrays Loaded with SnO2 Sim et al.
The photogenerated electrons at Sn4+ doping energy
level, TiO2 conduction band and SnO2 conduction band
react with O2 adsorbed on TiO2 surface or dissolved oxy-
gen in water to produce superoxide radical anion •O−2 .
55
While the photogenerated holes move from SnO2 valence
band to TiO2 valence band. It oxidize the organic molecule
in MB solution to form R+, or react with OH− or H2O then
oxidizing them into •OH radicals. Ti3+ which is the sur-
face defects as identified in XPS analysis can easily react
with O2 adsorbed on TiO2 surface, leading to the forma-
tion of radicals such as •O−2 , HO
•2, and
•OH radicals.46 The
resulting •OH radicals are strong oxidizing agent (standard
redox potential +2.8 V) can oxidize MB dye to mineral
end-products.
4. CONCLUSIONSSelf-organized and vertically oriented TNTs were loaded
with SnO2 particles using simple incipient wet impreg-
nation method. The characterization results indicated that
the morphology structure and crystalline phase of TNTs
was not affected by the loading of SnO2. The SnO2/TNTs
samples possess better visible light absorption property
compared to that of TNTs. Overall, SnO2/TNTs exhibited
higher solar-light-driven photocatalytic activity than TNTs
due to the contribution of substitutionally Sn4+, surfacedefects (Ti3+ and oxygen vacancy) and SnO2 nanopar-
ticles. The factor to enhance solar-light-driven photocat-
alytic activity does not always depend on the good visible
light absorption property. It also depends on the effec-
tive combination of the surface transfer of photoinduced
charge-carriers and further dosage optimizing of SnO2
nanoparticles to avoid electron–hole pairs recombination.
Acknowledgments: This work was supported by Uni-
versity of Malaya Research Grant (RG167/12SUS)
and Postgraduate Research Grant (PPP) (PV106/2012A)
respectively. The authors are grateful to Advance Materials
Research Centre (AMREC) and Low Dimensional Mate-
rials Research Centre (LDMRC), University of Malaya in
assisting characterization work.
References and Notes1. S. Mozia, A. Heciak, and A. W. Morawski, J. Photochem. Photobiol.
A: Chem. 216, 275 (2010).2. P. Roy, S. Berger, and P. Schmuki, Angew. Chem. Int. Ed. 50, 2904
(2011).3. R. Leary and A. Westwood, Carbon 49, 741 (2011).4. X. W. Cheng, H. L. Liu, X. J. Yu, Q. H. Chen, J. J. Li, P. Wang,
A. Umar, and Q. Wang, Sci. Adv. Mater. 5, 1563 (2013).5. C. Chen, Y. Xie, G. Ali, S. H. Yoo, and S. O. Cho, Nanotechnology
22, 015202 (2011).6. O. K. Varghese, M. Paulose, T. J. LaTempa, and C. A. Grimes, Nano
Lett. 9, 731 (2009).7. Y. K. Lai, H. F. Zhuang, K. P. Xie, D. G. Gong, Y. X. Tang, L. Sun,
C. J. Lin, and Z. Chen, New J. Chem. 34, 1335 (2010).8. S. K. Mohapatra, N. Kondamudi, S. Banerjee, and M. Misra,
Langmuir 24, 11276 (2008).
9. S. H. Kang, H. S. Kim, J. Y. Kim, and Y. E. Sung, Nanotechnology20, 355307 (2009).
10. M. Paulose, G. K. Mor, O. K. Varghese, K. Shankar, and C. A.
Grimes, J. Photochem. Photobiol. A: Chem. 178, 8 (2006).11. D. Y. Ding, C. Q. Ning, L. Huang, F. C. Jin, Y. Q. Hao, S. Bai,
Y. Li, M. Li, and D. L. Mao, Nanotechnology 20, 305103 (2009).12. S. Malato, P. Fernández-Ibáñez, M. I. Maldonado, J. Blanco, and
W. Gernjak, Catal. Today 147, 1 (2009).13. M. Qamar, S. J. Kim, and A. K. Ganguli, Nanotechnology
20, 455703 (2009).14. X. J. Feng, J. D. Sloppy, T. J. LaTempa, M. Paulose, S. Komarneni,
N. Bao, and C. A. Grimes, J. Mater. Chem. 21, 13429 (2011).15. Q. Wu, J. J. Ouyang, K. P. Xie, L. Sun, M. Y. Wang, and C. J. Lin,
J. Hazard. Mater. 199–200, 410 (2012).16. S. P. Xu and D. D. Sun, J. Nanosci. Nanotechnol. 13, 6866 (2013).17. Z. Jiang, F. Yang, N. J. Luo, B. T. T. Chu, D. Y. Sun, H. H. Shi,
T. C. Xiao, and P. P. Edwards, Chem. Commun. 47, 6372 (2008).18. G. D. Yang, Z. Jiang, H. H. Shi, T. C. Xiao, and Z. F. Yan, J. Mater.
Chem. 20, 5301 (2010).19. G. S. Wu, J. L. Wen, S. Nigro, and A. C. Chen, Nanotechnology
21, 085701 (2010).20. Y. M. Wu, M. Y. Xing, and J. L. Zhang, J. Hazard. Mater. 192, 368
(2011).21. G. T. Yan, M. Zhang, J. Hou, and J. J. Yang, Mater. Chem. Phys.
129, 553 (2011).22. C. Theerakarunwong, Z. F. Ma, and S. Phanichphant, J. Nanosci.
Nanotechnol. 12, 3970 (2012).23. J. H. Im, S. J. Yang, C. H. Yun, and C. R. Park, Nanotechnology
23, 035604 (2012).24. L. C. Chen, C. M. Huang, C. S. Gao, G. W. Wang, and M. C. Hsiao,
Chem. Eng. J. 175, 49 (2011).25. L. R. Hou, C. Z. Yuan, and Y. Peng, J. Hazard. Mater. B139, 310
(2007).26. C. S. Fu, Z. S. Juan, L. Wei, and Z. Wei, J. Hazard. Mater. 155, 320
(2008).27. J. Guo, W. Y. Fu, H. B. Yang, Q. J. Yu, W. Y. Zhao, X. M. Zhou,
Y. M. Sui, J. Ding, Y. G. Li, S. L. Cheng, and M. H. Li, J. Phys. D:Appl. Phys. 43, 1 (2010).
28. C. L. Cao, C. G. Hu, W. D. Shen, S. X. Wang, J. L. Wang, H. Liu,
and Y. Xi, Sci. Adv. Mater. 5, 796 (2013).29. M. R. Bayati, F. G. Fard, A. Z. Moshfegh, and R. Molaei, Mater.
Chem. Phys. 128, 427 (2011).30. C. L. Cao, C. G. Hu, W. D. Shen, S. X. Wang, H. Liu, and J. L.
Wang, Sci. Adv. Mater. 5, 1256 (2013).31. T. Wang, B. Y. Wang, W. Wei, H. Ding, Y. X. Hu, J. Zhang, and
H. Wang, Sci. Adv. Mater. 5, 1770 (2013).32. R. A. Rakkesh and S. Balakumar, J. Nanosci. Nanotechnol. 13, 370
(2013).33. K. Vinodgopal and P. V. Kamat, Environ. Sci. Technol. 29, 841
(1995).34. Z. Y. Liu, D. D. Sun, P. Guo, and J. O. Leckie, Nano Lett. 7, 1081
(2007).35. G. D. Du, Z. P. Guo, P. Zhang, Y. Li, M. B. Chen, D. Wexlerb, and
H. K. Liu, J. Mater. Chem. 20, 5689 (2010).36. X. M. Wu, S. C. Zhang, L. L. Wang, Z. J. Du, H. Fang, Y. H. Ling,
and Z. H. Huang, J. Mater. Chem. 22, 11151 (2012).37. H. Pettersson and T. Gruszecki, Sol. Energ. Mat. Sol. C 70, 203
(2001).38. S. H. Kang, Y. E. Sung, and W. H. Smyrl, J. Electrochem. Soc.
155, B1128 (2008).39. J. H. He, T. H. Wu, C. L. Hsin, K. M. Li, L. J. Chen, Y. L. Chueh,
L. J. Chou, and Z. L. Wang, Small 2, 116 (2006).40. B. Santara, B. Pal, and P. K. Giri, J. Appl. Phys. 110, 114322 (2011).41. S. Sakthivel, M. V. Shankar, M. Palanichamy, B. Arabindoo, D. W.
Bahnemann, and V. Murugesan, Water Res. 38, 3001 (2004).42. Y. Ku, C. N. Lin, and W. M. Hou, J. Mol. Catal. A: Chem. 349, 20
(2011).
7008 J. Nanosci. Nanotechnol. 14, 7001–7009, 2014

Delivered by Publishing Technology to: Inha UniversityIP: 165.246.66.35 On: Fri, 28 Mar 2014 11:40:41
Copyright: American Scientific Publishers
Sim et al. Synthesis, Features and Solar-Light-Driven Photocatalytic Activity of TiO2 Nanotube Arrays Loaded with SnO2
43. S. Singhal, A. K. Chawla, H. O. Gupta, and R. Chandra, NanoscaleRes. Lett. 5, 323 (2010).
44. E. J. Wang, T. He, L. S. Zhao, Y. M. Chen, and Y. A. Cao, J. Mater.Chem. 21, 144 (2011).
45. E. Arpaç, F. Sayılkan, M. Asiltürk, P. Tatar, N. Kiraz, and
H. Sayılkan, J. Hazard. Mater. 140, 69 (2007).46. L. B. Xiong, J. L. Li, B. Yang, and Y. Yu, J. Nanomater. 2012, 1
(2012).47. P. Xiao, Y. H. Zhang, and G. Z. Cao, Sensor Actuat. B-Chem.
155, 159 (2011).48. T. Ohsaka, S. Yamaoka, and O. Shimomura, Solid State Commun.
30, 345 (1979).49. J. X. Yuan, L. H. Juan, and Z. X. Ming, J. Mater. Sci. 43, 6505
(2008).
50. M. Pal, U. Pal, J. M. G. Y. Jiménez, and F. Pérez-Rodríguez,
Nanoscale Res. Lett. 7, 1 (2012).51. B. K. Kaleji and R. S. Mamoory, Mater. Res. Bull. 47, 362
(2012).52. J. H. Huang, W. K. Cheuk, Y. F. Wu, F. S. C. Lee, and W. K. Ho,
J. Nanotechnol. 2012, 214783 (2012).53. N. Bityurin, A. I. Kuznetsov, and A. Kanaev, Appl. Surf. Sci. 248, 86
(2005).54. M. J. Norman, L. D. Morpeth, and J. C. McCallum, Mater. Sci. Eng.
B 106, 257 (2004).55. I. K. Konstantinou and T. A. Albanis, Appl. Catal. B: Environ. 49, 1
(2004).56. Y. A. Cao, W. S. Yang, W. F. Zhang, G. Z. Liu, and P. Yue,
New J. Chem. 28, 218 (2004).
Received: 22 November 2012. Accepted: 29 December 2012.
J. Nanosci. Nanotechnol. 14, 7001–7009, 2014 7009