
Mixed SnO2/TiO2 included with carbon nanotubes for gas-sensing application
6
Mixed SnO 2 /TiO 2 included with carbon nanotubes for gas-sensing application Nguyen Van Duy a , Nguyen Van Hieu b,c, , Pham Thanh Huy b,c , Nguyen Duc Chien c,d , M. Thamilselvan a , Junsin Yi a a School of Information and Communication Engineering, Sungkyunkwan University, 300 Chunchun-dong, Jangan-gu, Suwon 440746, South Korea b International Training Institute for Materials Science (ITIMS), Hanoi University of Technology (HUT), No. 1 Dai Co Viet Road, Hanoi, Vietnam c Hanoi Advanced School of Science and Technology (HAST), Hanoi University of Technology (HUT), Vietnam d Institute of Engineering Physics (IEP), Hanoi University of Technology (HUT), Vietnam article info Article history: Received 21 April 2008 Received in revised form 9 July 2008 Accepted 9 July 2008 Available online 25 September 2008 PACS: 61.48.De 07.07.df 81.07.De Keywords: Mixed SnO 2 –TiO 2 Carbon nanotubes Gas sensor abstract TiO 2 and SnO 2 are the well-known sensing materials with a good thermal stability of the former and a high sensitivity of the latter. Carbon nanotubes (CNTs) have also gas sensing ability at room temperature. CNTs-included SnO 2 /TiO 2 material was a new exploration to combine the advantages of three kinds of materials for gas-sensing property. In this work, a uniform SnO 2 /TiO 2 solution was prepared by the sol–gel process with the ratio 3:7 in mole. The CNTs with contents in the range of 0.001–0.5 wt% were dispersed in a mixed SnO 2 /TiO 2 matrix by using an immersion-probe ultrasonic. The SnO 2 –TiO 2 and the CNTs-included SnO 2 –TiO 2 thin films were fabricated by the sol–gel spin-coating method over Pt-interdigitated electrode for gas-sensor device fabrication and they were heat treated at 500 1C for 30 min. FE-SEM and XRD characterizations indicated that the inclusion of CNTs did not affect the particle size as well as the morphology of the thin film. The sensing properties of all as-fabricated sensors were investigated with different ethanol concentrations and operating temperatures. An interesting sensing characteristic of mixed SnO 2 /TiO 2 sensors was that there was a two-peak shape in the sensitivity versus operating temperature curve. At the region of low operating temperature (below 280 1C), the hybrid sensors show improvement of sensing property. This result gives a prospect of the stable gas sensors with working temperatures below 250 1C. & 2008 Elsevier B.V. All rights reserved. 1. Introduction Semiconductor metal oxide gas sensors have been investigated extensively since the past decades owing to their advantages of high sensitivity to pollutant gases, fast response and recovery, low cost, easy implementation, and small size [1,2]. Gas sensors based on SnO 2 materials have been commercially available [3,4]. Thin- film gas sensors have improved the gas-sensing properties from bulk or thick- film ones. They not only give a high sensitivity but also have very fast response and recovery times. However, there still exist great disadvantages of SnO 2 and TiO 2 materials. SnO 2 is thermally unstable and its electrical properties can be degener- ated upon prolonged thermal treatment in reducing the gas atmosphere [1]. On the other hand, in spite of the high thermal and chemical stability, the gas sensors based on TiO 2 materials require high operating temperatures (normally up to 400 1C). This would result in high power consumption and difficulty of packaging. Mixed oxide has been studied to combine the advantages of the sensing property of each oxide component [4–6]. The formation of mixed oxide is classified into three types as follows: (1) Chemical compound. (2) Solid solution. (3) Mix of (1) and (2) types. SnO 2 –TiO 2 falls into the second category. The use of mixed oxides in gas detection has been tried successfully in some systems such as SnO 2 –WO 3 [5], TiO 2 –WO 3 [5–7], TiO 2 –SnO 2 [5,8]. Among these mixed oxides, the SnO 2 –TiO 2 system has been investigated more extensively for gas-sensing applications [5,8–12]. Carbon nanotubes (CNTs) have been the most actively studied material in recent years due to their unique electrical, mechanical and chemical properties, and much attention has been paid to their application in various fields of nanotechnology [13,14]. Moreover, they have nanoscale size and large surface area that can ARTICLE IN PRESS Contents lists available at ScienceDirect journal homepage: www.elsevier.com/locate/physe Physica E 1386-9477/$ - see front matter & 2008 Elsevier B.V. All rights reserved. doi:10.1016/j.physe.2008.07.007 Corresponding author at: International Training Institute for Materials Science (ITIMS), Hanoi University of Technology (HUT), No. 1 Dai Co Viet Road, Hanoi, Vietnam. Tel.: +84 4 8680787; fax: +84 4 8692963. E-mail addresses: [email protected], [email protected] (N. Van Hieu). Physica E 41 (2008) 258–263
-
Upload
independent -
Category
Documents
-
view
0 -
download
0
Transcript of Mixed SnO2/TiO2 included with carbon nanotubes for gas-sensing application

ARTICLE IN PRESS
Physica E 41 (2008) 258–263
Contents lists available at ScienceDirect
Physica E
1386-94
doi:10.1
� Corr
(ITIMS)
Vietnam
E-m
(N. Van
journal homepage: www.elsevier.com/locate/physe
Mixed SnO2/TiO2 included with carbon nanotubes for gas-sensing application
Nguyen Van Duy a, Nguyen Van Hieu b,c,�, Pham Thanh Huy b,c, Nguyen Duc Chien c,d,M. Thamilselvan a, Junsin Yi a
a School of Information and Communication Engineering, Sungkyunkwan University, 300 Chunchun-dong, Jangan-gu, Suwon 440746, South Koreab International Training Institute for Materials Science (ITIMS), Hanoi University of Technology (HUT), No. 1 Dai Co Viet Road, Hanoi, Vietnamc Hanoi Advanced School of Science and Technology (HAST), Hanoi University of Technology (HUT), Vietnamd Institute of Engineering Physics (IEP), Hanoi University of Technology (HUT), Vietnam
a r t i c l e i n f o
Article history:
Received 21 April 2008
Received in revised form
9 July 2008
Accepted 9 July 2008Available online 25 September 2008
PACS:
61.48.De
07.07.df
81.07.De
Keywords:
Mixed SnO2–TiO2
Carbon nanotubes
Gas sensor
77/$ - see front matter & 2008 Elsevier B.V. A
016/j.physe.2008.07.007
esponding author at: International Training I
, Hanoi University of Technology (HUT), No.
. Tel.: +84 4 8680787; fax: +84 4 8692963.
ail addresses: [email protected], hieunv-itim
Hieu).
a b s t r a c t
TiO2 and SnO2 are the well-known sensing materials with a good thermal stability of the former and a
high sensitivity of the latter. Carbon nanotubes (CNTs) have also gas sensing ability at room
temperature. CNTs-included SnO2/TiO2 material was a new exploration to combine the advantages of
three kinds of materials for gas-sensing property. In this work, a uniform SnO2/TiO2 solution was
prepared by the sol–gel process with the ratio 3:7 in mole. The CNTs with contents in the range of
0.001–0.5 wt% were dispersed in a mixed SnO2/TiO2 matrix by using an immersion-probe ultrasonic.
The SnO2–TiO2 and the CNTs-included SnO2–TiO2 thin films were fabricated by the sol–gel spin-coating
method over Pt-interdigitated electrode for gas-sensor device fabrication and they were heat treated at
500 1C for 30 min.
FE-SEM and XRD characterizations indicated that the inclusion of CNTs did not affect the particle
size as well as the morphology of the thin film. The sensing properties of all as-fabricated sensors were
investigated with different ethanol concentrations and operating temperatures. An interesting sensing
characteristic of mixed SnO2/TiO2 sensors was that there was a two-peak shape in the sensitivity versus
operating temperature curve. At the region of low operating temperature (below 280 1C), the hybrid
sensors show improvement of sensing property. This result gives a prospect of the stable gas sensors
with working temperatures below 250 1C.
& 2008 Elsevier B.V. All rights reserved.
1. Introduction
Semiconductor metal oxide gas sensors have been investigatedextensively since the past decades owing to their advantages ofhigh sensitivity to pollutant gases, fast response and recovery, lowcost, easy implementation, and small size [1,2]. Gas sensors basedon SnO2 materials have been commercially available [3,4]. Thin-film gas sensors have improved the gas-sensing properties frombulk or thick- film ones. They not only give a high sensitivity butalso have very fast response and recovery times. However, therestill exist great disadvantages of SnO2 and TiO2 materials. SnO2 isthermally unstable and its electrical properties can be degener-ated upon prolonged thermal treatment in reducing the gasatmosphere [1]. On the other hand, in spite of the high thermaland chemical stability, the gas sensors based on TiO2 materialsrequire high operating temperatures (normally up to 400 1C). This
ll rights reserved.
nstitute for Materials Science
1 Dai Co Viet Road, Hanoi,
would result in high power consumption and difficulty ofpackaging. Mixed oxide has been studied to combine theadvantages of the sensing property of each oxide component[4–6]. The formation of mixed oxide is classified into three typesas follows:
(1)
Chemical compound. (2) Solid solution. (3) Mix of (1) and (2) types.SnO2–TiO2 falls into the second category. The use of mixedoxides in gas detection has been tried successfully in somesystems such as SnO2–WO3 [5], TiO2–WO3 [5–7], TiO2–SnO2 [5,8].Among these mixed oxides, the SnO2–TiO2 system has beeninvestigated more extensively for gas-sensing applications[5,8–12].
Carbon nanotubes (CNTs) have been the most actively studiedmaterial in recent years due to their unique electrical, mechanicaland chemical properties, and much attention has been paid totheir application in various fields of nanotechnology [13,14].Moreover, they have nanoscale size and large surface area that can
ARTICLE IN PRESS
H P 4 1 5 6 ADelta ElectronicES30-5 Power
Supply
Exhaust
Target Gas
Rot
ary
Pum
p
MFC
Mass Flow Controller
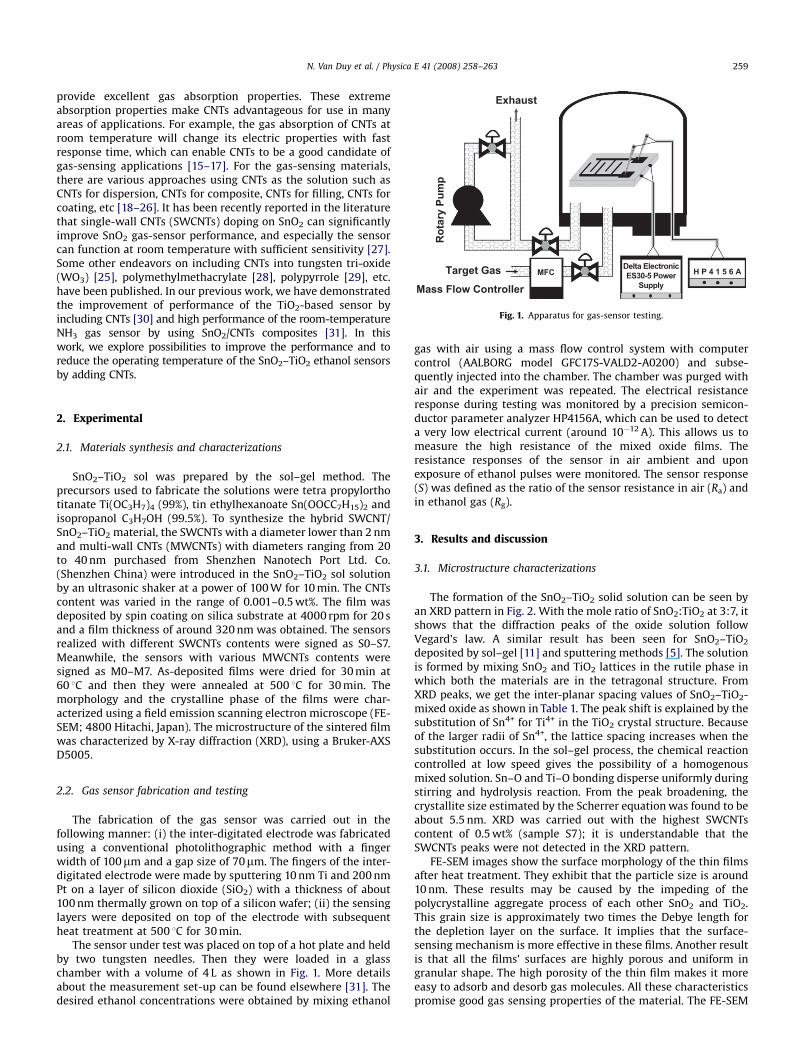
Fig. 1. Apparatus for gas-sensor testing.
N. Van Duy et al. / Physica E 41 (2008) 258–263 259
provide excellent gas absorption properties. These extremeabsorption properties make CNTs advantageous for use in manyareas of applications. For example, the gas absorption of CNTs atroom temperature will change its electric properties with fastresponse time, which can enable CNTs to be a good candidate ofgas-sensing applications [15–17]. For the gas-sensing materials,there are various approaches using CNTs as the solution such asCNTs for dispersion, CNTs for composite, CNTs for filling, CNTs forcoating, etc [18–26]. It has been recently reported in the literaturethat single-wall CNTs (SWCNTs) doping on SnO2 can significantlyimprove SnO2 gas-sensor performance, and especially the sensorcan function at room temperature with sufficient sensitivity [27].Some other endeavors on including CNTs into tungsten tri-oxide(WO3) [25], polymethylmethacrylate [28], polypyrrole [29], etc.have been published. In our previous work, we have demonstratedthe improvement of performance of the TiO2-based sensor byincluding CNTs [30] and high performance of the room-temperatureNH3 gas sensor by using SnO2/CNTs composites [31]. In thiswork, we explore possibilities to improve the performance and toreduce the operating temperature of the SnO2–TiO2 ethanol sensorsby adding CNTs.
2. Experimental
2.1. Materials synthesis and characterizations
SnO2–TiO2 sol was prepared by the sol–gel method. Theprecursors used to fabricate the solutions were tetra propylorthotitanate Ti(OC3H7)4 (99%), tin ethylhexanoate Sn(OOCC7H15)2 andisopropanol C3H7OH (99.5%). To synthesize the hybrid SWCNT/SnO2–TiO2 material, the SWCNTs with a diameter lower than 2 nmand multi-wall CNTs (MWCNTs) with diameters ranging from 20to 40 nm purchased from Shenzhen Nanotech Port Ltd. Co.(Shenzhen China) were introduced in the SnO2–TiO2 sol solutionby an ultrasonic shaker at a power of 100 W for 10 min. The CNTscontent was varied in the range of 0.001–0.5 wt%. The film wasdeposited by spin coating on silica substrate at 4000 rpm for 20 sand a film thickness of around 320 nm was obtained. The sensorsrealized with different SWCNTs contents were signed as S0–S7.Meanwhile, the sensors with various MWCNTs contents weresigned as M0–M7. As-deposited films were dried for 30 min at60 1C and then they were annealed at 500 1C for 30 min. Themorphology and the crystalline phase of the films were char-acterized using a field emission scanning electron microscope (FE-SEM; 4800 Hitachi, Japan). The microstructure of the sintered filmwas characterized by X-ray diffraction (XRD), using a Bruker-AXSD5005.
2.2. Gas sensor fabrication and testing
The fabrication of the gas sensor was carried out in thefollowing manner: (i) the inter-digitated electrode was fabricatedusing a conventional photolithographic method with a fingerwidth of 100mm and a gap size of 70mm. The fingers of the inter-digitated electrode were made by sputtering 10 nm Ti and 200 nmPt on a layer of silicon dioxide (SiO2) with a thickness of about100 nm thermally grown on top of a silicon wafer; (ii) the sensinglayers were deposited on top of the electrode with subsequentheat treatment at 500 1C for 30 min.
The sensor under test was placed on top of a hot plate and heldby two tungsten needles. Then they were loaded in a glasschamber with a volume of 4 L as shown in Fig. 1. More detailsabout the measurement set-up can be found elsewhere [31]. Thedesired ethanol concentrations were obtained by mixing ethanol
gas with air using a mass flow control system with computercontrol (AALBORG model GFC17S-VALD2-A0200) and subse-quently injected into the chamber. The chamber was purged withair and the experiment was repeated. The electrical resistanceresponse during testing was monitored by a precision semicon-ductor parameter analyzer HP4156A, which can be used to detecta very low electrical current (around 10�12 A). This allows us tomeasure the high resistance of the mixed oxide films. Theresistance responses of the sensor in air ambient and uponexposure of ethanol pulses were monitored. The sensor response(S) was defined as the ratio of the sensor resistance in air (Ra) andin ethanol gas (Rg).
3. Results and discussion
3.1. Microstructure characterizations
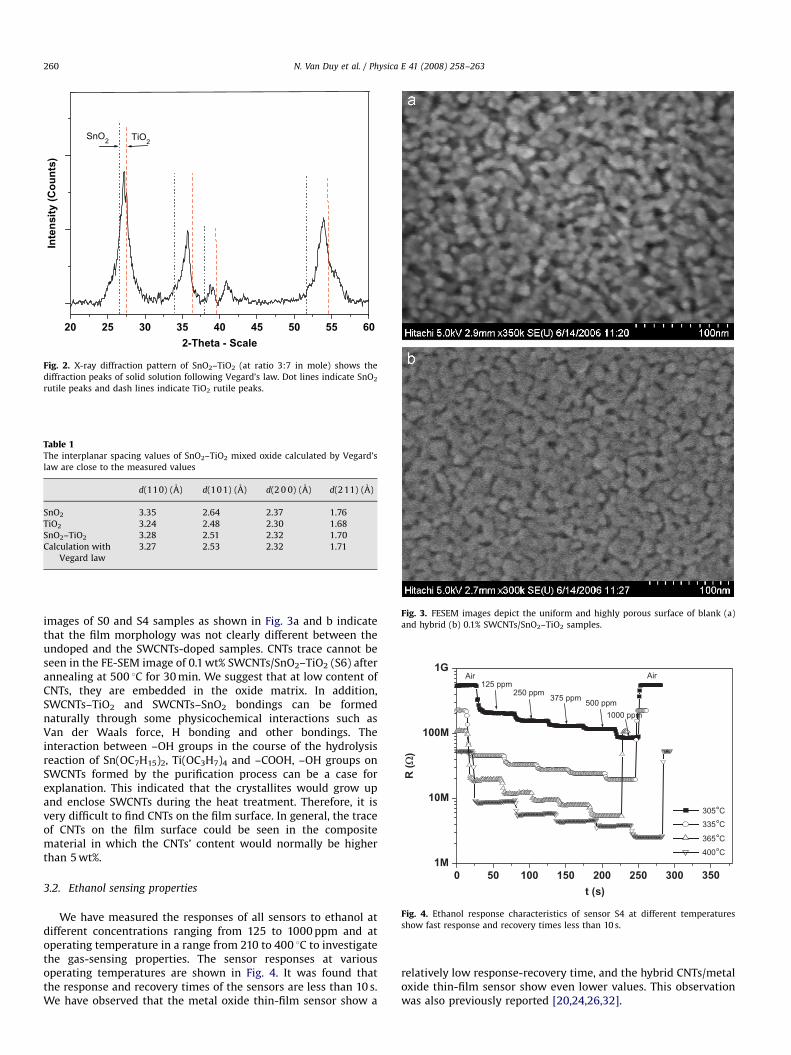
The formation of the SnO2–TiO2 solid solution can be seen byan XRD pattern in Fig. 2. With the mole ratio of SnO2:TiO2 at 3:7, itshows that the diffraction peaks of the oxide solution followVegard’s law. A similar result has been seen for SnO2–TiO2
deposited by sol–gel [11] and sputtering methods [5]. The solutionis formed by mixing SnO2 and TiO2 lattices in the rutile phase inwhich both the materials are in the tetragonal structure. FromXRD peaks, we get the inter-planar spacing values of SnO2–TiO2-mixed oxide as shown in Table 1. The peak shift is explained by thesubstitution of Sn4+ for Ti4+ in the TiO2 crystal structure. Becauseof the larger radii of Sn4+, the lattice spacing increases when thesubstitution occurs. In the sol–gel process, the chemical reactioncontrolled at low speed gives the possibility of a homogenousmixed solution. Sn–O and Ti–O bonding disperse uniformly duringstirring and hydrolysis reaction. From the peak broadening, thecrystallite size estimated by the Scherrer equation was found to beabout 5.5 nm. XRD was carried out with the highest SWCNTscontent of 0.5 wt% (sample S7); it is understandable that theSWCNTs peaks were not detected in the XRD pattern.
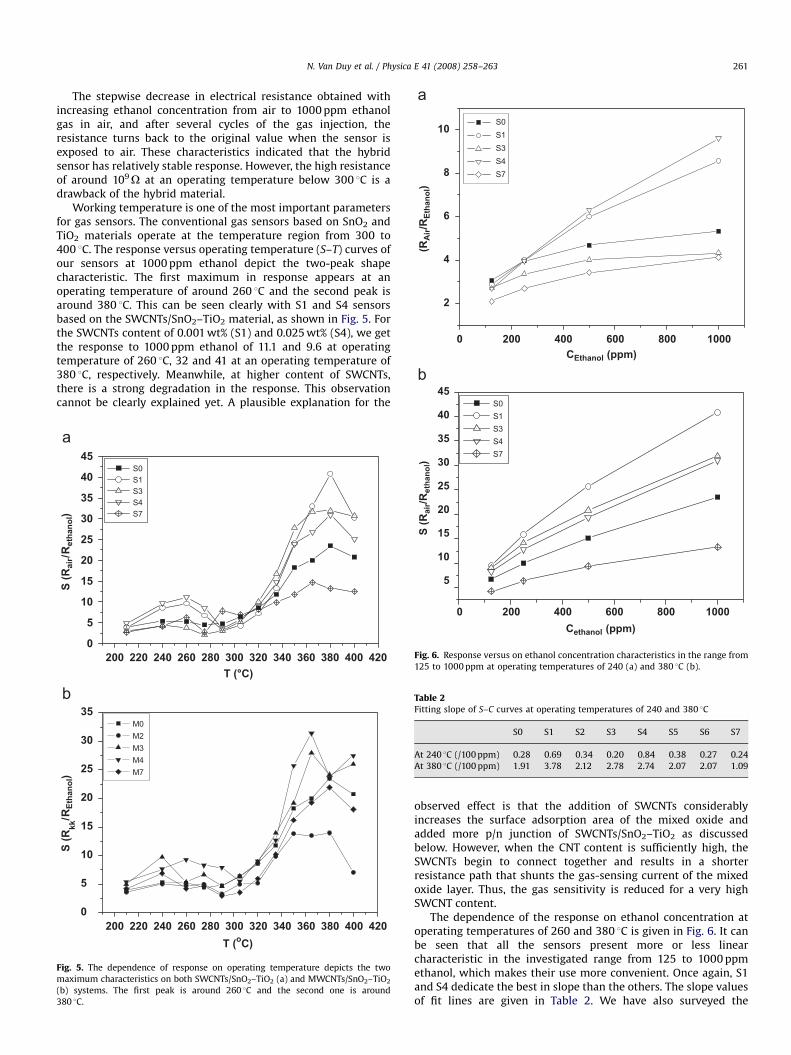
FE-SEM images show the surface morphology of the thin filmsafter heat treatment. They exhibit that the particle size is around10 nm. These results may be caused by the impeding of thepolycrystalline aggregate process of each other SnO2 and TiO2.This grain size is approximately two times the Debye length forthe depletion layer on the surface. It implies that the surface-sensing mechanism is more effective in these films. Another resultis that all the films’ surfaces are highly porous and uniform ingranular shape. The high porosity of the thin film makes it moreeasy to adsorb and desorb gas molecules. All these characteristicspromise good gas sensing properties of the material. The FE-SEM
ARTICLE IN PRESS
Table 1The interplanar spacing values of SnO2–TiO2 mixed oxide calculated by Vegard’s
law are close to the measured values
d(110) (A) d(10 1) (A) d(2 0 0) (A) d(2 11) (A)
SnO2 3.35 2.64 2.37 1.76
TiO2 3.24 2.48 2.30 1.68
SnO2–TiO2 3.28 2.51 2.32 1.70
Calculation with
Vegard law
3.27 2.53 2.32 1.71
Fig. 3. FESEM images depict the uniform and highly porous surface of blank (a)
and hybrid (b) 0.1% SWCNTs/SnO2–TiO2 samples.
1M0 50 100 150 200 250 300 350
10M
100M
1GAirAir
500 ppm
1000 ppm
375 ppm250 ppm
125 ppm
305°C
335°C
365°C
400°C
R (Ω
)
t (s)
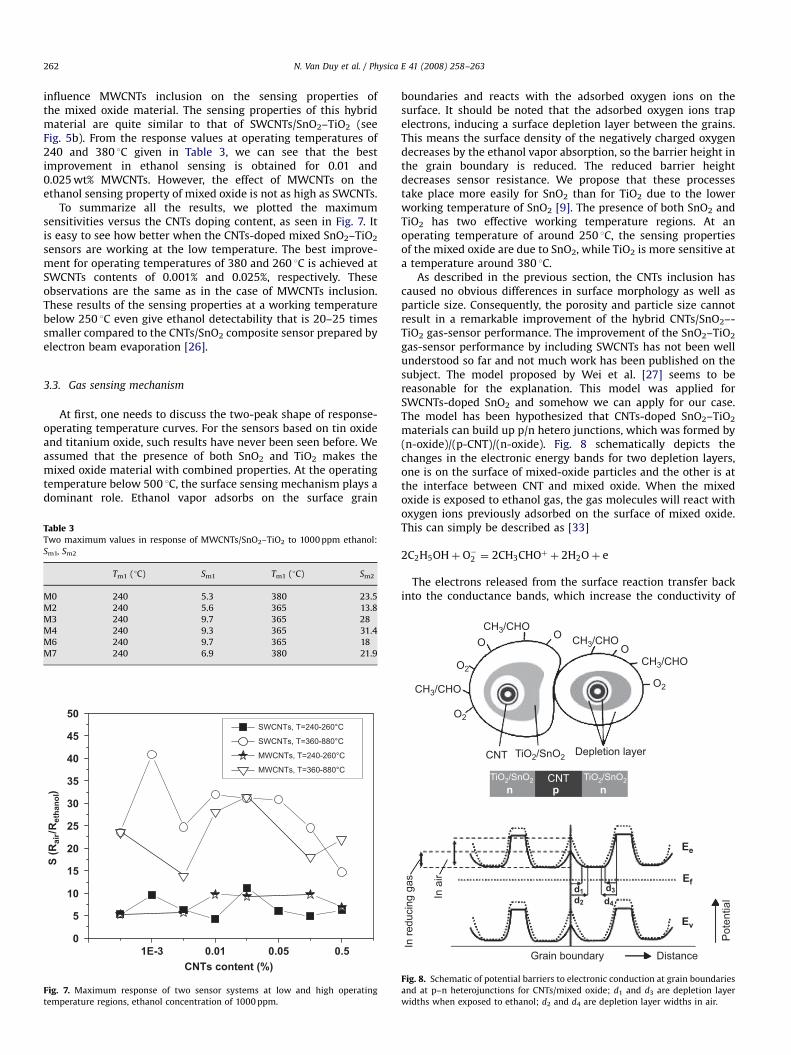
Fig. 4. Ethanol response characteristics of sensor S4 at different temperatures
show fast response and recovery times less than 10 s.
SnO2 TiO
2
2-Theta - Scale
Inte
nsi
ty (
Co
un
ts)
20 25 30 35 40 45 50 55 60
Fig. 2. X-ray diffraction pattern of SnO2–TiO2 (at ratio 3:7 in mole) shows the
diffraction peaks of solid solution following Vegard’s law. Dot lines indicate SnO2
rutile peaks and dash lines indicate TiO2 rutile peaks.
N. Van Duy et al. / Physica E 41 (2008) 258–263260
images of S0 and S4 samples as shown in Fig. 3a and b indicatethat the film morphology was not clearly different between theundoped and the SWCNTs-doped samples. CNTs trace cannot beseen in the FE-SEM image of 0.1 wt% SWCNTs/SnO2–TiO2 (S6) afterannealing at 500 1C for 30 min. We suggest that at low content ofCNTs, they are embedded in the oxide matrix. In addition,SWCNTs–TiO2 and SWCNTs–SnO2 bondings can be formednaturally through some physicochemical interactions such asVan der Waals force, H bonding and other bondings. Theinteraction between –OH groups in the course of the hydrolysisreaction of Sn(OC7H15)2, Ti(OC3H7)4 and –COOH, –OH groups onSWCNTs formed by the purification process can be a case forexplanation. This indicated that the crystallites would grow upand enclose SWCNTs during the heat treatment. Therefore, it isvery difficult to find CNTs on the film surface. In general, the traceof CNTs on the film surface could be seen in the compositematerial in which the CNTs’ content would normally be higherthan 5 wt%.
3.2. Ethanol sensing properties
We have measured the responses of all sensors to ethanol atdifferent concentrations ranging from 125 to 1000 ppm and atoperating temperature in a range from 210 to 400 1C to investigatethe gas-sensing properties. The sensor responses at variousoperating temperatures are shown in Fig. 4. It was found thatthe response and recovery times of the sensors are less than 10 s.We have observed that the metal oxide thin-film sensor show a
relatively low response-recovery time, and the hybrid CNTs/metaloxide thin-film sensor show even lower values. This observationwas also previously reported [20,24,26,32].
ARTICLE IN PRESS
45 S0
0
2
4
6
8
10
CEthanol (ppm)
(RA
ir/R
Etha
nol)
S0 S1 S3 S4 S7
1000800600400200
N. Van Duy et al. / Physica E 41 (2008) 258–263 261
The stepwise decrease in electrical resistance obtained withincreasing ethanol concentration from air to 1000 ppm ethanolgas in air, and after several cycles of the gas injection, theresistance turns back to the original value when the sensor isexposed to air. These characteristics indicated that the hybridsensor has relatively stable response. However, the high resistanceof around 109O at an operating temperature below 300 1C is adrawback of the hybrid material.
Working temperature is one of the most important parametersfor gas sensors. The conventional gas sensors based on SnO2 andTiO2 materials operate at the temperature region from 300 to400 1C. The response versus operating temperature (S–T) curves ofour sensors at 1000 ppm ethanol depict the two-peak shapecharacteristic. The first maximum in response appears at anoperating temperature of around 260 1C and the second peak isaround 380 1C. This can be seen clearly with S1 and S4 sensorsbased on the SWCNTs/SnO2–TiO2 material, as shown in Fig. 5. Forthe SWCNTs content of 0.001 wt% (S1) and 0.025 wt% (S4), we getthe response to 1000 ppm ethanol of 11.1 and 9.6 at operatingtemperature of 260 1C, 32 and 41 at an operating temperature of380 1C, respectively. Meanwhile, at higher content of SWCNTs,there is a strong degradation in the response. This observationcannot be clearly explained yet. A plausible explanation for the
2000
5
10
15
20
25
30
35
40
45
S (R
air/R
etha
nol)
S0 S1 S3 S4 S7
0
5
10
15
20
25
30
35
T (oC)
S (R
kk/R
Etha
nol)
M0 M2 M3 M4 M7
420400380360T (°C)
340320300280260240220
200 420400380360340320300280260240220
Fig. 5. The dependence of response on operating temperature depicts the two
maximum characteristics on both SWCNTs/SnO2–TiO2 (a) and MWCNTs/SnO2–TiO2
(b) systems. The first peak is around 260 1C and the second one is around
380 1C.
5
10
15
20
25
30
35
40 S1 S3 S4 S7
Cethanol (ppm)
S (R
air/R
etha
nol)
0 1000800600400200
Fig. 6. Response versus on ethanol concentration characteristics in the range from
125 to 1000 ppm at operating temperatures of 240 (a) and 380 1C (b).
Table 2Fitting slope of S–C curves at operating temperatures of 240 and 380 1C
S0 S1 S2 S3 S4 S5 S6 S7
At 240 1C (/100 ppm) 0.28 0.69 0.34 0.20 0.84 0.38 0.27 0.24
At 380 1C (/100 ppm) 1.91 3.78 2.12 2.78 2.74 2.07 2.07 1.09
observed effect is that the addition of SWCNTs considerablyincreases the surface adsorption area of the mixed oxide andadded more p/n junction of SWCNTs/SnO2–TiO2 as discussedbelow. However, when the CNT content is sufficiently high, theSWCNTs begin to connect together and results in a shorterresistance path that shunts the gas-sensing current of the mixedoxide layer. Thus, the gas sensitivity is reduced for a very highSWCNT content.
The dependence of the response on ethanol concentration atoperating temperatures of 260 and 380 1C is given in Fig. 6. It canbe seen that all the sensors present more or less linearcharacteristic in the investigated range from 125 to 1000 ppmethanol, which makes their use more convenient. Once again, S1and S4 dedicate the best in slope than the others. The slope valuesof fit lines are given in Table 2. We have also surveyed the
ARTICLE IN PRESS
N. Van Duy et al. / Physica E 41 (2008) 258–263262
influence MWCNTs inclusion on the sensing properties ofthe mixed oxide material. The sensing properties of this hybridmaterial are quite similar to that of SWCNTs/SnO2–TiO2 (seeFig. 5b). From the response values at operating temperatures of240 and 380 1C given in Table 3, we can see that the bestimprovement in ethanol sensing is obtained for 0.01 and0.025 wt% MWCNTs. However, the effect of MWCNTs on theethanol sensing property of mixed oxide is not as high as SWCNTs.
To summarize all the results, we plotted the maximumsensitivities versus the CNTs doping content, as seen in Fig. 7. Itis easy to see how better when the CNTs-doped mixed SnO2–TiO2
sensors are working at the low temperature. The best improve-ment for operating temperatures of 380 and 260 1C is achieved atSWCNTs contents of 0.001% and 0.025%, respectively. Theseobservations are the same as in the case of MWCNTs inclusion.These results of the sensing properties at a working temperaturebelow 250 1C even give ethanol detectability that is 20–25 timessmaller compared to the CNTs/SnO2 composite sensor prepared byelectron beam evaporation [26].
3.3. Gas sensing mechanism
At first, one needs to discuss the two-peak shape of response-operating temperature curves. For the sensors based on tin oxideand titanium oxide, such results have never been seen before. Weassumed that the presence of both SnO2 and TiO2 makes themixed oxide material with combined properties. At the operatingtemperature below 500 1C, the surface sensing mechanism plays adominant role. Ethanol vapor adsorbs on the surface grain
1E-30
5
10
15
20
25
30
35
40
45
50
CNTs content (%)
SWCNTs, T=240-260°C
SWCNTs, T=360-880°C
MWCNTs, T=240-260°C
MWCNTs, T=360-880°C
S (R
air/R
etha
nol)
0.50.050.01
Fig. 7. Maximum response of two sensor systems at low and high operating
temperature regions, ethanol concentration of 1000 ppm.
Table 3Two maximum values in response of MWCNTs/SnO2–TiO2 to 1000 ppm ethanol:
Sm1, Sm2
Tm1 (1C) Sm1 Tm1 (1C) Sm2
M0 240 5.3 380 23.5
M2 240 5.6 365 13.8
M3 240 9.7 365 28
M4 240 9.3 365 31.4
M6 240 9.7 365 18
M7 240 6.9 380 21.9
boundaries and reacts with the adsorbed oxygen ions on thesurface. It should be noted that the adsorbed oxygen ions trapelectrons, inducing a surface depletion layer between the grains.This means the surface density of the negatively charged oxygendecreases by the ethanol vapor absorption, so the barrier height inthe grain boundary is reduced. The reduced barrier heightdecreases sensor resistance. We propose that these processestake place more easily for SnO2 than for TiO2 due to the lowerworking temperature of SnO2 [9]. The presence of both SnO2 andTiO2 has two effective working temperature regions. At anoperating temperature of around 250 1C, the sensing propertiesof the mixed oxide are due to SnO2, while TiO2 is more sensitive ata temperature around 380 1C.
As described in the previous section, the CNTs inclusion hascaused no obvious differences in surface morphology as well asparticle size. Consequently, the porosity and particle size cannotresult in a remarkable improvement of the hybrid CNTs/SnO2–-TiO2 gas-sensor performance. The improvement of the SnO2–TiO2
gas-sensor performance by including SWCNTs has not been wellunderstood so far and not much work has been published on thesubject. The model proposed by Wei et al. [27] seems to bereasonable for the explanation. This model was applied forSWCNTs-doped SnO2 and somehow we can apply for our case.The model has been hypothesized that CNTs-doped SnO2–TiO2
materials can build up p/n hetero junctions, which was formed by(n-oxide)/(p-CNT)/(n-oxide). Fig. 8 schematically depicts thechanges in the electronic energy bands for two depletion layers,one is on the surface of mixed-oxide particles and the other is atthe interface between CNT and mixed oxide. When the mixedoxide is exposed to ethanol gas, the gas molecules will react withoxygen ions previously adsorbed on the surface of mixed oxide.This can simply be described as [33]
2C2H5OHþ O�2 ¼ 2CH3CHOþ þ 2H2Oþ e
The electrons released from the surface reaction transfer backinto the conductance bands, which increase the conductivity of
CNT
CNTn
d1d2
d3
d4
n
Ee
Ef
Ev
p
Depletion layer
Distance
Pot
entia
l
In re
duci
ng g
as
In a
ir
Grain boundary
TiO2/SnO2
CH3/CHO
CH3/CHOCH3/CHO
CH3/CHO
TiO2/SnO2 TiO2/SnO2
O2
O2
O2
OO
O
Fig. 8. Schematic of potential barriers to electronic conduction at grain boundaries
and at p–n heterojunctions for CNTs/mixed oxide; d1 and d3 are depletion layer
widths when exposed to ethanol; d2 and d4 are depletion layer widths in air.

ARTICLE IN PRESS
N. Van Duy et al. / Physica E 41 (2008) 258–263 263
the sensing material. It is noted that the adsorption of the ethanolgas may change the two depletions layers as described above.Before the ethanol gas is adsorbed, the widths of the depletionlayers at the interface between mixed oxide grains and mixedoxide/CNT are given as d2 and d4, respectively. After theadsorption, the widths of these depletion layers are d1 and d3,respectively. The change in both the depletion layers at the oxidegrain boundaries and the n/p junction contributed to theimproved sensitivity of the sensing materials. In other words,n-type mixed oxide and p-type CNT form a heterostructure. Likethe working principle of an n–p–n amplifier, the CNT works as abase, blocked electrons transfer from n (emitter) to n (collector),and thus lowering the barrier a little bit allows a large amount ofelectrons to pass from the emitter to the collector [24]. Thisamplification effect may explain the fact that the hybrid materials(SnO2/SWCNTs) can detect NO2 at room temperature [27]. So theimprovement of the gas sensor performance and the shift ofoperation temperature toward the lower temperature region inour work can be attributed to the amplification effect of the p–njunctions in addition to the effect of the grain boundaries.
Meanwhile, the fact that the contribution of MWCNTs(20odo40 nm) is not as much as SWCNTs (do2 nm) can beexplained based on the quantum effect as follows. The spacecharge layer thickness (Debye length) is around 3 nm for the metaloxides (for example SnO2). So the largest distance betweenadjacent boundaries accessing gas molecules should be less than6 nm [34]. However, mixed oxide (SnO2/TiO2) grains are muchlarger than 6 nm so that not all metal oxides can participate in thereaction when gas absorbs on it. Therefore, the mixed-oxide/SWCNT material structure formed by inclusion of the SWCNTswith diameter lower than 2 nm will produce quantum effectsbetween SWCNTs and mixed oxide nanoparticles. The SWCNTswith a diameter of o2 nm reduce the distance between twoadjacent gas-assessing and reaction surface to be less than thespace charge layer thickness.
4. Conclusion
SnO2–TiO2 mixed oxide has been studied at the ratio 3:7 inmole for ethanol-sensing properties. At appropriate annealingconditions, it has shown the formation of the solid solution fromtwo components by the XRD pattern. All the film surfaces wereuniform and highly porous. In addition, the grain size around10 nm gave a high specific surface. The new explorer in the two-peak shape of the response versus operating temperaturecharacteristics has proved the combined behavior of the mixed-oxide material. SnO2 and TiO2 are complementary to each otherfor gas-sensing properties. The inclusion of CNTs at specificcontents into the mixed oxide system improved the response ofthe sensor in the low operating temperature region. Furtherstudies on this type of material would make it a promising
candidate for gas sensing application that can work at around250 1C with a high stability.
Acknowledgements
This work was financially supported by HAST Project no. 01.The authors also acknowledge Grant no. 405006 (2006) from theBasic Research Program of the Ministry of Science and Technology(MOST) and for the financial support from Third Italian-VietnameseExecutive Programme of Co-operation in S&T for 2006–2008under the project ‘‘Synthesis and Processing of Nanomaterials forSensing, Optoelectronics and Photonic Applications’’.
References
[1] J. Puigcorbe, A. Cirera, J. Cerda, J. Folch, A. Cornet, J.R. Morante, Sens. ActuatorsB 84 (2002) 60.
[2] G. Eranna, B.C. Joshi, D.P. Runthala, R.P. Gupta, Crit. Rev. Solid State Mater. Sci.29 (2004) 111.
[3] Figaro Eng. Inc. /http://www.figarosensor.comS.[4] Microsens Inc. /http://www.microsens.chS.[5] K. Zakrzewska, Thin Solid Films 391 (2001) 229.[6] P. Nelli, L.E. Depero, M. Ferroni, S. Groppelli, V. Guidi, F. Ronconi, L. Sangaletti,
G. Sberveglieri, Sens. Actuators B 31 (1996) 89.[7] G.N. Chaudhari, A.M. Bende, A.B. Bodade, S.S. Patil, V.S. Sapkal, Sens. Actuators
B 115 (2006) 297.[8] K. Zakrzewska, M. Radecka, Thin Solid Films 515 (2007) 8332.[9] H.-C. Lee, W.-S. Hwang, Appl. Surf. Sci. 253 (2006) 1889.
[10] R.-J. Wu, C.-Y. Chen, M.-H. Chen, Y.-L. Sun, Sens. Actuators B 123 (2007) 1077.[11] M. Radecka, K. Zakrzewska, M. Rekas, Sens. Actuators B 47 (1998) 194.[12] C.M. Carney, S.Y. Sheikh, A. Akbar, Sens. Actuators B 108 (2005) 29.[13] T.W. Ebbesen, Annu. Rev. Mater. Sci. 24 (1994) 235.[14] R.H. Baughman, A.A. Zakhidov, W.A. de Heer, Science 297 (2002) 787.[15] A. Modi, N. Koratkar, E. Lass, B. Wei, Nature 424 (2003) 171.[16] T. Someya, J. Small, P. Kim, C. Nuckolls, J.T. Yardley, Nano Lett. 3 (2003) 877.[17] J. Li, Y. Lu, Q. Ye, M. Cinke, J. Han, M. Meyyappan, Nano Lett. 3 (2003) 929.[18] Y.-L. Liu, H.-F. Yang, Y. Yang, Z.-M. Liu, G.-L. Shen, R.-Q. Yu, Thin Solid Films
497 (2006) 355.[19] L. Zhao, L. Gao, Carbon 42 (2004) 3251.[20] Y.X. Liang, Y.J. Chen, T.H. Wang, Appl. Phys. Lett. 85 (2005) 666.[21] A. Yang, X. Tao, R. Wang, S. Lee, C. Surya, Appl. Phys. Lett. 91 (2007) 133110.[22] E.H. Espinosa, R. Ionescu, B. Chambon, G. Bedis, E. Sotter, C. Bittencourt,
A. Felten, J.J. Pireaux, E. Lolbet, Sens. Actuators B 127 (2007) 137.[23] R. Ionescu, E.H. Espinosa, R. Leghrib, A. Felten, J.J. Pireaux, R. Erni,
G.V. Tendeloo, C. Bittencourt, N. Canellas, E. Llobet, Sens. Actuators B 131(2008) 174.
[24] J. Gong, J. Sun, Q. Chen, Sens. Actuators B 130 (2008) 829.[25] C. Bittencourt, A. Felten, E.H. Espinosa, R. Ionescu, E. Llobet, X. Correig,
J.-J. Pireaux, Sens. Actuators B 115 (2006) 33.[26] A. Wisitsoraat, A. Tuantranont, C. Thanachayanont, V. Patthanasettakul,
P. Singjai, J. Electroceram. 17 (2006) 45.[27] B.-Y. Wei, M.-C. Hsu, P.-G. Su, H.-M. Lin, R.-J. Wu, H.-J. Lai, Sens. Actuators B
101 (2004) 81.[28] B. Philip, J.K. Abraham, A. Chandrasekhar, Smart Mater. Struct. 12 (2003) 935.[29] K.H. An, S.Y. Jeong, H.R. Hwang, J.H. Lee, Adv. Mater. 16 (2004) 1005.[30] N. Van Hieu, N. Van Duy, N.D. Chien, Physica E: Low-Dimensional Syst.
Nanostruct. 40 (2008) 2950.[31] N. Van Hieu, L.T.B. Thuy, N.D. Chien, Sens. Actuators B 129 (2008) 888.[32] H.C. Wang, Y. Li, M.J. Yang, Sens. Actuators B 119 (2006) 380.[33] H. Idriss, E.G. Seebauer, J. Mol. Catal. A: Chem. 152 (2000) 201.[34] Noboru Yamazoe, Sens. Actuators B 5 (1991) 7.