Nobel metal-TiO2 nanocomposites - Investigo
154
NOBEL METAL-TiO 2 NANOCOMPOSITES: SYNTHESIS, CHARACTERIZATION AND CATALYTIC ACTIVITY Memoria que presenta Ana Cláudia Lobão do Nascimento para optar al grado de Doctor Vigo, Septiembre de 2015
-
Upload
khangminh22 -
Category
Documents
-
view
0 -
download
0
Transcript of Nobel metal-TiO2 nanocomposites - Investigo

NOBEL METAL-TiO2
NANOCOMPOSITES:
SYNTHESIS,
CHARACTERIZATION
AND CATALYTIC
ACTIVITY
Memoria que presenta
Ana Cláudia Lobão do Nascimento
para optar al grado de Doctor
Vigo, Septiembre de 2015


DEPARTAMENTO DE QUÍMICA FÍSICA
NOBEL METAL-TiO2 NANOCOMPOSITES:
SYNTHESIS, CHARACTERIZATION AND
CATALYTIC ACTIVITY
Memoria que presenta Ana Cláudia Lobão do Nascimento
Para optar al grado de Doctor
Vigo, 15 de Septiembre de 2015


Contents
Thesis Scope 1
1.General introduction 5
1.1. Metal nanoparticles 5
1.1.1. Localized surface plasmon resonance 7
1.1.1.1. Spherical particles. Mie theory 8
1.1.1.2. Core-shell particles. Correct Mie Theory 10
1.1.2. Catalysis by metal nanoparticles 11
1.1.2.1. Reduction of hexacyanoferrate (III) by borohydride 12
1.2. Titanium dioxide 15
1.2.1. Gold nanoparticles doped titania 18
1.2.2. Catalysis by gold nanoparticles supported on TiO2 20
1.2.3. Elementary steps in photocatalytic TiO2 systems 21
1.2.3.1. Photocatalytic TiO2@Au systems 24
2. Titania-coated gold nanoparticles and growth of titania shell 27
2.1. Introduction 28
2.2. Experimental section 29
2.3. Results and discussion 32
2.4. Conclusions 39
3. Synthesis and characterization of Au-doped TiO2 nanoparticles 41
3.1. Introduction 42
3.2. Experimental section 44
3.3. Results and discussion
3.3.1. Anatase titanium dioxide
3.3.2. Gold-doped titanium dioxide nanoparticles
47
47
53
3.2.3.1. Electrostatic adsorption of AuCl4− on TiO2 surface 54
3.2.3.2. Adsorption of Au(Cl)4−n(OH)n− ions/Au(OH)3on TiO2 surface 55
3.2.3.3. Deposition-precipitation with urea 57
3.4. Conclusions 63
4. TiO2@Au catalyzed reduction of ferrycianate (III) by borohydride ions 65
4.1. Introduction 66
4.2. Experimental section 67
4.3. Results and discussion 68
4.3.1. Influence of borohydride concentration 69
4.3.2. Influence of the amount of catalyst 70
4.3.3. Influence of temperature 72
4.3.4. Recyclability of TiO2@Au catalyst 74
4.3.5. Effect of titania on the reaction rate 75
4.3.6. Model proposed for the catalytic process 77
4.4. Conclusions 78
5. Photochemical activity of TiO2 / TiO2@Au systems 81
5.1. Introduction 82

5.2. Experimental section 83
5.3. Results and discussion 84
5.3.1. Photoreduction of gold species on TiO2@Au composites 84
5.3.2. Photocatalytic degradation of rhodamine B 86
5.4. Conclusions 92
Conclusions 93
Appendix I 97
Appendix II 105
Appendix III 111
Resumen 113
Acknowledgements 135
References 137

1
Thesis Scope
The work presented in this thesis is focused on the synthesis, characterization and catalytic
activity of gold-TiO2 composites. We wanted to take advantage of the experience of the
Colloid Chemistry Group, whose activity is strongly focused on the synthesis,
characterization and evaluation of the formation mechanism of metal nanocrystals (mainly
gold and silver) with size and shape control, which allows a fine-tuning of the optical
response of these colloids in the UV-vis-NIR spectral range. Moreover, their experience also
allowed the possibility to design core-shell nanoparticles of metal nucleus (e.g. silver, gold)
surrounds by a layer of a material such as silica or titania. These core-shell systems allow
control the properties of the colloid by means of careful modification of the dimensions of the
core-shell geometry and of the nature of both the core and the shell. For instance, coating of
gold nanoparticles with a semiconductor material like titanium dioxide make them interesting
materials to be used for energy conversion of solar to electrical energy inside an
electrochemical cell, for the photocatalytic degradation of organic pollutants and for chemical
sensors, among others. In this context, we wanted, at first, coated gold nanoparticles with a
uniform shell of titanium dioxide, Au@TiO2. However, nanoparticles coated with titanium
dioxide are generally difficult to synthesize, because common titania precursors are highly
reactive, and thus control over their hydrolysis and condensation is not straightforward.
Different strategies were followed to achieve a homogeneous titania shell with controlled
thickness. Only, an approach based on the combination of the layer-by-layer self-assembly
technique and the hydrolysis and condensation of titanium (IV) butoxide allowed obtain
core-shell gold-titania nanocomposites, as describe in Chapter 2. Characterization of these
Au@TiO2 core-shell nanocomposites was carried out by UV-vis spectroscopy and electron
microscopy techniques.
In a second stage, composites of titanium dioxide doped by gold nanoparticles, TiO2@Au,
were synthesized in a two-step protocol. The strategy is based on the preparation of
spindle-shaped TiO2 nanoparticles and after the Au deposition following different strategies,
as explored in Chapter 3. Is generally known, that nanostructured catalysts with porosity are
one effective way to improve the surface area and the elementary processes in

THESIS SCOPE
2
(photo)catalysis, namely they offer a shorter path for the reagents reached the surfaces actives.
Therefore, we decided to synthesize nanoporous anatase titania nanoparticles with a high
surface area. Also, it is well known that the catalytic behavior of TiO2@Au (photo)catalysts is
strongly influenced by the size of the gold nanoparticles and by their reciprocal interaction.
Therefore, TiO2 nanoparticles homogeneously doped with gold NPs with about 2 and 4 nm in
diameter were obtained only by the method of deposition-precipitation with urea followed by
reduction with sodium borohydride. The structural, physico-chemical and morphological
properties of TiO2 and Au-doped TiO2 were examined by transmission electron microscopy,
high resolution transmission electron microscopy, X-ray photoelectron spectroscopy,
UV-visible absorption spectroscopy, X- ray diffraction, dynamic light scattering, selected area
electronic diffraction, and Brunauer-Emmett-Teller surface area studies.
In Chapter 4, knowing that citrate stabilized gold nanoparticles are very efficiency catalyst for
the reduction of ferricyanide ion to ferrocyanide by sodium borohydride, we studied the
catalytic activity of TiO2@Au composites in the this reduction reaccion, in order to
understand the importance of TiO2 support on kinetic results and provide a clear and relevant
characterization of this catalytic system. Therefore, the catalytic activity of TiO2@Au catalyst
was compared with the catalytic activity of anatase titania mesocrystals and citrate-stabilized
Au nanoparticles. Furthermore, it is well know that the catalytic activity of TiO2@Au
composites is affected by the gold nanoparticles size and the gold loading. So, TiO2@Au
samples with different Au loading (Au particle size remained unchanged) and with gold
nanoparticles of about 2 and 4 nm in diameter were used to study effect of the Au loading and
the gold NP size effect, respectively on the reaction rate of reduction of ferricyanide by
borohydride ions. Moreover, the colloidal stability, proven by reusing the TiO2@Au catalyst
without loss of catalytic activity, during the reaction allows us to propose a mechanism of the
catalyzed reaction after the kinetic analysis of the results.
In Chapter 5, knowing that heterogeneous photocatalysis based on TiO2 has been the focal
point of numerous investigations in recent years because of the chemical stability of this
material, its lack of toxicity, and its potential utility for total destruction of organic
compounds in polluted air and wastewater. Furthermore, TiO2 samples synthesized exhibits
stronger absorption in the UV-visible range with a red shift in the band gap transitions. So, the
photocatalytic activity for degradation of rhodamine B was investigated in water under visible
light using the prepared TiO2/TiO2@Au samples. In addition to this, the electrons transfer
from anatase titanium dioxide nanoparticles to the gold ions (Au1+
/Au3+
) in the TiO2@Au

THESIS SCOPE
3
composites, prepared by deposition-precipitation with urea and before NaBH4 reduction,
under sunlight irradiation was checked.
In the last chapter, a general conclusions of this thesis are presented. Finally, a synopsis, in
Spanish, of this dissertation is included at the end of the thesis as required by the regulation of
University of Vigo.

THESIS SCOPE
4

5
CHAPTER 1
General Introduction
1.1. Metal nanoparticles
Nanoparticles (NPs) has become an area of intense scientific activity, which are able to
establish a bridge between bulk materials and molecular structures and have a wide variety of
potential applications in biomedical, environmental, optical, and electronic fields. At the
nanoscale range the percentage of atoms at the surface of a material becomes significant, high
surface to volume ratio. It gives rise to interesting and sometimes unexpected properties of
NPs which are not observed in bulk material. Importantly, at the nanoscale the properties are
size and even shape dependent.
Nowadays, metal NPs of different composition, shape and size can be easily obtained through
chemical, photochemical, physical, and biologicalI strategies. For instance, the most
commonly used method to synthesize quasi-spherical gold NPs in the range of 10-40 nm is
the Turkevich method1. This method consists on the reduction of tetrachloroauric acid,
HAuCl4, in a boiling sodium citrate aqueous solution, leading to the formation of citrate
stabilized gold colloids with low polydispersity. This strategy also allows the production of
Au NPs larger than 40 nm, however the obtained NPs are then rather polydisperse in size and
shape. Nevertheless, uniform Au NPs larger than 40 nm have been synthesized using seeded
growth process. For example, Rodríguez-Fernández et al.2 have synthesized
cetyltrimethylammonium bromide, CTAB, stabilized gold NPs in a wide range, from 12 up to
180 nm, with low polydispersity by a multistep seeded growth process, using in the first
growth step a seed solution of 12 nm citrate-stabilized Au NPs, synthesized according to the
Turkevich method and diluted in a CTAB solution, ascorbic acid as a reducing agent and
CTAB as the stabilizer.
I Biological systems such as bacteria, fungi, actinomycetes, yeasts, viruses, and plants have been
reported to synthesize various metal and metal oxide NPs.

GENERAL INTRODUCTION
6
Bimetallic nanoparticles, in which two different metal elements are assembled, are attractive
because their properties often differ from those of its individual constituents3. Besides, the
properties depend on the arrangement of the individual metallic atoms within the particle, that
is, alloys, core-shell, heterodimers or core-satellites. In the alloy structure the metals A and B
are located completely at random (see Figure 1.1 (a)). In the core-shell structure a shell of A
atoms surround a core of B atoms (see Figure 1.1 (b)). The heterodimers structures often
exhibit small metal clusters which are located on/within a larger cluster (see Figure 1.1 (c)). It
should be noted there are other possible structures of bimetallic NPs, including intermetallic
structures and sub-surface shells4 (see Figure 1.1 (d) and (e), respectively).
Figure 1.1: Schematic illustration of various structures of bimetallic nanoparticles. Random alloy (a);
core-shell (b); heterodimers (c); intermetallic (d); and sub-surface shells (e).
Bimetallic NPs can be prepared by chemical methods, via simultaneous or successive
reduction of two metal ions (see Figure 1.2) in the presence of a suitable capping or template
stabilization strategy. To prepare core-shell bimetallic nanoparticle the seeded growth method
is generally used. In this method, the second metal is deposited on the surface of pre-formed
metallic NPs. The simultaneous reduction of the precursors often yields a heterodimer
structure, or a mixture of two kinds of monometallic NPs.
Figure 1.2: Schematic view of the synthesis of bimetallic nanoparticles by co-reduction method (a)
and successive reduction method (b).

GENERAL INTRODUCTION
7
1.1.1. Localized surface plasmon resonance
The localized surface plasmon resonance (LSPR) is an optical phenomena found in metallic
nanoparticles responsible for their remarkable optical properties. The LSPR arises from the
resonant interaction of the free electrons in the metal nanoparticles with an incident
electromagnetic radiation. When a small spherical nanoparticle is irradiated by light, the free
electrons are displaced with respect to fixed metal “positive core”, creating a dipole in the
spherical nanoparticle. The metal “positive core” acting as a restoring force due to the
Coulomb attraction, allows the free electrons cloud oscillates forth and back of the core (see
Figure 1.3).
Figure 1.3: Schematic representation of the LSPR induced in a metallic sphere upon excitation with
an electromagnetic radiation. E = Electric field, B = Magnetic field and k = Propagation direction.
Reproduced from reference [5].
This collective oscillation of conduction electrons is known as plasmon. It is observed
experimentally as a plasmon bandII in the UV region for Pb, Sn, Hg nanoparticles or in the
visible region for gold, silver or copper. Therefore, Au, Ag or Cu nanoparticles tend to exhibit
very bright colorsIII
(see Figure 1.4) and show applications in a different fields (sensing6,
photonics7
, bioelectronic devices8 and in medical imaging/diagnostics/treatment
9, etc.).
The resonance frequency (𝜔) is given by the following expression:
𝜔 = (𝑒2
𝜖0𝑚𝑒𝑓𝑓4𝜋𝑅𝑠3)
1
2 (1.1)
II As long as the metallic sphere is small compared to the radiation wavelength, the collective
oscillation of the electrons is dipolar in nature. III
The Roman cup illustrating the myth of King Lycurgus (4th century, exposed in the British
Museum) or the glass windows of Sainte Chappelle in Paris are examples of old applications of
metallic colloids. The glass Lycurgus cup contains Au and Ag NPs and it is wine-red in transmitted
light and appears opaque green in reflected light.

GENERAL INTRODUCTION
8
where 𝑅𝑠 is the radius of a sphere, 𝑚𝑒𝑓𝑓 is the effective mass and 𝜖0 is the vacuum
permittivity and 𝑒 is the electron charge. The resonance frequency depends on other
additional parameters, such as particle shape, composition and surrounding medium.
Figure 1.4: Dispersions of gold nanodecahedra, prepared by seeded growth in DMF using different
amounts of Au seed solution, with different particle sizes (increasing from left to right). The LSPR
determines the color. Samples prepared by the Colloid Group of the University of Vigo.
1.1.1.1. Spherical particles. Mie theory
The LSPR occurs when light interacts with NPs that are much smaller than the incident
wavelength. Besides it is strongly dependent on nanoparticle size, shape, composition and the
dielectric constant of the environment3,10
.
The optical response of a metal nanoparticle with a dielectric function 𝜖(𝜔) can be modelled
by solving Maxwell equations taking into account particles geometry, illumination conditions
and assuming a local (𝜖(𝜔)) description of the materials involved. In 1908, Gustav Mie11
analytically solved Maxwell’s equations for an electromagnetic light wave interacting with a
metal sphere, much smaller than the wavelength of light, with a complex and frequency
dependent dielectric constant 𝜖(𝜆) = 𝜖′(𝜆) + 𝑖𝜖"(𝜆), embedded in a medium with dielectric
constant 𝜖𝑚. SPR can be quantitatively explained according to the following equation:
𝐶𝑒𝑥𝑡 =24𝜋2𝑅3𝜖𝑚
3/2
𝜆
𝜖′′
(𝜖′+2𝜖𝑚)2+ 𝜖′′2 (1.2)
where 𝐶𝑒𝑥𝑡 is the extinction cross-section, 𝑅 is the radius of the particle, is the wavelength
of the incident electromagnetic radiation and 𝜖′and 𝜖′′are the real and imaginary parts of the
dielectric constant, respectively.
From Equation 1.2, it can be concluded that there is no absorption if 𝜖′′ = 0 (i.e.,
non-absorbing particles) or 𝜖′′ = ∞ (i.e., particles reflecting all the radiation). The origin of
the strong color changes displayed by small particles lies in the denominator of Equation 1.2,
which predicts the existence of an absorption peak when 𝜖′ = −2𝜖𝑚, if 𝜖′′ is small.
In the case of many metals, the electromagnetic region up to bulk plasma frequency is
dominated by the free electron behavior, and the dielectric response is well described by the

GENERAL INTRODUCTION
9
Drude model12
. According to this theory, the real and imaginary parts of the dielectric
function are given by3:
𝜖′ = 𝜖∞ −𝜔𝑝
2
𝜔2+ 𝜔𝑑2 (1.3)
𝜖′′ =𝜔𝑝
2 𝜔𝑑
𝜔(𝜔2+𝜔𝑑2)
(1.4)
where 𝜖∞ is the high frequency dielectric constant due to interband and core transitions, 𝑝
the bulk plasma frequency, and 𝑑 is the damping frequency. The bulk plasmon frequency is
given by:
𝜔𝑝2 =
𝑁𝑒2
𝑚𝜖0 (1.5)
were 𝑁 is the density of conduction electrons, 𝑚 is their effective optical mass, and 𝑒 the
electron charge. Additionally, the damping frequency (𝑑) is related to the mean free path of
the conduction electrons (𝑅bulk) and the velocity of the electrons at the Fermi energy (𝑣𝑓) by3:
𝜔𝑑 =𝑣𝑓
𝑅bulk (1.6)
When the particle radius, R, is smaller than the mean free path in the bulk metal, conduction
electrons are additionally scattered off the surface, and the effective mean free path, 𝑅eff,
becomes size dependent with:
1
𝑅eff=
1
𝑅+
1
𝑅bulk (1.7)
This equation was experimentally verified by Kreibig13
for silver and gold NPs down to 2 nm.
The advantage of using the Drude model is that it allows changes in the absorption spectrum
to be directly interpreted in terms of the material properties of the metal.
From equation 1.3 it can be observed that over the whole frequency regime below the bulk
plasma frequency, 𝜖′, is negative. It is due to the fact that the electrons oscillate out of phase
with the electric field vector of the light wave. This is why metal particles display extinction
spectra strong dependent of the particle size.
In a small metal particle, when the condition 𝜖𝑟() = −2𝜖𝑚 is fulfilled, the long wavelength
absorption by the bulk metal is condensed into a single localized surface plasmon resonance
band. But LSPR can be damped by interband transitions (transitions of bound electrons from
occupied to empty bulk bands of different index), by surface dispersion of the free electrons
(when their mean free path is similar to the particle size) or by scattering (retardation) effects
(more and more important when the particle size increases). While surface dispersion effects
produces the broadening and intensity decrease of the LSPR band, the scattering effects
(important for nanoparticles larger than 40 nm) also give rise a remarkable red-shift of the

GENERAL INTRODUCTION
10
band14
. Besides, while for small particles only dipolar modes are observed, new high
multipolar plasmon modes can be accommodated within the particle surface for sizes above
100 nm (the size limit decreases with the anisotropy)15
. The multipolar modes are always
located at higher energies with respect to the dipolar ones, which are always shifted to lower
energies by the presence of the electric field from the multipolar charge distributions.
Another important parameter affecting the LSPR is the surrounding environment. The
electron oscillations confined at the surface of NPs are very sensitive to any change in the
metal-dielectric interface. According to equation 1.2, it is apparent that the dielectric constant
of the surrounding medium determines the surface plasmon resonance of the nanoparticle. An
increase in the dielectric constant, particularly the refractive index 𝑛, (𝑛 = 𝜖𝑚
12⁄), of the
surrounding medium results in a decrease in the restoring force for the electron oscillation,
thus decreasing the plasmon oscillation frequency16
. More specifically, the LSPR wavelength
(λmax) of the NPs has been found to increase linearly with the local refractive index3,17
.
Finally the change in the electron density causes shifts in LSPR band of metallic nanoparticles
(see Equation 1.5), such as predicted by the Drude Model3. Kamat et al.
18,19 demonstrated that
the blue-shift band is associated with the electron density around metallic nanoparticles when
irradiated by UV light. The same behavior can be observed by the addition of an electron
donor such as sodium borohydride ions3. Extensive optical studies on bimetallic NPs colloids
performed during eighties and early nineties are summarized in the review by Mulvaney3.
1.1.1.2. Core-shell particles. Corrected Mie theory
For the particular case of a homogeneous sphere uniformly coated with a shell of a different
material (core-shell structure, Figure 1.5), the Mie theory has been modified obtaining an
analytical expression for the extinction cross-section of a small, concentric sphere is given
by3:
C𝑒xt = 4𝜋𝑅2k × Im{Q} (1.8)
where Q is determined by the following equation:
Q =(𝜖𝑠− 𝜖𝑚)(𝜖𝑐−2𝜖𝑠)+(1−𝑔) (𝜖𝑐− 𝜖𝑠)(𝜖𝑚+2𝜖𝑠)
(𝜖𝑠+2𝜖𝑚) (𝜖𝑐+2𝜖𝑠)+(1−𝑔) (2𝜖𝑠−2𝜖𝑚) (𝜖𝑐− 𝜖𝑠) (1.9)
where ϵc is the complex dielectric function of the core material, ϵs is that of the shell, ϵm is the
real dielectric function of the surrounding medium, 𝑔 is the volume fraction of the shell layer,
and 𝑅 the radius of the core-shell particle. When 𝑔 = 0 the equation 1.8 is reduced to

GENERAL INTRODUCTION
11
Equation 1.2 (for an uncoated sphere), whereas for 𝑔 = 1 the equation 1.8 yields the
extinction cross section for a sphere of the shell material7.
Figure 1.5: Sketch of a core-shell particle. A core, with a dielectric function ϵc, surrounded by a shell,
with a dielectric function of ϵs. The particle is embedded in a medium with a dielectric function ϵm. R
is the radius of the coated particle.
1.1.2. Catalysis by metal nanoparticles
Catalyst is a substance that increases the rate of a reaction by lowering the activation energy
required to convert reactants into products and without being consumed or produced by the
reaction. Metallic nanoparticles are very attractive to use as catalysts20
due to their high
surface-to-volume ratio and their high surface energy. A wide variety of reactions can be
catalyzed by metallic nanoparticles, for example, electron-transfer reactions21
, oxidations of
alcohols and alkenes22
, carbon cross-coupling reactions23
, and hydrogenation reactions of
unsaturated substrates24
.
Generally, the size, shape and the dispersion state of metal nanoparticles are important factors
in explaining its catalytic properties. Besides, in the particular case of bimetallic NPs the
catalytic performance depends on their composition, as well as structure. The relationship
between the Au NPs size and catalytic activity was reported by Carregal et al.25
using as
model reaction the reduction of hexacyanoferrate (III) by borohydride ions. They attributed
the enhancement of the catalytic activity to an increase in the Au surface area as the particle
size decreased.
However, the problem associated with the use of nanoparticles as catalysts is that they have
limited stability (tend to aggregate) at higher temperatures and harsh reaction conditions. In
most of the cases, NPs aggregation leads to loss of properties associated with their nanometer
size. Hence, the stabilization of the metallic nanoparticles in colloidal solution is an important
aspect to be considered during their preparation. However, the capping material can diminish
the catalytic performance of the nanoparticles by blocking access to the steps and kinks of the

GENERAL INTRODUCTION
12
surface. One way to solve this problem is to immobilize the metallic nanoparticles in a
support like titania, silica, etc..
1.1.2.1. Reduction of hexacyanoferrate (III) by borohydride
In this thesis, we have set up as model reaction the reduction of hexacyanoferrate (III) by
borohydride ions to evaluate the catalytic activity of our catalytic platform. A model reaction
is defined in the following way:
1. The chemical reaction takes place just in presence of nanoparticles. Moreover the
chemical reaction should be well-controlled from Fe(CN)63− to Fe(CN)6
4− in the
presence of nanoparticles without side reactions or by-products.
2. Kinetic measurement of the reaction rate should be highly accurate. Therefore the
analysis of the temperature dependence of the reaction rate should be possible, leading
to a detailed understanding of the reaction mechanism.
3. The reaction should proceed under mild conditions, preferably at around room
temperature and in mild solvents like water. This condition implies that no degradation
or transformation of the nanoparticles must occur during the reaction. It excludes all
reactions in which the nanoparticles serve merely as a source for metal ions in
solution.
Several redox reactions are used to investigate the catalytic activity of transition metal
nanoparticles such as the reduction of p-nitrophenol, hexacyanoferrate (III), and fluorescent
dyes26
all by borohydride ions; the reduction of hexacyanoferrate (III) by thiosulfate ions; and
the reduction of organic compounds (e.g. nitro-aryls and alcohols). These model reactions can
be easily followed spectroscopically in order to obtain a complete kinetic analysis. The
reduction of hexacyanoferrate (III) ions by borohydride ions in alkaline aqueous solution is an
electron transfer reaction used as a model reaction to investigated catalysis by metallic NPs.
This redox reaction is particularly interesting because (a) the iron ions oxidation states +3 and
+2 are stable with respect to dissociation, have the same geometry, and chemical
composition27,28
; (b) the process of reduction of hexacyanoferrate involves one electron
transfer; and (c) the course of the reaction can be monitored with high precision by UV-vis
spectroscopy, by the reduction in absorbance of the hexacyanoferrate (III) complex at 420 nm.
The redox reaction can be written as27
:
BH4− + 8Fe(CN)6
3− + 3H2O → H2BO3− + 8Fe(CN)6
4− + 8H+ (R. 1.1)

GENERAL INTRODUCTION
13
BH4−+ 2H2O → 4H2 + BO2
− (R. 1.2)
As shown above the reaction results in the formation of hexacyanoferrate (II) ions
and H2BO3−. Besides, the hydrolysis of the borohydride ion can also occur during the
reduction of hexacyanoferrate (III) (see Reaction 1.2). This parallel process can be inhibited
by working at basic pH29
. This reaction was employed by Carregal et al.25
to investigate the
catalytic activity of Au NPs. They found that the presence of gold NPs in the reduction
medium increased the reaction rate, as well as changed the order of the reaction with respect
to [Fe(CN)63−] from zero-order to pseudo-first-order kinetics (see Figure 1.6), and decreased
to half the activation energy. They explained the catalytic process as follows: reduction of
hexacyanoferrate (III) ions by borohydride ions in the presence of Au NPs took place in two
steps. In the first step, BH4− ions inject rapidly electrons onto the Au NPs, which act as a
reservoir. Then in a second, slow step, Fe(CN)63− ions diffuse toward the Au NP surface and
are reduced by the excess surface electrons (see scheme in Figure 1.6). No chemical reaction
occurs between the reactants and Au NPs since the optical properties of the Au NPs remain
unchanged during the redox process (see Figure 1.6).
Under pseudo-order conditions, where NaBH4 is always in excess over [Fe(CN)63− ], the
reduction of ferrocyanide ion obeys:
−d[Fe(CN6
3−)]
dt= kobs[Fe(CN6
3−)]n (1.10)
where kobs is the pseudo-nth-order rate constant for the reaction. Since this catalytic reaction
occurs at the Au surface and the relationship between the kobs and the Au surface area is
linear, Equation (1.10) can be written as follows:
− d[Fe(CN)6
3−]
dt = ks [Au]NP S [Fe(CN)6
3−]t (1.11)
where ks is the apparent rate constant normalized to the total surface area of gold per unit
volume of solution, S is the surface area per particle and [Fe(CN)63−] refers to the
concentration at time 𝑡.

GENERAL INTRODUCTION
14
Figure 1.6: Spectral evolution of a mixture of hexacyanoferrate (III) and Au nanoparticles upon
borohydride addition. Inset: kinetic trace of the absorbance at 420 nm during [Fe(CN)63−] reduction
and linearized data for first order analysis. The model proposed for the catalytic mechanism is
presented on the top. Reproduced from reference [28].
According to Carregal and coworkers25
the catalytic activity of the Au NPs in the
ferrocyanide reduction depends on the size of Au NPs, noting that 3.5 nm Au NPs exhibited
larger catalytic activity than the 6 nm particles. It was explained in terms of larger shifts on
Fermi energy for smaller nanoparticles. Other studies, developed by Carregal et al.30,31
, reveal
that using Au NPs encapsulated in a thermoresponsive microgel; or gold nanorods in
metallodielectric composites like SiO2 or TiO2; or Pt NPs, spherical and dendritic, supported
on carbon nanotubes; also acts as catalysts in the reduction of hexacyanoferrate (III) ions by
sodium borohydride ions.

GENERAL INTRODUCTION
15
1.2. Titanium dioxide
Titanium dioxide or titania (TiO2) is a multifunctional material with applications in
photocatalysis, namely degradation of environmental toxic dyes and organic pollutants, solar
cells, sensor devices, energy storage, spintronic devices, electrodes in lithium batteries,
photoelectrochemical splitting of water into hydrogen and oxygen, and so on. TiO2
applicability strongly depends on parameters such as crystalline structure, crystallite size,
specific surface area, porosity and morphology32
. For instance, high TiO2 surface area
provides a large interface, small primary crystals offer short diffusion paths and the particle
size has a tremendous effect on the mechanical, electronic and optical properties of the
material.
Titania crystallizes naturally in three major different structures: brookite (rhombohedral),
rutile (tetragonal), and anatase (tetragonal) where the two last are frequently used as
photocatalysts. Table 1.1 presents the most common synthetic routes to obtain the different
titania polymorphs. In the three structures each Ti4+
ions is octahedrally coordinated to six O2-
ions, but the distortion of each octahedron and the connection pattern of such octahedra chains
differs for the different structures (see Figure 1.7). In anatase the octahedra are connected by
their vertices, while in rutile are connected by their edges. The rutile structure is the densest
(smallest unit cell) and the most thermodynamically stable phase, and therefore the most
extensively studied among all TiO2 forms. While at low temperatures the anatase and brookite
phases are more stable, both will irreversibly revert to the rutile phase when subjected to high
temperatures (> 600 ºC). A summary of most relevant physical and chemical properties for
the three polymorphic forms of TiO2 are listed in the Table 1.2. Anatase is generally
considered the most active polymorph of TiO2. It is attributed to its higher degree of
hydroxylation, when compared with rutile phase, and its higher surface area33
. Brookite is the
least studied phase, due to the difficulties in synthesizing of pure brookite samples.

GENERAL INTRODUCTION
16
Figure 1.7: Geometrical illustration of the crystal structures of (a) rutile, (b) anatase, and (c)
brookite. Representation of: planar Ti3O building-block (left) and TiO6 polyhedra (right) for
each structure. The white spheres represent titanium, Ti, atoms and the red ones represent
oxygen, O, atoms. Reproduced from reference [34].
Titanium dioxide is considered as an n-type semiconductor due to the presence of oxygen
vacancies (VO) on its surface. The oxygen vacancy is responsible for the color centers in
TiO2. The VO are formed upon the release of two electrons and molecular oxygen leaving a
positive oxide ion vacancy. The redistribution of the two electrons creates Ti3+
sites in the
lattice which are highly reactive due to their unsaturated coordination. It explains the
electrical conductivity of TiO235
.

GENERAL INTRODUCTION
17
Table 1.1: Selected synthetic methods for obtaining TiO2 polymorphs.
Synthetic method Phases formed dBET
m2 g
-1
Reference
aA
bR
A+R
cB
A+B
Oxidation of
Ti(III)precursors
X X X X 200
Fröschl et al.
36
*Sol-gel X X X ~110-150 Fröschl et al.
36
X
X
X
X
X
200
115-345
NA
Schneider et al. 37
Niederberger et al. 38
Pottier et al.
39
Emulsions (mini/micro) X X X ~100-300 Fröschl et al.
36
Reverse micelle
X
X X NA Li et al.
40
Moran et al.
41
Hydrothermal X
X
X
X
X
X
X
X
X
75, 124, 190
70, 151, 253
43.1, 70,
151, 253
Chae et al. 42
Aruna et al.
43
Wang et al. 44
Solvothermal X X X ~215 Fröschl et al.
36
X 114 Ye et al.
45
Direct oxidation X X NA Wu et al. 46
Metalorganic/Δchemical
vapour deposition
X
X
X
X
X
X
3-300
NA
Fröschl et al.
36
Wu et al. 47
Physical/chemical vapour
deposition
X X X NA Fröschl et al.
36
Microwave
Microwave hydrothermal
X X ~250 Fröschl et al.
36
X X NA Ma et al. 48
Sonochemical X X X 230-400 Fröschl et al.
36
X X 26.3, 91.4,
97.6
Yu et al. 49
•Sonoelectrochemical
anodization
X X NA Mohapatra et al. 50
*Electrodeposition X NA Liu et al. 51
aA = Anatase
bR = Rutile
cB = Brookite
dBET = Brunauer, Emmett and Teller model, specific surface
area NA = Not Available
*The TiO2 samples prepared, in most case, have amorphous structure and calcination or hydrothermal
treatment is necessary to induce crystallinity.
ΔThe temperature and the pressure influence the crystalline
phase. •After annealing.

GENERAL INTRODUCTION
18
Table 1.2: Properties of anatase, rutile and brookite.
Property Anatase Rutile Brookite Reference
Crystal structure Tetragonal Tetragonal Rhombohedral Mo et al. 52
Molecules per unit cell 4 2 8 Kang et al 53
Mo et al.52
Lattice parameters (nm) a= b= 0.37842
c = 0.95146
a= b= 0.45937
c = 0.29587
a= 0.5447
b = 0.9184
c = 0.5145
Smyth et al. 54
Kang et al 53
Mo et al.52
Unite cell volume (nm3) 0.1363 0.0624 0.2575 Smyth et al.
54
Space group I41/amd P42/mnm Pbca Mo et al.52
Density (g cm-3
) 3.894 4.25 3.99 Kang et al53
Mo et al.52
Index of refraction 2.54, 2.49 2.79, 2.903 2.61-2.63 Hanaor et al. 55
Band gap (eV) 3.20
(~ 384 nm)
3.00
(~ 413 nm)
3.10 – 3.40
(~365–400 nm)
Fisher et al. 56
Brayner et al.57
Ti-O bond length (nm) 0.1937 (4)
0.1965 (2)
0.1949 (4)
0.1980 (2)
0.1993 (2)
0.1865 (1)
0.1919 (1)
0.1945 (1)
0.2040 (1)
Zallen et al.
58
Brayner et al.57
Mo et al.52
O-Ti-O bond angle 77.7 º
92.6º
81.2 º
90.0 º
77.0º ~ 105º Hanaor et al.55
Mo et al.52
Ti-Ti bond length (nm) 0.379
0.304
0.357
0.296
Linsebigler, et al.59
∆Gf° (kcal mol
-1) -211.4 -212.6 Linsebigler et al.
59
Solubility in HF Soluble Soluble Ohno et al. 60
Anatase TiO2 dissolves into an HF solution more easily than rutile TiO2.
1.2.1. Gold nanoparticles doped titania
Small metal nanoparticles (< 10 nm) can be thermodynamically unstable because of their high
surface energies and large surface areas. It is difficult to stabilize these nanoparticles by
maintaining a small size range while retaining their catalytic activity. Besides, the catalyst
separation from the products and reactants at the end of the reaction is difficult. To overcome
this problem, metal nanoparticles can be deposited in wide variety of support materials such
as titania, silica, carbon, zeolites, and alumina.
Different methods have been reported in the literature for doping TiO2 particles with small Au
NPs, TiO2@Au (see Table 1.3). The most widely used method for preparing TiO2@Au
catalysts with small Au sizes (<5nm), intimate interaction with TiO2, and good Au particle
distribution is the deposition-precipitation (DP) method61,62
. This technique involves the
deposition of gold hydroxide on the TiO2 surface by raising the pH of the gold chloride
precursor. The fact that the active component, the gold chloride precursor, remains on the
surface of the support and not buried in it and the easy removal of chloride ions, which poison
the NPs are advantages of this method over others.

GENERAL INTRODUCTION
19
Table 1.3 Selected synthetic methods for doping TiO2 with Au nanoparticles.
Synthetic
method
Interaction
with TiO2
Diameter
Au NPs
(nm)
Advantages /
Disadvantages
Reference
aAdsorption of
preformed Au NPs
Weak 5
Coalescence and
agglomeration of Au NPs
Buso et al. 63
Incipient wetness
impregnation
Weak
NA
10
Haruta et al.
64
Lin et al. 65
Zanella et al.
66
DP(NaOH) Strong 3.3
5
Part of the Au is not
deposited on TiO2 Zanella
et al.
66,79
Tsubota et al. 67
Tsubota et al.67
DP (NH4OH) Strong NA Sangeetha et al.
68
DP (CO(NH2)2) Strong 2-6
Depending
DP time
All of the Au is
deposited on the TiO2
Wen et al.
69
Hermans et al.
70
Zanella et al.
79
bAnion adsorption AuCl4
−
+ chemical reduction
4-6 Low Au loading Zanella et al.
66
Hidalgo et al.
71
Cation adsorption with
Au(en)23+ complex (en =
ethanediamine)
2-5
Contact
time ~ 1 h
Increasing the adsorption
time increases the
loading and the size of
Au and vice versa
Zanella et al.
66,79
Guillemot et al. 72
Guillemot et al.
73
Electrodeposition Quite
satisfactory
30-40 Uniform dispersion of
Au NPs on TiO2
Hosseini et al.
74
Metal sol method 4.5-5.0 Nguyen et al.
75
UV photoreduction 5 Good dispersion of Au
NPs in the TiO2. Au NPs
are deposited on TiO2
without requiring the
introduction of any toxic
agents
Chen et al.
76
aAu NPs synthesized by Turkevich
1 method or Brust method.
bTiO2 colloids prepared in acid medium were
positively charged. NA = Not Available. DP = Deposition-precipitation.
The control of the pH using NaOH77
allows to tune the size of the gold. Besides, Haruta et
al.78
found that uniform Au NPs distribution were achieved when the pH of the gold precursor
solution was adjusted to the isoelectric point of titania and the working temperature was
maintained between 47 and 87 ºC, so that Au(OH)3Cl− would be deposited on the support
without precipitating in the liquid. Nevertheless DP with NaOH present several disadvantages:
low metal loading (≤ 3 wt.%), deposition yield < 100% at pH range of 7-10, and
inapplicability of some supports with a point of zero charge below 566,
. For this reason,
Hermans et al.70
and Zanella et al.79
improved the method employing urea CO(NH2)2 as pH
adjusting agent.

GENERAL INTRODUCTION
20
1.2.2. Catalysis by gold nanoparticles supported on TiO2
The direct use of metal nanoparticles (homogeneous nanocatalysts) as catalysts is often
difficult because of their high tendency to aggregate, difficult recovering, among others
reasons. Hence research has been developed to create new catalysts where nanoparticles are
supported on a solid matrix (heterogeneous nanocatalysts).
Gold NPs on metal oxide support exhibit exceptionally high catalytic activity for different
reactions, such as, oxidation of carbon monoxide80
, hydrochlorination of acetylene81
, partial
oxidation of hydrocarbons82
at low temperature, hydrogenation of carbon oxides83
, and
reduction of nitrogen oxide84
. Generally, Au NPs (< 5 nm) supported on TiO2 particles show
higher catalytic activity than TiO2 and Au catalysts separately.
In the '80s Haruta and co-workers85
demonstrated that gold nanoparticles supported on
titanium, iron or cobalt oxides (Ti/Fe/CoO2@Au) exhibited highly catalytic activity for CO
oxidation at temperatures below 0 ºC. Since then, many research groups have investigated the
origin of the exceptional catalytic properties of supported Au NPs. Most of the published
work in this area are focused on elucidating; (i) if the catalytic efficiency depends on the NPs
size; (ii) the role of the supports; (iii) the nature of the active sites; and (iv) the reaction
mechanism for the low temperature CO oxidation. Several studies have found that the
reaction rate per unit area of gold surface is Au NPs size dependent, showing the Au NPs of 2
to 3 nm the highest activity86
. The remarkable catalytic performance of these Au NPs can be
attributed to, e.g., quantum size effects, a high activity of undercoordinated Au atoms at edges
and corners, or the increase perimeter length at the interface between support material and Au
NPs with decreasing Au NPs size. Some groups associate the reduction of gold NPs size with
the increase of steps, edge and kink sites, giving to the material different properties for the
chemisorption of gases reaction87
. Cleveland and coworkers88
found that as gold metal NPs
become smaller their face centered cubic structure transforms into decahedral (<2.5 nm) or
icosahedral (<1.6 nm).
The type of supporting material and the strategy for the immobilization of gold NPs are
factors which can determine the interaction gold NPs-support and therefore their physical
properties and catalytic efficiency89
. Frequently the main role of the support is to provide
stability to the nanoparticles90
. In the particular case of using TiO2 as support: (i) its nature
(e.g. its crystal phase, specific surface area, porosity, density of defects and morphology), (ii)
its chemical surface state (e.g. the presence of hydroxyl groups on the TiO2 surface), and (iii)

GENERAL INTRODUCTION
21
its intimate interaction with the Au NPs, are parameters involved in the catalytic activity.
Haruta105
reported, for first time, the direct role of TiO2 in the CO oxidation reaction.
Schubert91
and Liu92
proposed that the TiO2 support provided the activated oxygen species for
the CO oxidation reaction. Nevertheless, other reports claimed that the catalytically active
species are either oxidized species (Au+1
/ Au3+
)93
, or Au0, or both (Au
0 and Au
3+)94
.
Additionally, Haruta81
also reported the excellent selectivity ( 99 %) of TiO2@Au in the
partial oxidation of propene to propene oxide at 323 K.
1.2.3. Elementary steps in photocatalytic TiO2 systems
Semiconductors are characterized by their electronic structure, which can be described by the
band theory95
. Thus, the electronic structure is discussed in terms of energy bands made up of
large numbers of interacting atomic orbitals forming a continuum of energy levels. The
energy levels of interest are the highest occupied, the valence band (VB) and the highest
unoccupied, the conduction band, CB. Between these bands there is a forbidden energy gap
called band gap where no electrons can be accommodated. The band bap determines the
properties of the material. The electrons have, on average, a potential energy known as the
Fermi level, which is just below that of the CB in n-type semiconductors and just above that
of the VB in p-type semiconductors96
. For an intrinsic semiconductor, the Fermi level is
defined as the energy level in the middle of the bandgap (see Figure 1.8).
Figure 1.8: Schematic representation of the electronic band structure of semiconductors. E = Energy
and 𝐸𝑓 = Fermi energy.
For an n-type semiconductor, like TiO2, the Fermi level can be calculated using the following
expression:

GENERAL INTRODUCTION
22
Ef = Ei + kBT ln (ND
ni) (1.12)
where Ef is the Fermi energy, Ei is the initial energy, kB is the Boltzmann constant, T is the
temperature (K), ND is the concentration of donors, and ni is the intrinsic carrier density.
When an n-type semiconductor is in contact with a metal, the Fermi level equilibration
thermodynamically occurs by redistribution of the charge carriers from the lower work
function side to the higher work function side. Assuming that the metal work function is
higher than the semiconductor work function, the electrons migrations from the
semiconductor to the metal occur until the two Fermi level are aligns. As a consequence, a
double-layer is built-up at the interface where the surface of the metal presents an excess of
negative charge, while the semiconductor side exhibits an excess of “positive” charge. Due to
this electron accumulation the Fermi level of the metal increases to more negative potentials.
The Fermi level alignments, closer to the conduction band of the semiconductor, cause a
potential barrier across the interface known as Schottky barrier, which inhibits the
recombination of electron-hole pairs. It has been reported that smaller metallic NPs induced
more negative Fermi level shifts, than bigger ones. The height of the Schottky barrier is
defined as the difference between the semiconductor conduction band and Fermi level of the
metal97
.
Excitation of a semiconductor is initiated by the absorption of photon with energy equal to or
greater than the semiconductor band gap energy, Eg,, promoting an electron from the VB to
the CB and leaving a hole (h+) behind in the valence band (see Figure 1.9). In semiconductors
the lifetime of the charge carriers in the excited states is on the order of nanoseconds59
. Hence
the excited-state electrons and holes can recombine and dissipate the input energy as heat, or
get trapped in metastable surface states98
, or participate in redox process at the
semiconductor/water interface99
.
Figure 1.9: Schematic diagram of promotion of an electron from the valence band to the conduction
band on semiconductor after irradiation.

GENERAL INTRODUCTION
23
In the case of a photocatalytic redox reaction, it proceeds effectively when the top level of CB
is more negative than the reduction potential of the adsorbed acceptor species (A + e− →
A∙−). Nevertheless, for a hole transfer the position of the top level of VB should be lower
(more positive) than the oxidation potential of the adsorbed donor species D (D + h+ →
D∙+). The electron and hole transfer processes should occur simultaneously in order to
regenerate the photocatalyst. There are several ways to minimize charge carrier
recombination, e. g., incorporation of metal particles, manipulation of interfacial junctions,
adding dopants, and trapping sites.
Titania is the most widely investigated photocatalyst due to its strong oxidative properties at
ambient temperature and pressure, low cost, nontoxicity, and chemical stability again
photocorrosion100
. TiO2 presents a large intrinsic band gap energy of ~3.0 eV for rutile and
~3.2 eV for anatase (see Figure 1.10). This means, that anatase TiO2 can only be excited
under irradiation of UV light at wavelengths < 380 nm, which covers only ~ 3% of the solar
radiation. On the other hand, the rutile phase can be excited by wavelength that extent into the
visible range (410 nm).
Upon light absorption with energy equal to or greater than the TiO2 semiconductor band gap,
electrons (e-) are excited from the valence band to the conduction, leaving behind holes (h
+) in
the valence band (Reaction 1.3).
TiO2 + ℎ → eCB− + hVB
+ (R. 1.3)
The eCB− and hVB
+ migrate to the surface of TiO2 and participate in interfacial redox reaction.
The valence holes in the TiO2 surface react with adsorbed hydroxide ions or water molecules
generating adsorbed OH∙ radicalsIV
. The specific area plays an important role in the activity of
the TiO2 photocatalyst by providing a platform for the reactants. As a general rule, more
surface area, more number of surface active sites, more reactants adsorb on the active sites of
the surface and consequently more surface reactivity. Increased surface area of TiO2 may be
obtained by using highly porous materials, and/or reducing their size, and/or using specific
shapes such as nanotubes or whiskers. The chemical reaction that takes place at the surface
active site is either reduction (gain of electrons) or oxidation (loss of electrons) or both
(redox).
IV
This photodecomposition generally involves one or more radicals or intermediate species such as
O2∙− or H2O2.

GENERAL INTRODUCTION
24
A lot of studies reported that the photocatalytic activity of titania is also affected by particle
size, crystalline phase, surface properties (e.g. surface OH and oxygen vacancy) and defects
(active sites for the adsorption and dissociation of molecules on the surface).
As already stated, anatase TiO2 have no visible light response due to their large band gap. The
shift in the optical response of TiO2 from the UV to the visible range will have a positive
effect on the practical applications of the material. Various methods have been developed to
reduce the band gap of TiO2, for example, dope TiO2 with nonmetal such as carbon, nitrogen,
fluoride, iodine101
, or with transition metal NPs (e.g. copper, silver, gold102
); utilize
mixed-phase TiO2, particularly anatase-rutile mixtures103
, sensitize TiO2 with organic dyes or
coupled semiconductors104
. The incorporation of dyes molecules or metallic NPs on the TiO2
surface is known as photosensitization. This is the operating principle of dye-sensitized based
solar cell systems.
Figure 1.10: Band gaps and band edge positions of VB and CB versus standard hydrogen electrode
(SHE) at pH 7 of TiO2 anatase and TiO2 rutile.
The anatase phase has a higher photocatalytic activity over rutile due to the difference in
position of the top of valence band and the bottom of CB, i.e., its CB lies 0.2 eV above rutile
CB that gives more reducing power than rutile (see Figure 1.10). It is important refer that the
band levels of the oxide materials, like TiO2, usually are shifted with pH, surface impurities
and adsorbed compounds.
1.2.3.1. Photocatalytic TiO2@Au systems
Several studies reported that the presence of Au NPs enhanced the photocatalytic activity of
the titania support. However, there are numerous approaches to elucidate the process that
promotes the high photocatalytic performance of TiO2@Au or TiO2@noble metals, such as,
Ag, Cu, etc.

GENERAL INTRODUCTION
25
Several reports explaining the enhanced visible activity of TiO2@Au due to local electric
near-field enhancement in the TiO2 surface by the Au surface plasmon resonance105
.
Excitation of the surfaces plasmon resonances creates polarization at the metal nanoparticle
resulting in the generation of near-fields localized at the metal surface. Interaction of a
semiconductor nanoparticle with this kind of localized electric field could allow the formation
of electron/hole pairs in the near surface region (see Figure 1.11(a)). To transfer plasmon
energy to the TiO2 through near field effect the plasmon energy must be equal to or greater
than the band gap of the TiO2. Only NPs with size of 5-20 nm in diameter, with small
scattering cross-section, are able to achieve enhanced field, since in the larger particles there
is the creation of multipole resonance and dynamic depolarization of plasmon as indicated
above.
Christopher and coworkers106
reported that the enhanced photochemical reactivity of
TiO2@Ag materials is attributed to radiative transfer of energy, mediated by surface plasmon,
from Ag NPs to the semiconductor. This process produces high concentrations of charge
carriers (e−/h
+ pairs) in the TiO2 (see Figure 1.11(b)). Again, this plasmon relaxation process
is strongly dependent on the shape and size of metallic nanoparticles.
Furube and coworkers107
reported that spherical Au NPs are excited due to plasmon
resonance, inducing electron transfer from Au NPs to TiO2 conduction bandV. Specifically,
the electrons in the filled d-band of gold are excited to sp conduction band; electronic states
above the Fermi level (see Figure 1.11(c)). These energetic electrons, in metal conduction
levels above the Fermi energy, designated of hot electrons, have sufficient energy and
momentum to cross the Schottky barrier108
between metal and semiconductor (the Schottky
barrier between Au and TiO2 is about 1 eV). The semiconductor must be in intimate contact
with the plasmonic metal, allowing the LSPR-excited hot electrons to overcome the Schottky
barrier.
Noble metal nanoparticles with absorption in the visible region, such as Ag, Au, Cu,
deposited on the TiO2 surface can enhance, through the excitation of surface plasmon
resonance, the TiO2 photocatalytic efficiency. The excitation can induce the injection of
photogenerated electrons in the TiO2 CB causing photocurrent or reduction. Sellappan109
suggested the plasmonic heating (see Figure 1.11(d)) where the plasmon relaxation through
absorption in the nanoparticles leads to heating the nanoparticles in composites of
TiO2@metal NPs. Within this SPR-mediated heating process, the light absorbed by the NP
V TiO2 presents electron-accepting properties, due the high density of states in the conduction band.

GENERAL INTRODUCTION
26
generates a non-equilibrium electron distribution that decays via electron-electron scattering.
The hot electron gas equilibrates with lattice phonons which transfer this energy into the
surrounding medium and induces temperature increase in the vicinity of the Au NP surface.
The plasmonic heating depends on the size and shape of NPs, heat conductivity of the
surrounding environment and the incident light intensity.
Figure 1.11: LSPR energy transfer mechanism from the metal NP to TiO2: (a) Near-field nonradiative
enhancement; (b) Far-field radiative scattering; (c) Hot-electron transfer from the metal NP to TiO2;
and (d) Plasmonic heating. Reproduced from reference [111].
27
CHAPTER 2
Titania-coated gold nanoparticles and growth of titania shell
ABSTRACT
The aim of work described in this chapter is the synthesis and characterization of gold-titania
core-shell nanoparticles, Au@TiO2. In order to achieve homogeneous TiO2 coatings different
approaches based on the sol-gel reaction of titania precursors on the gold nanoparticle surface
are analysed. The surface chemistry of the Au nanoparticles is a critical parameter in the
titania deposition. Therefore Au nanoparticles with different capping ligands
cetyltrimethylammonium bromide (CTAB)-stabilized, poly(vinylpyrrolidone) (PVP) and
polyelectrolytes-PVP were employed.

2.1. INTRODUCTION
28
2.1. Introduction
Metal nanoparticles are of great interest because of their unique electronic and optical
properties110,111,112,113
. Furthermore, coating of those nanoparticles with a semiconductor like
titanium dioxide make them interesting materials for applications in photovoltaics114,115,116
,
photocatalytic degradation of pollutants117,118,119,120,121
, and for chemical sensors122,123,124
,
among others. However, titanium dioxide-coated metal nanoparticles are generally difficult to
synthesize, because titania precursors are highly reactive, and thus control over their
hydrolysis and condensation is not straightforward. The reaction mechanism describing the
sol-gel conversion of titanium alkoxides to titania involves two main reaction types:
hydrolysis and condensation of titanium alkoxides (see Scheme 2.1)125,126
. During hydrolysis,
the alkoxide groups (-OR) are replaced via the nucleophilic attack of the oxygen atom of a
water molecule under release of alcohol and the formation of titanium hydroxide (Equation
2.1). In a second step, condensation reactions between two hydroxylated metal species occur.
The partial negative charge of the oxygen atom in the hydroxide group (≡ Ti − OH) is
responsible for the nucleophilic attack to the partial positive charge of titanium (≡ Ti − OX ,
being X a H atom or alkyl group), with the transfer of a proton from −OH to the−OX group
and liberation of alcohol molecule (Equation 2.2).
≡ Ti − OR + H2O →≡ Ti − OH + ROH (2.1)
≡ Ti − OH + ≡ Ti − OX →≡ Ti − O − Ti ≡ + XOH X = H/alkyl group (2.2)
Main reactions in the sol-gel process using titanium alkoxides. Hydrolysis (Equation 2.1) and
condensation (Equation 2.2), involving oxolation and alkoxolation.
Since in our study the titanium alkoxide is titanium (IV) butoxide (TBT) or titanium
isopropoxide (TIP), the overall reactions are, respectively the following:
Ti(OC4H9)4 + 2H2O → TiO2(aq) + 4C4H9OH (2.3)
Ti{OCH(CH3)2}4 + 2H2O → TiO2(aq) + 4C3H7OH (2.4)
During the last decade, few works have been published on the coating of metal nanoparticles
with a titania shell. For instance, Pastoriza-Santos and co-workers127
synthesized silver-titania
core-shell nanoparticles (Ag@TiO2) through the high-temperature reduction of Ag+ by a
dimethylformamide/ethanol mixture; in the presence of titanium butoxide and acetylacetone.
The same procedure was adopted by Renjis et al.128
for the synthesis of Au@TiO2, Au@ZrO2,
Ag@TiO2 and Ag@ZrO2 nanoparticles. Later, Kamat and coworkers19
modified the
procedure using as titania precursor titanium(triethanolaminato)isopropoxide129
. Zhang et

2.1. INTRODUCTION
29
al.130
reported a route to synthesize polystyrene-silver-titania multishell spheres based on the
use of acetone and polyvinylpyrrolidone (PVP) as sweller and coupler, respectively, and using
tetra-n-butyl titanate as titania precursor. Following a different approach, Mayya and
co-authors131
presented the first titania coatings on gold nanoparticles based on complexation
of titanium (IV) bis(ammonium lactato) dihydroxide (TALH) with
poly(dimethydiallylammonium chloride) (PDDA, a positive polyelectrolyte), and then the
hydrolysis of TALH132,133
.
Herein, we report three different strategies to prepare Au@TiO2 core-shell nanoparticles
where titania precursors and surface chemistry of Au nanoparticles are varied. In the first
route, Au NPs stabilized in CTAB are coated with a titania shell using the sol-gel reaction of
TIP with acetylacetone. In the second, the Au NPs wrapped with a polymer such as PVP were
employed for the titania coating. This water soluble polymer is widely used as capping ligand
in the synthesis of colloidal particles, besides it easily adsorbs onto oxide surfaces (e. g.
titania, iron oxide, alumina, kaolinite)134
, metal (e.g. gold, silver, iron), polystyrene135
,
silica136
, and graphite137
. The third approach, is based on the method developed by
Pastoriza-Santos and co-workers138
to obtain Au@SiO2 nanorods which combines the
layer-by-layer, LBL, technique139,140
and the hydrolysis and condensation of TBT. The titania
layer thickness can be tuned through successive steps of hydrolysis and condensation of TBT
on the Au@TiO2 NPs.
2.2. Experimental section
Chemicals
Ascorbic acid, cetyltrimethylammonium bromide, acetylacetone (AA), polyallyamine
hydrochloride (Mw 15 000 g mol-1
), titanium isopropoxide, and titanium (IV) butoxide were
supplied by Aldrich. Tetrachloroauric (III) acid, trisodium citrate dihydrate and sodium
chloride were supplied by Sigma. Poly(sodium 4-styrenesulfonate) (Mw 14 900 g mol-1
) was
purchased from Polymer Standards Service. Poly(vinylpyrrolidone) (Mw 24 000 g mol-1
and
Mw 40 000 g mol-1
) was supplied by Fluka. All reactants were used without further
purification.
Pure grade propanol, ethanol and Milli-Q water, with a resistivity higher than 18.2 M . cm-1
,
were used in all preparations.

2.2. EXPERIMENTAL METHODS
30
Synthesis of Au@CTAB@TiO2
Au@CTAB nanoparticles. A gold seed solution of about 15 nm diameter was synthesized
according to the standard sodium citrate reduction method141
. Typically, 25 mL of a warm
sodium citrate (1 wt %) solution was added to 500 mL of a boiling 0.5 mM HAuCl4 aqueous
solution, under vigorous stirring. After boiling for 15 min, the gold sol was cooled at room
temperature. Subsequently, citrate molecules were exchanged by CTAB upon dilution of an
aliquot of the Au@citrate seeds with the same volume of CTAB 0.03 M. At this stage the
concentration of gold and CTAB are about 3.58 × 10⁻⁴
M and 0.015 M, respectively.
The preformed 15 nm Au NPs were grown up to 66 nm followed the procedure described by
Rodríguez-Fernández and co-authors2. Briefly, 32.47 μL of gold seed solution was added onto
a mixture of aqueous CTAB solution (1.79 mL, 0.03 M), Milli-Q water (3.18 mL), aqueous
ascorbic acid solution (17.9 μL, 0.1 M) and aqueous HAuCl4 solution (8.4 μL, 0.1 M) under
stirring. The temperature of the growth solution was kept constant at 35 ºC. After 1 hour, Au
NPs dispersion (~ 0.227 mM) was centrifuged at 3500 rpm for 30 min. the supernatant
discarded, and the nanoparticles redispersed in 5 mL of Milli-Q water. Thus, the final gold
dispersion presented a concentration of about 0.6 mM in CTAB and 0.454 mM in gold.
Au@CTAB@TiO2. The coating reaction was carried out by hydrolysis of TIP in ethanol, at
room temperature. To 5 mL of the gold solution, 71.8 μL of AA (9.74 M) and 500 μL of
ethanol were added. Then, 40 μL of ethanolic TIP solution (0.1 M), were added, under
vigorous stirring, to the gold NPs suspension. When the addition was over, the suspension
was gently stirred for twelve hours. The resulting titania-coated gold NPs were centrifuged at
3000 rpm for 30 min, the supernatant was removed and the nanoparticles redispersed in 5 mL
of ethanol.
The amount of TIP was calculated to overgrow a titania shell of 10 nm on the Au NPs.
Synthesis of Au@PVP-K30@TiO2
Au@PVP-K30. Gold NPs ([Au] = 2.74 × 10⁻⁴
M, [seeds Au] = 2.33 × 10⁻⁵
M, [PVP] = 0.8
mM) with about 26.6 nm of diameter were synthesized in the microwave by the procedure
describe by Pastoriza-Santos and co-workers142
. One milliliter of this gold NPs suspension
was transferred to an Eppendorf tube and centrifuged at 4500 rpm for 30 min and the
nanoparticles were dispersed in the same volume of ethanol. This washing cycle was repeated
two more times. The resulting gold dispersion presented a concentration of ≈ 8.64 × 10⁻⁵
mM
in PVP and 2.37 × 10⁻⁴
M in gold.

2.2. EXPERIMENTAL METHODS
31
Au@PVP-K30@TiO2 preparation. To Au@PVP NPs in ethanol (1 mL), 40 μL of Milli-Q
water were added and stirred for five minutes. Subsequently, 12 μL of 0.086 M TBT in
ethanol (freshly prepared) were added to the mixture under vigorous stirring. After 5 min. the
stirring was stopped and it was allowed to react for 30 min. Then, the mixture was centrifuged
at 4500 rpm for 30 minutes, the supernatant was discarded and the nanoparticles redispersed
in 1 mL of ethanol.
Synthesis of Au@CTAB@PSS@PAH@PVP@TiO2
Au@CTAB@PSS@PAH@PVP preparation. The gold colloids are synthesized according
the procedure described above (see Au@CTAB preparation). The polyelectrolyte coating of
the gold nanoparticles was carried out following the method described by Pastoriza-Santos et
al.31
. Briefly, the gold colloids were added dropwise to 5 mL of 2 mg mL-1
PSS aqueous
solution (6 mM NaCl, previously sonicated during 30 minutes) under vigorous stirring. The
solution was allowed to react for 3 h, after which the excess polyelectrolyte was removed via
centrifugation at 3500 rpm for 30 minutes and redispersed in 5 mL of Milli-Q water.
Thereafter, it was added dropwise to 5 mL of 2 mg mL-1
PAH aqueous solution (6 mM NaCl,
previously sonicated during 30 min) under vigorous stirring. After 30 min, it was centrifuged
at 3500 rpm for 30 minutes and redispersed in 5 mL of Milli-Q water. The polyelectrolyte
wrapping was followed by the surface adsorption of PVP. The amount of PVP was calculated
to provide the colloids with about 80 PVP molecules per nm2 gold surface. The PVP was
dissolved in water by ultrasonication for 15 min. Then, 5 mL of Au@CTAB@PSS@PAH
colloids were mixed with 5 mL of PVP (Mw 24 000 g mol-1
) aqueous solution and stirred for
15 h at room temperature. Finally, the mixture was centrifuged at 2500 rpm for 30 min, the
supernatant removed and the nanoparticles dispersed in 0.2 mL of Milli-Q water.
Subsequently, the mixture was added dropwise to 5 mL of ethanol under vigorous stirring.
The concentration of gold at this stage was around 0.376 mM.
Au@CTAB@PSS@PAH@PVP@TiO2 preparation. Briefly, 60 μL of a freshly prepared
85.5 mM TBT solution in ethanol was added dropwise onto the Au dispersion
(Au@CTAB@PSS@PAH@PVP in ethanol) under nitrogen atmosphere and vigorous stirring.
After the addition was completed, the mixture was gently stirred for 1 hour. Then, the mixture
was centrifuged at 2500 rpm for 20 min, the supernatant removed and the particles dispersed
in 5 mL of ethanol.

2.2. EXPERIMENTAL METHODS
32
Instrumentation
A JEOL JEM 1010 transmission electron microscope operating at an acceleration voltage of
100 KV was used to analyze the nanoparticles morphology. The UV-vis absorption spectra
were recorded on a VARIAN CARY 50 spectrophotometer. The zeta potential measurements
of aqueous dispersions of Au NPs coated with CTAB, PSS, PAH and PVP were performed
with a Malvern Zetasizer Nano ZS90 instrument at 25 °C.
2.3. Results and discussion
CTAB or PVP are both commonly used capping ligand employed to provide stability to Au
nanoparticles. Besides there are some reports that evidence that both ligands could induce the
deposition of titania on metal surfaces. For instance, Sakai and co-authors143
demonstrated
that silver nanoparticles could be successfully coated with titania by the sol-gel reaction of
titanium tetraisopropoxide in the presence of CTAB. In the case of PVP coated nanoparticles
the TiO2 deposition is justified by the ability of PVP to form hydrogen bonds with some
oxides27
. Therefore, the first approach was to apply the sol-gel reaction of titania precursor on
Au nanoparticles stabilized by CTAB or PVP. Thus, CTAB- or PVP-stabilized Au
nanoparticles were coated with titania by the hydrolysis and polycondensation process using
TIP and TOB in ethanol solution, respectively. The direct mixing of the CTAB-stabilized
aqueous gold suspension with the sol-gel solution is complicated because of rapid
hydrolysis/condensation reactions of the TIP promoted by the water in the gold solution.
Therefore, this issue was obviated by addition of acetylacetone to the solution, which retards
the hydrolysis rate of titania precursor.
The characterization of gold-titania core-shell nanoparticles was carried out using
transmission electron microscopy and Visible-NIR absorption spectroscopy. Figure 2.1 shows
the Visible-NIR absorption spectra of Au NPs stabilized by CTAB (A) or (B) PVP before and
after titania coating. As shown, LSPR band of both samples red-shifted after the titania
coating. While shifts of 10 nm were observed for Au@CTAB NPs, the coating of Au@PVP
NPs gave rise to 3 nm shifts (from 531 to 534 nm). It suggested that the Au NPs were coated
by titania. The high refractive index of the titania shell could cause the red-shifted (LSPR
strongly depends on the dielectric constant of the medium144
and the refractive index of
amorphous titanium dioxide is 2.45145
, much higher than that of the water (1.330). Also an

2.3. RESULTS AND DISCUSSION
33
increase of LSPR band width was observed when the gold nanoparticles are coverage with a
titania shell.
Figure 2.1: Visible-NIR spectra of Au NPs stabilized in CTAB (A) and PVP (B) before and after
titania coating. The spectra have been normalized at the plasmon absorption maximum.
In order to further characterize the titania deposition on the nanoparticles surface TEM
analysis was performed. The TEM images of Au@CTAB@TiO2 (see Figure 2.2 (A) and (B))
indicated that the gold NPs have an inhomogeneous coating thickness of titania layer. Also,
an excess of titanium dioxide was observed in the medium. It could occur, because of the
presence of CTAB in excess in the medium during the sol-gel reaction of the TIP. The CTAB
excess could not be perfectly removed and therefore it interfered in the subsequent titania
coating.
In the case of Au@PVP@TiO2 core-shell nanoparticles (see Figure 2.2 (C)-(F)) the coating
was not uniform in term of shell thickness, though the coverage was complete. The typical
shell thickness was in the range 1-10 nm.

2.3. RESULTS AND DISCUSSION
34
Figure 2.2: TEM images of (A-B) Au@CTAB@TiO2 and (C-F) Au@PVP@TiO2. Average diameter
of Au NPs: 66 nm (A-B) and 26.6 nm (C-F).
In the last method, the CTAB-stabilized Au nanoparticles (66 nm in diameter)35
were coated
following a combination of the polyelectrolyte layer-by-layer technique and the hydrolysis
and condensation of the titania precursor in ethanol (see Scheme 2.1). Although PVP
functionalization of the CTAB-coated nanoparticles allows the transfer of the particles into
ethanol/2-propanol (requirement for titania coating) and although PVP presents a good
affinity for titania, the PVP coating was not sufficient to screen the effect of CTAB during the
hydrolysis of the titania precursor, as previously observed for silica coating31
.
Since CTAB confers the Au nanoparticles with a high positive surface charge, LBL wrapping
of PSS (a negative polyelectrolyte) around the metal nanoparticles is strongly favored. The

2.3. RESULTS AND DISCUSSION
35
PSS deposition reversed the Au surface charge from +21 to –39 mV (see Figure 2.3). After a
washing step to remove excess PSS, the particles were coated with PAH (a positive
polyelectrolyte) reversing the ξ-potential from –39 mV to +40 mV. Two polyelectrolyte
layers have been found to completely screen the effect of CTAB on the gold nanoparticle
surface. In this step it is very important to choose polymers with an appropriate molecular
weight and to control the ionic strength of the polymer solutions and avoid aggregation32
.
Finally, the nanoparticles were functionalized with PVP to allow redispersion in ethanol. The
ξ-potential at this point was –6 mV (PVP is slightly negatively charged under experimental
conditions). Once the particles were in ethanol, TBT was added to the solution at room
temperature and under inert atmosphere (the precursors used are highly reactive in the
presence of water traces). The hydrolysis and condensation of the TBT produced a shell of
TiO2 onto the Au nanoparticles. Figures 2.4 (C) and 2.4 (D) show transmission electron
micrographs (TEM) of some titania coated gold spheres. It can be observed that the gold
nanoparticles are coated with a homogeneous titania shell of 10±4 nm.
Scheme 2.1: Schematic representation of titania coating of Au nanoparticles following the LBL
approach.

2.3. RESULTS AND DISCUSSION
36
Figure 2.3: ξ-potential for gold nanoparticles coated with CTAB, PSS, PAH and PVP, as indicated.
Figure. 2.4: TEM micrographs of: 66.4 ± 5.0 nm gold nanoparticles before (A-B), and after (C-D) the
titania coating. In image (D), the TiO2 shell thickness is about 6 nm.

2.3. RESULTS AND DISCUSSION
37
Focusing on the optical properties, Figure 2.5 (A) shows the Visible-NIR spectra of the gold
colloid at different coating stages. The aqueous dispersion of 66 nm gold nanoparticles
presented a LSPR band at 546 nm. We can observe that the polyelectrolyte coating does not
affect to the optical properties since the absorption spectra of the gold nanoparticles before
and after the coating are the same. However, some changes are observed when the particles
are coated with PVP and transferred into ethanol, the plasmon band red-shifted by 5 nm. It is
well known that the LSPR band position depends on the refractive index of the medium in
which the particles are dispersed146
, therefore these changes can be attributed to the solvent
exchange. Finally, the LSPR band further red-shifted after the titania coating, due to an
increase in the local refractive index (see discussion above).
Titania thickness of Au@TiO2 core-shell nanoparticles could be tuned through successive
steps of hydrolysis and condensation of TBT on the Au@TiO2 NPs (see Scheme 2.1). Thus,
Au@TiO2 core-shell nanoparticles with 5 nm Au@TiO2, 20 nm and 30 nm TiO2 thicknesses
were prepared by performing 1, 2 and 3 additions of TBT in 2-propanol, respectively. Figure
2.6 shows TEM images of gold-titania core-shells NPs with different shell thicknesses.The
increase of the titania thickness shell was produced the red-shift of LSPR band and an
increase of the band width (see Figure 2.5 (B)), as explained above.
Figure 2.5: Visible-NIR absorption spectra of gold particles at different coating stages (A) and gold
nanoparticles at different stages of titania coating (B). The spectra have been normalized at the surface
plasmon maximum.

2.3. RESULTS AND DISCUSSION
38
Figure 2.6: TEM images of titania-coated gold NPs with an average diameter of 60 nm, with
increasing titania shell thickness: Titania shells of: 5 nm in Au@TiO2 (A) and (B); 20 nm in
Au@1TiO2 (C) and (D); 30 nm in Au@2TiO2 (E) and (F).

2.4. CONCLUSIONS
39
2.4. Conclusions
Different strategies have been analysed to coat Au nanoparticles with a titania shell. In the
case of CTAB and PVP stabilized Au nanoparticles the hydrolysis and condensation of titania
precursor led to inhomogeneous titania coatings. The cationic surfactant CTAB and the
amphiphilic polymer PVP makes the affinity of the gold to TiO2 sufficiently high, so the
titania deposited directly on the surface of Au@CTAB or Au@PVP colloids. Nevertheless, it
was very difficult to have the ideal amount of CTAB/PVP in the medium (gold colloids are
frequently prepared in an excess of CTAB/PVP) in order to get homogeneous coatings.
In the third method, core-shell gold-titania nanoparticles with a homogeneous shell of
titanium dioxide were obtained via the combination of the LBL technique and the hydrolysis
and condensation of TBT. Besides, the titania thickness could be tuned by additions steps of
titania precursor. The control of the titania shell thickness can be used to control the dipolar
interactions between particles and improves the versatility of the particles.

2.4. CONCLUSIONS

41
CHAPTER 3
Synthesis and characterization of Au-doped TiO2 nanoparticles
ABSTRACT
Anatase titanium dioxide nanoparticles doped by gold nanoparticles were synthesized in a
two-step protocol. The strategy is based on the preparation of spindle-shaped TiO2
nanoparticles and after the further Au deposition. Thus, anatase TiO2 nanoparticles were
fabricated on a large scale through mesoscale assembly in the titanium (IV) butoxide-acetic
acid system without any additives under solvothermal conditions. For the deposition of Au
nanoparticles on the titania surface three different strategies were analyzed: two
adsorption-based processes and the deposition-precipitation method with urea. The structural,
physico-chemical and morphological properties of TiO2 and Au-doped TiO2 were examined
by TEM, DLS, BET, SAED, XPS, and UV-visible absorption spectroscopy.
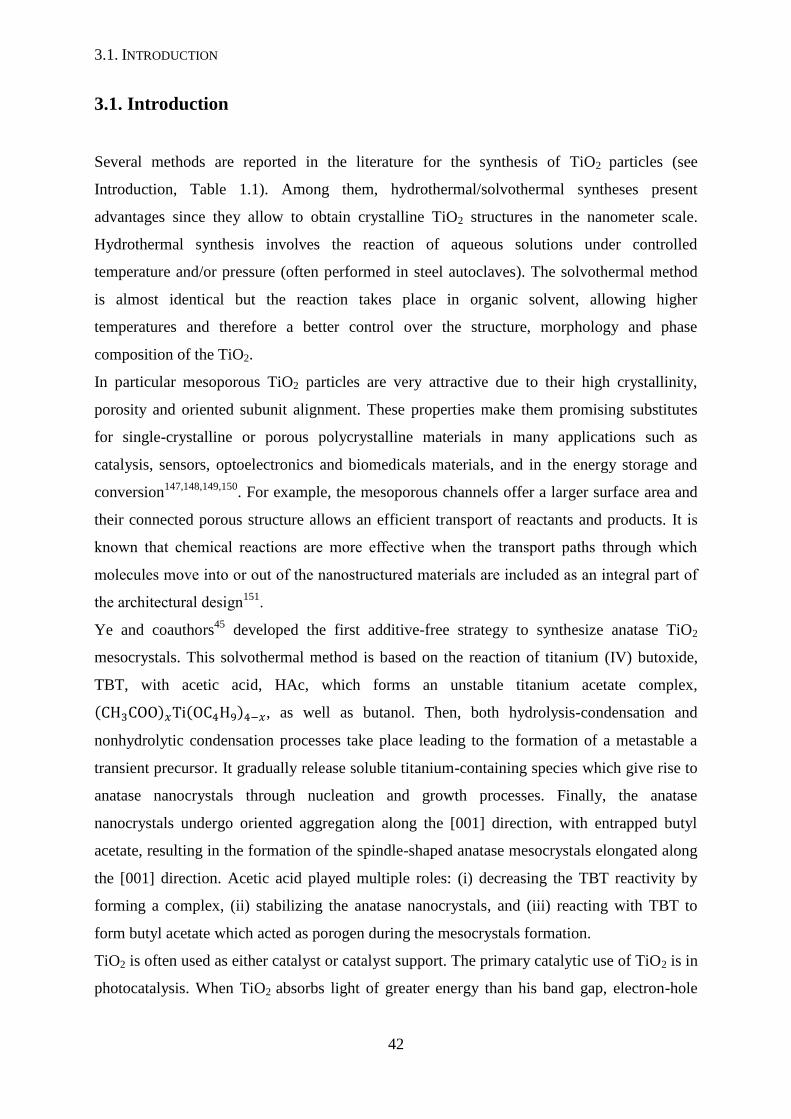
3.1. INTRODUCTION
42
3.1. Introduction
Several methods are reported in the literature for the synthesis of TiO2 particles (see
Introduction, Table 1.1). Among them, hydrothermal/solvothermal syntheses present
advantages since they allow to obtain crystalline TiO2 structures in the nanometer scale.
Hydrothermal synthesis involves the reaction of aqueous solutions under controlled
temperature and/or pressure (often performed in steel autoclaves). The solvothermal method
is almost identical but the reaction takes place in organic solvent, allowing higher
temperatures and therefore a better control over the structure, morphology and phase
composition of the TiO2.
In particular mesoporous TiO2 particles are very attractive due to their high crystallinity,
porosity and oriented subunit alignment. These properties make them promising substitutes
for single-crystalline or porous polycrystalline materials in many applications such as
catalysis, sensors, optoelectronics and biomedicals materials, and in the energy storage and
conversion147,148,149,150
. For example, the mesoporous channels offer a larger surface area and
their connected porous structure allows an efficient transport of reactants and products. It is
known that chemical reactions are more effective when the transport paths through which
molecules move into or out of the nanostructured materials are included as an integral part of
the architectural design151
.
Ye and coauthors45
developed the first additive-free strategy to synthesize anatase TiO2
mesocrystals. This solvothermal method is based on the reaction of titanium (IV) butoxide,
TBT, with acetic acid, HAc, which forms an unstable titanium acetate complex,
(CH3COO)𝑥Ti(OC4H9)4−𝑥, as well as butanol. Then, both hydrolysis-condensation and
nonhydrolytic condensation processes take place leading to the formation of a metastable a
transient precursor. It gradually release soluble titanium-containing species which give rise to
anatase nanocrystals through nucleation and growth processes. Finally, the anatase
nanocrystals undergo oriented aggregation along the [001] direction, with entrapped butyl
acetate, resulting in the formation of the spindle-shaped anatase mesocrystals elongated along
the [001] direction. Acetic acid played multiple roles: (i) decreasing the TBT reactivity by
forming a complex, (ii) stabilizing the anatase nanocrystals, and (iii) reacting with TBT to
form butyl acetate which acted as porogen during the mesocrystals formation.
TiO2 is often used as either catalyst or catalyst support. The primary catalytic use of TiO2 is in
photocatalysis. When TiO2 absorbs light of greater energy than his band gap, electron-hole

3.1. INTRODUCTION
43
pairs are generated and redox reactions with surface species are initiated, before
recombination. TiO2 photocatalysts are used in many ways including water purification,
hydrogen production, air purification, and selective organic synthesis.
Noble metals such as Au, Pt, and Pd supported on anatase TiO2 are particularly useful in a
number of oxidation reactions, e.g. oxidation of CO at low temperatures64
, direct synthesis of
hydrogen peroxide152
, selective oxidation of primary C-H bonds153
and oxidation of alcohols
to aldehydes154
. The advantages of supporting noble metals NPs in a platform such as TiO2, is
the enhancement of the nanoparticles stability towards ionic strength or solvent exchange, the
easy removal from reaction medium or improvement of reusability. Furthermore in some
cases, the synergistic effects could also improve the catalytic efficiency of the nanostructure.
Several methods have been reported in the literature for the deposition of Au NPs on TiO2
particles (see Chapter 1, Table 1.3). The deposition-precipitation, DP, method is the mostly
recommended method for obtaining TiO2@Au catalysts. It is explained in terms of: (i) small
and uniform gold NPs, (ii) reproducible properties, and (iii) a strong interaction between the
gold NPs and the TiO2 support61,62,155
. The DP technique involves the deposition of gold
hydroxide on the TiO2 support by raising the pH of AuCl4− solution. Although the pH adjust
could be carried out using NaOH66,80,
. The use of urea is recommended70,80
since urea
facilities surface complex formation and metal loadings of around 100 wt.% are achieved.
Zanella et al.80
proposed a mechanism based on the adsorption of AuCl4− and/or
AuCl3(OH)− which act as nucleation sites for the precipitation and growth of Au(C0(NH2)2).
Au(C0(NH2)2) resulted from the reaction between gold anions and urea or products of its
decomposition. The pH increase from 3 to ∼ 7 leads to the formation of gold nuclei and lead
to a decrease in the size of the gold nuclei on the TiO2 support156
.
TiO2@Au composites can be also obtained by chemical reduction of gold complexes
deposited on the titania surface. The nature of the gold complexes is strongly dependent of
pH157
. While at pH 3-4 the major species are neutral (AuCl3. H2O) at 7 and 10 the
predominant species are [AuCl(OH)3]− and [Au(OH)4]−, respectively. As is well known, at
higher pH anatase TiO2 particles are negatively charged (see Appendix I, Scheme I.1) and the
predominant gold precursor species in suspension were probably [AuCl(OH)3]− and/or
[Au(OH)4]− resulting in an electrostatic repulsing, whereby some other mechanism was
required. Haruta et al.86
proposed that Au(OH)3 was formed between pH 6 and pH 11 (see
Reaction (3.1)) and deposited on the TiO2 support (see Reaction (3.2)). Moreau and

3.1. INTRODUCTION
44
coworkers158
suggested also an adsorption of gold neutral species, Au(OH)3, on negatively
charged TiO2 surface.
Au(OH)4− ↔ Au(OH)3 + OH− (3.1)
Au(OH)3 + 2TiO− → [Au (OH)2(OTi)2]− + OH− (3.2)
In this chapter three different approaches for the synthesis of anatase TiO2 nanoparticles
doped with gold nanoparticles (TiO2@Au) were explored. The strategies are based on the
preparation of spindle-shaped TiO2 nanoparticles and the further Au deposition. The
deposition routes are based on either adsorption of AuCl4− or (Au(Cl)4−n(OH)n
−) ions /
Au(OH)3 on TiO2 surface and their further reduction with NaBH4 or the
deposition-precipitation with urea (DPU) followed by chemical reduction using NaBH4. This
last method, allowed modulate the size and density of the gold nanoparticles on titanium
dioxide surface by varying the amount of titania used in the process of DPU. The structural,
physico-chemical and morphological properties of TiO2 and Au-doped TiO2 were examined
by TEM, DLS, BET, SAED, XPS, and UV-visible absorption spectroscopy.
3.2. Experimental section
Chemicals
Titanium (IV) butoxide (Ti(OC4H9)4), reagent grade 97%, acetic acid (CH3CO2H),
tetrachloroauric acid trihydrate (HAuCl4. 3H2O), sodium borohydride (NaBH4), ammonia
25% (NH3), sodium ascorbate (C6H7NaO6) and urea (CO(NH2)2) were purchased from
Aldrich. All reactants were used without further purification. Milli-Q grade water with a
resistivity higher than 18.2 MΩ . cm-1
was used in all the preparations.
Anatase titanium dioxide synthesis
Nanoporous anatase TiO2 mesocrystals with two different sizes were prepared via the
solvothermal method described by Ye and co-authors6 with some modifications. In a typical
synthesis, 0.7 or 0.4 mL of titanium (IV) butoxide was added dropwise to 20 mL of acetic
acid with continuous stirring, yielding 1TiO2 and 2TiO2, respectively. Then the TiO2
suspension was transferred to a 40 mL Teflon-lined autoclave to perform the solvothermal
treatment at 200 ºC for 24 h. After that, the suspension was cooled at room temperature and
the product was collected and washed with absolute ethanol several times. Finally, it was
redispersed in Milli–Q water.

3.2. EXPERIMENTAL METHODS
45
Synthesis of gold doped anatase titanium dioxide nanoparticles
Adsorption of 𝐀𝐮𝐂𝐥𝟒− on TiO2 surface. In a typical experiment, 200 µL of HAuCl4 (13.2
mM) was added to 10 mL of an aqueous solution of as-synthesized anatase TiO2 (0.05 mg
mL-1
). It was stirred for 30 min in the dark at 25 ºC to allow complete adsorption of AuCl4−
ions over the TiO2 surface and then centrifuged. The supernatant was discarded, the pellet was
redispersed in 10 mL of Milli-Q water and 25 µL of NaBH4 (100 mM) were added under
stirring. Finally the suspension was centrifuged (3500 rpm for 15 min), the supernatant was
removed and the residue was redispersed in Milli-Q water. This washing cycle was repeated
once more.
Adsorption of Au(Cl)4-n(OH)-n / Au(OH)3 on TiO2 surface. In the standard preparation
conditions, 10 mL of aqueous suspension of TiO2 (0.05 mg mL-1
) was placed, for 30 minutes,
in a water bath at 40 °C, until achieve thermal equilibrium. Then, 10 µL of 1.0 M ammonia
(25 %) and 61.3 µL of 38.8 10-3
M HAuCl4 solution were added. After 15 min at 40 °C, the
suspension was centrifuged, the supernatant was discarded and the residue redispersed in 10
mL of Milli-Q water. Then 25 µL of NaBH4 (100 mM) were added under stirring and after 10
min it was centrifuged (3500 rpm for 15 min), the supernatant discarded and the residue
(TiO2@Au) redispersed in Milli-Q water. This washing cycle was repeated once more.
The Au NPs deposited in the TiO2 surface (TiO2@Au) were subjected to a process of seeded
growth. Briefly, 10 mL of the suspension of TiO2@Au was placed in an ultrasound bath.
Then, 10 µL of 0.2 M sodium ascorbate was added and 1.0 mL of 0.35 10-3
M HAuCl4 was
injected, in 100 µL portions at an interval of 1 min each, using an automatic injector, under
magnetic stirrer. The sample was then centrifuged, the supernatant was discarded, and the
residue was redispersed in Milli-Q water.
Deposition-precipitation with urea. TiO2@Au composites were prepared by the method of
deposition-precipitation with urea developed by Zanella and co-workers80
with some
modifications. In a typical procedure, the certain amount of as-synthesized titanium dioxide
was added to 1 mL of aqueous solution containing HAuCl4. 3H2O (4.2 mM) and urea (42
mM). The suspension was heated at 90 ºC through heater-stirrer and reflux during 4 h under
magnetic stirrer. After that, the suspension was cooled naturally at room temperature. Then,
the suspension was centrifuged (3500 rpm for 15 min), the supernatant discarded and the

3.2. EXPERIMENTAL METHODS
46
pellet redispersed in water. This washing procedure was repeated several times to remove the
residual urea as well as gold species non-adsorbed on titania. Finally, 25 µL of NaBH4 (100
mM) were added to the suspension under stirring and after 10 min it was centrifuged (3500
rpm for 15 min), the supernatant discarded and the pellet, TiO2@Au, redispersed in Milli-Q
water. This washing cycle was repeated once more.
In order to tune the size of the gold NPs, different amounts of titania nanoparticles were added
in the process of deposition precipitation with urea. The detailed experimental conditions for
the preparation of the aforementioned samples are listed in Table I.1 (see Appendix I). For
each preparation the initial pH (pHi) of the HAuCl4, urea and TiO2 suspension and the final
pH (pHf) at the end of the preparation were recorded.
Instrumentation
A JEOL JEM 1010 transmission electron microscope operating at an acceleration voltage of
100 kV and a HITACHI H-8100 microscope operating at an accelerating voltage of 200 kV
were used to perform general examination of samples at low magnification, including bright
field and dark field imaging and Selected Area Diffraction (SAD). A JEOL JEM 2010 FEG
(field emission gun) high resolution transmission electron microscope (HRTEM) operating at
an acceleration voltage of 200 kV was used to obtain SAED and HRTEM images. High Angle
Annular Dark-Field images were obtained in the same system working in STEM mode,
elemental maps were also obtained in STEM mode coupled with the X-ray spectrometer
(INCA Energy 200 from Oxford). The UV-Vis absorption spectra were recorded on a
VARIAN CARY 50 spectrophotometer. The zeta potential measurements were performed
with a Malvern Zetasizer Nano ZS90 instrument. The textural properties were determined by
nitrogen physisorption at 77 K, employing the Brunauer–Emmett–Teller (BET) method in a
Micromeritics ASAP 2020 apparatus. Before analysis the samples were out-gassed at 200 ºC.
Nitrogen adsorption/desorption isotherms at 77 K were obtained by plotting the amount of
nitrogen adsorbed vs. the corresponding relative pressure of nitrogen. The total surface area of
the TiO2@Au samples was determined using the BET method. The Barrett, Joyner, and
Halenda (BJH) method was used to calculate pore size distribution and total pore volume.
X-ray diffraction (XRD) measurements were carried out at room temperature by using
Siemens X-ray diffraction D5000 with Cu Kα radiation as incident beam (k = 1.5406 Å, 40
kV and 30 mA) with automatic data acquisition. Data were collected over the 2 range of 20–
70 º. XPS experiments were performed in a SPECS Sage HR 100 spectrometer with a

3.2. EXPERIMENTAL METHODS
47
non-monochromatic X-ray source (Magnesium Kα line of 1253.6 eV energy and 250 W and
calibrated using the 3d5/2 line of Ag with a full width at half maximum (FWHM) of 1.1 eV.
An electron flood gun was used to compensate for charging during XPS data acquisition. The
selected resolution for the spectra was 15 eV of Pass Energy and 0.15 eV/step for the detailed
spectra. All measurements were made in an ultra-high vacuum (UHV) chamber at a pressure
around 5 10-8
mbar. In the fittings Gaussian-Lorentzian functions were used (after a Shirley
background correction) where the FWHM of all the peaks were constrained while the peak
positions and areas were set free. The etching of the samples was done with an Ar+ beam with
energy of 3 kV at several times up to 1100 s. The gold content in the TiO2@Au sample
prepared by DPU was determined using an Inductively Coupled Plasma-Atomic Emission
Spectrometer (ICP-AES) system (Horiba Jobin-Yvon, France, Model: Ultima) equipped with
RF generator of 40.68 MHz, Czerny-Turner monochromator with 1.00 m (sequential), AS500
autosampler, and CMA device (Concomitant Metals Analyzer). Concentrated hydrochloric
acid and nitric acid were added to TiO2@Au suspension until completely dissolution of the
Au NPs. The resulting suspension was sonicated for 1 hour, then syringe-filtered and diluted
with Milli-Q water prior to analysis.
3.3. Results and discussion
3.3.1. Anatase titanium dioxide
Anatase titania nanoparticles, of two different sizes, were were prepared via the solvothermal
reaction of TBT in HAc at 200 ºC. The particle size was varied by adding different amounts
of TBT in the reaction medium. The resulting mesocrystals were characterized by various
techniques, including transmission electron microscopy, selected area electron diffraction,
BET specific surface area measurement, dynamic light scattering and X-ray photoelectron
spectroscopy.
TEM images (Figure 3.1 (A-D)) indicate that the resulting particles presented spindle-like
morphology, independently of the amount of TBT added. Nevertheless, the TiO2 dimensions
depended on the TBT concentration. While the addition of 0.7 mL of TBT resulted in
particles (named 1TiO2) of 175.7 ± 38.6 nm in length and 116.8 ± 28.8 nm in diameter (see
Appendix I, Figure I.1 (A) and (B)), the addition of 0.4 mL of TBT into 20 mL of HAc gave
rise to larger particles (named 2TiO2, 303.8 ± 72.8 nm in length and 226.4 ± 48.0 nm in
diameter) (see Appendix I, Figure I.1 (C) and (D)).

4.4. CONCLUSIONS
Figure 3.1: TEM images of anatase 1TiO2 (A-B), 2TiO2 (C-D) and High Angle Annular Dark-Field
STEM images of 2TiO2 (E-F) mesocrystals.
The characterization by high angle annular dark-field STEM images (Figure 3.1 (E-F))
showed that 2TiO2 particles presented areas with different contrasts indicating the presence of
defects in the crystal structure. In order to determine the phase of the TiO2 particles the
selected area electronic diffraction (SAED) patterns were analyzed. Figure 3.2.A shows that
the SAED pattern is constituted by polycrystalline diffraction rings that can be identified as
anatase structure (Figure 3.2A). Since there were no other diffraction rings corresponding to
rutile or brookite in the SAED pattern, it suggested that 2TiO2 particles were entirely anatase.
Besides, the analysis of a single nanoparticle reveal that the anatase TiO2 mesocrystals were
consisted of anatase subunits highly oriented along the [001] direction exhibiting diffraction
spots corresponding to the [100] zone axis of the anatase phase (Figures 3.2 (B)). Similar
results were found for 1TiO2 particles.

3.3. RESULTS AND DISCUSSION
49
Figure 3.2: (A) Electron diffraction ring pattern from the 2TiO2 particles showed in the inset, the
pattern was indexed using the anatase structure. (B) Electron diffraction pattern obtained from a single
particle showed in the inset. In plane rotation of SAED pattern was compensated.
The titania stability was measured on the basis of Zeta potential measurements. The TiO2
particles exhibited a high zeta potential values (1TiO2 = +38.5 7.58 mV and 2TiO2 = +32.1
11.4 mV) indicating that the suspension was highly stable in water. Figure 3.3(A) shows the
UV-visible absorption spectra for the TiO2 samples. A strong absorption in the ultraviolet
region, associated with the electron promotion of TiO2 from the valence to the conduction
band, was clearly observed with the absorption edge at wavelength around 335 nm. Besides,
both anatase TiO2 particles showed absorption spectra extended into the visible-NIR region
over the range of 400 to 800 nm. In semiconductors a shift in the optical edge corresponds to
a change in the band gap.159
Therefore, the observed absorption edge shift toward longer
wavelengths indicated a decrease in the TiO2 band gap energy7. To confirm this hypothesis
the energy band gap, Eg, of TiO26 samples was estimated from the relationship of the
absorption coefficient and the photon energy160
, which is given by (αℎʋ)1
2⁄ = ℎʋ, where
ℎʋ is the photon energy and α is absorption coefficient. α can be determined from Lambert
Beer Law, α =2.303A
d, where A is the absorbance and d is the optical path length. Thus
band-gap energy could be obtained from the extrapolation of the linear part of the curve
6 The band structure of the anatase single crystals has two maxima, M and Γ, near the top of the VB,
which are separated by a very small energy difference (~ 2 meV). The transitions from these states to
the bottom of the CB can be either direct (Γ (VB) → Γ (CB)) or indirect (M (VB) → Γ (CB)). This
depends upon the crystalline structure, the lattice parameters, and the material dispersion.

3.3. RESULTS AND DISCUSSION
50
(αℎʋ)1
2⁄ versus ℎʋ (photon energy). Figure 3.3 (B) shows a band gap value of 1.99 and 1.92
eV for 1TiO2 and 2TiO2, respectively.
Figure 3.3: (A) UV-vis absorption spectra of 1TiO2 and 2TiO2 samples. The spectra were normalized
at the maximum absorbance to facilitate comparison. (B) Plot of (αℎʋ)1
2⁄ versus the energy of light
for TiO2 samples.
The reduction in the band gap of anatase TiO2 can be analyzed by using the model of the band
structure. In the band structure of stoichiometric TiO2, the conduction band is Ti 3d and 4s in
character and the valence band is oxygen 2p in character. Scheme 3.1 shows that all the four
electrons from Ti are found in the half-filled O 2p states and it leaves the Ti 3d and 4s orbitals
empty forming the conduction band. The filled O 2p orbitals form the valence band of TiO2.
Theoretical analysis161,162
confirmed that when an oxygen atom is removed, three 2p orbitals
are removed with four electrons and the remaining two electrons from Ti localized on two
adjacent Ti atoms reduces them to Ti3+
. The introduction of dopants, such as carbon, reduce
the band gap by replacing oxygen 2p states in the valence band with 2p states that float up
into the band gap. In addition, carbon doped TiO2 samples exhibited an enhanced absorption
in the whole visible light region and a red shift in the absorption edges163,164
. Hence, XPS
measurements have been performed to analyze the presence of C and Ti3+
in the TiO2
structure. Both TiO2 samples contain Ti, O, and C elements (see Table 3.1). Additionally, the
stoichiometry of TiO2 samples was confirmed by the O/Ti ratio, 2.26 for 1TiO2 and 2.00 for
2TiO2, which indicated the absence of oxygen vacancies on the titania surface.

3.3. RESULTS AND DISCUSSION
51
Scheme 3.1: Representation of the electronic structure of TiO2. Adapted from reference [165].
Table 3.1: XPS elemental analysis (in at. %) for TiO2 samples
Sample
Atomic (%)
Ti O C O/Ti
1TiO2 28.1 63.6 8.3 2.26
2TiO2 31.0 62.0 7.0 2.00
Figure 3.4 shows the fitted Ti 2p, O 1s and C 1s spectra of the 2TiO2 sample. The C 1s XPS
spectrum (Figure 3.4 (C)) revealed an intense peak at 285 eV assigned to C-H or C-C bonds166
and other two peaks at 286.5 and 288.6 eV corresponding to C-O and C=O groups,
respectively, probably from carbonate species167
. No signals from Ti-C bond were observed at
281.8 eV. It indicated that C had been incorporated in the TiO2 mesocrystals essentially as
elemental carbon, probably within the tetrahedral and octahedral interstices existing in the
anatase lattice, and a small amount as carbonate species. Carbon from Ti(OC4H9)4 or HAc or
C4H9OCOCH3 was retained during the solvothermal process, which resulted in carbon
self-doping into the lattice of anatase TiO2 mesocrystals. These hypotheses were consistent
with the results obtained by Wu and coworkers168
who found that C-doped TiO2 could be
prepared by solvothermal reaction (180 ºC, 2 h) of tetra n-butoxide in ethanol/water without
the addition of extra carbon sources. The presence of C-O bonds in TiO2 was further observed
in the O 1s XPS spectrum from 2TiO2. Figure 3.4 (B) shows the expected positions of the
C-O, C=O and TiO2 bonds at 533.0, 531.8 and 530.0 eV43
, respectively. The XPS analysis
clearly showed that the oxygen atoms are bonded essentially to Ti, with some oxygen atoms
attached to the carbon. Figure 3.4 (A) shows Ti 2p XPS region169
where the major peak
located at 458.6 eV could be attributed to Ti-O bonds. The peak characteristic for Ti-C at
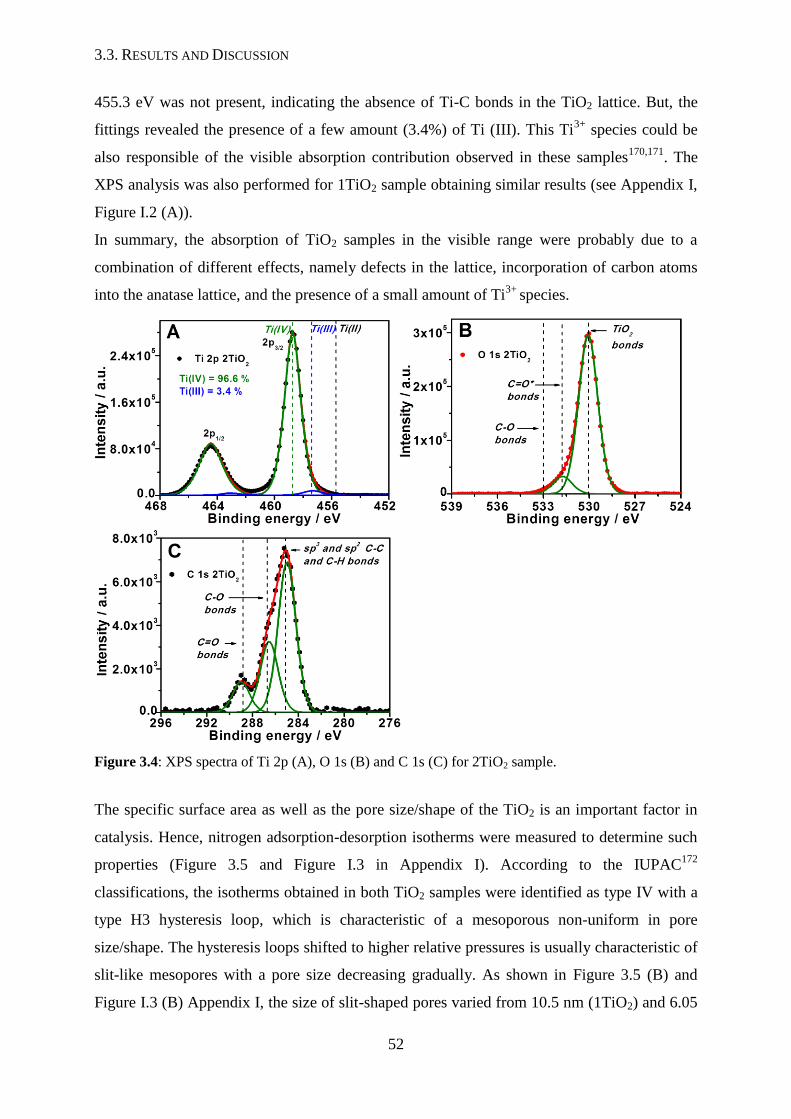
3.3. RESULTS AND DISCUSSION
52
455.3 eV was not present, indicating the absence of Ti-C bonds in the TiO2 lattice. But, the
fittings revealed the presence of a few amount (3.4%) of Ti (III). This Ti3+
species could be
also responsible of the visible absorption contribution observed in these samples170,171
. The
XPS analysis was also performed for 1TiO2 sample obtaining similar results (see Appendix I,
Figure I.2 (A)).
In summary, the absorption of TiO2 samples in the visible range were probably due to a
combination of different effects, namely defects in the lattice, incorporation of carbon atoms
into the anatase lattice, and the presence of a small amount of Ti3+
species.
Figure 3.4: XPS spectra of Ti 2p (A), O 1s (B) and C 1s (C) for 2TiO2 sample.
The specific surface area as well as the pore size/shape of the TiO2 is an important factor in
catalysis. Hence, nitrogen adsorption-desorption isotherms were measured to determine such
properties (Figure 3.5 and Figure I.3 in Appendix I). According to the IUPAC172
classifications, the isotherms obtained in both TiO2 samples were identified as type IV with a
type H3 hysteresis loop, which is characteristic of a mesoporous non-uniform in pore
size/shape. The hysteresis loops shifted to higher relative pressures is usually characteristic of
slit-like mesopores with a pore size decreasing gradually. As shown in Figure 3.5 (B) and
Figure I.3 (B) Appendix I, the size of slit-shaped pores varied from 10.5 nm (1TiO2) and 6.05

3.3. RESULTS AND DISCUSSION
53
nm (2TiO2) to pore sizes smaller than 2 nm. Besides, slight differences were observed in the
specific surface area, 124.77 and 151.22 m2g
-1 for 1TiO2 and 2TiO2, respectively, and in the
pore volumes, 0.32 and 0.22 cm3g
-1 for 1TiO2 and 2TiO2, respectively (see Table 3.2).
Figure 3.5: (A) Nitrogen adsorption-desorption isotherms for 2TiO2. (B) Pore size distribution
obtained from the adsorption branch of the sample 2TiO2.
Table 3.2 shows the physical properties of the synthesized anatase 1TiO2 and 2TiO2 particles.
It should be noted that the titanium dioxide mesocrystals, the 1TiO2 or 2TiO2, obtained at
each new solvothermal synthesis present slight differences in the lengths and widths.
However, both samples are rather similar in terms of crystalline structure, pore size, surface
charge, or chemical composition.
Table 3.2: Physical properties of anatase TiO2 particles.
Phase aSA
m2g
-1
bPore V
cm3g
-1
cPore D
nm
ξ
mV
Length
nm
Diameter
nm
dBG
eV
1TiO2 Anatase 124.8 0.32 10.1 +38.57.6 175.7±38.6 116.8±28.8 1.99
2TiO2 Anatase 151.2 0.22 6.1 +32.111.4 303.8±72.8 226.4±48.0 1.92
Method SAED BET BET BET DLS TEM a
BET surface area calculated from the linear part of the BET. b
Pore volume and caverage pore size
determined by nitrogen adsorption volume. dBand gap.
3.3.2. Gold-doped titanium dioxide nanoparticles
For the doping of anatase TiO2 with Au nanoparticles three different strategies were explored:
adsorption of AuCl4− or (Au(Cl)4−n(OH)n
−) ions / Au(OH)3 followed by reduction with
sodium borohydride and deposition–precipitation with urea.

3.3. RESULTS AND DISCUSSION
54
3.3.2.1. Electrostatic adsorption of 𝐀𝐮𝐂𝐥𝟒− on TiO2 surface
The first approach to dope TiO2 with Au nanoparticles is based on electrostatics adsorption.
Titania colloids exhibits a positive zeta potential (+ 38.5 7.58 mV) therefore the Au doping
was performed via the electrostatic adsorption of negatively charged AuCl4− ions on the
positively charged titania surface and their further reduction with sodium borohydride (see
Scheme 3.2). As shown in Figures 3.6 (A-B), 1TiO2 particles are homogeneously doped with
Au NPs. The average size of the Au NPs in the 1TiO2@Au was 1.3 ± 0.5 nm (see Figure I.4
(A) in Appendix I). The process was monitored by UV-visible absorption spectroscopy. As
shown in Figure 3.6 (C) the optical properties of TiO2 mesocrystals remained unperturbed
after the AuCl4− adsorption and upon their reduction with NaBH4 an increase in the visible
absorption was observed. However, 1TiO2@Au did not show a defined plasmon band due to
the small Au particle size.
Scheme 3.2: Synthesis of Au-doped TiO2 nanoparticles via electrostatic adsorption of AuCl4− ions
followed by reduction with sodium borohydride.
Figure 3.6: (A-B) TEM images of 1TiO2@Au nanoparticles. (C) UV-visible absorption spectra of
1TiO2, AuCl4−-adsorbed 1TiO2 and 1TiO2@Au colloids.
In order to increase the size of Au nanoparticles deposited on the TiO2 surface, the amount of
AuCl4− ions adsorbed on the titania surface was increased by successive additions of HAuCl4.

3.3. RESULTS AND DISCUSSION
55
The HAuCl4 concentrations tested were 0.26, 0.53, 0.79 and 1.06 mM. As shown in Figure
3.7 (C) at higher HAuCl4 concentration the absorption band attributed to AuIII
(221 nm) could
be observed, confirming the Au ions adsorption. Then, the Au NPs were obtained by adding a
strong reducing agent such as NaBH4. As shown in Figure 3.7 (A-B) higher HAuCl4
concentration led to larger Au nanoparticles (9.4 ± 2.6 nm, see Figure I.4 (B) in Appendix I),
but not to larger Au loadings.
Figure 3.7: (A-B) TEM images of TiO2@Au nanoparticles. (C) UV-visible absorption spectra of
1TiO2, AuCl4−-adsorbed 1TiO2 and 1TiO2@Au colloids. Au NPs with average diameters of 9.4 2.6
nm (A and B).
3.3.2.2. Adsorption of (𝐀𝐮(𝐂𝐥)𝟒−𝐧(𝐎𝐇)𝐧−) ions / 𝐀𝐮(𝐎𝐇)𝟑 on TiO2 surface
The second approach carried out to dope TiO2 mesocrystals with Au NPs was also based on
the adsorption of Au species and their further reduction. But in this case AuCl4− ions were
added to TiO2 colloids in the presence of ammonia. In basic medium Au(Cl)4−n(OH)n−
complexes were formed77
. The addition of Au salt decreased the pH to around 4. Taking into
account that titania is positively charge at this pH the adsorption took place via electrostatic
interactions.
The TEM characterization of TiO2@Au nanoparticles obtained after the addition of NaBH4
(see Figure 3.8 (A-B)) showed a nonuniform distribution of 6.9 ± 2.4 nm of Au NPs on the
TiO2 surface (see Figure I.5 (A) in Appendix I). Besides, the overgrowth of the Au NPs via
further addition of HAuCl4 and reduction with ascorbic acid was also studied. But it did not
improve the Au size distributions as observed in Figure 3.8 (C-D) and Figure I.5 (B) in
Appendix I.
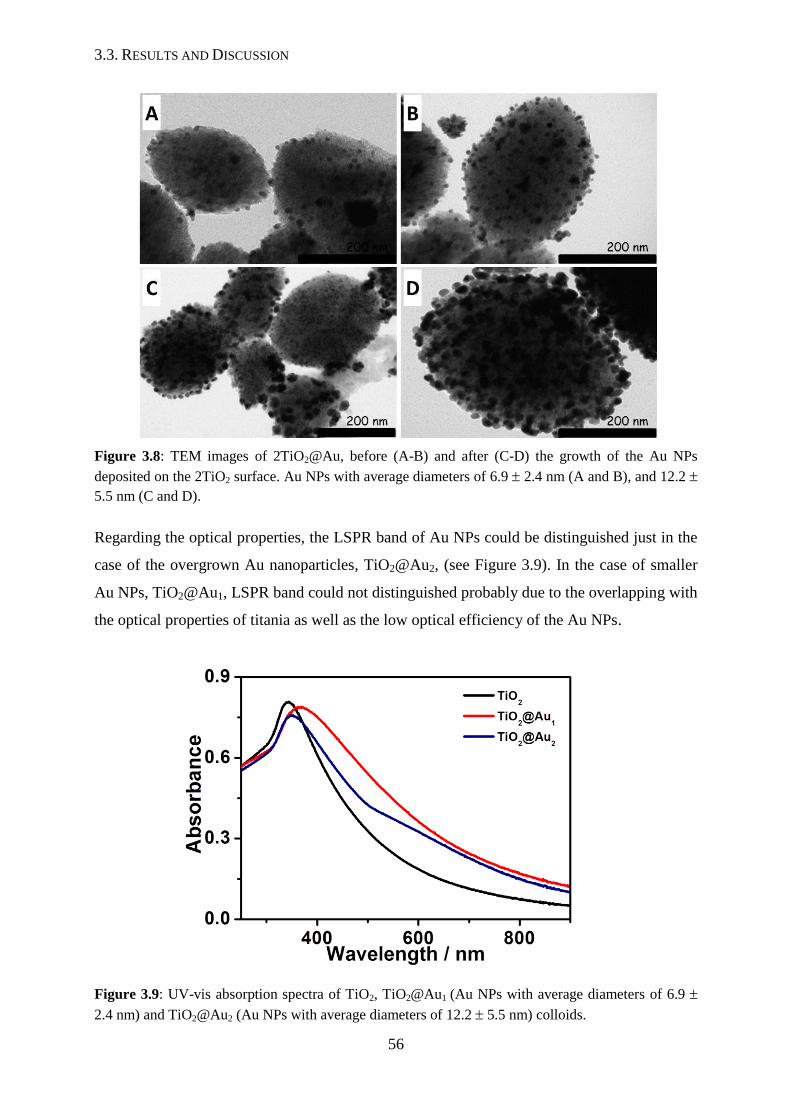
3.3. RESULTS AND DISCUSSION
56
Figure 3.8: TEM images of 2TiO2@Au, before (A-B) and after (C-D) the growth of the Au NPs
deposited on the 2TiO2 surface. Au NPs with average diameters of 6.9 2.4 nm (A and B), and 12.2
5.5 nm (C and D).
Regarding the optical properties, the LSPR band of Au NPs could be distinguished just in the
case of the overgrown Au nanoparticles, TiO2@Au2, (see Figure 3.9). In the case of smaller
Au NPs, TiO2@Au1, LSPR band could not distinguished probably due to the overlapping with
the optical properties of titania as well as the low optical efficiency of the Au NPs.
Figure 3.9: UV-vis absorption spectra of TiO2, TiO2@Au1 (Au NPs with average diameters of 6.9
2.4 nm) and TiO2@Au2 (Au NPs with average diameters of 12.2 5.5 nm) colloids.
3.3. RESULTS AND DISCUSSION
57
3.3.2.3. Deposition-precipitation with urea
The third approach to dope anatase TiO2 particles with Au was based on the
deposition-precipitation with urea. Both 1TiO2 and 2TiO2 samples were used to perform this
studied. Yet similar results of gold nanoparticles deposition over titania surface by DPU
method were obtained with both TiO2 samples. So it was decided to present only the results
obtained with 2TiO2 nanoparticles and the 1TiO2@Au results were recorded in Appendix I. In
this method, the formation of gold nanoparticles on titanium support can be briefly described
as follows: initial, the surface of TiO2 is positively charged (pH ~ 2) and the gold species in
suspension are probably AuCl4− and/or AuCl3(OH)−, thereby these gold species can interact
electrostatically with the TiO2 support. Then the growth of the particles of gold precipitate,
probably Au(CO(NH2)2 species, on these sites occurs which act as nucleation sites, due to the
progressive increase of pH by the urea decomposition. The obtained gold species in TiO2@Au
are cationic gold species, as it will be seen later in the XPS studies, and so the addition of
NaBH4 was required to reduce them to metallic Au. To modulate the size of the gold
nanoparticles, i.e. 17.5 5.3; 4.0 1.4 and 1.4 0.5 nm (see Figure I.8 in Appendix I), on
titanium dioxide surface the amount of titania used in DPU was 0.7, 7.0 and 10.5 mg/mL,
respectively (see Appendix I, Table I.1) yielding the nanostructures named TiO2@Au0,
TiO2@Au1 and 2TiO2@Au2, respectively. The resulting Au-doped TiO2 particles were
characterized by various techniques, including transmission electron microscopy, HTREM,
XRD, and X-ray photoelectron spectroscopy. Figure 3.11 shows TEM images of 2TiO2@Au
nanostructures where the amount of titanium dioxide added in the DPU was increased from
0.7 to 10.5 mg/mL. As shown in the TEM images of 2TiO2@Au the Au NPs were uniformly
distributed over the TiO2 surface7. Moreover it can be observed that the Au nanoparticle
loading and size decreased with the amount of titania used in the DPU method. Finally, Au
loading and size also varied with the amount of urea. The 2TiO2@Au sample, obtained using
42 mM of urea, (Figure 3.10 (E-F)) presented lower Au density compared with particles
obtained with 42 × 10-2
M urea, 2TiO2@Au4, (see Figure I.6 (A-B) in Appendix I). It also
produced remarkable differences in the optical properties, the 2TiO2@Au4 sample exhibited a
broad absorption in the visible light region (see Figure I.6 (C) in Appendix I).
7 See Figure I.7 in Appendix I for TEM images of 1TiO2@Au1-2 composites obtained using different
amounts of 1TiO2.

3.3. RESULTS AND DISCUSSION
58
Figure 3.10: TEM images of 2TiO2@Au composites obtained using different amounts of 2TiO2
nanoparticles. (A-B) 0.7 mg/mL of 2TiO2, 2TiO2@Au0 sample; (C-D) 3.5 mg/mL of 2TiO2,
2TiO2@Au1 sample; and (E-F) 10.5 mg/mL of 2TiO2, 2TiO2@Au2 sample. The Au NPs dimensions,
as determined from TEM, are summarized in Table I.1, Appendix I.
The optical properties of titania composites were analyzed by UV-vis absorption
spectroscopy. Figure 3.11 shows that LSPR band were not distinguished independently of the
composite. The absorption spectra of 1TiO2@Au1/2 and 2TiO2@Au1/2 in comparison to the
1TiO2 and 2TiO2 absorption spectra, respectively, show two prominent features: (i) the
overall visible-light absorbance intensities were enhanced, probably, due to the presence of
small gold nanoparticles on titania support and (ii) the maximum absorption edge shows an
obvious red shift, more accentuate for 1/2TiO2@Au1 sample that present the higher amount of
small gold NPs in the TiO2 support. Thus, these TiO2@Au nanostructures are potentially very
actives in visible region becoming suitable for many applications, such as, solar energy
conversion devices or photocatalysts of organic dye pollutants under sunlight irradiation as
discussed in Chapter 5.

3.3. RESULTS AND DISCUSSION
59
Figure 3.11: UV-visible spectra of (A) 1TiO2, 1TiO2@Au1, and 1TiO2@Au2; (B) 2TiO2 and
2TiO2@Au1 and 2TiO2@Au2. All spectra are normalized at the absorbance maximum.
The composites were further analyzed by high resolution transmission electron microscopy
(HRTEM). Figure 3.12 shows HRTEM images of 1TiO2@Au1 composites. The gold
nanoparticles in the titania surface showed interplanar distances of 2.3 Å, assigned to the
spacing of the (111) planes of gold. The lattice fringes on the crystal face had spacings of 3.5
Å which corresponded to the (011) planes of anatase. It was consistent with the results
observed in the SAED pattern (see Figure 3.2 (A)) for bare titania nanoparticles. Moreover,
HAADF STEM characterization of 1TiO2@Au1 nanoparticles (Figures 3.12 (C-D))
demonstrated the uniform distribution of the Au nanoparticles on the titania surface and the
presence of Au nanoparticles as small as 0.8 nm inside of the anatase titania mesocrystals.

3.3. RESULTS AND DISCUSSION
60
Figure 3.12: (A-B) HRTEM images of 1TiO2@Au1 composite. Gold nanoparticles are indicated with
arrows. (C-D) High Angle Annular Dark-Field STEM images of 1TiO2@Au1. The Au NPs, as small as
0.8 nm, were deposited inside the porous channel system of the TiO2 nanoparticles (D).
Additionally, the phase structure of TiO2@Au samples was investigated by XRD (see Figure
3.13). Apart from the characteristic peaks at 2θ = 25.34 º, 37.8 º, 48.11 º, 55.04 º and 62.75 º
attributed to different diffraction planes of anatase TiO2. Weak diffraction peaks at 2θ =
44.14º and 64.81º corresponding to [200], [220] reflections of the face centered cubic, fcc,
structure of metallic Au could be distinguished.
Since, the Au loading is high in the 1TiO2@Au1 (as confirmed by ICP, see Appendix I, Table
I.1) the lack of intense XRD peaks could be due to the small size of Au nanoparticles and
their distribution inside the mesocrystalline structure.

3.3. RESULTS AND DISCUSSION
61
Figure 3.13: XRD pattern of 1TiO2@Au1.
In order to obtain information about chemical composition of the composites synthesized by
DPU, the 1/2TiO2@Au samples were subjected to XPS analysis. As the XPS results obtained
for 1/2TiO2@Au samples are identical, we present only those obtained with 2TiO2@Au
samples, and the XPS information of 1TiO2@Au samples were included in Appendix I.
The survey spectra showed the presence of Au, Ti, O, and C species in all TiO2@Au
composites (see Table I.1 in Appendix I). To characterize the valence state of the gold on the
2TiO2@Au samples, obtained with different amount of titania, the XPS spectra of Au 4f were
made and the results are represented in Figure 3.14. The deconvoluted spectra (see Figure
3.14 (A) and (B)) showed that there are mainly Au (III), Au (I) but not Au (0) in 2TiO2@Au1,
while Au0 species (main component) and Au (I) were the main Au species in 2TiO2@Au2
composite. Similar results were obtained for 1TiO2@Au1-2 and they have been included in the
Appendix I, Figure I.9. Therefore it was found that samples obtained with larger ratios TiO2
to Au salt gave rise to TiO2@Au composites with larger concentrations of Au0 species respect
to Au (III), Au (I) species. As mentioned, the XPS analysis of Au 4f for the 2TiO2@Au3
sample (sample obtained by DPU with 8.5 mg/mL of 2TiO2) confirms that the amount of gold
ions decreases and consequently increases the amount of metallic gold with the increase of
titania (see Figure 3.14 (A), (B) and (C)). Probably, the presence of Ti3+
in the 2TiO2 sample,
supported by XPS (see Figure 3.4 (A)) reduce the Au cations to neutral metals atoms, and so
in the spectra of Ti 2p of 2TiO2@Au2 has not observed the peak at 457.3 eV corresponding to
Ti3+
(see Figure 3.14 (E)). This observation indicates the occurrence of electron transfer from
TiO2 to Au nuclei´s. In this context, where all TiO2@Au samples exhibit gold ion over the

3.3. RESULTS AND DISCUSSION
62
titania support in a greater or lesser amount depending of the initial ratios of TiO2 to Au salt,
NaBH4 was added to all TiO2@Au samples, obtained by DPU method, to ensure complete
reduction of gold cations to metallic gold. After chemical reduction by NaBH4, XPS results
reveal that Au is only present in the metallic state (see Figure 3.14 (D)).
Figure 3.14: XPS spectra: (A, B, and C) at the Au 4f energies for 2TiO2@Au1*, 2TiO2@Au2*,
2TiO2@Au3* samples prepared using different amount of TiO2, namely 3.5, 10.5 and 8.5 mg/mL and
before NaBH4 addition; (D) at the Au 4f energies for 2TiO2@Au1 after NaBH4 addition; and (E) at the
Ti 2p energies for 1TiO2@Au2 and 2TiO2@Au2 composites.

4.4. CONCLUSIONS
Also XPS depth profiling was performed for 1TiO2@Au1 and 2TiO2@Au2 samples in 30 nm
of depth, to corroborate if gold were just on the titania surface or also inside of titania
mesocrystals. In both samples the results (see Figure I.10 in Appendix I,) indicated that gold
was also distributed inside of the anatase TiO2 mesocrystals. However, as expected, the
1TiO2@Au1 sample presented a larger amount of gold inside (mean of Au/Ti is 0.60 ± 0.1 and
0.046 ± 0.02 for 1TiO2@Au1 and 2TiO2@Au2, respectively).
3.4. Conclusions
TiO2 mesocrystals with high specific surface area, anatase structure, slit-shaped pores and
strong absorption in the UV visible range were obtained through solvothermal method of
titanium (IV) butoxide in acetic acid. To homogeneously dope these mesocrystals with gold
nanoparticles three distinct approaches are used, namely two adsorption-based processes and
the deposition-precipitation method with urea followed by reduction with NaBH4. In the case
of electrostatic adsorption of AuCl4− ions on the titania surface, the method allowed not
increase the size of gold nanoparticles or control the density of gold NPs over the titanium
dioxide surface. The method of adsorption of Au(Cl)4-n(OH)-n / Au(OH)3 on TiO2 surface led
to a heterogeneous sizes distribution and inhomogeneous density of Au NPs on the titania
support. Only the deposition-precipitation method with urea allowed control the size/density
of gold NPs on the titania surface by varying the amount of TiO2 used in the preparation of
TiO2@Au composites.

4.4. CONCLUSIONS

65
CHAPTER 4
TiO2@Au catalyzed reduction of ferrycianate (III) by
borohydride ions
ABSTRACT
The reduction of hexacyanoferrate (III) ions to hexacyanoferrate (II) ions by sodium
borohydride in aqueous solution was found to be strongly catalyzed by TiO2@Au composites.
The kinetics of this electron transfer reaction was followed by UV-vis absorption
spectroscopy monitoring the hexacyanoferrate (III) ions consumption at 420 nm with time. To
carry out the kinetic study different parameters (concentration of TiO2@Au and NaBH4, and
temperature) were analyzed. The fact that gold NPs are immobilized on the TiO2 particles not
just ensured their stability against aggregation but also improved their catalytic activity, which
indicate a synergic effect between Au and TiO2 NPs and facilitated their reusability. The
reduction of the specific surface area of the TiO2 NPs by the amount of loaded Au NPs has
strong effects in the TiO2@Au catalytic efficiency. A mechanism relating the electron transfer
from de surface of Au NPs to the conduction band of TiO2 and the Fe(CN)63− ions diffusion
on the Au and TiO2 surface followed by reduction by an excess of electrons on these surfaces
is proposed.

4.1. INTRODUCTION
66
4.1. Introduction
The gold, the most stable among all metals, was long considered to be a catalytically inactive
metal until 1987 when Haruta and coworkers85
reported the high activity of supported gold
catalysts, when its size is in the nanometer range, in the low-temperature oxidation of carbon
monoxide. Since then, high activity of gold nanoparticles was demonstrated in several
oxygen–transfer reactions such as propene oxidation, water gas shift reaction, synthesis of
H2O2, selective oxidation of alcohols and aldehydes173,174
. Although, one major drawback of
these frees gold nanoparticles is their tendency to agglomerate toward factors such was ionic
strength or solvent exchange. Furthermore, the catalyst should be easily removed from
product upon completion of the catalytic process. A simple way to avoid these problems is to
deposit the gold nanoparticles on a support such as TiO2, Fe2O3, Al2O3, SiO2, etc.. Also, the
cooperation between gold nanoparticles and the support, in the catalytic cycle, has been
claimed frequently to rationalize the better catalytic performance of support gold
nanoparticles. Wherefore, the chemical nature of the support plays important role in
determining the catalytic performance. Therefore, the semiconductor nature of titania can be
an important factor to study the catalysis by gold support in titania in the electron transfer
reactions, such as the reduction of hexacyanoferrate (III) by borohydride ions, once the titania
can receive electrons from Au and so can also act as a catalyst for the reaction175
. It should be
noted also that titania mesoporous materials, are potentially better (photo)catalysts176,177,178
because the channels of the material offer a larger surface area and a connect pore system
which can help to concentrate molecules for the electron-transfer reactions. It is common
knowledge that chemical reactions are most effective when the transport paths through which
molecules move into or out of the nanostructured materials are included as an integral part of
the architectural design179
. In this chapter we analyzed the catalytic performance of the
TiO2@Au obtained employing the precipitation-deposition method with urea (see Chapter 3).
In order to perform the analysis, the reduction of hexacyanoferrate (III) by borohydride ions
in alkaline aqueous solution was selected as model electron-transfer reaction. The influence of
the TiO2@Au catalysts concentration, the borohydride concentration and the temperature (in
the range of 283 - 303 K) in the model reaction rate constant of reduction of Fe (III) by BH4−
were investigated. The catalytic performance of the TiO2@Au composites is also compared
with the catalytic performance of pure Au and TiO2.

4.2. EXPERIMENTAL METHODS
67
4.2. Experimental section
Chemicals
Potassium hexacyanoferrate (III), sodium borohydride and sodium hydroxide were purchased
from Aldrich. All reactants were used without further purification. Milli-Q grade water with a
resistivity higher than 18.2 MΩ . cm-1
was used in all the preparations.
Electron transfer reaction preparation
A 2 10-3
M stock solution of hexacyanoferrate (III) ions was prepared using the potassium
hexacyanoferrate (III) salt. A 10 10-2
M stock solution of borohydride ions was prepared
using the sodium borohydride salt. The pH of this stock solution was adjusted to 11.5, by the
addition of NaOH, in order to inhibit the chemical decomposition of the reducing agent29
.
The electron transfer reaction between hexacyanoferrate (III) ions and borohydride ions was
carried out as follows: 1.25 mL of an aqueous solution of Fe(CN)63− (2 10
-3 M) and 1.5 mL
of Milli-Q water containing a certain amount of Au-doped anatase TiO2 particles were placed
in a quartz cuvette with an optical path length of 1 cm and maintained at 25 ºC for 5 minutes.
Then, 250 µL of freshly prepared NaBH4 aqueous solution (10 10-2
M) were subsequently
added into the above suspension. The suspension was shaken and immediately transferred into
UV-vis spectrometer. The temperature of the suspension, in the quartz cuvette, was controlled
by water regulated Peltier assembly connect to a water bath. All solutions were placed in a
thermostatic bath at desired temperature. The catalytic electron transfer reaction was repeated
three times, for each catalyst, to ensure the reproducibility.
Recycling of TiO2@Au
In order to study the recyclability of the 1TiO2@Au1 and 2TiO2@Au2 catalysts, 1.250 mL of
an aqueous solution of Fe(CN)63− (2 10
-3 M) and 1.5 mL of Milli-Q water containing a
certain amount of TiO2@Au were placed in a quartz cuvette with an optical path length of 1
cm. Then, 250 µL of freshly prepared NaBH4 aqueous solution (10 10-2
M) was added into
the above suspension. The reaction is followed by UV-vis spectroscopy. After the first cycle
of the electron transfer reaction is completed, the next cycle of electron transfer reaction is
initiated by adding 5 µL of 0.5 M Fe(CN)63−to the suspension. A total of six cycles were
made. Since the overall volume increase after 6 cycles is of 30 µL in a total volume of 3 mL,
the catalyst concentration in each cycle could be considered as constant.

4.3. RESULTS AND DISCUSSION
68
Instrumentation
The UV-Vis absorption spectra were recorded on a VARIAN CARY 50 spectrophotometer
with temperature control CARY single cell peltier accessory. The pH was measured using
Crison pH-Meter Basic 20+.
4.3. Results and discussion
The catalytic performance of TiO2@Au composites, obtained in Chapter 3, was evaluated
using a model redox reaction between hexacyanoferrate (III) and borohydride ions (see
Introduction for further details). Herein we just showed the catalytic analysis performed for
2TiO2@Au2 catalyst, however similar results were obtained for 1TiO2@Au1 and they have
been included in the Appendix II.
The redox reaction can be written as27
:
BH4− + 8Fe(CN)6
3− + 3H2O → H2BO3− + 8Fe(CN)6
4− + 8H+ (4.1)
Nevertheless, during this reaction the hydrolysis of borohydride ions also takes place. To
inhibit the decomposition of the reducing agent during the reduction of hexacyanoferrate (III)
the pH was maintained at 11.529
. The reaction can be monitored with high precision by
UV-vis spectroscopy, following the decrease of the characteristic absorption peak of
hexacyanoferrate (III) at 420 nm with time (see Figure 4.1 (A)). The kinetic measurements
were performed under pseudo-nth-order conditions, where [BH4−] was always maintained in
large excess over [Fe(CN)63−]. Under these conditions, the reaction of the ferrocyanide ions
obeys:
− d[Fe(CN)6
3−]
dt= kobs[Fe(CN)6
3−]n (4.2)
where kobs is the pseudo-nth-order rate constant for the reaction. It has been reported that this
reaction in the absence of a catalyst follows zero-order kinetics with respect to [Fe(CN)63−]
lasting hours27
. In our case, we observed that the presence of the TiO2@Au in small amounts
catalyzed the process as well as change the reaction order to first order, as occurred with Au
colloids25
.
Values of pseudo-first-order rate constant, kobs, were obtained by fitting the exponential decay
of the absorbance at 420 nm using the following equation:
At = (A0 − A∞) exp(−kobst) + A∞ (4.3)
where At represents the absorbance at 420 nm. In all cases, we found that experimental results
showed an excellent agreement with first order kinetics.

4.3. RESULTS AND DISCUSSION
69
Figure 4.1: (A) UV-vis absorption spectral evolution of a mixture of hexacyanoferrate (III) and
2TiO2@Au2 catalyst upon the addition of sodium borohydride. (B) Kinetic trace of the absorbance at
420 nm during the Fe(CN)63− reduction and corresponding fitting for first order analysis according to
equation (4.3). Conditions: [Fe(CN)63−] = 8.33 × 10
-4 M, [BH4
−] = 8.33 × 10⁻³
M, [2TiO2@Au2] = 10.0
× 10-6
g mL-1
, T = 25 ºC, pH = 11.5. kobs= 9.7 × 10⁻²
s-1
.
Figure 4.1 (B) shows the kinetic trace of the absorbance at 420 nm during the Fe(CN)63−
reduction and corresponding fitting for first order kinetics according to equation 4.3 when
2TiO2@Au2 where used as catalyst (see Chapter 3 for details)8. A rate constant of 9.7 × 10
-2
s-1
was obtained for the catalyzed reaction ([Fe(CN)63−] = 8.33 × 10
-4 M, [BH4
−] = 8.33 × 10⁻³
M, [2TiO2@Au2] = 10.0 × 10⁻⁶
g mL-1
, T = 25 ºC, pH = 11.5).
4.3.1. Influence of borohydride concentration
The effect of the borohydride concentration on the reaction rate was studied keeping all
experimental conditions constant and by varying the initial concentration of BH4− from 4.16
mM to 50 mM (see Appendix II, Table II.1). It was found that the rate of reaction increases
with the concentration of BH4− (see Figure 4.2) observing a linear relationship. It suggested
that the reaction was first order with respect to the concentration of BH4− , which also
indicated that the reduction is a surface controlled process. Similar results were found for
1TiO2@Au1 catalyst (see Figure II.2 in Appendix II).
8 See Appendix II, Figure II.1 for 1TiO2@Au1 nanocomposite.

4.3. RESULTS AND DISCUSSION
70
Figure 4.2: Influence of NaBH4 concentration on the observed rate constant. Conditions: [Fe(CN)63−]
= 8.33 × 10⁻⁴
M, [2TiO2@Au2] = 1.33 × 10⁻⁵
g mL-1
, T = 25 ºC, pH = 11.5.
4.3.2. Influence of the amount of catalyst
The effect of the amount of catalyst on the electron transfer reaction rate was studied at six
different concentrations of 2TiO2@Au2, keeping other parameters constant. Table 4.1 shows
the kobs obtained from the fittings absorbance-time data for the different concentrations (see
Appendix II, Table II.2 for 1TiO2@Au1). The results are summarized in Figure 4.3 showing
that there is linear dependence of kobs on the catalyst concentration fixed reaction conditions,
which indicates that 2TiO2@Au2 acted as a catalysts involved in the rate-determining step of
this electron transfer reaction. Similar results were found for 1TiO2@Au1 catalyst (see
Appendix II, Figure II.3).
Table 4.1: Rate constant (kobs, s-1
) with their standard deviations () of catalysed reactions
between Fe(CN)63− and BH4
− ions at different concentrations of 2TiO2@Au2 catalyst.
10-6
[2TiO2@Au2] (g mL-1
) 10-2
kobs 10-3
(s-1
)
3.33 4.07 2.33
6.66 7.70 3.20
10.0 9.81 6.60
13.3 14.9 6.66
20.0 22.5 12.0
23.3 26.4 9.82

4.3. RESULTS AND DISCUSSION
71
Figure 4.3: Influence of the amount of 2TiO2@Au2 catalyst on the observed pseudo-first-order rate
constant. Conditions: [Fe(CN)63−] = 8.33 × 10
-4 M, [BH4
−] = 8.33 × 10⁻³
M, T = 25 ºC, pH = 11.5.
Besides, in order to analysis the surface effect we have plotted the observed rate constant
versus the total gold surface area (see Figure 4.4(A)). The total gold surface area was been
calculated taking into account the Au NP diameter and the amount of Au in the TiO2@Au
catalyst, which were determined by TEM and ICP, respectively (see Appendix II, Table II.3
and II.4). As shown in Figure 4.4 (A) there is a linear relationship between the observed rate
constant and the surface area of Au demonstrating that the Au particles participate in the
reduction of hexacyanoferrate (III) by borohydride ions. It is predicted by the following
equation:
− d[Fe(CN)6
3−]
dt= kobs [Fe(CN)6
3−] = kSA[Au][Fe(CN)63−] (4.4)
where kS is the rate constant normalized to the total surface area of gold per unit volume of
solution. As it can be observed, the 2TiO2@Au2 catalyst doped with smaller Au NPs (1.4 nm
in diameter) is more catalytic active than the 1TiO2@Au1 with bigger gold nanoparticles
(average size of 4.5 nm). Probably, the small size of gold nanoparticles facilitates the contact
with the titania support and the rapid electron transfer from gold nanoparticles, charged with
electrons by the borohydride, to the TiO2.

4.3. RESULTS AND DISCUSSION
72
Figure 4.4: (A) Influence of the amount of TiO2@Au catalysts in terms of gold surface area on the
observed pseudo-first-order rate constant. (B) Values of kobs normalized to the total surface area of
gold, averaged for different TiO2@Au concentrations. The dashed lines represent the mean value in
each case. Conditions: [Fe(CN)63−] = 8.33 × 10
-4 M, [BH4
−] = 8.33 × 10⁻³
M, T = 25 ºC, pH = 11.5.
Also, the observed rate constant normalized to the unit gold surface area is constant (see
Figure 4.4 (B)) indicating that the catalytic activity of these compounds depends on the total
surface area of gold. The 2TiO2@Au2 catalyst revealed better catalytic efficiency for exhibit
small gold NPs (~ 1.4 nm) and low density of Au NPs in the titania support and a higher
available specific surface area of titania (see Chapter 3, Figure 3.10 (E-F)). Probably, the
greater number of Au NPs at the surface and inside of 1TiO2 in 1TiO2@Au1 catalyst (see
Appendix I, Figure I. 7) decreases the catalytic efficiency by the screening effect of surface
area of 1TiO2, making less accessible the Fe(CN)63−, which results in less reaction rate of
reduction. This can be clearly seen from the high ratio of Au/Ti (15.6 at.%) in the 1TiO2@Au1
as reported in Table I.1 (see Appendix I).
4.3.3. Influence of temperature
In order to analyse the temperature effect the catalysed reaction was studied between 283 and
303 K. The values of kobs obtained for 2TiO2@Au2 at different temperatures are given in
Table 4.3 (see Appendix II, Table II.5 for 1TiO2@Au1). As expected the catalyzed reaction
rate increased as temperature increases for both catalysts. Besides, Figure 4.5 (A) displays
that ln kobs presented a linearly dependence with 1/T which indicates that the reduction of
ferrycianate (III) by borohydride ions obeys the Arrhenius temperature dependence. The
activation energy was calculated following the Arrhenius equation:
lnkobs = lnA −E𝐴
RT (4.5)

4.3. RESULTS AND DISCUSSION
73
where A is a constant, Ea is the activation energy and R is the gas constant. An Ea of 98.64 ±
0.96 kJ mol-1
was obtained for the catalyzed model. Additionally, the activation parameters
ΔH≠ and ΔS
≠ were obtained from the slope and intercept of the Eyring’s plot
9 of ln kobs/T
versus 1/T (see Figure 4.5 (B)). The thermodynamic activation parameters are given in Table
4.4. The positive sign of the ΔH≠ reflects the endothermic nature of the process of reduction
of Fe (III) in the presence of TiO2@Au catalysts. Similar observations were found for
1TiO2@Au1 (see Appendix II, Figure II.4).
Table 4.3: Rate constants (kobs, s-1
) with their standard deviations () of catalysed reactions
between Fe(CN)63−and BH4
− ions at different temperatures (283 - 303 K).
2TiO2@Au2
10-2
kobs 10-3
(s-1
)
283 1.09 1.55
286 1.64 0.51
288 1.87 0.90
290 2.90 1.83
293 4.80 1.45
298 8.07 5.18
303 19.4 15.19
Ea (kJ/mol)
98.64 ± 0.96
Table 4.4: The values of activation parameters for reduction of Fe(CN)63− by BH4
− ions in the
presence of 2TiO2@Au2 catalyst.
Catalyst Ea
kJ mol-1
ΔH≠
kJ mol-1
ΔS≠
J K-1
mol-1
2TiO2@Au2 98.64 99.93 70.45
9 The enthalpy and entropy of activation were obtained by Eyring equation. The linear form of the
Eyring equation is:
lnk
T=
−∆H≠
R ×
1
T+ ln
kB
h+
∆S≠
R (4.6)
where k = reaction rate constant; T = absolute temperature; −∆H≠= enthalpy of activation; R = gas
constant; kB= Boltzmann constant; h = Planck’s constant and ∆S≠= entropy of activation. The plot of
lnk
T vs
1
T gives a straight line with slope (
−∆H≠
R) from which the enthalpy of activation can be derived
and with intercept (lnkB
h+
∆S≠
R) from which the entropy of activation is derived.

4.3. RESULTS AND DISCUSSION
74
Figure 4.5: (A) Arrhenius plot of the temperature dependence of the electron transfer reaction in the
presence of 2TiO2@Au2. (B) Plot of ln (kobs/T) vs. 1/T for the electron transfer reaction in the presence
of 2TiO2@Au2 .Conditions: [Fe(CN)63−] = 8.33×10
-4 M, [BH4
−] = 8.33×10⁻³
M, [2TiO2@Au2] = 1.34 ×
10-5
g mL-1
, pH=11.5.
4.3.4. Recyclability of TiO2@Au catalyst
The recyclability of our catalysts was checked by the sequential reduction of hexacyanoferrate
(III) ions by borohydride ions in aqueous alkaline solution using the same catalyst and fresh
hexacyanoferrate (III) ions in each cycle. As shown in Figure 4.6, no reduction in the catalytic
efficiency of the 2TiO2@Au2 (data for 1TiO2@Au1 in Appendix II, Figure II.5) catalyst was
observed even after six cycles.
Figure 4.6: Absorbance kinetic traces at 420 nm, registered during the sequential reduction of
Fe(CN)63− in the presence of 2TiO2@Au2. Initial concentrations [Fe(CN)6
3−] = 8.33 × 10⁻⁴
M, [BH4−] =
8.33 × 10⁻³
M, [2TiO2@Au2] = 3.33 × 10⁻⁶
g mL-1
, T = 25 ºC, pH = 11.5.

4.3. RESULTS AND DISCUSSION
75
4.3.5. Effect of titania on the reaction rate
Finally we need to take into account the Au nanoparticles were supported on anatase titania
mesocrystals and the anatase titania is among the most widely investigated material for
photocatalysis and sensing. Therefore the catalytic activity of TiO2@Au catalyst was
compared with the activity of anatase titania mesocrystals and citrate-stabilized Au
nanoparticles of around 4 nm.
As shown in Figure 4.7, in the absence of Au nanoparticles the reduction of Fe(CN)63− does
not takes place since no change in the absorbance at 420 nm was observed with time.
Therefore, the Au nanoparticles as expected played the main role in the Au doped titania
catalyst.
But in order to check if the TiO2 mesocrystals could have any influence in the catalytic
performance of Au nanoparticles, the catalytic performance of citrate stabilized Au
nanoparticles, Au@cit, was studied for reduction of ferrocyanate (III) by borohydride ions.
Since the citrate-stabilized Au nanoparticles were around 4 nm in diameter (see Appendix II,
Figure II.6), 1TiO2@Au1 was chosen to carried out the comparison since Au particles
presented similar dimensions.
Figure 4.7: Kinetic trace of the absorbance at 420 nm during the reduction of Fe(CN)63−in the
presence of TiO2 (solid line) and Au-doped TiO2 (1TiO2@Au1, dashed line)
As previously reported, citrate stabilized gold nanoparticles are very efficiency catalyst for the
reduction of ferricyanide ion to ferrocyanide by sodium borohydride25
. As observed for Au

4.3. RESULTS AND DISCUSSION
76
doped TiO2 mesocrystals, Au nanoparticles alone change the order of the reaction from
zero-order kinetics to first order with respect to the amount of Fe(CN)63−
(Figure 4.8 (A)).
Besides, there is a linear relationship between the observed rate constant and the
concentration of gold, which demonstrated that reaction took place on the gold surface and the
catalytic activity depending on the total surface area.
Figure 4.8: Kinetic trace of the absorbance at 420 nm during the reduction of Fe(CN)63− in the
presence of Au@cit and corresponding fitting for first order analysis according to eq. 4.3. Conditions:
[Au@cit] = 4.6 10-6
mol L-1
, [BH4−] = 8.33×10
-3 M, pH = 11.5 e T = 25 ºC.
The effect of the titania support on the observed pseudo-first order rate constant was analyzed
comparing the kobs obtained for 1TiO2@Au1 and the Au NPs (both catalyst presenting the
same Au nanoparticle size). Figure 4.9 shows kobs plotted as a function of the gold
concentration for 1TiO2@Au1 and the Au NPs. The slope for 1TiO2@Au1 is much larger than
for the Au NPs under similar experimental conditions. Therefore Au nanoparticles supported
on titania mesocrystals exhibited higher catalytic performance than citrate-stabilized Au
colloids which indicated that titania played a role in the reaction mechanism. The catalytic
cooperation of the titania support and gold in TiO2@Au arise probably by a higher catalytic
surface due to the semiconductor nature of titania and, so that after charging the gold NPs by
borohydride, part of electrons can be transferred to the titania support, which can also act as a
catalyst for the model reaction.

4.3. RESULTS AND DISCUSSION
77
Figure 4.9: Comparative study of the influence of the amount of Au on the observed rate constant for
the reduction of Fe (III) in the presence of two different catalysts (1TiO2@Au1 and citrate-stabilized
Au nanoparticles). Conditions: [Fe(CN)63−] = 8.33×10
-4 M, [BH4
−] = 8.33×10⁻³
M, pH=11.5.
4.3.6. Model proposed for the catalytic process
Based on the experimental results, the possible mechanism for the TiO2@Au catalyzed
reduction of hexacyanoferrate (III) ions by BH4− ions was proposed (see Figure 4.10). In a first
step the oxidation of BH4− ions generated electrons that were injected onto the Au
nanoparticles:
BH4− + 8OH− + Aun → H2BO3
− + 5H2O + 8e−(Aun) (4.7)
As the electrons accumulate within the Au core, the Fermi level shifts to more negative
potential (close to the value of bulk Au, EF = +0.45 V vs NHE) closer to the conduction band
edge of titania180
. It should be noted the fact that the energy levels in the gold are discrete
expecting a greater shift in the energy level for each accumulated electron in smaller size Au
NPs than the larger ones21
. Then, the electrons migration from the Au NPs to the conduction
band of TiO2 occurs until the two systems attain equilibrium resulting in a more potential of
the Fermi level of TiO2@Au composites (see Figure 4.11), and hence greater reductive
power181
. The electrons in TiO2 were captured by Ti4+
reducing it to Ti3+
:
eCB− + > TiIVOH → {> TiIIIOH} (4.8)
Finally, the Fe(CN)63− ions diffuse to the Au and TiO2 surface and are reduced by excess
surface electrons in the Au NPs and by the electrons from the Ti3+
, which acts as an electron
donor:

4.4. CONCLUSIONS
78
8e−(Aun) + Fe(CN)63− → 8Aun + 8Fe(CN)6
4− (4.9)
{> TiIIIOH} + Fe(CN)63− → > TiIVOH + 8Fe(CN)6
4− (4.10)
According to Subramanian182
, the TiO2 can function as a reservoir of electrons and can be
used as a strong reductive source for any species.
Figure 4.10: Schematic diagram for the possible mechanism for the reduction of Fe(CN)63− ions by
BH4− ions catalyzed by TiO2@Au.
Figure 4.11: Equilibration of TiO2@Au (a) before and (b) after electrons injection. Ef – Apparent
Fermi Level before electrons injection and Ef∗ – Apparent Fermi Level after electrons injection.
4.4. Conclusions
In summary, we demonstrated that TiO2@Au act as a very efficient catalyst for the reduction
of ferricyanide to ferrocyanide ions by borohydride ions. Also, we observed that TiO2@Au
composites exhibited higher catalytic performance than Au@cit (with similar size to the Au
NPs on the surface of the TiO2@Au nanocomposite) or TiO2 colloids suggesting a synergistic
effect between TiO2 and Au NPs in the studied redox reaction, probably a higher catalytic
surface in the process of reduction.
Furthermore, the density of Au NPs is an important factor for the catalytic efficiency of
TiO2@Au composites. It has been found that the catalytic efficient for the reduction of
Fe(CN)63− by BH4
− ions decreases at higher loadings which proves that Au NPs take up much
surface area of titania. Additionally, TiO2@Au can be used as a reusable catalyst applicable to

4.4. CONCLUSIONS
79
chemical reactions. The catalytic properties of the catalysts TiO2@Au are not significantly
degraded after its repeated use.

4.4. CONCLUSIONS

81
CHAPTER 5
Photochemical activity of TiO2 / TiO2@Au nanostructures
ABSTRACT
The nanoporous anatase TiO2 nanoparticles showed obvious absorption in the 400-600 nm
range with a red shift in the band gap transition. This visible-light activity of TiO2 was
investigated in the photoreduction of cationic gold species of the TiO2@Au composites,
prepared by deposition precipitation method with urea and before NaBH4 reduction, and in
the photodegradation of rhodamine B dye in aqueous solution, utilizing sunlight as the
irradiation source. It was found that TiO2 is a visible–light active photocatalytic material, able
to reduce gold cations to gold metal nanoparticles and degrade the rhodamine B dye when
excited with solar light irradiation. The photocatalytic activity of TiO2@Au systems in the
degradation of rhodamine B under solar light irradiation was also evaluated concluding that
these composites are active photocatalytic species in this process.

5.1. INTRODUCTION
82
5.1. Introduction
Since the discovery of the photocatalytic water splitting on titania electrodes in 1972 by
Fujishima and Honda183
, a significant effort has been made to understand fundamental
processes involved in the photocatalytic efficiency of titania. TiO2 in any of its common
phases present wide band gaps (3.2 eV for anatase and 3.0 eV for rutile phase), which can
only be effectively activated under UV irradiation (about 2–3 % of the total solar energy), but
not by visible light. Several approaches have been reported to develop effective TiO2
photocatalysts under visible light, including TiO2 doping with noble metal NPs or other
elements such as sulfur, iodine, nitrogen or carbon which act as electron donor or acceptor in
the forbidden band of titania. For example, carbon doping anatase titania particles exhibited
an obvious red shift at the maximum absorption with an enhanced absorption in the whole
visible region184,185,186
. Besides, the change of lattice parameters, and the presence of trap
states within the conduction and valence bands from electronic perturbations, gives rise to
band gap narrowing187
(band gap of C-TiO2 < 3.2 eV). Furthermore, it was also reported that
carbon doping can enhance the conductivity of TiO2 nanostructures, i.e., facilitate the charge
transfer from bulk region to the surface region where the oxidation reactions take place.
Several studies confirm the capacity of C-TiO2 to degrade various organic and inorganic
compounds under visible light. For example, Huang et al.188
demonstrated that mesoporous
TiO2 doped with carbon were effective photocatalysts for visible-light degradation of nitric
oxide. Irie and co-workers189
reported that C-doped anatase TiO2 exhibited visible-light
photocatalytic activity for the decomposition of 2-propanol. Wu et al.190
synthesized C-doped
TiO2 nanotubes, nanowires and nanorods and reported their visible-light photocatalytic
activity for the degradation of toluene. Also, noble metal NPs exhibits considerable visible
light absorption due to their plasmon resonance (SPR) effect on the surface. In this context,
the doping of TiO2 with noble metals NPs such as gold or silver has demonstrated to be an
interesting approach to extend the optical response of titania. TiO2@Au composites exhibit
exceptionally high photocatalytic activity for different reactions under visible light. Silva et
al.191
reported that Au NP-doped TiO2 exhibit photocatalytic activity in water splitting when
excited under visible light. The excitation at wavelengths corresponding to the localized
surface plasmon resonance of gold produced the absorption of photons by Au NPs and the
electrons injection into the conduction band of TiO2. Finally, several authors studied the

5.2. EXPERIMENTAL METHODS
83
electron transfer from the Au NPs to the TiO2 in the TiO2@Au composites under visible-light
irradiation192,193
.
As mentioned in Chapter 3, the anatase titania particles synthesized in this work exhibit an
enhanced absorption in the whole visible-light region. Therefore in this chapter the
photocatalytic properties of titania and Au NP-doped titania mesocrystals are analyzed. Thus,
first the photoreduction of gold ions deposited on anatase TiO2 mesocrystals by precipitation
deposition by urea is studied. Besides, the photocatalytic activity of anatase TiO2 and Au
NPs-doped TiO2 mesocrystals is tested using as model reaction the degradation of a dye,
Rhodamine B, using sun light as irradiation source.
5.2. Experimental section
Chemicals
Rhodamine B dye were purchased from Sigma-Aldrich. All reactants were used without
further purification. Milli-Q grade water with a resistivity higher than 18.2 M cm-1
was used
in all the preparation. Anatase TiO2 mesocrystals and TiO2@Au composites were used as
photocatalysts (see Chapter 3 for the synthetic procedure).
Photoreduction of gold species in TiO2@Au composites
In a typical experiment, 500 µL of 1.2 mg mL-1
2TiO2@Au1 (see Chapter 3 for the synthetic
procedure) were dispersed in 15 mL of Milli-Q water in a conventional glass vial. Then, the
glass vial was closed and the suspension was exposed directly to natural sunshine during 3.5
hours under stirred. Time-sequenced aliquots were collected for UV-Visible analysis.
Photocatalytic degradation of rhodamine B with TiO2 and TiO2@Au over solar
irradiation
In a typical experiment, 15 mL of an aqueous 1.0 × 10⁻⁵
M RhB solution containing TiO2 or
TiO2@Au particles (5 × 10⁻⁵
g/mL) were stirred in a glass vial in the dark for 30 min to ensure
adsorption-desorption equilibrium between the TiO2 or TiO2@Au and the RhB dye. After
that, the reaction glass vial was exposed directly to natural sunshineduring 2 hours at room
temperature. Time-sequenced aliquots of 500 L were collected from the glass vial during the
time-course of illumination for UV-visible analysis. The TiO2/TiO2@Au particles were

5.3. RESULTS AND DISCUSSION
84
removed by centrifuging at 4000 rpm. After that, the degraded RhB solutions were analyzed
with the UV-Vis spectrophotometer. The kinetics of the photodegradation was achieved by
monitoring the main absorption peak at 554 nm.
Characterization and measurements
A JEOL JEM 1010 transmission electron microscope operating at an acceleration voltage of
100 kV was used to perform general examination of samples at low magnification.
Absorption spectra were recorded in a VARIAN CARY 50 UV-Vis-NIR spectrophotometer.
5.3. Results and discussion
5.3.1. Photoreduction of gold species on TiO2@Au composites
As mentioned in Chapter 3, the visible range absorption of TiO2 samples are probably due to a
combination of different effects, namely defects in the lattice, incorporation of carbon atoms
into the anatase lattice, and the presence of a small amount of Ti3+
species. In this context and
with the aim of investigating the electron transfer from TiO2 to gold species (Au3+
and Au+)
under visible light irradiation, anatase titania mesocrystals doped with Au species deposited
by deposition precipitation method with urea was subjected to sunlight irradiation for 210 min
(see Scheme 5.1). Thus 2TiO2@Au1 before the NaBH4 treatment was selected to perform the
experiments (see Chapter 3 for further details), as XPS analysis revealed that this sample
presented only Au3+
and Au+
ions doping the anatase TiO2 nanoparticles (see Figure 5.1(A)).
Scheme 5.1: Photoreduction of Au
3+ and Au
1+ on anatase TiO2 mesocrystals (e
–: photoexcited
electrons; h+: photoexcited holes).
The spectral evolution of the 2TiO2@Au1 suspension under sunlight irradiation was
monitored by UV-vis absorption spectroscopy. As shown in Figure 5.1 the irradiation with
sunlight gave rise to the appearance after 30 minutes of a broad band centered at 600 nm. This
band, which increased in intensity with the sun exposure, corresponded to the localized
surface plasmon resonance of the Au nanoparticles resulting of the reduction of gold ions to

5.3. RESULTS AND DISCUSSION
85
Au0. As a result the suspension turned from yellow to pink (see Scheme 5.1). The process
finished after 120 min since no further evolution were observed in the spectra. The
photoreduction of the Au ions was also analyzed by XPS (see Figure 5.2 (B)). The Au 4f XPS
spectrum obtained for the 2TiO2@Au1 after the sun exposure showed two peaks at binding
energies of 87.6 and 83.6 eV which were assigned to Au 4f5/2 (87.7 eV) and Au 4f7/2 (84.0
eV) from Au0. The absence of any peak assigned to Au
3+ and Au
1+, indicated the complete
photoreduction of the Au ions.
Figure 5.1: Time evolution of the UV-visible absorption spectra of 2TiO2@Au1 colloids upon sunlight
irradiation.
Figure 5.2: Au 4f X-ray photoelectron spectrum of the 2TiO2@Au1 nanocomposite (A) before and (B)
after solar irradiation for 210 minutes.

5.3. RESULTS AND DISCUSSION
86
Finally, TEM analysis of the 2TiO2@Au1 composites showed the presence of nanoparticles
before and after the photoreduction of 4.44 ± 1.62 and 8.92 ± 3.08 nm, respectively (see
Figure 5.3 and Appendix III, Figure III.1). The absence of Au0 (see Figure 5.2 (A)) before the
irradiation indicated that the nanoparticles should be constituted by Au(CO(NH2)2).
Nevertheless the NPs after the irradiation were Au0. All the results indicated that the sun
exposure of 2TiO2@Au1 composites produced the absorption of photons with energy equal to
or greater than the TiO2 band gap. It created electron-hole pairs which moved to the surface.
The photogenerated electrons reduced the gold ions (Au3+
and Au1+
) to Au0, while the holes
were scavenged by adsorbed water or hydroxyl molecules194,195,196
.
Figure 5.3: TEM images of 2TiO2@Au1 composites before (A-B) and after (C-D) sun irradiation.
In conclusion, the anatase TiO2 nanoparticles synthesized in the present work have
visible-light absorption, which was proved by the electrons transfer from TiO2 to gold ions,
that are in the titania support, reducing them to metallic gold, when the 2TiO2@Au sample
was sunlight irradiated.
5.3.2. Photocatalytic degradation of rhodamine B
The photocatalytic performance of anatase TiO2 and TiO2@Au nanostructures were also
evaluated by analyzing the photodegradation of rhodamine B, RhB, in water with sun.
Although several studies have showed that rhodamine B is stable in water under UV and
visible light irradiation, the photodegradation of RhB might occur in the presence of

5.3. RESULTS AND DISCUSSION
87
nanoparticles, such as, TiO2, TiO2@Au, TiO2@Ag. The RhB is a xanthene dye whose
degradation could be monitored by UV-vis spectroscopy since it presents a characteristic
absorption band centered at 554 nm. First, a control experiment was performed in absence of
TiO2 or TiO2@Au particles showing that the sun light irradiation just produced a slightly
decreased of the absorbance intensity of the 554 nm band (6.3% in 120 min of irradiation, see
Appendix III, Figure III.2). It indicated almost no degradation of RhB in the absence of
particles. Nevertheless, photodegradation of the dye was observed in the presence of TiO2 or
TiO2@Au particles. Figure 5.4 shows the time evolution of the absorption band from RhB in
water during irradiation with solar light presence of the TiO2 (Figure 5.4 (A) and (B)) or
TiO2@AuX particles (5.4 (C) and (D)). Thus, the main absorption band from RhB centered at
554 nm gradually decreased indicated the degradation of this aromatic chromophore, but after
certain irradiation time a blue-shift of the band was observed. The hypsochromic shifts might
attribute to the formation of a series of stepwise N-de-ethylated intermediates of RhB197
such
as N,N-diethyl-N′-ethylrhodamine, N-ethyl-N′-ethylrhodamine, N,N-diethylrhodamine,
N-ethylrhodamine, and rhodamine. Nevertheless, the degradation seemed to be the main
process. It should be pointed out that after mixing the RhB with the nanoparticles and under
dark conditions, a decrease in the absorption band was observed. It was explained in terms of
RhB adsorption on the TiO2 surface. Thus, from absorption spectra it was estimated that
~30.9% of the dye was adsorbed on 1TiO2 and ~26% for 2TiO2, and on TiO2@Au surface,
about 19.3% and 29.4% for the catalysts 1TiO2@Au1 and 2TiO2@Au2, respectively.
The degradation of RhB dye could be described by a pseudo-first order reaction with a
simplified Langmuir–Hinshelwood model:
lnA
A0= − kobst (5.1)
where A
A0 corresponds to the normalized RhB concentration (A0 is the initial absorbance at 554
nm after equilibrium adsorption, and A is the absorbance at 554 nm at time t, during the
reaction under solar irradiation) and kobs is the pseudo-first-order rate constant. The rate
constants were obtained by the linear fittings of lnA
A0 versus time t, and is equal to the
corresponding slope (see Figure 5.5 (F)). Table 5.2 presents the detailed information of rate
constants.
X To evaluate the photocatalytic performance, we selected the 1TiO2@Au1 and 2TiO2@Au2 samples,
synthesized with different sizes of anatase titania particles and doped with Au NPs of 4.5 ± 1.5 and 1.4
± 0.5 nm in diameter (see Chapter 3 for further details).

5.3. RESULTS AND DISCUSSION
88
Figure 5.4: Spectral evolution of a mixture of RhB and (A) 1TiO2, (B) 2TiO2, (C) 1TiO2@Au1 and
(D) 2TiO2@Au2 upon different visible light irradiation times. Comparison of photodegradation of RhB
aqueous solution with 1TiO2, 2TiO2, 1TiO2@Au1 and 2TiO2@Au2 under sunlight as the irradiation
source (E), and first-order kinetics in RhB photodegradation under solar irradiation in the presence of
1TiO2, 2TiO2, 1TiO2@Au1 and 2TiO2@Au2 (F). Negative time (-30 min) indicates the period of RhB
adsorption on the TiO2 or TiO2@Au surface without solar irradiation. Conditions: [RhB] = 1.0 ×
10−5 mol dm−3, [1TiO2] = [2TiO2] = [1TiO2@Au1] = [2TiO2@Au2] = 5.0 × 10⁻⁵ g mL−1,
sunlight.

5.3. RESULTS AND DISCUSSION
89
Table 5.2: Rate constants of the pseudo first-order fit of RhB photodegradation under solar
irradiation.
Photocatalyst *kobs (10
–2 min
-1)
•R
1TiO2 2.2 ± 0.28 0.924
2TiO2 3.1 ± 0.25 0.968
1TiO2@Au1 1.4 ± 0.16 0.939
2TiO2@Au2 2.3 ± 0.37 0.886 *Pseudo-first-order rate constant,
• Adj. R-Square.
The high photocatalytic activity of TiO2 particles could be attributed to synergic effects like
of its large surface area, visible-light absorption induced from C-doping of titania (see
Appendix III, Table III.1), and existence of porous structure that allows multiple reflections of
visible light within the interior of titania particles, allowing more efficient use of the visible
light. Deposition of Au NPs on anatase titania mesocrystals caused a decrease in the
photoactivity with respect to anatase TiO2 nanoparticles and the photocatalytic performance
of TiO2@Au decreases with increasing Au content. Concretely, the catalyst 2TiO2@Au2 that
exhibits a ratio of Au/Ti of 0.2 presents better photocatalytic efficiency, compared to the
catalyst 1TiO2@Au1 that present a ratio of Au/Ti of 15.6. This can be explained from that
excess Au NPs may: act as a (i) charge recombination center, or (ii) cover the active sites of
TiO2198
, or (iii) reduce of light penetration depth. In this regard, more studies are necessary to
confirm/exclude the influence of individual parameters.
Based on the experimental results, a mechanism for the degradation of RhB photocatalyzed
by TiO2, was proposed. The process started with dye adsorption on TiO2 surface, followed by
photochemical steps of the dye and TiO2, and finally a series of redox process involving the
active species produced in the photochemical steps, concretely, superoxide radical anions,
O2∙−, and/or hydroxyl radical, OH∙. Briefly, RhB was adsorbed at the TiO2 surface,
TiO2{RhB}ads (Reaction 5.2). Under solar irradiation the adsorbed RhB dye was excited to
produce singlet and triplet states, TiO2{RhB}ads∗ (Reaction 5.3). Subsequently, the
{RhB}ads∗ injected an electron into the conduction band of TiO2 with TiO2{RhB}ads
∗ being
converted to cationic dye radicals, TiO2{RhB}ads∙+ (Reaction 5.4). The TiO2 provided sufficient
unoccupied electron-acceptor states with a wide and continuous energy distribution, which
ensured rapid and efficient electron injection, and avoided useless loss of the dye excited
states. During this process, no hole on the valence band of TiO2 was involved and
consequently no formation of OH∙ by H2O oxidation or by photogenerated holes. The
electrons from the TiO2 conduction band were transferred to oxygen molecules

5.3. RESULTS AND DISCUSSION
90
surface-adsorbed (in aerated systems) to form the superoxide radical anions, O2∙− (Reaction
5.5). Once the dispersion discolored completely, the O2∙− formation terminated automatically.
In this context, the oxygen played an important role in the RhB photodegradation, in the
formation of reactive oxygen species for the mineralization of RhB, and in the scavenging the
electron, and consequently suppressed recombination between RhB∙+ and e-. The superoxide
radical anion can transform to H2O2 (Reaction 5.6 and 5.7). H2O2 was transformed by reacting
with the electron in the conduction band of TiO2199
or by the visible induced decomposition,
via formation of a TiO2-H2O2 surface complex200
(Reaction 5.8). Once RhB was discolored
completely, no visible light could be absorbed and consequently the photoreaction via dye
excitation ceased. However, despite the important role in the electron-transfer mediation by
anatase TiO2 nanoparticles they also are excited by solar light irradiation, with generation of
electrons and holes on TiO2 (Reaction 5.9) followed by the reactions 5.5 to 5.7 to yield the
same active oxygen species which lead to RhB mineralization (Reaction 5.13). The
photoinduced holes, generated in this process are apt to react with surface-bound OH- or H2O
to produce the hydroxyl radical species, OH∙, (Reaction 5.10 and Reaction 5.11) which is an
extremely strong oxidant for the mineralization of organic chemicals. OH∙ formation was
crucial for the N-de-ethylation of RhB and therefore required for the complete degradation of
RhB dye. The direct excitation of TiO2 by solar light also led to the cationic dye
radical RhB∙+ (Reaction 5.12). The radical cation TiO2{RhB}ads∙+ reacted with the reactive
oxygen radicals and/or hydroxyl radical until mineralization (Reaction 5.13).
RhB + TiO2 → TiO2{RhB}ads (5.2)
TiO2{RhB}ads →ℎ TiO2{RhB}ads∗ (5.3)
TiO2{RhB}ads∗ + TiO2 → TiO2{RhB}ads
∙+ + TiO2(eCB− ) (5.4)
TiO2(e𝐶𝐵− ) + O2 → TiO2 + O2
∙− (5.5)
O2∙− + 2H+ + TiO2(e𝐶𝐵
− ) → H2O2 + TiO2 (5.6)
O2∙− + 2H+ → O2 + H2O2 (5.7)
H2O2 + Ti(IV)complex →ℎ decomposition (5.8)
TiO2 →ℎ 𝑒𝐶𝐵− + ℎ𝑉𝐵
+ (5.9)
TiO2(hVB+ ) + OH− → OH∙ + TiO2 (5.10)
TiO2(hVB+ ) + H2O → OH∙ + H+ + TiO2 (5.11)
TiO2{RhB}ads + TiO2(hVB+ ) → TiO2{RhB}ads
∙+ + TiO2 (5.12)
TiO2{RhB}ads∙+ + (OH∙, O2
∙− ) → Degradated produts + TiO2 (5.13)

5.3. RESULTS AND DISCUSSION
91
In conclusion, the proposed mechanism for the photodegradation of RhB consists in a
synergetic pathway to produce reactive O2∙− and OH∙ species through the two pathways,
namely, dye sensitization pathway and TiO2-photocatalyzed pathway.
To confirm the possibility of recycling of the TiO2 NPs, the 2TiO2 photocatalyst was
repeatedly used for the RhB photodegradation reaction 2 times (see Figure 5.5) under visible
light as the irradiation source. For this purpose, 22.2 L of RhB ([RhB] = 1.173 mM) was
again added to the 10 mL of RhB and 2TiO2 suspension ([2TiO2] = 1.5 10-4
g mL-1
, [RhB] =
1.0 10-5
mol dm-3
), after complete degradation of the dye was attained. Two successive
catalytic cycles were performed and the photocatalytic performance of the second cycle of
RhB degradation was similar to the first run (see Figure 5.5 (C)). No filtration or centrifuging
was effectuated between each cycle of use of the TiO2 photocatalyst, or for the TiO2
suspension after the photocatalysis procedure and before UV-VIS spectrophotometric
analysis.
Figure 5.5: Spectral evolution of a mixture of RhB and (A) 2TiO2 – first reuse (B) 2TiO2 – second
reuse, upon different irradiation times. (C) Photodegradation of RhB aqueous solution with 2TiO2
under sunlight, as the irradiation source, in the first and second reuse. Condition: [RhB] = 1.0 ×
10−5 mol dm−3, [2TiO2] = 1.5 × 10⁻⁴ g mL−1, sunlight.

5.4. CONCLUSIONS
92
The results indicated that TiO2 photocatalyst are reusable, however more studies are needed to
evaluate the number of possible reuses without loss of catalytic performance, and the stability
of the mesoporous structure of titania nanoparticles during the RhB photodegradation process.
5.4. Conclusions
In conclusion, anatase TiO2 mesocrystals, with absorption extended to visible light region,
presented ability to reduce gold ions adsorbed on their surface under solar light irradiation.
Besides, anatase TiO2 and gold-doped TiO2 nanoparticles, TiO2@Au, showed high
photocatalytic activity for the degradation of RhB in aqueous solution under solar light
irradiation. The results further concluded that the synthesized TiO2 possess superior
photocatalytic activity than TiO2@Au composites in the degradation of RhB dye, using
present conditions, under direct sunlight irradiation. The RhB degradation rate decrease with
the increasing of Au nanoparticles on the titania support, probably due to the fact that more
Au nanoparticles may act as the centers of electron-hole recombination, or cover the active
sites of TiO2, or reduce the light penetration depth. The photodegradation of RhB by TiO2
nanoparticles consists in a cooperative effect to produce reactive radical species such as
superoxide radical anion, O2∙−, and hydroxyl radical, OH∙, from the sunlight absorption by the
RhB dye and TiO2 nanoparticles. Subsequently, the RhB dye reacts with highly potential
radicals, OH∙ and O2∙−, which results in generation of range of intermediates followed by
complete mineralization of dye. The narrow band gap of TiO2 favors the transfer of
photogenerated electrons and results in more electrons, thereby allowing holes to participate
in the photocatalytic redox reaction. A possible mechanism for this synergetic degradation
was proposed.
The recycling test revealed that the TiO2 photocatalyst are stable and possess recyclability,
which may have excellent application potentials in water treatment.
In conclusion, the nanoporous anatase TiO2 nanoparticles could be useful for environmental
applications such as water purification and hazardous waste remediation due to their high
visible-light photocatalytic activity, large specific surface area, and easy and cheap
preparation process on large scale.
The degradation of RhB dye can be driven by sunlight during daylight hours which represents
an economic and environmentally friendly perspective.

93
Conclusions
Even though specific conclusions have been address at the end of each chapter, the most
relevant, global, conclusions of the research described in this thesis are presented herein.
1. Gold nanoparticles, 66 nm in diameter, were coated with a homogeneous layer of TiO2
through an approach based on the combination of the the layer-by-layer self-assembly
technique and the hydrolysis and condensation of titanium precursor in alcoholic
medium. Besides, the sequential addition of the titania precursor allows grow the
semiconductor layer in a controlled manner.
2. Spindle-shaped mesoporous anatase titania nanoparticles were obtained by a
solvothermal method using acetic acid and titanium (IV) butoxide. The TiO2
nanoparticles exhibits strong absorption in the visible light region probably, as has been
shown, due to the combination of different effects, such as defects in the lattice,
incorporation of carbon atoms into the anatase lattice, and the presence of a small
amount of Ti3+
species. In addition, from the UV-vis absorption spectra of TiO2
nanoparticles, the band gap of the semiconductor nanoparticles was estimated using the
Kubelka-Munk equation, obtaining quite lower values (1.99 and 1.92 eV for 1TiO2 and
2TiO2, respectively).
Different strategies were explored to Au-doped TiO2 nanoparticles. Only the deposition-
precipitation method with urea followed by reduction with NaBH4 allowed control the
size and density of gold nanoparticles on the titania surface by varying the amount of
titania used in the preparation of TiO2@Au nanocomposites. In addition, we found by
XPS studies that the gold species in TiO2@Au after the step of deposition-precipitation
with urea are cationic and metallic. This fact, justifies the further treatment with
borohydride. Also the amount of cationic gold species respect to metallic gold in the
TiO2@Au nanocomposites decreases with the increase of the amount of titania in the
process of deposition-precipitation with urea. Probably, as confirmed by XPS analysis,
the presence of Ti3+
surface defect on TiO2 nanocrystals reduced the cationic gold
species, Au3+
and Au1+
, to metallic gold, Au0.

CONCLUSIONS
94
The TiO2@Au nanocomposites were used as catalyst for the reduction of ferricyanide to
ferrocyanide ions by sodium borohydride ions. It was found that:
(a) All TiO2@Au nanocomposites (synthesized by deposition-precipitation with urea,
using different amounts of TiO2 nanoparticles for the same amount of gold salt and
followed by reduction with NaBH4), in small amounts, act as a very efficient
catalyst for the reduction of ferricyanide to ferrocyanide by borohydride ions
increasing the reaction rate compared with the non-catalyzed reaction, under our
experimental conditions. Furthermore, the presence of TiO2@Au nanocomposite
changes de order of the reaction of reduction of hexacyanoferrate (III) to
hexacyanoferrate (II) with borohydride ions from zero-order kinetics to first-order
with respect to the amount of Fe(CN)63−, indicating a change in the reaction
mechanism regarding to the non-catalyzed reaction.
(b) Under pseudo-nth-order conditions, such that the concentration of NaBH4
exceeded the concentration of hexacyanoferrate (III), and maintained de pH of at
NaBH4 solution at 11.5, to avoid competitive reactions, the reaction is first order
with respect to the concentration of borohydride ions, as confirmed by the typical
kinetic trace of the absorbance at 420 nm during the reduction of Fe(CN)63−
highlighting the high-quality, first-order nature of the reaction, for the 2TiO2@Au2
and 1TiO2@Au1 catalysts.
(c) There is a linear relationship between the observed rate constant and the
concentration of TiO2@Au, which indicates that the TiO2@Au nanocomposite acts
as a catalyst involved in the rate–determining step of the model reaction in study.
(d) The dependence of observed rate constant of the reaction, kobs on temperature, for
the TiO2@Au nanocomposites in study, increases linearly with a typical Arrhenius
behavior.
(e) Au nanoparticles supported on titania mesocrystals, TiO2@Au, exhibit higher
catalytic performance than citrate-stabilized gold nanoparticles, Au@Cit, of
similar size, as evidenced by the greater slope in the representation of the observed
rate constant, kobs, as a function of the gold concentration for TiO2@Au and
Au@Cit, under similar experimental conditions, which indicated that titania
played a role in the reaction mechanism. Probably, the catalytic cooperation of the
titania support and gold in TiO2@Au nanocomposites arise by a higher catalytic
surface due to the semiconductor nature of titania and, so that after charging the
gold NPs by borohydride, part of electrons can be transferred to the titania support,

CONCLUSIONS
95
which can also act as a catalyst for the model reaction. Furthermore, in the absence
of gold nanoparticles on titania support the reduction of ferrocyanate (III) by
borohydride ions does not take place.
(f) The nanocomposite of TiO2@Au with small gold nanoparticles (1.4 0.5 nm in
diameter) show larger catalytic activity than the nanocomposite with larger gold
nanoparticles (4.5 1.5 nm) in the reduction of hexacyanoferrate (III) by
borohydride ions, as confirmed by its higher value of the observed pseudo first
order rate normalized per square nanometer of gold surface area. Probably, the
small size of gold nanoparticles facilitates the contact with the titania support and
the rapid electron transfer from gold nanoparticles, charged with electrons by the
borohydride, to the TiO2.
(g) The high density of Au NPs in the titania surface can making this surface less
active for catalysis, such as verified for the 1TiO2@Au1 catalyst, with a high
density of gold nanoparticles (4.5 1.5 nm) over and inside of titania
nanopartículas, as evidenced by TEM, HRTEM images and XPS depth profiles
analysis up to 30 nm, that shows the slowest kinetic in the model redox reaction,
under the same experimental conditions of other TiO2@Au catalysts in study.
(h) The heterostructured TiO2@Au catalysts show reusability, which can be
repeatedly applied for complete reduction of ferrocyanate (III) by borohydride ions
for at least 6 successive cycles (with identical values obtained for constant reaction
observed, kobs, in all cycles of catalysis, under the same reaction conditions). This
demonstrates the stability of the TiO2@Au nanocomposites in the reaction media
as well the reproducibility of its catalytic activity.
(a) From the kinetic results obtained with TiO2@Au nanocomposite and Au@Cit
nanoparticles (greater slope of kobs as a function of gold concentration for the
TiO2@Au than Au@Cit, indicating that titania play a role in the reaction
mechanism), and TiO2 nanoparticles (the characteristic absorption peak of
hexacyanoferrate (III) at 420 nm is constant with time in the presence of TiO2
nanoparticles upon borohydride addition, indicating an inefficient electron transfer
from borohydride ions to the titania nanoparticles) in the redox model reaction in
study, a reaction mechanism was proposed involving:
(a) the cathodic polarization of the metallic gold nanoparticles by sodium
borohydride;

CONCLUSIONS
96
(b) the electrons transfer from gold nanoparticles to the titania semiconductor until
the two system attain equilibrium;
(c) the reduction of ferricyanide ions when reaching the gold nanoparticles surface
or/and the titania surface.
(3) The TiO2 nanoparticles present visible light activity, as proven by the photoreduction
of cationic gold species, Au3+
and Au1+
, on titania support of the TiO2@Au
nanocomposites, obtained after deposition-precipitation with urea and gold salt, under
solar irradiation. The appearance of a plasmon band at 594 nm, in the absorption spectra
of UV-vis-NIR of the TiO2@Au suspension during irradiation with sunlight and the
XPS analysis before and after the photoreduction (a single peak of Au 4f 7/2, centered
at 83.6 eV, corresponding to metallic gold), confirms that electrons photoexcited in the
conduction band of TiO2 by sunlight, reduce the cationic species to metallic species on
the surface of titania.
(4) The TiO2 nanoparticles and the TiO2@Au nanocomposites act as efficient
photocatalysts in degradation of rhodamine B dye in water under direct sunlight
irradiation, as it has been observed by gradual decrease of the characteristic absorption
band at 554 nm. It was found that deposition of gold nanoparticles on TiO2 support
caused a decrease in the photoactivity with respect to anatase titania nanoparticles, as
confirmed by the lower obtained rate constant values, kobs, for photodegradation of
Rhodamine B under solar irradiation in the TiO2@Au nanocomposites, compared with
those obtained for the nanoparticles of titanium (to the same amount of TiO2@Au/TiO2
and the same reaction conditions). In addition, the photocatalytic performance of
TiO2@Au decreases with increase Au content. Such occurs, probably, because the
excess of gold nanoparticles may act as a charge recombination center, or cover the
active sites of titania, or reduces the depth of penetration of sunlight. The high
photocatalytic performance of the anatase TiO2 nanoparticles in the degradation of
rhodamine B dye, under visible-light irradiation, is ascribed to the synergistic effects,
like: (i) larger surface area, providing more surface active sites for the adsorption of
rhodamine B; (ii) porous structure, favoring the harvesting of exciting light due to
enlarged surface area and multiple scattering within the porous framework; and (iii)
visible-light absorption.

97
APPENDIX I
Synthesis and characterization of Au-doped TiO2 nanoparticles
Figure I.1: Length and width of the titania particles: (A) and (B) 1TiO2, and (C) and (D) Experimental
conditions: 20 mL of CH3CO2H and 0.7 or 0.4 mL of Ti(OC4H9)4 for 1TiO2 or 2TiO2, respectively,
and T = 200 ºC for 24 h.

APPENDIX I
98
Figure I.2: XPS spectra of Ti 2p (A), O 1s (B) and C 1s (C) for 1TiO2 sample.
Figure I.3: (A) Nitrogen adsorption-desorption isotherms for 1TiO2 and (B) pore size distribution
obtained from the adsorption branch of the sample 1TiO2.

APPENDIX I
99
Figure I.4: Size histogram of gold NPs. (A) and (B) 1TiO2@Au composites synthesized by the
approach of electrostatic adsorption of AuCl4− on TiO2 surface. In (B) the amount of AuCl4
− ions on the
TiO2 surface was increased by successive additions of HAuCl4.
Figure I.5: Diameter of Au NPs in the TiO2@Au sample synthesized by the approach of adsorption of
(Au(Cl)4−n(OH)n−) ions / Au(OH)3 on TiO2 surface, before (A) and after the growth (B) of the Au
NPs deposited on the 2TiO2 surface.

APPENDIX I
100
Figure I.6: (A) and (B) TEM images of 2TiO2@Au4 composite obtained using 42 10
-2 M of urea.
(C) UV-Visible spectra of 2TiO2 and 2TiO2@Au4 obtained using 42 10-2
M of urea. Experimental
conditions: [HAuCl4. 3H2O] = 4.2 10-3
M, [CO(NH2)2] = 42 10-2
M, [TiO2] = 10.5 mg mL-1
and T
= 90 ºC.
Figure I.7: TEM images of 1TiO2@Au samples obtained using different amounts of 1TiO2
nanoparticles: (A and B) 0.7 mg/mL of 1TiO2 (1TiO2@Au1 sample with Au NPs of 4.5 1.5 nm in
diameter), (C and D) 7.0 mg/mL of 1TiO2 (1TiO2@Au2 sample with Au NPs of 2.0 0.8 nm in
diameter). Experimental conditions: [HAuCl4. 3H2O] = 4.2 10-3
M, [CO(NH2)2] = 42 10-3
M, and
T = 90 ºC.

APPENDIX I
101
Figure I.8: Size distribution of Au NPs in the TiO2@Au samples obtained by DPU method using
different amounts of TiO2 nanoparticles: (A) 1TiO2@Au1 (0.7 mg/mL of 1TiO2); (B) 2TiO2@Au1 (3.5
mg/mL of 2TiO2); (C) 1TiO2@Au2 (7.0 mg/mL of 1TiO2); and (D) 2TiO2@Au2 (10.5 mg/mL of
2TiO2). Experimental conditions: [HAuCl4. 3H2O] = 4.2 10-3
M, [CO(NH2)2] = 42 10-3
M, and T =
90 ºC.
Figure I.9: XPS spectra at the Au 4f energies for 1TiO2@Au1 and 1TiO2@Au2 composites obtained
by DPU method using different amounts of TiO2 nanoparticles: 0.7 mg/mL of 1TiO2 for 1TiO2@Au1,
and 7.0 mg/mL for 1TiO2@Au2. Experimental conditions: [HAuCl4. 3H2O] = 4.2 10-3
M,
[CO(NH2)2] = 42 10-3
M, and T = 90 ºC.

APPENDIX I
102
Figure I.10: XPS depth profile composition of the Au and Ti elements in the 1TiO2@Au1 and
2TiO2@Au2 samples, synthesized via DPU method using 0.7 mg/mL and 10.5 mg/mL of titania
respectively. Experimental conditions: [HAuCl4. 3H2O] = 4.2 10-3
M, [CO(NH2)2] = 42 10-3
M,
and T = 90 ºC.
Scheme I.1: Relation between TiO2 supporting, pH and isoelectronic point of the titania.

APPENDIX I
103
Table I.1: Experimental conditions for the preparations of TiO2@Au composites by DPU and their physicochemical properties.
Composite
[HAuCl4]
mM
[CO(NH2)2]
mM
[TiO2]
mg/mL nm
Au3+
Au1+
Au0
Au Ti O C O/Ti Au/Ti Amount Au
ICP Wt. % Morphology
Area % (in at.%)
1T
iO2
1TiO2@Au1 4.2
42 0.7 4.51.5 59 41 0 15.6 1.0 55.3 28.2 55.3 15.6 20.48
1TiO2@Au2 7.0 2.00.8 0 16 84 0.6 20.8 59.9 18.7 2.9 0.029 8.1
2TiO2@Au0 4.2 42 0.7 17.55.3
2T
iO2
2TiO2@Au1 3.5 4.01.4 54 46 0 12.7 6.2 54.4 26.8 8.8 2.05 15.3
2TiO2@Au2 10.5 1.40.5 0 31 69 0.4 2.0 72.3 25.3 36.1 0.2 4.7
2TiO2@Au3 8.5 12 34 54
2TiO2@Au4 420 10.5 core-shell

APPENDIX I
104

105
APPENDIX II
TiO2@Au catalyzed reduction of ferrycianate (III) by
borohydride ions
Figure II.1: (A) UV-vis absorption spectral evolution of a mixture of hexacyanoferrate (III) and
1Au@TiO1 catalyst upon the addition of sodium borohydride. (B) Kinetic trace of the absorbance at
420 nm during the Fe(CN)63−reduction and corresponding fitting for first order analysis according to
equation (3). Conditions: [Fe(CN)63−] = 8.33 × 10
-4 M, [BH4
− ] = 8.33 × 10⁻³
M, [1TiO2@Au1] = 2.27 ×
10-5
g mL-1
, T = 25 ºC, pH = 11.5. kobs= 6.9 × 10⁻²
s-1
.

APPENDIX II
106
Figure II.2: Influence of NaBH4 concentration on the observed rate constant. Conditions: [Fe(CN)63−]
= 8.33 × 10⁻⁴
M, [1TiO2@Au1] = 1.33 × 10⁻⁵
g mL-1
, T = 25 ºC, pH = 11.5.
Figure II.3: (A) Influence of the amount of 2TiO2@Au2 catalyst (on the observed pseudo-first-order
rate constant. Conditions: [Fe(CN)63−] = 8.33 × 10
-4 M, [BH4
− ] = 8.33 × 10⁻³
M, T = 25 ºC, pH = 11.5.
Figure II.4: (A) Arrhenius plot of the temperature dependence of the electron transfer reaction in the
presence of 1TiO2@Au1. (B) Plot of ln (kobs/T) vs. 1/T for the electron transfer reaction in the presence
of 1TiO2@Au1 .Conditions: [Fe(CN)63−] = 8.33×10
-4 M, [BH4
− ] = 8.33×10⁻³
M, [1TiO2@Au1] = 1.34 ×
10-5
g mL-1
, pH = 11.5. From the intercept of Figure II.4 (B) we derived a value for activation entropy,
∆S≠, of 149.14 Jmol-1
K-1
.

APPENDIX II
107
Figure II.5: Absorbance kinetic traces at 420 nm, registered during the sequential reduction of
Fe(CN)63− in the presence of 1TiO2@Au1. Initial concentrations [Fe(CN)6
3−] = 8.33 × 10⁻⁴
M, [BH4− ] =
8.33 × 10⁻³
M, [1TiO2@Au1] = 6.66 × 10⁻⁶
g mL-1
, T = 25 ºC, pH = 11.5.

APPENDIX II
108
Figure II.6: (A) UV-visible spectra of citrate-stabilized Au colloids. (B) Representative TEM images
and (C) size distribution of gold nanoparticles.

APPENDIX II
109
Table II.1. Volume of NaBH4 (10 10-2
M), of K3Fe(CN)6 (2 10-3
M), of Milli-Q water and
of 1TiO2@Au1 (2 10-3
g mL-1
) used in the catalysed reactions between Fe(CN)63− and NaBH4
to different borohydride concentrations.
V (mL)
10-3
[NaBH4]f
(M) NaBH4
(10 10-2
M)
H2O
K3Fe(CN)6
(2.0 10-3
M)
1TiO2@Au1
(2.0 10-3
g mL-1
)
0.125 1.625 1.250 0.020 4.16
0.250 1.500 8.33
0.375 1.375 12.5
0.500 1.250 16.7
0.750 1.000 25.0
1.500 0.250 50.0
Table II.2: Rate constant (kobs, s-1
) with their standard deviations () of catalysed reactions
between Fe(CN)63− and BH4
− ions at different concentrations of 1TiO2@Au1 catalyst.
10-6
[1TiO2@Au1] (g mL-1
) 10-3
kobs 10-3
(s-1
)
3.33 8.79 1.82
6.66 17.48 0.596
10.0 29.70 0.848
13.3 34.54 2.90
20.0 55.33 3.11
23.3 69.93 1.84
Table II.3: Specific surface area of Au in the 2TiO2@Au2 catalyst.
[2TiO2@Au2]
g mL-1
aVTotal Au
cm3
DAu
nm
bVAu NPs
cm3
Amount of Au
NPs
cSAu NP
nm2
STotal
nm2
kobs
s-1
3.33 10-6 2.3810-8
1.4
1.44 10-21
1.661013
6.2
1.031014 4.0710-2
6.67 10-6 4.7710-8 3.321013 2.061014 8.0010-2
1.00 10-5 7.1610-8 4.971013 3.081014 9.8110-2
1.33 10-5 9.5210-8 6.611013 4.101014 1.4910-1
2.00 10-5 1.4310-7 9.941013 6.161014 2.2510-1
2.3310-5 1.6710-7 1.161014 7.181014 2.64 10-1
a The total volume of gold was calculated as: gold mass ([2TiO2@Au2] 3 mL amount of Au by
ICP) was divided by the gold density (19.7 g cm-3
). b
The Au nuclei were assumed as sphere and the
volume of a single Au nuclei is 4/3 R3 and the
c surface area is 4 R
2.

APPENDIX II
110
Table II.4: Specific surface area of Au in the 1TiO2@Au1 catalyst.
[1TiO2@Au1]
g mL-1
aVTotal Au
cm3
DAu
nm
bVAu NPs
cm3
Amount of Au
NPs
cSAu NP
nm2
STotal Au
nm2
kobs
s-1
3.33 10-6 1.0410-7
4.5
4.77 10-20
2.181012
63.6
1.381014 8.7910-3
6.67 10-6 2.0810-7 4.361012 2.771014 1.7510-2
1.00 10-5 3.1210-7 6.541012 4.161014 2.9710-2
1.33 10-5 4.1510-7 8.701012 5.531014 3.4510-2
2.00 10-5 6.2410-7 1.311013 8.321014 5.5310-2
2.3310-5 7.2710-7 1.521014 9.691014 6.9910-2
a The total volume of gold was calculated as: gold mass ([1TiO2@Au1] 3 mL amount of Au by
ICP) was divided by the gold density (19.7 g cm-3
). b
The Au nuclei were assumed as sphere and the
volume of a single Au nuclei is 4/3 R3 and the
c surface area is 4 R
2
Table II.5: Rate constants (kobs, s-1
) with their standard deviations () of catalysed reactions
between Fe(CN)63− and BH4
− ions at different temperatures (283 - 303 K).
T (K)
1TiO2@Au1
10-3
kobs 10-4
(s-1
)
283 3.35 1.63
286 4.08 0.71
288 6.34 7.0
290 7.25 2.81
293 16.9 11.4
298 42.5 4.35
303 98.6 123.27
Ea (kJ/mol)
135.95 ± 0.59

111
APPENDIX III
Photochemical activity of TiO2 / TiO2@Au nanostructures
Figure III.1: Size distribution of Au NPs before and after solar irradiation of the 2TiO2@Au1 sample
Figure III.2: UV–vis spectral evolution of RhB solution under sunlight irradiation.
Conditions: [RhB] = 1.0 × 10⁻⁵ mol dm−3, sunlight.

APPENDIX III
112
Table III.1: XPs elemental chemical compositions of the 1TiO2 and 2TiO2 samples (in at.%).
Sample Ti (at.%) C (at.%) O (at.%)
1TiO2 28.1 8.3 63.6
2TiO2 31.0 7.0 62.0

113
RESUMEN
Nanocompuestos de TiO2 y metales nobles: síntesis, caracterización y
actividad catalítica
En este resumen se pretende ofrecer una visión global del trabajo presentado en los distintos
capítulos de la presente tesis. En primer lugar se han diseñado las rutas para la obtención de
nanopartículas tipo núcleo-corteza de Au@TiO2 y de partículas de TiO2 dopadas con
nanopartículas de oro, TiO2@Au. Seguidamente, se investigó el efecto catalítico de la
presencia de nanopartículas de TiO2@Au en la reacción de reducción de iones
hexacianoferrato (III) por iones borohidruro en agua. Se realizaron estudios sobre la
influencia de la variación de ciertas propiedades del catalizador, concretamente, el tamaño y
densidad de las nanopartículas de oro en el suporte de TiO2. También se analizaran los efectos
de parámetros como la temperatura o cantidad de catalizador y de iones de borohidruro.
Además, se ha comparado la actividad catalítica de las nanopartículas de TiO2@Au con la de
nanopartículas de TiO2 y de oro estabilizadas en citrato de tamaño (4 nm de diámetro) similar
al de las nanopartículas de oro depositado en el nanocompuesto de TiO2@Au. En base en los
datos cinéticos obtenidos se propuso un mecanismo para el proceso catalítico.
Finalmente se han llevado a cabo estudios de fotocatálisis heterogénea con las partículas de
TiO2 y/o TiO2@Au empleando como reacción modelo la degradación del colorante textil
rodamina B usando luz solar.

RESUMEN
114
6.1. Objetivos
Basándose en la experiencia del grupo de investigación de Química Coloidal en la síntesis de
coloides metálicos con control de tamaño y forma, y en la propiedades catalíticas de
nanopartículas de oro con tamaños nanométricos y TiO2, se ha querido, en primer lugar,
sintetizar nanopartículas de oro y recubrir con una capa uniforme de dióxido de titanio,
Au@TiO2, de espesor controlado. Seguidamente, se han sintetizado nanopartículas de TiO2
con gran área superficial y dopadas con oro, TiO2@Au, y se ha estudiado su actividad
catalítica empleando la reducción de iones hexacianoferrato (III) por iones borohidruro como
reacción modelo, con el fin de entender la importancia del suporte de TiO2 en el proceso
catalizado por el Au. Finalmente, se ha analizado la actividad fotocatalítica de las
nanopartículas de TiO2 y los nanocompuestos de TiO2@Au empleando la fotodegradación del
colorante textil rodamina B como reacción modelo.
En este contexto, en el Capítulo 1, se presenta una breve introducción general para abordar la
temática relacionada con las nanopartículas metálicas, desde sus propiedades ópticas, pasando
por la teoría de Mie, hasta la catálisis. También se aborda, brevemente, las principales
propiedades del dióxido de titanio y el uso de nanopartículas de oro suportadas en el TiO2 en
catálisis y fotocatálisis.
En el Capítulo 2, se describe la síntesis de nanopartículas tipo núcleo-corteza (comúnmente
denominadas core-shell) de Au@TiO2 empleando diferentes aproximaciones y se presenta su
caracterización estructural y óptica. Como se sabe, una de las principales limitaciones de las
nanopartículas es su estabilidad coloidal. Es por ello, que para su aplicación tecnológica a
menudo son depositadas sobre un sustrato; o son dispersadas en soluciones con agentes
anti-aglomerantes; y/o son recubiertas con una corteza de naturaleza polimériza o inorgánica.
Además, el recubrimiento de las nanopartículas puede dar lugar a nuevos sistemas
hetero-estructurados con nuevas propiedades o propiedades mejoradas resultantes de la
combinación de más de un material. En el presente estudio, se hicieron tres rutas diferentes
para el recubrimiento de las nanopartículas de oro con dióxido de titanio. Sólo fue posible
obtener nanopartículas de oro con una capa homogénea de dióxido de titanio mediante un
enfoque basado en la combinación de la técnica de “capa por capa” y la hidrólisis y
condensación del precursor de dióxido de titanio en medio alcohólico. La capa de óxido de
titanio se puede ajustar por la adición sucesiva de precursor de titanio a los nanocompuestos

RESUMEN
115
de Au@TiO2. El control del espesor de la capa de titania se podría utilizar para controlar las
interacciones dipolares entre las partículas y mejorar la versatilidad de las mismas.
En el Capítulo 3, se presenta, la síntesis de nanopartículas porosas de TiO2 con dos tamaños
diferentes y su caracterización estructural y óptica. A continuación, se explora la deposición
homogénea de nanopartículas de oro, con diámetros comprendidos entre 2 y 5 nm, sobre la
superficie del dióxido de titanio, así como su caracterización estructural y óptica. Para tal fin,
se analizaron tres métodos distintos, siendo el método que combinaba la técnica de
deposición-precipitación con urea, DPU, y la reducción química con borohidruro el que
permitió obtener una distribución más homogénea de nanopartículas de oro sobre la superficie
del TiO2 y controlar su tamaño variando la cantidad de partículas de TiO2 usadas durante la
DPU.
En el Capítulo 4, se estudia la actividad catalítica de los nanocompuestos de TiO2@Au
empleando como reacción modelo la reducción de iones hexacianoferrato (III) por iones
borohidruro en medio acuoso. Se estudió la influencia del tamaño y densidad de las
nanopartículas de oro en el suporte de TiO2 durante el proceso catalítico. También se
analizaron los efectos en la actividad catalítica de parámetros como la: temperatura o la
cantidad de catalizador y borohidruro. Además, se comparó la actividad catalítica de las
nanopartículas de TiO2@Au con la de nanopartículas de TiO2 y de oro estabilizadas en citrato
de tamaño (4 nm de diámetro) similar al de las nanopartículas de oro depositado en el
nanocompuesto de TiO2@Au. En base en los datos cinéticos obtenidos se propuso un
mecanismo para el proceso catalítico.
En el Capítulo 5, se emplean las nanopartículas de TiO2 y los nanocompuestos de TiO2@Au,
sintetizadas anteriormente, para estudiar la degradación fotocatalítica del colorante rodamina
B, RB, bajo la luz solar directa. Se quiso demonstrar la calidad de las nanopartículas de TiO2
y TiO2@Au como fotocatalizadores empleando luz solar, dada su gran capacidad de
absorción en la zona del visible. También se comprobó la reducción fotoquímica de los
cationes de oro, Au3+
y Au1+
, presentes en las hetero-estructuras de TiO2@Au obtenidas por
DPU y antes de su reducción con borohidruro.
Finalmente, se resumieron las conclusiones generales más relevantes que se desprenden del
trabajo realizado.

RESUMEN
116
6.2. Introducción
En general, cuando se reduce a la escala nanométrica cualquier material, surgen nuevas
propiedades ópticas, catalíticas y magnéticas, entre otras, distintas a las del material masivo.
En el caso particular de los metales y más concretamente del oro, plata, o cobre, el
confinamiento de los mismos en la nanoescala da lugar a una modificación drástica de sus
propiedades ópticas, fundamentalmente en la región visible del espectro electromagnético. El
origen de dicha respuesta óptica se encuentra en la oscilación coherente de los electrones de la
banda de conducción del metal, por interacción con la radiación electromagnética incidente,
que se conoce como resonancia de plasmón superficial localizada. Dichas resonancias
plasmónicas son altamente sensibles al tamaño y morfología de las nanopartículas, así como
también a la distancia entre partículas o las propiedades dieléctricas del medio que las rodea.
Esto hace que estos materiales presenten infinidad de posibilidades tecnológicas en
diagnóstico y terapia médica, tecnología de almacenamiento de dados, biosensores,
optoelectrónica, catálisis, fotocatálisis, entre muchas otras.
El dióxido de titanio es uno de los materiales semiconductores más estudiado debido a sus
numerosas aplicaciones, que van desde celdas solares a (foto)catálisis, pasando por la
industria de pinturas y cosméticos, implantes de huesos, y desinfección de aguas, entre
muchas otras. De todas sus aplicaciones, nos interesa conocer su comportamiento y
características como soporte de metales para el estudio de reacciones catalíticas y
fotocatalíticas en su superficie.
En un proceso fotocatalítico la absorción de fotones, con una energía mayor que la banda
prohibida, band gap, del semiconductor da lugar a la excitación de los electrones desde la
banda de valencia hasta la banda de conducción generando el par electrón-hueco. Una vez
creado el par, este puede ser capturado por especies adsorbidas en la superficie, por impurezas
contenidas en el sistema, o por especies que están en fase gaseosa en contacto con la
superficie. Por ejemplo, el electrón en la banda de conducción puede ser capturado por
moléculas de oxígeno, mientras el hueco en la banda de valencia puede ser capturado por las
especies OH− o H2O, adsorbidas en la superficie del catalizador, generando radicales
hidroxilos. La recombinación electrón-hueco es un proceso que suele competir con la
transferencia de carga a las especies adsorbidas. La introducción de metales, como por
ejemplo el oro, o no metales, como por ejemplo el carbono, entre otros, es capaz de disminuir
o eliminar la recombinación electrón-hueco, visto que estas impurezas crean niveles

RESUMEN
117
intermedios, entre la banda de valencia y la banda de conducción, que actúan como trampa, y
posibilitan, además, la absorción de fotones de menores energías. Otros factores que
determinan la eficiencia del catalizador son la selectividad, la actividad y la estabilidad, así
como poseer una cuantidad suficiente de sitios activos en un área superficial de dimensiones
adecuadas y expuestos a las especies reactivas.
El trabajo de investigación presentado en esta memoria está centrado en la fabricación y
caracterización de nanopartículas de oro soportados en dióxido de titanio, TiO2@Au, y en su
aplicación en la catálisis de la reacción de transferencia electrónica entre los iones de
hexacianoferrato (III) y los iones de borohidruro en agua. Este estudio visa ampliar el
conocimiento existente de este tipo de sistemas en catálisis. En general, los materiales de
TiO2@Au son catalizadores heterogéneos porque el catalizador y los reactivos se encuentran
en fases distintas, en este caso, un catalizador sólido que acelera una reacción en fase acuosa.
Esto implica, que las reacciones catalíticas ocurren en las superficies de los catalizadores. Por
eso, la naturaleza de los átomos de estas superficies determinan cuan rápidas y de qué manera
ocurren estas reacciones. La facilidad de los reactivos en alcanzar la superficie catalizadora
para ser quimisorbidos con el mínimo de energía, o transferir electrones, favorece os procesos
catalíticos en los nanomateriales, llevando dichas reacciones por un camino de reacción de
menor energía. Así que conocer las propiedades estructurales y electrónicas de estos sistemas
es fundamental para entender los complejos procesos que tienen lugar durante la catálisis.
6.3. Fabricación de Nanopartículas núcleo-corteza de oro y dióxido de
titanio.
En el Capítulo 2, se estudian diferentes rutas para el recubrimiento de nanopartículas de oro,
de aproximadamente 66 nm de diámetro, con una capa homogénea de dióxido de titanio y
controlar su espesor. El proceso experimental consta de dos partes bien diferenciadas. Una
primera, donde se lleva a cabo la formación de semillas de oro de aproximadamente 15 nm de
tamaño y su crecimiento hasta unos 66 nm, siguiendo el proceso descrito por
Rodríguez-Fernández et al, y una segunda, donde se recubren las NPs de Au, estabilizadas en
bromuro de hexadeciltrimetilamonio, CTAB, con TiO2. De las tres rutas analizadas, sólo la
metodología que combina la técnica de “capa por capa” (deposición de polielectrolitos y PVP
mediante fuerzas electrostáticas sobre la superficie de las nanopartículas de oro) y la hidrólisis
y condensación de un precursor de dióxido de titanio ha permitido el recubrimiento

RESUMEN
118
homogéneo de las NPs de Au con titania. La presencia del surfactante catiónico, CTAB, en
exceso dificulta el recubrimiento homogéneo con TiO2 cuando se intenta recubrir las
nanopartículas simplemente empleando la hidrólisis y condensación de un precursor de
dióxido de titanio. Por eso primero se enmascara el surfactante por medio de la adsorción de
polielectrolitos sobre la superficie de las partículas de oro. El CTAB confiere à las
nanopartículas de oro una carga superficial positiva, por lo cual la deposición de sulfonato
sódico de poliestireno, PSS, un polielectrolito cargado negativamente, está fuertemente
favorecida. La capa de PSS invierte la carga de la superficie del oro y por lo tanto las
nanopartículas se pueden recubrir nuevamente con un polielectrolito con carga positiva como
el poli(hidrocloruro de alilamina), PAH. Seguidamente, las nanopartículas son
funcionalizadas con polivinilpirrolidona, PVP, para la redispersión en medio alcohólico. De
esta forma, es posible depositar una capa uniforme de TiO2 a través de la adición de butóxido
de titanio, TBT, a la solución alcohólica de Au@CTAB@PSS@PAH@PVP a temperatura
ambiente y bajo atmósfera inerte (el precursor de titanio es altamente reactivo en presencia de
trazas de agua). Para aumentar el espesor de la capa de titania, las hetero-estructuras de
Au@CTAB@PSS@PAH@PVP@TiO2 fueron sujetas a dos nuevos procesos de hidrólisis y
condensación del TBT. Las imágenes de TEM de las nanopartículas núcleo-corteza de
Au@TiO2, Figuras 6.1 (B) y 6.1 (D), confirmaron el aumento de espesor de la capa de
dióxido de titanio durante sus etapas de crecimiento. También, en la Figura 6.2 (B), el
desplazamiento continuo hacia el rojo de la banda de absorbancia debido a la resonancia de
plasmon superficial (SPR) y los aumentos del ancho de la banda SPR confirman el aumento
de espesor de la capa de TiO2 en las nanopartículas de Au@TiO2. Durante la adsorción de los
polielectrolitos no se observó cambio significativos en las propiedades ópticas de las
partículas (ver Figura 6.2 (A)).
Figura 6.1: Imágenes de TEM de nanopartículas de oro con aproximadamente 66 nm de diámetro (A)
y de nanopartículas tipo núcleo-corteza de Au@TiO2 con capas homogéneas de titania de espesor
controlado: 5 nm (B); 20 nm (C); y 30 nm (D).

RESUMEN
119
Figura 6.2: Espectros de absorción Vis-NIR de dispersiones acuosas de nanopartículas de oro
recubiertas con CTAB, PSSS, PAH y PVP (A), y nanopartículas de oro en diferentes etapas del
recubrimiento de dióxido de titanio (B). Los espectros se normalizaron en el máximo de absorción
para facilitar comparación.
En este capítulo además se analizan dos métodos más para la síntesis de nanopartículas
núcleo-corteza de Au@TiO2 basados en la hidrólisis de precursores de TiO2 directamente
sobre coloides de oro estabilizados con CTAB o PVP. Los resultados obtenidos permitieran
concluir que el tensioactivo catiónico CTAB y el polímero anfifílico PVP hacen que la
afinidad del oro para el TiO2 sea suficientemente alta, por lo que, las partículas de titania
hidrolizados se depositan directamente sobre la superficie de coloides de Au@CTAB o
Au@PVP durante el procedimiento de revestimiento con dióxido de titanio. Sin embargo, es
muy difícil tener la cantidad ideal de CTAB o de PVP en el medio de modo a obtener un
recubrimiento homogéneo.
7.4. Síntesis y caracterización de nanopartículas de TiO2 dopadas con oro
En el Capítulo 3, nanopartículas de TiO2 anatasa en forma de huso, con dos tamaños
diferentes (175.7 ± 38.6 de largo y 116.8 ± 28.8 nm de ancho para el 1TiO2, y 303.8 ± 72.8
nm de largo y 226.4 ± 48.0 nm de ancho para el 2TiO2) fueron sintetizados en gran escala
mediante un método solvotermal a 200 ºC. Se empleó como precursor el butóxido de titanio y
como disolvente el ácido acético y no se adicionaron aditivos. Se ha observado que el tamaño
y área específica de las partículas de dióxido de titanio dependían de la cantidad de precursor
de titanio. De este modo la muestra 2TiO2, sintetizada con menor cantidad de precursor de
titanio para igual volumen de ácido acético, presentaba mayor tamaño y menor área
específica. Las propiedades estructurales, fisicoquímicas y morfológicas de las nanopartículas
de TiO2 obtenidas fueron examinadas por microscopía electrónica de transmisión (TEM),

RESUMEN
120
dispersión dinámica de luz (DLS), el método de Brunauer-Emmett-Teller (BET),
espectroscopia fotoelectrónica de rayos X (XPS), y espectroscopia de absorción UV-vis.
Como bien se sabe, el área de superficie específica, el tamaño y forma del poro de las
nanopartículas de TiO2 son factores importantes en la catálisis. Por lo tanto, se llevaron a cabo
estudios de adsorción-desorción de nitrógeno para determinar tales parámetros. Las isotermas
de adsorción-desorción obtenidas para el 1TiO2 y el 2TiO2 fueron del tipo IV, con un ciclo de
histéresis tipo H3, características de materiales mesoporosos con una distribución no uniforme
de tamaño y forma de poro.
En lo referente a las propiedades ópticas, se observó que ambas muestras, 1TiO2 y 2TiO2,
absorbían radiación UV en longitudes de onda inferiores a 400 nm, este efecto está asociado
con la promoción de los electrones de la banda de valencia a la banda de conducción del TiO2,
con un máximo de absorción a ~ 335 nm. Además la absorción se extendía en la zona del
visible y el infrarrojo cercano (ver figura 6.3 (A)). Se evaluó la energía de banda prohibida o
band gap, Eg, del semiconductor a través de la representación espectral de la función
Kubelka-Munk (Figura 6.3 (B)), suponiendo transiciones indirectas. De este modo se obtuvo
un valor de Eg de 1.99 eV y de 1.92 eV para las partículas de 1TiO2 y 2TiO2, respectivamente.
Esta absorción de las muestras de TiO2 en el rango visible es probablemente debido a una
combinación de diferentes efectos, tales como: defectos en la red, la incorporación de carbono
y la presencia de una pequeña cantidad de Ti3+
en los mesocristales de TiO2. Mientras que los
defectos en la red se caracterizaron por microscopia electrónica de transmisión por barrido de
campo oscuro anular de alto ángulo (STEM-HAADF), la presencia de carbono y Ti3+
fueron
confirmadas por XPS.
Figure 6.3: (A) Espectros de absorción UV-vis-NIR de los coloides de 1TiO2 y 2TiO2. Los espectros
se normalizaron a la absorbancia máxima para facilitar comparación. (B) Relación de (αℎʋ)1
2⁄ vs
energía de la luz para las muestras de TiO2.

RESUMEN
121
Posteriormente, ambas nanopartículas de TiO2 fueren dopadas con oro, TiO2@Au, a través
del método de deposición-precipitación con urea (DPU). Así se prepararon diferentes
muestras manteniendo constante la cantidad de sal de Au y variando la cantidad de partículas
de TiO2. El análisis de las diferentes muestras por XPS mostraron que aumentando la
cuantidad de titania usada en el proceso de DPU aumenta la cuantidad de oro metálico, frente
a cationes Au+ y Au
3+, presente en la superficie de las partículas semiconductoras (ver Figuras
6.4 (A) –(C)). Esto ocurre probablemente porque los centros de Ti3+
presentes en TiO2, datos
suportados por XPS, son capaces de reducir los cationes de oro a Au0, y por eso el pico a
457.3 eV correspondiente a Ti3+
deja de observarse en los espectros de XPS. La completa
reducción de los cationes de Au tras la deposición-precipitación con urea se realizó mediante
la adición de borohidruro a los nanocompuestos de TiO2@Au tal y como se demostró por
XPS (ver Figura 6.4 (D)).
Los nanocompuestos de TiO2@Au obtenidos con el 1TiO2 y el 2TiO2 presentan características
similares en lo que respecta al tamaño y densidad de nanopartículas de oro, y por eso se hay
decidido presentar apenas los datos de una amuestra, 2TiO2, colocando los restantes
resultados en el anexo. Los nanocompuestos preparados se denominaron de 2TiO2@Aux,
donde X representa el contenido de oro, como una función de la cantidad de TiO2 utilizado la
etapa de DPU. De esto modo: X = 0[2TiO2]= 0.7 mg/mL, X = 1[2TiO2]=3.5 mg/mL,
X=2 [2TiO2]=10.5 mg/mL (ver Figura 6.4). Se ha observado que el porcentaje de
nanopartículas de oro y su diámetro, sobre el soporte de TiO2, disminuye al aumentar la
cuantidad de TiO2 empleado en el proceso de DPU (ver Figura 6.5).

RESUMEN
122
Figura 6.4: Espectros de XPS del nivel Au 4f de los nanocompuestos de 2TiO2@Au preparados por
deposición-precipitación con urea y antes de su reducción con borohidruro (A-C). (A) [2TiO2] = 3.5
mg/mL; (B) [2TiO2] = 8.5 mg/mL; (C) [2TiO2] = 10.5 mg/mL. (D) Espectro de XPS del nivel Au 4f
de la muestra mostrada en A después de la reducción con NaBH4.
En este capítulo, se analizan además otros dos métodos de preparación de los nanocompuestos
de TiO2@Au, los cuales están basados en la adsorción de especies de oro, AuCl4− o
Au(Cl)4-n(OH)n− sobre la superficie del TiO2 y su posterior reducción con borohidruro sódico.
Estos métodos se basan en el hecho de que los coloides de TiO2 sintetizados exhiben un
potencial zeta positivo, + 38.5 7.58 mV, por lo que el dopaje con NPs de oro a través de la
adsorción electrostática de especies de oro con carga negativa, AuCl4− o Au(Cl)4-n(OH)n
−, en
la superficie de TiO2, es favorecida. Estés métodos no han permitido aumentar y controlar el
tamaño de las nanopartículas de oro ni su densidad sobre la superficie de TiO2.

RESUMEN
123
Figura 6.5: Imágenes de TEM de (A) 2TiO2 y 2TiO2@Au obtenidos usando diferentes cantidades de
NPs de 2TiO2: (B) 0.7 mg/mL (muestra 2TiO2@Au0); (C) 3.5 mg/mL (muestra 2TiO2@Au1), y (D)
10.5 mg/mL (muestra 2TiO2@Au2). El tamaño promedio de las NPs de oro en las muestras de
2TiO2@Au0, 2TiO2@Au1, 1TiO2@Au2 es 17.5 ± 5.3 nm, 4.0 ± 1.4 nm y 1.4 ±0.4 nm, respectivamente.
6.5. TiO2@Au como catalizador en la reducción de ferrocianato (III) por
iones borohidruro
En el Capítulo 4, se estudia la actividad catalítica de los nanocompuestos de TiO2@Au
preparados en el Capítulo 3 empleando la reducción de hexacianoferrato (III) por iones
borohidruro como reacción modelo. Esta reacción fue seguida, por espectroscopia de
absorción UV-vis, vía diminución de la banda de absorción del hexacianoferrato (III) a 420
nm. Se ha verificado que todos los nanocompuestos de TiO2@Au actúan como eficientes
catalizadores en la reducción de ferrocianato por iones borohidruro aumentando altamente la
velocidad de reacción respecto de la reacción sin catalizar. El estudio de la reacción fue
llevado a cabo usando una concentración de iones borohidruro en exceso respecto a
hexacianoferrato (III), de modo que la concentración de iones de borohidruro se pueda
considerar constante. También, se trabajó a pH 11.5 para inhibir la hidrólisis del borohidruro
en agua. En estas condiciones, los resultados muestran que el orden de reacción con respecto a
la concentración de borohidruro, [NaBH4] y de catalizador, [TiO2@Au], es de primer orden.
Además se calculó la energía de activación para la reacción catalizada por 1TiO2@Au1 y por

RESUMEN
124
2TiO2@Au2 obteniendo unos valores de 135.95 ± 0.59 kJ mol-1
y 98.64 ± 0.96 kJ mol-1
,
respectivamente.
El efecto del soporte de TiO2 en la constante de velocidad observada de pseudo primer orden
se analizó comparando las constantes de velocidad observadas, kobs, obtenidas para el
nanocompuesto de 1TiO2@Au1 y para NPs de Au estabilizadas con citrato, Au@Cit, con
diámetro similar al de las NPs de oro presentes en 1TiO2@Au1, 4.0 0.7 nm. Para una mejor
comparativa se representó las kobs un función de la concentración de oro (ver Figura 6.6 (B).
Los resultados obtenidos mostraron que las nanopartículas de Au soportadas sobre TiO2
exhiben un mayor rendimiento catalítico que los coloides de oro estabilizados con citrato,
indicando que el soporte de TiO2 tiene un papel en el mecanismo de reacción. Probablemente,
la cooperación catalítica del TiO2 y oro, en el nanocompuesto TiO2@Au, surge por el
aumento de la superficie catalítica debido a la naturaleza semiconductora del TiO2. Es decir,
después de cargar con electrones las NPs de oro mediante la adición de borohidruro, parte de
los electrones se pueden transferir al soporte de óxido de titanio, qué puede así también actuar
como catalizador para el modelo de reacción en estudio. Además se verificó que bajo nuestras
condiciones experimentales, el borohidruro no consigue inyectar electrones en las
nanopartículas de TiO2 sin dopar ya que los iones de ferrocianuro no se reducen (ver Figura
6.6(A)). Así, las nanopartículas de oro, presentes en los nanocompuestos de TiO2@Au son la
única especie receptora de los electrones del borohidruro.
Figure 6.6: (A) Traza cinética de la absorbancia a 420 nm durante la reducción de Fe(CN)63− en
presencia de TiO2 ((línea continua) y TiO2 dopado con Au (1TiO2@Au1, línea discontinua). (B)
Estudio comparativo de la influencia de la cantidad de Au en la constante de velocidad observada para
la reducción de Fe (III) en presencia de dos catalizadores diferentes 1TiO2@Au1 y Au@Citrato.
Condiciones: [Fe(CN)63−] = 8.33 × 10
-4 M, [BH4
− ]= 8.33 × 10⁻³
M, T = 25 ºC, pH = 11.5.
El mecanismo de reacción propuesto se define del siguiente modo. Inicialmente el
borohidruro carga negativamente la superficie metálica de las nanopartículas de oro

RESUMEN
125
soportadas en el TiO2. En esta situación, su nivel de Fermi se desplaza a valores más
negativos, acercándose al borde de la banda de conducción del TiO2, permitiendo así la
transferencia de electrones desde el metal a la banda de conducción del TiO2 hasta que haya
equilibrio de cargas en el sistema de TiO2@Au (ambos los niveles de Fermi se igualan).
Posteriormente, los electrones presentes en la superficie del TiO2 y del oro son capaces de
reducir el hexacianoferrato (III). Se ha observado que la disminución de densidad de NPs de
oro en los nanocompuestos de TiO2@Au aumenta ligeramente su capacidad catalítica. Esto
puede ser debido a la diminución de la cantidad de nanopartículas de oro sobre la superficie
del TiO2, es decir, al aumento de área superficial de TiO2 libre, lo que aumenta la
probabilidad de contacto entre los iones de hexacianoferrato (III) y la superficie del TiO2.
Consecuentemente, aumenta a superficie catalítica, que ahora puede ser la del oro y a del
TiO2. Cuando el TiO2 se encuentra completamente dopado con NPs de oro, como en el caso,
por ejemplo, del catalizador 2TiO2@Au0, se observa un apantallamiento de la superficie del
TiO2 (ver Figura 6.5 (A)), disminuyendo así la probabilidad de reducción del Fe3+
por la
superficie del TiO2, por lo que la reducción se hace esencialmente vía superficie de las
nanopartículas de oro.
En lo que se refiere al efecto del tamaño de las nanopartículas de oro en los nanocompuestos
de TiO2@Au, se ha visto que la mayor capacidad catalítica se obtuvo para los
nanocompuestos de TiO2@Au con nanopartículas de oro de 1.4 0.5 nm de diámetro. Estas
pequeñas dimensiones facilitan el contacto entre el Au y el TiO2, y por otro, la rápida
transferencia de electrones del Au al TiO2 al ser cargadas con electrones por el borohidruro.
Finalmente también se ha estudiado la capacidad de reusabilidad de los catalizadores de
TiO2@Au empleando la misma reacción modelo. Los resultados no mostraron una reducción
importante en la eficacia catalítica de los catalizadores de TiO2@Au incluso después de seis
ciclos (ver Figura 6.7) lo que indica la excelente estabilidad de estos nanocompuestos.

RESUMEN
126
Figure 6.7: Trazas cinéticas de la absorbancia a 420 nm, registradas durante la reducción secuencial
de ferrocianato (III) por iones borohidruro en presencia de 2TiO2@Au2. Concentraciones iniciales
[Fe(CN)63−] = 8.33 × 10
-4 M, [BH4
− ] = 8.33 × 10⁻³
M, [2TiO2@Au2] = 3.33 × 10⁻⁶
g mL-1
, T = 25 ºC,
pH = 11.5.
6.6. ESTUDIOS FOTOQUÍMICOS CON NANOPARTÍCULAS DE TiO2 Y
TiO2@Au
En el Capítulo 6, se investigó la capacidad catalítica del TiO2, utilizando la luz solar como
fuente de irradiación, en la fotorreducción de las especies catiónicas de Au presentes en la
superficie de TiO2 tras la deposición-precipitación con urea de una sal de Au. También se
estudió la eficiencia de las nanopartículas de TiO2 y de TiO2@Au en la fotodegradación de la
rodamina B en solución acuosa.
De este modo se observó que cuando la suspensión acuosa de TiO2 dopado con cationes Au+
y Au3+
, contenida en un vial de vidrio cerrado, era expuesta a la luz solar, los electrones
fotoexcitados, en la banda de conducción de TiO2 eran capaces de reducir las especies
catiónicas a Au0. El proceso fue seguido por espectroscopia de absorción UV-Vis
observándose la aparición de una banda plasmónica a 594 nm que indicaba la presencia de
NPs de Au (ver Figura 7.7A). Estos resultados coinciden con los obtenidos en la
caracterización del nanocompuesto de 2TiO2@Au1, mediante XPS (ver Figura 6.7 (C) y (D)),
antes y después de la fotoreducción. Tras la fotoreducción aparece un único pico de Au 4f7/2,
centrado a 83.6 eV, correspondiente a oro metálico. También, la mudanza de color de la

RESUMEN
127
suspensión acuosa de TiO2@Au de amarillo para rosa (ver Figura 6.8 (B)) comprueba la
formación de NPs de oro.
Figura 6.8: (A) Evolución de los espectros de absorción UV-vis-NIR de una dispersión de
nanopartículas de 2TiO2@Au1 durante la irradiación con luz solar. (B) Esquema de la fotorreducción
de Au3+
y Au1+
a Au0
catalizada por las nanopartículas de TiO2 en los nanocompuestos de TiO2@Au
obtenidos por deposición-precipitación con urea (e- = electrones fotoexcitados, h
+ = huecos
fotogenerados). (C-D) Espectros de XPS del nivel Au 4f de 2TiO2@Au1 antes (C) y después (B) de
irradiación con luz solar durante 210 minutos.
Se investigó también la fotodegradación del colorante textil rodamina B con luz solar en
presencia de nanopartículas de TiO2 y TiO2@Au. El proceso se estudió por espectroscopia de
absorción UV-vis-NIR siguiendo la evolución de la banda de absorción característica de la
rodamina B a 554 nm. Así esta banda disminuía gradualmente en presencia de TiO2 o de
TiO2@Au (ver Figura 6.9) indicando que ambos actúan como eficientes fotocatalizadores en
la degradación de la RB por irradiación con luz solar. También, se notó un desplazamiento
hace al azul, indicando la N-des-metilación de la RB. Además la disminución de la
absorbancia a 554 nm en condiciones de oscuridad indicaba que las moléculas de RB era
pre-adsorbidas en la superficie de TiO2 y de TiO2@Au (ver Figuras 6.9 (A)-(D)).

RESUMEN
128
Así los estudios de la actividad catalítica efectuados mostraron que las nanopartículas de TiO2
cuando están dopadas con oro presentan un comportamiento cinético más lento en la
fotodegradación de la RB (ver Figura 6.9 (F)). También se observó que aumentando la
densidad de nanopartículas de oro sobre la superficie del TiO2, como en el caso del
fotocatalizador 1TiO2@Au1, la cinética de degradación del colorante RB es más lenta. Tal
ocurre, probablemente, porque el exceso de nanopartículas de oro funciona como centros de
recombinación de carga, o cubre los sitios activos del TiO2, o reduce la profundidad de
penetración de la luz solar.
El mecanismo sugerido para la descomposición fotocatalítica de la RB en presencia de TiO2
consiste, simplificadamente, en la acumulación de electrones en la banda de conducción de
TiO2, inyectados por la fotoexcitación del colorante textil de RB, TiO2{RB}ads∗ y del TiO2,
que entonces reaccionan con el oxígeno reduciéndolos a aniones radicales superóxidos, O2∙−,
responsables por la generación del radical hidroxilo, OH∙. También los huecos, fotogenerados
en el proceso de fotoexcitación del TiO2, son responsables por la formación de OH∙. A
continuación, el colorante rodamina B reacciona con los radicales OH∙ y O2∙− generando una
gama de productos intermedios seguido por su completa mineralización.
La importancia de este estudio reside en las excepcionales propiedades de las nanopartículas
de TiO2 en la región visible, que permiten su uso en fotocatálisis solar para resolución de
problemas de contaminación de aguas con materiales no biodegradables.
Para concluir, probablemente, a alta actividad fotoreductora y fotocatalítica de las
nanopartículas de TiO2 con luz solar podría atribuirse a efectos sinérgicos como: (i) la
presencia de carbono en los mesocristales de dióxido de titanio, que induce la absorción de
luz visible; (ii) su gran área de superficie, que proporciona más posiciones de adsorción para
las especies reactivas; y (iii) su estructura porosa, que permite múltiples reflexiones de la luz
visible en el interior de las partículas de dióxido de titanio, lo que hace un uso más eficiente
de la luz visible.

RESUMEN
129
Figure 6.9: Evolución espectral de una mezcla de rodamina B y (A) 1TiO2, (B) 2TiO2, (C)
1TiO2@Au1 y (D) 2TiO2@Au2 en diferentes tiempos de irradiación de luz visible.

RESUMEN
130
6.7. Conclusiones
A continuación se recogen las conclusiones más relevantes que se han obtenido en la presente
tesis.
1. Se han sintetizado nanopartículas núcleo-corteza de Au@TiO2 mediante el
recubrimiento de nanopartículas de oro presintetizadas con una capa homogénea de
TiO2 a través de una metodología que combina la técnica de “capa por capa” con la
hidrolisis y condensación del precursor de titanio en medio alcohólico. Además la
adición secuencial del precursor de TiO2 permite crecer la capa del semiconductor de
una manera controlada.
2. Se han sintetizado y caracterizado mesocristales de dióxido de titanio (anatasa) en
forma de huso mediante síntesis solvotermal con ácido acético y butóxido de titanio.
Estas nanopartículas presentan fuerte absorción en la región espectral del visible
probablemente debido, tal y como se ha comprobado, a la combinación de diferentes
efectos, tales como la incorporación de carbono en los mesocristales de dióxido de
titanio, y/o defectos en su red cristalina originados por la presencia de Ti3+
. Además, a
partir del espectro de absorción UV-visible se ha calculado el band gap de las partículas
semiconductoras empleando la relación de Kubelka-Munk, obteniéndose valores
bastante bajos (1.99 y 1.92 eV para el 1TiO2 y 2TiO2, respectivamente).
Se han desarrollado diferentes estrategias para dopar las nanopartículas de TiO2 con Au
y se ha encontrado que la ruta basada en la deposición-precipitación del precursor de
oro con urea y un posterior tratamiento con borohidruro es la que obtiene los mejores
resultados en cuanto a homogeneidad y control de tamaño. Además, hemos comprobado
por XPS que tras la etapa de deposición-precipitación con urea los mesocristales de
TiO2 estaban dopados no solo con Au metálico pero también con especies catiónicas de
oro, Au3+
y Au+. Hecho que justifica el posterior tratamiento con borohidruro. También
hemos visto que la cantidad de especies catiónicas de oro respecto a Au0 disminuía al
aumentar la cantidad de nanopartículas TiO2, relativamente a la sal de Au durante el
método de deposición-precipitación con urea. Los análisis de XPS llevados a cabo
indicaron que el Ti3+
, presente en la red cristalina de los cristales de TiO2, se
comportaba como agente reductor de iones Au3+
/ Au1+
a Au0.

RESUMEN
131
Se ha analizado la eficiencia catalítica de los nanocompuestos de TiO2@Au en
reacciones de transferencia de carga empleando como reacción modelo la reducción de
ferrocianato por iones borohidruro. Se ha verificado que:
(a) Todos los nanocompuestos de TiO2@Au (sintetizados por
deposición-precipitación con urea, usando diferentes cantidades de nanopartículas
de TiO2 para la misma cantidad de sal de oro, seguido de reducción química con
borohidruro), en pequeñas cantidades, actúan como eficientes catalizadores en la
reducción de ferrocianato por iones borohidruro aumentando altamente la
velocidad de reacción respecto de la reacción sin catalizar, sobe nuestras
condiciones experimentales. Además, la presencia de los nanocompuestos de
TiO2@Au cambia la orden de reacción de reducción del hexacianoferrato (III) a
hexacianoferrato (II) con borohidruro de pseudo-orden zero para pseudo-orden uno
respecto de la concentración de ferrocianato (III), indicando un cambio en el
mecanismo de reacción respecto de la reacción sin catalizar.
(b) Utilizando una concentración de iones borohidruro en exceso respecto de
hexacianoferrato (III), de manera que la concentración de iones borohidruro se
pueda considerar constante, y trabajando a pH 11.5 para evitar reacciones
competitivas, se obtuvo un pseudo-orden reacción uno respecto de la
concentración de borohidruro para los nanocompuestos 2TiO2@Au2 y
1TiO2@Au1.
(c) Hay una relación lineal entre la constante de velocidad observada y la
concentración de TiO2@Au, lo que indica que el nanocompuestos de TiO2@Au
actúa como un catalizador implicado en la etapa determinante de la velocidad de la
reacción modelo en el estudio.
(d) La dependencia de la constante observada de reacción kobs con la temperatura para
los nanocompuestos de TiO2@Au estudiados aumenta linealmente con un
comportamiento de Arrhenius típico.
(e) Las nanopartículas de Au soportadas sobre el TiO2, TiO2@Au, exhiben un mayor
rendimiento catalítico que los coloides de oro estabilizados con citrato, Au@Cit,
(de tamaño similar), tal y como se ha comprobado pela representación de las kobs
en función de la concentración de oro para TiO2@Au y Au@Cit. Lo que indica
que el soporte de TiO2 tiene un papel en el mecanismo de reacción redox elegido.
Probablemente, ocurre una cooperación catalítica del TiO2 y oro por el aumento de
la superficie catalítica, debido a la naturaleza semiconductora del TiO2. Además, el

RESUMEN
132
borohidruro no consigue inyectar electrones en las nanopartículas de TiO2 sin
dopar, ya que, tal como se ha comprobado, los iones de ferrocianuro na presencia
de nanopartículas de TiO2 no se reducen, bajo nuestras condiciones
experimentales. Por eso, son las nanopartículas de oro, en los nanocompuestos de
TiO2@Au, la única especie receptora de los electrones del borohidruro.
Posteriormente, las nanopartículas de titania, debido a su naturaleza
semiconductora, poden aceptar electrones procedentes de las nanopartículas de
oro, cargadas pelo borohidruro, y así actuar también como superficie catalizadora
aumentando, y por lo tanto, la capacidad catalítica de las nanopartículas de oro
suportado en titania, TiO2@Au, se ve incrementado.
(f) El nanocompuesto 2TiO2@Au2 con nanopartículas de oro más pequeñas (1.4 0.5
nm) presenta mayor capacidad catalítica en la reducción de iones hexacianoferrato
(III) por iones borohidruro que el nanocompuesto 1TiO2@Au1 con nanopartículas
de oro mayores (4.5 1.5), tal como se ha comprobado pelos mayores valores de la
constante de velocidad observada para la reacción, normalizada por nanómetro
cuadrado de área superficial de oro, kobsA-1
, (a una misma cantidad de TiO2@Au y
las mismas condiciones de reacción). Probablemente, la pequeña dimensión da las
nanopartículas de oro facilita el contacto con el suporte de titania y la rápida
transferencia de electrones de las nanopartículas de oro, cargadas con electrones
por el borohidruro, para al TiO2.
(g) La elevada densidad de nanopartículas de oro en la superficie del TiO2 en los
nanocompuesto de TiO2@Au disminuí su capacidad catalítica en la reacción redox
modelo en estudio, tal como se hay observado para el nanocompuesto 1TiO2@Au1
con elevada densidad de nanopartículas de oro en la superficie e dentro del
mesocristal de TiO2 comprobada por TEM, HRTEM y por análisis de XPS en
perfiles de profundidad de 30 nm. Se hay propuesto que el aumento de área
superficial libre de las nanopartículas semiconductoras de TiO2, aumenta la
probabilidad de contacto entre los iones de hexacianoferrato (III) y la superficie
del TiO2 y consecuentemente, aumenta a superficie catalítica, que puede ser la del
oro y a del TiO2.
(h) La capacidad catalítica de los nanocompuestos de TiO2@Au no se ve reducida
hasta pelo menos seis ciclos de catálisis, tal y como se comprobado empleando el
mismo catalizador de TiO2@Au en la reacción modelo durante seis ciclos de
catálisis y obteniéndose valores idénticos para la constante observado de reacción,

RESUMEN
133
kobs, en todos los ciclos de catálisis (bajo las mismas condiciones de reacción).
Este hecho demuestra la estabilidad de los nanocompuestos de TiO2@Au durante
la reacción catalizada.
(i) A partir dos resultados cinéticos obtenidos con los nanocompuestos de TiO2@Au,
las nanopartículas de Au estabilizadas en citrato de tamaño similar (mayor valor de
pendiente en la representación del kobs en función de la concentración de oro para
el TiO2@Au que para el Au@Cit, indicando que el titania desempeña un papel en
el mecanismo de reacción), y las nanopartículas de TiO2 (la banda de absorción
característica para el hexacianoferrato (III) a 420 nm é constante con el tiempo na
presencia de nanopartículas de TiO2 tras la adición de borohidruro, indicando una
ineficiente transferencia de electrones del borohidruro para el titanio) en la
reacción redox elegida, se propuso un mecanismo de reacción para el proceso
catalítico que consiste en la:
(a) polarización catódica de las nanopartículas de oro por los iones borohidruro;
(b) transferencia de los electrones de las nanopartículas de oro, cargadas
negativamente, para las nanopartículas semiconductoras de TiO2;
(c) reducción de los iones de hexacianoferrato (III) en la superficie metálica del
oro y/o na superficie semiconductora del TiO2.
3. Se ha analizado la capacidad catalítica del TiO2, utilizando la luz solar como fuente de
irradiación, en la fotoreducción de las especies catiónicas de oro, Au3+
y Au1+
, presentes
en la superficie de TiO2 tras la deposición-precipitación con urea de una sal de Au. Se
ha comprobado, pela aparición de una banda plasmónica a 594 nm en los espectros de
absorción UV-vis-NIR de la dispersión de nanopartículas de TiO2@Au durante la
irradiación con luz solar y pela análisis de XPS antes y después de la fotoreducción (un
único pico de Au 4f7/2, centrado a 83.6 eV, correspondiente a oro metálico), que los
electrones fotoexcitados en la banda de conducción de TiO2, por la luz solar, reducen las
especies catiónicas de oro a especies metálicas, Au0, sobre la superficie del titania.
4. Se ha analizado la eficiencia fotocatalítica de las nanopartículas de TiO2 y de los
nanocompuestos de TiO2@Au en la degradación del colorante textil rodamina B cuando
iluminados con luz solar directa. Estos sistemas, TiO2 y TiO2@Au, actúan como
eficientes fotocatalizadores en la degradación de la rodamina B por irradiación con luz
solar, tal y como se y comprobado, pela disminución gradual de la banda característica
de la rodamina B a 554 nm con el tiempo. Se ha verificado que las nanopartículas de
TiO2 cuando están dopadas con oro presentan un comportamiento cinético más lento en

RESUMEN
134
la fotodegradación de la rodamina B, tal y como se ha comprobado pelos menores
valores de la constante observado de reacción, kobs, de degradación de la rodamina B
bajo irradiación de luz solar, en los nanocompuestos de TiO2@Au (a una misma
cantidad de TiO2@Au/TiO2 y las mismas condiciones de reacción). Tal ocurre,
probablemente, porque el exceso de nanopartículas de oro funciona como centros de
recombinación de carga, o cubre los sitios activos del TiO2, o reduce la profundidad de
penetración de la luz solar. La mayor capacidad fotocatalítica de las nanopartículas de
TiO2 en la degradación de la rodamina B con luz solar puede atribuirse a efectos
sinérgicos como: (i) la presencia de carbono en los nanopartículas de dióxido de titanio
y/o defectos en su red cristalina originados por la presencia de Ti+3
que induce la
absorción de luz visible; (ii) su gran área de superficie, que proporciona más posiciones
de adsorción para la rodamina B; y (iii) su estructura porosa, que permite múltiples
reflexiones de la luz visible en el interior de las nanopartículas de dióxido de titanio, lo
que hace un uso más eficiente de la luz visible.
En general, durante el proceso de investigación que ha llevado al desarrollo de esta
tesis, se ha acumulado experiencia en la optimización de varios métodos de fabricación
de muestras, caracterización y análisis de las propiedades estructurales y ópticas de
diversos materiales, y se ha avanzado un poco en la área de catálisis heterogénea de
nanopartículas de oro suportadas en titania, aumentando el conocimiento de la química
subyacente y permitiendo el diseño de futuros materiales y dispositivos.

135
Acknowledgements
I want to thank to my supervisor, Professor Isabel Pastoriza Santos for her whole support,
guidance, patience, and the background information that provided me during the whole thesis.
I am also thankful to Professor Jorge Pérez-Juste for their support and for sharing their
scientific knowledge and Professor Eulália Pereira for their support and for giving me the
opportunity to work in the REQUIMTE laboratory.
I want to thank all the people that have contributed to the development of my PhD Thesis.
I want to thank to my work colleagues and my students, for their interest in learning concepts
of Nanoscience.
And finally, I want to thank to my family, especially Jorge and Margarida, for her patience,
understanding and support during my PhD study.

136

REFERENCES
137
References
1 Turkevich, J.; Stevenson, P. C.; Hillier, J. J. Phys. Chem. 1953, 57, 670.
2 Rodríguez-Fernández, J.; Pérez-Juste, J.; García de Abajo, F. J.; Liz-Marzán, L. M. Langmuir: the
ACS Journal of Surfaces and Colloids 2006, 22, 7007
3 Mulvaney, P. Langmuir. 1996, 12, 788.
4 Cable, R. E.; Schaak, R. E. Chem. Mater. 2005, 17, 6835.
5 Trügler, A. Optical Properties of Metallic Nanoparticles, PhD thesis, Institut für Physik, Fachbereich
Theoretische Physik, Karl–Franzens: Universität Graz, 2011.
6 Pastoriza-Santos, I.; Liz-Marzán, L. M. J. Mater. Chem. 2008, 18,1724.
7 Liz-Marzán, L. M.; Mulvaney, P. J. Phys. Chem. B 2003, 107, 7312.
8 Hepel, M.; Zhong, C.-J. Functional Nanoparticles for Bioanalysis, Nanomedicine, and Bioelectronic
Devices, Volume 1112, November 26, American Chemical Society, 2012.
9 Rengan, A. K.; Bukhari, A. B.; Pradhan, A.; Malhotra, R.; Banerjee, R.; Srivastava, R.; De, A. Nano
Lett. 2015, 15 (2), 842.
10 Wang, H.; Brandl, D. W.; Le, F.; Nordlander, P.; Halas, N. J. Nano Lett. 2006, 6, 827.
11 Mie, G. Annalen der Physik 1908, 330 (3), 377.
12 Liz-Marzán, L. M.; Kamat, P. V. (Ed.), Nanoscale Materials; Kluwer Academic Publishers: Boston,
2003.
13 Kreibig, U. Phys. B: Condens. Matter Quanta 1978, 31, 39.
14 Meier, M.; Wokaun, A. Opt. Lett. 1983, 8 (11), 581.
15 Liz-Marzán, L. M. Langmuir 2006, 22, (1), 32.
16 Tam, F.; Moran, C.; Halas, N. Journal of Physical Chemistry B 2004, 108 (45), 17290.
17 McFarland, A. D.; Van Duyne, R. P. Nano Letters 2003, 3 (8), 1057.
18 Kamat, P. V. Journal of Physical Chemistry B 2002, 106 (32), 7729.
19 Hirakawa, T.; Kamat, P. V. J. Am. Chem. Soc. 2005, 127 (11), 3928.
20 Henglein, A. Chem. Rev. 1989, 89, 1861.
21 Kamat, P. V. J. Phys. Chem. C 2007, 111, 2834.
22 Hou, W.; Dehm, N. A.; Scott, R. W. J. J. Catal. 2008, 253, 22.
23 Littke, A. F.; Dai, C.; Fu, G. C. J. Am. Chem. Soc. 2000, 122 (17), 4020.
24 Wilson, O. M.; Knecht, M. R.; Garcia-Martinez J. C. J. Am. Chem. Soc. 2006, 128 (14), 4510.

REFERENCES
138
25
Carregal-Romero, S.; Pérez-Juste, J.; Hervés, P.; Liz-Marzán, L. M.; Mulvaney, P. Langmuir 2010,
26 (2), 1271.
26 Mallik, M.; Witcomb, M. J.; Scurrell, M. S. Appl. Phys. A: Mater. Sci. Process. 2005, 80, 797.
27 Freund, T. J. Inorg. Nucl. Chem. 1959, 9, 246.
28 Hervés, P.; Pérez-Lorenzo, M.; Liz-Marzán, L. M.; Dzubiella, J.; Lu, Y.; Ballauff, M. Chem. Soc.
Rev. 2012, 41, 5577.
29 Chatenet, M.; Micoud, F.; Roche, I.; Chainet, E. Electrochim. Acta 2006, 51, 5459.
30 Carregal-Romero, S.; Buurma, N. J.; Perez-Juste, J.; Liz-Marzán, L. M.; Herves, P. Chem. Mater.
2010, 22, 3051.
31 Sanles-Sobrido, M.; Correa-Duarte, M. A.; Carregal-Romero, S.; Rodriguez-Gonzalez, B.;
Alvarez-Puebla, R. A.; Herves P.; Liz- Marzán, L. M. Chem. Mater. 2009, 21, 1531.
32 Zhang, H.; Finnegan, M.; Banfield, J. F. Nano Lett. 2001, 1, 81.
33 Stafford, U.; Gray, K. A.; Kamat, P. V.; Varma, A. Chem. Phys. Lett. 1993, 205, 55.
34 Landmann, M.; Rauls, E.; Schmidt, W. G. J. Phys.: Condens. Matter 2012, 24, 195503.
35 Fujishima, A.; Zhang, X. T.; Tryk, D. A. Surf. Sci. Rep. 2008, 63, 515.
36 Fröschl, T.; Hörmann, U.; Kubiak, P.; Kucerová, G.; Pfanzelt, M.; Weiss, C. K.; Behm, R. J.;
Hüsing, N.; Kaiser, U.; Landfesterd, K.; Wohlfahrt-Mehrens, M. Chem. Soc. Rev. 2012, 41, 5313.
37 Schneider, M.; Baiker, A. J. Mater. Chem. 1992, 2 (6), 587.
38 Niederberger, M.; Bartl, M. H.; Stucky, G. D. Chem. Mater. 2002, 14, 4364.
39 Pottier, A.; Cassaignon, S.; Chanéac, C.; Villain, F.; Tronc, E.; Jolivet, J.-P. J. Mater. Chem. 2003,
13, 877.
40 Li, G. L.; Wang, G. H. Nanostruct. Mater. 1999, 11, 663.
41 Moran, P. D.; Bartlett, J. R.; Bowmaker, G. A.; Woolfrey, J. L.; Cooney, R. P. J. Sol-Gel Sci.
Technol. 1999, 15, 251.
42 Chae, S. Y.; Park, M. K.; Lee, S. K.; Kim, T. Y.; Kim; S. K.; Lee, W. I. Chem. Mater. 2003, 15,
3326.
43 Aruna, S. T.; Tirosh, S.; Zaban, A. J. Mater. Chem. 2000, 10 (10), 2388.
44 Wang, C.-C.; Ying, J. Y. Chem. Mater. 1999, 11, 3113.
45 Ye, J.; Liu, W.; Cai, J.; Chen, S.; Zhao, X.; Zhou, H.; Qi, L. J. Am. Chem. Soc. 2011, 133, 933.
46 Wu, J. M.; Hayakawa, S.; Tsuru, K.; Osaka, A. Scripta Mater. 2002, 46, 101.
47Wu, J. J.; Yu, C. C. J. Phys. Chem. B 2004, 108, 3377.
48 Ma, G.; Zhao, X.; Zhu, J. Int. J. of Mod. Phys. B 2005, 19, 2763.

REFERENCES
139
49
Yu, J. C.; Yu, J.; Ho, W.; Zhang, L. Chem. Commun. 2001, 1942.
50 Mohapatra, S. K.; Kondamudi, N.; Banerjee, S.; Misra, M. Langmuir 2008, 24, 11276.
51 Liu, S.; Huang, K. Sol. Energy Mater.& Sol. Cells 2004, 85, 125.
52 Mo, S.-D.; Ching, W. Y. Phys. Rev. B 1995, 51 (19), 13023.
53 Kang, S. H.; Lim, J.-W.; Kim, H. S.; Kim, J.-Y.; Chung, Y.-H.; Sung, Y.-E. Chem. Mater. 2009, 21,
2777.
54 Smyth, J. R. and Mccormick, T. C. Crystallographic Data for Minerals, in Mineral Physics &
Crystallography: A Handbook of Physical Constants; Ahrens, T. J. (Ed), American Geophysical
Union: Washington, D. C., 2013.
55 Hanaor, D. A. H.; Sorrell, C. C. J. Mater. Sci. 2011, 46, 855.
56 Fisher J.; Egerton T. A. Titanium Compounds, Inorganic. In Kirk-Othmer Encyclopedia of
Chemical Technology. New York: John Wiley & Sons, 2001.
57 Brayner, R.; Fiévet, F.; Coradin, T. (Eds.) Nanomaterials: A Danger or a Promise? A Chemical and
Biological Perspective; Springer-Verlag: London, 156, 2013.
58 Zallen, R.; Moret, M. P. Solid State Communications 2006, 137 (3), 154.
59 Linsebigler, A. L.; Lu, G. Q.; Yates, J. T. Chem Rev, 1995, 95, 735.
60 Ohno, T.; Sarukawa, K.; Matsumura, M. J. Phys. Chem. B 2001, 105, 2417.
61 Hidalgo, M. C.; Murcia, J. J.; Navio, J. A.; Colon, G. Applied catalysis A: General 2011, 397, 112.
62 Hutchings, G. J.; Haruta, M. Appl. Catal. A 2005, 291, 2.
63 Buso, D.; Pacifico, J.; Martucci, A.; Mulvaney, P. Adv. Funct. Mater. 2007, 17 (3), 347.
64 Haruta, M.; Tsubota, S.; Kobayashi, T.; Kageyama, H.; Genet, M. J.; Delmon, B. J. of Catal. 1993,
144 (1), 175.
65 Lin, S.; Vannice, M. A. Catal. Lett. 1991, 10, 47.
66 Zanella, R.; Giorgio, S.; Henry, C. R.; Louis, C. J. Phys. Chem. B 2002, 106, 7634.
67 Tsubota, S.; Haruta, M.; Kobayashi, T.; Ueda, A.; Nakahara, Y. Stud. Surf. Sci. Catal. 1991, 72,
695.
68 Sangeetha, P.; Chang, L.-H.; Chen Y.-W. Materials Chemistry and Physics 2009, 118, 181.
69 Wen, Y.; Liu, B.; Zeng, W.; Wang, Y. Nanoscale 2013, 5, 9739.
70 Hermans, L. A. M.; Geus, J. W. Stud. Surf. Sci. Catal. 1979, 4, 113.
71 Hidalgo, M. C.; Maicu, M.; Navió, J. A.; Colón, G. J. Phys. Chem. C 2009, 113, 12840.
72 Guillemot, D.; Polisset-Thfoin, M.; Fraissard, J. Catal. Lett. 1996, 41, 143.

REFERENCES
140
73
Guillemot, D.; Borovskov, V. Y.; Kazansky, V. B.; Polisset-Thfoin, M.; Fraissard, J. J. Chem. Soc.,
Faraday Trans. 1997, 93, 3587.
74 Hosseini, M.; Momeni, M. M.; Faraji, M. J. Mol. Catal. A: Chem. 2011, 335, 199.
75 Nguyen, L. Q.; Salim, C.; Hinode, H. Applied Catalysis A: General 2008, 347, 94.
76 Chen, S. F.; Li, J. P.; Qian, K.; Xu, W. P.; Lu, Y.; Huang, W. X.; Yu, S. H. Nano Res 2010, 3, 244.
77 Tsubota, S.; Cunningham, D. A. H.; Bando, Y.; Haruta, M. Stud. Surf. Sci. Catal. 1995, 91, 227.
78 Haruta, M. J. New Mater. Electrochem. Syst. 2004, 7, 163.
79 Zanella, R.; Delannoy, L.; Louis, C. Appl. Catal. A 2005, 291, 62.
80 Haruta, M. Catal. Today 1997, 36, 153.
81 Thompson, D. T. Gold Bull. 1998, 31, 111.
82 Hayashi, T.; Tanaka, K.; Haruta, M. J. Catal. 1998, 178, 566.
83 Sakurai, H.; Haruta, M. Catal. Today 1996, 29, 361.
84 Ueda, M.; Haruta, M. Appl. Catal. B 1998, 18, 115.
85 Haruta, M.; Kobayashi, T.; Sano, H.; Yamada, N. Chem. Lett. 1987, 16, 405.
86 Valden, M.; Pak, S.; Lai, X.; Goodman, D. W. Catal. Letters 1998, 56, 7.
87 Mills, G.; Gordon, M. S.; Metiu, H. J. Chem. Phys. 2003, 118, 4198.
88 Cleveland, C. L.; Landman, U.; Schaaff, T. G.; Shafigullin, M. N.; Stephens, P. W.; Whetten, R. L.
Phys. Rev. Lett. 1997, 79, 1873.
89 Horsley, J. A. J Am. Chem. Soc. 1979, 101 (11), 2870.
90 Gluhoi, A. C.; Bogdanchikova, N.; Nieuwenhuys, B. E. J. Catal. 2005, 232 (1) 96.
91 Schubert, M. M.; Hackenberg, S.; Veen, A. C. v.; Muhler, M.; Plzak, V.; Behm, R. J. J. of Catal.
2001, 197, 113.
92 Liu, H., Kozlov, A. I.; Kozlova, A. P.; Shido, T.; Asakura, K., Iwasawa, Y. J. of Catal. 1999, 185
(2), 252.
93 Park, E. D.; Lee, I. S. J. of Catal. 1999, 186, 1.
94 Hodge, N. A.; Kiely, C. J.; Whyman, R.; Siddiqui, M. R. H.; Hutchings, G. J.; Pankhurst, Q. A.;
Wagner, F. E.; Rajaram, R. R.; Golunski, S. E. Catalysis Today 2002, 72, 133.
95 Kolasinski, K. Surface Science: Foundations of Catalysis and Nanoscience; John Wiley and Sons
Ltd.:London, 2002.
96 Wardle, B. Principles and Applications of Photochemistry, John Wiley & Sons, Ltd: United
Kingdom, 2009.

REFERENCES
141
97
Mandal, S. S.; Bhattacharyya, A. J. J. Chem. Sci. 2012, 124 (5), 969.
98 Hurum, D. C.; Gray, K. A.; Rajh, T.; Thurnauer, M. C. J. Phys. Chem. B, 2005, 109 (2), 977.
99 Hoffmann, M. R.; Martin, S. T.; Choi, W.; Bahnemann, D. W. Chem Rev. 1995, 95, 69.
100 Fujishima, A.; Rao, T. N.; Tryk, D. A. J. Photochem. Photobiol. C 2000, 1, 1.
101 Tojo, S.; Tachikawa, T.; Fujitsuka; M.; Majima, T. J. Phys. Chem. C 2008, 112 (38), 14948.
102 Wang, X.; Caruso, R. A. J. Mater. Chem. 2011, 21, 20.
103 Henderson, M. A. Surface Science Reports 2011, 66, 185.
104 Serpone, N.; Borgarello, E.; Graetzel, M. J. Chem. Soc., Chem. Commun. 1984, 342.
105 Seh, Z. W.; Liu, S.; Low, M.; Zhang, S.-Y.; Liu, Z.; Mlayah, A.; Han, M.-Y. Advanced Materials
2012, 24 (17), 2310.
106 Christopher, P.; Ingram, D. B.; Linic, S. J. Phys. Chem. C 2010, 114 (19), 9173.
107 Furube, A.; Du, L.; Hara, K.; Katoh, R.; Tachiya, M .J. Am. Chem. Soc. 2007, 129, 14852.
108 McFarland, E. W.; Tang, J. Nature 2003, 421, 616.
109 Sellappan, R. Mechanisms of Enhanced Activity of Model TiO2/Carbon and TiO2/Metal
Nanocomposite Photocatalysts; Phd Thesis, Department of Applied Physics, Chalmers University of
Technology, Göteborg, Sweden, 2013.
110 Liz-Marzán, L. M. Materials Today February 2004; 26.
111 Pérez-Juste, J.; Pastoriza-Santos, I.; Liz-Marzán, L. M.; Mulvaney. P. Coord. Chem. Rev. 2005,
249,1870.
112 Sánchez-Iglesias, A.; Pastoriza-Santos, I.; Pérez-Juste, J.; Rodríguez-González, B.; García de
Abajo, F. J.; Liz-Marzán. L. M. Adv. Mater. 2006, 18, 2529.
113 McConnell, W. P.; Novak, J. P.; Brousseau, L. C.; Fuierer, R. R.; Tenent, R. C.; Feldheim, D. L. J.
Phys. Chem. B 2000, 104, 8925.
114 Kondapaneni, S. C.; Singh, D.; Srivastava O. N. J. Phys. Chem. 1992, 96, 8094.
115 Stergiopoulos, T.; Arabatzis, I. M.; Katsaros, G.; Falaras, P. Nano Letters 2002, 2, 1259.
116 Lin, Cheng-Lan; Yeh, Mei-Yu; Chen, Chih-Hsien; Sudhakar, S.; Luo, Shr-Jie; Hsu, Ying-Chan;
Huang, Chung-Yi; Ho, Kuo-Chuan; Luh, Tien-Yau Chem. Mater. 2006, 18, 415.
117 Dagan, G.; Tomkiewicz, M. J. Phys. Chem. 1997, 49, 12652.
118 Rideh, L.; Wehrer, A.; Ronze, D.; Zoulalian, A. Ind. Eng. Chem. Res. 1997, 36, 4712.
119 Ranjit, K. T.; Willner, I.; Bossmann, S.; Braun, A. J. Phys. Chem. B 1998, 102, 9397.
120 Goutailler, G.; Guillard, C.; Faure, R.; Païssé, O. J. Agric. Food Chem. 2002, 50, 5115.

REFERENCES
142
121
Mills, A.; Crow, M.; Wang, J.; Parkin, I. P.; Boscher, N. J. Phys. Chem. C 2007, 111, 5520.
122 Zhu, Y.; Shi, J.; Zhang, Z.; Zhang, C.; Zhang, X. Anal. Chem. 2002, 74, 120.
123Du, X.; Wang, Y.; Mu, Y.; Gui, L; Wang, P.; Tang, Y. Chem. Mater. 2002, 14, 3953.
124 Lobato, K.; Peter, L. M. J. Phys. Chem. B 2006, 110, 21920.
125 Stallings, W. E.; Lamb, H. H. Langmuir 2003, 19, 2989.
126 Murakami, Y.; Matsumoto, T.; Takasu, Y. J. Phys. Chem. B 1999, 103, 1836.
127 Pastoriza-Santos, I.; Koktysh, D. S.; Mamedov, A. A.; Giersig, M.; Kotov, N. A.; Liz-Marzán, L.
M. Langmuir 2000, 16, 2731.
128 Tom, R. T.; Nair, A. S.; Singh, N.; Aslam, M.; Nagendra, C. L.; Philip, R.; Vijayamohanan, K.;
Pradeep, T. Langmuir 2003, 19, 3439.
129 Kreibig, U.; Vollmer, M. Optical Properties of Metal Clusters. Springer: Berlin, 1995.
130 Zhang, J. H.; Wang, S. Z.; Liu, J. B.; Wang, Z. L.; Ming, N. B. J. Mater. Res. 2005, 20, 965.
131 Mayya, K. S.; Gittins, D. I.; Caruso, F. Chem. Mater 2001, 13, 3833.
132 Hanprasopwattana, A.; Rieker, T.; Sault, A. G.; Datye, A. K. Catal. Lett. 1997, 45, 165.
133 Möckel, H.; Giersig, M.; Willig, F. J. Mater. Chem. 1999, 9, 3051.
134 Pattanaik, M.; Bhaumik, S. k. Mater. Lett. 2000, 44, 352.
135 Smith, J. N.; Meadows, J.; Williams, P. A. Langmuir 1996, 12, 3773.
136 Esumi, K.; Matsui, H. Colloid Surf., A: Physicochem. Eng. Asp. 1993, 80, 273.
137 Otsuka, H.; Esumii, H. J. Colloid Interface Sci. 1995, 170, 113.
138 Pastoriza-Santos, I.; Pérez-Juste, J.; Liz-Marzán, L. M. Chem. Mater. 2006, 18, 2465.
139 Decher, G. Science 1997, 277, 1232.
140 Gittins, D. I.; Caruso, F. J. Phys. Chem. B 2001, 105, 6846.
141 Enüstün, B. V.; Turkevich, J. J. Am. Chem Soc. 1963, 85, 3317.
142 Pastoriza-Santos, I.; Liz-Marzán, L Langmuir 2002, 18, 2888.
143 Sakai, H.; Kanda, T.; Shibata, H.; Ohkubo, T.; Abe, M. J. Am. Chem Soc. 2006, 128, 4944.
144 Kelly, K. L.; Coronado, E.; Zhao L. L.; Schatz, G. C. J. Phys. Chem. B 2003, 107, 668.
145 Lee, S.; Rhee, Sung-Gyu.; Oh, Soo-Ghee J. Korean Phys. Soc. 1999, 34, 319.
146 Underwood, S.; Mulvaney, P. Langmuir 1994, 10, 3427.
147 Song, R.-Q.; Cölfen, H. Adv. Mater. 2010, 22, 1301.

REFERENCES
143
148
Zhou, L.; O'Brien, P. Small 2008, 4, 1566.
149 Fang, J.; Ding, B.; Gleiter, H. Chem. Soc. Rev. 2011, 40, 5347.
150 Zhou, L.; O’Brien, P. J. Phys. Chem. Lett. 2012, 3, 620.
151 Rolison, D. R. Science 2003, 299, 1698.
152 Edwards, J. K.; Carley, A. F.; Herzing, A. A.; Kiely, C. J.; Hutchings, G. J., Faraday Discuss.
2008, 138, 225.
153 Kesavan, L.; Tiruvalam, R.; Ab, R. M. H.; bin, S. M. I.; Enache, D. I.; Jenkins, R. L.; Dimitratos,
N.; Lopez-Sanchez, J. A.; Taylor, S. H.; Knight, D. W.; Kiely, C. J.; Hutchings, G. J. Science 2011,
331 (6014), 195.
154 Enache, D. I.; Edwards, J. K.; Landon, P.; Solsona-Espriu, B.; Carley, A. F.; Herzing, A. A.;
Watanabe, M.; Kiely, C. J.; Knight, D. W.; Hutchings, G. J. Science 2006, 311 (5759), 362.
155 Bamwenda, G. R.; Tsubota, S.; Nakamura, T.; Haruta, M. Catal. Lett. 1997, 44, 83.
156 Jong, K. P. Synthesis of Solid Catalysts; WILEY-VCH Verlag GmbH & Co. KGaA: Weinheim,
2009.
157 Nechayev, Y. A.; Zvonareva, G. V. Geokhimiya 1983, 6, 919.
158 Moreau, F.; Bond, G. C.; Taylor, A. O. Journal of Catalysis 2005, 231, 105.
159 Yu, J. C.; Yu, J..; Ho, W.; Jiang, Z.; Zhang, L. Chem. Mater. 2002, 14, 3808.
160 Santara, B.; Giri, P. K. Materials Chemistry and Physics 2013, 137, 928.
161 Morgan, B. J.; Watson, G. W. Journal of Physical Chemistry C 2009,113 (17), 7322.
162 Henrich, V. E.; Dresselhaus, G.; Zeiger, H. J. Physical Review Letters 1976, 36, 1335.
163 Yu, J.; Dai, G.; Xiang, Q., Jaroniec, M. J. Mater. Chem. 2011, 21, 1049.
164 Chen, X.; Mao, S. S. Chem. Rev. 2007, 107, 2891.
165 Nie, X.; Zhuo, S.; Maeng, G.; Sohlberg, K. International Journal of Photoenergy 2009, 1.
166 Nagaveni, K.; Sivalingam, G.; Hegde, M. S.; Madras, G. Applied Catalysis B: Environmental 2004,
48, 83.
167 Gu, D.-e.; Lu, Y.; Yang, B.-c.; Hu, Y.-d. Chem. Commun. 2008, 2453.
168Wu, X.; Yin, S.; Dong, Q.; Guo, C.; Li, H.; Kimura, T.; Sato, T. Applied Catalysis B:
Environmental 2013, 142–143, 450.
169 Moulder, J. F.; Stickle, W. F.; Sobol, P. E.; Bomben, K. D. Handbook of X-Ray Photoelectron
Spectroscopy, Physical Electronics, Inc., Eden Prairie, MN, USA, 1995.
170 Kormann, C.; Bahnemann, D. W.; Hoffmann, M. R. The Journal of Physical Chemistry 1988, 92,
5196.

REFERENCES
144
171
Zuo, F.; Wang, L.; Wu, T.; Zhang, Z.; Borchardt, D.; Feng, P. Journal of the American Chemical
Society 2010, 132, 11856.
172 IUPAC J. Colloid Interface Chem.; Pure Appl. Chem. 1972, 31, 578.
173 Corma, A., Garcia, H. Chem. Soc. Rev. 2008, 37, 2096.
174 Hashmi, A.S.K., Hutchings, G.J., Angew. Chem. Int. Ed. 2006, 45, 7896.
175 Carregal-Romero, S.; Catalytic Activity of Gold Nanoparticles and Other Colloidal
Nanocomposites on a Model Redox Reaction; PhD Thesis, Universidade de Vigo: Vigo, 2009.
176 Ismail, A. A.; Kandiel, T. A.; Bahnemann, D. W. J. Photochem. and Photobiol. A: Chemistry 2010,
216, 183.
177 Ismail, A. A.; Bahnemann, D. W.; Robben, L.; Yarovyi, V.; Wark, M. Chem. Mater. 2010, 22, 108.
178 Li, H.; Bian, Z.; Zhu, J.; Huo, Y.; Li, H.; Lu, Y. J. Am. Chem. Soc. 2007, 129, 4538.
179 Zhang, L.; Yu, J. C. Chem. Commun. 2003, 2078.
180 Haroa, M.; Abargues, R.; Herraiz-Cardona, I.; Martínez-Pastor, J.; Giménez, S. Electrochimica
Acta 2014, 144, 64.
181 Kiyonaga, T.; Fujii, M.; Akita, T.; Kobayashic, H.; Tada, H. Phys. Chem. Chem. Phys. 2008, 10,
6553.
182 Subramanian, V., Photoelectrochemical and Photocatalytic Aspects of Semiconductor–Metal
Nanocomposites; PhD Thesis, Notre Dame: Indiana, 2004.
183 Fujishima, A.; Honda, K. Nature, 1972, 238, 37.
184 Asahi, R.; Morikawa, T.; Ohwaki, T.; Aoki, K.; Taga, Y. Science 2001, 293, 269.
185 Kamisaka, H.; Adachi, T.; Yamashita, K. J. Chem. Phys. 2005, 123, 84704.
186 Valentin, C. D.; Pacchioni, G.; Selloni, A. Chem. Mater. 2005, 17, 6656.
187 Hamal, D. B.; Klabunde, K. J. J. Colloid Interface Sci. 2007, 311, 514.
188 Huang, Y.; Ho, W. K.; Lee, S. C.; Zhang, L. Z.; Li, G. S.; Yu, J. C. Langmuir 2008, 24, 3510.
189 Irie, H.; Watanabe, Y.; Hashimoto, K. Chem. Lett. 2003, 32, 772.
190 Wu, Z. B.; Dong, F.; Zhao, W. R.; Wang, H. Q.; Liu, Y.; Guan, B. H. Nanotechnology 2009, 20,
235701.
191 Silva, C. G.; Juárez, R.; Marino, T.; Molinari, R. Garcia, H. J. Am. Chem. Soc. 2012, 134, 6309.
192 Zheng, Z.; Huang, B.; Qin, X.; Zhang, X.; Daib, Y.; Whangbo, M.-H. J. Mater. Chem. 2011, 21,
9079.
193 Primo, A.; Marino, T.; Corma, A.; Molinari, R.; Garcia, H. J. Am. Chem. Soc. 2011, 133, 6930.

REFERENCES
145
194
Deepa, J.; Christopher, M. S.; Sadhana, S. R.; Khadga, M. S.; Kenneth, J. K. International Journal
of Photoenergy 2013, 2013.
195 Yang, S.-y.; Chen, Y.-x.; Lou, L.-p.; Wi, X.-n. Journal of Environmental Sciences 2005, 17, 761.
196 Kuvarega, A. T.; Krause, R. W. M.; Mamba, B. B. J. Phys. Chem. C 2011, 115, 22110.
197 Yang, J.; Chen, C.; Ji, H.; Ma, W.; Zhao, J. J. Phys. Chem. B 2005, 109, 21900.
198 Ge, L.; Han, C. C.; Liu, J.; Li, Y. F. Appl. Catal. A: Gen. 2011, 409-410, 215.
199 Yu, J.; Dai, G.; Huang, B. J. Phys. Chem. C. 2009, 113, 16394.
200 Chen, C.; Ma, W.; Zhao, J. Chem. Soc. Rev. 2010, 39, 4206.