From Nobel Prize to Project Management: Getting Risks Right
12
5 AUGUST 2006 P ROJECT MANAGEMENT J OURNAL F ROM NOBEL PRIZE TO PROJECT MANAGEMENT : GETTING RISKS RIGHT A major source of risk in project manage- ment is inaccurate forecasts of project costs, demand, and other impacts. The paper presents a promising new approach to mitigating such risk based on theories of decision-making under uncertainty, which won the 2002 Nobel Prize in economics. First, the paper docu- ments inaccuracy and risk in project man- agement. Second, it explains inaccuracy in terms of optimism bias and strategic misrepresentation. Third, the theoretical basis is presented for a promising new method called “reference class forecast- ing,” which achieves accuracy by basing forecasts on actual performance in a ref- erence class of comparable projects and thereby bypassing both optimism bias and strategic misrepresentation. Fourth, the paper presents the first instance of practical reference class forecasting, which concerns cost forecasts for large transportation infrastructure projects. Finally, potentials for and barriers to ref- erence class forecasting are assessed. Keywords: risk management; project forecasting; forecast models ©2006 by the Project Management Institute Vol. 37, No. 3, 5-15, ISSN 8756-9728/03 The American Planning Association Endorses Reference Class Forecasting I n April 2005, based on a study of inaccuracy in demand forecasts for public works projects by Flyvbjerg, Holm, and Buhl (2005), the American Planning Association (APA) officially endorsed a promising new forecasting method called “reference class forecasting” and made the strong recommendation that planners should never rely solely on conventional forecasting techniques when making forecasts: APA encourages planners to use reference class forecasting in addition to traditional methods as a way to improve accuracy. The reference class fore- casting method is beneficial for non-routine projects... Planners should never rely solely on civil engineering technology as a way to generate project fore- casts (American Planning Association, 2005). Reference class forecasting is based on theories of decision-making under uncertainty that won Princeton psychologist Daniel Kahneman the Nobel prize in economics in 2002 (Kahneman, 1994; Kahneman & Tversky, 1979a; 1979b). Reference class forecasting promises more accuracy in forecasts by taking a so- called “outside view” on prospects being forecasted, while conventional forecast- ing takes an inside view. The outside view on a given project is based on knowledge about actual performance in a reference class of comparable projects. Where Flyvbjerg, Holm, and Buhl (2005) briefly outlined the idea of reference class forecasting, this paper presents the first instance of reference class forecasting in practical project management. The emphasis will be on transportation project management, because this is where the first instance of reference class forecasting occurred. It should be mentioned at the outset, however, that comparative research shows that the problems, causes, and cures identified for transportation apply to a wide range of other project types, including concert halls, museums, sports are- nas, exhibit and convention centers, urban renewal, power plants, dams, water projects, IT systems, oil and gas extraction projects, aerospace projects, new pro- duction plants, and the development of new products and new markets (Altshuler & Luberoff, 2003; Flyvbjerg, 2005; Flyvbjerg, Bruzelius, & Rothengatter, 2003, pp. 18–19; Flyvbjerg, Holm, & Buhl, 2002, p. 286). BENT FLYVBJERG, Aalborg University, Denmark ABSTRACT
Transcript of From Nobel Prize to Project Management: Getting Risks Right

5AU G U S T 2006 PR O J E C T MA N A G E M E N T JO U R N A L
FROM NOBEL PRIZE TO PROJECTMANAGEMENT: GETTING RISKS RIGHT
A major source of risk in project manage-
ment is inaccurate forecasts of project
costs, demand, and other impacts. The
paper presents a promising new
approach to mitigating such risk based
on theories of decision-making under
uncertainty, which won the 2002 Nobel
Prize in economics. First, the paper docu-
ments inaccuracy and risk in project man-
agement. Second, it explains inaccuracy
in terms of optimism bias and strategic
misrepresentation. Third, the theoretical
basis is presented for a promising new
method called “reference class forecast-
ing,” which achieves accuracy by basing
forecasts on actual performance in a ref-
erence class of comparable projects and
thereby bypassing both optimism bias
and strategic misrepresentation. Fourth,
the paper presents the first instance of
practical reference class forecasting,
which concerns cost forecasts for large
transportation infrastructure projects.
Finally, potentials for and barriers to ref-
erence class forecasting are assessed.
Keywords: risk management; project
forecasting; forecast models
©2006 by the Project Management Institute Vol. 37, No. 3, 5-15, ISSN 8756-9728/03
The American Planning Association Endorses Reference Class Forecasting
In April 2005, based on a study of inaccuracy in demand forecasts for publicworks projects by Flyvbjerg, Holm, and Buhl (2005), the American PlanningAssociation (APA) officially endorsed a promising new forecasting method
called “reference class forecasting” and made the strong recommendation thatplanners should never rely solely on conventional forecasting techniques whenmaking forecasts:
APA encourages planners to use reference class forecasting in addition totraditional methods as a way to improve accuracy. The reference class fore-casting method is beneficial for non-routine projects... Planners should neverrely solely on civil engineering technology as a way to generate project fore-casts (American Planning Association, 2005).Reference class forecasting is based on theories of decision-making under
uncertainty that won Princeton psychologist Daniel Kahneman the Nobel prize ineconomics in 2002 (Kahneman, 1994; Kahneman & Tversky, 1979a; 1979b).Reference class forecasting promises more accuracy in forecasts by taking a so-called “outside view” on prospects being forecasted, while conventional forecast-ing takes an inside view. The outside view on a given project is based onknowledge about actual performance in a reference class of comparable projects.
Where Flyvbjerg, Holm, and Buhl (2005) briefly outlined the idea of referenceclass forecasting, this paper presents the first instance of reference class forecastingin practical project management. The emphasis will be on transportation projectmanagement, because this is where the first instance of reference class forecastingoccurred. It should be mentioned at the outset, however, that comparative researchshows that the problems, causes, and cures identified for transportation apply toa wide range of other project types, including concert halls, museums, sports are-nas, exhibit and convention centers, urban renewal, power plants, dams, waterprojects, IT systems, oil and gas extraction projects, aerospace projects, new pro-duction plants, and the development of new products and new markets (Altshuler& Luberoff, 2003; Flyvbjerg, 2005; Flyvbjerg, Bruzelius, & Rothengatter, 2003, pp.18–19; Flyvbjerg, Holm, & Buhl, 2002, p. 286).
BENT FLYVBJERG, Aalborg University, Denmark
ABSTRACT
6 AU G U S T 2006 PR O J E C T MA N A G E M E N T JO U R N A L
Inaccuracy in Forecasts
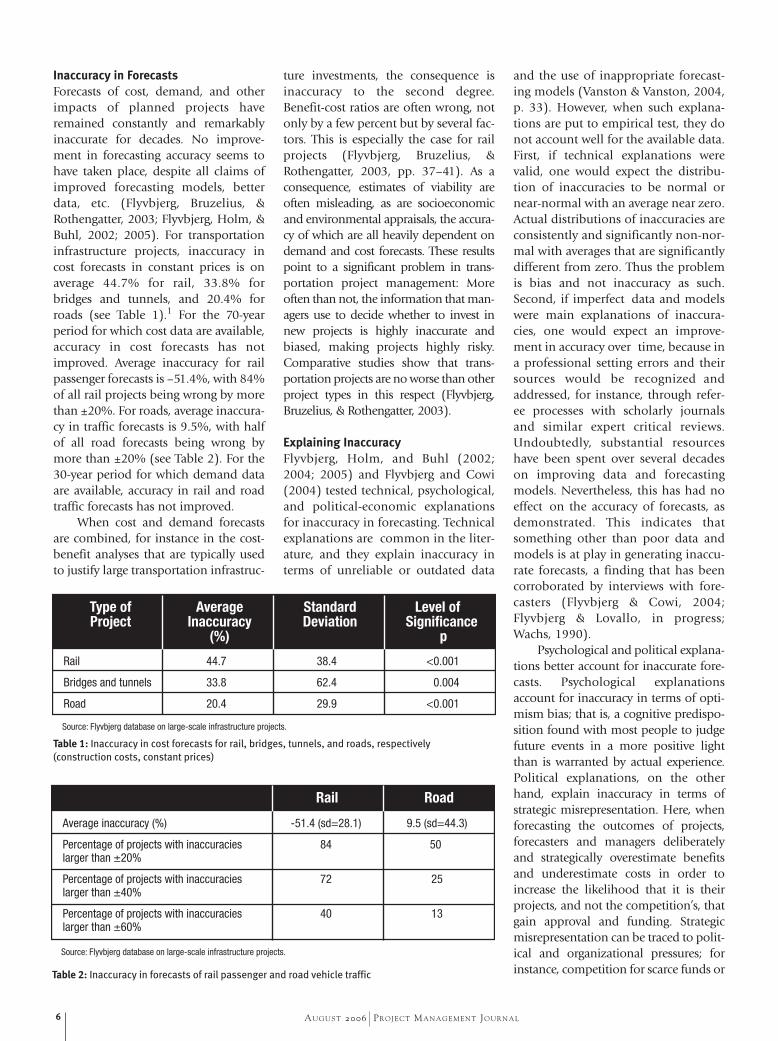
Forecasts of cost, demand, and otherimpacts of planned projects haveremained constantly and remarkablyinaccurate for decades. No improve-ment in forecasting accuracy seems tohave taken place, despite all claims ofimproved forecasting models, betterdata, etc. (Flyvbjerg, Bruzelius, &Rothengatter, 2003; Flyvbjerg, Holm, &Buhl, 2002; 2005). For transportationinfrastructure projects, inaccuracy incost forecasts in constant prices is onaverage 44.7% for rail, 33.8% forbridges and tunnels, and 20.4% forroads (see Table 1).1 For the 70-yearperiod for which cost data are available,accuracy in cost forecasts has notimproved. Average inaccuracy for railpassenger forecasts is –51.4%, with 84%of all rail projects being wrong by morethan ±20%. For roads, average inaccura-cy in traffic forecasts is 9.5%, with halfof all road forecasts being wrong bymore than ±20% (see Table 2). For the30-year period for which demand dataare available, accuracy in rail and roadtraffic forecasts has not improved.
When cost and demand forecastsare combined, for instance in the cost-benefit analyses that are typically usedto justify large transportation infrastruc-
ture investments, the consequence isinaccuracy to the second degree.Benefit-cost ratios are often wrong, notonly by a few percent but by several fac-tors. This is especially the case for railprojects (Flyvbjerg, Bruzelius, &Rothengatter, 2003, pp. 37–41). As aconsequence, estimates of viability areoften misleading, as are socioeconomicand environmental appraisals, the accura-cy of which are all heavily dependent ondemand and cost forecasts. These resultspoint to a significant problem in trans-portation project management: Moreoften than not, the information that man-agers use to decide whether to invest innew projects is highly inaccurate andbiased, making projects highly risky.Comparative studies show that trans-portation projects are no worse than otherproject types in this respect (Flyvbjerg,Bruzelius, & Rothengatter, 2003).
Explaining Inaccuracy
Flyvbjerg, Holm, and Buhl (2002;2004; 2005) and Flyvbjerg and Cowi(2004) tested technical, psychological,and political-economic explanationsfor inaccuracy in forecasting. Technicalexplanations are common in the liter-ature, and they explain inaccuracy interms of unreliable or outdated data
and the use of inappropriate forecast-ing models (Vanston & Vanston, 2004,p. 33). However, when such explana-tions are put to empirical test, they donot account well for the available data.First, if technical explanations werevalid, one would expect the distribu-tion of inaccuracies to be normal ornear-normal with an average near zero.Actual distributions of inaccuracies areconsistently and significantly non-nor-mal with averages that are significantlydifferent from zero. Thus the problemis bias and not inaccuracy as such.Second, if imperfect data and modelswere main explanations of inaccura-cies, one would expect an improve-ment in accuracy over time, because ina professional setting errors and theirsources would be recognized andaddressed, for instance, through refer-ee processes with scholarly journalsand similar expert critical reviews.Undoubtedly, substantial resourceshave been spent over several decadeson improving data and forecastingmodels. Nevertheless, this has had noeffect on the accuracy of forecasts, asdemonstrated. This indicates thatsomething other than poor data andmodels is at play in generating inaccu-rate forecasts, a finding that has beencorroborated by interviews with fore-casters (Flyvbjerg & Cowi, 2004;Flyvbjerg & Lovallo, in progress;Wachs, 1990).
Psychological and political explana-tions better account for inaccurate fore-casts. Psychological explanationsaccount for inaccuracy in terms of opti-mism bias; that is, a cognitive predispo-sition found with most people to judgefuture events in a more positive lightthan is warranted by actual experience.Political explanations, on the otherhand, explain inaccuracy in terms ofstrategic misrepresentation. Here, whenforecasting the outcomes of projects,forecasters and managers deliberatelyand strategically overestimate benefitsand underestimate costs in order toincrease the likelihood that it is theirprojects, and not the competition’s, thatgain approval and funding. Strategicmisrepresentation can be traced to polit-ical and organizational pressures; forinstance, competition for scarce funds or
Rail 44.7 38.4 <0.001
Bridges and tunnels 33.8 62.4 0.004
Road 20.4 29.9 <0.001
Type of Average Standard Level of Project Inaccuracy Deviation Significance (%) p
Source: Flyvbjerg database on large-scale infrastructure projects.
Table 1: Inaccuracy in cost forecasts for rail, bridges, tunnels, and roads, respectively
(construction costs, constant prices)
Average inaccuracy (%) -51.4 (sd=28.1) 9.5 (sd=44.3)
Percentage of projects with inaccuracies 84 50 larger than ±20%
Percentage of projects with inaccuracies 72 25larger than ±40%
Percentage of projects with inaccuracies 40 13larger than ±60%
Rail Road
Source: Flyvbjerg database on large-scale infrastructure projects.
Table 2: Inaccuracy in forecasts of rail passenger and road vehicle traffic
7AU G U S T 2006 PR O J E C T MA N A G E M E N T JO U R N A L
ation. Human judgment, includingforecasts, is biased. Reference classforecasting is a method for unbiasingforecasts.
Kahneman and Tversky (1979a;1979b) found human judgment to begenerally optimistic due to overconfi-dence and insufficient regard to distri-butional information. Thus, peoplewill underestimate the costs, comple-tion times, and risks of plannedactions, whereas they will overestimatethe benefits of the same actions.Lovallo and Kahneman (2003, p. 58)call such common behavior the “plan-ning fallacy” and argue that it stemsfrom actors taking an “inside view,”focusing on the constituents of thespecific planned action rather than onthe outcomes of similar already-com-pleted actions. Kahneman and Tversky(1979b) argued that the prevalent ten-dency to underweigh or ignore distrib-utional information is perhaps themajor source of error in forecasting.“The analysts should therefore makeevery effort to frame the forecastingproblem so as to facilitate utilizing allthe distributional information that isavailable,” say Kahneman and Tversky(1979b, p. 316). This may be consid-ered the single most important piece ofadvice regarding how to increase accu-racy in forecasting through improvedmethods. Using such distributionalinformation from other ventures simi-lar to that being forecasted is called
jockeying for position. Optimism biasand strategic misrepresentation bothinvolve deception, but where the latter isintentional—i.e., lying—the first is not.Optimism bias is self-deception.Although the two types of explanationare different, the result is the same: inac-curate forecasts and inflated benefit-costratios. However, the cures for optimismbias are different from the cures forstrategic misrepresentation, as we willsee next.
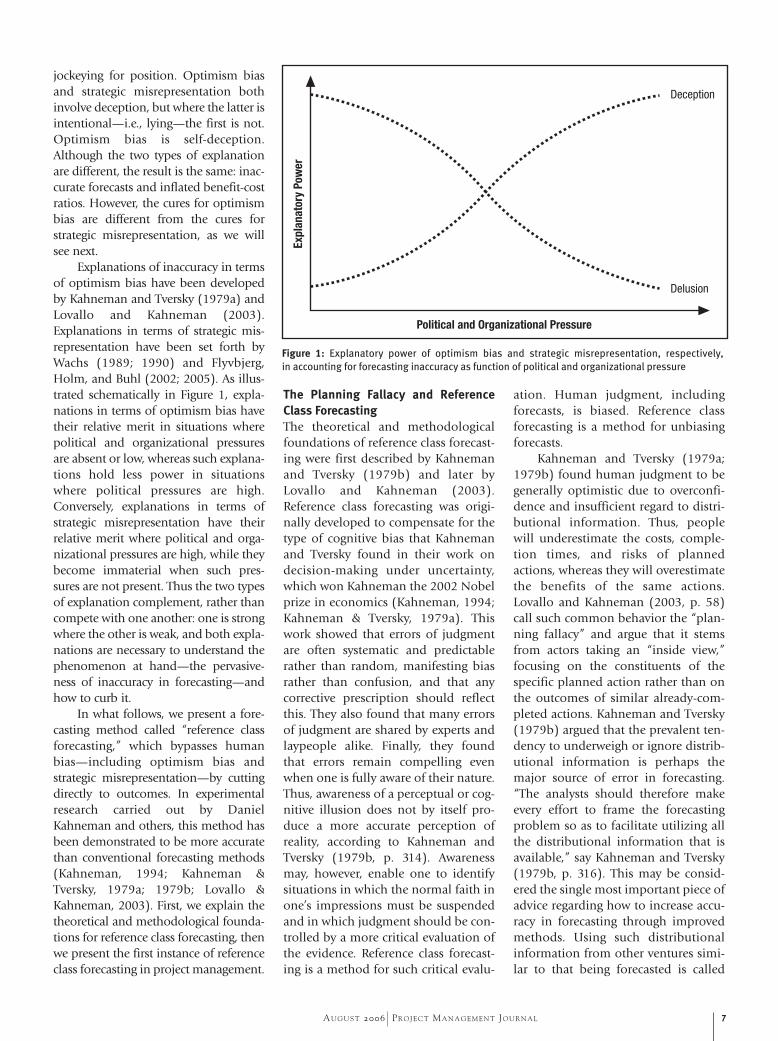
Explanations of inaccuracy in termsof optimism bias have been developedby Kahneman and Tversky (1979a) andLovallo and Kahneman (2003).Explanations in terms of strategic mis-representation have been set forth byWachs (1989; 1990) and Flyvbjerg,Holm, and Buhl (2002; 2005). As illus-trated schematically in Figure 1, expla-nations in terms of optimism bias havetheir relative merit in situations wherepolitical and organizational pressuresare absent or low, whereas such explana-tions hold less power in situationswhere political pressures are high.Conversely, explanations in terms ofstrategic misrepresentation have theirrelative merit where political and orga-nizational pressures are high, while theybecome immaterial when such pres-sures are not present. Thus the two typesof explanation complement, rather thancompete with one another: one is strongwhere the other is weak, and both expla-nations are necessary to understand thephenomenon at hand—the pervasive-ness of inaccuracy in forecasting—andhow to curb it.
In what follows, we present a fore-casting method called “reference classforecasting,” which bypasses humanbias—including optimism bias andstrategic misrepresentation—by cuttingdirectly to outcomes. In experimentalresearch carried out by DanielKahneman and others, this method hasbeen demonstrated to be more accuratethan conventional forecasting methods(Kahneman, 1994; Kahneman &Tversky, 1979a; 1979b; Lovallo &Kahneman, 2003). First, we explain thetheoretical and methodological founda-tions for reference class forecasting, thenwe present the first instance of referenceclass forecasting in project management.
The Planning Fallacy and Reference
Class Forecasting
The theoretical and methodologicalfoundations of reference class forecast-ing were first described by Kahnemanand Tversky (1979b) and later byLovallo and Kahneman (2003).Reference class forecasting was origi-nally developed to compensate for thetype of cognitive bias that Kahnemanand Tversky found in their work ondecision-making under uncertainty,which won Kahneman the 2002 Nobelprize in economics (Kahneman, 1994;Kahneman & Tversky, 1979a). Thiswork showed that errors of judgmentare often systematic and predictablerather than random, manifesting biasrather than confusion, and that anycorrective prescription should reflectthis. They also found that many errorsof judgment are shared by experts andlaypeople alike. Finally, they foundthat errors remain compelling evenwhen one is fully aware of their nature.Thus, awareness of a perceptual or cog-nitive illusion does not by itself pro-duce a more accurate perception ofreality, according to Kahneman andTversky (1979b, p. 314). Awarenessmay, however, enable one to identifysituations in which the normal faith inone’s impressions must be suspendedand in which judgment should be con-trolled by a more critical evaluation ofthe evidence. Reference class forecast-ing is a method for such critical evalu-
Deception
Delusion
Political and Organizational Pressure
Expl
anat
ory
Pow
er
Figure 1: Explanatory power of optimism bias and strategic misrepresentation, respectively,
in accounting for forecasting inaccuracy as function of political and organizational pressure

8 AU G U S T 2006 PR O J E C T MA N A G E M E N T JO U R N A L
taking an “outside view,” and it is thecure to the planning fallacy. Referenceclass forecasting is a method for sys-tematically taking an outside view onplanned actions.
More specifically, reference classforecasting for a particular projectrequires the following three steps:
1. Identification of a relevant refer-ence class of past, similar proj-ects. The class must be broadenough to be statistically mean-ingful, but narrow enough to betruly comparable with the spe-cific project.
2. Establishing a probability distri-bution for the selected referenceclass. This requires access tocredible, empirical data for asufficient number of projectswithin the reference class tomake statistically meaningfulconclusions.
3. Comparing the specific projectwith the reference class distribu-tion, in order to establish themost likely outcome for the spe-cific project.
Thus, reference class forecastingdoes not try to forecast the specificuncertain events that will affect theparticular project, but instead placesthe project in a statistical distributionof outcomes from the class of referenceprojects. In statisticians’ vernacular,reference class forecasting consists ofregressing forecasters’ best guessestoward the average of the referenceclass and expanding their estimate ofcredible interval toward the correspon-ding interval for the class (Kahneman& Tversky, 1979b, p. 326).
Daniel Kahneman relates the fol-lowing story about curriculum plan-ning to illustrate how reference classforecasting works (Lovallo &Kahneman, 2003, p. 61). Some yearsago, Kahneman was involved in a proj-ect to develop a curriculum for a newsubject area for high schools in Israel.The project was carried out by a teamof academics and teachers. In time, theteam began to discuss how long theproject would take to complete.Everyone on the team was asked towrite on a slip of paper the number of
months needed to finish and reportthe project. The estimates ranged from18 to 30 months. One of the teammembers—a distinguished expert incurriculum development—was thenposed a challenge by another teammember to recall as many projects sim-ilar to theirs as possible, and to thinkof these projects as they were in a stagecomparable to their project. “Howlong did it take them at that point toreach completion?,” the expert wasasked. After a while he answered, withsome discomfort, that not all the com-parable teams he could think of everdid complete their task. About 40% ofthem eventually gave up. Of thoseremaining, the expert could not thinkof any that completed their task in lessthan seven years, nor of any that tookmore than 10. The expert was thenasked if he had reason to believe thatthe present team was more skilled incurriculum development than the ear-lier ones had been. The expert said no,he did not see any relevant factor thatdistinguished this team favorably fromthe teams that he had been thinkingabout. His impression was that thepresent team was slightly below aver-age in terms of resources and potential.According to Kahneman, the wise deci-sion at this point would probably havebeen for the team to break up. Instead,the members ignored the pessimisticinformation and proceeded with theproject. They finally completed theproject eight years later, and theirefforts went largely wasted—the result-ing curriculum was rarely used.
In this example, the curriculumexpert made two forecasts for the sameproblem and arrived at very differentanswers. The first forecast was theinside view; the second was the outsideview, or the reference class forecast.The inside view is the one that theexpert and the other team membersadopted. They made forecasts by focus-ing tightly on the project at hand, andconsidering its objective, the resourcesthey brought to it, and the obstacles toits completion. They constructed intheir minds scenarios of their comingprogress and extrapolated currenttrends into the future. The resultingforecasts, even the most conservative
ones, were overly optimistic. The out-side view is the one provoked by thequestion to the curriculum expert. Itcompletely ignored the details of theproject at hand, and it involved noattempt at forecasting the events thatwould influence the project’s futurecourse. Instead, it examined the experi-ences of a class of similar projects, laidout a rough distribution of outcomesfor this reference class, and then posi-tioned the current project in that dis-tribution. The resulting forecast, as itturned out, was much more accurate.
The contrast between inside andoutside views has been confirmed bysystematic research (Gilovich, Griffin,& Kahneman, 2002). The researchshows that when people are asked sim-ple questions requiring them to takean outside view, their forecasts becomesignificantly more accurate. For exam-ple, a group of students enrolling at acollege were asked to rate their futureacademic performance relative to theirpeers in their major. On average, thesestudents expected to perform betterthan 84% of their peers, which is logi-cally impossible. The forecasts werebiased by overconfidence. Anothergroup of incoming students from thesame major were asked about theirentrance scores and their peers’ scoresbefore being asked about their expect-ed performance. This simple diversioninto relevant outside-view informa-tion, which both groups of subjectswere aware of, reduced the secondgroup’s average expected performanceratings by 20%. That is still overconfi-dent, but it is much more realistic thanthe forecast made by the first group(Lovallo & Kahneman, 2003, p. 61).
However, most individuals andorganizations are inclined to adopt theinside view in planning new projects.This is the conventional and intuitiveapproach. The traditional way to thinkabout a complex project is to focus onthe project itself and its details, tobring to bear what one knows about it,paying special attention to its uniqueor unusual features, trying to predictthe events that will influence its future.The thought of going out and gather-ing simple statistics about related proj-ects seldom enters a manager’s mind.

9AU G U S T 2006 PR O J E C T MA N A G E M E N T JO U R N A L
This is the case in general, according toLovallo and Kahneman (2003, pp.61–62). And it is certainly the case forcost and demand forecasting in trans-portation infrastructure projects. Ofthe several-hundred forecasts reviewedin Flyvbjerg, Bruzelius, andRothengatter (2003) and Flyvbjerg,Holm, and Buhl (2002; 2005), not onewas a reference class forecast.2
Although understandable, projectmanagers’ preference for the inside viewover the outside view is unfortunate.When both forecasting methods areapplied with equal skill, the outsideview is much more likely to produce arealistic estimate. That is because itbypasses cognitive and political biasessuch as optimism bias and strategicmisrepresentation, and cuts directly tooutcomes. In the outside view, projectmanagers and forecasters are notrequired to make scenarios, imagineevents, or gauge their own and others’levels of ability and control, so they can-not get all these things wrong. Humanbias is bypassed. Surely the outsideview, being based on historical prece-dent, may fail to predict extreme out-comes; that is, those that lie outside allhistorical precedents. But for most proj-ects, the outside view will produce moreaccurate results. In contrast, a focus oninside details is the road to inaccuracy.
The comparative advantage of theoutside view is most pronounced fornon-routine projects, understood asprojects that managers and decision-makers in a certain locale or organiza-tion have never attempted before—likebuilding new plants or infrastructure, orcatering to new types of demand. It is inthe planning of such new efforts thatthe biases toward optimism and strate-gic misrepresentation are likely to belargest. To be sure, choosing the rightreference class of comparative past proj-ects becomes more difficult when man-agers are forecasting initiatives forwhich precedents are not easily found;for instance, the introduction of newand unfamiliar technologies. However,most projects are both non-routinelocally and use well-known technolo-gies. Such projects are, therefore, partic-ularly likely to benefit from the outsideview and reference class forecasting.
First Instance of Reference Class
Forecasting in Practice
The first instance of reference class fore-casting in practice may be found inFlyvbjerg and Cowi (2004):“Procedures for Dealing with OptimismBias in Transport Planning.”3 Based onthis study in the summer of 2004, theU.K. Department for Transport and HMTreasury decided to employ the methodas part of project appraisal for largetransportation projects.
The immediate background tothis decision was the revision to TheGreen Book by HM Treasury in 2003that identified for large public pro-curement a demonstrated, systematictendency for project appraisers to beoverly optimistic:
“There is a demonstrated, system-atic tendency for project appraisers tobe overly optimistic. To redress thistendency, appraisers should makeexplicit, empirically based adjustmentsto the estimates of a project’s costs,benefits, and duration … [I]t is recom-mended that these adjustments bebased on data from past projects orsimilar projects elsewhere” (HMTreasury, 2003b, p. 1).
Such optimism was seen as animpediment to prudent fiscal plan-ning, for the government as a wholeand for individual departments withingovernment. To redress this tendency,HM Treasury recommended thatappraisers involved in large public pro-curement should make explicit, empir-ically based adjustments to theestimates of a project’s costs, benefits,and duration. HM Treasury recom-mended that these adjustments bebased on data from past projects orsimilar projects elsewhere, and adjust-ed for the unique characteristics of theproject at hand. In the absence of amore specific evidence base, HMTreasury encouraged governmentdepartments to collect valid and reli-able data to inform future estimates ofoptimism, and in the meantime to usethe best available data. The Treasury letit be understood that in the future theallocation of funds for large publicprocurement would be dependent onvalid adjustments of optimism inorder to secure valid estimates of costs,
benefits, and duration of large publicprocurement (HM Treasury, 2003a;2003b).
In response to the Treasury’sGreen Book and its recommendations,the U.K. Department for Transportdecided to collect the type of datawhich the Treasury recommended, andon that basis to develop a methodolo-gy for dealing with optimism bias inthe planning and management oftransportation projects. TheDepartment for Transport appointedBent Flyvbjerg in association withCowi to undertake this assignment asregards costing of large transportationprocurement. The main aims of theassignment were two; first, to provideempirically based optimism biasuplifts for selected reference classes oftransportation infrastructure projects,and, second, to provide guidance onusing the established uplifts to pro-duce more realistic forecasts of capitalexpenditures in individual projects(Flyvbjerg & Cowi, 2004). Upliftswould be established for capital expen-ditures based on the full business case(time of decision to build).
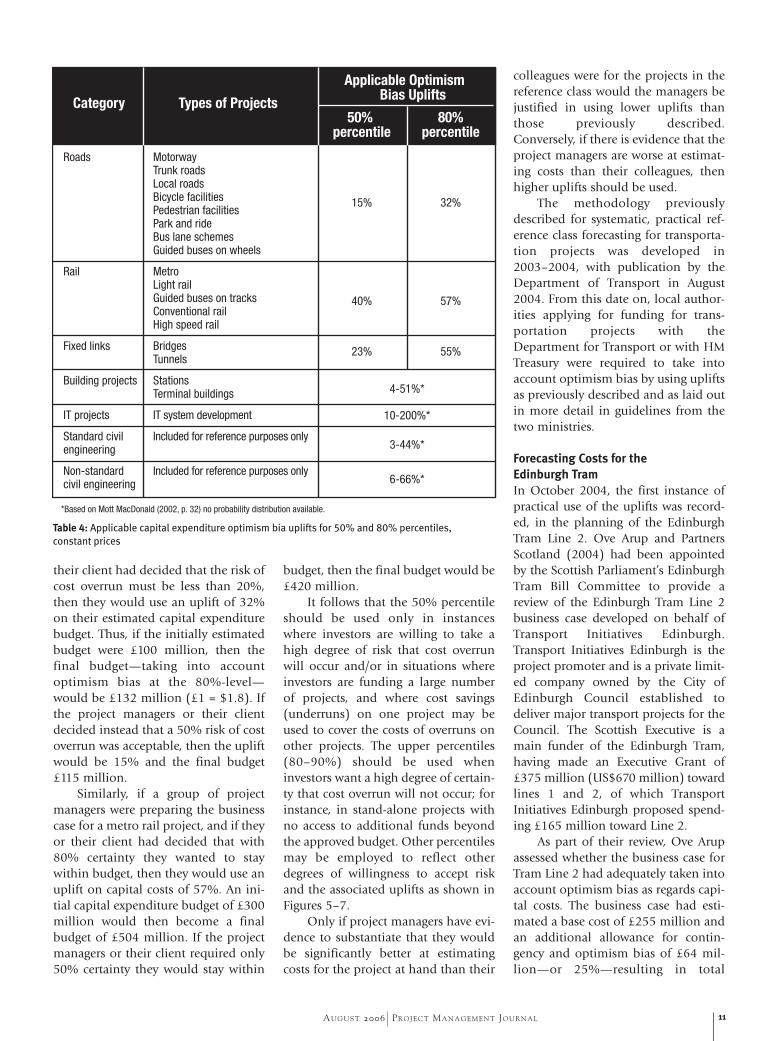
The types of transportationschemes under the direct and indirectresponsibility of the U.K. Departmentfor Transport were divided into a num-ber of distinct categories in which sta-tistical tests, benchmarkings, and otheranalyses showed that the risk of costoverruns within each category may betreated as statistically similar. For eachcategory, a reference class of projectswas then established as the basis forreference class forecasting, as requiredby step 1 in the three-step procedurefor reference class forecasting previous-ly described. The specific categoriesand the types of project allocated toeach category are shown in Table 3.
For each category of projects, a ref-erence class of completed, comparabletransportation infrastructure projectswas used to establish probability distri-butions for cost overruns for new proj-ects similar in scope and risks to theprojects in the reference class, asrequired by step 2 in reference classforecasting. For roads, for example, aclass of 172 completed and compara-ble projects was used to establish the

10 AU G U S T 2006 PR O J E C T MA N A G E M E N T JO U R N A L
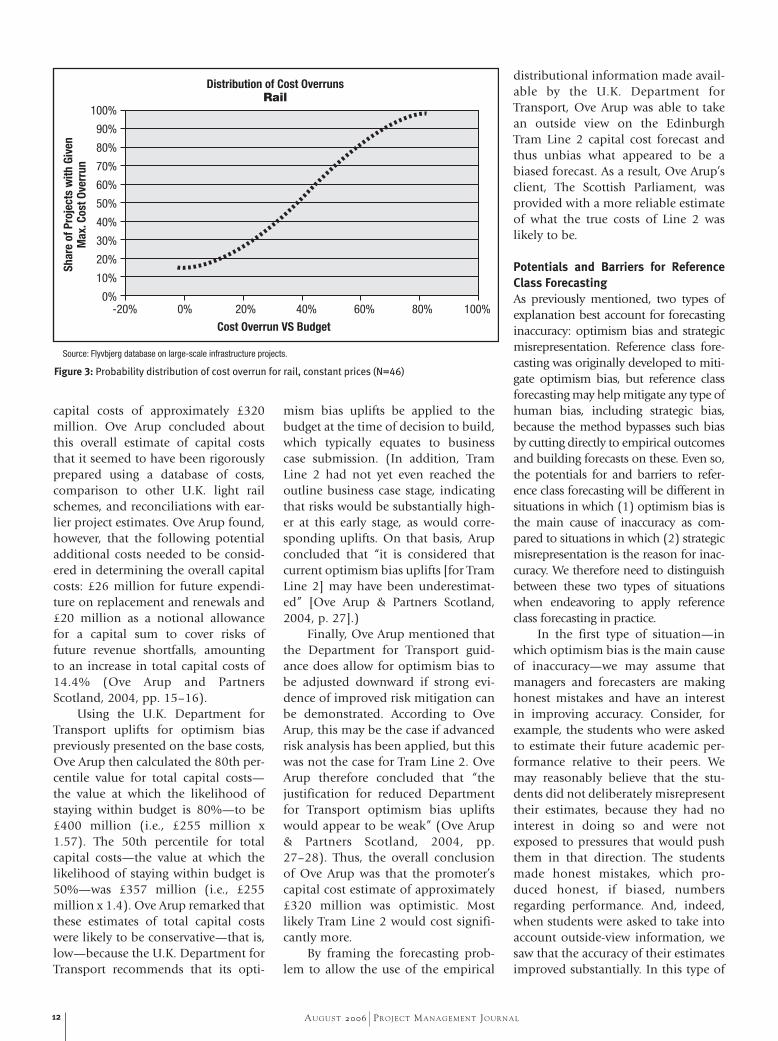
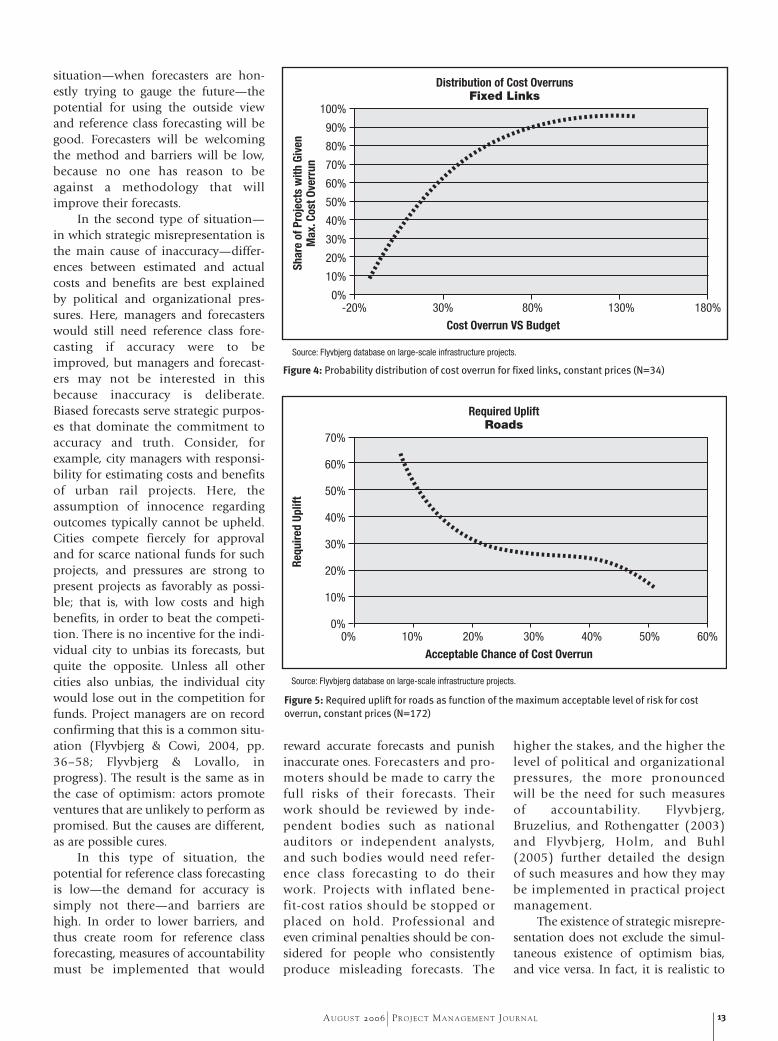
probability distribution of cost over-runs shown in Figure 2. The share ofprojects with a given maximum costoverrun is shown in the figure. Forinstance, 40% of projects have a maxi-mum cost overrun of 10%; 80% ofprojects a maximum overrun of 32%,etc. For rail, the probability distribu-tion is shown in Figure 3, and forbridges and tunnels in Figure 4. Thefigures show that the risk of cost over-
run is substantial for all three projecttypes, but highest for rail, followed bybridges and tunnels, and with the low-est risk for roads.
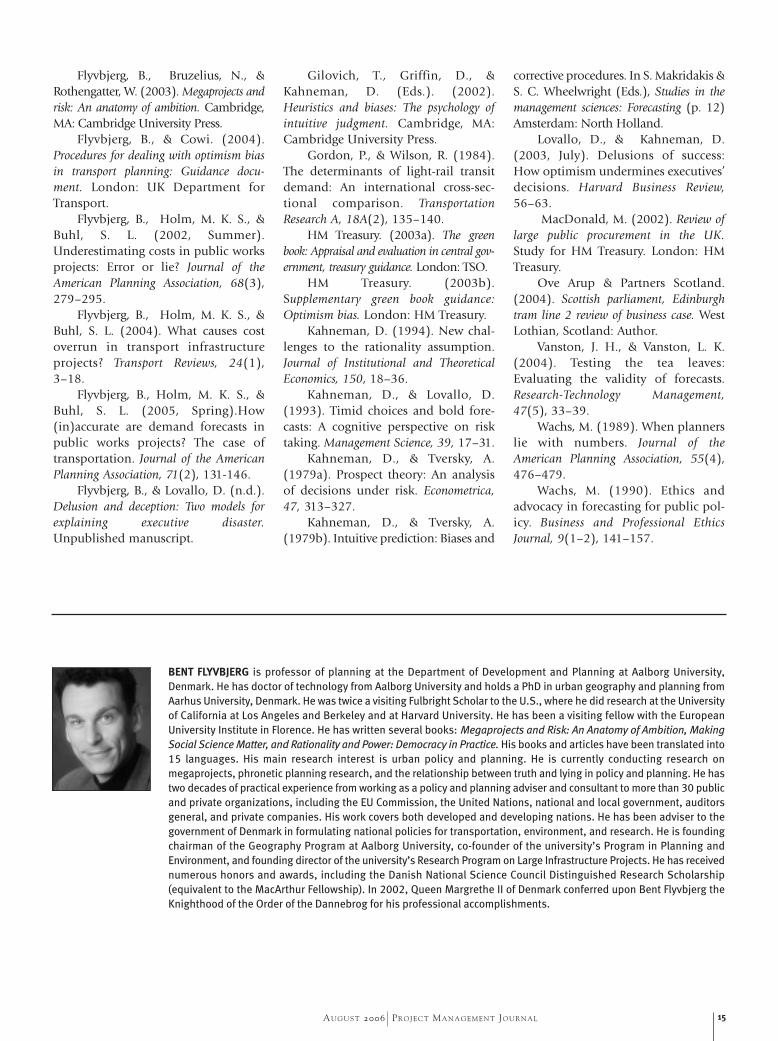
Based on the probability distribu-tions described, the required upliftsneeded to carry out step 3 in a refer-ence class forecast may be calculated asshown in Figures 5–7. The uplifts referto cost overrun calculated in constantprices. The lower the acceptable risk for
cost overrun, the higher the uplift. Forinstance, with a willingness to accept a50% risk for cost overrun in a roadproject, the required uplift for thisproject would be 15%. If theDepartment for Transport were willingto accept only a 10% risk for cost over-run, then the required uplift would be45%. In comparison, for rail, with awillingness to accept a 50% risk forcost overrun, the required uplift wouldbe 40%. If the Department forTransport were willing to accept only a10% risk for cost overrun, then therequired uplift would be 68% for rail.All three figures share the same basic S-shape, but at different levels, demon-strating that the required uplifts aresignificantly different for differentproject categories for a given level ofrisk of cost overrun. The figures alsoshow that the cost for additionalreductions in the risk of cost overrun isdifferent for the three types of projects,with risk reduction becoming increas-ingly expensive (rising marginal costs)for roads and fixed links below 20%risk, whereas for rail the cost ofincreased risk reduction rises moreslowly, albeit from a high level.
Table 4 presents an overview ofapplicable optimism bias uplifts forthe 50% and 80% percentiles for allthe project categories listed in Table 3.The 50% percentile is pertinent to theinvestor with a large project portfolio,where cost overruns on one projectmay be offset by cost savings on anoth-er. The 80% percentile—correspon-ding to a risk of cost overrun of20%—is the level of risk that the U.K.Department for Transport is typicallywilling to accept for large investmentsin local transportation infrastructure.
The established uplifts for opti-mism bias should be applied to esti-mated budgets at the time of decisionto build a project. In the U.K., theapproval stage for a large transporta-tion project is equivalent to the time ofpresenting the business case for theproject to the Department forTransport with a view to obtaining thego or no-go for that project.
If, for instance, a group of projectmanagers were preparing the businesscase for a new motorway, and if they or
Roads
Rail
Fixed links
Building projects
IT projects
Standard civil engineering
Non-standard civil engineering
MotorwayTrunk roadsLocal roads Bicycle facilitiesPedestrian facilities Park and rideBus lane schemesGuided buses on wheels
MetroLight railGuided buses on tracksConventional railHigh speed rail
BridgesTunnels
StationsTerminal buildings
IT system development
Included for reference purposes only
Included for reference purposes only
Category Types of Projects
Table 3: Categories and types of projects used as basis for reference class forecasting
-20% 0% 20% 40% 60% 80%
Cost Overrun VS Budget
Shar
e of
Pro
ject
s w
ith G
iven
Max
. Cos
t Ove
rrun
Distribution of Cost OverrunsRoads
100%
90%
80%
70%
60%
50%
40%
30%
20%
10%
0%
Source: Flyvbjerg database on large-scale infrastructure projects.
Figure 2: Probability distribution of cost overrun for roads, constant prices (N=172)
11AU G U S T 2006 PR O J E C T MA N A G E M E N T JO U R N A L
their client had decided that the risk ofcost overrun must be less than 20%,then they would use an uplift of 32%on their estimated capital expenditurebudget. Thus, if the initially estimatedbudget were £100 million, then thefinal budget—taking into accountoptimism bias at the 80%-level—would be £132 million (£1 = $1.8). Ifthe project managers or their clientdecided instead that a 50% risk of costoverrun was acceptable, then the upliftwould be 15% and the final budget£115 million.
Similarly, if a group of projectmanagers were preparing the businesscase for a metro rail project, and if theyor their client had decided that with80% certainty they wanted to staywithin budget, then they would use anuplift on capital costs of 57%. An ini-tial capital expenditure budget of £300million would then become a finalbudget of £504 million. If the projectmanagers or their client required only50% certainty they would stay within
budget, then the final budget would be£420 million.
It follows that the 50% percentileshould be used only in instanceswhere investors are willing to take ahigh degree of risk that cost overrunwill occur and/or in situations whereinvestors are funding a large numberof projects, and where cost savings(underruns) on one project may beused to cover the costs of overruns onother projects. The upper percentiles(80–90%) should be used wheninvestors want a high degree of certain-ty that cost overrun will not occur; forinstance, in stand-alone projects withno access to additional funds beyondthe approved budget. Other percentilesmay be employed to reflect otherdegrees of willingness to accept riskand the associated uplifts as shown inFigures 5–7.
Only if project managers have evi-dence to substantiate that they wouldbe significantly better at estimatingcosts for the project at hand than their
colleagues were for the projects in thereference class would the managers bejustified in using lower uplifts thanthose previously described.Conversely, if there is evidence that theproject managers are worse at estimat-ing costs than their colleagues, thenhigher uplifts should be used.
The methodology previouslydescribed for systematic, practical ref-erence class forecasting for transporta-tion projects was developed in2003–2004, with publication by theDepartment of Transport in August2004. From this date on, local author-ities applying for funding for trans-portation projects with theDepartment for Transport or with HMTreasury were required to take intoaccount optimism bias by using upliftsas previously described and as laid outin more detail in guidelines from thetwo ministries.
Forecasting Costs for the
Edinburgh Tram
In October 2004, the first instance ofpractical use of the uplifts was record-ed, in the planning of the EdinburghTram Line 2. Ove Arup and PartnersScotland (2004) had been appointedby the Scottish Parliament’s EdinburghTram Bill Committee to provide areview of the Edinburgh Tram Line 2business case developed on behalf ofTransport Initiatives Edinburgh.Transport Initiatives Edinburgh is theproject promoter and is a private limit-ed company owned by the City ofEdinburgh Council established todeliver major transport projects for theCouncil. The Scottish Executive is amain funder of the Edinburgh Tram,having made an Executive Grant of£375 million (US$670 million) towardlines 1 and 2, of which TransportInitiatives Edinburgh proposed spend-ing £165 million toward Line 2.
As part of their review, Ove Arupassessed whether the business case forTram Line 2 had adequately taken intoaccount optimism bias as regards capi-tal costs. The business case had esti-mated a base cost of £255 million andan additional allowance for contin-gency and optimism bias of £64 mil-lion—or 25%—resulting in total
Roads
Rail
Fixed links
Building projects
IT projects
Standard civil engineering
Non-standard civil engineering
15% 32%
40% 57%
23% 55%
4-51%*
10-200%*
3-44%*
6-66%*
MotorwayTrunk roadsLocal roads Bicycle facilitiesPedestrian facilities Park and rideBus lane schemesGuided buses on wheels
MetroLight railGuided buses on tracksConventional railHigh speed rail
BridgesTunnels
StationsTerminal buildings
IT system development
Included for reference purposes only
Included for reference purposes only
Category Types of Projects
Applicable Optimism Bias Uplifts
50% 80% percentile percentile
*Based on Mott MacDonald (2002, p. 32) no probability distribution available.
Table 4: Applicable capital expenditure optimism bia uplifts for 50% and 80% percentiles,
constant prices
12 AU G U S T 2006 PR O J E C T MA N A G E M E N T JO U R N A L
capital costs of approximately £320million. Ove Arup concluded aboutthis overall estimate of capital coststhat it seemed to have been rigorouslyprepared using a database of costs,comparison to other U.K. light railschemes, and reconciliations with ear-lier project estimates. Ove Arup found,however, that the following potentialadditional costs needed to be consid-ered in determining the overall capitalcosts: £26 million for future expendi-ture on replacement and renewals and£20 million as a notional allowancefor a capital sum to cover risks offuture revenue shortfalls, amountingto an increase in total capital costs of14.4% (Ove Arup and PartnersScotland, 2004, pp. 15–16).
Using the U.K. Department forTransport uplifts for optimism biaspreviously presented on the base costs,Ove Arup then calculated the 80th per-centile value for total capital costs—the value at which the likelihood ofstaying within budget is 80%—to be£400 million (i.e., £255 million x1.57). The 50th percentile for totalcapital costs—the value at which thelikelihood of staying within budget is50%—was £357 million (i.e., £255million x 1.4). Ove Arup remarked thatthese estimates of total capital costswere likely to be conservative—that is,low—because the U.K. Department forTransport recommends that its opti-
mism bias uplifts be applied to thebudget at the time of decision to build,which typically equates to businesscase submission. (In addition, TramLine 2 had not yet even reached theoutline business case stage, indicatingthat risks would be substantially high-er at this early stage, as would corre-sponding uplifts. On that basis, Arupconcluded that “it is considered thatcurrent optimism bias uplifts [for TramLine 2] may have been underestimat-ed” [Ove Arup & Partners Scotland,2004, p. 27].)
Finally, Ove Arup mentioned thatthe Department for Transport guid-ance does allow for optimism bias tobe adjusted downward if strong evi-dence of improved risk mitigation canbe demonstrated. According to OveArup, this may be the case if advancedrisk analysis has been applied, but thiswas not the case for Tram Line 2. OveArup therefore concluded that “thejustification for reduced Departmentfor Transport optimism bias upliftswould appear to be weak” (Ove Arup& Partners Scotland, 2004, pp.27–28). Thus, the overall conclusionof Ove Arup was that the promoter’scapital cost estimate of approximately£320 million was optimistic. Mostlikely Tram Line 2 would cost signifi-cantly more.
By framing the forecasting prob-lem to allow the use of the empirical
distributional information made avail-able by the U.K. Department forTransport, Ove Arup was able to takean outside view on the EdinburghTram Line 2 capital cost forecast andthus unbias what appeared to be abiased forecast. As a result, Ove Arup’sclient, The Scottish Parliament, wasprovided with a more reliable estimateof what the true costs of Line 2 waslikely to be.
Potentials and Barriers for Reference
Class Forecasting
As previously mentioned, two types ofexplanation best account for forecastinginaccuracy: optimism bias and strategicmisrepresentation. Reference class fore-casting was originally developed to miti-gate optimism bias, but reference classforecasting may help mitigate any type ofhuman bias, including strategic bias,because the method bypasses such biasby cutting directly to empirical outcomesand building forecasts on these. Even so,the potentials for and barriers to refer-ence class forecasting will be different insituations in which (1) optimism bias isthe main cause of inaccuracy as com-pared to situations in which (2) strategicmisrepresentation is the reason for inac-curacy. We therefore need to distinguishbetween these two types of situationswhen endeavoring to apply referenceclass forecasting in practice.
In the first type of situation—inwhich optimism bias is the main causeof inaccuracy—we may assume thatmanagers and forecasters are makinghonest mistakes and have an interestin improving accuracy. Consider, forexample, the students who were askedto estimate their future academic per-formance relative to their peers. Wemay reasonably believe that the stu-dents did not deliberately misrepresenttheir estimates, because they had nointerest in doing so and were notexposed to pressures that would pushthem in that direction. The studentsmade honest mistakes, which pro-duced honest, if biased, numbersregarding performance. And, indeed,when students were asked to take intoaccount outside-view information, wesaw that the accuracy of their estimatesimproved substantially. In this type of
-20% 0% 20% 40% 60% 80% 100%
Cost Overrun VS Budget
Shar
e of
Pro
ject
s w
ith G
iven
Max
. Cos
t Ove
rrun
Distribution of Cost OverrunsRail
100%
90%
80%
70%
60%
50%
40%
30%
20%
10%
0%
Source: Flyvbjerg database on large-scale infrastructure projects.
Figure 3: Probability distribution of cost overrun for rail, constant prices (N=46)
13AU G U S T 2006 PR O J E C T MA N A G E M E N T JO U R N A L
situation—when forecasters are hon-estly trying to gauge the future—thepotential for using the outside viewand reference class forecasting will begood. Forecasters will be welcomingthe method and barriers will be low,because no one has reason to beagainst a methodology that willimprove their forecasts.
In the second type of situation—in which strategic misrepresentation isthe main cause of inaccuracy—differ-ences between estimated and actualcosts and benefits are best explainedby political and organizational pres-sures. Here, managers and forecasterswould still need reference class fore-casting if accuracy were to beimproved, but managers and forecast-ers may not be interested in thisbecause inaccuracy is deliberate.Biased forecasts serve strategic purpos-es that dominate the commitment toaccuracy and truth. Consider, forexample, city managers with responsi-bility for estimating costs and benefitsof urban rail projects. Here, theassumption of innocence regardingoutcomes typically cannot be upheld.Cities compete fiercely for approvaland for scarce national funds for suchprojects, and pressures are strong topresent projects as favorably as possi-ble; that is, with low costs and highbenefits, in order to beat the competi-tion. There is no incentive for the indi-vidual city to unbias its forecasts, butquite the opposite. Unless all othercities also unbias, the individual citywould lose out in the competition forfunds. Project managers are on recordconfirming that this is a common situ-ation (Flyvbjerg & Cowi, 2004, pp.36–58; Flyvbjerg & Lovallo, inprogress). The result is the same as inthe case of optimism: actors promoteventures that are unlikely to perform aspromised. But the causes are different,as are possible cures.
In this type of situation, thepotential for reference class forecastingis low—the demand for accuracy issimply not there—and barriers arehigh. In order to lower barriers, andthus create room for reference classforecasting, measures of accountabilitymust be implemented that would
reward accurate forecasts and punishinaccurate ones. Forecasters and pro-moters should be made to carry thefull risks of their forecasts. Theirwork should be reviewed by inde-pendent bodies such as nationalauditors or independent analysts,and such bodies would need refer-ence class forecasting to do theirwork. Projects with inflated bene-fit-cost ratios should be stopped orplaced on hold. Professional andeven criminal penalties should be con-sidered for people who consistentlyproduce misleading forecasts. The
higher the stakes, and the higher thelevel of political and organizationalpressures, the more pronouncedwill be the need for such measuresof accountability. Flyvbjerg,Bruzelius, and Rothengatter (2003)and Flyvbjerg, Holm, and Buhl(2005) further detailed the designof such measures and how they maybe implemented in practical projectmanagement.
The existence of strategic misrepre-sentation does not exclude the simul-taneous existence of optimism bias,and vice versa. In fact, it is realistic to
0% 10% 20% 30% 40% 50% 60%
Acceptable Chance of Cost Overrun
Requ
ired
Uplif
t
Required UpliftRoads
70%
60%
50%
40%
30%
20%
10%
0%
Source: Flyvbjerg database on large-scale infrastructure projects.
Figure 5: Required uplift for roads as function of the maximum acceptable level of risk for cost
overrun, constant prices (N=172)
-20% 30% 80% 130% 180%
Cost Overrun VS Budget
Shar
e of
Pro
ject
s w
ith G
iven
Max
. Cos
t Ove
rrun
Distribution of Cost OverrunsFixed Links
100%
90%
80%
70%
60%
50%
40%
30%
20%
10%
0%
Source: Flyvbjerg database on large-scale infrastructure projects.
Figure 4: Probability distribution of cost overrun for fixed links, constant prices (N=34)

14 AU G U S T 2006 PR O J E C T MA N A G E M E N T JO U R N A L
expect such co-existence in forecastingin large and complex projects andorganizations. This again underscoresthe point that improved forecastingmethods—here, reference class fore-casting—and measures of accountabil-ity must go hand in hand if theattempt to arrive at more accurate fore-casts is to be effective.
Finally, it could be argued that insome cases the use of reference classforecasting may result in such largereserves set aside for a project that thiswould in itself lead to risks of ineffi-
ciencies and overspending. Reserveswill be spent simply because they arethere, as the saying goes in the con-struction business. For instance, it isimportant to recognize that, for thepreviously mentioned examples, theintroduction of reference class fore-casting and optimism-bias upliftswould establish total budget reserva-tions (including uplifts) which forsome projects would be more thanadequate. This may in itself create anincentive which works against firmcost control if the total budget reserva-
tion is perceived as being available tothe project and its contractors. Thismakes it important to combine theintroduction of reference class fore-casting and optimism bias uplifts withtight contracts, and maintained incen-tives for promoters to undertake goodquantified risk assessment and exerciseprudent cost control during projectimplementation. How this may bedone is described in Flyvbjerg andCowi (2004).
Notes1 Inaccuracy is measured in percent as(actual outcome/forecast outcome -1) x100. The base year of a forecast for aproject is the time of decision to buildthat project. An inaccuracy of 0 indi-cates perfect accuracy. Cost is measuredas construction costs. Demand is meas-ured as number of vehicles for roadsand number of passengers for rail.
2 The closest thing to an outside viewin large infrastructure forecasting isGordon and Wilson’s (1984) use ofregression analysis on an internationalcross section of light-rail projects toforecast patronage in a number oflight-rail schemes in North America.
3 The fact that this is, indeed, the firstinstance of practical reference classforecasting has been confirmed withDaniel Kahneman and Dan Lovallo,who also knows of no other instancesof practical reference class forecasting.Personal communications with DanielKahneman and Dan Lovallo, author’sarchives.
References
Altshuler, A., & Luberoff, D.(2003). Mega-projects: The changing poli-tics of urban public investment.Washington, DC: Brookings Institution.
American Planning Association.(2005). JAPA article calls on planners tohelp end inaccuracies in public project rev-enue forecasting. Retrieved April 7, 2005,from http://www.planning.org/newsre-leases/2005/ftp040705.htm
Flyvbjerg, B. (2005, Spring/Summer).Design by deception: The politics ofmegaproject approval. Harvard DesignMagazine, 22, 50–59.
0% 10% 20% 30% 40% 50% 60%
Acceptable Chance of Cost Overrun
Requ
ired
Uplif
tRequired Uplift
Rail90%
80%
70%
60%
50%
40%
30%
20%
10%
0%
Source: Flyvbjerg database on large-scale infrastructure projects.
Figure 6: Required uplift for rail as function of the maximum acceptable level of risk for cost
overrun, constant prices (N=46)
0% 10% 20% 30% 40% 50% 60%
Acceptable Chance of Cost Overrun
Requ
ired
Uplif
t
Required UpliftFixed Links
160%
140%
120%
100%
80%
60%
40%
20%
0%
Source: Flyvbjerg database on large-scale infrastructure projects.
Figure 7: Required uplift for fixed links as function of the maximum acceptable level of risk for
cost overrun, constant prices (N=34)
15AU G U S T 2006 PR O J E C T MA N A G E M E N T JO U R N A L
Flyvbjerg, B., Bruzelius, N., &Rothengatter, W. (2003). Megaprojects andrisk: An anatomy of ambition. Cambridge,MA: Cambridge University Press.
Flyvbjerg, B., & Cowi. (2004).Procedures for dealing with optimism biasin transport planning: Guidance docu-ment. London: UK Department forTransport.
Flyvbjerg, B., Holm, M. K. S., &Buhl, S. L. (2002, Summer).Underestimating costs in public worksprojects: Error or lie? Journal of theAmerican Planning Association, 68(3),279–295.
Flyvbjerg, B., Holm, M. K. S., &Buhl, S. L. (2004). What causes costoverrun in transport infrastructureprojects? Transport Reviews, 24(1),3–18.
Flyvbjerg, B., Holm, M. K. S., &Buhl, S. L. (2005, Spring).How(in)accurate are demand forecasts inpublic works projects? The case oftransportation. Journal of the AmericanPlanning Association, 71(2), 131-146.
Flyvbjerg, B., & Lovallo, D. (n.d.).Delusion and deception: Two models forexplaining executive disaster.Unpublished manuscript.
Gilovich, T., Griffin, D., &Kahneman, D. (Eds.). (2002).Heuristics and biases: The psychology ofintuitive judgment. Cambridge, MA:Cambridge University Press.
Gordon, P., & Wilson, R. (1984).The determinants of light-rail transitdemand: An international cross-sec-tional comparison. TransportationResearch A, 18A(2), 135–140.
HM Treasury. (2003a). The greenbook: Appraisal and evaluation in central gov-ernment, treasury guidance. London: TSO.
HM Treasury. (2003b).Supplementary green book guidance:Optimism bias. London: HM Treasury.
Kahneman, D. (1994). New chal-lenges to the rationality assumption.Journal of Institutional and TheoreticalEconomics, 150, 18–36.
Kahneman, D., & Lovallo, D.(1993). Timid choices and bold fore-casts: A cognitive perspective on risktaking. Management Science, 39, 17–31.
Kahneman, D., & Tversky, A.(1979a). Prospect theory: An analysisof decisions under risk. Econometrica,47, 313–327.
Kahneman, D., & Tversky, A.(1979b). Intuitive prediction: Biases and
corrective procedures. In S. Makridakis &S. C. Wheelwright (Eds.), Studies in themanagement sciences: Forecasting (p. 12)Amsterdam: North Holland.
Lovallo, D., & Kahneman, D.(2003, July). Delusions of success:How optimism undermines executives’decisions. Harvard Business Review,56–63.
MacDonald, M. (2002). Review oflarge public procurement in the UK.Study for HM Treasury. London: HMTreasury.
Ove Arup & Partners Scotland.(2004). Scottish parliament, Edinburghtram line 2 review of business case. WestLothian, Scotland: Author.
Vanston, J. H., & Vanston, L. K.(2004). Testing the tea leaves:Evaluating the validity of forecasts.Research-Technology Management,47(5), 33–39.
Wachs, M. (1989). When plannerslie with numbers. Journal of theAmerican Planning Association, 55(4),476–479.
Wachs, M. (1990). Ethics andadvocacy in forecasting for public pol-icy. Business and Professional EthicsJournal, 9(1–2), 141–157.
BENT FLYVBJERG is professor of planning at the Department of Development and Planning at Aalborg University,
Denmark. He has doctor of technology from Aalborg University and holds a PhD in urban geography and planning from
Aarhus University, Denmark. He was twice a visiting Fulbright Scholar to the U.S., where he did research at the University
of California at Los Angeles and Berkeley and at Harvard University. He has been a visiting fellow with the European
University Institute in Florence. He has written several books: Megaprojects and Risk: An Anatomy of Ambition, MakingSocial Science Matter, and Rationality and Power: Democracy in Practice. His books and articles have been translated into
15 languages. His main research interest is urban policy and planning. He is currently conducting research on
megaprojects, phronetic planning research, and the relationship between truth and lying in policy and planning. He has
two decades of practical experience from working as a policy and planning adviser and consultant to more than 30 public
and private organizations, including the EU Commission, the United Nations, national and local government, auditors
general, and private companies. His work covers both developed and developing nations. He has been adviser to the
government of Denmark in formulating national policies for transportation, environment, and research. He is founding
chairman of the Geography Program at Aalborg University, co-founder of the university’s Program in Planning and
Environment, and founding director of the university’s Research Program on Large Infrastructure Projects. He has received
numerous honors and awards, including the Danish National Science Council Distinguished Research Scholarship
(equivalent to the MacArthur Fellowship). In 2002, Queen Margrethe II of Denmark conferred upon Bent Flyvbjerg the
Knighthood of the Order of the Dannebrog for his professional accomplishments.

This material has been reproduced with the permission of the copyright owner. Unauthorized reproduction of this material is strictly prohibited. For permission to
reproduce this material, please contact PMI.