Akzo Nobel Pakistan Limited - Financials
100
-
Upload
khangminh22 -
Category
Documents
-
view
3 -
download
0
Transcript of Akzo Nobel Pakistan Limited - Financials


Akzo Nobel Pakistan LimitedFinancial Statements
Akzo Nobel Pakistan Limited

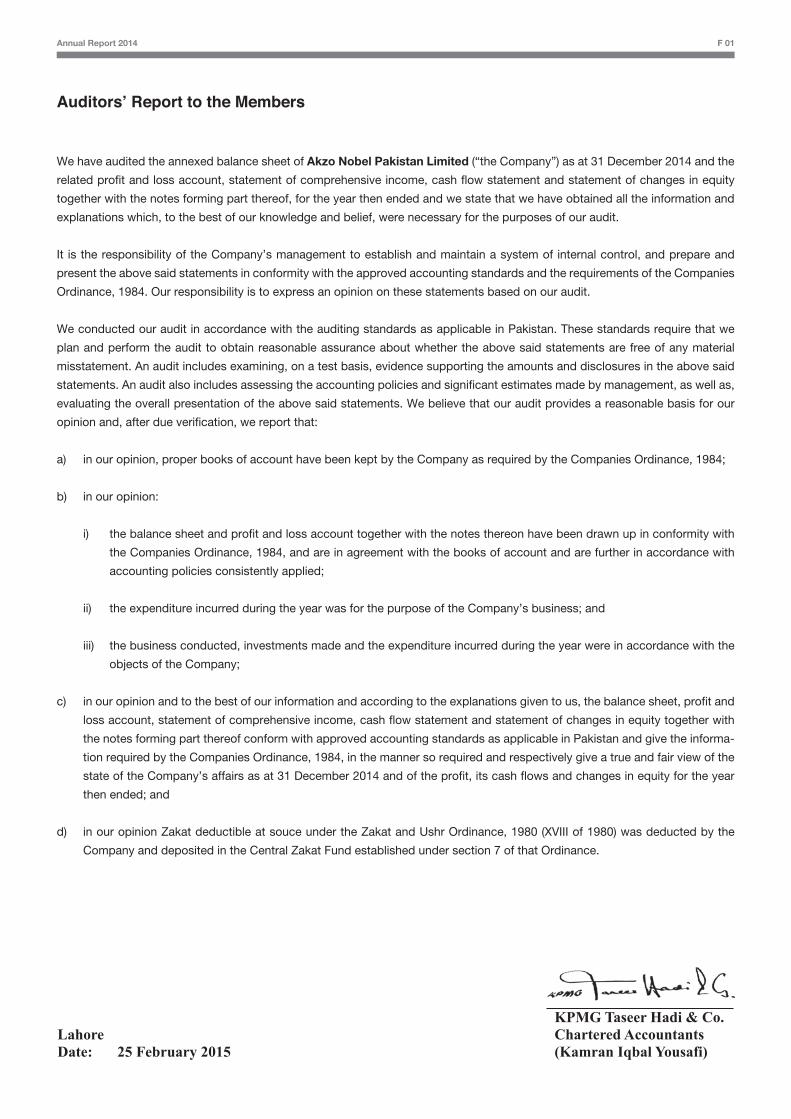
We have audited the annexed balance sheet of Akzo Nobel Pakistan Limited (“the Company”) as at 31 December 2014 and the
related profit and loss account, statement of comprehensive income, cash flow statement and statement of changes in equity
together with the notes forming part thereof, for the year then ended and we state that we have obtained all the information and
explanations which, to the best of our knowledge and belief, were necessary for the purposes of our audit.
It is the responsibility of the Company’s management to establish and maintain a system of internal control, and prepare and
present the above said statements in conformity with the approved accounting standards and the requirements of the Companies
Ordinance, 1984. Our responsibility is to express an opinion on these statements based on our audit.
We conducted our audit in accordance with the auditing standards as applicable in Pakistan. These standards require that we
plan and perform the audit to obtain reasonable assurance about whether the above said statements are free of any material
misstatement. An audit includes examining, on a test basis, evidence supporting the amounts and disclosures in the above said
statements. An audit also includes assessing the accounting policies and significant estimates made by management, as well as,
evaluating the overall presentation of the above said statements. We believe that our audit provides a reasonable basis for our
opinion and, after due verification, we report that:
a) in our opinion, proper books of account have been kept by the Company as required by the Companies Ordinance, 1984;
b) in our opinion:
i) the balance sheet and profit and loss account together with the notes thereon have been drawn up in conformity with
the Companies Ordinance, 1984, and are in agreement with the books of account and are further in accordance with
accounting policies consistently applied;
ii) the expenditure incurred during the year was for the purpose of the Company’s business; and
iii) the business conducted, investments made and the expenditure incurred during the year were in accordance with the
objects of the Company;
c) in our opinion and to the best of our information and according to the explanations given to us, the balance sheet, profit and
loss account, statement of comprehensive income, cash flow statement and statement of changes in equity together with
the notes forming part thereof conform with approved accounting standards as applicable in Pakistan and give the informa-
tion required by the Companies Ordinance, 1984, in the manner so required and respectively give a true and fair view of the
state of the Company’s affairs as at 31 December 2014 and of the profit, its cash flows and changes in equity for the year
then ended; and
d) in our opinion Zakat deductible at souce under the Zakat and Ushr Ordinance, 1980 (XVIII of 1980) was deducted by the
Company and deposited in the Central Zakat Fund established under section 7 of that Ordinance.
Auditors’ Report to the Members
LahoreDate: 25 February 2015
KPMG Taseer Hadi & Co.Chartered Accountants(Kamran Iqbal Yousafi)
Annual Report 2014 F 01
Annual Report 2014 F 02
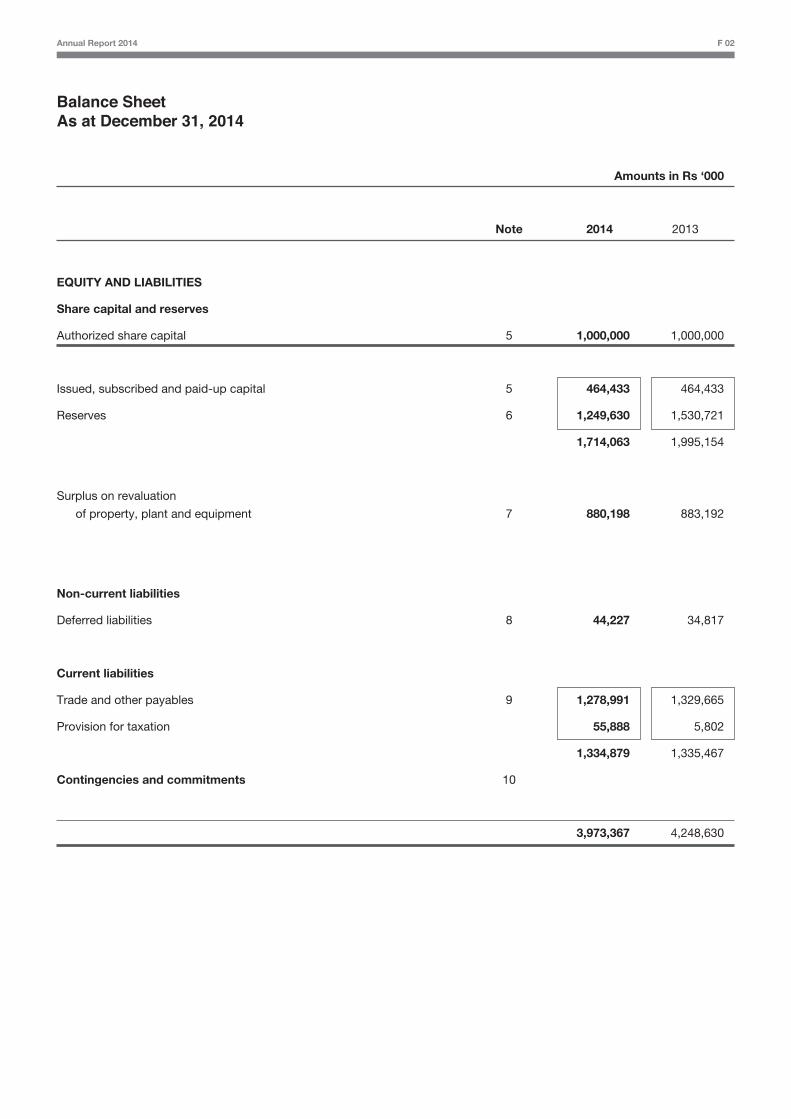
Balance SheetAs at December 31, 2014
Amounts in Rs ‘000
Note 2014 2013
EQUITY AND LIABILITIES
Share capital and reserves
Authorized share capital 5 1,000,000 1,000,000
Issued, subscribed and paid-up capital 5 464,433 464,433
Reserves 6 1,249,630 1,530,721
1,714,063 1,995,154
Surplus on revaluation
of property, plant and equipment 7 880,198 883,192
Non-current liabilities
Deferred liabilities 8 44,227 34,817
Current liabilities
Trade and other payables 9 1,278,991 1,329,665
Provision for taxation 55,888 5,802
1,334,879 1,335,467
Contingencies and commitments 10
3,973,367 4,248,630
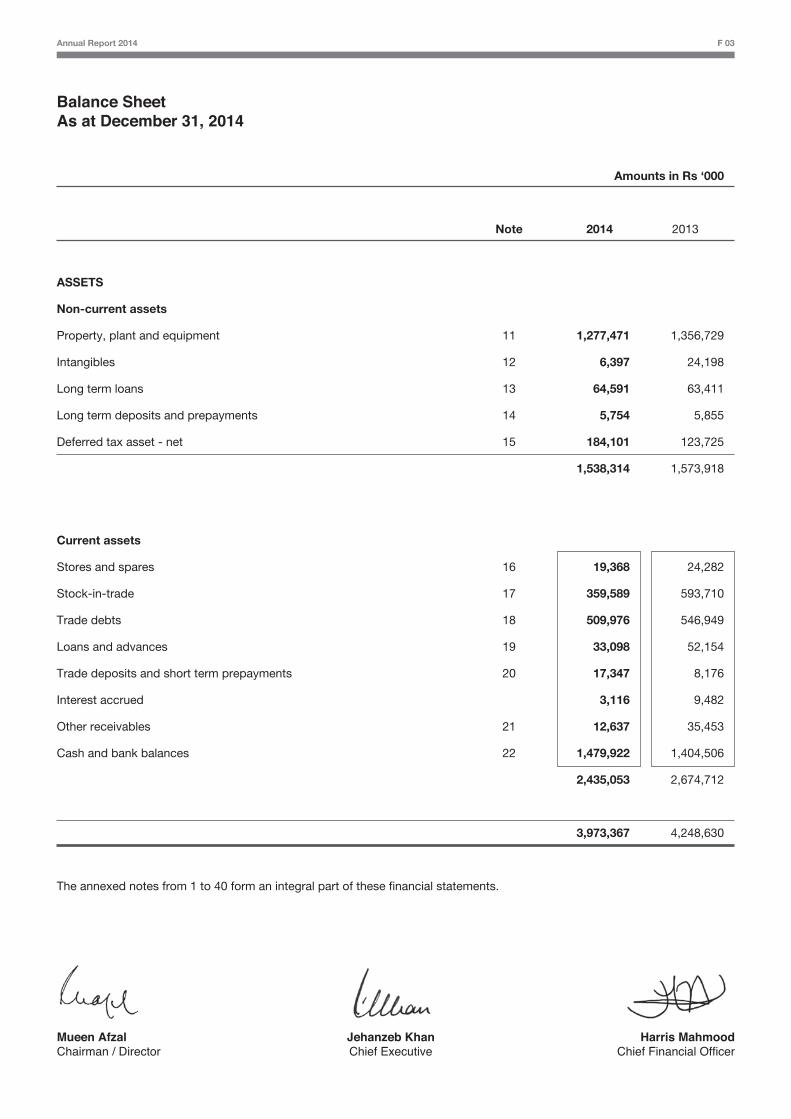
Annual Report 2014 F 03
Amounts in Rs ‘000
Note 2014 2013
ASSETS
Non-current assets
Property, plant and equipment 11 1,277,471 1,356,729
Intangibles 12 6,397 24,198
Long term loans 13 64,591 63,411
Long term deposits and prepayments 14 5,754 5,855
Deferred tax asset - net 15 184,101 123,725
1,538,314 1,573,918
Current assets
Stores and spares 16 19,368 24,282
Stock-in-trade 17 359,589 593,710
Trade debts 18 509,976 546,949
Loans and advances 19 33,098 52,154
Trade deposits and short term prepayments 20 17,347 8,176
Interest accrued 3,116 9,482
Other receivables 21 12,637 35,453
Cash and bank balances 22 1,479,922 1,404,506
2,435,053 2,674,712
3,973,367 4,248,630
The annexed notes from 1 to 40 form an integral part of these financial statements.
Balance SheetAs at December 31, 2014
Mueen AfzalChairman / Director
Harris MahmoodChief Financial Officer
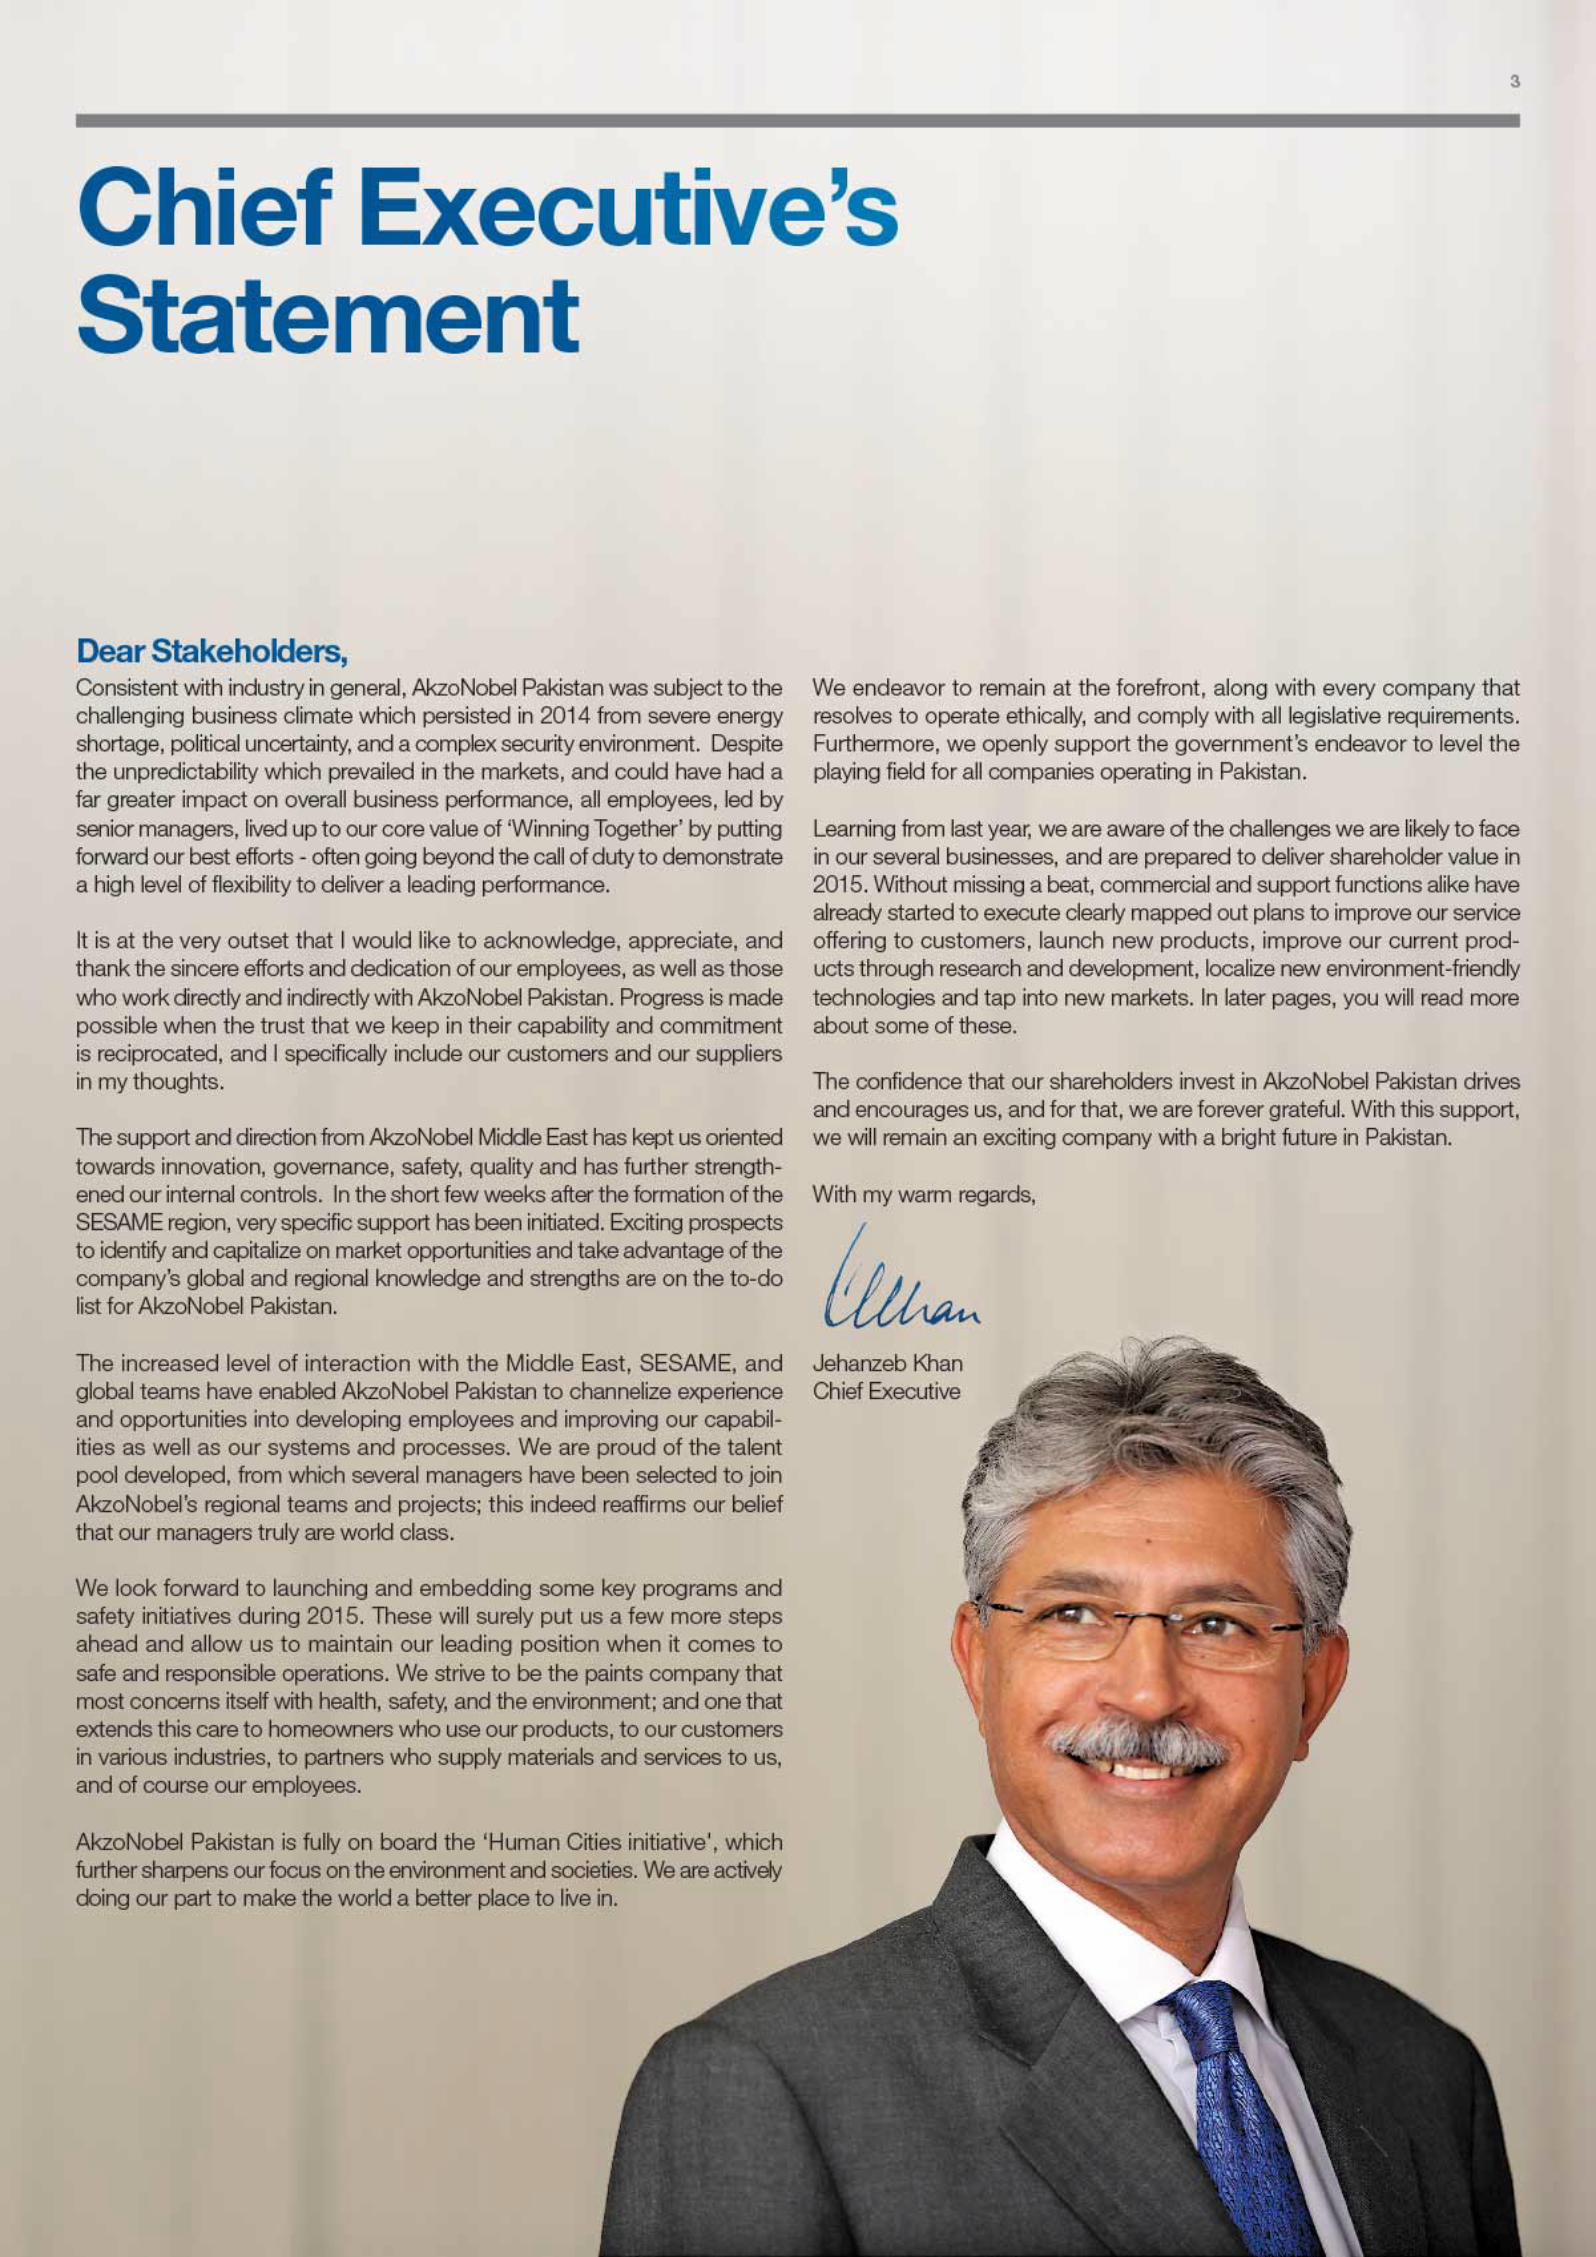
Jehanzeb KhanChief Executive

Annual Report 2014 F 04
Profit and Loss AccountFor the year ended December 31, 2014
Amounts in Rs ‘000
Note 2014 2013
Turnover 23 6,915,474 7,124,812
Sales tax, excise duty and discounts 23 (2,013,683) (1,859,668)
Net Sales 4,901,791 5,265,144
Cost of sales 24 (3,129,630) (3,326,178)
Gross profit 1,772,161 1,938,966
Selling and distribution expenses 25 (820,321) (911,268)
Administrative and general expenses 26 (394,922) (383,253)
Operating profit 556,918 644,445
Finance cost 27 (9,734) (35,219)
Other charges 28 (54,415) (80,515)
(64,149) (115,734)
Other income 29 185,730 408,224
Profit before taxation 678,499 936,935
Taxation 30 (219,643) (331,209)
Profit after taxation 458,856 605,726
Earnings per share - Basic and diluted - Rupees 31 9.88 13.04
The annexed notes from 1 to 40 form an integral part of these financial statements.
Mueen AfzalChairman / Director
Harris MahmoodChief Financial Officer
Jehanzeb KhanChief Executive

Annual Report 2014 F 05
Statement of Comprehensive IncomeFor the year ended December 31, 2014
Amounts in Rs ‘000
Note 2014 2013
Profit for the year 458,856 605,726
Other comprehensive income
Items that will never be reclassified to profit or loss:
Remeasurement of defined benefit liability 8.3 34,889 (32,275)
Related tax impact (11,513) 10,973
Tax impact due to reversal of related deferred tax assets - (48,151)
23,376 (69,453)
Total comprehensive income for the year 482,232 536,273
The annexed notes from 1 to 40 form an integral part of these financial statements.
Mueen AfzalChairman / Director
Harris MahmoodChief Financial Officer
Jehanzeb KhanChief Executive
Annual Report 2014 F 06
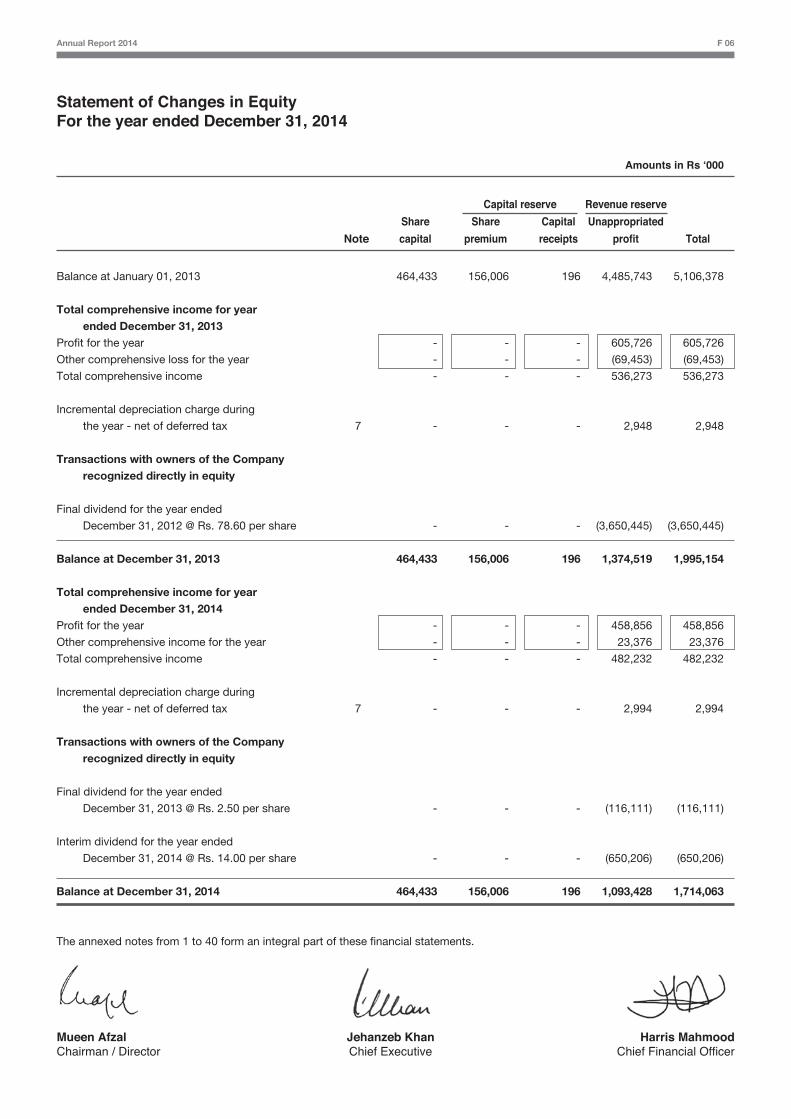
Capital reserve Revenue reserve
Unappropriated
profit Total
Share
premium
Capital
receipts
Share
capital
Statement of Changes in EquityFor the year ended December 31, 2014
Balance at January 01, 2013 464,433 156,006 196 4,485,743 5,106,378
Total comprehensive income for year ended December 31, 2013Profit for the year - - - 605,726 605,726
Other comprehensive loss for the year - - - (69,453) (69,453)
Total comprehensive income - - - 536,273 536,273
Incremental depreciation charge during
the year - net of deferred tax 7 - - - 2,948 2,948
Transactions with owners of the Company recognized directly in equity
Final dividend for the year ended
December 31, 2012 @ Rs. 78.60 per share - - - (3,650,445) (3,650,445)
Balance at December 31, 2013 464,433 156,006 196 1,374,519 1,995,154
Total comprehensive income for year ended December 31, 2014Profit for the year - - - 458,856 458,856
Other comprehensive income for the year - - - 23,376 23,376
Total comprehensive income - - - 482,232 482,232
Incremental depreciation charge during
the year - net of deferred tax 7 - - - 2,994 2,994
Transactions with owners of the Company recognized directly in equity
Final dividend for the year ended
December 31, 2013 @ Rs. 2.50 per share - - - (116,111) (116,111)
Interim dividend for the year ended
December 31, 2014 @ Rs. 14.00 per share - - - (650,206) (650,206)
Balance at December 31, 2014 464,433 156,006 196 1,093,428 1,714,063
The annexed notes from 1 to 40 form an integral part of these financial statements.
Amounts in Rs ‘000
Note
Mueen AfzalChairman / Director
Harris MahmoodChief Financial Officer
Jehanzeb KhanChief Executive
Mueen AfzalChairman / Director
Harris MahmoodChief Financial Officer
Jehanzeb KhanChief Executive
Annual Report 2014 F 07
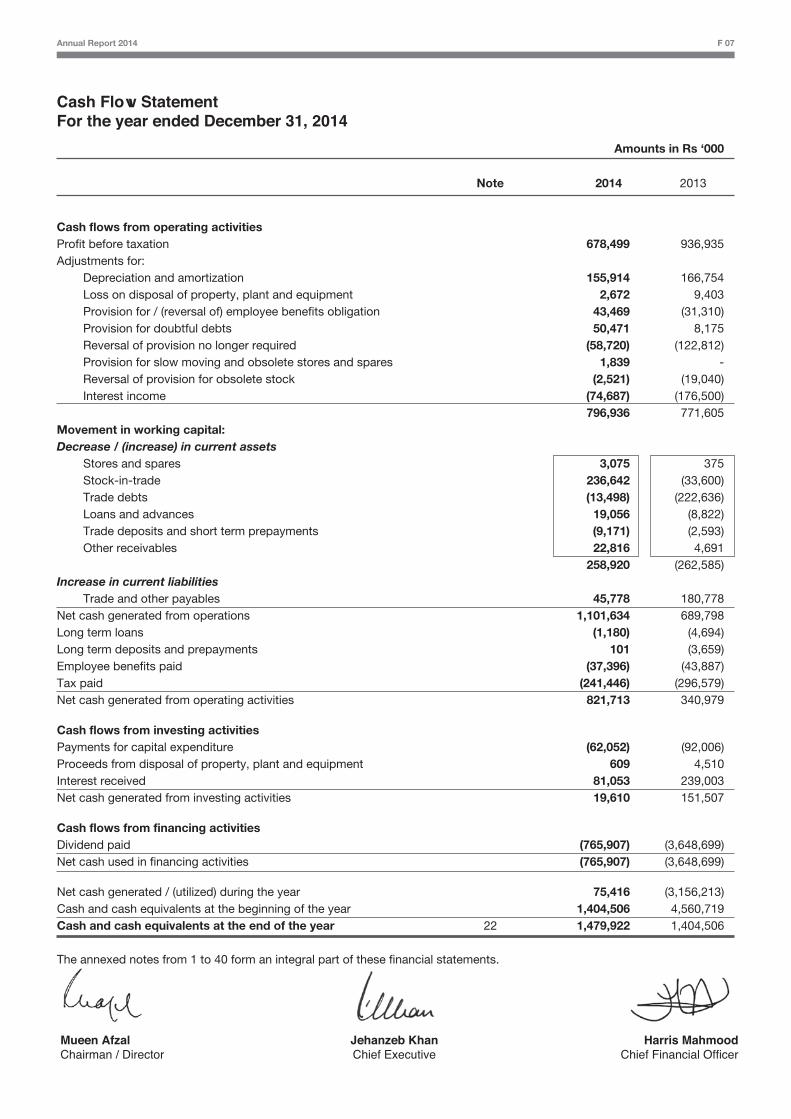
Cash Flow StatementFor the year ended December 31, 2014
Amounts in Rs ‘000
Note 2014 2013
Cash flows from operating activities Profit before taxation 678,499 936,935Adjustments for: Depreciation and amortization 155,914 166,754 Loss on disposal of property, plant and equipment 2,672 9,403 Provision for / (reversal of) employee benefits obligation 43,469 (31,310) Provision for doubtful debts 50,471 8,175 Reversal of provision no longer required (58,720) (122,812) Provision for slow moving and obsolete stores and spares 1,839 - Reversal of provision for obsolete stock (2,521) (19,040) Interest income (74,687) (176,500) 796,936 771,605Movement in working capital: Decrease / (increase) in current assets Stores and spares 3,075 375 Stock-in-trade 236,642 (33,600) Trade debts (13,498) (222,636) Loans and advances 19,056 (8,822) Trade deposits and short term prepayments (9,171) (2,593) Other receivables 22,816 4,691 258,920 (262,585)Increase in current liabilities Trade and other payables 45,778 180,778Net cash generated from operations 1,101,634 689,798Long term loans (1,180) (4,694)Long term deposits and prepayments 101 (3,659)Employee benefits paid (37,396) (43,887)Tax paid (241,446) (296,579)Net cash generated from operating activities 821,713 340,979
Cash flows from investing activitiesPayments for capital expenditure (62,052) (92,006)Proceeds from disposal of property, plant and equipment 609 4,510Interest received 81,053 239,003Net cash generated from investing activities 19,610 151,507
Cash flows from financing activitiesDividend paid (765,907) (3,648,699)Net cash used in financing activities (765,907) (3,648,699)
Net cash generated / (utilized) during the year 75,416 (3,156,213)Cash and cash equivalents at the beginning of the year 1,404,506 4,560,719Cash and cash equivalents at the end of the year 22 1,479,922 1,404,506
The annexed notes from 1 to 40 form an integral part of these financial statements.
Annual Report 2014 F 08
Notes to the Financial StatementsFor the year ended December 31, 2014
1 Reporting entity
Akzo Nobel Pakistan Limited (“the Company”) was incorporated in Pakistan on August 25, 2011 as a public unlisted company under the Companies Ordinance, 1984 and was subsequently listed on the Karachi and Islamabad Stock Exchanges on July 11, 2012 and Lahore Stock Exchange on July 17, 2012. The registered office of the Company is situated at 346, Ferozepur Road, Lahore. The Company is primarily involved in the manufacturing of paints and trading of specialty chemicals.
2 Basis of preparation
2.1 Statement of compliance
These financial statements have been prepared in accordance with approved accounting standards as applicable in Pakistan. Approved accounting standards comprise of such International Financial Reporting Standards (IFRS) issued by the International Accounting Standards Board and Islamic Financial Accounting Standards (IFAS's) issued by the Institute of Chartered Accountants of Pakistan as are notified under the Companies Ordinance, 1984, provi-sions of and directives issued under the Companies Ordinance, 1984. In case requirements differ, the provisions of, and directives issued under the Companies Ordinance, 1984 shall prevail.
2.2 Basis of measurement These financial statements have been prepared under the historical cost convention, except for certain classes of
property, plant and equipment (i.e. freehold land, buildings on freehold land and plant and machinery) that are stated at revalued amounts and defined benefit asset / liability at fair value of plan asset less present value of defined benefit obligation as referred to in Note 8.
2.3 Functional and presentation currency
These financial statements are presented in Pakistan Rupees which is also the Company's functional currency and has been rounded to the nearest thousand.
2.4 Use of estimates and judgments
The preparation of financial statements in conformity with approved accounting standards as applicable in Pakistan requires management to make estimates and assumptions that affect the application of policies and reported amounts of assets and liabilities and income and expenses. The estimates, associated assumptions and judgments are continually evaluated and are based on historical experience and various factors, including reasonable expecta-tions of future events.
Estimates and judgments made by the management that may have a significant risk of material adjustments to the financial statements in subsequent years are as below:
Defined benefit obligation
Certain actuarial assumptions have been adopted as disclosed in Note 8.11 to the financial statements for present value of defined benefit obligations and fair value of plan assets. Any changes in these assumptions in future years might affect gains and losses in those years.
Property, plant and equipment
The estimates for revalued amounts, if any, of different classes of property, plant and equipment, are based on valua-tion performed by external professional valuer and recommendation of technical teams of the Company. The said recommendations also include estimates with respect to residual values and depreciable lives. Further, the Company reviews the value of the assets for possible impairment on an annual basis. The future cash flows used in the impair-ment testing of assets is based on management's best estimates which may change in future periods. Any change
Notes to the Financial StatementsFor the year ended December 31, 2014
in the estimates in future years might affect the carrying amounts of the respective items of property, plant and equip-ment with a corresponding affect on the depreciation charge and impairment.
Income Taxes In making the estimates for income taxes currently payable by the Company, the management looks at the current
income tax laws and the decisions of appellate authorities on certain issues in the past. In determination of deferred taxes, estimates of the Company's future taxable profit are taken into consideration.
The tax year of the Company is same as its accounting year. The income tax assessments of the Company up to and including tax year 2014 have been completed under the provisions of section 120 of the Income Tax Ordinance, 2001 except for the following:
For the tax year 2012, the Additional Commissioner Inland Revenue (Audit) ['ACIR'], Zone-II, Large Taxpayers Unit, Lahore through order dated January 31, 2014 raised a tax demand of Rs. 89.49 million, in addition to the original assessment of Rs. 151.91 million. The Company filed an appeal before Commissioner Inland Revenue (Appeals) ['CIR (A)'] against the aforesaid order, which was disposed through the appellate order dated May 05, 2014 wherein the CIR (A) remanded majority of the issues back to the assessing officer. The remaining issues of 'apportionment of other income' and 'disallowance of tax credit' have been contested by the Company with the Appellate Tribunal Inland Revenue ('ATIR') whereas the tax department has also contested the issue of 'WWF' and 'amortization of advertisement expense' with the ATIR. The issues remanded are yet to be undertaken for re-adjudication by the ACIR and as such no demand is currently outstanding.
For the tax year 2013, the ACIR through assessment order dated April 30, 2014, passed under section 122(5A) of the Income Tax Ordinance, amended the taxable income of the Company and raised a tax demand of Rs. 15.53 million, in addition to original assessment of Rs. 44.73 million. The Company filed an appeal before the CIR (A), which was disposed through the appellate order dated October 27, 2014, wherein the CIR (A) decided some of the issues in favour of the Company. The remaining issues have been contested by the Company with the ATIR. The department has also filed an appeal with the ATIR on the issues decided in favour of the Company. The Company had partially paid the demand raised through the amendment order and as a consequence of the aforementioned appellate order, an amount of Rs. 4.6 million becomes refundable if the appeal effect is given by the department.
Stock-in-trade and stores and spares
The net realizable value of stock-in-trade and stores and spares are assessed for any diminution in their respective values. Any change in the estimates in future years might affect the carrying amounts of stock-in-trade and stores and spares with the corresponding effect of the impairment. Net realizable value is determined with respect to estimated selling price less estimated expenditure to make the sale.
Trade debts, advances and other receivables
The recoverability of trade debts, advances and other receivables are reviewed at each reporting date to assess whether provision should be recorded in the profit and loss account. In particular, judgment by management is required in the estimation of the amount and timing of future cash flows when determining the level of provision required. Such estimates are based on assumptions about a number of factors and actual results may differ, resulting in future changes to the provisions.
Other areas where estimates and judgments are involved have been disclosed in respective notes to the financial statements.
3 Significant accounting policies
These accounting policies set out below have been applied consistently to all periods presented in these financial statements.
Annual Report 2014 F 09
Notes to the Financial StatementsFor the year ended December 31, 2014
3.1 Property, plant and equipment Property, plant and equipment (except freehold land, buildings on freehold land and plant and machinery) are stated
at cost less accumulated depreciation and impairment losses, if any. Freehold land is stated at revalued amount, buildings on freehold land and plant and machinery are stated at revalued amounts less accumulated depreciation and impairment losses, if any. Capital work-in-progress is stated at cost. Cost of certain property, plant and equip-ment comprises historical cost, exchange differences recognized, cost of exchange risk cover in respect of foreign currency loans obtained, if any, for the acquisition of property, plant and equipment up to the commencement of commercial production and the cost of borrowings during construction period in respect of loans taken, if any, for specific projects.
Depreciation charge is based on the straight-line method whereby the cost or revalued amount of an asset is written off to profit and loss account over its estimated useful life after taking into account the residual value, if material. Depreciation on additions is charged from the month in which the asset is available for use and on disposals up to the month preceding the disposal. The rate of depreciation is specified in Note 11.1 to these financial statements.
The residual value, depreciation method and the useful lives of each part of property, plant and equipment that is significant in relation to the total cost of the asset are reviewed, and adjusted if appropriate, at each balance sheet date.
Surplus on revaluation of property, plant and equipment is credited to the surplus on revaluation account. To the extent of the incremental depreciation charged on the revalued assets the related surplus on revaluation of property, plant and equipment (net of deferred taxation) is transferred directly to unappropriated profit.
Maintenance and normal repairs are charged to profit and loss account as and when incurred. Improvements are capitalized when it is probable that respective future economic benefits will flow to the Company and the cost of the item can be measured reliably. Assets replaced, if any, are derecognized.
Gains and losses on disposal of assets are taken to the profit and loss account, and the related surplus / deficit on revaluation of property, plant and equipment is transferred directly to retained earnings (unappropriated profits).
3.2 Intangibles
Intangible assets with a finite useful life, such as certain software, licenses (including software licenses, etc.) and property rights, are capitalized initially at cost and subsequently stated at cost less accumulated amortization and impairment losses, if any.
Subsequent expenditure is capitalized only when it increases the future economic benefits embodied in the specific asset to which it relates. All other expenditures are recognized in profit and loss account as incurred.
Amortization is based on the cost of an asset less its residual value, if any. Amortization is recognized in profit and loss on a straight-line basis over the estimated useful lives of intangible assets. Amortization methods, useful lives and residual values are reviewed at each reporting date and adjusted, if appropriate.
3.3 Stores and spares
Stores and spares are stated at the lower of cost and net realizable value. Cost is determined using weighted average method.
3.4 Stock-in-trade
Stock-in-trade is valued at lower of weighted average cost and estimated net realizable value.
Cost comprises all costs of purchase, costs of conversion and other costs incurred in bringing the inventories to their present location and condition. Net realizable value signifies the estimated selling price in the ordinary course of
Annual Report 2014 F 10
Notes to the Financial StatementsFor the year ended December 31, 2014
business less net estimated costs of completion and selling expenses.
Stock in-transit is valued at a cost, comprising invoice value plus other charges invoiced there on.
3.5 Financial instruments
3.5.1 Non-derivative financial assets
The Company initially recognises loans and receivables on the date that they are originated. All other financial assets (including assets designated as at fair value through profit or loss) are recognised initially on the trade date, which is the date that the Company becomes a party to the contractual provisions of the instrument.
The Company derecognises a financial asset when the contractual rights to the cash flows from the assets expire, or it transfers the rights to receive the contractual cash flows in a transaction in which substantially all the risks and rewards of ownership of the financial assets are transferred. Any interest in such transferred financial assets that is created or retained by the Company is recognised as a separate asset or liability.
Financial assets and liabilities are offset and the net amount presented in the statement of financial position when, and only when, the Company has a legal right to offset the amounts and intends either to settle them on a net basis or to realise the asset and settle the liability simultaneously.
The Company classifies non-derivative financial assets into the following categories:
- Financial assets at fair value through profit or loss;
- Held-to-maturity financial assets;
- Loans and receivables; and
- Available-for-sale financial assets.
Loans and receivables
Loans and receivables are financial assets with fixed or determinable payments that are not quoted in an active market. Such assets are recognised initially at fair value plus any directly attributable transaction costs. Subsequent to initial recognition, loans and receivables are measured at amortised cost using the effective interest method, less any impairment losses. A provision for impairment of loans and receivables is established when there is objective evidence that the Company will not be able to collect all amounts due according to the original terms of receivables. Loans and receivables include loans, deposits, trade debts, interest accrued, other receivables and cash and bank balances of the Company.
Cash and cash equivalents
Cash and cash equivalents comprise cash balances and call deposits with maturities of three months or less from the acquisition date that are subject to an insignificant risk of changes in their fair value, and are used by the Company in the management of its short-term commitments.
As at December 31, 2014 no financial assets of the Company are classified under following categories:
- Financial assets at fair value through profit or loss;
- Available-for-sale financial assets; and
- Held-to-maturity financial assets.
Annual Report 2014 F 11
Notes to the Financial StatementsFor the year ended December 31, 2014
3.5.2 Non-derivative financial liabilities
The Company initially recognises debt securities issued and subordinated liabilities on the date that they are originat-ed. All other financial liabilities are recognised initially on the trade date, which is the date that the Company becomes a party to the contractual provisions of the instrument.
The Company derecognises a financial liability when its contractual obligations are discharged, cancelled or expired.
The Company classifies non-derivative financial liabilities into the other financial liabilities category. Such financial liabilities are recognised initially at fair value less any directly attributable transaction costs. Subsequent to initial recognition, these financial liabilities are measured at amortised cost using the effective interest method.
3.5.3 Derivative financial instruments
These are initially recorded at fair value on the date a derivative contract is entered into and are re-measured to fair value at subsequent reporting dates. The method of recognizing the resulting gain or loss depends on whether the derivative is designated as a hedging instrument, and if so, the nature of the item being hedged. The Company does not apply hedge accounting for any derivatives.
Any gain or loss from change in fair value of derivatives that do not qualify for hedge accounting are taken directly to profit and loss account.
3.6 Impairment
Financial assets (including receivables)
Financial assets are assessed at each reporting date to determine whether there is an objective evidence that they are impaired. A financial asset is impaired if objective evidence indicates that a loss event has occurred after the initial recognition of the asset, and that the loss event had a negative effect on the estimated future cash flows of that asset that can be estimated reliably. Objective evidence that financial assets are impaired may include default or delinquen-cy by a debtor, indications that a debtor or issuer will enter bankruptcy.
All individually significant receivables are assessed for specific impairment. All individually significant receivables found not to be specifically impaired are then collectively assessed for any impairment that has been incurred but not yet identified. Receivables that are not individually significant are collectively assessed for impairment by grouping together receivables with similar risk characteristics.
An impairment loss in respect of a financial asset measured at amortized cost is calculated as the difference between its carrying amount and the present value of the estimated future cash flows discounted at the asset’s original effec-tive interest rate. Losses are recognized in profit or loss and reflected in an allowance account against receivables. Interest on the impaired asset continues to be recognized through the unwinding of the discount. When a subsequent event causes the amount of impairment loss to decrease, the decrease in impairment loss is reversed through profit and loss account.
Non-Financial assets
The carrying amounts of non-financial assets other than inventories and deferred tax asset, are reviewed at each reporting date to determine whether there is any indication of impairment. If any such indication exists, then the asset’s recoverable amount is estimated. The recoverable amount of an asset or cash-generating unit is the higher of its value in use and its fair value less costs to sell. In assessing value in use, the estimated future cash flows are discounted to their present value using a pre-tax discount rate that reflects current market assessment of the time value of money and the risks specific to the asset. For the purpose of impairment testing, assets that cannot be tested individually are grouped together into the smallest group of assets that generates cash inflows from continuing use that are largely independent of the cash inflows of other assets or groups of assets (the “cash-generating unit, or CGU”).
Annual Report 2014 F 12
Notes to the Financial StatementsFor the year ended December 31, 2014
The Company’s corporate assets do not generate separate cash inflows. If there is an indication that a corporate asset may be impaired, then the recoverable amount is determined for the CGU to which the corporate asset belongs. An impairment loss is recognized if the carrying amount of an asset or its CGU exceeds its estimated recov-erable amount. Impairment losses are recognized in profit and loss account.
Impairment loss recognized in prior periods is assessed at each reporting date for any indications that the loss has decreased or no longer exists. An impairment loss is reversed if there has been a change in the estimates that are used to determine the recoverable amount. An impairment loss is reversed only to the extent that the asset’s carrying amount does not exceed the carrying amount that would have been determined, net of depreciation or amortization, if no impairment loss had been recognized.
3.7 Share capital (ordinary shares)
Ordinary shares are classified as equity. Incremental costs directly attributable to the issue of ordinary shares are recognised as a deduction from equity, net of any tax effects.
3.8 Staff retirement benefits
The Company’s retirement benefit plans comprise of provident funds, pensions, gratuity schemes and a medical scheme for eligible retired employees.
Defined benefit plans
The Company operates a funded pension scheme and a funded gratuity scheme for management staff. The pension and gratuity schemes are salary schemes providing pension and lump sums, respectively. Pension and gratuity schemes for management staff are invested through two approved trust funds. The Company also operates gratuity scheme for non-management staff and the pensioners' medical scheme which are unfunded. The pension and gratu-ity plans are final salary plans. The pensioners' medical plan reimburses actual medical expenses to pensioners as per entitlement. The Company recognizes expense in accordance with IAS 19 ‘Employee Benefits’.
All past service costs are recognized at earlier of when the amendment or curtailment occurs and when the Company has recognised related restructuring or termination benefits.
The Company's net obligation in respect of defined benefit plans is calculated separately for each plan by estimating the amount of future benefit that employees have earned in the current and prior periods, discounting that amount and deducting the fair value of any plan assets. The calculation of defined benefit obligations is performed annually by a qualified actuary using the projected unit credit method. When the calculation results in a potential asset for the Company, the recognised asset is limited to the present value of economic benefits available in the form of any future refunds from the plan or reductions in future contributions to the plan. To calculate the present value of economic benefits, consideration is given to any applicable minimum funding requirements.
Remeasurements of the net defined benefit liability, which comprise actuarial gains and losses, the return on plan
assets (excluding interest) and the effect of the asset ceiling (if any, excluding interest), are recognised immediately in other comprehensive income. The Company determines the net interest expense (income) on the net defined benefit liability (asset) for the period by applying the discount rate used to measure the defined benefit obligation at the beginning of the annual period to the then-net defined benefit liability (asset), taking into account any changes in the net defined benefit liability (asset) during the period as a result of contributions and benefit payments. Net interest expense and other expenses related to defined benefit plans are recognised in profit and loss account.
When the benefits of a plan are changed or when a plan is curtailed, the resulting change in benefit that relates to past service or the gain or loss on curtailment is recognised immediately in profit and loss account. The Company recognises gains and losses on the settlement of a defined benefit plan when the settlement occurs.
Annual Report 2014 F 13
Notes to the Financial StatementsFor the year ended December 31, 2014
Defined contribution plans
The Company operates two registered contributory provident funds for its permanent staff and a registered defined contribution superannuation fund for its management staff, who have either opted for this fund by July 31, 2004 or have joined the Company after April 30, 2004. In addition to this the Company also provides group insurance to all its employees.
Obligations for contributions to defined contribution plans are expensed as the related service is provided. Prepaid contributions are recognised as an asset to the extent that a cash refund or a reduction in future payments is available.
3.9 Provisions
A provision is recognized in the balance sheet when the Company has a legal or constructive obligation as a result of a past event, and it is probable that an outflow of economic benefits will be required to settle the obligation and a reliable estimate can be made of the amount of obligation. The amount recognized as a provision reflects the best estimate of the expenditure required to settle the present obligation at the end of the reporting period.
3.10 Contingent liabilities
Contingent liability is disclosed when:
- there is a possible obligation that arises from past events and whose existence will be confirmed only by the occurrence or non occurrence of one or more uncertain future events not wholly within the control of the Com-pany; or
- there is present obligation that arises from past events but it is not probable that an outflow of resources embodying economic benefits will be required to settle the obligation or the amount of the obligation cannot be measured with sufficient reliability.
3.11 Revenue recognition
Revenue from the sale of goods is recognized when the significant risks and rewards of ownership have been trans-ferred to the customer.
Profit on short-term deposits is accounted for on a time-apportioned basis using the effective interest rate method.
3.12 Financial expenses and financial income
Financial expenses are recognized using the effective interest rate method and comprise foreign currency losses and mark-up / interest expense on borrowings.
Financial income comprises interest income on funds invested and foreign currency gains. Mark-up / interest income is recognized as it accrues in profit and loss account, using the effective interest rate method.
3.13 Operating lease / Ijarah contracts
Leases in which a significant portion of the risks and rewards of ownership are retained by the lessor are classified as operating leases. Payments made under operating leases / Ijarah contracts (net of any incentives received from the lessor) are charged to the profit and loss account on a straight-line basis over the period of the lease.
3.14 Borrowing cost
Borrowing costs are recognized as an expense in the period in which these are incurred except to the extent of borrowing costs that are directly attributable to the acquisition, construction or production of a qualifying asset. Such
Annual Report 2014 F 14
Notes to the Financial StatementsFor the year ended December 31, 2014
borrowing costs, if any, are capitalized as part of the cost of that asset.
3.15 Foreign currency translation
Transactions denominated in foreign currencies are translated into Pak Rupees, at the foreign exchange rates prevailing at the date of transaction. Monetary assets and liabilities in foreign currencies are translated into Pak Rupees at the foreign exchange rates at the balance sheet date. Exchange differences are taken to the profit and loss account.
3.16 Taxation
Income tax expense comprises current and deferred tax. Income tax expense is recognized in the profit and loss account, except to the extent that it relates to items recognized directly in other comprehensive income or below equity, in which case it is recognized in other comprehensive income or below equity respectively.
Current
Provision for current taxation is based on taxable income at the enacted or substantively enacted rates of taxation after taking into account available tax credits and rebates, if any. The charge for current tax includes adjustments to charge for prior years, if any.
Deferred
Deferred tax is recognized using balance sheet method, providing for temporary differences between the carrying amounts of assets and liabilities for financial reporting purposes and the amounts used for taxation purposes. The amount of deferred tax provided is based on the expected manner of realization or settlement of the carrying amount of assets and liabilities, using the enacted or substantively enacted rates of taxation.
The Company recognizes a deferred tax asset to the extent that it is probable that taxable profits for the foreseeable future will be available against which the asset can be utilized. Deferred tax assets are reduced to the extent that it is no longer probable that the related tax benefit will be realized. Further, the Company recognizes deferred tax asset / liability on deficit / surplus on revaluation of property, plant and equipment which is adjusted against the related deficit / surplus.
3.17 Earnings per share
The Company presents basic and diluted earnings per share (EPS) data for its ordinary shares. Basic EPS is calculat-ed by dividing the profit after tax attributable to ordinary shareholders of the Company by the weighted average number of ordinary shares outstanding during the period. Diluted EPS is determined by adjusting the profit or loss attributable to ordinary shareholders and the weighted average number of ordinary shares outstanding for the effects of all dilutive potential ordinary shares.
3.18 Dividend and other appropriations
Dividend is recognised as a liability in the period in which it is declared and approved. Appropriations of profit are reflected in the statement of changes in equity in the period in which such appropriations are approved.
3.19 Related party transactions
The Company enters into transactions with related parties on arm's length basis except in rare circumstances where, subject to approval of Board of Directors, it is in the interest of the Company to do so.
4 Initial application of new standards, interpretations or amendments to existing standards and forthcoming requirements
Annual Report 2014 F 15
Notes to the Financial StatementsFor the year ended December 31, 2014
4.1 Standards, amendments or interpretations which became effective during the year
During the year certain amendments to standards or new interpretations became effective, however, the amend-ments or interpretation did not have any material effect on the financial statements of the Company.
4.2 New accounting standards and IFRIC interpretations that are not yet effective
The following standards, amendments and interpretations of approved accounting standards will be effective for accounting periods beginning on or after January 01, 2015:
- Amendments to IAS 19 ‘Employee Benefits’ Employee contributions – a practical approach (effective for annual periods beginning on or after July 01, 2014). The practical expedient addresses an issue that arose when amendments were made in 2011 to the previous pension accounting requirements. The amendments introduce a relief that will reduce the complexity and burden of accounting for certain contributions from employees or third parties. The amendments are relevant only to defined benefit plans that involve contributions from employees or third parties meeting certain criteria. This amendment is not likely to have any material impact on the financial statements of the Company.
- Amendments to IAS 38 ‘Intangible Assets’ and IAS 16 ‘Property, Plant and Equipment’ (effective for annual periods beginning on or after January 01, 2016) introduce severe restrictions on the use of revenue-based amortization for intangible assets and explicitly state that revenue-based methods of depreciation cannot be used for property, plant and equipment. The rebuttable presumption that the use of revenue-based amortiza-tion methods for intangible assets is inappropriate can be overcome only when revenue and the consumption of the economic benefits of the intangible asset are ‘highly correlated’, or when the intangible asset is expressed as a measure of revenue. These amendments are not likely to have an impact on the financial state-ments of the Company.
- IFRS 10 ‘Consolidated Financial Statements’ – (effective for annual periods beginning on or after January 01, 2015) replaces the part of IAS 27 ‘Consolidated and Separate Financial Statements’. IFRS 10 introduces a new approach to determining which investees should be consolidated. The single model to be applied in the control analysis requires that an investor controls an investee when the investor is exposed, or has rights, to variable returns from its involvement with the investee and has the ability to affect those returns through its power over the investee. IFRS 10 has made consequential changes to IAS 27 which is now called ‘Separate Financial State-ments’ and will deal with only separate financial statements. Certain further amendments have been made to IFRS 10, IFRS 12 and IAS 28 clarifying the requirements relating to accounting for investment entities and would be effective for annual periods beginning on or after January 01, 2016. The standard has no impact on the financial statements of the Company.
- IFRS 11 ‘Joint Arrangements’ (effective for annual periods beginning on or after January 01, 2015) replaces IAS 31 ‘Interests in Joint Ventures’. Firstly, it carves out, from IAS 31 jointly controlled entities, those cases in which although there is a separate vehicle, that separation is ineffective in certain ways. These arrangements are treated similarly to jointly controlled assets/operations under IAS 31 and are now called joint operations. Secondly, the remainder of IAS 31 jointly controlled entities, now called joint ventures, are stripped of the free choice of using the equity method or proportionate consolidation; they must now always use the equity method. IFRS 11 has also made consequential changes in IAS 28 which has now been named ‘Investment in Associates and Joint Ventures’. The amendments requiring business combination accounting to be applied to acquisitions of interests in a joint operation that constitutes a business are effective for annual periods begin-ning on or after January 01, 2016. The adoption of this standard is not likely to have an impact on the financial statements of the Company.
- IFRS 12 ‘Disclosure of Interest in Other Entities’ (effective for annual periods beginning on or after January 01, 2015) combines the disclosure requirements for entities that have interests in subsidiaries, joint arrangements (i.e. joint operations or joint ventures), associates and/or unconsolidated structured entities, into one place. The standard is not likely to have any impact on the financial statements of the Company.
Annual Report 2014 F 16
Notes to the Financial StatementsFor the year ended December 31, 2014
- IFRS 13 ‘Fair Value Measurement’ (effective for annual periods beginning on or after January 01, 2015) defines fair value, establishes a framework for measuring fair value and sets out disclosure requirements for fair value measurements. IFRS 13 explains how to measure fair value when it is required by other IFRSs. It does not introduce new fair value measurements, nor does it eliminate the practicability exceptions to fair value measurements that currently exist in certain standards. The adoption of this standard is likely to increase certain disclosures related to the fair value measurements.
- Amendment to IAS 27 ‘Separate Financial Statement’ (effective for annual periods beginning on or after January 01, 2016). The amendments to IAS 27 will allow entities to use the equity method to account for investments in subsidiaries, joint ventures and associates in their separate financial statements. This amendment is not likely to have any impact on the financial statements of the Company.
- Agriculture: Bearer Plants [Amendment to IAS 16 and IAS 41] (effective for annual periods beginning on or after January 01, 2016). Bearer plants are now in the scope of IAS 16 ‘Property, Plant and Equipment’ for measure-ment and disclosure purposes. Therefore, a company can elect to measure bearer plants at cost. However, the produce growing on bearer plants will continue to be measured at fair value less costs to sell under IAS 41 ‘Agriculture’. A bearer plant is a plant that: is used in the supply of agricultural produce; is expected to bear produce for more than one period; and has a remote likelihood of being sold as agricultural produce. Before maturity, bearer plants are accounted for in the same way as self-constructed items of property, plant and equipment during construction. This amendment is not likely to have any impact on the financial statements of the Company.
- Sale or Contribution of Assets between an Investor and its Associate or Joint Venture (Amendments to IFRS 10 and IAS 28) [effective for annual periods beginning on or after January 01, 2016]. The main consequence of the amendments is that a full gain or loss is recognised when a transaction involves a business (whether it is housed in a subsidiary or not). A partial gain or loss is recognised when a transaction involves assets that do not constitute a business, even if these assets are housed in a subsidiary. This amendment is not likely to have any impact on the financial statements of the Company.
Annual Improvements 2010-2012 and 2011-2013 cycles (most amendments will apply prospectively for annual periods beginning on or after July 01, 2014). The new cycle of improvements contain amendments to the following standards:
- IFRS 2 ‘Share-based Payment’. IFRS 2 has been amended to clarify the definition of ‘vesting condition’ by separately defining ‘performance condition’ and ‘service condition’.
- IFRS 3 ‘Business Combinations’. These amendments clarify the classification and measurement of contingent consideration in a business combination.
- IFRS 8 ‘Operating Segments’ has been amended to explicitly require the disclosure of judgments made by management in applying the aggregation criteria.
- Amendments to IAS 16 ‘Property, plant and equipment’ and IAS 38 ‘Intangible Assets’. The amendments clarify the requirements of the revaluation model in IAS 16 and IAS 38, recognizing that the restatement of accumulat-ed depreciation (amortization) is not always proportionate to the change in the gross carrying amount of the asset.
- IAS 24 ‘Related Party Disclosure’. The definition of related party is extended to include a management entity that provides key management personnel services to the reporting entity, either directly or through a group entity.
- IAS 40 ‘Investment Property’. IAS 40 has been amended to clarify that an entity should: assess whether an acquired property is an investment property under IAS 40 and perform a separate assessment under IFRS 3 to determine whether the acquisition of the investment property constitutes a business combination.
Annual Report 2014 F 17
Annual Report 2014 F 18
Notes to the Financial StatementsFor the year ended December 31, 2014
Amounts in Rs ‘000
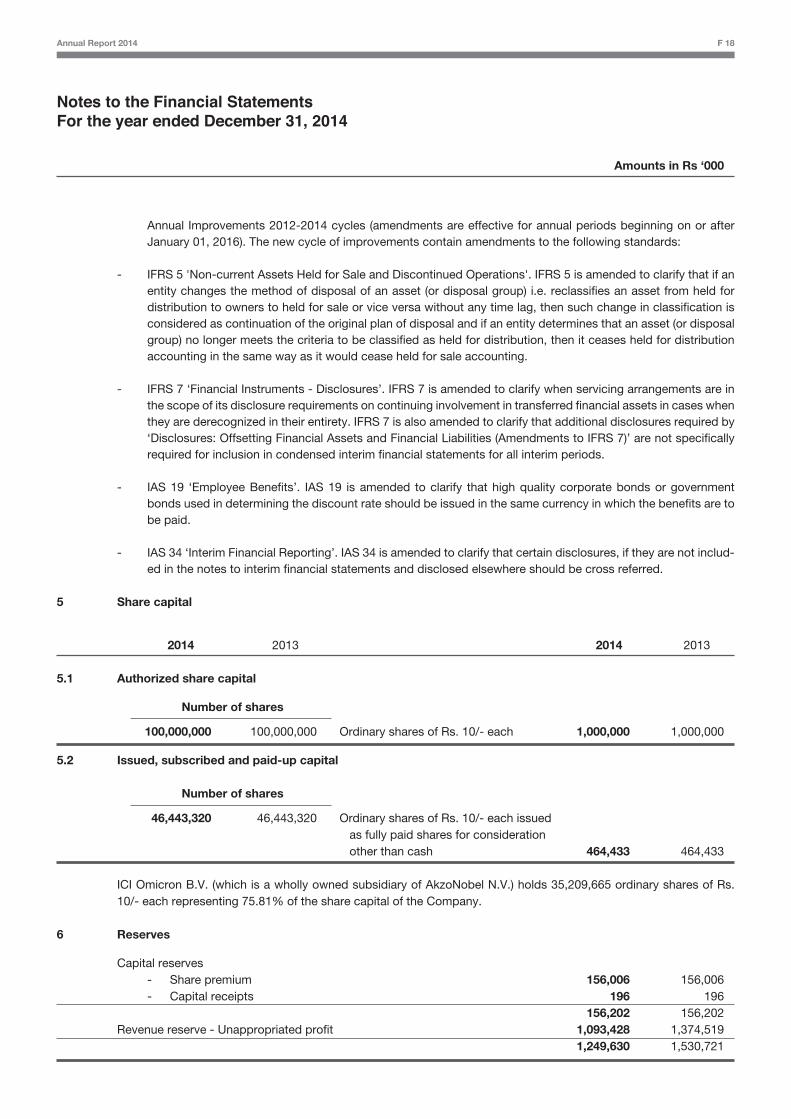
Annual Improvements 2012-2014 cycles (amendments are effective for annual periods beginning on or after January 01, 2016). The new cycle of improvements contain amendments to the following standards:
- IFRS 5 'Non-current Assets Held for Sale and Discontinued Operations'. IFRS 5 is amended to clarify that if an entity changes the method of disposal of an asset (or disposal group) i.e. reclassifies an asset from held for distribution to owners to held for sale or vice versa without any time lag, then such change in classification is considered as continuation of the original plan of disposal and if an entity determines that an asset (or disposal group) no longer meets the criteria to be classified as held for distribution, then it ceases held for distribution accounting in the same way as it would cease held for sale accounting.
- IFRS 7 ‘Financial Instruments - Disclosures’. IFRS 7 is amended to clarify when servicing arrangements are in the scope of its disclosure requirements on continuing involvement in transferred financial assets in cases when they are derecognized in their entirety. IFRS 7 is also amended to clarify that additional disclosures required by ‘Disclosures: Offsetting Financial Assets and Financial Liabilities (Amendments to IFRS 7)’ are not specifically required for inclusion in condensed interim financial statements for all interim periods.
- IAS 19 ‘Employee Benefits’. IAS 19 is amended to clarify that high quality corporate bonds or government bonds used in determining the discount rate should be issued in the same currency in which the benefits are to be paid.
- IAS 34 ‘Interim Financial Reporting’. IAS 34 is amended to clarify that certain disclosures, if they are not includ-ed in the notes to interim financial statements and disclosed elsewhere should be cross referred.
5 Share capital
2014 2013 2014 2013
5.1 Authorized share capital
Number of shares
100,000,000 100,000,000 Ordinary shares of Rs. 10/- each 1,000,000 1,000,000
5.2 Issued, subscribed and paid-up capital
Number of shares
46,443,320 46,443,320 Ordinary shares of Rs. 10/- each issued as fully paid shares for consideration other than cash 464,433 464,433
ICI Omicron B.V. (which is a wholly owned subsidiary of AkzoNobel N.V.) holds 35,209,665 ordinary shares of Rs. 10/- each representing 75.81% of the share capital of the Company.
6 Reserves
Capital reserves - Share premium 156,006 156,006 - Capital receipts 196 196 156,202 156,202 Revenue reserve - Unappropriated profit 1,093,428 1,374,519 1,249,630 1,530,721

Annual Report 2014 F 19
Notes to the Financial StatementsFor the year ended December 31, 2014
Amounts in Rs ‘000
2014 2013
7 Surplus on revaluation of property, plant and equipment
This represents surplus arising on revaluation of freehold land, buildings on freehold land and plant and machinery carried out in December 2011.
Balance at beginning of the year 883,192 886,140 Transfer to unappropriated profit in respect of incremental depreciation during the year - net of deferred tax (2,994) (2,948) Balance at end of the year 880,198 883,192
8 Deferred liabilities
8.1 The amounts recognized in the balance sheet are:
Unfunded - recognized in deferred liability 44,227 34,817 Payable to employee retirement benefit fund: - Pension fund 2,571 38,398 - Gratuity fund 73,898 76,297 76,469 114,695 120,696 149,512
2014 2013
Funded Funded
Pension Gratuity Sub Total Pension Gratuity Sub Total
8.2 The amounts recognized in the profit and loss account against defined benefit schemes are as follows:
Current service cost 11,077 13,947 25,024 1,414 26,438 7,167 10,993 18,160 1,448 19,608
Interest cost 34,000 26,384 60,384 4,480 64,864 22,208 18,674 40,882 4,065 44,947
Expected return on plan assets (30,024) (17,809) (47,833) - (47,833) (18,298) (11,901) (30,199) - (30,199)
15,053 22,522 37,575 5,894 43,469 11,077 17,766 28,843 5,513 34,356
Past service cost / (reversal) - - - - - (37,911) (16,666) (54,577) (11,089) (65,666)
Net charge / (reversal) for the year 15,053 22,522 37,575 5,894 43,469 (26,834) 1,100 (25,734) (5,576) (31,310)
8.3 Included in other comprehensive income:
Remeasurement of plan obligation from:
- Change in demographic assumptions - - - - - 1,768 (1,130) 638 4,763 5,401
- Change in financial assumptions - - - - - 496 304 800 113 913
- Experience on obligation 25,208 3,828 29,036 (4,194) 24,842 (56,534) (20,959) (77,493) 480 (77,013)
Return on plan assets, excluding
interest income 10,047 - 10,047 - 10,047 29,267 9,157 38,424 - 38,424
35,255 3,828 39,083 (4,194) 34,889 (25,003) (12,628) (37,631) 5,356 (32,275)
Unfunded Total Unfunded Total

Amounts in Rs ‘000
2014 2013
Funded Funded
Note Pension Gratuity Sub Total Pension Gratuity Sub Total
8.4 Movement in the net asset / (liability) recognized in the balance sheet are as follows:
Balance at beginning of the year (38,398) (76,297) (114,695) (34,817) (149,512) (60,362) (85,523) (145,885) (46,549) (192,434)
Net charge / (reversal) for the year 8.2 (15,053) (22,522) (37,575) (5,894) (43,469) 26,834 (1,100) 25,734 5,576 31,310
Contributions / payments 15,625 21,093 36,718 678 37,396 20,133 22,954 43,087 800 43,887
Actuarial gain / (loss) charged to OCI 8.3 35,255 3,828 39,083 (4,194) 34,889 (25,003) (12,628) (37,631) 5,356 (32,275)
Balance at end of the year (2,571) (73,898) (76,469) (44,227) (120,696) (38,398) (76,297) (114,695) (34,817) (149,512)
8.5 The amounts recognized in the balance sheet are as follows:
Fair value of plan assets 278,840 163,503 442,343 - 442,343 223,144 129,017 352,161 - 352,161
Present value of defined benefit obligation (281,411) (237,401) (518,812) (44,227) (563,039) (261,542) (205,314) (466,856) (34,817) (501,673)
Liability recognized (2,571) (73,898) (76,469) (44,227) (120,696) (38,398) (76,297) (114,695) (34,817) (149,512)
8.6 Movement in the present value of defined benefit obligation:
Balance at beginning of the year 261,542 205,314 466,856 34,817 501,673 224,922 175,301 400,223 35,460 435,683
Current service cost 11,077 14,245 25,322 1,414 26,736 7,167 10,993 18,160 1,448 19,608
Interest cost 34,000 26,384 60,384 4,480 64,864 22,208 18,674 40,882 4,065 44,947
Benefits paid - (4,714) (4,714) (678) (5,392) (47,025) (21,439) (68,464) (800) (69,264)
Actuarial loss / (gain) (25,208) (3,828) (29,036) 4,194 (24,842) 54,270 21,785 76,055 (5,356) 70,699
Balance at end of the year 281,411 237,401 518,812 44,227 563,039 261,542 205,314 466,856 34,817 501,673
8.7 Movement in the fair value of plan assets:
Balance at beginning of the year 223,144 129,017 352,161 - 352,161 202,471 106,444 308,915 - 308,915
Expected return 30,024 17,809 47,833 - 47,833 18,298 11,901 30,199 - 30,199
Contributions 15,625 21,391 37,016 - 37,016 20,133 22,954 43,087 - 43,087
Benefits paid - (4,714) (4,714) - (4,714) (47,025) (21,439) (68,464) - (68,464)
Actuarial gain / (loss) 10,047 - 10,047 - 10,047 29,267 9,157 38,424 - 38,424
Balance at end of the year 278,840 163,503 442,343 - 442,343 223,144 129,017 352,161 - 352,161
8.8 Plan assets comprise:
Government bonds 156,333 127,311 283,644 - 283,644 118,654 94,220 212,874 - 212,874
Corporate bonds - 1,057 1,057 - 1,057 - 1,491 1,491 - 1,491
Mutual funds – debt 713 21 734 - 734 666 20 686 - 686
Equity instrument 121,546 35,025 156,571 - 156,571 103,228 28,542 131,770 - 131,770
Level 3 adjustment - - - - - 513 4,328 4,841 - 4,841
Cash 248 89 337 - 337 83 416 499 - 499
278,840 163,503 442,343 - 442,343 223,144 129,017 352,161 - 352,161
Notes to the Financial StatementsFor the year ended December 31, 2014
Annual Report 2014 F 20
Unfunded Total Unfunded Total
Notes to the Financial StatementsFor the year ended December 31, 2014
Amounts in Rs ‘000
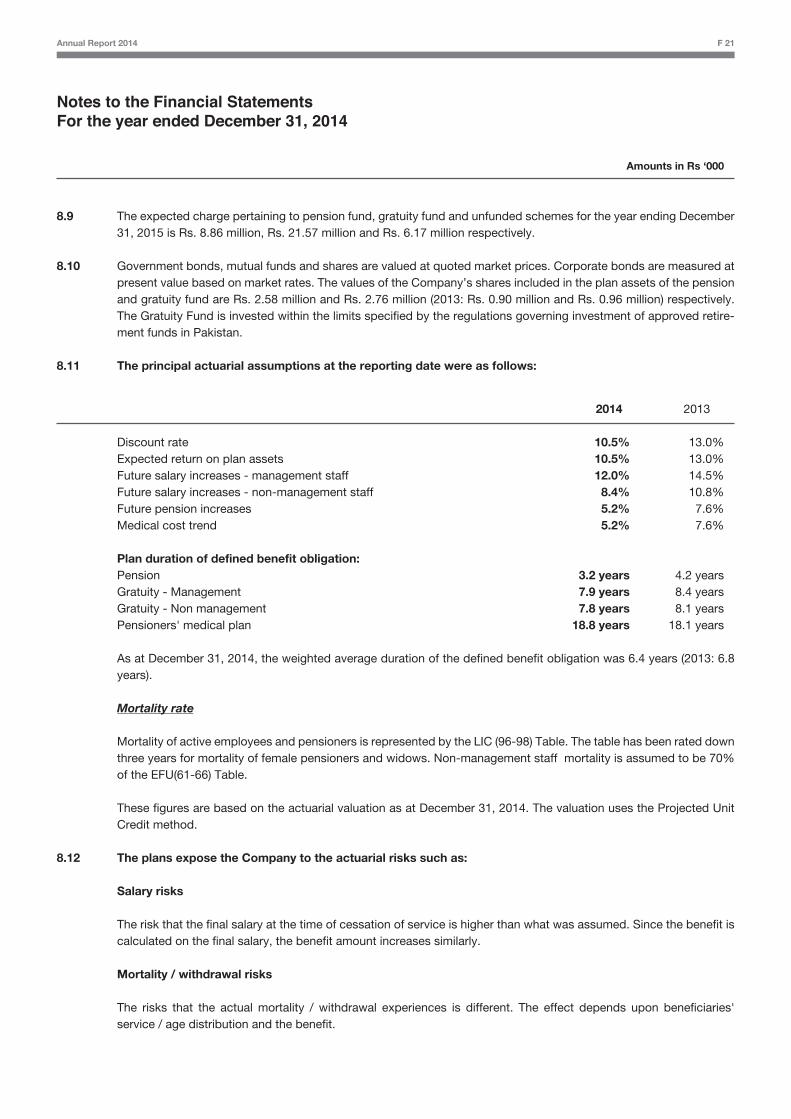
8.9 The expected charge pertaining to pension fund, gratuity fund and unfunded schemes for the year ending December 31, 2015 is Rs. 8.86 million, Rs. 21.57 million and Rs. 6.17 million respectively.
8.10 Government bonds, mutual funds and shares are valued at quoted market prices. Corporate bonds are measured at present value based on market rates. The values of the Company’s shares included in the plan assets of the pension and gratuity fund are Rs. 2.58 million and Rs. 2.76 million (2013: Rs. 0.90 million and Rs. 0.96 million) respectively. The Gratuity Fund is invested within the limits specified by the regulations governing investment of approved retire-ment funds in Pakistan.
8.11 The principal actuarial assumptions at the reporting date were as follows:
2014 2013
Discount rate 10.5% 13.0% Expected return on plan assets 10.5% 13.0% Future salary increases - management staff 12.0% 14.5% Future salary increases - non-management staff 8.4% 10.8% Future pension increases 5.2% 7.6% Medical cost trend 5.2% 7.6%
Plan duration of defined benefit obligation: Pension 3.2 years 4.2 years Gratuity - Management 7.9 years 8.4 years Gratuity - Non management 7.8 years 8.1 years Pensioners' medical plan 18.8 years 18.1 years
As at December 31, 2014, the weighted average duration of the defined benefit obligation was 6.4 years (2013: 6.8 years).
Mortality rate
Mortality of active employees and pensioners is represented by the LIC (96-98) Table. The table has been rated down three years for mortality of female pensioners and widows. Non-management staff mortality is assumed to be 70% of the EFU(61-66) Table.
These figures are based on the actuarial valuation as at December 31, 2014. The valuation uses the Projected Unit Credit method.
8.12 The plans expose the Company to the actuarial risks such as:
Salary risks
The risk that the final salary at the time of cessation of service is higher than what was assumed. Since the benefit is calculated on the final salary, the benefit amount increases similarly.
Mortality / withdrawal risks
The risks that the actual mortality / withdrawal experiences is different. The effect depends upon beneficiaries' service / age distribution and the benefit.
Annual Report 2014 F 21
Notes to the Financial StatementsFor the year ended December 31, 2014
Investment risks
The risk of the investment underperforming and not being sufficient to meet the liabilities. This is managed by formu-lating an investment policy and guidelines based on which investments are made after obtaining approval of trustees of funds.
8.13 In case of the funded plans, it is ensured that the long-term investments are in line with the obligation under the retire-ment benefit plan. Duration and the expected yield of the investments are matched with the expected cash outflows arising from the retirement benefit plan obligations. The process used to manage its risks has not been changed from previous periods. Investments are well diversified and large portion plans' assets in 2014 consist of Government Securities.
8.14 The expected return on plan assets was determined by considering the expected returns available on the assets underlying the current investment policy. Expected yields on fixed interest investments are based on gross redemp-tion yields as at the balance sheet date. Expected return on equity investments reflect long-term real rates of return experienced in the market.
8.15 Under the pension plan, management staff gratuity, non-management staff gratuity and pensioners' medical plan the normal retirement age is 60 years. For management staff who joined before February 1988, the normal retirement age is 58 years for men and 55 years for women. Currently the Company has following plans:
Pension
Pension scheme entitles the members to pension, subject to the conditions laid down in the rules, on reaching the normal retirement age of 60 years, disability, early retirement or death in which case the surviving spouse and the children under age of 25 shall be entitled.
Retirement benefit is a pension of 1.25% of final gross salary for each year of service less actuarial equivalent of any gratuity, if service is at least 10 years. Members may commute upto one-half of pension and the trustees may commute the balance.
The Trustees increase pensions in payment on an ad-hoc basis to provide some relief against inflation. The plan guarantees a minimum annual increase of 6%.
Gratuity
Gratuity scheme entitles the members to gratuity on resignation, termination, retirement, early retirement, retrench-ment, death and dismissal based on the Company's Service rules.
Gratuity is based on the last month basic salary for each year of service.
Pensioners’ Medical Plan
The pensioners' medical plan reimburses medical expense to retirees, their wives and widows and widows of management staff employees who died in service. Benefits are limited to a maximum amount depending on grade at retirement.
8.16 The Pension and Gratuity management plans are fully funded. The funds are legally separate from the Company and are recognized by the Commissioner of Income Tax under Income tax rules, 2002. Members do not contribute to the pension and gratuity funds. The Company contributes at rates advised by the actuary. The contributions are equal to current service cost with adjustment for any deficit. If their is a surplus, the Company takes a contribution holiday.
Annual Report 2014 F 22
Notes to the Financial StatementsFor the year ended December 31, 2014
Amounts in Rs ‘000
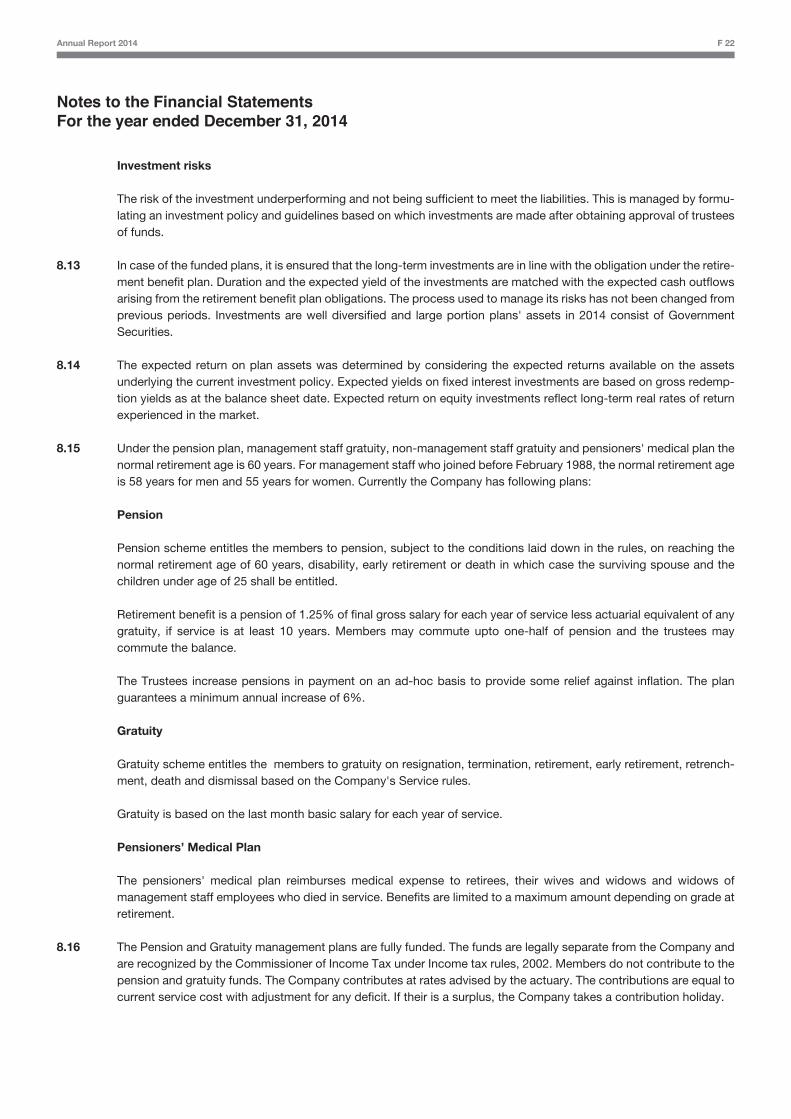
8.17 Sensitivity analysis
Reasonably possible changes at the reporting date to one of the relevant actuarial assumptions, holding other assumptions constant, would have affected the defined benefit obligation by the amounts shown below:
Impact on defined benefit obligation Change in Increase in Decrease in assumption assumption assumption
Discount rate 1% (28,804) 33,519
Salary growth rate 1% 25,334 (22,903)
Pension growth rate 1% - -
Medical cost trend rate 1% 7,156 (5,720)
If life expectancy increases by 1 year, the obligation decreases by Rs. 0.17 million.
The impact of changes in assumption has been determined by revaluation of the obligations on different rates.
8.18 The Company contributed Rs. 18.11 million (2013: Rs. 17.42 million) and Rs. 11.80 million (2013: Rs. 10.78 million) to
the provident fund and the defined contribution superannuation fund respectively during the year.
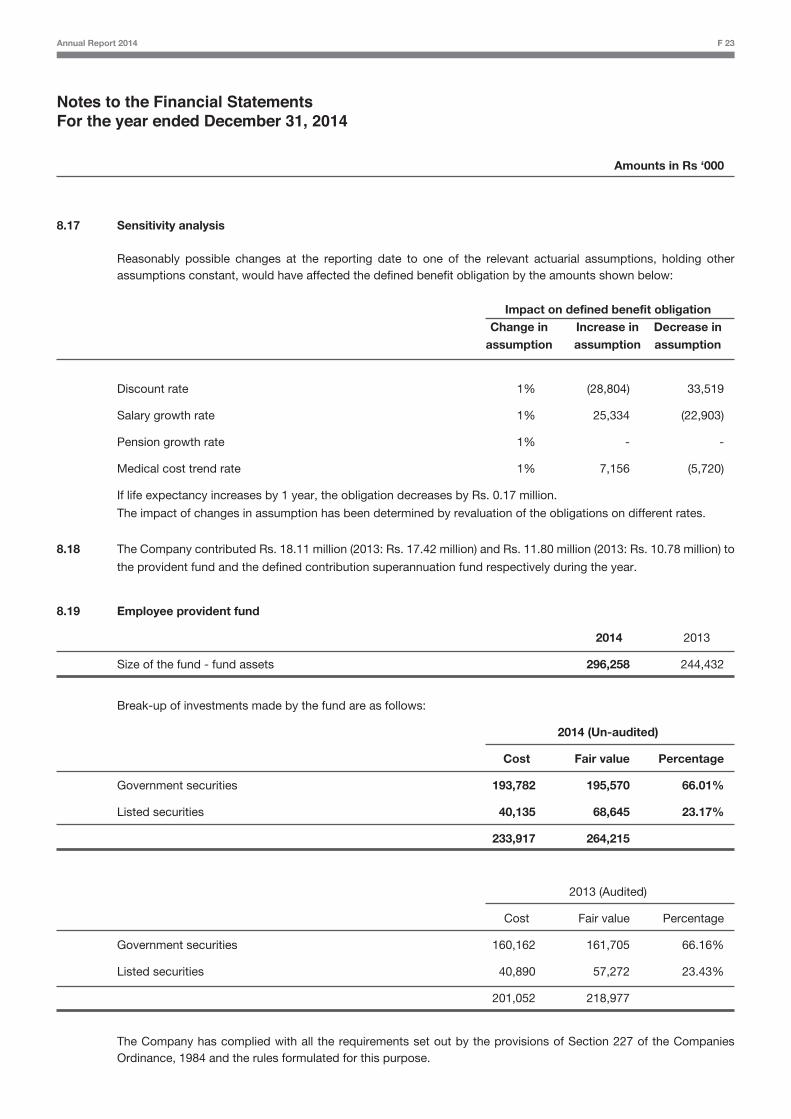
8.19 Employee provident fund
2014 2013
Size of the fund - fund assets 296,258 244,432
Break-up of investments made by the fund are as follows:
2014 (Un-audited)
Cost Fair value Percentage
Government securities 193,782 195,570 66.01%
Listed securities 40,135 68,645 23.17%
233,917 264,215
2013 (Audited)
Cost Fair value Percentage
Government securities 160,162 161,705 66.16%
Listed securities 40,890 57,272 23.43%
201,052 218,977
The Company has complied with all the requirements set out by the provisions of Section 227 of the Companies
Ordinance, 1984 and the rules formulated for this purpose.
Annual Report 2014 F 23
Notes to the Financial StatementsFor the year ended December 31, 2014
Amounts in Rs ‘000
Note 2014 2013
9 Trade and other payables
Creditors:
- local 561,793 486,463
- foreign 9.1 116,620 236,061
678,413 722,524
Royalty and technical service fee 9.2 196,738 88,130
Accrued liabilities 202,161 253,978
Advances from customers 34,687 45,196
Sales tax, excise and custom duties 31,494 39,817
Workers' Profit Participation Fund 9.3 35,844 49,312
Workers' Welfare Fund 9.4 9,733 8,517
Payable for capital expenditure 1,717 1,633
Withholding tax payable 8,484 3,317
Unpaid dividend 2,156 1,746
Payable to employee retirement benefit funds 8.1 76,469 114,695
Others 1,095 800
1,278,991 1,329,665
9.1 This includes balances due to following related parties:
AkzoNobel N.V. 39,424 46,806
AkzoNobel Car Refinishes B.V. 13,977 27,447
AkzoNobel Chemicals (Ningbo) Co. Ltd. 13,932 8,736
International Paint Saudi Arabia 5,727 14,410
AkzoNobel UAE Paints LLC 1,549 4,992
AkzoNobel Surface Chemistry AB 1,157 -
Imperial Chemical Industries Ltd. 554 1,077
AkzoNobel Packaging Coatings S.A 213 252
International Paint Netherlands 177 190
AkzoNobel (Asia Pacific) Pte Ltd. 17 19
AkzoNobel Functional Chemicals AB - 23,223
76,727 127,152
9.2 This includes royalty and technical service fee payable to following related parties:
Imperial Chemical Industries Ltd. 163,899 80,683
AkzoNobel Coatings International B.V. 25,139 4,257
AkzoNobel Chemicals International B.V. 3,945 193
192,983 85,133
Annual Report 2014 F 24
Notes to the Financial StatementsFor the year ended December 31, 2014
Amounts in Rs ‘000
Note 2014 2013
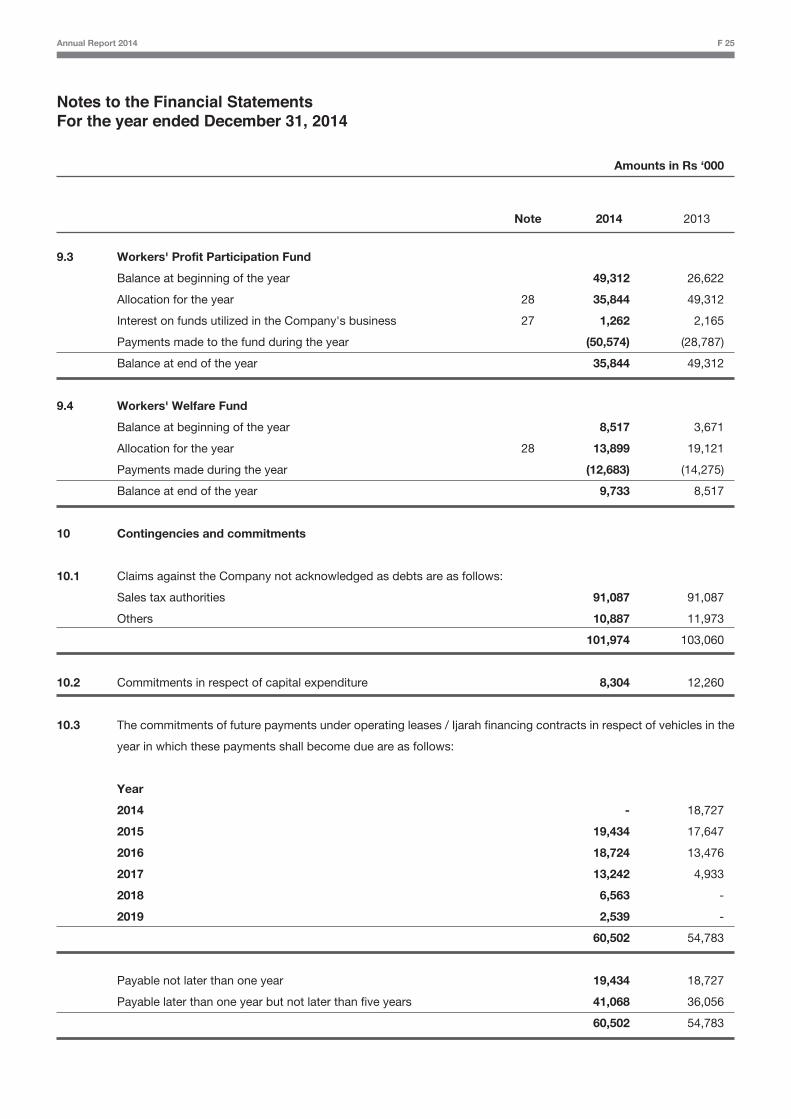
9.3 Workers' Profit Participation Fund
Balance at beginning of the year 49,312 26,622
Allocation for the year 28 35,844 49,312
Interest on funds utilized in the Company's business 27 1,262 2,165
Payments made to the fund during the year (50,574) (28,787)
Balance at end of the year 35,844 49,312
9.4 Workers' Welfare Fund
Balance at beginning of the year 8,517 3,671
Allocation for the year 28 13,899 19,121
Payments made during the year (12,683) (14,275)
Balance at end of the year 9,733 8,517
10 Contingencies and commitments
10.1 Claims against the Company not acknowledged as debts are as follows:
Sales tax authorities 91,087 91,087
Others 10,887 11,973
101,974 103,060
10.2 Commitments in respect of capital expenditure 8,304 12,260
10.3 The commitments of future payments under operating leases / Ijarah financing contracts in respect of vehicles in the
year in which these payments shall become due are as follows:
Year
2014 - 18,727
2015 19,434 17,647
2016 18,724 13,476
2017 13,242 4,933
2018 6,563 -
2019 2,539 -
60,502 54,783
Payable not later than one year 19,434 18,727
Payable later than one year but not later than five years 41,068 36,056
60,502 54,783
Annual Report 2014 F 25
Notes to the Financial StatementsFor the year ended December 31, 2014
Amounts in Rs ‘000
Note 2014 2013
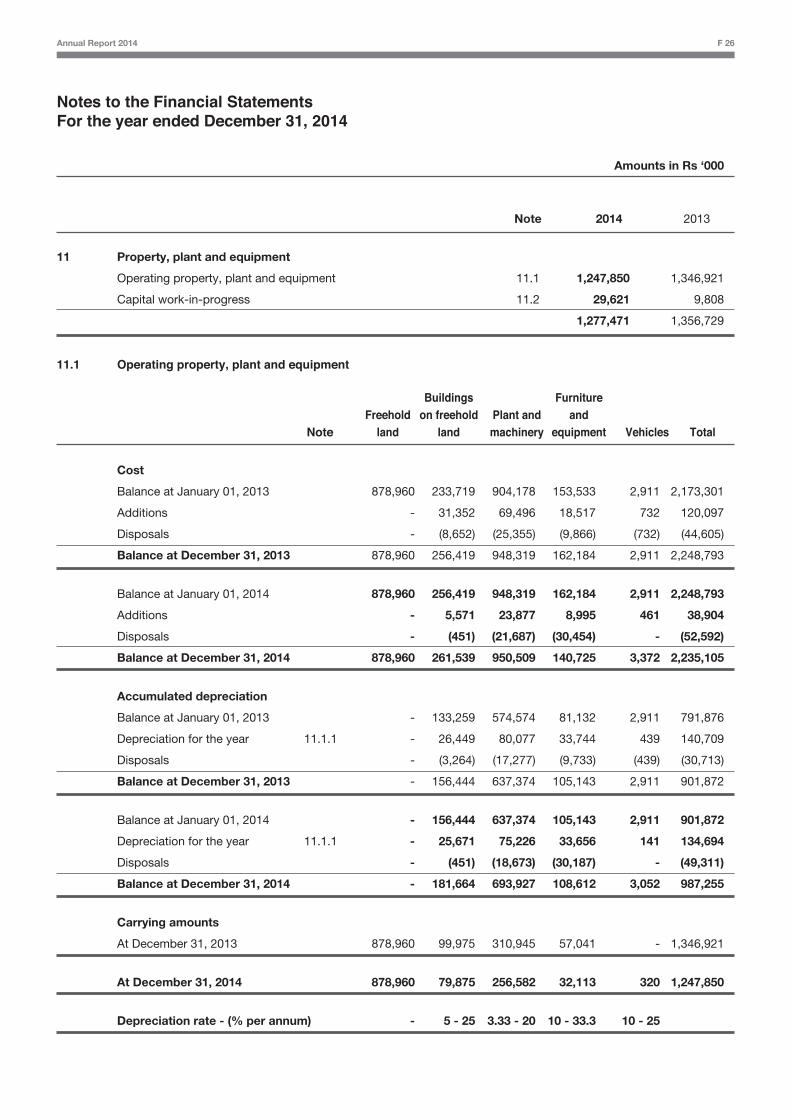
11 Property, plant and equipment
Operating property, plant and equipment 11.1 1,247,850 1,346,921
Capital work-in-progress 11.2 29,621 9,808
1,277,471 1,356,729
11.1 Operating property, plant and equipment
Annual Report 2014 F 26
Cost
Balance at January 01, 2013 878,960 233,719 904,178 153,533 2,911 2,173,301
Additions - 31,352 69,496 18,517 732 120,097
Disposals - (8,652) (25,355) (9,866) (732) (44,605)
Balance at December 31, 2013 878,960 256,419 948,319 162,184 2,911 2,248,793
Balance at January 01, 2014 878,960 256,419 948,319 162,184 2,911 2,248,793
Additions - 5,571 23,877 8,995 461 38,904
Disposals - (451) (21,687) (30,454) - (52,592)
Balance at December 31, 2014 878,960 261,539 950,509 140,725 3,372 2,235,105
Accumulated depreciation
Balance at January 01, 2013 - 133,259 574,574 81,132 2,911 791,876
Depreciation for the year 11.1.1 - 26,449 80,077 33,744 439 140,709
Disposals - (3,264) (17,277) (9,733) (439) (30,713)
Balance at December 31, 2013 - 156,444 637,374 105,143 2,911 901,872
Balance at January 01, 2014 - 156,444 637,374 105,143 2,911 901,872
Depreciation for the year 11.1.1 - 25,671 75,226 33,656 141 134,694
Disposals - (451) (18,673) (30,187) - (49,311)
Balance at December 31, 2014 - 181,664 693,927 108,612 3,052 987,255
Carrying amounts
At December 31, 2013 878,960 99,975 310,945 57,041 - 1,346,921
At December 31, 2014 878,960 79,875 256,582 32,113 320 1,247,850
Depreciation rate - (% per annum) - 5 - 25 3.33 - 20 10 - 33.3 10 - 25
NoteFreehold
land
Buildingson freehold
landPlant andmachinery
Furnitureand
equipment Vehicles Total
Notes to the Financial StatementsFor the year ended December 31, 2014
Amounts in Rs ‘000
Note 2014 2013
11.1.1 The depreciation charge for the year has been allocated as follows:
Cost of sales 24 82,848 91,758
Selling and distribution expenses 25 16,107 14,620
Administrative and general expenses 26 35,739 34,331
134,694 140,709
11.1.2 Depreciation for the year includes incremental depreciation due to revaluation, amounting to Rs. 4.54 million (2013:
Rs. 4.54 million).
11.1.3 Subsequent to transfer of property, plant and equipment (along with net revaluation surplus of Rs. 526.56 million)
from ICI Pakistan Limited on the effective date (July 01, 2011) of the scheme of demerger, specific classes of proper-
ty, plant and equipment (i.e. freehold land, buildings on freehold land and plant and machinery) of the Company were
revalued by an independent valuer. The said revaluation resulted in a surplus of Rs. 371.02 million. Valuations for
buildings on freehold land and plant and machinery were based on the estimated gross replacement cost, depreciat-
ed to reflect the residual service potential of the assets taking account of the age, conditions and obsolescence. Land
was valued on the basis of fair market value.
11.1.4 Had there been no revaluation, the net book value of specific classes of property, plant and equipment would have
amounted to:
Freehold land 6,259 6,259
Buildings on freehold land 72,728 90,180
Plant and machinery 252,183 304,657
331,170 401,096
Annual Report 2014 F 27
11.1.5 Following assets were disposed-off during the year:
Plant and machinery Tinting machines As per agreement 4,753 1,771 2,982 - Fatimid Paints, Karachi, Saqib Traders, Lahore, Jabbar Paints, Sialkot, Sab Rang, Dudhyaal, Zeeshan Paints, Lahore, Milli Paints, Sarae Alamgir and Bismillah Paints, Multan.
Furniture and equipment - Furniture and fixtures
Steel racks Write-off 200 120 80 - Written-off
Other assets with
book value less than Rs. 50,000 47,639 47,420 219 609
52,592 49,311 3,281 609
Mode of sale CostAccumulateddepreciation
Net bookvalue Sale proceeds Particulars of buyers
2014
Notes to the Financial StatementsFor the year ended December 31, 2014
Amounts in Rs ‘000
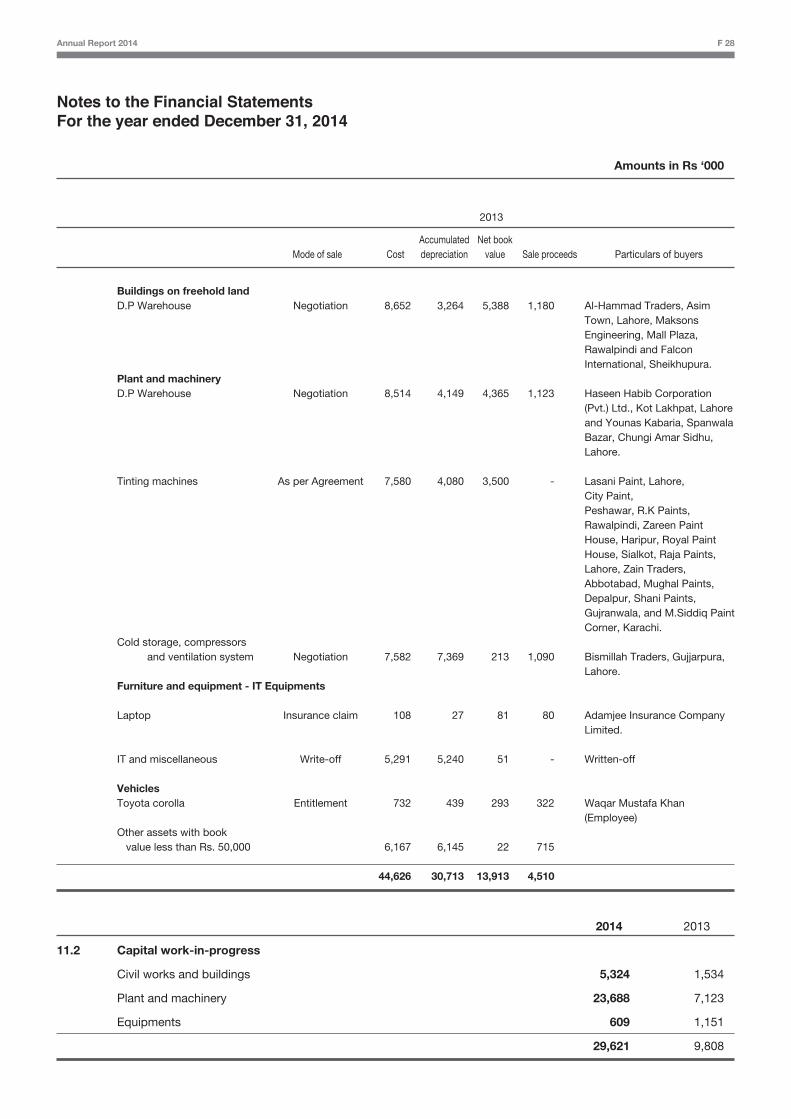
Buildings on freehold land D.P Warehouse Negotiation 8,652 3,264 5,388 1,180 Al-Hammad Traders, Asim Town, Lahore, Maksons Engineering, Mall Plaza, Rawalpindi and Falcon International, Sheikhupura. Plant and machinery D.P Warehouse Negotiation 8,514 4,149 4,365 1,123 Haseen Habib Corporation (Pvt.) Ltd., Kot Lakhpat, Lahore and Younas Kabaria, Spanwala Bazar, Chungi Amar Sidhu, Lahore. Tinting machines As per Agreement 7,580 4,080 3,500 - Lasani Paint, Lahore, City Paint, Peshawar, R.K Paints, Rawalpindi, Zareen Paint House, Haripur, Royal Paint House, Sialkot, Raja Paints, Lahore, Zain Traders, Abbotabad, Mughal Paints, Depalpur, Shani Paints, Gujranwala, and M.Siddiq Paint Corner, Karachi. Cold storage, compressors and ventilation system Negotiation 7,582 7,369 213 1,090 Bismillah Traders, Gujjarpura, Lahore. Furniture and equipment - IT Equipments
Laptop Insurance claim 108 27 81 80 Adamjee Insurance Company Limited.
IT and miscellaneous Write-off 5,291 5,240 51 - Written-off
Vehicles Toyota corolla Entitlement 732 439 293 322 Waqar Mustafa Khan (Employee) Other assets with book value less than Rs. 50,000 6,167 6,145 22 715
44,626 30,713 13,913 4,510
2014 2013
11.2 Capital work-in-progress
Civil works and buildings 5,324 1,534
Plant and machinery 23,688 7,123
Equipments 609 1,151
29,621 9,808
Mode of sale CostAccumulateddepreciation
Net bookvalue Sale proceeds Particulars of buyers
2013
Annual Report 2014 F 28
Notes to the Financial StatementsFor the year ended December 31, 2014
Amounts in Rs ‘000
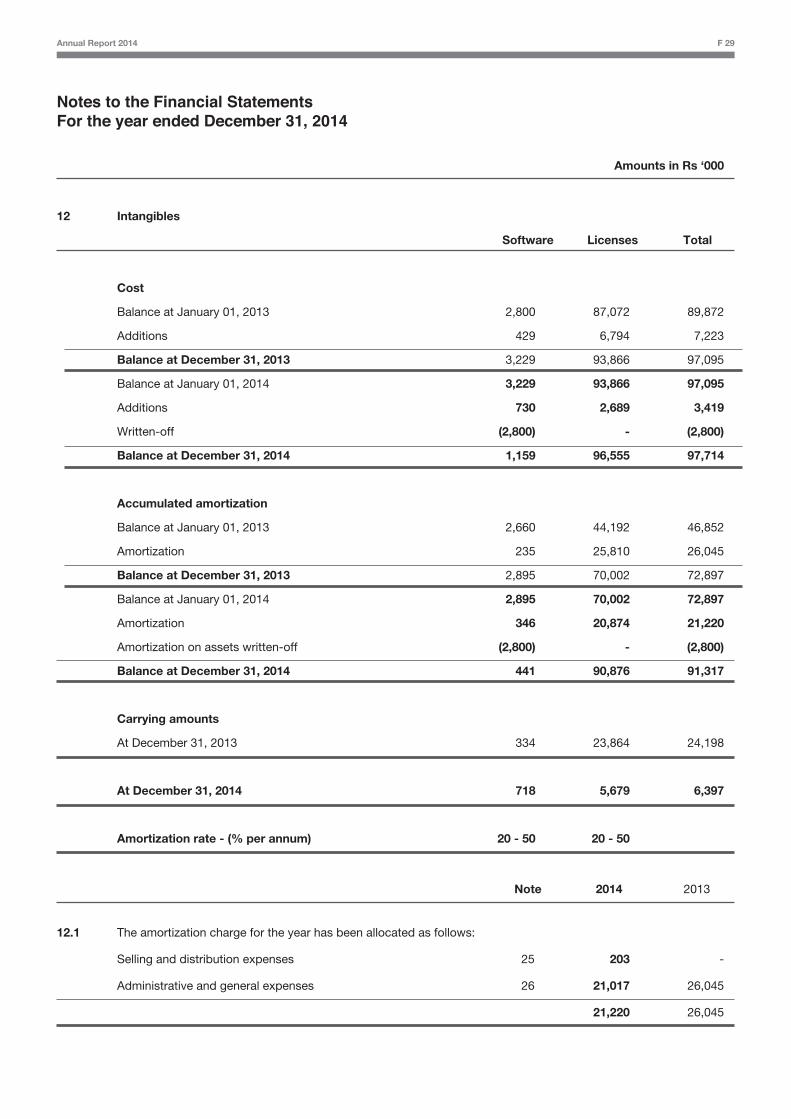
12 Intangibles
Software Licenses Total
Cost
Balance at January 01, 2013 2,800 87,072 89,872
Additions 429 6,794 7,223
Balance at December 31, 2013 3,229 93,866 97,095
Balance at January 01, 2014 3,229 93,866 97,095
Additions 730 2,689 3,419
Written-off (2,800) - (2,800)
Balance at December 31, 2014 1,159 96,555 97,714
Accumulated amortization
Balance at January 01, 2013 2,660 44,192 46,852
Amortization 235 25,810 26,045
Balance at December 31, 2013 2,895 70,002 72,897
Balance at January 01, 2014 2,895 70,002 72,897
Amortization 346 20,874 21,220
Amortization on assets written-off (2,800) - (2,800)
Balance at December 31, 2014 441 90,876 91,317
Carrying amounts
At December 31, 2013 334 23,864 24,198
At December 31, 2014 718 5,679 6,397
Amortization rate - (% per annum) 20 - 50 20 - 50
Note 2014 2013
12.1 The amortization charge for the year has been allocated as follows:
Selling and distribution expenses 25 203 -
Administrative and general expenses 26 21,017 26,045
21,220 26,045
Annual Report 2014 F 29
Annual Report 2014 F 30
Notes to the Financial StatementsFor the year ended December 31, 2014
Amounts in Rs ‘000
Note 2014 2013
13 Long term loans
Secured - considered good
- Directors and executives 13.1 63,816 53,298
- Other employees 32,122 34,877
95,938 88,175
Receivable within one year 19 (31,347) (24,764)
64,591 63,411
13.1 Reconciliation of the carrying amount of loans to directors and executives:
Balance at beginning of the year 53,298 43,730
Disbursements 41,779 36,239
Repayments / adjustments (31,261) (26,671)
Balance at end of the year 63,816 53,298
13.2 Loans to employees are provided for purchase of motorcycle, motor car and construction of house. Vehicle loans are
secured against registration documents of vehicles and house building loans are secured against provident fund,
gratuity, pension or any other dues payable to the employees.
13.3 Loans for purchase of motor cars and house building are repayable between two to ten years. These loans are
interest free and granted to the employees including executives of the Company in accordance with their terms of
employment.
13.4 The maximum aggregate amount of long term loans due from the executive directors and other executives at the end
of any month during the year was Rs. 0.89 million (2013: Rs. 3.57 million) and Rs. 74.21 million (2013: Rs. 59.09
million) respectively.
14 Long term deposits and prepayments
Deposits 4,470 4,087
Prepayments 1,284 1,768
5,754 5,855
Notes to the Financial StatementsFor the year ended December 31, 2014
15 Deferred tax asset - net
2014 Recognized in Balance at Recognized in other Balance at beginning of profit and comprehensive end of the year loss income the year
Deductible temporary differences
Provisions and tax credits 178,074 36,208 - 214,282
Taxable temporary differences
Property, plant and equipment
and intangibles (54,349) 24,168 - (30,181)
123,725 60,376 - 184,101
2013 Recognized in Balance at Recognized in other Balance at beginning of profit and comprehensive end of the year loss income the year
Deductible temporary differences
Provisions and tax credits 274,613 (48,388) (48,151) 178,074
Taxable temporary differences
Property, plant and equipment
and intangibles (63,128) 8,779 - (54,349)
211,485 (39,609) (48,151) 123,725
Note 2014 2013
16 Stores and spares
Stores 5,729 7,003
Spares 22,922 24,723
28,651 31,726
Provision for slow moving and obsolete stores and spares 16.1 (9,283) (7,444)
19,368 24,282
16.1 Provision for slow moving and obsolete stores and spares
Balance at beginning of the year 7,444 7,444
Charge for the year 24 1,839 -
Balance at end of the year 9,283 7,444
16.2 Stores and spares does not include any item that has been purchased for the purpose of capital expenditure.
Amounts in Rs ‘000
Annual Report 2014 F 31
Annual Report 2014 F 32
Notes to the Financial StatementsFor the year ended December 31, 2014
Amounts in Rs ‘000
Note 2014 2013
17 Stock-in-trade
Raw and packing material 17.1 200,373 329,229
Work-in-process 10,069 18,498
Finished goods 17.2 & 17.3 184,168 292,545
394,610 640,272
Provision for slow moving and obsolete stocks:
- Raw material (16,679) (14,794)
- Finished goods (18,342) (31,768)
17.4 (35,021) (46,562)
359,589 593,710
17.1 Raw and packing material includes items in-transit as at December 31, 2014 amounting to Rs. 50.48 million (2013: Rs. 158.14 million).
17.2 Finished goods include items in-transit as at December 31, 2014 aggregating to Rs. 2.58 million (2013: Rs. 16.68 million).
17.3 Finished goods include trading items amounting to Rs. 65.98 million (2013: Rs. 63.96 million).
17.4 Provision for stock-in-trade
Balance at beginning of the year 46,562 98,697
Stock written-off against provision (9,020) (32,566)
Provision written back (2,521) (19,040)
Transfers / reclassification - (529)
Balance at end of the year 35,021 46,562
18 Trade debts
Considered good
- Secured 18.1 42,050 17,124
- Unsecured 823,042 786,601
865,092 803,725
Considered doubtful 248,173 242,276
1,113,265 1,046,001
Provision for
- Doubtful debts 18.2 (248,173) (242,276)
- Discounts 18.3 (355,116) (256,776)
(603,289) (499,052)
509,976 546,949
Annual Report 2014 F 33
Notes to the Financial StatementsFor the year ended December 31, 2014
Amounts in Rs ‘000
Note 2014 2013
18.1 These debts are secured against letters of credit.
18.2 Provision for doubtful debts
Balance at beginning of the year 242,276 272,782
Charge for the year 26 50,471 8,175
Debts written-off against provision (44,574) (77,508)
Transfers / reclassification - 38,827
Balance at end of the year 248,173 242,276
18.3 Provision for discounts
Balance at beginning of the year 256,776 268,050
Charge for the year 791,084 750,020
Provision written back (16,300) -
Discounts paid during the year (676,444) (747,706)
Transfers / reclassification - (13,588)
Balance at end of the year 355,116 256,776
19 Loans and advances
Secured - considered good
Current portion of loans to:
- Directors and executives 22,565 17,616
- Other employees 8,782 7,148
31,347 24,764
Advances to:
- Executives 19.1 137 244
- Other employees - 218
137 462
Unsecured - considered good
Advances to contractors and suppliers 1,614 26,928
33,098 52,154
19.1 These are advances to executives in respect of travelling expenses. The maximum aggregate amount of advances due from the executives at the end of any month during the year was Rs. 2.46 million (2013: Rs. 0.94 million).
20 Trade deposits and short term prepayments
Trade deposits 4,817 1,350
Short term prepayments 12,530 6,826
17,347 8,176
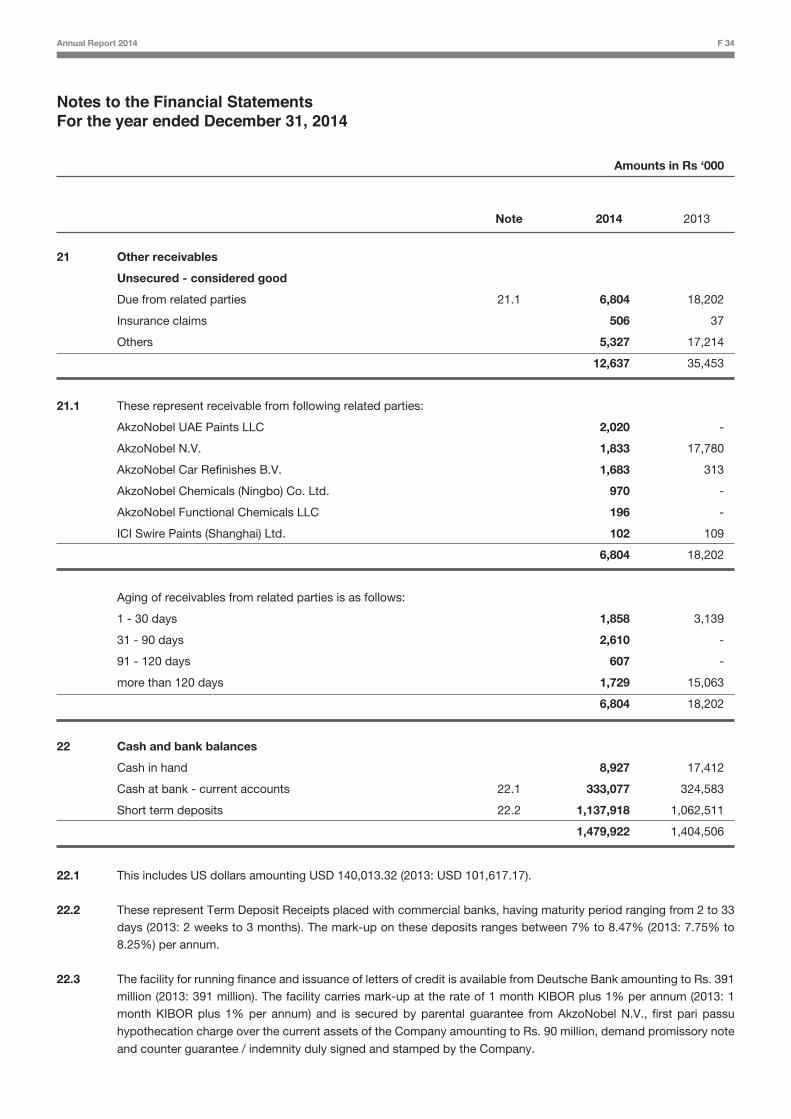
Annual Report 2014 F 34
Notes to the Financial StatementsFor the year ended December 31, 2014
Amounts in Rs ‘000
Note 2014 2013
21 Other receivables
Unsecured - considered good
Due from related parties 21.1 6,804 18,202
Insurance claims 506 37
Others 5,327 17,214
12,637 35,453
21.1 These represent receivable from following related parties:
AkzoNobel UAE Paints LLC 2,020 -
AkzoNobel N.V. 1,833 17,780
AkzoNobel Car Refinishes B.V. 1,683 313
AkzoNobel Chemicals (Ningbo) Co. Ltd. 970 -
AkzoNobel Functional Chemicals LLC 196 -
ICI Swire Paints (Shanghai) Ltd. 102 109
6,804 18,202
Aging of receivables from related parties is as follows:
1 - 30 days 1,858 3,139
31 - 90 days 2,610 -
91 - 120 days 607 -
more than 120 days 1,729 15,063
6,804 18,202
22 Cash and bank balances
Cash in hand 8,927 17,412
Cash at bank - current accounts 22.1 333,077 324,583
Short term deposits 22.2 1,137,918 1,062,511
1,479,922 1,404,506
22.1 This includes US dollars amounting USD 140,013.32 (2013: USD 101,617.17).
22.2 These represent Term Deposit Receipts placed with commercial banks, having maturity period ranging from 2 to 33 days (2013: 2 weeks to 3 months). The mark-up on these deposits ranges between 7% to 8.47% (2013: 7.75% to 8.25%) per annum.
22.3 The facility for running finance and issuance of letters of credit is available from Deutsche Bank amounting to Rs. 391 million (2013: 391 million). The facility carries mark-up at the rate of 1 month KIBOR plus 1% per annum (2013: 1 month KIBOR plus 1% per annum) and is secured by parental guarantee from AkzoNobel N.V., first pari passu
hypothecation charge over the current assets of the Company amounting to Rs. 90 million, demand promissory note
and counter guarantee / indemnity duly signed and stamped by the Company.
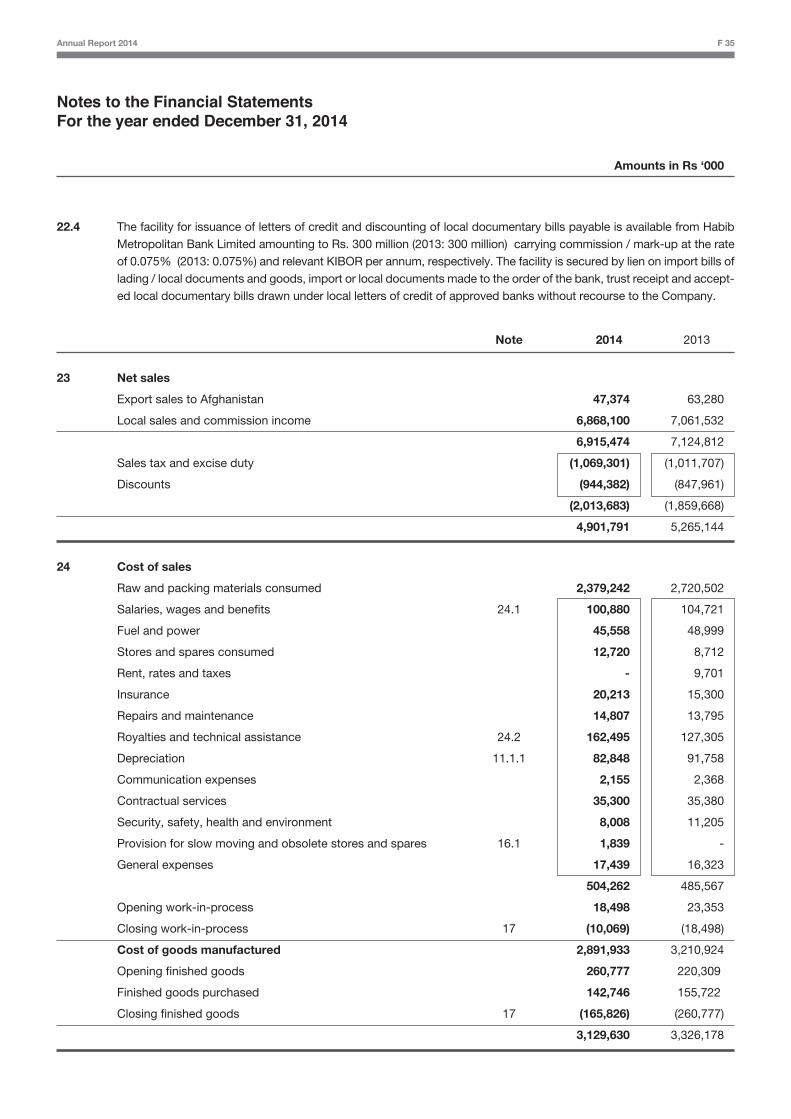
Annual Report 2014 F 35
Notes to the Financial StatementsFor the year ended December 31, 2014
Amounts in Rs ‘000
22.4 The facility for issuance of letters of credit and discounting of local documentary bills payable is available from Habib Metropolitan Bank Limited amounting to Rs. 300 million (2013: 300 million) carrying commission / mark-up at the rate of 0.075% (2013: 0.075%) and relevant KIBOR per annum, respectively. The facility is secured by lien on import bills of lading / local documents and goods, import or local documents made to the order of the bank, trust receipt and accept-ed local documentary bills drawn under local letters of credit of approved banks without recourse to the Company.
Note 2014 2013
23 Net sales
Export sales to Afghanistan 47,374 63,280
Local sales and commission income 6,868,100 7,061,532
6,915,474 7,124,812
Sales tax and excise duty (1,069,301) (1,011,707)
Discounts (944,382) (847,961)
(2,013,683) (1,859,668)
4,901,791 5,265,144
24 Cost of sales
Raw and packing materials consumed 2,379,242 2,720,502
Salaries, wages and benefits 24.1 100,880 104,721
Fuel and power 45,558 48,999
Stores and spares consumed 12,720 8,712
Rent, rates and taxes - 9,701
Insurance 20,213 15,300
Repairs and maintenance 14,807 13,795
Royalties and technical assistance 24.2 162,495 127,305
Depreciation 11.1.1 82,848 91,758
Communication expenses 2,155 2,368
Contractual services 35,300 35,380
Security, safety, health and environment 8,008 11,205
Provision for slow moving and obsolete stores and spares 16.1 1,839 -
General expenses 17,439 16,323
504,262 485,567
Opening work-in-process 18,498 23,353
Closing work-in-process 17 (10,069) (18,498)
Cost of goods manufactured 2,891,933 3,210,924
Opening finished goods 260,777 220,309
Finished goods purchased 142,746 155,722
Closing finished goods 17 (165,826) (260,777)
3,129,630 3,326,178
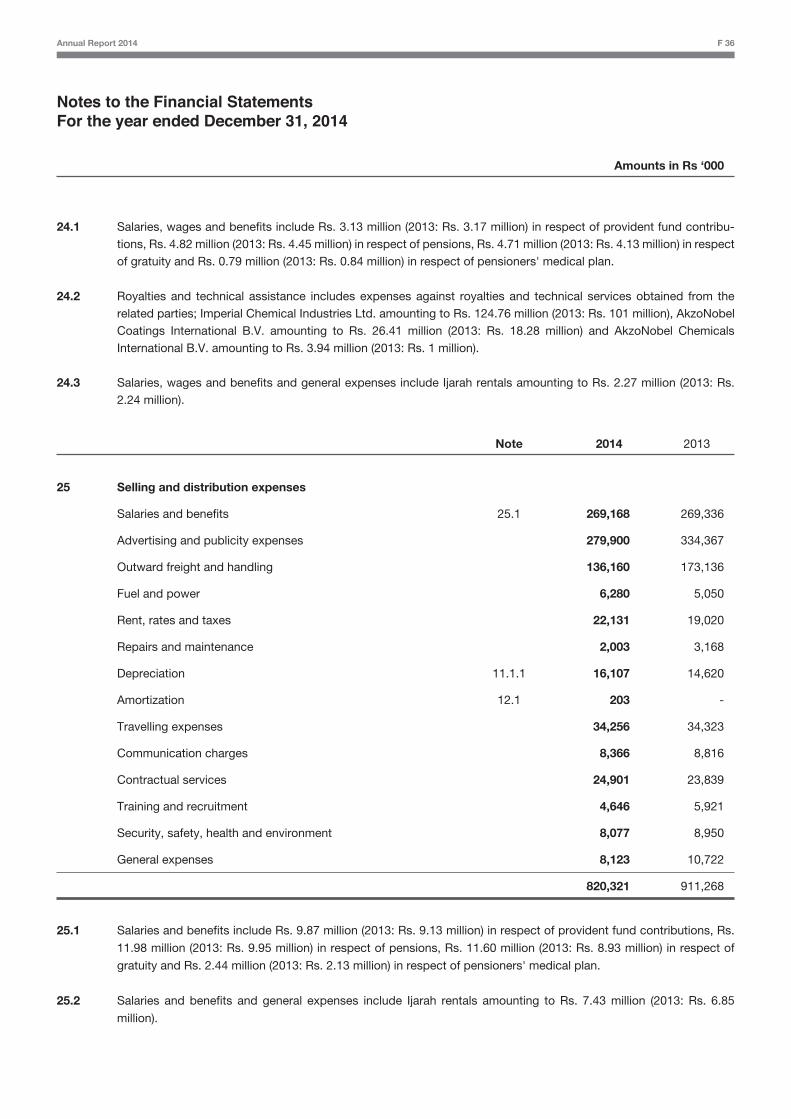
Annual Report 2014 F 36
Notes to the Financial StatementsFor the year ended December 31, 2014
Amounts in Rs ‘000
24.1 Salaries, wages and benefits include Rs. 3.13 million (2013: Rs. 3.17 million) in respect of provident fund contribu-tions, Rs. 4.82 million (2013: Rs. 4.45 million) in respect of pensions, Rs. 4.71 million (2013: Rs. 4.13 million) in respect of gratuity and Rs. 0.79 million (2013: Rs. 0.84 million) in respect of pensioners' medical plan.
24.2 Royalties and technical assistance includes expenses against royalties and technical services obtained from the related parties; Imperial Chemical Industries Ltd. amounting to Rs. 124.76 million (2013: Rs. 101 million), AkzoNobel Coatings International B.V. amounting to Rs. 26.41 million (2013: Rs. 18.28 million) and AkzoNobel Chemicals International B.V. amounting to Rs. 3.94 million (2013: Rs. 1 million).
24.3 Salaries, wages and benefits and general expenses include Ijarah rentals amounting to Rs. 2.27 million (2013: Rs. 2.24 million).
Note 2014 2013
25 Selling and distribution expenses
Salaries and benefits 25.1 269,168 269,336
Advertising and publicity expenses 279,900 334,367
Outward freight and handling 136,160 173,136
Fuel and power 6,280 5,050
Rent, rates and taxes 22,131 19,020
Repairs and maintenance 2,003 3,168
Depreciation 11.1.1 16,107 14,620
Amortization 12.1 203 -
Travelling expenses 34,256 34,323
Communication charges 8,366 8,816
Contractual services 24,901 23,839
Training and recruitment 4,646 5,921
Security, safety, health and environment 8,077 8,950
General expenses 8,123 10,722
820,321 911,268
25.1 Salaries and benefits include Rs. 9.87 million (2013: Rs. 9.13 million) in respect of provident fund contributions, Rs.
11.98 million (2013: Rs. 9.95 million) in respect of pensions, Rs. 11.60 million (2013: Rs. 8.93 million) in respect of
gratuity and Rs. 2.44 million (2013: Rs. 2.13 million) in respect of pensioners' medical plan.
25.2 Salaries and benefits and general expenses include Ijarah rentals amounting to Rs. 7.43 million (2013: Rs. 6.85
million).
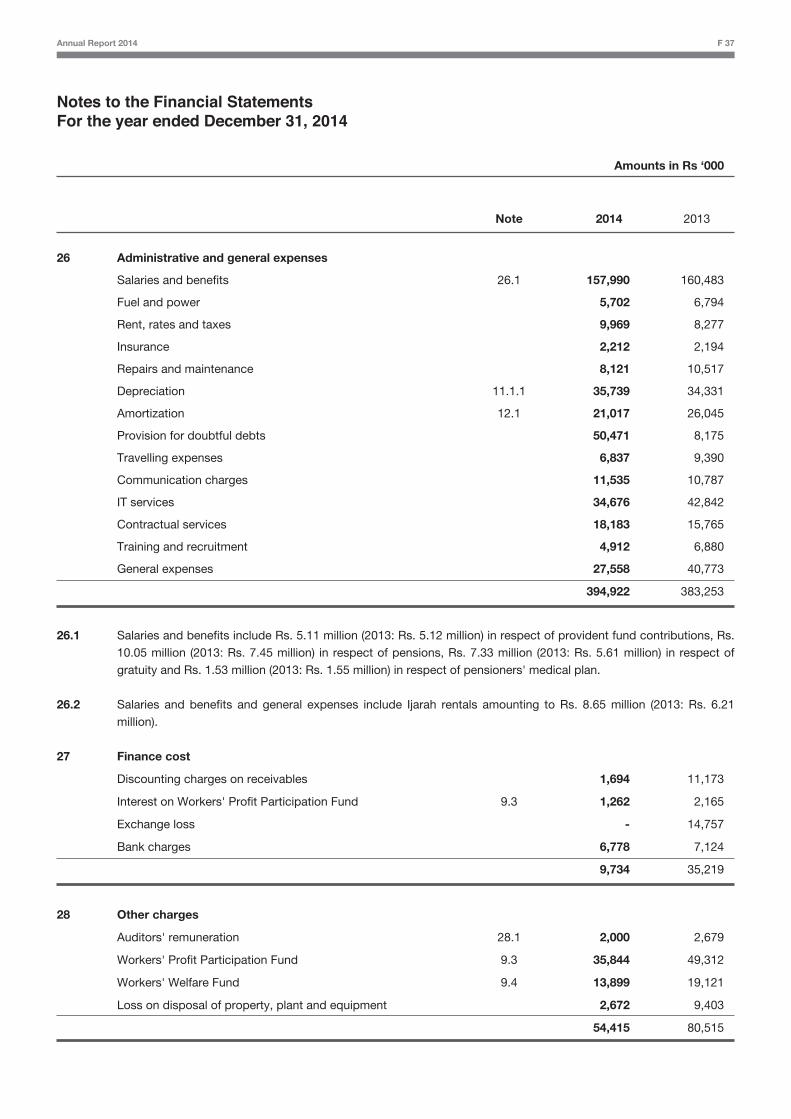
Annual Report 2014 F 37
Notes to the Financial StatementsFor the year ended December 31, 2014
Amounts in Rs ‘000
Note 2014 2013
26 Administrative and general expenses
Salaries and benefits 26.1 157,990 160,483
Fuel and power 5,702 6,794
Rent, rates and taxes 9,969 8,277
Insurance 2,212 2,194
Repairs and maintenance 8,121 10,517
Depreciation 11.1.1 35,739 34,331
Amortization 12.1 21,017 26,045
Provision for doubtful debts 50,471 8,175
Travelling expenses 6,837 9,390
Communication charges 11,535 10,787
IT services 34,676 42,842
Contractual services 18,183 15,765
Training and recruitment 4,912 6,880
General expenses 27,558 40,773
394,922 383,253
26.1 Salaries and benefits include Rs. 5.11 million (2013: Rs. 5.12 million) in respect of provident fund contributions, Rs. 10.05 million (2013: Rs. 7.45 million) in respect of pensions, Rs. 7.33 million (2013: Rs. 5.61 million) in respect of gratuity and Rs. 1.53 million (2013: Rs. 1.55 million) in respect of pensioners' medical plan.
26.2 Salaries and benefits and general expenses include Ijarah rentals amounting to Rs. 8.65 million (2013: Rs. 6.21 million).
27 Finance cost
Discounting charges on receivables 1,694 11,173
Interest on Workers' Profit Participation Fund 9.3 1,262 2,165
Exchange loss - 14,757
Bank charges 6,778 7,124
9,734 35,219
28 Other charges
Auditors' remuneration 28.1 2,000 2,679
Workers' Profit Participation Fund 9.3 35,844 49,312
Workers' Welfare Fund 9.4 13,899 19,121
Loss on disposal of property, plant and equipment 2,672 9,403
54,415 80,515

Annual Report 2014 F 38
Notes to the Financial StatementsFor the year ended December 31, 2014
Amounts in Rs ‘000
Note 2014 2013
28.1 Auditors' remuneration
Audit fee 1,500 1,500
Other assurances and certifications 300 1,090
Out of pocket expenses 200 89
2,000 2,679
29 Other income
Income from financial assets
Profit on short-term and call deposits 74,687 176,500
Exchange gain - net 19,538 -
Income from non-financial assets
Scrap sales 10,688 10,937
Others
Provisions no longer required written back:
- Employee retirement benefits - 65,666
- Obsolete stocks 2,521 19,040
- Others 58,720 122,812
Miscellaneous 19,576 13,269
185,730 408,224
30 Taxation
Current year 278,769 250,542
Prior year 1,250 41,058
Deferred 15 (60,376) 39,609
219,643 331,209
30.1 Tax charge reconciliation
Profit before taxation 678,499 936,935
Tax using domestic rates 223,905 318,558
Effect of prior year change 1,250 41,058
Tax impact on income under FTR of the current year 10,768 11,162 Tax impact due to reversal of other comprehensive income related deferred tax assets - (48,151)
Others (16,280) 8,582
Net tax charged 219,643 331,209

Annual Report 2014 F 39
Notes to the Financial StatementsFor the year ended December 31, 2014
Amounts in Rs ‘000
Note 2014 2013
31 Earnings per share
31.1 Basic earnings per share
Profit after taxation 458,856 605,726
Number of shares
Weighted average number of ordinary shares 46,443,320 46,443,320
Rupees
Earnings per share 31.2 9.88 13.04
31.2 Diluted earnings per share
There is no dilutive effect as the Company does not have any convertible instruments in issue as at December 31, 2014 and December 31, 2013.
32 Operating segments
32.1 These financial statements have been prepared on the basis of single reportable segment.
32.2 Revenue from sale of paints represents 98.76% (2013: 99.25%) of the total revenue of the Company.
32.3 99.31% (2013: 99.11%) sales of the Company relate to customers in Pakistan.
32.4 All non-current assets of the Company as at December 31, 2014 are located in Pakistan.
33 Remuneration of chief executive, directors and executives
Chief executive Executive director Executives
2014 2013 2014 2013 2014 2013
Managerial remuneration 15,301 13,172 8,479 7,155 161,199 143,746
Medical 123 60 312 936 8,729 7,719
Utilities 1,360 1,157 694 587 11,363 10,285
Retirement benefits 7,027 5,463 3,929 3,039 55,783 45,881
Group insurance 49 49 31 31 1,300 1,151
Rent and house maintenance 5,441 4,629 3,122 2,643 45,369 41,562
29,301 24,530 16,567 14,391 283,743 250,344
Number of persons 1 1 1 1 117 111
* The chief executive and the executive director hold 10 shares each of the Company.
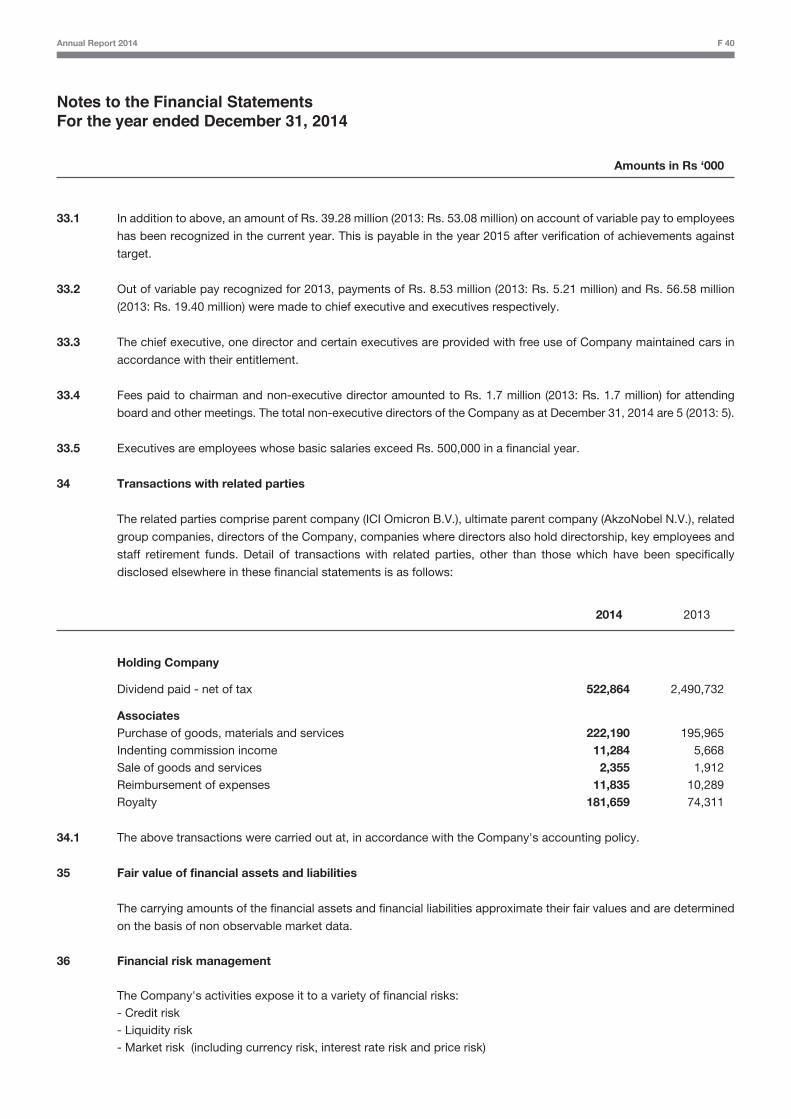
Annual Report 2014 F 40
Amounts in Rs ‘000
33.1 In addition to above, an amount of Rs. 39.28 million (2013: Rs. 53.08 million) on account of variable pay to employees
has been recognized in the current year. This is payable in the year 2015 after verification of achievements against
target.
33.2 Out of variable pay recognized for 2013, payments of Rs. 8.53 million (2013: Rs. 5.21 million) and Rs. 56.58 million
(2013: Rs. 19.40 million) were made to chief executive and executives respectively.
33.3 The chief executive, one director and certain executives are provided with free use of Company maintained cars in
accordance with their entitlement.
33.4 Fees paid to chairman and non-executive director amounted to Rs. 1.7 million (2013: Rs. 1.7 million) for attending
board and other meetings. The total non-executive directors of the Company as at December 31, 2014 are 5 (2013: 5).
33.5 Executives are employees whose basic salaries exceed Rs. 500,000 in a financial year.
34 Transactions with related parties
The related parties comprise parent company (ICI Omicron B.V.), ultimate parent company (AkzoNobel N.V.), related
group companies, directors of the Company, companies where directors also hold directorship, key employees and
staff retirement funds. Detail of transactions with related parties, other than those which have been specifically
disclosed elsewhere in these financial statements is as follows:
2014 2013
Holding Company
Dividend paid - net of tax 522,864 2,490,732
Associates Purchase of goods, materials and services 222,190 195,965 Indenting commission income 11,284 5,668 Sale of goods and services 2,355 1,912 Reimbursement of expenses 11,835 10,289 Royalty 181,659 74,311
34.1 The above transactions were carried out at, in accordance with the Company's accounting policy.
35 Fair value of financial assets and liabilities
The carrying amounts of the financial assets and financial liabilities approximate their fair values and are determined
on the basis of non observable market data.
36 Financial risk management
The Company's activities expose it to a variety of financial risks: - Credit risk - Liquidity risk - Market risk (including currency risk, interest rate risk and price risk)
Notes to the Financial StatementsFor the year ended December 31, 2014
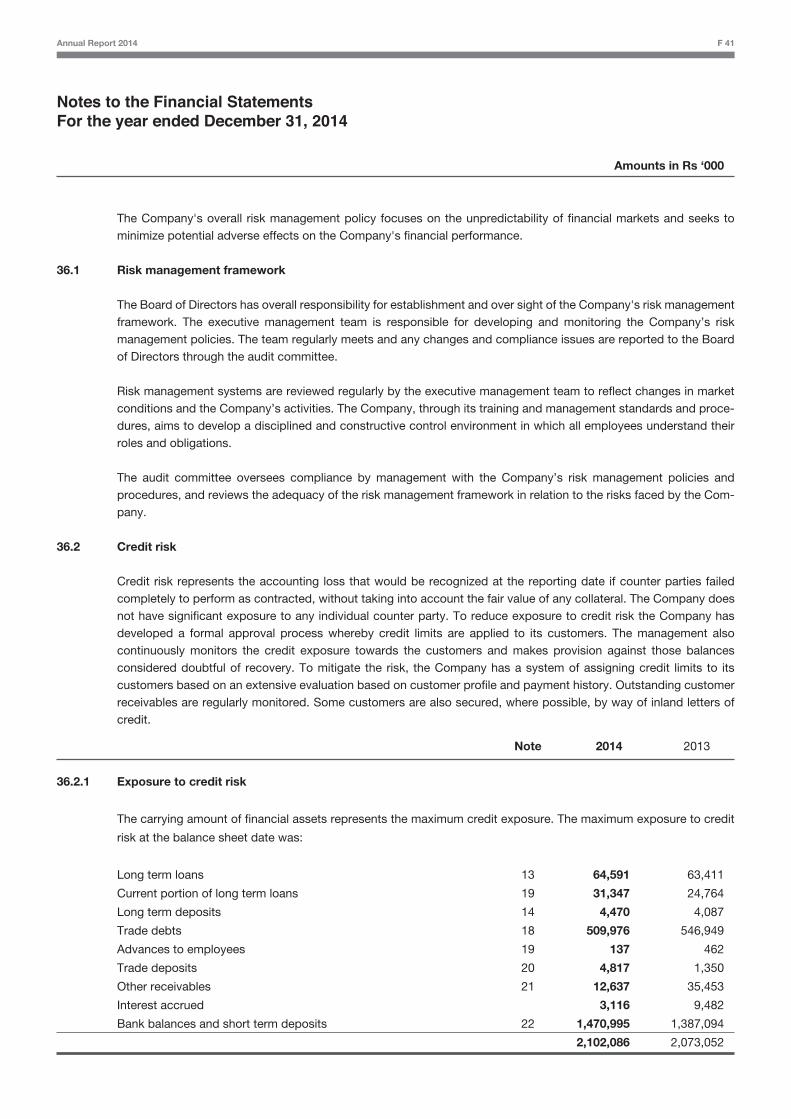
Annual Report 2014 F 41
Notes to the Financial StatementsFor the year ended December 31, 2014
Amounts in Rs ‘000
The Company's overall risk management policy focuses on the unpredictability of financial markets and seeks to minimize potential adverse effects on the Company's financial performance.
36.1 Risk management framework
The Board of Directors has overall responsibility for establishment and over sight of the Company's risk management framework. The executive management team is responsible for developing and monitoring the Company’s risk management policies. The team regularly meets and any changes and compliance issues are reported to the Board of Directors through the audit committee.
Risk management systems are reviewed regularly by the executive management team to reflect changes in market conditions and the Company’s activities. The Company, through its training and management standards and proce-dures, aims to develop a disciplined and constructive control environment in which all employees understand their roles and obligations.
The audit committee oversees compliance by management with the Company’s risk management policies and procedures, and reviews the adequacy of the risk management framework in relation to the risks faced by the Com-pany.
36.2 Credit risk Credit risk represents the accounting loss that would be recognized at the reporting date if counter parties failed
completely to perform as contracted, without taking into account the fair value of any collateral. The Company does not have significant exposure to any individual counter party. To reduce exposure to credit risk the Company has developed a formal approval process whereby credit limits are applied to its customers. The management also continuously monitors the credit exposure towards the customers and makes provision against those balances considered doubtful of recovery. To mitigate the risk, the Company has a system of assigning credit limits to its customers based on an extensive evaluation based on customer profile and payment history. Outstanding customer receivables are regularly monitored. Some customers are also secured, where possible, by way of inland letters of credit.
Note 2014 2013
36.2.1 Exposure to credit risk
The carrying amount of financial assets represents the maximum credit exposure. The maximum exposure to credit
risk at the balance sheet date was:
Long term loans 13 64,591 63,411
Current portion of long term loans 19 31,347 24,764
Long term deposits 14 4,470 4,087
Trade debts 18 509,976 546,949
Advances to employees 19 137 462
Trade deposits 20 4,817 1,350
Other receivables 21 12,637 35,453
Interest accrued 3,116 9,482
Bank balances and short term deposits 22 1,470,995 1,387,094
2,102,086 2,073,052
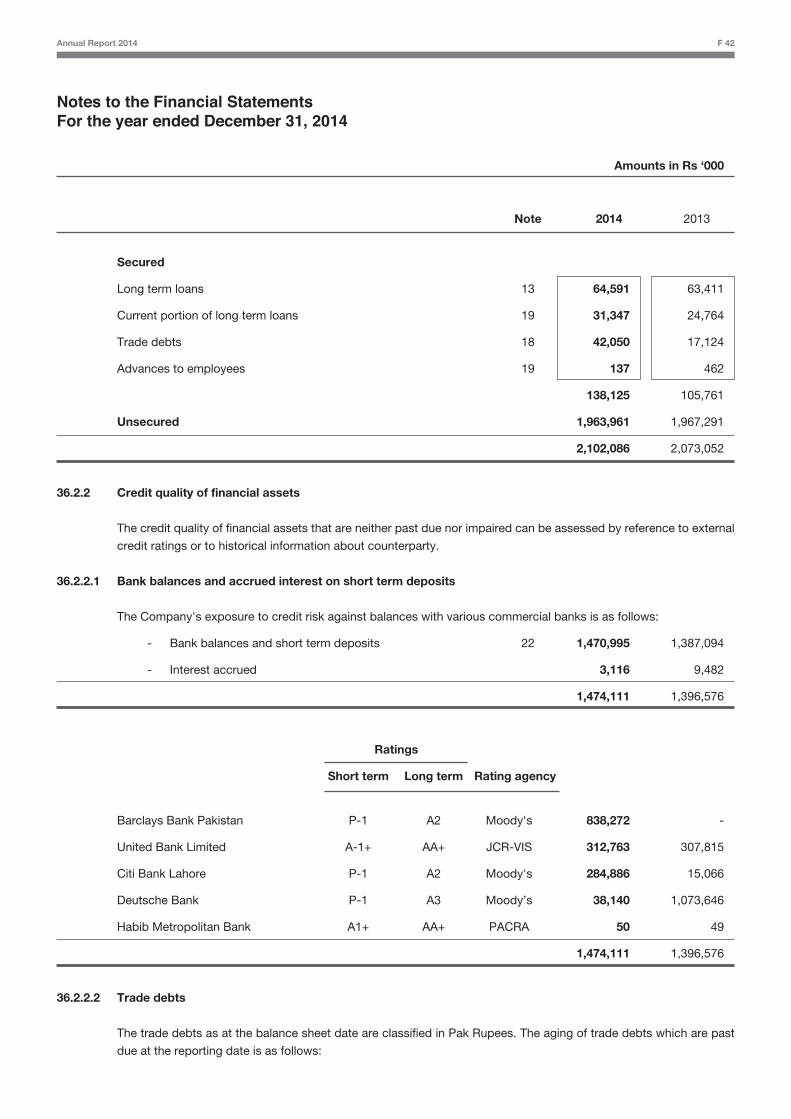
Amounts in Rs ‘000
Note 2014 2013
Secured
Long term loans 13 64,591 63,411
Current portion of long term loans 19 31,347 24,764
Trade debts 18 42,050 17,124
Advances to employees 19 137 462
138,125 105,761
Unsecured 1,963,961 1,967,291
2,102,086 2,073,052
36.2.2 Credit quality of financial assets
The credit quality of financial assets that are neither past due nor impaired can be assessed by reference to external
credit ratings or to historical information about counterparty.
36.2.2.1 Bank balances and accrued interest on short term deposits
The Company's exposure to credit risk against balances with various commercial banks is as follows:
- Bank balances and short term deposits 22 1,470,995 1,387,094
- Interest accrued 3,116 9,482
1,474,111 1,396,576
Ratings
Short term Long term Rating agency
Barclays Bank Pakistan P-1 A2 Moody's 838,272 -
United Bank Limited A-1+ AA+ JCR-VIS 312,763 307,815
Citi Bank Lahore P-1 A2 Moody's 284,886 15,066
Deutsche Bank P-1 A3 Moody’s 38,140 1,073,646
Habib Metropolitan Bank A1+ AA+ PACRA 50 49
1,474,111 1,396,576
36.2.2.2 Trade debts
The trade debts as at the balance sheet date are classified in Pak Rupees. The aging of trade debts which are past
due at the reporting date is as follows:
Notes to the Financial StatementsFor the year ended December 31, 2014
Annual Report 2014 F 42
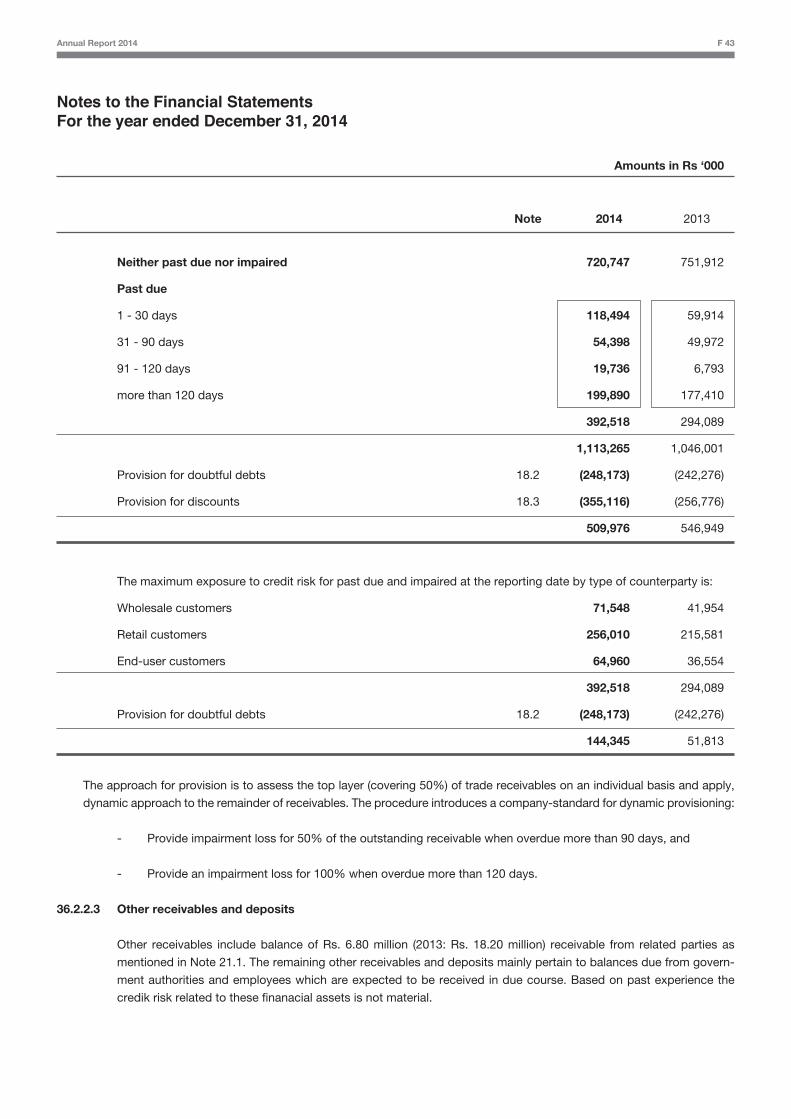
Annual Report 2014 F 43
Notes to the Financial StatementsFor the year ended December 31, 2014
Amounts in Rs ‘000
Note 2014 2013
Neither past due nor impaired 720,747 751,912
Past due
1 - 30 days 118,494 59,914
31 - 90 days 54,398 49,972
91 - 120 days 19,736 6,793
more than 120 days 199,890 177,410
392,518 294,089
1,113,265 1,046,001
Provision for doubtful debts 18.2 (248,173) (242,276)
Provision for discounts 18.3 (355,116) (256,776)
509,976 546,949
The maximum exposure to credit risk for past due and impaired at the reporting date by type of counterparty is:
Wholesale customers 71,548 41,954
Retail customers 256,010 215,581
End-user customers 64,960 36,554
392,518 294,089
Provision for doubtful debts 18.2 (248,173) (242,276)
144,345 51,813
The approach for provision is to assess the top layer (covering 50%) of trade receivables on an individual basis and apply,
dynamic approach to the remainder of receivables. The procedure introduces a company-standard for dynamic provisioning:
- Provide impairment loss for 50% of the outstanding receivable when overdue more than 90 days, and
- Provide an impairment loss for 100% when overdue more than 120 days.
36.2.2.3 Other receivables and deposits
Other receivables include balance of Rs. 6.80 million (2013: Rs. 18.20 million) receivable from related parties as
mentioned in Note 21.1. The remaining other receivables and deposits mainly pertain to balances due from govern-
ment authorities and employees which are expected to be received in due course. Based on past experience the
credik risk related to these finanacial assets is not material.
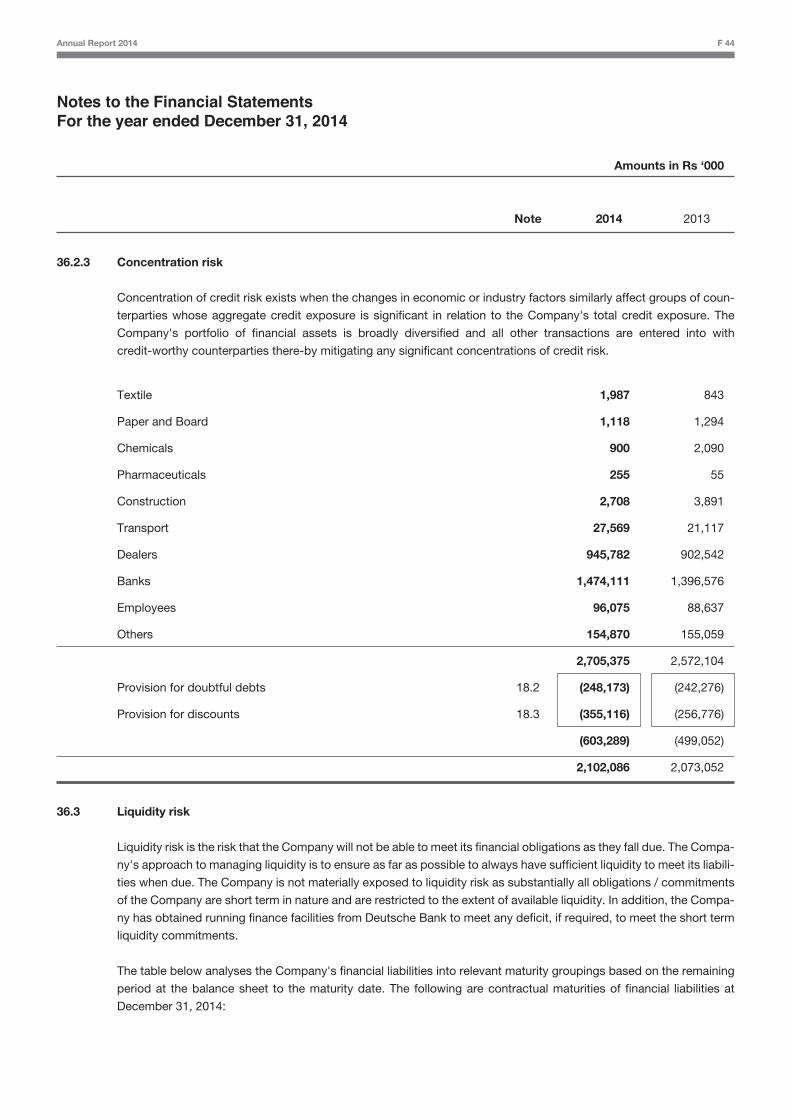
Annual Report 2014 F 44
Notes to the Financial StatementsFor the year ended December 31, 2014
Amounts in Rs ‘000
Note 2014 2013
36.2.3 Concentration risk
Concentration of credit risk exists when the changes in economic or industry factors similarly affect groups of coun-
terparties whose aggregate credit exposure is significant in relation to the Company's total credit exposure. The
Company's portfolio of financial assets is broadly diversified and all other transactions are entered into with
credit-worthy counterparties there-by mitigating any significant concentrations of credit risk.
Textile 1,987 843
Paper and Board 1,118 1,294
Chemicals 900 2,090
Pharmaceuticals 255 55
Construction 2,708 3,891
Transport 27,569 21,117
Dealers 945,782 902,542
Banks 1,474,111 1,396,576
Employees 96,075 88,637
Others 154,870 155,059
2,705,375 2,572,104
Provision for doubtful debts 18.2 (248,173) (242,276)
Provision for discounts 18.3 (355,116) (256,776)
(603,289) (499,052)
2,102,086 2,073,052
36.3 Liquidity risk
Liquidity risk is the risk that the Company will not be able to meet its financial obligations as they fall due. The Compa-
ny's approach to managing liquidity is to ensure as far as possible to always have sufficient liquidity to meet its liabili-
ties when due. The Company is not materially exposed to liquidity risk as substantially all obligations / commitments
of the Company are short term in nature and are restricted to the extent of available liquidity. In addition, the Compa-
ny has obtained running finance facilities from Deutsche Bank to meet any deficit, if required, to meet the short term
liquidity commitments.
The table below analyses the Company's financial liabilities into relevant maturity groupings based on the remaining
period at the balance sheet to the maturity date. The following are contractual maturities of financial liabilities at
December 31, 2014:
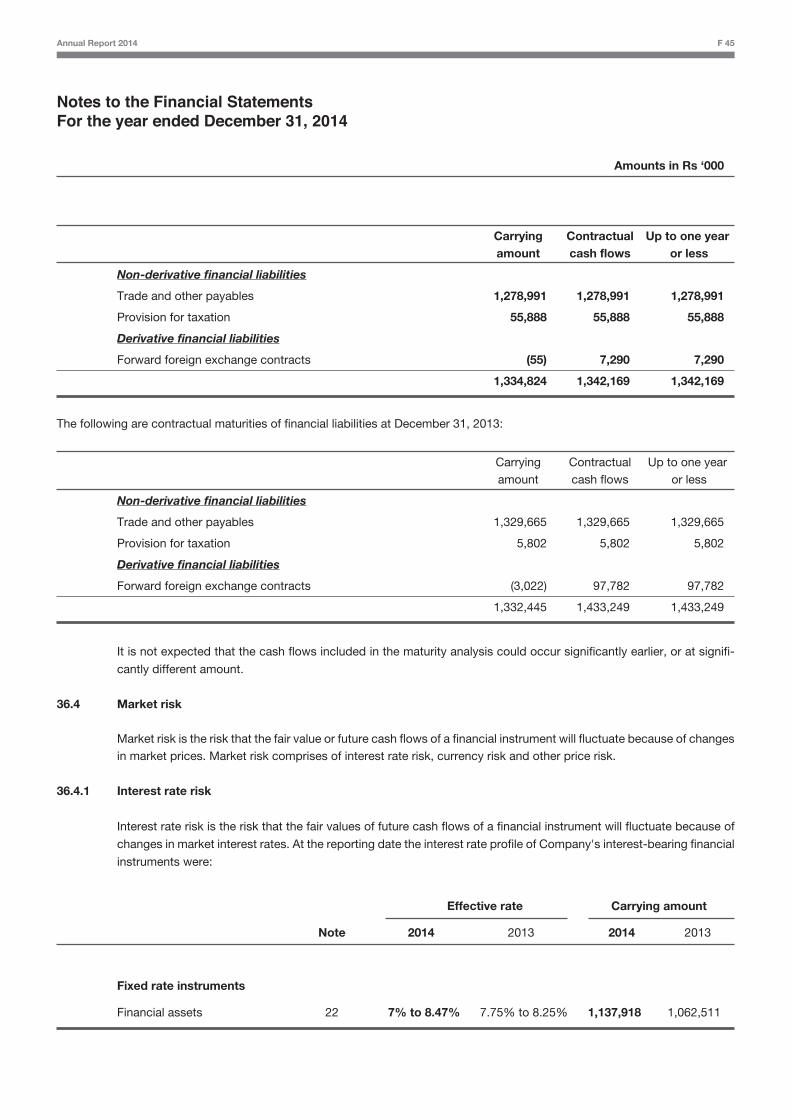
Annual Report 2014 F 45
Notes to the Financial StatementsFor the year ended December 31, 2014
Amounts in Rs ‘000
Carrying Contractual Up to one year amount cash flows or less
Non-derivative financial liabilities
Trade and other payables 1,278,991 1,278,991 1,278,991
Provision for taxation 55,888 55,888 55,888
Derivative financial liabilities
Forward foreign exchange contracts (55) 7,290 7,290
1,334,824 1,342,169 1,342,169
The following are contractual maturities of financial liabilities at December 31, 2013:
Carrying Contractual Up to one year amount cash flows or less
Non-derivative financial liabilities
Trade and other payables 1,329,665 1,329,665 1,329,665
Provision for taxation 5,802 5,802 5,802
Derivative financial liabilities
Forward foreign exchange contracts (3,022) 97,782 97,782
1,332,445 1,433,249 1,433,249
It is not expected that the cash flows included in the maturity analysis could occur significantly earlier, or at signifi-
cantly different amount.
36.4 Market risk
Market risk is the risk that the fair value or future cash flows of a financial instrument will fluctuate because of changes in market prices. Market risk comprises of interest rate risk, currency risk and other price risk.
36.4.1 Interest rate risk
Interest rate risk is the risk that the fair values of future cash flows of a financial instrument will fluctuate because of
changes in market interest rates. At the reporting date the interest rate profile of Company's interest-bearing financial
instruments were:
Effective rate Carrying amount
Note 2014 2013 2014 2013
Fixed rate instruments
Financial assets 22 7% to 8.47% 7.75% to 8.25% 1,137,918 1,062,511
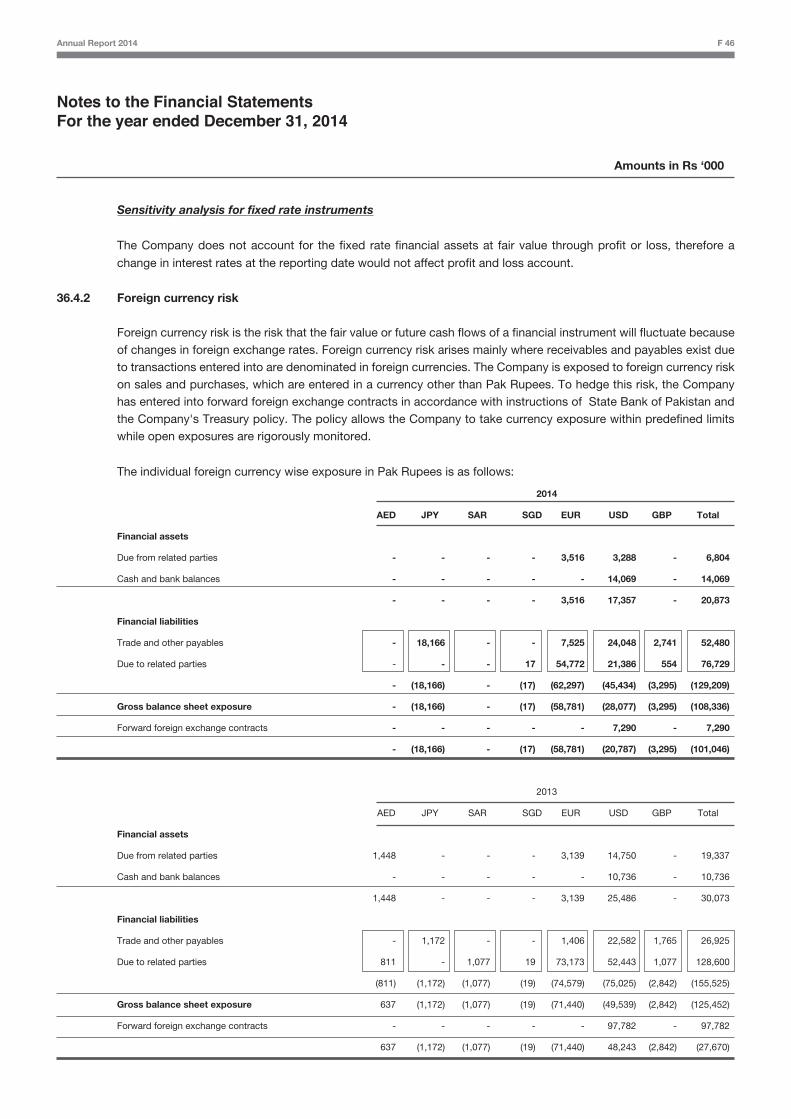
Annual Report 2014 F 46
Notes to the Financial StatementsFor the year ended December 31, 2014
Amounts in Rs ‘000
Sensitivity analysis for fixed rate instruments
The Company does not account for the fixed rate financial assets at fair value through profit or loss, therefore a
change in interest rates at the reporting date would not affect profit and loss account.
36.4.2 Foreign currency risk
Foreign currency risk is the risk that the fair value or future cash flows of a financial instrument will fluctuate because of changes in foreign exchange rates. Foreign currency risk arises mainly where receivables and payables exist due to transactions entered into are denominated in foreign currencies. The Company is exposed to foreign currency risk on sales and purchases, which are entered in a currency other than Pak Rupees. To hedge this risk, the Company has entered into forward foreign exchange contracts in accordance with instructions of State Bank of Pakistan and the Company's Treasury policy. The policy allows the Company to take currency exposure within predefined limits while open exposures are rigorously monitored.
The individual foreign currency wise exposure in Pak Rupees is as follows:
2014
AED JPY SAR SGD EUR USD GBP Total
Financial assets
Due from related parties - - - - 3,516 3,288 - 6,804
Cash and bank balances - - - - - 14,069 - 14,069
- - - - 3,516 17,357 - 20,873
Financial liabilities
Trade and other payables - 18,166 - - 7,525 24,048 2,741 52,480
Due to related parties - - - 17 54,772 21,386 554 76,729
- (18,166) - (17) (62,297) (45,434) (3,295) (129,209)
Gross balance sheet exposure - (18,166) - (17) (58,781) (28,077) (3,295) (108,336)
Forward foreign exchange contracts - - - - - 7,290 - 7,290
- (18,166) - (17) (58,781) (20,787) (3,295) (101,046)
2013
AED JPY SAR SGD EUR USD GBP Total
Financial assets
Due from related parties 1,448 - - - 3,139 14,750 - 19,337
Cash and bank balances - - - - - 10,736 - 10,736
1,448 - - - 3,139 25,486 - 30,073
Financial liabilities
Trade and other payables - 1,172 - - 1,406 22,582 1,765 26,925
Due to related parties 811 - 1,077 19 73,173 52,443 1,077 128,600
(811) (1,172) (1,077) (19) (74,579) (75,025) (2,842) (155,525)
Gross balance sheet exposure 637 (1,172) (1,077) (19) (71,440) (49,539) (2,842) (125,452)
Forward foreign exchange contracts - - - - - 97,782 - 97,782
637 (1,172) (1,077) (19) (71,440) 48,243 (2,842) (27,670)
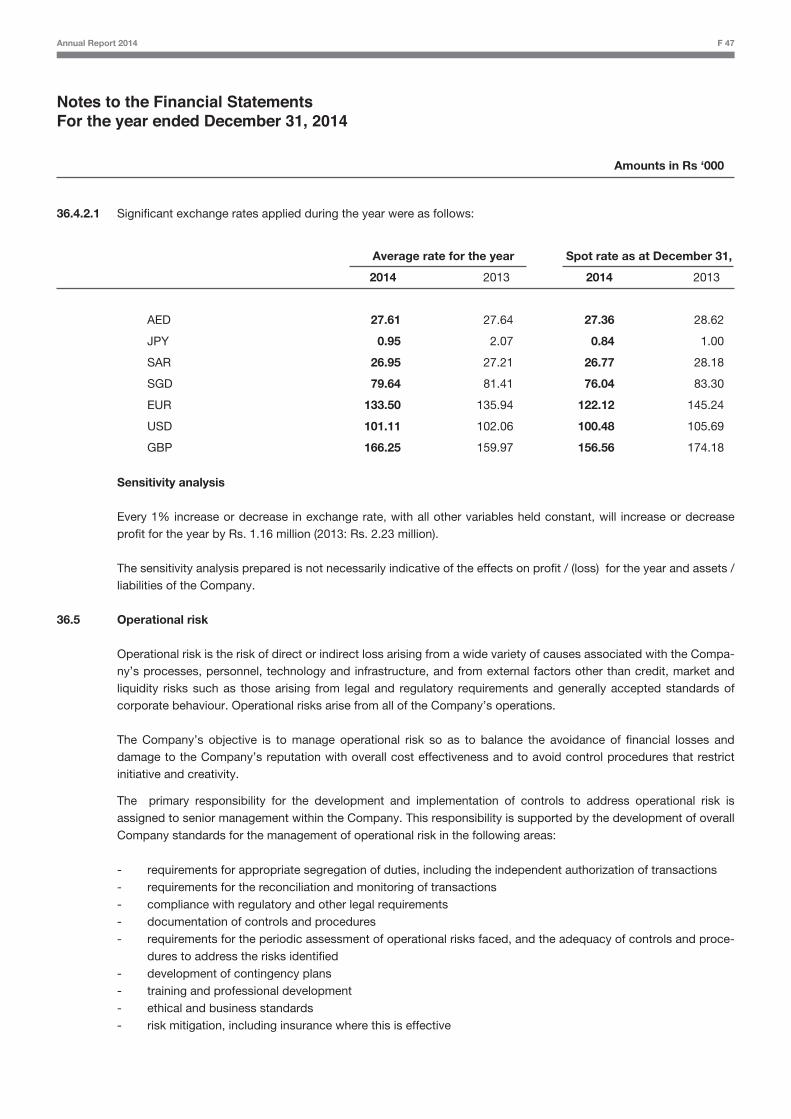
Annual Report 2014 F 47
Notes to the Financial StatementsFor the year ended December 31, 2014
Amounts in Rs ‘000
36.4.2.1 Significant exchange rates applied during the year were as follows:
Average rate for the year Spot rate as at December 31,
2014 2013 2014 2013
AED 27.61 27.64 27.36 28.62
JPY 0.95 2.07 0.84 1.00
SAR 26.95 27.21 26.77 28.18
SGD 79.64 81.41 76.04 83.30
EUR 133.50 135.94 122.12 145.24
USD 101.11 102.06 100.48 105.69
GBP 166.25 159.97 156.56 174.18
Sensitivity analysis
Every 1% increase or decrease in exchange rate, with all other variables held constant, will increase or decrease profit for the year by Rs. 1.16 million (2013: Rs. 2.23 million).
The sensitivity analysis prepared is not necessarily indicative of the effects on profit / (loss) for the year and assets / liabilities of the Company.
36.5 Operational risk
Operational risk is the risk of direct or indirect loss arising from a wide variety of causes associated with the Compa-ny’s processes, personnel, technology and infrastructure, and from external factors other than credit, market and liquidity risks such as those arising from legal and regulatory requirements and generally accepted standards of corporate behaviour. Operational risks arise from all of the Company’s operations.
The Company’s objective is to manage operational risk so as to balance the avoidance of financial losses and damage to the Company’s reputation with overall cost effectiveness and to avoid control procedures that restrict initiative and creativity.
The primary responsibility for the development and implementation of controls to address operational risk is assigned to senior management within the Company. This responsibility is supported by the development of overall Company standards for the management of operational risk in the following areas:
- requirements for appropriate segregation of duties, including the independent authorization of transactions - requirements for the reconciliation and monitoring of transactions - compliance with regulatory and other legal requirements - documentation of controls and procedures - requirements for the periodic assessment of operational risks faced, and the adequacy of controls and proce-
dures to address the risks identified - development of contingency plans - training and professional development - ethical and business standards - risk mitigation, including insurance where this is effective
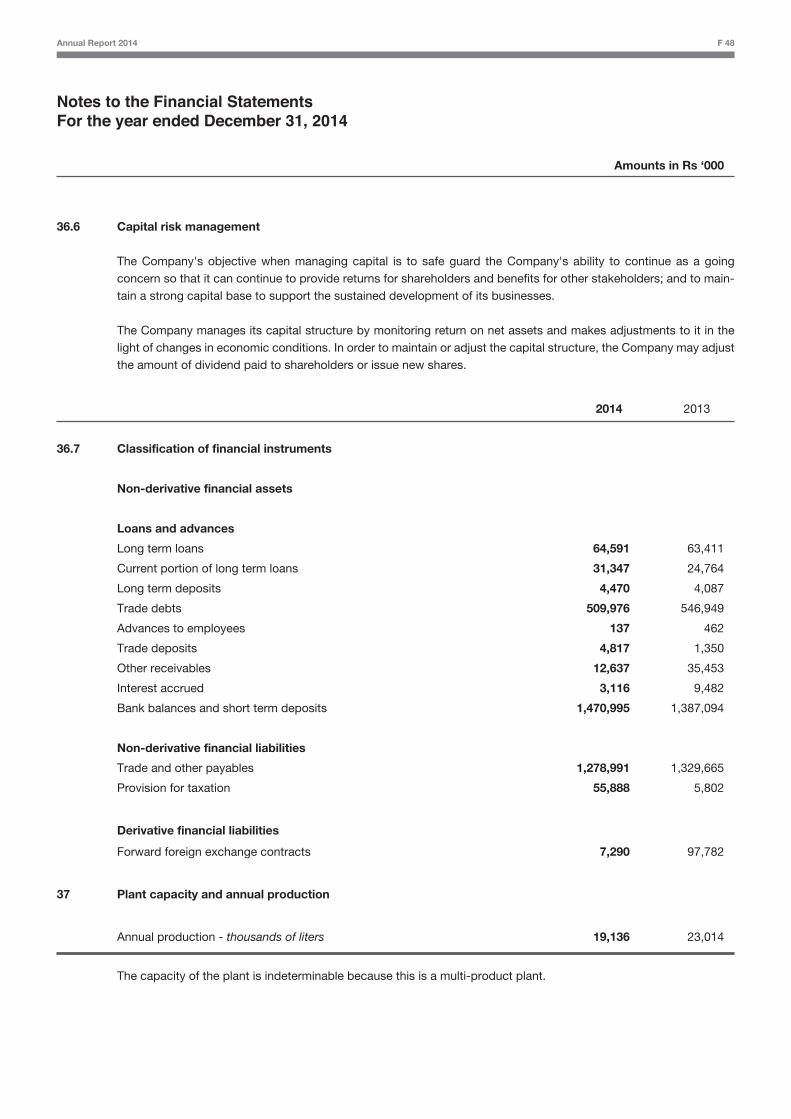
Annual Report 2014 F 48
Notes to the Financial StatementsFor the year ended December 31, 2014
Amounts in Rs ‘000
36.6 Capital risk management
The Company's objective when managing capital is to safe guard the Company's ability to continue as a going concern so that it can continue to provide returns for shareholders and benefits for other stakeholders; and to main-tain a strong capital base to support the sustained development of its businesses.
The Company manages its capital structure by monitoring return on net assets and makes adjustments to it in the light of changes in economic conditions. In order to maintain or adjust the capital structure, the Company may adjust the amount of dividend paid to shareholders or issue new shares.
2014 2013
36.7 Classification of financial instruments
Non-derivative financial assets
Loans and advances
Long term loans 64,591 63,411
Current portion of long term loans 31,347 24,764
Long term deposits 4,470 4,087
Trade debts 509,976 546,949
Advances to employees 137 462
Trade deposits 4,817 1,350
Other receivables 12,637 35,453
Interest accrued 3,116 9,482
Bank balances and short term deposits 1,470,995 1,387,094
Non-derivative financial liabilities
Trade and other payables 1,278,991 1,329,665
Provision for taxation 55,888 5,802
Derivative financial liabilities
Forward foreign exchange contracts 7,290 97,782
37 Plant capacity and annual production
Annual production - thousands of liters 19,136 23,014
The capacity of the plant is indeterminable because this is a multi-product plant.
Annual Report 2014 F 49
Notes to the Financial StatementsFor the year ended December 31, 2014
38 Number of employees
The number of employees of the Company as at December 31, 2014 were 261 (2013: 270) and the average number
of employees were 263 (2013: 271).
39 Non-adjusting event after reporting date
The Board of Directors of the Company in its meeting held on February 25, 2015 has recommended a special
dividend of Rs. 4.50 per share. On the basis of the Company’s full year performance a final dividend of Rs. 0.50 per
share is also proposed. This will imply a total final dividend of Rs. 5.00 per share in addition to the interim dividend
paid earlier. The financial statements of the Company for the year ended December 31, 2014 do not include the effect
of the final dividend which will be accounted for in the year in which it is approved.
40 General
40.1 These financial statements were authorized for issue in the Board of Directors meeting held on February 25, 2015.
40.2 Corresponding figures have been rearranged or reclassified wherever necessary for the purpose of comparison.
However, no significant rearrangement or reclassification has been made during the year ended December 31, 2014.
Mueen AfzalChairman / Director
Harris MahmoodChief Financial Officer
Jehanzeb KhanChief Executive
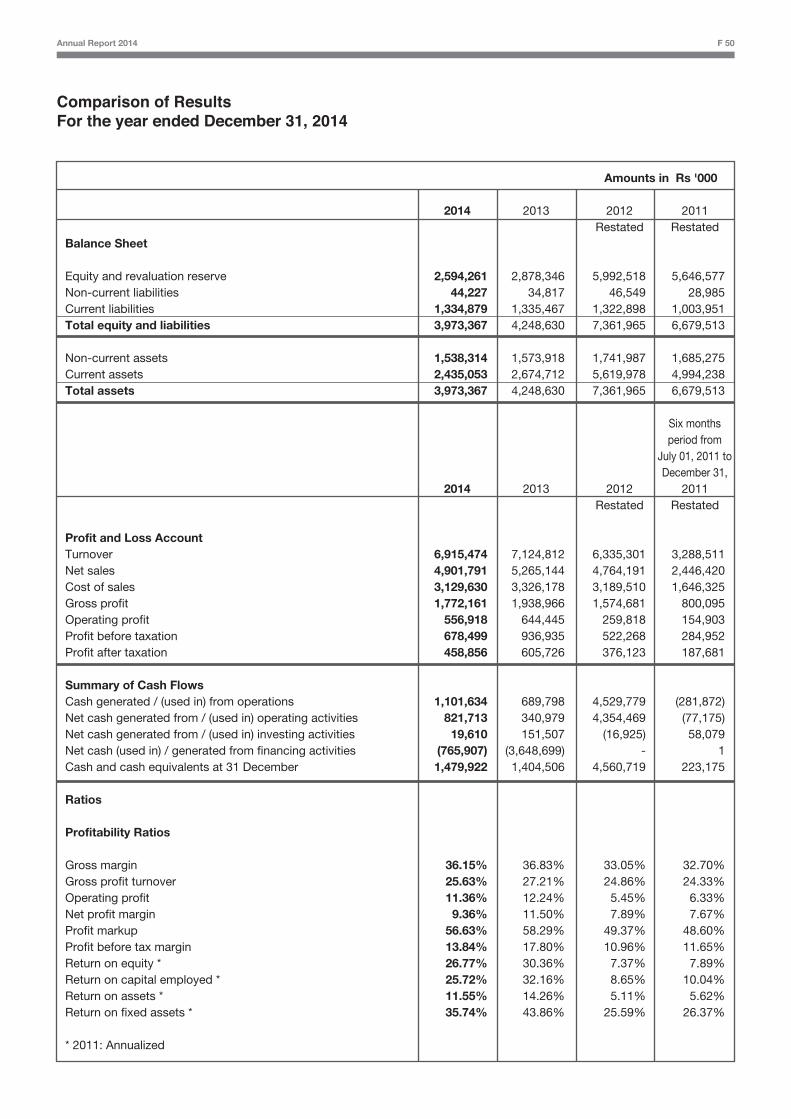
Annual Report 2014 F 50
Comparison of Results For the year ended December 31, 2014
Amounts in Rs '000
2014 2013 2012 2011 Restated RestatedBalance Sheet Equity and revaluation reserve 2,594,261 2,878,346 5,992,518 5,646,577Non-current liabilities 44,227 34,817 46,549 28,985Current liabilities 1,334,879 1,335,467 1,322,898 1,003,951Total equity and liabilities 3,973,367 4,248,630 7,361,965 6,679,513
Non-current assets 1,538,314 1,573,918 1,741,987 1,685,275Current assets 2,435,053 2,674,712 5,619,978 4,994,238Total assets 3,973,367 4,248,630 7,361,965 6,679,513 Six months period from July 01, 2011 to December 31, 2014 2013 2012 2011 Restated Restated
Profit and Loss AccountTurnover 6,915,474 7,124,812 6,335,301 3,288,511Net sales 4,901,791 5,265,144 4,764,191 2,446,420Cost of sales 3,129,630 3,326,178 3,189,510 1,646,325Gross profit 1,772,161 1,938,966 1,574,681 800,095Operating profit 556,918 644,445 259,818 154,903Profit before taxation 678,499 936,935 522,268 284,952Profit after taxation 458,856 605,726 376,123 187,681
Summary of Cash FlowsCash generated / (used in) from operations 1,101,634 689,798 4,529,779 (281,872)Net cash generated from / (used in) operating activities 821,713 340,979 4,354,469 (77,175)Net cash generated from / (used in) investing activities 19,610 151,507 (16,925) 58,079Net cash (used in) / generated from financing activities (765,907) (3,648,699) - 1Cash and cash equivalents at 31 December 1,479,922 1,404,506 4,560,719 223,175
Ratios
Profitability Ratios
Gross margin 36.15% 36.83% 33.05% 32.70%Gross profit turnover 25.63% 27.21% 24.86% 24.33%Operating profit 11.36% 12.24% 5.45% 6.33%Net profit margin 9.36% 11.50% 7.89% 7.67%Profit markup 56.63% 58.29% 49.37% 48.60%Profit before tax margin 13.84% 17.80% 10.96% 11.65%Return on equity * 26.77% 30.36% 7.37% 7.89%Return on capital employed * 25.72% 32.16% 8.65% 10.04%Return on assets * 11.55% 14.26% 5.11% 5.62%Return on fixed assets * 35.74% 43.86% 25.59% 26.37%
* 2011: Annualized
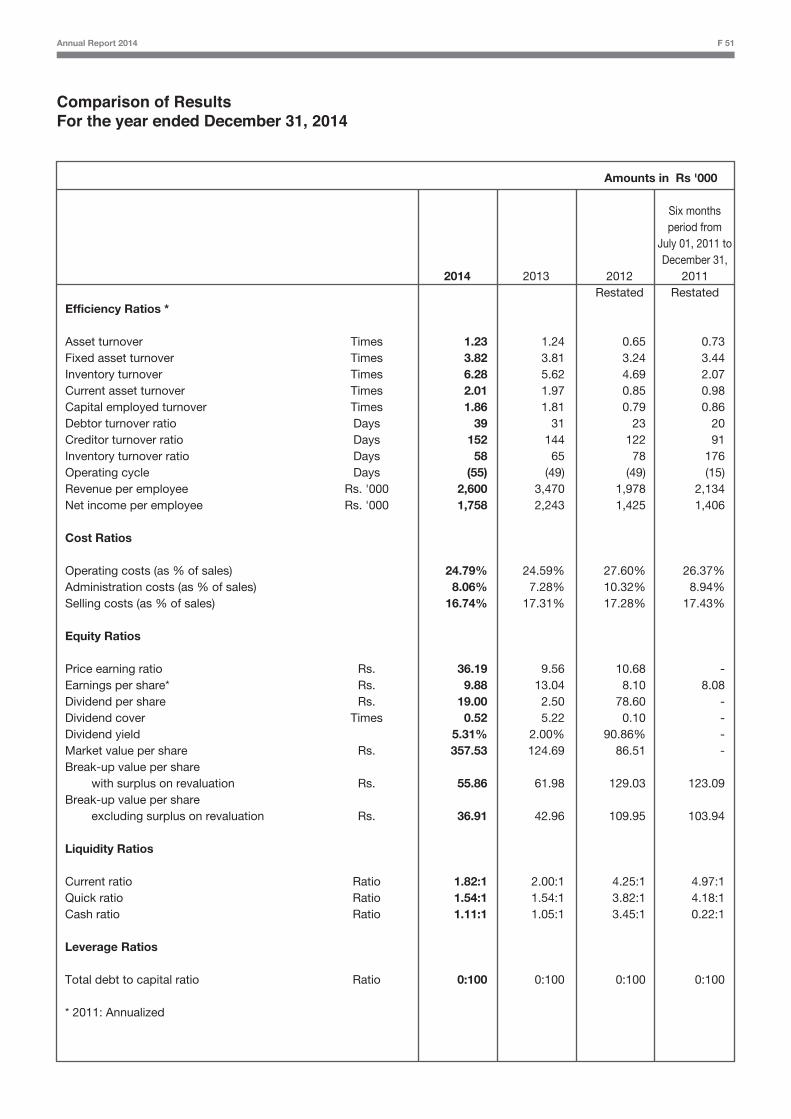
Annual Report 2014 F 51
Comparison of Results For the year ended December 31, 2014
Amounts in Rs '000
Six months period from July 01, 2011 to December 31, 2014 2013 2012 2011 Restated RestatedEfficiency Ratios *
Asset turnover Times 1.23 1.24 0.65 0.73Fixed asset turnover Times 3.82 3.81 3.24 3.44Inventory turnover Times 6.28 5.62 4.69 2.07Current asset turnover Times 2.01 1.97 0.85 0.98Capital employed turnover Times 1.86 1.81 0.79 0.86Debtor turnover ratio Days 39 31 23 20Creditor turnover ratio Days 152 144 122 91Inventory turnover ratio Days 58 65 78 176Operating cycle Days (55) (49) (49) (15)Revenue per employee Rs. '000 2,600 3,470 1,978 2,134Net income per employee Rs. '000 1,758 2,243 1,425 1,406
Cost Ratios
Operating costs (as % of sales) 24.79% 24.59% 27.60% 26.37%Administration costs (as % of sales) 8.06% 7.28% 10.32% 8.94%Selling costs (as % of sales) 16.74% 17.31% 17.28% 17.43%
Equity Ratios
Price earning ratio Rs. 36.19 9.56 10.68 -Earnings per share* Rs. 9.88 13.04 8.10 8.08Dividend per share Rs. 19.00 2.50 78.60 -Dividend cover Times 0.52 5.22 0.10 -Dividend yield 5.31% 2.00% 90.86% -Market value per share Rs. 357.53 124.69 86.51 -Break-up value per share with surplus on revaluation Rs. 55.86 61.98 129.03 123.09Break-up value per share excluding surplus on revaluation Rs. 36.91 42.96 109.95 103.94
Liquidity Ratios
Current ratio Ratio 1.82:1 2.00:1 4.25:1 4.97:1Quick ratio Ratio 1.54:1 1.54:1 3.82:1 4.18:1Cash ratio Ratio 1.11:1 1.05:1 3.45:1 0.22:1
Leverage Ratios
Total debt to capital ratio Ratio 0:100 0:100 0:100 0:100
* 2011: Annualized
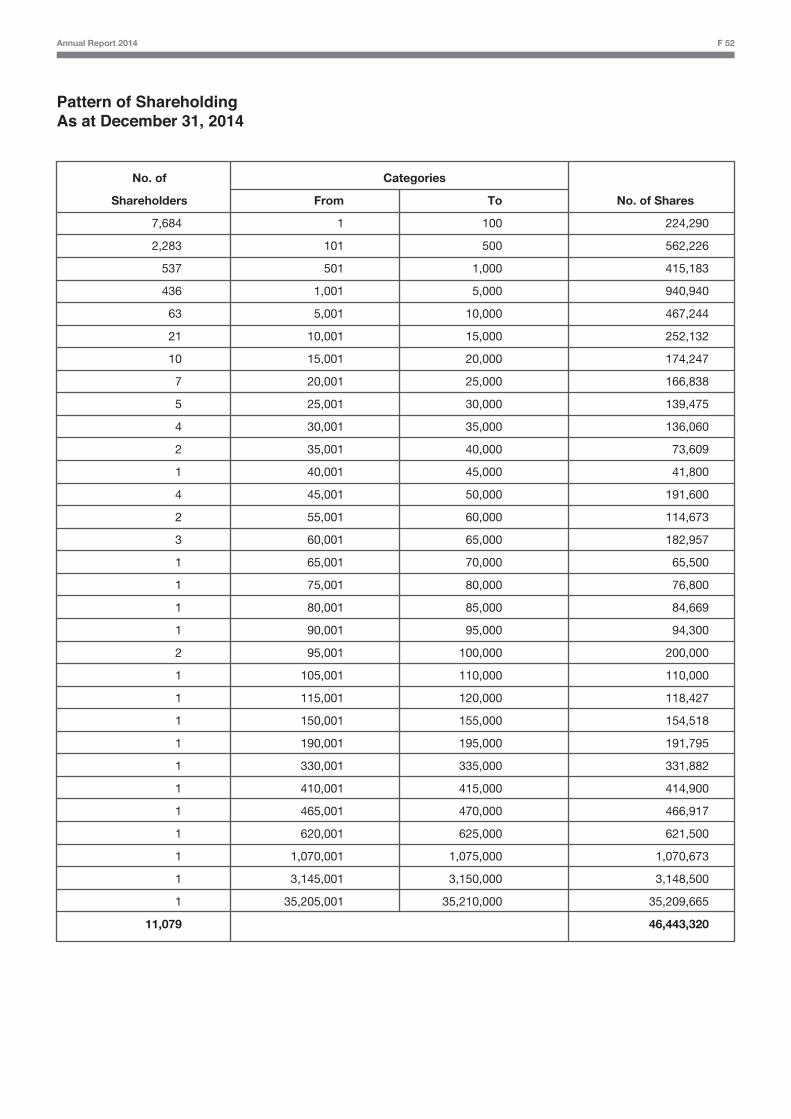
Annual Report 2014 F 52
Pattern of ShareholdingAs at December 31, 2014
No. of Categories
Shareholders From To No. of Shares
7,684 1 100 224,290
2,283 101 500 562,226
537 501 1,000 415,183
436 1,001 5,000 940,940
63 5,001 10,000 467,244
21 10,001 15,000 252,132
10 15,001 20,000 174,247
7 20,001 25,000 166,838
5 25,001 30,000 139,475
4 30,001 35,000 136,060
2 35,001 40,000 73,609
1 40,001 45,000 41,800
4 45,001 50,000 191,600
2 55,001 60,000 114,673
3 60,001 65,000 182,957
1 65,001 70,000 65,500
1 75,001 80,000 76,800
1 80,001 85,000 84,669
1 90,001 95,000 94,300
2 95,001 100,000 200,000
1 105,001 110,000 110,000
1 115,001 120,000 118,427
1 150,001 155,000 154,518
1 190,001 195,000 191,795
1 330,001 335,000 331,882
1 410,001 415,000 414,900
1 465,001 470,000 466,917
1 620,001 625,000 621,500
1 1,070,001 1,075,000 1,070,673
1 3,145,001 3,150,000 3,148,500
1 35,205,001 35,210,000 35,209,665
11,079 46,443,320
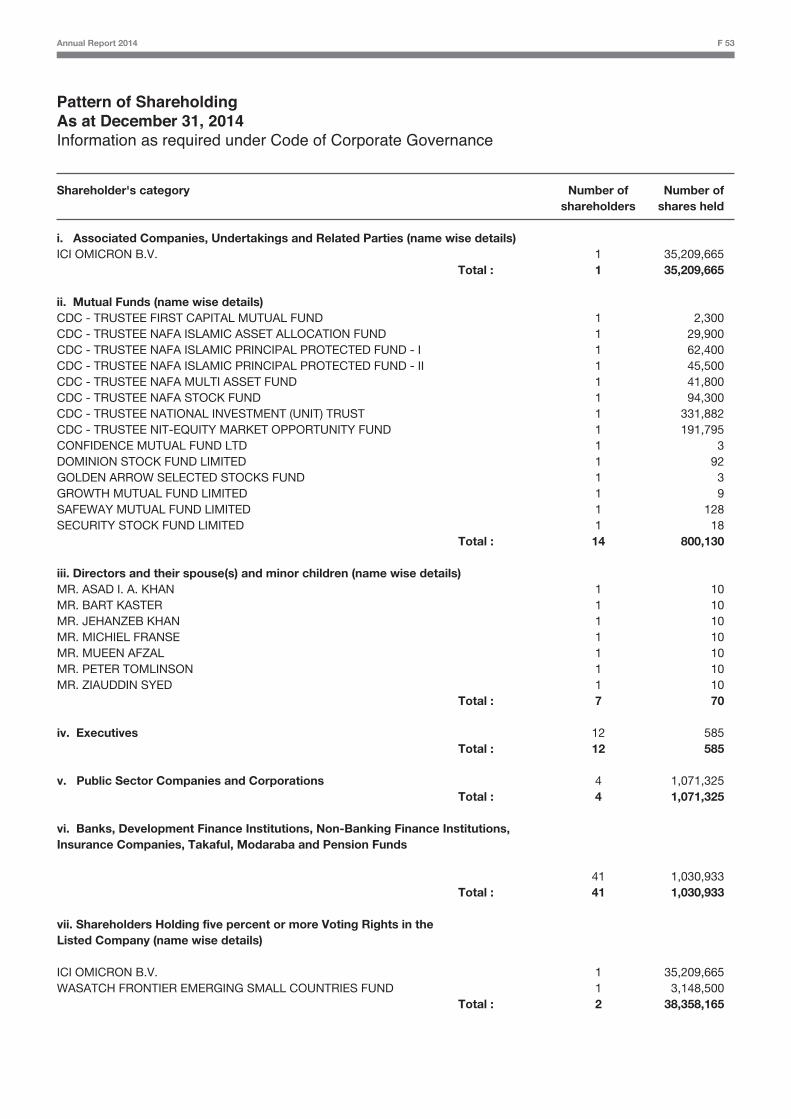
Annual Report 2014 F 53
Pattern of ShareholdingAs at December 31, 2014Information as required under Code of Corporate Governance
Shareholder's category Number of Number of shareholders shares held
i. Associated Companies, Undertakings and Related Parties (name wise details)ICI OMICRON B.V. 1 35,209,665 Total : 1 35,209,665
ii. Mutual Funds (name wise details)CDC - TRUSTEE FIRST CAPITAL MUTUAL FUND 1 2,300CDC - TRUSTEE NAFA ISLAMIC ASSET ALLOCATION FUND 1 29,900CDC - TRUSTEE NAFA ISLAMIC PRINCIPAL PROTECTED FUND - I 1 62,400CDC - TRUSTEE NAFA ISLAMIC PRINCIPAL PROTECTED FUND - II 1 45,500CDC - TRUSTEE NAFA MULTI ASSET FUND 1 41,800CDC - TRUSTEE NAFA STOCK FUND 1 94,300CDC - TRUSTEE NATIONAL INVESTMENT (UNIT) TRUST 1 331,882CDC - TRUSTEE NIT-EQUITY MARKET OPPORTUNITY FUND 1 191,795CONFIDENCE MUTUAL FUND LTD 1 3DOMINION STOCK FUND LIMITED 1 92GOLDEN ARROW SELECTED STOCKS FUND 1 3GROWTH MUTUAL FUND LIMITED 1 9SAFEWAY MUTUAL FUND LIMITED 1 128SECURITY STOCK FUND LIMITED 1 18 Total : 14 800,130
iii. Directors and their spouse(s) and minor children (name wise details)MR. ASAD I. A. KHAN 1 10MR. BART KASTER 1 10MR. JEHANZEB KHAN 1 10MR. MICHIEL FRANSE 1 10MR. MUEEN AFZAL 1 10MR. PETER TOMLINSON 1 10MR. ZIAUDDIN SYED 1 10 Total : 7 70
iv. Executives 12 585 Total : 12 585
v. Public Sector Companies and Corporations 4 1,071,325 Total : 4 1,071,325
vi. Banks, Development Finance Institutions, Non-Banking Finance Institutions, Insurance Companies, Takaful, Modaraba and Pension Funds
41 1,030,933 Total : 41 1,030,933
vii. Shareholders Holding five percent or more Voting Rights in the Listed Company (name wise details)
ICI OMICRON B.V. 1 35,209,665WASATCH FRONTIER EMERGING SMALL COUNTRIES FUND 1 3,148,500 Total : 2 38,358,165
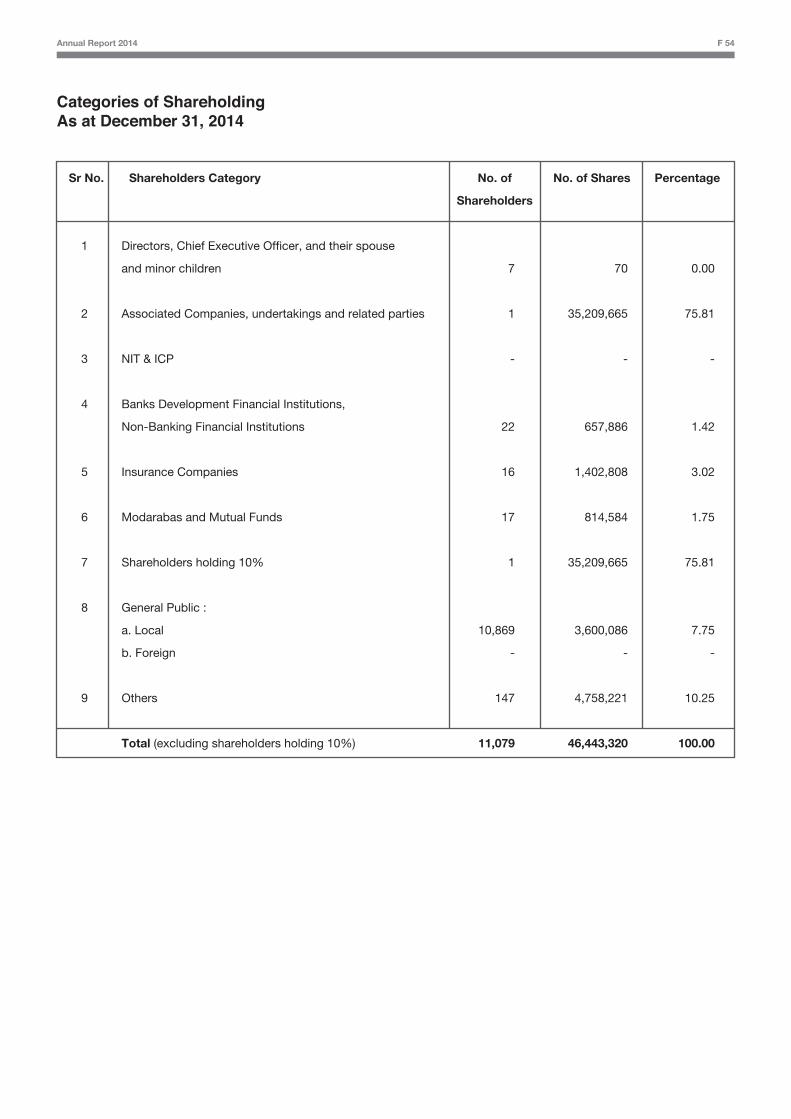
Annual Report 2014 F 54
Categories of ShareholdingAs at December 31, 2014
Sr No. Shareholders Category No. of No. of Shares Percentage
Shareholders
1 Directors, Chief Executive Officer, and their spouse
and minor children 7 70 0.00
2 Associated Companies, undertakings and related parties 1 35,209,665 75.81
3 NIT & ICP - - -
4 Banks Development Financial Institutions,
Non-Banking Financial Institutions 22 657,886 1.42
5 Insurance Companies 16 1,402,808 3.02
6 Modarabas and Mutual Funds 17 814,584 1.75
7 Shareholders holding 10% 1 35,209,665 75.81
8 General Public :
a. Local 10,869 3,600,086 7.75
b. Foreign - - -
9 Others 147 4,758,221 10.25
Total (excluding shareholders holding 10%) 11,079 46,443,320 100.00
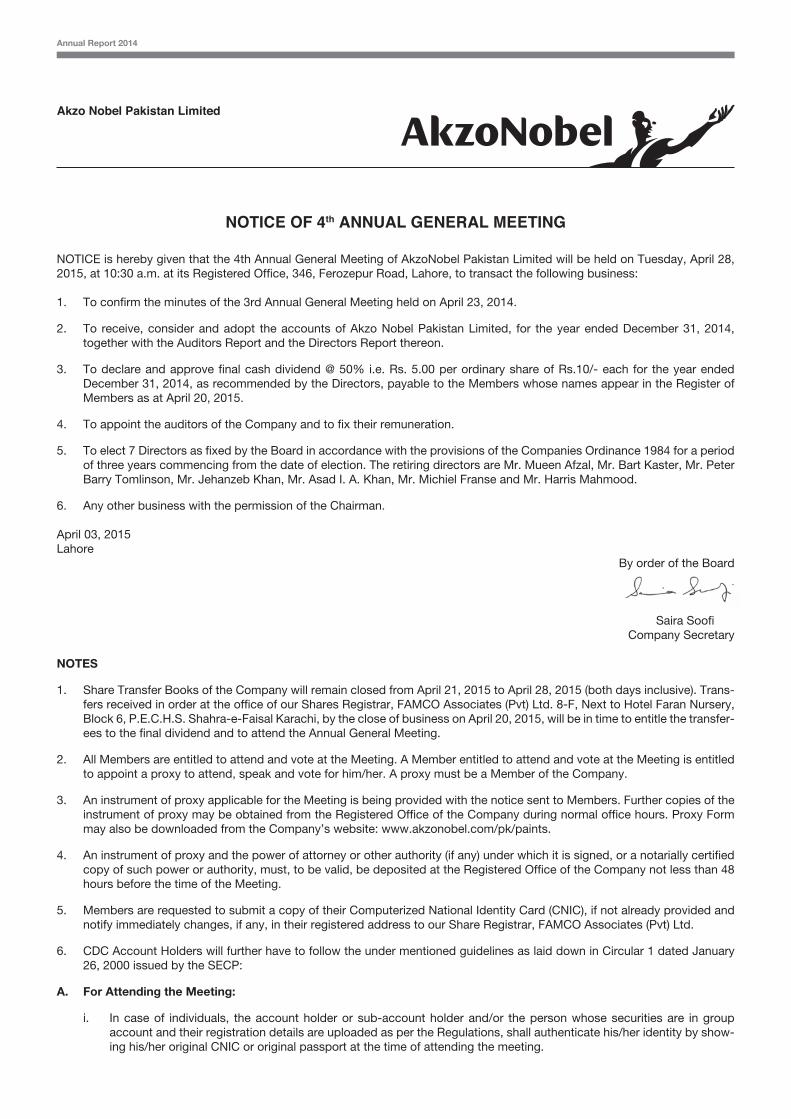
Annual Report 2014
Akzo Nobel Pakistan Limited
NOTICE OF 4th ANNUAL GENERAL MEETING
NOTICE is hereby given that the 4th Annual General Meeting of AkzoNobel Pakistan Limited will be held on Tuesday, April 28, 2015, at 10:30 a.m. at its Registered Office, 346, Ferozepur Road, Lahore, to transact the following business:
1. To confirm the minutes of the 3rd Annual General Meeting held on April 23, 2014.
2. To receive, consider and adopt the accounts of Akzo Nobel Pakistan Limited, for the year ended December 31, 2014, together with the Auditors Report and the Directors Report thereon.
3. To declare and approve final cash dividend @ 50% i.e. Rs. 5.00 per ordinary share of Rs.10/- each for the year ended December 31, 2014, as recommended by the Directors, payable to the Members whose names appear in the Register of Members as at April 20, 2015.
4. To appoint the auditors of the Company and to fix their remuneration.
5. To elect 7 Directors as fixed by the Board in accordance with the provisions of the Companies Ordinance 1984 for a period of three years commencing from the date of election. The retiring directors are Mr. Mueen Afzal, Mr. Bart Kaster, Mr. Peter Barry Tomlinson, Mr. Jehanzeb Khan, Mr. Asad I. A. Khan, Mr. Michiel Franse and Mr. Harris Mahmood.
6. Any other business with the permission of the Chairman.
April 03, 2015Lahore
By order of the Board
Saira SoofiCompany Secretary
NOTES
1. Share Transfer Books of the Company will remain closed from April 21, 2015 to April 28, 2015 (both days inclusive). Trans-fers received in order at the office of our Shares Registrar, FAMCO Associates (Pvt) Ltd. 8-F, Next to Hotel Faran Nursery, Block 6, P.E.C.H.S. Shahra-e-Faisal Karachi, by the close of business on April 20, 2015, will be in time to entitle the transfer-ees to the final dividend and to attend the Annual General Meeting.
2. All Members are entitled to attend and vote at the Meeting. A Member entitled to attend and vote at the Meeting is entitled to appoint a proxy to attend, speak and vote for him/her. A proxy must be a Member of the Company.
3. An instrument of proxy applicable for the Meeting is being provided with the notice sent to Members. Further copies of the instrument of proxy may be obtained from the Registered Office of the Company during normal office hours. Proxy Form may also be downloaded from the Company’s website: www.akzonobel.com/pk/paints.
4. An instrument of proxy and the power of attorney or other authority (if any) under which it is signed, or a notarially certified copy of such power or authority, must, to be valid, be deposited at the Registered Office of the Company not less than 48 hours before the time of the Meeting.
5. Members are requested to submit a copy of their Computerized National Identity Card (CNIC), if not already provided and notify immediately changes, if any, in their registered address to our Share Registrar, FAMCO Associates (Pvt) Ltd.
6. CDC Account Holders will further have to follow the under mentioned guidelines as laid down in Circular 1 dated January 26, 2000 issued by the SECP:
A. For Attending the Meeting:
i. In case of individuals, the account holder or sub-account holder and/or the person whose securities are in group account and their registration details are uploaded as per the Regulations, shall authenticate his/her identity by show-ing his/her original CNIC or original passport at the time of attending the meeting.
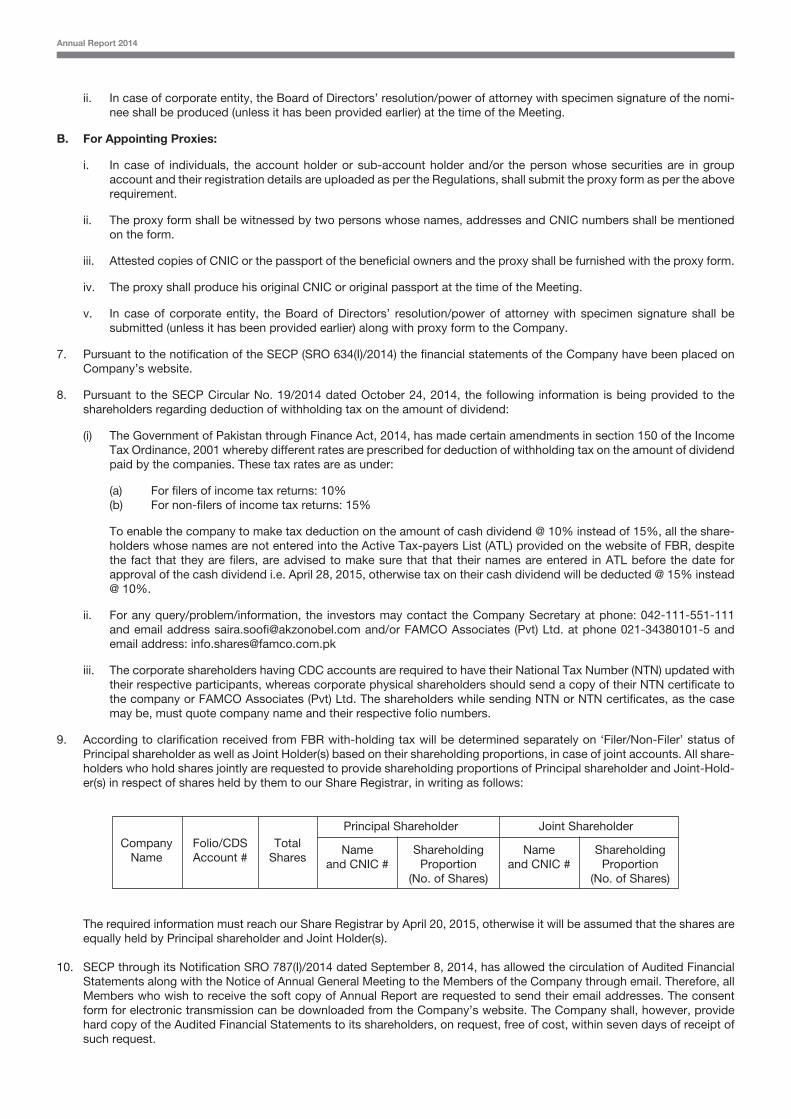
Annual Report 2014
ii. In case of corporate entity, the Board of Directors’ resolution/power of attorney with specimen signature of the nomi-nee shall be produced (unless it has been provided earlier) at the time of the Meeting.
B. For Appointing Proxies:
i. In case of individuals, the account holder or sub-account holder and/or the person whose securities are in group account and their registration details are uploaded as per the Regulations, shall submit the proxy form as per the above requirement.
ii. The proxy form shall be witnessed by two persons whose names, addresses and CNIC numbers shall be mentioned on the form.
iii. Attested copies of CNIC or the passport of the beneficial owners and the proxy shall be furnished with the proxy form.
iv. The proxy shall produce his original CNIC or original passport at the time of the Meeting.
v. In case of corporate entity, the Board of Directors’ resolution/power of attorney with specimen signature shall be submitted (unless it has been provided earlier) along with proxy form to the Company.
7. Pursuant to the notification of the SECP (SRO 634(I)/2014) the financial statements of the Company have been placed on Company’s website.
8. Pursuant to the SECP Circular No. 19/2014 dated October 24, 2014, the following information is being provided to the shareholders regarding deduction of withholding tax on the amount of dividend:
(i) The Government of Pakistan through Finance Act, 2014, has made certain amendments in section 150 of the Income Tax Ordinance, 2001 whereby different rates are prescribed for deduction of withholding tax on the amount of dividend paid by the companies. These tax rates are as under:
(a) For filers of income tax returns: 10% (b) For non-filers of income tax returns: 15%
To enable the company to make tax deduction on the amount of cash dividend @ 10% instead of 15%, all the share-holders whose names are not entered into the Active Tax-payers List (ATL) provided on the website of FBR, despite the fact that they are filers, are advised to make sure that that their names are entered in ATL before the date for approval of the cash dividend i.e. April 28, 2015, otherwise tax on their cash dividend will be deducted @ 15% instead @ 10%.
ii. For any query/problem/information, the investors may contact the Company Secretary at phone: 042-111-551-111 and email address [email protected] and/or FAMCO Associates (Pvt) Ltd. at phone 021-34380101-5 and email address: [email protected]
iii. The corporate shareholders having CDC accounts are required to have their National Tax Number (NTN) updated with their respective participants, whereas corporate physical shareholders should send a copy of their NTN certificate to the company or FAMCO Associates (Pvt) Ltd. The shareholders while sending NTN or NTN certificates, as the case may be, must quote company name and their respective folio numbers.
9. According to clarification received from FBR with-holding tax will be determined separately on ‘Filer/Non-Filer’ status of Principal shareholder as well as Joint Holder(s) based on their shareholding proportions, in case of joint accounts. All share-holders who hold shares jointly are requested to provide shareholding proportions of Principal shareholder and Joint-Hold-er(s) in respect of shares held by them to our Share Registrar, in writing as follows:
The required information must reach our Share Registrar by April 20, 2015, otherwise it will be assumed that the shares are equally held by Principal shareholder and Joint Holder(s).
10. SECP through its Notification SRO 787(I)/2014 dated September 8, 2014, has allowed the circulation of Audited Financial Statements along with the Notice of Annual General Meeting to the Members of the Company through email. Therefore, all Members who wish to receive the soft copy of Annual Report are requested to send their email addresses. The consent form for electronic transmission can be downloaded from the Company’s website. The Company shall, however, provide hard copy of the Audited Financial Statements to its shareholders, on request, free of cost, within seven days of receipt of such request.
CompanyName
Folio/CDSAccount #
TotalShares
Nameand CNIC #
ShareholdingProportion
(No. of Shares)
Principal Shareholder Joint Shareholder
Nameand CNIC #
ShareholdingProportion
(No. of Shares)
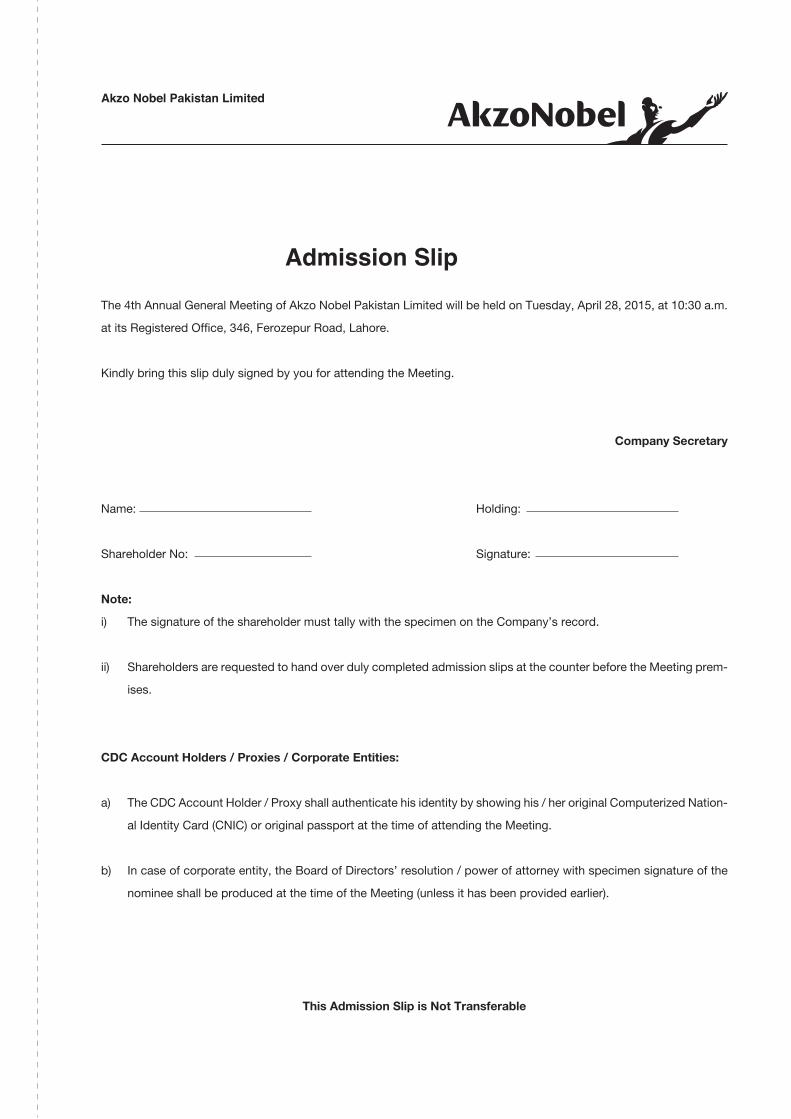
The 4th Annual General Meeting of Akzo Nobel Pakistan Limited will be held on Tuesday, April 28, 2015, at 10:30 a.m.
at its Registered Office, 346, Ferozepur Road, Lahore.
Kindly bring this slip duly signed by you for attending the Meeting.
Company Secretary
Name: Holding:
Shareholder No: Signature:
Note:
i) The signature of the shareholder must tally with the specimen on the Company’s record.
ii) Shareholders are requested to hand over duly completed admission slips at the counter before the Meeting prem-
ises.
CDC Account Holders / Proxies / Corporate Entities:
a) The CDC Account Holder / Proxy shall authenticate his identity by showing his / her original Computerized Nation-
al Identity Card (CNIC) or original passport at the time of attending the Meeting.
b) In case of corporate entity, the Board of Directors’ resolution / power of attorney with specimen signature of the
nominee shall be produced at the time of the Meeting (unless it has been provided earlier).
This Admission Slip is Not Transferable
Admission Slip
Akzo Nobel Pakistan Limited

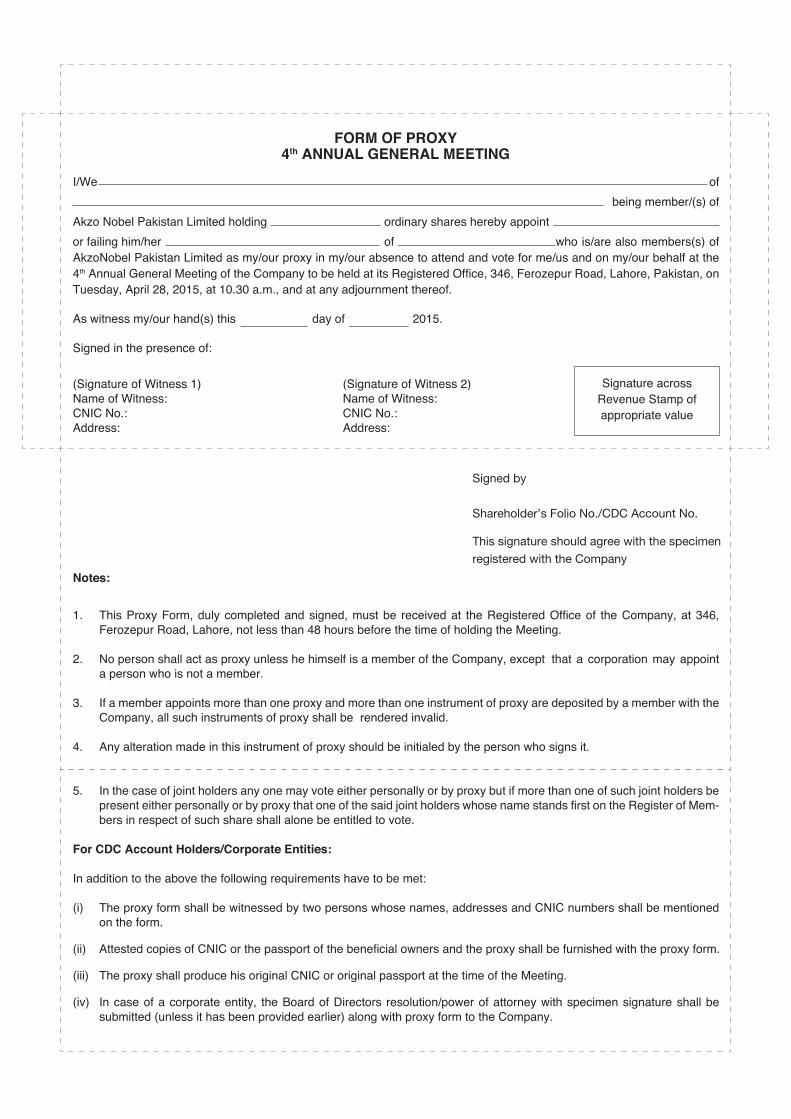
I/We of
being member/(s) of
Akzo Nobel Pakistan Limited holding ordinary shares hereby appoint
or failing him/her of who is/are also members(s) of AkzoNobel Pakistan Limited as my/our proxy in my/our absence to attend and vote for me/us and on my/our behalf at the 4th Annual General Meeting of the Company to be held at its Registered Office, 346, Ferozepur Road, Lahore, Pakistan, on Tuesday, April 28, 2015, at 10.30 a.m., and at any adjournment thereof.
As witness my/our hand(s) this day of 2015.
Signed in the presence of:
(Signature of Witness 1) (Signature of Witness 2) Name of Witness: Name of Witness: CNIC No.: CNIC No.: Address: Address:
Notes:
1. This Proxy Form, duly completed and signed, must be received at the Registered Office of the Company, at 346, Ferozepur Road, Lahore, not less than 48 hours before the time of holding the Meeting.
2. No person shall act as proxy unless he himself is a member of the Company, except that a corporation may appoint a person who is not a member.
3. If a member appoints more than one proxy and more than one instrument of proxy are deposited by a member with the Company, all such instruments of proxy shall be rendered invalid.
4. Any alteration made in this instrument of proxy should be initialed by the person who signs it.
5. In the case of joint holders any one may vote either personally or by proxy but if more than one of such joint holders be present either personally or by proxy that one of the said joint holders whose name stands first on the Register of Mem-bers in respect of such share shall alone be entitled to vote.
For CDC Account Holders/Corporate Entities:
In addition to the above the following requirements have to be met:
(i) The proxy form shall be witnessed by two persons whose names, addresses and CNIC numbers shall be mentioned on the form.
(ii) Attested copies of CNIC or the passport of the beneficial owners and the proxy shall be furnished with the proxy form.
(iii) The proxy shall produce his original CNIC or original passport at the time of the Meeting.
(iv) In case of a corporate entity, the Board of Directors resolution/power of attorney with specimen signature shall be submitted (unless it has been provided earlier) along with proxy form to the Company.
FORM OF PROXY4th ANNUAL GENERAL MEETING
Signature acrossRevenue Stamp ofappropriate value
Signed by
Shareholder’s Folio No./CDC Account No.
This signature should agree with the specimen
registered with the Company

AFFIXCORRECTPOSTAGE
Akzo Nobel Pakistan Limited 346, Ferozepur RoadLahore - 54600Tel: (042) 111-551-111Fax: (042) 35835011www.akzonobel.com/pk/paints
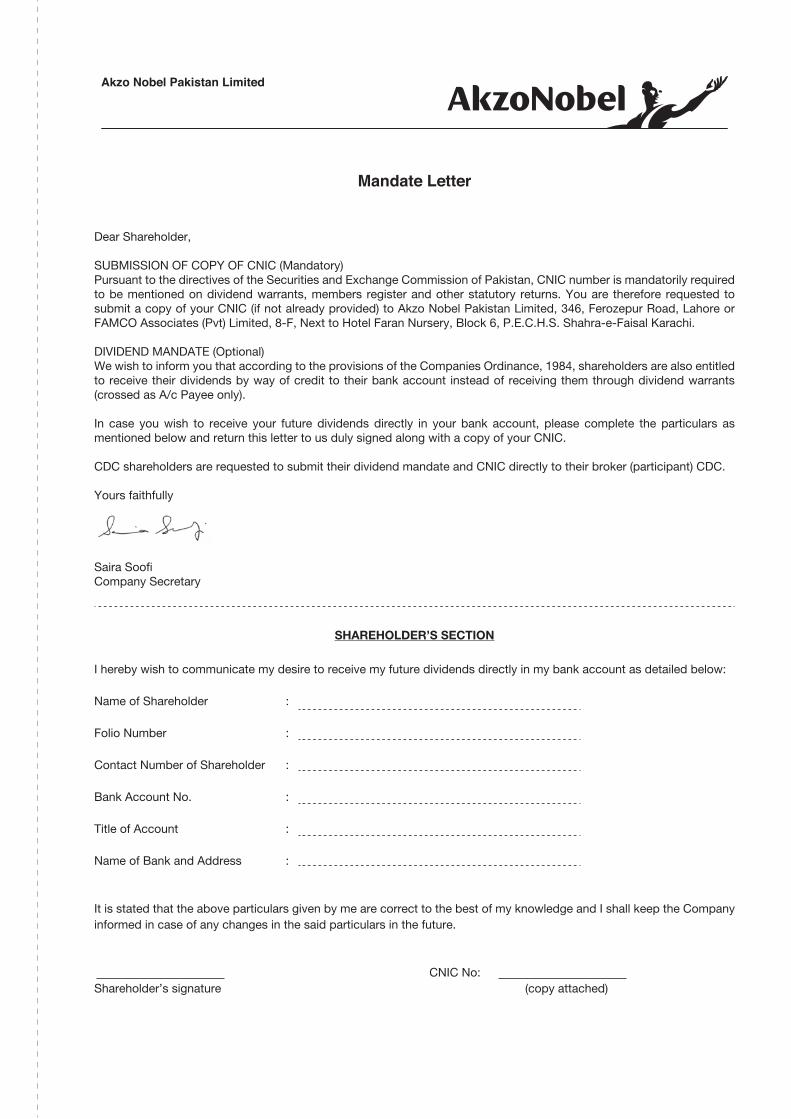
Mandate Letter
Dear Shareholder,
SUBMISSION OF COPY OF CNIC (Mandatory)Pursuant to the directives of the Securities and Exchange Commission of Pakistan, CNIC number is mandatorily required to be mentioned on dividend warrants, members register and other statutory returns. You are therefore requested to submit a copy of your CNIC (if not already provided) to Akzo Nobel Pakistan Limited, 346, Ferozepur Road, Lahore or FAMCO Associates (Pvt) Limited, 8-F, Next to Hotel Faran Nursery, Block 6, P.E.C.H.S. Shahra-e-Faisal Karachi.
DIVIDEND MANDATE (Optional) We wish to inform you that according to the provisions of the Companies Ordinance, 1984, shareholders are also entitled to receive their dividends by way of credit to their bank account instead of receiving them through dividend warrants (crossed as A/c Payee only).
In case you wish to receive your future dividends directly in your bank account, please complete the particulars as mentioned below and return this letter to us duly signed along with a copy of your CNIC.
CDC shareholders are requested to submit their dividend mandate and CNIC directly to their broker (participant) CDC.
Yours faithfully
Saira SoofiCompany Secretary
SHAREHOLDER’S SECTION
I hereby wish to communicate my desire to receive my future dividends directly in my bank account as detailed below:
Name of Shareholder :
Folio Number :
Contact Number of Shareholder :
Bank Account No. :
Title of Account :
Name of Bank and Address :
It is stated that the above particulars given by me are correct to the best of my knowledge and I shall keep the Company informed in case of any changes in the said particulars in the future.
CNIC No:Shareholder’s signature (copy attached)
Akzo Nobel Pakistan Limited