Striving Today for a Sustainable Tomorrow - Financials
292
INTERNATIONAL INDUSTRIES LIMITED ANNUAL REPORT 2020 Striving Today for a Sustainable Tomorrow
-
Upload
khangminh22 -
Category
Documents
-
view
2 -
download
0
Transcript of Striving Today for a Sustainable Tomorrow - Financials
INTE
RN
ATIO
NA
L IN
DU
STR
IES
LIM
ITED
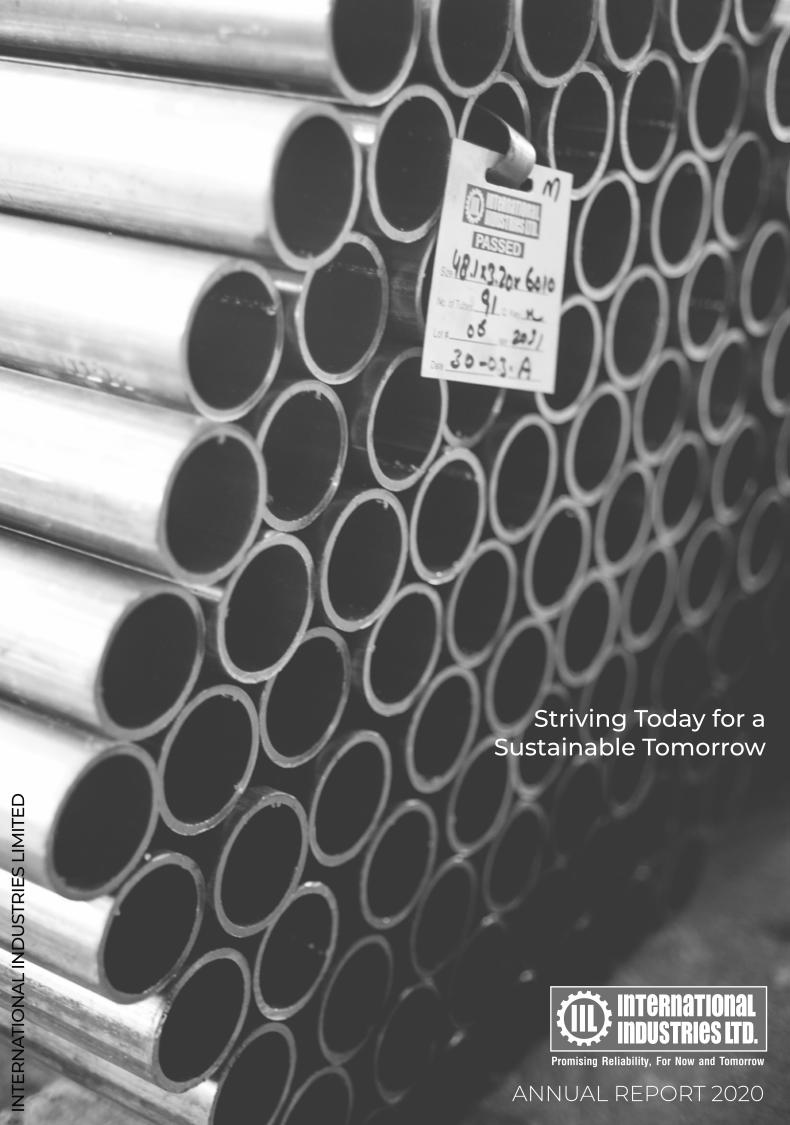
ANNUAL REPORT 2020
Striving Today for aSustainable Tomorrow

(ا�ل)Without the nation’s coherence, an individual firm is nothinglike a wave is nothing without the ocean.
(Iqbal)
TRIBUTE TO THE PEOPLE OF
PAKISTANPaying tribute to the people of this resilient nation, Pakistan.Who stay united with their steely strength and determination to face enemies across all the battlefields, whether it be defending the territories, navigating through economic turbulence or fighting a pandemic.
Unity | Strength | Resilience

Annual Report 2020
ABOUT THISREPORTWe are pleased to present our Annual Report for the year ended June 30th, 2020. The objective of this report is to provide all stakeholders with a transparent and balanced appraisal of the material issues that confronted the business during the year under review. This report should be read in conjunction with the full financial statements.
SCOPE AND LIMITATION OF THIS REPORTThis annual report is for the period from July 1st, 2019 to June 30th, 2020 and it provides an account of the Company’s operational, financial, social, economic and environmental performances as well as governance.
ANNUAL FINANCIAL STATEMENTSThese financial statements are also available on our website (www.iil.com.pk) and provide a complete insight of the financial positions for the period under review.
FORWARD LOOKING STATEMENTSThis report contains certain ‘forward looking statements’ which are related to the future. These statements include known and unknown risks and opportunities, uncertainties and important factors that could turn out to be materially different following the publications of these results. These statements are as of the date of this document. The Company undertakes no obligation to update publically or release any provisions of these forward looking statements.
FEEDBACKWe value the feedback of our stakeholders and use it to continuously improve our reporting and to ensure that we are reporting on issues relevant to them.
Your emails are welcomed at [email protected]
In the Name of AllahThe Most Gracious, The Most Merciful.This is by the Grace of Allah.

CONTENTS18 Company Profile20 Company Information22 Business at a Glance28 Vision and Mission30 Ethics, Culture and Values31 Strategic Objectives32 Geographical Presence34 Milestones36 Awards and Accolades38 Certifications40 Calendar of Major Events41 SWOT Analysis42 STEEPLES Analysis44 IIL’s Position in the Value Chain45 Group Structure and Group Facts
46Strategic Objectives, Strategies and Key Performance Indicators
48 Stakeholder Engagement50 Risk and Opportunity Report52 Code of Conduct
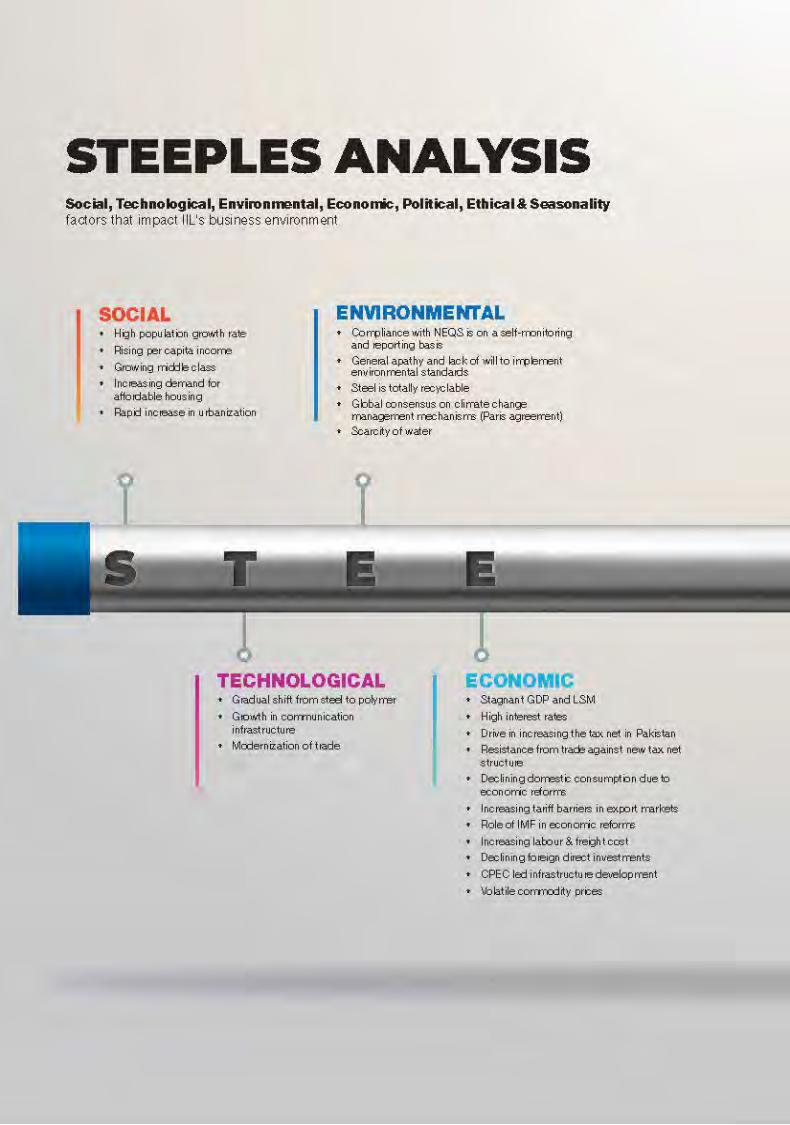
54 Chairman’s Review58 Chairman’s Review (Urdu)
59 Directors’ Report Board Composition and RemunerationGlobal Macroeconomic OutlookDomestic EconomyGlobal Steel ScenarioObjectives, Strategies and Critical Performance IndicatorsCompany OperationsProductionFinancial ReviewSegment ReviewDividendAuditorsSocial ImpactHuman Resources ManagementInternal Control FrameworkRisk, Opportunity and Mitigation ReportRelationship with StakeholdersQuarterly and Annual Financial StatementsCFO, Company Secretary and Head of Internal AuditComplianceInforming System and Re-engineeringVIS RatingInvestmentsAcknowledgement
78 Directors’ Report (Urdu)
Corporate Governance80 Profile of the Board of Directors83 List of other Directorships85 Organization Structure86 Governance Framework91 Mechanism for Providing Information92 Board Committees94 Meetings of the Board of Directors95 Managing Committee96 Executive Committee
97Report of The Board Audit Committee on Adherence to the Code of Corporate Governance
99Review Report on Statement of Compliance contained in Listed Companies (Code of Corporate Governance) Regulations, 2019
100Statement of Compliance with Listed Companies (Code of Corporate Governance) Regulations, 2019
Financial Statements and Highlights104 Financial Highlights
Business GrowthShareholder Value Accretion
Analysis of Financial Statements105 Statement of Financial Position106 Statement of Profit or Loss107 Statement of Cash Flows
108Graphical Presentation of Statement of Financial Position and Statement of Profit or Loss
109 Key Financial Indicators (Graphs)Conversion Cost Product Wise Sales Break Up
110 Key Financial Indicators Profitability RatiosLiquidity RatiosActivity / Turnover RatiosInvestment / Market RatiosCapital Structure Ratios
111 Free Cashflow112 Economic Value Added
113Comments on Six years Analysis on the Performance of the CompanyStatement of Financial PositionStatement of Comprehensive IncomeCashflow AnalysisRatio Analysis
115 DuPont Analysis116 Quarterly Performance Analysis117 Statement of Value Addition118 Performance at a Glance120 Statement of Cash Flows - Direct Method121 Share Price Sensitivity Analysis122 Forward Looking Statement124 Auditors’ Report to the Members

Unconsolidated Financial Statements132 Statement of Financial Position133 Statement of Profit or Loss134 Statement of Comprehensive Income135 Statement of Cash Flows136 Statement of Changes in Equity137 Notes to the Financial Statements
Consolidated Financial Statements and Highlights
189 Consolidated Financial HighlightsBusiness GrowthShareholder Value Accretion
Analysis of Consolidated Financial Statements190 Statement of Financial Position191 Statement of Profit or Loss192 Statement of Cash Flows
193Graphical Presentation of Consolidated Statement of Financial Position and Consolidated Statement of Profit or Loss
194 Consolidated Key Financial Indicators Profitability RatiosLiquidity RatiosActivity / Turnover RatiosInvestment / Market RatiosCapital Structure Ratios
195 Consolidated Statement of Value Addition196 Consolidated Performance at a Glance198 Auditors’ Report to the Members
Consolidated Financial Statements204 Consolidated Statement of Financial Position205 Consolidated Statement of Profit or Loss
206Consolidated Statement of Comprehensive Income
207 Consolidated Statement of Cash Flows208 Consolidated Statement of Changes in Equity
209Notes to the Consolidated Financial Statements
Stakeholders Information268 Financial Calendar268 Shareholders Composition269 Pattern of Shareholding270 Categories of Shareholders270 Key Shareholding and Shares Traded271 Notice of Annual General Meeting275 Notice of Annual General Meeting (Urdu)
GlossaryJumma PunjiConsent for Annual Report Through EmailsE-Dividend Mandate LetterProxy FormProxy Form (Urdu)
Karachi via video conferencing
Wednesday, September 30th, 2020
11:30 AM

6 International Industries Limited

8 International Industries Limited


10 International Industries Limited


12 International Industries Limited


14 International Industries Limited


16 International Industries Limited


18 International Industries Limited
COMPANY PROFILE International Industries Limited (IIL) is Pakistan’s largest manufacturer of steel, stainless steel and polymer pipes with an annual manufacturing capacity of 817,000 tons and annual revenues of PKR 18.9 billion.
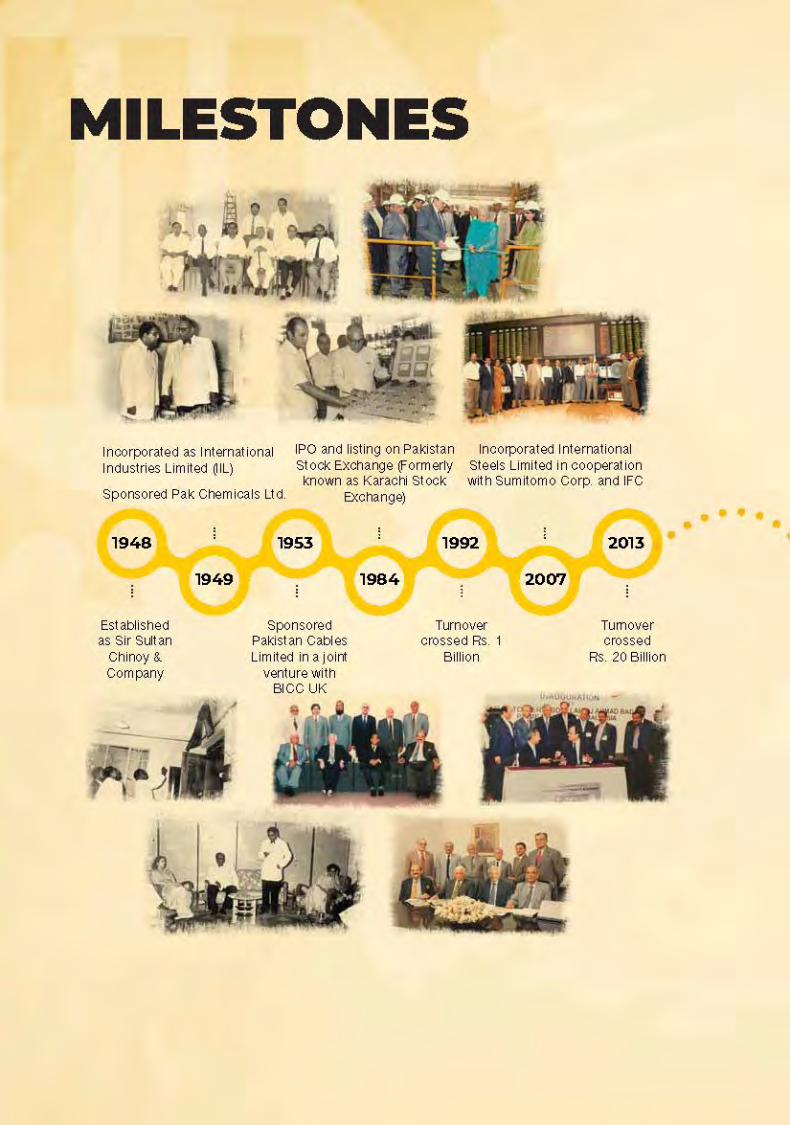
IIL was incorporated in Pakistan in 1948, is quoted on the Pakistan Stock Exchange and has an equity of over PKR 8.9 billion and has featured on the listing of Pakistan’s Top 25 Companies consecutively for more than 12 years.
IIL is a part of a group of Companies that includes:
International Steels Limited (ISL): Pakistan’s largest manufacturer of cold rolled, galvanized and color coated steel coils and sheets. ISL has an annual manufacturing capacity of over 1 million tons and annual revenues of over PKR 48.1 billion.
Pakistan Cables Limited (PCL): Pakistan’s premium manufacturer of electrical cables, wires, copper rod, PVC compound and aluminum sections with annual revenues in excess of PKR 9.1 billion.
IIL Australia Pty Limited: IIL’s wholly owned Australian subsidiary which represents the Group’s interest in the Asia Pacific region.
IIL Americas Inc.: IIL’s wholly owned Canadian subsidiary which represents the Group’s interest in the North America.
19Annual Report 2020
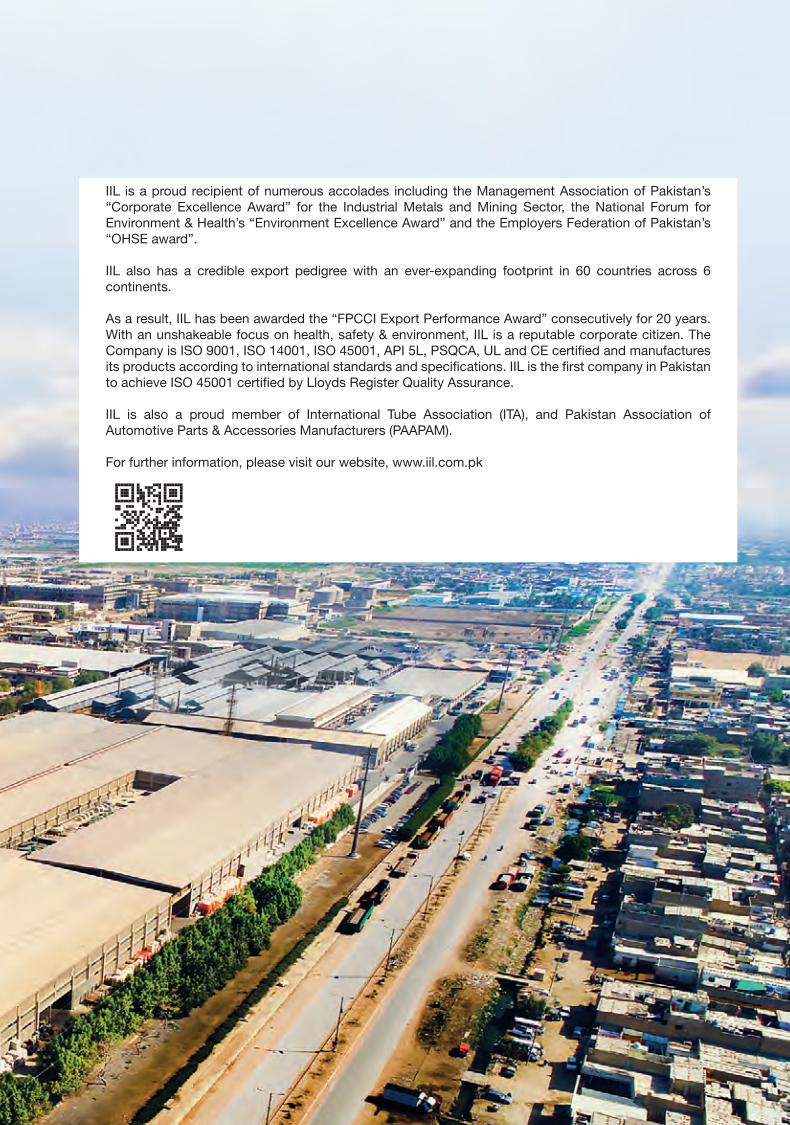
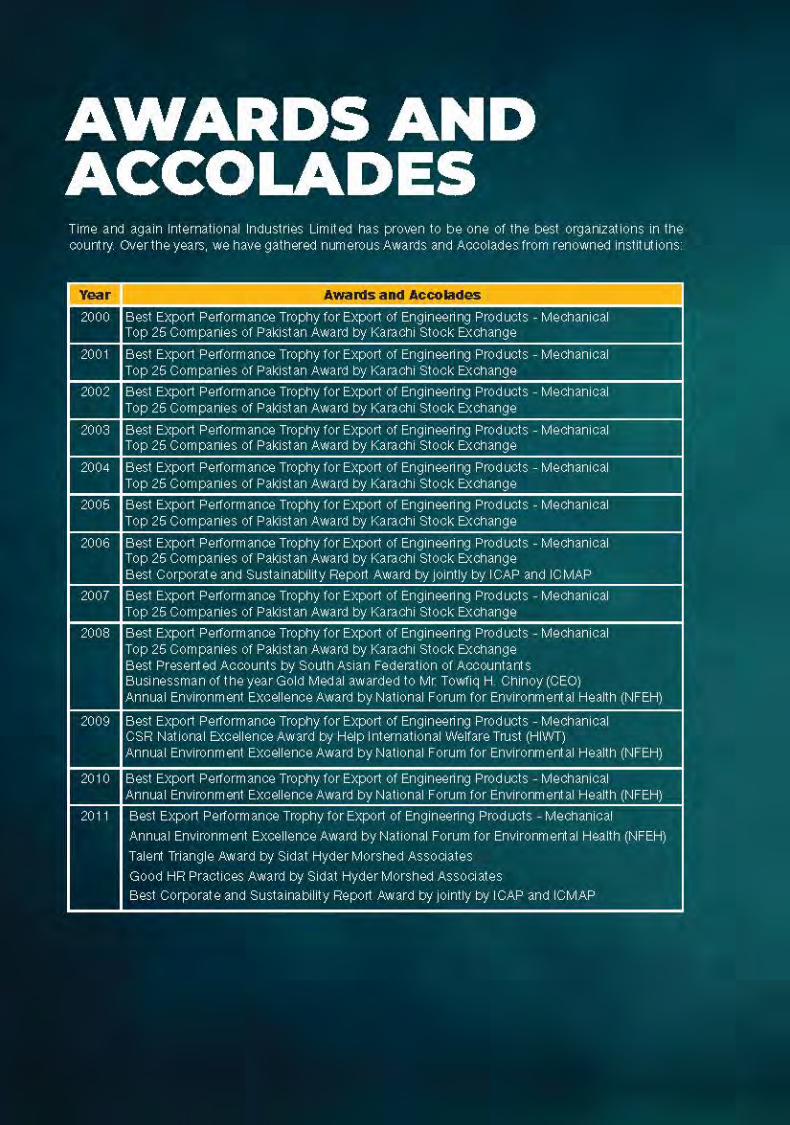
IIL is a proud recipient of numerous accolades including the Management Association of Pakistan’s “Corporate Excellence Award” for the Industrial Metals and Mining Sector, the National Forum for Environment & Health’s “Environment Excellence Award” and the Employers Federation of Pakistan’s “OHSE award”.
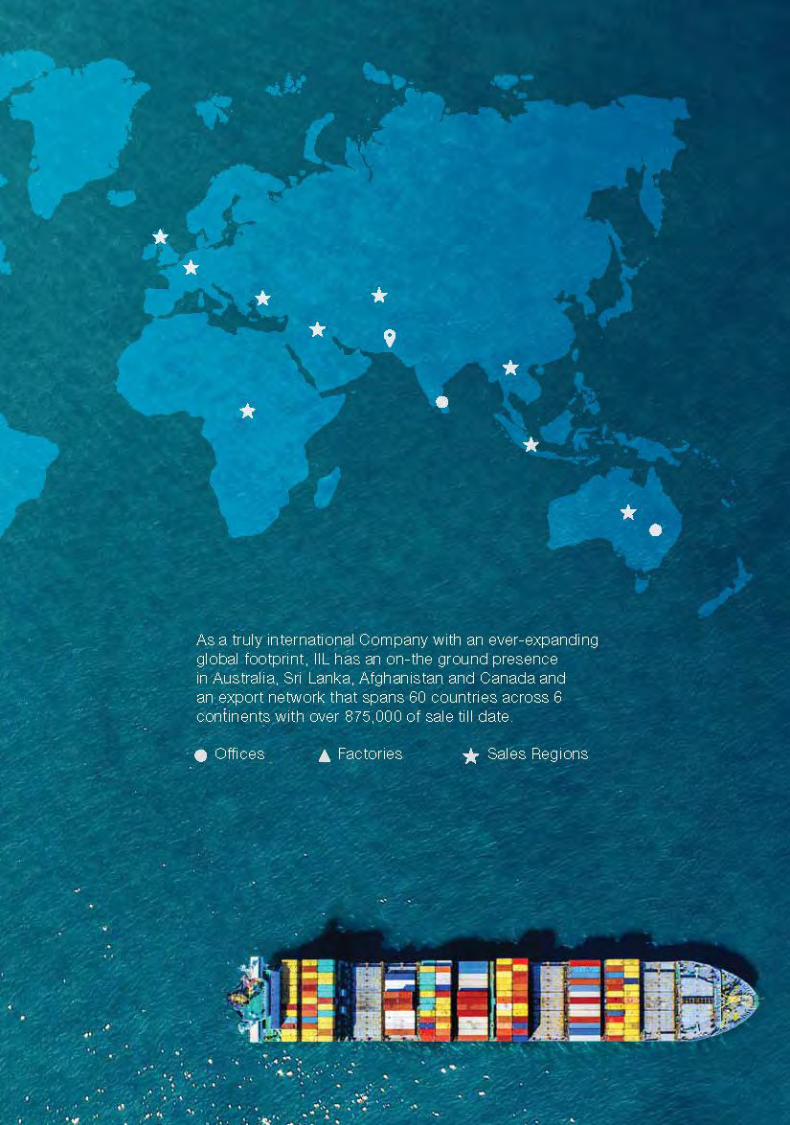
IIL also has a credible export pedigree with an ever-expanding footprint in 60 countries across 6 continents.
As a result, IIL has been awarded the “FPCCI Export Performance Award” consecutively for 20 years. With an unshakeable focus on health, safety & environment, IIL is a reputable corporate citizen. The Company is ISO 9001, ISO 14001, ISO 45001, API 5L, PSQCA, UL and CE certified and manufactures its products according to international standards and specifications. IIL is the first company in Pakistan to achieve ISO 45001 certified by Lloyds Register Quality Assurance.
IIL is also a proud member of International Tube Association (ITA), and Pakistan Association of Automotive Parts & Accessories Manufacturers (PAAPAM).
For further information, please visit our website, www.iil.com.pk
20 International Industries Limited
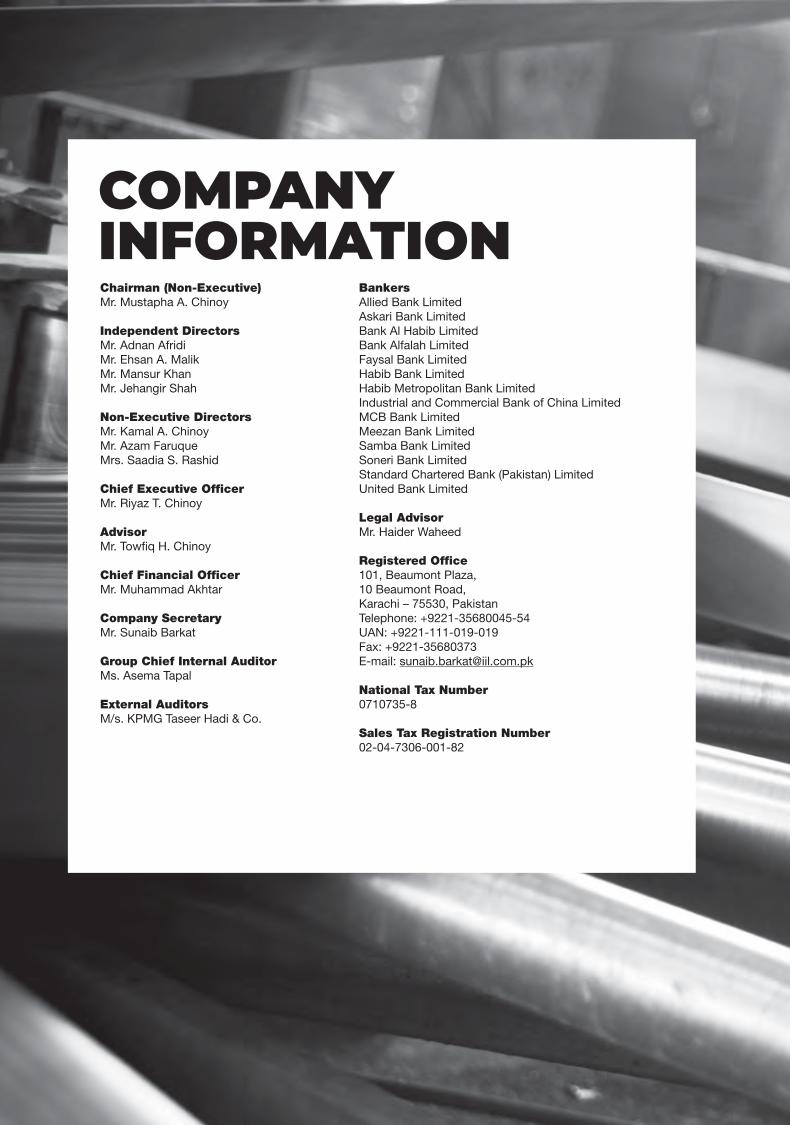
Chairman (Non-Executive)Mr. Mustapha A. Chinoy
Independent DirectorsMr. Adnan AfridiMr. Ehsan A. MalikMr. Mansur KhanMr. Jehangir Shah
Non-Executive DirectorsMr. Kamal A. ChinoyMr. Azam FaruqueMrs. Saadia S. Rashid
Chief Executive OfficerMr. Riyaz T. Chinoy
AdvisorMr. Towfiq H. Chinoy
Chief Financial OfficerMr. Muhammad Akhtar
Company SecretaryMr. Sunaib Barkat
Group Chief Internal AuditorMs. Asema Tapal
External AuditorsM/s. KPMG Taseer Hadi & Co.
COMPANY INFORMATION
BankersAllied Bank LimitedAskari Bank LimitedBank Al Habib LimitedBank Alfalah LimitedFaysal Bank LimitedHabib Bank LimitedHabib Metropolitan Bank LimitedIndustrial and Commercial Bank of China LimitedMCB Bank LimitedMeezan Bank LimitedSamba Bank LimitedSoneri Bank LimitedStandard Chartered Bank (Pakistan) LimitedUnited Bank Limited
Legal AdvisorMr. Haider Waheed
Registered Office101, Beaumont Plaza, 10 Beaumont Road, Karachi – 75530, PakistanTelephone: +9221-35680045-54UAN: +9221-111-019-019Fax: +9221-35680373E-mail: [email protected]
National Tax Number0710735-8
Sales Tax Registration Number02-04-7306-001-82
21Annual Report 2020
Lahore OfficeChinoy House, 6 Bank Square, Lahore - 54000 , PakistanTelephone: +9242-37229752-55UAN: +9242-111-019-019, Fax: +9242-37220384E-Mail: [email protected]
Islamabad Office3rd Floor, Evacuee Trust, Plot No. 4, Agha Khan Road F-5/1, Islamabad, PakistanTelephone: +9251-2524650, +9251-4864601-2
Multan Office1592, 2nd Floor, Quaid-e-Azam Shopping Centre No.1 Multan Cantt., Multan, PakistanTelephone: +9261-4583332
Faisalabad OfficeOffice No.1/1, Wahab Centre, Electrocity Plaza Susan Road, Faisalabad, PakistanTelephone: +9241-8720037
Peshawar OfficeOffice No.1 & 2, First Floor, Hurmaz Plaza, Opp. Airport Main University Road, Peshawar, PakistanTelephone: +9291-5845068
IIL Australia Pty LimitedRegistered Office: 103, Abbot Road,Hallam, Victoria 3803, AustraliaWebsite: www.iilaustralia.com
IIL Americas Inc.Registered Office: 36, Gerigs Street,Scarborough, Toronto, ON M1L 0B9, CanadaWebsite: www.iilamericas.com
Factories
Factory 1LX 15-16, Landhi Industrial Area, Karachi – 75120, PakistanTelephone: +9221-35080451-55Fax: +9221-35082403, E-mail: [email protected]
Factory 2Survey # 405 & 406, Rehri Road, Landhi, Karachi – 75160, PakistanTelephone: +9221-35017026-28, 35017030Fax: +9221-35013108
Factory 322 KM, Sheikhupura Road, Lahore, PakistanTelephone: +9242-37190491-3
Investor Relations Contact Shares RegistrarCDC Share Registrar Services LimitedCDC House, 99-B, Block “B”, S.M.C.H.SShahrah-e-Faisal, Karachi, Pakistan Telephone: +92-0800-23275Fax: +92-21-34326053E-mail: [email protected]: www.cdcsrsl.com
Corporate Websitewww.iil.com.pk
Financial StatementsAnnual Report 2020
Group Sustainability ReportSustainability Report 2020

22 International Industries Limited
BUSINESS AT A GLANCEPrincipal Business Activities:
IIL is engaged in the manufacture, sale and export of steel pipes and tubes, stainless steel tubes and polymer pipes and fittings.
Key Markets:
The Company is the market leader in Pakistan with sales across the Nation. Sales are led by the North region consisting of Punjab, Khyber Pakhtunkhwa, Azad Jammu and Kashmir and Gilgit-Baltistan followed by the South region consisting of Sindh and Balochistan.
Additionally, IIL is Pakistan’s main exporter of pipes and tubes with a significant export footprint spanning 60 countries across 6 continents with over 875,000 tons of pipe exported to date.
Key Brands and Products:
IIL is widely recognised as Pakistan’s leading brand of pipes and tubes across all product segments.
However, IIL also has various product specific brands and products as follows:
1- Steel Pipes & Tubes2- Stainless Steel Tubes3- Polymer Pipes & Fittings

23Annual Report 2020
STEEL PIPES & TUBESIIL Galvanized Iron PipesIIL Galvanized Iron (GI) pipes are corrosion and rust resistant pipes that are ideal for the transmission of potable water, natural gas, oil and other fluids. They are also used in fencing, hand pumps, low cost shelters and general fabrication.
IIL GI pipes are certified as European Conformity Standards (CE) and are manufactured in accordance with the highest international standards (BS EN 10255: 2004, ASTM A53, ASTM A795, EN39, SLS829:2009)
IIL GI pipes are available in nominal diameters of 15mm (1/2”) to 200mm (8”) and in thickness from 1.60mm to 5.40mm.
IIL Hollow Structural SectionsIIL Hollow Structural Sections (HSS) are ideal for construction of buildings, bridges, pedestrian walkways, stadiums and structures of all kinds.
IIL Hollow Structural Sections are made in accordance with the highest relevant international quality standards (BS EN 10219, ASTM A53, A500 & A252).
IIL Hollow Structural Sections are available in round, square and rectangle shapes with thickness range from 1.65mm to 12.70mm.
IIL Cold Rolled Steel TubesIIL Cold Rolled (CR) steel tubes are predominantly used in the automotive, motorcycle, bicycle, transformer industries and in the manufacturing of fans, furniture, tents and other mechanical and general engineering items.
IIL CR steel tubes are certified as European Conformity Standards (CE) and are manufactured in accordance with the highest international standards (BS 1717: 1983, BS EN 10305-3: 2010, BSEN 10305-5: 2010 and EN 10296-1:2003)
IIL CR steel tubes are available in round, square, rectangle, oval and elliptical shapes in various sizes with thickness range from 0.6mm to 2.00mm.
IIL Scaffolding Pipes (SAFESCAF)IIL’s high strength scaffolding pipes are sold under the brand name IIL Safescaf and can be applied for scaffolding use in any construction project.
IIL Scaffolding Pipes are manufactured in accordance with BS EN 39:2001 which is the highest international quality standard for such pipes.
IIL Scaffolding Pipes are available in galvanized and black forms with outer diameter of 48.3mm in Type 2, 3 and 4.
IIL Firefighting PipesIIL Firefighting pipes are ideal for specialized water transmission (high pressure, chemical liquids, extreme temperature steam, water and gas).
IIL Firefighting pipes are certified as European Conformity Standards (CE) and Underwriters Laboratories (UL) and are manufactured in accordance with the highest international standards (ASTM A53 Sch. 40 Grade A and B and ASTM A795).
IIL Firefighting pipes are available in nominal diameters of ½” to 12” with thickness range from 2.77mm to 10.31mm.

24 International Industries Limited
STEEL PIPES & TUBESIIL Pre-Galvanized TubesIIL Pre-Galvanized tubes have a variety of uses in general fabrication including fence framework.
IIL Pre-Galvanized tubes are manufactured in accordance with BS EN10305-3.
IIL Pre-Galvanized tubes are available in round, square and rectangle shapes and thickness range from 0.8mm to 1.50mm.
IIL CRS TubesIIL CRS tubes are ideal for straight use and are most commonly used in the fabrication of gates, grills, railings, charpai and other furniture.
These pipes are available in various thicknesses ranging from 0.9mm to 1.8mm.
IIL API Line PipesIIL API Line pipes are used in distribution of natural gas and petroleum.
IIL API Line pipes are available in PSL1 and PSL2 specification made in accordance with API Monogram, and API Specification under license: 5L-0391 and 5L-1104.
IIL API Line pipes are available in diameter ranging from ¾” to 12 ¾” with the length ranging from 6 meters to 12.20 meters.
IIL LTZD ProfilesIIL LTZD profiles are used in fabrication of doors, windows, gates and railings.
These profiles are available in various sizes with thickness range from 0.70mm to 1.20mm.

25Annual Report 2020
STAINLESS STEEL TUBESIIL Cosmo (SS Grade 300 Series)IIL Cosmo (SS Grade 300 Series) tubes are rust resistant, premium stainless steel tubes that can be used in a variety of ornamental applications.
IIL Cosmo (SS Grade 300 Series) tubes are made in accordance with ASTM A240 and A554, JIS G-4305.
IIL Cosmo (SS Grade 300 Series) tubes are available in round, square and rectangle shapes in various sizes with thickness range from 0.8mm to 1.5mm. IIL Cosmo (SS Grade 300 Series) tubes are available in bright, satin/euro and hairline surface finish.
IIL Forza (SS Grade 400 Series)IIL FORZA (SS Grade 400 Series) tubes are manufactured for use in automotive exhausts, trims and frames, mufflers and home geysers.
IIL Forza (SS Grade 400 Series) tubes are manufactured in accordance with ASTM A240 and A554.
IIL Forza (SS Grade 400 Series) tubes are available in diameter range from 12.0mm to 63.50mm with wall thickness range from 0.8mm to 1.5mm.
IIL Eco (SS Grade 200 Series)IIL Eco (SS Grade 200 Series) tubes are economical grade stainless steel tubes that can be used in indoor applications and non-coastal areas only.
IIL Eco (SS Grade 200 Series) tubes are made in accordance with high ASTM A240 and A554, JIS G-4305.
IIL Eco (SS Grade 200 Series) tubes are available in round, square and rectangle shapes in various sizes with thickness range from 0.8mm to 1.5mm. IIL Cosmo (SS Grade 200 Series) are available in bright, satin/euro and hairline surface finish.

26 International Industries Limited
IIL PPRC Pipes and FittingsIIL PPRC pipes and fittings are ideal for transmission of hot and cold water in all residential, commercial, and industrial settings.
IIL PPRC pipes and fittings are manufactured in accordance with the highest quality international standards (DIN 16962, DIN 8077, DIN 8078).
IIL PPRC pipes and fittings are the only PSQCA certified PPRC pipes and fittings in Pakistan.
IIL PPRC pipes are available in PN-16, PN-20 and PN-25 with diameter range from 20mm to 110mm and wall thickness range of 2.8mm to 18.3mm. IIL’s PPRC fittings range is the largest in Pakistan.
IIL HDPE Water PipesIIL HDPE water pipes are used in municipal and industrial applications and provide a safe, corrosion free piping system for transporting potable water and other liquids.
IIL HDPE water pipes are made in accordance with the highest quality standards (DIN 8074/75, ISO 4427) and are PSQCA certified.
IIL HDPE water pipes are available in Grade-80 (PN 08), Grade-100 (PN 08, PN 10, PN 12.5, PN 16 and PN 20) with diameter range from 20mm to 1600mm and wall thickness of 1.9mm to 94.1mm.
At 1600mm in diameter, IIL manufactures the largest HDPE pipe in Pakistan.
IIL MDPE Gas PipesIIL MDPE gas pipes are used for distribution of natural gas, liquefied petroleum gas (LPG) and other gaseous fuels.
IIL MDPE gas pipes are made in accordance with the highest quality international standards (BGC/PS/PL2: Part 1, ISO 4437 and ASTM D-2513)
IIL MDPE gas pipes are available in PE-80 and PE-100 and SDR 7-17.6, with diameter range from 20mm to 250mm and wall thickness range from 1.0mm to 22.7mm.
POLYMER PIPES & FITTINGS

27Annual Report 2020
POLYMER PIPES & FITTINGSIIL HDPE Duct PipesIIL HDPE duct pipes are used to provide a ducting sheath for fiber optic and telecom cables.
IIL HDPE duct pipes are made in accordance with the highest quality international standards (ASTM D638, ISO 1183, ASTM F-2160, ISO 2505, Bell Core GR-456)
IIL HDPE duct pipes are available in diameter range from 12mm to 250mm with wall thickness range from 1.9mm to 27.9mm.
IIL HDPE CorruDuct PipesIIL HDPE CorruDuct pipes are corrugated structural wall duct with advantage of light weight and high flexibility.
IIL HDPE CorruDuct pipes are used to provide a ducting sheath for fiber optic and telecom cables.
IIL HDPE CorruDuct pipes are made in accordance with the highest quality international standards (ASTM D638, ISO 1183, ASTM F-2160, ISO 2505, Bell Core GR-456)
IIL HDPE CorruDuct pipes are available in diameter range from 20mm to 50mm with wall thickness range from 0.4mm to 1.0mm.


30 International Industries Limited
ETHICS, CULTURE AND VALUESAt IIL, we take pride in uncompromising integrity through each individual’s effort towards a quality product for our customers and sizeable contributions to the National Exchequer.
Ethical: IIL is honest and ethical in its dealings at all times through compliance with the applicable laws and regulations.
Excellence: IIL endeavors to exceed the expectations of all stakeholders.
Fairness: IIL believes in fairness to all stakeholders.
Innovation: IIL encourages its employees to be creative and seek innovative solutions.
Reliability: IIL has established itself as a reliable and dependable business partner.
Respect: IIL values the self-esteem of all stakeholders, be it employees, suppliers, customers or shareholders.
Responsibility: IIL considers quality health, safety and the environment an integral part of its activities and way of life.

31Annual Report 2020
STRATEGIC OBJECTIVES• To remain an ethical Company.
• Ensure a fair return to shareholders.
• Retain our reputation as the quality leader in our markets.
• To remain the volume leader by maintaining quality and easy availability of diversified products.
• To enhance market share by maintaining a fair price, ensuring availability and timely deliveries.
• To enhance exports and leverage them to take advantage of economies of scale.
• Focus on new ventures, especially M&A’s and JV’s in near home markets in order to capitalize on opportunities for inorganic growth.
• Capitalize on traditionally strong engineering base and invest to expand / modernize production capability.
• Maintain focus on CSR, environment and safety management in order to reap corporate benefits as good corporate citizen and employer.
• Ensure aggressive training and development of personnel commensurate with strategic needs, of the company specially those who are key executives of the company.


45Annual Report 2020
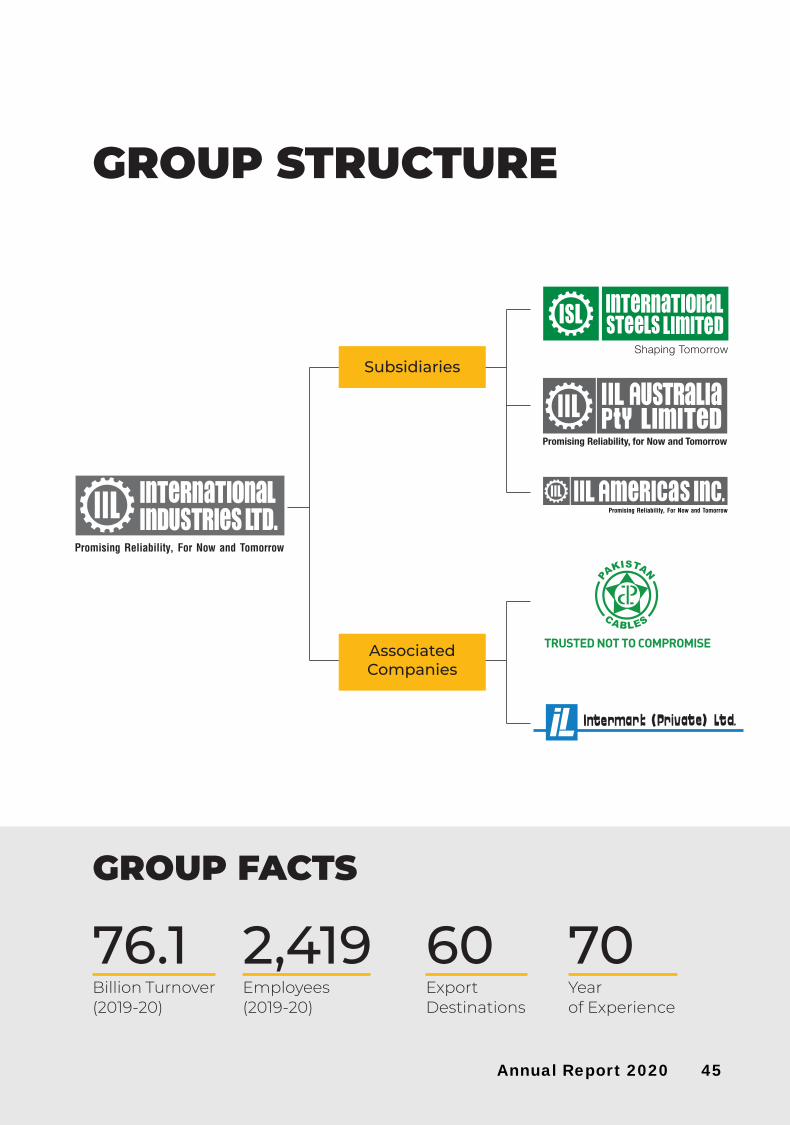
GROUP STRUCTURE
GROUP FACTS
76.1Billion Turnover(2019-20)
2,419Employees(2019-20)
60ExportDestinations
70Year of Experience
AssociatedCompanies
Subsidiaries
46 International Industries Limited
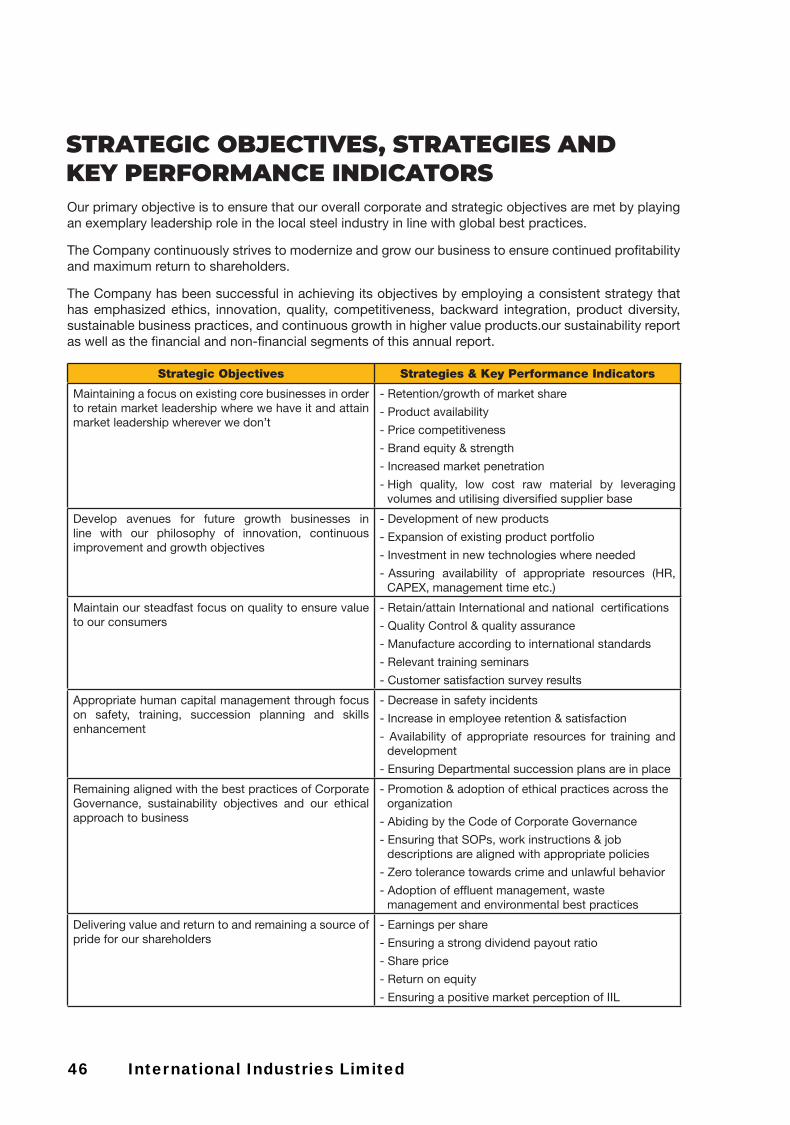
STRATEGIC OBJECTIVES, STRATEGIES AND KEY PERFORMANCE INDICATORSOur primary objective is to ensure that our overall corporate and strategic objectives are met by playing an exemplary leadership role in the local steel industry in line with global best practices.
The Company continuously strives to modernize and grow our business to ensure continued profitability and maximum return to shareholders.
The Company has been successful in achieving its objectives by employing a consistent strategy that has emphasized ethics, innovation, quality, competitiveness, backward integration, product diversity, sustainable business practices, and continuous growth in higher value products.our sustainability report as well as the financial and non-financial segments of this annual report.
Strategic Objectives Strategies & Key Performance Indicators
Maintaining a focus on existing core businesses in order to retain market leadership where we have it and attain market leadership wherever we don’t
- Retention/growth of market share
- Product availability
- Price competitiveness
- Brand equity & strength
- Increased market penetration
- High quality, low cost raw material by leveraging volumes and utilising diversified supplier base
Develop avenues for future growth businesses in line with our philosophy of innovation, continuous improvement and growth objectives
- Development of new products
- Expansion of existing product portfolio
- Investment in new technologies where needed
- Assuring availability of appropriate resources (HR, CAPEX, management time etc.)
Maintain our steadfast focus on quality to ensure value to our consumers
- Retain/attain International and national certifications
- Quality Control & quality assurance
- Manufacture according to international standards
- Relevant training seminars
- Customer satisfaction survey results
Appropriate human capital management through focus on safety, training, succession planning and skills enhancement
- Decrease in safety incidents
- Increase in employee retention & satisfaction
- Availability of appropriate resources for training and development
- Ensuring Departmental succession plans are in place
Remaining aligned with the best practices of Corporate Governance, sustainability objectives and our ethical approach to business
- Promotion & adoption of ethical practices across the organization
- Abiding by the Code of Corporate Governance
- Ensuring that SOPs, work instructions & job descriptions are aligned with appropriate policies
- Zero tolerance towards crime and unlawful behavior
- Adoption of effluent management, waste management and environmental best practices
Delivering value and return to and remaining a source of pride for our shareholders
- Earnings per share
- Ensuring a strong dividend payout ratio
- Share price
- Return on equity
- Ensuring a positive market perception of IIL

47Annual Report 2020
Significant changes in objectives and strategies from previous periodsThere are no material changes in the Company’s objectives, strategies or critical performance indicators from the previous year. Resource Allocation PlansIIL will ensure that appropriate resources are available to assist with the implementation of its strategic objectives. Appropriate investments have already been made in land and production facilities to ensure that demand for our core products can be met without any delay or interruption in sales. A dedicated ‘new ventures’ department is tasked with unearthing potential new businesses and creating feasibilities accordingly. All strategic actions are backed with managerial and financial resources as required and as best determined by the Board and Management. Significant Plans and DecisionsThere was no significant corporate restructuring during the year and no significant plans for the coming year. IIL did not experience any disruption or discontinuance of operations during 2018-19 and does not foresee any in the coming year. Relationship between Company’s result and managements objectivesThe Company’s results and its objectives, as outlined above, are very strongly aligned. Our core businesses have shown considerable growth with highest ever sales in our steel & polymers segments. The successful launch of our PPRC pipes & fittings range reflects our focus on future growth businesses. Various certifications including UL certification for our ERW pipe, PSQCA for PPRC and the fact that IIL has become the first company in Pakistan to achieve ISO 45001:2018 certification is testament to our commitment to quality. Our commitment to Corporate Governance, our employees and our shareholders is reflected, in detail, in our sustainability report as well as the financial and non-financial segments of this annual report.

48 International Industries Limited
STAKEHOLDER ENGAGEMENTRelationship with Stakeholders
The management objectives to enhance the stakeholder’s wealth is reflected in the financial and non-financial results of the Company. These results are carefully evaluated against the respective objectives to confirm the achievements.
Amicable relationships are sustained with all the stakeholders through effective and timely communication beside having a customer-centric approach.
Stakeholders Why they are important Nature of engagement Frequency
Shareholders 1. They are the owners of the Company
2. They expect a return on their investment
3. Decisions are made in line with increasing shareholder value
1. AGM
2. EOGM
3. Interim Reports
4. Annual reports
5. Website
6. Social media
1. Annually
2. If/when needed
3. Quarterly
4. Annually
5. Continuously available
6. Continuously available
Customers 1. They buy our products which, in turn, drives our revenue
2. They expect quality and drive demand for our products through word-of-mouth
3. They are our business partners
1. Direct relationships
2. Customer gatherings
3. Satisfaction surveys
4. Website
5. Social media
1. Continuous/ongoing
2. Regularly
3. Annually
4. Continuously available
5. Continuously available
Employees They deliver IIL’s success, Company could not function without its employees
1. Interaction with management
2. Appraisals
3. Job satisfaction survey
4. Union interactions
5. Employee events
6. Newsletter
7. Website
8. Social media
9. Gym
1. Daily
2. Annual/semi-annual
3. Annual
4. Regularly
5. Regularly
6. Continuous
7. Quarterly
8. Continuous
9. Continuously available
Suppliers Reliable and reasonable provision of raw materials determines our ability to supply finished goods
1. Direct relationships
2. Meetings
3. Trade shows
4. Website
5. Social media
1. Daily
2. Regularly
3. Regularly
4. Continuously available
5. Continuously available

49Annual Report 2020
Stakeholders Why they are important Nature of engagement Frequency
Government Bodies
Determine trade policies that could positively or negatively impact IIL
1. Issue specific meetings/ discussions/correspondence
2. Submission of statutory returns and reports
3. Website
4. Social media
1. As required
2. As required
3. Continuously available
4. Continuously available
Local Community
1. Provide manpower for our operations
2. Their living environment depends on the environmental friendliness of our operations
3. Our CSR initiatives are primarily aimed towards them
1. IIL TCF school in Majid Colony
2. IIL-SINA health clinic in Majid Colony
3. Mosque in Majid Colony
4. Bus stop in Majid Colony
5. Union and employees
6. Website
7. Social media
8. Street School
1. Continuous
2. Continuous
3. Continuous
4. Continuous
5. Continuous
6. Continuously available
7. Continuously available
8. Continuously available
Banks Provision of finance and trade facilities
1. Direct Relationships
2. Meetings
3. Financial reporting
4. Website / Social media
1. Regular
2. As needed
3. Periodic
4. Continuously available
Media Ability to influence brand awareness and perception
1. Advertising Campaign
2. Press releases
3. Interviews
1. Periodic
2. Periodic
3. Periodic
Investor Relations Section on the corporate website:
IIL has a dedicated and updated investors relations section on its corporate website (http://www.iil.com.pk/investors) which contains comprehensive information that would be interesting and informative for any investor or potential investor. This section includes detailed information pertaining to: Company Information, Corporate Governance, Financial Information and Reports, Stock and Dividends, Announcements, Link to SECP website, SECP Complaint Forms and the IIL CEO Video which provides a summary of the previous year’s performance.

50 International Industries Limited
Risk/Opportunity Category
Major Business Risk/Opportunity
SensitivitySource of
Risk/Opportunity
Mitigating Factors / Steps to create value
Financial Risk Devaluation of PKR against foreign currencies may negatively impact Company’s financial Performance
High External - Ensuring a balanced ratio between export & domestic sales as needed
- Appropriate hedging instruments such as forward cover & currency options if/when needed
Payment defaults by customers
Low External - Credit worthiness is assessed for each customer and credit limits are assigned according to our credit policy
Financial Opportunity Devaluation of PKR could make IIL exports more competitive in international markets & provide opportunities for inventory gain
High External - Maintaining an opportunistic position and supply flexibility to take advantage of devaluing PKR to increase exports to certain export markets
Operational Risk Volatility in the international price of steel
High External - Well versed and dedicated procurement department matched with 5 decades of steel buying experience along with a diversified supplier base and large volumes keep IIL relatively insulated from volatility in steel prices
Energy & water shortage in Pakistan
High External IIL has its own captive power generation and water supply. The management keeps an eye on alternate energy sources
Employee turnoever amongst senior management positions
Medium-Low Internal - Strong succession planning & HR policies, employee engagement initiatives, workplace satisfaction surveys, training/development, rotational policies and compensation audits are in place.
Work place injuries & safety incidents
Medium Internal - Strong OHSE culture enforced through regular ‘safety walks’ by senior management, safety trainings & drills and enforcement of safety equipment and protocols. Appropriate health insurance policies are also in place.
Supplier Default Medium-High External - Long term relationships with reputable international suppliers with ethical and professional standard operating procedures that reflect our own values. - We maintain sufficient raw material and finished goods inventory to cover our requirements in case such a situation arises - All raw material is insured for loss during transit
Operational Opportunity Sell excess electricty to the national grid
Medium Internal - Agreed contracts in place with relevant utility companies to sell excess electricty at pre-agreed rates as per availability
Generate incremental revenue from increased scrap due to enhanced production
Medium Internal - Establish scrap prices in-line with commercial product prices, diversify customer base
Improve delivery times due to improved warehousing near major markets
High Internal - Increase in finished goods stock to ensure timely delivery to customer base.
RISK OPPORTUNITY

51Annual Report 2020
Risk/Opportunity Category
Major Business Risk/Opportunity
SensitivitySource of
Risk/Opportunity
Mitigating Factors / Steps to create value
Commercial Risk Economic downturn may impact demand for IIL products
Medium External - IIL’s diversified product portfolio and strong export footprint allow the Company to counter economic cyclicality
Trade protectionism amongst export markets via imposition of tariffs and anti-dumping duties could impact Company sales
Medium-High External - Ensuring that prices and quantum of exports do not pose potential for dumping inquiries. Additionally, maintaining diversity of export markets to limit dependance on one single destination
Unethical practices by market players leading to lower prices of similar products
Medium-High External - IIL has differentiated itself from any competition by providing consistent quality for over 50 years. This has allowed the Company to develop a strong brand name which customers seek out and are willing to pay a premium for (if applicable). Additionally, IIL is able to leverage economies of scale and procurement expertise to maintain price competitiveness regardless of competitor activities.
Strategic Risk Shift in market dynamics away from steel pipe
Low External - Mostly only applicable to water & gas applications. IIL has already established itself in the plastic pipe segment for these applications. IIL also maintains a constant focus of developing diversified markets for its products.
Shift in production technologies may make IIL’s processes obsolete and its product and prices non-competitive in local and/or international markets
Low External - IIL strongly believes in the philosophy of ‘Continuous Improvement’ and firmly applies this to its processes and plants. Accordingly, modernization and upgradation of production facilities and investment in new technologies allows IIL to position to respond adequately to any changes in production technologies.

52 International Industries Limited
The Code of Conduct is equally applicable to the Board of Directors as well as all the employees of the Company. The salient features of the Code of Conduct are as follows:
A. BUSINESS ETHICS
i. The Company’s policy is to conduct its business with honesty and integrity and be ethical in its dealings, showing respect for the interest of all stakeholders including its shareholders, employees, customers, suppliers and the society.
ii. The Company is dedicated to providing a safe and non-discriminatory working environment for all employees.
iii. The Company does not support any political party or contributes funds to groups whose activities promote political interests.
iv. The Company is committed to provide products which consistently offer value in terms of price and quality and are safe for their intended use, to satisfy customer needs and expectations.
v. The Board of Directors and the Management both are committed to ensure that the Company is a responsible corporate citizen and the business shall be carried out in a sustainable manner.
vi. The operations shall be carried out with minimum adverse effect on the environment and producing quality products in a healthy and safe working environment.
vii. We, as a responsible corporate citizen shall promote our role towards betterment of the society in health and education sectors as a part of our Corporate Social Responsibility.
B. CONFLICTS OF INTEREST
i. Every employee should conduct his/her personal and business affairs in a manner such that neither a conflict, nor the appearance of a conflict, arises between those interests and the interests of the Company.
ii. An employee should avoid any situation in which he or she, or a family member, might profit personally either (directly or indirectly), from the Company’s facilities, its products, or Company’s relationships with its vendors or customers.
iii. An employee should not permit himself/ herself (or members of his/her family) to be obligated (other than in the course of normal banking relationships) to any organization or individual with whom the Company has a business relationship. However, business lunches, dinners or social invitations, nominal giveaways and attendance at conferences and seminars would not be considered a violation of this Code.
iv. In case an employee is offered or receives something of value which he/she believes may be impermissible under this Code, he/she should disclose the matter.
v. All employees shall avoid any kind of bribery, extortion and all other forms of corruption.
vi. Conflict of interest shall be avoided and promptly disclosed where they exist and guidance should be sought from superiors.
C. ACCOUNTING RECORDS, CONTROLS AND STATEMENTS
i. All books, records, accounts and statements should conform to generally accepted and applicable accounting principles and to all applicable laws and regulations and should be maintained accurately.
ii. Employees are expected to sign only documents or records which they believe to be accurate and truthful.
D. ENVIRONMENT
i. The Company is committed to carry its business in an environmentally sound and sustainable manner and promote preservation and sustainability of the environment.
CODE OF CONDUCT

53Annual Report 2020
ii. All employees are required to adhere strictly to all applicable environmental laws and regulations that impact the Company’s operations.
E. REGULATORY COMPLIANCE
i. The Company is committed to make prompt public disclosure of “material information” regarding the Company as prescribed in the Pakistan Stock Exchange Regulations, if required.
ii. Where an employee is privy to the information, which is generally referred to as “material inside information”, the same must be held in strict confidence by the employee involved until it is publicly released.
iii. The employees shall abide by the appropriate Competition Laws and shall not enter into understandings, arrangements or agreements with competitors, which have the effect of fixing or controlling prices, dividing and allocating markets or territories, or boycotting suppliers or customers.
F. PERSONAL CONDUCT
i. All employees should conduct themselves with the highest degree of integrity and professionalism in the workplace or any other location while on Company business.
ii. The employees shall be careful while dealing with personal or business associates and not disclose, divulge or provide any information regarding the Company to anyone except where the same is used as a part of his/ her official obligations and as required for official purpose and shall abide by the Closed Period announced by the Company from time to time and also sign a Non- Disclosure Agreement if the need arises.
iii. All employees should avoid any kind of bribery, extortion and all other forms of corruption.
iv. Employees should always be cognizant of the need to adhere strictly to all safety policies and regulations.
v. Any legally prohibited or controlled substances if found in the possession of any employee will be confiscated and where appropriate, turned over to the authorities.
G. MISCELLANEOUS
i. All employees are required to comply with this code of conduct and are personally responsible for doing so. Employees must comply with any rules set out in this code of conduct. Breach of any principles within the code may result in disciplinary action and a serious breach – such as if any employee is found to be in wanton abuse of the code and their action cause reputational risk or damage or financial loss to the Company may amount to gross misconduct, which may result in summary dismissal. Further, the Company reserves the right to seek redress and damages from such individuals.
ii. Employees at all levels will be required to certify annually that they understand the code and that they are in full compliance with this code. The Board monitors the findings of this certification on annual basis.
iii. The Company has in place a confidential “Whistleblowing” policy as whistleblowing mechanism and process to encourage the reporting of any non-compliance with this code of conduct.

54 International Industries Limited
I wish to begin firstly by extending my deepest courtesies to those state and private sector institutions which have led the fight in combating the threat that the Coronavirus outbreak continues to pose towards the nation at large. The Coronavirus pandemic has spared almost no industry and its effects will be noticeable for months and perhaps years to come. Economic activity, and in particular Large-Scale Manufacturing (LSM), had been in decline following the painful post-election adjustment period, and the outbreak of the pandemic has unfortunately only added to the set of challenges. However, I am confident that our resolve and ability to adapt to change will ultimately restore normalcy to a great extent in the coming year. I also commend the perseverance and dedication of our management team and employees who continue to perform despite two consecutive years of economic hardship.
Your company posted a Loss after Tax (LAT) of Rs. 694.21 million (EPS -5.26). Sales volumes remained lower compared to last year as demand from the automotive, building & construction and export segments continued to disappoint. This was further impacted by COVID-19 in the last quarter.
Our subsidiary, International Steels Limited (ISL), reported PAT of Rs. 494.85 million (EPS 1.14). Its gross turnover was Rs. 48.08 billion, compared to Rs. 57.48 billion in the preceding year.
IIL and ISL sold over 530,772 Metric Tons (MT) of steel products, including exports of over 109,574 MT, and posted sales turnover in excess of Rs. 65.65 billion for the year under review. Group contributions
to the National Exchequer during the year amounted to Rs. 14.8 billion.
Large Scale Manufacturing (LSM) declined 10.17% year on year during the outgoing year, with the Iron & Steel industry contracting by 17.36%. High interest rates, inability to fully pass on the cumulative increase in energy and imported raw material costs due to PKR depreciating in the preceding year and lack of government funding towards new infrastructure projects were the primary limiting factors for the large-scale manufacturing industry during the first half of the year. The second half the year was dominated by lockdowns, first in China and South-East Asia, and later in the rest of the world, which resulted in a historic decline in sales across the board.
Here, I would like to credit the Government and SBP for their quick and proactive fiscal and monetary policy response to the Coronavirus outbreak, which provided much needed relief to the private sector during the lockdown. I am also proud to inform you that IIL was designated as an essential industry and continued servicing key institutional, government and export orders in line with government directives, while following all standard operating procedures to combat local transmission of the Coronavirus.
However, despite a tough year we continued to engage our customers and partners to further promote our brand name and seek new opportunities for future growth. A testament to this philosophy was the incorporation of IIL Americas Inc. in October 2019, which is registered as a private limited company in Canada. North America is the largest steel tube & pipe importing market in the
CHAIRMAN’S REVIEW
Dear Shareholders,
On behalf of The Board of Directors, I am pleased to present the
annual financial results of our organization for the year
ending June 30, 2020.

55Annual Report 2020
world, and we are confident that a strong footprint in the region shall enable us to regain export market share. A second such example is IIL Construction Solutions (Private) Limited, which is currently under the final stages of signing an agreement with an internationally renowned construction solutions provider for investment and technical support. This comes as a natural extension to our investments in Hollow Structural Sections and High Strength Scaffolding projects in the preceding years.
Alongside the business, we continue to serve and invest in communities where we operate. Furthermore, we continue to strive to support our workers and their families during difficult economic times, and the company and its management staff have generously donated to supplement factory staff income during the lockdown.
Board Performance
Mr. Fuad Azim Hashimi retired from the Board of Directors on September 29th, 2019, at the conclusion of his term. Mr. Hashimi joined the BOD in 2005 and served on the Board audit committee for 15 years with 8 years as its Chairman. Mr. Tariq Ikram also retired at the conclusion of his term as an Independent Director after having served on the IIL Board since 2011 including having served as the Chairman of the Human Resource Committee. The Board wishes to place on record its deepest appreciation for the contribution and wise counsel of Mr. Hashimi and Mr. Ikram.
On September 30th, 2019, a new Board consisting of nine (9) Directors was elected for a term of three (3) years and its terms is expiring on September 30th, 2022. The remaining other seven retiring Directors along with Mr. Mansur Nur Khan and Mrs. Saadia Shireen Rashid were elected to a new three-year term on the Board of IIL. I welcome Mr. Khan and Mrs. Rashid and look forward to their contribution.
Immediately on the election of the new Board, an orientation session was held where the Board was introduced to the management and taken through the workings of the Company.
The Board has performed its duties and responsibilities diligently and has contributed effectively in guiding the Company in its strategic affairs. The Board also played a key role in monitoring management performance and focusing on major risk areas. The Board was fully involved in the strategic planning process and enhancing the vision of the Company.
The Board recognises that well-defined Corporate Governance processes are vital to enhancing
corporate accountability and are committed to ensuring high standards of Corporate Governance to preserve and maintain stakeholder value. All Directors, including Independent Directors, fully participated and contributed to the decision-making process of the Board.
As Chairman of your Company, I will continue to be responsible for leading the Board, fostering a culture of openness and constructive debate during which all views are heard and ensure that the Board hears from an appropriate range of senior management. I will remain firmly committed to ensuring that your Company complies with all relevant codes and regulations and that the management continues to make decisions that create value for you in the short, medium and long term.
The Company has an independent Internal Audit department, which believes in a risk-based audit methodology and leads the Internal Audit function together with an external firm. Internal Audit reports are presented to the Board Audit Committee (BAC) on a quarterly basis and areas for improvement are highlighted.
This was the eighth year that the Board as a whole carried out its self-evaluation, and third time individual Directors were also self-evaluated. The evaluations identified areas for further improvement in line with global best practices. The main focus remained on strategic growth, business opportunities, risk management, Board composition and providing oversight to the management. Along with the Boards’ self-evaluation, the Board Audit Committee and Board Human Resources & Remuneration Committee also carried out their independent evaluation.
The Board Audit Committee is chaired by Mr. Ehsan A. Malik, an Independent Director, and the Board Human Resources and Remuneration Committee (BHR&RC) is chaired by Mr. Mansur Khan, an Independent Director. Apart from the BAC and the BHR&RC, the Board met eight (8) times this year. The Board normally meets at least once in every quarter to consider operational results, once a year to consider the budget for the following year whereas one meeting is focused on strategy.
I am proud to announce that we were once again featured in the list of PSX Top 25 Companies Awards for 2018 and beat our previous years ranking by securing 7th place. The Company also in keeping with the tradition was the proud recipient of the FPCCI Best Export Performance Award 2019 in the engineering products (mechanical) segment for the 20th consecutive year.

56 International Industries Limited
Despite the national lockdown, we continued our efforts to showcase our products at local and international forums in order to further strengthen our brand. Notable exhibitions in which we participated during the year included:
1. Tube South East Asia, 2019
2. Pakistan Auto Show 2020
3. IAPEX 2020
In closing, on behalf of the Board, I wish to acknowledge the contribution of all our stakeholders, including, shareholders, employees, customers, suppliers, bankers and others during the year. I would like to emphasize that the challenges for our
Company as a whole shall persist in the year ahead, however the Board and Management are confident and fully prepared to face all eventualities as we have in the past.
Mustapha A. ChinoyChairmanAugust 27th, 2020


59Annual Report 2020
DIRECTORS’ REPORTThe Directors of the Company are pleased to present their report along with the Audited Financial Statements of the Company for the year ended June 30th, 2020.
BOARD COMPOSITION AND REMUNERATIONComposition of the Board and the names of Members of Board sub-committees are disclosed on Page No. 20 and 92 (Corporate Governance section). The Company has a formal policy and transparent procedures for the remuneration of its Directors in accordance with the Companies Act, 2017 and the Listed Companies (Code of Corporate Governance) Regulations, 2019.
The remuneration, including the director fee for attending the Board Meeting paid to the Directors and Chief Executive Officer is disclosed on Page No. 173 (Note 33 to the unconsolidated financial statements.)
GLOBAL MACROECONOMIC OUTLOOKAs per IMF World Economic Outlook (WEO) estimates, the world economy grew 2.9% in 2019, compared to 3.6% in 2018. However, this growth turned negative in Q1 and Q2 of CY 2020 due to the onset of the Coronavirus pandemic. The synchronized nature of the downturn has hit consumption, tourism, services and international trade the hardest and resulted in historic unemployment and GDP contraction across the globe. Projections for world GDP contraction in CY 2020 are 4.9%, with Advanced Economies and Emerging and Developing Economies contracting by 8% and 3% respectively.
GDP Growth (%) - Advanced vs. Emerging and Developing
2017 – 2021 (f)
Source: IMF World Economic Outlook, June 2020
Already reeling from escalating trade tensions between the US and China, anemic growth in Europe and rising geopolitical tensions, the Coronavirus pandemic has dealt a lasting blow to global economic trade and growth. Growth in the global trade of goods and services was down significantly from 3.8% in 2018 to 0.9% in 2019, and projections for 2020 predict a contraction of 11.9%. To counteract the negative demand shock due to the Coronavirus pandemic, central banks and governments around the world have aggressively cut interest rates and expanded fiscal policy space in order to stimulate aggregate demand. Although partial recoveries are expected in 2021, we expect the year ahead to remain challenging for both Advanced and Emerging and Developing economies.
DOMESTIC ECONOMYThe provisional GDP growth rate for FY 2019-20 is estimated at -0.38% against 1.9% during the preceding year. The manufacturing sector was particularly affected, with growth in Large Scale Manufacturing (LSM) contracting by 10.17%. Iron and steel and associated industries such as engineering products and automotive which form a large portion of the LSM sector all experienced a contraction in offtake. Before the onset of the Coronavirus pandemic, a large-scale industry had been struggling to pass on the cumulative gas price increase and PKR depreciation that it had been subject to during the preceding years. Furthermore, the high cost of capital, reduction in PSDP and condition of CNIC disclosure on purchases of Rs. 50,000 and above resulted in a severe contraction in demand from end users at the same time.
The stringent post-IMF policy measures implemented by the government had started to reflect in better macroeconomic indicators at the beginning of Q3, including falling current account and fiscal deficits, however, the added burden of the lockdown in late Q3 will bring a new set of economic challenges in the months ahead. Nonetheless the government and SBP’s initiatives to protect the livelihoods of people are welcomed. The Rs. 1.24 trillion fiscal stimulus package, construction package and refinance scheme for payment of wages and salaries at subsidized rates, were timely decisions and the need of the hour.
-0.100
-0.068
-0.036
-0.004
0.028
0.060
2021(f)2020(f)201920182017
Advanced economies Emerging & Developing economiesAdvanced economies Emerging & Developing economiesAdvanced economies Emerging & Developing economies
GD
P G
row
th

60 International Industries Limited
With Coronavirus infection rates in decline at the time of writing this report, we are hopeful that despite the tough conditions the government will continue to pursue sustainable policies. Documentation of the economy and enhancing the tax base continue to be painful undertakings, however, the country as a whole and the organized sector in particular stand to benefit from such measures in the long run. Furthermore, the reduction in duties on imported raw materials announced in Budget 2020-21 is positive for the industry and will allow for the conservation of cash flow and capital formation in the year ahead.
The Government’s revised GDP growth target of 2.1% for FY 2020-21 will be a formidable challenge for all stakeholders, however, we remain hopeful that falling Coronavirus case rates and vigilance with regards to SOP’s will set us on the right trajectory. Initiatives such as the construction package and other water and energy distribution projects announced by the government shall also provide avenues for growth ahead.
The World Steel Association’s assessment of steel consumption for 2019 indicates a world average of approximately 229 kg/capita. Although Pakistan remains well below the world average at 46 kg/capita, this indicates the immense potential for growth in the domestic steel manufacturing and processing industry.
Per Capita Steel Consumption
Kg per Capita, 2019
Source: World Steel Association, 2019
GLOBAL STEEL SCENARIOWorld crude steel production was estimated at 1.87 billion metric tons (MT) in 2019, was up 3% compared to the previous year. China accounted for 996 million MT (↑8.3% YoY), which is a significant increase from the preceding years and represents roughly 53% of global crude steel. Other major players include India (111 million MT), Japan (99 million MT), United States (88 million MT) and Russia (72 million MT).
Share of Global Crude Steel Production (%)
2019
Source: World Steel Association, 2019
FY 2019-20 began with global steel prices firm on the back of high iron ore prices, which had been trending up since January 2019 due to the Brumadinho dam disaster in Brazil; the event severely affected production at a nearby iron ore mine operated by Vale S. A. Although iron ore prices plateaued in August 2019, the spillover impact on downstream steel processing industries, including cold-rolling and pipe manufacturing, which typically have a three-month lead time for raw material delivery, lasted well into Q2 of FY 2019-20.
Thereafter, iron ore and steel prices fell significantly due to negative sentiment emanating from the US-China trade frictions, and weakening currencies in China, CIS and India, which allowed mills to drop prices up to 15-20%. Prices eventually bottomed out in November 2019, subsequently rising, and fully recovered on the successful conclusion of US-China Phase 1 trade negotiations in January 2020. The outbreak of the Coronavirus, first in China and
Taiwan 760
Pakistan 46
India 74
USA 297
China 633
Korea 1039
World Average Steel Consumption:
229 Kg per Capita
0
200
400
600
800
1000
1200
China53%India
6%
Japan5%
USA5%
Russia4%
Others27%

61Annual Report 2020
South East Asia, and later on in the rest of the world however, resulted in a steep decline in steel prices from January to April 2020, with prices touching a 5-year record low of $390/MT.
Fortunately, the pandemic did not result in any significant closures in mining or steelmaking plants, and production continued with crude steel production down only 5.5% during January – June 2020, compared to the corresponding period last year. This, however, along with the synchronized global monetary stimulus injection by global central banks are the primary reason for recovery in global steel and metals prices at the time of writing this report. Prices have now reached pre-pandemic levels and are expected to further strengthen barring any unexpected rise in global infection rates and/or increased US-China trade related frictions.
With new capacities having come online, steel production in Pakistan was rising steadily up until January 2019. However, the Coronavirus pandemic and political and financial frictions have resulted in a major slowdown in growth during the last one and a half years. Nonetheless, Pakistan’s demographic profile, an announcement of construction package and progress on dams, motorways and CPEC projects indicate that energy, infrastructure, automotive, white good and raw material demand will support growth in steel consumption in the medium to long term.
Iron Ore, Coking Coal and Hot Rolled Steel Coil PriceJuly 2019 – June 2020, USD per Ton
Source: Kallanish Commodities
Steel Tube and Pipe IndustryThe global steel tube and pipe industry manufactures a broad range of welded and seamless pipes and tubes. Steel pipes are used primarily in oil, gas, water and fluid transmission and distribution, and various fencing and fabrication related applications. Structural steel pipes and hollow structural sections (HSS) are used in high strength applications in the construction industry, whereas cold rolled steel tubing is used in automotive parts, bicycles, home appliance manufacturing and various furniture and fabrication related applications.
World production of steel tubes and pipes on average is roughly 160 million MT, which represents roughly 9% of total world crude steel output. Out of the total production of steel tubes and pipes, the welded tube and pipe segment represent 70% of the total tube and pipe produced, whereas a seamless pipe represents 30% of the production share. Global trade in steel tubes and pipes represents approximately 25% of annual production. Pakistan’s steel tube and pipe market size are estimated at approximately 780,000 MT out of a total domestic steel market size of 9 million MT. The domestic steel tube and pipe market are highly fragmented and consists of a large number of small-to-medium-sized manufacturers spread all over the country.
Stainless SteelGlobal production of stainless steel was approximately 52.2 million MT in 2019 compared to 51 million MT in 2018. Output continues to grow aggressively at a CAGR of close to 6% over the last 5 years. As with carbon steel, China dominates the stainless-steel market, producing approximately 56% of world output.
Stainless steel pipes and tubes are typically suited for end uses that require high corrosion and temperature resistance, and aesthetic appeal. Major end uses of stainless-steel pipes and tubes include:
• Chemical and petrochemical processing• Liquid natural gas piping• White goods and household utensils• Automotive exhaust systems• Construction - offshore and humid environments• Food and pharmaceutical processing• Desalination and wastewater projects
Iron Ore Coking Coal HRC
$200
$400
$600
Jul Aug Sep Oct Nov Dec Jan Feb Mar Apr May Jun
62 International Industries Limited
300 Series stainless steel and its constituent grades comprise almost 50% of global stainless-steel production and are widely used in a range of applications due to high Nickel content, which reduces the corrosion rate. 300 Series pipes and tubes are the flagship products in your Company’s stainless-steel product line. In addition, this year we launched 200 Series stainless-steel pipes and tubes in which are more economical and have a larger market.
Pakistan’s average stainless-steel consumption per capita is approximately 0.5 kg/capita relative to the world average of 5.7 kg/capita, indicating massive potential for growth in this particular segment.
OBJECTIVES, STRATEGIES AND CRITICAL PERFORMANCE INDICATORSIIL’s core motive is to attain overall corporate and strategic objectives and to adopt preeminent global practices while playing a crucial role in the steel industry. The Company strives to grow and to improve its processes to ensure maximum return for its shareholders. A detailed discussion on IIL’s objectives, strategies and critical performance indicators can be found on Page No. 46.
COMPANY OPERATIONS
Market ShareYour Company is the leading tube and pipe manufacturer in the domestic market for GI Pipes, CR Tubes, Stainless-Steel Tubes and Pipes, and Black and Scaffolding Pipe and has the largest product range in its relevant segments. The Company enjoys continuing loyalty from its customers, dealers and business partners. Our Polymers segment caters to water and gas transmission and distribution, and telecommunication applications, and the Company is continuously evolving to meet the demands of its customers.
Gross SalesYour Company achieved a gross sales volume of approximately 143,000 MT during the outgoing financial year, with a gross turnover of Rs. 22.9 billion.
Domestic Steel SalesYour Company’s gross domestic sales for the year were Rs. 20 billion (2019: Rs. 26.5 billion). Domestic sales volume was down 25% over the previous year on account of the economic slowdown, and this was further compounded by Coronavirus induced lockdowns. Water and gas distribution, real estate and construction, automotive and general fabrication segments all steel segments
underperformed compared to the previous year in both commercial and institutional segments of the market. In addition to deteriorating demand over the last two years, government policy dis-allowing procurement of Cold Rolled Coils (CRC) raw material from local sources have contributed towards material availability issues for pipe manufacturers and resulted in the loss of sales; we have raised our concerns at multiple forums to alleviate this issue.
Despite the above, we actively continue to enhance commercial and institutional customer engagement via nationwide events, participation in trade exhibitions, sponsorships and direct engagement mechanisms to positive effect.
Export Steel SalesYour Company’s gross export sales turnover for year was Rs. 2.9 billion (2019: Rs. 4.4 billion). Export sales volumes were down 34% year-on-year as slowing global trade and growth, volatility in international steel prices throughout the year, protectionist measures were taken against IIL in late 2018, and the Coronavirus pandemic kept international buyers on the sidelines. Furthermore, opportunities to capitalize on the PKR depreciation that has materialized over the last two years were limited due to the aforementioned factors. We were however successful in making inroads into the Middle East, which was the only market where volumes were up over the previous year. The impact of anti-dumping duty (ADD) imposed on IIL by Canada deterred buyers, however, the incorporation of IIL Americas Inc. is expected to lead to better access to buyers and more opportunities to develop alternative products.

63Annual Report 2020
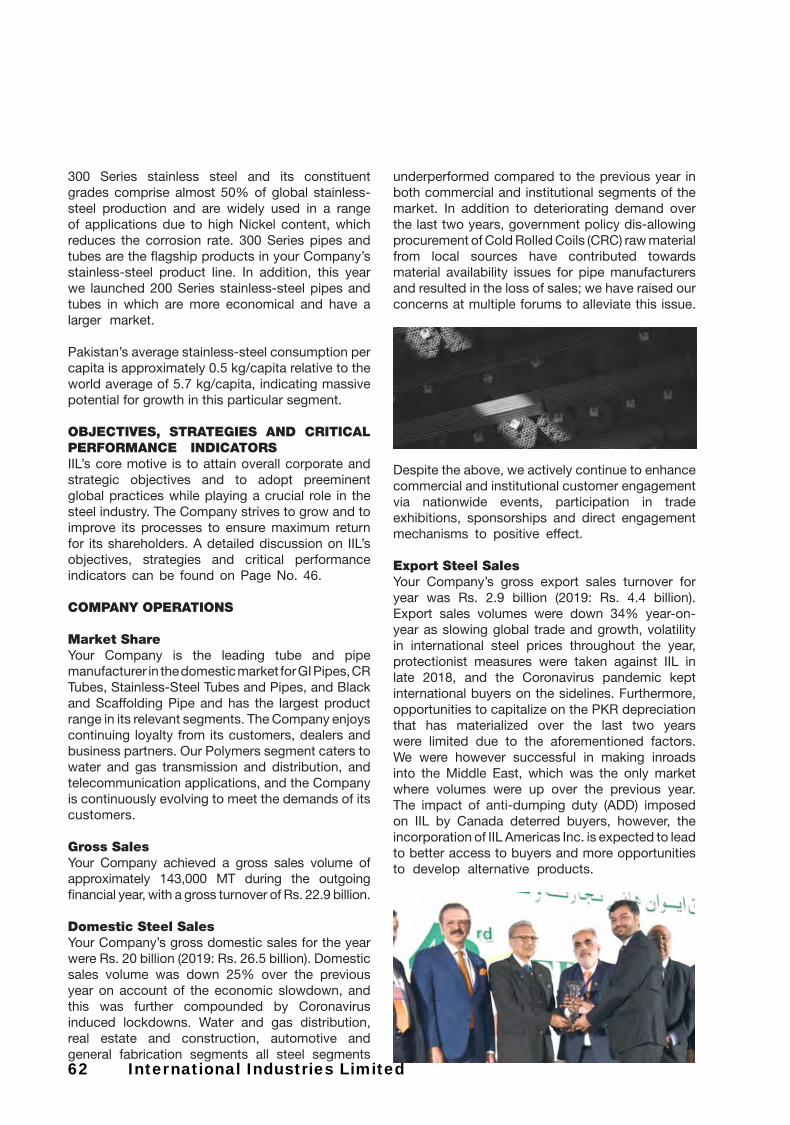
Despite tough international business conditions, we remain one of the largest exporters of engineering products in Pakistan, and in keeping with tradition IIL received the FPCCI Best Export Performance Award 2019 for the 20th consecutive year in the engineering products (mechanical) segment during the year.
IIL Australia Pty LimitedNet turnover of IIL Australia Pty Ltd. was AUD 11.9 million, (FY 2018-19: AUD 15.5 million). The decline in turnover was primarily due to volatile steel prices, bushfires and the Coronavirus pandemic induced lockdowns. The Company continues to expand its network and build a sustainable customer base.
IIL Americas Inc.During the year, IIL Americas Inc. was incorporated in Ontario, Canada as a wholly-owned subsidiary of the Company.
The market remained depressed due to COVID-19 due to which net turnover of IIL Americas Inc. was CAD 0.35 million in the 8 months in which they operated.
The next year has started with the order book of over CAD 1 million and we hope as and when COVID-19 recedes and US elections are over, business should restart with rigor.
Stainless Steel SalesStainless Steel Tube sales of the Company were up 16% year-on-year. The introduction this year of our SS 201 ‘Eco’ brand of stainless-steel pipes and a broader range of diameters and shapes have improved our product portfolio. This is an encouraging sign and our stainless-steel product line will be a major engine for growth in the coming year.
Polymer SalesThe Company’s polymer sales volume was marginally down by approximately 4% over the previous year. The net turnover for the year was Rs. 2.5 billion (2019: 2.4 billion) with a gross profit of Rs. 346 million (2019: 220 million). Gas company tender based business was down significantly compared to last year due to lack of government funding,
however, the shortfall was adequately fulfilled by duct and large diameter water pipe orders from other institutional clients. We continue to try and persuade SSGC and SNGPL to implement the same supplier evaluation and safety protocols on polymer pipe as they do with API Steel Pipes.
Our line of PPRC Pipes and fittings performed well and volumes were up 13% year-on-year but well below are internal targets due to the lockdown and ensuing two months of lost sales. We continue working towards developing the same customer centric approach in this segment that is associated with our brand name in the steel segment.
The proliferation of inferior quality polymer products in Pakistan makes sales and marketing of premium quality products to customers with little or no product knowledge a formidable challenge. The management continues to create awareness about quality standards and the long-term health implications of using sub-standard polymer pipe systems. This is made possible through regular nationwide dealer events, seminars with institutional clients and site visits. We also continue to educate institutional clients about quality standards for water and duct pipes; however, the commercial market remains a challenge where cheap, substandard product is available in abundance.

64 International Industries Limited
PRODUCTIONApart from the deliberate shutdown at the initial stages of the lockdown from March 24th to May 11th, 2020, when only export related production of the galvanized pipes were allowed, no other significant production related issues were experienced for galvanized pipe, polymers and stainless steel during the year. However, due to the unavailability of local CR raw material, CR Tube operations were affected.
FINANCIAL REVIEW
Company ResultsThe Company posted net sales of Rs. 18,964 million, which was 27% lower than last year, earning a Gross Profit of Rs. 1,371 million. Your Company had posted a Loss before Tax of Rs. 430 million for the first time in the last 30 years due to a substantial decline in sales volumes as discussed above. Further, due to unfair tax laws, the Company is liable to pay a minimum tax on turnover and consequently, the Company had posted a Loss after Tax of Rs. 694 million. Loss per Share for the year was Rs. 5.26. The operating profit was visibly lower than last year on account of a substantial decline in sales volumes.
Cost of Goods Sold for the year at Rs. 17,593 million was 24% lower than last year.
Selling and Distribution Expenses of Rs. 813 million were 29% lower than last year primarily on account of lower volumetric sales.
Administrative Expenses of Rs. 298 million were almost at the same level as last year despite legal charges paid for our antidumping case in Canada.
Other Operating Charges of Rs. 31 million were 69% lower than last year. Other Income of Rs. 580 million showed a decrease of Rs. 66% mainly due to lower dividend income and exchange gain during the year.
Financial Charges for the year increased by Rs. 314 million which is 34% higher than last year, primarily due to consecutive hikes in the policy rate.
Segment ReviewRevenue from the Steel segment stood at Rs. 16,478 million, yielding a loss before tax of Rs. 939 million due to 37% decline in the sales volume. Revenue from Polymer Segment was Rs. 2,485 million, yielding a profit before tax of Rs. 133 million despites of the same sales volume as compared to the last period.
Cash Flow Management and Borrowing StrategyThe Company’s cash flow management system projects cash inflows and outflows on a regular basis and monitors the cash position on a daily basis. During the year 2019-20, we generated Rs. 268 million cash from operations. Our average borrowing reduced by Rs. 1.1 billion from last year but our weighted average cost of borrowing, including exchange losses, was 48% higher than last year.
Capital StructureDebt to equity ratio 61:39 on 30 June 2020 was at the same level as 30 June 2019.
DIVIDEND AND/OR BONUSThe Board of Directors has not recommended dividend and/or bonus for the year ended June 30, 2020 in compliance to Section 240 of the Companies Act, 2017.
AUDITORSThe present external auditors, M/S. KPMG Taseer Hadi and Co., Chartered Accountants were appointed in 2003-04, The Management and The Board of Directors are grateful for their services which will end on the conclusion of the 72nd Annual General Meeting which will be held on September 30th, 2020. The Board on the recommendation of the Board Audit Committee has recommended the appointment of M/s A. F. Ferguson and Co.,

65Annual Report 2020
Chartered Accountants as statutory auditors for the year 2020-21 at the same fees as paid to the retiring auditors.
The recommendations of the audit committee for appointment of an auditor may be referred to on Page No. 97 (Report of the Board Audit Committee on adherence to the Code of Corporate Governance).
SOCIAL IMPACTIIL prides itself in being a responsible corporate citizen and positive contributor to the communities in which it operates and the society at large. A detailed insight into IIL’s social, philanthropic and environmental protection initiatives can be found in the ‘Group Sustainability Report’ which has been circulated with Annual Report 2020 and is also available on the Company’s website.
HUMAN RESOURCE MANAGEMENTIIL believes that employees are its biggest asset. Empowering employees with meaningful roles, challenging assignments and world class learning platforms have paved the way for a more purpose-driven organization. The Company has taken several initiatives during the year for well-being of the employees, a few of the initiatives are as follows:
Industrial RelationsThe bilateral negotiation settlement 2019-21 was reached in July 2020 in a peaceful manner. WPPF dues for 2018–19 were distributed in March 2020.
The Company is pleased to report that in compliance with provincial and federal regulations, no daily wage employees were laid off during the lock down period.
The Apprenticeship Training ProgramThe Apprenticeship Training Program is running at all factories in the areas of Production, Maintenance and Quality Control areas.
Gratuity Scheme and Provident FundsThe Company provides retirement benefits to its employees. These include a non-contributory defined benefit Gratuity Scheme for all employees and a contributory Provident Fund for all employees except unionized staff. Both plans are funded schemes recognised by tax authorities. The un-audited net asset values of the Provident and the Gratuity Funds at the year ended June 30, 2020 were Rs. 448 million and Rs. 470 million respectively.
Employment of Differently Abled PeopleComplying with the legal requirement to hire differently abled people, IIL’s workforce has 18 (i.e. 1.9%) such people.
Diversity and Inclusion Reporting1. IIL has one female (11%) director on the Board.2. IIL has one female (11%) employee as Head of
Internal Audit who directly reports to the CEO.3. IIL has three female (0.32%) employees directly
reporting to Head of Department who directly reports to the CEO.
TrainingsDuring FY 2019-20, 41 in-house trainings were conducted on various Technical and OHSE topics including API 5L 45th Edition, Special Process Training on Galvanizing, HF Welding and Seam Annealing, Extrusion Process, API Standards Poly Ethylene Pipes, Hands safety, Safe Crane Operations, PTW, Bearings and Gears Proper Usage and Maintenance, etc. In all more than 790 staff members attended these trainings.
In addition, 47 employees attended external training programs, workshops and conferences on diverse topics from reputable institutes.
Succession PlanningThe Company has formulated a succession plan, which includes performance evaluation and appropriate training requirements for the development of future leaders. This means recruiting employees, developing their knowledge and skill sets and preparing them for advancement or promotion into more challenging roles.

66 International Industries Limited
Occupational Health, Safety and Environment Systems (OHSE)The health and safety of our employees is crucial to IIL. We are responsible for providing a healthy and injury free environment to our employees and contractors, and we strive to achieve this through our OHSE Management System (Occupational Health Safety and Environment System) that is implemented by the HSE Department. In order to improve the safety standards and to prevent any unforeseen incident at work the HSE Department distributed safety helmets, harness, gloves, shoes and other safety gadgets amid its workforce and provided them various trainings as part of their recurring function. A well-equipped gym is situated at the IIL factory premises in order to encourage employees to focus on health and wellbeing. Further information on OHSE is available on the ‘Group Sustainability Report’ provided in Compact Disk (CD) format or available on the Company’s website. A brief outline of OHSE practices is as follows:
1. We have achieved a significant improvement in lost time injury frequency rate (LTIFR) of 0.62, compared to previous years 1.65; This compares favorably to World Steel Association (WSA) Lost Time Injury Frequency Rate of 0.86
2. During the year, 496 OHSE trainings were organized by OHSE Department for 7,482 employees at all locations. Trainings hours per employee increased from 2.60 to 3.3
3. The Company has started calculating carbon emission4. A new initiative of guest speaker session was
started and four guest speaker sessions conducted on various OHSE related matters
5. Revamped employees’ suggestion scheme under Meri Awaz and significantly improved reaction time and written acknowledgement of suggestion.
6. The Company took various preventives to tackle COVID-19 related challenges, including:• Installation of sanitization tunnels• Installation of vehicle sanitization systems at main
gates• Development and installation of COVID-19 awareness
boards and posters for employees and dealers • Thermal temperature checking and monitoring at
entrance• Hand washing and sanitization facilities at entrance
and work stations• Provision of face masks and hand gloves to all
employees and visitors• Floor marking at entrance, canteen, plants and prayer
areas to ensure social distancing• Encouragement of online meetings and work from
home• Shift wise sanitation of work places • COVID-19 tests for suspected cases
Contribution to the National ExchequerYour Company is registered with the Large Taxpayers Unit (LTU) and contributed over Rs. 4.9 billion towards the national exchequer in the form of Income Tax, Sales Tax, other taxes, duties and levies during the financial year.
INTERNAL CONTROL FRAMEWORKThe Board has in place an effective Internal Control framework which may be referred on Page No. 88 (Internal Control Framework).
RISK, OPPORTUNITY AND MITIGATION REPORTThe Management, in consultation with the Board of Directors and Strategic Planning Committee continues to develop capacities to anticipate risks and create new strategies to mitigate these risks while developing our strategic roadmap. A detailed Risk and Opportunity Report is presented on Page No. 50 for further reference.
The government’s policy restricting the sale of locally produced Cold Rolled Coils (CRC) to domestic pipe manufacturers created material availability issues during the 3-month lead time that it takes for imported raw material to arrive. Furthermore, to account for the import lead time companies also need to maintain 2-3 months of raw material, which escalates inventory holding costs. A related issue with imported CRC raw material is the existing anti-dumping duty (ADD) on Chinese, Russian and Ukrainian origin CRC. This limits local buyers’ access to the largest steel producers in the world, given sourcing from other countries is not always viable in terms of availability, price or quality. Together these two factors create significant risk for local CR Tube manufacturers, which the government must recognise and address.
IIL Construction Solutions (Pvt) LimitedThe Company has recently incorporated a wholly-owned subsidiary i.e. M/s. IIL Construction Solutions (Private) Limited, Karachi, Pakistan for the purpose of manufacturing Scaffolding, Shoring
67Annual Report 2020
and Formwork products and systems used in the construction industry.
The Company is looking to have a partnership with one of the largest construction solutions providers in the world. This is a timely move given the announcement of the construction package and Naya Pakistan Housing scheme.
RELATIONSHIP WITH STAKEHOLDERSIIL greatly values all of its stakeholders and tries to sustain an amicable relationship with stakeholders via effective and timely communication and interaction. Please refer to Page No. 48 for a detailed Stakeholder Engagement analysis.
QUARTERLY AND ANNUAL FINANCIAL STATEMENTSThe quarterly unaudited financial statements of the Company along with the Director’s Report, are approved, published and circulated to the shareholders on a timely basis. The half-yearly financial statements were subjected to a limited scope review by the statutory auditors. These annual financial statement are audited by the external auditors and approved by the Board and will be presented to the shareholders at Annual General Meeting for approval. Periodic financial statements of the Company were circulated to Directors duly endorsed by the CEO and the CFO. Half-yearly and annual accounts were initialed by the external auditors before presenting it to the Audit Committee and the Board of Directors for approval.
CHIEF FINANCIAL OFFICER (CFO), COMPANY SECRETARY AND HEAD OF INTERNAL AUDITThe Chief Financial Officer (CFO) and the Head of Internal Audit possesses the requisite qualification and experience as prescribed in the Code of Corporate Governance. The Company Secretary possesses the requisite qualification and experience as prescribed in the Companies Act, 2017. The appointment, remuneration and terms and conditions of employment of CFO, the Company Secretary and the Head of Internal Audit were determined by the Board of Directors. The removal of CFO and Company Secretary whenever applicable is made with the approval of the Board of Directors.
COMPLIANCEAt IIL, we are firmly committed to ensuring the highest level of good governance through adoption of the best business practices and standards. The Board reviews the Company’s strategic direction and business plans on a regular basis. The Board Audit committee is empowered for effective compliance
with the Code of Corporate Governance. All related party transactions are placed before the Board Audit Committee and upon recommendation of the Board Audit Committee, the same is placed before the Board for review and approval. The Board is strongly committed to maintaining a high standard of good corporate governance. For further details, kindly refer to the Code of Corporate governance section of this report.
INFORMATION SYSTEMS AND RE-ENGINEERINGWe are committed to the process of continuously upgrading and enhancing our IT infrastructure and moving towards greater process automation and a paperless environment. Additionally, we remain focused on working closely with end users in studying their day-to-day activities and finding opportunities to automate and streamline various tasks.
JCR RATINGOur rating exercise conducted in June 2019 achieved a long-term rating of AA- and short-term rating of A-1. We are also amongst a select few companies evaluated by JCR for grading on the basis of investment strength, governance and environmental and social responsibility (IS-ESG).
INVESTMENTSThe Company holds 56.33% ownership interest in its subsidiary, International Steels Limited (ISL), which is in the business of processing flat steel products. ISL ended the financial year with sales volume in excess of 417,000 MT, Gross Sales of roughly Rs. 48 billion and PAT of Rs. 495 million.
68 International Industries Limited
Your Company also holds a 17.12% ownership interest in Pakistan Cables Limited (PCL) a company which was set up in 1953. PCL is a listed company and is in the business of manufacturing copper rods, wires and cables, and is the country’s first manufacturer of copper cables and wiring.
ACKNOWLEDGEMENTWe would like to extend our sincere gratitude to healthcare workers, essential service providers, security apparatus and the entire IIL team for managing and controlling the spread of COVID-19 during the year.
With one of the toughest years on record coming to a close, it is important here to look back and reflect. During FY 2019-20, we have witnessed, raw material shortages, lagged impact of rupee devaluation and gas price hike, shrinking domestic GDP and lastly the COVID-19 pandemic. This is the first time in 30 years that IIL has posted a significant loss, with the last such instance being when IIL commissioned its first rolling mill in 1989. Our overall sales volumes were also lower than what was achieved in the
2008-09 recession. In spite of all this, we ensured that our values were not violated, and we dealt with the challenges in a compassionate manner. During the lockdown period, we refrained from laying off a single employee and IIL and its management staff donated generously to the IIL Daily Wage Fund, in order to ensure that almost 500 workers were paid their salaries despite being unable to come to work. Furthermore, salaries for management staff were also not cut during these difficult times.
The IIL Team has worked tirelessly towards our targets despite the difficult financial climate that the country is facing. Finally, we thank all other stakeholders including our esteemed customers, suppliers and bankers for their commitment to the Company and look forward to sharing more successes with them in the coming years.
For and on behalf of the Board of Directors
KarachiDated: August 27th, 2020
Mr. Riyaz T. ChinoyChief Executive Officer
Mr. Ehsan A. MalikDirector/Chairman BAC


79Annual Report 2020
CORPORATEGOVERNANCE
80 International Industries Limited
PROFILE OF THE BOARD OF DIRECTORSMr. Mustapha A. Chinoy Director since: February 23rd, 1998Chairman since: September 30th, 2016Non-Executive Director
Mr. Mustapha A. Chinoy holds a B.Sc. in Economics from Wharton School of Finance, University of Pennsylvania, USA and has majored in Industrial Management and Marketing. Thereafter, he served as Marketing Manager, at International Industries Limited. He is currently the Chairman of International Industries Limited and Pakistan Cables Limited, and a director on the Board of Crea8ive Bench (Private) Limited, Global E-Commerce Services (Private) Limited, Global Reservation (Private) Limited and Travel Solutions (Private) Limited. He is the Chief Executive Officer of Intermark (Private) Limited. He has previously served on the Board of Union Bank Limited until it was acquired by Standard Chartered Bank.
Mr. Adnan AfridiDirector since: February 18th, 2019Independent Director
Mr. Adnan Afridi graduated with high honors from Harvard University with a degree in Economics (A.B.) and from Harvard Law School with a J.D. He has 25 years global and Pakistan based experience in Change Management, business transformation, innovation and profitability enhancement in blue chip companies, public-sector and start-up situations. Industry experience includes Capital Markets, Private Equity, Financial Services, Real-Estate, Health Care, Natural Resources, Technology and Food sectors, operating in CEO roles with Board level representations. Functional experience focuses on Governance, Strategy, Negotiation/Structuring, Corporate Planning, Group Company management, Public Relations and large-scale talent building.
Previously he was a Director at Silkbank Limited and Gul Ahmed Textile Limited. He has also served as Managing Director of the Karachi Stock Exchange Limited, CEO of the Tethyan Copper Company (Private) Limited and CEO of the OICCI.
He is currently the Managing Director of NITL and a private sector member of SECP Policy Board. In addition to being on the board of IIL, he is a
director at Bank Al Habib Limited, Lotte Pakistan Limited, Dynea Pakistan Limited, Habib Sugar Mills Limited, Mari Petroleum Limited and Bulk Transport Company (Private) Limited. He also serves as the Vice- Chairman of the Board of Governors of The Kidney Centre Institute and is a member of YPO Pakistan.
Mr. Kamal A. ChinoyDirector since: February 6th, 1984Non-Executive Director
Mr. Kamal A. Chinoy is a graduate of the Wharton School, University of Pennsylvania, USA. He is the Chairman of Jubilee Life Insurance Company Limited and serves as a director on the Board of International Industries Limited, International Steels Limited, and Pakistan Cables Limited.
He is also Honorary Consul General of the Republic of Cyprus. Mr. Kamal A. Chinoy is a member of the Executive Committee of the International Chamber of Commerce (ICC) Pakistan and Past President of the Management Association of Pakistan (MAP). He has previously served as Chairman of the Aga Khan Foundation (Pakistan). He has also served as Chief Executive Officer of the Pakistan Cables Limited for 27 years. He has also served as a Director of Pakistan Security Printing Corporation, Atlas Insurance Limited, Atlas Power Limited, Askari Bank Limited, First International Investment Bank, ICI Pakistan Limited, NBP Fund Management Limited and Pakistan Centre of Philanthropy. He has also served on the Undergraduate Admissions Committee of the Aga Khan University, the University of Pennsylvania Alumni Committee for Pakistan and on the Board of Governors of Army Burn Hall Institutions.
Mr. Azam FaruqueDirector since: November 26th, 2009Non-Executive Director
Mr. Azam Faruque is the Chief Executive Officer of Cherat Cement Company Limited, a Ghulam Faruque Group (GFG) company. He holds a graduation degree in Electrical Engineering and Computer Science from Princeton University, USA, and also possesses an MBA (High Honors) from

81Annual Report 2020
the University of Chicago Booth School of Business, USA. He has spent 30 years in the cement industry and other GFG businesses. He has also served as a member on the boards of Privatization Commission of the Government of Pakistan, National Bank of Pakistan and Oil and Gas Development Corporation Limited. He has also served as a member of the Board of Governors of GIK Institute and was a member of the National Commission of Science and Technology. Currently, he is also a director of Atlas Battery Limited, Faruque (Private) Limited, Greaves Pakistan (Private) Limited, Indus Motors Company Limited, Unicol Limited, Habib University Foundation and State Bank of Pakistan.
Mr. Mansur KhanDirector since: September 30th, 2019Independent Director
He has over 25 years of diversified experience, and a proven track record in Development/Commercial/Investment Banking. He has done Masters in Business Administration (with distinction) from Pace University, New York, USA; majoring in Financial Management. Mr. Khan has served as a President / CEO of Zarai Taraqiati Bank Limited (ZTBL), SME (small and Medium Enterprises) Bank Limited, Managing Director of Pak Kuwait Investment Company, Punjab Small Industries Corporation (PSIC) and the Sudanese Microfinance Development facility (SMDF). He has international experience of working in Asia, Africa, USA, Europe and the Middle East. Prior to joining Pak Kuwait as Managing Director, he was associated with Weidemann Associates Inc, a Crown Agents USA, company. Mr. Khan was a Fighter Pilot in the Pakistan Air Force from 1970 to 1978. He held Directorship in The General Tyre and Rubber Company of Pakistan Limited, Sudanese Microfinance Development Facility, Zarai Taraqiati Bank Limited, National Commodity Exchange Limited, Saudi Pak Agricultural and Investment Company Limited, National Database and Registration Authority, Kissan Support Services Limited, SME Bank Limited, SME Leasing Limited, TMT venture Capital Fund, Small and Medium Enterprise Development Authority, Business
Competitiveness/Support Funds, and Punjab Small Industries Corporation. A certified director from Pakistan Institute of Corporate Governance.
Mr. Ehsan A. MalikDirector since: September 30th, 2016Independent Director
Mr. Ehsan A. Malik is a certified director from the Pakistan Institute of Corporate Governance (PICG). Mr. Ehsan A. Malik is currently serving as the Chief Executive Officer of Pakistan Business Council. Mr. Malik was the Chief Executive Officer of Unilever Pakistan Limited from 1st September 2006 to 31 October 2014, and also a Director of Unilever Pakistan Foods Limited. Prior to this he was Chairman and CEO, Unilever Sri Lanka Limited. His earlier international appointments covered Unilever’s regional business in Egypt, Lebanon, Jordan, Syria and Sudan as well as Unilever’s Head Office in UK. These preceded senior commercial and financial roles at Unilever Pakistan. He is also a Member of the Board of Directors of Abbott Laboratories Pakistan Limited, Gul Ahmed Textiles Limited and National Foods Limited. Mr. Malik is a Fellow of the Institute of Chartered Accountants of England and Wales and alumni of the Wharton and Harvard Business Schools.
Mrs. Saadia Shireen RashidDirector since: September 30th, 2019Non-Executive Director
Mrs. Saadia Shireen Rashid holds a degree from Ecole Miramonte, Montreux, Switzerland. She has served as a Director at Lahore College of Arts and Sciences (LCAS) where, apart from general management of the college, her primary responsibility included managing the institution’s Finance & Accounts department. She previously also held Directorship in Kashmir Edible Oils Limited (public quoted company) for a period of nearly ten years.
In pursuit of her philanthropic aims, she has been involved in several charitable fundraisings in Lahore providing relief to natural disaster victims, thalassemia patients and furthering education and vocational training.

PROFILE OF THE BOARD OF DIRECTORSMr. Jehangir ShahDirector since: September 30th, 2016Independent Director
Mr. Jehangir Shah has forty (40) years of experience in commercial banking, private & personal banking and leasing. He has had overseas work experience in UAE, Egypt and Brazil. Prior to joining Pak Oman Investment Company as Deputy Managing Director in 2008, Mr. Shah served as Country Manager-Pakistan of Oman International Bank SAOG and as Managing Director and CEO of Capital Assets Leasing Corporation Limited (Calcorp). His former employments include those of Executive Director at Pak Gulf Leasing Company Limited; Habib Credit and Exchange Bank and Bank of Credit and Commerce International. Mr. Shah also looks after the Investment Banking Division at Pak Oman. Mr. Shah is a Director of Pak Oman Asset Management Company Limited and an Independent Director of International Industries Limited.
Mr. Riyaz T. Chinoy
Director since: August 30th, 2007Chief Executive Officer since: August 11th, 2011
Mr. Riyaz T. Chinoy was appointed as the Chief Executive Officer of IIL on August 11th, 2011, after serving the IIL since 1992 in various positions. By profession he is a qualified Industrial Engineer and has obtained a B.Sc. in Industrial Engineering, from Case Western Reserve University, USA. He
is also a certified ISO 9001 Lead Auditor and a Certified Director from the Pakistan Institute of Corporate Governance.
He has had extensive experience of all processes ranging from production, operations, supply chain, quality management systems and projects. His previous employment was with Pakistan Cables Limited. He has served as the Chairman of the Landhi Association of Trade and Industry and Amir Sultan Chinoy Foundation and is a member of the Pakistan-India CEO’s Business Forum, Pak-Australia Business Forum, The Institute of Industrial Engineers Pakistan and the Pakistan Engineering Council. He is also the Chairman of IIL Australia Pty Limited, a fully owned Australian subsidiary of IIL and IIL Americas Inc., a fully owned Canadian subsidiary and the Independent Chairman of the Pakistan Institute of Corporate Governance. He is also a Non-Executive Director on the Board of Bulleh Shah Packaging (Private) Limited, Indus Motor Company Limited, Jubilee General Insurance Limited, Pakistan Business Council, Management Association of Pakistan, The Citizens Foundation, Citizens Trust Against Crime and The Water Foundation.

83Annual Report 2020
LIST OF OTHER DIRECTORSHIPSDirectors Organizations
Mr. Mustapha A. Chinoy International Industries LimitedInternational Steels LimitedPakistan Cables LimitedIntermark (Private) LimitedCrea8ive Bench (Private) LimitedGlobal e-Commerce Services (Private) LimitedGlobal Reservation (Private) LimitedTravel Solutions (Private) Limited
Mr. Adnan Afridi International Industries LimitedNational Investment Trust LimitedBank Al Habib LimitedBulk Transport Company (Private) LimitedDynea Pakistan LimitedHabib Sugar Mills LimitedLotte Chemical Pakistan LimitedMari Petroleum Company LimitedThe Kidney Centre InstituteSECP Policy Board
Mr. Kamal A. Chinoy International Industries LimitedInternational Steels LimitedPakistan Cables LimitedJubilee Life Insurance Company Limited
Mr. Azam Faruque International Industries LimitedCherat Cement Company LimitedAtlas Battery LimitedFaruque (Private) LimitedGreaves Pakistan (Private) LimitedIndus Motors Company LimitedUnicol LimitedHabib University FoundationState Bank of Pakistan
Mr. Mansur Khan International Industries LimitedMr. Ehsan A. Malik International Industries Limited
Pakistan Business CouncilAbbot Laboratories Pakistan LimitedGul Ahmed Textile LimitedNational Foods Limited
Mrs. Saadia Shireen Rashid International Industries LimitedMr. Jehangir Shah International Industries Limited
Pak Oman Asset Management Company LimitedMr. Riyaz T. Chinoy International Industries Limited
IIL Americas Inc.IIL Australia Pty LimitedBulleh Shah Packaging (Private) LimitedIndus Motor Company LimitedJubilee General Insurance LimitedPakistan Business Council (PBC)Citizens Trust Against Crime (CTAC)Management Association of PakistanPakistan Institute of Corporate Governance (PICG)The Citizens FoundationThe Water Foundation


85Annual Report 2020
ORGANIZATION STRUCTURE
Executive Committee (Polymer)
Managing Committee
Executive Committee
(Steel)
GroupChief
InternalAuditor
Company Secretary & Head of
Legal Affairs
ChiefExecutive
Officer
Mr. Towfiq H. Chinoy Advisor
Board Audit Committee
Board Human Resource &
Remuneration Committee
BOARD OF DIRECTORS
Human Resources
Finance andInformation Technology
Marketing and Sales
Qualityand Supply
Chain
Polymers Operations / Engineering,
New Ventures, Projects and HSE
Management
Steel Operations

86 International Industries Limited
GOVERNANCE FRAMEWORK
The main philosophy of business followed by the sponsors of International Industries Limited for the last 72 years has been to create value for all stakeholders through fair and sound business practices, which translates into policies approved by the Board and implemented throughout the Company to enhance the economic and social values of all stakeholders of the Company.
Our Governance strategy is to ensure that the Company follows the direction defined by its Core Values, current regulatory framework and global best practices. The Board, discharges its responsibilities as defined by the Companies Act, 2017, Code of Corporate Governance Regulation 2019, Rule Book of the Pakistan Stock Exchange Limited and the Corporate Financial Reporting Framework of Securities and Exchange Commission of Pakistan. Our approach towards corporate governance ensures ethical behavior, transparency, accountability in all that we do and to attaining a fair value for the shareholders.
Compliance StatementLiving up to its standards, the Board of Directors has, throughout the year 2019-20, complied withthe Code of Corporate Governance, Rule Book of the Pakistan Stock Exchange Limited and theFinancial Reporting framework of Securities and Exchange Commission of Pakistan (SECP).
The Directors confirm that the following has been complied with:
a) The financial statements have been prepared which fairly represent the state of affairs of the Company, the result of its operations, cash flows and changes in equity.
b) Proper books of accounts of the Company have been maintained.
c) Appropriate accounting policies have been consistently applied in preparation of financial statements and accounting estimates are based on reasonable and prudent business judgment.
d) International Financial Reporting Standards (IFRS), as applicable in Pakistan, have been followed in preparation of financial statements and any departures therefrom have been adequately disclosed and explained.
e) The system of internal control is sound in design and has been effectively implemented and monitored. The Internal Audit function is based on a hybrid system led by the Group Chief Internal Auditor supported by in-house staff as well as M/s EY Ford Rhodes, Chartered Accountants.
f) There are no significant doubts upon the Company’s ability to continue as a going concern.
g) There is no material departure from the best practices of corporate governance as per regulations.
The Board of DirectorsThe Board of Directors consists of qualified individuals possessing knowledge, experience and skills in various professions, with the leadership and vision to provide oversight to the Company. The Board is chaired by Mr. Mustapha A. Chinoy, a Non-Executive Chairman; out of nine (9) Directors, four (4) are Independent Directors and one (1) is Female Director. The current Board composition reflects a good mix of experience, diversity in backgrounds, skills and qualifications. All Directors have many years of experience, and are fully aware of their duties and responsibilities under the Code of Corporate Governance. At present, all Directors have either attended the Directors Training Program or have minimum of 14 years of education and 15 years of experience on the Board of listed companies and therefore are exempt from the Directors Training Program.
To further its role of providing oversight and strategic guidelines to the Company, the Board has formulated a Board Charter to define its role of strategic leadership and provide oversight to the management. The Board has constituted two Sub Committees, namely Board Audit Committee (BAC) and Board Human Resources and Remuneration Committee (BHR&RC). The composition, role and responsibilities of the Committees are clearly defined in their respective Terms of References.
A Board Meeting Calendar is issued annually to reflect the dates planned for the Board of Directors meeting, Board Audit Committee and Board Human Resource and Remuneration Committee Meetings. All the Board members

87Annual Report 2020
are given relevant documents in advance of each meeting which normally includes a detailed analysis of business and matters, where the Board will be required to make a decision or give its approval.
During the year 2019-20, the Board had eight (8) meetings during this year, out of which four (4) were held to review the annual/quarterly results, one (1) for appointment of Chairman and CEO and constitution of the Board Committees, one (1) for Strategy and two (2) for budget. The average attendance of the Directors in Board meetings during the year was 93%.
The Board of Directors has complied with the Code of Corporate Governance, the listing requirements of Pakistan Stock Exchange Limited and the Financial Reporting framework of Securities and Exchange Commission of Pakistan.
Changes in the BoardMr. Fuad Azim Hashimi retired from the Board of Directors on September 29, 2019, at the conclusion of his term. Mr. Hashimi joined the BOD in 2005 and served on the Board audit committee for 15 years with 8 years as its Chairman. Mr. Tariq Ikram also retired at the conclusion of his term as an independent Director after having served on the IIL Board since 2011 including having served as the Chairman of the Board Human Resource & Remuneration Committee. The Board wishes to place on record its deepest appreciation for the contribution and wise counsel of Mr. Hashimi and Mr. Ikram.
On September 30, 2019, the remaining seven retiring Directors along with Mr. Mansur Khan and Mrs. Saadia Shireen Rashid were elected to a new three-year term on the Board of IIL. The Board welcomes Mr. Khan and Mrs. Rashid and looks forward to their contribution.
Board Meetings Outside PakistanDuring the year 2019-20, no Board meetings were held outside Pakistan.
Role and Responsibilities of the Chairman and Chief ExecutiveThe Board of Directors provides the overall direction for the Company operations and provides oversight for various policies and monitors the management in the light of operational and financial plans. The roles of Board and the Chief Executive Officer have
been clearly defined where the Board is responsible for strategic guidance and providing directions for sustainable business.
The Chairman and the Chief Executive have separate and distinct roles. The Chairman has all the powers vested in him under the Code of Corporate Governance and presides over all Board meetings. The Chief Executive performs his duties under the powers vested by the law and the Board and recommends and implements the business plans and is responsible for overall control and operation of the Company.
Business Philosophy and Best Corporate PracticesWe believe in ethical practices, sustainable manufacturing processes, transparent reporting to the shareholders and in the best practices of Corporate Governance to ensure success and better results for all stakeholders.
The Board Charter defines the scope of the Board’s activities in setting the tone at the top, formulating strategies and providing oversight to the management for sustainable growth of the business. The Board members actively participate in the meetings to provide guidance concerning the Company’s business activities, operational plans, review corporate operations and formulate and review all significant policies. The Board firmly adheres to the best ethical practices and fully recognises its responsibilities for protection and efficient utilisation of Company assets for legitimate business objectives and compliance with laws and regulations. The Chairman ensures that the discussions held during the Board meetings and the consequent decisions arising are duly recorded and circulated to all the Directors within fourteen (14) days. The CFO and the Company Secretary attended all the meetings of the Board as required by the Code of Corporate Governance.
All periodic financial statements and other working papers for the consideration of the Board/ Committees are circulated to the Directors well before the meetings so as to give sufficient time to the Directors to make decisions on an informed basis. This year the Board has held eight (8) meetings, agendas of which were duly circulated at least a week before the meetings.

88 International Industries Limited
Timely Communication of Financial ResultsThe quarterly un-audited financial statements and the half-yearly financial statements (reviewed by the Auditors) were duly circulated within thirty (30) days and sixty (60) days respectively along with the Directors’ Report. Annual financial statements, including consolidated financial statements, Board of Directors’ Report, Auditors’ Report and other statutory statements and information are being circulated for consideration and approval by the shareholders within sixty nine (69) days from the close of the financial year. Additionally, all important disclosures, including the financial statement, were also made on the Company’s website to keep the stakeholders duly informed.
Board EvaluationThe Board of Directors has formulated a policy to evaluate its own performance, the salient features of which are as follows:
1. The Board Evaluation Methodology to be adopted as self-evaluation of the Board as a whole through an agreed questionnaire and has been complied with.
2. The individual Directors self- evaluation exercise has been complied with.
3. The evaluation system is designed to address areas of critical importance and should include, but not be limited to the following:
a) Appraising the basic organization of the Board of Directors,
b) The effectiveness and efficiency of the operation of the Board and its committees,
c) Assess the Board’s overall scope of responsibilities,
d) Evaluate the flow of information, and
e) Validate the support and information provided by management.
4. The Board would review the results and suggest measures to improve the areas identified for improvement.
The Board is continuing its self-evaluation for many years as a part of good governance and has identified areas for further improvement in line with global best practices. The main focus remained on strategic growth, business opportunities, risk management, Board composition and providing oversight to the management etc.
Risk and Opportunity ManagementRisk management is crucial to any business, which includes identification and assessment of various risks followed by coordinated application of resources, to economically minimize, monitor and control the impact of such risks and maximize the realization of opportunities. Management periodically reviews major financial and operating risks faced by the business. The Board Audit Committee is responsible for the Risk Management and one meeting will be dedicated to the management of risk.
For more details on Risk and Opportunity Management, please refer to the Directors’ Report on page No. 66.
Internal Control FrameworkThe Company maintains an established control framework comprising clear structures, authority limits, and accountabilities, well understood policies and procedures and budgeting for review processes. All policies and control procedures are documented in manuals. The Board establishes corporate strategy and the Company’s business objectives.
The Board Audit Committee has been entrusted with the main responsibility of Internal Controls. The Audit Committee receives the Audit reports by the Internal and External auditors, and after detailed deliberations, and suggesting improvements, periodic reports are submitted to the Board of Directors. The Company places a high value on transparency, both internally and externally, in its corporate management. It focuses consistently on the implementation of efficient management practices for the purpose of achieving clear and quantifiable commitments. The Company has a Chartered Accountant posted as Head of Internal Audit, who is being assisted by M/s M/s. EY Ford Rhodes and in-house executives to carry out the Internal Control functions.
The management has placed an explicit internal control framework with clear structures, authority limits, and accountabilities, well defined policies and detailed procedures, enabling the Audit Committee and the Board to have clear understanding of risk areas and to place effective controls to mitigate these risks.
Disclosure of Conflict of InterestThe Company has taken measures to prevent conflict of interests between Directors, employees and the Company. In this regard, a clear policy on conflict of interests is contained in the Code of Conduct duly approved by the Board of Directors which is placed on page No. 52.

89Annual Report 2020
As per the Code of Corporate Governance, the Company annually circulates and obtains a confirmation from all employees and Directors that they have read and understood the Code of Conduct. Further, the Directors and key employees are reminded of insider trading and avoiding in the dealing of shares during the closed period.
Every Director is required to bring to the attention of the board complete details regarding any material transaction which has a conflict of interest for prior approval of the Board. The interested Directors neither participate in discussions nor vote on such matters.
The complete details of all transaction with related parties are submitted to the Audit Committee who recommends them to the Board for approval in each quarter. These transactions are also fully disclosed in the annual financial statement of the Company.
Corporate Social ResponsibilityThe Company has implemented comprehensive policies on “Occupational Health, Safety and Environment” and “Donations, Charities and Contributions” to meet its Corporate Social Responsibilities.
The social and environmental responsibility reflects the Company’s recognition that there is as strong positive correlation between financial performance and corporate, social and environmental responsibility. Social and environment responsibility include the following:1. Community investment and welfare schemes.2. Environmental protection measures.3. Occupational health and safety.4. Business ethics and anti-corruption measures.5. Energy conservation.6. Industrial relations.7. National cause donations.8. Contribution to national exchequer.9. Consumer protection measures.
Our role as a corporate citizen is as important to us as satisfaction of our customers and earning a fair return for our shareholders. We are committed to work for the betterment and prosperity of our stakeholders. Management has endeavored to provide a safe and healthy work atmosphere by adopting practices and creating working conditions which are safe and healthy for our employees, vendors, contractors, suppliers and customers.
We are committed to providing better educational and health facilities to the less fortunate. In line with our philosophy of CSR we regularly maintain and support a TCF school – IIL Campus in Landhi adjacent to our factory along with offering need based scholarships to NED University students for a better tomorrow of our younger generation.
We also support NGO’s like TCF, Sina Foundation – IIL Clinic, Indus Hospital and Amir Sultan Chinoy Foundation to help deserving patients for their treatment.
Sustainability MeasuresAll aspects of sustainability including efficient operational procedures, effective internal controls, ethical behavior, and energy conservation are an integral part of our business model.
We also believe that employees are most critical in the progress, growth and sustainability of any organization.
For more details, please refer to our Group Sustainability Report which has been circulated with the Annual Report 2020 and is available on our website (www.iil.com.pk)
Engaging Stakeholders and TransparencyDevelopment of stakeholders’ relationship is of significant importance for the Company. Building “stakeholder’s engagement”, compliance with regulatory requirements and terms and conditions are one of the main business principles by which we abide.
To bring an accurate understanding of the Management’s policies and business activities to all its stakeholders, the Company strives to make full disclosure of all material information to all stakeholders by various announcements on its website, to the Stock Exchange and other sources available to help investors to make informed decisions. The Company encourages full participation of the members in the Annual General Meetings by sending corporate results and sufficient information following the prescribed timeline so as to enable the shareholders to participate on an informed basis. While increasing management transparency, it aims to strengthen its relationships and trust with shareholders and investors.
Our stakeholders include but are not limited to customers, employees, government, shareholders, suppliers, local communities and bankers.
Policy for Investor GrievancesThe Company has an “Investor Relation Policy” that sets out the principles in providing the shareholders and prospective investors with necessary information to make well informed investment decisions and to ensure a level playing field. Investor grievances and complaints are very important and are properly reviewed to minimize the recurrence of similar issues in future. The following principles are adhered to with regards to investor grievances:
1. Investors are treated fairly at all times.
2. Complaints raised are dealt with in a courteous and timely manner.

90 International Industries Limited
3. Various modes of communication like email, telephone, meetings and raising matters at the Annual General Meeting are available to investors to raise grievances.
4. Queries and complaints are treated fairly and efficiently.
5. Employees work in good faith and without prejudice towards the interest of the creditors.
6. Detailed Company information regarding financial highlights, investor information, and other requisite information specified under the relevant regulations has been placed on the corporate website of the Company which is updated on regular basis.
Safety of Company RecordsInternational Industries Limited has a firm “Document and Record Control Policy” for establishing, approving, reviewing, changing, maintaining, replacing, retrieving, retaining, distributing and administering control of all documents and data that relate to the Company and has taken the following concrete measures to ensure safety/security of the records and creating a paperless environment.
• All important documents such as, minutes and proceedings of the Board and its sub-committees, annual general meetings, statutory certificates, title documents of the Company’s property and all other important communications and records are digitally scanned and archived on secured Company servers.
• All-important original documents are placed at a neutral, secured and well known vault.
• Record keeping of accounting books is being arranged at a separate location.
Human Resources Management Policies and Succession PlanningA comprehensive set of policies has been well implemented to cover all aspects related to HR. The main focus of the policies is to train, motivate and retain valuable human assets for the future growth of the Company. In order to maintain continuity of the business operations, particularly at senior management and key managerial positions, a well-defined Succession Policy is in practice.
Information Technology PolicyA well-defined Information Technology Policy is place to help achieve efficient and effective use of IT resources for the Company so as to establish
priorities, strategy delivery, increase productivity and deliver right services to users. The IT Steering Committee comprising of CEO, CFO and CIO are responsible for taking major IT decisions. The CIO is responsible for ensuring communication of CIO security policies to all users of the Company. Further, Internal Audit is responsible for monitoring compliance of IT policies.
The Policy on Information Technology is focused upon information security, human resource security, access control, information system acquisition development and maintenance, business continuity management, incident management, website and ERP.
Whistleblowing PolicyWe are committed to creating an atmosphere in which our people can freely communicate their concerns to their supervisors and Functional Heads. Our Whistle-blowing Policy has been in place for a number of years as IIL’s ‘Whistle-Blowing’ system to report any corrupt or unethical behavior, if employees feel that they are not able to use the normal management routes.
Policy for Security Clearance of Foreign DirectorsIIL has no foreign Directors on its Board. However, as we remain committed to the well-being of our Board, the Company has in place various protocols and procedures to ensure the safety and security of all Directors, including any foreign Directors should there be any in the future.
Issues Raised at Last AGMWhile general clarifications were sought by shareholders on Company’s published financial statements during the 71st Annual General Meeting of the Company held on September 30th, 2019, no significant issues were raised.
Dividend and/or Bonus SharesThe Board of Directors of the Company has not recommended dividend and/or bonus for the year ended June 30th, 2020.
Pattern of ShareholdingA statement on the pattern of shareholding along with categories of shareholders, where disclosure is required under the reporting framework and the statement of shares held by the Directors and executives as on June 30th, 2020 is placed on Page No. 269.

91Annual Report 2020
MECHANISM FOR PROVIDING INFORMATION FORMAL REPORTING LINEThe current organization/structure of the Company consists of various departments/divisions, each of which is led by a divisional head. These divisional heads are responsible for the reforms, of their respective divisions and the Board can then have access to them.
EMPLOYEESEmployees are encouraged to express their view and forward their suggestions. We follow an open-door policy and employees are free to send emails, phone or even talk directly to the CEO. The employees can give suggestions, grievances and concerns or raise any matter related to theCompany. In case the matter is of significant nature, the same is addressed in the meetings ofthe Managing Committee, the Board of Directors or the relevant Board Committees.
The Company also has a Whistle-blowing policy to enable employees to raise serious concerns at the relevant forum regarding the business or Company without fear and repercussions.
The CEO also meets the entire Managing Committee and Executive Committee at least once every quarter through which they are provided an opportunity to express their concerns and suggestions directly to the CEO. These meeting are aimed at capturing free and first hand suggestions.
CORPORATE BRIEFING SESSIONSThe Corporate Briefing Session of the Company was held on Monday, September 30, 2019 at 4.00 p.m. at Jasmin Hall, Beach Luxury Hotel, off: M.T. Khan Road, Karachi to brief the investors/analyst/shareholders about the financial performance and future outlook of the Company.
SHAREHOLDERSEvery year the Annual General Meeting of shareholders is held in accordance with the requirements of the Companies’ Act, 2017 which is attended by the Board, CEO, Company Secretary, CFO and the senior management of the Company.
The interactive session with the shareholders allows the shareholders to ask questions on financial, economic, social and other issues and also give suggestions and recommendations. The CEO responds to all questions.
The Company has also provided contact details of all relevant personals for general and specific queries on its website.
MANAGING CONFLICT OF INTERESTAs per the Code of Corporate Governance, the Company annually circulates and obtains signed copy of the Code of Conduct from all employees and Directors. Further, the Directors and key employees are reminded of insider trading and to avoid dealing in shares during closed period.
Every Director is required to bring to the attention of the Board complete details regarding any material transaction which has a conflict of interest for prior approval of the Board. The interested Directors neither participate in discussions nor vote on such matters.
The complete details of all transactions with related parties are provided to the Board for approval. These transactions are also fully disclosed in the annual financial statement of the Company.

92 International Industries Limited
BOARD COMMITTEESThe Board is assisted by two Committees, namely the Board Audit Committee and the Human Resource & Remuneration Committee to support its decision making in their respective domains:
A. Board Audit Committee
Mr. Ehsan Malik ChairmanIndependent Director
Mr. Kamal A. Chinoy MemberNon - Executive Director
Mr. Jehangir Shah MemberIndependent Director
Ms. Asema Tapal SecretaryGroup Chief Internal Auditor
The Board Audit Committee comprises of three (03) Non-executive Directors, out of which two (02) are independent. The Chairman of the Committee is a Fellow of the Institute of Chartered Accountants of England and Wales and alumni of the Wharton and Harvard Business Schools. The Chief Financial Officer and the Chief Internal Auditor attend the BAC meetings, while the Chief Executive Officer is invited to attend the meetings. The Board Audit Committee also separately meets the internal and external auditors at least once in a year without the presence of the Management.
Meetings of the Board Audit Committee are held at least once every quarter; the recommendations of the Board Audit Committee are then submitted for approval of financial results of the Company by the Board. During the year 2019-20, the Board Audit Committee held five (05) meetings. The Chief Internal Auditor is the Secretary of the Board Audit Committee. The minutes of the meetings of the Board Audit Committee are provided to all members, Directors and the Chief Financial Officer. The Chief Internal Auditor meets the Board Audit Committee, without the presence of the Management, at least once a year, to point out various risks, their intensity and suggestions for mitigating risks and improvement areas. The business risks identified are then referred to the respective departments and corrective actions are then implemented. The Board Audit Committee has completed its independent evaluation.
Terms of Reference of the Board Audit CommitteeThe Board Audit Committee is mainly responsible for reviewing the financial statements, ensuring
proper internal controls to align operations in accordance with the mission, vision and business plans and monitoring compliance with all applicable laws and regulations and accounting and financial reporting standards.
The salient features of terms of reference of the Board Audit Committee are as follows:
1. Recommending the appointment of internal and external auditors to the Board.
2. Consideration of questions regarding resignation or removal of external auditors, audit fees and provision by the external auditors of any services to the Company in addition to the audit of financial statements.
3. Determination of appropriate measures to safeguard the Company’s assets.
4. Review of preliminary announcements of results prior to publication.
5. Review of quarterly, half-yearly and annual financial statements of the Company, prior to their approval by the Board, focusing on major judgmental areas, significant adjustments resulting from the audit, any changes in accounting policies and practices, compliance with applicable accounting standards and compliance with listing regulations and other statutory and regulatory requirements.
6. Facilitating the external audit and discussion with external auditors on major observations arising from audit and any matter that the auditors may wish to highlight (without the presence of the Management, where necessary).
7. Review of the Management Letter issued by external auditors and the Management’s response thereto.
8. Ensuring coordination between the internal and external auditors of the Company.
9. Review of the scope and extent of internal audit and ensuring that the internal audit function is adequately resourced and placed within the organization.
10. Consideration of major findings of internal investigations and the Management’s response thereto.

11. Ascertaining that the internal control system including financial and operational controls, accounting system and reporting structure are adequate and effective.
12. Review of Company’s statement on internal control systems prior to endorsement by the Board.
13. Instituting special projects, value for money studies or other investigations on any matter specified by the Board, in consultation with the Chief Executive and to consider remittance of any matter to the external auditors or to any other external body.
14. Determination of compliance with relevant statutory requirements review of periodic financial statements and preliminary announcements of results prior to the external communication and publication with a view to highlight.
15. Monitoring compliance together with the external auditors and internal audit with the best practices of corporate governance and identification of significant violations such as fraud, corruption, and abuse of power thereof.
16. Consideration of any other issue or matter as may be assigned by the Board.
B. Board Human Resources & Remuneration Committee
Mr. Mansur Khan ChairmanIndependent Director
Mr. Kamal A. Chinoy MemberNon- Executive Director
Mr. Mustapha A. Chinoy MemberNon- Executive Director
Mr. Azam Faruque MemberNon- Executive Director
Mr. Riyaz T. Chinoy MemberChief Executive Officer
Mr. Khalid Junejo SecretaryDirector Human Resources
BHR&RC comprises of five (05) members and the Chairman is an Independent Director whereas the other four members are the Chief Executive Officer and three non-executive Directors. Meetings
are conducted at least quarterly or at such other frequency as the Chairman may determine. Director Human Resources is the Secretary of the BHR&RC. The minutes of the meetings of the BHR&RC meetings are provided to all members and Directors. The Committee held two (02) meetings during the year.
Terms of Reference of Board Human Resource & Remuneration Committee
The Committee defines the HR policy framework and makes recommendations to the Board in the evaluation and approval of employee benefit plans and succession planning.
The salient features of the Terms of Reference of BHR&RC are as follows:
1. Major HR Policy / frameworks including compensation.
2. Overall organizational structure.
3. Organization model and periodically seek assessment of the same.
4. Succession planning for key executives, including the CEO.
5. Recruitment, remuneration and evaluation of the CEO and his direct reports, including CFO, Chief Internal Auditor and the Company Secretary.
6. The CEO, being a member of the BHR&RC shall not be a part of Committee meetings, if his/her compensation/performance is being discussed/evaluated.
7. Charter of demands and negotiated settlements with CBA.
8. Compensation of the Non-Executive Directors.
9. Board Remuneration Policy & Procedure.
10. Board Evaluation Policy and Procedure for the Board as a Whole and for the Individual Directors.

94 International Industries Limited
MEETINGS OF THE BOARD OF DIRECTORS
Meetings of the Board of Directors, Board Audit Committee and Board Human Resource and Remuneration Committee were held according to an annual schedule circulated before each fiscal year to ensure maximum director participation.
Board BAC BHR&RCMeetings held during FY 2019-20Mr. Mustapha A. Chinoy ^ 8/8 - 1/1Mr. Adnan Afridi 7/8 - -Mr. Kamal A. Chinoy ^ 6/8 4/5 -Mr. Azam Faruque 7/8 - 1/2Mr. Mansur Khan * ^ 6/6 - 1/1Mr. Ehsan A. Malik 8/8 5/5 -Mrs. Saadia S. Rashid * 6/6 - -Mr. Jehangir Shah 8/8 5/5 -Mr. Riyaz T. Chinoy 8/8 - 2/2Mr. Fuad Azim Hashimi ** 2/2 1/1 -Mr. Tariq Ikram** 2/2 - 1/1
* Mr. Mansur Khan and Mrs. Saadia S. Rashid elected on the Board of Directors on September 30, 2019.
** Mr. Fuad Azim Hashimi and Mr. Tariq Ikram retired from the Board of Directors and Board Committees on September 29, 2019.
^ Mr. Mustapha A. Chinoy and Mr. Mansur Khan were appointed as a member of BHR&RC w.e.f. September 30, 2019 and Mr. Kamal A. Chinoy was also appointed a member of BHR&RC on April 2, 2020.

95Annual Report 2020
MANAGING COMMITTEEThe mission of the Managing Committee (MC) is to support the Chief Executive Officer to determine and implement the business policies within the strategy approved by the Board of Directors. MC meetings are conducted on a monthly basis or more frequently as circumstances dictate. The Committee reviews all operational and financial aspects, advises improvements to operational policies / procedures and monitors implementation of the same. The MC meets to review operational performance and to consider various policies and procedures.
Composition of the Managing Committee:Meetings held during the
FY 2019-20Mr. Riyaz T. Chinoy Chairman Chief Executive Officer 21/21Mr. Muhammad Akhtar* Member Chief Financial Officer 11/11Mr. Khawar Bari Member Director Marketing & Sales 21/21Mr. Khalid Junejo Member Director Human Resources 21/21Mr. Zulfiqar Mooraj** Member BUH Construction Division 16/16Ms. Asema Tapal Member Group Chief Internal Auditor 21/21Mr. Perwaiz Ibrahim Member Technical Advisor 21/21Mr. Mohsin Safdar Member CEO IIL Americas 21/21Mr. Sohail Bhojani Member CEO IIL Australia 21/21Mr. Owais Ahmed Secretary Chief Information Officer 21/21Mr. Muhammad Hanif Idrees*** Member Chief Financial Officer 10/10
* Mr. Muhammad Akhtar joined on January 16th, 2020** Mr. Zulfiqar Mooraj joined on October 1st, 2019*** Mr. Hanif Idrees resigned on January 15th, 2020
Role of the Managing CommitteeThe Committee is responsible for the following:
a) Reviewing the organizational structure.b) Establishing the Executive Committees and their TORs.c) Reviewing the annual budget of the Company.d) Reviewing the business principles, strategy, strategic priorities, risk analysis, business plan as well
as key performance indicators, financial performance, annual targets and variances.e) Reviewing the Company’s Management Information System (MIS).

96 International Industries Limited
EXECUTIVE COMMITTEESThe mission of the Executive Committee (EC) is to support the Managing Committee (MC) in implementing the business policies within the strategy approved by the Board of Directors. The Company has in place two dedicated Executive Committee’s for each of its divisions, one focusing on the Company’s steel business whereas the second EC focuses on Polymer Business. EC meetings are conducted on a monthly basis or more frequently if needed.
Composition of the Executive Committee – Steel:Meetings held during the
FY 2019-20Mr. Muhammad Riaz Moazzam Chairman GM Operations (Steel) 12/12
Mr. Mirza Samar Abbas Member GM Domestic Sales (South) & Global Sales 12/12
Mr. Sheraz Ahmed Khan Member GM Domestic Sales (North) 12/12
Mr. Salman Najeeb Member Financial Controller 12/12
Mr. Syed Ghazanfar Ali Shah Member Div. Manager Supply Chain & QA 12/12
Mr. Zain Kamal Chinoy Member Div. Manager Global Sales 12/12
Mr. Samiuddin Khan Secretary Div. Manager IR & Admin (South) 12/12
Composition of the Executive Committee – Polymer:
Mr. Muhammad Imran Siddiqui Chairman GM Polymer, Engineering, Projects & New Ventures 12/12
Mr. Mirza Samar Abbas Member GM Domestic Sales (South) & Global Sales 12/12
Mr. Sheraz Ahmed Khan Member GM Domestic Sales (North) 12/12
Mr. Usman Ali * Member Div. Manager PPRC Sales 9/9
Mr. Nasir Arif Raja Member Div. Manager Polymer Operations 12/12
Mr. Fahad Mushtaq Secretary Deputy Manager IR & Admin (North) 12/12
*Mr. Usman Ali joined on October 7th, 2019
Role of the Executive Committee
The Committee is responsible for the following:a)Reviewing the organizational structure and recommending the changes to the Managing Committee.b)Reviewing the business principles, strategy, strategic priorities, risk analysis, business plan.c)Reviewing the key performance indicators, financial and non-finance performance, targets and
variances against budget, if any.d)Recommending the changes in the Company’s Management Information System (MIS) to the Managing
Committee.e)Reviewing the training needs for optimization of the resources.f) Briefing the Managing Committee and CEO on the matters discussed at the EC meeting.g)Reviewing the raw material, WIP and finished goods inventory levels and taking timely action on
reducing/controlling the same. h)Reviewing the status of the order book for the next month production planning.i) Reviewing the product development and new projects and ventures.

97Annual Report 2020
REPORT OF THE BOARD AUDIT COMMITTEE on Adherence to the Code of Corporate Governance
The Board Audit Committee has concluded its annual review of the conduct and operations of the company for the year ended June 30th, 2020 and reports that:
• The company has adhered in full, without any material departure, with both the mandatory and voluntary provisions of the listing regulations of the Pakistan Stock Exchange, Code of Corporate Governance, Company’s Code of Conduct and Values and the international best practices of governance throughout the year.
• The company has issued a “Statement of Compliance with the Code of Corporate Governance” which has also been reviewed and certified by the auditors of the company.
• Appropriate accounting policies have been consistently applied except those disclosed in financial statements. Applicable accounting standards were followed in preparation of the financial statements of the company on a going concern basis for the financial year ended June 30th, 2020, which present fairly the state of affairs, results of operations, profits, cash flows and changes in equity of the company for the year under review.
• The Chief Executive Officer and the Chief Financial Officer have reviewed the financial statements of the company and the Chairman & Board of Directors Report. They acknowledge their responsibility for true and fair presentation of the financial statements, accuracy of reporting, compliance with regulations and applicable accounting standards and establishment and maintenance of internal controls and systems of the company.
• Accounting estimates are based on reasonable and prudent judgment. Proper, accurate and adequate accounting records have been maintained by the company in accordance with the Companies Act, 2017.
• The financial statements comply with the requirements of the Fourth Schedule to the Companies Act, 2017 and applicable International Accounting Standards and International Financial Reporting Standards notified by the SECP.
• All direct and indirect trading in and holdings of the company’s shares by Directors and executives or their spouses were notified in writing to the Company Secretary along with the price, number of shares, form of share certificates and nature of transaction. All such transactions have been disclosed.
INTERNAL AUDIT FUNCTION• The internal control framework was effectively implemented through outsourcing the internal audit
function to M/s EY Ford Rhodes, Chartered Accountants, for the last many years. Presently the Company’s internal Audit function is being looked after by the Chief Internal Auditor in compliance of the Code of Corporate Governance, who is assisted by the internal auditor’s M/s EY Ford Rhodes. The Chief Internal Auditor reports directly to the Chairman of the Board Audit Committee.
• The company’s system of internal control is sound in design and has been continually evaluated for effectiveness and control.
• The Board Audit Committee has ensured the achievement of operational, compliance and financial reporting objectives, safeguarding of the assets of the company and the shareholder’s wealth through effective financial, operational and compliance controls and risk management at all levels within the company.
• Coordination between the external and internal auditors was facilitated to ensure efficiency and contribution to the company’s objectives, including a reliable financial reporting system and compliance with laws and regulations.

98 International Industries Limited
EXTERNAL AUDITORS• The statutory auditors of the Company, KPMG Taseer Hadi & Co, Chartered Accountants, have completed
their audit of the Company’s financial statements and the Statement of Compliance with the Code of Corporate Governance for the financial year ended June 30th, 2020 and shall retire on the conclusion of the 72nd Annual General Meeting.
• The final Management Letter is required to be submitted within forty-five (45) days of the date of the Auditors’ Report on the financial statements under the listing regulations and shall therefore accordingly be discussed in the next Board Audit Committee meeting.
• The Audit firm has been given a satisfactory rating under the Quality Control Review Programme of the Institute of Chartered Accountants of Pakistan (ICAP) and the firm is fully compliant with the International Federation of Accountants (IFAC) Guidelines on Code of Ethics, as adopted by ICAP. The auditors have indicated their willingness to continue as auditors.
• The retiring Auditors, KPMG Taseer Hadi & Co., Chartered Accountants, have completed the period of five years. Therefore, the Board Audit Committee recommends that A. F. Ferguson & Co., Chartered Accountants (a member firm of the PwC network), who have indicated their consent to act as Auditors, be appointed as Statutory Auditors at the same statutory audit fees as currently being paid to the retiring Auditors. In addition, any Federal or Provincial taxes and reimbursements of out of pocket expenses will be paid at actuals.
Mr. Ehsan A. MalikChairman - BAC
Dated: August 20th, 2020Karachi

99Annual Report 2020
INDEPENDENT AUDITOR’S REVIEW REPORTTo the members of International Industries Limited
Review Report on the Statement of Compliance contained in Listed Companies (Code of Corporate Governance) Regulations, 2019
We have reviewed the enclosed Statement of Compliance with the Listed Companies (Code of Corporate Governance) Regulations, 2019 (the regulations) prepared by the Board of Directors of International Industries Limited (“the Company”) for the year ended 30 June 2020 in accordance with the requirement of regulation 36 of the Regulations.
The responsibility for compliance with the Regulations is that of the Board of Directors of the Company. Our responsibility is to review whether the Statement bf Compliance reflects the status of the Company’s compliance with the provisions of the Regulations and report if it does not and to highlight any non-compliance with the requirements of the Regulations. A review is limited primarily to inquiries of the Company’s personnel and review of various documents prepared by the Company to comply with the Regulations.
As a part of our audit of the financial statements, we are required to obtain an understanding of the accounting and internal control systems sufficient to plan the audit and develop effective audit approach. We are not required to consider whether the Board of Directors’ statement on internal control covers all risks and controls or to form an opinion on the effectiveness of such internal controls, the Company’s corporate governance procedures and risks.
The regulations require the Company to place before the Audit Committee, and upon recommendation of the Audit Committee, place before the Board of Directors for their review and approval, its related party transactions and also ensure compliance with the requirements of Section 208 of the Companies Act, 2017. We are only required and have ensured compliance of this requirement to the extent of the approval of the related part transactions by the Board of Directors upon recommendation of the Audit Committee. We have not carried out procedures to assess and determine the Company’s process for identification of related parties and that whether the related party transactions were undertaken at arm’s length price or not.
Based on our review, nothing has come to our attention which causes us to believe that the Statement of Compliance does not appropriately reflect the Company’s compliance, in all material respects, with the requirements contained in the Regulations as applicable to the Company for the year ended 30 June 2020.
Date: September 6th, 2020 KPMG Taseer Hadi & Co.Chartered Accountants
Karachi

100 International Industries Limited
STATEMENT OF COMPLIANCE WITH LISTED COMPANIES (CODE OF CORPORATE GOVERNANCE) REGULATIONS, 2019International Industries LimitedFor the year ending June 30th, 2020
International Industries Limited (hereinafter referred to as ‘the Company’) has complied with the requirements of the Listed Companies (Code of Corporate Governance) Regulations, 2019 (“the Regulations”) in the following manner:
1. The total number of Directors is 9 as shown in the following table:
Category Number of Directors
a. Male Director* 8
b. Female Director 1
* including the Chief Executive Officer, who is an Executive Director.
2. The composition of the Board of Directors is as follows:
Categories Names of Directors
Independent Directors
1- Mr. Adnan Afridi
2- Mr. Mansur Khan
3- Mr. Ehsan A. Malik
4- Mr. Jehangir Shah
Non-Executive Directors
1- Mr. Kamal A. Chinoy
2- Mr. Mustapha A. Chinoy
3- Mr. Azam Faruque
Non-Executive Female Director 1- Mrs. Saadia S. Rashid
Executive Director 1- Mr. Riyaz T. Chinoy
3. The Independent Directors meet the criteria of independence as defined under the Companies Act, 2017.
4. The Directors have confirmed that none of them is serving as a Director of more than seven (7) listed companies, including this Company.
5. The Company has prepared a ‘Code of Conduct’ and has ensured that appropriate steps have been taken to disseminate it throughout the Company along with its supporting policies and procedures.
6. The Board has approved a Vision/Mission statement, overall corporate strategy and significant policies of the Company. The Board has ensured that complete record of particulars of the significant policies along with their date of approval or updating is maintained by the Company.
7. All the powers of the Board have been duly exercised and decisions on relevant matters have been taken by the Board/shareholders as empowered by the relevant provisions of the Companies Act, 2017 and the Regulations.

101Annual Report 2020
8. The meetings of the Board were presided over by the Chairman of the Board and, in his absence, by a Director elected by the Board for this purpose. The Board has complied with the requirements of Companies Act, 2017 and the Regulations with respect to frequency, recording and circulating minutes of meetings of the Board.
9. The Board of Directors have a formal policy and transparent procedures for remuneration of Directors in accordance with the Companies Act, 2017 and the Regulations.
10. All Directors have either attended the Directors Training Program or have minimum of 14 years of education and 15 years of experience on the Board of listed companies and therefore are exempt from the Directors Training Program.
11. The Board has approved appointment of the Chief Executive Officer, the Chief Financial Officer, the Company Secretary and the Head of Internal Audit, including their remuneration and terms and conditions of employment and complied with the relevant requirements of the Regulations.
12. The Chief Financial Officer and the Chief Executive Officer have duly endorsed the financial statements before the approval of the Board.
13. The Board has formulated the following committees comprising of the members listed against each committee as of June 30th, 2020:
Name of Committee Compositiona) Board Audit Committee (BAC) 1. Mr. Ehsan Malik, Chairman – Independent Director
2. Mr. Kamal A. Chinoy, Member – Non-Executive Director3. Mr. Jehangir Shah, Member – Independent Director
b) Board Human Resource & Remuneration Committee (BHR&RC)
1. Mr. Mansur Khan, Chairman – Independent Director2. Mr. Kamal A. Chinoy, Member – Non-Executive Director3. Mr. Mustapha A. Chinoy, Member – Non-Executive Director4. Mr. Azam Faruque, Member – Non-Executive Director5. Mr. Riyaz T. Chinoy, Member – Chief Executive Officer
14. The Terms of Reference of the aforesaid committees have been formed, documented and advised to the committee for compliance.
15. The number of meetings of the committees held during the year were as per the following table:
Name of Committee Number of Meetingsa) Board Audit Committee (BAC) Five (05)b) Board Human Resource and Remuneration Committee (BHR&RC) Two (02)
16. The Board has set up an effective Internal Audit function supervised by a qualified Chartered Accountant, who is being assisted by M/s EY Ford Rhodes and in house executives to carry out the Internal Control functions. The Internal Auditors are conversant with the policies and procedures of the Company and are considered suitably qualified and experienced for the purpose.
17. The Statutory Auditors of the Company have confirmed that they have been given a satisfactory rating under the quality control review program of the Institute of Chartered Accountants of Pakistan and are registered with the Audit Oversight Board of Pakistan, that they and all their partners are in compliance with International Federation of Accountants (IFAC) guidelines on code of ethics as adopted by the Institute of Chartered Accountants of Pakistan and that they and the partners of the firm involved in the audit are not a close relative (spouse, parent, dependent and non-dependent children) of the Chief Executive Officer, Chief Financial Officer, Chief Internal Auditor, Company Secretary or Director of the Company.

102 International Industries Limited
18. The Statutory Auditors or the persons associated with them have not been appointed to provide other services except in accordance with the Companies Act, 2017, the regulations or any other regulatory requirement and the auditors have confirmed that they have observed IFAC guidelines in this regard.
19. We confirm that all requirements of regulations 3, 8, 27, 32, 33 and 36 of the Regulations have been complied with.
Mr. Ehsan A. Malik Mr. Riyaz T. ChinoyChairman - BAC Chief Executive Officer
Dated: August 27th, 2020
103Annual Report 2020
FINANCIAL HIGHLIGHTS


ANALYSIS OF FINANCIAL STATEMENTSStatement of Financial Position
2020 2019 2018 2017 2016 2015 2014------------------------------- Rs. in million -------------------------------
Property, plant and equipment 7,081 7,360 5,770 5,088 4,852 3,622 3,502 Investments 3,295 3,277 3,277 2,743 2,743 2,743 2,593 Other non current assets 5 7 72 67 59 21 18 Current assets 12,758 14,683 13,346 10,619 6,322 6,752 10,133 Total assets 23,140 25,327 22,465 18,516 13,977 13,138 16,247
Shareholders' equity 8,946 9,949 8,894 7,859 7,307 6,343 6,004 Non current liabilities 1,971 2,156 2,338 1,494 1,332 458 568 Current portion of long term financing 411 291 181 110 158 150 150 Short term borrowings 9,394 9,425 8,310 5,899 3,243 4,664 6,277 Other Current liabilities 2,417 3,506 2,743 3,155 1,937 1,522 3,247 Total equity & liabilities 23,140 25,327 22,465 18,516 13,977 13,138 16,247
Vertical Analysis Percentage
Property, plant and equipment 30.6 29.1 25.7 27.5 34.7 27.6 21.6 Investments 14.2 12.9 14.6 14.8 19.6 20.9 16.0 Other non current assets 0.0 0.0 0.3 0.4 0.4 0.2 0.1 Current assets 55.1 58.0 59.4 57.3 45.2 51.4 62.4 Total assets 100.0 100.0 100.0 100.0 100.0 100.0 100.0
Shareholders' equity 38.7 39.3 39.6 42.4 52.3 48.3 37.0 Non current liabilities 8.5 8.5 10.4 8.1 9.5 3.5 3.5 Current portion of long term financing 1.8 1.1 0.8 0.6 1.1 1.1 0.9 Short term borrowings 40.6 37.2 37.0 31.9 23.2 35.5 38.6 Other Current liabilities 10.4 13.8 12.2 17.0 13.9 11.6 20.0 Total equity & liabilities 100.0 100.0 100.0 100.0 100.0 100.0 100.0
Horizontal Analysis Percentage
Property, plant and equipment (3.8) 27.6 13.4 4.9 34.0 3.4 1.1 Investments 0.5 0.0 19.5 - - 5.8 0.4 Other non current assets (23.9) (90.4) 6.9 12.9 183.6 13.9 4.2 Current assets (13.1) 10.0 25.7 68.0 (6.4) (33.4) 19.2 Total assets (8.6) 12.7 21.3 32.5 6.4 (19.1) 11.5
Shareholders’ equity (10.1) 11.9 13.2 7.6 15.2 5.6 0.4 Non current liabilities (8.6) (7.8) 56.5 12.1 190.9 (19.4) (20.8)Current portion of long term financing 41.2 60.8 64.9 (30.7) 5.5 - - Short term borrowings (0.3) 13.4 40.9 81.9 (30.5) (25.7) (12.3)Other Current liabilities (31.1) 27.8 (13.1) 62.9 27.2 (53.1) 358.9 Total equity & liabilities (8.6) 12.7 21.3 32.5 6.4 (19.1) 11.5
105Annual Report 2020

Statement of Profit or Loss
ANALYSIS OF FINANCIAL STATEMENTS
2020 2019 2018 2017 2016 2015 2014----------------------------------- Rs. in million -----------------------------------
Net Sales 18,964 25,975 26,130 17,565 15,623 18,871 17,655 Cost of Sales (17,593) (23,149) (22,619) (14,396) (12,800) (16,425) (15,088)Gross Profit 1,371 2,826 3,511 3,169 2,824 2,446 2,567 Administrative, Selling and Distribution expenses (1,112) (1,443) (1,631) (1,408) (1,424) (1,346) (1,229)Other operating expenses (31) (98) (172) (180) (116) (82) (73)Other operating income 580 1,733 883 1,037 155 402 166 Operating profit before financing cost 809 3,017 2,591 2,618 1,438 1,420 1,431 Finance cost (1,238) (924) (442) (224) (334) (488) (779)(Loss) / Profit before Taxation (430) 2,093 2,149 2,393 1,104 933 652 Taxation (264) (518) (567) (551) (318) (202) (149)(Loss) / Profit after Taxation (694) 1,575 1,582 1,842 786 731 503
Vertical Analysis Percentage
Net Sales 100.0 100.0 100.0 100.0 100.0 100.0 100.0 Cost of Sales (92.8) (89.1) (86.6) (82.0) (81.9) (87.0) (85.5)Gross Profit 7.2 10.9 13.4 18.0 18.1 13.0 14.5 Administrative, Selling and Distribution expenses (5.9) (5.6) (6.2) (8.0) (9.1) (7.1) (7.0)Other operating expenses (0.2) (0.4) (0.7) (1.0) (0.7) (0.4) (0.4)Other operating income 3.1 6.7 3.4 5.9 1.0 2.1 0.9 Operating profit before financing cost 4.3 11.6 9.9 14.9 9.2 7.5 8.1 Finance cost (6.5) (3.6) (1.7) (1.3) (2.1) (2.6) (4.4)(Loss) / Profit before Taxation (2.3) 8.1 8.2 13.6 7.1 4.9 3.7 Taxation (1.4) (2.0) (2.2) (3.1) (2.0) (1.1) (0.8)(Loss) / Profit after Taxation (3.7) 6.1 6.1 10.5 5.0 3.9 2.8
Horizontal Analysis Percentage
Net Sales (27.0) (0.6) 48.8 12.4 (17.2) 6.9 (1.9)Cost of Sales (24.0) 2.3 57.1 12.5 (22.1) 8.9 (3.7)Gross Profit (51.5) (19.5) 10.8 12.2 15.4 (4.7) 10.1 Administrative, Selling and Distribution expenses (22.9) (11.5) 15.8 (1.1) 5.8 9.5 21.6 Other operating expenses (68.8) (43.0) (4.0) 55.0 42.1 12.0 2.1 Other operating income (66.5) 96.2 (14.8) 567.7 (61.4) 141.7 11.4 Operating profit before financing cost (73.2) 16.5 (1.0) 82.0 1.3 (0.7) 2.4 Finance cost 34.0 109.3 97.1 (33.0) (31.4) (37.4) 11.5 (Loss) / Profit before Taxation (120.5) (2.6) (10.2) 116.8 18.3 43.1 (6.8)Taxation (49.0) (8.6) 3.0 73.3 57.2 35.9 5.8 (Loss) / Profit after Taxation (144.1) (0.4) (14.1) 134.4 7.6 45.3 (9.9)
106 International Industries Limited

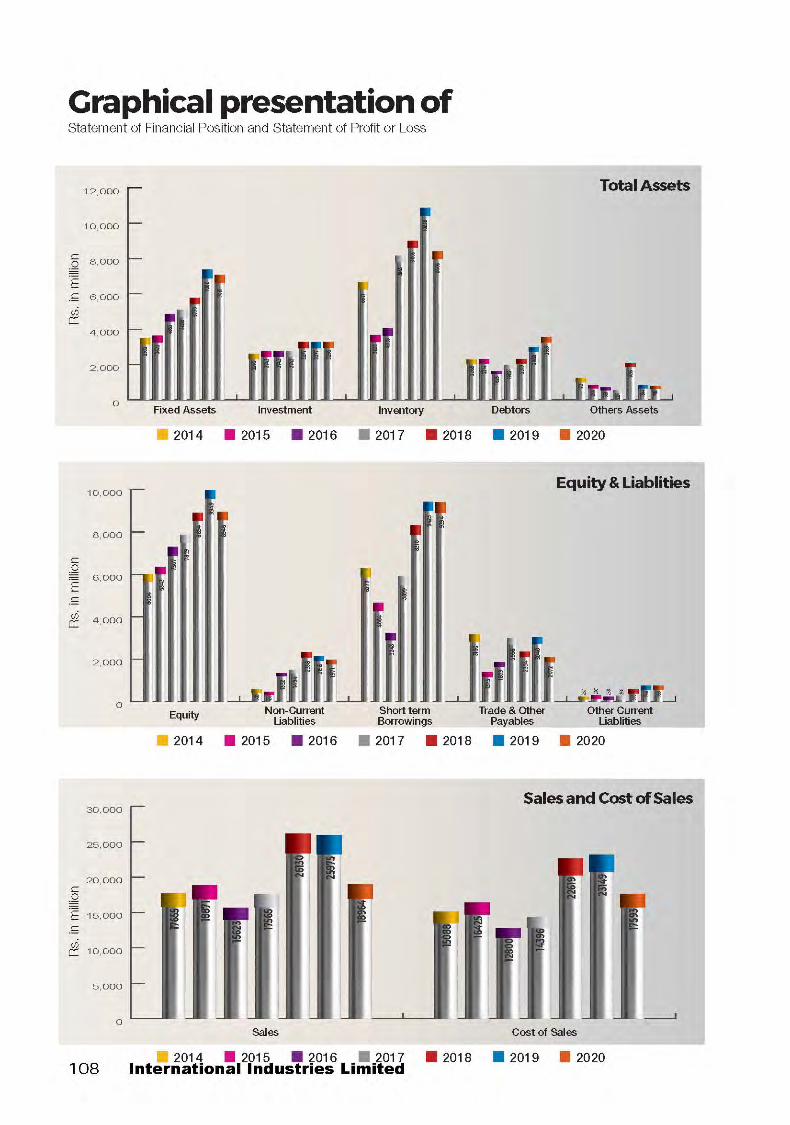

Key Financial Indicators (Graphs)
Product Wise Performance
Conversion Cost
2020
2020
2019
2019
2019 2018Rs in million
Salaries, wages and benefits 867 970 Electricity, gas and water 394 389 Depreciation and amortisation 494 428 Operational supplies and consumables 80 101 Repairs and maintenance 106 141 Others 112 120
2,054 2,150
2020 2019% of tonnage
Galvanized iron pipes 37% 34%CR steel tubes 28% 27%API line pipes 4% 11%Black pipes 3% 2%Polymer 7% 5%Others 21% 21%
100% 100%
109Annual Report 2020

Key Financial Indicators2020 2019 2018 2017 2016 2015 2014
Profitability RatiosGross profit ratio % 7.2 10.9 13.4 18.0 18.1 13.0 14.5 Net profit to Sales % (3.7) 6.1 6.1 10.5 5.0 3.9 2.8 EBITDA Margin to Sales % 7.1 13.4 11.4 17.1 10.9 8.8 9.4 Cost to Income Ratio Times 12.2 2.6 1.9 1.8 2.3 2.8 1.9 Operating Leverage % 2.3 (28.8) 0.0 6.1 (0.2) 0.0 (1.9)Return on Equity with Surplus on revaluation of fixed assets % (7.8) 15.8 17.8 23.4 10.8 11.5 8.4 Return on Equity without Surplus on revaluation of fixed assets % (10.6) 21.0 22.8 31.5 15.1 15.3 11.4 Return on Capital Employed % (6.6) 13.5 14.6 20.4 9.4 11.1 8.0 Return on Total Assets % (3.0) 6.2 7.0 10.0 5.6 5.6 3.1
Liquidity RatiosCurrent ratio Times 1.04 1.11 1.19 1.16 1.18 1.07 1.05 Quick / Acid test ratio Times 0.34 0.27 0.37 0.26 0.40 0.47 0.34 Cash to Current Liabilities Times (0.53) (0.39) (0.54) (0.06) (0.15) (0.03) (0.03)Cash flow from Operations to Sales Times 0.01 0.01 (0.05) (0.12) 0.12 0.12 0.09
Activity / Turnover RatiosInventory turnover ratio Times 1.8 2.3 2.6 2.4 3.3 3.2 2.5Inventory turnover in days Days 200 157 139 155 110 115 146Debtor turnover ratio Times 7.0 11.6 14.3 10.8 8.9 8.8 8.6Debtor turnover in days Days 52 31 26 34 41 41 43Creditor turnover ratio Times 22.9 34.2 37.1 20.1 22.6 7.7 10.4Creditor turnover in days Days 16 11 10 18 16 47 35Total assets turnover ratio Times 0.8 1.0 1.2 0.9 1.1 1.4 1.1Fixed assets turnover ratio Times 2.7 3.5 4.5 3.5 3.2 5.2 5.0Operating cycle in days Days 236 177 154 171 135 109 154Capital employed turnover ratio Times 1.7 2.3 2.6 2.0 2.1 2.9 2.8
Investment / Market RatiosEarnings per share - basic and diluted Rs. (5.3) 11.9 13.2 15.4 6.6 6.1 4.2 Price earning ratio Times (17.4) 6.5 17.6 24.0 10.8 11.0 11.8 Dividend Yield ratio % 0.0 8.4 3.7 2.4 6.4 6.0 6.6 Dividend Payout ratio % 0.0 54.4 64.4 58.57 68.64 65.6 77.5 Dividend per share - Cash Rs. - 5.50 8.50 9.00 4.50 4.00 3.25 Bonus shares Rs. - 1.00 - - - - - Dividend Cover Times - 1.84 1.55 1.71 1.46 1.52 1.29 Market value per share at the end of the year Rs. 91.73 77.07 231.98 368.57 70.55 67.14 49.44 Market value per share high during the year Rs. 120.99 247.97 377.00 405.99 93.90 86.90 61.35 Market value per share low during the year Rs. 63.50 71.25 203.00 85.80 60.00 44.51 39.70 Break-up value per share with revaluation of fixed assets Rs. 67.83 82.98 74.19 65.55 60.94 52.91 50.08 Break-up value per share without revaluation of fixed assets Rs. 49.84 62.54 57.85 48.72 43.39 39.89 36.89 Break-up value per share including Investment in Related Party
with revaluation of fixed assetsRs. 143.82 144.03 264.30 311.88 115.65 92.16 77.66
Break-up value per share including Investment in Related Party without revaluation of fixed assets
Rs. 125.84 123.59 247.97 295.05 98.10 79.14 64.47 Price to book ratio Times 0.52 0.36 1.24 2.39 0.61 0.61 0.37
ISL (Market Value of Investment at year end) Rs. 12,657 9,731 24,922 31,340 8,729 6,886 5,649 PCL (Market Value of Investment at year end) Rs. 651 856 1,139 776 414 404 242 IIL A (Unquoted - Value of Initial Investment) Rs. 9 9 9 9 9 9 9 IIL SS (Unquoted - Value of Initial Investment) Rs. - - - 150 150 150 - Total Investment in Related Parties at Market Value Rs. 13,318 10,596 26,070 32,276 9,302 7,449 5,900
Capital Structure RatiosFinancial leverage ratio Times 1.6 1.5 1.5 1.4 0.9 1.1 1.7 Net assets per share Rs. 67.83 82.98 74.19 65.55 60.94 52.91 50.08Weight avg : cost of debts Times 10.9 8.1 4.0 2.8 5.4 5.8 9.9 Total Debt : Equity ratio Times 61 : 39 61 : 39 60 : 40 58 : 42 48 : 52 52 : 48 63 : 37Interest cover Times 0.2 1.5 4.3 7.9 4.2 2.3 1.7
110 International Industries Limited


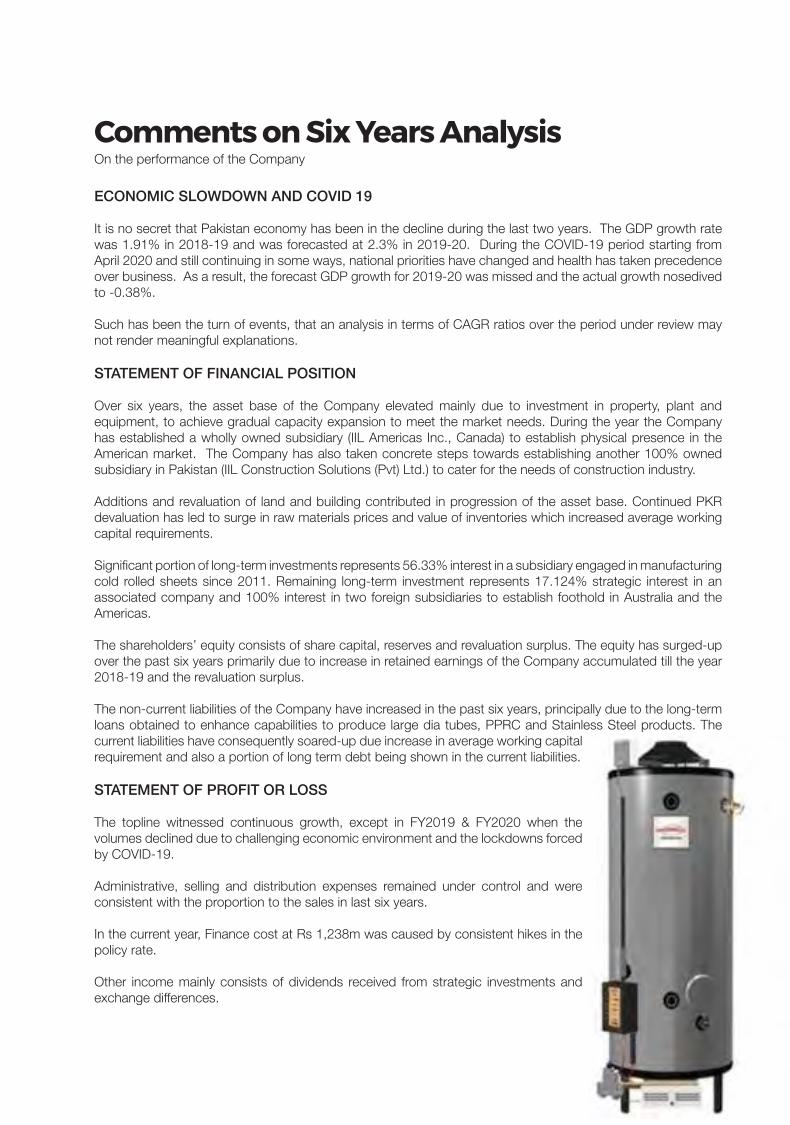
Comments on Six Years AnalysisOn the performance of the Company
ECONOMIC SLOWDOWN AND COVID 19
It is no secret that Pakistan economy has been in the decline during the last two years. The GDP growth rate was 1.91% in 2018-19 and was forecasted at 2.3% in 2019-20. During the COVID-19 period starting from April 2020 and still continuing in some ways, national priorities have changed and health has taken precedence over business. As a result, the forecast GDP growth for 2019-20 was missed and the actual growth nosedived to -0.38%.
Such has been the turn of events, that an analysis in terms of CAGR ratios over the period under review may not render meaningful explanations.
STATEMENT OF FINANCIAL POSITION
Over six years, the asset base of the Company elevated mainly due to investment in property, plant and equipment, to achieve gradual capacity expansion to meet the market needs. During the year the Company has established a wholly owned subsidiary (IIL Americas Inc., Canada) to establish physical presence in the American market. The Company has also taken concrete steps towards establishing another 100% owned subsidiary in Pakistan (IIL Construction Solutions (Pvt) Ltd.) to cater for the needs of construction industry.
Additions and revaluation of land and building contributed in progression of the asset base. Continued PKR devaluation has led to surge in raw materials prices and value of inventories which increased average working capital requirements.
Significant portion of long-term investments represents 56.33% interest in a subsidiary engaged in manufacturing cold rolled sheets since 2011. Remaining long-term investment represents 17.124% strategic interest in an associated company and 100% interest in two foreign subsidiaries to establish foothold in Australia and the Americas.
The shareholders’ equity consists of share capital, reserves and revaluation surplus. The equity has surged-up over the past six years primarily due to increase in retained earnings of the Company accumulated till the year 2018-19 and the revaluation surplus.
The non-current liabilities of the Company have increased in the past six years, principally due to the long-term loans obtained to enhance capabilities to produce large dia tubes, PPRC and Stainless Steel products. The current liabilities have consequently soared-up due increase in average working capital requirement and also a portion of long term debt being shown in the current liabilities.
STATEMENT OF PROFIT OR LOSS
The topline witnessed continuous growth, except in FY2019 & FY2020 when the volumes declined due to challenging economic environment and the lockdowns forced by COVID-19.
Administrative, selling and distribution expenses remained under control and were consistent with the proportion to the sales in last six years.
In the current year, Finance cost at Rs 1,238m was caused by consistent hikes in the policy rate.
Other income mainly consists of dividends received from strategic investments and exchange differences.

CASHFLOW ANALYSIS
The Company’s expansion projects are financed via long-term borrowing and cash generation from operations, the working capital requirement is fulfilled through short term running finance from reputable banks.
The Company generated funds from its operating activities due to positive working capital variations at period end. Investing activities comprises of investment in capital expenditure, subsidiaries and dividend income. Financing activities comprises of long-term loans obtained, changes in short term borrowings and dividends paid to the shareholders.
RATIO ANALYSIS
PROFITABILTYEBITDA margin to sales is 7.1% driven by the decline in business volume.
INVESTMENT / MARKETCompany’s earnings per share and price earning ratio at Rs -5.3 and -17.4 times in FY2020 were the lowest in last 6 years – again driven down by the decline in business volume.
For the first time in the last six years, the Company has not announced any dividend.
LIQUIDITYDespite a negative business environment, the Company generated overall positive cash flow in FY2020. Throughout the last six years, the Company’s current ratio remained above 1. All short term and long term debt commitments were discharged on timely basis.
CAPITAL STRUCTUREThe gearing level of the Company remained around 60:40 for most part of the last six years.
ACTIVITY / TURNOVERFor the most part of last six years, the operating cycle remained at around 150-170 days. However, during FY2020, the operating cycle appears high because of a low denominator.


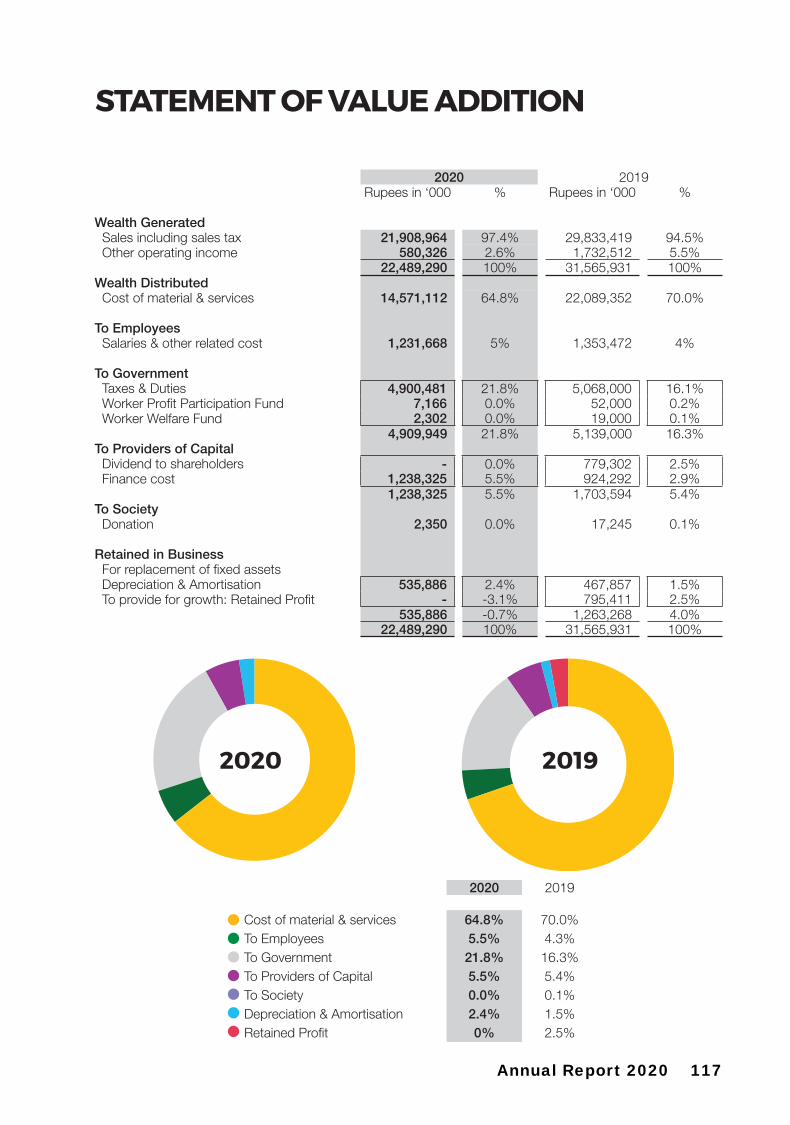
STATEMENT OF VALUE ADDITION
2020 2019Rupees in ‘000 % Rupees in ‘000 %
Wealth GeneratedSales including sales tax 21,908,964 97.4% 29,833,419 94.5%Other operating income 580,326 2.6% 1,732,512 5.5%
22,489,290 100% 31,565,931 100%Wealth Distributed
Cost of material & services 14,571,112 64.8% 22,089,352 70.0%
To EmployeesSalaries & other related cost 1,231,668 5% 1,353,472 4%
To GovernmentTaxes & Duties 4,900,481 21.8% 5,068,000 16.1%Worker Profit Participation Fund 7,166 0.0% 52,000 0.2%Worker Welfare Fund 2,302 0.0% 19,000 0.1%
4,909,949 21.8% 5,139,000 16.3%To Providers of Capital
Dividend to shareholders - 0.0% 779,302 2.5%Finance cost 1,238,325 5.5% 924,292 2.9%
1,238,325 5.5% 1,703,594 5.4%To Society
Donation 2,350 0.0% 17,245 0.1%
Retained in BusinessFor replacement of fixed assetsDepreciation & Amortisation 535,886 2.4% 467,857 1.5%To provide for growth: Retained Profit - -3.1% 795,411 2.5%
535,886 -0.7% 1,263,268 4.0% 22,489,290 100% 31,565,931 100%
2020 2019
Cost of material & services 64.8% 70.0%To Employees 5.5% 4.3%To Government 21.8% 16.3%To Providers of Capital 5.5% 5.4%To Society 0.0% 0.1%Depreciation & Amortisation 2.4% 1.5%Retained Profit 0% 2.5%
2020 2019
117Annual Report 2020


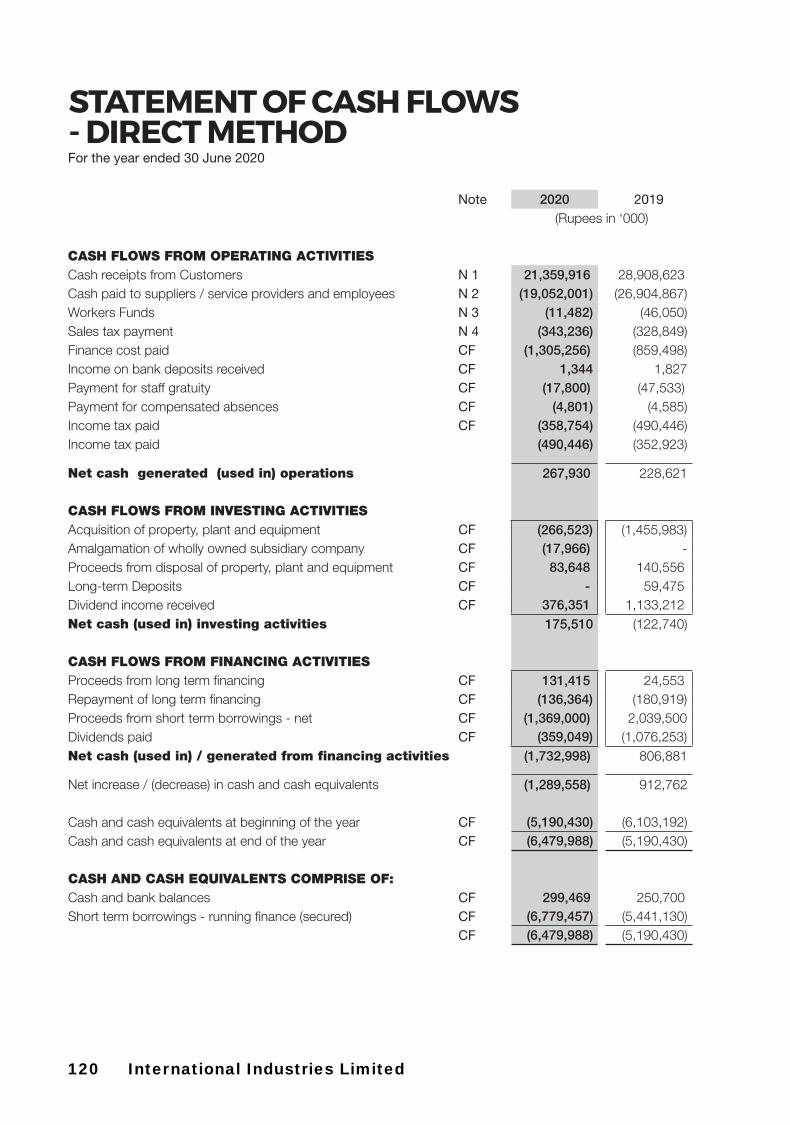
STATEMENT OF CASH FLOWS - DIRECT METHOD
Note 2020 2019(Rupees in ‘000)
CASH FLOWS FROM OPERATING ACTIVITIESCash receipts from Customers N 1 21,359,916 28,908,623 Cash paid to suppliers / service providers and employees N 2 (19,052,001) (26,904,867)Workers Funds N 3 (11,482) (46,050)Sales tax payment N 4 (343,236) (328,849)Finance cost paid CF (1,305,256) (859,498)Income on bank deposits received CF 1,344 1,827 Payment for staff gratuity CF (17,800) (47,533)Payment for compensated absences CF (4,801) (4,585)Income tax paid CF (358,754) (490,446)Income tax paid (490,446) (352,923)
Net cash generated (used in) operations 267,930 228,621 CASH FLOWS FROM INVESTING ACTIVITIESAcquisition of property, plant and equipment CF (266,523) (1,455,983)Amalgamation of wholly owned subsidiary company CF (17,966) - Proceeds from disposal of property, plant and equipment CF 83,648 140,556 Long-term Deposits CF - 59,475 Dividend income received CF 376,351 1,133,212 Net cash (used in) investing activities 175,510 (122,740)
CASH FLOWS FROM FINANCING ACTIVITIESProceeds from long term financing CF 131,415 24,553 Repayment of long term financing CF (136,364) (180,919)Proceeds from short term borrowings - net CF (1,369,000) 2,039,500 Dividends paid CF (359,049) (1,076,253)Net cash (used in) / generated from financing activities (1,732,998) 806,881
Net increase / (decrease) in cash and cash equivalents (1,289,558) 912,762
Cash and cash equivalents at beginning of the year CF (5,190,430) (6,103,192)Cash and cash equivalents at end of the year CF (6,479,988) (5,190,430)
CASH AND CASH EQUIVALENTS COMPRISE OF:Cash and bank balances CF 299,469 250,700 Short term borrowings - running finance (secured) CF (6,779,457) (5,441,130)
CF (6,479,988) (5,190,430)
For the year ended 30 June 2020
120 International Industries Limited

SHARE PRICE SENSITIVITY ANALYSIS
The following are some factors which may affect the share price of the Company in the stock exchange.
INCREASE IN DEMANDIncrease in demand of our product will contribute towards better profitability and EPS which will in turn increase the share price. INCREASE IN VARIABLE COSTAny increase in variable cost may badly impact the gross margin and will result in fall in profitability and EPS if the cost cannot be passed on to the customers. This will have a negative impact on our share price. INCREASE/DECREASE IN STEEL PRICESCost of steel is a major component of the cost of the product. Stability in price which cannot be passed on to the customers will have an impact on profitability and the share price. INCREASE IN FIXED COSTSIncrease in fixed cost would reduce profitability affecting the EPS and share prices respectively. CHANGE IN GOVERNMENT POLICIESAny change in government policies related to steel sector may affect the share price of the Company. A positive change would increase the share price and a negative change would reduce the share price.
-
500,000
1,000,000
1,500,000
2,000,000
2,500,000
3,000,000
3,500,000
0
20
40
60
80
100
120
140
Jul-19 Aug-19 Sep-19 Oct-19 Nov-19 Dec-19 Jan-20 Feb-20 Mar-20 Apr-20 May-20 Jun-20
NU
MB
ER
OF
SH
AR
ES
SH
AR
E P
RIC
E (
PK
R)
-
Volume Max Closing
IIL SHARE PRICES - TREND V/S VOLUME TRADED FY 2019-20

122 International Industries Limited
FORWARD LOOKING STATEMENTThe international outlook in the wake of the Coronavirus pandemic, increasing US-China trade tension and approaching US elections will remain unpredictable to a large extent in the months and years ahead. Even after the successful development of a Covid-19 vaccine, it’s distribution and the successful immunization of the masses may take years and may present unanticipated challenges for nations around the world. Needless to say, the present state of condition in industries such as airlines, automobile manufacturing, tourism and hospitality will continue to persist in the short to medium term, and one should remain alert to shifting economic trends and behavioral patterns in trade, commerce and technology adoption to better position themselves for the future.
Global economic indicators are expected to react gradually to the policy response of the Covid-19 healthcare crisis. However, the unprecedented fiscal and monetary policy response by governments and global central banks have had an almost immediate impact on commodity prices and financial asset prices globally. To note, over a 3 to 4-month period, the fiscal policy outlay legislated by the US government was estimated at $2.8 trillion (13% of GDP), whereas monetary policy measures amounted to $2.3 trillion (11% of GDP) as of May 2020, and are still ongoing. In perspective, during the 2007-08 financial crisis and subsequent recession, monetary policy measures amounted to $3.6 trillion over an 8-year period. This extensive increase in liquidity over a short period of time has inflated asset and commodity prices and will continue to do so in the absence of any external shock or policy countermeasures. We continue to monitor such further developments to gauge future outlook on commodity and steel prices going forward and remain cautious to rising valuations that are divorced from economic fundamentals. Other factors that will contribute towards the outlook will be the pace of recovery in major global economic hubs and the ensuing policy response.
On the domestic front the policy response by the government and State Bank of Pakistan (SBP) has also been swift. The cumulative 625 basis point cut in interest rates has helped improve business sentiment and the decline in the incidence of daily Coronavirus cases and re-normalization of commercial and social activities will sustain business confidence. The construction package announced by the government, development work on dams and gas distribution infrastructure is also expected to help the construction and engineering industries in the months ahead.
We however remain cautiously optimistic as automotive, general fabrication and real estate construction remain the primary drivers for growth in our business, and barring a visible improvement in activity in these segments, business conditions may not full recover. Furthermore, oil prices and inflation rates may not remain at their current lows in the coming months, which may put added burden on the domestic economy, and prompt policy countermeasures which can be counterproductive for industry.
The export market remained subdued due to high volatility in steel prices in the first half of the outgoing year. This was followed by the Covid-19 crisis in the second half, which although did not halt exports, but have had a detrimental impact on export orders. Various trade barriers on steel products continue to affect our exports and our strategy for the foreseeable future is to leverage our footprint in existing regions to promote new products for which investments have been made in previous years.
Notwithstanding the above, the long-term outlook for steel and related industries in Pakistan remains positive as developing economies with young and growing populations, require large investments in public infrastructure to continue growing. The country’s demographic profile indicates that the economy will require greater investment in housing, energy, automobiles and white goods to service the needs of this demographic. As per the World Steel Association’s assessment for 2019, world average steel consumption was 228 kg per capita, whereas Pakistan, as per industry estimates remained well below the world average at approximately 46 kg per capita steel. This highlights the extent of shortage of steel products in Pakistan and indicates the immense potential for growth in the domestic steel manufacturing and processing industry.
Status of projects in progress and disclosed in the previous years:
1. Our Hollow Structural Sections (HSS) and API pipe mill has been fully operational for the last 4 years. The mill has been servicing various export and domestic orders for square and rectangle HSS during the year. Although large tender based API business has been visibly absent during FY 2019-20, the Gas Infrastructure Development Cess (GIDC) judgement by the Supreme Court will provide the government much needed funds to initiate gas infrastructure development projects for execution in the coming years.

2. IIL Construction Solution (Pvt) Limited “CSL” was incorporated in August 2020. The company is geared to produce scaffolding, shoring and formwork products and systems used in the construction industry worldwide. CSL will also provide technical solutions and structural engineering and fabrication services to further support our investments in our scaffolding and HSS mills commissioned in previous years. High-rise buildings, warehouses, industrial sheds, pedestrian bridges and walkways etc. are the key target market for our solutions.
3. Our Stainless-Steel business has been performing well with our expanded range of products which includes squares and rectangles and newly introduced mid-range ‘Eco’ rage of Stainless-Steel pipes. Our premium range of 304 grade ‘Cosmo’ pipes are well-positioned in the market. Sales were up 15% year-on-year and our projections remain optimistic.
4. Australia has been one of our top performing international markets over the past 3 years, with IIL Australia Pty Ltd. now a well-established name in the country. Although sales to Australia were 20% lower than last year due to bushfires, economic conditions and the Coronavirus pandemic, reconstruction efforts following the bushfires will play a major role in increasing sales in the coming year.
5. IIL Americas Inc. was incorporated in Ontario, Canada, in October 2019, as a wholly owned subsidiary of IIL. North America is the largest steel tube and pipe importing market in the world, and through IIL Americas we expect to re-enter this market with a diversified portfolio of products to re-gain our foothold in this region.
6. We remain cognizant of shifting market dynamics that may affect our business. A shift away from small diameter steel pipe towards polymer pipe
for water supply led to IIL’s foray into PPRC pipes & fittings. The Company views this new business as an important part of its future strategy as the polymer pipes market for water supply is set to grow along with the rise in housing demand. Bulk water supply utilises large diameter HDPE water pipe and IIL is proud to be the only manufacturer with the largest product range of HDPE water pipes in Pakistan. Our new Polymer Division in Sheikhupura is well-equipped to manufacture the full range our water, gas and duct polymer pipes and fittings. Polymer sales volumes were down marginally by 4% over last year.
7. Our subsidiary International Steels Ltd. (ISL) reported earnings of Rs. 495 million for FY 2019-20 (2019: 2.7 Bn). Net sales turnover was down 17% over last year. The company is the market leader in its segment and remains well-positioned in the domestic and export market.
Explanation of how the performance of the entity meets the forward-looking disclosures made in the previous year:
It is a matter of pride that all new business undertakings mentioned in our previous report have not only been commissioned but are now fully engaged in commercial production and servicing orders.
Sources of information:
Management has quoted figures from the World Steel Association Report (2018), IMF and The Federal Reserve, and has made estimates through market surveys, discussions with industry professionals, internal discussions and research. IIL regularly utilises the services of external consultants including during the establishment of its PPRC Pipes & Fittings facility and during the commissioning of its mills as and when required.

124 International Industries Limited
INDEPENDENT AUDITOR’S REPORTTO THE MEMBERS OF INTERNATIONAL INDUSTRIES LIMITED
REPORT ON THE AUDIT OF THE FINANCIAL STATEMENTS
Opinion
We have audited the annexed financial statements of International Industries Limited (the Company), which comprise the statement of financial position as at 30 June 2020, and the statement of profit or loss account, the statement of comprehensive income, the statement of changes in equity, the statement of cash flows for the year then ended, and notes to the financial statements, including a summary of significant accounting policies and other explanatory information, and we state that we have obtained all the information and explanations which, to the best of our knowledge and belief, were necessary for the purposes of the audit.
In our opinion and to the best of our information and according to the explanations given to us, the statement of financial position, statement of profit or loss account, the statement of comprehensive income, the statement of changes in equity and the statement of cash flows together with the notes forming part thereof conform with the accounting and reporting standards as applicable in Pakistan and give the information required by the Companies Act, 2017 (XIX of 2017), in the manner so required and respectively give a true and fair view of the state of the Company’s affairs as at 30 June 2020 and of the profit and other comprehensive income, the changes in equity and its cash flows for the year then ended.
Basis for Opinion
We conducted our audit in accordance with International Standards on Auditing (ISAs) as applicable in Pakistan. Our responsibilities under those standards are further described in the Auditor’s Responsibilities for the Audit of the Financial Statements section of our report. We are independent of the Company in accordance with the International Ethics Standards Board for Accountants’ Code of Ethics for Professional Accountants as adopted by the Institute of Chartered Accountants of Pakistan (the Code) and we have fulfilled our other ethical responsibilities in accordance with the Code. We believe that the audit evidence we have obtained is sufficient and appropriate to provide a basis for our opinion.
Key Audit Matters
Key audit matters are those matters that, in our professional judgment, were of most significance in our audit of the financial statements of the current period. These matters were addressed in the context of our audit of the financial statements as a whole, and in forming our opinion thereon, and we do not provide a separate opinion on these matters.
Following are the Key audit matters:

125Annual Report 2020
S. No. Key audit matters How the matters were addressed in our audit
1 Revenue recognition
Refer notes 4.11, 22 and 37.1 to the financial statements relating to revenue recognition.
The Company generates revenue from sale of goods to domestic as well as export customers. Sales to domestic and export customers represent 87% and 13% of the total sales respectively. Sales to related parties represent 6% of total sales respectively.
We identified revenue recognition as key audit matter as it is one of the key performance indicators of the Company and because of the potential risk that revenue transactions may not being recognised in the appropriate period.
Our key audit procedures amongst others, included the following:
• We obtained an understanding of, assessed and tested the design and operating effectiveness of controls designed to ensure that revenue is recognised in the appropriate accounting period;
• We assessed the appropriateness of the Company’s accounting policies for revenue recognition and compliance of those policies with applicable accounting standards;
• We compared, on a sample basis, specific revenue transactions recorded before and after the reporting date with underlying documentation to assess whether revenue has been recognised in the appropriate accounting period; and
• We inspected credit notes issued to record sales returns subsequent to year end, if any.

126 International Industries Limited
S. No. Key audit matters How the matters were addressed in our audit
2. Valuation of Trade Debts
Refer notes 4.5.2.1, 4.13.1 and 10 to the financial statements relating to valuation of trade debts.
The Company has a significant balance of trade debts. Provision against doubtful trade debts is based on loss allowance for Expected Credit Loss (ECL).
We identified recoverability of trade debts as a key audit matter as it involves significant management judgment in determining the recoverable amount of trade debts.
Our key audit procedures amongst others, included the following:
• We obtained an understanding of the management’s basis for the determination of the provision required at the year end and the receivables collection process;
• We assessed the method used by the company for the recognition of the impact of the application of IFRS 9 regarding provision for doubtful debts as allowable under IFRS 9 and assessing the reasonableness of assumptions of ECL; and
• We tested the accuracy of the data on a sample basis extracted from the Company’s accounting system which has been used to calculate the provision required including the subsequent recoveries.
3. Valuation of Stock-in-trade
Refer notes 4.7, 9, 23 and 37.1 to the financial statements relating to valuation of stock-in-trade.
Inventory forms a significant part of the Company’s assets. During the year 11% of raw materials were purchased by the Company from a related party.
We identified the valuation of stock in trade as key audit matter as it directly affects the profitability of the Company.
Our key audit procedures amongst others, included the following:
• We obtained an understanding of internal controls over purchases and valuation of stock in trade and tested, on a sample basis, their design, implementation and operating effectiveness;
• We compared on a sample basis specific purchases (including those from related party) with underlying supporting documents / agreements, if any;
• We compared calculations of the allocation of directly attributable costs with the underlying supporting documents;
• We obtained an understanding of management’s determination of net realizable value (NRV) and the key estimates adopted, including future selling prices, future costs to complete work-in-process and costs necessary to make the sales and their basis; and
• We compared the NRV, on a sample basis, to the cost of finished goods to assess whether any adjustments are required to value inventory in accordance with applicable accounting and reporting standards.

127Annual Report 2020
Information Other than the Financial Statements and Auditor’s Report Thereon
Management is responsible for the other information. The Other Information comprises the information included in the Annual Report but does not include the financial statements and our auditor’s report thereon.
Our opinion on the financial statements does not cover the Other Information and we do not express any form of assurance conclusion thereon.
In connection with our audit of the financial statements, our responsibility is to read the Other Information and, in doing so, consider whether the Other Information is materially inconsistent with the financial statements or our knowledge obtained in the audit, or otherwise appears to be materially misstated.
If, based on the work we have performed, we conclude that there is a material misstatement of this Other Information, we are required to report that fact. We have nothing to report in this regard.
Responsibilities of Management and Board of Directors for the Financial Statements
Management is responsible for the preparation and fair presentation of the financial statements in accordance with the accounting and reporting standards as applicable in Pakistan and the requirements of Companies Act, 2017(XIX of 2017) and for such internal control as management determines is necessary to enable the preparation of financial statements that are free from material misstatement, whether due to fraud or error.
In preparing the financial statements, management is responsible for assessing the Company’s ability to continue as a going concern, disclosing, as applicable, matters related to going concern and using the going concern basis of accounting unless management either intends to liquidate the Company or to cease operations, or has no realistic alternative but to do so.
Board of directors are responsible for overseeing the Company’s financial reporting process.
Auditor’s Responsibilities for the Audit of the Financial Statements
Our objectives are to obtain reasonable assurance about whether the financial statements as a whole are free from material misstatement, whether due to fraud or error, and to issue an auditor’s report that includes our opinion. Reasonable assurance is a high level of assurance, but is not a guarantee that an audit conducted in accordance with ISAs as applicable in Pakistan will always detect a material misstatement when it exists. Misstatements can arise from fraud or error and are considered material if, individually or in the aggregate, they could reasonably be expected to influence the economic decisions of users taken on the basis of these financial statements.
As part of an audit in accordance with ISAs as applicable in Pakistan, we exercise professional judgment and maintain professional skepticism throughout the audit. We also:
• Identify and assess the risks of material misstatement of the financial statements, whether due to fraud or error, design and perform audit procedures responsive to those risks, and obtain audit evidence that is sufficient and appropriate to provide a basis for our opinion. The risk of not detecting a material misstatement resulting from fraud is higher than for one resulting from error, as fraud may involve collusion, forgery, intentional omissions, misrepresentations, or the override of internal control.

128 International Industries Limited
• Obtain an understanding of internal control relevant to the audit in order to design audit procedures that are appropriate in the circumstances, but not for the purpose of expressing an opinion on the effectiveness of the Company’s internal control.
• Evaluate the appropriateness of accounting policies used and the reasonableness of accounting estimates and related disclosures made by management.
• Conclude on the appropriateness of management’s use of the going concern basis of accounting and, based on the audit evidence obtained, whether a material uncertainty exists related to events or conditions that may cast significant doubt on the Company’s ability to continue as a going concern. If we conclude that a material uncertainty exists, we are required to draw attention in our auditor’s report to the related disclosures in the financial statements or, if such disclosures are inadequate, to modify our opinion. Our conclusions are based on the audit evidence obtained up to the date of our auditor’s report. However, future events or conditions may cause the Company to cease to continue as a going concern.
• Evaluate the overall presentation, structure and content of the financial statements, including the disclosures, and whether the financial statements represent the underlying transactions and events in a manner that achieves fair presentation.
We communicate with the board of directors regarding, among other matters, the planned scope and timing of the audit and significant audit findings, including any significant deficiencies in internal control that we identify during our audit.
We also provide the board of directors with a statement that we have complied with relevant ethical requirements regarding independence, and to communicate with them all relationships and other matters that may reasonably be thought to bear on our independence, and where applicable, related safeguards.
From the matters communicated with the board of directors, we determine those matters that were of most significance in the audit of the financial statements of the current period and are therefore the key audit matters. We describe these matters in our auditor’s report unless law or regulation precludes public disclosure about the matter or when, in extremely rare circumstances, we determine that a matter should not be communicated in our report because the adverse consequences of doing so would reasonably be expected to outweigh the public interest benefits of such communication.

129Annual Report 2020
Report on Other Legal and Regulatory Requirements
Based on our audit, we further report that in our opinion:
a) proper books of account have been kept by the Company as required by the Companies Act, 2017 (XIX of 2017);
b) the statement of financial position, the statement of profit or loss account, the statement of comprehensive income, the statement of changes in equity and the statement of cash flows together with the notes thereon have been drawn up in conformity with the Companies Act, 2017 (XIX of 2017) and are in agreement with the books of account;
c) investments made, expenditure incurred and guarantees extended during the year were for the purpose of the Company’s business; and
d) zakat deductible at source under the Zakat and Ushr Ordinance, 1980 (XVIII of 1980), was deducted by the Company and deposited in the Central Zakat Fund established under section 7 of that Ordinance.
The engagement partner on the audit resulting in this independent auditor’s report is Muhammad Taufiq.
Date: September 6th,2020 KPMG Taseer Hadi & Co.Chartered Accountants
Karachi

130 International Industries Limited

UNCONSOLIDATEDFINANCIAL STATEMENTS

132 International Industries Limited
As at 30 June 2020
STATEMENT OF FINANCIAL POSITION
Note 2020 2019
----------- Rupees in ‘000 -----------ASSETSNon-current assetsProperty, plant and equipment 5 7,081,385 7,360,485 Intangible assets 6 1,710 3,351 Investments 7 3,295,242 3,277,276 Long term deposits 3,519 3,519
10,381,856 10,644,631 Current assetsStores and spares 8 213,371 215,528 Stock-in-trade 9 8,405,807 10,857,730 Trade debts - considered good 10 3,558,719 2,988,083 Advances, trade deposits and short-term prepayments 11 28,526 51,384 Receivable from K-Electric Limited (KE) - unsecured, considered good 19,006 30,124 Other receivables 12 15,000 9,523 Sales tax receivable 217,762 279,468 Cash and bank balances 14 299,469 250,700
12,757,660 14,682,540
Total assets 23,139,516 25,327,171
EQUITY AND LIABILITIES
Share capital and ReservesAuthorised capital200,000,000 (2019: 200,000,000) ordinary shares of Rs.10 each 2,000,000 2,000,000
Share capitalIssued, subscribed and paid-up capital 15 1,318,819 1,198,926
Revenue reserveGeneral reserve 2,700,036 2,700,036 Un-appropriated profit 2,554,370 3,599,089
Capital reserve Revaluation surplus on property, plant and equipment 16 2,372,304 2,450,893 Total Shareholders’ equity 8,945,529 9,948,944
LIABILITIES
Non-current liabilitiesLong term financing - secured 17 1,577,275 1,702,174 Staff retirement benefits 32 89,552 118,409 Deferred taxation 18 304,615 335,547
1,971,442 2,156,130 Current liabilitiesTrade and other payables 19 1,846,134 2,764,019 Contract Liabilities 184,462 235,171 Short term borrowings - secured 20 9,394,457 9,425,130 Unpaid dividend 2,438 4,257 Unclaimed dividend 39,044 36,596 Current portion of long term financing- secured 17 410,863 290,913 Taxation - net 13 269,317 322,545 Accrued mark-up 75,830 143,466
12,222,545 13,222,097 Total liabilities 14,193,987 15,378,227
Contingencies and commitments 21
Total equity and liabilities 23,139,516 25,327,171
The annexed notes from 1 to 42 form an integral part of these unconsolidated financial statements.
Ehsan A. Malik Muhammad Akhtar Riyaz T. ChinoyDirector & Chairman Chief Financial Chief Executive
Board Audit Committee Officer Officer
Unconsolidated

133Annual Report 2020
Ehsan A. Malik Muhammad Akhtar Riyaz T. ChinoyDirector & Chairman Chief Financial Chief Executive
Board Audit Committee Officer Officer
For the year ended 30 June 2020STATEMENT OF PROFIT OR LOSS
Note 2020 2019 --------- Rupees in ‘000 ---------
Net sales 22 18,964,215 25,975,107Cost of sales 23 (17,592,908) (23,148,791)Gross profit 1,371,307 2,826,316
Selling and distribution expenses 24 (813,043) (1,141,480)Administrative expenses 25 (298,707) (295,796)Net impairment loss on trade debts 10.4 (664) (5,767)
(1,112,414) (1,443,043)
Finance cost 26 (1,238,325) (924,292)Other operating charges 27 (30,702) (98,364)
(1,269,027) (1,022,656)
Other income 28 580,326 1,732,512 (Loss) / Profit before taxation (429,808) 2,093,129
Taxation 29 (264,397) (518,416)(Loss) / Profit after taxation for the year (694,205) 1,574,713
(Rupees)
(Loss) / Earnings per share - basic and diluted 30 (5.26) 11.94
The annexed notes from 1 to 42 form an integral part of these unconsolidated financial statements.
Unconsolidated

134 International Industries Limited
For the year ended 30 June 2020STATEMENT OF COMPREHENSIVE INCOME
Note 2020 2019 --------- Rupees in ‘000 ---------
(Loss) / Profit for the year (694,205) 1,574,713
Other comprehensive income
Items that will not be subsequently reclassified to Statement of profit or loss account
Gain on Remeasurements of net defined benefit liability 60,665 27,844
Adjustment related to opening deferred tax balance 595 (2,933)Related deferred tax charge for the year (7,107) (6,718)
(6,512) (9,651)
54,153 18,193
Gain due to addition to Surplus on Revaluation during the year
Freehold land 5.1 - 72,635
Leasehold land 5.1 - 197,316
Building 5.1 - 358,144 Adjustment related to opening deferred tax balance (3,685) (685)Related deferred tax charge for the year - (86,721)
(3,685) 270,738 (3,685) 540,689
Other comprehensive income for the year - net of tax 50,468 558,882
Total comprehensive income for the year (643,737) 2,133,595
The annexed notes from 1 to 42 form an integral part of these unconsolidated financial statements.
Ehsan A. Malik Muhammad Akhtar Riyaz T. ChinoyDirector & Chairman Chief Financial Chief Executive
Board Audit Committee Officer Officer
Unconsolidated
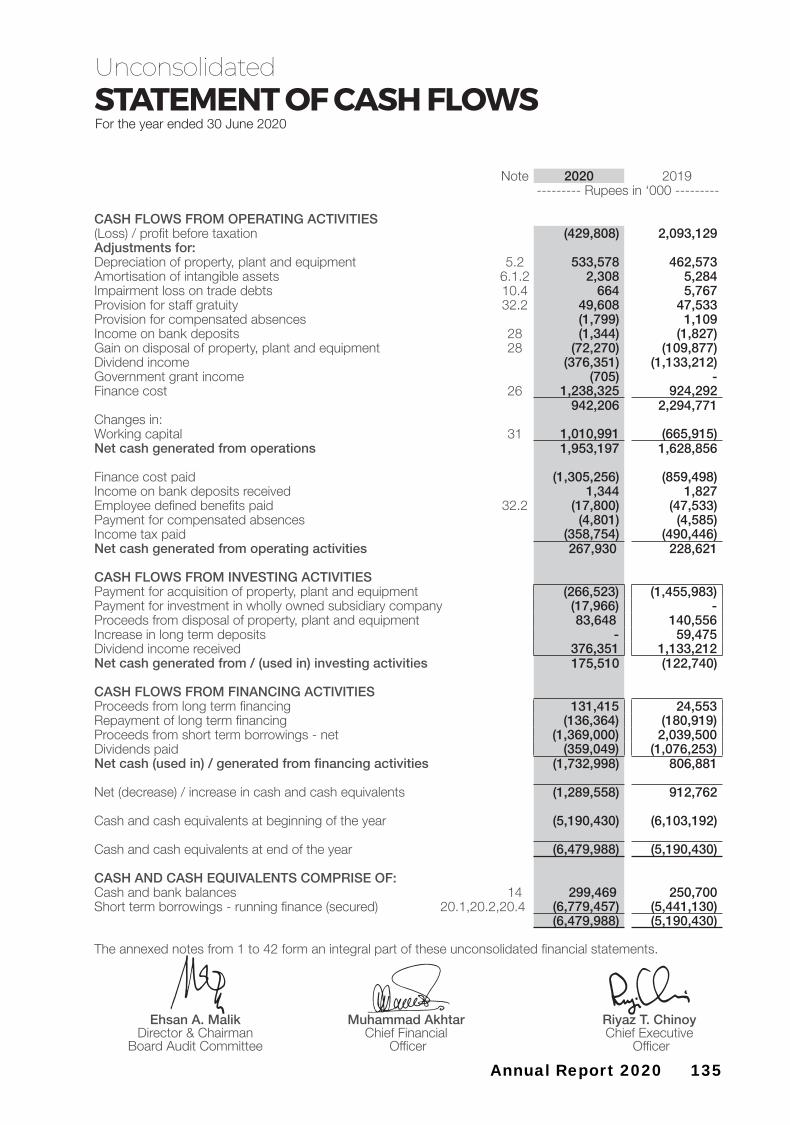
135Annual Report 2020
For the year ended 30 June 2020STATEMENT OF CASH FLOWS
Note 2020 2019 --------- Rupees in ‘000 ---------
CASH FLOWS FROM OPERATING ACTIVITIES(Loss) / profit before taxation (429,808) 2,093,129 Adjustments for:Depreciation of property, plant and equipment 5.2 533,578 462,573 Amortisation of intangible assets 6.1.2 2,308 5,284 Impairment loss on trade debts 10.4 664 5,767 Provision for staff gratuity 32.2 49,608 47,533 Provision for compensated absences (1,799) 1,109 Income on bank deposits 28 (1,344) (1,827)Gain on disposal of property, plant and equipment 28 (72,270) (109,877)Dividend income (376,351) (1,133,212)Government grant income (705) - Finance cost 26 1,238,325 924,292
942,206 2,294,771 Changes in:Working capital 31 1,010,991 (665,915)Net cash generated from operations 1,953,197 1,628,856
Finance cost paid (1,305,256) (859,498)Income on bank deposits received 1,344 1,827 Employee defined benefits paid 32.2 (17,800) (47,533)Payment for compensated absences (4,801) (4,585)Income tax paid (358,754) (490,446)Net cash generated from operating activities 267,930 228,621
CASH FLOWS FROM INVESTING ACTIVITIESPayment for acquisition of property, plant and equipment (266,523) (1,455,983)Payment for investment in wholly owned subsidiary company (17,966) - Proceeds from disposal of property, plant and equipment 83,648 140,556 Increase in long term deposits - 59,475 Dividend income received 376,351 1,133,212 Net cash generated from / (used in) investing activities 175,510 (122,740)
CASH FLOWS FROM FINANCING ACTIVITIESProceeds from long term financing 131,415 24,553 Repayment of long term financing (136,364) (180,919)Proceeds from short term borrowings - net (1,369,000) 2,039,500 Dividends paid (359,049) (1,076,253)Net cash (used in) / generated from financing activities (1,732,998) 806,881
Net (decrease) / increase in cash and cash equivalents (1,289,558) 912,762
Cash and cash equivalents at beginning of the year (5,190,430) (6,103,192)
Cash and cash equivalents at end of the year (6,479,988) (5,190,430)
CASH AND CASH EQUIVALENTS COMPRISE OF:Cash and bank balances 14 299,469 250,700 Short term borrowings - running finance (secured) 20.1,20.2,20.4 (6,779,457) (5,441,130)
(6,479,988) (5,190,430)
The annexed notes from 1 to 42 form an integral part of these unconsolidated financial statements.
Ehsan A. Malik Muhammad Akhtar Riyaz T. ChinoyDirector & Chairman Chief Financial Chief Executive
Board Audit Committee Officer Officer
Unconsolidated

136 International Industries Limited
For the year ended 30 June 2020
STATEMENT OF CHANGES IN EQUITY
Issued, Revenue reserves Capital Reserves Totalsubscribed General Un- Revaluation and paid reserves appropriated surplus on up capital profit property, plant
& equipment
-------------------------------- (Rupees in ‘000) --------------------------------
Balance as at 01 July 2018 1,198,926 2,700,036 3,037,210 1,958,211 8,894,383
Profit for the year - - 1,574,713 - 1,574,713 Other comprehensive income for the year - - 18,193 540,689 558,882 Total comprehensive income for the year - - 1,592,906 540,689 2,133,595
Transactions with owners recorded directly in equity - distributionsDividend:- Final dividend at 65% (i.e. Rs. 6.50 per share) for the year ended 30 June 2018 - - (779,302) - (779,302)- Interim dividend at 25% (i.e. Rs. 2.50 per share) for the year ended 30 June 2019 - - (299,732) - (299,732)
Total transactions with owners of the Company - distributions - - (1,079,034) - (1,079,034)
Transferred from revaluation surplus on disposal of property, plant and equipment - net of tax - - 7,139 (7,139) -
Transferred from revaluation surplus on property, plant and equipment on account of incremental depreciation - net of tax - - 40,868 (40,868) -
Balance as at 30 June 2019 1,198,926 2,700,036 3,599,089 2,450,893 9,948,944
Loss for the year - - (694,205) - (694,205)Other comprehensive income for the year - - 54,153 (3,685) 50,468 Total comprehensive income for the year - - (640,052) (3,685) (643,737)
Transactions with owners recorded directly in equity - distributionsDividend:- Final dividend at 30% (i.e. Rs. 3.00 per share) for the year ended 30 June 2019 - - (359,678) - (359,678)- Bonus share at 10% (i.e. 1 share for every 10 shares) for the year ended 30 June 2019 119,893 - (119,893) - -
Total transactions with owners of the Company - distributions 119,893 - (479,571) - (359,678)
Transferred from revaluation surplus on disposal of property, plant and equipment - net of tax - - 8,772 (8,772) -
Transferred from revaluation surplus on property, plant and equipment on account of incremental depreciation - net of tax - - 66,132 (66,132) -
Balance as at 30 June 2020 1,318,819 2,700,036 2,554,370 2,372,304 8,945,529
The annexed notes from 1 to 42 form an integral part of these unconsolidated financial statements.
Ehsan A. Malik Muhammad Akhtar Riyaz T. ChinoyDirector & Chairman Chief Financial Chief Executive
Board Audit Committee Officer Officer
Unconsolidated
137Annual Report 2020
For the year ended 30 June 2020
NOTES TO THE UNCONSOLIDATED FINANCIAL STATEMENTS
1 STATUS AND NATURE OF BUSINESS
International Industries Limited (“the Company”) was incorporated in Pakistan in 1948 and is quoted on the Pakistan Stock Exchange. The Company is engaged in the business of manufacturing and marketing of galvanized steel pipes, precision steel tubes, API line pipes, polymer pipes & fittings. The registered office of the Company is situated at 101, Beaumont Plaza, 10, Beaumont Road, Karachi - 75530.
The manufacturing facilities of the Company are situated as follows:
a) LX 15-16, Landhi Industrial Area, Karachib) Survey # 402,405-406, Dehshrabi Landhi Town, Karachic) 22 KM, Sheikhupura Road, Lahore
Sales offices are located at Lahore, Islamabad, Faisalabad, Peshawar and Multan.
Details of the Company’s investment in subsidiaries and associated company are stated in note 7 to these unconsolidated financial statements.
1.1 Impact of COVID-19As in the rest of the world, COVID-19 adversely affected lifestyles and business operations in Pakistan. The Company complied with the SOPs prescribed by Federal and Provincial Governments. Sales and production activities were affected during lockdowns, however, the factory reopened after necessary permissions to produce orders for exports and essential services. The Company remained up to date in all its financial commitments. The Management believes that the going concern assumption of the Company remains valid.
The Company availed employee refinance facility for payment of salaries and wages under SBP’s infrastructure, Housing & SME Finance department (IH&SMEFD) Circular No. 6 of 2020 dated April 10, 2020.
2 BASIS OF PREPARATION
2.1 Statement of compliance
These unconsolidated financial statements have been prepared in accordance with the accounting and reporting standards as applicable in Pakistan. The accounting and reporting standards as applicable in Pakistan comprise of:
- International Financial Reporting Standards (IFRS Standards) issued by the International Accounting Standard Board (IASB) as notified under the Companies Act, 2017; and
- Provisions of and directives issued under the Companies Act 2017.
Where the provisions of and directives issued under the Companies Act 2017 differ with the requirements of IFRS Standards, the provisions of and directives issued under the Companies Act 2017 have been followed.
2.2 Basis of measurement
These unconsolidated financial statements have been prepared under the historical cost convention except for the Company’s liability under defined benefit plan (gratuity) that is determined based on the present value of defined benefit obligation less fair value of plan assets, land & buildings thereon that are stated at fair values determined by an independent valuer and derivative financial instruments which are stated at fair value.
2.3 Functional and presentation currency
These unconsolidated financial statements are presented in Pakistan Rupees, which is the Company’s functional currency. All amounts have been rounded to the nearest thousand, unless otherwise indicated.

138 International Industries Limited
2.4 Use of estimates and judgments
The preparation of unconsolidated financial statements in conformity with accounting and reporting standards, as applicable in Pakistan, requires management to make judgments, estimates and assumptions that affect the application of the accounting policies and the reported amounts of assets, liabilities, income and expenses. The estimates and associated assumptions are based on historical experience and various other factors that are believed to be reasonable under the circumstances, the results of which form the basis of making the judgments about the carrying values of assets and liabilities that are not readily apparent from other sources. Actual results may differ from these estimates.
The estimates underlying the assumptions are reviewed on an ongoing basis. Revisions to accounting estimates are recognised in the period in which the estimate is revised if the revision affects only that period, or in the period of the revision and future periods if the revision affects both current and future periods. Information about the judgments made by the management in the application of the accounting policies, that have the most significant effect on the amount recognised in these unconsolidated financial statements, assumptions and estimation uncertainties with significant risk of material adjustment to the carrying amount of asset and liabilities in the next year are described in the following notes:
- Property, plant and equipment and Intangible assets (notes 4.2 and 4.3)- Trade debts, advances and other receivables (note 4.5.2.1)- Derivative financial instruments (note 4.5.4 and 4.5.5)- Stores and spares (note 4.6)- Stock-in-trade (note 4.7)- Taxation (note 4.8)- Staff retirement benefits (note 4.9)- Impairment (note 4.13)- Provisions (note 4.14)- Contingent liabilities (note 4.15)
3 New or amendments / interpretations to existing standards, interpretation and forthcoming requirements
There are new and amended standards and interpretations that are mandatory for accounting periods beginning 01 July 2019 other than disclosed in note 4.1. These are considered not to be relevant or do not have any significant effect on the Company’s unconsolidated financial statements and are therefore not stated in these unconsolidated financial statements.
3.1 Standards, interpretations and amendments to published approved accounting standards that are not yet effective
The following International Financial Reporting Standards (IFRS Standards) as notified under the Companies Act, 2017 and the amendments and interpretations thereto will be effective for accounting periods beginning on or after 01 January 2020:
- Amendment to IFRS 3 ‘Business Combinations’ – Definition of a Business (effective for business combinations for which the acquisition date is on or after the beginning of annual period beginning on or after 1 January 2020). The IASB has issued amendments aiming to resolve the difficulties that arise when an entity determines whether it has acquired a business or a group of assets. The amendments clarify that to be considered a business, an acquired set of activities and assets must include, at a minimum, an input and a substantive process that together significantly contribute to the ability to create outputs. The amendments include an election to use a concentration test. The standard is effective for transactions in the future and therefore would not have an impact on past financial statements.

139Annual Report 2020
- Amendments to IAS 1 Presentation of Financial Statements and IAS 8 Accounting Policies, Changes in Accounting Estimates and Errors (effective for annual periods beginning on or after 1 January 2020). The amendments are intended to make the definition of material in IAS 1 easier to understand and are not intended to alter the underlying concept of materiality in IFRS Standards. In addition, the IASB has also issued guidance on how to make materiality judgments when preparing their general purpose financial statements in accordance with IFRS Standards.
- On 29 March 2018, the International Accounting Standards Board (the IASB) has issued a revised Conceptual Framework for Financial Reporting which is applicable immediately contains changes that will set a new direction for IFRS in the future. The Conceptual Framework primarily serves as a tool for the IASB to develop standards and to assist the IFRS Interpretations Committee in interpreting them. It does not override the requirements of individual IFRSs and any inconsistencies with the revised Framework will be subject to the usual due process – this means that the overall impact on standard setting may take some time to crystallise. The companies may use the Framework as a reference for selecting their accounting policies in the absence of specific IFRS requirements. In these cases, companies should review those policies and apply the new guidance retrospectively as of 1 January 2020, unless the new guidance contains specific scope outs.
- Interest Rate Benchmark Reform which amended IFRS 9, IAS 39 and IFRS 7 is applicable for annual financial periods beginning on or after 1 January 2020. The G20 asked the Financial Stability Board (FSB) to undertake a fundamental review of major interest rate benchmarks. Following the review, the FSB published a report setting out its recommended reforms of some major interest rate benchmarks such as IBORs. Public authorities in many jurisdictions have since taken steps to implement those recommendations. This has in turn led to uncertainty about the long-term viability of some interest rate benchmarks. In these amendments, the term ‘interest rate benchmark reform’ refers to the market-wide reform of an interest rate benchmark including its replacement with an alternative benchmark rate, such as that resulting from the FSB’s recommendations set out in its July 2014 report ‘Reforming Major Interest Rate Benchmarks’ (the reform). The amendments made provide relief from the potential effects of the uncertainty caused by the reform. A company shall apply the exceptions to all hedging relationships directly affected by interest rate benchmark reform. The amendments are not likely to affect the financial statements of the Company.
- Classification of liabilities as current or non-current (Amendments to IAS 1) effective for the annual period beginning on or after 1 January 2022. These amendments in the standards have been added to further clarify when a liability is classified as current. The standard also amends the aspect of classification of liability as non-current by requiring the assessment of the entity’s right at the end of the reporting period to defer the settlement of liability for at least twelve months after the reporting period. An entity shall apply those amendments retrospectively in accordance with IAS 8.
- Onerous Contracts - Cost of Fulfilling a Contract (Amendments to IAS 37) effective tor the annual period beginning on or after 1 January 2022 amends IAS 1 by mainly adding paragraphs which clarifies what comprise the cost of fulfilling a contract, Cost of fulfilling a contract is relevant when determining whether a contract is onerous. An entity is required to apply the amendments to contracts for which it has not yet fulfilled all its obligations at the beginning of the annual reporting period in which it first applies the amendments (the date of initial application). Restatement of comparative information is not required, instead the amendments require an entity to recognise the cumulative effect of initially applying the amendments as an adjustment to the opening balance of retained earnings or other component of equity, as appropriate, at the date of initial application.

140 International Industries Limited
- Property, Plant and Equipment: Proceeds before Intended Use (Amendments to IAS 16) effective for the annual period beginning on or after 1 January 2022. Clarifies that sales proceeds and cost of items produced while bringing an item of property, plant and equipment to the location and condition necessary for it to be capable of operating in the manner intended by management e.g. when testing etc., are recognised in profit or loss in accordance with applicable Standards. The entity measures the cost of those items applying the measurement requirements of IAS 2. The standard also removes the requirement of deducting the net sales proceeds from cost of testing. An entity shall apply those amendments retrospectively, but only to items of property, plant and equipment that are brought to the location and condition necessary for them to be capable of operating in the manner intended by management on or after the beginning of the earliest period presented in the financial statements in which the entity first applies the amendments. The entity shall recognise the cumulative effect of initially applying the amendments as an adjustment to the opening balance of retained earnings (or other component of equity, as appropriate) at the beginning of that earliest period presented.
3.2 Annual Improvements to IFRS Standards 2018-2020 Cycle
The following annual improvements to IFRS standards 2018-2020 are effective for annual reporting periods beginning on or after 1 January 2022.
- IFRS 9- The amendment clarifies that an entity includes only fees paid or received between the entity {the borrower) and the lender, including fees paid or received by either the entity or the lender on the other's behalf, when it applies the '10 per cent' test in paragraph 83.3.6 of IFRS 9 in assessing whether to derecognise a financial liability.
- IFRS 16 - The amendment partially amends Illustrative Example 13 accompanying IFRS 16 by excluding the illustration of reimbursement of leasehold improvements by the lessor. The objective of the amendment is to resolve any potential confusion that might arise in lease incentives.
- IAS 41 - The amendment removes the requirement in paragraph 22 of IAS 41 for entities to exclude taxation cash flows when measuring the fair value of a biological asset using a present value technique.
The above improvements to standards are not likely to have material / significant impact on Company's financial statements.
4 SIGNIFICANT ACCOUNTING POLICIES
Except as described in 4.1, the significant accounting policies are consistently applied in the preparation of these financial statements are the same as those applied in earlier periods presented.
The significant judgements made by the management in applying the Company’s accounting policies and the key sources of estimation uncertainty were the same except for, during the year, the Company has revised the useful life of its certain plant and machinery, however the impact of such change is immaterial.
4.1 Changes in significant accounting policies
The Company has adopted IFRS 16 ‘Leases’ from 01 July 2019 which is effective from annual periods beginning on or after 01 January 2019 and the key changes to the Company’s accounting policies resulting from adoption of IFRS 16 are summarized below:
IFRS 16 ‘Leases’
IFRS 16 has introduced a single. on-balance sheet accounting model for lessees. As a result, the entity, as a lessee has recognised right-of-use asset representing its rights to use the underlined assets and lease liabilities representing its obligation to make lease payments.

141Annual Report 2020
The Company has applied IFRS 16 using the modified retrospective approach. Under this approach the cumulative effect of initial application has been recognised in retained earnings at 1 July 2019. Accordingly, the comparative information presented for 2019 has not been restated - i.e. it is presented, as previously reported, under IAS 17 and related interpretations. The details of the changes in accounting policies are disclosed below.
A contract is, or contains a lease if the contract conveys a right to control the use of an identified asset for a period of time in exchange for consideration. The entity mainly leases properties for its operations. The entity recognises a right-of-use asset and lease liability at the lease · commencement date. The right-of-use asset is initially measured at cost, and subsequently at cost less any accumulated depreciation and impairment losses if any, and adjusted for certain remeasurements of the lease liability. The right-of-use asset is depreciated using the straight line method over the shorter of the lease term and the asset’s useful life. The estimated useful lives of assets are determined on the same basis as that for owned assets. In addition. the right-of-use asset is periodically reduced by impairment losses, if any.
The lease liability is initially measured at the present value of the lease payments that are not paid at the commencement date. discounted using the interest rate implicit in the lease or. if that rate cannot be readily determined, the entity’s incremental borrowing rate. The lease liability is subsequently increased by the interest cost on the lease liability and decreased by lease payments made. It is re-measured when there is a change in future lease payments arising from a change in an index or rate, a change in assessment of whether extension option is reasonably certain to be exercised or a termination option is reasonably certain not to be exercised.
‘The lease payments associated with these leases are recognised as an expenses on a straight-line basis over the lease term. The right-of-use assets are presented as separate line item in the statement of financial position.
‘The Company did not have any property leases arrangement therefore adoption of IFRS 16 at 1 July 2019 did not have an effect on the unconsolidated financial statements of the Company.
4.2 Property, plant and equipment
4.2.1 Operating assets and depreciation
Initial Recognition
The cost of an item of property, plant and equipment is recognised as an asset if it is probable that future economic benefits associated with the item will flow to the entity and the cost of such item can be measured reliably.
Recognition of the cost in the carrying amount of an item of plant and equipment ceases when the item is in the location and condition necessary for it to be capable of operating in the manner intended by the management.
Measurement
Property, plant and equipment (except freehold and leasehold land and buildings) are stated at cost less accumulated depreciation and impairment losses, if any. Freehold and leasehold lands are stated at revalued amounts and buildings on freehold and leasehold lands are stated at revalued amounts less accumulated depreciation and impairment loss (if any). The value assigned to leasehold lands is not amortised as the respective leases are expected to be renewed for further periods on payment of relevant rentals. The costs of Property, plant and equipment include:
(a) its purchase price including import duties, non-refundable purchase taxes after deducting trade discounts and rebates; and
(b) any other costs directly attributable to bringing the asset to the location and condition necessary for it to be capable of operating in the manner intended by management.
(c) Borrowing costs, if any.

142 International Industries Limited
When parts of an item of property, plant and equipment have different useful lives, they are accounted for as separate items (major components) of property, plant and equipment.
Subsequent expenditure
Expenditure incurred to replace a significant component of an item of plant and equipment is capitalised and the asset so replaced is retired. Other subsequent expenditure is capitalised only when it is probable that future economic benefits associated with the item will flow to the Company and the cost of the items can be measured reliably. All other expenditure (including repairs and normal maintenance) is recognised in the statement of profit or loss account as an expense when it is incurred.
Depreciation
Depreciation on all items except for land is charged on straight line method at the rates specified in respective note to the unconsolidated financial statements and is generally recognised in statement of profit or loss account.
Depreciation on addition is charged from the month the asset is available for use up to the month prior to disposal.
Depreciation methods, useful lives and residual values of each part of property, plant and equipment that is significant in relation to the total cost of the asset are reviewed, and adjusted if appropriate, at each balance sheet date.
Revaluation surplus
Revaluation of land and building is carried out with sufficient regularity to ensure that the carrying amount of assets does not differ materially from the fair value. Any revaluation increase in the carrying amount of land and building is recognised, net of tax, in other comprehensive income and presented as a separate component of equity as “ Revaluation surplus on property, plant and equipment “ except to the extent that it reverses a revaluation decrease / deficit for the same asset previously recognised in statement of profit or loss account, in which case the increase is first recognised in statement of profit or loss account to the extent of the decrease previously charged. Any decreases that reverse previous increases of the same asset are first recognised in other comprehensive income to the extent of the remaining surplus attributable to the asset, all other decreases are charged to statement of profit or loss account. The revaluation reserve is not available for distribution to the Company’s shareholders. Each year, the difference between depreciation based on the revalued carrying amount of the asset charged to statement of profit or loss account and depreciation based on the asset’s original cost, net of tax, is reclassified from revaluation surplus to retained earnings.
Gains and losses on disposal
Gains and losses on disposal of assets are taken to the statement of profit or loss account, and the related revaluation surplus on property, plant and equipment, if any, is transferred directly to retained earnings.
4.2.2 Capital work-in-progress
Capital work-in-progress is stated at cost less impairment loss, if any and consists of expenditure incurred (including any borrowing cost, if applicable) and advances made in the course of their construction and installation. Transfers are made to relevant asset category as and when assets are available for intended use.
4.3 Intangible assets
An intangible asset is recognised as an asset if it is probable that future economic benefits attributable to the asset will flow to the entity and the cost of such asset can be measured reliably.

143Annual Report 2020
Costs directly associated with identifiable software that will have probable economic benefits exceeding, beyond one year, are recognised as an intangible asset.
Indefinite Intangible
These are stated at cost less impairment, if any.
Definite Intangible
a) These are stated at cost less accumulated amortisation and impairment, if any.
b) Intangible assets are amortised on straight line basis over its estimated useful life(s) (refer note 6).
c) Amortisation on additions during the financial year is charged from month in which the asset is intended to use, whereas no amortisation is charged from the month the asset is disposed-off.
4.4 Investments
Investments in subsidiaries
Investments in subsidiaries are initially recognised and carried at cost. The carrying amount of investments is reviewed at each reporting date to determine whether there is any indication of impairment. If any such indication exists the investment’s recoverable amount is estimated which is the higher of its value in use and its fair value less cost to sell. An impairment loss is recognised if the carrying amount exceeds its recoverable amount. Impairment losses are recognised in statement of profit or loss account. An impairment loss is reversed if there has been a change in estimates used to determine the recoverable amount but limited to the extent of initial cost of investments. A reversal of impairment loss is recognised in the statement of profit or loss.
Investments in associates
Investments in associates are initially recognised and carried at cost. The carrying amount of investments is reviewed at each reporting date to determine whether there is any indication of impairment. If any such indication exists the investment’s recoverable amount is estimated which is higher of its value in use and its fair value less cost to sell. An impairment loss is recognised if the carrying amount exceeds its recoverable amount.
Impairment losses are recognised in statement of profit or loss account. An impairment loss is reversed if there has been a change in estimates used to determine the recoverable amount but limited to the extent of initial cost of investments. A reversal of impairment loss is recognised in the statement of profit or loss.
4.5 Financial Instruments
4.5.1 Initial measurement of financial asset
The Company classifies its financial assets into following three categories:
- fair value through other comprehensive income (FVOCI);- fair value through profit or loss (FVTPL); and- measured at amortised cost. A financial asset is initially measured at fair value plus, for an item not at FVTPL, transaction costs that are directly attributable to its acquisition.

144 International Industries Limited
Subsequent measurement
Debt Investments at FVOCI These assets are subsequently measured at fair value. Interest / markup income calculated using the effective interest method, foreign exchange gains and losses and impairment are recognised in the statement of profit or loss account. Other net gains and losses are recognised in other comprehensive income. On de-recognition, gains and losses accumulated in other comprehensive income are reclassified to the statement of profit or loss.
Equity Investments at FVOCI These assets are subsequently measured at fair value. Dividends are recognised as income in the statement of profit or loss account unless the dividend clearly represents a recovery of part of the cost of the investment. Other net gains and losses are recognised in other comprehensive income and are never reclassified to the statement of profit or loss.
Financial assets at FVTPL These assets are subsequently measured at fair value. Net gains and losses, including any interest / markup or dividend income, are recognised in the statement of profit or loss.
Financial assets measured atamortised cost
These assets are subsequently measured at amortised cost using the effective interest method. The amortised cost is reduced by impairment losses. Interest / markup income, foreign exchange gains and losses and impairment are recognised in the statement of profit or loss.
4.5.2 Non-derivative financial assets
All non-derivative financial assets are initially recognised on trade date i.e. date on which the Company becomes party to the respective contractual provisions. Non-derivative financial assets comprise loans and receivables that are financial assets with fixed or determinable payments that are not quoted in active markets and includes trade debts, advances, other receivables and cash and cash equivalent. The Company derecognises the financial assets when the contractual rights to the cash flows from the asset expires or it transfers the rights to receive the contractual cash flows in a transaction in which substantially all of the risk and rewards of ownership of the financial assets are transferred or it neither transfers nor retain substantially all of the risks and rewards of ownership and does not retain control over the transferred asset.
4.5.2.1 Trade debts, advances and other receivables
These are classified at amortised cost and are initially recognised when they are originated and measured at fair value of consideration receivable. These assets are written off when there is no reasonable expectation of recovery. Actual credit loss experience over past years is used to base the calculation of expected credit loss.
4.5.2.2 Cash and cash equivalents
For the purpose of presentation in statement of cash flow, cash and cash equivalents includes cash in hand, balances with banks and investments with maturities of less than three months or less from acquisition date that are subject to insignificant risk of changes in fair value and short term borrowings availed by the Company, which are repayable on demand and form an integral part of the Company’s cash management.

145Annual Report 2020
4.5.3 Financial liabilities
Financial liabilities are initially recognised on trade date i.e. date on which the Company becomes party to the respective contractual provisions. Financial liabilities include mark-up bearing borrowings and trade and other payables. The Company derecognises the financial liabilities when contractual obligations are discharged or cancelled or expire. Financial liability other than at fair value through profit or loss are initially measured at fair value less any directly attributable transaction cost. Subsequent to initial recognition, these liabilities are measured at amortised cost using effective interest rate method.
4.5.3.1 Mark-up bearing borrowings and borrowing costs
Mark-up bearing borrowings are recognised initially at fair value, less attributable transaction costs. Subsequent to initial recognition, mark-up bearing borrowings are stated at amortised cost, while the difference between the cost (reduced for periodic payments) and redemption value is recognised in the statement of profit or loss account over the period of the borrowings using the effective interest method.
Borrowing costs that are directly attributable to the acquisition, construction or production of a qualifying asset are capitalised as part of the cost of the relevant asset.
4.5.3.2 Trade and other payables
Trade and other payables are recognised initially at fair value plus directly attributable costs, if any, and subsequently measured at amortised costs.
4.5.4 Derivative financial instruments - other than hedging
Derivatives that do not qualify for hedge accounting are recognised in the statement of financial position at estimated fair value with corresponding effect to statement of profit or loss account. Derivative financial instruments are carried as assets when fair value is positive and liabilities when fair value is negative.
4.5.5 Derivative financial instruments - cash flow hedges
When a derivative is designated as a cash flow hedging instrument, the effective portion of changes in fair value of the derivative is recognised in other comprehensive income and accumulated in hedging reserve. Any ineffective portion of changes in fair value of derivative is recognised immediately in the statement of profit or loss account. The amount accumulated in equity is removed therefrom and included in the initial carrying amount of non-financial asset upon recognition of non-financial asset.
The fair value of forward exchange contracts is estimated using appropriate valuation techniques. These are carried as assets when the fair value is positive and liabilities when the fair value is negative.
4.5.6 Offsetting of financial assets and financial liabilities
Financial assets and financial liabilities are offset and the net amount is reported in the unconsolidated financial statements only when the Company has currently legally enforceable right to set-off the recognised amounts and the Company intends either to settle on a net basis or to realise the assets and to settle the liabilities simultaneously. The legally enforceable right must not be contingent on future events and must be enforceable in normal course of business and in the event of default, insolvency or winding up of the Company or the counter parties.

146 International Industries Limited
4.6 Stores and spares
Stores and spares are stated at lower of weighted average cost and net realizable value, less provision for impairment if any. Items in transit are valued at cost comprising invoice value plus other charges incurred thereon.
Provision is made for obsolete and slow moving spares older than one year and is recognised in the statement of profit loss.
4.7 Stock-in-trade
These are valued at lower of cost and net realizable value. Cost is determined under the weighted average basis. Cost comprises all costs of purchase, conversion and other costs incurred in bringing the inventories to their present location and condition. Net realizable value signifies the estimated selling price in the ordinary course of the business less net estimated cost of completion and selling expenses. Scrap and by-product is valued at estimated realizable value.
4.8 Taxation
Income tax expense comprises current and deferred tax. Income tax expense is recognised in the statement of profit or loss account, except to the extent that it relates to items recognised directly in equity or in other comprehensive income, in which case it is recognised in equity or in other comprehensive income respectively. In making the estimates for income taxes currently payable by the Company, the management considers the current income tax law and the decisions of appellate authorities on certain issues in the past.
Current
Current tax is the expected tax payable or receivable on the taxable income or loss for the year, using tax rates enacted or substantively enacted at the reporting date, and any adjustment to tax payable or receivable in respect of previous years.
Provisions for current taxation is based on taxability of certain income streams of the Company under presumptive / final tax regime at the applicable tax rates and remaining income streams chargeable at current rate of taxation under the normal tax regime and / or minimum tax liability or alternate corporate tax as applicable, after taking into account tax credits and tax rebates available, if any.
Deferred tax
Deferred tax is recognised using balance sheet liability method, providing for temporary difference between the carrying amounts of assets and liabilities for financial reporting purposes and the amounts used for taxation purposes. The amount of deferred tax provided is based on the expected manner of realisation or settlement of the carrying amount of assets and liabilities, using the tax rates enacted or substantively enacted at the balance sheet date.
The Company recognises a deferred tax asset to the extent that it is probable that taxable profits for the foreseeable future will be available against which the assets can be utilised. Deferred tax assets are reduced to the extent that it is no longer probable that the related tax benefit will be realised.
4.9 Staff retirement benefits
4.9.1 Defined benefit plan
The Company provides gratuity benefits to all its permanent employees who have completed their minimum qualifying period of service i.e. three year (except in case of workers where minimum qualifying period of service is six months). For executives and officers having total service of over twenty years, the benefit is available at one month’s basic salary (eligible salary) for each completed year of service. For executives and officers having total service of less than twenty years, the benefit is available at half month’s basic salary (eligible salary) for each completed year of service. For workers, the benefit is available at one month’s gross salary less conditional allowances (eligible salary) for each completed year of service. The Company’s obligation is determined through actuarial valuations carried out under the ‘Projected Unit Credit Method’. Remeasurements which comprise actuarial gains and losses and the return on plan assets (excluding interest) are recognised immediately in other comprehensive income. The Company determines the net interest expense (income) on the net defined benefit liability (asset) for the period by applying the discount rate used to measure the defined benefit obligation at the beginning of the annual period to the then-net defined benefit liability (asset), taking into account any changes in the net defined benefit liability (asset) during the period as a result of contribution and benefit

147Annual Report 2020
. Net interest expense and current service cost are recognised in statement of profit or loss account. The latest actuarial valuation was conducted at the reporting date by a qualified professional firm of actuaries.
4.9.2 Defined contribution plan
The Company provides provident fund benefits to all its officers. Equal contributions are made, both by the Company and the employees, at the rate of 8.33% of basic salary and cost of living allowance and the same is charged to the statement of profit or loss.
4.9.3 Compensated absences
The liability for accumulated compensated absences of employees is recognised in the period in which employees render service that increases their entitlement to future compensated absences.
4.10 Foreign currency translation
Transactions in foreign currencies are translated into Pak Rupees at the rates of exchange approximating those prevailing on the date of transactions. Monetary assets and liabilities in foreign currencies are translated into Pak Rupees at the rates of exchange ruling on the reporting date. Exchange differences are included in the statement of profit or loss currently.
4.11 Revenue recognition
- Domestic sales are recognised as revenue when invoiced with the transfer of control of goods , which coincides with delivery.
- Export sales are recognised as revenue when invoiced with the transfer of control of goods, which coincides either with the date of bill of lading or upon delivery to customer or its representative, based on terms of arrangement.
- Revenue from power generation plant on account of sales of surplus electricity is recognised on transmission of electricity to K-Electric Limited.
- Toll manufacturing / Partial manufacturing income is recognised when related services are rendered.
- Dividend income is recognised when the right to receive payment is established.
- Gains / losses arising on sale of investments are included in the statement of profit or loss in the period in which they arise.
- Service income is recognised when related services are rendered.
- Rental income is recognised on straight line basis over the term of the respective lease agreement.
4.12 Income on bank deposits and finance cost
The Company’s finance income and finance cost includes interest income and interest expense. Interest income or expense is recognised using the effective interest method.
4.13 Impairment
4.13.1 Financial assets
The Company recognises loss allowances for Expected Credit Losses (ECLs) in respect of financial assets measured at amortised cost.
The Company measures loss allowances at an amount equal to lifetime ECLs, except for the following, which are measured at 12-month ECLs:
- debt securities that are determined to have low credit risk at the reporting date; and

148 International Industries Limited
- other debt securities and bank balance for which credit risk (i.e. the risk of default occurring over the expected life of the financial instrument) has not increased significantly since initial recognition.
Loss allowances for trade receivables are always measured at an amount equal to lifetime ECLs.
When determining whether the credit risk of a financial asset has increased significantly since initial recognition and when estimating ECLs, the Company considers reasonable and supportable information that is relevant and available without undue cost or effort. This includes both quantitative and qualitative information and analysis, based on the Company’s historical experience and informed credit assessment and including forward-looking information.The Company assumes that the credit risk on a financial asset has increased significantly if it is more than past due for a reasonable period of time. Lifetime ECLs are the ECLs that result from all possible default events over the expected life of a financial instrument. 12-month ECLs are the portion of ECLs that result from default events that are possible within the 12 months after the reporting date (or a shorter period if the expected life of the instrument is less than 12 months). The maximum period considered when estimating ECLs is the maximum contractual period over which the Company is exposed to credit risk.
Loss allowances for financial assets measured at amortised cost are deducted from the Gross carrying amount of the assets.
The gross carrying amount of a financial asset is written off when the Company has no reasonable expectations of recovering of a financial asset in its entirety or a portion thereof. The Company individually makes an assessment with respect to the timing and amount of write-off based on whether there is a reasonable expectation of recovery. The Company expects no significant recovery from the amount written off. However, financial assets that are written off could still be subject to enforcement activities in order to comply with the Company’s procedures for recovery of amounts due.
The adoption of the expected loss approach has not resulted in any material change in impairment provision for any financial asset.
4.13.2 Non-financial assets
The carrying amounts of the Company’s non-financial assets, other than deferred tax assets and inventories are reviewed at each balance sheet date to determine whether there is any indication of impairment. If such indication exists, the asset’s recoverable amount, being higher of value in use and fair value less costs to sell, is estimated. In assessing value in use, the estimated future cash flows are discounted to their present value using a pre-tax discount rate that reflects current market assessments of the time value of money and the risks specific to the asset. For the purpose of impairment testing, assets that cannot be tested individually are grouped together into the smallest group of assets that generates cash inflows from continuing use that are largely independent of the cash inflows of other assets or groups of assets. An impairment loss is recognised whenever the carrying amount of an asset exceeds its recoverable amount. Impairment losses are recognised in the statement of profit or loss.
4.14 Provisions
A provision is recognised in the statement of financial position when the Company has a legal or constructive obligation as a result of a past event, and it is probable that an outflow of economic benefits will be required to settle the obligation and a reliable estimate can be made of the amount of obligation. Provisions are measured at the present value of expected expenditure, discounted at a pre-tax rate reflects current market assessment of the time value of money and the risk specific to the obligation. However, provisions are reviewed at each reporting date and adjusted to reflect current best estimate.
4.15 Contingent liabilities
A contingent liability is disclosed when the Company has a possible obligation as a result of past events, whose existence will be confirmed only by the occurrence or non-occurrence, of one or more uncertain future events not wholly within the control of the Company; or the Company has a present legal or constructive obligation that arises from past events, but it is not probable that an outflow of resources embodying economic benefits will be required to settle the obligation, or the amount of the obligation cannot be measured with sufficient reliability.

149Annual Report 2020
4.16 Segment reporting
Operating segments are reported in a manner consistent with the internal reporting structure. The management monitors the operating results of its products (i.e. Steel and Plastic Pipes) separately for the purposes of making decisions regarding resource allocation and performance assessment. Further, due to significant returns from its investment in 56.33% owned subsidiary and an associated company, the management now monitors returns from its strategic investments separately. Accordingly, Investments has also been identified as a reportable segment.
The Company does not consider sale of electricity to KE as separate reportable segment as the power plant of the Company is installed primarily to supply power to its production facilities and currently any excess electricity is sold to KE.
4.17 Dividend and appropriation to / from reserves
Dividend distribution to the Company’s shareholders and appropriations to / from reserves are recognised in the period in which these are approved.
4.18 Government grants
'Government grants are transfers of resources to an entity by a government entity in return for compliance with certain past or future conditions related to the entity's operating activities - e.g. a government subsidy. The definition of "government" refers to governments, government agencies and similar bodies, whether local, national or international.
The Company recognises government grants when there is reasonable assurance that grants will be received and the Company will be able to comply with conditions associated with grants.
Government grants are recognised at fair value, as deferred income, when there is reasonable assurance that the grants will be received and the Company will be able to comply with the conditions associated with the grants.
Grants that compensate the Company for expenses incurred, are recognised on a systematic basis in the income for the year in which the related expenses are recognised. Grants that compensate for the cost of an asset are recognised in income on a systematic basis over the expected useful life of the related asset.
A loan is initially recognised and subsequently measured in accordance with IFRS 9. IFRS 9 requires loans at below- market rates to be initially measured at their fair value - e.g. the present value of the expected future cash flows discounted at a market-related interest rate. The benefit that is the government grant is measured as the difference between the fair value of the loan on initial recognition and the amount received, which is accounted for according to the nature of the grant.
5. PROPERTY, PLANT AND EQUIPMENT Note 2020 2019 --------- Rupees in ‘000 ---------
Operating assets 5.1 7,052,984 7,309,783 Capital work-in-progress (CWIP) 5.5 4,161 19,749 Stores and spares held for capital expenditures - at cost 24,240 30,953
7,081,385 7,360,485
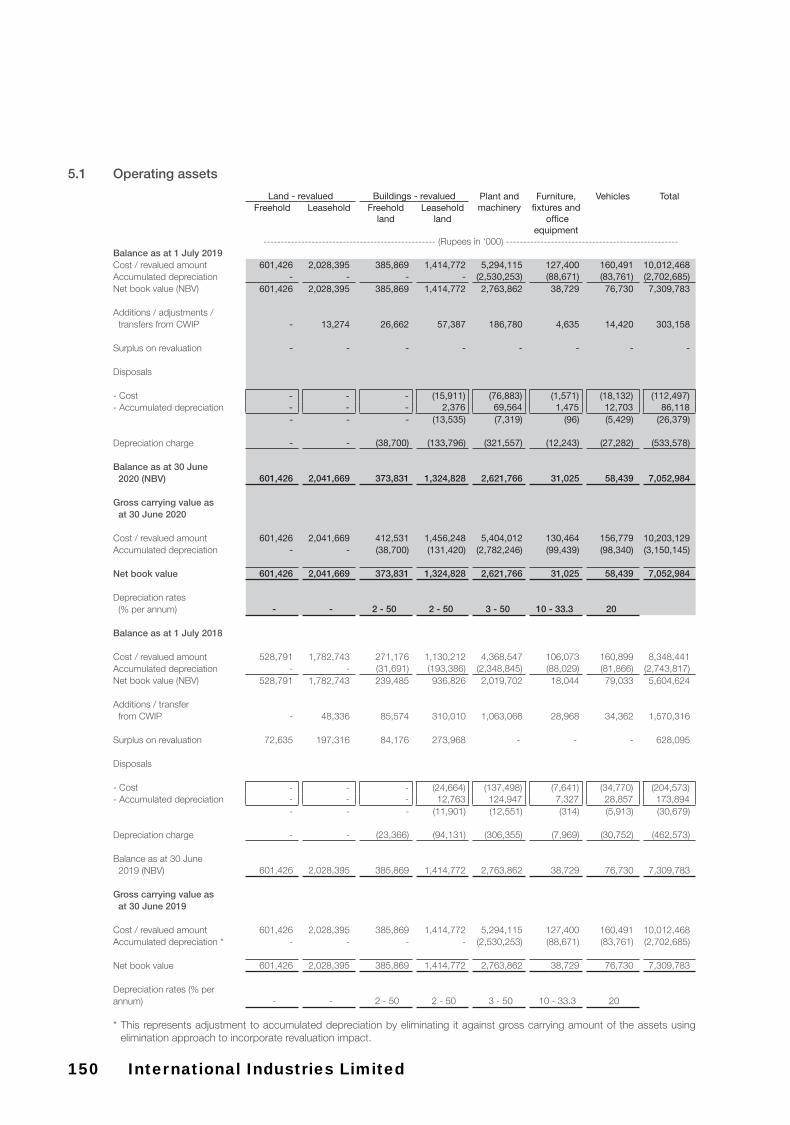
150 International Industries Limited
5.1 Operating assets
Land - revalued Buildings - revalued Plant and Furniture, Vehicles TotalFreehold Leasehold Freehold Leasehold machinery fixtures and
land land officeequipment
-------------------------------------------------- (Rupees in ‘000) --------------------------------------------------Balance as at 1 July 2019Cost / revalued amount 601,426 2,028,395 385,869 1,414,772 5,294,115 127,400 160,491 10,012,468 Accumulated depreciation - - - - (2,530,253) (88,671) (83,761) (2,702,685)Net book value (NBV) 601,426 2,028,395 385,869 1,414,772 2,763,862 38,729 76,730 7,309,783
Additions / adjustments / transfers from CWIP - 13,274 26,662 57,387 186,780 4,635 14,420 303,158
Surplus on revaluation - - - - - - - -
Disposals
- Cost - - - (15,911) (76,883) (1,571) (18,132) (112,497)- Accumulated depreciation - - - 2,376 69,564 1,475 12,703 86,118
- - - (13,535) (7,319) (96) (5,429) (26,379)
Depreciation charge - - (38,700) (133,796) (321,557) (12,243) (27,282) (533,578)
Balance as at 30 June 2020 (NBV) 601,426 2,041,669 373,831 1,324,828 2,621,766 31,025 58,439 7,052,984
Gross carrying value as at 30 June 2020
Cost / revalued amount 601,426 2,041,669 412,531 1,456,248 5,404,012 130,464 156,779 10,203,129Accumulated depreciation - - (38,700) (131,420) (2,782,246) (99,439) (98,340) (3,150,145)
Net book value 601,426 2,041,669 373,831 1,324,828 2,621,766 31,025 58,439 7,052,984
Depreciation rates (% per annum) - - 2 - 50 2 - 50 3 - 50 10 - 33.3 20
Balance as at 1 July 2018
Cost / revalued amount 528,791 1,782,743 271,176 1,130,212 4,368,547 106,073 160,899 8,348,441 Accumulated depreciation - - (31,691) (193,386) (2,348,845) (88,029) (81,866) (2,743,817)Net book value (NBV) 528,791 1,782,743 239,485 936,826 2,019,702 18,044 79,033 5,604,624
Additions / transfer from CWIP - 48,336 85,574 310,010 1,063,066 28,968 34,362 1,570,316
Surplus on revaluation 72,635 197,316 84,176 273,968 - - - 628,095
Disposals
- Cost - - - (24,664) (137,498) (7,641) (34,770) (204,573)- Accumulated depreciation - - - 12,763 124,947 7,327 28,857 173,894
- - - (11,901) (12,551) (314) (5,913) (30,679)
Depreciation charge - - (23,366) (94,131) (306,355) (7,969) (30,752) (462,573)
Balance as at 30 June 2019 (NBV) 601,426 2,028,395 385,869 1,414,772 2,763,862 38,729 76,730 7,309,783
Gross carrying value as at 30 June 2019
Cost / revalued amount 601,426 2,028,395 385,869 1,414,772 5,294,115 127,400 160,491 10,012,468 Accumulated depreciation * - - - - (2,530,253) (88,671) (83,761) (2,702,685)
Net book value 601,426 2,028,395 385,869 1,414,772 2,763,862 38,729 76,730 7,309,783
Depreciation rates (% perannum) - - 2 - 50 2 - 50 3 - 50 10 - 33.3 20
* This represents adjustment to accumulated depreciation by eliminating it against gross carrying amount of the assets using elimination approach to incorporate revaluation impact.

151Annual Report 2020
5.2 The depreciation charge for the year has been allocated as follows:
Note 2020 2019 --------- Rupees in ‘000 ---------
Cost of sales 23 492,651 428,041 Selling and distribution expenses 24 13,765 14,945 Administrative expenses 25 15,348 10,703 Power Generation 28.1 11,814 8,884
533,578 462,573
Particulars of immovable property (i.e. land and building) in the name of the Company and related Forced Sales Value are as follows:
Area of Land (acres)
Covered Area (Sq Ft)Particulars Location
Leasehold Land and Building (Manufacturing Plant) Plot no.LX15-16, HX-7/4 Landhi Industrial Estate Karachi 25.59 791,614
Leasehold Land and Building (Manufacturing Plant) 22 KM Sheikhupura Road, Mouza Khanpur Nabipur 31.45 370,664 Tehsil Ferozpur District Sheikhupura.
Freehold Land and Building (Manufacturing Plant) Survey Nos.402,405-406, Deh Sharabi, Landhi 10 220,480 Town, City District Government, Karachi
Leasehold Building (Office Premises) Office No.101-105, 1st Floor, Beaumont Plaza, Not applicable 13,676 10 Beaumont Road, Karachi
Leasehold Building (Sales Office Premises) Chinoy House, 2nd and 3rd Floor Off Thornton Not applicable 4,906 Road, Hadbast Mouza Khas District Lahore
Freehold Land and Building (Sales Godown) Plot bearing No.NEIR-61 Khasra No.3303 - 3308, 0.17 6,295 Hadbast Mouza Naulakha GT Road Lahore
Freehold Land and Building (Sales Godown) Plot bearing No.47, Khasra Nos.298/1, 2978/1 0.18 6,215 Ghoray Shah Road, Hadbast Mouza Khoi MeranDistrict Lahore
67.39 1,413,850
5.3 The revaluation of freehold land, leasehold land and buildings thereon was carried out as of 30 June 2019 by MYK Associates (Private) Limited (an independent valuer who is located in Karachi) on the basis of their professional assessment of present market values based on enquiries made about the cost of land of similar nature, size and location including consideration of current cost of acquisition or construction, net of diminution owing to depreciation, keeping in view the current condition. The revaluation resulted in a surplus amounting to Rs.628 million which was incorporated in the books of the Company as at 30 June 2019.
The Company commissioned independent valuation of freehold land, leasehold land and buildings thereon during the years / periods ended 30 June 1988, 30 June 1997, 30 June 2000, 30 June 2004, 31 December 2007, 30 June 2013, 30 June 2016 & 30 June 2019.
The carrying amount of the aforementioned assets as at 30 June 2020, if the said assets had been carried at historical cost, would have been as follows:
Cost Accumulated Net bookdepreciation value
---------------- (Rupees in '000) ----------------
Freehold land 141,962 - 141,962Leasehold land 724,456 - 724,456Buildings 1,397,495 (489,089) 908,406As at 30 June 2020 2,263,913 (489,089) 1,774,824
As at 30 June 2019 2,182,501 (418,349) 1,764,152
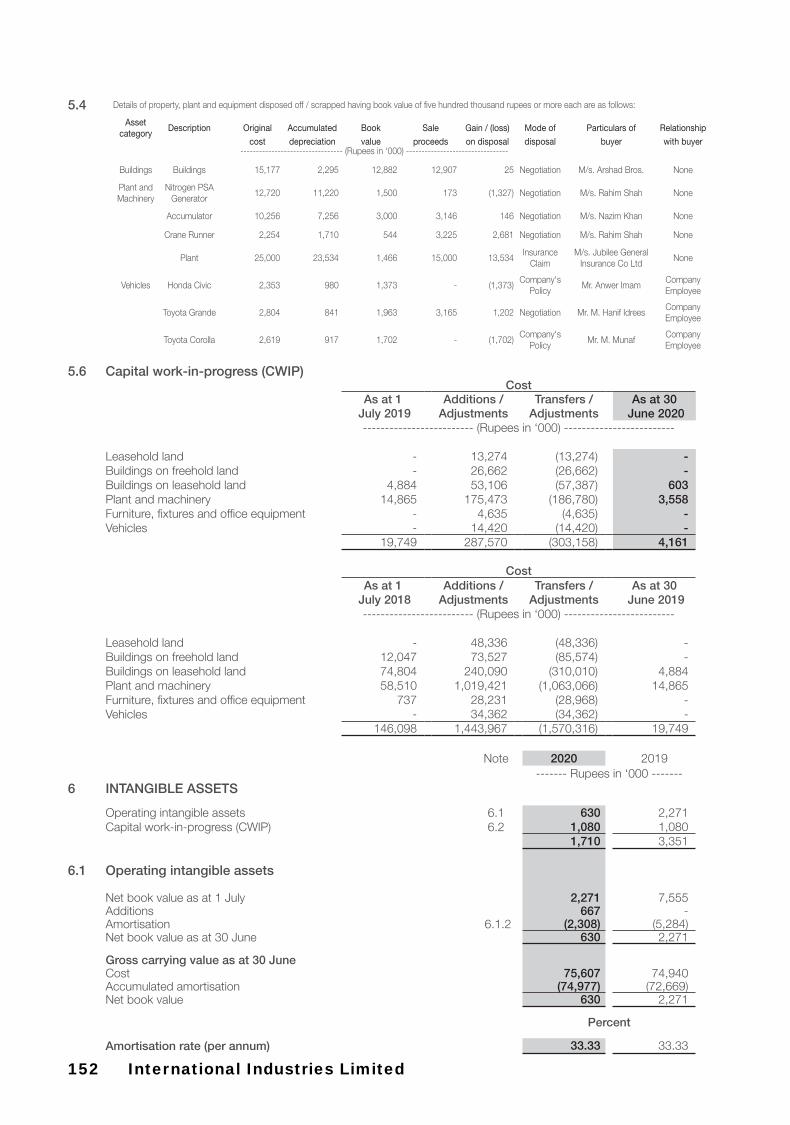
152 International Industries Limited
5.4 Details of property, plant and equipment disposed off / scrapped having book value of five hundred thousand rupees or more each are as follows:
Asset category
Description Original Accumulated Book Sale Gain / (loss) Mode of Particulars of Relationship
cost depreciation value proceeds on disposal disposal buyer with buyer--------------------------------- (Rupees in ‘000) ---------------------------------
Buildings Buildings 15,177 2,295 12,882 12,907 25 Negotiation M/s. Arshad Bros. None
Plant and Machinery
Nitrogen PSA Generator
12,720 11,220 1,500 173 (1,327) Negotiation M/s. Rahim Shah None
Accumulator 10,256 7,256 3,000 3,146 146 Negotiation M/s. Nazim Khan None
Crane Runner 2,254 1,710 544 3,225 2,681 Negotiation M/s. Rahim Shah None
Plant 25,000 23,534 1,466 15,000 13,534 Insurance
ClaimM/s. Jubilee General
Insurance Co LtdNone
Vehicles Honda Civic 2,353 980 1,373 - (1,373)Company's
PolicyMr. Anwer Imam
Company Employee
Toyota Grande 2,804 841 1,963 3,165 1,202 Negotiation Mr. M. Hanif IdreesCompany Employee
Toyota Corolla 2,619 917 1,702 - (1,702)Company's
PolicyMr. M. Munaf
Company Employee
5.6 Capital work-in-progress (CWIP)Cost
As at 1 Additions / Transfers / As at 30 July 2019 Adjustments Adjustments June 2020
------------------------- (Rupees in ‘000) -------------------------
Leasehold land - 13,274 (13,274) - Buildings on freehold land - 26,662 (26,662) - Buildings on leasehold land 4,884 53,106 (57,387) 603 Plant and machinery 14,865 175,473 (186,780) 3,558 Furniture, fixtures and office equipment - 4,635 (4,635) - Vehicles - 14,420 (14,420) -
19,749 287,570 (303,158) 4,161
CostAs at 1 Additions / Transfers / As at 30
July 2018 Adjustments Adjustments June 2019------------------------- (Rupees in ‘000) -------------------------
Leasehold land - 48,336 (48,336) - Buildings on freehold land 12,047 73,527 (85,574) - Buildings on leasehold land 74,804 240,090 (310,010) 4,884 Plant and machinery 58,510 1,019,421 (1,063,066) 14,865 Furniture, fixtures and office equipment 737 28,231 (28,968) - Vehicles - 34,362 (34,362) -
146,098 1,443,967 (1,570,316) 19,749
Note 2020 2019------- Rupees in ‘000 -------
6 INTANGIBLE ASSETS
Operating intangible assets 6.1 630 2,271Capital work-in-progress (CWIP) 6.2 1,080 1,080
1,710 3,351
6.1 Operating intangible assets
Net book value as at 1 July 2,271 7,555Additions 667 - Amortisation 6.1.2 (2,308) (5,284)Net book value as at 30 June 630 2,271
Gross carrying value as at 30 JuneCost 75,607 74,940Accumulated amortisation (74,977) (72,669)Net book value 630 2,271
Percent
Amortisation rate (per annum) 33.33 33.33
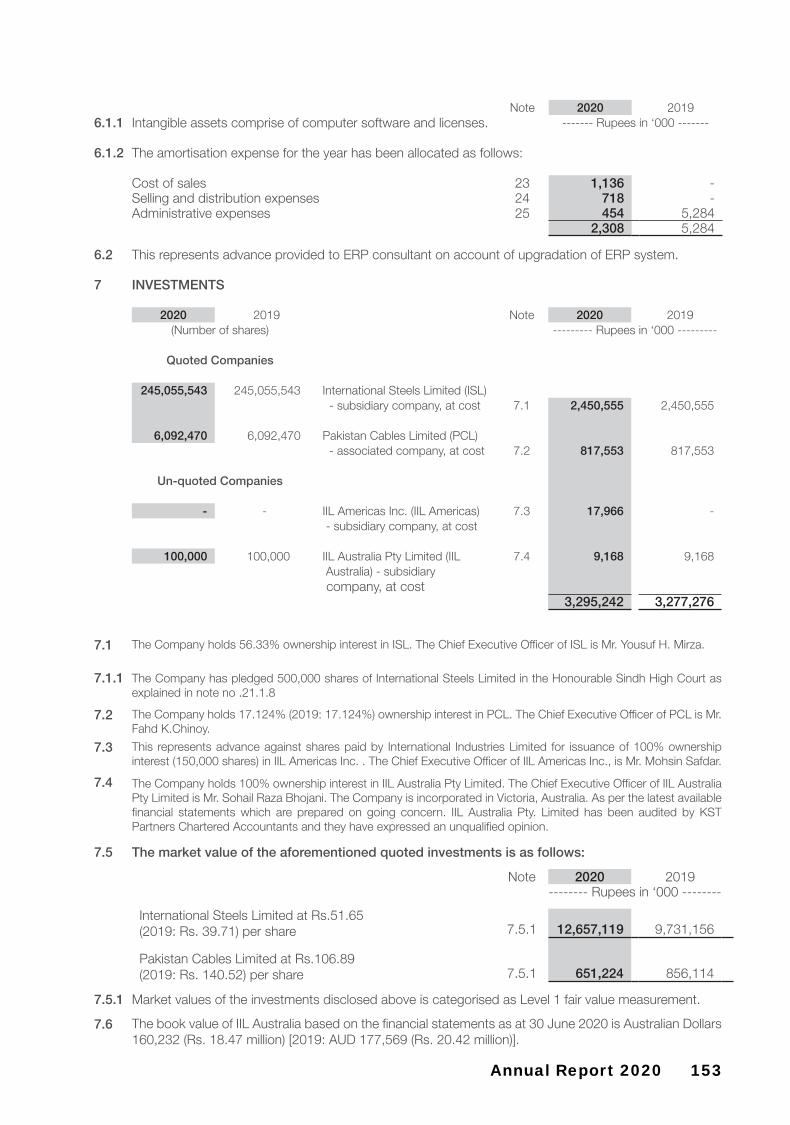
153Annual Report 2020
6.1.1 Intangible assets comprise of computer software and licenses.
6.1.2 The amortisation expense for the year has been allocated as follows:
Cost of sales 23 1,136 - Selling and distribution expenses 24 718 - Administrative expenses 25 454 5,284
2,308 5,284
Note 2020 2019------- Rupees in ‘000 -------
6.2 This represents advance provided to ERP consultant on account of upgradation of ERP system.
7 INVESTMENTS
2020 2019 Note 2020 2019(Number of shares) --------- Rupees in ‘000 ---------
Quoted Companies
245,055,543 245,055,543 International Steels Limited (ISL) - subsidiary company, at cost 7.1 2,450,555 2,450,555
6,092,470 6,092,470 Pakistan Cables Limited (PCL) - associated company, at cost 7.2 817,553 817,553
Un-quoted Companies
- - IIL Americas Inc. (IIL Americas) 7.3 17,966 - - subsidiary company, at cost
100,000 100,000 IIL Australia Pty Limited (IIL 7.4 9,168 9,168 Australia) - subsidiary company, at cost
3,295,242 3,277,276
7.1 The Company holds 56.33% ownership interest in ISL. The Chief Executive Officer of ISL is Mr. Yousuf H. Mirza.
7.1.1 The Company has pledged 500,000 shares of International Steels Limited in the Honourable Sindh High Court as explained in note no .21.1.8
7.2 The Company holds 17.124% (2019: 17.124%) ownership interest in PCL. The Chief Executive Officer of PCL is Mr. Fahd K.Chinoy.
7.3 This represents advance against shares paid by International Industries Limited for issuance of 100% ownership interest (150,000 shares) in IIL Americas Inc. . The Chief Executive Officer of IIL Americas Inc., is Mr. Mohsin Safdar.
7.4 The Company holds 100% ownership interest in IIL Australia Pty Limited. The Chief Executive Officer of IIL Australia Pty Limited is Mr. Sohail Raza Bhojani. The Company is incorporated in Victoria, Australia. As per the latest available financial statements which are prepared on going concern. IIL Australia Pty. Limited has been audited by KST Partners Chartered Accountants and they have expressed an unqualified opinion.
7.5 The market value of the aforementioned quoted investments is as follows:
Note 2020 2019-------- Rupees in ‘000 --------
International Steels Limited at Rs.51.65 (2019: Rs. 39.71) per share 7.5.1 12,657,119 9,731,156
Pakistan Cables Limited at Rs.106.89 (2019: Rs. 140.52) per share 7.5.1 651,224 856,114
7.5.1 Market values of the investments disclosed above is categorised as Level 1 fair value measurement.
7.6 The book value of IIL Australia based on the financial statements as at 30 June 2020 is Australian Dollars 160,232 (Rs. 18.47 million) [2019: AUD 177,569 (Rs. 20.42 million)].

154 International Industries Limited
8 STORES AND SPARES Note 2020 2019-------- Rupees in ‘000 --------
Stores 104,119 98,269 Spares 104,624 113,286 Loose tools 4,628 3,973
213,371 215,5289 STOCK-IN-TRADE
Raw material - in hand 9.1 4,433,572 5,186,733 - in transit 120,327 1,721,549
4,553,899 6,908,282
Work-in-process 1,648,287 1,516,682 Finished goods 2,123,945 2,358,009 By-products 32,295 45,970 Scrap material 47,381 28,787
8,405,807 10,857,730
9.1 Raw material amounting to Rs. 2.3 million as at 30 June 2020 (2019: Rs. 4.9 million) was held at a vendor’s premises for the production of pipe caps.
10 TRADE DEBTS - considered good Note 2020 2019-------- Rupees in ‘000 --------
Considered good - secured 10.1 183,471 86,154 - unsecured 3,375,248 2,901,929
3,558,719 2,988,083
Considered doubtful 146,431 145,767 3,705,150 3,133,850
Provision for impairment on trade debts 10.4 (146,431) (145,767) 3,558,719 2,988,083
10.1 This represents trade debts arising on account of export sales of Rs. 139.9 million (2019: Rs. 63.3 million) which are secured by way of Export Letters of Credit and Rs. 43.5 million (2019: Rs. 22.8 million) on account of domestic sales which are secured by way of Inland Letter of Credit.
10.2 Related parties from whom trade debts are due as at 30 June 2020 are as under:
Note 2020 2019-------- Rupees in ‘000 --------
IIL Australia Pty Limited 814,507 581,091 IIL Americas Inc. 70,042 - Pakistan Cables Limited 702 9,695
10.3.1 885,251 590,786
10.3 The maximum aggregate amount due from the related parties at any time during the year calculated by reference to month-end balances is Rs. 947.11 million. Companies fully owned subsidiaries i.e., IIL Americas and IIL Australia have obtained credit insurance on their debtors.
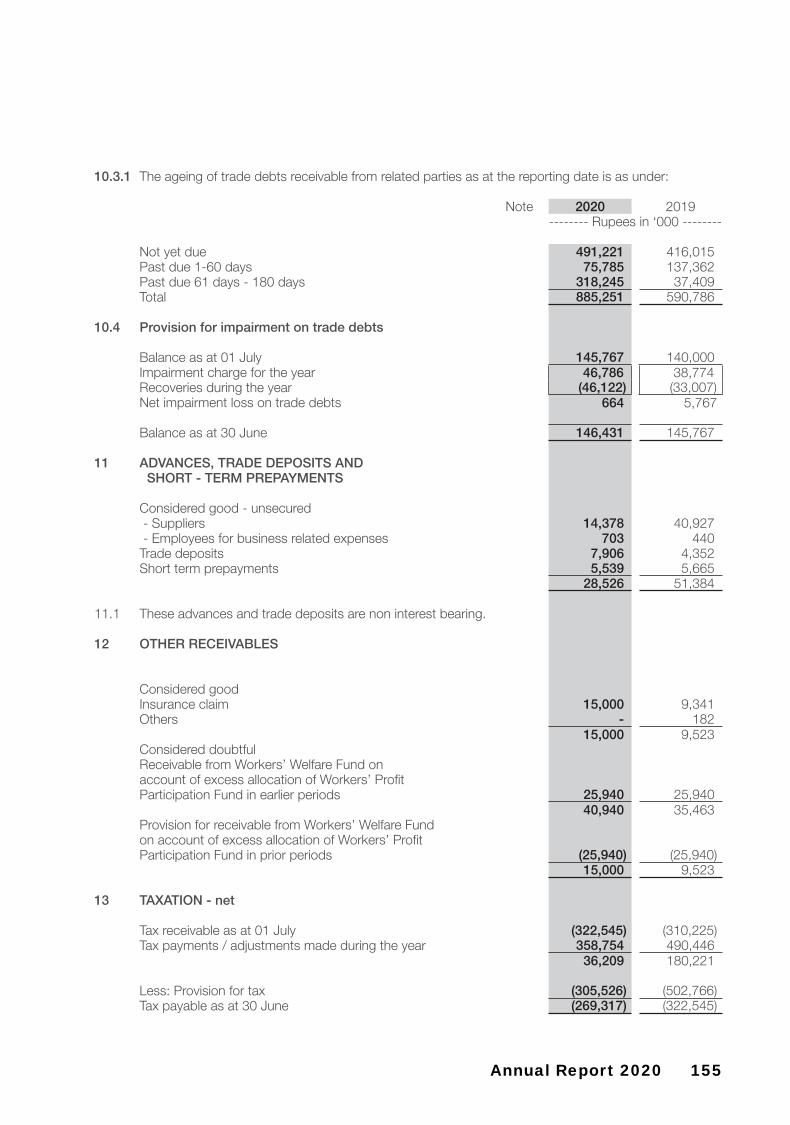
155Annual Report 2020
10.3.1 The ageing of trade debts receivable from related parties as at the reporting date is as under:
Note 2020 2019-------- Rupees in ‘000 --------
Not yet due 491,221 416,015 Past due 1-60 days 75,785 137,362 Past due 61 days - 180 days 318,245 37,409 Total 885,251 590,786
10.4 Provision for impairment on trade debts
Balance as at 01 July 145,767 140,000Impairment charge for the year 46,786 38,774 Recoveries during the year (46,122) (33,007)Net impairment loss on trade debts 664 5,767
Balance as at 30 June 146,431 145,767
11 ADVANCES, TRADE DEPOSITS AND SHORT - TERM PREPAYMENTS
Considered good - unsecured - Suppliers 14,378 40,927 - Employees for business related expenses 703 440 Trade deposits 7,906 4,352 Short term prepayments 5,539 5,665
28,526 51,384
11.1 These advances and trade deposits are non interest bearing.
12 OTHER RECEIVABLES
Considered goodInsurance claim 15,000 9,341 Others - 182
15,000 9,523 Considered doubtfulReceivable from Workers’ Welfare Fund on account of excess allocation of Workers’ Profit Participation Fund in earlier periods 25,940 25,940
40,940 35,463 Provision for receivable from Workers’ Welfare Fund on account of excess allocation of Workers’ Profit Participation Fund in prior periods (25,940) (25,940)
15,000 9,523
13 TAXATION - net
Tax receivable as at 01 July (322,545) (310,225)Tax payments / adjustments made during the year 358,754 490,446
36,209 180,221
Less: Provision for tax (305,526) (502,766)Tax payable as at 30 June (269,317) (322,545)

156 International Industries Limited
Note 2020 2019-------- Rupees in ‘000 --------
14 CASH AND BANK BALANCES
Cash at bank- Current accounts 299,469 245,408 - Deposit accounts - 5,292
299,469 250,700
14.1 Mark-up rate on deposits accounts, placed with banks under conventional banking arrangement, is 3.25% - 6.5% (2019: 3.25% - 10.25%).
15 ISSUED, SUBSCRIBED AND PAID-UP CAPITAL
2020 2019 Note 2020 2019 (Number of shares) -------- Rupees in ‘000 --------
6,769,725 6,769,725 Fully paid ordinary shares of Rs. 10 each issued for cash 67,697 67,697
125,112,156 113,122,894 Fully paid ordinary shares of Rs.10each issued as bonus shares 1,251,122 1,131,229
131,881,881 119,892,619 1,318,819 1,198,926
15.1 Pakistan Cables Limited, an associated company, due to common directors, held 633,600 (2019: 576,000) ordinary shares of Rs. 10 each at the year end.
16 REVALUATION SURPLUS ON PROPERTY,PLANT AND EQUIPMENT
Freehold land
Balance as at 01 July 459,464 386,829 Surplus on revaluation of Freehold land 5.1 - 72,635 Balance as at 30 June 459,464 459,464
Leasehold land
Balance as at 01 July 1,317,213 1,119,897 Surplus on revaluation of Leasehold land 5.1 - 197,316 Balance as at 30 June 1,317,213 1,317,213
Buildings
Balance as at 01 July 889,633 594,834 Surplus on revaluation of buildings 5.1 - 358,144 Disposal of buildings (11,638) (9,420)Transferred to retained earnings (un-appropriated profit) in respect of incremental depreciation charged during the year (87,741) (53,925)
790,253 889,633
Related deferred tax liability 16.2 (194,626) (215,417)Balance as at 30 June - net of deferred tax 595,627 674,216
2,372,304 2,450,893
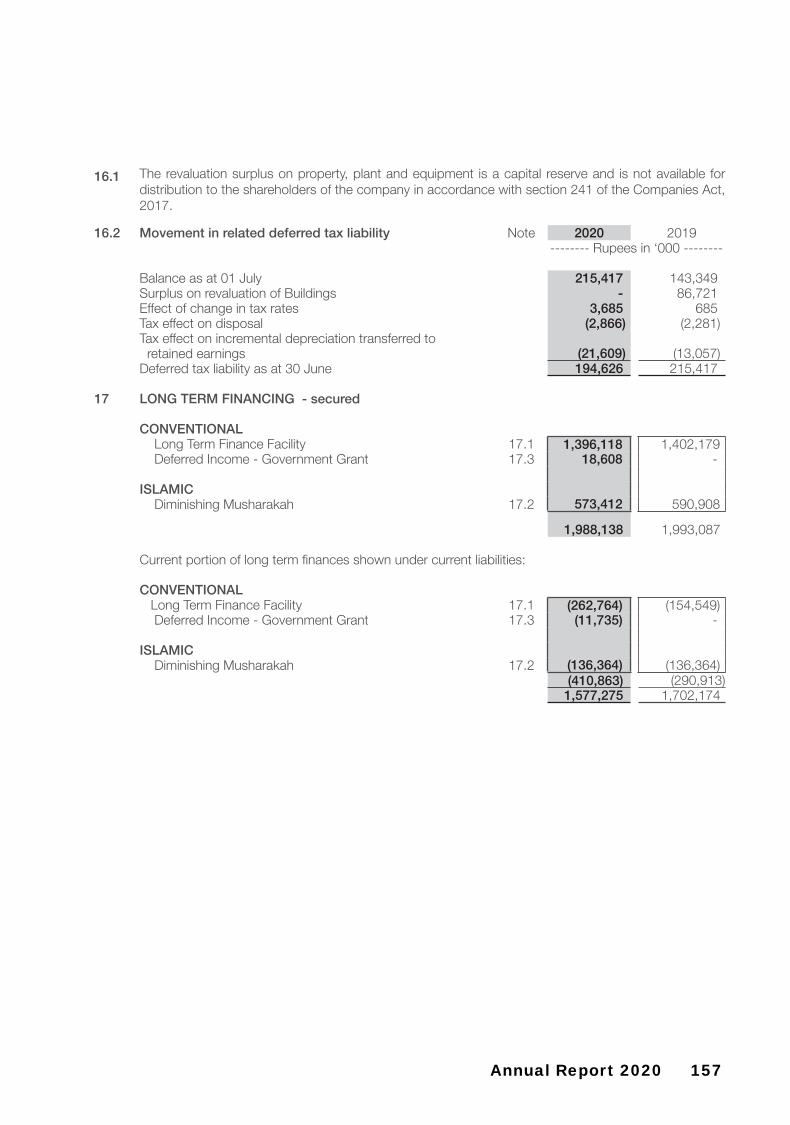
157Annual Report 2020
16.1 The revaluation surplus on property, plant and equipment is a capital reserve and is not available for distribution to the shareholders of the company in accordance with section 241 of the Companies Act, 2017.
16.2 Movement in related deferred tax liability Note 2020 2019-------- Rupees in ‘000 --------
Balance as at 01 July 215,417 143,349 Surplus on revaluation of Buildings - 86,721 Effect of change in tax rates 3,685 685 Tax effect on disposal (2,866) (2,281)Tax effect on incremental depreciation transferred to
retained earnings (21,609) (13,057)Deferred tax liability as at 30 June 194,626 215,417
17 LONG TERM FINANCING - secured
CONVENTIONAL Long Term Finance Facility 17.1 1,396,118 1,402,179 Deferred Income - Government Grant 17.3 18,608 -
ISLAMIC Diminishing Musharakah 17.2 573,412 590,908
1,988,138 1,993,087
Current portion of long term finances shown under current liabilities:
CONVENTIONAL Long Term Finance Facility 17.1 (262,764) (154,549) Deferred Income - Government Grant 17.3 (11,735) -
ISLAMIC Diminishing Musharakah 17.2 (136,364) (136,364)
(410,863) (290,913) 1,577,275 1,702,174
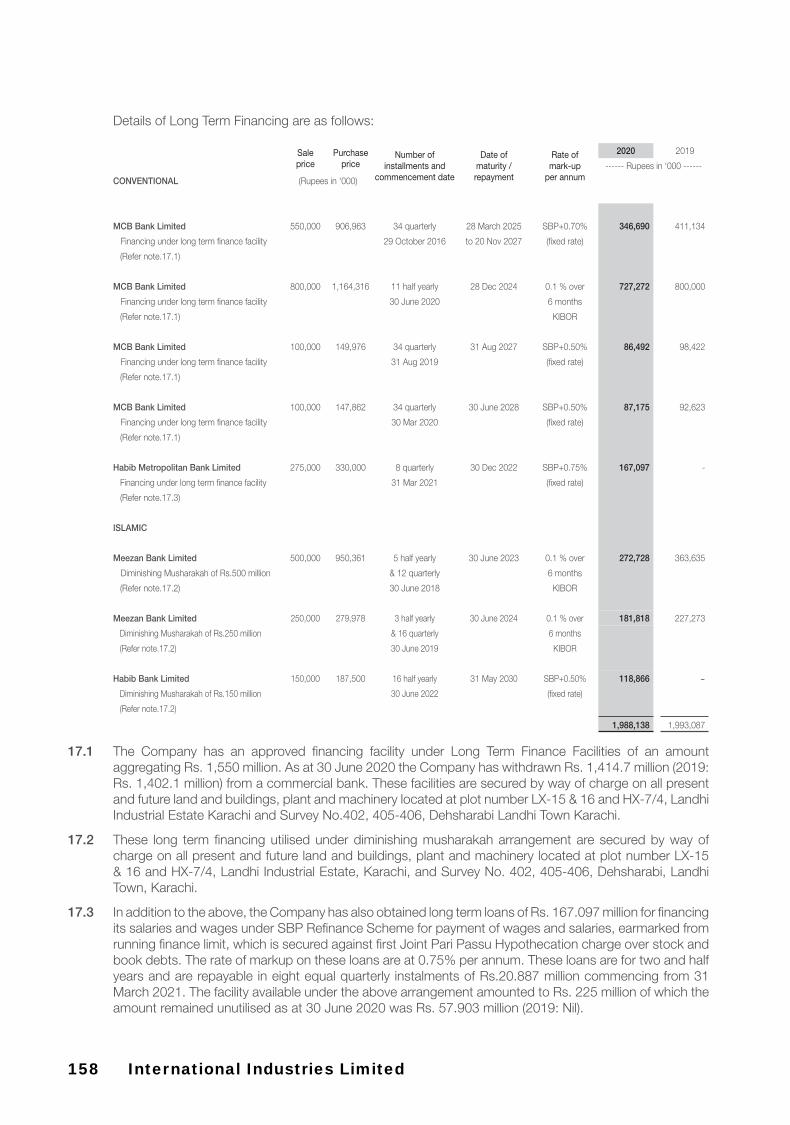
158 International Industries Limited
Details of Long Term Financing are as follows:
Sale price
Purchaseprice
Number of installments and
commencement date
Date of maturity /repayment
Rate ofmark-up
per annum
2020 2019
------ Rupees in ‘000 ------
CONVENTIONAL (Rupees in '000)
MCB Bank Limited 550,000 906,963 34 quarterly 28 March 2025 SBP+0.70% 346,690 411,134
Financing under long term finance facility 29 October 2016 to 20 Nov 2027 (fixed rate)
(Refer note.17.1)
MCB Bank Limited 800,000 1,164,316 11 half yearly 28 Dec 2024 0.1 % over 727,272 800,000
Financing under long term finance facility 30 June 2020 6 months
(Refer note.17.1) KIBOR
MCB Bank Limited 100,000 149,976 34 quarterly 31 Aug 2027 SBP+0.50% 86,492 98,422
Financing under long term finance facility 31 Aug 2019 (fixed rate)
(Refer note.17.1)
MCB Bank Limited 100,000 147,862 34 quarterly 30 June 2028 SBP+0.50% 87,175 92,623
Financing under long term finance facility 30 Mar 2020 (fixed rate)
(Refer note.17.1)
Habib Metropolitan Bank Limited 275,000 330,000 8 quarterly 30 Dec 2022 SBP+0.75% 167,097 -
Financing under long term finance facility 31 Mar 2021 (fixed rate)
(Refer note.17.3)
ISLAMIC
Meezan Bank Limited 500,000 950,361 5 half yearly 30 June 2023 0.1 % over 272,728 363,635
Diminishing Musharakah of Rs.500 million & 12 quarterly 6 months
(Refer note.17.2) 30 June 2018 KIBOR
Meezan Bank Limited 250,000 279,978 3 half yearly 30 June 2024 0.1 % over 181,818 227,273
Diminishing Musharakah of Rs.250 million & 16 quarterly 6 months
(Refer note.17.2) 30 June 2019 KIBOR
Habib Bank Limited 150,000 187,500 16 half yearly 31 May 2030 SBP+0.50% 118,866 - Diminishing Musharakah of Rs.150 million 30 June 2022 (fixed rate)
(Refer note.17.2)
1,988,138 1,993,087
17.1 The Company has an approved financing facility under Long Term Finance Facilities of an amount aggregating Rs. 1,550 million. As at 30 June 2020 the Company has withdrawn Rs. 1,414.7 million (2019: Rs. 1,402.1 million) from a commercial bank. These facilities are secured by way of charge on all present and future land and buildings, plant and machinery located at plot number LX-15 & 16 and HX-7/4, Landhi Industrial Estate Karachi and Survey No.402, 405-406, Dehsharabi Landhi Town Karachi.
17.2 These long term financing utilised under diminishing musharakah arrangement are secured by way of charge on all present and future land and buildings, plant and machinery located at plot number LX-15 & 16 and HX-7/4, Landhi Industrial Estate, Karachi, and Survey No. 402, 405-406, Dehsharabi, Landhi Town, Karachi.
17.3 In addition to the above, the Company has also obtained long term loans of Rs. 167.097 million for financing its salaries and wages under SBP Refinance Scheme for payment of wages and salaries, earmarked from running finance limit, which is secured against first Joint Pari Passu Hypothecation charge over stock and book debts. The rate of markup on these loans are at 0.75% per annum. These loans are for two and half years and are repayable in eight equal quarterly instalments of Rs.20.887 million commencing from 31 March 2021. The facility available under the above arrangement amounted to Rs. 225 million of which the amount remained unutilised as at 30 June 2020 was Rs. 57.903 million (2019: Nil).
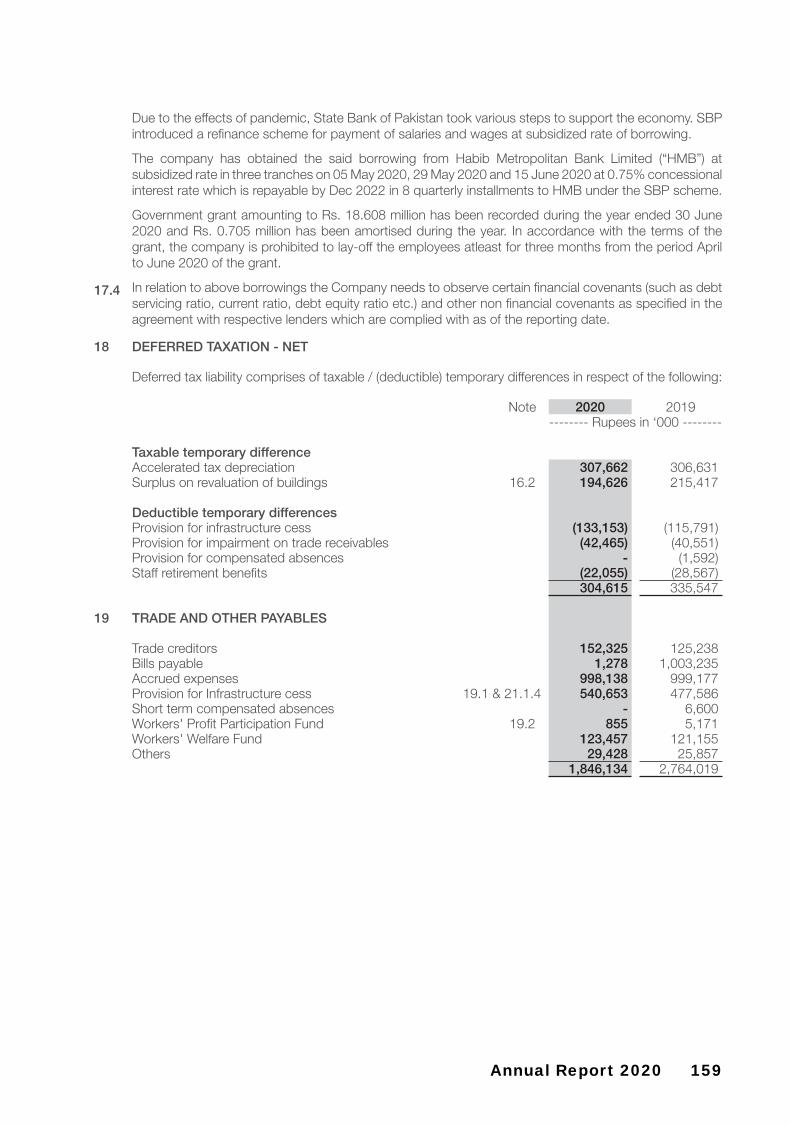
159Annual Report 2020
Due to the effects of pandemic, State Bank of Pakistan took various steps to support the economy. SBP introduced a refinance scheme for payment of salaries and wages at subsidized rate of borrowing.
The company has obtained the said borrowing from Habib Metropolitan Bank Limited (“HMB”) at subsidized rate in three tranches on 05 May 2020, 29 May 2020 and 15 June 2020 at 0.75% concessional interest rate which is repayable by Dec 2022 in 8 quarterly installments to HMB under the SBP scheme.
Government grant amounting to Rs. 18.608 million has been recorded during the year ended 30 June 2020 and Rs. 0.705 million has been amortised during the year. In accordance with the terms of the grant, the company is prohibited to lay-off the employees atleast for three months from the period April to June 2020 of the grant.
17.4 In relation to above borrowings the Company needs to observe certain financial covenants (such as debt servicing ratio, current ratio, debt equity ratio etc.) and other non financial covenants as specified in the agreement with respective lenders which are complied with as of the reporting date.
18 DEFERRED TAXATION - NET
Deferred tax liability comprises of taxable / (deductible) temporary differences in respect of the following:
Note 2020 2019-------- Rupees in ‘000 --------
Taxable temporary differenceAccelerated tax depreciation 307,662 306,631 Surplus on revaluation of buildings 16.2 194,626 215,417
Deductible temporary differencesProvision for infrastructure cess (133,153) (115,791)Provision for impairment on trade receivables (42,465) (40,551)Provision for compensated absences - (1,592)Staff retirement benefits (22,055) (28,567)
304,615 335,547
19 TRADE AND OTHER PAYABLES
Trade creditors 152,325 125,238 Bills payable 1,278 1,003,235 Accrued expenses 998,138 999,177 Provision for Infrastructure cess 19.1 & 21.1.4 540,653 477,586 Short term compensated absences - 6,600 Workers' Profit Participation Fund 19.2 855 5,171 Workers' Welfare Fund 123,457 121,155 Others 29,428 25,857
1,846,134 2,764,019

160 International Industries Limited
19.1 Provision for Infrastructure Cess
This represents provision against fifty percent amount guaranteed to Excise and Taxation Officer (refer note 21.1.5).
Note 2020 2019-------- Rupees in ‘000 --------
Balance as at 01 July 477,586 401,376 Charge for the year 63,067 76,210 Balance as at 30 June 540,653 477,586
19.2 Workers’ Profit Participation Fund
Balance as at 01 July 5,171 (311)Interest on funds utilised in the Company’s business 48.75% (2019: Nil) 26 600 -
5,771 (311)
Allocation for the year 7,166 51,532 12,937 51,221
Payments made during the year (12,082) (46,050)Balance as at 30 June 855 5,171
20 SHORT TERM BORROWINGS - secured
CONVENTIONALRunning finance under mark-up arrangement from banks 20.1 2,019,425 868,485 Short term borrowing under Money Market Scheme Maturing after three months 800,000 500,000 Maturing within three months 3,900,000 4,216,850
20.2 4,700,000 4,716,850
Short term borrowing under Export Refinance Scheme 20.3 1,315,000 2,176,000
ISLAMICShort term borrowing under running Musharakah 20.4 860,032 355,795 Short term borrowing under term Murabaha 20.5 - 1,308,000 Short term borrowing under Export Refinance Scheme 20.5 500,000 -
9,394,457 9,425,130
20.1 The facilities for running finance available from various commercial banks amounted to Rs. 2,625.0 million (2019: Rs.3,342.5 million). The rates of mark-up on these finances range from 8.73% to 11.76% per annum (2019: 11.44% to 13.04% per annum). Unavailed facility as at the year end amounted to Rs. 605.6 million (2019: Rs. 2,474 million).
20.2 The facilities for short term borrowing under Money Market Scheme available from various commercial banks under mark-up arrangement amounted to Rs. 7,875 million (2019: Rs. 5,270 million).Unavailed facility as at the year end amounted to Rs. 3,175.0 million (2019: Rs. 553.1 million). The rates of mark-up on these finances range from 7.51% to 8.76% (2019: 11.04% to 13.06%) per annum
20.3 The Company has borrowed short term running finance under the Export Refinance Scheme of the State Bank of Pakistan (SBP). The facility availed is for an amount of Rs. 1,315 million (2019: Rs. 2,176 million). The rate of mark-up on this facility was 3.00% per annum (2019: 2.50% to 3.00% per annum).
20.4 The facilities for running musharakah available from various banks amounted to Rs. 2,850 million (2019: Rs. 1,500 million). The rates of mark-up on these finances range from 8.90% to 9.33% per annum (2019: 13.10% per annum). Unavailed facility as at the year end amounted to Rs. 1,989.9 million (2019: Rs. 1,144.2 million).

161Annual Report 2020
20.5 The Company obtained loan from Standard Chartered Bank, UK - Dubai International Finance Centre Branch through Standard Chartered Bank (Pakistan) Limited amounting to USD 8 million equivalent to fixed amount of Rs.1,308 million for meeting working capital requirement. The tenor of the loan was six months i.e from 26 June 2019 to 26 December 2019. The price of loan was six months KIBOR minus 0.28%. As per the term of agreement, Standard Chartered Bank (Pakistan) has obtained forward cover on behalf of the Company to hedge foreign currency risk.
20.6 The Company has borrowed short term running finance under Islamic Export Refinance Scheme of the State Bank of Pakistan from a commercial bank. The rate of mark-up on this facility is 3% per annum.
20.7 All running finance and short term borrowing facilities are secured by way of hypothecation of all present and future current and moveable assets.
21 CONTINGENCIES AND COMMITMENTS
21.1 Contingencies
Description of the factual basis of the proceeding and relief sought
Name of the court
Principal parties
Date Instituted
21.1.1 Customs duties amounting to Rs. 40.5 million as at 30 June 2020 (2019: Rs. 40.5 million) on import of raw material shall be payable by the Company in case of non-fulfilment of certain conditions imposed by the customs authorities under SRO 565(1) / 2006. The Company has provided post-dated cheques in favour of the Collector of Customs which are, in the normal course of business, to be returned to the Company after fulfilment of stipulated conditions. The Company has fulfilled the conditions for the aforementioned amounts and is making efforts to retrieve the associated post-dated cheques from the customs authorities.
Sindh High Court
Collector of Customs /
Federation of Pakistan
2005
21.1.2 An amount of Rs. 375 million was claimed by the customs authorities as duty rate differential on imports made during 2005-10 due to an anomaly in SRO 565(1) / 2006 Serial 88. Since then, the anomaly has been rectified. The Company filed a petition with the Honourable Sindh High Court in 2010 for an injunction and is awaiting the final judgement. The management is confident that the decision will be given in favour of the Company.
Sindh High Court
Collector of Customs /
Federation of Pakistan
15 January 2010
21.1.3 The customs authorities have charged a redemption fine of Rs. 83 million on clearance of imported raw material consignments in 2006. The Company has filed an appeal before the Honourable Sindh High Court, which has set aside the examination reports including subsequent order produced by the custom authorities, and ordered the authorities to re-examine the matter afresh. However, the custom authorities had filed an application for leave to appeal against the order of the Honourable High Court. The management anticipates that the chances of admission of such appeal are remote.
Sindh High Court
Collector of Customs /
Federation of Pakistan
30 August 2007

162 International Industries Limited
Description of the factual basis of the proceeding and relief sought
Name of the court
Principal parties
Date Instituted
21.1.4 The Company filed a Suit before Honourable Sindh High Court (SHC) for declaration and permanent injunction in 2002 against Infrastructure Fee (levy) levied through Sindh Finance Act 1994. Single bench of SHC vide its order (order) declared the levy constitutional, which was challenged by the Company through filing an appeal against the said order in 2004. In the appeal proceedings, larger bench of SHC granted a relief in 2006, by allowing the clearance of imported goods subject to submission of security / bank guarantees. Company submitted guarantees amounting to Rs.115 million for release of goods attracting levy of Rs.107 million. The SHC decided the matter on 17 September 2008 declaring the levy before 28 December 2006 as void and invalid. Excise and Taxation Department filed an appeal before the Honourable Supreme Court of Pakistan (SCP) against the order dated 17 September 2008 hence the guarantees were not released as the matter was sub-judice.
Sindh High Court
Secretary Excise and Taxation /
Federation of Pakistan
28 October 2002
Subsequently, in May 2011, the SCP disposed-off the appeal by referring the matter back to the SHC. On 31 May 2011, the SHC ordered returning the bank guarantees in respect of the consignments released up to 27 December 2006. In respect of consignments to be released subsequent to 27 December 2006 SHC ordered to pay 50% of the amount and submit bank guarantees for the balance amount. Bank guarantees amounting to Rs. 655 million (2019: Rs. 595 million) which includes afore-mentioned bank guarantees of Rs. 115 million are outstanding as at 30 June 2020. As a matter of prudence, company is making provision for the balance amount, which as at 30 June 2020 amounts to Rs. 540.7 million (2019: Rs.477.6 million) as disclosed in note 19.1.
Subsequently, in 2017 the Department vide Sindh Finance Act 2015 & 2016 enhanced the levy by 100%. On 24 October 2017 the Company has obtained stay from the SHC against the enhancement. The SHC has clubbed all the cases pertaining to the levy for final disposal.
21.1.5 The Federal Government issued Gas Infrastructure Development Cess (GIDC) Acts in the years 2011, 2014 and 2015. All GIDC Acts have been subject of thorough debate and consideration at honorable High Courts of the Country as well as the Supreme Court of Pakistan. On 12 August 2020, the Supreme Court of Pakistan issued its verdict and held that “the levy imposed under Gas Infrastructure Development Cess Act, 2015 is in accordance with the provisions of the Constitution”. The Supreme Court has also held that “the provisions of Section 8 of the Act, which give retrospective effect to the charge and recovery of ‘Cess’ levied from the year 2011 are also declared to be valid being within the legislative competence of the Parliament.”
Sindh High Court
OGRA / SSGC /
Federation of Pakistan
8 January 2012

163Annual Report 2020
Description of the factual basis of the proceeding and relief sought
Name of the court
Principal parties
Date Instituted
The Management has recorded GIDC provision in unconsolidated financial statements, as per the act / ordinance applicable at the time of respective law being in force for the periods up to the year ended 30 June 2020.
Further the Company has not recognised GIDC amounting to Rs. 142.36 million (2019: Rs. 89.65 million) pertaining to period from 01 July 2011 to 30 June 2020 with respect to its captive power plant from which power generation is supplied to K-Electric Limited. Management considers that, in the event such levy is imposed, it shall recover GIDC from K-Electric Limited through fuel adjustments after getting requisite approval from National Electric Power Regulatory Authority (NEPRA).
21.1.6 Sindh Revenue Board (SRB) issued a notice to the Company for payment of Sindh Workers Welfare Fund under the Sindh Workers Welfare Fund Act, 2014. The Company filed a constitutional petition in the Sindh High Court, challenging the said unlawful demand on the ground that the Company is a trans-provincial establishment operating industrial and commercial activities across Pakistan. The Sindh High Court granted stay order in favor of the Company declaring exemption on the basis that the Company being a trans-provincial establishment is liable to pay Workers Welfare Fund under Federal Workers Welfare Fund Ordinance, 1971. In a separate case, the Sindh High Court has dealt on the subject of trans-provincial establishment in its judgement with a conflicting view.
Sindh High Court
SRB / Gov-ernment of
Sindh
9 Sep 2017
21.1.7 Oil and Gas Regulatory Authority (OGRA) revised the gas tariff to Rs.600/- MMBTU by increasing the gas tariff by Rs.112/- per MMBTU vide its notification dated 30 December 2016 disregarding the protocol laid down in OGRA Ordinance, 2002. The Company filed a suit before the Sindh High Court (the Court) challenging the increase in gas tariff. The Court granted a stay order subject to submission of security for the differential amount with the Nazir of the Court. The Company has issued cheques amounting to Rs 99.5 million (2019: Rs.99.5 million) in favour of Nazir of the court upto September 2018. The Company, on a prudent basis, has also accrued this amount in these unconsolidated financial statements. OGRA has further revised the gas tariff to Rs.780 per MMBTU vide its notification dated 04 October 2018, further increasing the rate by Rs.180 per MMBTU. The Company has filed a petition before the Court challenging such further revision and the matter is partially heard. Pending the decision on the matter, the Company is settling the bills at the revised rate.
Sindh High Court
OGRA / SSGC /
Federation of Pakistan
19 January 2017
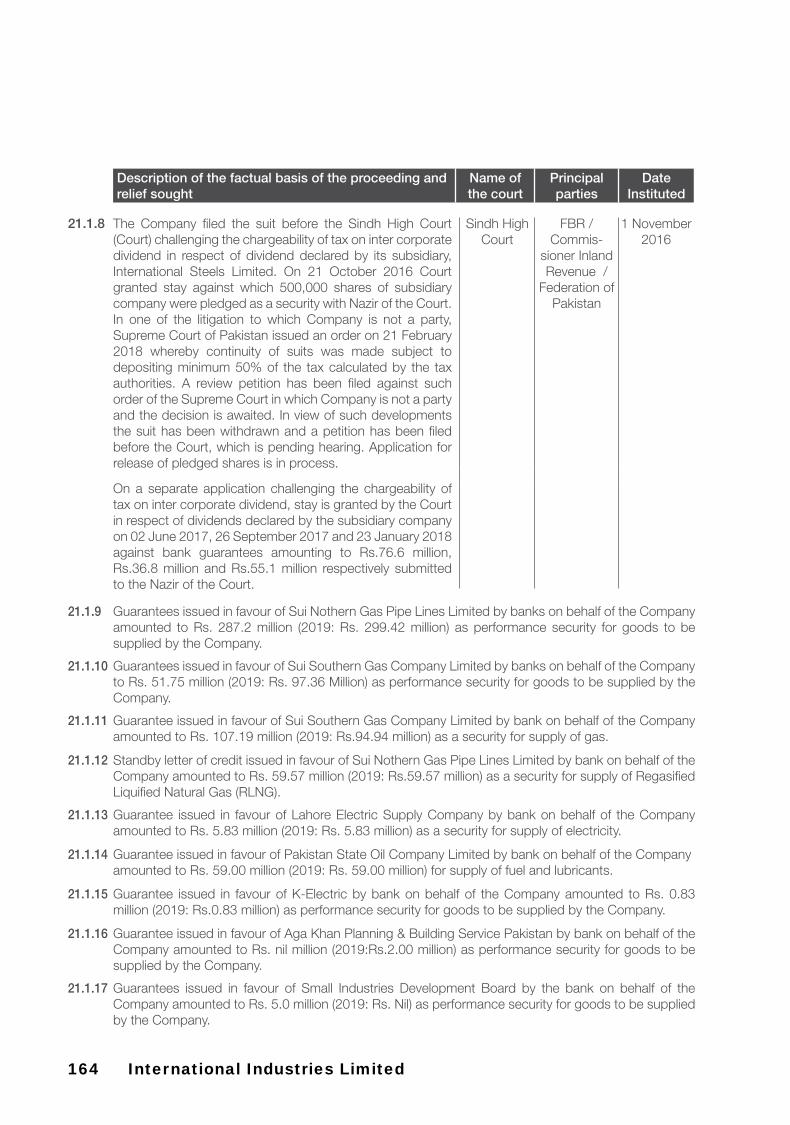
164 International Industries Limited
Description of the factual basis of the proceeding and relief sought
Name of the court
Principal parties
Date Instituted
21.1.8 The Company filed the suit before the Sindh High Court (Court) challenging the chargeability of tax on inter corporate dividend in respect of dividend declared by its subsidiary, International Steels Limited. On 21 October 2016 Court granted stay against which 500,000 shares of subsidiary company were pledged as a security with Nazir of the Court. In one of the litigation to which Company is not a party, Supreme Court of Pakistan issued an order on 21 February 2018 whereby continuity of suits was made subject to depositing minimum 50% of the tax calculated by the tax authorities. A review petition has been filed against such order of the Supreme Court in which Company is not a party and the decision is awaited. In view of such developments the suit has been withdrawn and a petition has been filed before the Court, which is pending hearing. Application for release of pledged shares is in process.
Sindh High Court
FBR / Commis-
sioner Inland Revenue /
Federation of Pakistan
1 November 2016
On a separate application challenging the chargeability of tax on inter corporate dividend, stay is granted by the Court in respect of dividends declared by the subsidiary company on 02 June 2017, 26 September 2017 and 23 January 2018 against bank guarantees amounting to Rs.76.6 million, Rs.36.8 million and Rs.55.1 million respectively submitted to the Nazir of the Court.
21.1.9 Guarantees issued in favour of Sui Nothern Gas Pipe Lines Limited by banks on behalf of the Company amounted to Rs. 287.2 million (2019: Rs. 299.42 million) as performance security for goods to be supplied by the Company.
21.1.10 Guarantees issued in favour of Sui Southern Gas Company Limited by banks on behalf of the Company to Rs. 51.75 million (2019: Rs. 97.36 Million) as performance security for goods to be supplied by the Company.
21.1.11 Guarantee issued in favour of Sui Southern Gas Company Limited by bank on behalf of the Company amounted to Rs. 107.19 million (2019: Rs.94.94 million) as a security for supply of gas.
21.1.12 Standby letter of credit issued in favour of Sui Nothern Gas Pipe Lines Limited by bank on behalf of the Company amounted to Rs. 59.57 million (2019: Rs.59.57 million) as a security for supply of Regasified Liquified Natural Gas (RLNG).
21.1.13 Guarantee issued in favour of Lahore Electric Supply Company by bank on behalf of the Company amounted to Rs. 5.83 million (2019: Rs. 5.83 million) as a security for supply of electricity.
21.1.14 Guarantee issued in favour of Pakistan State Oil Company Limited by bank on behalf of the Company amounted to Rs. 59.00 million (2019: Rs. 59.00 million) for supply of fuel and lubricants.
21.1.15 Guarantee issued in favour of K-Electric by bank on behalf of the Company amounted to Rs. 0.83 million (2019: Rs.0.83 million) as performance security for goods to be supplied by the Company.
21.1.16 Guarantee issued in favour of Aga Khan Planning & Building Service Pakistan by bank on behalf of the Company amounted to Rs. nil million (2019:Rs.2.00 million) as performance security for goods to be supplied by the Company.
21.1.17 Guarantees issued in favour of Small Industries Development Board by the bank on behalf of the Company amounted to Rs. 5.0 million (2019: Rs. Nil) as performance security for goods to be supplied by the Company.
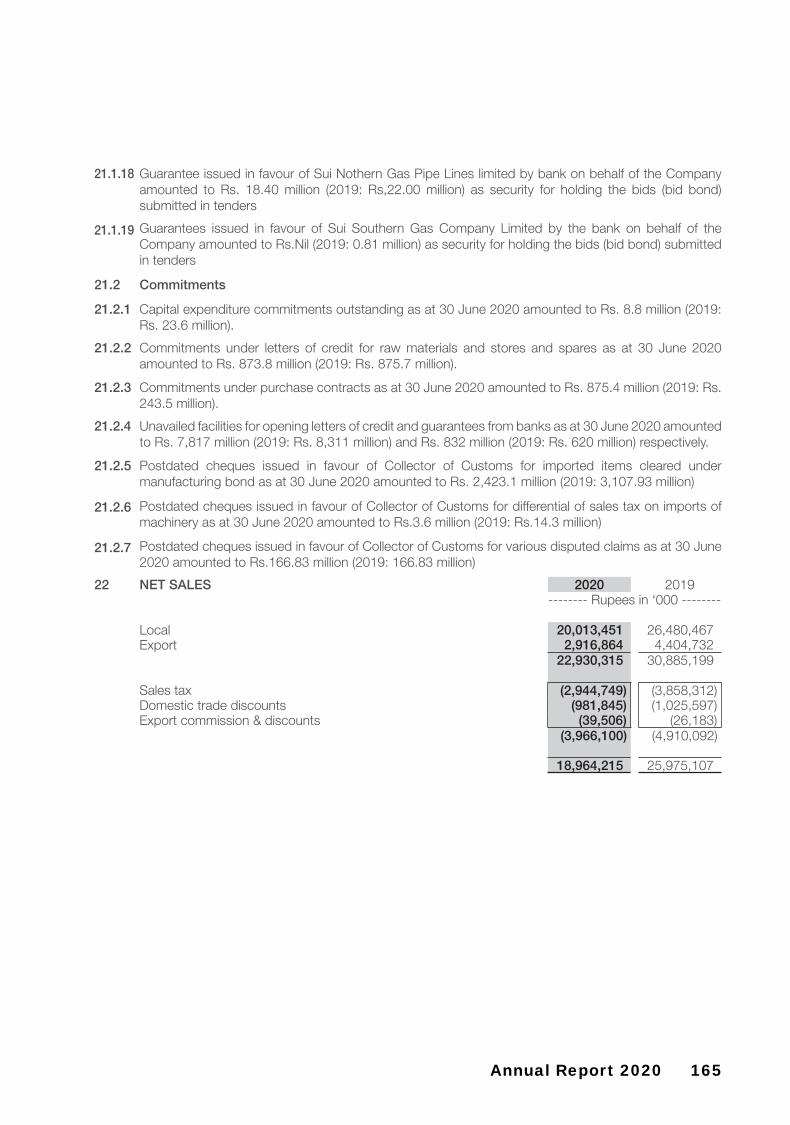
165Annual Report 2020
21.1.18 Guarantee issued in favour of Sui Nothern Gas Pipe Lines limited by bank on behalf of the Company amounted to Rs. 18.40 million (2019: Rs,22.00 million) as security for holding the bids (bid bond) submitted in tenders
21.1.19 Guarantees issued in favour of Sui Southern Gas Company Limited by the bank on behalf of the Company amounted to Rs.Nil (2019: 0.81 million) as security for holding the bids (bid bond) submitted in tenders
21.2 Commitments
21.2.1 Capital expenditure commitments outstanding as at 30 June 2020 amounted to Rs. 8.8 million (2019: Rs. 23.6 million).
21.2.2 Commitments under letters of credit for raw materials and stores and spares as at 30 June 2020 amounted to Rs. 873.8 million (2019: Rs. 875.7 million).
21.2.3 Commitments under purchase contracts as at 30 June 2020 amounted to Rs. 875.4 million (2019: Rs. 243.5 million).
21.2.4 Unavailed facilities for opening letters of credit and guarantees from banks as at 30 June 2020 amounted to Rs. 7,817 million (2019: Rs. 8,311 million) and Rs. 832 million (2019: Rs. 620 million) respectively.
21.2.5 Postdated cheques issued in favour of Collector of Customs for imported items cleared under manufacturing bond as at 30 June 2020 amounted to Rs. 2,423.1 million (2019: 3,107.93 million)
21.2.6 Postdated cheques issued in favour of Collector of Customs for differential of sales tax on imports of machinery as at 30 June 2020 amounted to Rs.3.6 million (2019: Rs.14.3 million)
21.2.7 Postdated cheques issued in favour of Collector of Customs for various disputed claims as at 30 June 2020 amounted to Rs.166.83 million (2019: 166.83 million)
22 NET SALES 2020 2019-------- Rupees in ‘000 --------
Local 20,013,451 26,480,467 Export 2,916,864 4,404,732
22,930,315 30,885,199
Sales tax (2,944,749) (3,858,312)Domestic trade discounts (981,845) (1,025,597)Export commission & discounts (39,506) (26,183)
(3,966,100) (4,910,092)
18,964,215 25,975,107

166 International Industries Limited
22.1 DISAGGREGATION OF REVENUE
In the following table, revenue is disaggregated by primary geographical markets and major product lines:
Note 2020 2019-------- Rupees in ‘000 --------
Primary geographical markets:Local 16,086,857 21,596,558 Asia 1,084,015 1,371,762 Europe 610,914 751,202 Australia 1,005,744 1,202,049 Africa 3,435 - Americas 173,250 1,053,536
18,964,215 25,975,107
Major Product Lines:Steel products 16,478,968 23,584,360 Polymer products 2,485,247 2,390,747
18,964,215 25,975,107
23 COST OF SALES
Raw material consumedOpening stock of raw material 5,186,733 4,384,947 Purchases 14,688,567 21,971,063
19,875,300 26,356,010
Closing stock of raw material 9 (4,433,572) (5,186,733) 15,441,728 21,169,277
Manufacturing overheadsSalaries, wages and benefits 23.1 867,150 970,252 Rent, rates and taxes 370 2,025 Electricity, gas and water 394,169 389,345 Insurance 10,413 9,255 Security and janitorial 32,805 33,895 Depreciation and amortisation 5.2 & 6.1.2 493,787 428,041 Operational supplies and consumables 79,790 101,057 Repairs and maintenance 106,478 140,723 Postage, telephone and stationery 9,142 12,059 Vehicle, travel and conveyance 17,471 22,379 Internal material handling 31,785 34,688 Environment controlling expense 334 361 Sundries 4,474 5,601 Partial manufacturing 5,472 -
2,053,640 2,149,681 17,495,368 23,318,958
Work-in-processOpening stock 1,516,682 1,409,862 Closing stock 9 (1,648,287) (1,516,682)
(131,605) (106,820)Cost of goods manufactured 17,363,763 23,212,138
Finished goods, by-products and scrap:
Opening stock 2,432,766 2,369,419 Closing stock 9 (2,203,621) (2,432,766)
229,145 (63,347)
17,592,908 23,148,791

167Annual Report 2020
23.1 Salaries, wages and benefits include Rs. 55.8 million for the year ended 30 June 2020 (2019: Rs. 54.3 million) in respect of staff retirement benefits.
24 SELLING AND DISTRIBUTION EXPENSES Note 2020 2019-------- Rupees in ‘000 --------
Freight and forwarding 542,113 813,119 Salaries, wages and benefits 24.1 166,209 169,411 Rent, rates and taxes 1,841 1,757 Electricity, gas and water 7,183 7,468 Insurance 1,027 3,605 Depreciation and amortisation 5.2 & 6.1.2 14,483 14,945 Repairs and maintenance 534 979 Advertising and sales promotion 43,709 82,887 Postage, telephone and stationery 5,523 7,058 Office supplies 39 135 Vehicle, travel and conveyance 20,350 23,966 Trade debts written off - 994 Certification and registration charges 2,374 3,982 Others 7,658 11,174
813,043 1,141,480
24.1 Salaries, wages and benefits include Rs. 10.68 million for the year ended 30 June 2020 (2019: Rs. 11.96 million) in respect of staff retirement benefits.
25 ADMINISTRATIVE EXPENSES Note 2020 2019-------- Rupees in ‘000 --------
Salaries, wages and benefits 25.1 192,008 207,645 Rent, rates and taxes 116 123 Electricity, gas and water 2,255 2,609 Insurance 1,467 1,478 Depreciation and amortisation 5.2 & 6.1.2 15,802 15,987 Repairs and maintenance 2,118 1,646 Postage, telephone and stationery 9,925 10,507 Office supplies 537 590 Vehicle, travel and conveyance 11,623 12,486 Legal and professional charges 33,789 17,218 Certification and registration charges 10,752 6,742 Others 18,315 18,765
298,707 295,796
25.1 Salaries, wages and benefits include Rs. 14.4 million for the year ended 30 June 2020 (2019: Rs. 15.1 million) in respect of staff retirement benefits.
26 FINANCE COST Note 2020 2019-------- Rupees in ‘000 --------
Conventional:- Interest on long term finance 131,356 96,836 - Interest on short term borrowings 741,331 671,892
872,687 768,728Islamic:- Mark-up on running musharakah 14,240 79,377 - Mark-up on term murabaha 83,689 2,351 - Mark-up on diminishing musharakah 73,613 61,045
171,542 142,773
Exchange loss and others 179,428 - Interest on Workers' Profit Participation Fund 19.2 600 - Bank charges 14,068 12,791
1,238,325 924,292

168 International Industries Limited
Note 2020 2019-------- Rupees in ‘000 --------
27 OTHER OPERATING CHARGES
Auditors' remuneration 27.1 3,256 3,131 Donations 27.2 2,350 17,245 Workers' Profit Participation Fund 7,166 51,532 Workers' Welfare Fund 2,302 19,198 Business development expense 15,628 7,258
30,702 98,364
27.1 Auditors' remuneration
Audit servicesAudit fee 1,625 1,625 Half yearly review 466 466 Out of pocket expenses 162 162
2,253 2,253 Non-audit servicesCertifications for regulatory purposes 1,003 878
3,256 3,131
27.2 Donations
27.2.1 Donation to the following organization exceed 10% of total amount of donations made or Rs. 1 million, whichever is higher
Note 2020 2019-------- Rupees in ‘000 --------
SINA Health, Education and Welfare Trust (IIL Clinic) - 6,000 The Citizen Foundation (IIL Campus) 27.2.2 - 5,100 Amir Sultan Chinoy Foundation - 2,320 Indus Earth Trust 1,000 -
1,000 13,420
27.2.2 Mr. Riyaz T. Chinoy’s interest in The Citizen Foundation is limited to the extent of his involvement as a director.
28 OTHER INCOME Note 2020 2019-------- Rupees in ‘000 --------
Income / return on financial assetsIncome on bank deposits - conventional 1,344 1,827 Exchange gain 86,257 472,531 Government grant 705 -
Income from non-financial assetsLoss from power generation 28.1 (4,172) (12,172)Rental income from subsidiary company 47,265 27,082 Dividend income from associated company 28.2 6,092 30,462 Dividend income from subsidiary company 28.2 370,259 1,102,750 Gain on disposal of property, plant and equipment 72,270 109,877 Others 306 155
580,326 1,732,512

169Annual Report 2020
2020 201928.1 Loss from power generation -------- Rupees in ‘000 --------
Net sales 122,785 102,191
Cost of electricity produced:Salaries, wages and benefits 6,301 6,164 Electricity, gas and water 104,450 93,585 Insurance 59 60 Depreciation 11,814 8,884 Operational supplies & consumables 1,908 3,348 Repairs and maintenance 2,425 2,322
126,957 114,363
Loss from power generation (4,172) (12,172)
28.1.1 Salaries, wages and benefits include Rs. 0.550 million (2019: Rs. 0.539 million) in respect of staff retirement benefits.
28.1.2The Company has 4MW electricity power generation facility at its premises generating electricity in excess of its requirements which is supplied to K-Electric Limited under an agreement.
28.2 Associated company is Pakistan Cables Limited and Subsidiary company is International Steels Limited.
29 TAXATION 2020 2019-------- Rupees in ‘000 --------
Current - for the year 329,526 502,766 - for prior years (24,000) -
305,526 502,766
- Deferred (41,129) 15,650 264,397 518,416
29.1 Relationship between income tax 2020 2019 2020 2019 expense and accounting profit (Effective tax rate %) -------- Rupees in ‘000 --------
(Loss) / Profit before taxation (429,808) 2,093,129
Tax at the enacted tax rate 29.00 29.00 (124,644) 607,007 Tax effect of:Income subject to final tax regime (5.06) (7.19) 21,748 (150,581)Income taxed as separate block of income 12.35 (7.58) (53,091) (158,650)Tax credits 0.00 (2.03) - (42,523)Minimum tax (95.92) 11.98 412,281 250,777 Tax effect of permanent differences (4.84) 0.90 20,791 18,893 Change in tax rate on opening deferred tax (2.63) (1.66) 11,312 (34,683)Super tax 0.00 1.35 - 28,176 Prior year 5.58 0.00 (24,000) -
(61.52) 24.87 264,397 518,416

170 International Industries Limited
30 EARNINGS PER SHARE - BASIC AND DILUTED Note 2020 2019-------- Rupees in ‘000 --------
(Loss) / Profit after taxation (694,205) 1,574,713
(Number)Weighted average number of ordinary shares (Restated)in issue during the year 15 131,881,881 131,881,881
(Rupees)(Restated)
(Loss) / Earnings per share - basic and diluted (5.26) 11.94
30.1 There is no dilutive impact on Earnings per share.
31 CHANGES IN WORKING CAPITAL
(Increase) / decrease in current assets:Stores and spares 2,157 (63,229)Stock-in-trade 2,451,923 (1,853,178)Trade debts (571,300) (674,974)Advances, trade deposits and short-term prepayments 22,858 1,014,443 Receivable from K-Electric Limited 11,118 (10,159)Other receivables (5,477) (4,818)Sales tax receivables 61,706 238,929
1,972,985 (1,352,986)Increase / (decrease) in current liabilities:Trade and other payables (911,285) 694,767 Contract liabilities (50,709) (7,696)
1,010,991 (665,915)

171Annual Report 2020
32 STAFF RETIREMENT BENEFITS
32.1 Defined contribution plan
Staff Provident Fund
The investments out of provident fund have been made in accordance with the provisions of section 218 of the Companies Act, 2017 and the conditions specified thereunder.
32.2 Defined benefit schemes
Staff Gratuity Fund
The actuarial valuation of gratuity was carried out at 30 June 2020 under projected unit credit method using the following significant assumptions;
2020 2019
% per annumFinancial AssumptionsDiscount Rate 8.50% 14.25%Salary increase rate
First year - Unionized staff 16% 10.85%First year - Management 0% 10.85%Long term 6.50% 12.25%
Demographic AssumptionsMortality rate SLIC 2001-05-1
HeavySLIC 2001-05-1
HeavyRates of employee turnoverRetirement assumption Age 60 years Age 60 years
The amounts recognised in statement of financial position are as follows:
2020 2019-------- Rupees in ‘000 --------
Present value of defined benefit obligation (DBO) 559,293 556,142 Fair value of plan assets (469,741) (437,733)(Surplus) / Deficit 89,552 118,409
Movements in the net defined benefit liability (assets)
Balance Sheet (prepaid) / accrued as at the beginning of the period 118,409 146,253Net the periodic benefit cost / (income) for the period ended 49,608 47,533Actual Contribution by the Employer to the Fund (17,800) (47,533)Total amount of Remeasurements recognised in OCI (60,665) (27,844)Balance Sheet (prepaid) / accrued as at the end of the period 89,552 118,409
Defined Benefit Cost for the period
Cost recognised in P&L for the period Service cost Current service cost 33,646 34,856
Interest Cost on DBO 77,720 49,563 Interest income on plan assets (61,758) (36,886)
15,962 12,677 Cost recognised in P&L for the period 49,608 47,533

172 International Industries Limited
2020 2019-------- Rupees in ‘000 --------
Re-measurements recognised in OCI during the period
Actuarial (gain) / loss on obligation (81,320) (67,470)Actuarial (gain) / loss on plan assets 20,655 39,626Total re-measurements recognised in OCI (60,665) (27,844)
Total defined benefit cost recognised in P&L and OCI (11,057) 19,689
Movements in the present value of defined benefit obligation
Present value of DBO at beginning of the period 556,142 563,010 Service cost 33,646 34,856 Interest cost on DBO 77,720 49,563 Actual benefits paid/payable during the year (26,895) (23,817)Re-measurements : Actuarial (gain) / loss on obligation (81,320) (67,470)Present value of DBO at end of the period 559,293 556,142
Movements in the fair value of plan assets
Fair value of plan assets at beginning of the period 437,733 416,757 Interest income on plan assets 61,758 36,886 Actual contribution by the employer to the Fund 17,800 47,533 Actual benefit paid / payable from the Fund during the year (26,895) (23,817)Re-measurements : Actuarial gain / (loss) on plan assets (20,655) (39,626)Fair value of plan assets at end of the period 469,741 437,733
Component of defined benefit costs recognised in profit and loss account
Analysis of Present value of DBO
Vested / Non-VestedVested Benefits 557,451 552,976Non-Vested benefits 1,842 3,166
559,293 556,142
Type of Benefits earned to dateAccumulated Benefit Obligation 375,632 278,308Amounts attributed to future salary increases 183,661 277,834
559,293 556,142
Disaggregation of fair value of plan assets
Cash and cash equivalents (after adjusting current liabilities) 2,079 13,286Equity instruments 75,659 118,712Debt instruments Pakistan Investment Bonds 154,122 109,538 National Saving Bonds - 196,197 Market Treasury Bills 7,097 - Defence Saving Certificates 168,235 - Regular Income Certificates 62,549 -
469,741 437,733
Remeasurements recognised in Other Comprehensive Expense/(Income) for the period
Re-measurements : Actuarial (gain) / loss on obligation i) (Gain) / Loss due to change in financial assumptions (12,948) (19,937)ii) (Gain) / Loss due to change in experience adjustments (68,372) (47,533) Total actuarial (gain) / loss on obligation (81,320) (67,470)
Re-measurements: Actuarial (gain) / loss on plan assetsi) Actual return on plan assets 49,483 (5,400)ii) Interest income on plan assets 61,758 36,886 iii) Opening difference (8,380) 2,660Total actuarial (gain) / loss on plan assets = (ii) - (i) - (iii) 20,655 39,626
(60,665) (27,844)

173Annual Report 2020
Maturity profile of the defined benefit obligation (DBO) 2020 2019 ------------ Years --------------
Weighted average duration of the DBO 6.03 5.97-------- Rupees in ‘000 --------
Distribution of timing of benefit payments (time in the periods)1 51,809 55,8642 69,018 59,4603 89,663 79,4364 66,587 110,4385 178,526 91,250
6-10 330,390 643,631
Sensitivity analysis of significant actuarial assumptions : Actuarial Liability
Reasonably possible changes at the reporting date to one of the relevant actuarial assumptions, holding other assumptions constant, would have affected the present value of DBO by the amounts shown below:
2020 2019-------- Rupees in ‘000 --------
Discount rate + 1% 527,440 524,948Discount rate - 1% 595,100 591,001Long Term Salary increases + 1% 614,565 588,710Long Term Salary increases - 1% 543,402 526,503
33 REMUNERATION OF CHIEF EXECUTIVE, DIRECTORS AND EXECUTIVES
Chief Executive Directors Executives2020 2019 2020 2019 2020 2019
---------------------------------Rupees in ‘000)---------------------------------
Managerial remuneration 36,332 36,332 - - 155,432 183,777
Bonus 12,111 16,111 - - 54,469 61,259
Retirement benefits 3,026 3,026 - - 10,227 12,227
Rent, utilities allowance etc. 18,907 18,945 - - 83,804 94,622
Directors’ fees - - 7,050 6,825 - - 70,376 74,414 7,050 6,825 303,932 351,885
Number of persons 1 1 8 8 51 55
33.1 In addition to the above, the Chief Executive, Directors and certain executives are provided with free use of Company maintained vehicles & Chief Executive is provided with security guards in accordance with the Company’s policy.
33.2 Fees paid to non-executive directors was Rs. 7.050 million (2019: Rs. 6.825 million) on account of meetings attended by them.
33.3 Reimbursement of chairman expense was Rs. 5.9 million (2019: Rs. 7.2 million).

174 International Industries Limited
34 FINANCIAL INSTRUMENTS AND RELATED DISCLOSURES
Financial risk management
The Board of Directors of the Company has overall responsibility for the establishment and oversight of the Company’s risk management framework. The Company has exposure to the following risks from its use of financial instruments:
- Credit risk- Liquidity risk- Market risk
Risk management framework
The Board meets frequently throughout the year for developing and monitoring the Company’s risk management policies. The Company’s risk management policies are established to identify and analyse the risks faced by the Company, to set appropriate risk limits and controls, and to monitor risks and adherence to limits. Risk management policies and systems are reviewed regularly to reflect changes in market conditions and the Company’s activities. The Company, through its standards and procedures, aims to develop a disciplined and constructive control environment in which all employees understand their roles and obligations.
The Audit Committee oversees how management monitors compliance with the Company’s risk management policies and procedures, and reviews the adequacy of the risk management framework in relation to the risks faced by the Company.
34.1 Credit risk
Credit risk is the risk of financial loss to the Company if a customer or counterparty to a financial instrument fails to meet its contractual obligations without considering the fair value of the collateral available there against.
Exposure to credit risk
The carrying amount of respective financial assets represent the maximum credit exposure. The maximum exposure to credit risk at the reporting date is as follows:
Note 2020 2019-------- Rupees in ‘000 --------
- Long term deposits 3,519 3,519 - Trade debts - net of provision 10 3,558,719 2,988,083 - Trade deposits 7,906 4,352 - Receivable from K-Electric Limited 19,006 30,124 - Other receivables 12 15,000 9,523 - Bank balances 14 299,469 250,700
3,903,619 3,286,301
The Company does not take into consideration the value of collateral while testing financial assets for impairment. The Company considers the credit worthiness of counterparties as part of its risk management.
Long term deposits
These represent long term deposits with various parties for the purpose of securing supplies of raw materials and services. The Company does not foresee any credit exposure there against as the amounts are paid to counterparties as per agreements and are refundable on termination of the agreements with respective counterparties.

175Annual Report 2020
Trade debts
The Company’s exposure to credit risk arising from trade debtors is mainly influenced by the individual characteristics of each customer. The majority of the customers have been transacting with the Company for several years. The Company establishes an allowance for impairment that represents its estimate of incurred losses.
Trade deposits
These represent deposits placed with various suppliers as per the terms of securing availability of services. The management does not expect to incur credit loss there against.
Other receivables and receivable from K-Electric Limited
This mainly includes insurance claim and an amount receivable from supplier amounting to Rs. 15 million (2019: Rs. 9.5 million). Receivable from K - Electric Limited amounting to Rs. 19.01 million (2019: Rs. 30.10 million) is on account of electricity provided to it from the 4 MW plant located at the factory site under an agreement. The Company does not expect to incur credit loss against these receivables.
Analysis of gross amounts receivable from local and foreign trade debtors and receivable from K Electric are as follows:
2020 2019-------- Rupees in ‘000 --------
Domestic 2,586,325 2,006,463 Export 1,137,831 1,157,511
3,724,156 3,163,974
The majority of export debtors of the Company are situated in Australia, Americas and Asia.
34.1.1 Impairment losses
The ageing of trade debtors and receivable from K-electric as per above at the reporting date was as follows:
2020 2019Gross Impairment Gross Impairment
--------------------------- (Rupees in ‘000) ---------------------------
0-30 Days 2,833,286 5,950 2,496,299 5,83931-60 Days 113,100 582 351,163 2,85161-90 Days 300,541 2,770 79,002 99291-120 Days 176,349 2,989 23,357 426121-150 Days 134,538 3,648 19,383 598151-180 Days 10,758 590 8,991 430181-210 Days 4,624 464 31,839 2,483211-240 Days 10,854 1,320 18,691 1,986241-270 Days 6,576 1,492 2,841 400271-300 Days 3,664 1,614 3,124 1,250301-330 Days 3,400 1,991 962 539331-360 Days 35,412 31,967 1,067 718Over 1 year 91,054 91,054 127,255 127,255
3,724,156 146,431 3,163,974 145,767

176 International Industries Limited
Management believes that the unimpaired balances that are past dues are still collectible in full, based on historical payment behaviour and review of financial strength of respective customers. Further, certain trade debtors are secured by way of Export Letter of Credit and Inland Letter of Credit which can be called upon if the counter party is in default under the terms of the agreement.
Bank Balances
Cash is held only with reputable banks with high quality external credit rating assessed by external rating agencies. Following are the credit ratings of banks within which balances are held or credit lines available:
Bank Rating Rating Agency Short term Long term
Habib Bank Limited VIS A-1+ AAAUnited Bank Limited VIS A-1+ AAAFaysal Bank Limited PACRA / VIS A-1+ AABank AL Habib Limited PACRA A-1+ AA+MCB Bank Limited PACRA A-1+ AAAStandard Chartered Bank (Pakistan) Limited PACRA A-1+ AAAMeezan Bank Limited VIS A-1+ AA+Bank Alfalah Limited PACRA / VIS A-1+ AA+Allied Bank Limited PACRA A-1+ AAAAskari Bank Limited PACRA A-1+ AA+Samba Bank Limited VIS A-1 AASoneri Bank Limited PACRA A-1+ AA-Industrial & Commercial Bank of China S&P - AIndustrial & Commercial Bank of China Moody's P-1* A1Habib Metropolitan Bank Limited PACRA A-1+ AA+
Concentration of credit risk
Concentrations arise when a number of counterparties are engaged in similar business activities, or activities in the same geographical region, or have economic features that would cause their ability to meet contractual obligations to be similarly affected by changes in economic, political or other conditions. Concentrations indicate the relative sensitivity of the Company’s performance to developments affecting a particular industry. In order to avoid excessive concentrations of risk, management focus on the maintenance of a diversified portfolio. Identified concentrations of credit risks are controlled and managed accordingly. Management does not consider that it has any concentration of credit risk at reporting date.
34.2 Liquidity risk
Liquidity risk is the risk that the Company will encounter difficulty in meeting obligations associated with financial liabilities that are settled by delivering cash or another financial asset. Liquidity risk arises because of the possibility that the Company could be required to pay its liabilities earlier than expected or difficulty in raising funds to meet commitments associated with financial liabilities as they fall due. The Company’s approach to managing liquidity is to ensure, as far as possible, that it will always have sufficient liquidity to meet its liabilities when due, under both normal and stressed conditions, without incurring unacceptable losses or risking damage to the Company’s reputation. The Company ensures that it has sufficient cash to meet expected working capital requirements by having credit lines available. The following are the contractual maturities of financial liabilities, including interest payments and excluding the impact of netting agreements:

177Annual Report 2020
2020
Carrying amount
On demand
Contractual cash flows
Six months or less
Six to twelve months
Two to five
years
More than five
years---------------------------------------------------- (Rupees in ‘000) ----------------------------------------------------
Non-derivative financial liabilitiesLong term financing 1,988,138 - (2,399,727) (245,983) (282,625) (1,706,015) (165,104)Trade and other payables 1,151,741 - (1,151,741) (1,151,741) - - - Accrued mark-up 75,830 - (75,830) (75,830) - - - Short-term borrowings 9,394,457 (9,394,457) - - - - - Contract liability 184,462 (184,462) - - - - - Unpaid dividend 2,438 (2,438) - - - - - Unclaimed dividend 39,044 (39,044) - - - - -
12,836,110 (9,620,401) (3,627,298) (1,473,554) (282,625) (1,706,015) (165,104)
2019
Carrying amount
On demand Contractual cash flows
Six months or less
Six to twelve months
Two to five years
More than five years
---------------------------------------------------- (Rupees in ‘000) -----------------------------------------------------Non-derivative financial liabilitiesLong term financing 1,993,087 - (2,635,328) (210,132) (281,967) (1,805,397) (337,832)Trade and payables 2,134,250 - (2,134,250) (2,134,250) - - - Accrued mark-up 143,466 - (143,466) (143,466) - - - Short-term borrowings 9,425,130 (9,425,130) - - - - - Contract liability 235,171 (235,171) - - - - - Unpaid dividend 4,257 (4,257) - - - - - Unclaimed dividend 36,596 (36,596) - - - - -
13,971,957 (9,701,154) (4,913,044) (2,487,848) (281,967) (1,805,397) (337,832)
34.2.1 The contractual cash flows relating to the above financial liabilities have been determined on the basis of mark-up rate effective as at 30 June. The rate of mark-up have been disclosed in respective notes to these unconsolidated financial statements..
34.2.2 Long term financing from various banks contains certain loan covenants. A breach of covenant, in future, may require the Company to repay the respective loans earlier than as directed in the above table.
34.3 Market risk
Market risk is the risk that changes in market prices, such as foreign exchange rates, interest rates and equity prices will affect the Company’s income or the value of its holdings of financial instruments. The objective of market risk management is to manage and control market risk exposures within acceptable parameters, while optimising the return. The Company is exposed to currency risk and interest rate risk only.
34.3.1 Currency risk
Currency risk is the risk that the fair value or future cash flows of a financial instrument will fluctuate because of changes in foreign exchange rates.
Exposure to currency risk
The Company is exposed to currency risk on trade debts, borrowings, accrued mark-up and trade creditors that are denominated in a currency other than the respective functional currency of the Company, primarily U.S. Dollar. The Company’s exposure to foreign currency risk is as follows:

178 International Industries Limited
2020 2019
Rupees US Dollars AUD Rupees US Dollars AUD
-------------------- (In ‘000) -------------------- -------------------- (In ‘000) --------------------
Financial assets
Bank Balance 295,389 1,758 - 250,395 1,537 -
Trade debts 1,137,831 1,508 7,674 1,156,897 3,535 5,088
Financial liabilities
Trade and other payables (1,278) (8) - (1,003,235) (6,146) -
Net exposure 1,431,942 3,258 7,674 404,057 (1,074) 5,088
The following significant exchange rates were applicable during the year:
Reporting date rate2020 2019
Buying/Selling Buying/Selling
US Dollars to Pakistan Rupee 167.98 / 168.35 162.87 / 163.24
AUD to Pakistan Rupee 115.26 / 115.50 114.20 / 114.47
Sensitivity analysis
A 10 percent strengthening / (weakening) of the Pak Rupee against the US Dollar and Australian Dollar at 30 June would have (decreased) / increased the equity / profit after tax by the amounts shown below. This analysis assumes that all other variables, in particular interest rates, remain constant. The analysis is performed on the same basis for both the years. However, prior year amount is net of corporate tax while there is no impact of corporate tax on current year as company is subject to minimum tax.
Effect on statement of profit or loss account
2020 2019-------- Rupees in ‘000 --------
As at 30 June Effect in US Dollars 50,897 (16,692)Effect in AUD 82,259 54,038
34.3.2 Interest rate risk
Interest rate risk is the risk that the fair value or future cash flows of a financial instrument will fluctuate because of changes in market interest rates. Interest rate exposure arises from short and long term borrowings from banks.
At the reporting date, the interest rate profile of the Company’s interest-bearing financial instrument is:
Carrying amount Note 2020 2019
-------- Rupees in ‘000 --------Fixed rate instrumentsFinancial liabilities 17 & 20 (2,121,320) (2,778,179)
Variable rate instrumentsFinancial liabilities 17 & 20 (9,261,275) 8,640,038

179Annual Report 2020
Cash flow sensitivity analysis for variable rate instruments
A change of 100 basis points in interest rates at the reporting date would have increased / (decreased) equity and the loss after tax by Rs. 113.82 million (2019: Rs. 86.40 million) with the corresponding effect on the carrying amount of the liability. This analysis assumes that all other variables, in particular foreign currency rates, remain constant. The analysis is performed on the same basis for both the years. However, prior year amount is net of corporate tax while there is no impact of corporate tax on current year as company is subject to minimum tax.
Fair value sensitivity analysis for fixed rate instruments
The Company does not account for any fixed rate financial assets and liabilities at fair value through the statement of profit or loss account. Therefore a change in interest rates at the reporting date would not affect the statement of profit or loss account.
34.4 Reconciliation of movements of liabilities to cash flows arising from financing activities
2020Short term Other Short Long term Unappropriated Totalborrowings term Borrowings profit
used for cash borrowingmanagement
purpose--------------------------------------- (Rupees in ‘000) ---------------------------------------
Balance as at 1 July 2019 5,441,130 4,121,376 1,999,177 3,599,089 15,160,772
Changes from financing cash flowsRepayment of long term loan - - (136,364) - (136,364)Proceeds from long term loan - - 131,415 - 131,415 Dividend paid - - - (359,049) (359,049)Total changes from financing activities - - (4,949) (359,049) (363,998)
Other changes - interest costInterest expense - 1,033,356 204,264 - 1,237,620 Interest paid - (1,102,863) (202,393) - (1,305,256)Changes in short term borrowings 1,338,327 (1,369,000) - - (30,673)Total loan related other changes 1,338,327 (1,438,507) 1,871 - (98,309)
Total equity related other changes - - - (685,670) (685,670)
Balance as at 30 June 6,779,457 2,682,869 1,996,099 2,554,370 14,012,795
2019Short term Other Short Long term Unappropriated Totalborrowings term Borrowings profit
used for cash borrowingmanagement
purpose--------------------------------------- (Rupees in ‘000) ---------------------------------------
Balance as at 1 July 2018 6,365,057 2,016,863 2,155,762 3,037,210 13,574,892
Changes from financing cash flowsRepayment of long term loan - - (180,919) - (180,919)Proceeds from long term loan - - 24,553 - 24,553 Dividend paid - - - (1,076,253) (1,076,253)Total changes from financing activities - - (156,366) (1,076,253) (1,232,619)
Other changes - interest costInterest expense - 766,411 157,881 - 924,292 Interest paid - (701,398) (158,100) - (859,498)Changes in short term borrowings (923,927) 2,039,500 - - 1,115,573 Total loan related other changes (923,927) 2,104,513 (219) - 1,180,367
Total equity related other changes - - - 1,638,132 1,638,132
Balance as at 30 June 5,441,130 4,121,376 1,999,177 3,599,089 15,160,772

180 International Industries Limited
Other price risk
At present, the company is not exposed to any other price risk.
34.5 Fair value of financial assets and liabilities
The carrying values of financial assets and financial liabilities reported in the statement of financial position approximate their fair values.
34.6 Financial instruments by categories Note 2020 2019-------- Rupees in ‘000 --------
Financial assets
Held at amortised cost - Long term deposits 3,519 3,519 - Trade debts - net of provision 10 3,558,719 2,988,083 - Trade deposits 7,906 4,352 - Receivable from K-Electric Limited 19,006 30,124 - Other receivables 12 15,000 9,523 - Cash and bank balances 14 299,469 250,700
3,903,619 3,286,301
Financial liabilities
Held at amortised cost - Long term financing 1,988,138 1,993,087 - Trade and other payables 1,151,741 2,134,250 - Accrued mark-up 75,830 143,466 - Short term borrowings 20 9,394,457 9,425,130 - Contract Liabilities 184,462 235,171 - Unpaid dividend 2,438 4,257 - Unclaimed dividend 39,044 36,596
12,836,110 13,971,957
35 CAPITAL MANAGEMENT
The objective of the Company when managing capital is to safeguard its ability to continue as a going concern so that it can continue to provide returns for shareholders and benefits for other stakeholders and to maintain a strong capital base to support the sustained development of its businesses. The Company intends to manage its capital structure by monitoring return on capital, as well as the level of dividends to ordinary shareholders.
36 MEASUREMENT OF FAIR VALUES
Management engages an independent external expert / valuer to carry out valuation of its non-financial assets (i.e. Land and Building) with sufficient regularity and obtains rate from financial institution to value derivative financial instruments. Involvement of external valuers is decided upon by management. Selection criteria include market knowledge, reputation, independence and whether professional standards are maintained.
When measuring the fair value of an asset or a liability , the Company uses valuation techniques that are appropriate in the circumstances and uses observable market data as far as possible. Fair values are categorized into different levels in a fair value hierarchy based on the inputs used in the valuation techniques as follows:
- Level 1: quoted prices (unadjusted) in active markets for identical assets or liabilities.

181Annual Report 2020
- Level 2: inputs other than quoted prices included in Level 1 that are observable for the asset or liability, either directly (i.e. as prices) or indirectly (i.e. derived from prices).
- Level 3: inputs for the asset or liability that are not based on observable market data (unobservable inputs).
If the inputs used to measure the fair value of an asset or a liability fall into different levels of the fair value hierarchy, then the fair value measurement is categorized in its entirety in the same level of the fair value hierarchy as the lowest level input that is significant to the entire measurement.
For assets and liabilities that are recognised in the unconsolidated financial statements at fair value on a recurring basis, the management recognises transfers between levels of the fair value hierarchy at the end of the reporting period during which the change has occurred. There were no transfers between different levels of fair values mentioned above.
30 June 2020Carrying amount Fair Value
Amortisedcost
Other financialliabilities
Total Level 1 Level 2 Level 3
--------------------------------------- (Rupees in ‘000) --------------------------------------- Financial assets not measured at fair valueLong term deposits 3,519 - 3,519 - - - Trade debts - net of provision 3,558,719 - 3,558,719 - - - Trade deposits 7,906 - 7,906 - - - Receivable from K-Electric Limited 19,006 - 19,006 - - - Other receivables 15,000 - 15,000 - - - Cash and bank balances 299,469 - 299,469 - - - Total 3,903,619 - 3,903,619 - - -
Financial liabilities not measured at fair value- Long term financing - 1,988,138 1,988,138 - - - - Trade and other payables - 1,151,741 1,151,741 - - - - Accrued mark-up - 75,830 75,830 - - - - Short term borrowings - 9,394,457 9,394,457 - - - - Contract Liabilities - 184,462 184,462 - - - - Unpaid dividend - 2,438 2,438 - - - - Unclaimed dividend - 39,044 39,044 - - -
- 12,836,110 12,836,110 - - -
30 June 2019Carrying amount Fair Value
Amortisedcost
Other financialliabilities
Total Level 1 Level 2 Level 3
--------------------------------------- (Rupees in ‘000) --------------------------------------- Financial assets not measured at fair valueLong term deposits 3,519 - 3,519 - - - Trade debts - net of provision 2,988,083 - 2,988,083 - - - Trade deposits 4,352 - 4,352 - - - Receivable from K-Electric Limited 30,124 - 30,124 - - - Other receivables 9,523 - 9,523 - - - Cash and bank balances 250,700 - 250,700 - - - Total 3,286,301 - 3,286,301 - - -
Financial liabilities not measured at fair value - Long term financing - 1,993,087 1,993,087 - - - - Trade and other payables - 2,134,250 2,134,250 - - - - Accrued mark-up - 143,466 143,466 - - - - Short term borrowings - 9,425,130 9,425,130 - - - - Contract Liabilities - 235,171 235,171 - - - - Unpaid dividend - 4,257 4,257 - - - - Unclaimed dividend - 36,596 36,596 - - -
- 13,971,957 13,971,957 - - -

182 International Industries Limited
The following table provides the fair value measurement hierarchy of the Company’s assets and liabilities measured at fair value:
Dates ofInter-relationship between significant unobservable inputs and fair value measurement
Assets measured at fair value valuation
Revalued property, plant and equipment
- Land and Building 30 June 2019The fair value are subject to change owing to changes in input. However, the management does not expect there to be a material sensitivity to the fair values arising from the non-observable inputs.
Management assessed that the fair values of cash & cash equivalents, other receivable, receivables from K-Electric, trade deposits, trade receivables, short term borrowings, trade and other payables, accrued mark-up, contract liabilities and unpaid / unclaimed dividends approximate their carrying amounts largely due to short-term maturities of these instruments. For long term deposit and long term financing, management consider that their carrying values approximates fair value owing to credit standing of counterparties and interest payable on borrowings are market rates. Fair values of investment in quoted subsidiary and associate are disclosed in note 7.4 to these unconsolidated financial statements.
37 TRANSACTIONS WITH RELATED PARTIES
The related parties comprise the subsidiary companies, associated undertakings, directors of the Company, key management personnel and staff retirement funds. The Company continues to have a policy whereby transactions with related parties are entered into at commercial terms, approved policy and at rate agreed under a contract/ arrangement/agreement. The contribution to defined contribution plan (provident fund) are made as per the terms of employment and contribution to the defined benefit plan (gratuity fund) are made on the basis of latest actuarial advice. Remuneration of key management personnel are in accordance with their terms of engagements.
Key management personnel are those persons having authority and responsibility for planning, directing and controlling the activities of the Company. The Company considers its Chief Executive Officer, Chief Financial Officer, Company Secretary, Non-Executive Directors and departmental heads to be its key management personnel. There are no transactions with key management personnel other than their terms of employment / entitlement.

183Annual Report 2020
2020 201937.1 Transactions with related parties -------- Rupees in ‘000 --------
SubsidiariesSales 1,295,844 1,249,821 Purchases 1,572,505 9,484,967 Investments in Subsidiary Company 17,966 - Partial manufacturing - purchases (inclusive of sales tax) 6,431 54 Cost of shared resources 65,178 78,010 Rental income 47,265 27,080 Dividend received 370,259 1,102,750 Reimbursement of expenses incurred on behalf of the Company 35,106 8,788
Associated companiesSales 56,476 12,861 Purchases 10,459 23,290 Purchase of vehicles 2,530 -Insurance premium 2,979 3,469 Insurance claim 623 6,247 Bonus shares issued 576 - Dividend paid 1,728 5,184 Dividend received 6,092 30,463 Registration and training 273 3,380 Subscription 2,177 Reimbursement of expenses 669 2,025 Donation - 5,100
Key management personnelRemuneration 276,273 287,829
Non-executive directorsDirectors’ fee 7,050 6,825 Reimbursement of Chairman’s expenses 5,903 7,200
Staff retirement fundsContributions paid 66,620 101,101
37.2 Name of the Related Party Relationship and percentage of Shareholding
International Steels Limited Subsidiary Company holds 56.3346% (2019:56.3346%)IIL Australia Pty Limited Wholly owned Subsidiary CompanyIIL Americas Inc. Wholly owned Subsidiary CompanyPakistan Cables Limited Associated Company holds 17.124% (2019:17.124%)Jubilee Life Insurance Company Limited Associated Company by nature of common directorshipPakistan Institute of Corporate Governance Associated Company by nature of common directorshipCherat Cement Company Limited Associated Company by nature of common directorshipBulleh Shah Packaging (Pvt.) Ltd. Associated Company by nature of common directorshipICI Pakistan Limited Associated Company by nature of common directorshipGul Ahmed Textile Mills Limited Associated Company by nature of common directorshipThe Pakistan Business Council Associated Company by nature of common directorshipManagement Association of Pakistan Associated Company by nature of common directorshipIndus Motor Company Limited Associated Company by nature of common directorship
37.3 Outstanding balances with related parties have been separately disclosed in trade debts. These are settled in ordinary course of business.

184 International Industries Limited
38 ANNUAL PRODUCTION CAPACITY 2020 2019-------- Metric Tones --------
Name-plate production capacity at the year end was as follows:Steel pipe 585,000 585,000 Galvanizing 120,000 150,000 Cold rolled steel strip 50,000 50,000 Polymer pipes & fittings 30,000 30,000 Stainless steel - pipe 2,400 2,400
The actual production for the year was:Steel pipe 116,660 192,936Galvanizing 50,167 75,454Polymer pipes & fittings 10,361 10,071Stainless steel - pipe 981 771
Actual production during the year was sufficient to meet the market demand.
The name-plate capacities of the plants are determined based on a certain product mix. The actual production mix was different.
39 SEGMENT REPORTING
Performance is measured based on respective segment results. Information regarding the Company’s reportable segments specified in note 4.16 is presented below.
39.1 Segment revenue and results Steel Polymer Investments Totalsegment segment segment
For the year ended 30 June 2020 ----------------------------- (Rupees in ‘000) -----------------------------
Sales 16,478,968 2,485,247 - 18,964,215 Cost of sales (15,453,725) (2,139,183) - (17,592,908)Gross profit 1,025,243 346,064 - 1,371,307
Selling and distribution expenses (740,030) (73,013) - (813,043)Administrative expenses (278,752) (19,955) - (298,707)Net impairment loss on trade debts (14,851) 14,187 (664)
(1,033,633) (78,781) - (1,112,414)
Finance cost (1,114,537) (123,788) - (1,238,325)Other operating charges (20,489) (10,213) - (30,702)
(1,135,026) (134,001) - (1,269,027)
Other income 203,975 - 376,351 580,326
(Loss) / profit before taxation (939,441) 133,282 376,351 (429,808)
Taxation (264,397)Loss after taxation (694,205)

185Annual Report 2020
Steel Polymer Investments Totalsegment segment segment
For the year ended 30 June 2019 ----------------------------- (Rupees in ‘000) -----------------------------
Sales 23,584,360 2,390,747 - 25,975,107Cost of sales (20,978,049) (2,170,742) - (23,148,791)Gross profit 2,606,311 220,005 - 2,826,316
Selling and distribution expenses (1,049,804) (91,676) - (1,141,480)Administrative expenses (277,178) (18,618) - (295,796)Impairment loss on trade debts (4,862) (905) (5,767)
(1,331,844) (111,199) - (1,443,043)
Finance cost (834,884) (89,408) - (924,292)Other operating charges (96,609) (1,755) - (98,364)
(931,493) (91,163) - (1,022,656)
Other income 599,300 - 1,133,212 1,732,512
Profit before taxation 942,274 17,643 1,133,212 2,093,129
Taxation (518,416)Profit after taxation 1,574,713
39.2 Segment assets and liabilities Steel Polymer Investment Totalsegment segment segment
----------------------------- (Rupees in ‘000) -----------------------------
As at 30 June 2020Segment assets 16,753,164 1,904,264 3,295,242 21,952,670Segment liabilities 10,396,496 1,114,031 - 11,510,527
As at 30 June 2019Segment assets 18,725,225 2,139,907 3,277,276 24,142,408Segment liabilities 11,699,298 1,226,029 - 12,925,327
Reconciliation of segment assets and liabilities with total assets and liabilities in the statement of financial position is as follows:
2020 2019-------- Rupees in ‘000 --------
Total for reportable segments assets 21,952,670 24,142,408Unallocated assets 1,186,846 1,184,763Total assets as per statement of financial position 23,139,516 25,327,171
Total for reportable segments liabilities 11,510,527 12,925,327Unallocated liabilities 2,683,460 2,452,900Total liabilities as per statement of financial position 14,193,987 15,378,227
39.3 Segment revenues reported above are revenues generated from external customers. There were no inter-segment sales during the year.
39.4 Segment assets reported above comprise of property, plant and equipment, stock-in-trade and trade debts.

186 International Industries Limited
39.5 Information about major customers
Revenue from major customers of the Polymer segment was Rs. 1,159 million (2019: Rs. 1,112 million), where as in the Steel segment was Rs. Nil (2019: Rs. Nil), whose revenue accounts for more than 10% of the Segment’s revenue.
39.6 Geographical information
The Company’s net revenue from external customers by geographical location is disclosed in note no.22.1
39.7 Management considers that revenue from its ordinary activities are shariah compliant.
39.8 As at 30 June 2020, all non-current assets of the Company are located in Pakistan with an exception of its investment in IIL-Australia Pty Limited which is domiciled in Victoria, Australia & IIL Americas Inc. which is domiciled in Ontario Canada.
40 NUMBER OF EMPLOYEES 2020 2019
The detail of number of employees are as follows:
Total employees of the Company at the year end 992 1,054Average employees of the Company during the year 1,031 1,090
41 GENERAL
41.1 Non-adjusting events after reporting date
The Board of Directors of the Company in their meeting held on 27 August 2020 has not proposed any dividend (2019: Rs.3.00 per share amounting to Rs. 358.68 million and 10% bonus shares i.e. one ordinary share for each 10 ordinary shares held, amounting to Rs. 119.89 million) for the year ended 30 June 2020.
41.2 Corresponding figures have been reclassified for the purpose of comparison and better presentation. These reclassifications have no impact on previously reported profit or equity.
42 DATE OF AUTHORISATION FOR ISSUE
These unconsoldiated financial statements were authorised for issue on 27 August 2020 by the Board of Directors of the Company.
Ehsan A. Malik Muhammad Akhtar Riyaz T. ChinoyDirector & Chairman Chief Financial Chief Executive
Board Audit Committee Officer Officer


CONSOLIDATEDFINANCIAL STATEMENTS


190 International Industries Limited
Analysis of Consolidated Financial StatementsConsolidated Statement of Financial Position
2020 2019 2018 2017 2016 2015 2014---------------------------- Rs. in million ----------------------------
Property, plant and equipment 27,720 27,224 24,032 18,814 17,565 16,050 13,272 Investments 1,113 1,015 1,004 300 270 260 183 Other non current assets 21 10 74 71 60 22 22 Current assets 35,115 34,440 30,391 23,368 14,677 13,546 17,178 Total assets 63,968 62,688 55,501 42,553 32,571 29,877 30,655
Shareholders’ equity 14,342 15,163 13,709 10,810 9,338 7,293 7,030 Non - controlling interest 5,467 5,463 4,655 3,305 2,690 2,170 2,271 Non current liabilities 8,543 10,779 10,833 6,608 6,221 6,598 3,952 Current portion of long term financing 1,898 1,201 1,383 1,307 857 1,000 900 Short term borrowings 20,915 19,616 16,772 10,939 6,767 8,780 11,154 Other Current liabilities 12,803 10,466 8,149 9,583 6,697 4,035 5,349 Total equity & liabilities 63,968 62,688 55,501 42,553 32,571 29,877 30,655
Vertical Analysis Percentage
Property, plant and equipment 43.3 43.4 43.3 44.2 53.9 53.7 43.3 Investments 1.7 1.6 1.8 0.7 0.8 0.9 0.6 Other non current assets 0.0 0.0 0.1 0.2 0.2 0.1 0.1 Current assets 54.9 54.9 54.8 54.9 45.1 45.3 56.0 Total assets 100.0 100.0 100.0 100.0 100.0 100.0 100.0
Shareholders’ equity 22.4 24.2 24.7 25.4 28.7 24.4 22.9 Non - controlling interest 8.5 8.7 8.4 7.8 8.3 7.3 7.4 Non current liabilities 13.4 17.2 19.5 15.5 19.1 22.1 12.9 Current portion of long term financing 3.0 1.9 2.5 3.1 2.6 3.3 2.9 Short term borrowings 32.7 31.3 30.2 25.7 20.8 29.4 36.4 Other Current liabilities 20.0 16.7 14.7 22.5 20.6 13.5 17.4 Total equity & liabilities 100.0 100.0 100.0 100.0 100.0 100.0 100.0
Horizontal Analysis Percentage
Property, plant and equipment 1.8 13.3 27.7 7.1 9.4 20.9 (1.1)Investments 9.7 1.1 235.3 10.9 3.9 42.2 3.4 Other non current assets 112.4 -86.9 4.0 19.7 176.9 (3.2) (13.6)Current assets 2.0 13.3 30.1 59.2 8.4 (21.1) 29.8 Total assets 2.0 13.0 30.4 30.6 9.0 (2.5) 14.1
Shareholders’ equity (5.4) 10.6 26.8 15.8 28.0 3.7 6.8 Non - controlling interest 0.1 17.3 40.8 22.9 24.0 (4.4) 15.4 Non current liabilities (20.7) (0.5) 63.9 6.2 (5.7) 67.0 (9.3)Current portion of long term financing 58.1 (13.1) 5.8 52.4 (14.3) 11.1 14.9 Short term borrowings 6.6 17.0 53.3 61.6 (22.9) (21.3) (1.1)Other Current liabilities 22.3 28.4 (15.0) 43.1 66.0 (24.6) 183.8 Total equity & liabilities 2.0 13.0 30.4 30.6 9.0 (2.5) 14.1

191Annual Report 2020
Consolidated Statement of Profit or Loss
2020 2019 2018 2017 2016 2015 2014----------------------- Rs. in million -----------------------
Net Sales 65,657 75,612 67,209 46,067 34,664 35,952 37,234 Cost of Sales (59,773) (66,300) (56,183) (36,922) (28,886) (31,996) (32,405)Gross Profit 5,883 9,312 11,027 9,145 5,778 3,956 4,829 Administrative, Selling and Distribution expenses (2,282) (2,464) (2,394) (1,997) (1,801) (1,679) (1,498)Other operating expenses (365) (632) (834) (605) (381) (101) (185)Share of profit in equity accounted investee (7) 50 35 36 18 20 16 Other operating income 208 618 338 176 204 246 196 Operating profit before financing cost 3,439 6,884 8,172 6,755 3,818 2,442 3,357 Finance cost (3,547) (2,214) (981) (680) (1,069) (1,517) (1,832)(Loss) / Profit before Taxation (109) 4,670 7,191 6,076 2,750 925 1,525 Taxation (211) (1,381) (1,922) (2,011) (795) (239) (333)(Loss) / Profit after Taxation (320) 3,289 5,268 4,065 1,955 686 1,191
Vertical Analysis Percentage
Net Sales 100.0 100.0 100.0 100.0 100.0 100.0 100.0 Cost of Sales (91.0) (87.7) (83.6) (80.1) (83.3) (89.0) (87.0)Gross Profit 9.0 12.3 16.4 19.9 16.7 11.0 13.0 Administrative, Selling and Distribution expenses (3.5) (3.3) (3.6) (4.3) (5.2) (4.7) (4.0)Other operating expenses (0.6) (0.8) (1.2) (1.3) (1.1) (0.3) (0.5)Share of profit in equity accounted investee (0.0) 0.1 0.1 0.1 0.1 0.1 0.0 Other operating income 0.3 0.8 0.5 0.4 0.6 0.7 0.5 Operating profit before financing cost 5.2 9.1 12.2 14.7 11.0 6.8 9.0 Finance cost (5.4) (2.9) (1.5) (1.5) (3.1) (4.2) (4.9)(Loss) / Profit before Taxation (0.2) 6.2 10.7 13.2 7.9 2.6 4.1 Taxation (0.3) (1.8) (2.9) (4.4) (2.3) (0.7) (0.9)(Loss) / Profit after Taxation (0.5) 4.3 7.8 8.8 5.6 1.9 3.2
Horizontal Analysis Percentage
Net Sales (13.2) 12.5 45.9 32.9 (3.6) (3.4) 10.2 Cost of Sales (9.8) 18.0 52.2 27.8 (9.7) (1.3) 8.6 Gross Profit (36.8) (15.5) 20.6 58.3 46.1 (18.1) 22.2 Administrative, Selling and Distribution expenses
(7.4) 2.9 19.9 10.9 7.2 12.1 24.9
Other operating expenses (42.3) (24.2) 37.9 58.8 278.1 (45.6) 61.0 Share of profit in equity accounted investee (113.0) 41.7 (1.5) 100.8 (10.5) 26.7 (0.7)Other operating income (66.3) 82.8 91.7 (13.5) (17.0) 25.5 5.5 Operating profit before financing cost (50.0) (15.8) 21.0 76.9 56.4 (27.3) 18.2 Finance cost 60.3 125.7 44.3 (36.4) (29.5) (17.2) 8.3 (Loss) / Profit before Taxation (102.3) (35.1) 18.4 121.0 197.2 (39.3) 32.8 Taxation (84.7) (28.2) (4.4) 152.9 232.4 (28.3) 48.8 (Loss) / Profit after Taxation (109.7) (37.6) 29.6 108.0 184.9 (42.4) 29.0
Analysis of Consolidated Financial Statements

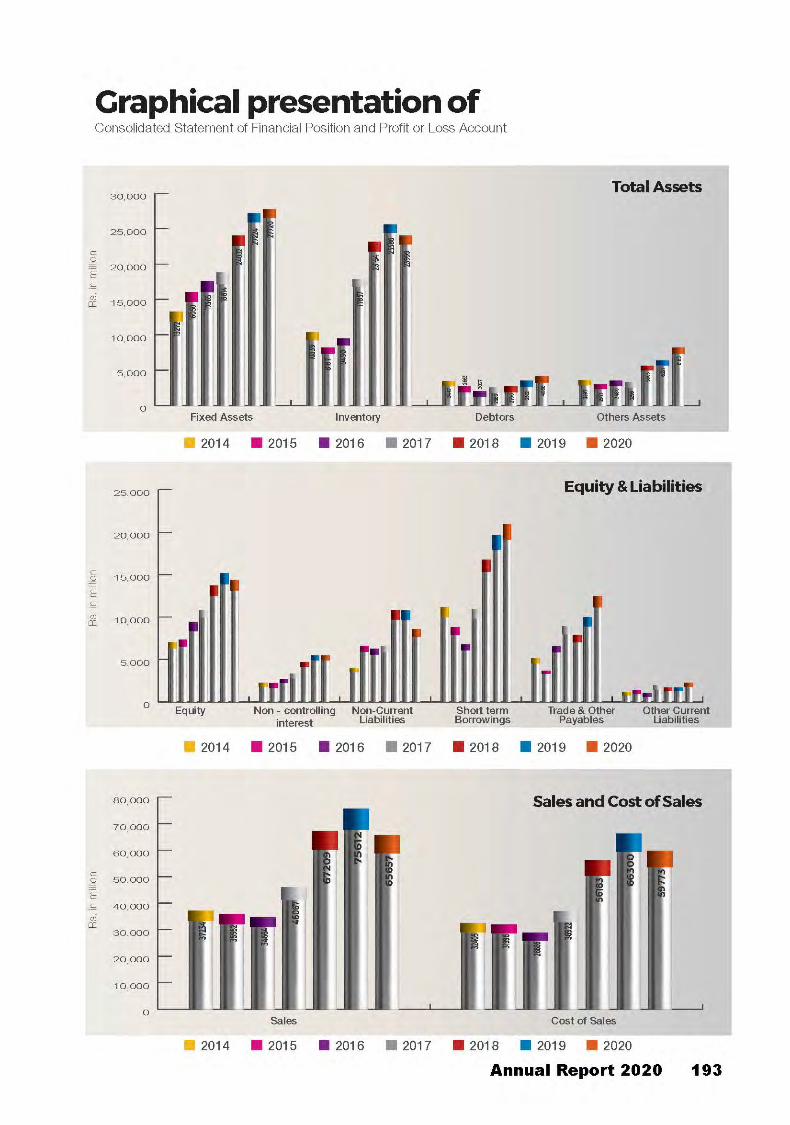

194 International Industries Limited
Consolidated Key Financial Indicators
2020 2019 2018 2017 2016 2015 2014
Profitability RatiosGross profit ratio % 8.96 12.32 16.41 19.85 16.67 11.00 12.97 Net profit to Sales % (0.49) 4.35 7.84 8.82 5.64 1.91 3.20 Cost to Income Ratio Times 2.31 1.15 0.82 0.86 1.42 1.97 1.25EBITDA Margin to Sales % 8.18 11.15 14.02 17.17 13.87 8.99 11.03 Operating Leverage % 2.75 (0.84) 0.42 1.96 (13.60) 6.18 1.75 Return on Equity with Surplus on revaluation of fixed assets % (1.62) 15.95 28.69 28.80 16.25 7.25 12.81 Return on Equity without Surplus on revaluation of fixed assets % (1.98) 19.34 35.09 38.02 22.94 9.90 17.52 Return on Capital Employed % (1.21) 11.46 19.44 21.49 11.42 4.44 9.45 Return on Total Assets % (0.50) 5.25 9.49 9.55 6.00 2.30 3.89
Liquidity RatiosCurrent ratio Times 0.99 1.10 1.16 1.07 1.02 0.98 0.99 Quick / Acid test ratio Times 0.29 0.26 0.25 0.22 0.32 0.35 0.37 Cash to Current Liabilities Times (0.42) (0.36) (0.42) (0.13) (0.24) (0.01) (0.09)Cash flow from Operations to Sales Times 0.04 0.05 (0.02) (0.01) 0.14 0.10 0.04
Activity / Turnover RatiosInventory turnover ratio Times 2.4 2.7 2.7 2.7 3.3 3.5 3.5Inventory turnover in days days 151 134 133 135 112 106 103Debtor turnover ratio Times 20.2 28.7 29.8 22.5 16.7 13.1 13.7Debtor turnover in days days 18 13 12 16 22 28 27Creditor turnover ratio Times 12.7 20.7 14.8 8.3 8.0 8.8 13.5 Creditor turnover in days days 29 18 25 44 46 41 27 Total assets turnover ratio Times 1.0 1.2 1.2 1.1 1.1 1.2 1.2Fixed assets turnover ratio Times 2.4 2.8 2.8 2.4 2.0 2.2 2.8Operating cycle in days days 141 129 121 108 88 92 103Capital employed turnover ratio Times 2.5 2.6 2.5 2.4 2.0 2.3 3.0
Investment / Market RatiosEarnings per share - basic and diluted Rs. (4.60) 18.26 28.75 22.91 11.99 4.99 7.45 Price earning ratio Times (19.93) 4.22 8.07 16.09 5.88 13.42 6.64 Dividend Yield ratio % - 8.43 3.66 2.44 6.38 5.97 6.57 Dividend Payout ratio % - 30.12 29.56 39.29 37.53 80.09 43.64 Dividend per share - Cash Rs. 0.00 5.50 8.50 9.00 4.50 4.00 3.25 Bonus shares Rs. - 1 - - - - - Dividend Cover Times - 3.32 3.38 2.55 2.66 1.25 2.29 Market value per share at the end of the year Rs. 92 77 232 369 71 67 49 Market value per share high during the year Rs. 121 248 377 406 94 87 61 Market value per share low during the year Rs. 64 71 203 86 60 45 40 Price to book ratio Times 0.19 0.15 0.5 1.04 0.26 0.27 0.19Break-up value per share with revaluation of fixed assets Rs. 109 126 114 90 78 61 59Break-up value per share without revaluation of fixed assets Rs. 81 96 86 62 49 40 38
Capital Structure RatiosFinancial leverage ratio Times 2.2 2.0 2.0 2.0 1.7 2.2 2.3Net assets per share Rs. 150 172 153 118 100 79 78Total Debt : Equity ratio Times 69 : 31 67 : 33 67 : 33 67 : 33 63 : 37 68 : 32 70 : 30Interest cover Times 1.0 3.1 8.8 10.5 3.7 1.5 1.8
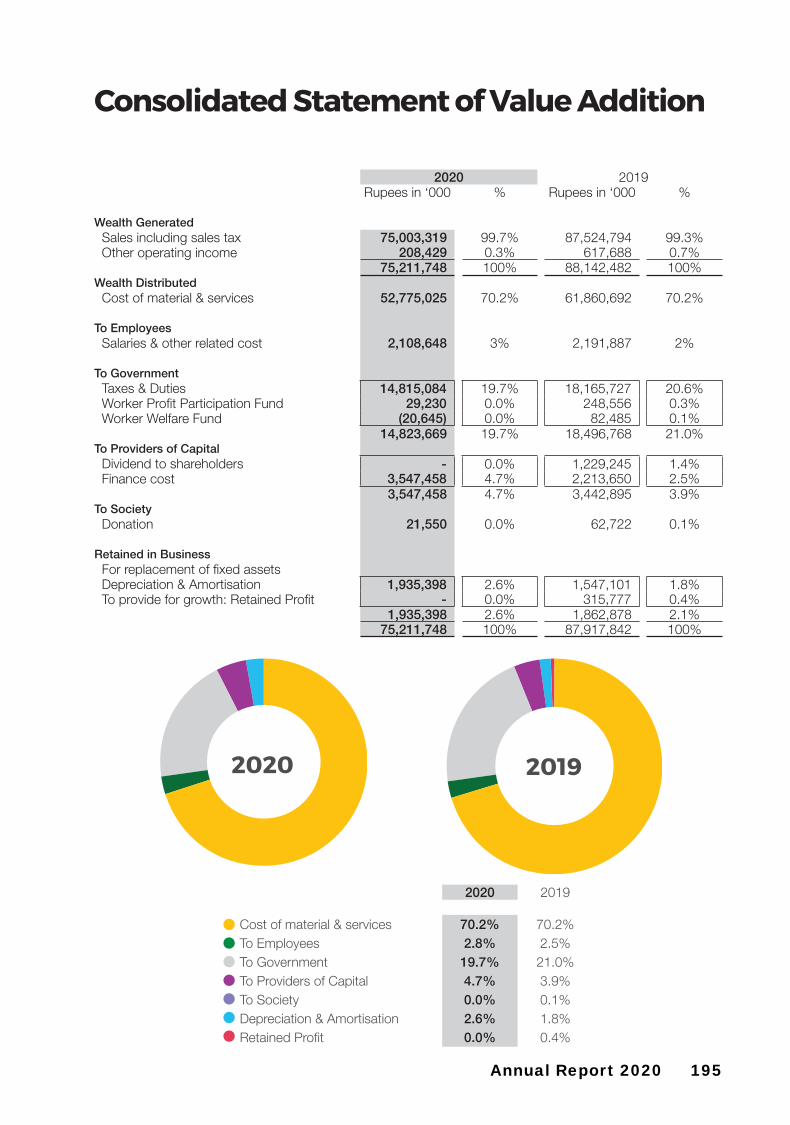
195Annual Report 2020
Consolidated Statement of Value Addition
2020 2019Rupees in ‘000 % Rupees in ‘000 %
Wealth GeneratedSales including sales tax 75,003,319 99.7% 87,524,794 99.3%Other operating income 208,429 0.3% 617,688 0.7%
75,211,748 100% 88,142,482 100%Wealth Distributed
Cost of material & services 52,775,025 70.2% 61,860,692 70.2%
To EmployeesSalaries & other related cost 2,108,648 3% 2,191,887 2%
To GovernmentTaxes & Duties 14,815,084 19.7% 18,165,727 20.6%Worker Profit Participation Fund 29,230 0.0% 248,556 0.3%Worker Welfare Fund (20,645) 0.0% 82,485 0.1%
14,823,669 19.7% 18,496,768 21.0%To Providers of Capital
Dividend to shareholders - 0.0% 1,229,245 1.4%Finance cost 3,547,458 4.7% 2,213,650 2.5%
3,547,458 4.7% 3,442,895 3.9%To Society
Donation 21,550 0.0% 62,722 0.1%
Retained in BusinessFor replacement of fixed assets Depreciation & Amortisation 1,935,398 2.6% 1,547,101 1.8%To provide for growth: Retained Profit - 0.0% 315,777 0.4%
1,935,398 2.6% 1,862,878 2.1% 75,211,748 100% 87,917,842 100%
2020 2019
Cost of material & services 70.2% 70.2%To Employees 2.8% 2.5%To Government 19.7% 21.0%To Providers of Capital 4.7% 3.9%To Society 0.0% 0.1%Depreciation & Amortisation 2.6% 1.8%Retained Profit 0.0% 0.4%
2020 2019


198 International Industries Limited
INDEPENDENT AUDITOR’S REPORTTO THE MEMBERS OF INTERNATIONAL INDUSTRIES LIMITED
REPORT ON THE AUDIT OF THE CONSOLIDATED FINANCIAL STATEMENTS
Opinion
We have audited the annexed consolidated financial statements of International Industries Limited and its subsidiaries (the Group), which comprise the consolidated statement of financial position as at 30 June 2020, and the consolidated statement of profit or loss, the consolidated statement of comprehensive income, the consolidated statement of changes in equity, the consolidated statement of cash flows for the year then ended, and notes to the consolidated financial statements, including a summary of significant accounting policies and other explanatory information.
In our opinion, consolidated financial statements give a true and fair view of the consolidated financial position of the Group as at 30 June 2020, and of its consolidated financial performance and its consolidated cash flows for the year then ended in accordance with the accounting and reporting standards as applicable in Pakistan.
Basis for Opinion
We conducted our audit in accordance with International Standards on Auditing (ISAs) as applicable in Pakistan. Our responsibilities under those standards are further described in the Auditor’s Responsibilities for the Audit of the Financial Statements section of our report. We are independent of the Group in accordance with the International Ethics Standards Board for Accountants’ Code of Ethics for Professional Accountants as adopted by the Institute of Chartered Accountants of Pakistan (the Code), and we have fulfilled our other ethical responsibilities in accordance with the Code. We believe that the audit evidence we have obtained is sufficient and appropriate to provide a basis for our opinion.
Key Audit Matters
Key audit matters are those matters that, in our professional judgment, were of most significance in our audit of the financial statements of the current period. These matters were addressed in the context of our audit of the financial statements as a whole, and in forming our opinion thereon, and we do not provide a separate opinion on these matters.
Following are the Key audit matters:

199Annual Report 2020
S. No. Key audit matters How the matters were addressed in our audit
1 Revenue recognition
Refer notes 4.10, 22 and 37 to the consolidated financial statements.
The Group generates revenue from sale of goods to domestic as well as export customers. Sales to domestic and export customers represent 84% and 16% of total sales respectively.
We identified revenue recognition as key audit matter as it is one of the key performance indicators of the Group and because of the potential risk that revenue transactions may not being recognised in the appropriate period.
Our key audit procedures, amongst others, included the following:
• We obtained an understanding of and assessed the design and operating effectiveness of controls designed to ensure that revenue is recognised in the appropriate accounting period;
• We assessed the appropriateness of the Group’s accounting policies for revenue recognition and compliance of those policies with applicable accounting standards;
• We compared on a sample basis, specific revenue transactions recorded before and after the reporting date with underlying documentation to assess whether revenue has been recognised in the appropriate accounting period; and
• We inspected credit notes issued to record sales returns subsequent to year end, if any.
2 Valuation of Trade Debts
Refer notes 4.4.2, 4.12 and 10 to the consolidated financial statements.
The Group has a significant balance of trade debts. Provision against doubtful trade debts is based on loss allowance for Expected Credit Loss (ECLs).
We identified recoverability of trade debts as a key audit matter as it involves significant management judgment in determining the recoverable amount of trade debts
Our key audit procedures amongst others, included the following:
• We obtained an understanding of the management’s basis for the determination of the provision required at the year end and the receivables collection process;
• We assessed the method used by the Group for the recognition of the impact of the application of IFRS 9 regarding provision for doubtful debts as allowable under IFRS 9 and assessing the reasonableness of assumptions of ECL; and
• We tested the accuracy of the data on a sample basis extracted from the Group’s accounting system which has been used to calculate the provision required including the subsequent recoveries.
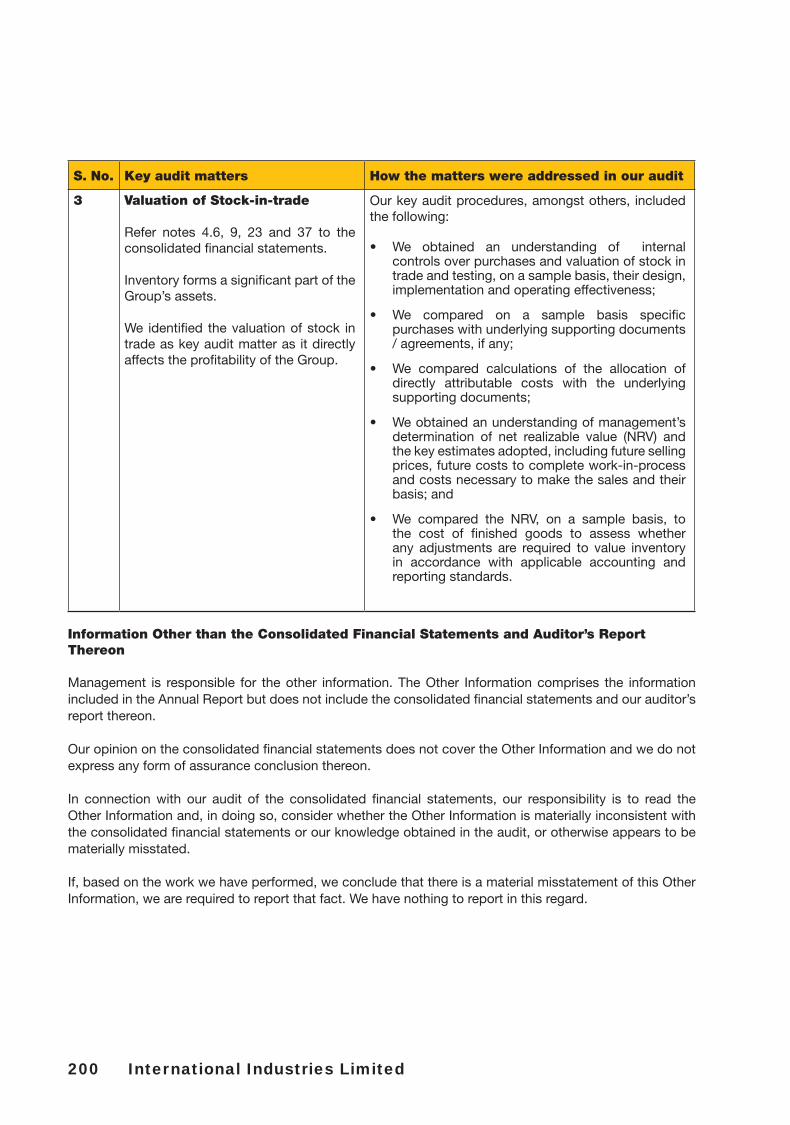
200 International Industries Limited
S. No. Key audit matters How the matters were addressed in our audit
3 Valuation of Stock-in-trade
Refer notes 4.6, 9, 23 and 37 to the consolidated financial statements.
Inventory forms a significant part of the Group’s assets.
We identified the valuation of stock in trade as key audit matter as it directly affects the profitability of the Group.
Our key audit procedures, amongst others, included the following:
• We obtained an understanding of internal controls over purchases and valuation of stock in trade and testing, on a sample basis, their design, implementation and operating effectiveness;
• We compared on a sample basis specific purchases with underlying supporting documents / agreements, if any;
• We compared calculations of the allocation of directly attributable costs with the underlying supporting documents;
• We obtained an understanding of management’s determination of net realizable value (NRV) and the key estimates adopted, including future selling prices, future costs to complete work-in-process and costs necessary to make the sales and their basis; and
• We compared the NRV, on a sample basis, to the cost of finished goods to assess whether any adjustments are required to value inventory in accordance with applicable accounting and reporting standards.
Information Other than the Consolidated Financial Statements and Auditor’s Report Thereon
Management is responsible for the other information. The Other Information comprises the information included in the Annual Report but does not include the consolidated financial statements and our auditor’s report thereon.
Our opinion on the consolidated financial statements does not cover the Other Information and we do not express any form of assurance conclusion thereon.
In connection with our audit of the consolidated financial statements, our responsibility is to read the Other Information and, in doing so, consider whether the Other Information is materially inconsistent with the consolidated financial statements or our knowledge obtained in the audit, or otherwise appears to be materially misstated.
If, based on the work we have performed, we conclude that there is a material misstatement of this Other Information, we are required to report that fact. We have nothing to report in this regard.

201Annual Report 2020
Responsibilities of Management and the Board of Directors for the Consolidated Financial Statements
Management is responsible for the preparation and fair presentation of the consolidated financial statements in accordance with the accounting and reporting standards as applicable in Pakistan and the requirements of Companies Act, 2017(XIX of 2017) and for such internal control as management determines is necessary to enable the preparation of consolidated financial statements that are free from material misstatement, whether due to fraud or error.
In preparing the consolidated financial statements, management is responsible for assessing the Group’s ability to continue as a going concern, disclosing, as applicable, matters related to going concern and using the going concern basis of accounting unless management either intends to liquidate the Group or to cease operations, or has no realistic alternative but to do so.
Board of directors are responsible for overseeing the Group’s financial reporting process.
Auditor’s Responsibilities for the Audit of the Consolidated Financial Statements
Our objectives are to obtain reasonable assurance about whether the consolidated financial statements as a whole are free from material misstatement, whether due to fraud or error, and to issue an auditor’s report that includes our opinion. Reasonable assurance is a high level of assurance, but is not a guarantee that an audit conducted in accordance with ISAs as applicable in Pakistan will always detect a material misstatement when it exists. Misstatements can arise from fraud or error and are considered material if, individually or in the aggregate, they could reasonably be expected to influence the economic decisions of users taken on the basis of these consolidated financial statements.
As part of an audit in accordance with ISAs as applicable in Pakistan, we exercise professional judgment and maintain professional skepticism throughout the audit. We also:
• Identify and assess the risks of material misstatement of the consolidated financial statements, whether due to fraud or error, design and perform audit procedures responsive to those risks, and obtain audit evidence that is sufficient and appropriate to provide a basis for our opinion. The risk of not detecting a material misstatement resulting from fraud is higher than for one resulting from error, as fraud may involve collusion, forgery, intentional omissions, misrepresentations, or the override of internal control.
• Obtain an understanding of internal control relevant to the audit in order to design audit procedures that are appropriate in the circumstances, but not for the purpose of expressing an opinion on the effectiveness of the Group’s internal control.
• Evaluate the appropriateness of accounting policies used and the reasonableness of accounting estimates and related disclosures made by management.
• Conclude on the appropriateness of management’s use of the going concern basis of accounting
and, based on the audit evidence obtained, whether a material uncertainty exists related to events or conditions that may cast significant doubt on the Group’s ability to continue as a going concern. If we conclude that a material uncertainty exists, we are required to draw attention in our auditor’s report to the related disclosures in the financial statements or, if such disclosures are inadequate, to modify our opinion. Our conclusions are based on the audit evidence obtained up to the date of our auditor’s report. However, future events or conditions may cause the Group to cease to continue as a going concern.
• Evaluate the overall presentation, structure and content of the financial statements, including the
disclosures, and whether the financial statements represent the underlying transactions and events in a manner that achieves fair presentation.

202 International Industries Limited
We communicate with the board of directors regarding, among other matters, the planned scope and timing of the audit and significant audit findings, including any significant deficiencies in internal control that we identify during our audit.
We also provide the board of directors with a statement that we have complied with relevant ethical requirements regarding independence, and to communicate with them all relationships and other matters that may reasonably be thought to bear on our independence, and where applicable, related safeguards.
From the matters communicated with the board of directors, we determine those matters that were of most significance in the audit of the consolidated financial statements of the current period and are therefore the key audit matters. We describe these matters in our auditor’s report unless law or regulation precludes public disclosure about the matter or when, in extremely rare circumstances, we determine that a matter should not be communicated in our report because the adverse consequences of doing so would reasonably be expected to outweigh the public interest benefits of such communication.
The engagement partner on the audit resulting in this independent auditor’s report is Muhammad Taufiq.
Date: September 6th, 2020 KPMG Taseer Hadi & Co.Chartered Accountants
Karachi

203Annual Report 2020

204 International Industries Limited
Note 2020 2019 ----------- Rupees in ‘000 -----------
ASSETSNon-current assetsProperty, plant and equipment 5 27,719,526 27,223,797 Right-of-use assets 14,093 - Intangible assets 6 2,907 6,087 Investment in equity accounted investee 7 1,113,256 1,014,685 Long term deposits 3,619 3,619
28,853,401 28,248,188 Current assetsStores and spares 8 882,331 826,502 Stock-in-trade 9 23,999,119 25,585,569 Trade debts 10 4,085,937 3,521,626 Advances, trade deposits and short-term prepayments 11 164,411 168,153 Receivable from K-Electric (KE) - unsecured, considered good 58,399 69,121 Other receivables 12 23,271 17,771 Sales tax receivable 4,246,047 2,596,098 Taxation - net 13 1,073,966 895,642 Cash and bank balances 14 581,074 759,543
35,114,555 34,440,025
Total assets 63,967,956 62,688,213
EQUITY AND LIABILITIES
Share capital and ReservesAuthorised capital200,000,000 (2018: 200,000,000) ordinary shares of Rs.10 each 2,000,000 2,000,000
Share capital Issued, subscribed and paid-up capital 15 1,318,819 1,198,926
Revenue reserve General reserve 2,991,258 2,991,258 Un-appropriated profit 6,411,432 7,343,772 Exchange translation reserve 4,565 4,658
Capital reserve Revaluation surplus on property, plant and equipment 16 3,616,039 3,624,344 Total Shareholders’ equity 14,342,113 15,162,958
Non - controlling interest 5,466,668 5,462,651 19,808,781 20,625,609
LIABILITIES
Non-current liabilitiesLong term financing - secured 17 6,619,457 8,069,315 Staff retirement benefits 32 82,314 118,409 Deferred taxation 18 1,829,413 2,591,517 Lease Liabilities 11,949 -
8,543,133 10,779,241 Current liabilitiesTrade and other payables 19 10,887,408 8,473,948 Contract Liabilities 1,561,899 1,494,346 Short term borrowings - secured 20 20,914,861 19,616,349 Unpaid dividend 3,246 6,642 Unclaimed dividend 39,044 36,596 Unclaimed dividend attributable to non-controlling interest 7,625 6,453 Current portion of long term financing - secured 17 1,898,497 1,200,856 Current portion of lease liabilities 3,854 -Accrued mark-up 299,608 448,173
35,616,042 31,283,363 Total liabilities 44,159,175 42,062,604
Total equity and liabilities 63,967,956 62,688,213
Contingencies and commitments 21
The annexed notes from 1 to 43 form an integral part of these consolidated financial statements.
As at 30 June 2020
STATEMENT OF FINANCIAL POSITIONConsolidated
Ehsan A. Malik Muhammad Akhtar Riyaz T. ChinoyDirector & Chairman Chief Financial Chief Executive
Board Audit Committee Officer Officer

205Annual Report 2020
For the year ended 30 June 2020
Note 2020 2019 ----------- Rupees in ‘000 -----------
Net sales 22 65,656,669 75,612,084Cost of sales 23 (59,773,426) (66,300,102)Gross profit 5,883,243 9,311,982
Selling and distribution expenses 24 (1,711,034) (1,853,103)Administrative expenses 25 (584,405) (605,104)Net Impairment gain / (loss) on trade debts 10.3 13,785 (5,618)
(2,281,654) (2,463,825)
Finance cost 26 (3,547,458) (2,213,650)Other operating charges 27 (364,959) (632,165)
(3,912,417) (2,845,815)
Other income 28 208,429 617,688 Share of profit in equity accounted investee (6,502) 49,906 Profit before taxation (108,901) 4,669,936
Taxation 29 (211,477) (1,381,044)(Loss) / profit after taxation for the year (320,378) 3,288,892
(Loss) / profit attributable to: (607,044) 2,189,614 - Owners of the Holding Company 286,666 1,099,278 - Non controlling interest (320,378) 3,288,892
(Rupees)
Restated
(Loss) / Earnings per share - basic and diluted 30 (4.60) 16.60
The annexed notes from 1 to 43 form an integral part of these consolidated financial statements.
STATEMENT OF PROFIT OR LOSSConsolidated
Ehsan A. Malik Muhammad Akhtar Riyaz T. ChinoyDirector & Chairman Chief Financial Chief Executive
Board Audit Committee Officer Officer

206 International Industries Limited
For the year ended 30 June 2020
2020 2019 ---------- Rupees in ‘000 ----------
(Loss) / profit for the year (320,378) 3,288,892
Other comprehensive income
Item that will never be reclassified to profit or loss account
Gain / (loss) on remeasurements of net defined benefit liability 67,981 (542)Adjustment to related opening deferred tax balance 595 (2,933)Related deferred tax charge for the year (9,229) 1,514
59,347 (1,961)
Gain due to addition to Surplus on revaluation during the year
Freehold Land 5.1 - 234,885
Leasehold Land 5.1 - 197,316
Building 5.1 - 645,881 Adjustment to related opening deferred tax balance (3,685) (685)Related deferred tax charge for the year - (170,165)
(3,685) 475,031
Item that will be classified to profit or loss account
Foreign operations- foreign currency translation difference (93) 4,353
Proportionate share of other comprehensive income of equity accounted investee 3,183 (3,461)
58,752 906,163
Total comprehensive income for the year (261,626) 4,195,055
Total comprehensive income attributable to:- Owners of the Holding Company (550,560) 2,944,525- Non controlling interest 288,934 1,250,530
(261,626) 4,195,055
The annexed notes from 1 to 43 form an integral part of these consolidated financial statements.
Ehsan A. Malik Muhammad Akhtar Riyaz T. ChinoyDirector & Chairman Chief Financial Chief Executive
Board Audit Committee Officer Officer
STATEMENT OF COMPREHENSIVE INCOMEConsolidated

207Annual Report 2020
Note 2020 2019-------- Rupees in ‘000 --------
CASH FLOWS FROM OPERATING ACTIVITIES(Loss) / profit before taxation (108,901) 4,669,936
Adjustments for:Depreciation of property, plant and equipment 5.2 1,931,551 1,540,427 Amortisation of intangible assets 6.1 3,847 6,674 Net Impairment gain / (loss) on trade debts 10.3 (13,785) 5,618 Provision for stores and spares 38,583 15,278 Provision for staff gratuity 32.2 73,304 66,681 Provision for compensated absences 6,476 8,323 Income on bank deposits 28 (7,877) (10,483)Gain on disposal of property, plant and equipment 28 (59,541) (79,516)Government grant income (1,423) - Share of Loss / (profit) from associated company 6,502 (49,906)Finance cost 26 3,547,458 2,213,650
5,416,194 8,386,682 Changes in:Working capital 31 1,793,870 (1,038,040)Net cash generated from operations 7,210,064 7,348,642
Translation reserve (4,979) 1,462 Finance cost paid (3,694,608) (2,000,638)Income on bank deposits received 7,877 10,484 Employee defined benefits paid 32.2 (41,418) (95,067)Payment of compensated absences (13,828) (11,490)Income taxes paid (1,164,848) (1,541,692)Net cash generated (used in) / generated from operating activities 2,298,260 3,711,701
CASH FLOWS FROM INVESTING ACTIVITIESPayment for acquisition of property, plant and equipment (2,476,404) (3,739,018)Right-of-use assets (18,627) -Investments in wholly owned subsidiary company (17,966) - Dividend income received 6,092 30,462 Long term deposits - 59,475 Proceeds from disposal of property, plant and equipment 112,439 162,634Net cash used in investing activities (2,394,466) (3,486,447)
CASH FLOWS FROM FINANCING ACTIVITIESProceeds from long term financing 131,415 624,553 Repayment of long term financing (883,632) (1,473,795)Proceeds from / (repayment of) short term borrowing - net (2,079,781) 2,308,937 Lease liabilities 15,803 -Dividends paid to non controlling interest (285,312) (858,369)Dividends paid to shareholders of the Holding Company (359,049) (1,076,253)Net cash used in financing activities (3,460,556) (474,927)
Net (decrease) / increase in cash and cash equivalents (3,556,762) (249,673)
Cash and cash equivalents at beginning of the year (11,316,541) (11,066,868)Cash and cash equivalents at end of the year (14,873,303) (11,316,541)
CASH AND CASH EQUIVALENTS COMPRISE OF:Cash and bank balances 14 581,074 759,543Short term borrowings - running finance (secured) 20 (15,454,377) (12,076,084)
(14,873,303) (11,316,541)
The annexed notes from 1 to 43 form an integral part of these consolidated financial statements.
For the year ended 30 June 2020
Ehsan A. Malik Muhammad Akhtar Riyaz T. ChinoyDirector & Chairman Chief Financial Chief Executive
Board Audit Committee Officer Officer
STATEMENT OF CASH FLOWSConsolidated
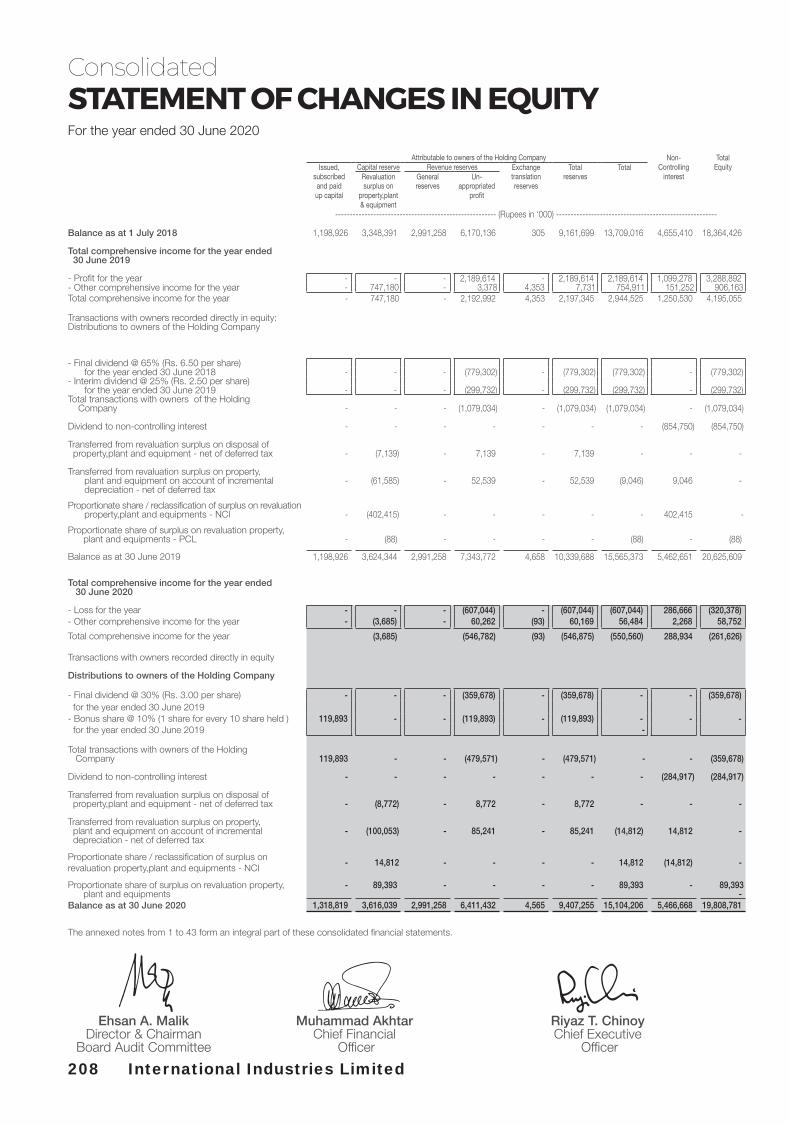
208 International Industries Limited
Attributable to owners of the Holding Company Non- TotalIssued, Capital reserve Revenue reserves Exchange Total Total Controlling Equity
subscribed Revaluation General Un- translation reserves interestand paid surplus on reserves appropriated reservesup capital property,plant profit
& equipment------------------------------------------------------- (Rupees in ‘000) -------------------------------------------------------
Balance as at 1 July 2018 1,198,926 3,348,391 2,991,258 6,170,136 305 9,161,699 13,709,016 4,655,410 18,364,426
Total comprehensive income for the year ended 30 June 2019
- Profit for the year - - - 2,189,614 - 2,189,614 2,189,614 1,099,278 3,288,892 - Other comprehensive income for the year - 747,180 - 3,378 4,353 7,731 754,911 151,252 906,163 Total comprehensive income for the year - 747,180 - 2,192,992 4,353 2,197,345 2,944,525 1,250,530 4,195,055
Transactions with owners recorded directly in equity:Distributions to owners of the Holding Company
- Final dividend @ 65% (Rs. 6.50 per share) for the year ended 30 June 2018 - - - (779,302) - (779,302) (779,302) - (779,302)
- Interim dividend @ 25% (Rs. 2.50 per share) for the year ended 30 June 2019 - - - (299,732) - (299,732) (299,732) - (299,732)
Total transactions with owners of the Holding Company - - - (1,079,034) - (1,079,034) (1,079,034) - (1,079,034)
Dividend to non-controlling interest - - - - - - - (854,750) (854,750)
Transferred from revaluation surplus on disposal of property,plant and equipment - net of deferred tax - (7,139) - 7,139 - 7,139 - - -
Transferred from revaluation surplus on property, plant and equipment on account of incremental - (61,585) - 52,539 - 52,539 (9,046) 9,046 - depreciation - net of deferred tax
Proportionate share / reclassification of surplus on revaluation property,plant and equipments - NCI - (402,415) - - - - - 402,415 -
Proportionate share of surplus on revaluation property, plant and equipments - PCL - (88) - - - - (88) - (88)
Balance as at 30 June 2019 1,198,926 3,624,344 2,991,258 7,343,772 4,658 10,339,688 15,565,373 5,462,651 20,625,609
Total comprehensive income for the year ended 30 June 2020
- Loss for the year - - - (607,044) - (607,044) (607,044) 286,666 (320,378)- Other comprehensive income for the year - (3,685) - 60,262 (93) 60,169 56,484 2,268 58,752
Total comprehensive income for the year (3,685) (546,782) (93) (546,875) (550,560) 288,934 (261,626)
Transactions with owners recorded directly in equity
Distributions to owners of the Holding Company
- Final dividend @ 30% (Rs. 3.00 per share) - - - (359,678) - (359,678) - - (359,678) for the year ended 30 June 2019- Bonus share @ 10% (1 share for every 10 share held ) 119,893 - - (119,893) - (119,893) - - - for the year ended 30 June 2019 -
Total transactions with owners of the Holding Company 119,893 - - (479,571) - (479,571) - - (359,678)
Dividend to non-controlling interest - - - - - - - (284,917) (284,917)
Transferred from revaluation surplus on disposal of property,plant and equipment - net of deferred tax - (8,772) - 8,772 - 8,772 - - -
Transferred from revaluation surplus on property, plant and equipment on account of incremental - (100,053) - 85,241 - 85,241 (14,812) 14,812 - depreciation - net of deferred tax
Proportionate share / reclassification of surplus on revaluation property,plant and equipments - NCI
- 14,812 - - - - 14,812 (14,812) -
Proportionate share of surplus on revaluation property, - 89,393 - - - - 89,393 - 89,393 plant and equipments - Balance as at 30 June 2020 1,318,819 3,616,039 2,991,258 6,411,432 4,565 9,407,255 15,104,206 5,466,668 19,808,781
The annexed notes from 1 to 43 form an integral part of these consolidated financial statements.
For the year ended 30 June 2020
STATEMENT OF CHANGES IN EQUITYConsolidated
Ehsan A. Malik Muhammad Akhtar Riyaz T. ChinoyDirector & Chairman Chief Financial Chief Executive
Board Audit Committee Officer Officer

209Annual Report 2020
For the year ended 30 June 2020
1. THE GROUP AND ITS OPERATIONS
1.1 The Group consists of International Industries Limited, (the Holding Company) and its 56.33% owned subsidiary International Steels Limited and its wholly owned foreign subsidiary IIL Australia PTY Limited [together referred to as “the Group” and individually as “Group entities”] and the Holding Company’s 17.124% interest in equity accounted investee namely Pakistan Cables Limited (PCL).
1.2 International Industries Limited (“the Holding Company”) was incorporated in Pakistan in 1948 and is quoted on the Pakistan Stock Exchange. The Holding Company is engaged in the business of manufacturing and marketing of galvanized steel pipes, precision steel tubes, API line pipes, polymer pipes and fittings. The registered office of the Holding Company is situated at 101, Beaumont Plaza, 10, Beaumont Road, Karachi - 75530.
The manufacturing facilities of the Holding Company are situated as follows:
a) LX 15-16, Landhi Industrial Area, Karachib) Survey # 402,405-406, Dehshrabi Landhi Town, Karachic) 22 KM, Sheikhupura Road, Lahore
Sales office are located at Lahore, Islamabad, Faisalabad, Peshawar and Multan.
1.3 International Steels Limited (“the Subsidiary Company”) was incorporated on 03 September 2007 as a public unlisted company limited by shares under the repealed Companies Ordinance, 1984 and is domiciled in the province of Sindh. Subsequent to the sale of shares by the Holding Company to general public under Initial Public Offer, the Subsidiary Company was listed on the Pakistan Stock Exchange on 1 June 2011. The primary activities of the Subsidiary Company are business of manufacturing of cold rolled steel coils and galvanized sheets. The Subsidiary Company commenced commercial operations on 1 January 2011. The registered office of the Subsidiary Company is situated at 101, Beaumont Plaza, 10, Beaumont Road, Karachi - 75530. The Holding Company has 56.33% ownership in International Steels Limited.
The manufacturing facilities of the Subsidiary Company is situated at 399-405, Rehri Road, Landhi Industrial Area, Karachi and having sales offices located at Lahore, Islamabad and Multan.
1.4 IIL Australia Pty. Limited (“the foreign Subsidiary”) was incorporated in Australia on 02 May 2014. It is engaged in the business of distribution and marketing of galvanized steel pipes, precision steel tubes and pre-galvanized pipes. The registered office and sales office of the foreign Subsidiary Company is situated at 101-103, Abbot Road, Hallam, Victoria 3803, Australia. IIL Australia Pty. Limited is a wholly owned foreign subsidiary of the Holding Company.
1.5 IIL Americas Inc.,(“the foreign subsidiary”) was incorporated in Canada on 08 October 2019. It is engaged in the business of distribution and marketing of galvanized steel pipes. Precision steel tubes and pre-galvanized pipes. The registered office and sales office of the foreign Subsidiary Company is situated at 36 Gerigs St.Scarborough Ontario, Canada MIL 0B9.
1.6 Detail of equity accounted investee is given in note 7 to these consolidated financial statement.
1.7 Impact of COVID-19As in the rest of the world, COVID-19 adversely affected lifestyles and business operation in Pakistan. The Group compiled with the SOPs prescribed by Federal Government and Provincial Government. Sales and production activities were affected during lockdown, however, the factories reopened after necessary permission to produce orders for exports and essential services. The Group remained up to date in all its financial commitments. The management believes that the going concern assumption of the Group remains valid.
The Holding Company and the Subsidiary Company availed employee refinance facility for payment of salaries and wages under SBP’s infrastructure, Housing & SME Finance department (IH&SMEFD) Circular No. 6 of 2020 dated Apr 10, 2020.
NOTES TO THE CONSOLIDATED FINANCIAL STATEMENTS

210 International Industries Limited
2 BASIS OF PREPARATION
These consolidated financial statements have been prepared from the information available in the audited separate financial statements of the Holding Company, the Subsidiary Company and the foreign Subsidiary Company for the year ended 30 June 2020. Details regarding the financial information of equity accounted investee used in the preparation of these consolidated financial statements are given in note 7 to these consolidated financial statements.
2.1 Statement of compliance
These consolidated financial statements have been prepared in accordance with approved accounting standards as applicable in Pakistan. The accounting and reporting standards as applicable in Pakistan for these financial reporting compromise of :
- International Financial Reporting (IFRS) issued by the International Accounting Standard Board (IASB) as notified under the Companies Act, 2017; and
- Provisions of and directives issued under the Companies Act 2017.
Where the provisions of and directives issued under the Companies Act 2017 differ with the requirements of IFRS, the provisions of and directives issued under the Companies Act 2017 have been followed.
2.2 Basis of measurement
These consolidated financial statements have been prepared under the historical cost convention except for the liabilities under defined benefit plan (gratuity) that is determined based on the present value of defined benefit obligation less fair value of plan assets, land & buildings thereon that are stated at fair values determined by an independent valuer and derivative financial instruments which are stated at fair value.
2.3 Functional and presentation currency
These consolidated financial statements are presented in Pakistan Rupees which is the Holding Company’s functional and presentation currency and have been rounded to the nearest thousand Rupee, unless otherwise indicated.
2.4 Use of estimates and judgments
The preparation of the consolidated financial statements in conformity with accounting and reporting standards, as applicable in Pakistan, requires management to make judgments, estimates and assumptions that affect the application of the accounting policies and the reported amounts of assets, liabilities, income and expenses. The estimates and associated assumptions are based on historical experience and various other factors that are believed to be reasonable under the circumstances, the results of which form the basis of making the judgments about the carrying values of assets and liabilities that are not readily apparent from other sources. Actual results may differ from these estimates.
The estimates underlying the assumptions are reviewed on an ongoing basis. Revisions to accounting estimates are recognised in the period in which the estimate is revised if the revision affects only that period, or in the period of the revision and future periods if the revision affects both current and future periods. Information about the judgments made by the management in the application of the accounting policies, that have the most significant effect on the amount recognised in these consolidated financial statements, assumptions and estimation uncertainties with significant risk of material adjustment to the carrying amount of asset and liabilities in the next year are described in the following notes:
- Property, plant and equipment and intangible assets (notes 4.2 and 4.3).- Trade debts, advances and other receivables (note 4.4.2)- Derivative financial instruments (note 4.4.7 and 4.4.8)- Stores and spares (note 4.5)- Stock-in-trade (note 4.6)
211Annual Report 2020
- Taxation (note 4.7)- Staff retirement benefits (note 4.8)- Impairment (note 4.12)- Provisions (note 4.13)- Contingent liabilities (note 4.14)
3 New or Amendments / interpretations to existing standards and Forthcoming Requirements yet effective
There are new and amended standards and interpretations that are mandatory for accounting periods beginning 01 July 2019 other than those disclosed in note 4.2, are considered not to be relevant or do not have any significant effect on the Consolidated financial statements and are therefore not stated in these Consolidated financial statements.
3.1 Standards, interpretations and amendments to published approved accounting standards that are not yet effective:
The following International Financial Reporting Standards (IFRS Standards) as notified under the Companies Act, 2017 and the amendments and interpretations thereto will be effective for accounting periods beginning on or after 01 January 2020:
Amendment to IFRS 3 ‘Business Combinations’ – Definition of a Business (effective for business combinations for which the acquisition date is on or after the beginning of annual period beginning on or after 1 January 2020). The IASB has issued amendments aiming to resolve the difficulties that arise when an entity determines whether it has acquired a business or a group of assets. The amendments clarify that to be considered a business, an acquired set of activities and assets must include, at a minimum, an input and a substantive process that together significantly contribute to the ability to create outputs. The amendments include an election to use a concentration test. The standard is effective for transactions in the future and therefore would not have an impact on past financial statements.
Amendments to IAS 1 Presentation of Financial Statements and IAS 8 Accounting Policies, Changes in Accounting Estimates and Errors (effective for annual periods beginning on or after 1 January 2020). The amendments are intended to make the definition of material in IAS 1 easier to understand and are not intended to alter the underlying concept of materiality in IFRS Standards. In addition, the IASB has also issued guidance on how to make materiality judgments when preparing their general purpose financial statements in accordance with IFRS Standards.
On 29 March 2018, the International Accounting Standards Board (the IASB) has issued a revised Conceptual Framework for Financial Reporting which is applicable immediately contains changes that will set a new direction for IFRS in the future.. The Conceptual Framework primarily serves as a tool for the IASB to develop standards and to assist the IFRS Interpretations Committee in interpreting them. It does not override the requirements of individual IFRSs and any inconsistencies with the revised Framework will be subject to the usual due process – this means that the overall impact on standard setting may take some time to crystallise. The companies may use the Framework as a reference for selecting their accounting policies in the absence of specific IFRS requirements. In these cases, companies should review those policies and apply the new guidance retrospectively as of 1 January 2020, unless the new guidance contains specific scope outs.
Interest Rate Benchmark Reform which amended IFRS 9, IAS 39 and IFRS 7 is applicable for annual financial periods beginning on or after 1 January 2020. The G20 asked the Financial Stability Board (FSB) to undertake a fundamental review of major interest rate benchmarks. Following the review, the FSB published a report setting out its recommended reforms of some major interest rate benchmarks such as IBORs. Public authorities in many jurisdictions have since taken steps to implement those recommendations. This has in turn led to uncertainty about the long-term viability of some interest rate benchmarks. In these amendments, the term ‘interest rate benchmark reform’ refers to the market-wide reform of an interest rate benchmark including its replacement with an alternative benchmark rate, such as that resulting from the FSB’s recommendations set out in its July 2014 report ‘Reforming Major Interest Rate Benchmarks’ (the reform). The amendments made provide relief from the potential effects of the uncertainty caused by the reform. A company shall apply the exceptions to all hedging relationships directly affected by interest rate benchmark reform. The amendments are not likely to affect the financial statements of the Group.

212 International Industries Limited
Classification of liabilities as current or non-current (Amendments to IAS 1) effective for the annual period beginning on or after 1 January 2022. These amendments in the standards have been added to further clarify when a liability is classified as current. The standard also amends the aspect of classification of liability as non-current by requiring the assessment of the entity's right at the end of the reporting period to defer the settlement of liability for at least twelve months after the reporting period. An entity shall apply those amendments retrospectively in accordance with IAS 8.
Onerous Contracts - Cost of Fulfilling a Contract (Amendments to IAS 37) effective tor the annual period beginning on or after 1 January 2022 amends IAS 1 by mainly adding paragraphs which clarifies what comprise the cost of fulfilling a contract, Cost of fulfilling a contract is relevant when determining whether a contract is onerous. An entity is required to apply the amendments to contracts for which it has not yet fulfilled all its obligations at the beginning of the annual reporting period in which it first applies the amendments (the date of initial application). Restatement of comparative information is not required, instead the amendments require an entity to recognise the cumulative effect of initially applying the amendments as an adjustment to the opening balance of retained earnings or other component of equity, as appropriate, at the date of initial application.
Property, Plant and Equipment: Proceeds before Intended Use (Amendments to IAS 16) effective for the annual period beginning on or after 1 January 2022. Clarifies that sales proceeds and cost of items produced while bringing an item of property, plant and equipment to the location and condition necessary for it to be capable of operating in the manner intended by management e.g. when testing etc., are recognised in profit or loss in accordance with applicable Standards. The entity measures the cost of those items applying the measurement requirements of IAS 2. The standard also removes the requirement of deducting the net sales proceeds from cost of testing. An entity shall apply those amendments retrospectively, but only to items of property, plant and equipment that are brought to the location and condition necessary for them to be capable of operating in the manner intended by management on or after the beginning of the earliest period presented in the financial statements in which the entity first applies the amendments. The entity shall recognise the cumulative effect of initially applying the amendments as an adjustment to the opening balance of retained earnings (or other component of equity, as appropriate) at the beginning of that earliest period presented.
ANNUAL IMPROVEMENTS TO IFRS STANDARDS 2018-2020 CYCLE
The following annual improvements to IFRS standards 2018-2020 are effective for annual reporting periods beginning on or after 1 January 2022.
IFRS 9- The amendment clarifies that an entity includes only fees paid or received between the entity {the borrower) and the lender, including fees paid or received by either the entity or the lender on the other's behalf, when it applies the '10 per cent' test in paragraph 83.3.6 of IFRS 9 in assessing whether to derecognise a financial liability.
IFRS 16 - The amendment partially amends Illustrative Example 13 accompanying IFRS 16 by excluding the illustration of reimbursement of leasehold improvements by the lessor. The objective of the amendment is to resolve any potential confusion that might arise in lease incentives.
IAS 41 - The amendment removes the requirement in paragraph 22 of IAS 41 for entities to exclude taxation cash flows when measuring the fair value of a biological asset using a present value technique.
The above improvements to standards are not likely to have material / significant impact on Company's financial statements.
4 SIGNIFICANT ACCOUNTING POLICIES
Except as described below in note 4.1, the significant accounting policies are consistently applied in the preparation of these financial statements are the same as those applied in earlier periods presented.

213Annual Report 2020
4.1 IFRS 16 ‘Leases’
IFRS 16 has introduced a single on-balance sheet accounting model for lessees. As a result, the entity, as a lessee has recognised right-of-use asset representing its rights to use the underlined assets and lease liabilities representing its obligation to make lease payments.
The Company has applied IFRS 16 using the modified retrospective approach. Under this approach the cumulative effect of initial application has been recognised in retained earnings at 1 July 2019. Accordingly, the comparative information presented for 2019 has not been restated - i.e. it is presented, as previously reported, under IAS 17 and related interpretations. The details of the changes in accounting policies are disclosed below.
A contract is, or contains a lease if the contract conveys a right to control the use of an identified asset for a period of time in exchange for consideration. The entity mainly leases properties for its operations. The entity recognises a right-of-use asset and lease liability at the lease commencement date. The right-of-use asset is initially measured at cost, and subsequently at cost less any accumulated depreciation and impairment losses if any, and adjusted for certain remeasurements of the lease liability. The right-of-use asset is depreciated using the straight line method over the shorter of the lease term and the asset’s useful life. The estimated useful lives of assets are determined on the same basis as that for owned assets. In addition. the right-of-use asset is periodically reduced by impairment losses, if any.
The lease liability is initially measured at the present value of the lease payments that are not paid at the commencement date. Discounted using the interest rate implicit in the lease or, if that rate cannot be readily determined, the entity’s incremental borrowing rate. The lease liability is subsequently increased by the interest cost on the lease liability and decreased by lease payments made. It is re-measured when there is a change in future lease payments arising from a change in an index or rate, a change in assessment of whether extension option is reasonably certain to be exercised or a termination option is reasonably certain not to be exercised.
The lease payments associated with these leases are recognised as an expenses on a straight-line basis over the lease term. The right-of-use assets are presented as separate line item in the statement of financial position.
4.2 Property, plant and equipment
4.2.1 Operating assets and depreciation
Initial Recognition
The cost of an item of property, plant and equipment is recognised as an asset if it is probable that future economic benefits associated with the item will flow to the group entities and the cost of such item can be measured reliably.
Recognition of the cost in the carrying amount of an item of plant and equipment ceases when the item is in the location and condition necessary for it to be capable of operating in the manner intended by the management.
Measurement
Property, plant and equipment (except freehold and leasehold land and buildings) are stated at cost less accumulated depreciation and impairment losses, if any. Freehold land are stated at revalued amounts and buildings on freehold land are stated at revalued amounts less accumulated depreciation. The value assigned to leasehold lands is not amortised as the respective leases are expected to be renewed for further periods on payment of relevant rentals. The costs of Property, plant and equipment include:
(a) its purchase price including import duties, non-refundable purchase taxes after deducting trade discounts and rebates; and
(b) any other costs directly attributable to bringing the asset to the location and condition necessary for it to be capable of operating in the manner intended by management.

214 International Industries Limited
(c) Borrowing costs, if any.
When parts of an item of property, plant and equipment have different useful lives, they are accounted for as separate items (major components) of property, plant and equipment.
Subsequent expenditure
Expenditure incurred to replace a significant component of an item of plant and equipment is capitalised and the asset so replaced is retired. Other subsequent expenditure is capitalised only when it is probable that future economic benefits associated with the item will flow to the group entities and the cost of the items can be measured reliably. All other expenditure (including repairs and normal maintenance) is recognised in the consolidated statement of profit or loss account as an expense when it is incurred.
Depreciation
Depreciation on all items except for land is charged on straight line method at the rates specified in respective note to the consolidated financial statements and is generally recognised in the consolidated statement of profit or loss.
Depreciation on addition is charged from the month the asset is available for use up to the month prior to disposal.
Depreciation methods, useful lives and residual values of each part of property, plant and equipment that is significant in relation to the total cost of the asset are reviewed, and adjusted if appropriate, at each reporting date.
Revaluation surplus
Revaluation of land and building is carried out with sufficient regularity to ensure that the carrying amount of assets does not differ materially from the fair value. Any revaluation increase in the carrying amount of land and building is recognised, net of tax, in the consolidated other comprehensive income and presented as a separate component of equity as " Revaluation surplus on property, plant and equipment " except to the extent that it reverses a revaluation decrease / deficit for the same asset previously recognised in the consolidated statement of profit or loss, in which case the increase is first recognised in the consolidated statement of profit or loss to the extent of the decrease previously charged. Any decreases that reverse previous increases of the same asset are first recognised in other comprehensive income to the extent of the remaining surplus attributable to the asset, all other decreases are charged to the consolidated statement of profit or loss. The revaluation reserve is not available for distribution to the shareholders. Each year, the difference between depreciation based on the revalued carrying amount of the asset charged to consolidated statement of profit or loss and depreciation based on the asset's original cost, net of tax, is reclassified from revaluation surplus to retained earnings.
Gains and losses on disposal
Gains and losses on disposal of assets are taken to the consolidated statement of profit or loss, and the related revaluation surplus on property, plant and equipment, if any, is transferred directly to unappropriated profit.
4.2.2 Capital work-in-progress
Capital work-in-progress is stated at cost less impairment loss, if any and consists of expenditure incurred (including any borrowing cost, if applicable) and advances made in the course of their construction and installation. Transfers are made to relevant asset category as and when assets are available for intended use.
4.3 Intangible assets
An intangible asset is recognised as an asset if it is probable that future economic benefits attributable to the asset will flow to the group entities and the cost of such asset can be measured reliably.

215Annual Report 2020
Costs directly associated with identifiable software that will have probable economic benefits exceeding, beyond one year, are recognised as an intangible asset.
Infinite Intangible
These are stated at cost less impairment, if any.
Definite Intangible
a) These are stated at cost less accumulated amortisation and impairment, if any.
b) Intangible assets are amortised on straight line basis over its estimated useful life(s) (refer note 6).
c) Amortisation on additions during the financial year is charged from month in which the asset is put to use, whereas no amortisation is charged from the month the asset is disposed-off.
4.4 Financial Instruments
Initial measurement of financial asset
Financial assets are classified into following three categories:
- fair value through other comprehensive income (FVOCI);
- fair value through profit or loss (FVTPL); and
- measured at amortised cost.
A financial asset is initially measured at fair value plus, for an item not at FVTPL, transaction costs that are directly attributable to its acquisition.
Subsequent measurement
Debt Investments at FVOCI These assets are subsequently measured at fair value. Interest / markup income calculated using the effective interest method, foreign exchange gains and losses and impairment are recognised in the consolidated statement of profit or loss. Other net gains and losses are recognised in other comprehensive income. On de-recognition, gains and losses accumulated in other comprehensive income are reclassified to the consolidated statement of profit or loss.
Equity Investments at FVOCI These assets are subsequently measured at fair value. Dividends are recognised as income in the consolidated statement of profit or loss unless the dividend clearly represents a recovery of part of the cost of the investment. Other net gains and losses are recognised in other comprehensive income and are never reclassified to the consolidated statement of profit or loss.
Financial assets at FVTPL These assets are subsequently measured at fair value. Net gains and losses, including any interest / markup or dividend income, are recognised in the consolidated statement of profit or loss.
Financial assets measured atamortised cost
These assets are subsequently measured at amortised cost using the effective interest method. The amortised cost is reduced by impairment losses. Interest / markup income, foreign exchange gains and losses and impairment are recognised in the consolidated statement of profit or loss.
216 International Industries Limited
4.4.1 Non-derivative Financial assets
All non-derivative financial assets are initially recognised on trade date i.e. date on which group entities become party to the respective contractual provisions. Non-derivative financial assets comprise loans and receivables that are financial assets with fixed or determinable payments that are not quoted in active markets and includes trade debts, advances, other receivables and cash and cash equivalent. Group entities derecognise the financial assets when the contractual rights to the cash flows from the asset expires or it transfers the rights to receive the contractual cash flows in a transaction in which substantially all of the risk and rewards of ownership of the financial assets are transferred or it neither transfers nor retain substantially all of the risks and rewards of ownership and does not retain control over the transferred asset.
4.4.2 Trade debts, advances and other receivables
These are classified at amortised cost and are initially recognised when they are originated and measured at fair value of consideration receivable. These assets are written off when there is no reasonable expectation of recovery. Actual credit loss experience over past years is used to base the calculation of expected credit loss.
4.4.3 Cash and cash equivalents
For the purpose of presentation in statement of cash flow, cash and cash equivalents includes cash in hand, balances with banks and investments with maturities of less than three months or less from acquisition date that are subject to insignificant risk of changes in fair value and short term borrowings availed by group entities, which are repayable on demand and form an integral part of the group entities’ cash management.
4.4.4 Financial Liabilities
Financial liabilities are initially recognised on trade date i.e. date on which an group entities become party to the respective contractual provisions. Financial liabilities include mark-up bearing borrowings and trade and other payables. Group entities derecognise the financial liabilities when contractual obligations are discharged or cancelled or expire. Financial liability other than at fair value through profit or loss are initially measured at fair value less any directly attributable transaction cost. Subsequent to initial recognition, these liabilities are measured at amortised cost using effective interest rate method.
4.4.5 Mark-up bearing borrowings and borrowing costs
Mark-up bearing borrowings are recognised initially at fair value, less attributable transaction costs. Subsequent to initial recognition, mark-up bearing borrowings are stated at amortised cost, while the difference between the cost (reduced for periodic payments) and redemption value is recognised in the consolidated statement of profit or loss over the period of the borrowings using the effective interest method.
Borrowing costs that are directly attributable to the acquisition, construction or production of a qualifying asset are capitalised as part of the cost of the relevant asset.
4.4.6 Trade and other payables
Trade and other payables are recognised initially at fair value plus directly attributable costs, if any, and subsequently measured at amortised costs.
4.4.7 Derivative financial instruments - other than hedging
Derivatives that do not qualify for hedge accounting are recognised in the statement of financial position at estimated fair value with corresponding effect to the consolidated statement of profit or loss. Derivative financial instruments are carried as assets when fair value is positive and liabilities when fair value is negative.

217Annual Report 2020
4.4.8 Derivative financial instruments - cash flow hedges
When a derivative is designated as a cash flow hedging instrument, the effective portion of changes in fair value of the derivative is recognised in other comprehensive income and accumulated in hedging reserve. Any ineffective portion of changes in fair value of derivative is recognised immediately in the consolidated statement of profit or loss. The amount accumulated in equity is removed therefrom and included in the initial carrying amount of non-financial asset upon recognition of non-financial asset.
The fair value of forward exchange contracts is estimated using appropriate valuation techniques. These are carried as assets when the fair value is positive and liabilities when the fair value is negative.
4.4.9 Offsetting of financial assets and financial liabilities
Financial assets and financial liabilities are offset and the net amount is reported in the consolidated financial statements only when group entities has currently legally enforceable right to set-off the recognised amounts and the group entities intend either to settle on a net basis or to realize the assets and to settle the liabilities simultaneously. The legally enforceable right must not be contingent on future events and must be enforceable in normal course of business and in the event of default, insolvency or winding up of the group entities’ or the counter parties.
4.5 Stores and spares
Stores and spares are stated at lower of weighted average cost and net realizable value, less provision for impairment, if any. Items in transit are valued at cost comprising invoice value plus other charges incurred thereon.
Provision is made for obsolete and slow moving spares older than one year and is recognised in the consolidated statement of profit or loss.
4.6 Stock-in-trade
These are valued at lower of cost and net realizable value. Cost is determined under the weighted average basis. Cost comprises all costs of purchase, conversion and other costs incurred in bringing the inventories to their present location and condition. Net realizable value signifies the estimated selling price in the ordinary course of the business less net estimated cost of completion and selling expenses. Scrap and by-product is valued at estimated realizable value.
4.7 Taxation
Income tax expense comprises current and deferred tax. Income tax expense is recognised in the consolidated statement of profit or loss, except to the extent that it relates to items recognised directly in equity or in other comprehensive income, in which case it is recognised in equity or in other comprehensive income respectively. In making the estimates for income taxes currently payable by an group entities, the current income tax law and the decisions of appellate authorities on certain issues in the past are considered.
Current
Current tax is the expected tax payable or receivable on the taxable income or loss for the year, using tax rates enacted or substantively enacted at the reporting date, and any adjustment to tax payable or receivable in respect of previous years.
Provisions for current taxation is based on taxability of certain income streams of the group entities, other than the wholly owned foreign subsidiary under presumptive / final tax regime at the applicable tax rates and remaining income streams chargeable at current rate of taxation under the normal tax regime and / or minimum tax liability or alternate corporate tax as applicable, after taking into account tax credits and tax rebates available, if any.

218 International Industries Limited
Deferred tax
Deferred tax is recognised using the balance sheet liability method, providing for temporary difference between the carrying amounts of assets and liabilities for financial reporting purposes and the amounts used for taxation purposes. The amount of deferred tax provided is based on the expected manner of realization or settlement of the carrying amount of assets and liabilities using the tax rates enacted or substantively enacted at the balance sheet date.
The group entities recognise a deferred tax asset to the extent that it is probable that taxable profits for the foreseeable future will be available against which the assets can be utilised. Deferred tax assets are reduced to the extent that it is no longer probable that the related tax benefit will be realised.
4.8 Staff retirement benefits
Defined benefit plan
The Holding Company and Subsidiary Company (herein after referred to as “Companies” in this note) provide gratuity benefit to all their respective permanent employees who have completed their minimum qualifying period of service i.e. three years (except in case of workers where minimum qualifying period of service is six months). For executives and officers having total service of over twenty years, the benefit is available at 1 month’s basic salary (eligible salary) for each completed year of service. For executives and officers having total service of less than twenty years, the benefit is available at half month’s basic salary (eligible salary) for each completed year of service. For workers, the benefit is available at 1 month’s gross salary less conditional allowances (eligible salary) for each completed year of service.
Companies’ obligations are determined through actuarial valuations carried out under the “Projected Unit Credit Method”. Remeasurements which comprise actuarial gains or losses and the return on plan assets (excluding interest) are recognised immediately in other comprehensive income in the consolidated financial statements.
Companies determine their respective net interest expenses (income) on the net defined benefit liability (asset) for the period by applying the discount rate used to measure the defined benefit obligation at the beginning of the annual period to the then net defined benefit liability (asset), taking into account any changes in the net defined liability (asset) during the period as a result of contribution and benefit payments. Net interest expense and current service cost are recognised in the consolidated statement of profit or loss account. The latest actuarial valuations were conducted at the balance sheet date by qualified professional firms of actuaries.
Defined contribution plan
Companies provide provident fund to all its officers. Equal contributions are made, both by the Companies and their employees, at the rate of 8.33% of basic salary and cost of living allowance and the same is charged to the consolidated statement of profit or loss account.
Compensated absences
The liability for accumulated compensated absences of employees is recognised in the period in which employees render service that increases their entitlement to future compensated absences.
4.9 Foreign currency translation
Transactions in foreign currencies are translated into Pak Rupees at the rates of exchange approximating those prevailing on the date of transactions. Monetary assets and liabilities in foreign currencies are translated into Pak Rupees at the rates of exchange ruling on the reporting date. Exchange differences are included in the consolidated statement of profit or loss currently.

219Annual Report 2020
4.10 Revenue recognition
- Domestic sales are recognised as revenue when invoiced with the transfer of control of goods, which coincides with delivery.
- Export sales are recognised as revenue when invoiced with the transfer of control of goods, which coincides either with the date of bill of lading or upon delivery to customer or its representative, based on terms of arrangement.
- Revenue from power generation plant on account of sales of surplus electricity is recognised on transmission of electricity to K-Electric Limited (KE).
- Toll manufacturing / Partial manufacturing income is recognised when related services are rendered.
- Dividend income is recognised when the right to receive payment is established.
- Gains / losses arising on sale of investments are included in the consolidated statement of profit or loss in the period in which they arise.
- Service income is recognised when services are rendered.
- Rental income is recognised on straight line basis over the term of the respective lease agreement.
4.11 Income on bank deposits and finance cost
Finance income and finance cost includes interest income and interest expense. Interest income or expense is recognised using the effective interest method.
4.13 Impairment
4.13.1 Financial assets
Loss allowances for Expected Credit Loss (ECL) are recognised in respect of financial assets measured at amortised cost.
Loss allowances are measured at an amount equal to lifetime ECL, except for the following, which are measured at 12-month ECL:
- debt securities that are determined to have low credit risk at the reporting date; and
- other debt securities and bank balance for which credit risk (i.e. the risk of default occurring over the expected life of the financial instrument) has not increased significantly since initial recognition.
Loss allowances for trade receivables are always measured at an amount equal to lifetime ECL.
When determining whether the credit risk of a financial asset has increased significantly since initial recognition and when estimating ECL, group entities consider reasonable and supportable information that is relevant and available without undue cost or effort. This includes both quantitative and qualitative information and analysis, based on group entities historical experience and informed credit assessment and including forward-looking information.
Credit risk on a financial asset is assumed to have increased significantly if it is more than past due for a reasonable period of time. Lifetime ECL are the ECL that result from all possible default events over the expected life of a financial instrument. 12-month ECL are the portion of ECL that result from default events that are possible within the 12 months after the reporting date (or a shorter period if the expected life of the instrument is less than 12 months). The maximum period considered when estimating ECL is the maximum contractual period over which group entities are exposed to credit risk.

220 International Industries Limited
Loss allowances for financial assets measured at amortised cost are deducted from the Gross carrying amount of the assets.
The gross carrying amount of a financial asset is written off when group entities have no reasonable expectations of recovering of a financial asset in its entirety or a portion thereof. Group entities individually make an assessment with respect to the timing and amount of write-off based on whether there is a reasonable expectation of recovery. Group entities expect no significant recovery from the amount written off. However, financial assets that are written off could still be subject to enforcement activities in order to comply with an group entities procedures for recovery of amounts due.
The adoption of the expected loss approach has not resulted in any material change in impairment provision for any financial asset.
4.12.2 Non-Financial assets
The carrying amounts of non-financial assets, other than deferred tax assets and inventories are reviewed at each reporting date to determine whether there is any indication of impairment. If such indication exists, the asset’s recoverable amount, being higher of value in use and fair value less costs to sell, is estimated. In assessing value in use, the estimated future cash flows are discounted to their present value using a pre-tax discount rate that reflects current market assessments of the time value of money and the risks specific to the asset. For the purpose of impairment testing, assets that cannot be tested individually are grouped together into the smallest group of assets that generates cash inflows from continuing use that are largely independent of the cash inflows of other assets or groups of assets. An impairment loss is recognised whenever the carrying amount of an asset exceeds its recoverable amount. Impairment losses are recognised in the consolidated statement of profit or loss.
4.13 Provisions
A provision is recognised in the consolidated statement of financial position when group entities have a legal or constructive obligation as a result of a past event, and it is probable that an outflow of economic benefits will be required to settle the obligation and a reliable estimate can be made of the amount of obligation. Provisions are measured at the present value of expected expenditure, discounted at a pre-tax rate reflects current market assessment of the time value of money and the risk specific to the obligation. However, provisions are reviewed at each reporting date and adjusted to reflect current best estimate.
4.14 Contingent liabilities
A contingent liability is disclosed when an group entities have a possible obligation as a result of past events, whose existence will be confirmed only by the occurrence or non-occurrence, of one or more uncertain future events not wholly within the control of the group entities or the group entities has a present legal or constructive obligation that arises from past events, but it is not probable that an outflow of resources embodying economic benefits will be required to settle the obligation, or the amount of the obligation cannot be measured with sufficient reliability.
4.15 Segment reporting
Operating segments are reported in a manner consistent with the internal reporting structure. The operating results are monitored separately for each product category (i.e. Steel Coils and Sheets, Steel Pipes and Plastic Pipes) for the purposes of making decisions regarding resource allocation and performance assessment.
Sale of electricity to KE is not considered as separate reportable segment as the power plants of the entities are installed primarily to supply power to their production facilities and currently any excess electricity is sold to KE.
4.16 Dividend and appropriation to / from reserves
Dividend distribution to the shareholders and appropriations to / from reserves are recognised in the period in which these are approved.

221Annual Report 2020
5. PROPERTY, PLANT AND EQUIPMENT Note 2020 2019-------- Rupees in ‘000 --------
Operating assets 5.1 27,583,787 26,510,066 Capital work-in-progress (CWIP) 5.6 111,499 682,778 Store and spares held for capital expenditure - at cost 24,240 30,953
27,719,526 27,223,797
5.1 Operating assetsLand - revalued Buildings - revalued Plant and Furniture, Vehicles Total
Freehold Leasehold Freehold Leasehold machinery** fixtures andland land office
equipment----------------------------------------------------(Rupees in ‘000) ----------------------------------------------------
Balance as at 1 July 2019Cost / revalued amount 2,223,926 2,028,395 2,813,841 1,414,772 25,056,208 237,624 299,243 34,074,009 Accumulated depreciation - - - - (7,284,775) (146,429) (132,739) (7,563,943)Net Book value (NBV) 2,223,926 2,028,395 2,813,841 1,414,772 17,771,433 91,195 166,504 26,510,066
Additions / transfer from CWIP 618,941 13,274 949,201 61,922 1,349,179 22,377 58,371 3,073,265
Surplus on revaluation - - - - - - - - Translation reserve - - - - - (94) - (94)
Disposals - Cost - - (4,573) (15,911) (137,792) (1,571) (41,487) (201,334)- Accumulated depreciation - - 3,074 2,376 102,647 1,475 23,863 133,435
- - (1,499) (13,535) (35,145) (96) (17,624) (67,899)
Depreciation charge - - (194,433) (138,331) (1,514,342) (27,185) (57,260) (1,931,551)Balance as at 30 June
2020 (NBV) 2,842,867 2,041,669 3,567,110 1,324,828 17,571,125 86,197 149,991 27,583,787
Gross carrying value as at 30 June 2020
Cost / revalued amount 2,842,867 2,041,669 3,567,110 1,324,828 26,267,595 258,336 316,127 36,618,532 Accumulated depreciation - - - - (8,696,470) (172,139) (166,136) (9,034,745)Net book value 2,842,867 2,041,669 3,567,110 1,324,828 17,571,125 86,197 149,991 27,583,787
Depreciation rates(% per annum) - - 2 - 50 2 - 50 3 - 50 10 - 33.3 20
Balance as at 1 July 2018Cost / revalued amount 1,989,041 1,782,743 1,744,747 1,130,212 20,022,489 192,269 272,424 27,133,925 Accumulated depreciation - - (201,405) (193,386) (6,165,222) (136,071) (122,599) (6,818,683)Net Book value (NBV) 1,989,041 1,782,743 1,543,342 936,826 13,857,267 56,198 149,825 20,315,242
Additions / transfer from CWIP - 48,336 1,011,132 310,010 5,228,265 53,091 88,505 6,739,339
Surplus on revaluation 234,885 197,316 371,913 273,968 - - - 1,078,082
Translation reserve - - - - - 197 - 197
Disposals- Cost - - - (24,664) (194,546) (7,933) (61,686) (288,829)- Accumulated depreciation - - - 12,763 140,619 7,534 45,546 206,462
- (11,901) (53,927) (399) (16,140) (82,367)
Depreciation charge - - (112,546) (94,131) (1,260,172) (17,892) (55,686) (1,540,427)Balance as at 30 June
2019 (NBV) 2,223,926 2,028,395 2,813,841 1,414,772 17,771,433 91,195 166,504 26,510,066
Gross carrying value as at 30 June 2019
Cost / revalued amount 2,223,926 2,028,395 2,813,841 1,414,772 25,056,208 237,624 299,243 34,074,009Accumulated depreciation * - - - - (7,284,775) (146,429) (132,739) (7,563,943)Net book value 2,223,926 2,028,395 2,813,841 1,414,772 17,771,433 91,195 166,504 26,510,066
Depreciation rates (% perannum) - - 2 - 50 2 - 50 3 - 50 10 - 33.3 20
* This represents adjustment to accumulated depreciation by eliminating it against gross carrying amount of the assets using elimination approach to incorporate revaluation impact.
** This includes capital spares having cost of Rs 722 million (2019: Rs 522 million) and net book value of Rs.639 million (2019: Rs.449 million).
5.1.1 Addition to plant & machinery include interest and other charges capitalized by the Subsidiary Company on loan obtained for expansion project amounting to Rs.24.3 million (2019: Rs.238.2 million). Rate of markup capitalization is 6% (2019: 6.56% to 7.12%) per annum.

222 International Industries Limited
5.2 The depreciation charge for the year has been allocated as follows:
Note 2020 2019-------- Rupees in ‘000 --------
Cost of sales 23 1,755,910 1,393,363 Selling and distribution expenses 24 26,220 23,157 Administrative expenses 25 27,495 17,760 Power generation 28.1 121,926 106,147
1,931,551 1,540,427
Particulars of immovable property (i.e. land and building) in the name of the Group are as follows:
Area of Land (acres)
Covered Area (Sq Ft)Particulars Location
Leasehold Land (Manufacturing plant) Plot no.LX15-16, HX-7/4 Landhi Industrial Estate Karachi 25.59 791,614
Leasehold Land (Manufacturing plant) 22 KM Sheikhupura Road, Mouza Khanpur Nabipur 31.45 370,664Tehsil Ferozpur District Sheikhupura.
Freehold Land (Manufacturing plant) Survey Nos.399-405-406, Deh Sharabi, Landhi 42.45 377,538Town, City District Government, Karachi
Office Premises Office No.101-105, 1st Floor, Beaumont Plaza, Not applicable 13,67610 Beaumont Road, Karachi
Office Premises Office No.203,2nd Floor, Beaumont Plaza, Not applicable 1,79410 Beaumont Road, Karachi
Sales Office Premises Chinoy House, 2nd and 3rd Floor Off Thornton Not applicable 4,906Road, Hadbast Mouza Khas District Lahore
Sales Godown Plot bearing No.NEIR-61 Khasra No.3303 - 3308, 0.17 6,295Hadbast Mouza Naulakha GT Road Lahore
Sales Godown Plot bearing No.47, Khasra Nos.298/1, 2978/1 0.18 6,215Ghoray Shah Road, Hadbast Mouza Khoi MeranDistrict Lahore
Service Center Plot No. LE-73-79,102-103, 112-118, 125-129 Not applicable 653,400Survey # NC.98, near Arabian Country Club,NIP, Bin Qasim Industrial Park, Karachi
Multan warehouse Khewat No.(B) 38, 114, 302, Khatooni No.127,475, Not applicable 365,9041114, Mouza Laar Bahawalpur Road, Multan
99.84 1,572,702
5.3 The revaluation of the freehold land, leasehold land and buildings thereon of the Holding Company and Subsidiary Company was carried out as of 30 June 2019 by MYK Associates (Private) Limited (an independent valuer) on the basis of their professional assessment of present market values based on enquiries made about the cost of land of similar nature, size and location including consideration of current cost of acquisition or construction net of diminution owing to depreciation. The revaluation resulted in a surplus amounting to Rs.1,078 million which was incorporated in the books of the Holding and Subsidiary Company as at 30 June 2019.
The Holding Company has carried out valuation of freehold land, leasehold land and buildings during the years ended / periods 30 June 1988, 30 June 1997, 30 June 2000, 30 June 2004, 31 December 2007, 30 June 2013, 30 June 2016 and 30 June 2019.
The resulting revaluation surplus has been disclosed in notes 5 and 16 to the consolidated financial state-ments and has been credited to revaluation surplus account net of related tax effect.
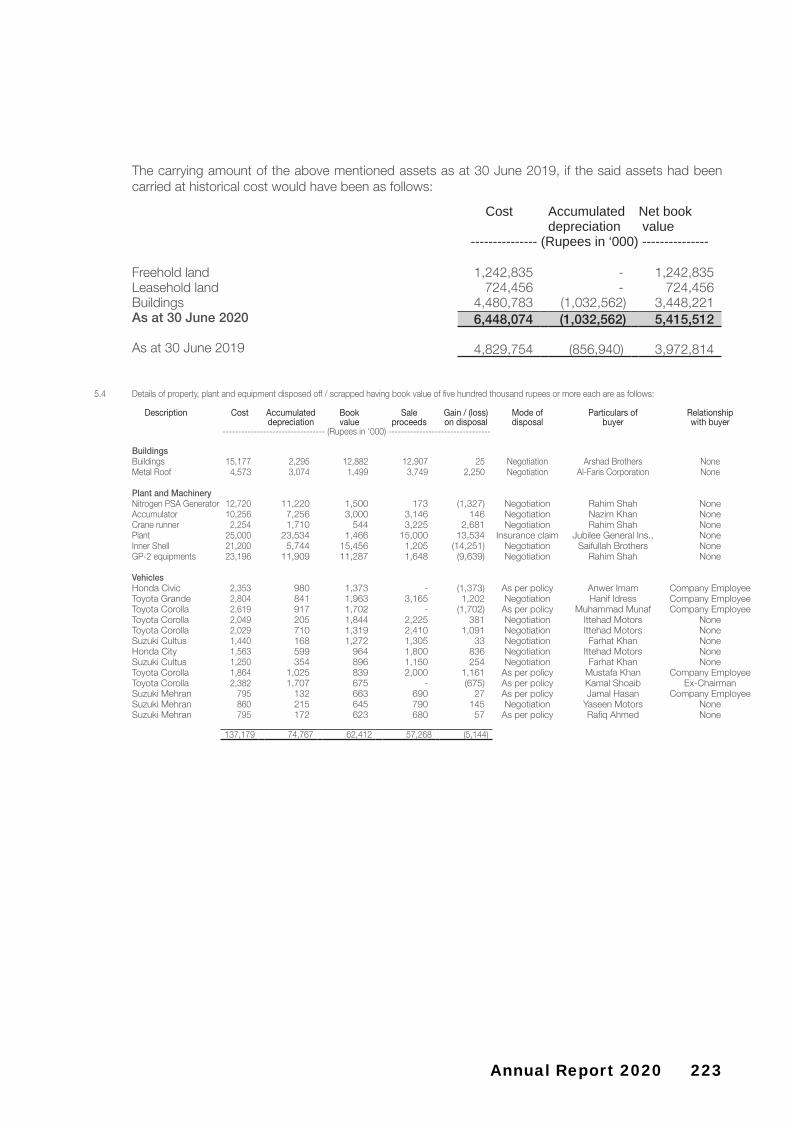
223Annual Report 2020
5.4 Details of property, plant and equipment disposed off / scrapped having book value of five hundred thousand rupees or more each are as follows:
Description Cost Accumulated Book Sale Gain / (loss) Mode of Particulars of Relationship depreciation value proceeds on disposal disposal buyer with buyer
--------------------------------- (Rupees in ‘000) ---------------------------------
Buildings Buildings 15,177 2,295 12,882 12,907 25 Negotiation Arshad Brothers NoneMetal Roof 4,573 3,074 1,499 3,749 2,250 Negotiation Al-Faris Corporation None
Plant and MachineryNitrogen PSA Generator 12,720 11,220 1,500 173 (1,327) Negotiation Rahim Shah NoneAccumulator 10,256 7,256 3,000 3,146 146 Negotiation Nazim Khan NoneCrane runner 2,254 1,710 544 3,225 2,681 Negotiation Rahim Shah NonePlant 25,000 23,534 1,466 15,000 13,534 Insurance claim Jubilee General Ins., NoneInner Shell 21,200 5,744 15,456 1,205 (14,251) Negotiation Saifullah Brothers NoneGP-2 equipments 23,196 11,909 11,287 1,648 (9,639) Negotiation Rahim Shah None
VehiclesHonda Civic 2,353 980 1,373 - (1,373) As per policy Anwer Imam Company EmployeeToyota Grande 2,804 841 1,963 3,165 1,202 Negotiation Hanif Idress Company EmployeeToyota Corolla 2,619 917 1,702 - (1,702) As per policy Muhammad Munaf Company EmployeeToyota Corolla 2,049 205 1,844 2,225 381 Negotiation Ittehad Motors NoneToyota Corolla 2,029 710 1,319 2,410 1,091 Negotiation Ittehad Motors NoneSuzuki Cultus 1,440 168 1,272 1,305 33 Negotiation Farhat Khan NoneHonda City 1,563 599 964 1,800 836 Negotiation Ittehad Motors NoneSuzuki Cultus 1,250 354 896 1,150 254 Negotiation Farhat Khan NoneToyota Corolla 1,864 1,025 839 2,000 1,161 As per policy Mustafa Khan Company EmployeeToyota Corolla 2,382 1,707 675 - (675) As per policy Kamal Shoaib Ex-ChairmanSuzuki Mehran 795 132 663 690 27 As per policy Jamal Hasan Company EmployeeSuzuki Mehran 860 215 645 790 145 Negotiation Yaseen Motors NoneSuzuki Mehran 795 172 623 680 57 As per policy Rafiq Ahmed None
137,179 74,767 62,412 57,268 (5,144)
The carrying amount of the above mentioned assets as at 30 June 2019, if the said assets had been carried at historical cost would have been as follows:
Cost Accumulated Net bookdepreciation value
--------------- (Rupees in ‘000) ---------------
Freehold land 1,242,835 - 1,242,835Leasehold land 724,456 - 724,456Buildings 4,480,783 (1,032,562) 3,448,221As at 30 June 2020 6,448,074 (1,032,562) 5,415,512
As at 30 June 2019 4,829,754 (856,940) 3,972,814

224 International Industries Limited
5.5 Capital work-in-progress (CWIP)Cost
As at 01 Additions / (Transfers) / As at 30 July 2019 Adjustments Adjustments June 2020--------------------- (Rupees in ‘000) ---------------------
Freehold land 463,830 155,111 (618,941) - Leasehold land - 13,274 (13,274) - Buildings on freehold land 51,446 965,620 (1,017,066) - Buildings on leasehold land 4,884 53,106 (57,387) 603 Plant and machinery 138,726 1,209,397 (1,269,410) 78,713 Furniture, fixtures and office equipments 23,892 24,904 (22,219) 26,577 Vehicles - 63,977 (58,371) 5,606
682,778 2,485,389 (3,056,668) 111,499
CostAs at 1 Additions / (Transfers) / As at 30
July 2018 Adjustments Adjustments June 2019--------------------- (Rupees in ‘000) ---------------------
Freehold land 61,250 463,830 (61,250) 463,830 Leasehold land - 48,336 (48,336) - Buildings on freehold land 708,486 354,092 (1,011,132) 51,446 Buildings on leasehold land 74,804 240,090 (310,010) 4,884 Plant and machinery 2,840,549 2,411,074 (5,112,897) 138,726 Furniture, fixtures and office equipment 8,885 65,076 (50,069) 23,892 Vehicles 3,453 85,052 (88,505) -
3,697,427 3,667,550 (6,682,199) 682,778
5.6 LEASES
5.6.1 Right-of-use assets2020
(Rupees in '000) As at July 1, 2019 - Additions 18,628 Disposals -Depreciation expense (4,535)As at June 30, 2020 14,093
As at June 30, 2019 -
5.6.2 The depreciation charge on right of use assets for the year has been allocated as follows:
2020 (Rupees in '000)
Cost of sales - Selling and distribution expenses 2,428Administrative expenses 2,107
4,535
5.6.2 Lease liabilities
Rental contracts are made for a fixed period subject to renewal upon mutual consent of Company and lessor. Wherever practicable the Company seeks to include extension option to provide operational flexibility. Lease terms are negotiated on an individual basis and contain a wide range of different terms and conditions. Management exercises significant judgement in determining whether these extension and termination options are reasonably certain to be exercised. The future lease payments have been discounted using average borrowing rate as at 01 July 2019.
Set out below the carrying amount of lease liabilities and the movements during the year:

225Annual Report 2020
2020 (Rupees in '000)
As at July 01, 2019 -Additions 18,628 Disposal -Interest expense 2,259 Payments (5,084)As at June 30, 2020 15,803
Current 3,854Non - current 11,949
15,803
2019 -
Lease liabilities are payable as follows:Minimum Interest Present
lease value ofpayments minimum
leasepayment
Less than one year 6,569 1,742 4,827Between one and five years 13,047 2,071 10,976More than five years - - -
6. INTANGIBLE ASSETS Note 2020 2019-------- Rupees in ‘000 --------
Operating intangible assets 6.1 1,827 5,007Capital work-in-progress (CWIP) 6.2 1,080 1,080
2,907 6,087
6.1 Net book value as at 01 July 5,007 10,120Additions / Adjustments 667 1,561 Amortisation 6.1.2 (3,847) (6,674)Net book value as at 30 June 1,827 5,007
Gross carrying value as at 30 JuneCost 98,874 98,207Accumulated amortisation (97,047) (93,200)Net book value 1,827 5,007
(Percent)
Amortisation rate (per annum) 20 - 33.33 33.33
6.1.1 Intangible assets comprise of computer software and licenses.
6.1.2 The amortisation expense for the year has been allocated as follows:
-------- Rupees in ‘000 --------
Cost of sales 23 2,675 1,390 Selling and distribution expenses 24 718 - Administrative expenses 25 454 5,284
3,847 6,674
6.2 This represents advance provided to ERP consultant on account of upgradation of ERP system.

226 International Industries Limited
Note 2020 20197.3 Movement during the year -------- Rupees in ‘000 --------
Investment at the beginning of the year 1,014,685 1,004,132 Share of profit from associate - before tax (6,502) 49,906 Related tax 29 623 (5,341)Share of profit from associate - net of tax (5,879) 44,565
Share of OCI 3,183 (3,461)Surplus on revaluation on land and buildings 89,393 (88)Dividends received (6,092) (30,462)Closing balance 1,095,290 1,014,685
(Number)
Number of shares held 6,092,470 6,092,470
-------- Rupees in ‘000 --------
Cost of investment 817,553 817,553
Ownership interest 17.12% 17.12%
7.4 Summarized statement of financial position of associate -------- Rupees in ‘000 --------
Current assets 4,250,829 4,638,945 Non-current assets 4,123,047 2,741,781 Total assets 8,373,876 7,380,726
Current liabilities (2,666,013) (2,174,928)Non-current liabilities (842,256) (810,908)Total liabilities (3,508,269) (2,985,836)
Net assets 4,865,607 4,394,890
7. INVESTMENT IN EQUITY ACCOUNTED INVESTEE
2020 2019 2020 2019(Number of shares) -------- Rupees in ‘000 --------
Pakistan Cables Limited (PCL) 6,092,470 6,092,470 - associated company 7.1 1,095,290 1,014,685
IIL Americas Inc., - Foreign subsidiary 7.8 17,966 -
1,113,256 1,014,685
7.1 This represents investment in PCL, an Associated Company, on account of cross directorship. The Holding Company holds 17.124% of effective share of interest in PCL due to crossholding.
7.2The Chief Executive Officer of PCL is Mr. Fahd K. Chinoy. The market value as at 30 June 2020 was Rs. 651.224 million (30 June 2019 Rs. 856.114 million) and is categorised as level 1 under the fair value hierarchy. The share of profit after acquisition is recognised based on unaudited condensed interim financial information as at 31 March 2020 as the latest financial statements as at 30 June 2020 were not presently available.
The summarized financial information of the associate and reconciliation with the carrying amount of the investment in these consolidated financial statements are set out below:

227Annual Report 2020
For the period from April 1, 2019 to March 31,
2020
For the period from
April 1, 2018 to March 31,
2019 7.5 Summarized statement of profit or loss account of associate -------- Rupees in ‘000 --------
Turnover - net 9,838,709 9,983,358 Cost of sales (8,841,683) (8,830,353)Gross profit 997,026 1,153,005
General and administration expenses (1,072,834) (931,364)Other income 37,839 69,794 (Loss) / Profit before tax for the period (37,969) 291,435 Taxation 3,638 (31,193)(Loss) / Profit after tax for the period (34,331) 260,242
Other comprehensive income for the period 547,073 (30,764)Direct adjustment in equity (6,447) (14,542)
Total comprehensive income for the period 506,295 214,936
7.6 Reconciliation of the above summarized financial information to the carrying amount of the interest in associate recognised in these consolidated financial statements is as follows:
For the period from April 1, 2019 to March 31,
2020
For the period from
April 1, 2018 to March 31,
2019-------- Rupees in ‘000 --------
Opening net assets 4,394,890 3,209,076 Issuance of shares at premium - 1,148,768 Total comprehensive income for the period 506,295 214,936 Dividend distributed during the period (35,578) (177,890)Net assets of the associate 4,865,607 4,394,890
Proportion of Company’s interest in associate 17.12% 17.12%Share of net assets of associate 833,187 752,581
Goodwill & Others 262,104 262,104
Carrying amount of the Company’s interest in associate 1,095,290 1,014,685
7.7 The market value of PCL shares as at 30 June 2020 was Rs. 106.89 per share (2019: Rs. 140.52 per share).
7.8 This represents advance against shares paid by International Industries limited for issuance of 100 % ownership interest (150,000 shares) in IIL Americas Inc. The Chief Executive Officer of IIL Americas Inc, is Mr. Mohsin Safdar.
8. STORES AND SPARES 2020 2019-------- Rupees in ‘000 --------
Stores 297,118 316,868Spares 572,114 497,889Loose tools 13,099 11,745
882,331 826,502
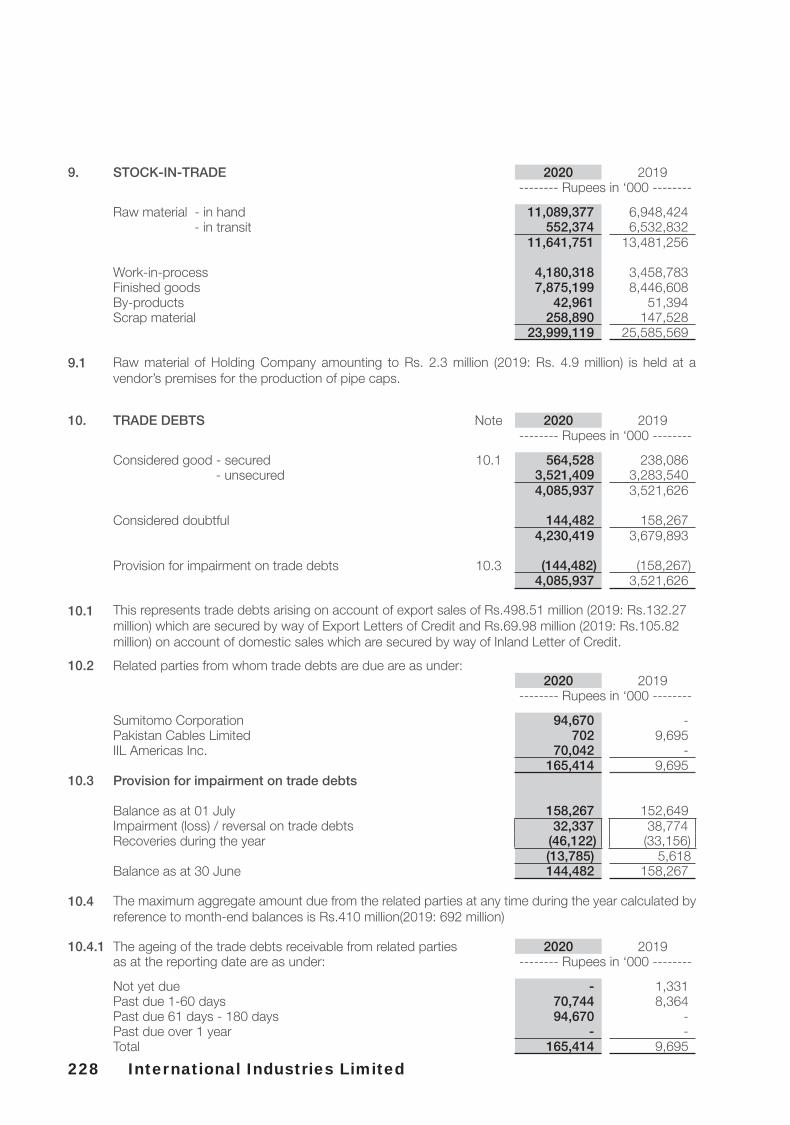
228 International Industries Limited
9. STOCK-IN-TRADE 2020 2019-------- Rupees in ‘000 --------
Raw material - in hand 11,089,377 6,948,424 - in transit 552,374 6,532,832
11,641,751 13,481,256
Work-in-process 4,180,318 3,458,783 Finished goods 7,875,199 8,446,608 By-products 42,961 51,394 Scrap material 258,890 147,528
23,999,119 25,585,569
9.1 Raw material of Holding Company amounting to Rs. 2.3 million (2019: Rs. 4.9 million) is held at a vendor’s premises for the production of pipe caps.
10. TRADE DEBTS Note 2020 2019-------- Rupees in ‘000 --------
Considered good - secured 10.1 564,528 238,086 - unsecured 3,521,409 3,283,540
4,085,937 3,521,626
Considered doubtful 144,482 158,267 4,230,419 3,679,893
Provision for impairment on trade debts 10.3 (144,482) (158,267) 4,085,937 3,521,626
10.1 This represents trade debts arising on account of export sales of Rs.498.51 million (2019: Rs.132.27 million) which are secured by way of Export Letters of Credit and Rs.69.98 million (2019: Rs.105.82 million) on account of domestic sales which are secured by way of Inland Letter of Credit.
10.2 Related parties from whom trade debts are due are as under:2020 2019
-------- Rupees in ‘000 --------
Sumitomo Corporation 94,670 - Pakistan Cables Limited 702 9,695 IIL Americas Inc. 70,042 -
165,414 9,695 10.3 Provision for impairment on trade debts
Balance as at 01 July 158,267 152,649Impairment (loss) / reversal on trade debts 32,337 38,774Recoveries during the year (46,122) (33,156)
(13,785) 5,618 Balance as at 30 June 144,482 158,267
10.4 The maximum aggregate amount due from the related parties at any time during the year calculated by reference to month-end balances is Rs.410 million(2019: 692 million)
10.4.1 The ageing of the trade debts receivable from related parties 2020 2019as at the reporting date are as under: -------- Rupees in ‘000 --------
Not yet due - 1,331 Past due 1-60 days 70,744 8,364 Past due 61 days - 180 days 94,670 - Past due over 1 year - - Total 165,414 9,695

229Annual Report 2020
11. ADVANCES, TRADE DEPOSITS AND 2020 2019 SHORT - TERM PREPAYMENTS -------- Rupees in ‘000 --------
Considered good- Suppliers 93,624 105,521 - Employees for business related expenses 703 440 Trade deposits 22,942 18,969 Margin against shipping guarantee 6,807 16,255 Short term prepayments 40,335 26,968
164,411 168,153
11.1 These advances and trade deposits are non interest bearing.
12. OTHER RECEIVABLES 2020 2019-------- Rupees in ‘000 --------
Considered goodInsurance claim 15,000 9,341 Others 8,271 8,430
23,271 17,771 Considered doubtfulReceivable from Workers’ Welfare Fund on account of excess
allocation of Workers’ Profit Participation Fund in earlier periods 25,940 25,940 49,211 43,711
Provision for receivable from Workers’ Welfare Fund on account of excess allocation of Workers’ Welfare Fund in earlier periods (25,940) (25,940)
23,271 17,771
13. TAXATION - NET
Tax receivable as at 1 July 895,642 260,145 Tax payments / adjustment made during the year 1,164,848 1,541,692
2,060,490 1,801,837
Less: Provision for tax 29 (986,524) (906,195) 1,073,966 895,642
14. CASH AND BANK BALANCES
Cash in hand 269 - Current accounts 391,110 301,700 Profit and loss sharing accounts 14.1 189,695 457,843
581,074 759,543
14.1 Mark-up rate on profit and loss sharing account ranges from 6.50 % to 11.25 % per annum (2019: 4.75% to 10.25% per annum). The deposits accounts are placed with bank under conventional banking arrangements.
15. ISSUED, SUBSCRIBED AND PAID-UP CAPITAL
2020 2019 2020 2019 (Number of shares) -------- Rupees in ‘000 --------
6,769,725 6,769,725 Fully paid ordinary shares of Rs. 10 each issued for cash 67,697 67,697
125,112,156 113,122,894 Fully paid ordinary shares of Rs. 10 each issued as 1,251,122 1,131,229
131,881,881 119,892,619 bonus shares 1,318,819 1,198,926
15.1 Associated companies, due to common directors, held 633,600 (2019 : 576,600) ordinary shares of Rs. 10 each at the year end.

230 International Industries Limited
16. REVALUATION SURPLUS ON PROPERTY, Note 2020 2019PLANT AND EQUIPMENT -------- Rupees in ‘000 --------
Freehold landBalance as at 01 July 1,600,033 1,365,148 Surplus on revaluation of freehold land 5.1 - 234,885 Balance as at 30 June 1,600,033 1,600,033
Leasehold landBalance as at 01 July 1,317,213 1,119,897 Surplus on revaluation of leasehold land 5.1 - 197,316 Balance as at 30 June 1,317,213 1,317,213
Buildings
Balance as at 01 July 1,034,532 1,043,642 Surplus on revaluation of buildings - 83,414 Disposal of buildings (11,638) (9,420)Transferred to retained earnings (Un-appropriated
Profit) in respect of incremental depreciation charged during the year (120,706) (83,104)
902,187 1,034,532
Related deferred tax liability 16.2 (385,907) (420,554)Balance as at 30 June - net of deferred tax 516,280 613,978
3,433,526 3,531,224 Proportionate share of surplus on revaluation of
property, plant and equipment of equity accountedinvestee 182,513 93,120
3,616,039 3,624,344
16.1 The revaluation surplus on property, plant and equipment is a capital reserve and is not available for distribution to the shareholders of the company in accordance with section 241 of the Companies Act, 2017.
16.2 Movement in related deferred tax liability 2020 2019-------- Rupees in ‘000 --------
Balance as at 01 July 420,554 273,504 Surplus on revaluation of buildings - 86,721 Effect of change in tax rate 3,685 84,129 Tax effect on disposal (2,866) (2,281)Tax effect on incremental depreciation
transferred to retained earnings (35,465) (21,519)Deferred tax liability as at 30 June 385,907 420,554
17. LONG TERM FINANCING - secured 2020 2019-------- Rupees in ‘000 --------
CONVENTIONAL Long Term Finance Facility 17.1 3,147,966 3,129,263 Deferred Income - Government Grant 17.3 36,978 -
ISLAMIC Diminishing Musharakah 17.2 5,333,010 6,140,908
8,517,954 9,270,171
Current portion of long term finances shown under current liabilities:
CONVENTIONAL Long Term Finance Facility 17.1 (512,788) (614,492) Deferred Income - Government Grant 17.3 (22,810) -
ISLAMIC Diminishing Musharakah 17.2 (1,362,899) (586,364)
(1,898,497) (1,200,856) 6,619,457 8,069,315

231Annual Report 2020
17.1 Long term finances utilised under mark-up arrangements
Sale Purchase Number of Date of Rate of 2020 2019price price installments and maturity / mark-up ------- Rupees in ‘000 -------(Rupees in ‘000) commencement repayment per annum
dateCONVENTIONAL
i) MCB Bank LimitedFinancing under Long term 550,000 906,963 34 quarterly 28-Mar-24 SBP+0.70% 346,690 411,134
finance facility (note 17.1.1) 29-Oct-16 to 20 Nov 25 (fixed rate)
ii) MCB Bank LimitedFinancing under Long term 800,000 1,164,316 11 half yearly 28 Dec 2024 0.1 % over 727,272 800,000
finance facility (note 17.1.1) 30 June 2019 6 months KIBOR
iii) MCB Bank LimitedFinancing under Long term 100,000 149,976 34 quarterly 31 Aug 2027 SBP+0.50% 86,492 98,422
finance facility (note 17.1.1) 31 May 2019 (fixed rate)
iv) MCB Bank LimitedFinancing under Long term 100,000 147,862 34 quarterly 30 June 2028 SBP+0.50% 87,175 92,623
finance facility (note 17.1.1) 30 Jan 2020 (fixed rate)
v) Bank Al-Habib assistance for plant 1,000,000 4,675,000 32 quarterly 11-Nov-26 1.00% over 615,440 740,441
and machinery (note 16-Oct-16 SBP17.1.2) Refinance rate
(fixed rate)vi) United Bank Limited
assistance for plant 1,000,000 2,501,562 16 half yearly 28-Nov-26 1.00% over 590,500 719,977 and machinery (note 12-Dec-16 SBP17.1.2) Refinance rate
(fixed rate)vii) MCB Bank Limited
assistance for plant 800,000 1,112,512 18 quarterly 7-Jan-20 0.15% over - 266,666 and machinery (note 30-Jun-16 6 months17.1.2) KIBOR
viii) Habib Metropolitan Bank LimitedFinancing under Long term 275,000 330,000 8 quarterly 30-Dec-22 SBP+0.75% 167,097 -
finance facility (note 17.1.4) 31-Mar-21 (fixed rate)
ISLAMIC
i) Meezan Bank LimitedDiminishing Musharakah 500,000 950,361 10 half yearly 30-Jun-23 0.1 % over 272,728 363,635
of Rs.500 million 30-Jun-18 6 months KIBOR(Refer note 17.1.3)
ii) Meezan Bank LimitedDiminishing Musharakah 250,000 279,978 11 half yearly 30-Jun-24 0.1 % over 181,818 227,273
of Rs.250 million 30-Jun-19 6 months KIBOR(Refer note 17.1.3)
iii) Meezan Bank LimitedDiminishing Musharakah 1,000,000 1,098,867 36 equal monthly 1-Sep-19 0.20 % over - 250,000
of Rs.750 million for plant and 31-Oct-16 1 months KIBORmachinery (Refer note 17.1.2)
iv) Habib Bank LimitedDiminishing Musharakah 4,300,000 5,640,228 10 half yearly 24-Feb-25 0.10 % over 4,410,000 4,900,000
of Rs.4,300 million for plant and 28-Feb-20 6 months KIBORmachinery (Refer note 17.1.2)
v) Meezan Bank LimitedDiminishing Musharakah 500,000 575,512 30 equal monthly 28-Jun-21 0.15 % over 200,000 400,000
of Rs.4,300 million for plant and 28-Dec-18 3 months KIBORmachinery (Refer note 17.1.2)
vi) Habib Bank LimitedDiminishing Musharakah 150,000 187,500 16 half yearly 31-May-30 SBP+0.50% 118,866 -
of Rs.250 million 30-Jun-22 (fixed rate)(Refer note 17.1.2)
vii) Meezan Bank Limited 700,000 36 quarterly 2-Jun-30 3.00% over 545,909 - assistance for plant 17-Oct-20 6 months
and machinery (note 17.1.2) Refinance rate
viii) Faysal Bank Limited 200,000 167,968 8 quarterly 31-Dec-22 1.00% over 167,968 - SBP Payroll finance facility 1-Apr-21 SBP
Refinance rate
8,517,955 9,270,171

232 International Industries Limited
17.1.1 The Holding Company has an approved financing facility under Long Term Finance Facility of an amount aggregating Rs. 1,550 million. As at 30 June 2020 the Holding Company has withdrawn Rs. 1,414.7 million (2019: Rs. 1,402.179 million) from a commercial bank. These facilities are secured by way of charge on all present and future land and buildings, plant and machinery located at plot number LX-15 & 16 and HX-7/4, Landhi Industrial Estate Karachi and Survey No.402, 405-406, Dehsharabi Landhi Town Karachi.
17.1.2 These finances are obtained by Subsidiary Company (ISL) and are secured against joint pari passu charge over fixed assets of the Subsidiary Company (such as. land, building, plant and machinery etc) with aggregate carrying amount of Rs.13,577 million
The above long term financing utilised under mark-up arrangement is secured by way of charge on all present and future land and buildings, plant and machinery located at plot number LX-15 & 16 and HX-7/4, Landhi Industrial Estate, Karachi, and Survey no. 405, 405-406, Dehsharabi, Landhi Town, Karachi.
17.1.3 In addition to above, the Holding Company and Subsidiary Company have also obtained long term loans of Rs.335.064 million for financing its salaries and wages under SBP Refinance Scheme for payment of wages and salaries, earnmarked from running finance limit, which is secured against first joint Pari Passu Hypothecation charge over stock and book debts. The rate of markup for Holding Company on these loans are at 0.75% per annum and for Subsidiary Company are at 1%. These loans are for two and half years and are repayables in eight equally quarterly instalments of Rs.41.882 million commencing from 31 March 2021.The facility available under the above arrangement amounted to Rs.425 million of which the amount remained unutilised as at 30 June 2020 was Rs.89.933 million (2019: nil).
Due to the effects of pandemic, State Bank of Pakistan took various steps to support the economy. SBP introduced a refinance scheme for payment of salaries and wages at subsidized rate of borrowing.
The Holding Company has obtained the said borrowing from Habib Metropolitan Bank Limited (“HMB”) at subsidized rate in three tranches on 05 May 2020, 29 May 2020 and 15 June 2020 at 0.75% while Subsidiary Company has obtained the said borrowing from Faysal Bank Limited (“FBL”) at subsidized rate in three tranches on 20 May 2020, 4 June 2020 and 25 June 2020 at 1% concessional rate which is repayable by Dec 2022 in 8 quarterly instalment to HMB and FBL under the SBP scheme.
Government grant amounting to Rs. 36.978 million has been recorded during the year ended 30 June 2020 and Rs. 1.423 million has been amortised during the year. In accordance with the terms of the grant, the Holding Company and Subsidiary Company are prohibited to lay-off the employees atleast for three months from the period April 2020 to June 2020 of the grant.
17.1.4 In relation to above borrowings, the Group need to observe certain financial covenants (such as debt servicing ratio, current ratio, debt equity ratio etc.) and other non financial covenants as specified in the agreement with respective lenders which are complied with as of the reporting date.

233Annual Report 2020
18. DEFERRED TAXATION - NET
Deferred tax liability comprises of taxable / (deductible) temporary differences in respect of the following:
Note 2020 2019-------- Rupees in ‘000 --------
Taxable temporary differences
Accelerated tax depreciation 2,382,466 2,564,679 Share of profit from equity accounted investee 25,120 25,120 Surplus on revaluation of buildings 16.2 385,907 420,554
Deductible temporary differences
Provision for infrastructure cess (377,363) (323,204)Provision for impairment on trade receivables (42,465) (40,551)Unrealised exchange losses (17,070) (17,517)Provision for obsolescence against stores and spares (17,329) (4,112)Staff retirement benefits (22,055) - Provision for compensated absences (2,711) (4,885)Provision for lease liability (12,947) - Alternate Corporate Taxation (472,140) (28,567)
1,829,413 2,591,517
19. TRADE AND OTHER PAYABLES
Trade creditors 19.1 5,449,018 2,734,738 Bills payable 1,278 1,003,235 Accrued expenses 3,237,184 2,752,115 Provision for Infrastructure Cess 19.2 & 21.1.2 1,860,728 1,535,752 Provision for Government Levies 19.3 2,047 329 Short term compensated absences 11,485 18,837 Workers' Profit Participation Fund 19.4 2,145 22,195 Workers' Welfare Fund 272,735 340,421 Others 50,788 66,326
10,887,408 8,473,948
19.1 This includes an amount of Rs. 2.6 million payable to related parties by Subsidiary Company (ISL) (2019: Rs. Nil).
19.2 This represents provision against fifty percent amount guaranteed to Excise and Taxation Officer (refer note 21.1.2).
Provision for Infrastructure Cess Note 2020 2019-------- Rupees in ‘000 --------
Balance as at 01 July 1,535,752 1,176,189 Charge for the year 324,976 359,563 Balance as at 30 June 1,860,728 1,535,752
19.3 Provision for Government levies
Opening balance as at 01 July 329 230 Provided during the year 6,951 350 Payment during the year (5,233) (251)Closing balance as at 30 June 2,047 329
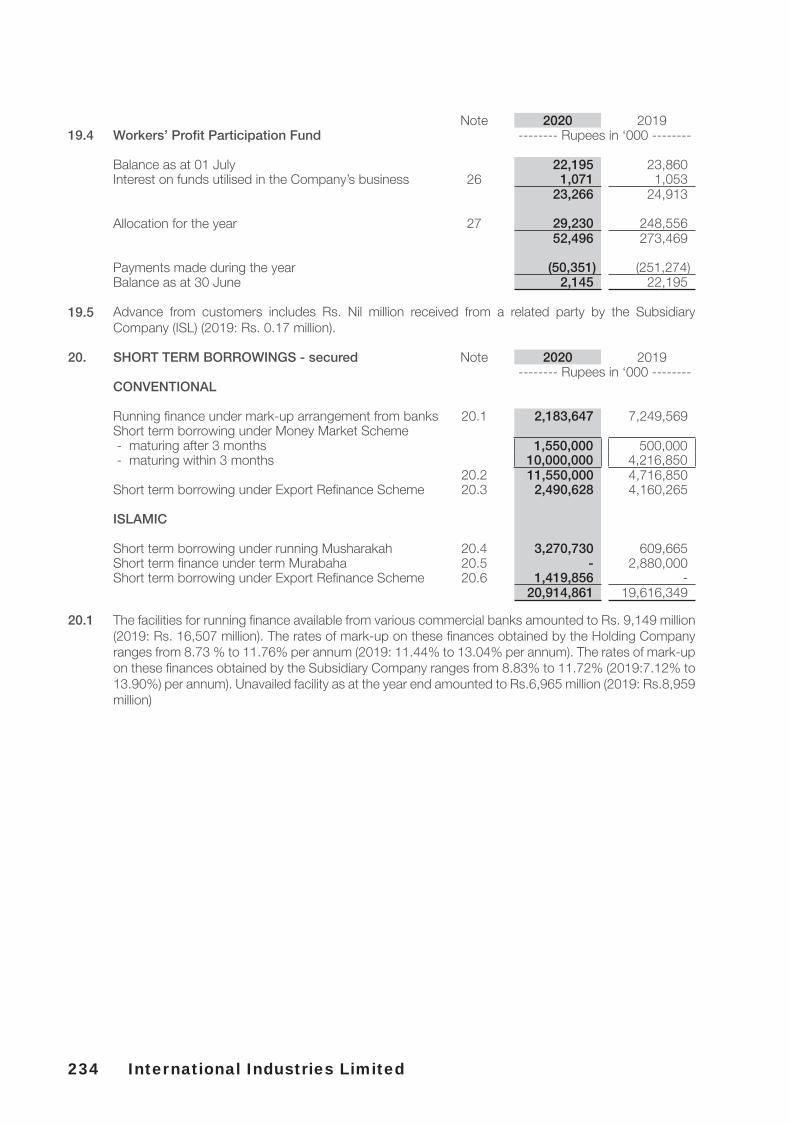
234 International Industries Limited
Note 2020 201919.4 Workers’ Profit Participation Fund -------- Rupees in ‘000 --------
Balance as at 01 July 22,195 23,860 Interest on funds utilised in the Company’s business 26 1,071 1,053
23,266 24,913
Allocation for the year 27 29,230 248,556 52,496 273,469
Payments made during the year (50,351) (251,274)Balance as at 30 June 2,145 22,195
19.5 Advance from customers includes Rs. Nil million received from a related party by the Subsidiary Company (ISL) (2019: Rs. 0.17 million).
20. SHORT TERM BORROWINGS - secured Note 2020 2019-------- Rupees in ‘000 --------
CONVENTIONAL
Running finance under mark-up arrangement from banks 20.1 2,183,647 7,249,569 Short term borrowing under Money Market Scheme - maturing after 3 months 1,550,000 500,000 - maturing within 3 months 10,000,000 4,216,850
20.2 11,550,000 4,716,850 Short term borrowing under Export Refinance Scheme 20.3 2,490,628 4,160,265
ISLAMIC
Short term borrowing under running Musharakah 20.4 3,270,730 609,665 Short term finance under term Murabaha 20.5 - 2,880,000 Short term borrowing under Export Refinance Scheme 20.6 1,419,856 -
20,914,861 19,616,349
20.1 The facilities for running finance available from various commercial banks amounted to Rs. 9,149 million (2019: Rs. 16,507 million). The rates of mark-up on these finances obtained by the Holding Company ranges from 8.73 % to 11.76% per annum (2019: 11.44% to 13.04% per annum). The rates of mark-up on these finances obtained by the Subsidiary Company ranges from 8.83% to 11.72% (2019:7.12% to 13.90%) per annum). Unavailed facility as at the year end amounted to Rs.6,965 million (2019: Rs.8,959 million)

235Annual Report 2020
20.2 The facilities for short term borrowing under Money Market Scheme financing available to the Holding Company from various commercial banks under mark-up arrangement amounted to Rs. 14,725 million (2019: Rs. 5,270 million). Unavailed facilities as at year-end amounted to Rs. 3,175.0 million (2019: Rs.553.1 million).The rate of mark-up on these finances range from 7.51% to 8.76 % per annum (2019: 11.04% to 13.06% per annum).
20.3 The Holding Company and the Subsidiary Company have obtained short term running finance under the Export Refinance Scheme of the State Bank of Pakistan. The facility availed is for an amount of Rs. 2,490.6 million (2019: Rs. 4,160.2 million). The rates of mark-up on these facilities were 3.00% per annum (2019: 2.1% to 3.00% per annum).
20.4 The facilities for running musharikah available form various banks amounted to Rs.6,030 (2019: Rs.6,728 million). The rate of profit on these finances availed by the Holding Company range from 8.9% to 9.33% per annum (2019: 13.10%) per annum and for facilities availed by the Subsidiary Company range from 8.46% to 11.84% (2019: 7.12% to 13.10%) per annum. Unavailed facilities as at year end amounted to Rs. 2,759 million (2019: Rs.6,118 million).
20.5 The Holding Company & the Subsidiary Company obtained loan from Standard Chartered Bank, UK - Dubai International Finance Centre Branch through Standard Chartered Bank (Pakistan) Limited amounting to USD 18 million equivalent to fixed amount of Rs.2,880 million for meeting working capital requirement. The tenor of the loan was six months i.e. from 26 June 2019 to 26 December 2019 for the Holding Company and from 20 June 2019 to 19 December 2019 for Subsidiary Company. The price of loan was six months KIBOR minus 0.28% for Holding Company and six month KIBOR minus 0.08% for Subsidiary Company. As per the terms of agreement, Standard Chartered Bank (Pakistan) has obtained forward cover on behalf of the Holding Company & Subsidiary Company to hedge foreign currency risk.
20.6 The Holding Company and the Subsidiary Company have obtained short term running finance under Islamic Export Refinance Scheme of the State Bank of Pakistan from a commercial bank. The facility availed is for an amount of Rs. 1,419.8 million (2019: Nil). The rates of mark-up on these facilities were 3.00% per annum.
20.7 All running finance and short term borrowing facilities are secured by way of hypothecation of all present and future current and moveable assets.
21. CONTINGENCIES AND COMMITMENTS
21.1 Contingencies
Description of factual basis and relief sought Name of court
Principal parties
Date instituted
Holding Company and the Subsidiary Company (collectively referred as “Companies”)
21.1.1 The Federal Government issued Gas Infrastructure Development Cess (GIDC) Acts in the years 2011, 2014 and 2015. All GIDC Acts have been subject of thorough debate and consideration at honourable High Courts of the Country as well as the Supreme Court of Pakistan.
Sindh High Court
OGRA / SSGC / Federation of
Pakistan
01-Aug-2012
On 12 August 2020, the Supreme Court of Pakistan issued its verdict and held that “the levy imposed under Gas Infrastructure Development Cess Act, 2015 is in accordance with the provisions of the Constitution”. The Supreme Court has also held that “the provisions of Section 8 of the Act, which give retrospective effect to the charge and recovery of ‘Cess’ levied from the year 2011 are also declared to be valid being within the legislative competence of the Parliament.”
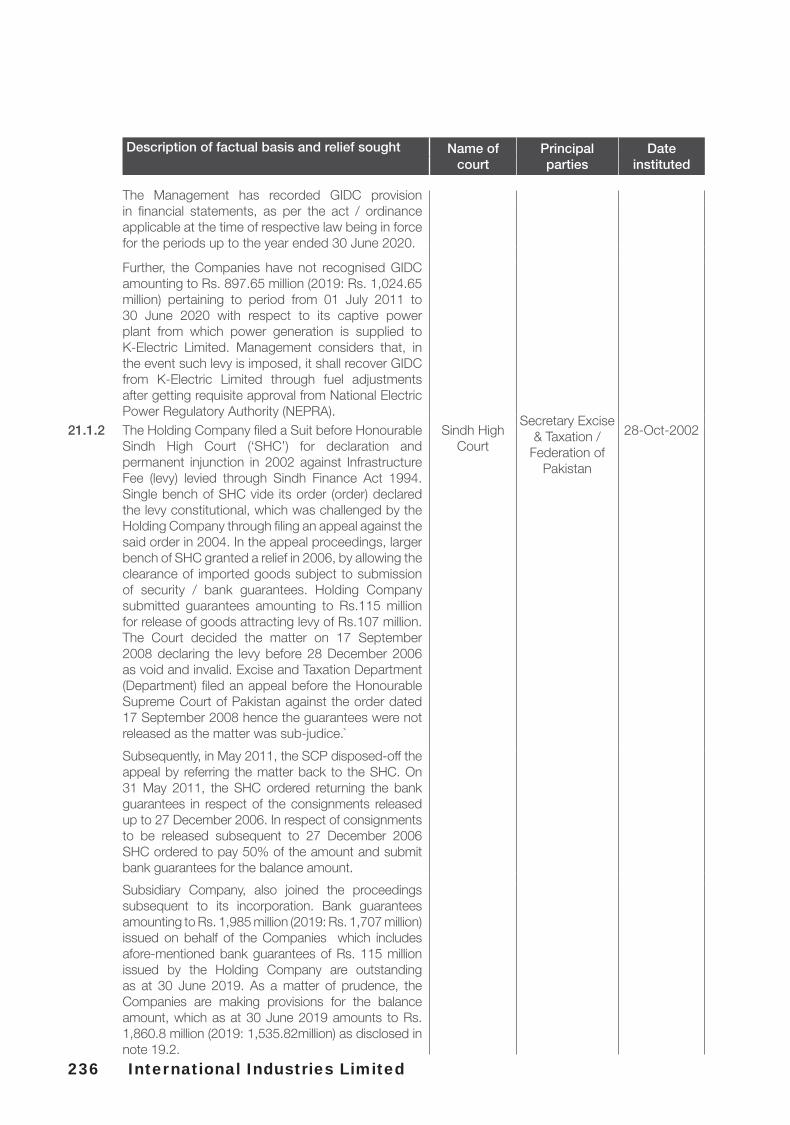
236 International Industries Limited
Description of factual basis and relief sought Name of court
Principal parties
Date instituted
The Management has recorded GIDC provision in financial statements, as per the act / ordinance applicable at the time of respective law being in force for the periods up to the year ended 30 June 2020.
Further, the Companies have not recognised GIDC amounting to Rs. 897.65 million (2019: Rs. 1,024.65 million) pertaining to period from 01 July 2011 to 30 June 2020 with respect to its captive power plant from which power generation is supplied to K-Electric Limited. Management considers that, in the event such levy is imposed, it shall recover GIDC from K-Electric Limited through fuel adjustments after getting requisite approval from National Electric Power Regulatory Authority (NEPRA).
Secretary Excise& Taxation /
Federation ofPakistan
21.1.2 The Holding Company filed a Suit before Honourable Sindh High Court (‘SHC’) for declaration and permanent injunction in 2002 against Infrastructure Fee (levy) levied through Sindh Finance Act 1994. Single bench of SHC vide its order (order) declared the levy constitutional, which was challenged by the Holding Company through filing an appeal against the said order in 2004. In the appeal proceedings, larger bench of SHC granted a relief in 2006, by allowing the clearance of imported goods subject to submission of security / bank guarantees. Holding Company submitted guarantees amounting to Rs.115 million for release of goods attracting levy of Rs.107 million. The Court decided the matter on 17 September 2008 declaring the levy before 28 December 2006 as void and invalid. Excise and Taxation Department (Department) filed an appeal before the Honourable Supreme Court of Pakistan against the order dated 17 September 2008 hence the guarantees were not released as the matter was sub-judice.`
Sindh High Court
28-Oct-2002
Subsequently, in May 2011, the SCP disposed-off the appeal by referring the matter back to the SHC. On 31 May 2011, the SHC ordered returning the bank guarantees in respect of the consignments released up to 27 December 2006. In respect of consignments to be released subsequent to 27 December 2006 SHC ordered to pay 50% of the amount and submit bank guarantees for the balance amount.
Subsidiary Company, also joined the proceedings subsequent to its incorporation. Bank guarantees amounting to Rs. 1,985 million (2019: Rs. 1,707 million) issued on behalf of the Companies which includes afore-mentioned bank guarantees of Rs. 115 million issued by the Holding Company are outstanding as at 30 June 2019. As a matter of prudence, the Companies are making provisions for the balance amount, which as at 30 June 2019 amounts to Rs. 1,860.8 million (2019: 1,535.82million) as disclosed in note 19.2.

237Annual Report 2020
Description of factual basis and relief sought Name of court
Principal parties
Date instituted
Subsequently, vide Sindh Finance Act 2015 & 2016 the levy has been doubled from 2017. On 24 October 2017 the Companies have obtained stay from the SHC against the enhancement. The SHC has clubbed all the cases pertaining to the levy for final disposal.
21.1.3 Oil and Gas Regulatory Authority (OGRA) revised the gas tariff to Rs.600/- per MMBTU by increasing the gas tariff by Rs.112/- per MMBTU vide its notification dated 30 December 2016 disregarding the protocol laid down in OGRA Ordinance, 2002. The Companies have filed a suit in the Sindh High Court (The Court) challenging the gas tariff increase. The Court granted a stay order subject to submission of security for the differential amount with the Nazir of the Court. The Companies have issued cheques amounting to Rs.524.3 million (2019: Rs. 524.3) in favour of Nazir of the court upto 30 September 2018. The Companies, on a prudent basis, have also accrued this amount in these consolidated financial statements.
Sindh High Court
OGRA / SSGC / Federation of
Pakistan
19-Jan-2017
OGRA has further revised the gas tariff to Rs.780/- per MMBTU by increasing the gas tariff by Rs.180/- vide its notification dated 4 October, 2018. The Companies have filed a petition before the Court challenging such further revision and the matter is partially heard. Pending the decision on the matter Companies are settling the bills at the revised rate.
21.1.4 Sindh Revenue Board (SRB) issued notices to the Companies for payment of Sindh Workers Welfare Fund under the Sindh Workers Welfare Fund Act, 2014. The Companies filed a constitutional petition in the Sindh High Court, challenging the said unlawful demand on the ground that the Companies are trans-provincial establishment operating industrial and commercial activities across Pakistan. The Sindh High Court granted stay order in favour of the Companies by declaring exemption on the basis that the Companies being a trans-provincial establishment are paying Workers Welfare Fund under Federal Workers Welfare Fund Ordinance, 1971. In a separate case, the Sindh High Court has dealt on the subject of trans-provisional establishment in its judgement with a conflicting view.
Sindh High Court
SRB / Government of
Sindh
09-Jun-2017
21.1.5 Guarantees issued in favour of Sui Southern Gas Company Limited by the bank on behalf of the Companies amounted to Rs. 511.8 million (2019: Rs.499.6 million) as a security for supply of gas.
21.1.6 Guarantee issued in favour of Pakistan State Oil Company Limited by banks on behalf of the Companies amounted to Rs. 83 million (2019: Rs.112 million ) for supply of fuel and lubricants.

238 International Industries Limited
Description of factual basis and relief sought Name of court
Principal parties
Date instituted
Holding Company
21.1.7 Customs duties amounting to Rs. 40.5 million as at 30 June 2020 (2019: Rs. 40.5 million) on import of raw material shall be payable by the Company in case of non-fulfilment of certain conditions imposed by the customs authorities under SRO 565(1) / 2006. The Company has provided post-dated cheques in favour of the Collector of Customs which are, in the normal course of business, to be returned to the Company after fulfilment of stipulated conditions. The Company has fulfilled the conditions for the aforementioned amounts and is making efforts to retrieve the associated post-dated cheques from the customs authorities.
Sindh High Court
Collector of Customs /
Federation of Pakistan
2005
21.1.8 An amount of Rs. 375 million was claimed by the customs authorities as duty rate differential on imports made during 2005-10 due to an anomaly in SRO 565(1) / 2006 Serial 88. Since then, the anomaly has been rectified. The Company filed a petition with the Honourable Sindh High Court in 2010 for an injunction and is awaiting the final judgement. The management is confident that the decision will be given in favour of the Company.
Sindh High Court
Collector of Customs /
Federation ofPakistan
15-Jan-2010
21.1.9 The customs authorities have charged a redemption fine of Rs. 83 million on clearance of imported raw material consignments in 2006. The Company has filed an appeal before the Honourable Sindh High Court, which has set aside the examination reports including subsequent order produced by the custom authorities, and ordered the authorities to re-examine the matter afresh. However, the custom authorities had filed an application for leave to appeal against the order of the Honourable High Court. The management anticipates that the chances of admission of such appeal are remote.
Sindh High Court
Collector of Customs /
Federation ofPakistan
30-Aug-2007
21.1.10 The Company filed the suit before the Sindh High Court (Court) challenging the chargeability of tax on inter corporate dividend in respect of dividend declared by its subsidiary, International Steels Limited. On 21 October 2016 Court granted stay order against which 500,000 shares of subsidiary company were pledged as a security with Nazir of the Court. In one of the litigation to which Company is not a party, Supreme Court of Pakistan issued an order on 21 February 2018 whereby continuity of suits was made subject to depositing minimum 50% of the tax calculated by the tax authorities. A review petition has been filed against such order of the Supreme Court of Pakistan in which Company is not a party and the decision is awaited. In view of such developments the suit has been withdrawn and a petition has been filed before the Court, which is pending hearing Application for release of pledged shares is in process.
Sindh High Court
FBR / Commissioner
Inland Revenue /
Federation ofPakistan
01-Nov-2016

239Annual Report 2020
Description of factual basis and relief sought Name of court
Principal parties
Date instituted
On a separate application challenging the chargeability of tax on inter corporate dividend, stay order is granted by the Court in respect of dividends declared by the subsidiary company on 02 June 2017, 26 September 2017 and 23 January 2018 against bank guarantees amounting to Rs.76.6 million, Rs.36.8 million and Rs.55.1 million respectively submitted to the Nazir of the Court.
21.1.11 The Holding Company’s share of contingent liabilities of its associated company is Rs. 106.1 million (2019: Rs. 66.9 million).
21.1.12 Guarantees issued in favour of Sui Nothern Gas Pipe Lines Limited by banks on behalf of the Company amounted to Rs. 287.2 million (2019: Rs. 299.42 million) as performance security for goods to be supplied by the Company.
21.1.13 Guarantees issued in favour of Sui Southern Gas Company Limited by banks on behalf of the Company to Rs. 51.75 million (2019: Rs. 97.36 Million) as performance security for goods to be supplied by the Company.
21.1.14 Standby letter of credit issued in favour of Sui Nothern Gas Pipe Lines Limited by bank on behalf of the Company amounted to Rs. 59.57 million (2019: Rs.59.57 million) as a security for supply of Regasified Liquified Natural Gas (RLNG).
21.1.15 Guarantees issued in favour of Lahore Electric Supply Company by bank on behalf of the Company amounted to Rs. 5.83 million (2019: Rs. 5.83 million) as a security for supply of electricity.
21.1.16 Guarantee issued in favour of Aga Khan Planning & Building Service Pakistan by bank on behalf of the Company amounted to Rs. nil million (2019: Rs.2.00 million) as performance security for goods to be supplied by the Company.
21.1.17 Guarantee issued in favour of Small Industries Development Board by bank on behalf of the Company amounted to Rs. 5.00 million (2019: Rs. nil million) as performance security for goods to be supplied by the Company.
21.1.18 Guarantees issued in favour of Sui Nothern Gas Pipe Lines limited by bank on behalf of the Company amounted to Rs.18.40 million (2019: 22.0 million) as security for holding the bids (bid bond) submitted in tenders
21.1.19 Guarantees issued in favour of Sui Southern Gas Company Limited by bank on behalf of the Company amounted to Rs. nil million (2019: 0.81 million) as security for holding the bids (bid bond) submitted in tenders
21.1.20 Guarantee issued in favour of K-Electric by bank on behalf of the Company amounted to Rs. 0.83 million (2019:Rs.0.83 million) as performance security for goods to be supplied by the Company.
21.1.21 Guarantee issued in favour of Lahore Electric Supply Company by bank on behalf of the Company amounted to Rs. 5.83 million (2019:Rs.5.83 million) as security for supply of electricity.
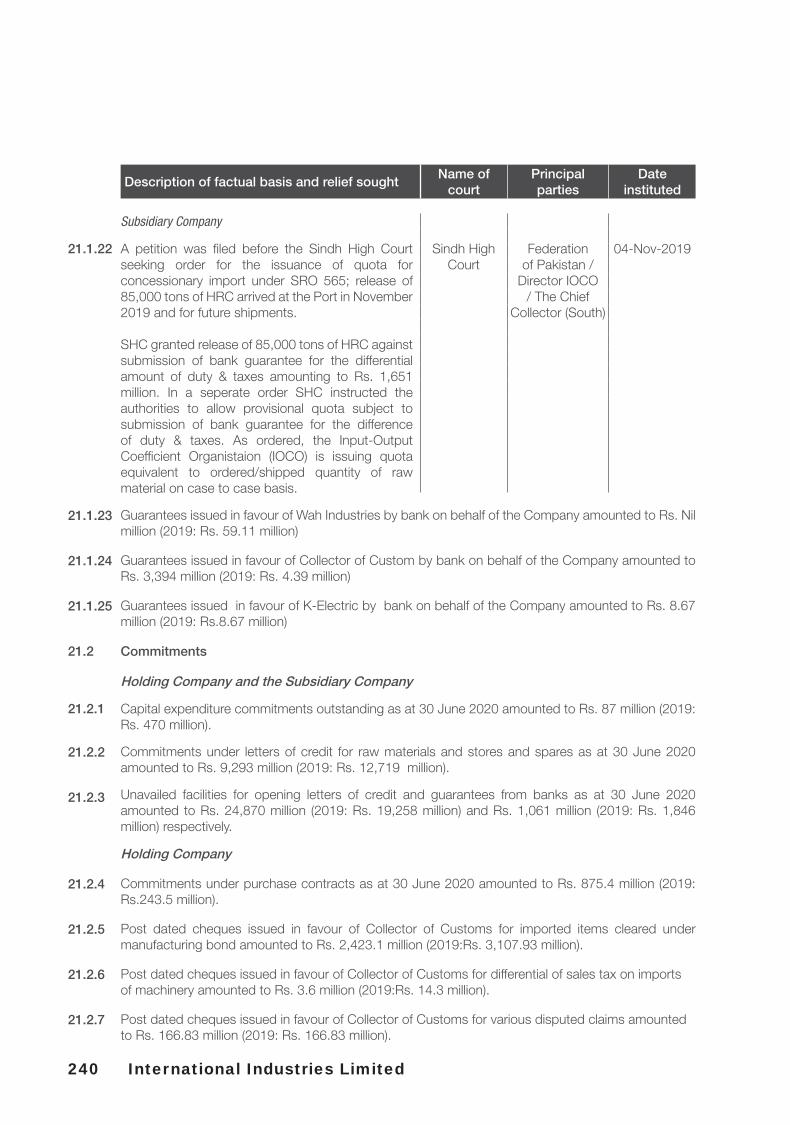
240 International Industries Limited
Description of factual basis and relief soughtName of
courtPrincipal parties
Date instituted
Subsidiary Company
21.1.22 A petition was filed before the Sindh High Court seeking order for the issuance of quota for concessionary import under SRO 565; release of 85,000 tons of HRC arrived at the Port in November 2019 and for future shipments.
SHC granted release of 85,000 tons of HRC against submission of bank guarantee for the differential amount of duty & taxes amounting to Rs. 1,651 million. In a seperate order SHC instructed the authorities to allow provisional quota subject to submission of bank guarantee for the difference of duty & taxes. As ordered, the Input-Output Coefficient Organistaion (IOCO) is issuing quota equivalent to ordered/shipped quantity of raw material on case to case basis.
Sindh HighCourt
Federation of Pakistan /
Director IOCO / The Chief
Collector (South)
04-Nov-2019
21.1.23 Guarantees issued in favour of Wah Industries by bank on behalf of the Company amounted to Rs. Nil million (2019: Rs. 59.11 million)
21.1.24 Guarantees issued in favour of Collector of Custom by bank on behalf of the Company amounted to Rs. 3,394 million (2019: Rs. 4.39 million)
21.1.25 Guarantees issued in favour of K-Electric by bank on behalf of the Company amounted to Rs. 8.67 million (2019: Rs.8.67 million)
21.2 Commitments
Holding Company and the Subsidiary Company
21.2.1 Capital expenditure commitments outstanding as at 30 June 2020 amounted to Rs. 87 million (2019: Rs. 470 million).
21.2.2 Commitments under letters of credit for raw materials and stores and spares as at 30 June 2020 amounted to Rs. 9,293 million (2019: Rs. 12,719 million).
21.2.3 Unavailed facilities for opening letters of credit and guarantees from banks as at 30 June 2020 amounted to Rs. 24,870 million (2019: Rs. 19,258 million) and Rs. 1,061 million (2019: Rs. 1,846 million) respectively.
Holding Company
21.2.4 Commitments under purchase contracts as at 30 June 2020 amounted to Rs. 875.4 million (2019: Rs.243.5 million).
21.2.5 Post dated cheques issued in favour of Collector of Customs for imported items cleared under manufacturing bond amounted to Rs. 2,423.1 million (2019:Rs. 3,107.93 million).
21.2.6 Post dated cheques issued in favour of Collector of Customs for differential of sales tax on imports of machinery amounted to Rs. 3.6 million (2019:Rs. 14.3 million).
21.2.7 Post dated cheques issued in favour of Collector of Customs for various disputed claims amounted to Rs. 166.83 million (2019: Rs. 166.83 million).

241Annual Report 2020
22. NET SALES2020 2019
-------- Rupees in ‘000 --------
Local 64,858,972 80,642,288Export 12,050,057 8,677,083
76,909,029 89,319,371
Sales tax (9,346,650) (11,912,710)Trade discounts (1,373,808) (1,110,512)Export commission & discounts (531,902) (684,065)
(11,252,360) (13,707,287)
65,656,669 75,612,084
22.1 DISAGGREGATION OF REVENUE
In the following table, revenue is disaggregated by primary geographical markets and major product lines:
Primary geographical markets: 2020 2019
-------- Rupees in ‘000 --------
Local 53,646,118 66,961,184
Asia 4,984,351 3,207,394
Europe 626,582 754,460
Australia 1,259,876 1,610,217
Africas 1,334,796 446,507
Americas 3,804,946 2,632,322
65,656,669 75,612,084
Major Product Lines:
Steel products 63,171,422 73,221,337
Polymer products 2,485,247 2,390,747
65,656,669 75,612,084

242 International Industries Limited
Note 2020 2019-------- Rupees in ‘000 --------
23. COST OF SALES
Raw material consumed
Opening stock of raw material 6,948,424 10,219,889 Purchases 58,135,922 62,055,988
65,084,346 72,275,877
Closing stock of raw material 9 (11,089,377) (6,948,424) 53,994,969 65,327,453
Manufacturing overheads
Salaries, wages and benefits 23.1 1,439,966 1,516,398 Rent, rates and taxes 370 2,025 Electricity, gas and water 2,104,031 1,740,599 Insurance 38,918 36,883 Security and janitorial 64,578 62,292 Depreciation and amortisation 5.2 & 6.1.2 1,758,585 1,394,753 Operational supplies and consumables 219,466 224,602 Repairs and maintenance 201,472 244,124 Postage, telephone and stationery 27,551 28,877 Vehicle, travel and conveyance 50,674 60,051 Internal material handling 44,365 73,948 Partial manufacturing 6,286 - Environment controlling 2,943 2,586 Sundries 33,724 24,621 Provision for obsolescence against spares 38,583 15,278
6,031,512 5,427,037
60,026,481 70,754,490
Work-in-process
Opening stock 3,458,783 2,597,105 Closing stock 9 (4,180,318) (3,458,783)Cost of goods manufactured (721,535) (861,678)
59,304,946 69,892,812
Finished goods by-products and scrap
Opening stock 8,645,530 5,052,820 Closing stock 9 (8,177,050) (8,645,530)
468,480 (3,592,710)
59,773,426 66,300,102

243Annual Report 2020
23.1 Salaries, wages and benefits include Rs. 86.49 million (2019: Rs. 75.95 million) in respect of staff retirement benefits
24. SELLING AND DISTRIBUTION EXPENSES Note 2020 2019-------- Rupees in ‘000 --------
Freight and forwarding 1,176,586 1,233,299Salaries, wages and benefits 24.1 284,491 276,192 Rent, rates and taxes 8,731 8,050 Electricity, gas and water 9,956 10,222 Insurance 5,944 10,793 Depreciation and amortisation 5.2 & 6.1.2 26,938 23,157 Repairs and maintenance 534 979 Advertising and sales promotion 119,762 197,562 Postage, telephone and stationery 10,373 10,951 Office supplies 39 135 Vehicle, travel and conveyance 41,857 52,881 Trade Debts written off - 994 Certification and registration charges 2,374 3,982 Others 23,449 23,906
1,711,034 1,853,103
24.1 Salaries, wages and benefits include Rs.16.11 million (2019: Rs. 17.29 million) in respect of staff retirement benefits.
25. ADMINISTRATIVE EXPENSES Note 2020 2019-------- Rupees in ‘000 --------
Salaries, wages and benefits 25.1 355,327 371,943 Rent, rates and taxes 1,448 5,771 Electricity, gas and water 4,732 4,799 Insurance 3,876 4,139 Depreciation and amortisation 5.2 & 6.1.2 27,949 23,044 Repairs and maintenance 2,118 1,646 Postage, telephone and stationery 14,334 16,794 Office supplies 537 590 Vehicle, travel and conveyance 20,962 23,253 Legal and professional charges 94,538 101,746 Certification and registration charges 17,638 9,959 Others 40,946 41,420
584,405 605,104
25.1 Salaries, wages and benefits include Rs. 22.33 million (2019: Rs. 25.22 million) in respect of staff retirement benefits.
26. FINANCE COST Note 2020 2019-------- Rupees in ‘000 --------
Conventional:- Interest on long term finance 224,007 220,291 - Interest on short term borrowings 1,801,798 1,322,209
Islamic:- Mark-up on running musharakah 211,671 190,356 - Mark-up on Islamic export refinance 6,069 - - Mark-up on term musharakah - 102,652 - Mark-up on diminishing musharakah 763,126 340,490 - Mark-up on term murabaha 187,703 8,628
Exchange loss and others 301,073 - Interest on Workers' Profit Participation Fund 19.4 1,071 1,053 Bank charges 48,681 27,971 Interest on lease liabilities 2,259 -
3,547,458 2,213,650

244 International Industries Limited
27. OTHER OPERATING CHARGES Note 2020 2019-------- Rupees in ‘000 --------
Auditors' remuneration 27.1 5,803 5,917 Donations 27.2 21,550 62,722 Exchange loss - net 313,393 225,227 Workers' Profit Participation Fund 19.4 29,230 248,556 Workers' Welfare Fund (20,645) 82,485 Business development expenses 15,628 7,258
364,959 632,165
27.1 Auditors’ remuneration
Audit fee 3,254 3,254 Half yearly review 909 909 Out of pocket expenses 403 293
4,566 4,456 Non-audit servicesCertifications for regulatory purposes 1,237 1,461
5,803 5,917 27.1.1 These amounts are inclusive of sales tax.
27.2 Donations
27.2.1 Donations to the following organization exceed 10 % of total donations by the Group or Rs. 1 million which ever is higher.
2020 2019-------- Rupees in ‘000 --------
SINA Health, Education and Welfare Trust (IIL Clinic) - 12,000 The Citizen Foundation (IIL Campus) 5,600 15,100 Amir Sultan Chinoy Foundation - 8,320 Sindh Institute of Urology and Transplantation (SIUT) - 10,000 Indus Earth Trust 1,000 - Karachi Relief Trust 10,000 -
16,600 45,420
27.3 None of the other donations were made to any donee in which a director or his spouse had any interest at any time during the year. Mr. Riyaz T. Chinoy’s interest in The Citizen Foundation is limited to the extent of his involvement as a director.
28. OTHER INCOME Note 2020 2019-------- Rupees in ‘000 --------
Income / return on financial assets
Income on bank deposits - conventional 7,877 10,483 Exchange gain 86,257 472,531 Government grant 1,423
Income from non-financial assets
Income from power generation 28.1 16,343 8,656 Rental income 2,526 1,948 Gain on disposal of property, plant and equipment 59,541 79,516 Others 34,462 44,554
208,429 617,688

245Annual Report 2020
28.1 Income from power generation Notes 2020 2019-------- Rupees in ‘000 --------
Net sales 723,856 509,222 Cost of electricity produced:Salaries, wages and benefits 28.1.1 (28,864) (27,354)Electricity, gas and water (1,443,959) (1,097,115)Depreciation 5.2 (121,926) (106,147)Stores and spares consumed (22,891) (28,278)Repairs and maintenance (65,831) (52,156)Sundries (1,452) (4,167)
(1,684,923) (1,315,217)
Self consumption 977,410 814,651 Income from power generation 16,343 8,656
28.1.1 Salaries, wages and benefits include Rs. 2.05 million (2019: Rs. 1.37 million) in respect of staff retire-ment benefits.
28.1.2 The Holding Company has 4MW electricity power generation facility at its premises and power generated in excess of its requirements was supplied to K-Electric Limited under an agreement.
28.1.3 The Subsidiary Company (ISL) has 18MW electricity power generation facility at its premises and power generated in excess of its requirements was supplied to K-Electric Limited under an agreement.
29. TAXATION Notes 2020 2019-------- Rupees in ‘000 --------
Current - for the year 1,010,524 906,195 - for prior years (24,000) -
986,524 906,195 - for the year related to share of profit in equity accounted investee - 5,341
13 986,524 911,536
Deferred (775,047) 469,508 211,477 1,381,044
29.1 Relationship between income tax 2020 2019 2020 2019 expense and accounting profit Effective tax rate ------ Rupees in ‘000 ------
(%)Profit before taxation (108,901) 4,669,936
Tax at the enacted rate applicable in Pakistan 29.00 29.00 (31,581) 1,354,281 Tax effect of : Income subject to final tax regime 90.04 (4.83) (98,056) (225,711)Income taxed as separate block of income 48.75 - (53,091) - Minimum tax (378.58) 5.37 412,281 250,777 Tax credits 5.11 (5.65) (5,568) (264,008) Super tax - 1.69 - 79,090 Permanent differences - 0.40 - 18,893
Prior year 22.04 0.00 (24,000) - Change in tax rate on opening deferred tax - (0.74) - (34,683)Adjustments on account of change in rates & proportionate etc, (19.09) 4.33 20,791 202,426 Others (10.39) (0.19) 11,312 (8,924)Consolidation adjustments 18.93 0.19 (20,611) 8,903
(194.19) 29.57 211,477 1,381,044

246 International Industries Limited
30. EARNINGS PER SHARE - BASIC AND DILUTED Note 2020 2019-------- Rupees in ‘000 --------
Profit after taxation for the year (607,044) 2,189,614
(Number)Weighted average number of ordinary shares
in issue during the year 15 131,881,881 119,892,619
(Rupees) Restated
Earnings per share (4.60) 16.60
30.1 There is no dilutive impact on Earnings per share
31. CHANGES IN WORKING CAPITAL 2020 2019-------- Rupees in ‘000 --------
Increase / (decrease) in current assets:Stores and spares (94,412) (250,484)Stock-in-trade 1,586,449 (2,421,461)Trade debts (550,526) (830,924)Advances, trade deposit and short term prepayments 3,742 965,400 Receivable from K-Electric Limited (KE) 10,722 (16,493)Other receivables (5,500) (6,481)Sale tax receivables (1,649,949) (593,833)
(699,474) (3,154,276)Increase /(decrease) in current liabilities:Trade and other payables 2,425,791 1,764,746 Contract liabilities 67,553 351,490
1,793,870 (1,038,040)
32. STAFF RETIREMENT BENEFITS
32.1 Defined Contribution Plan
32.1.1 Employees Provident Funds
The investments out of provident fund have been made in accordance with the provisions of section 218 of the Companies Act, 2017 and the conditions specified thereunder.
32.2 Defined Benefit Schemes Employees Gratuity Funds
The actuarial valuation of gratuity was carried out at 30 June 2020 under projected unit credit method using the following significant assumptions:
a) Financial assumptions 2020 2019
Holding Company (% per annum)
Discount rate 8.50 % 14.25%Salary increase rate First year - Unionized staff 16.00 % 10.85% First year - Management 0% 10.85% Long term 6.50 % 12.25%
Subsidiary CompanyRate of discount 9.25 % 14.25%Expected rate of salary increase 8.25 % 13.25%

247Annual Report 2020
b) Demographic assumptions 2020 2019
Holding CompanyMortality rate SLIC 2001-05-1
HeavyAge 60 years
SLIC 2001-05-1Heavy
Age 60 yearsRates of employee turnoverRetirement assumption
Subsidiary CompanyMortality rate SLIC 2001-05
ModerateAge 60 years
SLIC 2001-05-1Moderate
Age 60 yearsRates of employee turnoverRetirement assumption
c) The amount recognised in the consolidated statement of financial position is as follows:
2020 2019-------- Rupees in ‘000 --------
Present value of defined benefit obligation - beginning of the year 744,907 705,547 Fair value of plan assets (662,593) (587,138)Liability as at 30 June 82,314 118,409
Movement in the net defined liability / (asset)Opening balance 118,409 146,253 Re-measurements recognised in other comprehensive income
during the year (67,981) 541 Expense chargeable to profit & loss account 73,303 66,681 Contribution paid during the year (41,418) (95,066)Closing balance 82,314 118,409
d) Defined benefits cost for the periodCost recognised in P&L for the period Service cost- Current service cost 59,025 55,240
- Interest cost on defined benefits obligation 98,694 61,288 - Interest income on plan assets (84,415) (49,847)
14,279 11,441 Cost recognised in P&L for the period 73,304 66,681
Re-measurements recognised in OCI during the period
Actuarial (gain) / loss on obligation (87,022) (59,280)Actuarial (gain) / loss on plan assets 19,041 59,821 Total re-measurements recognised in OCI (67,981) 541
Total defined benefit cost recognised in P&L and OCI 5,323 67,222
e) Movement in the present value of defined benefit obligationPresent value of defined benefit obligation - beginning of the year 705,547 688,409 Current service cost 59,025 55,240 Interest cost 98,694 61,288 Re-measurement : Actuarial losses/ (gain) on obligation (32,597) (15,626)Benefits paid (85,762) (83,764)Present value of defined benefit obligation - closing date 744,907 705,547
f) Movement in the fair value of plan assetsFair value of plan assets at beginning of the period 587,138 542,156 Interest income on plan assets 84,415 49,847 Re-measurement : acturial gain / loss on plan assets (19,041) (59,821)Actual benefits paid / payable from the Fund (31,337) (40,111)Actual contribution by the employer to the Fund 41,418 95,067 Fair value of plan assets at the end of period 662,593 587,138
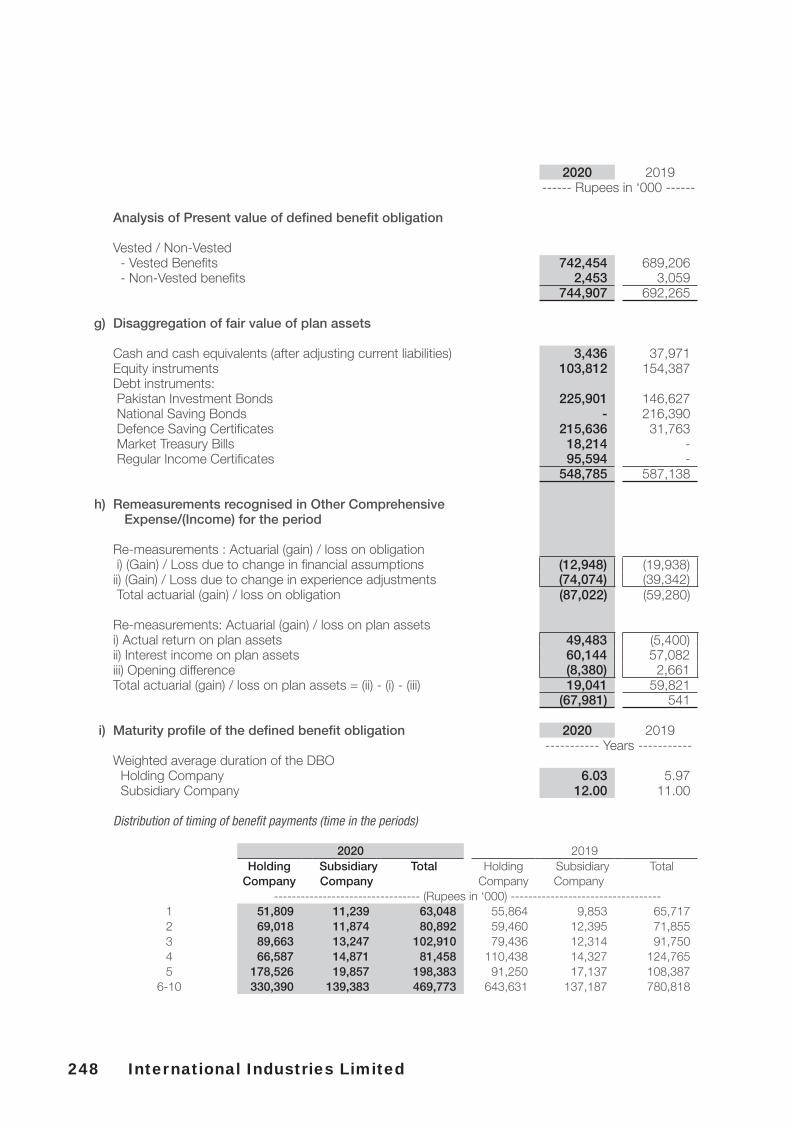
248 International Industries Limited
2020 2019------ Rupees in ‘000 ------
Analysis of Present value of defined benefit obligation
Vested / Non-Vested - Vested Benefits 742,454 689,206 - Non-Vested benefits 2,453 3,059
744,907 692,265
g) Disaggregation of fair value of plan assets
Cash and cash equivalents (after adjusting current liabilities) 3,436 37,971 Equity instruments 103,812 154,387 Debt instruments: Pakistan Investment Bonds 225,901 146,627 National Saving Bonds - 216,390 Defence Saving Certificates 215,636 31,763 Market Treasury Bills 18,214 - Regular Income Certificates 95,594 -
548,785 587,138
h) Remeasurements recognised in Other Comprehensive Expense/(Income) for the period
Re-measurements : Actuarial (gain) / loss on obligation i) (Gain) / Loss due to change in financial assumptions (12,948) (19,938)ii) (Gain) / Loss due to change in experience adjustments (74,074) (39,342) Total actuarial (gain) / loss on obligation (87,022) (59,280)
Re-measurements: Actuarial (gain) / loss on plan assetsi) Actual return on plan assets 49,483 (5,400)ii) Interest income on plan assets 60,144 57,082 iii) Opening difference (8,380) 2,661 Total actuarial (gain) / loss on plan assets = (ii) - (i) - (iii) 19,041 59,821
(67,981) 541
i) Maturity profile of the defined benefit obligation 2020 2019----------- Years -----------
Weighted average duration of the DBOHolding Company 6.03 5.97 Subsidiary Company 12.00 11.00
Distribution of timing of benefit payments (time in the periods)
2020 2019Holding Subsidiary Total Holding Subsidiary Total
Company Company Company Company --------------------------------- (Rupees in ‘000) ----------------------------------
1 51,809 11,239 63,048 55,864 9,853 65,717 2 69,018 11,874 80,892 59,460 12,395 71,855 3 89,663 13,247 102,910 79,436 12,314 91,750 4 66,587 14,871 81,458 110,438 14,327 124,765 5 178,526 19,857 198,383 91,250 17,137 108,387
6-10 330,390 139,383 469,773 643,631 137,187 780,818

249Annual Report 2020
33. REMUNERATION OF CHIEF EXECUTIVES, DIRECTORS AND EXECUTIVES
Chief Executives Directors Executives2020 2019 2020 2019 2020 2019
--------------------------------- (Rupees in ‘000) ----------------------------------
Managerial Remuneration 36,332 36,332 - - 328,630 343,904 Bonus 12,111 16,111 - - 104,036 100,925Retirement benefits 3,026 3,026 - - 28,857 27,356 Rent, utilities etc 18,907 18,945 - - 170,292 175,130 Directors’ fee - - 7,050 6,825 - -
70,376 74,414 7,050 6,825 631,815 647,315
Number of persons 1 1 8 8 96 94
33.1 In addition to the above, the Chief Executives, directors and certain executives are provided with free use of Company maintained vehicles & Chief Executive of Holding Company is provided with security guards in accordance with the respective policies.
33.2 Reimbursement of Holding Company’s chairman expense was Rs. 5.9 million (2019: Rs. 7.2 million).
34. FINANCIAL INSTRUMENTS AND RELATED DISCLOSURES
a) Financial risk management
The Boards of respective group entities have overall responsibility for the establishment and oversight of the risk management framework for the respective group entity. Each group entity has exposure to the following risks from its use of financial instruments:
- Credit risk- Liquidity risk- Market risk
j) Sensitivity analysis of significant actuarial assumptions on present value of DBO
Reasonably possible changes at the reporting date to one of the relevant actuarial assumptions, holding other assumption constant, would have affected the present value of DBO by the amounts shown below:
2020 2019Holding Subsidiary Total Holding Subsidiary Total
Company Company Company Company -------------------------------- (Rupees in ‘000) ---------------------------------
Discount rate + 1% 527,440 165,510 692,950 524,948 133,914 658,862 Discount rate - 1% 595,100 209,618 804,718 591,001 167,787 758,788 Long Term Salary increase + 1% 614,565 209,973 824,538 588,710 168,074 756,784 Long Term Salary increase - 1% 543,402 164,854 708,256 526,503 133,406 659,909
The sensitivity analysis presented above may not be representative of the actual change in the present value of DBO as it is unlikely that the change in assumptions would occur in isolation of one another as some of the assumptions may be correlated.

250 International Industries Limited
b) Risk management framework
The Boards of respective group entities meet frequently throughout the year for developing and monitoring the risk management of the respective group entity. The risk management policies are established for each group entity to identify and analyse the risks faced by the respective entity, to set appropriate risk limits and controls and to monitor risks including adherence to limits. Risk management policies and systems are reviewed regularly to reflect changes in market conditions and the respective group entity’s activities. Each group entity, through its training and management standards and procedures, aims to develop a disciplined and constructive control environment in which all employees understand their roles and obligations.
The Audit Committee (“the Committee”) oversees how management monitors compliance with the respective group entity’s risk management policies and procedures, and reviews the adequacy of the risk management framework in relation to the risks faced by the respective group entity.
34.1 Credit risk
Credit risk is the risk of financial loss to a group entity if a customer or counterparty to a financial instrument fails to meet its contractual obligation without considering fair value of collateral available there against.
Exposure to credit risk
The carrying amount of respective financial assets represent the maximum credit exposure. The maximum exposure to credit risk at balance sheet date is as follows:
2020 2019-------- Rupees in ‘000 --------
- Long term deposit 3,619 3,619- Trade debts - net of provision 4,085,937 3,521,626- Trade deposits 22,942 18,969- Other receivable 23,271 17,771- Receivable from K-Electric Limited 58,399 69,121- Bank balances 580,805 759,543
4,774,973 4,390,649
The group entities do not take into consideration the value of collateral while testing financial assets for impairment. The group entities consider the credit worthiness of counter parties as part of their risk management.
Long term deposits
These represent long term deposits with various parties for the purpose of securing supplies of raw materials and services. No credit exposure is foreseen there against as the amounts are paid to counter parties as per the agreement and are refundable on termination of agreement with respective counterparties.
Trade debts- net of provision
The exposure to credit risk of each group entity arising from trade debtors is mainly influenced by the individual characteristics of each customer. None of the group entity has major concentration of credit risk with any single customer. The majority of the customers of respective group entity have been transacting with them for several years. The Holding Company has computed allowance for impairment on the basis of expected loss model estimate of incurred losses for balances above one year except for amounts due from government / public sector entities.

251Annual Report 2020
Trade deposits
These represent deposits placed with various suppliers as per the terms of securing availability of services. The management does not expect to incur credit loss there against.
Other Receivable & Receivable from K-Electric Limited
This represents receivable from KE on account of electricity provided to it from the 4 MW and 18 MW plant located at factory sites of the Holding Company and Subsidiary Company respectively under an agreement. The Group does not expect to incur credit loss there against.
Analysis of amounts receivable from KE and from local and foreign trade debtors are as follows:
2020 2019-------- Rupees in ‘000 --------
Domestic 2,714,026 2,129,446 Export 1,578,834 1,669,423
4,292,860 3,798,869
The majority of export debtors of the Group are situated in Americas, Australia & Asia.
34.1.1 Impairment losses
The aging of trade debtors and amounts receivable from K-Electric Limited at the reporting date was as follows:
2020 2019Gross Impairment Gross Impairment
-------------------------- (Rupees in ‘000) --------------------------
0-30 Days 3,038,931 22,492 3,221,231 18,339 31-60 Days 391,084 582 248,167 2,851 61-90 Days 385,616 2,770 50,527 992 91-120 Days 176,349 2,989 14,599 426 121-150 Days 134,538 3,648 19,475 598 151-180 Days 10,758 590 8,991 430 181-210 Days 4,624 464 31,839 2,483 211-240 Days 10,854 1,320 18,691 1,986 241-270 Days 6,576 1,492 3,085 400 271-300 Days 3,664 1,614 3,124 1,250 301-330 Days 3,400 1,991 962 539 331-360 Days 35,411 31,966 1,067 718 Over 1 year 91,055 91,055 127,255 127,255 Total 4,292,860 162,973 3,749,014 158,266
Based on an assessment conducted of individual customers, the management believes that receivable falling within the age bracket of upto one year do not require any impairment provision other than to the extent determined above. Further, provision recognised against balances appearing over one year is without prejudice to other recourse the management has for recovery against outstanding balances. Movement in provision has been stated elsewhere in these consolidated financial statements.

252 International Industries Limited
Balances with bankThe group entities places their surplus funds with banks carrying good credit standing assessed by reputable credit agencies. Funds as at 30 June 2019 are placed with banks having credit ratings as follows:
Bank Rating Agency Short term Long term
Habib Bank Limited VIS A-1+ AAAUnited Bank Limited VIS A-1+ AAAFaysal Bank Limited PACRA / VIS A-1+ AABank AL Habib Limited PACRA A-1+ AA+MCB Bank Limited PACRA A-1+ AAAStandard Chartered Bank (Pakistan) Limited PACRA A-1+ AAAMeezan Bank Limited VIS A-1+ AA+Bank Al Falah Limited PACRA / VIS A-1+ AA+Allied Bank Limited PACRA A-1+ AA+Askari Bank Limited PACRA A-1+ AA+Samba Bank Limited VIS A-1 AASoneri Bank Limited PACRA A-1+ AA-Dubai Islamic Bank Limited VIS A-1+ AAHabib Metropolitan Bank Limited PACRA A-1+ AA+MCB Islamic Bank Limited PACRA A1 AAAIndustrial & Commercial Bank of China S&P - AIndustrial & Commercial Bank of China Moody's P-1 A-1Commonwealth Bank of Australia Fitch F1+ AA-
Concentration of credit riskConcentrations arise when a number of counterparties are engaged in similar business activities, or activities in the same geographical region, or have economic features that would cause their ability to meet contractual obligations to be similarly affected by changes in economic, political or other conditions. Concentrations indicate the relative sensitivity of an group entities’ performance to developments affecting a particular industry. In order to avoid excessive concentrations of risk, management focus on the maintenance of a diversified portfolio. Identified concentrations of credit risks are controlled and managed accordingly. Management does not consider that it has any concentration of credit risk at reporting date.
34.2 Liquidity risk Liquidity risk is the risk that a group entity will encounter difficulty in meeting obligations associated
with financial liabilities that are settled by delivering cash or another financial asset. Liquidity risk arises because of the possibility that group entity could be required to pay its liabilities earlier than expected or difficulty in raising funds to meet commitments associated with financial liabilities as they fall due. The approach of group entities to managing liquidity is to ensure, as far as possible, that they will always have sufficient liquidity to meet its liabilities when due, under both normal and stressed conditions, without incurring unacceptable losses or risking damage to the entity’s or group’s reputation. The group entities ensure that they have sufficient liquidity including credit lines to meet expected working capital requirements. The following are the contractual maturities of financial liabilities, including interest payments and excluding the impact of netting agreements.

253Annual Report 2020
2020
Carrying amount
On demand
Contractual cash flows
Six months or less
Six to twelve months
Two to five
years
More than five
years---------------------------------------------------- (Rupees in ‘000) ----------------------------------------------------
Non-derivative financial liabilitiesLong term financing 8,517,954 - (10,186,383) (1,202,197) (1,263,746) (7,233,553) (486,887)Trade and other payables 8,788,183 - (8,788,183) (8,788,183) - - - Accrued mark-up 299,608 - (299,608) (299,608) - - - Short-term borrowings 20,914,861 (20,914,861) - - - - - Contract Liabilities 1,561,899 (1,561,899) - - - - - Unpaid dividend 3,246 (3,246) - - - - - Unclaimed dividend 46,669 (46,669) - - - - -
40,132,420 (22,526,675) (19,274,174) (10,289,988) (1,263,746) (7,233,553) (486,887)
2019
Carrying amount
On demand Contractual cash flows
Six months or less
Six to twelve months
Two to five years
More than five years
---------------------------------------------------- (Rupees in ‘000) -----------------------------------------------------Non-derivative financial liabilitiesLong term financing 9,270,171 - (12,071,436) (1,011,528) (1,059,852) (8,428,826) (1,571,231)Trade and other payables 6,606,105 - (6,606,105) (6,606,105) - - - Accrued mark-up 448,173 - (448,173) (448,173) - - - Short-term borrowings 19,616,349 (19,616,349) - - - - - Contract liability 1,494,346 (1,494,346) - - - - - Unpaid dividend 6,642 (6,642) - - - - - Unclaimed dividend 43,049 (43,049) - - - - -
37,484,835 (21,160,386) (19,125,714) (8,065,806) (1,059,852) (8,428,826) (1,571,231)
34.2.1 The contractual cash flows relating to the above financial liabilities have been determined on the basis of mark-up rate effective as at 30 June. The rates of mark-up have been disclosed in notes 17.1 and 20 to these consolidated financial statements.
34.2.2 Long term financing from various banks contains certain loan covenants. A breach of covenant, in future, may require the Group to repay the respective loans earlier than as directed in the above table.
34.3 Market risk
Market risk is the risk that changes in market prices, such as foreign exchange rates, interest rates and equity prices will affect a group entity’s income or the value of its holdings of financial instruments. The objective of market risk management is to manage and control market risk exposures within acceptable parameters, while optimising the return. Group entities are exposed to currency risk and interest rate risk only.
34.3.1 Currency risk
Currency risk is the risk that the fair value or future cash flows of a financial instrument will fluctuate because of changes in foreign exchange rates.
Exposure to currency risk
The Group is exposed to currency risk on trade debts, borrowings, trade and other payables, bank balances and accrued mark-up that are denominated in a currency other than the functional currency of the Group. The Group’s exposure to foreign currency risk is as follows:

254 International Industries Limited
2020 2019
Rupees US Dollars AUD Rupees US Dollars AUD
----------------------------------------------- (In ‘000) -----------------------------------------------
Financial assets
Bank Balance 485,084 2,888 1,522 702,946 4,316 922
Trade debts 1,578,834 12,471 2,846 1,618,954 11,917 2,436
Financial liabilities
Running finance under FE-25 Export
and Import Scheme - - - - - -
Trade and other payable (5,201,481) (19,668) (2,438) (3,317,176) (9,194) (53)
Net exposure (3,137,563) (4,309) 1,930 (995,276) 7,039 3,305
The following significant exchange rates applied during the year:Rate as at reporting date
2020 2019Buying/Selling Buying/Selling
US Dollars to PKR 167.98 / 168.35 162.87 / 163.24
Australian Dollars to PKR 115.25 / 115.50 114.20 / 114.47
Sensitivity analysis
A 10 percent strengthening / (weakening) of the Pak Rupee against the US Dollar at 30 June would have (decreased) / increased equity / profit and loss after tax as shown below. This analysis assumes that all other variables, in particular interest rates, remain constant. The analysis is performed on the same basis for both the years by applying the corporate tax rates enacted in Pakistan on Consolidated amounts
Effect on profit and loss(net of tax)
2020 2019-------- Rupees in ‘000 --------
As at 30 June Effect - US Dollars (48,278) 75,475 Effect - Australian Dollars 14,649 24,917
34.3.2 Interest rate risk
Interest rate risk is the risk that the fair value of future cash flows of a financial instrument will fluctuate because of changes in market interest rates. The majority of the interest rate exposure arises from short and long term borrowings from banks.
At the reporting date the interest rate profile of the Group’s interest-bearing financial instrument is:
Carrying amount 2020 2019
-------- Rupees in ‘000 --------Fixed rate instrumentsFinancial liabilities (4,502,888) (5,578,506)
Variable rate instrumentsFinancial liabilities (24,929,928) (23,308,014)

255Annual Report 2020
Fair value sensitivity analysis for fixed rate instruments
The group entities do not account for any fixed rate financial assets and liabilities at fair value through the profit and loss. Therefore a change in interest rates at the reporting date would not affect the profit and loss.
Cash flow sensitivity analysis for variable rate instruments
A change of 100 basis points in interest rates at the reporting date would have increased / (decreased) equity and profit and loss by Rs. 230 million (2019: Rs. 200 million) with corresponding effect on the carrying amount of the liability. This analysis assumes that all other variables, in particular foreign currency rates, remain constant. The analysis is performed on the same basis for both the years by applying corporate tax rates enacted in Pakistan on consolidated amounts.
34.4 Reconciliation of movements of liabilities to cash flows arising from financing activities
2020Short term Other Short Long term Unappropriated Totalborrowings term Borrowings profit
used for cash borrowingmanagement
purpose--------------------------------------- (Rupees in ‘000) ---------------------------------------
Balance as at 1 July 12,076,084 7,793,919 9,464,690 7,343,772 36,678,465
Changes from financing cash flowsRepayment of long term loan - - (883,632) - (883,632)Proceeds from long term loan - - 131,415 - 131,415Dividend paid - - - (359,049) (359,049)Total changes from financing activities - - (752,217) (359,049) 35,567,199
Other changes - interest costInterest expense - 2,560,325 987,133 - 3,547,458Interest paid - (2,590,549) (1,105,473) - (3,696,022)Changes in short term borrowings 5,783,150 - - - 5,783,150 Total equity related other changes 3,378,293 (2,110,005) (118,340) - 1,149,948
Total equity related other changes - - - (573,291) (573,291)
Balance as at 30 June 15,454,377 5,683,914 8,594,133 6,411,432 72,822,321
2019Short term Other Short Long term Unappropriated Totalborrowings term Borrowings profit
used for cash borrowingmanagement
purpose--------------------------------------- (Rupees in ‘000) ---------------------------------------
Balance as at 1 July 11,540,539 5,346,081 10,239,821 6,170,136 33,296,577
Changes from financing cash flowsRepayment of long term loan - - (1,473,795) - (1,473,795)Proceeds from long term loan - - 624,553 - 624,553 Dividend paid - - - (1,934,622) (1,934,622)Total changes from financing activities - - (849,242) (1,934,622) (2,783,864)
Other changes - interest costInterest expense - 1,652,869 560,781 - 2,213,650 Interest paid - (1,513,968) (486,670) - (2,000,638)Changes in short term borrowings 535,545 2,308,937 - - 2,844,482 Total equity related other changes 535,545 2,447,838 74,111 - 3,057,494
Total equity related other changes - - - 3,108,258 3,108,258
Balance as at 30 June 12,076,084 7,793,919 9,464,690 7,343,772 36,678,465

256 International Industries Limited
34.4.1 During the year, Rs. 24.3 million (2019: Rs. 238.2 million) has been capitalized as borrowing cost as diclosed in note 5.1.1 to these consolidated financial statements and the related amount is not yet due for payment.
34.5 Other price risks
At present the Group is not exposed to any other price risks.
34.6 Fair value of financial assets and liabilities
The carrying values of financial assets and financial liabilities reported in the balance sheet approximate their fair values.
34.7 Financial instruments by categories Note 2020 2019-------- Rupees in ‘000 --------
Financial assets
Held at amortised costLoans and receivables- Long term deposit 3,619 3,619- Trade debts - net of provision 10 4,085,937 3,521,626- Trade deposits 22,942 18,969- Receivable from K-Electric Limited 58,399 69,121- Other receivable 12 23,271 17,771- Bank balances 14 580,805 759,543
4,774,973 4,390,649
Financial liabilities
Held at amortised cost- Long term financing 17 8,517,955 9,270,171- Trade and other payables 19 8,788,183 6,606,105- Accrued mark-up 299,608 448,173- Short-term borrowings 20 20,914,861 19,616,349- Contract liabilities 1,561,899 1,494,346- Unpaid dividend 3,246 6,642- Unclaimed dividend 46,669 43,049
40,132,421 37,484,835
34.8 None of the financial assets and liabilities are offset in the consolidated statement of financial position.
35. CAPITAL MANAGEMENT
The objective of group entities when managing capital is to safeguard its ability to operate as a going concern so that it can continue to provide returns to shareholders and benefits to other stakeholders and to maintain a strong capital base to support the sustained development of its businesses.
The group entities manage respective capital structure by monitoring return on net assets and making adjustments to it in the light of changes in economic conditions.
36. MEASUREMENT OF FAIR VALUES
A number of the accounting policies require the measurement of fair values, for both financial and non-financial assets and liabilities.
An independent external expert / valuer is engaged with sufficient regularity to carry out valuation of group entities non-financial assets (i.e. Land and Building) and rates are obtained from financial institution to value derivative financial instruments. Involvement of external valuers is decided upon by managements of the group entities. Selection criteria include market knowledge, reputation, independence and whether professional standards are maintained.

257Annual Report 2020
When measuring the fair value of an asset or a liability, an entity uses valuation techniques that are appropriate in the circumstances and uses observable market data as far as possible. Fair values are categorized into different levels in a fair value hierarchy based on the inputs used in the valuation techniques as follows:
- Level 1: quoted prices (unadjusted) in active markets for identical assets or liabilities.
- Level 2: inputs other than quoted prices included in Level 1 that are observable for the asset or liability, either directly (i.e. as prices) or indirectly (i.e. derived from prices).
- Level 3: inputs for the asset or liability that are not based on observable market data (unobservable inputs).
If the inputs used to measure the fair value of an asset or a liability fall into different levels of the fair value hierarchy, then the fair value measurement is categorized in its entirety in the same level of the fair value hierarchy as the lowest level input that is significant to the entire measurement.
For assets and liabilities that are recognised in the consolidated financial statements at fair value on a recurring basis, the management recognises transfers between levels of the fair value hierarchy at the end of the reporting period during which the change has occurred. There were no transfers between different levels of fair values mentioned above.
30 June 2020Carrying amount Fair Value
Amortisedcost
Other financial assets
Liabilities at fair value
through profit or loss
Other financialliabilities
Total Level 1 Level 2 Level 3
---------------------------------------- (Rupees in ‘000) ---------------------------------------- Financial assets not measured at fair valueLong term deposits 3,619 - - - 3,619 - - - Trade debts - net of provision 4,085,937 - - - 4,085,937 - - - Trade deposits 22,942 - - - 22,942 - - - Receivable from K-Electric Limited 58,399 - - - 58,399 - - - Other receivables 23,271 - - - 23,271 - - - Cash and bank balances 580,805 269 - - 581,074 - - - Total 4,774,973 269 - - 4,775,242 - - -
Financial liabilities not measured at fair value - Long term financing - - - 8,517,955 8,517,955 - - - - Trade and other payables - - - 8,788,183 8,788,183 - - - - Accrued mark-up - - - 299,608 299,608 - - - - Short term borrowings - - - 20,914,861 20,914,861 - - - - Contract Liabilities - - - 1,561,899 1,561,899 - - - - Unpaid dividend - - - 3,246 3,246 - - - - Unclaimed dividend - - - 46,669 46,669 - - - Total - - - 40,132,421 40,132,421 - - -
The following table provides the fair value measurement hierarchy of the consolidated assets and liabilities measured at fair value:
30 June 2019Carrying amount Fair Value
Amortisedcost
Other financial assets
Liabilities at fair value through profit or loss
Other financialliabilities
Total Level 1 Level 2 Level 3
---------------------------------------- (Rupees in ‘000) ---------------------------------------- Financial assets not measured at fair valueLong term deposits 3,619 - - - 3,619 - - - Trade debts - net of provision 3,521,626 - - - 3,521,626 - - - Trade deposits 18,969 - - - 18,969 - - - Receivable from K-Electric Limited 69,121 - - - 69,121 - - - Other receivables 17,771 - - - 17,771 - - - Cash and bank balances 759,543 - - - 759,543 - - - Total 4,390,649 - - - 4,390,649 - - -
Financial liabilities not measured at fair value - Long term financing - - - 9,270,171 9,270,171 - - - - Trade and other payables - - - 6,606,105 6,606,105 - - - - Accrued mark-up - - - 448,173 448,173 - - - - Short term borrowings - - - 19,616,349 19,616,349 - - - - Contract Liabilities - - - 1,494,346 1,494,346 - - - - Unpaid dividend - - - 6,642 6,642 - - - - Unclaimed dividend - - - 43,049 43,049 - - - Total - - - 37,484,835 37,484,835 - - -

258 International Industries Limited
The following table provides the fair value measurement hierarchy of the Group’s assets and liabilities measured at fair value:
Assets measured at fair value
Dates of Valuation approach and inputs used Inter-relationship betweenvaluation significant unobservable
inputs and fair valueRevalued property, plant and equipment
measurement
- Land and Building 30 June 2019 The valuation model is based on price per square meter and current replacement cost method adjusted for depreciation factor for the existing assets in use. In determining the valuations for land and buildings, the valuer refers to current market conditions, structure, current replacement cost, sale prices of comparable land in similar location adjusted for differences in key attributes such as land size and inquires with numerous independent local estate agents / realtors in the vicinity to establish the present market value. The fair valuation of land and building are considered to represent a level 3 valuation based on significant non-observable inputs being the location and condition of the assets.
The fair value are subject to change owing to changes in input. However, management does not expect material sensitivity to the fair values arising from the non-observable inputs.
Management assessed that the fair values of cash & cash equivalents, other receivable, receivables from K-Electric, trade deposits, trade receivables, short term borrowings, trade and other payables, accrued mark-up, contract liabilities and unpaid / unclaimed dividends approximate their carrying amounts largely due to short-term maturities of these instruments. For long term deposit and long term financing, management consider that their carrying values approximates fair value owing to credit standing of counterparties and interest payable on borrowings are market rates. Fair value of investment in equity accounted investee is disclosed in note 7.2 to these financial statements.
37. TRANSACTIONS WITH RELATED PARTIES
Related parties comprise associated undertakings, directors of the group entities , key management employees and staff retirement funds. The group entities continue to have a policy whereby all transactions with related parties are entered into at commercial terms and conditions. Contribution to Provident Fund of the group entities, wherever applicable, are made as per the terms of employment and contribution to the group entities defined benefit plan (Gratuity Fund), wherever applicable are in accordance with actuarial advice. Remuneration of key management personnel are in accordance with their terms of employment and policy of respective group entities.
Key management personnel are those persons having authority and responsibility for planning, directing and controlling the activities of the respective group entity. The group entities consider their Chief Executive Officer, Chief Financial Officer, Company Secretary, Non Executive Directors and departmental heads to be their key management personnel. There are no transactions with key management personnel other than their terms of employment / entitlement.
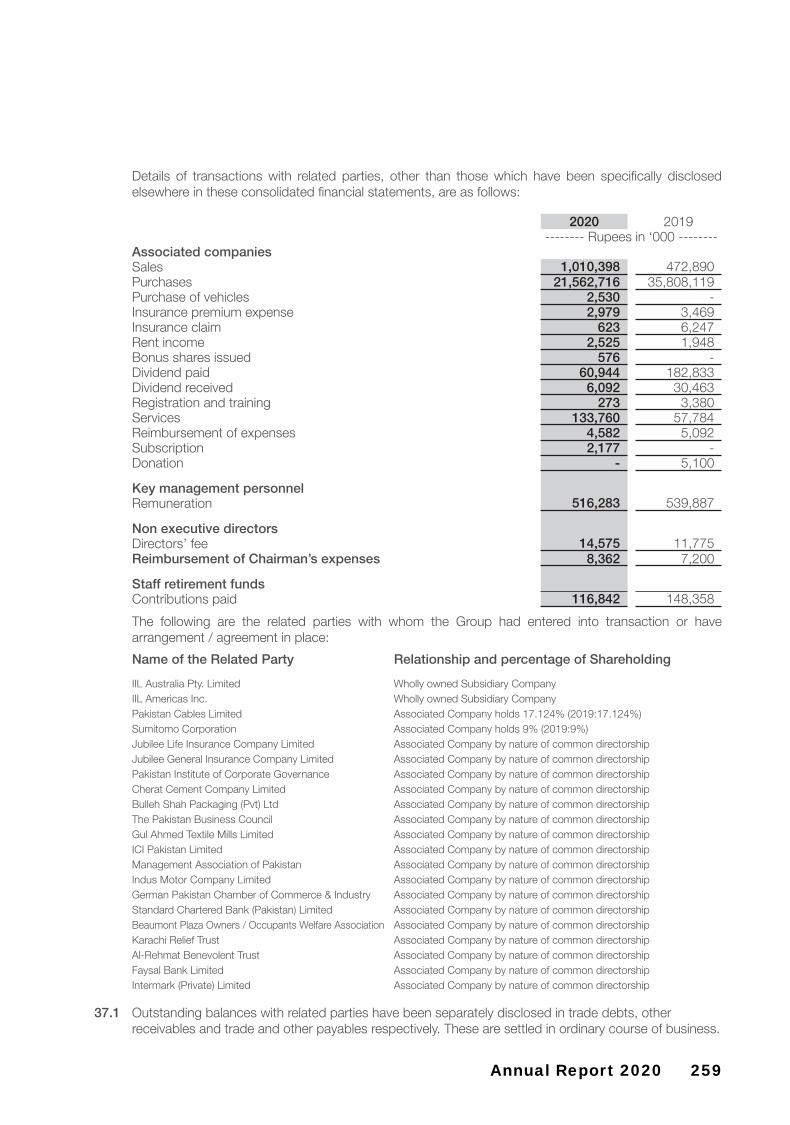
259Annual Report 2020
Details of transactions with related parties, other than those which have been specifically disclosed elsewhere in these consolidated financial statements, are as follows:
2020 2019-------- Rupees in ‘000 --------
Associated companiesSales 1,010,398 472,890 Purchases 21,562,716 35,808,119 Purchase of vehicles 2,530 - Insurance premium expense 2,979 3,469 Insurance claim 623 6,247 Rent income 2,525 1,948 Bonus shares issued 576 - Dividend paid 60,944 182,833 Dividend received 6,092 30,463 Registration and training 273 3,380 Services 133,760 57,784 Reimbursement of expenses 4,582 5,092 Subscription 2,177 - Donation - 5,100
Key management personnelRemuneration 516,283 539,887
Non executive directorsDirectors’ fee 14,575 11,775 Reimbursement of Chairman’s expenses 8,362 7,200
Staff retirement fundsContributions paid 116,842 148,358
The following are the related parties with whom the Group had entered into transaction or have arrangement / agreement in place:
Name of the Related Party Relationship and percentage of Shareholding
IIL Australia Pty. Limited Wholly owned Subsidiary CompanyIIL Americas Inc. Wholly owned Subsidiary CompanyPakistan Cables Limited Associated Company holds 17.124% (2019:17.124%)Sumitomo Corporation Associated Company holds 9% (2019:9%)Jubilee Life Insurance Company Limited Associated Company by nature of common directorshipJubilee General Insurance Company Limited Associated Company by nature of common directorshipPakistan Institute of Corporate Governance Associated Company by nature of common directorshipCherat Cement Company Limited Associated Company by nature of common directorshipBulleh Shah Packaging (Pvt) Ltd Associated Company by nature of common directorshipThe Pakistan Business Council Associated Company by nature of common directorshipGul Ahmed Textile Mills Limited Associated Company by nature of common directorshipICI Pakistan Limited Associated Company by nature of common directorshipManagement Association of Pakistan Associated Company by nature of common directorshipIndus Motor Company Limited Associated Company by nature of common directorshipGerman Pakistan Chamber of Commerce & Industry Associated Company by nature of common directorshipStandard Chartered Bank (Pakistan) Limited Associated Company by nature of common directorshipBeaumont Plaza Owners / Occupants Welfare Association Associated Company by nature of common directorshipKarachi Relief Trust Associated Company by nature of common directorshipAl-Rehmat Benevolent Trust Associated Company by nature of common directorshipFaysal Bank Limited Associated Company by nature of common directorshipIntermark (Private) Limited Associated Company by nature of common directorship
37.1 Outstanding balances with related parties have been separately disclosed in trade debts, other receivables and trade and other payables respectively. These are settled in ordinary course of business.
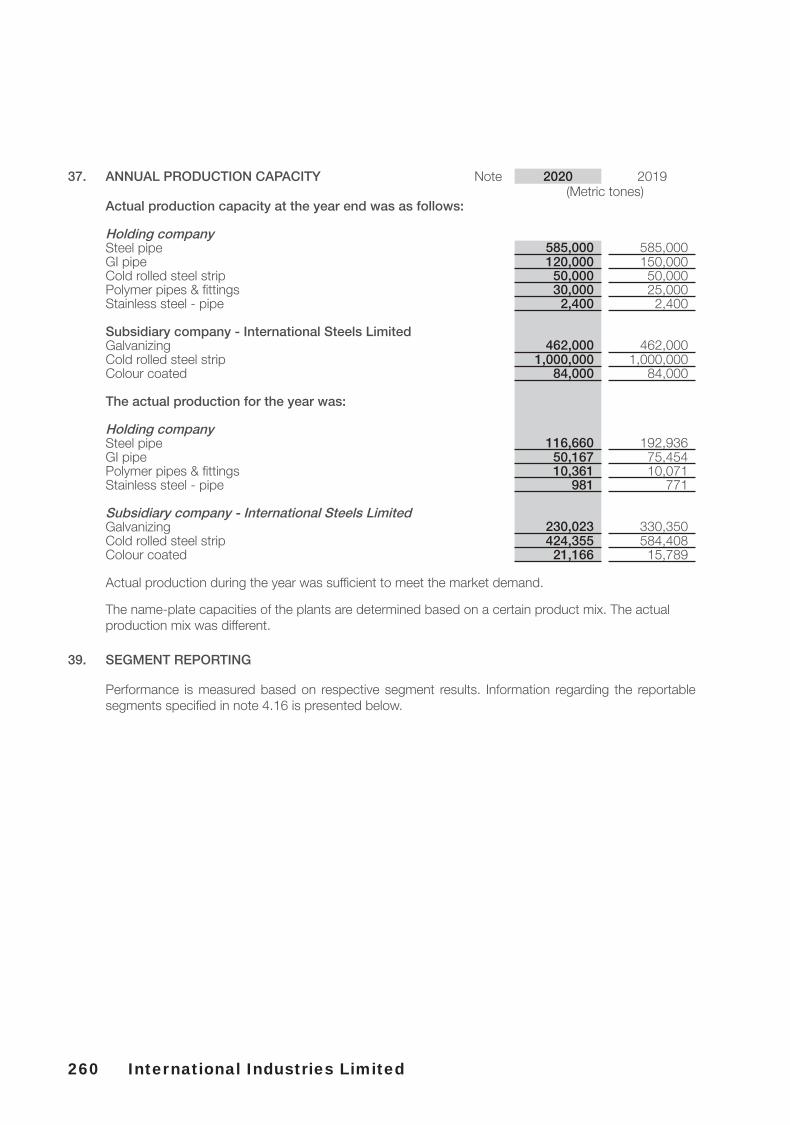
260 International Industries Limited
39. SEGMENT REPORTING
Performance is measured based on respective segment results. Information regarding the reportable segments specified in note 4.16 is presented below.
37. ANNUAL PRODUCTION CAPACITY Note 2020 2019(Metric tones)
Actual production capacity at the year end was as follows:
Holding companySteel pipe 585,000 585,000 GI pipe 120,000 150,000 Cold rolled steel strip 50,000 50,000 Polymer pipes & fittings 30,000 25,000 Stainless steel - pipe 2,400 2,400
Subsidiary company - International Steels LimitedGalvanizing 462,000 462,000 Cold rolled steel strip 1,000,000 1,000,000 Colour coated 84,000 84,000
The actual production for the year was:
Holding companySteel pipe 116,660 192,936GI pipe 50,167 75,454Polymer pipes & fittings 10,361 10,071Stainless steel - pipe 981 771
Subsidiary company - International Steels LimitedGalvanizing 230,023 330,350Cold rolled steel strip 424,355 584,408Colour coated 21,166 15,789
Actual production during the year was sufficient to meet the market demand.
The name-plate capacities of the plants are determined based on a certain product mix. The actual production mix was different.

261Annual Report 2020
202039.1 Segment revenue and results Steel coils Steel pipes Polymer Investment Total
& sheets segment segment segmentsegment
------------------------------- (Rupees in ‘000) -------------------------------For the year ended 30 June 2020Sales 46,732,419 16,439,003 2,485,247 - 65,656,669
Cost of sales (42,415,017) (15,219,226) (2,139,183) - (59,773,426)
Gross profit 4,317,402 1,219,777 346,064 - 5,883,243
Selling and distribution expenses (852,005) (786,016) (73,013) - (1,711,034)Administrative expenses (259,921) (304,529) (19,955) - (584,405)Impairment loss on trade debts (4,042) 3,640 14,187 13,785
(1,115,968) (1,086,905) (78,781) - (2,281,654)
Finance cost (2,308,995) (1,114,675) (123,788) - (3,547,458)Other operating charges (334,257) (20,489) (10,213) - (364,959)
(2,643,252) (1,135,164) (134,001) - (3,912,417)
Other income 35,523 172,906 - - 208,429
Share of loss in equity accounted investee - net of tax - - - (6,502) (6,502)
Profit / (loss) before taxation 593,706 (829,386) 133,282 (6,502) (108,901)Taxation (211,477)Loss after taxation (320,378)
2019Steel coils Steel pipes Polymer Investment Total& sheets segment segment segmentsegment
------------------------------- (Rupees in ‘000) -------------------------------For the year ended 30 June 2019Sales 46,955,070 26,266,267 2,390,747 - 75,612,084
Cost of sales (41,455,520) (22,673,840) (2,170,742) - (66,300,102)
Gross profit 5,499,550 3,592,427 220,005 - 9,311,982
Selling and distribution expenses (898,480) (862,947) (91,676) - (1,853,103)Administrative expenses (284,404) (302,082) (18,618) - (605,104)Impairment reversal on trade debts - (4,713) (905) - (5,618)
(1,182,884) (1,169,742) (111,199) - (2,463,825)
Finance cost (1,289,315) (834,927) (89,408) - (2,213,650)Other operating charges (533,801) (96,609) (1,755) - (632,165)
(1,823,116) (931,536) (91,163) - (2,845,815)
Other income 27,241 590,447 - - 617,688
Share of profit in equity accounted investee - net of tax - - - 49,906 49,906
Profit before taxation 2,520,791 2,081,596 17,643 49,906 4,669,936 Taxation (1,381,044)Profit after taxation 3,288,892

262 International Industries Limited
39.2 Segment assets and liabilities Steel coils Steel pipes Polymer Investment Total& sheets segment segment segmentsegment
------------------------------- (Rupees in ‘000) -------------------------------As at 30 June 2020Segment assets 36,758,671 16,753,164 1,904,264 1,113,256 56,529,355Segment liabilities 29,161,322 10,396,496 1,114,031 - 40,671,849
As at 30 June 2019Segment assets 35,124,694 18,725,225 2,139,907 1,014,685 57,004,511Segment liabilities 24,604,478 11,699,298 1,226,029 - 37,529,805
Reconciliation of segment assets and liabilities with total assets and liabilities in the Balance Sheet is as follows:
2020 2019------ Rupees in ‘000 ------
Total for reportable segments assets 56,529,355 57,004,511Unallocated assets 7,438,601 5,683,702Total assets as per balance sheet 63,967,956 62,688,213
Total for reportable segments liabilities 40,671,849 37,529,805Unallocated liabilities 3,487,326 4,532,799Total liabilities as per balance sheet 44,159,175 42,062,604
39.3 Segment revenues reported above are revenues generated from external customers.
39.4 Segment assets reported above comprise of property, plant and equipment, stock-in-trade and trade debts.
39.5 Information about major customers
Revenue from major customer of Plastic Segment is Rs. 1,159 million (2019: Rs. 1,112 million), where as in the Steel segment was Rs. Nil (2019: Nil) whose revenue accounts for more than 10% of segment’s revenue.
39.6 Geographical information
The consolidated net revenue is from external customers by geographical location is disclosed in note no. 22.1
39.7 Management considers that revenue from its ordinary activities are shariah compliant.
39.8 As at 30 June 2020, all consolidated non current assets are located in Pakistan with an exception of assets of wholly owned foreign subsidiary which are not material for the consolidated financial statements and therefore have not been disclosed.
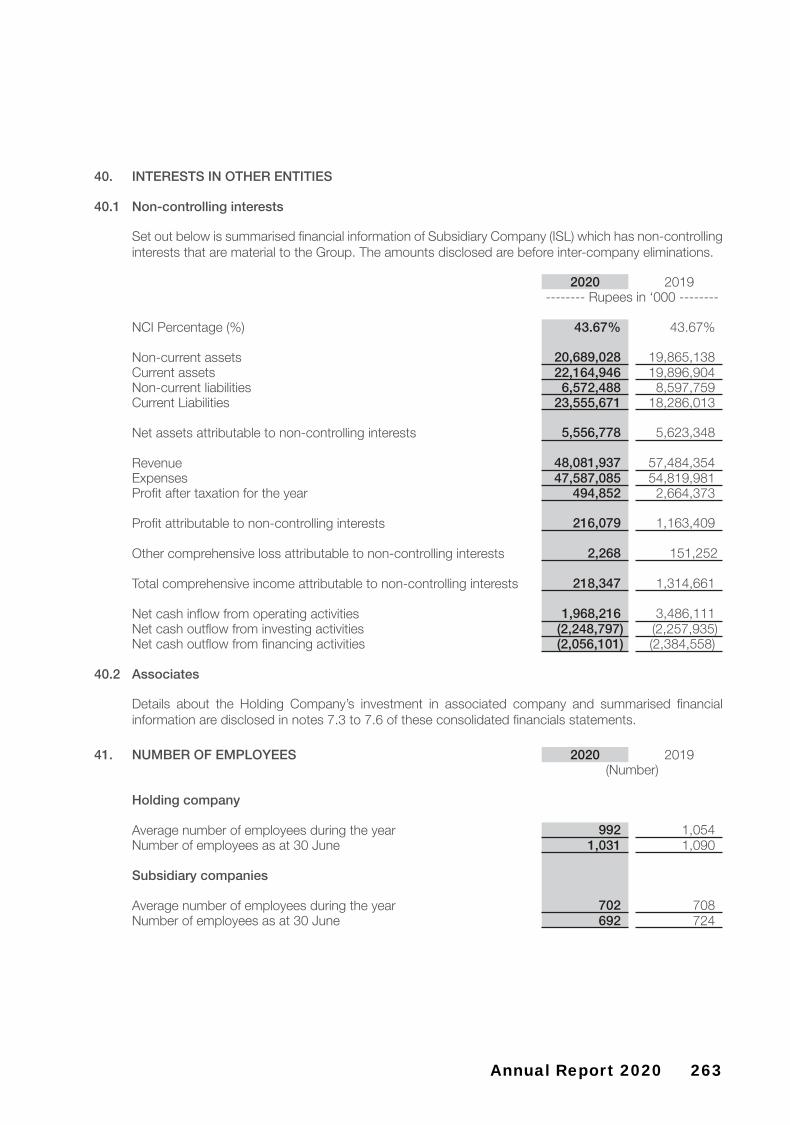
263Annual Report 2020
40. INTERESTS IN OTHER ENTITIES
40.1 Non-controlling interests
Set out below is summarised financial information of Subsidiary Company (ISL) which has non-controlling interests that are material to the Group. The amounts disclosed are before inter-company eliminations.
2020 2019-------- Rupees in ‘000 --------
NCI Percentage (%) 43.67% 43.67%
Non-current assets 20,689,028 19,865,138Current assets 22,164,946 19,896,904Non-current liabilities 6,572,488 8,597,759Current Liabilities 23,555,671 18,286,013
Net assets attributable to non-controlling interests 5,556,778 5,623,348
Revenue 48,081,937 57,484,354Expenses 47,587,085 54,819,981Profit after taxation for the year 494,852 2,664,373
Profit attributable to non-controlling interests 216,079 1,163,409
Other comprehensive loss attributable to non-controlling interests 2,268 151,252
Total comprehensive income attributable to non-controlling interests 218,347 1,314,661
Net cash inflow from operating activities 1,968,216 3,486,111Net cash outflow from investing activities (2,248,797) (2,257,935)Net cash outflow from financing activities (2,056,101) (2,384,558)
40.2 Associates
Details about the Holding Company’s investment in associated company and summarised financial information are disclosed in notes 7.3 to 7.6 of these consolidated financials statements.
41. NUMBER OF EMPLOYEES 2020 2019(Number)
Holding company
Average number of employees during the year 992 1,054 Number of employees as at 30 June 1,031 1,090
Subsidiary companies
Average number of employees during the year 702 708Number of employees as at 30 June 692 724

264 International Industries Limited
42. GENERAL
42.1 Non Adjusting events after balance sheet date
The Board of Directors of the Holding Company in their meeting held on 27 August 2020 has not proposed any dividend (2019: Rs.3.00 per share amounting to Rs. 399.68 million and 10% bonus shares i.e. one ordinary share for each 10 ordinary shares) for the year ended 30 June 2020.
The Board of Directors of the Subsidiary Company (International Steels Limited) in their meeting held on 25 August 2020 has not proposed any dividend (2019: Rs.1.50 per share amounting to Rs.652.50 million) for the year ended 30 June 2020.
The Board of Directors of the equity accounted investee company (Pakistan Cables Limited) in their meeting held on 11 August 2020 has not proposed any dividend (2019: 1.00 per share amounting to Rs.35.58 million) for the year ended 30 June 2020.
42.2 Corresponding figures have been reclassified for the purpose of comparison and better presentation. These reclassifications have no impact on previously reported profit or equity.
44 DATE OF AUTHORISATION FOR ISSUE
These consolidated financial statements were authorised for issue on 27 August 2020 by the Board of Directors.
Ehsan A. Malik Muhammad Akhtar Riyaz T. ChinoyDirector & Chairman Chief Financial Chief Executive
Board Audit Committee Officer Officer

265Annual Report 2020

266 International Industries Limited

267Annual Report 2020
STAKEHOLDERSINFORMATION

268 International Industries Limited
STAKEHOLDERS INFORMATION
FINANCIAL CALENDARRESULTSFirst quarter ended September 30th, 2019 Approved and Announced on October 18th, 2019Half year ended December 31st, 2019 Approved and Announced on January 30th, 2020Third quarter ended March 31st, 2020 Approved and Announced on April 16th, 2020Year ended June 30th, 2020 Approved and Announced on August 27th, 2020
DIVIDENDSFinal – Cash (2018-19) Approved on September 30th, 2019
Entitlement date September 30th, 2019Statutory limit up to which payable October 21st, 2019Paid on October 17th, 2019
Final Bonus (2018-19) Approved on September 30th, 2019Entitlement date September 30th, 2019Statutory limit up to which shares to be allottedOctober 30th, 2019Allotted on October 28th, 2019
LATEST ANNUAL REPORT Issued on September 7th, 2020
72ND ANNUAL GENERAL MEETING To be held on September 30th, 2020
TENTATIVE DATES OF FINANCIAL RESULTS OF 2020-21First quarter ended September 30th, 2020 October 22nd, 2020Half year ended December 31st, 2020 February 1st, 2021Third quarter ended March 31st, 2021 April 22nd, 2021Year ended June 30th, 2021 August 26th, 2021
OWNERSHIPOn June 30th, 2020 there were 4,045 members on the record of the Company’s ordinary shares.
DIVIDEND AND/OR BONUS SHARESThe Board of Directors of the Company has not recommended dividend and/or bonus for the year ended June 30th, 2020.
SHAREHOLDERS COMPOSITION
0 20 40 60 80 100
2015-16
2016-17
2017-18
2018-19
2019-20 8.4 16.47 50.5 24.63
9.88 16.79 50.7 22.63
9.87 21.24 50.61 18.28
6.75 24.07 50.49 18.68
7.93 22.1 50.57 19.4
Govt. FICorporate Shareholders Individuals
Sponsors/ Directors/Group Companies

269Annual Report 2020
PATTERN OF SHAREHOLDINGAs at June 30th, 2020
NO. OF SHAREHOLDERS HAVING SHARES SHARES HELD PERCENTAGE FROM TO 793 1 100 23,142 0.0175 888 101 500 261,389 0.1982 524 501 1,000 411,376 0.3119 982 1,001 5,000 2,328,494 1.7656 287 5,001 10,000 2,054,460 1.5578 134 10,001 15,000 1,658,887 1.2579 81 15,001 20,000 1,437,813 1.0902 46 20,001 25,000 1,037,781 0.7869 32 25,001 30,000 867,064 0.6575 27 30,001 35,000 878,112 0.6658 17 35,001 40,000 647,318 0.4908 17 40,001 45,000 726,881 0.5512 15 45,001 50,000 728,639 0.5525 9 50,001 55,000 472,688 0.3584
12 55,001 60,000 695,938 0.5277 10 60,001 65,000 623,556 0.4728 5 65,001 70,000 339,011 0.2571
12 70,001 75,000 878,891 0.6664 7 75,001 80,000 540,742 0.4100
15 80,001 90,000 1,275,729 0.9673 13 90,001 100,000 1,247,235 0.9457 17 100,001 120,000 1,860,665 1.4109 17 120,001 150,000 2,341,598 1.7755 12 150,001 200,000 2,027,859 1.5376 17 200,001 250,000 3,845,405 2.9158 9 250,001 300,000 2,494,922 1.8918 5 300,001 400,000 1,751,100 1.3278 5 400,001 500,000 2,318,775 1.7582 4 500,001 600,000 2,195,779 1.6650 2 600,001 700,000 1,306,460 0.9906 2 700,001 800,000 1,428,810 1.0834 4 800,001 1,000,000 3,486,616 2.6437 1 1,000,001 1,100,000 1,100,000 0.8341 4 1,100,001 1,300,000 4,909,713 3.7228 1 1,300,001 1,380,000 1,366,464 1.0361 1 1,380,001 1,400,000 1,390,100 1.0540 1 1,400,001 1,500,000 1,473,500 1.1173 6 1,500,001 1,600,000 9,396,387 7.1249 2 1,600,001 2,000,000 3,438,655 2.6074 2 2,000,001 3,000,000 5,647,200 4.2820 1 3,000,001 4,000,000 3,827,316 2.9021 1 4,000,001 5,500,000 5,482,183 4.1569 2 5,500,001 6,000,000 11,914,417 9.0342 1 6,000,001 10,000,000 6,096,218 4.6225 1 10,000,001 15,000,000 14,202,600 10.7692 1 15,000,001 18,000,000 17,443,992 13.2270
4045 131,881,880 100.0000

270 International Industries Limited
CATEGORIES OF SHAREHOLDERSAs at June 30th, 2020
KEY SHAREHOLDING As at June 30th, 2020
Information on shareholding required under reporting framework is as follows:
No. of Shares Percentage
Directors and Spouses 43,309,479 32.8396%
Associated companies, undertakings and related partiesJubilee General Insurance Company Limited 2,737,200 2.0755%Pakistan Cables Limited 633,600 0.4804%Pakistan Cables Limited Employees Provident Fund 599,197 0.4543%Pakistan Cables Limited Management Staff Pension Fund 255,860 0.1940%
4,225,857 3.2043%
Government Financial Institutions and AssociatesNational Investment (Unit) Trust 5,997,136 4.5474%National Bank of Pakistan 2,910,000 2.2065%National Bank of Pakistan Employees Pension Fund 1,227,573 0.9308%State Life Insurance Corporation of Pakistan 721,620 0.5472%National Investment Trust Limited - Administration Fund 176,025 0.1335%National Bank of Pakistan Employees Benevolent Fund Trust 43,074 0.0327%National Bank of Pakistan 7,540 0.0057%IDBL (ICP UNIT) 885 0.0007%Investment Corporation of Pakistan 462 0.0004%
11,084,315 8.4047%
MEMBERS HAVING 5% or more of voting rights
Name of Shareholder Shares Held Percentage
Mr. Mustapha A. Chinoy 17,444,592 13.2274%Mr. Kamal A. Chinoy 14,202,700 10.7693%
SALE/PURCHASE OF SHARES BY DIRECTORS/EXECUTIVES During the financial year 2019-20, 351,072 shares of IIL were sold/purchased by the directors/executives.
PARTICULARS NO. OF
SHAREHOLDERS NO. OF
SHARES HELD PERCENTAGE
Directors, CEO, Sponsors and Family Members 22 65,112,861 49.3721%Associated companies, undertakings and related parties 4 4,225,857 3.2043%Government Financial Institutions and Associates 9 11,084,315 8.4047%Banks, Development Finance Institutions, Non-Banking Finance Companies, Insurance Companies, Takaful, Modarabas and Pension Funds
38 8,801,998 5.5360%
Mutual Funds 44 4,098,429 3.3357%Foreign Companies 5 182,124 1.0810%Public, Private and Other Companies 126 555,597 4.4392%General Public 3797 37,820,699 24.6270%TOTAL 4045 131,881,880 100.0000%

271Annual Report 2020
NOTICE OF ANNUAL GENERAL MEETINGFor the year ended June 30th, 2020
Notice is hereby given to the members that the 72nd Annual General Meeting of the International Industries Limited will be held on September 30th, 2020 at 11:30 a.m. at Karachi to transact the following business. Due to the current situation caused by COVID-19 pandemic, shareholders shall be entitled to attend the meeting through video conference facility managed by the Company as per the instructions given in the notes section.
Ordinary business1. To receive, consider and adopt the Audited Accounts (consolidated and unconsolidated) of the Company
for the year ended June 30th, 2020, together with the Reports of the Directors and Auditors thereon. As required under Section 223 (7) of the Companies Act 2017, Financial Statements of the Company have been uploaded on website of the Company which can be downloaded from the following link: http://www.iil.com.pk/investors/financial-information
2. To appoint Auditors for a term ending at the conclusion of the next Annual General Meeting and fix their remuneration. The retiring Auditors, KPMG Taseer Hadi & Co., Chartered Accountants, has completed the period of five years. Therefore, the Board Audit Committee and Board of Directors recommends that A. F. Ferguson & Co., Chartered Accountants (a member firm of the PwC network), who have indicated their consent to act as Auditors, be appointed as Statutory Auditors at the same statutory audit fees as currently being paid to the retiring Auditors. In addition, any Federal or Provincial taxes and reimbursements of out of pocket expenses will be paid at actuals.
Any Other BusinessTo consider any other business with the permission of the Chair.
By Order of the Board
September 7th, 2020 Sunaib BarkatKarachi Company Secretary
Notes:1. Participation in the AGM proceeding via the video conference facility:
Due to current COVID-19 situation, the AGM proceedings shall be held via video conference facility only.
Shareholders interested to participate in the meeting are requested to email their Name, Folio Number, Cell Number, and Number of shares held in their name with subject “Registration for International Industries Limited AGM” along with valid copy of both sides of Computerized National Identity Card (CNIC) at [email protected], video link and login credentials will be shared with only those members whose emails, containing all the required particulars, are received at least 48 hours before the time of AGM.
Shareholders can also provide their comments and questions for the agenda items of the AGM at the email address [email protected]
2. The Register of Members and the Share Transfer Books will be closed from September 16th, 2020, to September 30th, 2020 (both days inclusive) for the purpose of the Annual General Meeting.
3. Only those persons whose names appear in the Register of Members of the Company as at September 16th, 2020 are entitled to attend and vote at the Annual General Meeting.
4. A Member entitled to attend and vote at the Annual General Meeting may appoint another Member as his/her proxy to attend and vote for him/her provided that a corporation may appoint as its proxy a person who is not a Member but is duly authorized by the corporation. Proxies must be received at the Registered Office of the Company not less than 48 hours before the time of the holding of the Annual General Meeting.
5. CDC Account Holders will further have to follow the under mentioned guidelines as laid down in Circular 1 dated January 26, 2000 issued by the Securities and Exchange Commission of Pakistan.
6. Pursuant to Section 150 of the Income Tax Ordinance, 2001 and Finance Act, 2018 withholding tax on dividend income will be deducted for shareholder appearing and not appearing on Active Taxpayers List at 15% and 30% respectively. According to the Federal Board of Revenue (FBR), withholding tax in case of joint accounts will be determined separately based on the ‘shareholders appearing / not appearing on Active Taxpayers List’ status of the principal shareholder as well as the status of the joint holder(s) based on their shareholding proportions. Members that hold shares with joint shareholders are requested to provide the shareholding proportions of the principal shareholder and the joint holder(s) in respect of shares held by them to our Share Registrar, M/s. CDC Share Registrar Services Limited in writing. In case the required information is not provided to our Registrar it will be assumed that the shares are held in equal proportion by the principal shareholder and the joint holder(s).
A. Requirements for attending the Annual General Meeting:
(i) In the case of individuals, the account holder or sub-account holder whose registration details are uploaded as per the Central Depository Company of Pakistan Limited Regulations, shall authenticate his/her identity by showing his/her original Computerized National Identity Card (CNIC) or original passport at the time of attending the Annual General Meeting.
(ii) In case of a corporate entity, the Board of Directors’ resolution/power of attorney, with specimen signature of the nominee, shall be presented at the time of the Annual General Meeting, unless it has been provided earlier.
272 International Industries Limited
B. Requirements for appointing Proxies:
(i) In case of individuals, the account holder or sub-account holder whose registration details are uploaded as per the Central Depository Company of Pakistan Limited Regulations, shall submit the proxy form as per the above requirement.
(ii) The proxy form shall be witnessed by two persons whose names, addresses and CNIC numbers shall be mentioned on the form.
(iii) Attested copies of the CNICs or the passports of the beneficial owner(s) and the proxy shall be furnished with the proxy form.
(iv) In case of a corporate entity, the Board of Directors’ resolution/power of attorney, with specimen signature of the nominee, shall be submitted to the Company along with the proxy form unless the same has been provided earlier.
(v) The proxy shall present his/her original CNIC or original passport at the time of the Annual General Meeting.
C. Electronic dividend mandate:Under the Section 242 of Companies Act, 2017, it is mandatory for all listed companies to pay cash dividend to its shareholders through electronic mode directly in to the bank account designated by the entitled shareholders. In order to receive dividend directly into their bank account, shareholders are requested (if not already provided) to fill in Bank Mandate Form for Electronic Credit of Cash Dividend available on the Company’s website and send it duly signed along with a copy of CNIC to the Share Registrar, M/s. CDC Share Registrar Services Limited, CDC House 99-B, Block ‘B’, Sindhi Muslim Cooperative Housing Society (S.M.C.H.S), Main Shahrah-e-Faisal, Karachi - 74400, in case of physical shares.
In case of shares held in CDC then Electronic Dividend Mandate Form must be directly submitted to shareholder’s brokers / participant / CDC account services.
In case of non-receipt of information, the Company will be constrained to withhold payment of dividend to shareholders.
D. Submission of valid CNIC (Mandatory):
As per SECP directives the dividend of shareholders whose valid CNICs, are not available with the Share Registrar could be withheld. All shareholders having physical shareholding are therefore advised to submit a photocopy of their valid CNICs immediately, if already not provided, to the Share Registrar, M/s. CDC Share Registrar Services Limited, CDC House, 99-B, Block ‘B’, Sindhi Muslim Cooperative Housing Society (S.M.C.H.S), Main Shahrah-e-Faisal, Karachi - 74400 without any further delay.
E. Unclaimed dividend and/or bonus shares:
Shareholders, who by any reason, could not claim their dividend and/or bonus shares, if any, are advised to contact our Share Registrar to collect / enquire about their unclaimed dividend and/or bonus shares, if any.
F. Electronic voting:
Members can exercise their right to demand a poll subject to meeting requirements of Section 143 -145 of the Companies Act, 2017 and applicable clauses of the Companies (Postal Ballot) Regulations, 2018.
G. Consent for Video Conference facility:
Pursuant to SECP Circular No 10 of 2014 dated May 21st, 2014, if the Company receives consent from members holding in aggregate 10% or more shareholding residing in a geographical location to participate in the meeting through video conference at least 7 days prior to the date of Annual General Meeting, the Company will arrange video conference facility in that city subject to availability of such facility in that city.
To avail this facility please provide the following information to the Share Registrar Office of the Company i.e. M/s. CDC Share Registrar Services Limited, CDC House, 99-B, Block ‘B’, Sindhi Muslim Cooperative Housing Society (S.M.C.H.S), Main Shahrah-e-Faisal, Karachi – 74400 and email: [email protected]
I/We, of being a member of International Industries Limited holder of Ordinary Share(s) as per Register Folio No. _____________ hereby opt for video conference facility at (Please insert name of the City).
____________________Signature of the member
H. Electronic transmission of Financial Statements and Notices:
Pursuant to Notification vide SRO 787(I)/2014 dated September 8th, 2014, the Securities and Exchange Commission of Pakistan (SECP) has directed all companies to facilitate their members receiving annual financial statements and notice of annual/extraordinary general meeting through electronic mail system (Email). The Company is pleased to offer this facility to our valued members who desire to receive annual financial statements and notices through email in future.
In this regard, those members who wish to avail this facility are hereby requested to convey their consent via email on a standard request form which is available at the Company’s website. Further, if a shareholder, in addition to above, also requests for the hard copy of Annual Financial Statements, then the same shall be provided free of cost within seven (7) days of receipt of such request.
Please ensure that your email account has sufficient rights and space available to receive such email which may be greater than 1 MB in size. Further, it is the responsibility of member(s) to timely update the share registrar of any changes in his/her/its/their registered email address at the address of Company’s Registrar.


276 International Industries Limited
AGM Annual General Meeting
API American Petroleum Institute
ATIR Appellate Tribunal Inland Revenue
ATL Active Tax Payer List
AUD Australian Dollars
BAC Board Audit Committee
BCP Business Continuity Planning
Board/BOD Board of Directors
CBA Collective Bargaining Agreement
CCG Code of Corporate Governance
CDC Central Depository Company
CE Conformité Européene or European Conformity
CEO Chief Executive Officer
CDC Central Depository Company
CFO Chief Financial Officer
CIR Commissioner Inland Revenue
CIT Commissioner Income Tax
COLA Cost of Living Allowance
CR Cold Rolled
CRC Cold Rolled Coil
CSR Corporate Social Responsibility
CTAC Citizens Trust Against Crime
CWIP Capital Work in Progress
DBN Debottlenecking
EBIT Earnings before Interest and Taxation
EBITDA Earnings before Interest, Taxation Depreciation and Amortisation
EC Executive Committee
EFP Employees Federation of Pakistan
EPS Earning Per Share
ERW Electric Resistance Weld
ETP Effluent Treatment Plant
EY Ernst Young
FBR Federal Board of Revenue
FPAP Fire Protection Association of PakistanFPCCI Federation of Pakistan Chambers of Commerce and Industry
FTA Free-Trade Agreement
FTO Federal Tax Ombudsman
FTR Final Tax Regime
GDP Gross Domestic Product
GI Galvanized Iron
GIDC Gas Infrastructure Development Cess
GoP Government of Pakistan
HDPE High Density Polyethylene
HoD Head of Department
HR Human Resource
HRRC Human Resource Remuneration Committee
HRC Hot Rolled Coil
HSE Health, Safety and Environment
HSS Hollow Structural Sections
IAS International Accounting Standards
IBA Institute of Business Administration
ICAP Institute of Chartered Accountants of Pakistan
ICMAP Institute of Cost and Management Accountants of Pakistan
IFC International Finance Corporation
IFRIC International Financial Reporting Interpretation Committee
IFRS International Financial Reporting Standards
IIL International Industries Limited
IPO Initial Public Offering
ISL International Steels Limited
ISO International Organization for Standardization
ISO International Standards Organization
IT Information Technology
ITAT Income Tax Appellate Tribunal
JV Joint Ventures
KE Karachi Electric
KIBOR Karachi Interbank Offer Rate
KPMG Klynveld Peat Marwick Goerdeler
LIBOR London Interbank Offered Rate
LPG Liquefied Petroleum Gas
LSM Large Scale Manufacturing
LTC Lost Time Case
GLOSSARY

277Annual Report 2020
LTIFR Lost Time Injury Frequency Rate
LTU Large Taxpayers Unit
LUMS Lahore University of Management Sciences
M&A Memorandum and Articles
MAP Management Association of Pakistan
MC Management Committee
MDPE Medium Density Polyethylene
MoC Ministry of Commerce
MT Metric Ton(s)
NBV Net Book Value
NFEH National Forum for Environment and Health
NOC No Objection Certificate
NRV Net Realizable Value
NTC National Tariff Commission
OHSAS Occupational Health and Safety Assessment Specification
OPEC Organization of the Petroleum Exporting Countries
PACRA Pakistan Credit Rating Agency
PAT Profit after tax
PCL Pakistan Cables Limited
PEX Cross-linked Polyethylene
PICG Pakistan Institute of Corporate Governance
PKR Pakistan Rupees
PPRC Polypropylene Random Copolymer
PSQCA Pakistan Standards and Quality Control Authority
PSX Pakistan Stock Exchange
Rs. Pakistani Rupees
SECP Securities and Exchange Commission of Pakistan
SHC Sindh High Court
SNGPL Sui Northern Gas Pipelines Limited
SS Stainless Steel
SSGC Sui Southern Gas Company Limited
TCF The Citizens Foundation
UL Underwriters Laboratories
US$/USD United States Dollar


CONSENT FOR ANNUAL REPORT
Dear Shareholder(s)
The Securities and Exchange Commission of Pakistan (SECP) through its Notification (SRO 787(I)/2014) dated September 8th, 2014 has allowed the circulation of Company’s annual balance sheet and profit and loss account, auditor’s report and directors’ report etc. (Audited Annual Financial Statements) to shareholders along with notice of Annual General Meeting (AGM) through e-mail.
Therefore, if you wish to receive company’s (Audited Annual Financial Statements) along with notice of (AGM) via - email, you are requested to provide this letter duly filled and signed to us or our Share Registrar at their below address:
E – MAIL ADDRESS: ___________________________________________
CNIC NUMBER: _______________________________________________
FOLIO / CDS ACCOUNT # ______________________________________
____________________________
SIGNATURE OF SHAREHOLDER
Share Registrar:CDC Share Registrar Services Limited CDC House, 99- B, Block - B, S.M.C.H.S.,Main Shahrah-e-Faisal,Karachi.Customer Support Service: +92-0800-23275Fax: +92-21-34326053Email: [email protected]: www.cdcsrsl.com
Yours sincerely,For INTERNATIONAL INDUSTRIES LTD.,
Sunaib BarkatCompany Secretary
through e-mails


E-DIVIDEND Mandate Form
To: Date: ____________
Subject: Bank account details for payment of Dividend through electronic mode
Dear Sir,
I/We/Messrs. ____________________________________________________________________________, being a/the shareholder(s) of International Industries Limited [the “Company”], hereby, authorize the Company, to directly credit cash dividends declared by it, in my bank account as detailed below:
(i) Shareholder’s details:
Name of the Shareholder
CDC Participant ID & Sub-Account No. /CDC IAS
CNIC/NICOP/Passport/NTN No. (please attach copy)
Contact Number (Landline & Cell Nos.)
Shareholder’s Address
(ii) Shareholder’s Bank account details:
Title of Bank Account
IBAN (See Note 1 below)
Bank’s Name
Branch Name & Code No.
Branch Address
It is stated that the above particulars given by me are correct and I shall keep the Company, informed in case of any changes in the said particulars in future.
Yours sincerely
___________________Signature of Shareholder(Please affix company stamp in case of corporate entity)
Notes:
1. Please provide complete IBAN, after checking with your concerned branch to enable electronic credit directly into your bank account.
2. This letter must be sent to shareholder’s participant/CDC Investor Account Services which maintains his/her CDC account for incorporation of bank account details for direct credit of cash dividend declared by the Company from time to time.

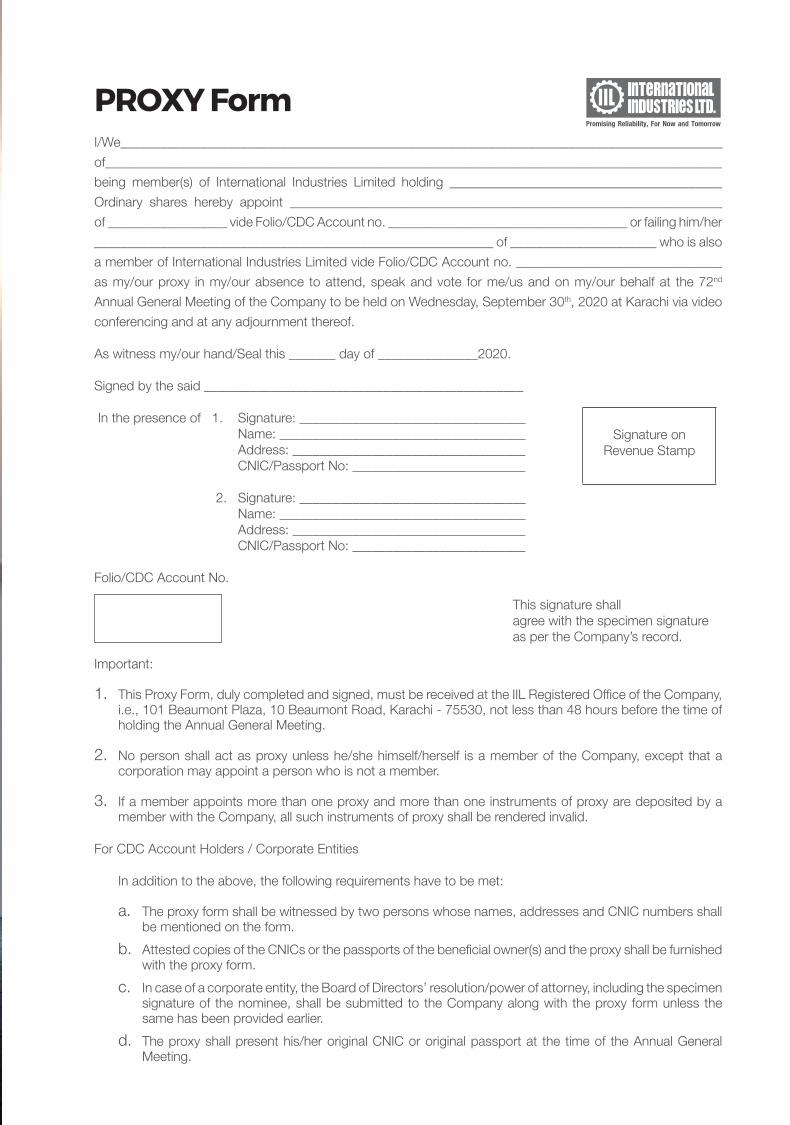
PROXY FormI/We__________________________________________________________________________________________
of____________________________________________________________________________________________
being member(s) of International Industries Limited holding _________________________________________
Ordinary shares hereby appoint _________________________________________________________________
of __________________ vide Folio/CDC Account no. ____________________________________ or failing him/her
____________________________________________________________ of ______________________ who is also
a member of International Industries Limited vide Folio/CDC Account no. _______________________________
as my/our proxy in my/our absence to attend, speak and vote for me/us and on my/our behalf at the 72nd
Annual General Meeting of the Company to be held on Wednesday, September 30th, 2020 at Karachi via video
conferencing and at any adjournment thereof.
As witness my/our hand/Seal this _______ day of _______________2020.
Signed by the said ________________________________________________
In the presence of 1. Signature: __________________________________ Name: _____________________________________ Address: ___________________________________ CNIC/Passport No: __________________________
2. Signature: __________________________________
Name: _____________________________________ Address: ___________________________________ CNIC/Passport No: __________________________
Folio/CDC Account No.
This signature shall agree with the specimen signatureas per the Company’s record.
Important:
1. This Proxy Form, duly completed and signed, must be received at the IIL Registered Office of the Company, i.e., 101 Beaumont Plaza, 10 Beaumont Road, Karachi - 75530, not less than 48 hours before the time of holding the Annual General Meeting.
2. No person shall act as proxy unless he/she himself/herself is a member of the Company, except that a corporation may appoint a person who is not a member.
3. If a member appoints more than one proxy and more than one instruments of proxy are deposited by a member with the Company, all such instruments of proxy shall be rendered invalid.
For CDC Account Holders / Corporate Entities
In addition to the above, the following requirements have to be met:
a. The proxy form shall be witnessed by two persons whose names, addresses and CNIC numbers shall be mentioned on the form.
b. Attested copies of the CNICs or the passports of the beneficial owner(s) and the proxy shall be furnished with the proxy form.
c. In case of a corporate entity, the Board of Directors’ resolution/power of attorney, including the specimen signature of the nominee, shall be submitted to the Company along with the proxy form unless the same has been provided earlier.
d. The proxy shall present his/her original CNIC or original passport at the time of the Annual General Meeting.
Signature onRevenue Stamp


CORPORATEWEBSITE
ANNUALREPORT
GROUPSUSTAINABILITY
REPORT
SALES INQUIRIESDomestic Clients: [email protected]
International Clients: [email protected]
IIL AUSTRALIA PTY LIMITEDRegistered Office
103, Abbot Road,Hallam, Victoria 3803,
AustraliaTel: +61 (03) 9796 5617
IIL AMERICAS INC.Registered Office
36, Gerigs Street,Scarborough, Toronto, ON M1L 0B9,
CanadaTel: +1 289 201 9341
LAHORE OFFICEChinoy House,6-Bank Square,
Lahore - 54000, PakistanUAN: (92 42) 111 019 019
HEAD OFFICE101 Beaumont Plaza,10 Beaumont Road,
Karachi - 75530, PakistanUAN: (92 21) 111 019 019
ISLAMABAD OFFICEOffice No. 303-A, 3rd Floor, Evacuee
Trust Complex, Sir Agha Khan Road, Sector F-5/1, Islambad
PakistanTel: (92 51) 282 3041-2
FACTORY 1LX 15-16,
Landhi Industrial Area,Karachi - 75120
PakistanTel: (92 21) 3508 0451-55
FACTORY 2Survey # 405-406,Rehri Road, Landhi,
Karachi - 75160Pakistan
Tel: (92 21) 3501 7027-28
FACTORY 322 KM,
Sheikhupura Road,Lahore,Pakistan
Tel: (92 21) 3501 7027-28
FAISALABAD OFFICEOffice No. 1/1 Wahab
Centre, Electrocity Plaza,Susan Road, Faisalabad
PakistanTel: (92 41) 872 0037
MULTAN OFFICE1592, 2nd Floor
Quaid-e-Azam ShoppingCentre No. 1 Multan Cantt. Multan
PakistanTel: (92 61) 458 3332
PESHAWAR OFFICEOffice No. 1 & 2, First Floor,
Hurmaz Plaza Opp. Airport RunwayMain University Road, Peshawar
PakistanTel: (92 91) 584 5068