A Wild Solution for Climate Change Blue Planet Prize ...
84
A Wild Solution for Climate Change Blue Planet Prize Commemorative Lecture Tokyo November 1, 2012 Thomas E. Lovejoy Thomas E. Lovejoy University Professor Environmental Science and Policy George Mason University Biodiversity Chair, The Heinz Center THE H. JOHN HEINZ III CENTER THE H. JOHN HEINZ III CENTER FOR FOR SCIENCE, ECONOMICS AND THE ENVIRONMENT SCIENCE, ECONOMICS AND THE ENVIRONMENT
-
Upload
khangminh22 -
Category
Documents
-
view
1 -
download
0
Transcript of A Wild Solution for Climate Change Blue Planet Prize ...

A Wild Solution for Climate Change
Blue Planet Prize Commemorative Lecture
TokyoNovember 1, 2012
Thomas E. Lovejoy Thomas E. Lovejoy University Professor
Environmental Science and PolicyGeorge Mason University
Biodiversity Chair, The Heinz Center
THE H. JOHN HEINZ III CENTER THE H. JOHN HEINZ III CENTER FOR FOR SCIENCE, ECONOMICS AND THE ENVIRONMENTSCIENCE, ECONOMICS AND THE ENVIRONMENT


Planetary Boundaries
Source: Rockström, J. et al. 2009

Dr. Svante August Arrhenius1859-1927

Source: Wallace Broecker
Analysis of a Greenlandice core oxygen isotope proxy

Years before presentYears before present
COCO
22-- con
cent
ratio
n (p
pm)
conc
entr
atio
n (p
pm)
175017501750175017501750
200200
240240
280280
320320
360360
160160
400400
00100'000100'000200'000200'000300'000300'000400'000400'000500'000500'000600'000600'000
Siegenthaler U Siegenthaler U et al.et al. (2005) Science 310:1313(2005) Science 310:1313Petit JR Petit JR et al.et al. (1999) Nature 399:429(1999) Nature 399:429
20072007Currently 385 ppmCurrently 385 ppm
�� Ch KCh Köörnerrner
CO2 for the Last 600,000 Years

Source: Hadley Centre and Climatic Research Unit, School of Environmental Sciences, UEA
Global temperature record
tem
pera
ture
ano
mal
y (d
egC
)

1990 1995 2000 2005 2010
CO
2 Em
issi
ons
(GtC
y-1)
5
6
7
8
9
10Actual emissions: CDIACActual emissions: EIA450ppm stabilisation650ppm stabilisationA1FI A1BA1T A2B1B2
SRES (2000) aver. growth rates in % y -1for 2000-2010:
A1B: 2.42 A1FI: 2.71A1T: 1.63A2: 2.13B1: 1.79B2: 1.61
Observed2000-20073.5%
20062005
2007
Fossil Fuel Emissions: Actual vs. IPCC Scenarios
Global Carbon Project; Raupach et al 2007, PNAS (updated)
(Avgs.)

Signals from nature
THE H. JOHN HEINZ III CENTER FOR
SCIENCE, ECONOMICS AND THE ENVIRONMENT
Lara Hansen / WWF
Jeremy Little / University of Washington


Source: IPCC 2001, modified from Magnuson et al. 2000
Warming trend in 37 of 39Northern Hemisphere lakes and rivers
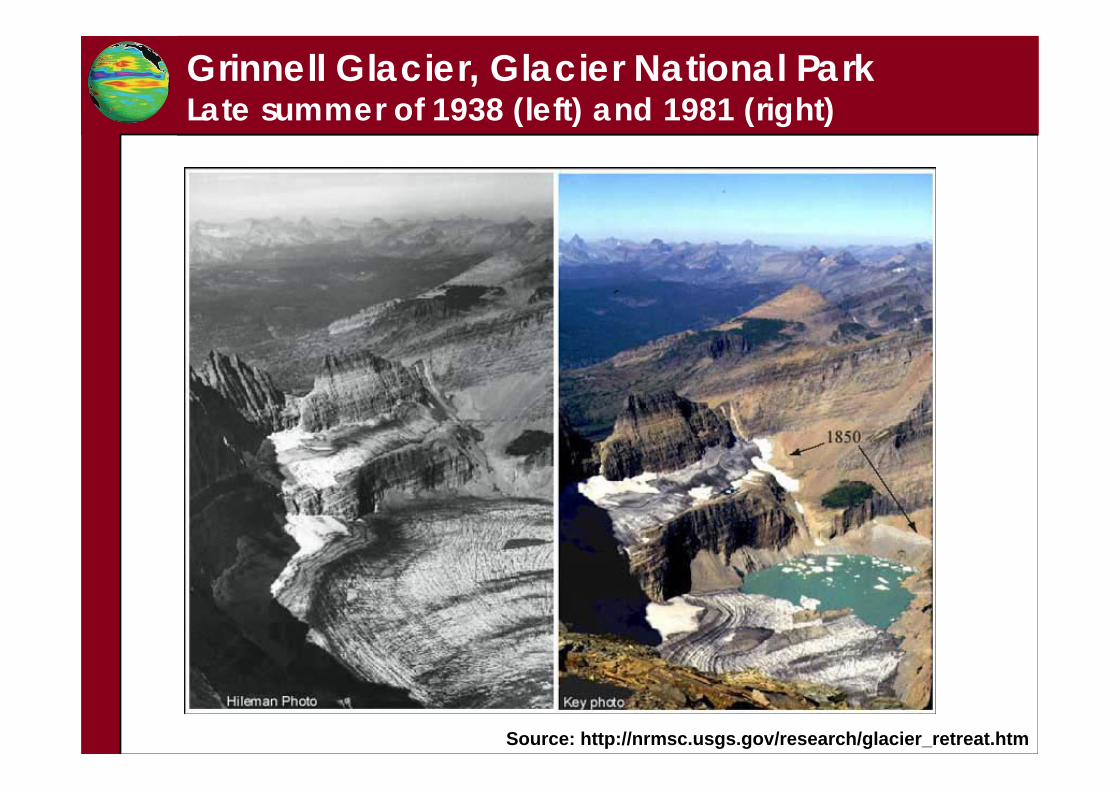
Source: http://nrmsc.usgs.gov/research/glacier_retreat.htm
Grinnell Glacier, Glacier National ParkLate summer of 1938 (left) and 1981 (right)

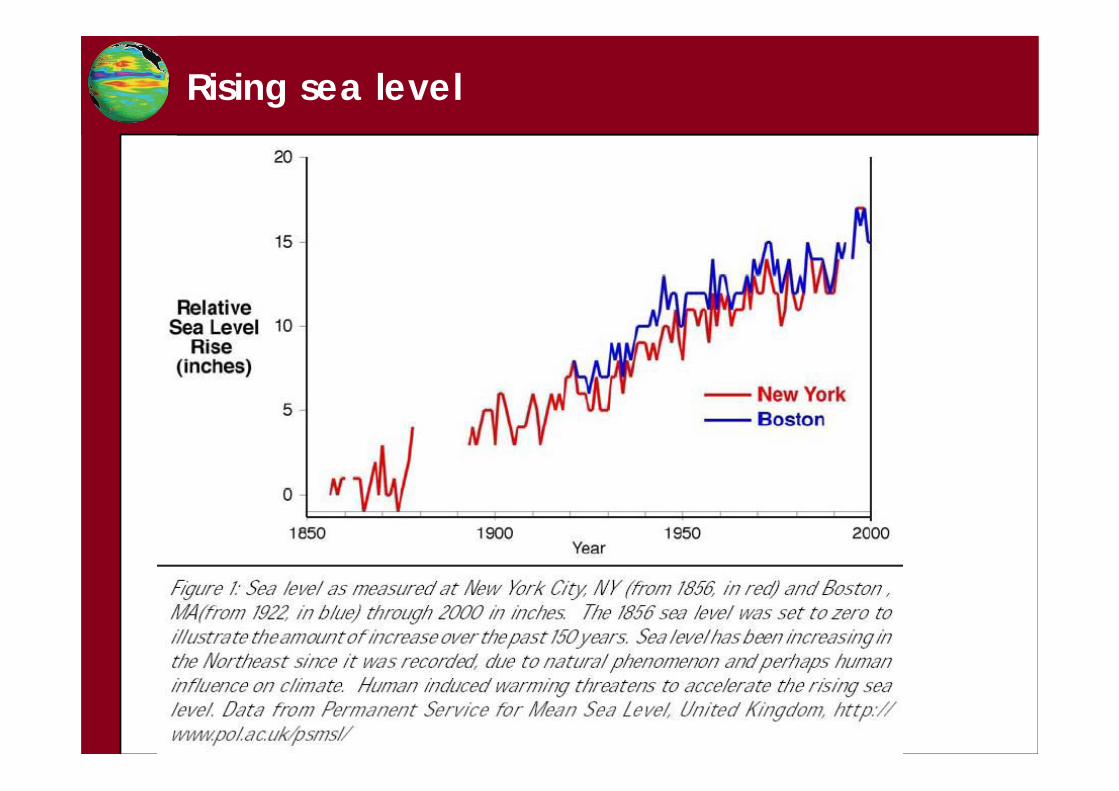
Rising sea level

Sea Level Rise in the Chesapeake BaySea Level Rise in the Chesapeake Bay
BlackwaterNational Refuge,
Maryland
Photo Courtesy of NOAA

Source: CSRIO 2001 (www.dar.csiro.au/publications/projections2001.pdf).
Probable Increased Frequency of More Intense Tropical Cyclones

Source: Westerling et al. 2006. Science 313: 940-943.
Wildfire increase in Western U.S.
Warmer summers and earlier snow meltsincreased opportunities for wildfire in the western U.S. beginning in the mid-1980s

Earlier flowering date

Kew Magazine, Summer 2007
Climate Change at the Royal Botanic Gardens, Kew

Source: Camille Parmesan
Spring comes about 2 weeks earlier
• Across the USA, tree swallows are nesting 9 days earlier than 40 years ago
• Laying date is highly correlated with May temperature

Edith’s Checkerspot
• Range shift northward and upward during the 20th century
• Most extinctions in south and low elevations


Source: National Arbor Day Foundation
Hardiness zones adjusted to warmer climateHardiness zones adjusted to warmer climate

Replacement of marine copepod planktoncommunities in NE Atlantic
Source: Beaugrand et al. Science 2002

EelgrassEelgrass

Chesapeake BayChesapeake Bay
•Largest estuary in the United States
•In 2006 Underwater grasses decreased by 25% Baywide
•Decrease from 78,263 acres in 2005 to 59,090 acres in 2006

© WWF-Canon / Michèle Dépraz

Increasing number of dry days
Source: J.A. Pounds et al 2005

Decoupling
Snowshoe Hare (Lepus Americanus)
Photos: University of Michigan
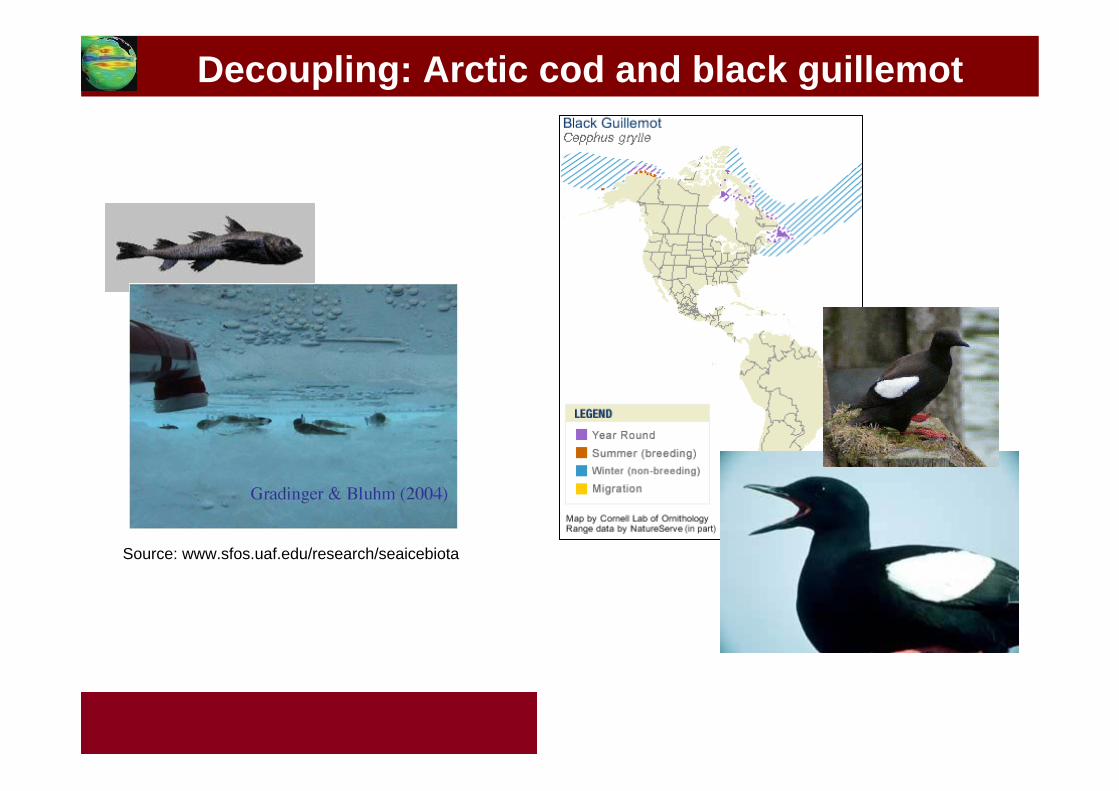
Source: www.sfos.uaf.edu/research/seaicebiota
Decoupling: Arctic cod and black guillemot

Biological Response
Phenological changes attributed to recent
climate change
McCarty (2001)
White et al. (2004)
Nat
iona
l Ec
olog
ical O
bser
vato
ry N
etwo
rk (NEO
N)
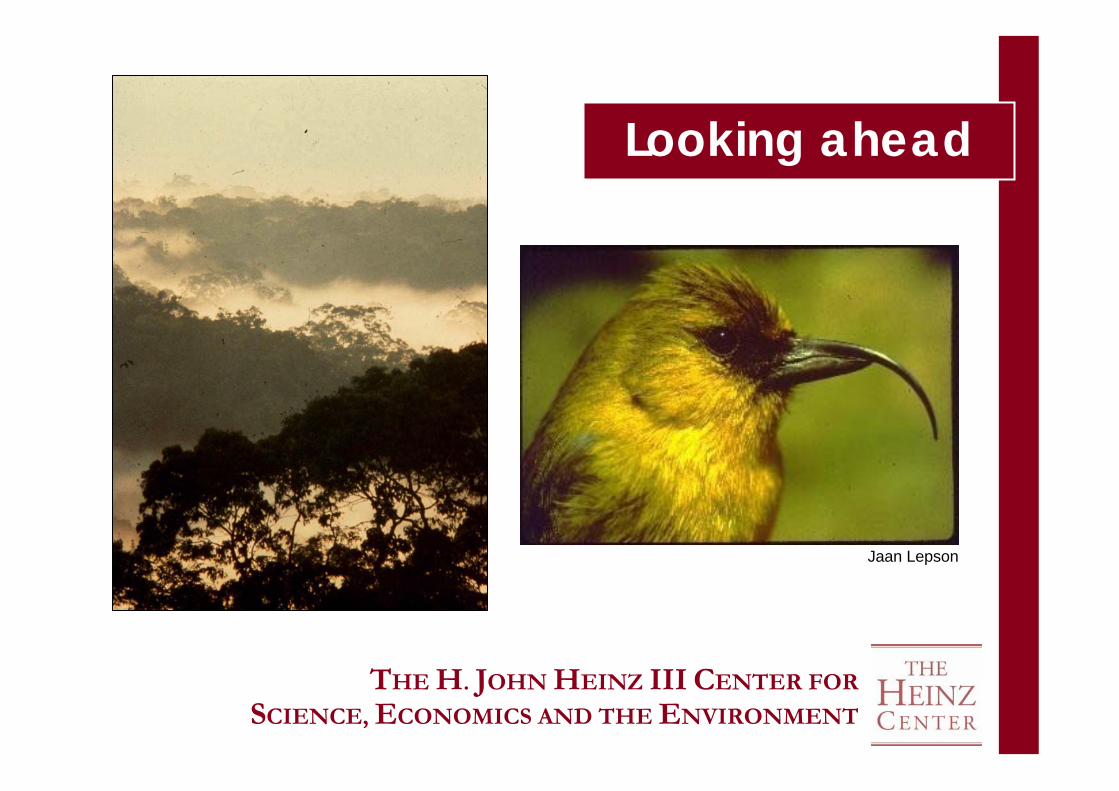
Looking ahead
THE H. JOHN HEINZ III CENTER FOR
SCIENCE, ECONOMICS AND THE ENVIRONMENT
Jaan Lepson

Sugar Maple range projectionsby 5 GCMs with 2 x CO2
Source: A.M. Prasad and Iverson, L.R: www.fs.fed.us/ne/delaware/atlas/index.html
Maple_GCMs

2050
2090
2000
Climate change impacts on
European beech
Niche-based modelBIOMOD
W. Thuiller
Mechanistic tree growth model
CASTANEAA Cheaib,
C François, E Dufrêne
2000 2050
2090
Dler
Shifts in species distributions are likely to be large

Climate Change includesprecipitation change
Precipitation
Projectedchangesfor 2090
Temperature

Lake Chad Basin
Lake Chad is 1/20th
the size it was 35 years ago

Loss of stream segments able tosupport cold-water trout
Source: Poff et al. 2002, based on Keheler and Rahel 1996
Present +3�C

American pika (Ochotona princeps)
photo: J. MacKENZIE / www.pikaworks.com

Temperature Increase
876543210
Num
ber o
f Pre
dict
ed E
xtin
ctio
ns
70
60
50
40
30
20
10
0
S-curve fit: adj. r2 = 0.997 p = 0.001
18356465N =
Temperature Scenario
+7.0+5.0+3.5+1.0Current
Cor
e H
abita
t Rem
aini
ng (%
)
110
100
90
80
70
60
50
40
30
20
10
00
Spatial Pattern of Species RichnessDark red = high species richness
Species Extinctions
Mean Range Size
Williams et al. 2003. Proc Roy Soc Lond. B: 270:1887-1892
Slide courtesy of Stephen Williams

Sea Level Rise in the Next 100 Years
Galveston
Manyimportant
places on the Texas Coast
will disappear
Whooping Crane habitat
Source: Camille Parmesan

Key Deer
Population Low:
27 in 1957
Population today:
Between 700 and 800
Photo courtesy of National Key Deer Refuge
National Key Deer RefugeBig Pine Key, Florida
•84,000 acres, Established 1957

Source: World Wildlife Fund
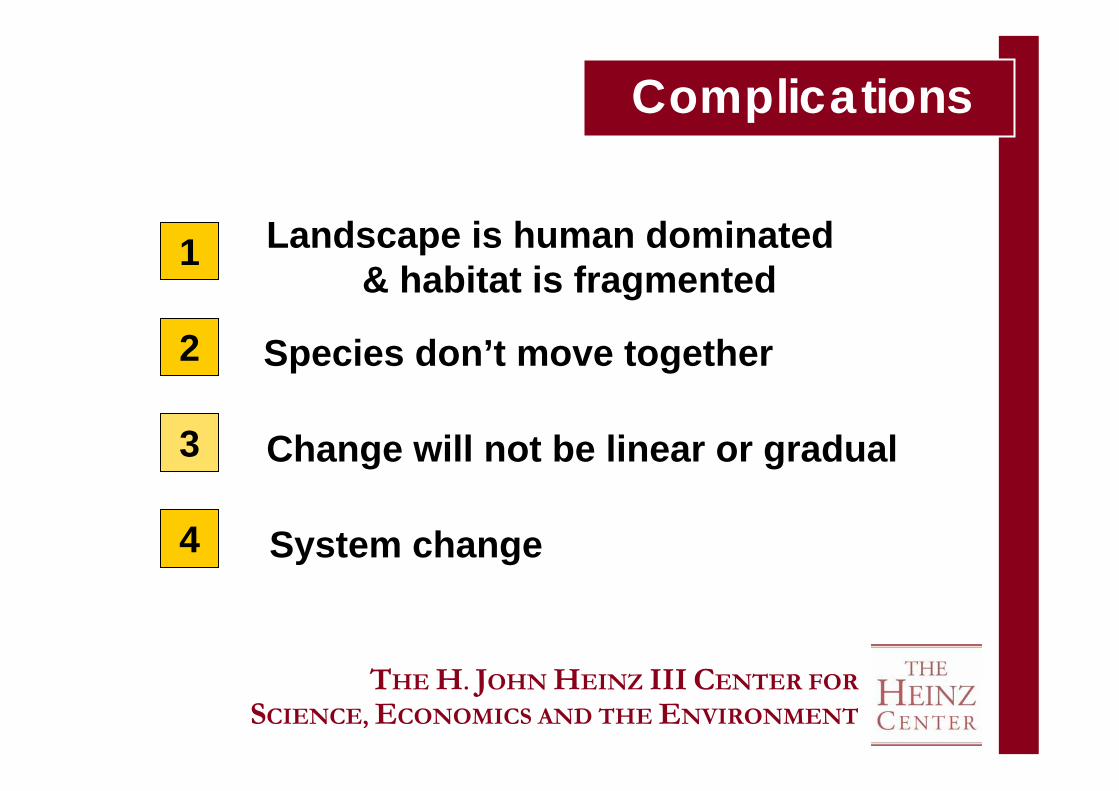
Complications
THE H. JOHN HEINZ III CENTER FOR
SCIENCE, ECONOMICS AND THE ENVIRONMENT
Landscape is human dominated& habitat is fragmented
Species don’t move together
Change will not be linear or gradual
System change
3
4
1
2


Complications
THE H. JOHN HEINZ III CENTER FOR
SCIENCE, ECONOMICS AND THE ENVIRONMENT
Landscape is human dominated& habitat is fragmented
Species don’t move together
Change will not be linear or gradual
System change
3
4
1
2

Ecosystems disassemble and speciesreassemble into new ecosystems
Source: G.M. Hewitt and Nichols, R.A. 2005

Complications
THE H. JOHN HEINZ III CENTER FOR
SCIENCE, ECONOMICS AND THE ENVIRONMENT
Landscape is human dominated& habitat is fragmented
Species don’t move together
Change will not be linear or gradual
System change
3
4
1
2

Source: E. Maier-Reimer

Elevated night time temperaturesElevated night time temperaturesmagnify bark beetle impactmagnify bark beetle impact
Source: D. Struck 3/1/2006, Washington Post, pA1
‘Rapid Warming’ SpreadsHavoc in Canada’s ForestsWednesday, March 1, 2006Wednesday, March 1, 2006
QUESNEL, B.C. -- Millions of acres of Canada's lush green forests are turning red in spasms of death. A voracious beetle, whose population has exploded with the warming climate, is killing more trees than wildfires or logging.

Mountain Pine Beetle outbreaks (1959- 2002)
Courtesy of Mike Bradley, Canfor Corporation

© WWF-Cannon / Jurgen Freund

Complications
THE H. JOHN HEINZ III CENTER FOR
SCIENCE, ECONOMICS AND THE ENVIRONMENT
Landscape is human dominated& habitat is fragmented
Species don’t move together
Change will not be linear or gradual
System change
3
4
1
2

Courtesy of NOAA/NCAR

2010 2005
Amazon Rainfall in 2010 and 2005(deviation from 10-year mean)
S. Lewis, P. Brando, D. Nepstad, submitted


Critical thresholds in the Earth system
Where local or regional changes may have strong effects on earth system interactions, feedbacks, or teleconnections
?

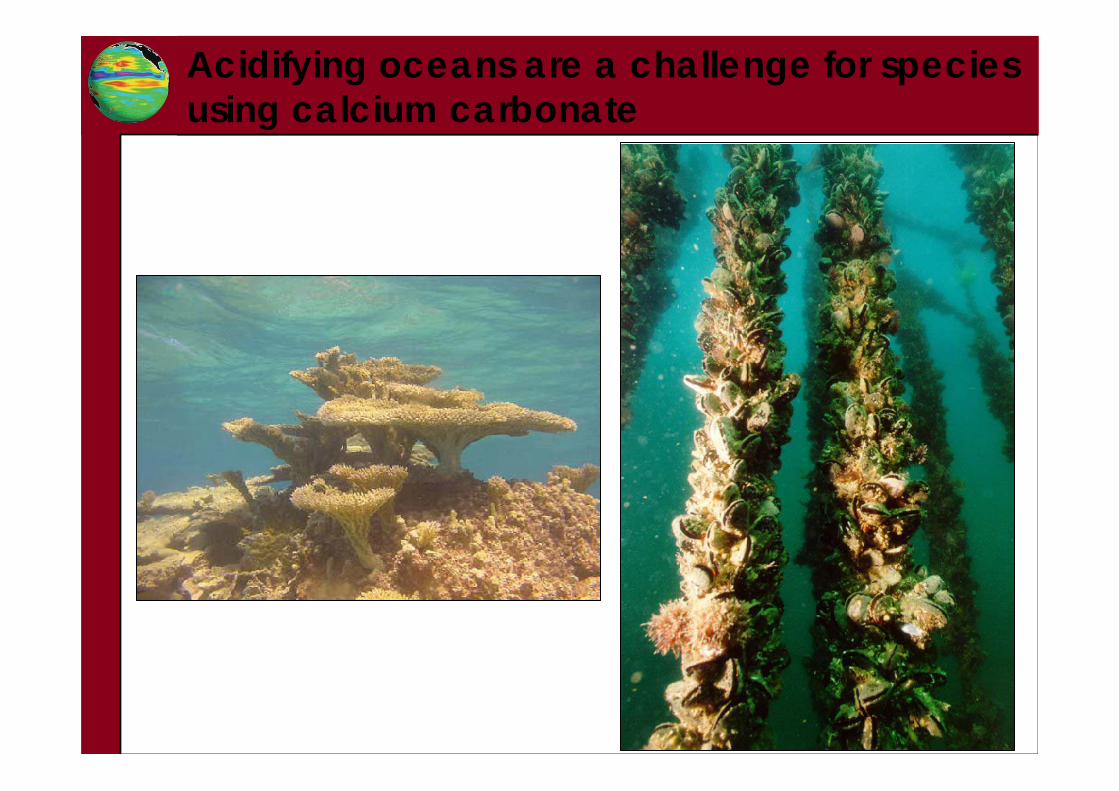
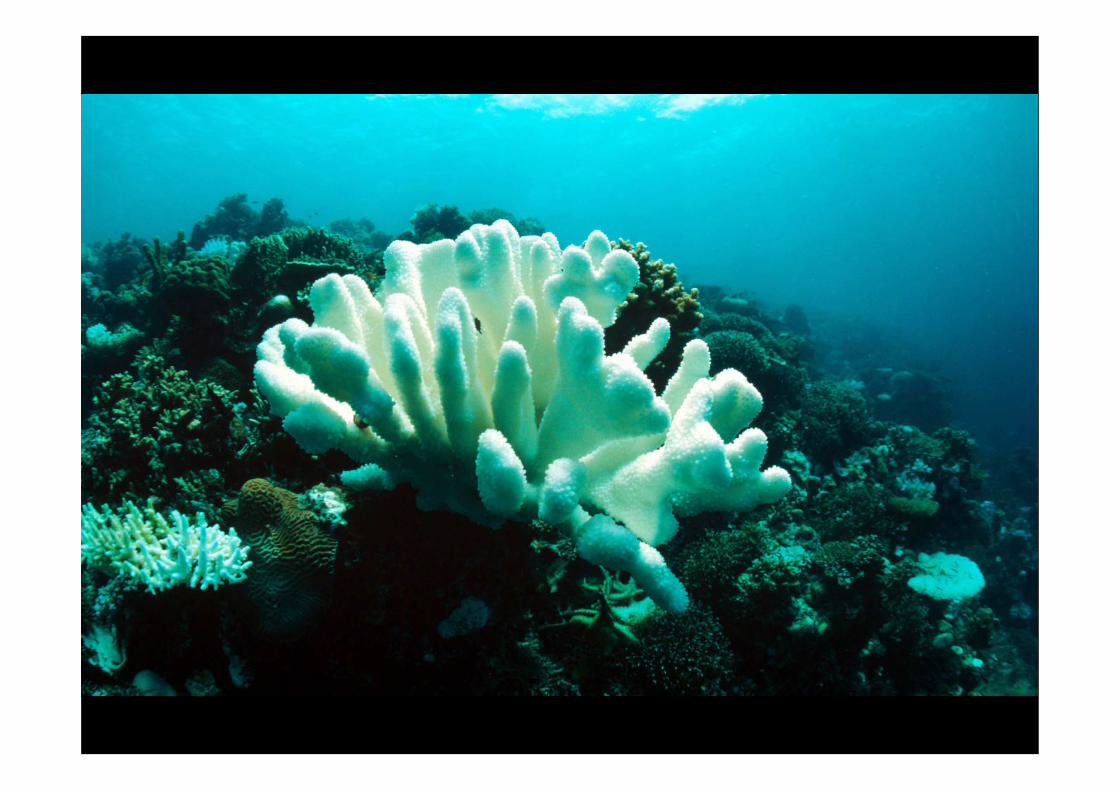
Acidifying oceans are a challenge for speciesusing calcium carbonate

Acidifying oceans are a challenge for species Acidifying oceans are a challenge for species at the base of the marine food chainat the base of the marine food chain
[Source: www.ipsl.jussieu.fr/~jomce/acidification]

a pteropod, or sea butterfly, is a typeof planktonic mollusk

Deteriorating chemical condition for coral reefs
0 1 2 3 4
�aragoniteOptimal for
coral reefsCorrosive to coral reefs
5
In the pre-industrial ocean, 99.8% of coral reefs were near water with �aragonite > 3.25
Under a 550 ppm atmosphere, < 2% of coral reefs will be near water with �aragonite > 3.25

(1) Arctic sea-ice
(2) Greenland ice-sheet stability
(3) Antarctic ice-sheet stability
(4) Major ecosystem disruption
Why is a CO2 target of 450ppm too high ? Two degrees is too much
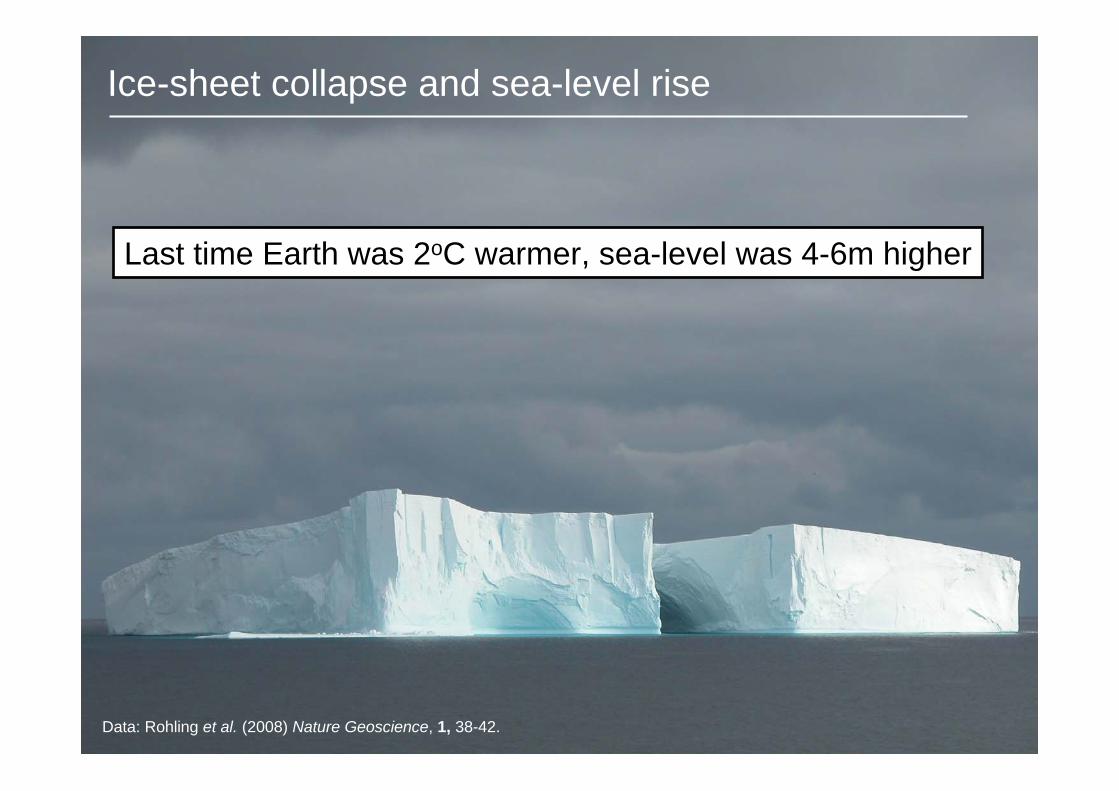
Ice-sheet collapse and sea-level rise
Last time Earth was 2oC warmer, sea-level was 4-6m higher
Data: Rohling et al. (2008) Nature Geoscience, 1, 38-42.

•At today’s level of 387ppm CO2, reefs are seriously declining and time-lagged effects will result in their continued demise with parallel impacts on other marine and coastal ecosystems.
•Proposals to limit CO2 levels to 450ppm will not prevent the catastrophic loss of coral reefs from the combined effects of climate change and ocean acidification.
•To ensure the long-term viability of coral reefs atmospheric carbon dioxide level must be reduced significantly below 350ppm.
Royal Society Meeting, July 6th 2009
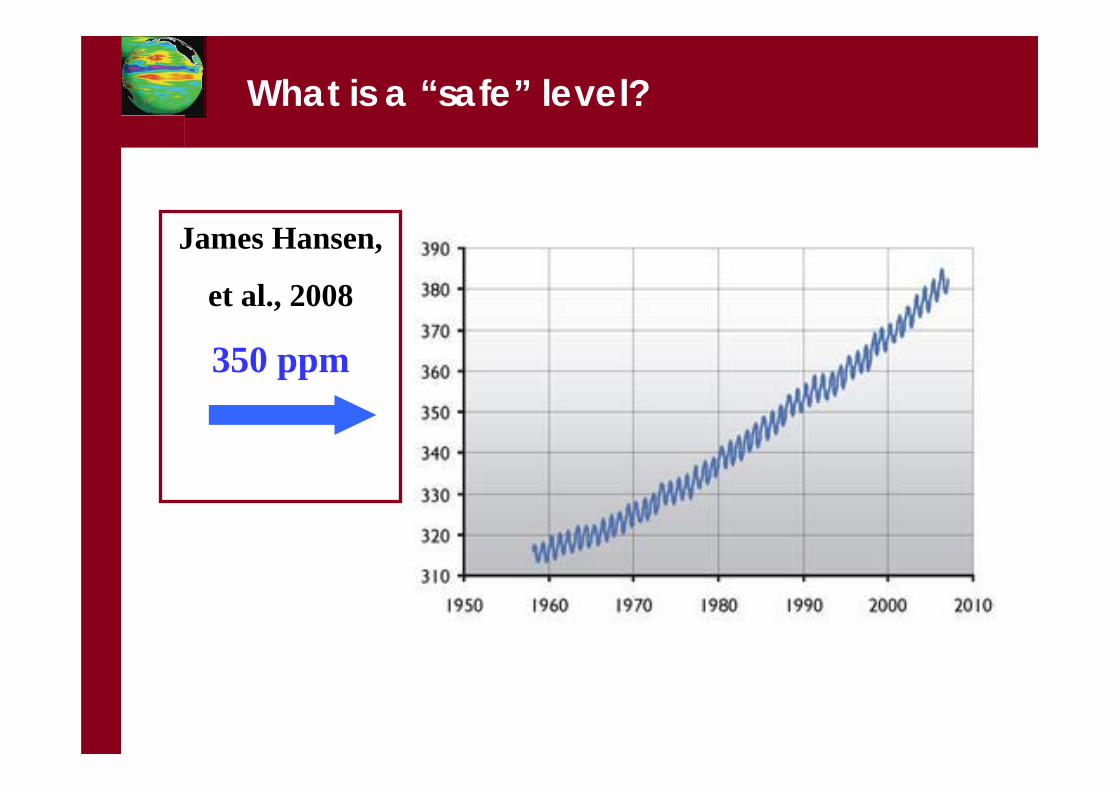
What is a “safe” level?
James Hansen,
et al., 2008
350 ppm

Projected temperature rise for A1B & A1F1 scenarios (Hadley, 2009)

What canWhat canbe donebe done
Adaptation
-Revise Conservation Strategies
Limit Greenhouse Gas Concentrations
-Reduce and eliminate emissions
--revise energy base for society
--reduce/eliminate deforestation

Increase natural connectivity to facilitate species movement
Adaptation: Revise conservation strategiesAdaptation: Revise conservation strategies
Minimize climate change impacts by reducing other stresses, e.g.,
siltation on coral reefs

Limit Greenhouse Gas Concentrations
Revise Energy Base for Society
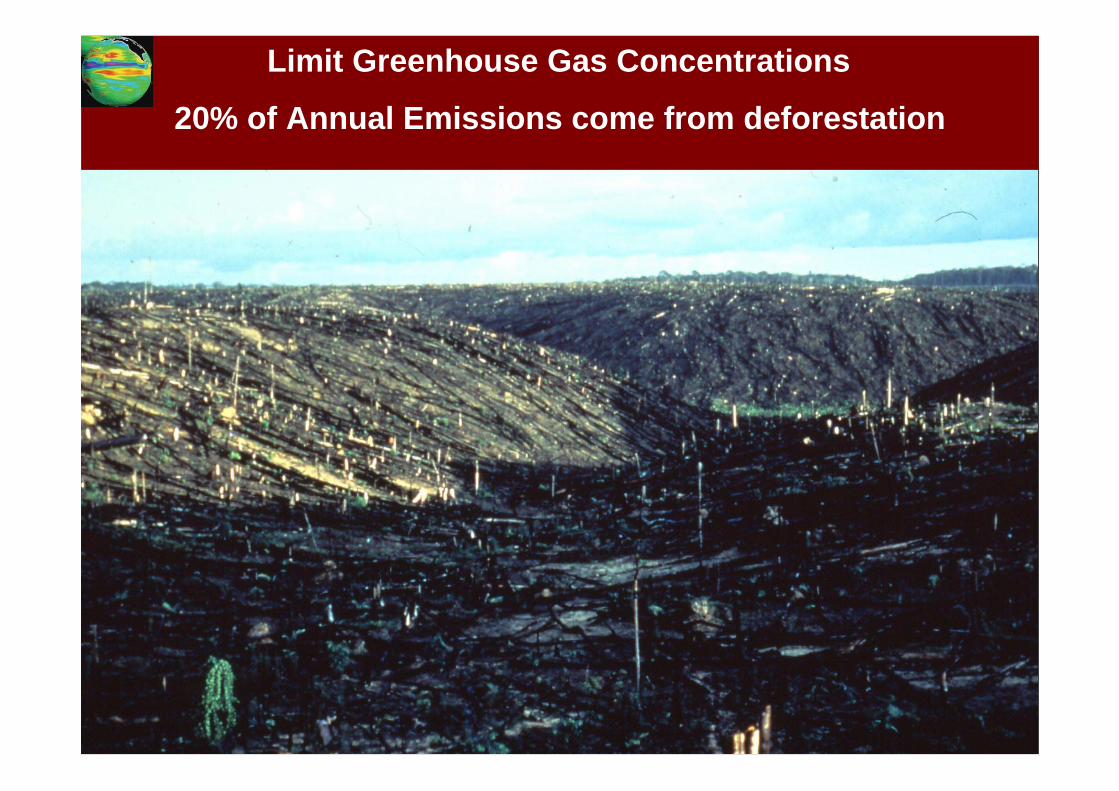
Limit Greenhouse Gas Concentrations
20% of Annual Emissions come from deforestation

Fate of Anthropogenic CO2 Emissions (2000-2007)
Canadell et al. 2007, PNAS (updated)
1.5 Pg C y-1
+7.5 Pg C y-1
Atmosphere46%
4.2 Pg y-1
Land29%
2.6 Pg y-1
Oceans26%
2.3 Pg y-1

Long atmospheric residence times
for greenhouse gases

What canWhat canbe donebe done
Lower Atmospheric CO 2
- Restore ecosystems
(biodiversity and carbon)
- Non-biological CO 2 removal

Origin of land plants
Expansion of angiosperms
Present-day CO2
The Role of Life Processes

Over the past three centuries, ecosystems have lost 200-250 billion tons of carbon

Planetary Engineering Using Ecosystems
CO2 PPM
Time
280

The Role of Forests

Photo courtesy USDA NRCS
Restoring Grazing Land

Photos: United States Department of Agriculture—Natural Resources Conservation Service.
Modify Agriculture to Build up Soil Carbon


Re-Greening the Emerald Planet

THE H. JOHN HEINZ III CENTER FOR
SCIENCE, ECONOMICS AND THE ENVIRONMENT
y