Polymer/inorganic nanocomposites using hyperbranched ...
277
Polymer/inorganic nanocomposites using hyperbranched polyalkoxysiloxanes Von der Fakultät für Mathematik, Informatik und Naturwissenschaften der RWTH Aachen University zur Erlangung des akademischen Grades eines Doktors der Naturwissenschaften genehmigte Dissertation vorgelegt von Master of Science Qizheng Dou aus Henan, P.R.China Berichter: Universitätsprofessor Dr. rer. Nat. Martin Möller Universitätsprofessor Dr. rer. Nat. Ulrich Simon Tag der mündlichen Prüfung: 14. Februar 2014 Diese Dissertation ist auf den Internetseiten der Hochschulbibliothek online verfügbar.
-
Upload
khangminh22 -
Category
Documents
-
view
0 -
download
0
Transcript of Polymer/inorganic nanocomposites using hyperbranched ...
Polymer/inorganic nanocomposites using
hyperbranched polyalkoxysiloxanes
Von der Fakultät für Mathematik, Informatik und Naturwissenschaften der RWTH Aachen
University zur Erlangung des akademischen Grades eines Doktors der Naturwissenschaften
genehmigte Dissertation
vorgelegt von
Master of Science
Qizheng Dou
aus Henan, P.R.China
Berichter: Universitätsprofessor Dr. rer. Nat. Martin Möller
Universitätsprofessor Dr. rer. Nat. Ulrich Simon
Tag der mündlichen Prüfung: 14. Februar 2014
Diese Dissertation ist auf den Internetseiten der Hochschulbibliothek online verfügbar.

To my family
I
Table of Contents
List of abbreviations and symbols ........................................................................................ V
Summary ............................................................................................................................ IX
Zusammenfassung............................................................................................................ XIII
1. Introduction ...................................................................................................................... 1
1.1. Preparation of PEOS and modified PEOS .................................................................. 1
1.2. Preparation of PP-Silica hybrids by reactive extrusion of PEOS ................................ 2
1.3. Preparation of PP-BENT-Silica hybrids ..................................................................... 3
1.4. Application of NH2-PEOS in PU foams ..................................................................... 3
1.5. Preparation of PAOT .................................................................................................. 4
2. Literature review ............................................................................................................... 5
2.1. Nanocomposites ......................................................................................................... 5
2.2. Precursors for silica .................................................................................................... 7
2.3. iPP/Silica hybrids ..................................................................................................... 10
2.4. iPP/layered silicate ................................................................................................... 12
2.5. Flame retardant materials ......................................................................................... 16
2.5.1. Mechanism of polymer combustion ................................................................... 16
2.5.2. Mechanism of flame retardants .......................................................................... 18
2.6. Titanium dioxide ...................................................................................................... 24
2.6.1. Application of titanium dioxide.......................................................................... 25
2.6.2. Preparation of titanium dioxide .......................................................................... 27
3. PEOS and modified PEOS preparation ........................................................................... 37
3.1. PEOS ........................................................................................................................ 38
3.1.1. Experimental ...................................................................................................... 38
3.1.2. Results and discussion ........................................................................................ 39

II
3.2. iso-Butyl modified PEOS ......................................................................................... 44
3.2.1. Experimental ...................................................................................................... 45
3.2.2. Results and discussion ........................................................................................ 46
3.3. n-Octyl modified PEOS ............................................................................................ 48
3.3.1. Experimental ...................................................................................................... 49
3.3.2. Results and discussion ........................................................................................ 50
3.4. NH2-PEOS (together with other amino modified silica precursors) .......................... 55
3.4.1. Experimental ...................................................................................................... 57
3.4.2. Results and discussion ........................................................................................ 60
3.5. n-Octyl and NH2 modified PEOS ............................................................................. 70
3.6. Conclusion ................................................................................................................ 72
4. Preparation and morphology study of iPP / silica composites via unmodified PEOS ..... 75
4.1. Introduction .............................................................................................................. 75
4.2. Experimental ............................................................................................................ 78
4.3. Results and discussion .............................................................................................. 90
4.4. Conclusion .............................................................................................................. 116
5. Preparation and characterization of iPP / modified silica composites via modified PEOS
................................................................................................................................... 123
5.1. Preparation of iPP / iBSilica via iBPEOS ............................................................... 123
5.1.1. Experimental .................................................................................................... 123
5.1.2. Results and discussion ...................................................................................... 125
5.1.3. Preliminary conclusion ..................................................................................... 128
5.2. Preparation of iPP / OSilica via OPEOS ................................................................. 128
5.2.1. Experimental .................................................................................................... 129
5.2.2. Results and discussion ..................................................................................... 132
5.2.3. Preliminary conclusion ..................................................................................... 148
5.3. Preparation of iPP / NH2-Silica via NH2-PEOS ...................................................... 148
5.3.1. Experimental .................................................................................................... 148
III
5.3.2. Results and discussion ...................................................................................... 149
5.3.3. Preliminary conclusion ..................................................................................... 153
5.4. Conclusion .............................................................................................................. 154
6. Application of PEOS as an assistant in the layer-exfoliation of layered silicate in iPP
matrix ........................................................................................................................ 157
6.1. Experimental .......................................................................................................... 159
6.2. Results and discussion ............................................................................................ 162
6.3. Conclusion .............................................................................................................. 172
7. Application of PEOS in the flexible polyurethane foams .............................................. 175
7.1. Project plan ............................................................................................................. 178
7.2. Generation 1.: Polyol with dissolved-in NH2-PEOS ............................................... 180
7.2.1. Stability test of polyol with dissolved-in NH2[25]-PEOS or silica precursor with
25% amino groups prepared from precondensed TEOS .................................... 181
7.2.2. Stability test of polyol with dissolved-in NH2[3]-PEOS or NH2[10]-PEOS ...... 184
7.3. Generation 2.: Isocyanate with dissolved-in NH2-PEOS ........................................ 187
7.4. Generation 3.: Polyol with build-in NH2-PEOS. Part 1: PIPA preparation ............. 190
7.4.1. PIPA prepared using polyol IP585 and NH2-PEOS ........................................... 190
7.4.2. PIPA prepared using CP4702 and NH2-PEOS .................................................. 194
7.5. Generation 3.: Polyol with build-in NH2-PEOS. Part 2: polyol with build-in
NH2[3~10]-PEOS via hydrolysis in CP4702 without TDI ..................................... 199
7.5.1. Preparation of polyol with build-in NH2[3~10]-PEOS via one-step hydrolysis
directly in CP4702 ............................................................................................. 200
7.5.2. Preparation of polyol with build-in unmodified PEOS via two-step hydrolysis in
CP4702 in acidic environment ........................................................................... 201
7.5.3. Preparation of polyol with build-in partially hydrolyzed NH2[3]-PEOS via two-
step condensation in CP4702 with water ............................................................ 204
7.5.4. Preparation of polyol with build-in NH2[3~10]-PEOS via two-step condensation
in CP4702 in acidic environment ....................................................................... 208
7.5.5. Conclusion of CP4702 with build-in PEOS or NH2[3~10]-PEOS ..................... 216

IV
7.6. Generation 3.: Polyol with build-in NH2-PEOS. Part 3: polyol with build-in PAPTES
............................................................................................................................... 216
7.6.1. One-step preparation of CP4702-PAPTES (x=1) blends ................................... 217
7.6.2. One-step preparation of CP4702-PAPTES (x=1) blends with adding of water (1:1
with PAPTES in wt) to remove the ethoxy groups ............................................. 219
7.6.3. Preparation of CP4702-PAPTES (x=1) blends with a better connection ........... 222
7.6.4. Preparation of CP4702-PAPTES (x=1.4) blends ............................................... 226
7.6.5. Preparation of CP4702-SiON blends ................................................................. 228
7.7. Foam preparation ..................................................................................................... 230
7.8. Conclusion ............................................................................................................... 240
8. Preparation and application of poly(isopropoxyl titanium) as a TiO2 precursor with high
storage stability ......................................................................................................... 243
8.1. Experimental .......................................................................................................... 245
8.2. Results and discussion ............................................................................................ 247
8.3. Conclusion .............................................................................................................. 255
Acknowledgements .......................................................................................................... 258

V
List of abbreviation and symbols
Chemicals:
AAM anodic alumina membrane
AIBN N,N-azobis(isobutyronitrile)
APTES 3-aminopropyl triethoxysilane
BENT bentonite
DBTO dibutyltin oxide
EtO ethoxy groups
EP ethylene–propylene copolymer
EVA ethylene–vinyl acetate copolymer
HDPE high density polyethylene
iBTEOS isobutyltriethoxysilane
iBPEOS iso-butyl modified PEOS
10-iBPEOS 10% iso-butyl groups (relative to ethoxy groups) modified PEOS
iPP isotactic polypropylene
MAO methylaluminoxane
NH2-PEOS amino modified PEOS
NH2[10]-
PEOS
10% amino groups (relative to ethoxy groups) modified PEOS
NH2-OPEOS PEOS modified with both n-octyl and amino groups
NH2[10]-20-
OPEOS
10% amino groups and 20% n-octyl groups (relative to ethoxy groups)
modified PEOS
OPEOS n-octyl modified PEOS
10-OPEOS 10% n-octyl groups (relative to ethoxy groups) modified PEOS
OSilica n-octyl modified silica
OTEOS n-octyltriethoxysilane
PA6 polyimide from caprolactam
PA12 polyimide from lauric lactam
VI
PAOT polyalkoxytitanate
PAPTES pre-condensed APTES
PEOS hyperbranched polyethoxysiloxane
PIR polyisocyanurate
PMDI polymeric methylene diphenyl diisocyanate
PMMA Poly(methyl methacrylate)
POSS polyhedral oligomeric silsesquioxanes
PP-g-MA polypropylene copolymer with maleic anhydride groups
PP-OH polypropylene modified by hydroxyl groups
PS polystyrene
PU polyurethane
SC CO2 supercritical carbon dioxide
SiO2 silica
SOC silicon oxycarbide
TCPP tris(clorisopropyl)phosphate
TDI toluene diisocyanate
TEOS tetraethoxysilane
TEOT tetraethyl-orthotitanate
TFE thin-film evaporator
THF tetrahydrofuran
Ti(O-iPr)4 tetraisopropyl orthotitanate
TMS tetramethylsilane
TPOS tetrapropoxysilane
General:
VTEOS vinyl triethoxysilane
CVD chemical vapour deposition
DB degree of branching
DE degree of esterification
DMA dynamic mechanical analysis
DQ double-quantum
DSC differential scanning calorimetry
EDX energy-dispersive X-ray spectroscopy

VII
ELS evaporative light scattering
EU European Union
FR flame retardancy
GPC gel permeation chromatography
HPLC high-performance liquid chromatography
IDF Interface distribution functions
MD machine direction
NMR nuclear magnetic resonance
PMC polymer-matrix composites
RI the refractive index
SAXS small angle x-ray scattering
SEC size exclusion chromatography
SEM scanning electronic microscopy
TEM transmission electronic microscopy
TD transverse direction
TGA thermogravimetric analysis
UV ultraviolet
UV-VIS ultraviolet-visible light
WAXD wide angle x-ray diffraction = WAXS
WAXS wide angle x-ray scattering
XRD X-ray diffraction
Symbols:
°C degree Centigrade
cm centimeter
g/mol gram per mole
h hour
ΔHc heat of crystallization
ΔHm heat of fusion
ΔHf melting enthalpy of the composite which is given by the area under the
endotherm
K/min kelvin per minute
kV kilovolt

VIII
L liter
mbar millibar
mg milligram
mg KOH/g acid value: milligram potassium hydroxide that is required to neutralize one
gram of chemical substance
mg/mL milligram per milliliter
MHz megahertz
mL milliliter
mL/min milliliter per minute
mm/min millimeter per minute
Mn number average molecular weight
mol% mole percentage
mol/g mole per gram
mol/L mole per liter
Mw weight average molecular weight
Mw/Mn polydispersity index
N newton
nm nanometer
ppm part per million
s second
Tc crystallization temperature
Tm melting temperature
vol% volume percentage
wt % weight percentage
Xc crystalline fraction
Å angstrom
µL microliter
µs microsecond
F diameter
IX
Summary
The present dissertation mainly deals with the preparation, modification and application
of a premium precursor of silica ------hyperbranched Polyethoxysiloxane (PEOS), which was
firstly developed by us and have very good high temperature stability, good miscibility with
most of the solvents and possibility to be modified easily by end group exchange or exchange
of silicon by other elements. One of the modifications this work deals with is
Polyalkoxytitanate (PAOT), in which of all of the silicon atoms are completely exchanged by
titanium. .
The basic process for the synthesis of PEOS, and all of its modifications with n-octyl
groups or isobutyl groups, are one-pot catalytic condensation reaction of tetraethoxysilane
(TEOS) and acetic anhydride. The very low fraction of volatile compounds in the product
was removed completely by passing through a vacuum thin-film evaporator (TFE). Four
different end groups modified PEOS were introduced in this dissertation. Isobutyl modified
PEOS (iBPEOS) and n-octyl modified PEOS (OPEOS) were prepared via a similar route by
additional using isobutyltriethoxysilane or n-octyltriethoxysilane as co-monomers. By
varying the ratio between TEOS and the co-monomers, PEOS with isobutyl groups’ or n-
octyl groups’ content from 10% to 40% (relative to ethoxy groups) were prepared.
Amino groups modified PEOS (NH2-PEOS) and other amino modified silica
precursors with different amino contents (2~10% and >20%, relative to ethoxy groups) were
prepared via four different methods. A pre-study about the preparation of PEOS modified
by both amino groups and n-octyl groups were started, and an amphiphilic PEOS modified
by both 10% amino groups and 10% n-octyl groups was synthesized.
By means of in situ sol-gel technology iPP/silica composites were prepared on a 15
mL co-rotating twin-screw microcompounder via melt-blending off iPP and PEOS and the
SiO2 content of the composites can easily be controlled due to the non-volatility of PEOS.
By varying the PEOS fed content, the dimension of the resulting silica particles, which are
homogeneously distributed in the iPP matrix, varied from 100 nm to several micrometers.
IPP/silica composites showed improved thermal stability under nitrogen and higher degree
X
of crystallinity, but almost not affected mechanical properties as compared with pure iPP. A
combination of wide- and small-angle X-ray scattering and solid-state 1H NMR
spectroscopy was used to analyze the semicrystalline morphology. Both WAXS and SAXS
revealed a significant orientation of the iPP crystals in the core of the injection-molded parts
in the machine direction, meanwhile, the core of the pure iPP sample did not exhibit any
orientation. The β-crystals are formed mainly in the core zone of the composite samples
while the β-crystals were normally observed only in the surface layer of the previous
nucleated iPP samples. The increase of the polymer chain mobility in the amorphous region
in the presence of silica particles was proved by the proton spin-diffusion experiments.
iPP/modified silica composites were prepared via similar in situ sol-gel technology
using iPP with different modified PEOS. With the incorporation of iBPEOS, the dimension
of the resulting iBSilica particles in the composites slightly is reduced comparing with the
silica particles converted from non-modified PEOS containing the same silica content.
Proved by the TEM / FESEM results, the compatibility between PEOS and molten iPP
matrix was significantly improved by the modification of PEOS by n-octyl groups.
Benefited from the better compatibility, the resulting composites have a much better
transparency.
Precondensed 3-aminopropyl triethoxysilane (PAPTES) was also selected in the
application in iPP composites and the amino groups brought significant effect to the
increasing thermal stability of the iPP composites under air.
Pure PEOS was also used as an assistant to the exfoliation of layered silicate in iPP
matrix. The samples were prepared via melt blending on microcompounder. Proven by the
WAXS and TEM, PEOS can intercalate into bentonite and play a positive role in the
exfoliation of bentonite. At the same time in-situ generated silica particles play a role of
nucleation agent for -phase of iPP.
NH2-PEOS and other amino modified silica precursors were applied in the flexible
polyurethane (PU) foams preparation. Three different methods were conducted: Polyol with
dissolved-in NH2-PEOS or other amino modified silica precursors; isocyanate with
dissolved-in PEOS or NH2-PEOS; Polyol with build-in NH2-PEOS or other amino modified
silica precursors. When NH2-PEOS was dissolved in polyol, the transesterification between
ethoxy groups and hydroxyl groups under the catalysis of amino groups cannot be prevented
and it is quite difficult to detect the detailed structure of the mixture. For the second route of
isocyanate with dissolved-in PEOS, unmodified PEOS can hardly be dissolved in MDI /
XI
PMDI because of its low reactivity with isocyanate groups and the very different polarity.
With the amino groups modified PEOS, the reactivity of amino groups with isocyanate
increased while the miscibility of the final product in both MDI and PMDI also increased.
However, while the reactivity is too high, the reaction goes out of control and the final
product may end up totally cross-linked lumps. Concerning the complexity of the chemical
structures of these mixtures, moving to next method of Polyol with build-in NH2-PEOS or
other amino modified silica precursors would be needed to produce a series of product with
predictable structures.
NH2-PEOS and other amino modified silica precursors were firstly built-in in the
preparation of PolyIsocyanate PolyAddition (PIPA) polyol which is very commonly used in
PU foam industry nowadays. PEOS with 3~10% amino groups were applied in polyol for
both rigid PU foams (IP585) and flexible PU foams (CP4702) production with TDI as
crosslink agent. With IP585, the weight content of NH2-PEOS varied from 8 wt% to 12
wt% and the resulting PIPA particles which were not bigger than 5 μm in dimension were
prepared. With CP4702 as the base resin polyol for PIPA preparation, weight content of
NH2-PEOS varied from 4 wt% to 16 wt% and different final PIPA particles can be
achieved. However, to avoid the crosslinking, the maximum weight content of the NH2-
PEOS decreased with the increase of amino content in NH2-PEOS. On the other hand, big
PIPA particles would deposit after storage and phase-separation would be observed.
Since amino groups can catalyze the reaction between ethoxy groups from PEOS and
hydroxyl groups from polyol, NH2-PEOS themselves may act as the crosslinking agent with
pure polyol as base resin. To avoid cross-linking of NH2-PEOS with isocyanate and to make
the mixture more stable with smaller particles, we started another series of experiments
regarding the synthesis of polyol with build-in without TDI. Weight content of NH2-PEOS
varied from 2 to 10 wt% and homogeneous liquids were obtained when the NH2[3~10]-
PEOS hydrolyzed in acidic environment. Two blends were selected for foam preparation
and the foams were too sticky and weak. Shown by TGA measurements, polyol with build-
in NH2-PEOS has a better thermal stability both in air and nitrogen. Moreover, higher
amino content may influence the thermal stability positively.
Due to the high amino group content, different PAPTES were selected instead of NH2-
PEOS to be built in polyol. Significant improvement can be detected via TGA measurement
in air or nitrogen. Different procedures were applied to increase the stability of the
polyol/PAPTES blends and three best samples with 20 wt% PAPTES or 20 % fully
XII
hydrolyzed APTES were chosen for the foam preparation. However, after one week’s
efforts, only two blends with 20 wt% PAPTES were successfully applied in the flexible PU
foams and all the foams containing PAPTES failed the Cal 117 and Crib 5 tests. However,
since the surface area of foams and cell sizes normally have even larger effects on the
flammability than density or differences in chemical structure, more trials with different
foaming process/recipe or different polyols with build-in PEOS should be carried out. On
the other hand, the adding of PAPTES may bring positive influence on the compression set
resistance, the hysteresis and comfort index.
Based on previous studies from M. Jaumann, using a method similar to PEOS
synthesis, polyalkoxytitanate (PAOT) as a precursor of TiO2 was prepared. PAOT has a
much higher stability comparing with the monomer Ti(O-iPr)4 and can easily be stored in a
solvent such as chloroform without use of any additional protections. With this precursor, a
smooth TiO2 film can be prepared by spin-cast followed with H2 plasma-curing. After curing,
more than 90% of Ti-OiPr could convert to TiO2 film.
XIII
Zusammenfassung
Die vorliegende Arbeit beschäftigt sich mit der Herstellung, Modifizierung und
Anwendung eines am DWI entwickelten, neuen Siliziumdioxid Precursors, dem hoch
verzweigten Polyethoxysiloxan (PEOS). Dieser Precursor zeichnet sich aus durch hohe
thermische Stabilität, sehr gute Mischbarkeit mit den meisten organischen Lösungsmitteln
und eine einfache Modifizierbarkeit sowohl der Endgruppen als auch durch Austausch der Si-
Atome durch andere Elemente. Eine in dieser Arbeit behandelte Modifikation ist das
Polyalkoxytitanate (PAOT), bei dem alle Si-Atome durch Titan ersetzt sind.
Die Synthese von PEOS sowie seiner Modifikationen mit i-Butyl order n-Oktyl erfolgt
über die Ein-Topf Kondensationsreaktion von Tetraethoxysilan (TEOS) mit
Essigsäureanhydrid in Gegenwart eines Katalysators. Der dabei gebildete, sehr niedrige
Anteil flüchtiger Verbindungen kann über eine Behandlung mittels Dünnschichtverdampfer
(DSV) komplett entfernt werden.
In dieser Dissertation werden insgesamt vier unterschiedliche Endgruppenmodifizierte
PEOS-Varianten betrachtet. Durch die Verwendung von i-Butyltriethoxysilan bzw. n-
Oktyltriethoxysilane als Co-monomere bei der Kondensation von TEOS und
Essigsäureanhydrid wurden i-Butyl-(iBPEOS) bzw. n-Oktyl-modifiziertes PEOS (OPEOS)
erhalten. Die Modifizierungsgrade wurden dabei im Bereich von 10% bis 40% bezogen auf
den Gehalt an Ethoxygruppen durch die Variation des Verhältnisses von TEOS zu
Comonomer variiert.
Zur Einführung reaktiver Amino-Gruppen in PEOS (NH2-PEOS) oder zur Herstellung
anderer Amino-modifizierter SiO2-Precursoren mit unterschiedlichem Gehalt an NH2-
Gruppen (2 bis ca. 10% und >20% bezogen auf die Anzahl der Ethoxygruppen) wurden vier
unterschiedliche Syntheseabläufe erarbeitet. Auch ein sogenanntes amphiphiles PEOS, das
jeweils 10% Amino- als auch n-Oktyl-Gruppen enthält, wurde synthetisiert.
Die Herstellung von iPP/SiO2-Kompositen erfolgte durch in situ Sol-Gel Technik in
einem 15 mL Doppelschnecken-Miniextruder über die Mischung von iPP und PEOS in der
Schmelze, wobei der SiO2-Anteil aufgrund der geringen Flüchtigkeit von PEOS einfach über
die zugesetzte PEOS-Menge kontrolliert werden kann. Während der Extrusion werden
Komposite mit homogen verteilten SiO2-Teilchen gebildet, die in Abhängigkeit von der
XIV
Menge des zugesetzten PEOS im Bereich von 100 nm bis zu mehreren Mikrometern
variieren. Die resultierenden iPP/SiO2-Komposite zeigen unter Stickstoff verbesserte
thermische Eigenschaften sowie höherer Kristallinität. Die mechanischen Eigenschaften
bleiben dagegen im Vergleich zu ungefülltem iPP unbeeinflusst.
Die Morphologie der Komposite wurde durch die Kombination von Klein- und
Weitwinkel Streu-Experimenten (SAXS und WAXS) sowie Festphasen 1H-NMR Messungen
bestimmt. Sowohl durch WAXS- als auch SAXS-Experimente wurde im Kern des
Spritzgusskörpers eine signifikante Orientierung der iPP Kristalle in Spritzgussrichtung
nachgewiesen, während der Kern eines ungefüllten iPP-Spritzgusskörpers keine Orientierung
-Kristalle finden sich normalerweise nur in
der Oberflächenschicht von nukleiertem iPP. Durch Protonen Spin Diffusion Experimente
konnte außerdem eine deutliche Zunahme der Kettenbeweglichkeit in der amorphen Phase in
Gegenwart von SiO2 Partikeln nachgewiesen werden.
Die Herstellung von Kompositen auf der Basis von mit Endgruppen modifiziertem
PEOS erfolgte durch einen der Herstellung von iPP mit unmodifiziertem PEOS analogen in
situ Sol-Gel Prozess. Im Vergleich zu den auf der Basis von PEOS hergestellten iPP/SiO2
Kompositen sind die durch den Einsatz von iBPEOS erhalten iB-SiO2-Partikel etwas kleiner.
Modifiziert man PEOS mit n-Octylgruppen, so verbessert sich die Verträglichkeit mit der iPP
Schmelze deutlich, wie mittels TEM und FESEM nachgewiesen wurde. Diese bessere
Verträglichkeit führt über kleinere SiO2 Partikel letztendlich zu höherer Transparenz der
Komposite.
Durch den Einsatz von vorkondensiertem 3-Aminopropyltriethoxysilane (PAPTES) als
SiO2-Precursor in iPP wurde die thermische Stabilität der Komposite unter Luft deutlich
verbessert.
In der Arbeit wurde weiterhin gezeigt, dass PEOS die Exfolierung von Schichtsilikaten
unterstützen kann. An den mittels Schmelze Mischung im Microcompounder erhaltenen
Proben wurde durch WAXS- und TEM-Experimente die Interkalation von Bentoniten
nachgewiesen. Die gleichzeitig in situ gebildeten SiO2-Partikel unterstützen als
-Phase in iPP.
NH2-PEOS und andere NH2-modifizierte SiO2-Precursoren wurden für die Herstellung
flexibler Polyurethane (PU) Schäume eingesetzt. Dafür wurden drei unterschiedliche Ansätze
verfolgt:
(A) Herstellung von Polyolen mit darin gelöstem NH2-PEOS oder andere, mit Amino-
Gruppen modifizierte SiO2-Precursoren,
XV
(B) Herstellung von Isocyanaten mit darin gelösten PEOS oder NH2-PEOS und
(C) die (kovalente) Einbindung von NH2-PEOS oder anderer NH2-modifizierter SiO2-
Precursoren in Polyole.
Im Falle der Lösung von NH2-PEOS in Polyolen (A) können Umesterungsreaktionen
zwischen den Ethoxy-Gruppen von PEOS und den Hydroxy-Gruppen des Polyols unter der
katalytischen Wirkung der NH2-Gruppen nicht vermieden werden. Eine detaillierte
Aufklärung der resultierenden Struktur der Mischung ist deshalb nicht möglich.
Für den zweiten Ansatz kann unmodifiziertes PEOS aufgrund geringer Löslichkeit nur
sehr schlecht in den Isocyanaten MDI / PMDI gelöst werden. Die Isocyanate und PEOS
unterscheiden sich stark hinsichtlich ihrer Polarität und die Reaktivität zwischen NCO- und
Ethoxy-Gruppen ist nur sehr gering. Die Reaktivität lässt sich durch die Einführung von NH2-
Gruppen in PEOS deutlich steigern, wodurch die Mischbarkeit im resultierenden Produkt
sowohl auf der Basis von MDI als auch von PMDI deutlich zunimmt. Wird die Reaktivität
jedoch zu groß, lässt sich die Reaktion nicht mehr kontrollieren und man erhält komplett
vernetzte Klumpen.
Um sich auf die komplexe chemische Struktur solcher Mischungen zu konzentrieren,
war nach Ansatz C, dem Einbau von NH2-PEOS in Polyole, die Erzeugung eine Reihe von
Produkten mit definierten Strukturen notwendig. PolyIsocyanate PolyAdditions (PIPA)
Polyole werden für die industrielle Herstellung von PU-Schäumen genutzt. Aus diesem Grund
wurden NH2-PEOS und andere NH2-modifizierte SiO2-Precursoren in PIPA Polyole
eingebaut. Dazu wurde PEOS mit 3~10% Aminogruppen sowohl in starre PU-Schäume
(Polyol IP585) als auch in flexible PU-Schäume (Polyol CP4702) mit TDI als Vernetzer
eingebaut. Im Ergebnis führte die Verwendung des starren Polyols IP585 in Verbindung mit 8
bis 12 Gew.-% NH2-PEOS zu sehr kleinen PIPA-Partikeln von maximal 5 µm Größe.
Verwendet man dagegen das flexible Polyol CP4702 als Basis Polyol für die PIPA-
Herstellung, so erhält man unter Einsatz von 4 bis 16 Gew.-% NH2-PEOS unterschiedliche
PIPA-Partikel. Der maximale Gehalt an NH2-PEOS hängt wesentlich vom
Modifizierungsgrad, d.h. von der Menge NH2-Gruppen in PEOS ab. Je höher dieser Anteil
ist, eine umso geringere Menge kann davon eingesetzt werden, wenn Vernetzung vermieden
werden soll. Gleichzeitig setzen sich die dann gebildeten größeren PIPA-Partikel während der
Lagerung aufgrund von Phasenseparation ab.
Aufgrund der Fähigkeit der NH2-Gruppen, die Reaktion zwischen den Ethoxy-Gruppen
von PEOS und den Hydroxyl-Gruppen der Polyole zu katalysieren, kann NH2-PEOS selbst
als Vernetzer mit Polyol fungieren. Um eine Vernetzung von NH2-PEOS mit Isocyanaten zu
XVI
verhindern und gleichzeitig die Mischung mit kleinen Partikeln zu stabilisieren, wurde NH2-
PEOS ohne TDI direkt in Polyole eingebaut. Der Anteil an NH2-PEOS wurde zwischen 2 und
10 Gew.-% variiert, wobei sich immer dann homogene Mischungen bildeten, wenn
NH2[3~10]-PEOS in saurer Umgebung hydrolysiert wurde.
Zwei dieser Blends wurden für die Herstellung von Schäumen eingesetzt. Diese waren
jedoch klebrig und schwach.
TGA-Messungen zeigten, dass die nach Ansatz C synthetisierten Polyole mit
eingebautem NH2-PEOS sowohl unter Luft als auch unter Stickstoff höhere thermische
Stabilität aufweisen als die reinen Polyole. Dabei sind die Produkte umso stabiler, je höher
der Anteil an Amino-Gruppen ist. Um die Stabilität solcher Blends weiter zu steigern, wurden
PAPTES mit hohen NH2-Gehalten eingesetzt und die drei besten Proben mit jeweils 20 Gew.-
% PAPTES bzw. komplett hydrolysiertem APTES für die Schaumherstellung ausgewählt.
Aufgrund unzureichender Lagerstabilität konnten jedoch nur mit den beiden Blends mit je 20
Gew.-% PAPTES flexible Schäume hergestellt werden. Beide Schäume bestanden die Tests
zur Ermittlung der Flammfestigkeit (Cal 117 und Crib 5) nicht. Da die Oberfläche und die
Größe der Zellen einen wesentlich größeren Einfluss auf die Flammeigenschaften der
Schäume besitzen als deren Dichte oder Unterschiede in der chemischen Struktur, scheinen
weiterführende Versuche mit veränderten Rezepturen oder anderen Polyolen mit eingebauten
PEOS-Modifikationen notwendig. Andererseits übt der Zusatz von PAPTES einen positiven
Einfluss auf die Kompressionsfestigkeit, die Hysterese und den Komfort-Index aus.
Aufbauend auf erste Untersuchungen von M. Jaumann wurde nach einer der Synthese
von PEOS ähnlichen Methode Polyalkoxytitanate (PAOT) als Precursor für TiO2
synthetisiert. Ein großer Vorteil von PAOT gegenüber dem Monomer Ti(O-iPr) ist seine
wesentlich höhere Stabilität gegen Hydrolyse und die Möglichkeit, dieses in einem
Lösungsmittel wie Chloroform ohne weiteren Schutz zu lagern. Über Spin-casting, gefolgt
von der Härtung im H2-Plasma, können glatte TiO2-Filme erzeugt werden. Dabei werden
mehr als 90% des PAOT in TiO2 umgewandelt.
Chapter 1
1
1. Introduction
Polymeric/inorganic nanocomposites have attracted much attention nowadays for its
special properties and industrial applications. With good dispersion, the inclusion of nano-
sized particles with huge surface area and often anisotropic geometry in a polymer matrix
leads to tremendous changes in morphology and performance. Significant improvements in
e.g. thermal stability, flame retardancy, mechanical and dielectric properties and rheological
behaviour have been observed at low filler volume fraction. Nanoscale silica particles are
among the most widely used reinforcing fillers.[1]
Almost all my work in the four years’ study focused on a premium precursor of silica
------hyperbranched Polyethoxysiloxane (PEOS), which was firstly developed by us and
have very good high temperature stability, good miscibility with most of the solvents and
possibility to be modified easily. It can be employed in thermoplastic processing aimed at
the development of a solvent-free sol-gel technology for the in situ formation of nanoscale
silica particles, which is one of the most commonly used inorganic fillers. Comparing with
common commercially available precursors, PEOS has a better hydrolytic and storage
stability under air and at higher temperature. Also because of its hydrophobicity, it could be
applied to the system which has low-surface-energy, e.g. molten iPP, and then convert to
silica particles. After proper modification to PEOS, it is possible to combine the resulting
silica particles with different functional groups, e.g. some further modifications were done
to make it more hydrophilic or even amphiphilic for some other applications.
1.1. Preparation of PEOS and modified PEOS
PEOS was used as a basic-material in all the synthesis of modified PEOS. It was
synthesized via a one-pot catalytic condensation reaction of tetraethoxysilane (TEOS) with
acetic anhydride. The resulting product after the condensation was a transparent, yellow and
oily liquid. The low fraction of volatile compounds in the product was removed completely
by passing through a vacuum thin-film evaporator (TFE). Because of its perfect stability
under high temperature and good miscibility with most of the solvent which are mentioned
Introduction
2
in the previous part, the final products PEOS can be used directly in the preparation of iPP /
Silica blend or further modification of itself.
Because of the limited compatibility of PEOS in molten iPP and following big silica
particles after conversion at higher PEOS concentration, two different modified PEOS with
better miscibility with molten iPP were prepared: isobutyl modified PEOS (iBPEOS) and n-
octyl modified PEOS (OPEOS). The routes were similar with the preparation of PEOS and
a mixture of isobutyl triethoxysilane (iBTEOS) or n-octyl triethoxysilane (OTEOS) with
TEOS was used instead of only TEOS. And the miscibility of the octyl modified PEOS in
molten iPP, which was tested by Faymonville, were prove to be increased significantly with
the modification of octyl groups.
Amino-modified PEOS (NH2-PEOS) with different amino contents were prepared by
three different ways and the hydrolytically stably linked amino groups were provided by 3-
Aminopropyl triethoxysilane (APTES): (1). PEOS with 3%~10% amino groups was
prepared by two-step co-condensation of APTES with pre-hydrolyzed PEOS; (2). PEOS
with 20%~50% amino groups was prepared by two-step co-condensation of PEOS with a
pre-condensed APTES (PAPTES); (3). PEOS with higher than 50% amino groups was
prepared by a self-condensation of APTES. All the NH2-PEOS were used in the application
in flexible PU foam and some of them were used in the application of iPP.
PEOS were also considered as an assistant for the exfoliation of layered silicates in
iPP matrix. However, because of the limited miscibility of PEOS in iPP and the poor
compatibility of PEOS with layered silicate, the improvement to exfoliation of layered
silicate was a bit limited. To increase the compatibility of PEOS with both iPP matrix and
layered silicate, PEOS modified with both n-octyl and amino groups (NH2-nOPEOS) were
prepared as a kind of surfactant for layered-silicate and molten iPP. The NH2-OPEOS were
prepared by two-step co-condensation of APTES with pre-hydrolyzed OPEOS.
1.2. Preparation of PP-Silica hybrids by reactive extrusion of PEOS
Pure PEOS was used as a kind of well-defined precursor polymer for silica and it can
be employed in thermoplastic processing aimed at the development of a solvent-free sol-gel
technology for the in situ formation of nanoscale filler particles. PP-SiO2 hybrids were
prepared in a 15 mL co-rotating twin-screw microcompounder (DSM Xplore) operating at
200 oC under nitrogen atmosphere. After PEOS and molten iPP being mixed well, water
vapor was introduced with nitrogen flow to convert PEOS to silica particles with aluminum
Chapter 1
3
isopropoxide as a catalyst. Afterwards, the composites were transferred to a 5.5 mL
injection-molding machine (DSM Xplore), and further processed into standard specimens
for tensile testing. The SiO2 content of the composites can be controlled easily and the
particles were found to be homogeneously dispersed in the polymer matrix. With low PEOS
loading, this procedure yielded PP-silica composites with particle diameter less than 100
nm. The particle size increased with the increase of the PEOS amount blended with PP.
To reduce the particle size SiO2 in the iPP hybrids, we used iso-butyl-PEOS and n-
octyl-PEOS instead of normal PEOS with the same procedure. With iso-butyl-PEOS, the
improvement is not so significantly, while with OPEOS, the resulting n-octyl modified
silica (OSilica) particles appeared to be smaller with the same weight content and more
bonding connection between the OSilica particles and iPP chains can be observed.
1.3. Preparation of PP-BENT-Silica hybrids
Layered silicate polymer nanocomposites have been proposed as a totally new and
promising approach for the fire retardancy of polymers.[2]
PEOS was used as an assistant of
the exfoliation of layered-silicate (raw bentonite, BENT) in the application in iPP. The PP-
BENT-Silica hybrids were prepared with the same apparatus and a similar procedure with
the PP-SiO2 hybrids preparation. The exfoliation of bentonite was detected by transmission
electronic microscopy (TEM) and wide angle x-ray scattering (WAXS). PEOS was proved
to be positive additive for the preparation of PP-bentonite hybrids.
The compatibility of PEOS with BENT or iPP were varied by modifications with
different functional groups and the relationship between hydrophobicity of PEOS and the
exfoliation effect of BENT were tested afterwards. Four different PEOS were selected: 20%
n-octyl groups modified PEOS (20-OPEOS), 20% amino groups modified PEOS
(NH2[20%]-PEOS), 20% amino groups and 20% octyl groups modified PEOS (NH2[20%]-
20-OPEOS) and of course normal PEOS as a comparison. TEM and WAXS measurements
were used to detect the internal morphology of the hybrids.
1.4. Application of NH2-PEOS in PU foams
The recent increase in published patents and papers on flame retardancy (FR) at least
partially reflects a growing need for "pristine" FR technology which is most likely inspired
by the expectation that halogen and maybe even phosphorous containing "traditional" FR
Introduction
4
agents will experience increased scrutiny by regulatory bodies, both in the EU and
elsewhere.
Amino groups modified PEOS prepared by transesterification of ethoxy groups in
PEOS by ethanolamine have been investigated for their ability to enhance flame-retardancy
of rigid polyurethane foams. To improve the stability of amino modified PEOS, we
prepared a series of hydrolytically-stable NH2-PEOS with different methods and this series
of NH2-PEOS was used for the modification of flexible polyurethane foams.
1.5. Preparation of PAOT
Titanium dioxide is one of the most basic materials in our daily life. Nowadays, the
most widely used methods to prepare TiO2 films are chemical vapour deposition (CVD),
oxidation of titanium35, electron beam evaporation, ion sputtering, and sol-gel methods.
But all of the preparation methods for TiO2 have disadvantages: the procedure is too
complex and the pre-product of TiO2 cannot be stored because of the high activity in air
atmosphere. So a precursor for TiO2 film-preparation with higher storage and processing
stability is urgently needed.
A new precursor of TiO2 which we named polyalkoxytitanate (PAOT) is prepared by
one-step condensation of tetraisopropyl orthotitanate (Ti(O-iPr)4) similar to the synthesis of
PEOS. It can be stored in common solvents (e.g. chloroform, toluene) without special drying
for weeks and can be applied in standard dip-coating or spin-casting processes. For
application, a smooth TiO2 film could be prepared with this precursor by spin-cast followed
with H2 plasma-curing.
References:
[1]. Dou, Q., et al., Journal of Sol-Gel Science and Technology, 2008. 48(1-2): p. 51-
60.
[2]. Gilman, J.W., Kashiwagi, T., and Lichtenhan, J.D., Sampe Journal, 1997. 33(4):
p. 40-46.
Chapter 2
5
2. Literature review
For hyperbranched PEOS, which is the basic chemical used through the whole thesis
and my 4 years’ study, one of the most important applications is acting as the silica
precursor for nanocomposites. To get an overview of the state of art of the possibly
application of PEOS, we start the literature review with the brief summary of the
development of nanocomposites.
2.1. Nanocomposites
The design and synthesis of modern materials with control over shape, dimension and
functionality is a fundamental research field of materials scientists. This has led to
incredible progress in the synthesis of nanocomposites, which can be defined as containing
of at least two Gibbsian phases, one of them being nanoscaled.[1]
One can differentiate three
types of nanocomposites, depending on how many dimensions of the dispersed particles are
in the nanometer range. When the three dimensions are in the order of nanometers, we are
dealing with isodimensional nanoparticles, such as spherical silica nanoparticles obtained by
in situ sol-gel methods[2, 3]
or by polymerization promoted directly from their surface,[4]
but
also can include semiconductor nanoclusters[5]
and others[3]
. When two dimensions are in
the nanometer scale and the third is larger, forming an elongated structure, we speak about
nanotubes or whiskers as, for example, carbon nanotubes[6]
or cellulose whiskers[7, 8]
which
are extensively studied as reinforcing nanofillers yielding materials with exceptional
properties. The third type of nanocomposites is characterized by only one dimension in the
nanometer range. In this case the filler is present in the form of sheets of one to a few
nanometer thick to hundreds to thousands nanometers long.
The nanocomposite can be traced back to Roy and Komarneni, who have used sol-gel-
based processes to produce heterogeneous powders.[9, 10]
This type of materials has received
increased attention in the 80s, due to the work of Gleiter[11]
on nanocrystalline materials,
showing that by reducing the size of the components within the composite materials towards
the nanoscale. An enormous improvement in their properties (e.g. mechanical, electrical,
Literature review
6
optical etc.) can be achieved. Therefore, the design concept used for the synthesis for
nanocomposite materials allows for the production of materials with exceptional properties
which additionally can exhibit multifunctionality.
Over the last decades, a large number of nanocomposite materials classes have been
developed. e.g. polymer-based nanocomposites (such as polymer/glass, polymer/metal,
polymer/ceramic), metalbasednanocomposites (metal/metal, metal/glass, or metal/ceramic),
or ceramic-based nanocomposites. The combination of inorganic and organic components in
one composite system allows for the preparation of new materials with multifunctional
properties. Ideally, such a composite reflects the properties of its individual building blocks
and also synergetic effects due to the interaction of different materials can be achieved. In
addition to the established main material classes of polymers, polymer-matrix composites
(PMC), allow for a physical property tailoring using different type of fillers.[12, 13]
Depending on the particle size, particle shape, specific surface area and chemical nature, the
following polymer matrix properties can be modified:
• electrical and thermal conductivity
• polymer phase behavior and thermal stability
• mechanical properties like stiffness, Young’s modulus, wear, fatigue, and others
• flame retardancy[14]
• density
• physical properties such as magnetic, optic, or dielectric properties.
Inorganic nanoparticles represent such a commonly used building block since they can
provide a variety of different properties.[15-19]
This can be related to the quantum size effect,
e.g., the confinement of electrons and excitons, as well as their enormous surface to volume
ratio. Such nanocomposites have throwed light on their synthesis techniques, properties, and
applications. These materials are almost exclusively obtained by the intercalation of the
polymer (or a monomer subsequently polymerized) inside the galleries of layered host
crystals. There is a wide variety of both, synthetic and natural crystalline fillers that are able
- under specific conditions - to intercalate a polymer. Table 2. 1 presents a non-exhaustive
list of possible layered host crystals.[20]
Chapter 2
7
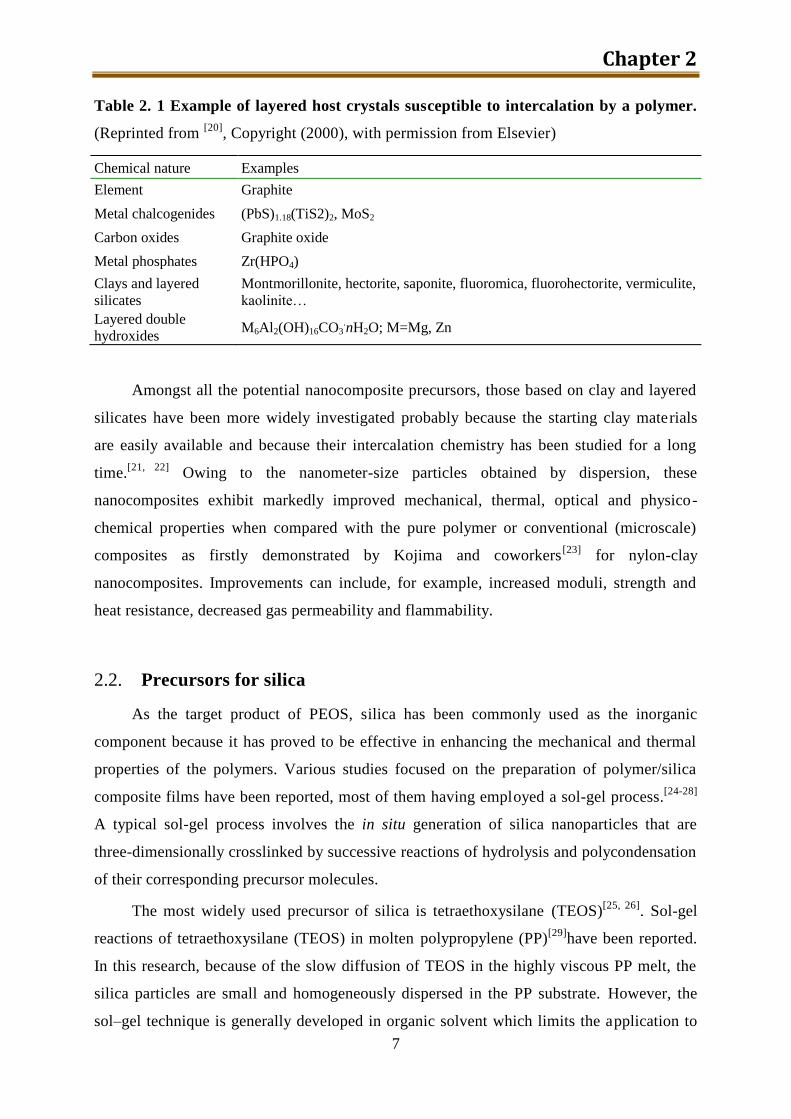
Table 2. 1 Example of layered host crystals susceptible to intercalation by a polymer.
(Reprinted from [20]
, Copyright (2000), with permission from Elsevier)
Chemical nature Examples
Element Graphite
Metal chalcogenides (PbS)1.18(TiS2)2, MoS2
Carbon oxides Graphite oxide
Metal phosphates Zr(HPO4)
Clays and layered
silicates
Montmorillonite, hectorite, saponite, fluoromica, fluorohectorite, vermiculite,
kaolinite…
Layered double
hydroxides M6Al2(OH)16CO3
.nH2O; M=Mg, Zn
Amongst all the potential nanocomposite precursors, those based on clay and layered
silicates have been more widely investigated probably because the starting clay materials
are easily available and because their intercalation chemistry has been studied for a long
time.[21, 22]
Owing to the nanometer-size particles obtained by dispersion, these
nanocomposites exhibit markedly improved mechanical, thermal, optical and physico-
chemical properties when compared with the pure polymer or conventional (microscale)
composites as firstly demonstrated by Kojima and coworkers[23]
for nylon-clay
nanocomposites. Improvements can include, for example, increased moduli, strength and
heat resistance, decreased gas permeability and flammability.
2.2. Precursors for silica
As the target product of PEOS, silica has been commonly used as the inorganic
component because it has proved to be effective in enhancing the mechanical and thermal
properties of the polymers. Various studies focused on the preparation of polymer/silica
composite films have been reported, most of them having employed a sol-gel process.[24-28]
A typical sol-gel process involves the in situ generation of silica nanoparticles that are
three-dimensionally crosslinked by successive reactions of hydrolysis and polycondensation
of their corresponding precursor molecules.
The most widely used precursor of silica is tetraethoxysilane (TEOS)[25, 26]
. Sol-gel
reactions of tetraethoxysilane (TEOS) in molten polypropylene (PP)[29]
have been reported.
In this research, because of the slow diffusion of TEOS in the highly viscous PP melt, the
silica particles are small and homogeneously dispersed in the PP substrate. However, the
sol–gel technique is generally developed in organic solvent which limits the application to
Literature review
8
coatings. Nevertheless, some studies were dedicated to the generation of inorganic domains
in bulk polymer. Specifically for the polypropylene, Sun et al.[30]
reported on
polypropylene/silica nanocomposites prepared using supercritical carbon dioxide (SC CO2).
In that case, TEOS is first impregnated into PP matrix. Then, the TEOS confined in polymer
network is submitted to hydrolysis condensation reactions. The results showed that nano-
sized silica networks were formed and distributed uniformly in PP matrix. Zhang et al.[31]
used the same previous approach but studied the effect of a co-solvent such as the ethanol
on the PP impregnation by the TEOS. Jain et al.[32-34]
combined a PP solid-state
modification by grafting vinyl triethoxysilane (VTEOS) followed by a sol–gel treatment. By
this method, they prepared PP/silica nanocomposites with varying degree of adhesion
between silica nano-filler and matrix. An extension of the sol–gel method to the classical
polymer processing has been also proposed. Mizutani et al.[29]
succeeded in sol–gel reaction
of TEOS in molten PP with the aid of an extruder. They based their synthesis on several
successive extrusion steps : (1) formation of PP/TEOS pellets; (2) second extrusion of the
previous pellets with a constant water feeding. Polyethoxysiloxane was also prepared by
Abe et al. via acid-catalyzed self-condensation of TEOS[35]
. However, the stability of this
polyethoxysiloxane is restricted by the high silanol content.
Some researchers also used other precursors to tailor the materials structure in terms
of particles size and dispersion. Ethylene–vinyl acetate copolymer (EVA)/silica hybrids
were elaborated in two steps with the formation of the silica phase during processing
operation without solvent.[36, 37]
In a first step, the tetrapropoxysilane (TPOS) was grafted
onto the copolymer by reaction with the acetate function in presence of dibutyltin oxide
(DBTO). Then, the hydrolysis and condensation reactions of TPOS lead to the formation of
an inorganic silica phase grafted onto the copolymer. This approach has been also applied to
the in situ generation of titanium dioxide in molten PP.[38, 39]
In the past decade, a group of molecules, named polyhedral oligomeric
silsesquioxanes (POSS), have attracted wide-spread interest mainly as precursors of silica in
the preparation of hybrid inorganic / organic materials. POSS which is first synthesised in
1946[40]
belong to the wide family of silsesquioxanes, characterised by the general formula
(RSiO1,5)n where R is hydrogen or an organic group, such as alkyl, aryl or any of their
derivatives. POSS molecules are physically large with respect to monomer dimensions and
nearly equivalent in size to most polymer segments.
Chapter 2
9
In the regard for being precursor of hybrid silica materials, POSS are very attractive as
they can be simply functionalised by chemically changing the substituent groups, therefore
having the potentiality of undergoing copolymerisation or grafting reactions. Several
polymeric systems have been taken in to account incorporating POSS cages both in
thermoplastic matrices, such as styryl-based polymers[41-43]
, acrilates[44-47]
, olefines[48-50]
,
and in thermosets, mainly as regards epoxy resins.[51-54]
As far as polyolefins are concerned, the possibility to fine tuning POSS cage
interfacial properties, by playing on the substituent group nature is even more appealing, as
it was reported that in polyolefins–clay systems the formation of nanocomposites (either
intercalated or exfoliated) is impeded by the unfavourable interactions between hydrophilic
clay surfaces and hydrophobic polyolefins.[55]
Even by using chemically modified
organphilic clays and a compatibiliser such as maleic anhydride grafted polyolefin, it is
difficult to obtain an exfoliated structure.[56]
Fu et al.[57]
reported the first study concerning
PP/POSS composites evaluating their crystallisation behaviour, at quiescent and shear
states. Octamethyl-POSS was added via compounding in an internal mixer to i-PP at quite
high concentrations (10, 20 and 30 wt%) and the crystallisation behaviour was studied by
means of DSC and in situ SAXS measurements. POSS was found to influence quiescent
melt crystallisation enhancing (by acting as a nucleating agent) or retarding the
crystallisation process, depending on its concentration. On the other hand, the POSS always
accelerated such mechanism under shearing[57]
.
More recently, the same research group investigated the physical gelation in ethylene–
propylene (EP) copolymer melts induced by POSS molecules.[54]
EP/octamethyl– POSS
composites were prepared by melt-mixing in a twinscrew microcompounder with EP
copolymers characterised by different ethylene contents and varying the POSS loadings
from 10 to 30 wt%. From WAXD analysis it was found that no molecular dispersion of
POSS cages could be achieved as POSS X-ray pattern was maintained in the composites.
Small-amplitude oscillatory shear experiments showed that the presence of POSS molecules
changed the rheological behaviour above melting from liquid-like in the neat resin to solid-
like in the nanocomposites. Moreover, the addition of 10 wt% of POSS was found to
increase considerably the Young’s modulus and the Tg value (both calculated by means of
DMA analysis) as compared to neat EP. The nonisothermal crystallisation of HDPE/POSS
nanocomposites was very recently studied by Joshi et al.[58]
: The crystallinity of HDPE was
found to be dependent on the amount of added octamethyl-POSS and on the cooling rates.
Literature review
10
Very recently, since scientists have been investigating methods to control polymer
architectures to obtain new material properties, changes in polymer branching architecture
have been applied to give different polymer properties. Therefore, silicon-based
hyperbranched polymers and oligomers were widely developed as potential candidates for
additives, coupling agents, surface modifier, and building blocks for ladder and cube
oligosiloxanes, polysiloxanes with well-controlled structure and silicon-based materials. It
should be noted that they are potential precursors as well for the synthesis of silicon-based
organic–inorganic hybrids.
The sol–gel process with TEOS forms polysiloxanes with sufficient spinnability to
form fibers that are transformed to silica fibers by a subsequent pyrolysis. This is an
effective process to obtain silica fibers at an appreciable low temperature although there are
the problems to be improved such as the stability of sols to condensation regardless of the
optical properties of silica fibers. On the other hand, esterification of silicic acid provides
spinnable polysiloxanes[59]
, for which the stability and/or self-condensation are dependent
on the degree of esterification (DE) and the alkyl group, so that the esters with appropriate
DEs can be used as a good precursor for the preparation of silica fibers. Thus, esters with
DE less than around 60%undergo further condensation which, on precipitation with a
solvent such as hexane, form insoluble powders which are the precursors for the preparation
of submicrometer-sized silica particles.[60]
Silicic acid itself is also used as a precursor for
the preparation of bulk silica glasses, which are prepared by aging a concentrated silicic
acid in organic solvents, followed by gradual evaporation of the solvent at room
temperatures .[61]
Polysilsesquioxanes can be a precursor for the preparation of silicon oxycarbide
SiOC.[62]
A mixture of the two components of (RSiO3/2)n (R ¼ Me, Pr, Ph) provides silicon
oxycarbide fibers on heating the precursor fibers in N2 or argon.[63]
Black glasses, silicon
oxycarbide, are formed by heat-treatment of polysilsesquioxane gels prepared by hydrolytic
polycondensation. They are also obtained by heating the polysiloxanes prepared by
hydrolytic polycondensation of TEOS/a,v-polydimethylsiloxanediol[64]
or
TEOS/Me2Si(OEt)2.[65]
2.3. iPP/Silica hybrids
Isotactic polypropylene (iPP) was firstly chosen as the matrix in the application of
PEOS as silica precursor. PP is one of the most widely used polyolefin polymers due to its
Chapter 2
11
attractive properties and low cost. Isotactic polypropylene (iPP), prepared using metallocene
catalysts, is probably the most interesting commodity thermoplastic due to its high
isotacticity, enhanced mechanical properties, narrow molecular weight distribution and
increased clarity. It is well known that the mechanical properties of PP can be improved
when inorganic fillers are well dispersed in PP matrix.[66-71]
One big issue by dispersion of
inorganic fillers in PP is the hydrophobic nature of PP itself, which prevents a good
interfacial adhesion between hydrophilic fillers and hydrophobic PP matrix. In general, this
issue can be overcome by using the following methods: addition of coupling agents such as
maleic anhydride grafted PP, chemical surface modification of inorganic fillers and in situ
polymerization, etc. There are two advantages regarding chemical surface modification of
nanoparticles. One is the steric stabilization of nanoparticles towards agglomeration and the
other is to improve the compatibility between particle surface and polymer matrix. In the
case of nanosilica-filled PP composites, many studies have shown improvements in
mechanical properties when silica nanoparticles were chemically surface-treated compared
to unmodified silica particles[49, 72]
. Rong et al.[49, 73]
have indicated that a small
concentration of modified nanoparticles (7 nm’s nanosilica or 60 nm’s nano-CaCO3) less
than 3 volume percentage (vol%) can effectively improve the toughness, modulus, strength
and thermal deformation temperature of PP. One of the few disadvantages associated with
the nanoparticle addition is its high cost. In principle, this negative effect is counterbalanced
as only relatively small amounts (2– 5 wt%) of nanoparticles are needed, while traditional
fillers require a much higher content to achieve a similar performance. However, due to the
high interface content, the nanoparticles always tend to aggregate during the mixing and
higher nanofiller content is always needed to provide a similar improvement. Also with
higher nanofiller content, the melt viscosity will increase significantly. So homogeneous
dispersion of silica nanoparticles in the iPP matrix is always an important topic in the study
of iPP / silica nanocomposites, and is very difficult to be obtained via only melt-blending.
To avoid this problem, new silica incorporation techniques were employed such as in
situ silica formation or treatment with effective surface coupling agents.[74, 75]
c-
Mercaptopropyltrimethoxysilane and bis(3-triethoxysilylpropyl)tetrasulfide are very
effective surface coupling agents for the silica nanoparticles to become hydrophobic. On the
other hand, hydrophobic silica particles with the modification of octyl-silane or p-toluene
sulfonic acid are commercially availed. It was found that the addition of treated silica
particles resulted in enhanced mechanical properties, compared with that of untreated SiO2
particles, due to the higher silica dispersion in the rubber matrix.
Literature review
12
In the study on iPP/SiO2 nanocomposites by the group of Karayannidis, an
improvement in mechanical properties such as tensile and impact strength as well as
elongation at break was observed after nanoparticle addition.[76]
A maximum in mechanical
properties appeared at a silica content of 2.5 wt% in either surface treated or untreated SiO2
nanoparticles (with average size of 12 nm). A nanoparticle content higher than 2.5 wt% in
the polymer matrix resulted in decreased mechanical properties. This was attributed to the
increased tendency of SiO2 nanoparticles to form agglomerates at higher concentrations.
This behavior is encouraged by the hydrogen bond creation between the surface hydroxyl
groups on the nanoparticles. The hydroxyl groups can be found in high content due to the
formation of silanol functionalities during nanoparticle manufacture. These surface
hydroxyls increase the tendency to form hydrogen bonds between nanoparticles and directly
result in the formation of aggregates. These bonds are powerful enough so that they can
maintain the particles agglomerated even during the compounding process where powerful
shear stresses are applied on the surface of the agglomerates. In another report made by the
same group,[77]
in order to destroy the hydrogen bonds of fumed silica and achieve a better
dispersion in the iPP matrix, PP copolymer with maleic anhydride groups (PP-g-MA) was
used as a compatibilizer. It is believed that the maleic anhydride groups can react with the
surface hydroxyl groups of SiO2 nanoparticles and thus agglomerates can be destroyed or
reduced in size.
2.4. iPP/layered silicate
PEOS was also applied to assist the exfoliation of layered silicate in iPP matrix. So
the state of art of the iPP / layered silicate composites is summarized.
Clay and layered silicates have been widely investigated for a long time[21, 22]
Among
all the potential nanocomposite precursors. the reason could be clay materials are easily
available their intercalation chemistry has been fully studied.
The layered silicates commonly used in nanocomposites belong to the structural
family known as the 2:1 phyllosilicates. Their crystal lattice consists of two-dimensional
layers where a central octahedral sheet of alumina or magnesia is fused to two external
silica tetrahedron by the tip so that the oxygen ions of the octahedral sheet do also belong to
the tetrahedral sheets. On the other hand, depending on the nature of the components used
(layered silicate, organic cation and polymer matrix) and the method of preparation, three

Chapter 2
13
main types of composites may be obtained when a layered clay is mixed with a polymer
(Figure 2. 1)[20]
Figure 2. 1 Scheme of different composites resulted from the interaction of layered silicates
and polymer matrix: (a) phases-eparated microcomposite; (b) intercalated nanocomposite
and (c) exfoliated nanocomposite. (Reprinted from [20]
, Copyright (2000), with permission
from Elsevier)
If the polymer is unable to move into the interlayer distance of the silicate sheets, a
phase separated composite (Figure 2. 1a) is obtained, whose properties stay in the same
level as traditional microcomposites. Beyond this classical family of composites, two types
of nanocomposites can be discovered. Intercalated structure (Figure 2. 1b) in which a single
(and sometimes more than one) extended polymer chain is intercalated between the silicate
layers resulting in a well ordered multilayer morphology built up with alternating polymeric
and inorganic layers. When the silicate layers are completely and uniformly dispersed in a
continuous polymer matrix, an exfoliated or delaminated structure is obtained (Figure 2.
1c).
The study of polymer-layered silicate nanocomposites came into vogue about 10 years
ago with the work initiated by the Toyota research team.[78, 79]
They studied the possibility
of Na-montmorillonite organically modified by protonated a,o-aminoacid to be swollen by
Literature review
14
the e-caprolactam monomer (melting temperature is 70 oC) at 100
oC and subsequently to
initiate its ring opening polymerization to obtain nylon-6-based nanocomposites.[79, 80]
In situ intercalative polymerization has also been extensively studied for producing
poly(styrene)- based nanocomposites. Akelah and Moet[81]
modified the interlayer of Na-
montmorillonite and Ca-montmorillonite by exchanging the inorganic cations with
(vinylbenzyl)trimethyl ammonium chloride, increasing the interlayer spacing by 5.4 Å.
These modified clays were then dispersed and swollen in various solvent and co-solvent
mixtures such as acetonitrile, acetonitrile/toluene and acetonitrile/THF. Styrene
polymerizations were carried out in presence of N,N-azobis(isobutyronitrile) (AIBN) as
catalyst under 80 °C for 5 h. The composites were isolated by precipitation of the colloidal
suspension in methanol, filtered off and dried. By this technique, intercalated composites
were produced with interlayer spacings varying between 17.2 and 24.5 Å depending on the
nature of the solvent used. Even if the polymer is well intercalated, a drawback of this
technique remains that the macromolecule produced is not a pure PS but rather a copolymer
between styrene and (vinylbenzyl)trimethyl ammonium cations.
Polyolefins represent another important family of polymers that has been investigated
in order to produce nanocomposites through in situ intercalative polymerization process.
Tudor et al.[82]
have demonstrated the ability of soluble metallocene catalysts to intercalate
inside silicate layers and to promote the coordination polymerization of propylene.
Accordingly, a synthetic hectorite (Laponite RD) was first treated with methylaluminoxane
(MAO) in order to remove all the acidic protons and to prepare the interlayer spacing to
receive the transition metal catalyst. It has to be pointed-out that MAO is commonly used in
association with metallocenes to produce coordination catalysts active in olefin
polymerization. During this first treatment step, no significant increase of the layer spacing
could be detected (even if the diffraction peak broadened slightly) but both increase in Al
content and IR data showing complete disappearance of absorptions assignable to Si-OH
groups agree with the MAO reaction/adsorption inside the layered silicate galleries. Upon
the addition of the metallocene catalyst, a cation exchange occurs with Na+ and the catalyst
is incorporated in the hectorite galleries as demonstrated by an increase in the interlayer
spacing of 4.7Å, consistent with the size of the catalyst species. Using a synthetic
fluorinated mica-type silicate which is derived from any protons in the galleries, the catalyst
was even incorporated directly within the filler interlayer, without the need of MAO
pretreatment. These two modified layered silicates may catalyze with reasonably high
activity during the polymerization of propylene when contacted with an excess of MAO,
Chapter 2
15
and can produce PP oligomers. Unfortunately, no composite characterization was provided
with, so as one cannot claim intercalated or exfoliated morphology.
The thermodynamics that drives the intercalation of a polymer inside modified layered
silicate while the polymer is in the molten state has been approached through an Lattice-
based mean field theory by Vaia and Giannelis.[83]
They discovered that, in general, the
outcome of polymer intercalation is determined by interplay of entropic and enthalpic
factors. Polypropylene (PP) has also been tested as matrix for the preparation of
nanocomposites. However, no direct intercalation of PP in organically modified layered
silicates has been observed so far, PP being too much apolar to correctly interact with the
modified layers. In a first study, Kato et al.[84]
described the melt intercalation of PP chains
modified with either maleic anhydride (PP-MA) or hydroxyl groups (PP-OH) in
octadecylammonium-exchanged montmorillonite (CEC: 119 meq/100 g). When PP-MA
(Mw=30,000, acid value=52 mg KOH/g) or PP-OH (Mw=20,000, OH value=54 mg KOH/g)
was melt blended under shearing with same certain amount of modified montmorillonite at
200 °C for 15 min, intercalated nanocomposites were recovered as demonstrated by the
increase in the layer spacing from 21.7 Å for the initially organomodified montmorillonite
to 38.2 and 44.0 Å for PP-MA and PP-OH based nanocomposites, respectively.
Interestingly, a PP-MA matrix with a lower maleic anhydride content (acid value=7 mg
KOH/g for Mw=12,000) did not intercalate under the same conditions, showing that a
minimal functionalization of the PP chains has to be reached for intercalation to proceed.
The authors also examined the effect of polymer to clay ratio on the intercalation extent and
showed that intercalation increased when the PP-MA fraction was increased, going up to
72.2 Å for a PP-MA to clay ratio of 3:1.
Intercalation of PP-MA in modified clay was used in order to prepare PP-based
nanocomposites.[85, 86]
In both studies, the three components (PP, PP-MA and modified clay)
were compounded in a twin-screw extruder at 210 °C in order to obtain composites
containing 5 wt% clay. Formation of an exfoliated structure was observed for: (1) relatively
high PP-MA content (typically 22 wt%), (2) sufficient polar functionalization of PP-MA
chains (acid value=26 mg KOH/g for Mwˆ40,000). However, the relative content in maleic
anhydride cannot exceed a given value in order to obtain certain miscibility between PP-
MA and PP chains. Indeed, when too many carboxyl groups are spread along the polyolefin
chains (e.g. acid value=52 mg KOH/g), instead of any further increase in the interlayer
spacing in clay/PP/PP-MA blends, it will lead to the dispersion of PP-MA intercalated clay
in the PP matrix.
Literature review
16
Another way to obtain nanocomposites from organo-modified clays and PP has been
recently proposed by Wolf et al.[87]
In this technique, the authors modified a commercially
available organoammonium-exchanged montmorillonite using an organic swelling agent
(whose boiling point is situated between 100 and 200 o
C, such as ethylene glycol, naphtha
or heptane) in order to increase the interlayer spacing. The swollen organo-modified clay
was then compounded with PP in a twin-screw extruder at 250 o
C. The swelling agent was
volatized during melt-blending, leading to the formation of a `nano' composite which did
not present any crystalline reflection in the 20±40 Å range of XRD patterns.
2.5. Flame retardant materials.
One of the target improvements with the introduction of nano silica particle converted
from PEOS in iPP or PU matrix is a better thermal stability as well as the higher flame
retardance.
Fire safety is an integral part of fire precautions which have the objective to minimise
the number of and damage from fires by measures hindering their initiation, limiting their
propagation and possibly excluding flash-over. Preventing fires or delaying them makes
escape possible overa longer time and then, as a result, life, health and property are
efficiently protected.
2.5.1. Mechanism of polymer combustion:
When a material is exposed to fire, the flammability of the material can be described
as one of the four types below:
1) Combustible.
The material will burn when exposed to fire.
2) Flame resistant.
The material is quite difficult to ignite when exposed to fire, however, after
burning it may not self-extinguish.
3) Flame retardant.
Chapter 2
17
It is also difficult to ignite. However, once burning, after the ignition source is
removed, it will self-extinguish.
4) Non-combustible.
The object won’t burn when being exposed to fire.
To protect combustible materials against fire, one of the best ways is to introduce
flame retardants to decrease the flammability. In many cases the combustion of polymers is
similar to the combustion of many other solid materials; however, the tendency of polymers
to spread flame away from a fire source is critical because many polymers melt and tend to
produce flammable drips or flow. Besides, polymers used in manufacturing are not only
bulk parts but also films, fibres, coatings, which are even more combustible than moulded
parts.
All polymer fires start with an ignition event, where a heat source contacts with a fuel
generated by the heating of the polymer. The resulting flow of flammable degradation
products might react with oxygen in the air to generate further flame and heat. Part of the
heat is transferred back to the surface of the fuel, maintaining the flammable volatile
degradation flows[88]
. Lower ignitability, which means longer time or more heat for ignition,
would be the first defence line against fire. Generally, ignitability depends mainly on how
fast the surface can be heat up to the certain ignition temperature. Removal of heat from the
surface by flow or drip of the melting polymer is beneficial for flame retardancy of
uncharable polymers.
After ignition, the extinguishing of fire on the polymer correlates mainly with the
mechanism of thermal decomposition of the polymer. The thermal decomposition of
polymers can be categorized into four general mechanisms:
1) Random chain scission.
2) Chain-end scission.
3) Elimination of pendant groups without breaking of the backbone.
4) Cross-linking.
In most cases, more than one mechanism combines for the decomposition process.
Among this four, polymers decomposed under the mechanisms of “random chain scission”
and “chain-end scission” are more flammable. Cross-linking leads to precursor of char that
might reduce the flammability[52]
. Elimination of side groups results in double bonds, which
Literature review
18
can also diminish the flammability by cross-links as mentioned or aromatization that is
normally less combustible than aliphatic polymers[89]
.
Char, as a product of steady burning, is produced at the expense of combustible
volatile components or fragments. Proved in a previous paper[90]
, the oxygen index shows a
very good correlation with the char yield. On the other hand, char can prevent the heat flux
from transferring from the flame to the polymer surface and act as a diffusion barrier for gas
transport to the flame. Therefore, the contribution of the char is much more pronounced
than being expected from a simple reduction in combustible gases.
Formation of chars from polymers proceeds through four different stages[91]
:
1) Cross-linking.
2) Aromatization.
3) Fusion of aromatics.
4) Graphitization.
The char formation is mainly affected by the chemical structure of the polymer and
the flame retardant additives. When the decomposed polymer contains or tends to form
aromatic fragments, char will be formed. The amorphous char formed by the pregraphitic
domains containing fused aromatic rings would be the best-performing char to hinder the
diffusion of combustible materials to the flame [91]
.
2.5.2. Mechanism of flame retardants:
Generally, all flame retardants can be separated to gas-phase-active and condensed-
phase-active, while the mechanism of flame retardancy can be categorized to physical
mechanism and chemical mechanism.
Gas-phase-active flame retardants act primarily via removing free radicals which
belongs to the chemical mechanism. However, some flame retardants can generate big
amount of non-flammable gases which can dilute the flammable gases and absorb the heat
in the flame. This belongs to the physical mechanism.
Condensed-phase-active mechanism is more complicated comparing to the gas-phase-
active mechanism. Formation of chars is the most common condensed-phase-active
mechanism.
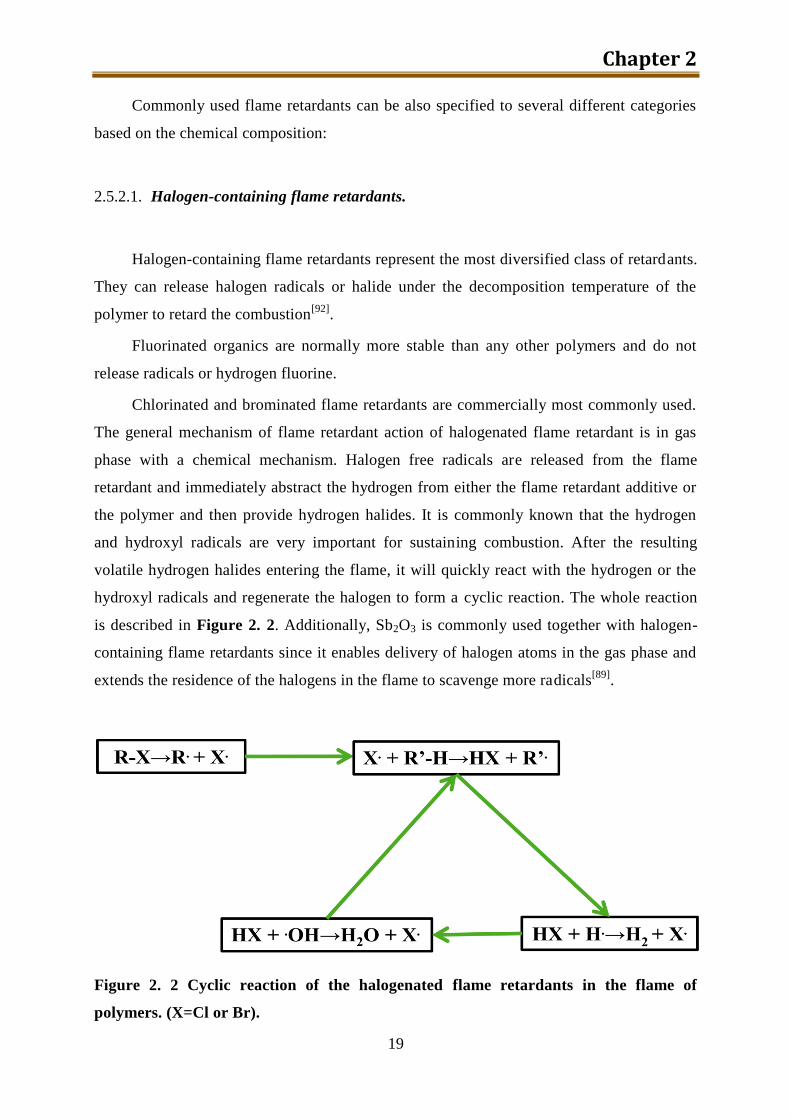
Chapter 2
19
Commonly used flame retardants can be also specified to several different categories
based on the chemical composition:
2.5.2.1. Halogen-containing flame retardants.
Halogen-containing flame retardants represent the most diversified class of retardants.
They can release halogen radicals or halide under the decomposition temperature of the
polymer to retard the combustion[92]
.
Fluorinated organics are normally more stable than any other polymers and do not
release radicals or hydrogen fluorine.
Chlorinated and brominated flame retardants are commercially most commonly used.
The general mechanism of flame retardant action of halogenated flame retardant is in gas
phase with a chemical mechanism. Halogen free radicals are released from the flame
retardant and immediately abstract the hydrogen from either the flame retardant additive or
the polymer and then provide hydrogen halides. It is commonly known that the hydrogen
and hydroxyl radicals are very important for sustaining combustion. After the resulting
volatile hydrogen halides entering the flame, it will quickly react with the hydrogen or the
hydroxyl radicals and regenerate the halogen to form a cyclic reaction. The whole reaction
is described in Figure 2. 2. Additionally, Sb2O3 is commonly used together with halogen-
containing flame retardants since it enables delivery of halogen atoms in the gas phase and
extends the residence of the halogens in the flame to scavenge more radicals[89]
.
Figure 2. 2 Cyclic reaction of the halogenated flame retardants in the flame of
polymers. (X=Cl or Br).
Literature review
20
Iodinated organics, which should have the best flame retardant effect, normally have
very low thermal stability and cannot be processed with most commercial polymers.
In addition, the much higher price of fluorine and iodine comparing with that of
chlorine and bromine also prevents the development of flame retardant based on those.
Besides the chemical mechanism, it is also believed that the large heat capacity of
hydrogen halides and their dilution of the flame results in a decrease in the mass
concentration of combustible gases and the temperature of the flame.
For both chlorinated and brominated flame retardants, the aliphatic and cycloaliphatic
products are more efficient than the aromatic ones. Besides flame retardancy, the
brominated products can also grant a good balance of physical properties, such as good
impact and tensile strength and a high heat distortion temperature[93]
.
However, many health and environmental problems were induced by the application
of halogenated flame retardant. Exposure to halogenated flame retardant has been associated
with and/or causally related to numerous health effects in animals and humans, including
endocrine disruption, immune toxicity, reproductive toxicity, effects on fetal/child
development, and cancer[94-96]
. Consequently, most of the developments of new flame
retardants have shifted strongly toward halogen-free systems.
2.5.2.2. Phosphorus-based flame retardants.
Phosphorus-based flame retardants are the second most commonly used flame
retardants. Generally, phosphorus flame retardants are extremely effective in oxygen- or
nitrogen- containing polymers. Since normally the phosphorus flame retardants may
contribute in the charring and react with polymer in the condense-phase, they act more
specifically to chosen polymers than the halogen-based products.
Applied in the polymers with hydroxyl groups, phosphorus flame retardants, in the
form of either acids or esters, react with the hydroxyl groups (phosphorylation) and then
converted to a significant amount of char at the expense of combustible volatile products[97]
.
Some nitrogen-containing compounds, like urea, melamine, may be applied together with
the phosphorus-based flame retardants because of their accelerating effect to the
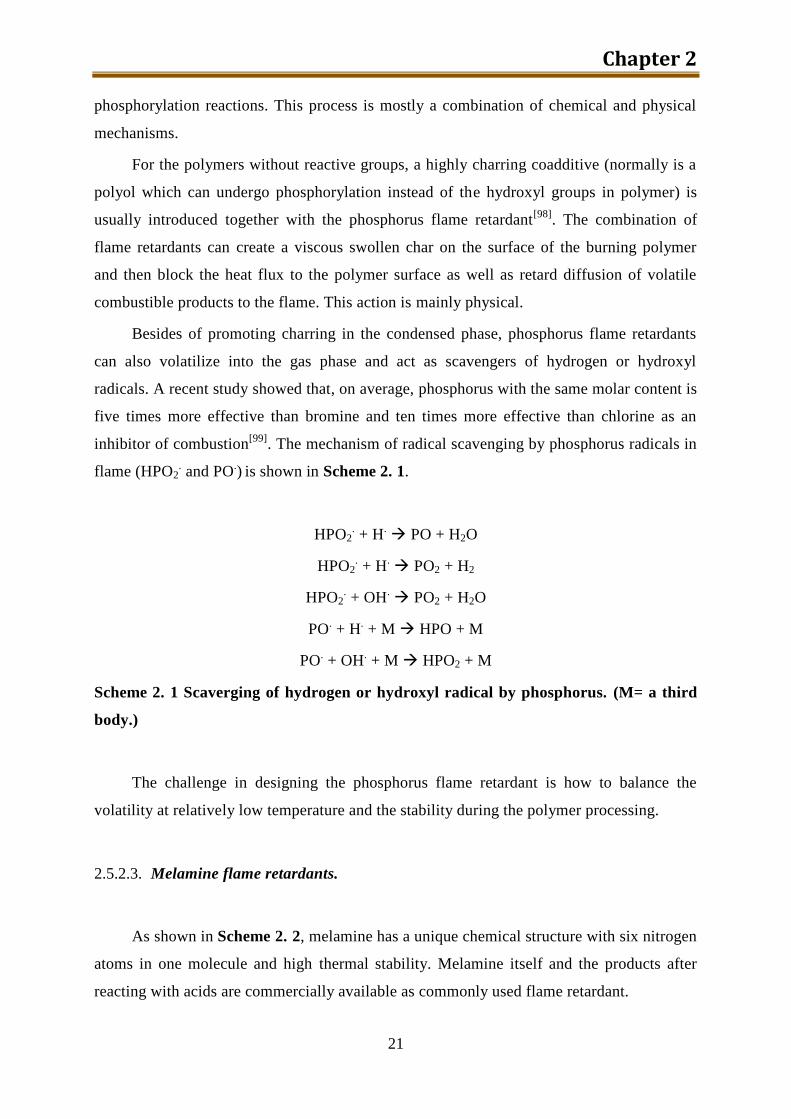
Chapter 2
21
phosphorylation reactions. This process is mostly a combination of chemical and physical
mechanisms.
For the polymers without reactive groups, a highly charring coadditive (normally is a
polyol which can undergo phosphorylation instead of the hydroxyl groups in polymer) is
usually introduced together with the phosphorus flame retardant[98]
. The combination of
flame retardants can create a viscous swollen char on the surface of the burning polymer
and then block the heat flux to the polymer surface as well as retard diffusion of volatile
combustible products to the flame. This action is mainly physical.
Besides of promoting charring in the condensed phase, phosphorus flame retardants
can also volatilize into the gas phase and act as scavengers of hydrogen or hydroxyl
radicals. A recent study showed that, on average, phosphorus with the same molar content is
five times more effective than bromine and ten times more effective than chlorine as an
inhibitor of combustion[99]
. The mechanism of radical scavenging by phosphorus radicals in
flame (HPO2. and PO
.) is shown in Scheme 2. 1.
HPO2. + H
. PO + H2O
HPO2. + H
. PO2 + H2
HPO2. + OH
. PO2 + H2O
PO. + H
. + M HPO + M
PO. + OH
. + M HPO2 + M
Scheme 2. 1 Scaverging of hydrogen or hydroxyl radical by phosphorus. (M= a third
body.)
The challenge in designing the phosphorus flame retardant is how to balance the
volatility at relatively low temperature and the stability during the polymer processing.
2.5.2.3. Melamine flame retardants.
As shown in Scheme 2. 2, melamine has a unique chemical structure with six nitrogen
atoms in one molecule and high thermal stability. Melamine itself and the products after
reacting with acids are commercially available as commonly used flame retardant.
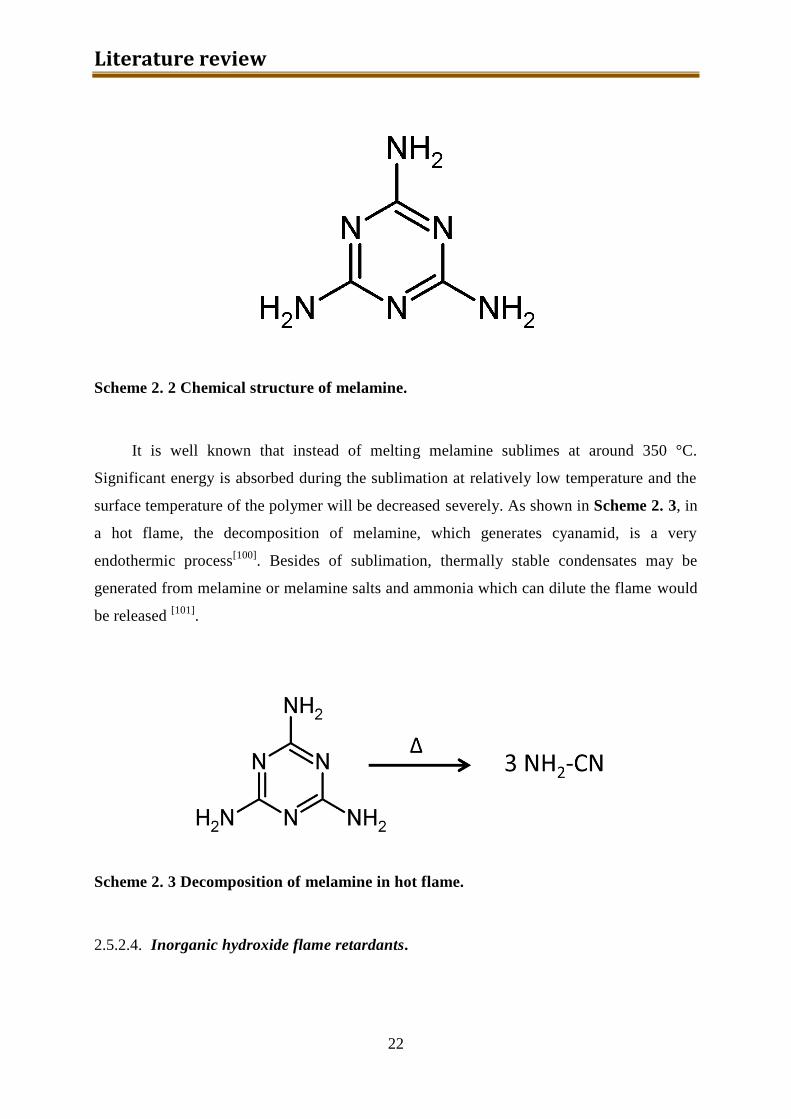
Literature review
22
Scheme 2. 2 Chemical structure of melamine.
It is well known that instead of melting melamine sublimes at around 350 °C.
Significant energy is absorbed during the sublimation at relatively low temperature and the
surface temperature of the polymer will be decreased severely. As shown in Scheme 2. 3, in
a hot flame, the decomposition of melamine, which generates cyanamid, is a very
endothermic process[100]
. Besides of sublimation, thermally stable condensates may be
generated from melamine or melamine salts and ammonia which can dilute the flame would
be released [101]
.
Scheme 2. 3 Decomposition of melamine in hot flame.
2.5.2.4. Inorganic hydroxide flame retardants.
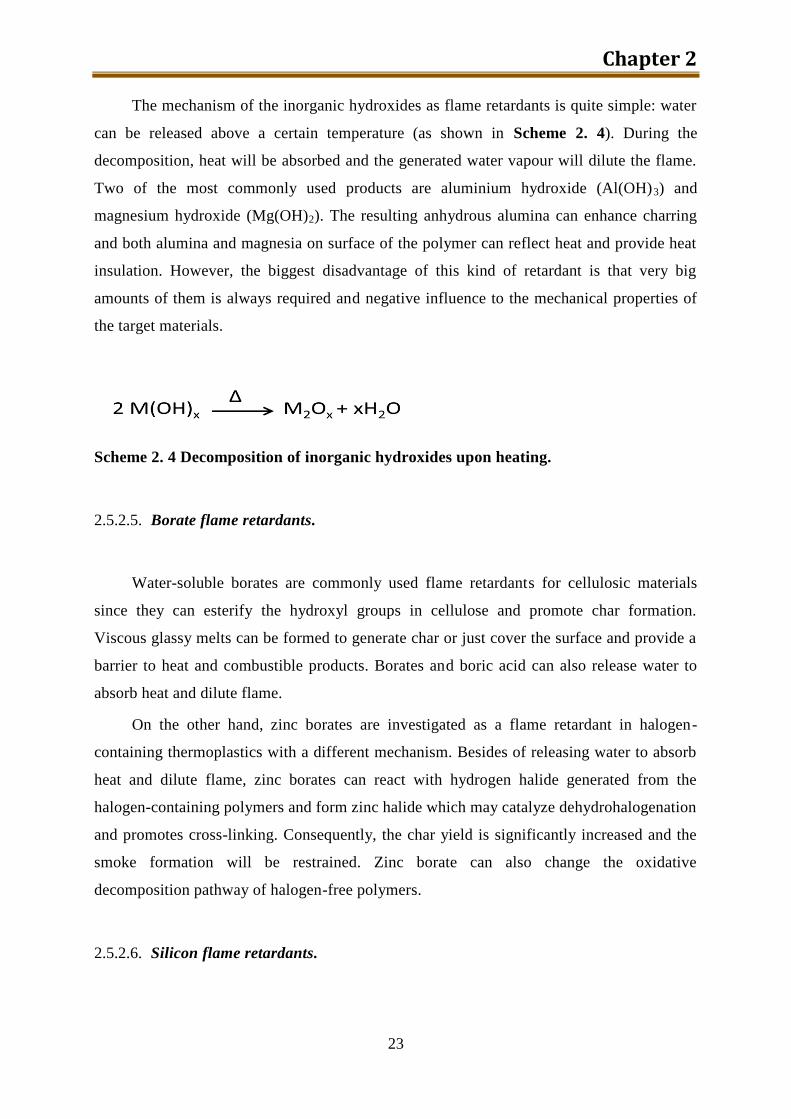
Chapter 2
23
The mechanism of the inorganic hydroxides as flame retardants is quite simple: water
can be released above a certain temperature (as shown in Scheme 2. 4). During the
decomposition, heat will be absorbed and the generated water vapour will dilute the flame.
Two of the most commonly used products are aluminium hydroxide (Al(OH)3) and
magnesium hydroxide (Mg(OH)2). The resulting anhydrous alumina can enhance charring
and both alumina and magnesia on surface of the polymer can reflect heat and provide heat
insulation. However, the biggest disadvantage of this kind of retardant is that very big
amounts of them is always required and negative influence to the mechanical properties of
the target materials.
Scheme 2. 4 Decomposition of inorganic hydroxides upon heating.
2.5.2.5. Borate flame retardants.
Water-soluble borates are commonly used flame retardants for cellulosic materials
since they can esterify the hydroxyl groups in cellulose and promote char formation.
Viscous glassy melts can be formed to generate char or just cover the surface and provide a
barrier to heat and combustible products. Borates and boric acid can also release water to
absorb heat and dilute flame.
On the other hand, zinc borates are investigated as a flame retardant in halogen-
containing thermoplastics with a different mechanism. Besides of releasing water to absorb
heat and dilute flame, zinc borates can react with hydrogen halide generated from the
halogen-containing polymers and form zinc halide which may catalyze dehydrohalogenation
and promotes cross-linking. Consequently, the char yield is significantly increased and the
smoke formation will be restrained. Zinc borate can also change the oxidative
decomposition pathway of halogen-free polymers.
2.5.2.6. Silicon flame retardants.
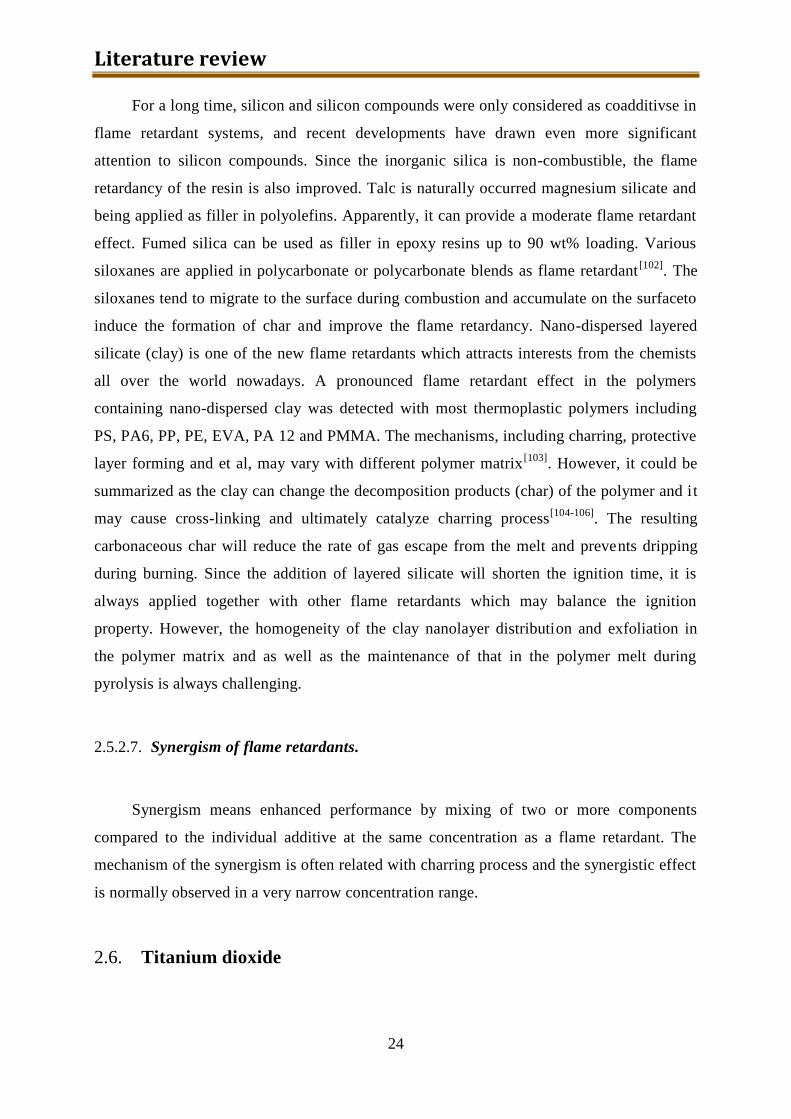
Literature review
24
For a long time, silicon and silicon compounds were only considered as coadditivse in
flame retardant systems, and recent developments have drawn even more significant
attention to silicon compounds. Since the inorganic silica is non-combustible, the flame
retardancy of the resin is also improved. Talc is naturally occurred magnesium silicate and
being applied as filler in polyolefins. Apparently, it can provide a moderate flame retardant
effect. Fumed silica can be used as filler in epoxy resins up to 90 wt% loading. Various
siloxanes are applied in polycarbonate or polycarbonate blends as flame retardant[102]
. The
siloxanes tend to migrate to the surface during combustion and accumulate on the surfaceto
induce the formation of char and improve the flame retardancy. Nano-dispersed layered
silicate (clay) is one of the new flame retardants which attracts interests from the chemists
all over the world nowadays. A pronounced flame retardant effect in the polymers
containing nano-dispersed clay was detected with most thermoplastic polymers including
PS, PA6, PP, PE, EVA, PA 12 and PMMA. The mechanisms, including charring, protective
layer forming and et al, may vary with different polymer matrix[103]
. However, it could be
summarized as the clay can change the decomposition products (char) of the polymer and it
may cause cross-linking and ultimately catalyze charring process[104-106]
. The resulting
carbonaceous char will reduce the rate of gas escape from the melt and prevents dripping
during burning. Since the addition of layered silicate will shorten the ignition time, it is
always applied together with other flame retardants which may balance the ignition
property. However, the homogeneity of the clay nanolayer distribution and exfoliation in
the polymer matrix and as well as the maintenance of that in the polymer melt during
pyrolysis is always challenging.
2.5.2.7. Synergism of flame retardants.
Synergism means enhanced performance by mixing of two or more components
compared to the individual additive at the same concentration as a flame retardant. The
mechanism of the synergism is often related with charring process and the synergistic effect
is normally observed in a very narrow concentration range.
2.6. Titanium dioxide

Chapter 2
25
In my 4 years’ study, one precursor of titanium dioxide was prepared via a water-free
sol-gel method, which is similar to the preparation of PEOS.
Titanium dioxide is the naturally occurring oxide of titanium as well-know minerals
rutile, anatase and brookite and additionally as two high pressure forms[107]
. The most
common form is rutile, which is also stable phase at all temperature and at normal pressures.
It has a broad range of applications, from paint to sunscreen to photocatalyst.
2.6.1. Application of titanium dioxide
Pigment. From ancient time, because of its brightness and very high refractive index,
titanium dioxide was widely used as a white pigment which is called titanium white
nowadays. When being applied as a film, its refractive index and color makes it an excellent
reflective optical coating. Also it is an effective opacifier in powder form, where it is
employed as a pigment to provide whiteness and opacity to products such as paints, coating,
plastics, papers, inks, foods, medicines as well as almost all the toothpastes.
Sunscreen / UV filter. Titanium dioxide has been used as sunscreens for many years
because of its ability to filter UVA as well as UVB radiation, giving wide protection than
other sunscreening products. As we have mentioned, titanium dioxide has a visible white
color, however, by reducing the particle size to nano scale, it will become invisible on the
skin but still retain the sunscreening properties. Since 1990, nano sized titanium dioxide
particles have been used as sunscreens, and then further as UV filter in plastics and
clothing.
Photocatalyst. Starting in the 1960s, people started to focus on the
photoelectrochemical solar energy conversion effect of titanium dioxide and then shifted into
the area of environmental photocatalysis, including the self-cleaning surfaces, and most
recently into the area of photo-induced hydrophilicity, which involves not only self-cleaning
surfaces, but also antifogging ones.
The possibility of solar photoelectrolysis was demonstrated for the first time by A.
Fujishima with a system in which an n-type titanium dioxide semiconductor electrode,
which was connected through an electrical load to a platinum black counter electrode, was
Literature review
26
exposed to near-UV light[108]
. Both the oxidation reaction at the titanium dioxide electrode
and the reduction reaction at the Pt electrode were observed, and this fact proved that water
could be decomposed using UV-VIS light into oxygen and hydrogen without application of
external energy.
During the semiconductor photoelectrochemistry, it turned out that titanium dioxide is
excellent for photocatalytically breaking down organic compounds. When catalytically
active titanium dioxide powder is put into a shallow pool of polluted water and expose it
under sunlight, the water will gradually become purified. Then extensive global efforts in
the field of environmental purification were carried out since 1977[109-113]
.
Titanium dioxide photocatalysts can also be used to kill bacteria and, therefore, self-
sterilizing surfaces can be prepared[114, 115]
. One experiment involves palcing 150 μl of an
E.coli suspension, containing 3×10⁴ cells on an illuminated titanium dioxide coated glass
plate. No cells survived after only 1 h of illumination [114]
.
Cancer treatment is one of the most popular topics associated with photocatalysis. In
1980s, the strong oxidizing power of illuminated titanium dioxide was firstly applied to kill
tumor cells[116]
. Then after a series of studies with various experimental conditions, it was
found possible to selectively kill a single cancer cell using a polarized, illuminated titanium
dioxide microelectrode[117, 118]
.
Besides photocatalytic effect, another photo-induced phenomenon of titanium dioxide
is high wettability (superhydrophilicity), which is recently being studied. It was found that,
if a titanium dioxide film is prepared with a certain amount of silica, it acquires
superhydrophilic properties after UV illumination. In this case, after electrons and holes are
produced, the holes oxidize the O2-
anions and vacancies are created after the ejection of
oxygen atoms. Water molecules can occupy those vacancies and make the surface
hydrophilic. The mechanism is shown in Scheme 2. 5. This property of titanium dioxide
coatings are widely applied in the self-cleaning surface, anti-fogging or anti-beading
windows and mirrors.
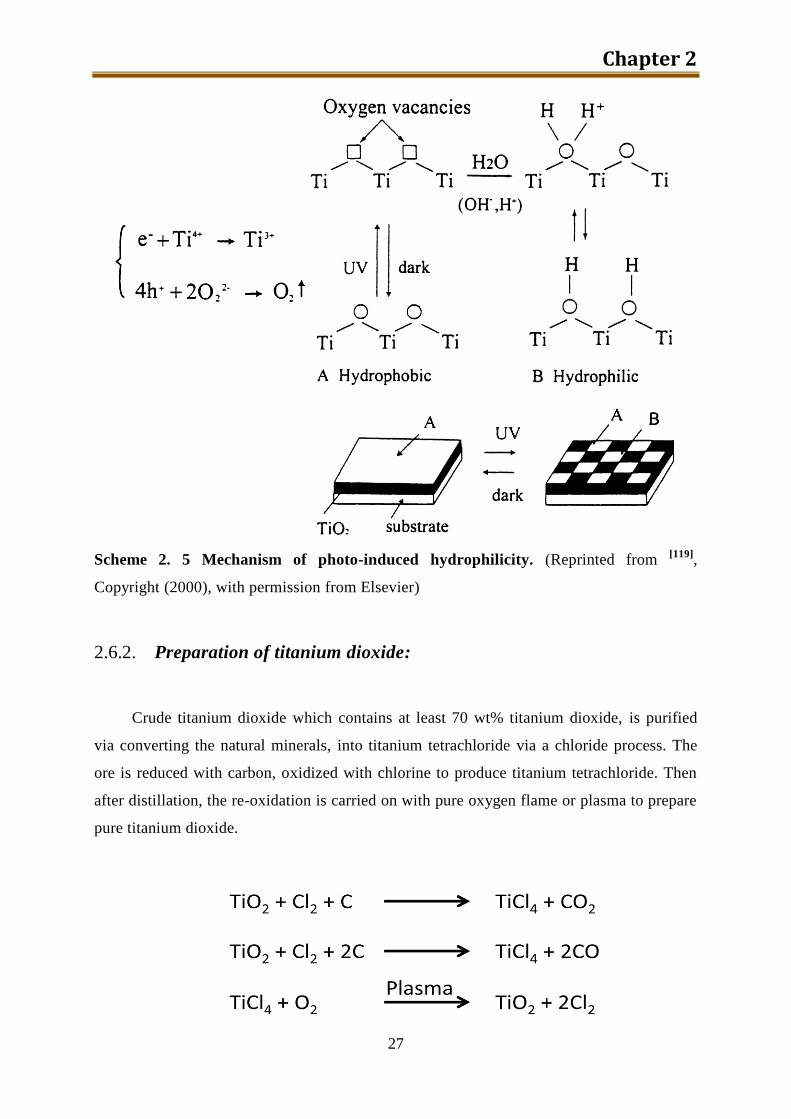
Chapter 2
27
Scheme 2. 5 Mechanism of photo-induced hydrophilicity. (Reprinted from [119]
,
Copyright (2000), with permission from Elsevier)
2.6.2. Preparation of titanium dioxide:
Crude titanium dioxide which contains at least 70 wt% titanium dioxide, is purified
via converting the natural minerals, into titanium tetrachloride via a chloride process. The
ore is reduced with carbon, oxidized with chlorine to produce titanium tetrachloride. Then
after distillation, the re-oxidation is carried on with pure oxygen flame or plasma to prepare
pure titanium dioxide.
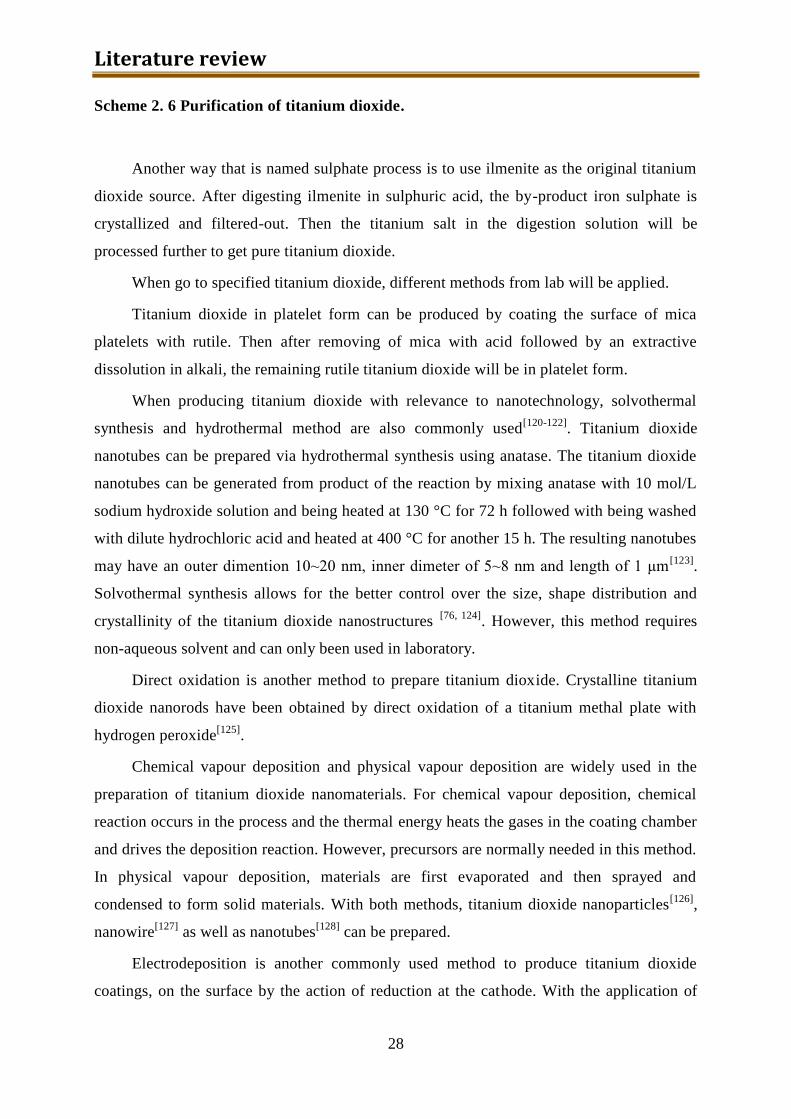
Literature review
28
Scheme 2. 6 Purification of titanium dioxide.
Another way that is named sulphate process is to use ilmenite as the original titanium
dioxide source. After digesting ilmenite in sulphuric acid, the by-product iron sulphate is
crystallized and filtered-out. Then the titanium salt in the digestion solution will be
processed further to get pure titanium dioxide.
When go to specified titanium dioxide, different methods from lab will be applied.
Titanium dioxide in platelet form can be produced by coating the surface of mica
platelets with rutile. Then after removing of mica with acid followed by an extractive
dissolution in alkali, the remaining rutile titanium dioxide will be in platelet form.
When producing titanium dioxide with relevance to nanotechnology, solvothermal
synthesis and hydrothermal method are also commonly used[120-122]
. Titanium dioxide
nanotubes can be prepared via hydrothermal synthesis using anatase. The titanium dioxide
nanotubes can be generated from product of the reaction by mixing anatase with 10 mol/L
sodium hydroxide solution and being heated at 130 °C for 72 h followed with being washed
with dilute hydrochloric acid and heated at 400 °C for another 15 h. The resulting nanotubes
may have an outer dimention 10~20 nm, inner dimeter of 5~8 nm and length of 1 μm[123]
.
Solvothermal synthesis allows for the better control over the size, shape distribution and
crystallinity of the titanium dioxide nanostructures [76, 124]
. However, this method requires
non-aqueous solvent and can only been used in laboratory.
Direct oxidation is another method to prepare titanium dioxide. Crystalline titanium
dioxide nanorods have been obtained by direct oxidation of a titanium methal plate with
hydrogen peroxide[125]
.
Chemical vapour deposition and physical vapour deposition are widely used in the
preparation of titanium dioxide nanomaterials. For chemical vapour deposition, chemical
reaction occurs in the process and the thermal energy heats the gases in the coating chamber
and drives the deposition reaction. However, precursors are normally needed in this method.
In physical vapour deposition, materials are first evaporated and then sprayed and
condensed to form solid materials. With both methods, titanium dioxide nanoparticles[126]
,
nanowire[127]
as well as nanotubes[128]
can be prepared.
Electrodeposition is another commonly used method to produce titanium dioxide
coatings, on the surface by the action of reduction at the cathode. With the application of
Chapter 2
29
anodic alumina membrane (AAM) as template, titanium dioxide nanowires can be obtained
by electrodeposition[129]
.
Among all those methods, sol-gel method is the most popular methods nowadays in
the preparation of titanium dioxide nanoscale materials. The sol-gel processing has low
temperature chemical method used for production of inorganic oxide materials[130, 131]
. In a
typical sol-gel process, a colloidal suspension (a sol) is formed during hydrolysis and
polymerization reactions of the precursors, which are usually inorganic metal salts or metal
organic compounds such as metal alkoxides. With completion of polymerization and loss of
solvent, the transition from liquid sol into solid gel phase is finished. It may be used to
produce single or multi-component oxides as crystalline or amorphous form. It can give
bulk materials as well as thin film coatings by spin-coating of dip-coating. Titanium dioxide
nanomaterials have been synthesized with the sol-gel method form hydrolysis of a titanium
precursor[132, 133]
. This process commonly can be described as the hydrolysis of titanium(IV)
alkoxide under the catalysis of acid. Highly crystalline anatase titanium dioxide
nanoparticles with different dimensions and shapes could be obtained with the self-
condensation of titanium alkoxide in the presence of tetramethylammonium hydroxide[132]
.
Solutions, precursor’s combination, pH of the mixture and temperature of the whole process
could be varied to obtain titanium dioxide nanoparticles’ morphology. Combining with
AAM, titanium dioxide nanorods can also be produced.
Ultrasonic or microwave may be used to provide the energy for the preparation of
titanium dioxide and those two new methods were named as sonochemical[134, 135]
and
microwave[136]
methods which might be applied aligned with other methods.
Reference:
[1]. Ionescu, E., Kleebe, H.-J., and Riedel, R., Chemical Society Reviews. 41(15): p.
5032-5052.
[2]. Heremans, J.P., et al., Science, 2008. 321(5888): p. 554-557.
[3]. Bell, L.E., Science, 2008. 321(5895): p. 1457-1461.
[4]. Harman, T.C., et al., Science, 2002. 297(5590): p. 2229-2232.
[5]. DiSalvo, F.J., Science, 1999. 285(5428): p. 703-706.
[6]. Boukai, A.I., et al., Nature, 2008. 451(7175): p. 168-171.
Literature review
30
[7]. Majumdar, A., Science, 2004. 303(5659): p. 777-778.
[8]. Chung, D.Y., et al., Science, 2000. 287(5455): p. 1024-1027.
[9]. Roy, R., Komarneni, S., and Roy, D.M., eds. Multi-phasic Ceramic Composites
Made by Sol-Gel Technique. Better Ceramics Through Chemistry, ed. Brinker, C.J.,
Clark, D.E., and Ulrich, D.R. Vol. 32. 1984, Elsevier: New York. 347-359.
[10]. Komarneni, S., Journal of Materials Chemistry, 1992. 2(12): p. 1219-1230.
[11]. Gleiter, H., Progress in Materials Science, 1989. 33(4): p. 223-315.
[12]. Talreja, R., Polymer Matrix Composites, ed. Manson, J.A.E. 2002, Oxford:
Elsevier Science Ltd.
[13]. Gerard, J.F., ed. Fillers and Filled Polymers. Vol. 169. 2001, Wiley-VCH:
Weinheim.
[14]. Mittal, V., Materials, 2009. 2(3): p. 992-1057.
[15]. Daniel, M.C. and Astruc, D., Chemical Reviews, 2004. 104(1): p. 293-346.
[16]. Burda, C., et al., Chemical Reviews, 2005. 105(4): p. 1025-1102.
[17]. Murphy, C.J., et al., Journal of Physical Chemistry B, 2005. 109(29): p. 13857-
13870.
[18]. Grzelczak, M., et al., Chemical Society Reviews, 2008. 37(9): p. 1783-1791.
[19]. Sau, T.K., et al., Advanced Materials, 2010. 22(16): p. 1805-1825.
[20]. Alexandre, M. and Dubois, P., Materials Science & Engineering R-Reports,
2000. 28(1-2): p. 1-63.
[21]. Theng, B.K.G., The Chemistry of Clay-Organic Reactions. 1974, New York:
Wiley.
[22]. Ogawa, M. and Kuroda, K., Bulletin of the Chemical Society of Japan, 1997.
70(11): p. 2593-2618.
[23]. Kojima, Y., et al., Journal of Materials Research, 1993. 8(5): p. 1185-1189.
[24]. Shantalii, T.A., et al., Polymers for Advanced Technologies, 2005. 16(5): p. 400-
404.
[25]. Kioul, A. and Mascia, L., Journal of Non-Crystalline Solids, 1994. 175(2-3): p.
169-186.
[26]. Kim, Y., et al., Polymer International, 1997. 43(2): p. 129-136.
[27]. Shang, X.Y., et al., Chemistry of Materials, 2002. 14(1): p. 71-77.
Chapter 2
31
[28]. Mascia, L. and Kioul, A., Polymer, 1995. 36(19): p. 3649-3659.
[29]. Mizutani, Y. and Nago, S., Journal of Applied Polymer Science, 1999. 72(11): p.
1489-1494.
[30]. Sun, D.H., et al., Macromolecules, 2005. 38(13): p. 5617-5624.
[31]. Zhang, A.-Q., et al., Acta Physico-Chimica Sinica, 2010. 26(3): p. 643-648.
[32]. Jain, S., Goossens, J.G.P., and van Duin, M., Macromolecular Symposia, 2006.
233: p. 225-234.
[33]. Jain, S., et al., Polymer, 2005. 46(17): p. 6666-6681.
[34]. Jain, S., et al., Polymer, 2005. 46(20): p. 8805-8818.
[35]. Abe, Y., et al., Journal of Polymer Science Part A: Polymer Chemistry, 2003.
41(14): p. 2250-2255.
[36]. Bounor-Legare, V., et al., Polymer, 2004. 45(5): p. 1485-1493.
[37]. Phe, B.H., et al., Journal of Sol-Gel Science and Technology, 2004. 31(1-3): p.
47-50.
[38]. Bahloul, W., et al., Journal of Polymer Science Part B-Polymer Physics, 2010.
48(11): p. 1213-1222.
[39]. Bahloul, W., et al., Aiche Journal, 2011. 57(8): p. 2174-2184.
[40]. Scott, D.W., Journal of the American Chemical Society, 1946. 68(3): p. 356-358.
[41]. Haddad, T.S. and Lichtenhan, J.D., Macromolecules, 1996. 29(22): p. 7302-
7304.
[42]. Romo-Uribe, A., et al., Journal of Polymer Science Part B-Polymer Physics,
1998. 36(11): p. 1857-1872.
[43]. Carroll, J.B., et al., Macromolecules, 2003. 36(17): p. 6289-6291.
[44]. Sellinger, A. and Laine, R.M., Macromolecules, 1996. 29(6): p. 2327-2330.
[45]. Costa, R.O.R., et al., Macromolecules, 2001. 34(16): p. 5398-5407.
[46]. Santoso, S., et al., Nano Letters, 2002. 2(7): p. 687-691.
[47]. Tegou, E., et al., Microelectronic Engineering, 2004. 73-4: p. 238-243.
[48]. Tsuchida, A., et al., Macromolecules, 1997. 30(10): p. 2818-2824.
[49]. Rong, M.Z., et al., Polymer, 2001. 42(1): p. 167-183.
[50]. Waddon, A.J., et al., Nano Letters, 2002. 2(10): p. 1149-1155.
[51]. Lee, A. and Lichtenhan, J.D., Macromolecules, 1998. 31(15): p. 4970-4974.
Literature review
32
[52]. Al-Malaika, S., Golovoy, A., and Wilkie, C.A., eds. Specialty Polymer Additives:
Principles and Application. Is there a correlation between crosslinking and thermal
stability?, ed. Wilkie, C.A., Levchik, S.V., and Levchik, G.F. 2001, Blackwell Science:
Oxford. 359-374.
[53]. Ramirez, C., et al., Journal of Thermal Analysis and Calorimetry, 2003. 72(2):
p. 421-429.
[54]. Fu, B.X., et al., Polymer, 2003. 44(5): p. 1499-1506.
[55]. Kato, M., Usuki, A., and Okada, A., Journal of Applied Polymer Science, 1997.
66(9): p. 1781-1785.
[56]. Kawasumi, M., et al., Macromolecules, 1997. 30(20): p. 6333-6338.
[57]. Fu, B.X., et al., Journal of Polymer Science Part B-Polymer Physics, 2001.
39(22): p. 2727-2739.
[58]. Joshi, M. and Butola, B.S., Polymer, 2004. 45(14): p. 4953-4968.
[59]. Abe, Y., Sekiguchi, T., and Misono, T., Journal of Polymer Science Part a-
Polymer Chemistry, 1984. 22(3): p. 761-767.
[60]. Abe, Y., Nagao, Y., and Misono, T., Yogyo-Kyokai-Shi, 1986. 94(11): p. 1169-
1173.
[61]. Abe, Y., et al., Yogyo-Kyokai-Shi, 1987. 95(7): p. 672-675.
[62]. Belot, V., et al., Journal of Non-Crystalline Solids, 1992. 144(2-3): p. 287-297.
[63]. Hurwitz, F.I., et al., Ultrastructure processing of advanced ceramics, ed.
Mackenzie, J.D. and Ulrich, D.R. 1988, New York: Wiley/Interscience.
[64]. Mackenzie, J.D., Chung, Y.J., and Hu, Y., Journal of Non-Crystalline Solids,
1992. 147: p. 271-279.
[65]. Babonneau, F., Bois, L., and Livage, J., Journal of Non-Crystalline Solids, 1992.
147: p. 280-284.
[66]. Streller, R.C., et al., Macromolecular Materials and Engineering, 2008. 293(3):
p. 218-227.
[67]. Mittal, V., Journal of Thermoplastic Composite Materials, 2007. 20(6): p. 575-
599.
[68]. Yuan, Q., et al., Journal of Thermoplastic Composite Materials, 2008. 21(3): p.
195-208.
Chapter 2
33
[69]. Liu, X.H., et al., Polymer, 2001. 42(19): p. 8235-8239.
[70]. Nejad, S.J., et al., E-Polymers, 2007.
[71]. Vukhanh, T. and Fisa, B., Polymer Composites, 1986. 7(5): p. 375-382.
[72]. Garcia, M., et al., Reviews on Advanced Materials Science, 2004. 6(2): p. 169-
175.
[73]. Rong, M.Z., et al., Journal of Materials Science Letters, 2000. 19(13): p. 1159-
1161.
[74]. Ikeda, Y. and Kohjiya, S., Polymer, 1997. 38(17): p. 4417-4423.
[75]. Ward, A.A.M., et al., Macromolecular Materials and Engineering, 2003.
288(12): p. 971-979.
[76]. Bikiaris, D.N., et al., Journal of Applied Polymer Science, 2006. 100(4): p. 2684-
2696.
[77]. Bikiaris, D.N., et al., European Polymer Journal, 2005. 41(9): p. 1965-1978.
[78]. Fukushima, Y., et al., Clay Mineral, 1988. 23: p. 27-34.
[79]. Usuki, A., et al., Journal of Materials Research, 1993. 8(5): p. 1179-1184.
[80]. Usuki, A., et al., Journal of Materials Research, 1993. 8(5): p. 1174-1178.
[81]. Akelah, A. and Moet, A., Journal of Materials Science, 1996. 31(13): p. 3589-
3596.
[82]. Tudor, J., et al., Chemical Communications, 1996(17): p. 2031-2032.
[83]. Vaia, R.A. and Giannelis, E.P., Macromolecules, 1997. 30(25): p. 7990-7999.
[84]. Kato, M., Usuki, A., and Okada, A., Journal of Applied Polymer Science, 1997.
66(9): p. 1781-1785.
[85]. Hasegawa, N., et al., Journal of Applied Polymer Science, 1998. 67(1): p. 87-92.
[86]. Kawasumi, M., et al., Macromolecules, 1997. 30(20): p. 6333-6338.
[87]. Wolf, D., et al. Nanocomposites of polyolefin clay hybrids. in Proceedings of the
Eurofiller'99, 1999. Lyon-Villeurbanne.
[88]. Irvine, D.J., McCluskey, J.A., and Robinson, I.M., Polymer Degradation and
Stability, 2000. 67(3): p. 383-396.
[89]. Aseeva, R.M. and Zaikov, G.E., Combustion of Polymer Materials. 1986,
Munich: Carl Hanser Verlag. 149.
[90]. Vankrevelen, D.W., Polymer, 1975. 16(8): p. 615-620.
Literature review
34
[91]. Grand, A.F. and Wilkie, C.A., eds. Fire Retardancy of polymeric materials. Char
formation, ed. Levchik, S. and Wilkie, C.A. 2000, Marcel Dekker: New York. 27-79.
[92]. Troitzsch, A., Kunststoffe-Plast Europe, 2002. 92(9): p. 18-20.
[93]. Litzenburger, A., Polymers & Polymer Composites, 2000. 8(8): p. 581-592.
[94]. Shaw, S.D. and Kannan, K., Reviews on Environmental Health, 2009. 24(3): p.
157-229.
[95]. Birnbaum, L.S. and Staskal, D.F., Environmental Health Perspectives, 2004.
112(1): p. 9-17.
[96]. Costa, L.G. and Giordano, G., Neurotoxicology, 2007. 28(6): p. 1047-1067.
[97]. Kandola, B.K., et al., Journal of Macromolecular Science-Reviews in
Macromolecular Chemistry and Physics, 1996. C36(4): p. 721-794.
[98]. Bourbigot, S., et al., Macromolecular Materials and Engineering, 2004. 289(6):
p. 499-511.
[99]. Babushok, V. and Tsang, W., Combustion and Flame, 2000. 123(4): p. 488-506.
[100]. Weil, E.D. and Choudhary, V., Journal of Fire Sciences, 1995. 13(2): p. 104-
126.
[101]. Bann, B. and Miller, S.A., Chemical Reviews, 1958. 58(1): p. 131-172.
[102]. Masatoshi, I. and Serizawa, S., Polymers for Advanced Technologies, 1998.
9(10-11): p. 593-600.
[103]. Zanetti, M., Flammability and thermal stability of polymer/layered silicate
nanocomposites, in Polymer nanocomposites, Mai, Y.W. and Yu, Z.Z., Editors. 2006,
Woodhead Publishing Limited. p. 256-272.
[104]. Laachachi, A., et al., Polymer Degradation and Stability, 2005. 89(2): p. 344-
352.
[105]. Kashiwagi, T., et al., Polymer, 2004. 45(3): p. 881-891.
[106]. Gilman, J.W., Kashiwagi, T., and Lichtenhan, J.D., Sampe Journal, 1997.
33(4): p. 40-46.
[107]. Jamieson, J.C., et al., American Mineralogist, 1969. 54(9-10): p. 1477-&.
[108]. Fujishima, A., Kohayakawa, K., and Honda, K., Journal of the
Electrochemical Society, 1975. 122(11): p. 1487-1489.
[109]. Heller, A., Accounts of Chemical Research, 1981. 14(5): p. 154-162.
Chapter 2
35
[110]. Nozik, A.J. and Memming, R., Journal of Physical Chemistry, 1996. 100(31):
p. 13061-13078.
[111]. Watanabe, T., Fujishima, A., and Honda, K., Bulletin of the Chemical Society
of Japan, 1976. 49(2): p. 355-358.
[112]. Wrighton, M.S., Accounts of Chemical Research, 1979. 12(9): p. 303-310.
[113]. Frank, S.N. and Bard, A.J., Journal of the American Chemical Society, 1977.
99(1): p. 303-304.
[114]. Kikuchi, Y., et al., Journal of Photochemistry and Photobiology a-Chemistry,
1997. 106(1-3): p. 51-56.
[115]. Sunada, K., et al., Environmental Science & Technology, 1998. 32(5): p. 726-
728.
[116]. Fujishima, A., et al., Photomedicine and Photobiology, 1986. 8: p. 45-46.
[117]. Cai, R., et al., Chemistry Letters, 1992(3): p. 427-430.
[118]. Sakai, H., et al., Chemistry Letters, 1995(3): p. 185-186.
[119]. Fujishima, A., Rao, N.T, and Tryk, D.A., Journal of Phochemistry and
Photobiology C: Photochemistry Reviews, 2000. 1(1): p. 1-21.
[120]. Cot, F., et al., Journal of the European Ceramic Society, 1998. 18(14): p. 2175-
2181.
[121]. Chae, S.Y., et al., Chemistry of Materials, 2003. 15(17): p. 3326-3331.
[122]. Xie, R.-C. and Shang, J.K., Journal of Materials Science, 2007. 42(16): p. 6583-
6589.
[123]. Armstrong, G., et al., Chemical Communications, 2005(19): p. 2454-2456.
[124]. Xu, J., Ge, J.P., and Li, Y.D., Journal of Physical Chemistry B, 2006. 110(6): p.
2497-2501.
[125]. Wu, J.M., Journal of Crystal Growth, 2004. 269(2-4): p. 347-355.
[126]. Seifried, S., Winterer, M., and Hahn, H., Chemical Vapor Deposition, 2000.
6(5): p. 239-244.
[127]. Wu, J.M., Shih, H.C., and Wu, W.T., Chemical Physics Letters, 2005. 413(4-6):
p. 490-494.
[128]. Pradhan, S.K., et al., Journal of Crystal Growth, 2003. 256(1-2): p. 83-88.
Literature review
36
[129]. Lei, Y., Zhang, L.D., and Fan, J.C., Chemical Physics Letters, 2001. 338(4-6):
p. 231-236.
[130]. Schwarz, J.A., Contescu, C., and Contescu, A., Chemical Reviews, 1995. 95(3):
p. 477-510.
[131]. Pierre, A.C. and Pajonk, G.M., Chemical Reviews, 2002. 102(11): p. 4243-
4265.
[132]. Chemseddine, A. and Moritz, T., European Journal of Inorganic Chemistry,
1999(2): p. 235-245.
[133]. Bessekhouad, Y., Robert, D., and Weber, J.V., Journal of Photochemistry and
Photobiology a-Chemistry, 2003. 157(1): p. 47-53.
[134]. Jokanovic, V., Spasic, A.M., and Uskokovic, D., Journal of Colloid and
Interface Science, 2004. 278(2): p. 342-352.
[135]. Blesic, M.D., et al., Materials Letters, 2002. 54(4): p. 298-302.
[136]. Corradi, A.B., et al., Journal of the American Ceramic Society, 2005. 88(9): p.
2639-2641.
Chapter 3
37
3. PEOS and modified PEOS preparation.
Hyperbranched polymers are considered as a fast growing field in polymer science. In
comparison to their linear analogues, these polymers exhibit lower melt viscosities and
much higher solubility. Comparing with the multistep synthesis of uniformly branched
dendrimers, the preparation of hyperbranched polymers is more economical and suitable for
industry. Because of their unique properties, current research activities in the field of
hyperbranched polymers nowadays are broad.[1, 2]
The synthesis of hyperbranched polymers was first published by Flory[3]
as a special
type of polycondensation of ABx monomers, of which only the cross-coupling of A and B
functionalities is possible. This process has the typical features of a step growth reaction of
multifunctional monomers, however, without the danger of crosslinking. Prepared by this
method, the hyperbranched polymers bear a large number of unreacted B functions, but only
one A focal function unit. If a “core” molecule Bx is added, mainly for a better control over
the molar mass but also for a control of the resulting geometrical shape, no A function will
be present. [2, 4]
After that preparation of hyperbranched polymers from a combination of A2
and B3 monomers instead of the rarely-available ABx has been published,[5-8]
silicon-
containing hyperbranched polymers were also prepared by this means. [9-11]
However, these
reactions can hardly be controlled; hence it is difficult to obtain fully soluble or liquid
products of high molecular weight.
Silicon is a very important core element for the dendritic polymers due to the
versatility of organosilicon chemistry.[12-14]
Among all the silicon-containing polymers,
polyethoxysiloxanes (also called ethyl silicates) are of increasing technological interest as
processable precursors for silica.[15]
Typically, they are prepared via condensation of
tetraethoxysilane (TEOS) with water, and the products obtained contain silanol groups
which can undergo further condensation and then cause aging and changes in the properties
in storage.[16]
Additionally, because of the reaction mechanism the products show a very
broad molecular weight distribution and a high amount of volatile components. Previously,
Jaumann et al. have published a preparation method of hyperbranched polyethoxysiloxanes
(PEOS) from triethoxysilanol and acetoxytriethoxysilane AB3 monomer,[17]
and comparing
PEOS and modified PEOS preparation.
38
with the ethylsilicates synthesized via hydrolytic condensation of TEOS, the product
contains no hydroxyl groups and is stable upon long-term storage. Furthermore, due to the
mechanism of the synthesis, it is quite easy to incorporate modification to the precursor
(PEOS) as well as the final SiO2 after conversion by introducing different comonomer with
functional groups. Since the purification of AB3 monomers is quite complicated for
industrial production, another controlled one-pot process based on the catalysed-
condensation reaction of TEOS with acetic anhydride and with titanium (IV) ethoxide as
catalyst[18]
was developed. This process is more suitable for big-scale manufacture and
allows a distinct molar mass control of the product. Further modifications on the chemical
structure of PEOS were done based on this process or based on pure PEOS which will be
firstly discussed in this chapter below.
3.1. PEOS
The synthesis of PEOS is published before I started my research in DWI. However,
during my first year of my ph.D study, I have done some work about the preparation and
purification of PEOS. Therefore, this chapter will begin with a short introduction of the
preparation and some characterization of PEOS. All the characterizations were done by
previous authors and published in the previous paper[19]
. The copy right was obtained from
American Chemical Society.
3.1.1. Experimental
Materials. Tetraethoxysilane (TEOS, for synthesis, Merck), acetic anhydride (for
synthesis, Merck), and titanium (IV)ethoxide (Technical Grad, Aldrich) were used without
further purification.
Synthesis. TEOS and acetic anhydride were mixed together with titanium (IV)ethoxide
as a catalyst in a 2 L three-neck round-bottom flask equipped with a mechanical stirrer and a
30 cm dephlagmator connected with a distillation bridge. The equipment was protected by dry
nitrogen throughout the whole reaction. The mixture was heated in a 135 °C’s oil bath under
stirring. The resulting side-product ethyl acetate was continuously distilled off. After the
distillation stopped, the mixture was cooled to room temperature and dried in a vacuum of 10-
2 mbar for 5 h. A yellowish oily liquid was obtained.
To remove all of the volatile compounds in the PEOS, the product was put through a
thin-film evaporator (TFE, type S 51/31; Normag; Germany) equipped with a rotary vane
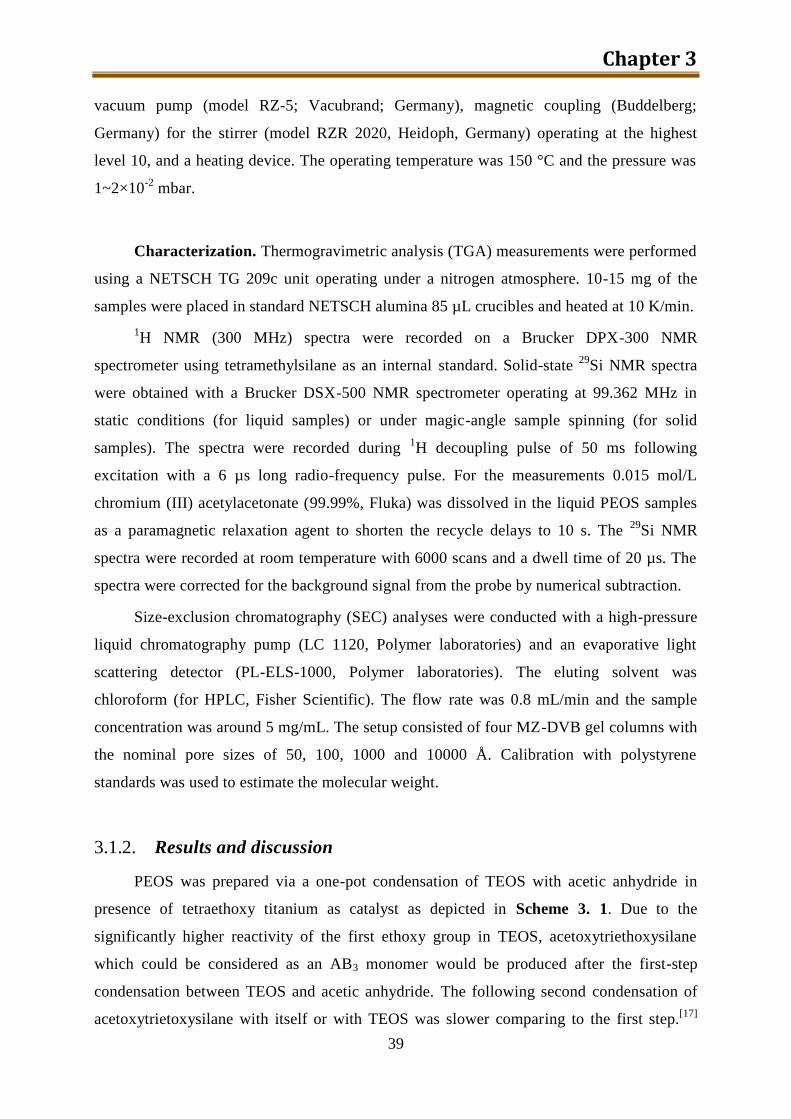
Chapter 3
39
vacuum pump (model RZ-5; Vacubrand; Germany), magnetic coupling (Buddelberg;
Germany) for the stirrer (model RZR 2020, Heidoph, Germany) operating at the highest
level 10, and a heating device. The operating temperature was 150 °C and the pressure was
1~2×10⁻²
mbar.
Characterization. Thermogravimetric analysis (TGA) measurements were performed
using a NETSCH TG 209c unit operating under a nitrogen atmosphere. 10-15 mg of the
samples were placed in standard NETSCH alumina 85 µL crucibles and heated at 10 K/min.
1H NMR (300 MHz) spectra were recorded on a Brucker DPX-300 NMR
spectrometer using tetramethylsilane as an internal standard. Solid-state 29
Si NMR spectra
were obtained with a Brucker DSX-500 NMR spectrometer operating at 99.362 MHz in
static conditions (for liquid samples) or under magic-angle sample spinning (for solid
samples). The spectra were recorded during 1H decoupling pulse of 50 ms following
excitation with a 6 µs long radio-frequency pulse. For the measurements 0.015 mol/L
chromium (III) acetylacetonate (99.99%, Fluka) was dissolved in the liquid PEOS samples
as a paramagnetic relaxation agent to shorten the recycle delays to 10 s. The 29
Si NMR
spectra were recorded at room temperature with 6000 scans and a dwell time of 20 µs. The
spectra were corrected for the background signal from the probe by numerical subtraction.
Size-exclusion chromatography (SEC) analyses were conducted with a high-pressure
liquid chromatography pump (LC 1120, Polymer laboratories) and an evaporative light
scattering detector (PL-ELS-1000, Polymer laboratories). The eluting solvent was
chloroform (for HPLC, Fisher Scientific). The flow rate was 0.8 mL/min and the sample
concentration was around 5 mg/mL. The setup consisted of four MZ-DVB gel columns with
the nominal pore sizes of 50, 100, 1000 and 10000 Å. Calibration with polystyrene
standards was used to estimate the molecular weight.
3.1.2. Results and discussion
PEOS was prepared via a one-pot condensation of TEOS with acetic anhydride in
presence of tetraethoxy titanium as catalyst as depicted in Scheme 3. 1. Due to the
significantly higher reactivity of the first ethoxy group in TEOS, acetoxytriethoxysilane
which could be considered as an AB3 monomer would be produced after the first-step
condensation between TEOS and acetic anhydride. The following second condensation of
acetoxytrietoxysilane with itself or with TEOS was slower comparing to the first step.[17]
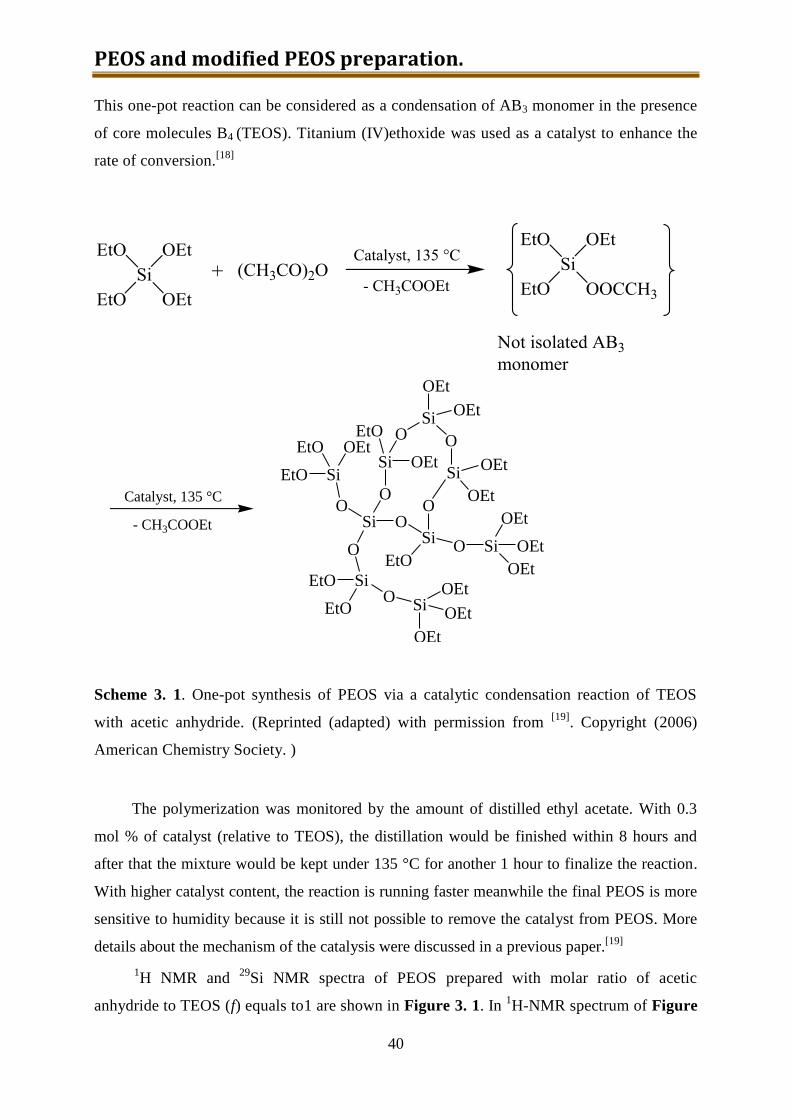
PEOS and modified PEOS preparation.
40
This one-pot reaction can be considered as a condensation of AB3 monomer in the presence
of core molecules B4 (TEOS). Titanium (IV)ethoxide was used as a catalyst to enhance the
rate of conversion.[18]
- CH3COOEt SiO
O
O
O
Si
SiSi
SiEtO
EtOO
EtO
O
O
EtO
EtO OEtOEt
OSi
OEt
OEt
O
Si
OEt
OEt
Si
OEt
OEt
OEt
SiOEt
OEt
OEt
Catalyst, 135 °C
EtO
Scheme 3. 1. One-pot synthesis of PEOS via a catalytic condensation reaction of TEOS
with acetic anhydride. (Reprinted (adapted) with permission from [19]
. Copyright (2006)
American Chemistry Society. )
The polymerization was monitored by the amount of distilled ethyl acetate. With 0.3
mol % of catalyst (relative to TEOS), the distillation would be finished within 8 hours and
after that the mixture would be kept under 135 °C for another 1 hour to finalize the reaction.
With higher catalyst content, the reaction is running faster meanwhile the final PEOS is more
sensitive to humidity because it is still not possible to remove the catalyst from PEOS. More
details about the mechanism of the catalysis were discussed in a previous paper.[19]
1H NMR and
29Si NMR spectra of PEOS prepared with molar ratio of acetic
anhydride to TEOS (f) equals to1 are shown in Figure 3. 1. In 1H-NMR spectrum of Figure
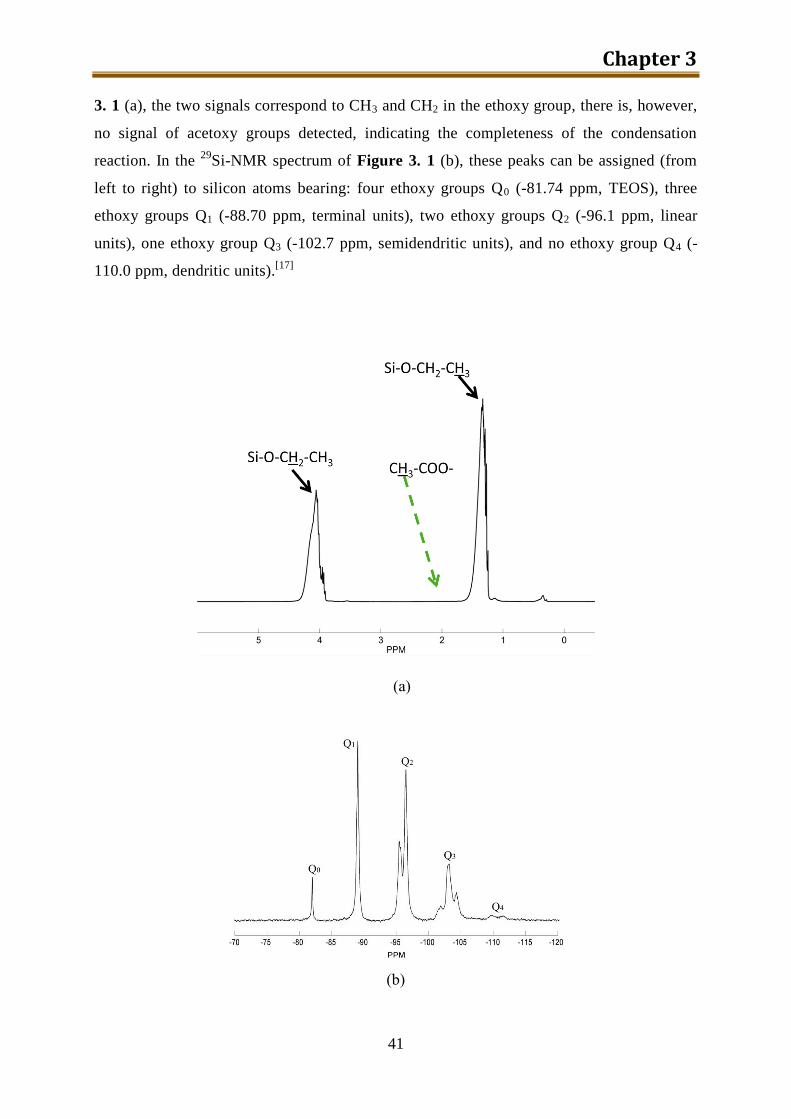
Chapter 3
41
3. 1 (a), the two signals correspond to CH3 and CH2 in the ethoxy group, there is, however,
no signal of acetoxy groups detected, indicating the completeness of the condensation
reaction. In the 29
Si-NMR spectrum of Figure 3. 1 (b), these peaks can be assigned (from
left to right) to silicon atoms bearing: four ethoxy groups Q0 (-81.74 ppm, TEOS), three
ethoxy groups Q1 (-88.70 ppm, terminal units), two ethoxy groups Q2 (-96.1 ppm, linear
units), one ethoxy group Q3 (-102.7 ppm, semidendritic units), and no ethoxy group Q4 (-
110.0 ppm, dendritic units).[17]
(a)
(b)
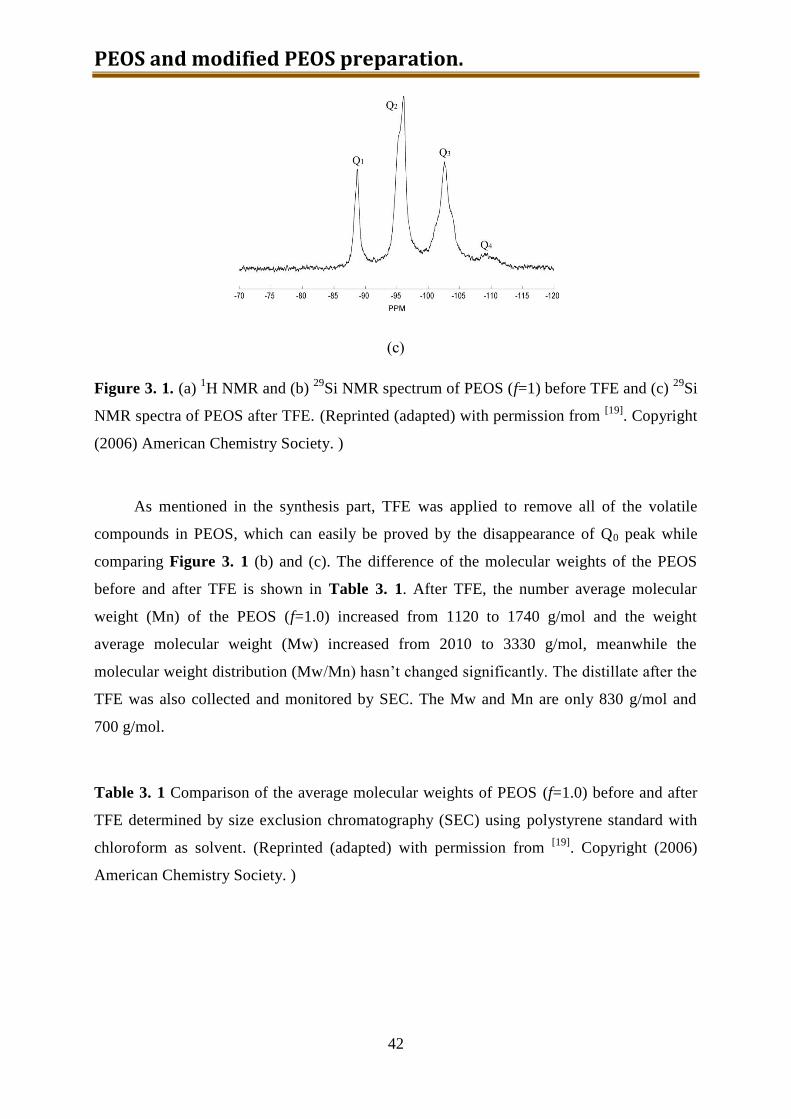
PEOS and modified PEOS preparation.
42
(c)
Figure 3. 1. (a) 1H NMR and (b)
29Si NMR spectrum of PEOS (f=1) before TFE and (c)
29Si
NMR spectra of PEOS after TFE. (Reprinted (adapted) with permission from [19]
. Copyright
(2006) American Chemistry Society. )
As mentioned in the synthesis part, TFE was applied to remove all of the volatile
compounds in PEOS, which can easily be proved by the disappearance of Q0 peak while
comparing Figure 3. 1 (b) and (c). The difference of the molecular weights of the PEOS
before and after TFE is shown in Table 3. 1. After TFE, the number average molecular
weight (Mn) of the PEOS (f=1.0) increased from 1120 to 1740 g/mol and the weight
average molecular weight (Mw) increased from 2010 to 3330 g/mol, meanwhile the
molecular weight distribution (Mw/Mn) hasn’t changed significantly. The distillate after the
TFE was also collected and monitored by SEC. The Mw and Mn are only 830 g/mol and
700 g/mol.
Table 3. 1 Comparison of the average molecular weights of PEOS (f=1.0) before and after
TFE determined by size exclusion chromatography (SEC) using polystyrene standard with
chloroform as solvent. (Reprinted (adapted) with permission from [19]
. Copyright (2006)
American Chemistry Society. )
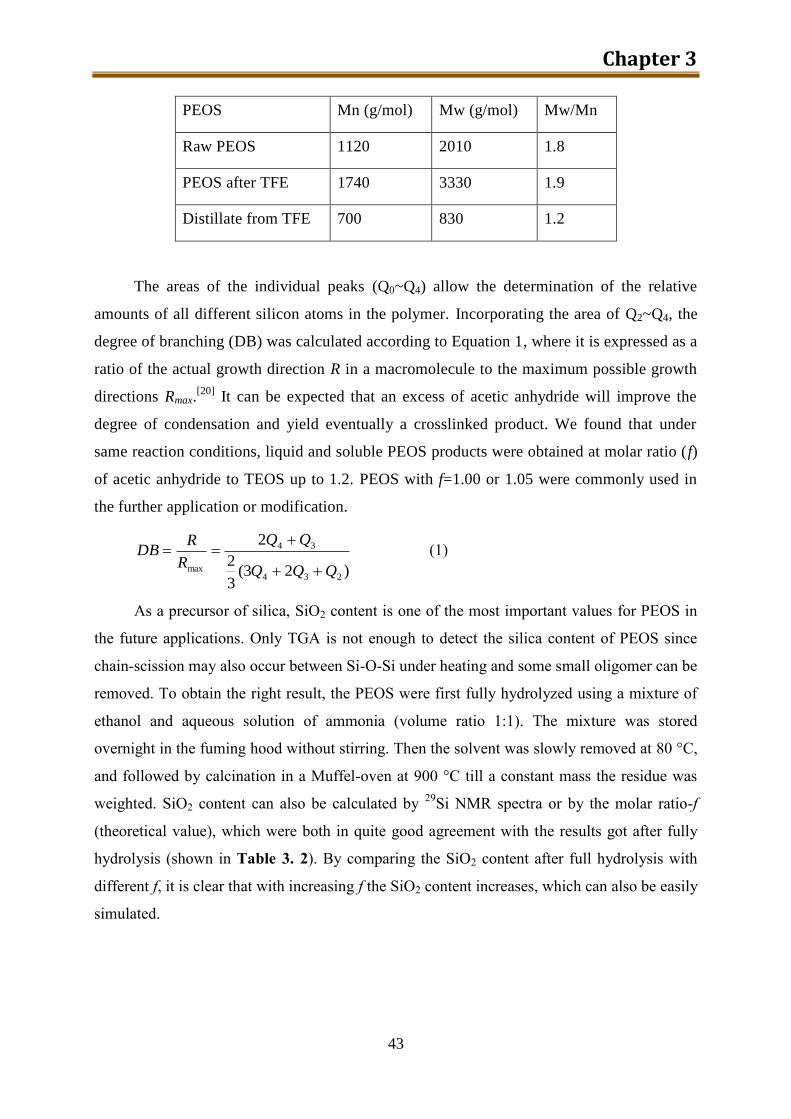
Chapter 3
43
PEOS Mn (g/mol) Mw (g/mol) Mw/Mn
Raw PEOS 1120 2010 1.8
PEOS after TFE 1740 3330 1.9
Distillate from TFE 700 830 1.2
The areas of the individual peaks (Q0~Q4) allow the determination of the relative
amounts of all different silicon atoms in the polymer. Incorporating the area of Q2~Q4, the
degree of branching (DB) was calculated according to Equation 1, where it is expressed as a
ratio of the actual growth direction R in a macromolecule to the maximum possible growth
directions Rmax.[20]
It can be expected that an excess of acetic anhydride will improve the
degree of condensation and yield eventually a crosslinked product. We found that under
same reaction conditions, liquid and soluble PEOS products were obtained at molar ratio (f)
of acetic anhydride to TEOS up to 1.2. PEOS with f=1.00 or 1.05 were commonly used in
the further application or modification.
)23(3
2
2
234
34
max QQQ
R
RDB
(1)
As a precursor of silica, SiO2 content is one of the most important values for PEOS in
the future applications. Only TGA is not enough to detect the silica content of PEOS since
chain-scission may also occur between Si-O-Si under heating and some small oligomer can be
removed. To obtain the right result, the PEOS were first fully hydrolyzed using a mixture of
ethanol and aqueous solution of ammonia (volume ratio 1:1). The mixture was stored
overnight in the fuming hood without stirring. Then the solvent was slowly removed at 80 °C,
and followed by calcination in a Muffel-oven at 900 °C till a constant mass the residue was
weighted. SiO2 content can also be calculated by 29
Si NMR spectra or by the molar ratio-f
(theoretical value), which were both in quite good agreement with the results got after fully
hydrolysis (shown in Table 3. 2). By comparing the SiO2 content after full hydrolysis with
different f, it is clear that with increasing f the SiO2 content increases, which can also be easily
simulated.
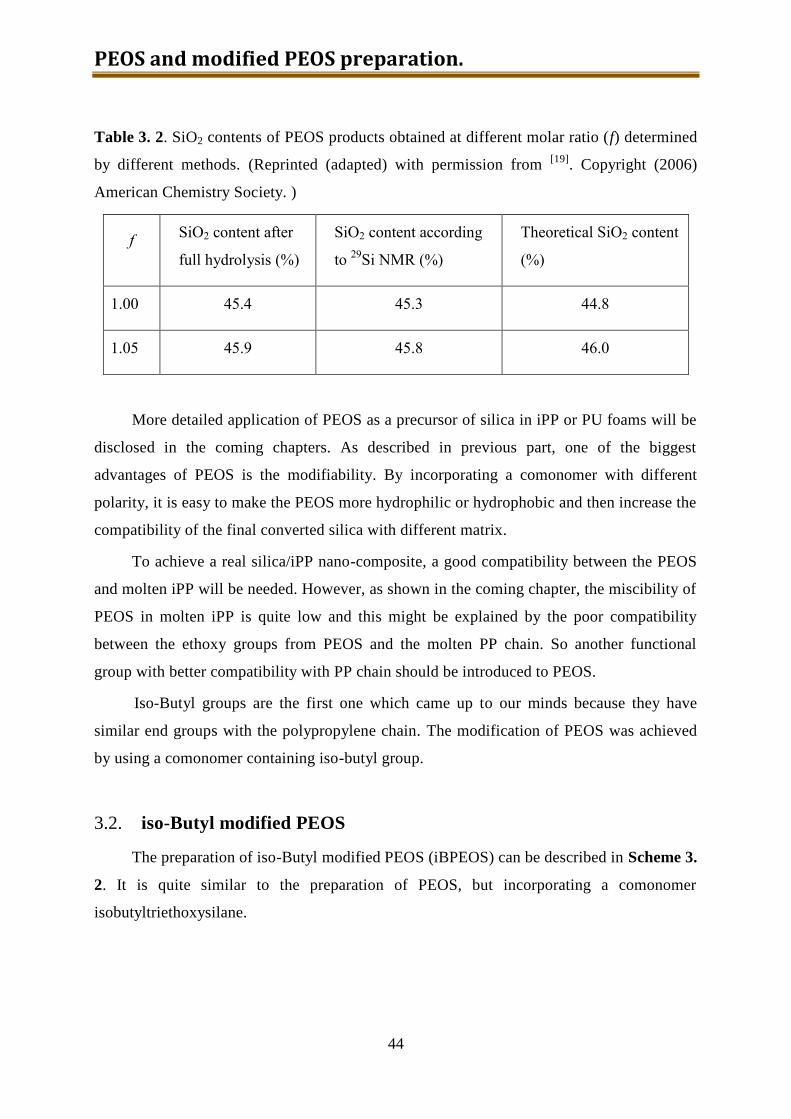
PEOS and modified PEOS preparation.
44
Table 3. 2. SiO2 contents of PEOS products obtained at different molar ratio (f) determined
by different methods. (Reprinted (adapted) with permission from [19]
. Copyright (2006)
American Chemistry Society. )
f SiO2 content after
full hydrolysis (%)
SiO2 content according
to 29
Si NMR (%)
Theoretical SiO2 content
(%)
1.00 45.4 45.3 44.8
1.05 45.9 45.8 46.0
More detailed application of PEOS as a precursor of silica in iPP or PU foams will be
disclosed in the coming chapters. As described in previous part, one of the biggest
advantages of PEOS is the modifiability. By incorporating a comonomer with different
polarity, it is easy to make the PEOS more hydrophilic or hydrophobic and then increase the
compatibility of the final converted silica with different matrix.
To achieve a real silica/iPP nano-composite, a good compatibility between the PEOS
and molten iPP will be needed. However, as shown in the coming chapter, the miscibility of
PEOS in molten iPP is quite low and this might be explained by the poor compatibility
between the ethoxy groups from PEOS and the molten PP chain. So another functional
group with better compatibility with PP chain should be introduced to PEOS.
Iso-Butyl groups are the first one which came up to our minds because they have
similar end groups with the polypropylene chain. The modification of PEOS was achieved
by using a comonomer containing iso-butyl group.
3.2. iso-Butyl modified PEOS
The preparation of iso-Butyl modified PEOS (iBPEOS) can be described in Scheme 3.
2. It is quite similar to the preparation of PEOS, but incorporating a comonomer
isobutyltriethoxysilane.
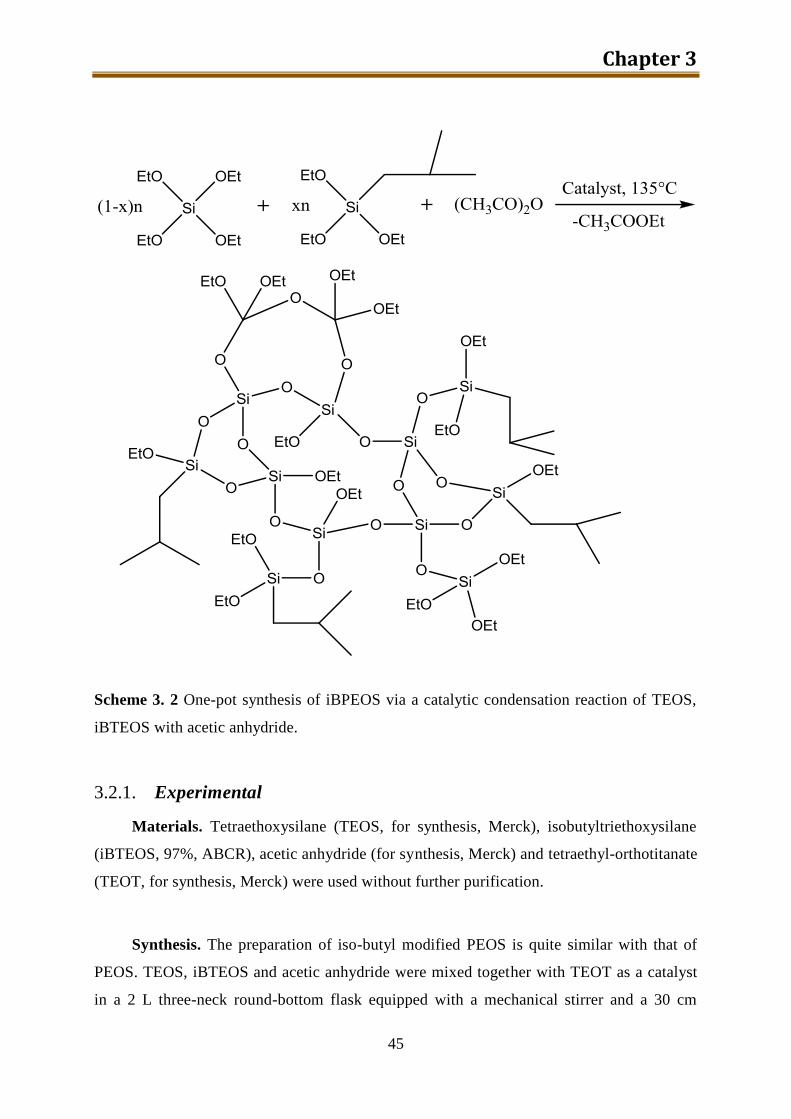
Chapter 3
45
Scheme 3. 2 One-pot synthesis of iBPEOS via a catalytic condensation reaction of TEOS,
iBTEOS with acetic anhydride.
3.2.1. Experimental
Materials. Tetraethoxysilane (TEOS, for synthesis, Merck), isobutyltriethoxysilane
(iBTEOS, 97%, ABCR), acetic anhydride (for synthesis, Merck) and tetraethyl-orthotitanate
(TEOT, for synthesis, Merck) were used without further purification.
Synthesis. The preparation of iso-butyl modified PEOS is quite similar with that of
PEOS. TEOS, iBTEOS and acetic anhydride were mixed together with TEOT as a catalyst
in a 2 L three-neck round-bottom flask equipped with a mechanical stirrer and a 30 cm
PEOS and modified PEOS preparation.
46
dephlagmator connected with a distillation bridge. The whole reaction was also carried out
at 135~138 °C under the protection of dry nitrogen. After the distillation of ethyl acetate
was finished, the mixture was cooled to room temperature and dried in a vacuum of 10-2
mbar for 5 h. The resulting yellow liquid was put through the TFE to finalize the removing
of the volatile component.
Characterization. 1H NMR (300 MHz) spectra were recorded on a Brucker DPX-300
NMR spectrometer using tetramethylsilane as an internal standard.
3.2.2. Results and discussion
The polymerization was monitored by the amount of ethyl acetate distillate. To make
the result comparable with PEOS, the content of catalyst was kept the same (0.3 mol%,
relative to the sum of TEOS and iBTEOS) as that of the preparation of PEOS. Although it is
difficult to make it quantitative, the reaction was found to be slightly slower than PEOS which
might because of the lower reactivity of iBTEOS. To finish the reaction within 8 hours,
slightly higher temperature (~138 °C) was applied flexibly during the reaction. After the
distillation was finished, the mixture was kept under the same temperature for another 1 hour
to finish the reaction. Residual small molecules in the yellow liquid obtained after distillation,
which were volatile and would decrease the stability of the final product, were completely
removed by TFE after high vacuum (10-2
mbar, till no bubbles observed) under 150 °C.
The molar ratio of acetic anhydride to TEOS+iBTEOS (fi) was kept as 1.1 in the whole
series of preparation. To achieve a different chemical polarity, the molar ratio between
iBTEOS and TEOS was varied from 1:9 to 2:3. The iBPEOS prepared are listed in Table 3. 3:
Table 3. 3. List of all the iBPEOS prepared with different ratio between iBTEOS and TEOS.
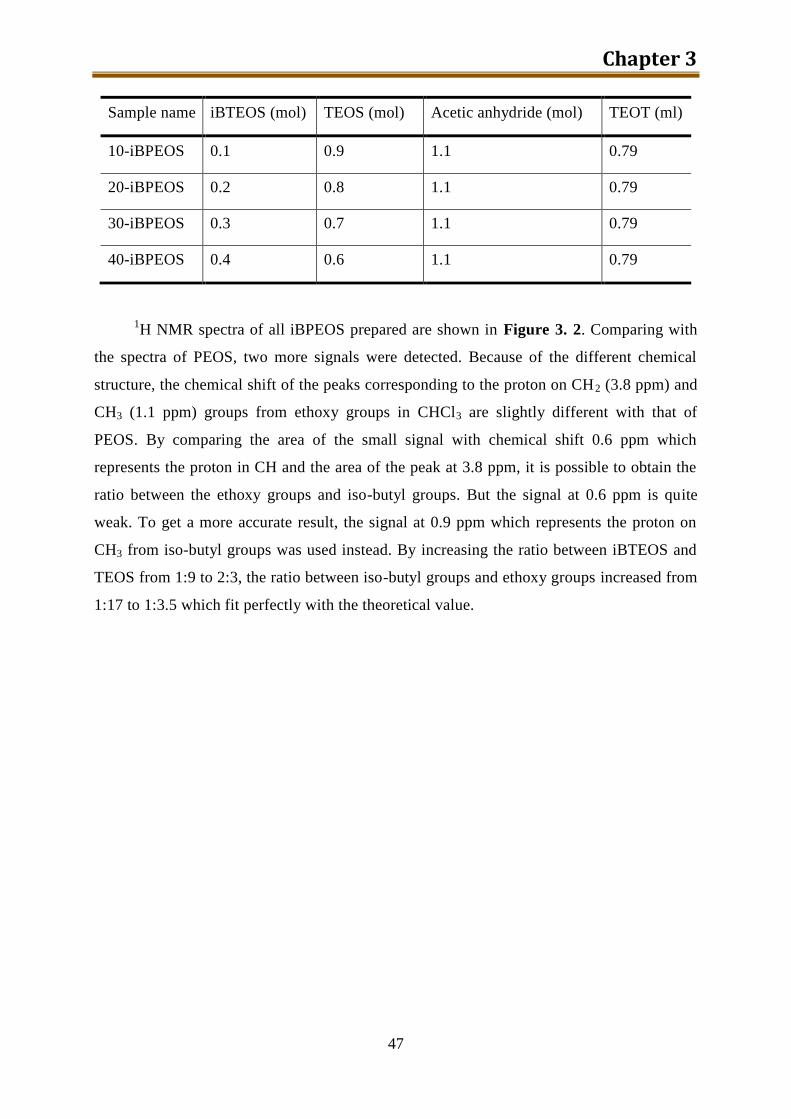
Chapter 3
47
Sample name iBTEOS (mol) TEOS (mol) Acetic anhydride (mol) TEOT (ml)
10-iBPEOS 0.1 0.9 1.1 0.79
20-iBPEOS 0.2 0.8 1.1 0.79
30-iBPEOS 0.3 0.7 1.1 0.79
40-iBPEOS 0.4 0.6 1.1 0.79
1H NMR spectra of all iBPEOS prepared are shown in Figure 3. 2. Comparing with
the spectra of PEOS, two more signals were detected. Because of the different chemical
structure, the chemical shift of the peaks corresponding to the proton on CH2 (3.8 ppm) and
CH3 (1.1 ppm) groups from ethoxy groups in CHCl3 are slightly different with that of
PEOS. By comparing the area of the small signal with chemical shift 0.6 ppm which
represents the proton in CH and the area of the peak at 3.8 ppm, it is possible to obtain the
ratio between the ethoxy groups and iso-butyl groups. But the signal at 0.6 ppm is quite
weak. To get a more accurate result, the signal at 0.9 ppm which represents the proton on
CH3 from iso-butyl groups was used instead. By increasing the ratio between iBTEOS and
TEOS from 1:9 to 2:3, the ratio between iso-butyl groups and ethoxy groups increased from
1:17 to 1:3.5 which fit perfectly with the theoretical value.
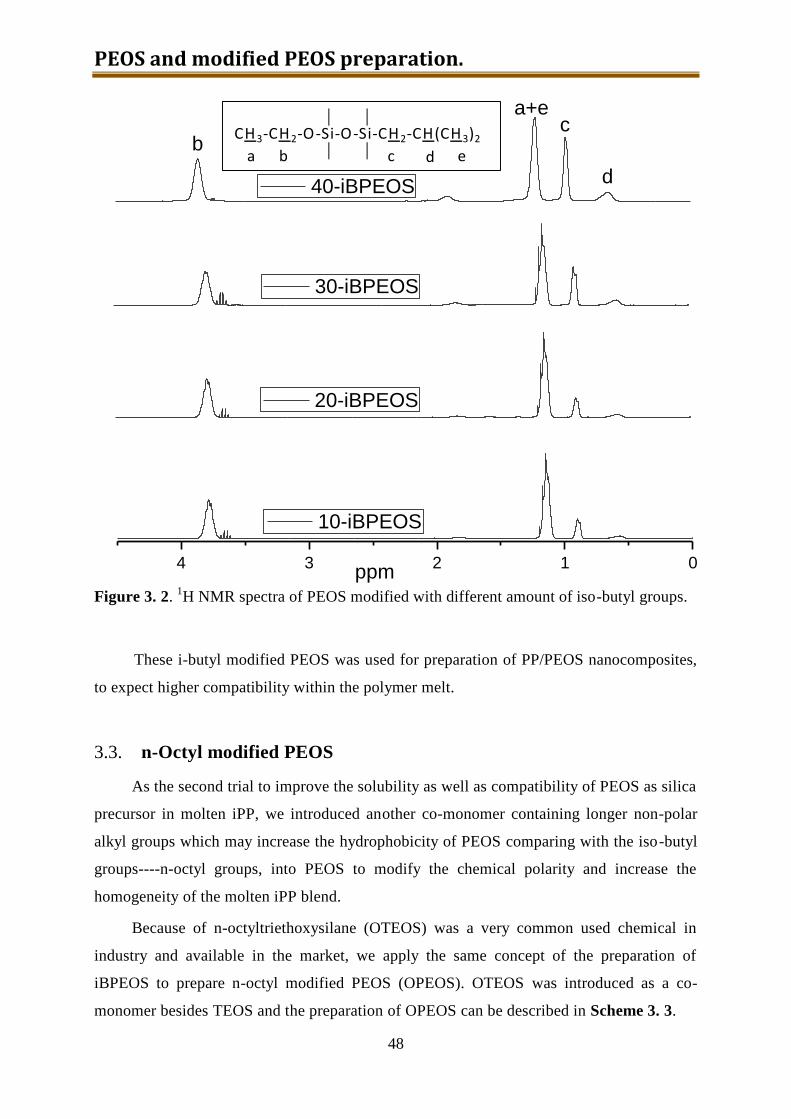
PEOS and modified PEOS preparation.
48
4 3 2 1 0
CH3-CH2-O-Si-O-Si-CH2-CH(CH3)2
a b c d e
40-iBPEOS
b
d
a+ec
30-iBPEOS
ppm
10-iBPEOS
20-iBPEOS
Figure 3. 2. 1H NMR spectra of PEOS modified with different amount of iso-butyl groups.
These i-butyl modified PEOS was used for preparation of PP/PEOS nanocomposites,
to expect higher compatibility within the polymer melt.
3.3. n-Octyl modified PEOS
As the second trial to improve the solubility as well as compatibility of PEOS as silica
precursor in molten iPP, we introduced another co-monomer containing longer non-polar
alkyl groups which may increase the hydrophobicity of PEOS comparing with the iso-butyl
groups----n-octyl groups, into PEOS to modify the chemical polarity and increase the
homogeneity of the molten iPP blend.
Because of n-octyltriethoxysilane (OTEOS) was a very common used chemical in
industry and available in the market, we apply the same concept of the preparation of
iBPEOS to prepare n-octyl modified PEOS (OPEOS). OTEOS was introduced as a co-
monomer besides TEOS and the preparation of OPEOS can be described in Scheme 3. 3.
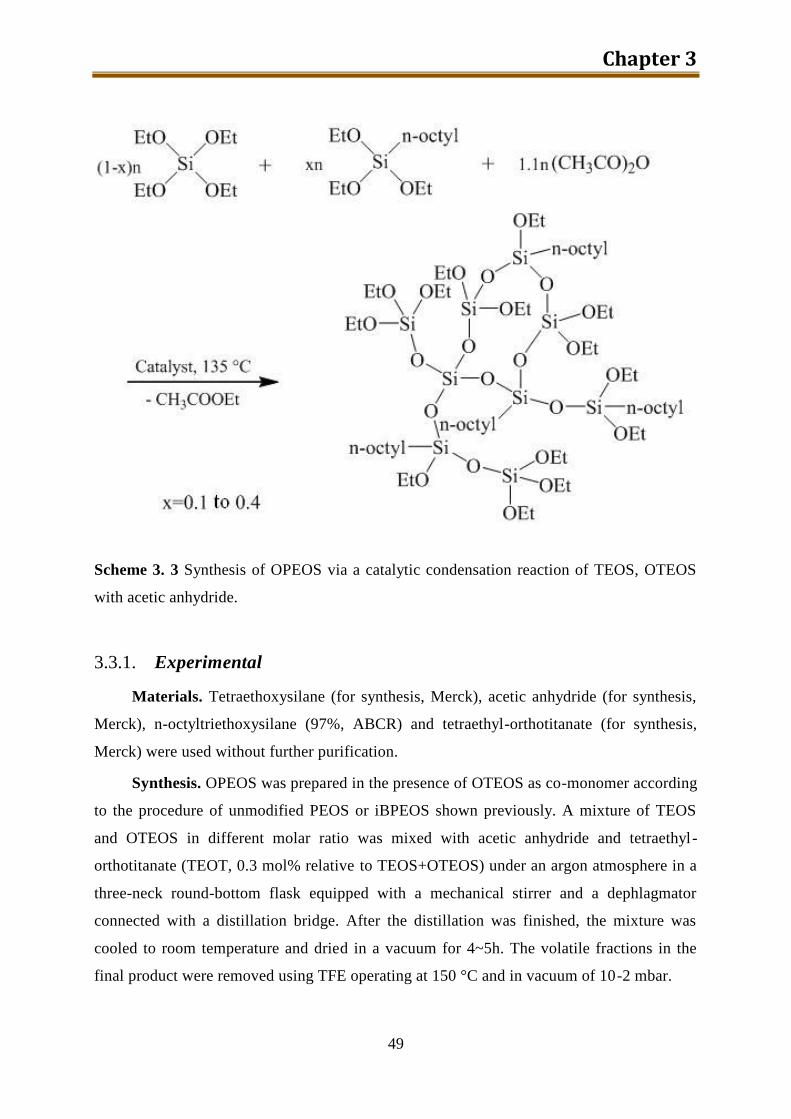
Chapter 3
49
Scheme 3. 3 Synthesis of OPEOS via a catalytic condensation reaction of TEOS, OTEOS
with acetic anhydride.
3.3.1. Experimental
Materials. Tetraethoxysilane (for synthesis, Merck), acetic anhydride (for synthesis,
Merck), n-octyltriethoxysilane (97%, ABCR) and tetraethyl-orthotitanate (for synthesis,
Merck) were used without further purification.
Synthesis. OPEOS was prepared in the presence of OTEOS as co-monomer according
to the procedure of unmodified PEOS or iBPEOS shown previously. A mixture of TEOS
and OTEOS in different molar ratio was mixed with acetic anhydride and tetraethyl-
orthotitanate (TEOT, 0.3 mol% relative to TEOS+OTEOS) under an argon atmosphere in a
three-neck round-bottom flask equipped with a mechanical stirrer and a dephlagmator
connected with a distillation bridge. After the distillation was finished, the mixture was
cooled to room temperature and dried in a vacuum for 4~5h. The volatile fractions in the
final product were removed using TFE operating at 150 °C and in vacuum of 10-2 mbar.
PEOS and modified PEOS preparation.
50
Characterization. 1H NMR (300 MHz) spectra were recorded on a Bruker DPX-300
NMR spectrometer using tetramethylsilane as an internal standard.
29Si NMR spectra were measured at room temperature with 3000 scans and a dwell
time of 20 µs on Advance III-600 MHz Bruker NMR spectrometer. The spectra were
corrected for the background signal from the probe by numerical subtraction.
Size-exclusion chromatography (SEC) analyses were conducted with a high-pressure
liquid chromatography pump (LC 1120, Polymer laboratories) and an evaporative light
scattering detector (PL-ELS-1000, Polymer laboratories). The eluting solvent was
chloroform (HPLC grade, Fisher Scientific). The flow rate was 0.8 mL/min. The sample
concentration was around 5 mg/mL. The setup consisted of four MZ-DVB gel columns with
the nominal pore sizes of 50, 100, 1000, and 10 000 Å. Calibration with polystyrene
standards was used to estimate the molecular weight.
3.3.2. Results and discussion
Similar with iBTEOS, the reactivity of the OTEOS might not be as high as TEOS
because of the long non-polar n-octyl group. A slightly higher temperature (135~138°C)
was applied to finish the distillation of ethyl acetate within 8 hours. After TFE yellowish
oily liquid was obtained.
The molar ratio of acetic anhydride to TEOS+OTEOS (fO) was kept at 1.1 in the
whole series of preparation. To achieve a different chemical polarity, the molar ratio
between OTEOS and TEOS was varied from 1:9 to 2:3. The OPEOS prepared are listed in
Table 3. 4 below:
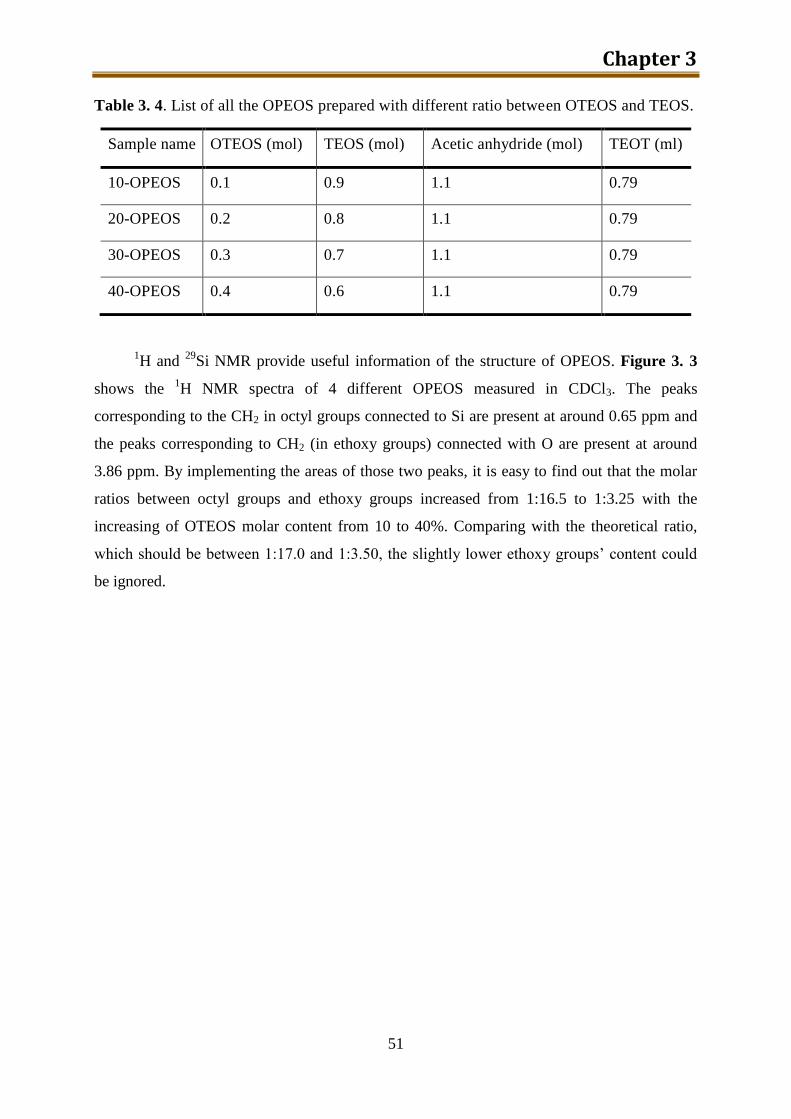
Chapter 3
51
Table 3. 4. List of all the OPEOS prepared with different ratio between OTEOS and TEOS.
Sample name OTEOS (mol) TEOS (mol) Acetic anhydride (mol) TEOT (ml)
10-OPEOS 0.1 0.9 1.1 0.79
20-OPEOS 0.2 0.8 1.1 0.79
30-OPEOS 0.3 0.7 1.1 0.79
40-OPEOS 0.4 0.6 1.1 0.79
1H and
29Si NMR provide useful information of the structure of OPEOS. Figure 3. 3
shows the 1H NMR spectra of 4 different OPEOS measured in CDCl3. The peaks
corresponding to the CH2 in octyl groups connected to Si are present at around 0.65 ppm and
the peaks corresponding to CH2 (in ethoxy groups) connected with O are present at around
3.86 ppm. By implementing the areas of those two peaks, it is easy to find out that the molar
ratios between octyl groups and ethoxy groups increased from 1:16.5 to 1:3.25 with the
increasing of OTEOS molar content from 10 to 40%. Comparing with the theoretical ratio,
which should be between 1:17.0 and 1:3.50, the slightly lower ethoxy groups’ content could
be ignored.
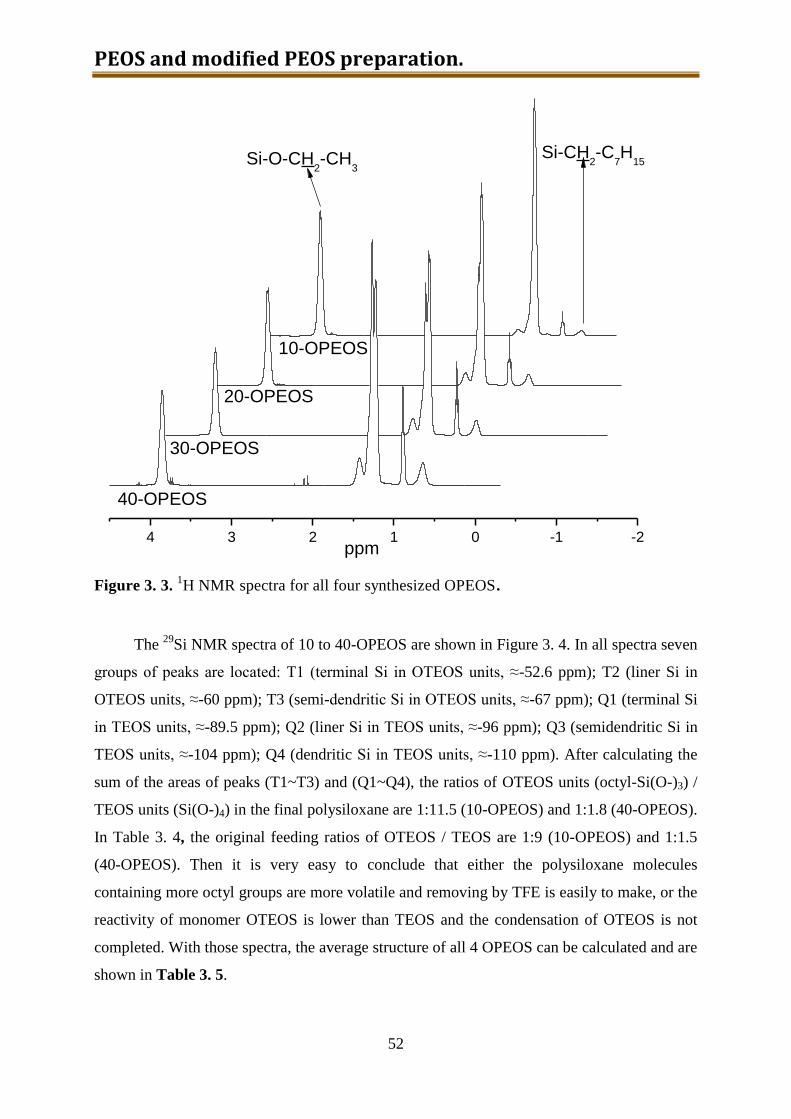
PEOS and modified PEOS preparation.
52
4 3 2 1 0 -1 -2
40-OPEOS
30-OPEOS
20-OPEOS
10-OPEOS
Si-CH2-C
7H
15Si-O-CH2-CH
3
ppm
Figure 3. 3. 1H NMR spectra for all four synthesized OPEOS.
The 29
Si NMR spectra of 10 to 40-OPEOS are shown in Figure 3. 4. In all spectra seven
groups of peaks are located: T1 (terminal Si in OTEOS units, ≈-52.6 ppm); T2 (liner Si in
OTEOS units, ≈-60 ppm); T3 (semi-dendritic Si in OTEOS units, ≈-67 ppm); Q1 (terminal Si
in TEOS units, ≈-89.5 ppm); Q2 (liner Si in TEOS units, ≈-96 ppm); Q3 (semidendritic Si in
TEOS units, ≈-104 ppm); Q4 (dendritic Si in TEOS units, ≈-110 ppm). After calculating the
sum of the areas of peaks (T1~T3) and (Q1~Q4), the ratios of OTEOS units (octyl-Si(O-)3) /
TEOS units (Si(O-)4) in the final polysiloxane are 1:11.5 (10-OPEOS) and 1:1.8 (40-OPEOS).
In Table 3. 4, the original feeding ratios of OTEOS / TEOS are 1:9 (10-OPEOS) and 1:1.5
(40-OPEOS). Then it is very easy to conclude that either the polysiloxane molecules
containing more octyl groups are more volatile and removing by TFE is easily to make, or the
reactivity of monomer OTEOS is lower than TEOS and the condensation of OTEOS is not
completed. With those spectra, the average structure of all 4 OPEOS can be calculated and are
shown in Table 3. 5.
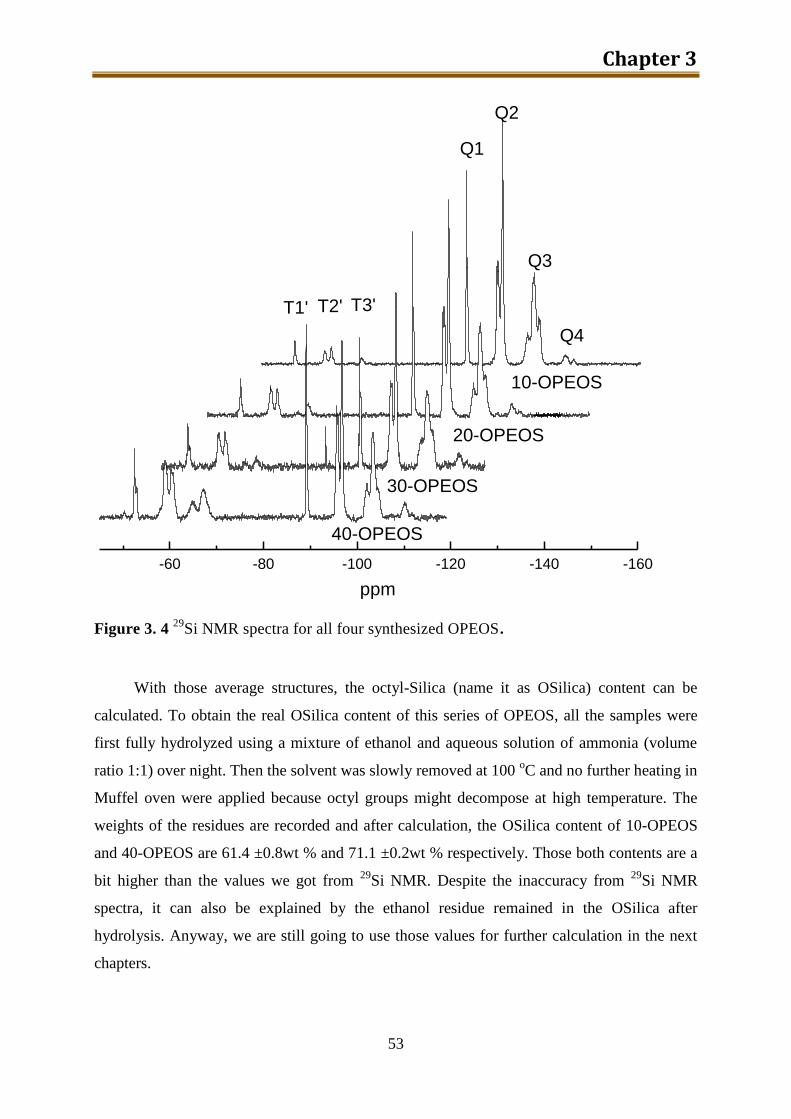
Chapter 3
53
-60 -80 -100 -120 -140 -160
40-OPEOS
30-OPEOS
20-OPEOS
10-OPEOS
ppm
T1' T2' T3'
Q1
Q2
Q3
Q4
Figure 3. 4 29
Si NMR spectra for all four synthesized OPEOS.
With those average structures, the octyl-Silica (name it as OSilica) content can be
calculated. To obtain the real OSilica content of this series of OPEOS, all the samples were
first fully hydrolyzed using a mixture of ethanol and aqueous solution of ammonia (volume
ratio 1:1) over night. Then the solvent was slowly removed at 100 oC and no further heating in
Muffel oven were applied because octyl groups might decompose at high temperature. The
weights of the residues are recorded and after calculation, the OSilica content of 10-OPEOS
and 40-OPEOS are 61.4 ±0.8wt % and 71.1 ±0.2wt % respectively. Those both contents are a
bit higher than the values we got from 29
Si NMR. Despite the inaccuracy from 29
Si NMR
spectra, it can also be explained by the ethanol residue remained in the OSilica after
hydrolysis. Anyway, we are still going to use those values for further calculation in the next
chapters.

PEOS and modified PEOS preparation.
54
Table 3. 5. Average structure and the OSilica content of 10-OPEOS and 40-OPEOS
obtained from 29
Si NMR or hydrolysis test.
Sample name:
Average structure of
OPEOS from 29
Si NMR
Average structure
of OSilica from
29Si NMR
OSilica weight
content from 29
Si
NMR (%)
OSilica weight
content from
hydrolysis test (%)
10-OPEOS SiO1.13(OEt)1.66(C8H17)0.07 SiO1.965(C8H17)0.07 52.33% 61.40 ±0.8wt %
20-OPEOS SiO1.12(OEt)1.62(C8H17)0.14 SiO1.93(C8H17)0.14 55.48% ----------------
30-OPEOS SiO1.13(OEt)1.56(C8H17)0.18 SiO1.91(C8H17)0.18 57.75% ----------------
40-OPEOS SiO1.13(OEt)1.38(C8H17)0.36 SiO1.82(C8H17)0.36 65.70% 71.10 ±0.2wt %
The branching-degree (DB) of OPEOS was calculated by the formula below:
22334
334
233
2
2
TQTQQ
TQQDB
To obtain the influence of OTEOS content to the DB, the branching degrees of 10-
OPEOS and 40-OPEOS were calculated and listed in Table 3. 6. By increasing of OTEOS
content from 10% to 40%, the DB increased from 0.4892 to 0.4901. It is quite clear that there
is almost no relationship between the branching degrees with the OTEOS content. We can
imagine that the amount of Ac2O would affect DB more significantly.
Table 3. 6. Relative contents of different building units, degrees of branching and molecular
weights of 10-OPEOS and 40-OPEOS.
TEOS OTEOS
Q1 % Q2 % Q3 % Q4 % T1 % T2 % T3 % DB Mn Mw/Mn
10-OPEOS 12,99 42,50 34,42 2,89 1,73 4,40 1,08 0.4892 2695.7 2.5555
40-OPEOS 9,61 28,47 23,13 3,20 5,34 18,51 11,74 0.4901 4057.1 5.1193
Figure 3. 5 shows the SEC analysis results of them. As discussed in a previous paper[17]
,
the refractive index (RI) increment of polyethoxysiloxane (PEOS) depends on the molecular
weight. So instead of a RI detector, an evaporative light scattering (ELS) detector was used.
As shown also in Table 3. 6, the apparent number average of molecular weight (comparing to
PS standard samples) increased with the increment of OTEOS content. This result might be
explained by the higher molar mass of the octyl groups in comparison to ethoxy units. With
the same amount of repeating units, 40-OPEOS should have a higher molecular weight.
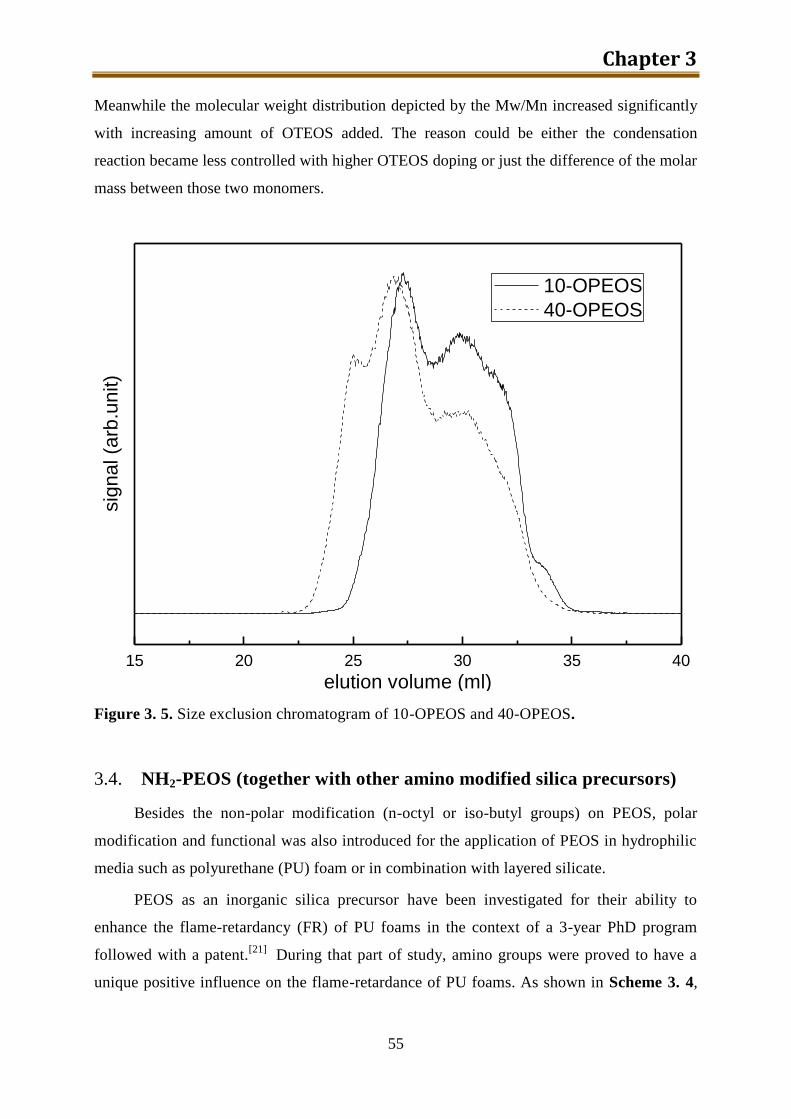
Chapter 3
55
Meanwhile the molecular weight distribution depicted by the Mw/Mn increased significantly
with increasing amount of OTEOS added. The reason could be either the condensation
reaction became less controlled with higher OTEOS doping or just the difference of the molar
mass between those two monomers.
15 20 25 30 35 40
sig
na
l (a
rb.u
nit)
elution volume (ml)
10-OPEOS
40-OPEOS
Figure 3. 5. Size exclusion chromatogram of 10-OPEOS and 40-OPEOS.
3.4. NH2-PEOS (together with other amino modified silica precursors)
Besides the non-polar modification (n-octyl or iso-butyl groups) on PEOS, polar
modification and functional was also introduced for the application of PEOS in hydrophilic
media such as polyurethane (PU) foam or in combination with layered silicate.
PEOS as an inorganic silica precursor have been investigated for their ability to
enhance the flame-retardancy (FR) of PU foams in the context of a 3-year PhD program
followed with a patent.[21]
During that part of study, amino groups were proved to have a
unique positive influence on the flame-retardance of PU foams. As shown in Scheme 3. 4,
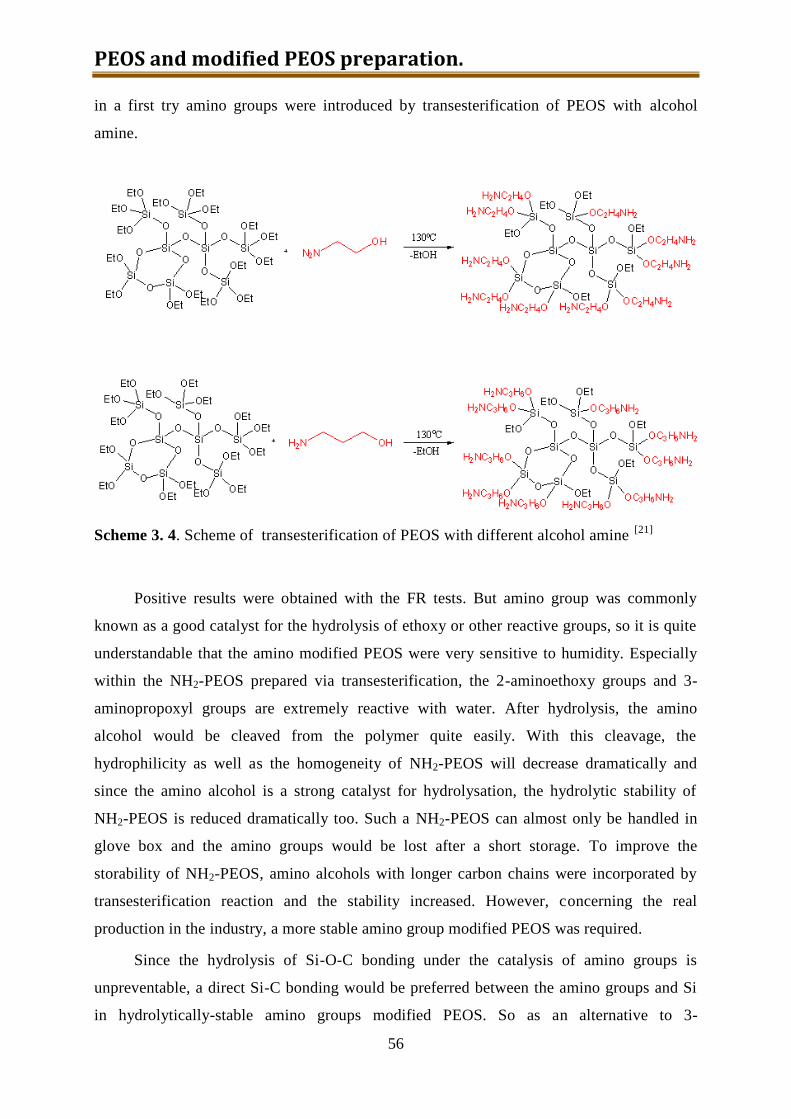
PEOS and modified PEOS preparation.
56
in a first try amino groups were introduced by transesterification of PEOS with alcohol
amine.
Scheme 3. 4. Scheme of transesterification of PEOS with different alcohol amine [21]
Positive results were obtained with the FR tests. But amino group was commonly
known as a good catalyst for the hydrolysis of ethoxy or other reactive groups, so it is quite
understandable that the amino modified PEOS were very sensitive to humidity. Especially
within the NH2-PEOS prepared via transesterification, the 2-aminoethoxy groups and 3-
aminopropoxyl groups are extremely reactive with water. After hydrolysis, the amino
alcohol would be cleaved from the polymer quite easily. With this cleavage, the
hydrophilicity as well as the homogeneity of NH2-PEOS will decrease dramatically and
since the amino alcohol is a strong catalyst for hydrolysation, the hydrolytic stability of
NH2-PEOS is reduced dramatically too. Such a NH2-PEOS can almost only be handled in
glove box and the amino groups would be lost after a short storage. To improve the
storability of NH2-PEOS, amino alcohols with longer carbon chains were incorporated by
transesterification reaction and the stability increased. However, concerning the real
production in the industry, a more stable amino group modified PEOS was required.
Since the hydrolysis of Si-O-C bonding under the catalysis of amino groups is
unpreventable, a direct Si-C bonding would be preferred between the amino groups and Si
in hydrolytically-stable amino groups modified PEOS. So as an alternative to 3-
Chapter 3
57
aminopropoxyl groups, 3-aminopropyl groups from 3-aminopropyltriethoxysilane (APTES),
which is a commonly used commercial grade chemical, was selected to provide amino
groups and modify PEOS. Besides the modification of PEOS with APTES, some other silica
precursors with different amount of amino groups were also prepared as comparisons to the
NH2-PEOS. In summary, 5 different trials were carried out and with 4 of them NH2-PEOS
or other amino modified silica precursor were generated. By different modification
methods, PEOS or other precursor for silica with almost all different amino contents were
prepared by using TEOS or PEOS with APTES. And all the amino modified silica
precursors as well as NH2-PEOS will be discussed in this section.
3.4.1. Experimental
Materials. Tetraethoxysilane (for synthesis, Merck), 3-aminopropyltriethoxysilane
(99%, sigma-aldrich), ethanol (absolute, Merck), Hydrochloride acid (37% in water, Merck)
were used without further purification.
Synthesis. Five different synthesis routes were implemented to prepare amino modified
PEOS and different method ended up with NH2 modified silica precusor with different amino
content. All those five different routes were summarized in Figure 3. 6.
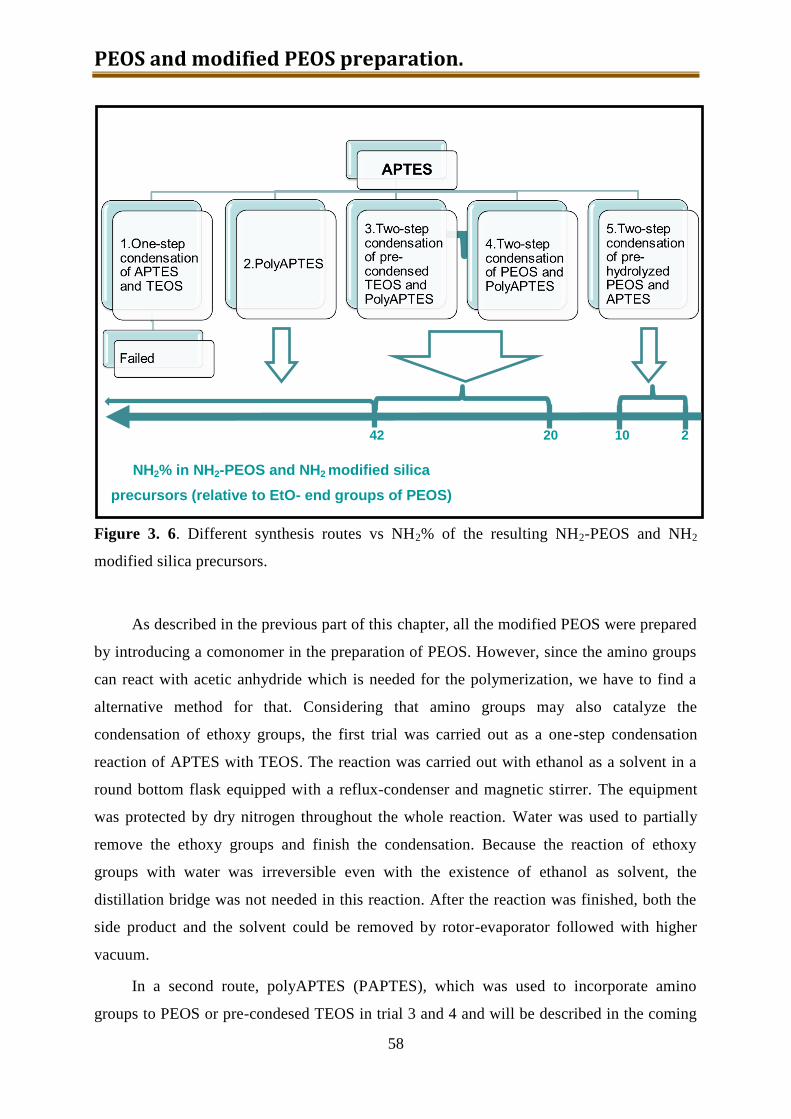
PEOS and modified PEOS preparation.
58
Figure 3. 6. Different synthesis routes vs NH2% of the resulting NH2-PEOS and NH2
modified silica precursors.
As described in the previous part of this chapter, all the modified PEOS were prepared
by introducing a comonomer in the preparation of PEOS. However, since the amino groups
can react with acetic anhydride which is needed for the polymerization, we have to find a
alternative method for that. Considering that amino groups may also catalyze the
condensation of ethoxy groups, the first trial was carried out as a one-step condensation
reaction of APTES with TEOS. The reaction was carried out with ethanol as a solvent in a
round bottom flask equipped with a reflux-condenser and magnetic stirrer. The equipment
was protected by dry nitrogen throughout the whole reaction. Water was used to partially
remove the ethoxy groups and finish the condensation. Because the reaction of ethoxy
groups with water was irreversible even with the existence of ethanol as solvent, the
distillation bridge was not needed in this reaction. After the reaction was finished, both the
side product and the solvent could be removed by rotor-evaporator followed with higher
vacuum.
In a second route, polyAPTES (PAPTES), which was used to incorporate amino
groups to PEOS or pre-condesed TEOS in trial 3 and 4 and will be described in the coming
10 20 42
2
NH2% in NH2-PEOS and NH2 modified silica
precursors (relative to EtO- end groups of PEOS)
Chapter 3
59
part, was prepared by a self-condensation reaction of APTES with water. PAPTES is an
analogous compound to NH2-PEOS since it is also an amino modified silica precursor. By
varying the degree of condensation, the amino content was varied from 42 % to almost
100%. APTES and ethanol were added together in a round-bottom flask equipped with a
reflux-condenser and magnetic stirrer. Water was added under stirring and then the mixture
was stirred overnight under room temperature to finish the conversion. After that the
ethanol in the mixture was removed by application of a rotor-evaporator followed with
higher vacuum (10-2
mbar) for 2 h and a transparent liquid was obtained. Because of the
higher amino content, PAPTES is also quite commonly used in the further applications (see
in Chapter 07).
Procedures of routes No.3 and No. 4 are quite similar. NH2-PEOS was prepared by
modifying either PEOS, or pre-condensed TEOS with PAPTES prepared in trial 2. Pre-
condensed TEOS was prepared by mixing TEOS with HCl water solution in ethanol and
then stirring overnight. After removing the solvent and HCl by using a rotor-evaporator and
then under high vacuum (10-2
mbar), pre-condensed TEOS (or called ethylsilicate) was
obtained as a transparent liquid. The pre-condensed TEOS is also a kind of precursor of
silica, however comparing with PEOS, it has broader molecular weight distribution, more
smaller molecules, more linear structure, more OH end groups and as well as much lower
stability. The modification with PAPTES on pre-condensed TEOS might be easier due to its
lower stability. PEOS (or pre-condensed TEOS) and PAPTES were mixed together in a
round-bottom flask equipped with a reflux-condenser using ethanol as the solvent, and the
resulting mixture is refluxed for 8 h. Removing of the solvent in those trials were the same
process as that of trial 2.
The last route (No.5) could be described as a two-step co-condensation reaction of
pre-hydrolyzed PEOS with APTES. At first, PEOS was hydrolyzed by mixing with HCl
aqueous solution in a round bottom flask protected with dry nitrogen over night. The
amount of water was calculated in dependence on the degree of modification to get. Then
APTES was added dropwise into the mixture and refluxed for 8 h. The same removal
process of the solvent was applied as in previous trials.
Characterization. 1H NMR (300 MHz) spectra were recorded on a Bruker DPX-300
NMR spectrometer using tetramethylsilane as an internal standard.
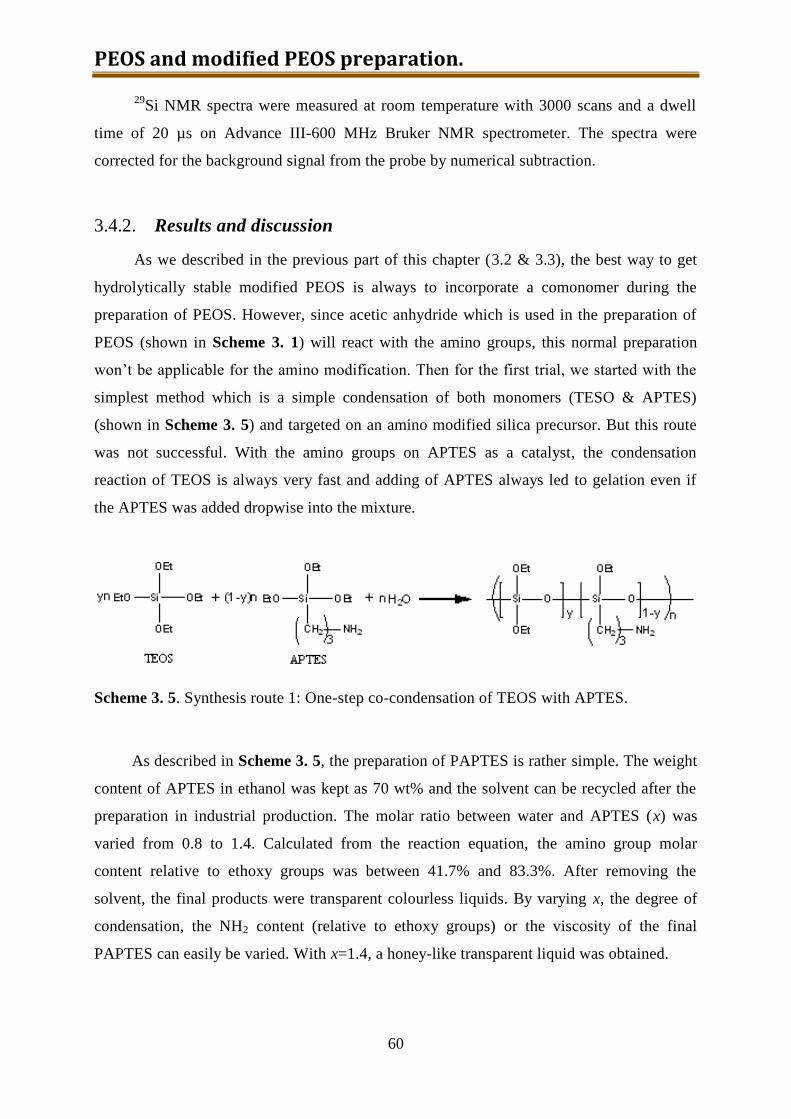
PEOS and modified PEOS preparation.
60
29Si NMR spectra were measured at room temperature with 3000 scans and a dwell
time of 20 µs on Advance III-600 MHz Bruker NMR spectrometer. The spectra were
corrected for the background signal from the probe by numerical subtraction.
3.4.2. Results and discussion
As we described in the previous part of this chapter (3.2 & 3.3), the best way to get
hydrolytically stable modified PEOS is always to incorporate a comonomer during the
preparation of PEOS. However, since acetic anhydride which is used in the preparation of
PEOS (shown in Scheme 3. 1) will react with the amino groups, this normal preparation
won’t be applicable for the amino modification. Then for the first trial, we started with the
simplest method which is a simple condensation of both monomers (TESO & APTES)
(shown in Scheme 3. 5) and targeted on an amino modified silica precursor. But this route
was not successful. With the amino groups on APTES as a catalyst, the condensation
reaction of TEOS is always very fast and adding of APTES always led to gelation even if
the APTES was added dropwise into the mixture.
Scheme 3. 5. Synthesis route 1: One-step co-condensation of TEOS with APTES.
As described in Scheme 3. 5, the preparation of PAPTES is rather simple. The weight
content of APTES in ethanol was kept as 70 wt% and the solvent can be recycled after the
preparation in industrial production. The molar ratio between water and APTES (x) was
varied from 0.8 to 1.4. Calculated from the reaction equation, the amino group molar
content relative to ethoxy groups was between 41.7% and 83.3%. After removing the
solvent, the final products were transparent colourless liquids. By varying x, the degree of
condensation, the NH2 content (relative to ethoxy groups) or the viscosity of the final
PAPTES can easily be varied. With x=1.4, a honey-like transparent liquid was obtained.
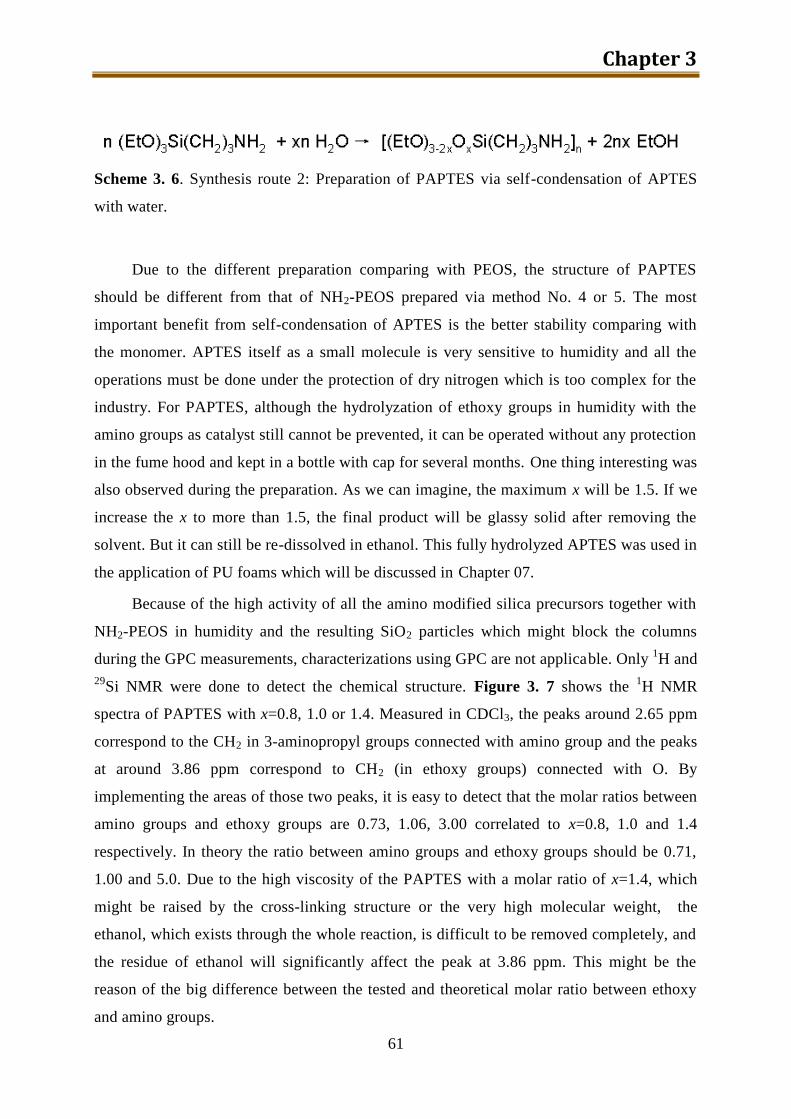
Chapter 3
61
Scheme 3. 6. Synthesis route 2: Preparation of PAPTES via self-condensation of APTES
with water.
Due to the different preparation comparing with PEOS, the structure of PAPTES
should be different from that of NH2-PEOS prepared via method No. 4 or 5. The most
important benefit from self-condensation of APTES is the better stability comparing with
the monomer. APTES itself as a small molecule is very sensitive to humidity and all the
operations must be done under the protection of dry nitrogen which is too complex for the
industry. For PAPTES, although the hydrolyzation of ethoxy groups in humidity with the
amino groups as catalyst still cannot be prevented, it can be operated without any protection
in the fume hood and kept in a bottle with cap for several months. One thing interesting was
also observed during the preparation. As we can imagine, the maximum x will be 1.5. If we
increase the x to more than 1.5, the final product will be glassy solid after removing the
solvent. But it can still be re-dissolved in ethanol. This fully hydrolyzed APTES was used in
the application of PU foams which will be discussed in Chapter 07.
Because of the high activity of all the amino modified silica precursors together with
NH2-PEOS in humidity and the resulting SiO2 particles which might block the columns
during the GPC measurements, characterizations using GPC are not applicable. Only 1H and
29Si NMR were done to detect the chemical structure. Figure 3. 7 shows the
1H NMR
spectra of PAPTES with x=0.8, 1.0 or 1.4. Measured in CDCl3, the peaks around 2.65 ppm
correspond to the CH2 in 3-aminopropyl groups connected with amino group and the peaks
at around 3.86 ppm correspond to CH2 (in ethoxy groups) connected with O. By
implementing the areas of those two peaks, it is easy to detect that the molar ratios between
amino groups and ethoxy groups are 0.73, 1.06, 3.00 correlated to x=0.8, 1.0 and 1.4
respectively. In theory the ratio between amino groups and ethoxy groups should be 0.71,
1.00 and 5.0. Due to the high viscosity of the PAPTES with a molar ratio of x=1.4, which
might be raised by the cross-linking structure or the very high molecular weight, the
ethanol, which exists through the whole reaction, is difficult to be removed completely, and
the residue of ethanol will significantly affect the peak at 3.86 ppm. This might be the
reason of the big difference between the tested and theoretical molar ratio between ethoxy
and amino groups.

PEOS and modified PEOS preparation.
62
4 3 2 1 0
Si-C2H
4-CH
2-NH
2
x=0.8
CH3-CH
2-O-Si Si-CH
2-C
2H
4-NH
2
ppm [ppm]
x=1.0
x=1.4
Figure 3. 7. 1H NMR spectra of PAPTES with different molar ratios x.
The 29
Si NMR spectra of PAPTES with different x are shown in Figure 3. 8. Four
groups of peaks can be found: T0 (APTES monomer, ≈-46 ppm); T1 (terminal Si in
PAPTES units, ≈-53.3 ppm); T2 (liner Si in PAPTES units, ≈-57~-62 ppm) and T3 (semi-
dendritic Si in PAPTES units, ≈-64~-72 ppm). The signal of APTES monomer can always
be observed because high vacuum alone is never enough to remove all of the small, low
molecular molecules. The transesterification reaction of the PAPTES with amino groups as
catalyst by itself can never be prevented. Since TFE was used in the removal of volatile
components in PEOS, we also tried to apply this procedure to PAPTES (x=1). As a result, a
honey-like liquid was collected. In 29
Si NMR of PAPTES after TFE the signal of T0
disappeared. Simultaneously, the structure of PAPTES is changed which might related to a
partly decomposition during TFE processing. Due to the impurity of the PAPTES (x=1.4 or
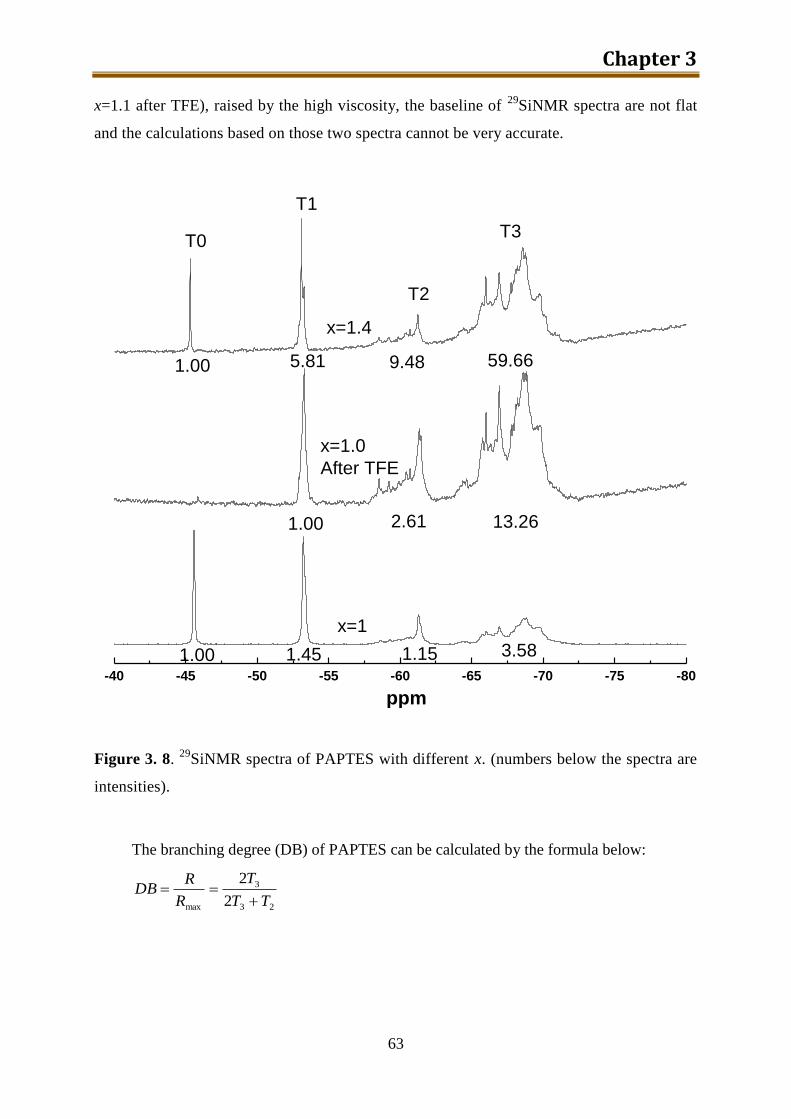
Chapter 3
63
x=1.1 after TFE), raised by the high viscosity, the baseline of 29
SiNMR spectra are not flat
and the calculations based on those two spectra cannot be very accurate.
-40 -45 -50 -55 -60 -65 -70 -75 -80
ppm
x=1
x=1.4
T0
T1
T2
T3
1.00 1.45 1.15 3.58
1.00 5.81 9.48 59.66
1.00 2.61 13.26
x=1.0
After TFE
Figure 3. 8. 29
SiNMR spectra of PAPTES with different x. (numbers below the spectra are
intensities).
The branching degree (DB) of PAPTES can be calculated by the formula below:
23
3
max 2
2
TT
T
R
RDB
PEOS and modified PEOS preparation.
64
The DB increased from 0.86 to 0.93 with the increasing of x from 1 to 1.4. On the
other hand, both, PAPTES (x=1 after TFE) and PAPTES(x=1.4) are honey-like liquids and
show similar DB.
By incorporating the area of T0~T3 peaks, it is possible to calculate the average
structure of PAPTES with different x or after TFE (shown in Table 3. 7). The average
structure of PAPTES with x=1 fit in quite well with the calculation of the original molar
ratio between APTES and water (x). With PAPTES (x=1.4 or x=1.1 after TFE), the average
structure can only be estimated because of the bumpy baseline of the spectra.
Table 3. 7. Average structure and DB of different PAPTES.
PAPTES Average structure from 29
Si NMR DB
x=1 SiO1.01(OEt)0.98C3H6NH2 0.86
x=1 after TFE SiO1.36(OEt)0.27C3H6NH2 0.91
x=1.4 SiO1.34(OEt)0.32C3H6NH2 0.93
The following three different synthetic routes can be described as modifications of
PEOS. Despite the pre-condensed TEOS has a non-hyperbranched and active structure than
that of PEOS, both synthesis in method No.3 and No. 4 which are depicted together in
Scheme 3. 7 are quite similar. The PEOS or pre-condensed TEOS and PAPTES are
combined under addition of a small amount of water. Because of the differences in
hydrophobicity, the miscibility between PEOS and PAPTES is really poor. Ethanol was
introduced in route No.4 as a solvent to increase the homogeneity. Pre-condensed TEOS
was applied as a more active comparison to the PEOS and ethanol was also introduced in
route No. 3 to keep it parallel with route No. 4 although the miscibility with PAPTES is
much better comparing with that of PEOS. However, since the amino groups from PAPTES
in the presence of traces of water is a nice catalyst for the hydrolysis of either PEOS or pre-
condensed TEOS, the higher activity of pre-condensed TEOS didn’t show too much
difference during the preparation and even in further application of the final products. We
didn’t do too much examination on the product from route No. 3 and we will combine it
with route No. 4 as one part in this section.
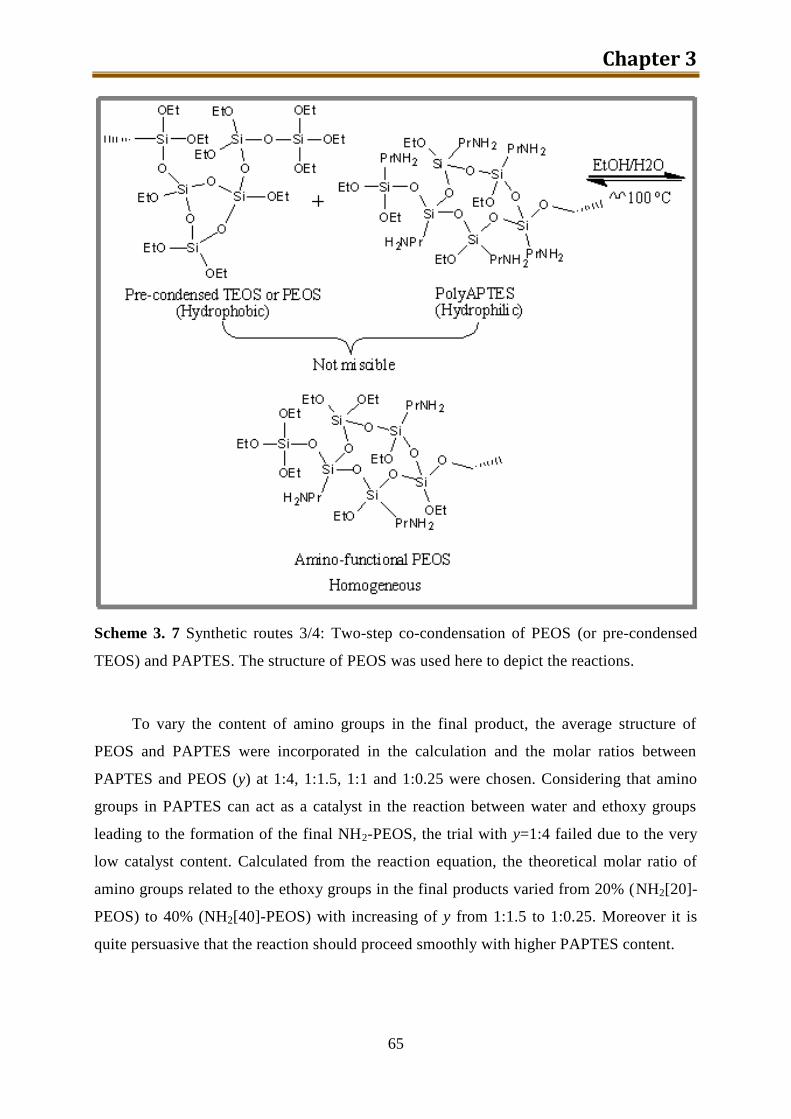
Chapter 3
65
Scheme 3. 7 Synthetic routes 3/4: Two-step co-condensation of PEOS (or pre-condensed
TEOS) and PAPTES. The structure of PEOS was used here to depict the reactions.
To vary the content of amino groups in the final product, the average structure of
PEOS and PAPTES were incorporated in the calculation and the molar ratios between
PAPTES and PEOS (y) at 1:4, 1:1.5, 1:1 and 1:0.25 were chosen. Considering that amino
groups in PAPTES can act as a catalyst in the reaction between water and ethoxy groups
leading to the formation of the final NH2-PEOS, the trial with y=1:4 failed due to the very
low catalyst content. Calculated from the reaction equation, the theoretical molar ratio of
amino groups related to the ethoxy groups in the final products varied from 20% (NH2[20]-
PEOS) to 40% (NH2[40]-PEOS) with increasing of y from 1:1.5 to 1:0.25. Moreover it is
quite persuasive that the reaction should proceed smoothly with higher PAPTES content.
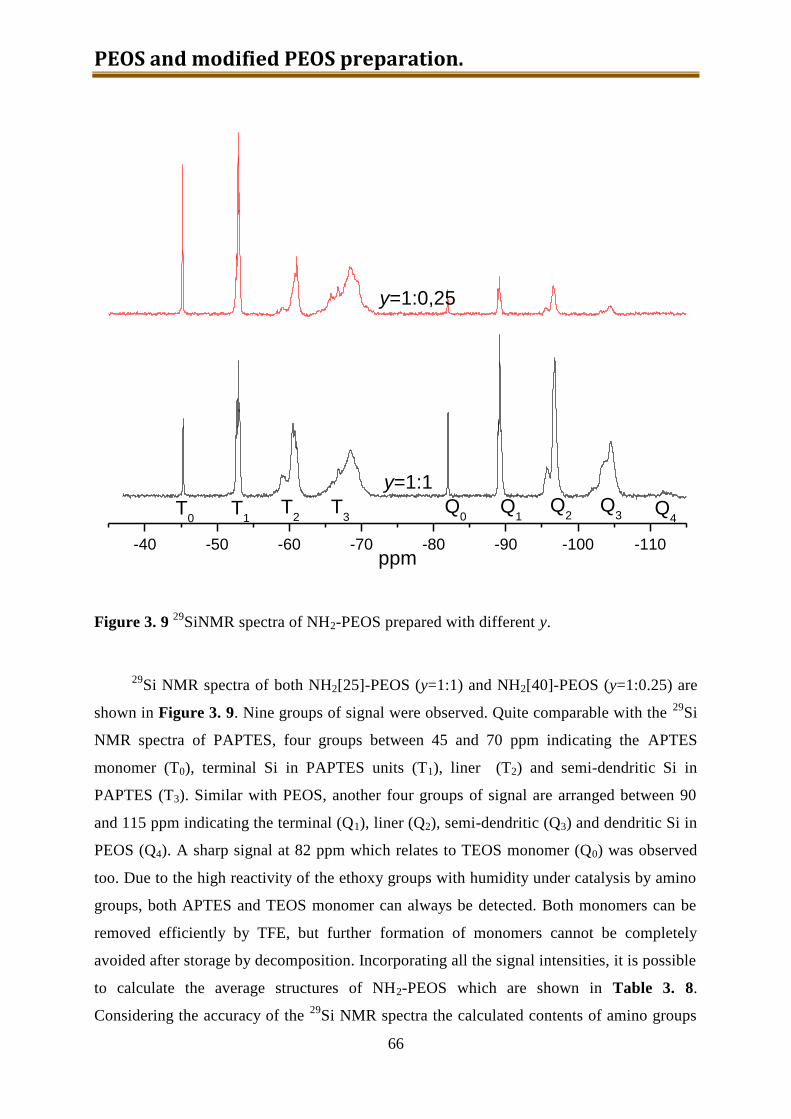
PEOS and modified PEOS preparation.
66
-40 -50 -60 -70 -80 -90 -100 -110
y=1:1
Q4
T1
ppm
T0
T3
T2
Q1
Q0
Q3
Q2
y=1:0,25
Figure 3. 9 29
SiNMR spectra of NH2-PEOS prepared with different y.
29Si NMR spectra of both NH2[25]-PEOS (y=1:1) and NH2[40]-PEOS (y=1:0.25) are
shown in Figure 3. 9. Nine groups of signal were observed. Quite comparable with the 29
Si
NMR spectra of PAPTES, four groups between 45 and 70 ppm indicating the APTES
monomer (T0), terminal Si in PAPTES units (T1), liner (T2) and semi-dendritic Si in
PAPTES (T3). Similar with PEOS, another four groups of signal are arranged between 90
and 115 ppm indicating the terminal (Q1), liner (Q2), semi-dendritic (Q3) and dendritic Si in
PEOS (Q4). A sharp signal at 82 ppm which relates to TEOS monomer (Q0) was observed
too. Due to the high reactivity of the ethoxy groups with humidity under catalysis by amino
groups, both APTES and TEOS monomer can always be detected. Both monomers can be
removed efficiently by TFE, but further formation of monomers cannot be completely
avoided after storage by decomposition. Incorporating all the signal intensities, it is possible
to calculate the average structures of NH2-PEOS which are shown in Table 3. 8.
Considering the accuracy of the 29
Si NMR spectra the calculated contents of amino groups
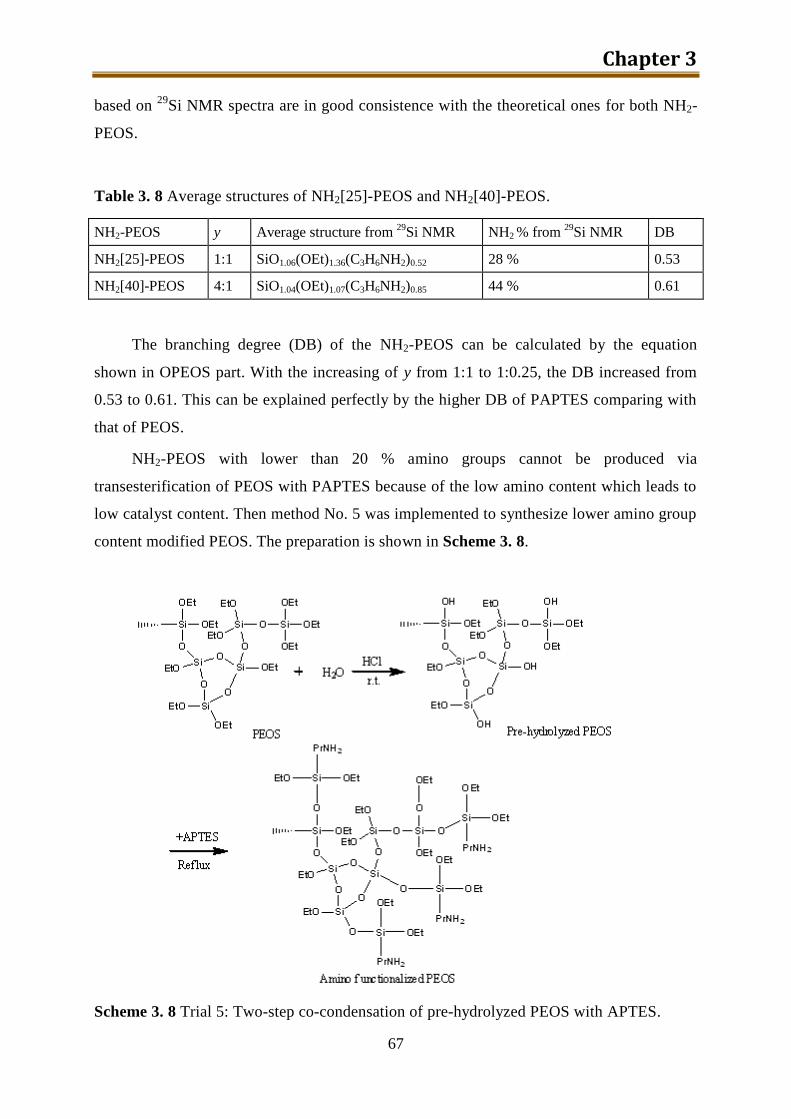
Chapter 3
67
based on 29
Si NMR spectra are in good consistence with the theoretical ones for both NH2-
PEOS.
Table 3. 8 Average structures of NH2[25]-PEOS and NH2[40]-PEOS.
NH2-PEOS y Average structure from 29
Si NMR NH2 % from 29
Si NMR DB
NH2[25]-PEOS 1:1 SiO1.06(OEt)1.36(C3H6NH2)0.52 28 % 0.53
NH2[40]-PEOS 4:1 SiO1.04(OEt)1.07(C3H6NH2)0.85 44 % 0.61
The branching degree (DB) of the NH2-PEOS can be calculated by the equation
shown in OPEOS part. With the increasing of y from 1:1 to 1:0.25, the DB increased from
0.53 to 0.61. This can be explained perfectly by the higher DB of PAPTES comparing with
that of PEOS.
NH2-PEOS with lower than 20 % amino groups cannot be produced via
transesterification of PEOS with PAPTES because of the low amino content which leads to
low catalyst content. Then method No. 5 was implemented to synthesize lower amino group
content modified PEOS. The preparation is shown in Scheme 3. 8.
Scheme 3. 8 Trial 5: Two-step co-condensation of pre-hydrolyzed PEOS with APTES.
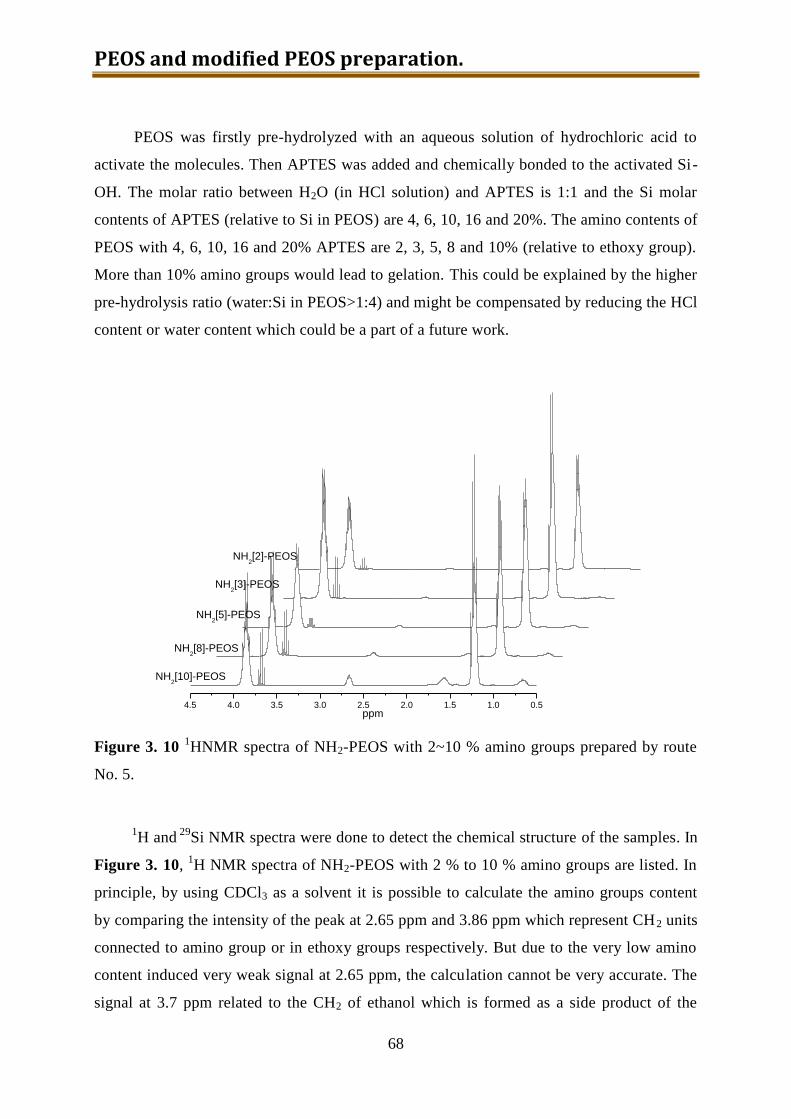
PEOS and modified PEOS preparation.
68
PEOS was firstly pre-hydrolyzed with an aqueous solution of hydrochloric acid to
activate the molecules. Then APTES was added and chemically bonded to the activated Si-
OH. The molar ratio between H2O (in HCl solution) and APTES is 1:1 and the Si molar
contents of APTES (relative to Si in PEOS) are 4, 6, 10, 16 and 20%. The amino contents of
PEOS with 4, 6, 10, 16 and 20% APTES are 2, 3, 5, 8 and 10% (relative to ethoxy group).
More than 10% amino groups would lead to gelation. This could be explained by the higher
pre-hydrolysis ratio (water:Si in PEOS>1:4) and might be compensated by reducing the HCl
content or water content which could be a part of a future work.
4.5 4.0 3.5 3.0 2.5 2.0 1.5 1.0 0.5
NH2[10]-PEOS
NH2[8]-PEOS
NH2[5]-PEOS
NH2[3]-PEOS
ppm
NH2[2]-PEOS
Figure 3. 10 1HNMR spectra of NH2-PEOS with 2~10 % amino groups prepared by route
No. 5.
1H and
29Si NMR spectra were done to detect the chemical structure of the samples. In
Figure 3. 10, 1H NMR spectra of NH2-PEOS with 2 % to 10 % amino groups are listed. In
principle, by using CDCl3 as a solvent it is possible to calculate the amino groups content
by comparing the intensity of the peak at 2.65 ppm and 3.86 ppm which represent CH2 units
connected to amino group or in ethoxy groups respectively. But due to the very low amino
content induced very weak signal at 2.65 ppm, the calculation cannot be very accurate. The
signal at 3.7 ppm related to the CH2 of ethanol which is formed as a side product of the
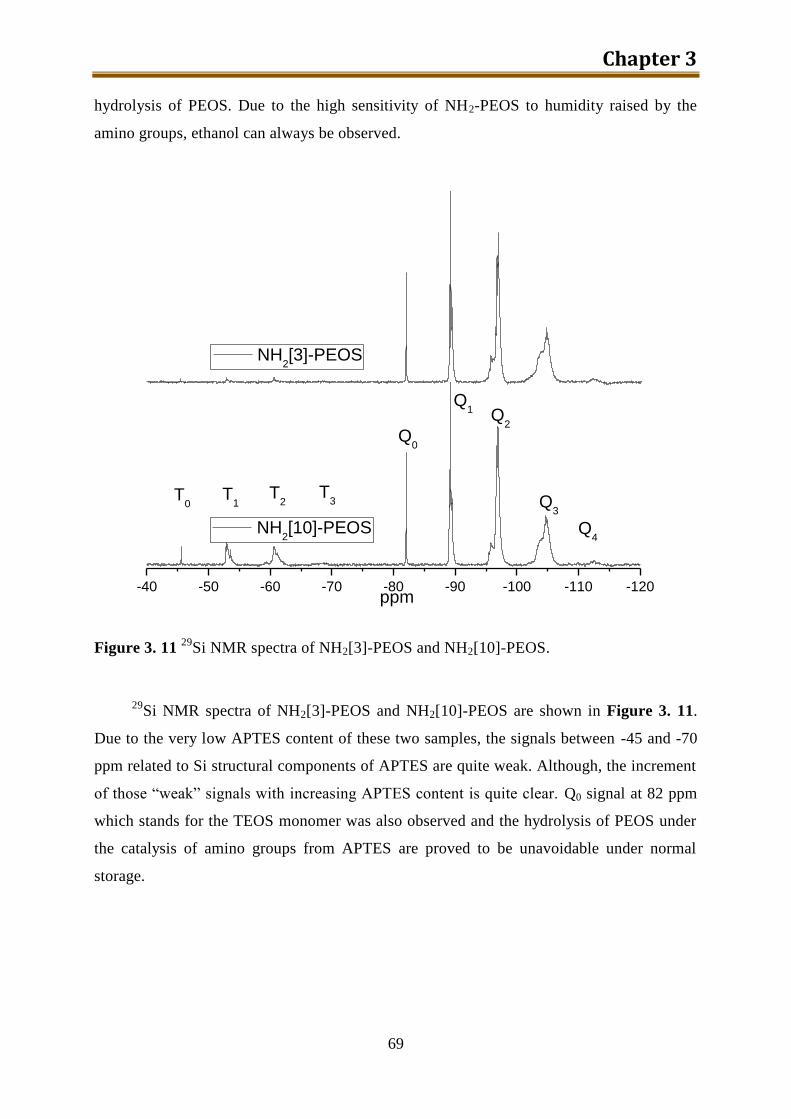
Chapter 3
69
hydrolysis of PEOS. Due to the high sensitivity of NH2-PEOS to humidity raised by the
amino groups, ethanol can always be observed.
-40 -50 -60 -70 -80 -90 -100 -110 -120
NH2[3]-PEOS
ppm
NH2[10]-PEOS
T0
T1
T2
T3
Q0
Q1 Q
2
Q3
Q4
Figure 3. 11 29
Si NMR spectra of NH2[3]-PEOS and NH2[10]-PEOS.
29Si NMR spectra of NH2[3]-PEOS and NH2[10]-PEOS are shown in Figure 3. 11.
Due to the very low APTES content of these two samples, the signals between -45 and -70
ppm related to Si structural components of APTES are quite weak. Although, the increment
of those “weak” signals with increasing APTES content is quite clear. Q0 signal at 82 ppm
which stands for the TEOS monomer was also observed and the hydrolysis of PEOS under
the catalysis of amino groups from APTES are proved to be unavoidable under normal
storage.
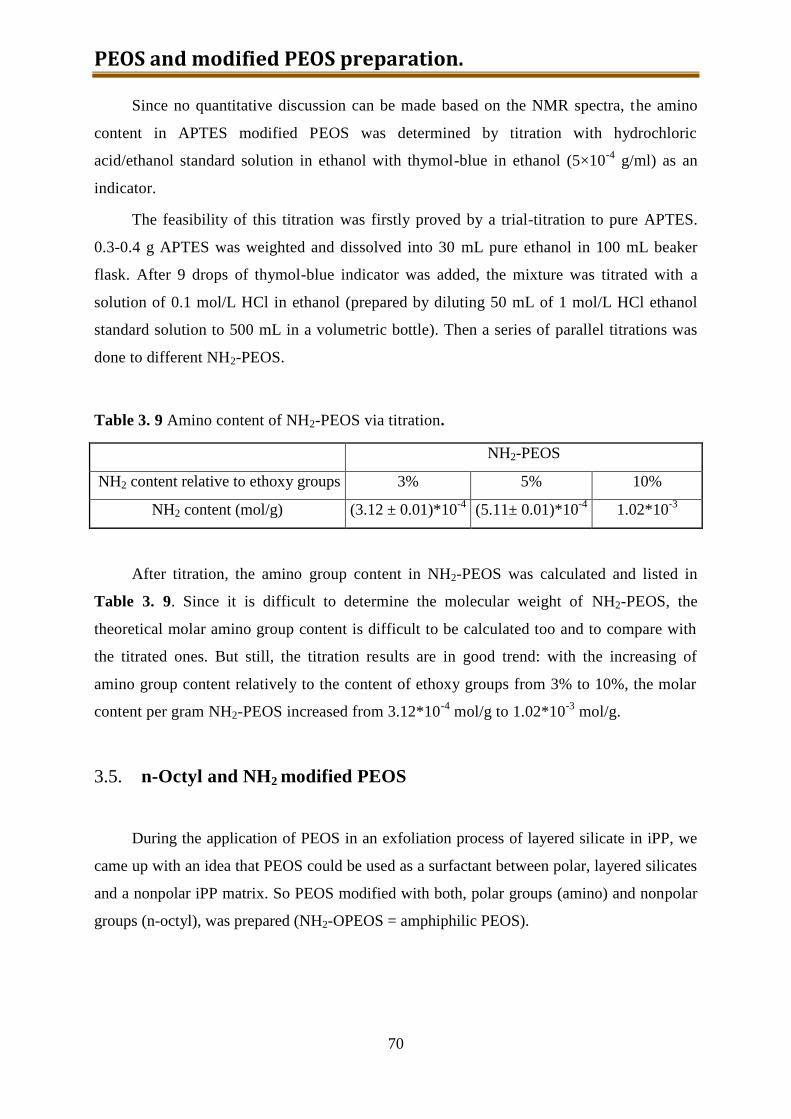
PEOS and modified PEOS preparation.
70
Since no quantitative discussion can be made based on the NMR spectra, the amino
content in APTES modified PEOS was determined by titration with hydrochloric
acid/ethanol standard solution in ethanol with thymol-blue in ethanol (5×10⁻⁴
g/ml) as an
indicator.
The feasibility of this titration was firstly proved by a trial-titration to pure APTES.
0.3-0.4 g APTES was weighted and dissolved into 30 mL pure ethanol in 100 mL beaker
flask. After 9 drops of thymol-blue indicator was added, the mixture was titrated with a
solution of 0.1 mol/L HCl in ethanol (prepared by diluting 50 mL of 1 mol/L HCl ethanol
standard solution to 500 mL in a volumetric bottle). Then a series of parallel titrations was
done to different NH2-PEOS.
Table 3. 9 Amino content of NH2-PEOS via titration.
NH2-PEOS
NH2 content relative to ethoxy groups 3% 5% 10%
NH2 content (mol/g) (3.12 ± 0.01)*10-4
(5.11± 0.01)*10-4
1.02*10-3
After titration, the amino group content in NH2-PEOS was calculated and listed in
Table 3. 9. Since it is difficult to determine the molecular weight of NH2-PEOS, the
theoretical molar amino group content is difficult to be calculated too and to compare with
the titrated ones. But still, the titration results are in good trend: with the increasing of
amino group content relatively to the content of ethoxy groups from 3% to 10%, the molar
content per gram NH2-PEOS increased from 3.12*10-4
mol/g to 1.02*10-3
mol/g.
3.5. n-Octyl and NH2 modified PEOS
During the application of PEOS in an exfoliation process of layered silicate in iPP, we
came up with an idea that PEOS could be used as a surfactant between polar, layered silicates
and a nonpolar iPP matrix. So PEOS modified with both, polar groups (amino) and nonpolar
groups (n-octyl), was prepared (NH2-OPEOS = amphiphilic PEOS).
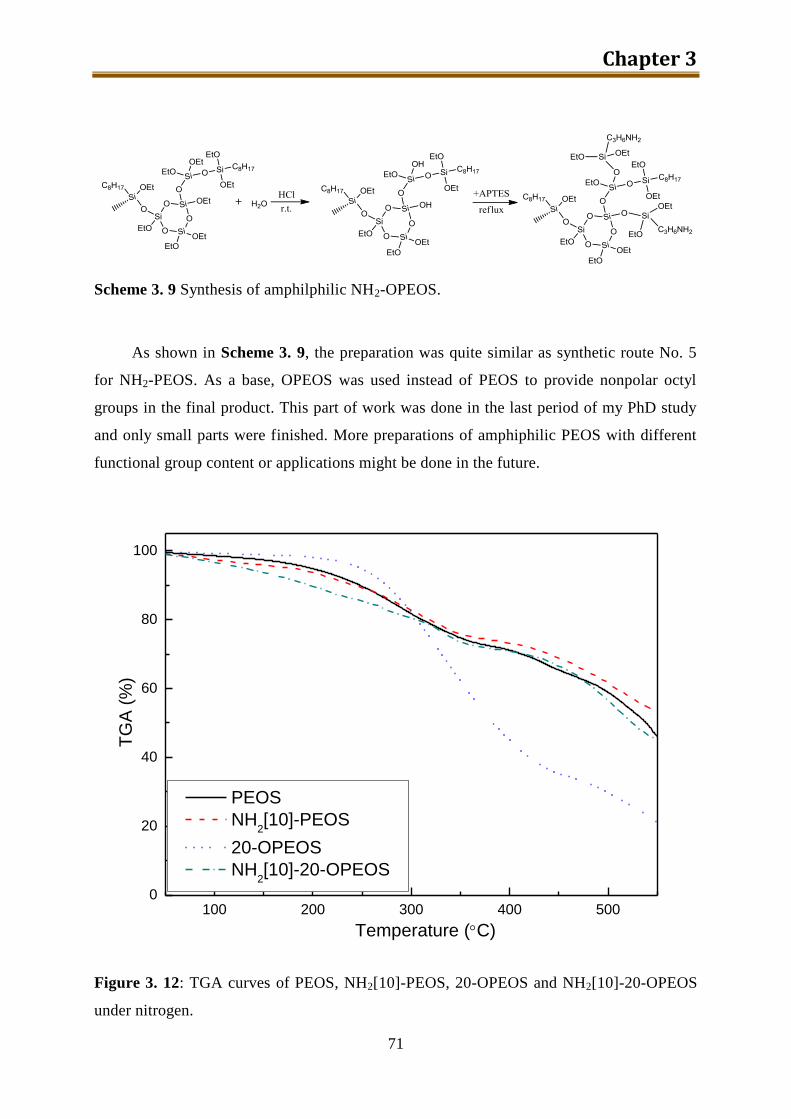
Chapter 3
71
Scheme 3. 9 Synthesis of amphilphilic NH2-OPEOS.
As shown in Scheme 3. 9, the preparation was quite similar as synthetic route No. 5
for NH2-PEOS. As a base, OPEOS was used instead of PEOS to provide nonpolar octyl
groups in the final product. This part of work was done in the last period of my PhD study
and only small parts were finished. More preparations of amphiphilic PEOS with different
functional group content or applications might be done in the future.
100 200 300 400 5000
20
40
60
80
100
PEOS
NH2[10]-PEOS
20-OPEOS
NH2[10]-20-OPEOS
TG
A (
%)
Temperature (C)
Figure 3. 12: TGA curves of PEOS, NH2[10]-PEOS, 20-OPEOS and NH2[10]-20-OPEOS
under nitrogen.
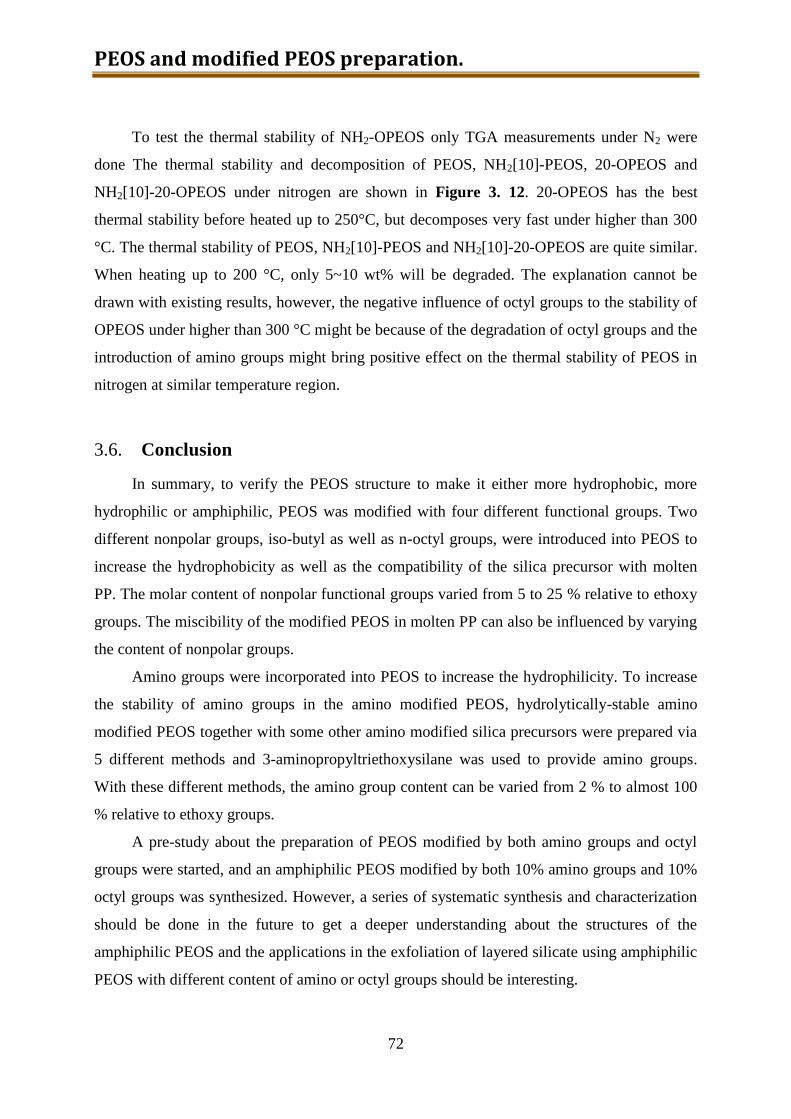
PEOS and modified PEOS preparation.
72
To test the thermal stability of NH2-OPEOS only TGA measurements under N2 were
done The thermal stability and decomposition of PEOS, NH2[10]-PEOS, 20-OPEOS and
NH2[10]-20-OPEOS under nitrogen are shown in Figure 3. 12. 20-OPEOS has the best
thermal stability before heated up to 250°C, but decomposes very fast under higher than 300
°C. The thermal stability of PEOS, NH2[10]-PEOS and NH2[10]-20-OPEOS are quite similar.
When heating up to 200 °C, only 5~10 wt% will be degraded. The explanation cannot be
drawn with existing results, however, the negative influence of octyl groups to the stability of
OPEOS under higher than 300 °C might be because of the degradation of octyl groups and the
introduction of amino groups might bring positive effect on the thermal stability of PEOS in
nitrogen at similar temperature region.
3.6. Conclusion
In summary, to verify the PEOS structure to make it either more hydrophobic, more
hydrophilic or amphiphilic, PEOS was modified with four different functional groups. Two
different nonpolar groups, iso-butyl as well as n-octyl groups, were introduced into PEOS to
increase the hydrophobicity as well as the compatibility of the silica precursor with molten
PP. The molar content of nonpolar functional groups varied from 5 to 25 % relative to ethoxy
groups. The miscibility of the modified PEOS in molten PP can also be influenced by varying
the content of nonpolar groups.
Amino groups were incorporated into PEOS to increase the hydrophilicity. To increase
the stability of amino groups in the amino modified PEOS, hydrolytically-stable amino
modified PEOS together with some other amino modified silica precursors were prepared via
5 different methods and 3-aminopropyltriethoxysilane was used to provide amino groups.
With these different methods, the amino group content can be varied from 2 % to almost 100
% relative to ethoxy groups.
A pre-study about the preparation of PEOS modified by both amino groups and octyl
groups were started, and an amphiphilic PEOS modified by both 10% amino groups and 10%
octyl groups was synthesized. However, a series of systematic synthesis and characterization
should be done in the future to get a deeper understanding about the structures of the
amphiphilic PEOS and the applications in the exfoliation of layered silicate using amphiphilic
PEOS with different content of amino or octyl groups should be interesting.
Chapter 3
73
Reference:
[1]. Kim, Y.H., Journal of Polymer Science Part a-Polymer Chemistry, 1998. 36(11): p.
1685-1698.
[2]. Voit, B., Journal of Polymer Science Part a-Polymer Chemistry, 2000. 38(14): p.
2505-2525.
[3]. Flory, P.J., Journal of the American Chemical Society, 1952. 74(11): p. 2718-2723.
[4]. Frey, H., Lach, C., and Lorenz, K., Advanced Materials, 1998. 10(4): p. 279-293.
[5]. Komber, H., et al., Macromolecules, 2001. 34(16): p. 5487-5493.
[6]. Russo, S., et al., Macromolecular Symposia, 1999. 143: p. 309-321.
[7]. Jikei, M., et al., Macromolecules, 1999. 32(6): p. 2061-2064.
[8]. Emrick, T., et al., Polymer Bulletin, 2000. 45(1): p. 1-7.
[9]. Dvornic, P.R., et al., Michigan Molecular Inst US6384172-B1; JP2002212294-A;
EP1219666-A2.
[10]. Dvornic, P.R., et al., Michigan Molecular Inst; Dvornic P R; Hu J; Meier D J;
Nowak R M EP1300434-A; EP1300434-A2; JP2003201406-A; US6646089-B2;
US2003088024-A1; US2003212234-A1; US2005277746-A1; US6995215-B2; US7446155-
B2.
[11]. Dvornic, P.R., et al., Dvornic P R; Hu J; Meier D J; Nowak R M; Parham P L;
Michigan Molecular Inst US2002161113-A1; US6534600-B2.
[12]. Bischoff, R. and Cray, S.E., Progress in Polymer Science, 1999. 24(2): p. 185-219.
[13]. Lang, H. and Luhmann, B., Advanced Materials, 2001. 13(20): p. 1523-+.
[14]. Frey, H. and Schlenk, C., Dendrimers Ii, 2000. 210: p. 69-129.
[15]. Abe, Y. and Gunji, T., Progress in Polymer Science, 2004. 29(3): p. 149-182.
[16]. Boulos, E.N., et al., Silicon-29 Nuclear Magnetic Resonance Spectroscopy of
Silicon Ethoxide and Titanium Ethoxide Sols: Resonance Assignments and Solution
Stability. 1988, Cambridge Journals Online.
[17]. Jaumann, M., et al., Macromolecular Chemistry and Physics, 2003. 204(7): p.
1014-1026.
[18]. Curran, M.D., Gedris, T.E., and Stiegman, A.E., Chemistry of Materials, 1998.
10(6): p. 1604-1612.
[19]. Zhu, X.M., et al., Macromolecules, 2006. 39(5): p. 1701-1708.
[20]. Holter, D., Burgath, A., and Frey, H., Acta Polymerica, 1997. 48(1-2): p. 30-35.
[21]. Gruenbauer, H.J.M., et al., WO 2009078725, 2009.

PEOS and modified PEOS preparation.
74
Chapter 4
75 *: The work in this chapter has been published in “J Sol-Gel Sci Technol. 2008, 48, 51-60.” and
“Macromolecules. 2010, 43, 6067-6074.”.
4. Preparation and morphology study of
iPP / silica composites via unmodified
PEOS*
4.1. Introduction
Polymeric/inorganic nanocomposites, in which at least one of the components has a
dimension smaller than 100 nm, have attracted a lot of attention nowadays for its special
properties and industrial applications [1-6]
. The application of nano-sized particles with huge
surface area and often anisotropic geometry in a polymeric matrix leads to incredible
changes in morphology and performance. Even at low filler volume fraction, significant
enhancements in thermal stability, flame retardancy, and mechanical and dielectric
properties have been detected[7-16]
.
Nanoscale silica particles are one of the most widely used reinforcing fillers. There
are three major procedures commonly applied to introduce nanoparticles in a polymeric
matrix: (a) blending in solution [17, 18]
; (b) blending in melt [19, 20]
; (c) in situ sol-gel
processing [21-23]
.
Nanoscale colloidal silica is commercially available in powder form, aqueous and
organic solutions. Direct blending the silica and polymer matrix in a certain solvent
provides a convenient route to form polymer/silica composites. This solution process is
simple and may yield high-quality nanocomposites; however, it is applicable only for
certain types of polymers, and cannot be upscale to big-scale manufacturing processes of
thermoplastics due to the huge consumption of solvent.
The melt-blending method is environmentally favorable due to the absence of organic
solvents. It is compatible with most of the current industrial processes, such as extrusion
and injection molding. However, due to the lightness of nansoscale silica powder, blending
Preparation and morphology study of iPP/silica composites via unmodified PEOS.
76
it with molten polymers is a difficult procedure. Nanoparticles are toxic because of the
small size and distributes through air as the so-called respirable dust. On the other hand, due
to the poor compatibility of hydrophilic silica nanoparticles with conventional hydrophobic
polymer matrices, this route can hardly result in real nanocomposites without particle
agglomeration. Nevertheless, melt-blending process for nanocomposite preparation has been
developed successfully when the silica particle surface has been modified with long alkyl
chains [24-26]
.
In situ sol-gel technology is based on mixing of silica precursor with a polymer
followed with a subsequent condensation of the precursor molecules. In a classical in situ
sol-gel process hydrolysis and then polycondensation of alkoxysilanes takes place under
acidic or basically environment in the solution of polymers [27-33]
. This method is, however,
not suitable for big-scale application due to the needs of relatively big amounts of solvents.
Sol-gel reactions of tetraethoxysilane (TEOS) in molten polypropylene (PP) [34]
, and of
tetrapropoxysilane (TPOS) in molten ethylene vinyl acetate copolymer (EVA) [35]
have been
reported. Because of the slow diffusion of TEOS in the very viscous molten PP, the silica
particles are relatively small and homogeneously dispersed in the PP matrix. The reactive
processing of EVA with TPOS was a two-step process with the existance of dibutyltin oxide
as a transesterification catalyst and quite small particles could be produced. However,
because of the volatility of TEOS and TPOS, the SiO2 content in composites can barely be
controlled, and it is difficult to generate composites with high inorganic content. In situ sol-
gel process for the preparation of PP/silica nanocomposite, where porous PP was absorbed
in silica sol, has been reported as well [23]
. This method is obviously not applicable for a
big-scale production.
In spite of the routes for the preparation of polymer/inorganic nanocomposites by sol
gel technology reported in the literature, these methods suffer from the multi-step procedure
and the requiring of water/organic solvents in the sol-gel process. In this chapter we propose a
new method based on a series of precursor for silica – hyperbranched polyethoxysiloxane
(PEOS) [36]
–that can be applied in thermoplastic processing heading for the development of a
solvent-free sol-gel technology for the in situ formation of nanoscale filler particles. With
different modification on the PEOS, the converted silica particles can be varied and
morphology of the final hybrid can be also different. Isotactic PP, a commercially available
and widely used polymer is selected as the matrix polymer in this study. A microcompounder,
developed by DSM Xplore, is used for the preparation of PP/silica composites. This
Chapter 4
77
equipment is a micro-scale twin-screw compounder, which has been designed to process up to
15 mL of polymer, mimicking the mixing behavior of large-scale twin-screw extruders. In
addition, this device allows a continuous processing procedure.
Unmodified PEOS was firstly chosen as the precursor of silica in the preparation of iPP
/ silica composite. As the most commonly investigated iPP / silica composite, a systematic
study on the morphology, rheology, thermal and mechanical properties were finished.
With different PEOS content, the resulting silica particle varied from microns to nano-
scale. As explained by the Einstein’s theory, the viscosity of a composite increases with
volume fraction of the filler. However, it has been recently demonstrated that nanoparticles
homogeneously distributed in the polymer matrix can reduce the polymer melt viscosity.[37-39]
The viscosity decrease was attributed in this case to increased free volume induced by the
nanoparticles. By measuring the diffusion coefficient of nanoparticles in the polymer melt via
dynamic X-ray scattering it has been revealed that the nanoparticles diffuse faster than the
entangled mesh and so do not participate in its dynamics, they simply occupy space to provide
a constraint release mechanism via dilution.[40]
As one of the most common processing techniques for the semicrystalline iPP,[41]
injection molding was used to produce the iPP / silica composites. In the course of injection
molding, iPP undergoes flow-induced crystallization. The presence of additives can have a
significant influence on this process, and varies the final morphology and properties of the
resulting articles.[42]
Recently, a combination of differential scanning calorimetry (DSC),
small- and wide-angle X-ray scattering (SAXS/WAXS) and 1H time-domain and frequency-
domain nuclear magnetic resonance (NMR) measurements was applied to determine the
rigid (crystalline), semi-rigid (interface) and mobile (amorphous) fractions in
semicrystalline iPP as a function of annealing time and temperature.[43]
The information
about the iPP microstructure detected by proton spin-diffusion NMR[44]
and SAXS allows to
address the effect of annealing,[43]
uniaxial stretching and ageing.[45, 46]
Solid-state NMR is a
powerful technique for investigation of morphology and chain dynamics of polymer
materials.[44, 47-49]
The phase composition and size of different structural domains can be
normally determined based on the wide-line NMR spectra and spin-diffusion measurements,
respectively. Comparing with X-ray scattering, NMR can provide additional information on
the intermediate phase between the rigid and mobile fractions associated with the
semicrystalline lamellar structure.[50-53]
The interface region is characterized by a degree of
order in the direction perpendicular to the basal lamellae surface along with disorder in the

Preparation and morphology study of iPP/silica composites via unmodified PEOS.
78
lateral direction, and is one of the key factors determining the overall morphology and the
mechanical properties of semicrystalline polymers.
More detailed work was completed to study the influence of the in-situ formed silica
particles on the structure formation in the iPP/silica composites during the injection molding
process and to establish correlations between the morphology of the injection-molded
articles and their rheological and mechanical properties.
4.2. Experimental
Materials. Hyperbranched polyethoxysiloxane (PEOS) were prepared according to the
procedure reported previously [36]
using a stoichiometric one to one reaction mixture of
tetraethoxysilane (TEOS) and acetic anhydride with 0.3 mol % of a catalyst (relative to
TEOS). The volatile fractions and small molecules were removed using a thin-film evaporator
operating at 150 °C and then in vacuum of 10-2
mbar. According to size-exclusion
chromatography data in chloroform calibrated with polystyrene standards, PEOS product has
Mn = 1740, Mw = 3330. The degree of branching (DB) was determined by 29
Si-NMR to be
0.54, and SiO2 content was 50 %.
Isotactic polypropylene (iPP, MOPLEN, HF500N) was obtained from Basell AG, and
was used as received. Aluminum isopropoxide (98+%, Aldrich), sodium hypochlorite
(aqueous solution containing 13% of free chlorine, Acros) and ruthenium (III) chloride
hydrate (Fluka) were used without further purification.
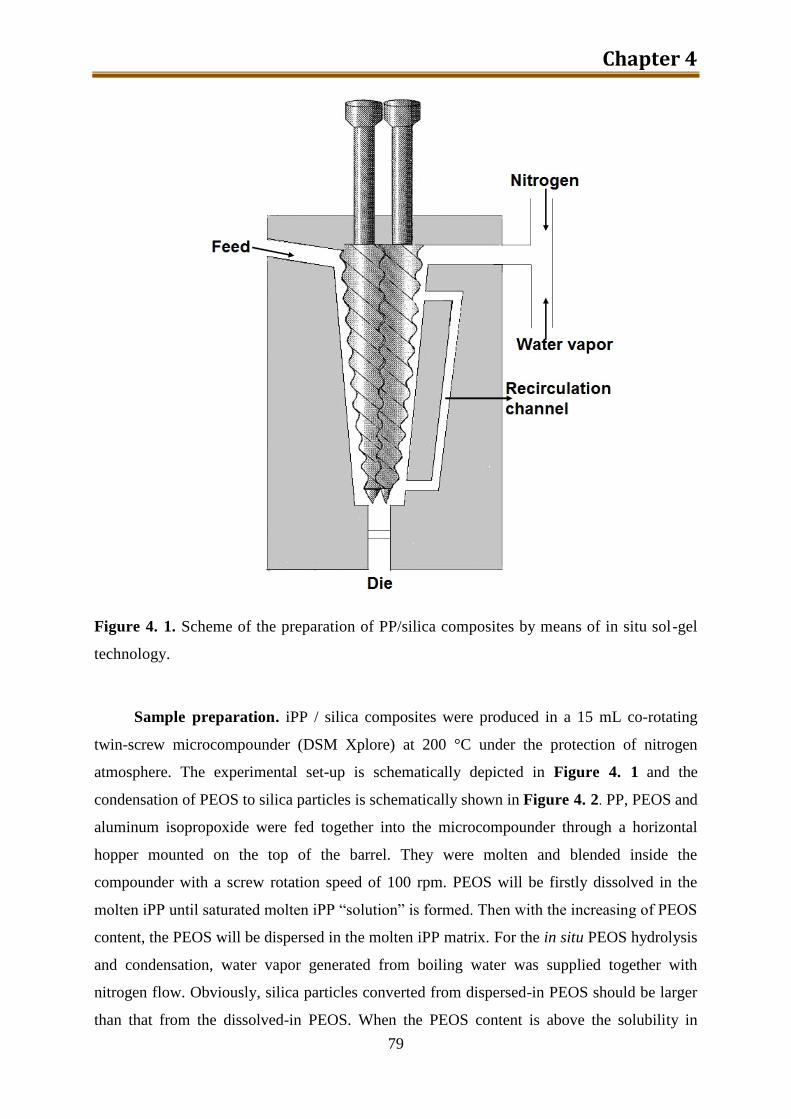
Chapter 4
79
Figure 4. 1. Scheme of the preparation of PP/silica composites by means of in situ sol-gel
technology.
Sample preparation. iPP / silica composites were produced in a 15 mL co-rotating
twin-screw microcompounder (DSM Xplore) at 200 °C under the protection of nitrogen
atmosphere. The experimental set-up is schematically depicted in Figure 4. 1 and the
condensation of PEOS to silica particles is schematically shown in Figure 4. 2. PP, PEOS and
aluminum isopropoxide were fed together into the microcompounder through a horizontal
hopper mounted on the top of the barrel. They were molten and blended inside the
compounder with a screw rotation speed of 100 rpm. PEOS will be firstly dissolved in the
molten iPP until saturated molten iPP “solution” is formed. Then with the increasing of PEOS
content, the PEOS will be dispersed in the molten iPP matrix. For the in situ PEOS hydrolysis
and condensation, water vapor generated from boiling water was supplied together with
nitrogen flow. Obviously, silica particles converted from dispersed-in PEOS should be larger
than that from the dissolved-in PEOS. When the PEOS content is above the solubility in
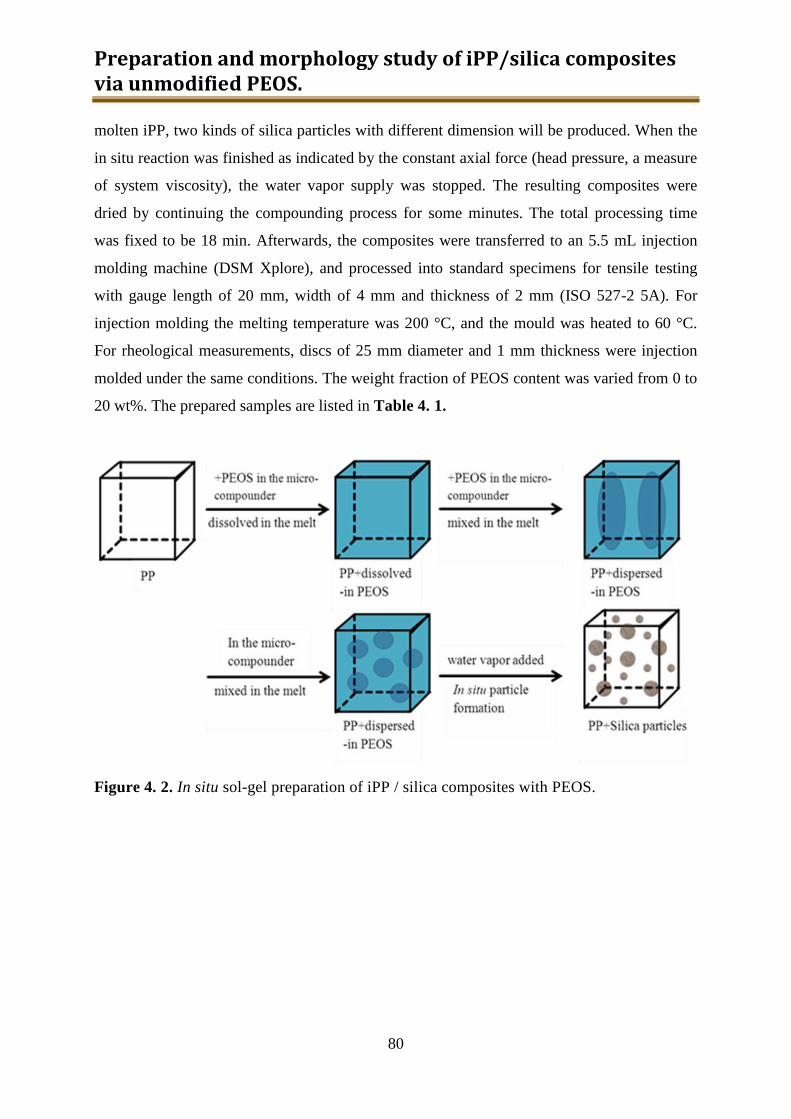
Preparation and morphology study of iPP/silica composites via unmodified PEOS.
80
molten iPP, two kinds of silica particles with different dimension will be produced. When the
in situ reaction was finished as indicated by the constant axial force (head pressure, a measure
of system viscosity), the water vapor supply was stopped. The resulting composites were
dried by continuing the compounding process for some minutes. The total processing time
was fixed to be 18 min. Afterwards, the composites were transferred to an 5.5 mL injection
molding machine (DSM Xplore), and processed into standard specimens for tensile testing
with gauge length of 20 mm, width of 4 mm and thickness of 2 mm (ISO 527-2 5A). For
injection molding the melting temperature was 200 °C, and the mould was heated to 60 °C.
For rheological measurements, discs of 25 mm diameter and 1 mm thickness were injection
molded under the same conditions. The weight fraction of PEOS content was varied from 0 to
20 wt%. The prepared samples are listed in Table 4. 1.
Figure 4. 2. In situ sol-gel preparation of iPP / silica composites with PEOS.
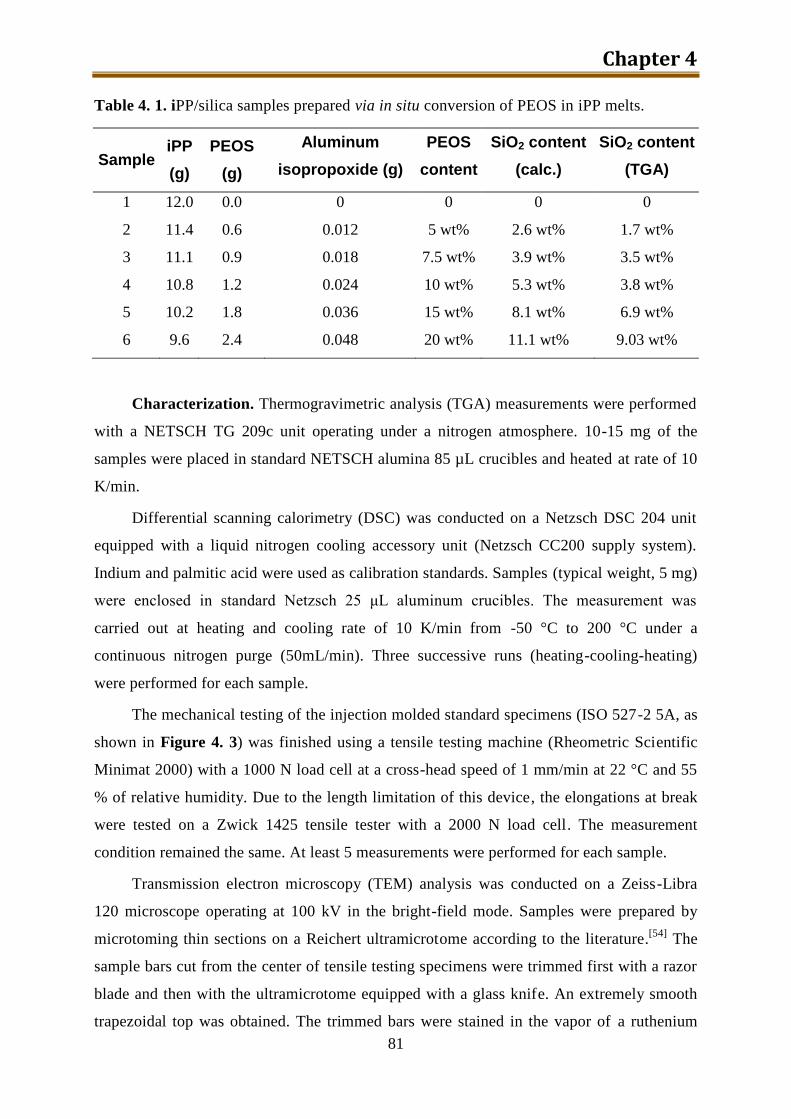
Chapter 4
81
Table 4. 1. iPP/silica samples prepared via in situ conversion of PEOS in iPP melts.
Sample iPP
(g)
PEOS
(g)
Aluminum
isopropoxide (g)
PEOS
content
SiO2 content
(calc.)
SiO2 content
(TGA)
1 12.0 0.0 0 0 0 0
2 11.4 0.6 0.012 5 wt% 2.6 wt% 1.7 wt%
3 11.1 0.9 0.018 7.5 wt% 3.9 wt% 3.5 wt%
4 10.8 1.2 0.024 10 wt% 5.3 wt% 3.8 wt%
5 10.2 1.8 0.036 15 wt% 8.1 wt% 6.9 wt%
6 9.6 2.4 0.048 20 wt% 11.1 wt% 9.03 wt%
Characterization. Thermogravimetric analysis (TGA) measurements were performed
with a NETSCH TG 209c unit operating under a nitrogen atmosphere. 10-15 mg of the
samples were placed in standard NETSCH alumina 85 µL crucibles and heated at rate of 10
K/min.
Differential scanning calorimetry (DSC) was conducted on a Netzsch DSC 204 unit
equipped with a liquid nitrogen cooling accessory unit (Netzsch CC200 supply system).
Indium and palmitic acid were used as calibration standards. Samples (typical weight, 5 mg)
were enclosed in standard Netzsch 25 μL aluminum crucibles. The measurement was
carried out at heating and cooling rate of 10 K/min from -50 °C to 200 °C under a
continuous nitrogen purge (50mL/min). Three successive runs (heating-cooling-heating)
were performed for each sample.
The mechanical testing of the injection molded standard specimens (ISO 527-2 5A, as
shown in Figure 4. 3) was finished using a tensile testing machine (Rheometric Scientific
Minimat 2000) with a 1000 N load cell at a cross-head speed of 1 mm/min at 22 °C and 55
% of relative humidity. Due to the length limitation of this device, the elongations at break
were tested on a Zwick 1425 tensile tester with a 2000 N load cell. The measurement
condition remained the same. At least 5 measurements were performed for each sample.
Transmission electron microscopy (TEM) analysis was conducted on a Zeiss-Libra
120 microscope operating at 100 kV in the bright-field mode. Samples were prepared by
microtoming thin sections on a Reichert ultramicrotome according to the literature.[54]
The
sample bars cut from the center of tensile testing specimens were trimmed first with a razor
blade and then with the ultramicrotome equipped with a glass knife. An extremely smooth
trapezoidal top was obtained. The trimmed bars were stained in the vapor of a ruthenium
Preparation and morphology study of iPP/silica composites via unmodified PEOS.
82
tetraoxide solution freshly prepared from ruthenium trichloride hydrate in an aqueous
solution of sodium hypochloride for 48 h. After staining, the bars were washed in a 3%
aqueous solution of sodium periodate and then in distilled water, and in the end were dried
in a desiccator. The final ultrathin sections with thickness less than 150 nm as indicated by
the interference color were obtained at ambient temperature with a diamond knife (45°,
Diatome). The sections were transferred on copper grids and applied in the TEM.
Small- and wide-angle X-ray scattering (SAXS/WAXS) experiments were performed
on a custom-built SAXS/WAXS machine coupled to a Rigaku MicroMax™-007 HF
rotating anode generator ( =1.54Å). The dimension of the point-like X-ray beam on the
sample was approx. 300 µm. The 2D WAXS data were collected using X-ray sensitive Fuji
image plates with the pixel size of 100x100 µm2. SAXS data were recorded with a 2D
multi-wire detector. The modulus of the scattering vector s (s = 2sin/, where is the
Bragg angle) was calibrated using three diffraction orders of silver behenate. The hole in the
center of the image plate allows performing simultaneous SAXS and WAXS measurements.
For X-ray diffraction (XRD) measurements small pieces of iPP composites were cut
out from the central part of standard specimens for tensile testing as depicted in Figure 4. 3.
The surfaces which are parallel to the machine direction (MD) and perpendicular to the
transverse direction (TD) were removed to minimize the influence of different thermal
history to the crystallinity behaviour.

Chapter 4
83
Figure 4. 3. Injection-molded iPP/silica specimen showing the central part cut out from it
for SAXS/WAXS measurements. The MD and TD stand for the machine and transverse
direction, respectively.
Only α-phase can be detected from the diffraction patterns of pure iPP, while -crystals
also present in the iPP composites. The experimental Lorenz-corrected WAXS curves were
fitted with a sum of Gaussian functions (cf. Figure 4. 4) corresponding to the crystalline
peaks and the amorphous halo. Since the relative content of different crystalline phase can be
calculated via the intensity of related peaks, the entire area of the most intense peaks such as
the 110, 040, 130, 111, 13-1/041, 150, 060 and 220 for the α-phase, 300 and 311 for the -
phase were normalized by the total intensity. Since the amorphous halo of the composite
samples also contains the contribution from amorphous silica, its intensity was renormalized
by the iPP fraction.
surface
core
surface
MD
TD
Z-s
can
surface
core
surface
MD
TD
Z-s
can
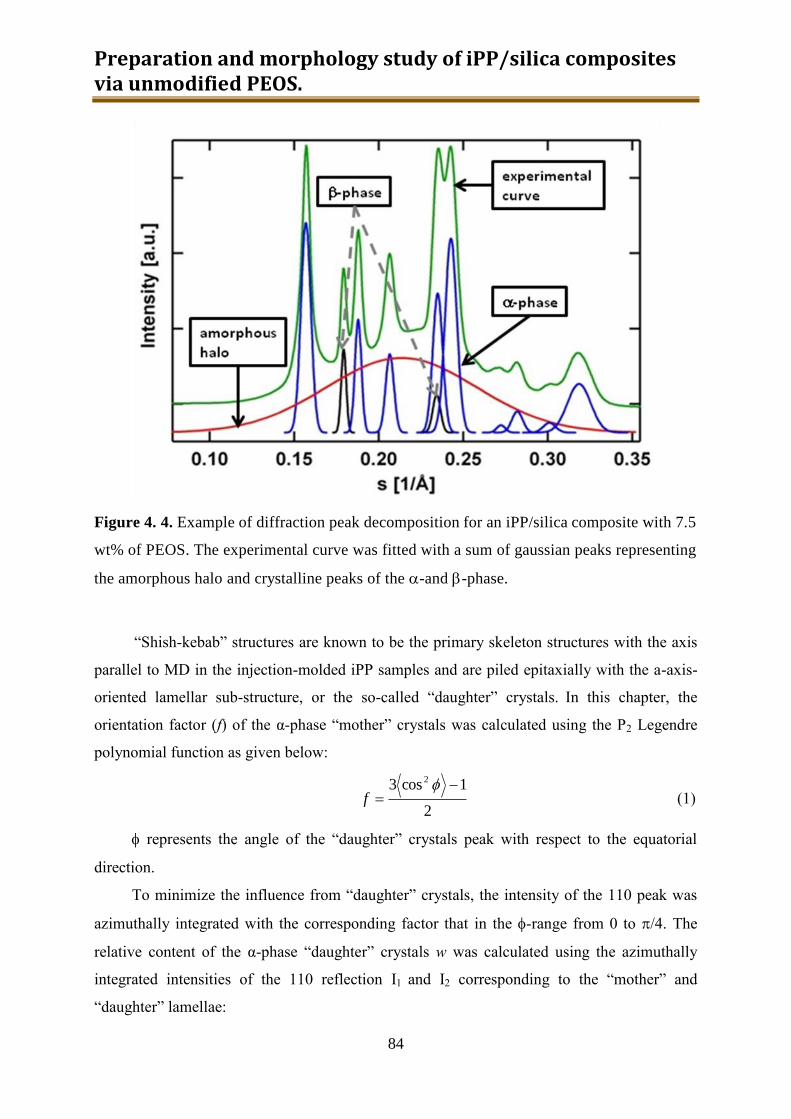
Preparation and morphology study of iPP/silica composites via unmodified PEOS.
84
Figure 4. 4. Example of diffraction peak decomposition for an iPP/silica composite with 7.5
wt% of PEOS. The experimental curve was fitted with a sum of gaussian peaks representing
the amorphous halo and crystalline peaks of the -and -phase.
“Shish-kebab” structures are known to be the primary skeleton structures with the axis
parallel to MD in the injection-molded iPP samples and are piled epitaxially with the a-axis-
oriented lamellar sub-structure, or the so-called “daughter” crystals. In this chapter, the
orientation factor (f) of the α-phase “mother” crystals was calculated using the P2 Legendre
polynomial function as given below:
2
1cos3 2
f (1)
represents the angle of the “daughter” crystals peak with respect to the equatorial
direction.
To minimize the influence from “daughter” crystals, the intensity of the 110 peak was
azimuthally integrated with the corresponding factor that in the -range from 0 to /4. The
relative content of the α-phase “daughter” crystals w was calculated using the azimuthally
integrated intensities of the 110 reflection I1 and I2 corresponding to the “mother” and
“daughter” lamellae:

Chapter 4
85
)0(
cos)(
1
2
I
Iw
(2)
Because of the very limited angular spread of the 110 peak, the cosine correction was
neglected in the orientation factor calculation.
The thickness of the amorphous (La) and crystalline (Lc) domains as well as long period
(LB ≡ La + Lc) were calculated from the conventional SAXS Interface Distribution functions
(IDF).26, 27
The micro-structural analysis based on these functions is illustrated in Figure 4. 5.
Figure 4. 5. Interface distribution functions (IDF) computed from 1D SAXS patterns
for pure iPP and iPP composite with 20 wt% PEOS as indicated by the dashed arrows
in the figure.
As shown in Figure 4. 5, the LB values are calculated from the first minimum of the
IDF whereas the Lc and La can be discriminated from the starting part of the IDF. However,
shown in the Babinet principle, SAXS data alone cannot fully explain the attribution of the
distances and additional characterizations like WAXS or DSC would be needed to provide
detailed structural information.
Size-exclusion chromatography (SEC) analyses were conducted with a high-pressure
liquid chromatography pump (LC 1120, Polymer laboratories) and an evaporative light
scattering detector (PL-ELS-1000, Polymer laboratories). Chloroform (für HPLC, Fisher
Scientific) was used as the eluting solvent. The flowing rate was 0.8 mL/min and the sample
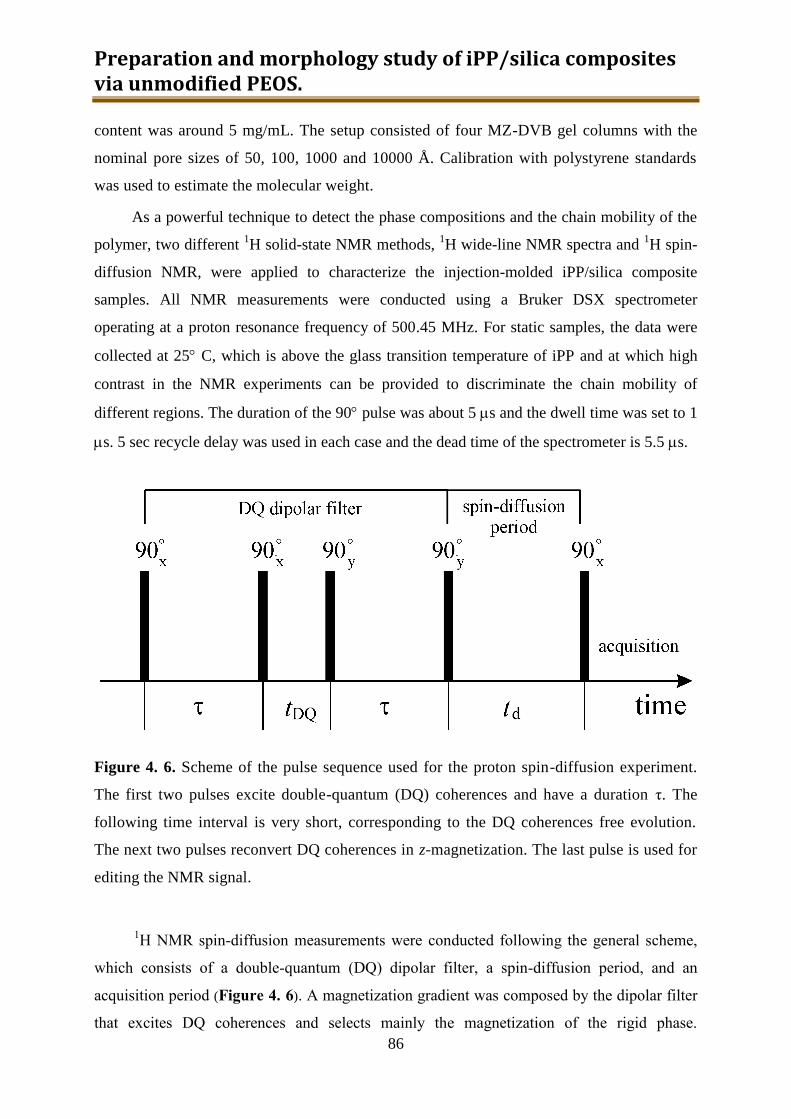
Preparation and morphology study of iPP/silica composites via unmodified PEOS.
86
content was around 5 mg/mL. The setup consisted of four MZ-DVB gel columns with the
nominal pore sizes of 50, 100, 1000 and 10000 Å. Calibration with polystyrene standards
was used to estimate the molecular weight.
As a powerful technique to detect the phase compositions and the chain mobility of the
polymer, two different 1H solid-state NMR methods,
1H wide-line NMR spectra and
1H spin-
diffusion NMR, were applied to characterize the injection-molded iPP/silica composite
samples. All NMR measurements were conducted using a Bruker DSX spectrometer
operating at a proton resonance frequency of 500.45 MHz. For static samples, the data were
collected at 25 C, which is above the glass transition temperature of iPP and at which high
contrast in the NMR experiments can be provided to discriminate the chain mobility of
different regions. The duration of the 90 pulse was about 5 s and the dwell time was set to 1
s. 5 sec recycle delay was used in each case and the dead time of the spectrometer is 5.5 s.
Figure 4. 6. Scheme of the pulse sequence used for the proton spin-diffusion experiment.
The first two pulses excite double-quantum (DQ) coherences and have a duration τ. The
following time interval is very short, corresponding to the DQ coherences free evolution.
The next two pulses reconvert DQ coherences in z-magnetization. The last pulse is used for
editing the NMR signal.
1H NMR spin-diffusion measurements were conducted following the general scheme,
which consists of a double-quantum (DQ) dipolar filter, a spin-diffusion period, and an
acquisition period (Figure 4. 6). A magnetization gradient was composed by the dipolar filter
that excites DQ coherences and selects mainly the magnetization of the rigid phase.
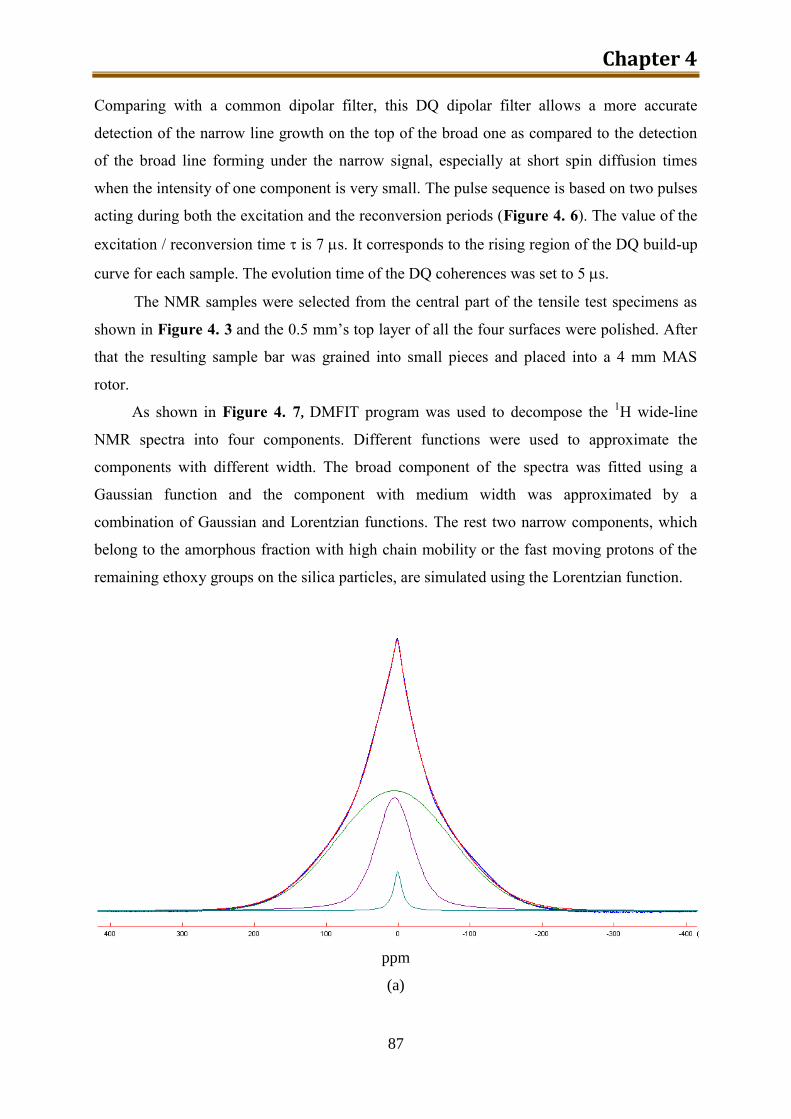
Chapter 4
87
Comparing with a common dipolar filter, this DQ dipolar filter allows a more accurate
detection of the narrow line growth on the top of the broad one as compared to the detection
of the broad line forming under the narrow signal, especially at short spin diffusion times
when the intensity of one component is very small. The pulse sequence is based on two pulses
acting during both the excitation and the reconversion periods (Figure 4. 6). The value of the
excitation / reconversion time is 7 s. It corresponds to the rising region of the DQ build-up
curve for each sample. The evolution time of the DQ coherences was set to 5 s.
The NMR samples were selected from the central part of the tensile test specimens as
shown in Figure 4. 3 and the 0.5 mm’s top layer of all the four surfaces were polished. After
that the resulting sample bar was grained into small pieces and placed into a 4 mm MAS
rotor.
As shown in Figure 4. 7, DMFIT program was used to decompose the 1H wide-line
NMR spectra into four components. Different functions were used to approximate the
components with different width. The broad component of the spectra was fitted using a
Gaussian function and the component with medium width was approximated by a
combination of Gaussian and Lorentzian functions. The rest two narrow components, which
belong to the amorphous fraction with high chain mobility or the fast moving protons of the
remaining ethoxy groups on the silica particles, are simulated using the Lorentzian function.
ppm
(a)
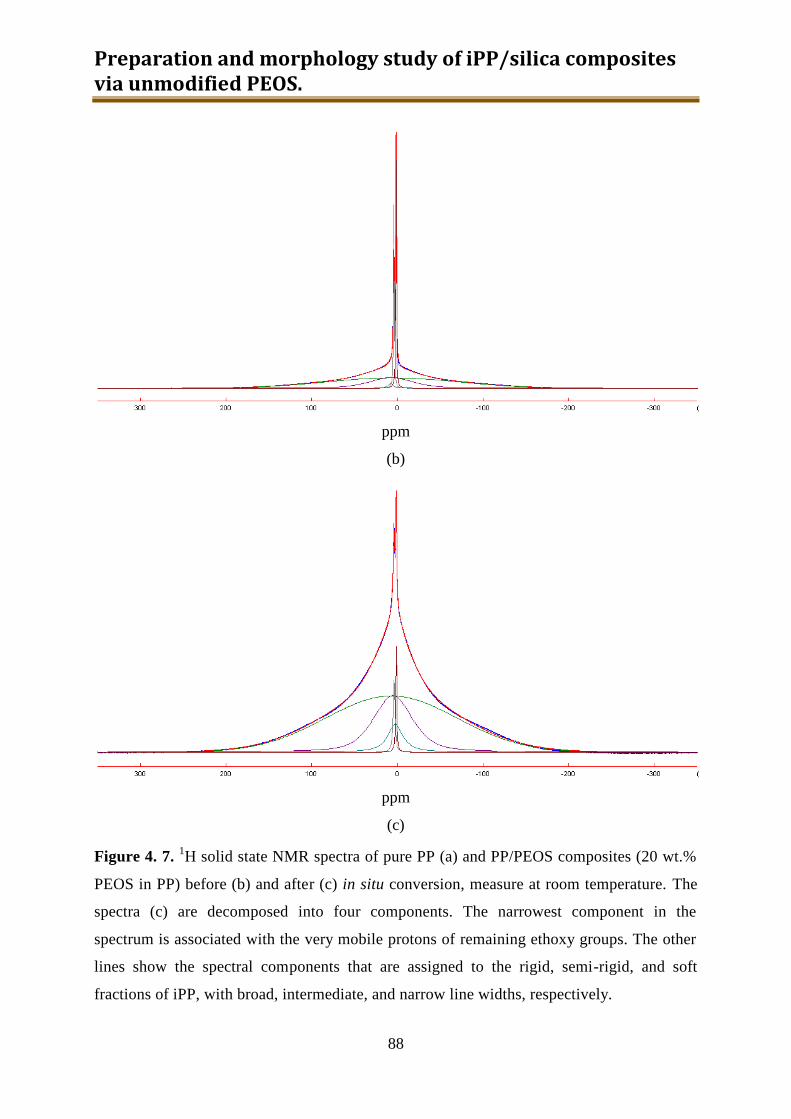
Preparation and morphology study of iPP/silica composites via unmodified PEOS.
88
ppm
(b)
ppm
(c)
Figure 4. 7. 1H solid state NMR spectra of pure PP (a) and PP/PEOS composites (20 wt.%
PEOS in PP) before (b) and after (c) in situ conversion, measure at room temperature. The
spectra (c) are decomposed into four components. The narrowest component in the
spectrum is associated with the very mobile protons of remaining ethoxy groups. The other
lines show the spectral components that are assigned to the rigid, semi-rigid, and soft
fractions of iPP, with broad, intermediate, and narrow line widths, respectively.
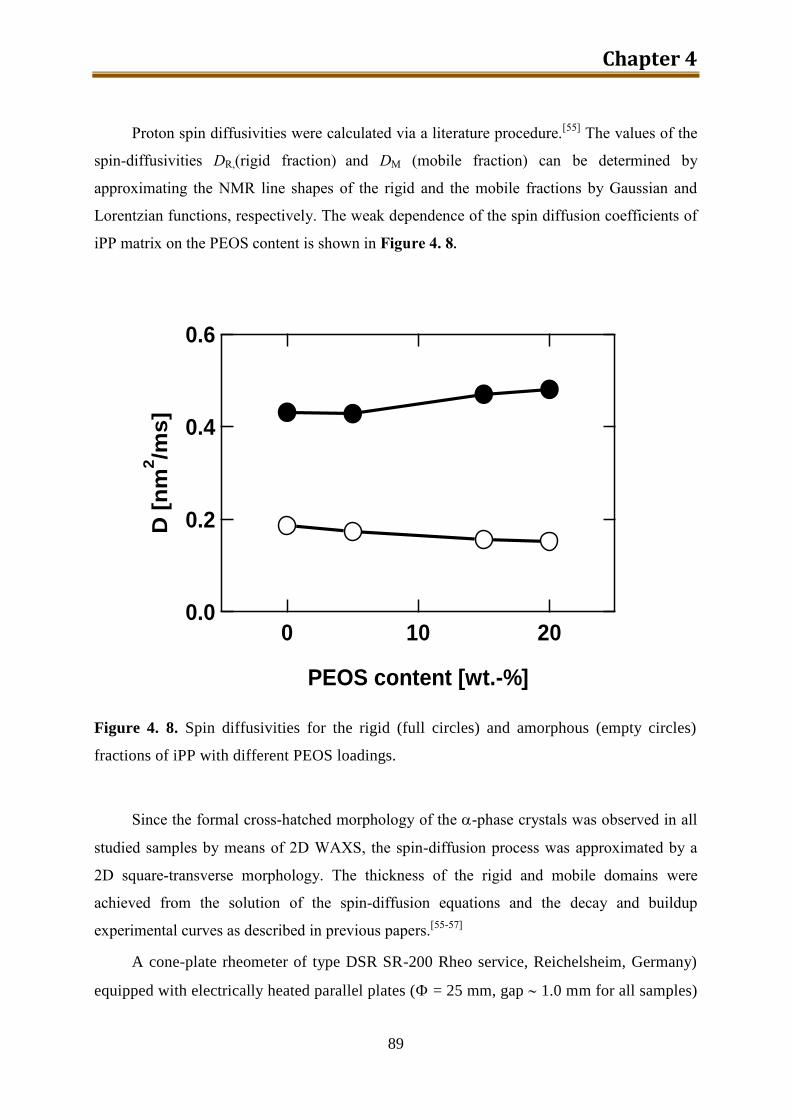
Chapter 4
89
Proton spin diffusivities were calculated via a literature procedure.[55]
The values of the
spin-diffusivities DR,(rigid fraction) and DM (mobile fraction) can be determined by
approximating the NMR line shapes of the rigid and the mobile fractions by Gaussian and
Lorentzian functions, respectively. The weak dependence of the spin diffusion coefficients of
iPP matrix on the PEOS content is shown in Figure 4. 8.
Figure 4. 8. Spin diffusivities for the rigid (full circles) and amorphous (empty circles)
fractions of iPP with different PEOS loadings.
Since the formal cross-hatched morphology of the -phase crystals was observed in all
studied samples by means of 2D WAXS, the spin-diffusion process was approximated by a
2D square-transverse morphology. The thickness of the rigid and mobile domains were
achieved from the solution of the spin-diffusion equations and the decay and buildup
experimental curves as described in previous papers.[55-57]
A cone-plate rheometer of type DSR SR-200 Rheo service, Reichelsheim, Germany)
equipped with electrically heated parallel plates ( = 25 mm, gap 1.0 mm for all samples)
0.6
0.4
0.2
0.0
D [
nm
2/m
s]
20100
PEOS content [wt.-%]
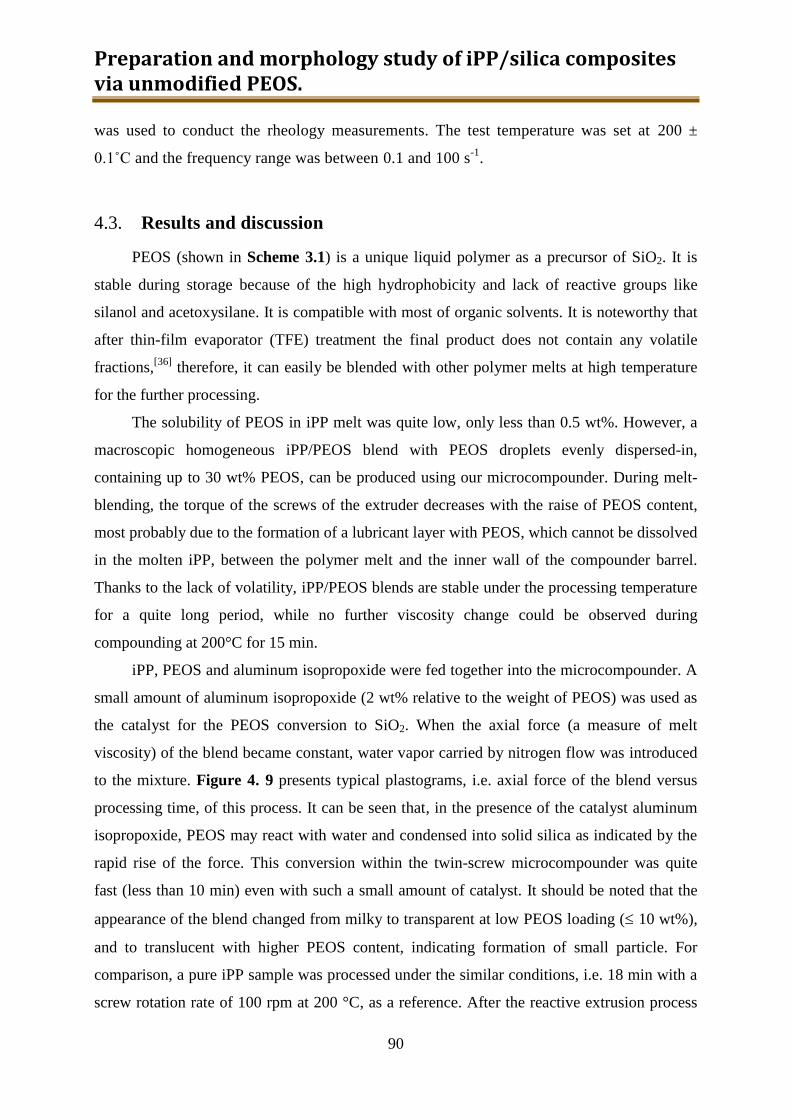
Preparation and morphology study of iPP/silica composites via unmodified PEOS.
90
was used to conduct the rheology measurements. The test temperature was set at 200 ±
0.1˚C and the frequency range was between 0.1 and 100 s-1
.
4.3. Results and discussion
PEOS (shown in Scheme 3.1) is a unique liquid polymer as a precursor of SiO2. It is
stable during storage because of the high hydrophobicity and lack of reactive groups like
silanol and acetoxysilane. It is compatible with most of organic solvents. It is noteworthy that
after thin-film evaporator (TFE) treatment the final product does not contain any volatile
fractions,[36]
therefore, it can easily be blended with other polymer melts at high temperature
for the further processing.
The solubility of PEOS in iPP melt was quite low, only less than 0.5 wt%. However, a
macroscopic homogeneous iPP/PEOS blend with PEOS droplets evenly dispersed-in,
containing up to 30 wt% PEOS, can be produced using our microcompounder. During melt-
blending, the torque of the screws of the extruder decreases with the raise of PEOS content,
most probably due to the formation of a lubricant layer with PEOS, which cannot be dissolved
in the molten iPP, between the polymer melt and the inner wall of the compounder barrel.
Thanks to the lack of volatility, iPP/PEOS blends are stable under the processing temperature
for a quite long period, while no further viscosity change could be observed during
compounding at 200°C for 15 min.
iPP, PEOS and aluminum isopropoxide were fed together into the microcompounder. A
small amount of aluminum isopropoxide (2 wt% relative to the weight of PEOS) was used as
the catalyst for the PEOS conversion to SiO2. When the axial force (a measure of melt
viscosity) of the blend became constant, water vapor carried by nitrogen flow was introduced
to the mixture. Figure 4. 9 presents typical plastograms, i.e. axial force of the blend versus
processing time, of this process. It can be seen that, in the presence of the catalyst aluminum
isopropoxide, PEOS may react with water and condensed into solid silica as indicated by the
rapid rise of the force. This conversion within the twin-screw microcompounder was quite
fast (less than 10 min) even with such a small amount of catalyst. It should be noted that the
appearance of the blend changed from milky to transparent at low PEOS loading ( 10 wt%),
and to translucent with higher PEOS content, indicating formation of small particle. For
comparison, a pure iPP sample was processed under the similar conditions, i.e. 18 min with a
screw rotation rate of 100 rpm at 200 °C, as a reference. After the reactive extrusion process

Chapter 4
91
finished, the resulting melts were directly further processed into standard specimens for
tensile testing by injection molding. The samples prepared in this study were summarized in
Table 4. 1. The theoretical SiO2 content of the resulting PP/silica composites was calculated
taking 50 wt% of SiO2 in PEOS which was mentioned in Chapter 3 into account. The SiO2
content obtained from TGA measurement (the residual mass after pyrolysis at 600°C) fits
quite well with the theoretical values.
0 6 12 180
2
4
6
Time (min)
Axia
l fo
rce (
kN
)
Water vapor applied
Adding PP/PEOS/catalyst
(a)
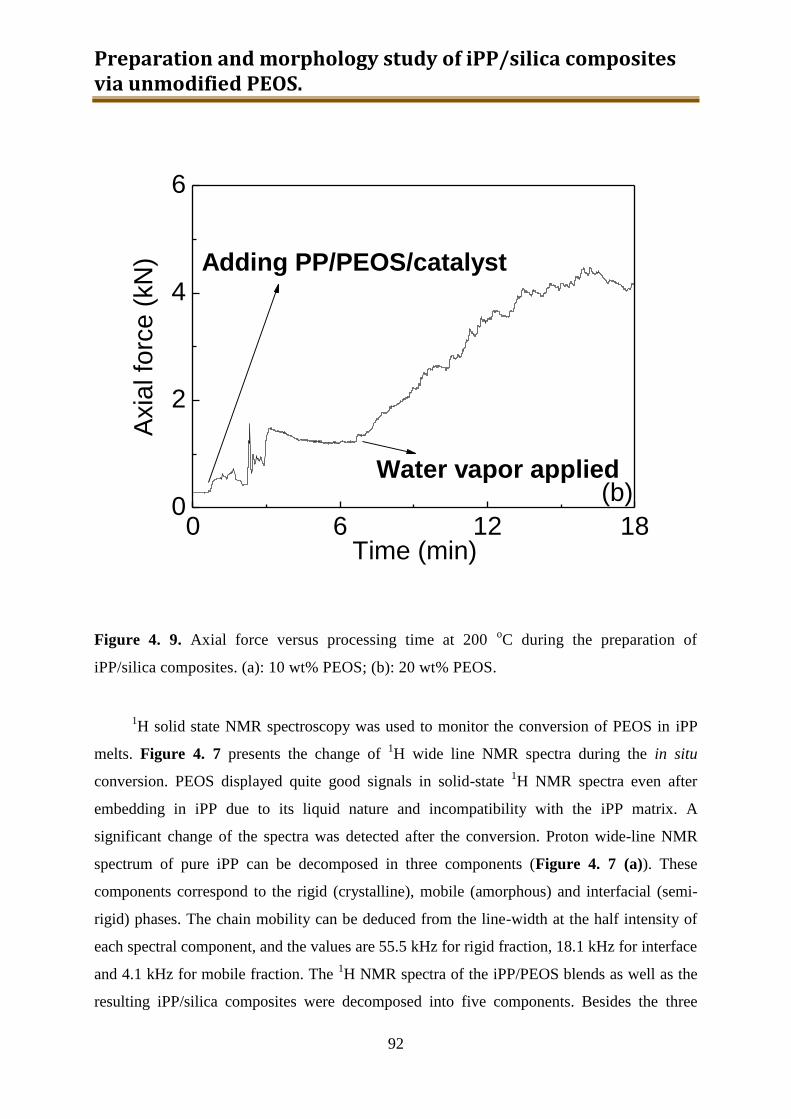
Preparation and morphology study of iPP/silica composites via unmodified PEOS.
92
0 6 12 180
2
4
6
Time (min)
Axia
l fo
rce (
kN
) Adding PP/PEOS/catalyst
Water vapor applied
(b)
Figure 4. 9. Axial force versus processing time at 200 oC during the preparation of
iPP/silica composites. (a): 10 wt% PEOS; (b): 20 wt% PEOS.
1H solid state NMR spectroscopy was used to monitor the conversion of PEOS in iPP
melts. Figure 4. 7 presents the change of 1H wide line NMR spectra during the in situ
conversion. PEOS displayed quite good signals in solid-state 1H NMR spectra even after
embedding in iPP due to its liquid nature and incompatibility with the iPP matrix. A
significant change of the spectra was detected after the conversion. Proton wide-line NMR
spectrum of pure iPP can be decomposed in three components (Figure 4. 7 (a)). These
components correspond to the rigid (crystalline), mobile (amorphous) and interfacial (semi-
rigid) phases. The chain mobility can be deduced from the line-width at the half intensity of
each spectral component, and the values are 55.5 kHz for rigid fraction, 18.1 kHz for interface
and 4.1 kHz for mobile fraction. The 1H NMR spectra of the iPP/PEOS blends as well as the
resulting iPP/silica composites were decomposed into five components. Besides the three
Chapter 4
93
components belonging to pure iPP, two narrow peaks were detected at 3.9 ppm and 1.3 ppm
that corresponded to CH2 and CH3 of ethoxysilane group (Figure 4. 7 (c)). Comparing the
areas of CH2 and CH3 signals before and after conversion we could calculate the percentage
of the remaining ethoxysilane groups, which is shown in Table 4. 2. It can be seen that
despite the high hydrophobicity of iPP matrix, the in situ conversion of PEOS proceeded to a
very large extent. After conversion from PEOS to silica particles, the remaining ethoxy
groups should be found only on the surface of the silica particles. With more PEOS loaded,
bigger silica particles will be formed and the specific surface area of the silica particles may
decrease. This could explain that with the increase of PEOS content, the remaining ethoxy
group percentage content reduced.
Figure 4. 10. The amounts of rigid (squares), semi-rigid (triangles), and mobile (circles)
fractions of iPP as a function of PEOS content measured from 1H wide-line NMR spectra.
60
40
20
0
Fra
cti
on
[%
]
20100
PEOS content [wt.-%]
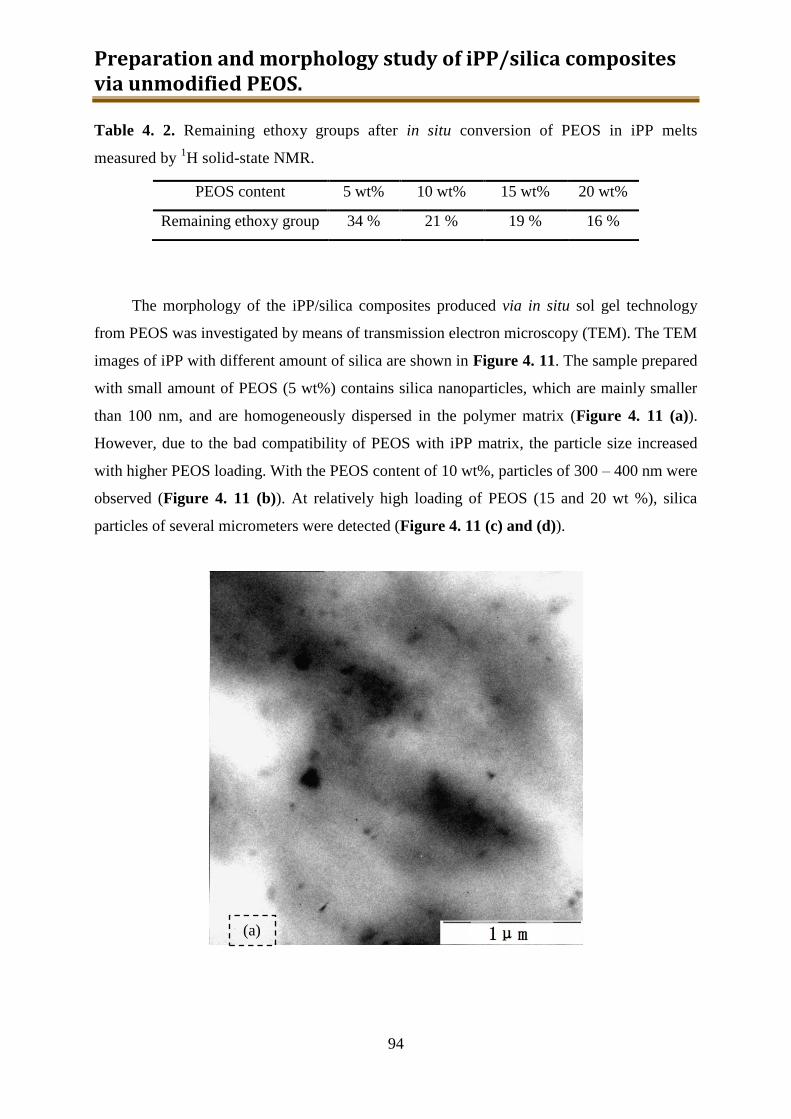
Preparation and morphology study of iPP/silica composites via unmodified PEOS.
94
Table 4. 2. Remaining ethoxy groups after in situ conversion of PEOS in iPP melts
measured by 1H solid-state NMR.
PEOS content 5 wt% 10 wt% 15 wt% 20 wt%
Remaining ethoxy group 34 % 21 % 19 % 16 %
The morphology of the iPP/silica composites produced via in situ sol gel technology
from PEOS was investigated by means of transmission electron microscopy (TEM). The TEM
images of iPP with different amount of silica are shown in Figure 4. 11. The sample prepared
with small amount of PEOS (5 wt%) contains silica nanoparticles, which are mainly smaller
than 100 nm, and are homogeneously dispersed in the polymer matrix (Figure 4. 11 (a)).
However, due to the bad compatibility of PEOS with iPP matrix, the particle size increased
with higher PEOS loading. With the PEOS content of 10 wt%, particles of 300 – 400 nm were
observed (Figure 4. 11 (b)). At relatively high loading of PEOS (15 and 20 wt %), silica
particles of several micrometers were detected (Figure 4. 11 (c) and (d)).
(a)
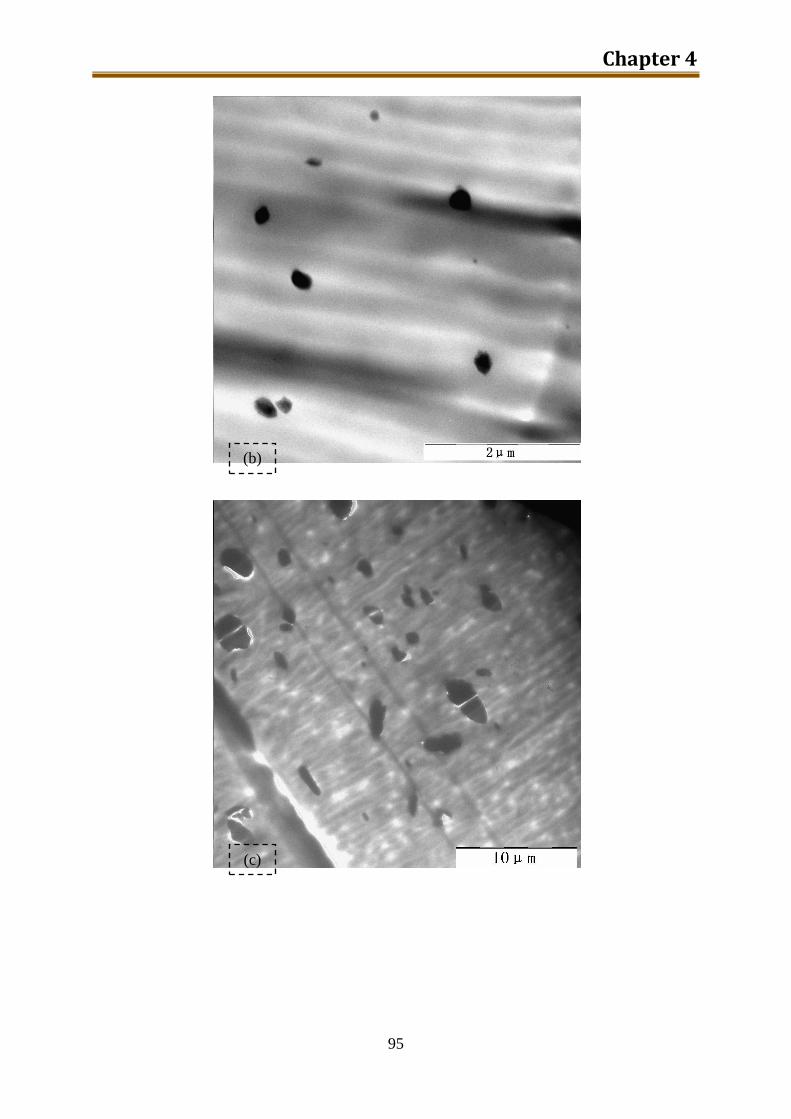
Chapter 4
95
(b)
(c)
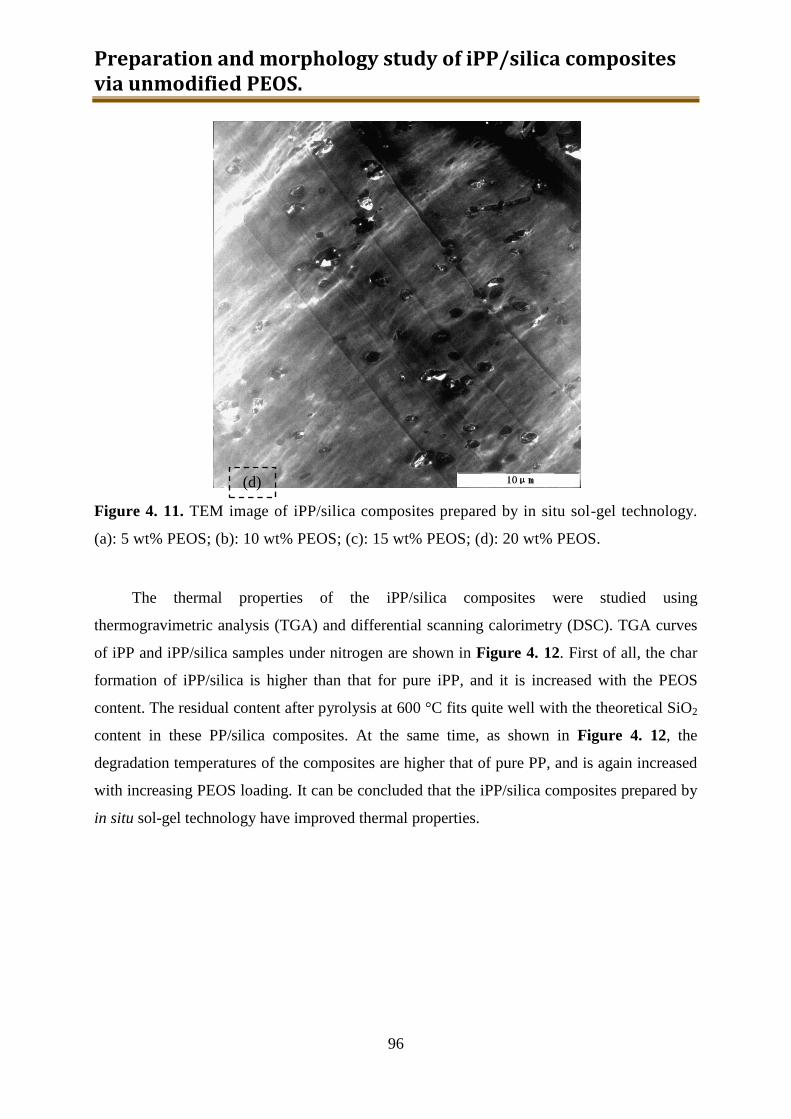
Preparation and morphology study of iPP/silica composites via unmodified PEOS.
96
Figure 4. 11. TEM image of iPP/silica composites prepared by in situ sol-gel technology.
(a): 5 wt% PEOS; (b): 10 wt% PEOS; (c): 15 wt% PEOS; (d): 20 wt% PEOS.
The thermal properties of the iPP/silica composites were studied using
thermogravimetric analysis (TGA) and differential scanning calorimetry (DSC). TGA curves
of iPP and iPP/silica samples under nitrogen are shown in Figure 4. 12. First of all, the char
formation of iPP/silica is higher than that for pure iPP, and it is increased with the PEOS
content. The residual content after pyrolysis at 600 °C fits quite well with the theoretical SiO2
content in these PP/silica composites. At the same time, as shown in Figure 4. 12, the
degradation temperatures of the composites are higher that of pure PP, and is again increased
with increasing PEOS loading. It can be concluded that the iPP/silica composites prepared by
in situ sol-gel technology have improved thermal properties.
(d)
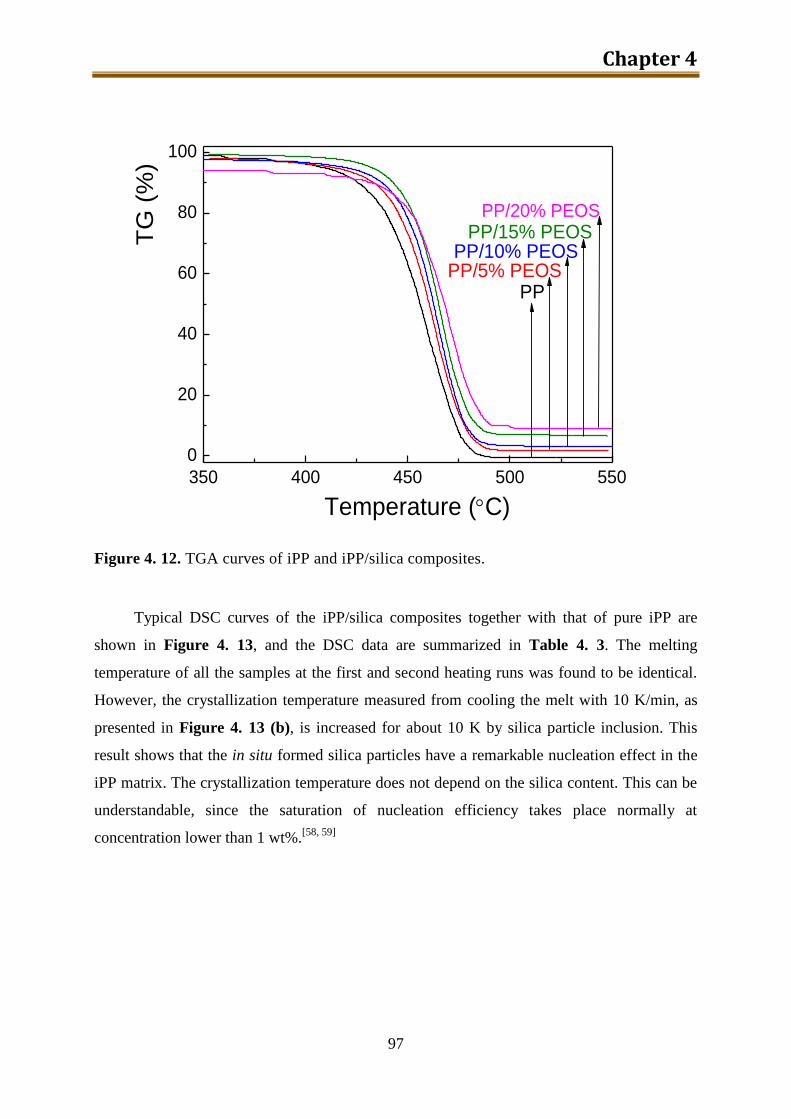
Chapter 4
97
350 400 450 500 550
0
20
40
60
80
100
PPPP/5% PEOSPP/10% PEOS
PP/15% PEOS
TG
(%
)
Temperature (C)
PP/20% PEOS
Figure 4. 12. TGA curves of iPP and iPP/silica composites.
Typical DSC curves of the iPP/silica composites together with that of pure iPP are
shown in Figure 4. 13, and the DSC data are summarized in Table 4. 3. The melting
temperature of all the samples at the first and second heating runs was found to be identical.
However, the crystallization temperature measured from cooling the melt with 10 K/min, as
presented in Figure 4. 13 (b), is increased for about 10 K by silica particle inclusion. This
result shows that the in situ formed silica particles have a remarkable nucleation effect in the
iPP matrix. The crystallization temperature does not depend on the silica content. This can be
understandable, since the saturation of nucleation efficiency takes place normally at
concentration lower than 1 wt%.[58, 59]
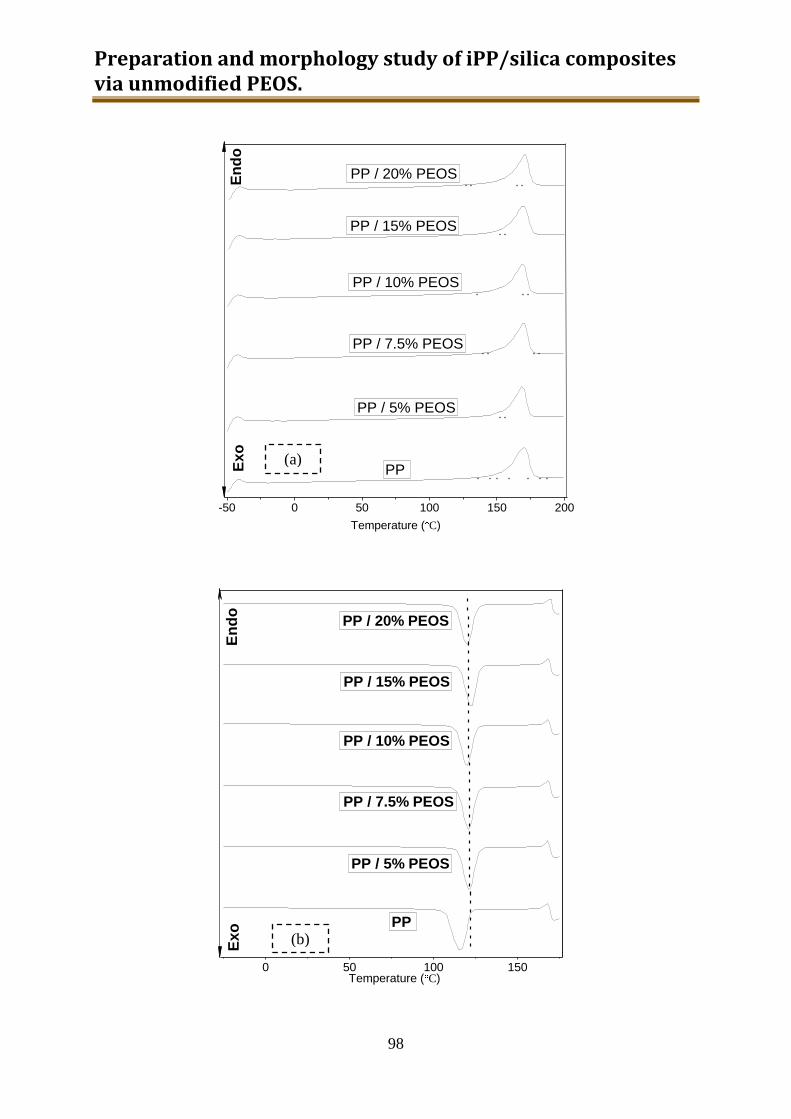
Preparation and morphology study of iPP/silica composites via unmodified PEOS.
98
-50 0 50 100 150 200
Temperature ( C)
Ex
oE
nd
o
PP
PP / 5% PEOS
PP / 7.5% PEOS
PP / 10% PEOS
PP / 15% PEOS
PP / 20% PEOS
0 50 100 150
En
do
Ex
o
PP / 20% PEOS
PP / 15% PEOS
PP / 10% PEOS
PP / 7.5% PEOS
PP / 5% PEOS
PP
Temperature ( C)
(a)
(b)
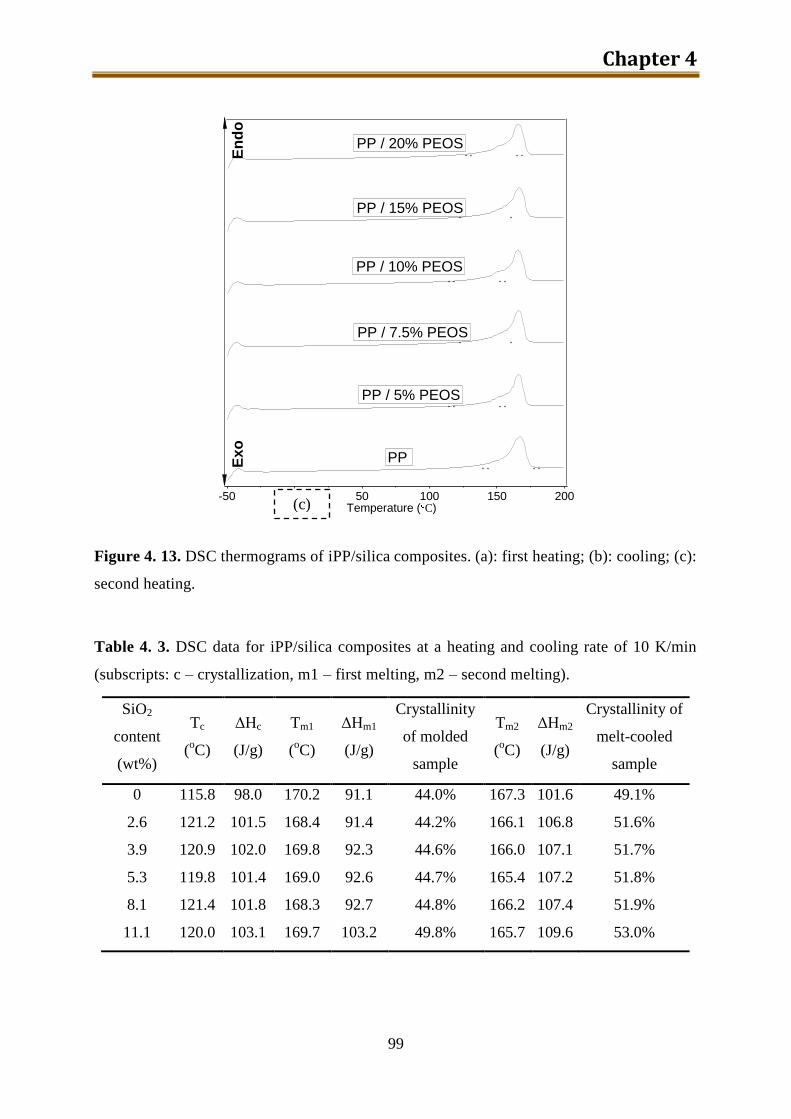
Chapter 4
99
-50 0 50 100 150 200
En
do
Temperature ( C)
PP / 20% PEOS
PP
PP / 5% PEOS
PP / 7.5% PEOS
PP / 10% PEOS
PP / 15% PEOS
Exo
Figure 4. 13. DSC thermograms of iPP/silica composites. (a): first heating; (b): cooling; (c):
second heating.
Table 4. 3. DSC data for iPP/silica composites at a heating and cooling rate of 10 K/min
(subscripts: c – crystallization, m1 – first melting, m2 – second melting).
SiO2
content
(wt%)
Tc
(oC)
ΔHc
(J/g)
Tm1
(oC)
ΔHm1
(J/g)
Crystallinity
of molded
sample
Tm2
(oC)
ΔHm2
(J/g)
Crystallinity of
melt-cooled
sample
0 115.8 98.0 170.2 91.1 44.0% 167.3 101.6 49.1%
2.6 121.2 101.5 168.4 91.4 44.2% 166.1 106.8 51.6%
3.9 120.9 102.0 169.8 92.3 44.6% 166.0 107.1 51.7%
5.3 119.8 101.4 169.0 92.6 44.7% 165.4 107.2 51.8%
8.1 121.4 101.8 168.3 92.7 44.8% 166.2 107.4 51.9%
11.1 120.0 103.1 169.7 103.2 49.8% 165.7 109.6 53.0%
(c)
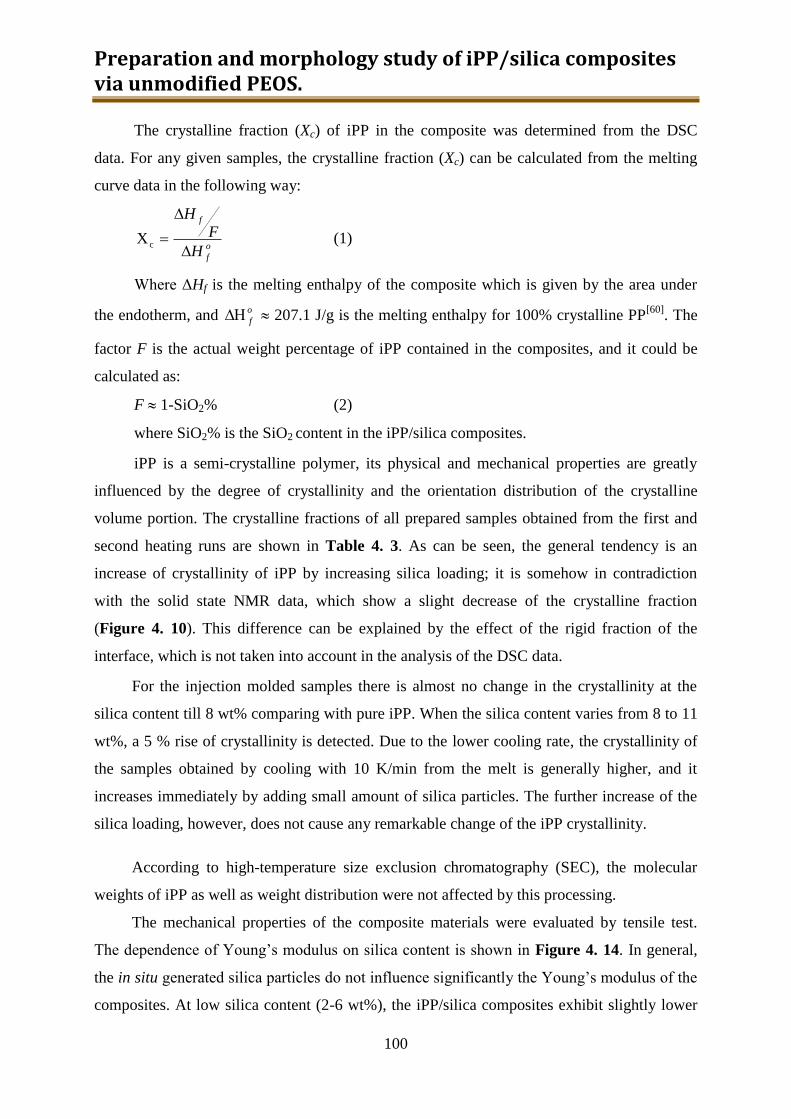
Preparation and morphology study of iPP/silica composites via unmodified PEOS.
100
The crystalline fraction (Xc) of iPP in the composite was determined from the DSC
data. For any given samples, the crystalline fraction (Xc) can be calculated from the melting
curve data in the following way:
o
f
f
H
F
H
cX (1)
Where ΔHf is the melting enthalpy of the composite which is given by the area under
the endotherm, and o
f 207.1 J/g is the melting enthalpy for 100% crystalline PP[60]
. The
factor F is the actual weight percentage of iPP contained in the composites, and it could be
calculated as:
F 1-SiO2% (2)
where SiO2% is the SiO2 content in the iPP/silica composites.
iPP is a semi-crystalline polymer, its physical and mechanical properties are greatly
influenced by the degree of crystallinity and the orientation distribution of the crystalline
volume portion. The crystalline fractions of all prepared samples obtained from the first and
second heating runs are shown in Table 4. 3. As can be seen, the general tendency is an
increase of crystallinity of iPP by increasing silica loading; it is somehow in contradiction
with the solid state NMR data, which show a slight decrease of the crystalline fraction
(Figure 4. 10). This difference can be explained by the effect of the rigid fraction of the
interface, which is not taken into account in the analysis of the DSC data.
For the injection molded samples there is almost no change in the crystallinity at the
silica content till 8 wt% comparing with pure iPP. When the silica content varies from 8 to 11
wt%, a 5 % rise of crystallinity is detected. Due to the lower cooling rate, the crystallinity of
the samples obtained by cooling with 10 K/min from the melt is generally higher, and it
increases immediately by adding small amount of silica particles. The further increase of the
silica loading, however, does not cause any remarkable change of the iPP crystallinity.
According to high-temperature size exclusion chromatography (SEC), the molecular
weights of iPP as well as weight distribution were not affected by this processing.
The mechanical properties of the composite materials were evaluated by tensile test.
The dependence of Young’s modulus on silica content is shown in Figure 4. 14. In general,
the in situ generated silica particles do not influence significantly the Young’s modulus of the
composites. At low silica content (2-6 wt%), the iPP/silica composites exhibit slightly lower
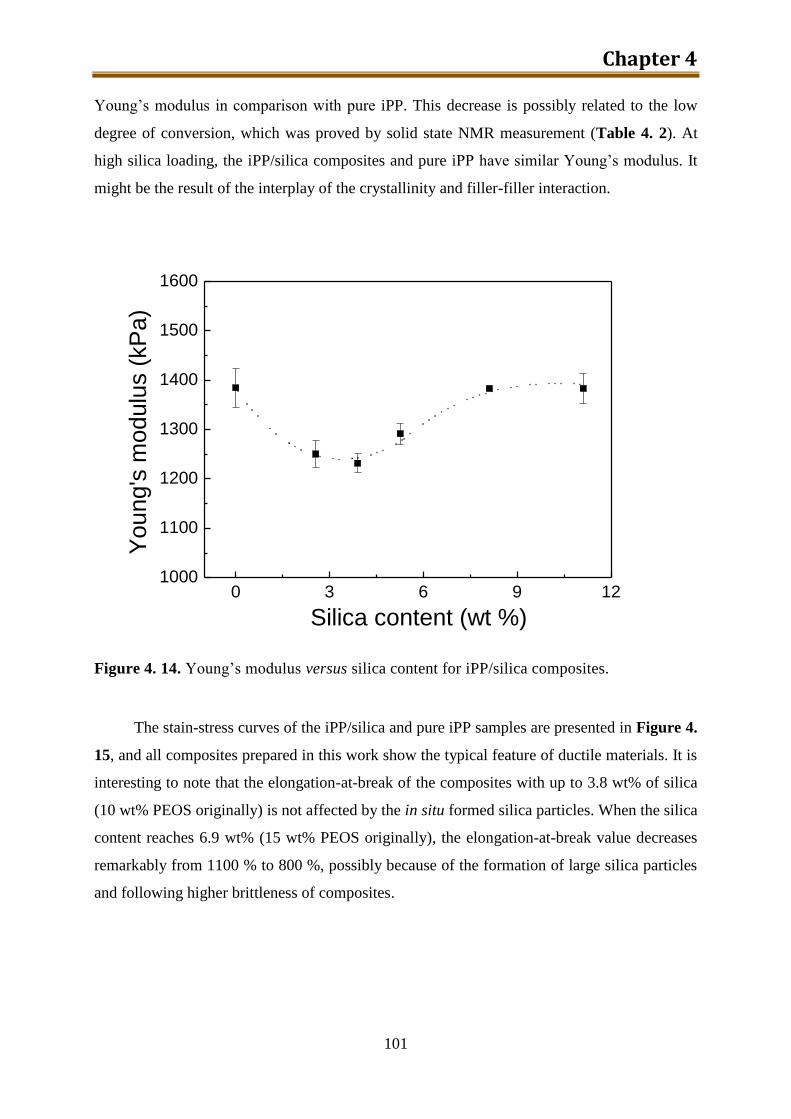
Chapter 4
101
Young’s modulus in comparison with pure iPP. This decrease is possibly related to the low
degree of conversion, which was proved by solid state NMR measurement (Table 4. 2). At
high silica loading, the iPP/silica composites and pure iPP have similar Young’s modulus. It
might be the result of the interplay of the crystallinity and filler-filler interaction.
0 3 6 9 121000
1100
1200
1300
1400
1500
1600
You
ng's
mo
dulu
s (
kP
a)
Silica content (wt %)
Figure 4. 14. Young’s modulus versus silica content for iPP/silica composites.
The stain-stress curves of the iPP/silica and pure iPP samples are presented in Figure 4.
15, and all composites prepared in this work show the typical feature of ductile materials. It is
interesting to note that the elongation-at-break of the composites with up to 3.8 wt% of silica
(10 wt% PEOS originally) is not affected by the in situ formed silica particles. When the silica
content reaches 6.9 wt% (15 wt% PEOS originally), the elongation-at-break value decreases
remarkably from 1100 % to 800 %, possibly because of the formation of large silica particles
and following higher brittleness of composites.
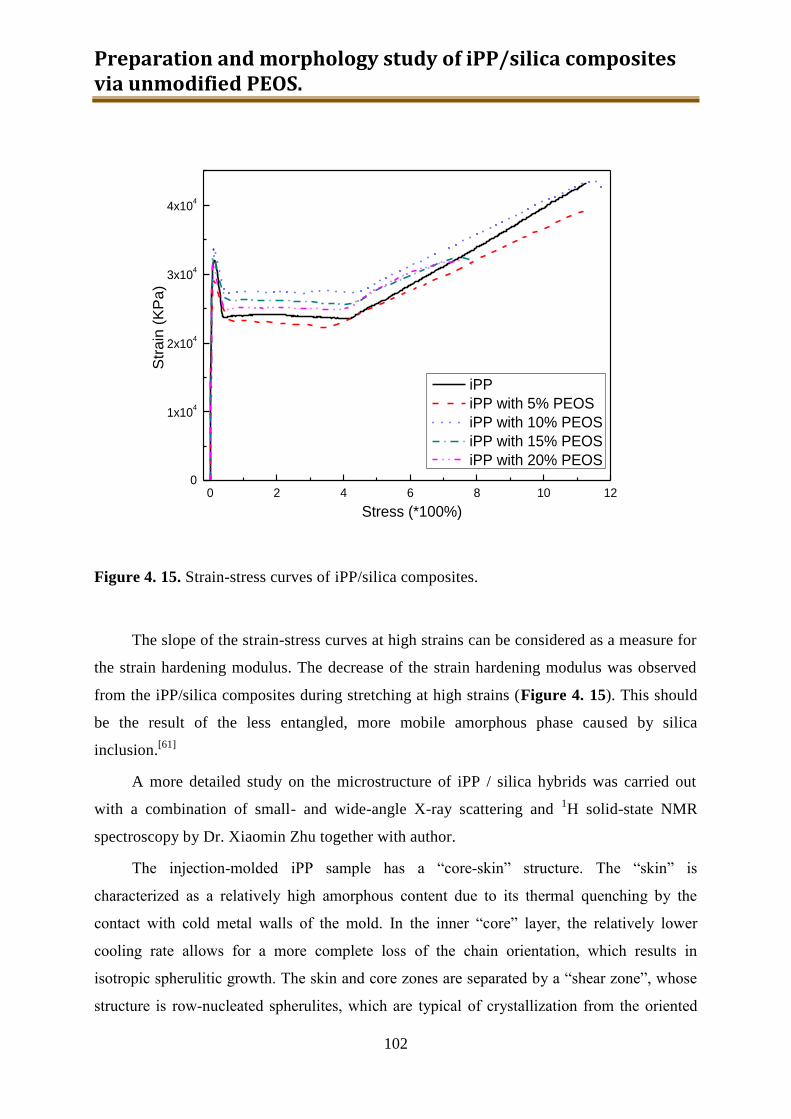
Preparation and morphology study of iPP/silica composites via unmodified PEOS.
102
0 2 4 6 8 10 120
1x10⁴
2x10⁴
3x10⁴
4x10⁴
Str
ain
(K
Pa
)
Stress (*100%)
iPP
iPP with 5% PEOS
iPP with 10% PEOS
iPP with 15% PEOS
iPP with 20% PEOS
Figure 4. 15. Strain-stress curves of iPP/silica composites.
The slope of the strain-stress curves at high strains can be considered as a measure for
the strain hardening modulus. The decrease of the strain hardening modulus was observed
from the iPP/silica composites during stretching at high strains (Figure 4. 15). This should
be the result of the less entangled, more mobile amorphous phase caused by silica
inclusion.[61]
A more detailed study on the microstructure of iPP / silica hybrids was carried out
with a combination of small- and wide-angle X-ray scattering and 1H solid-state NMR
spectroscopy by Dr. Xiaomin Zhu together with author.
The injection-molded iPP sample has a “core-skin” structure. The “skin” is
characterized as a relatively high amorphous content due to its thermal quenching by the
contact with cold metal walls of the mold. In the inner “core” layer, the relatively lower
cooling rate allows for a more complete loss of the chain orientation, which results in
isotropic spherulitic growth. The skin and core zones are separated by a “shear zone”, whose
structure is row-nucleated spherulites, which are typical of crystallization from the oriented
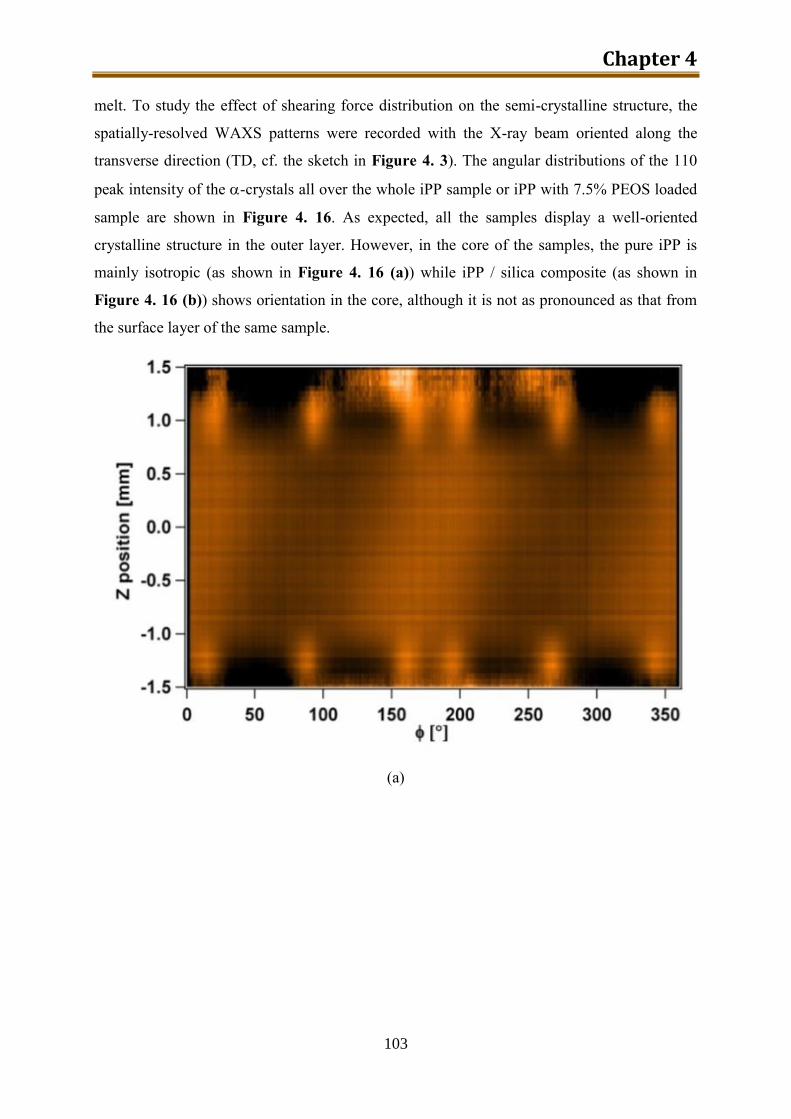
Chapter 4
103
melt. To study the effect of shearing force distribution on the semi-crystalline structure, the
spatially-resolved WAXS patterns were recorded with the X-ray beam oriented along the
transverse direction (TD, cf. the sketch in Figure 4. 3). The angular distributions of the 110
peak intensity of the -crystals all over the whole iPP sample or iPP with 7.5% PEOS loaded
sample are shown in Figure 4. 16. As expected, all the samples display a well-oriented
crystalline structure in the outer layer. However, in the core of the samples, the pure iPP is
mainly isotropic (as shown in Figure 4. 16 (a)) while iPP / silica composite (as shown in
Figure 4. 16 (b)) shows orientation in the core, although it is not as pronounced as that from
the surface layer of the same sample.
(a)
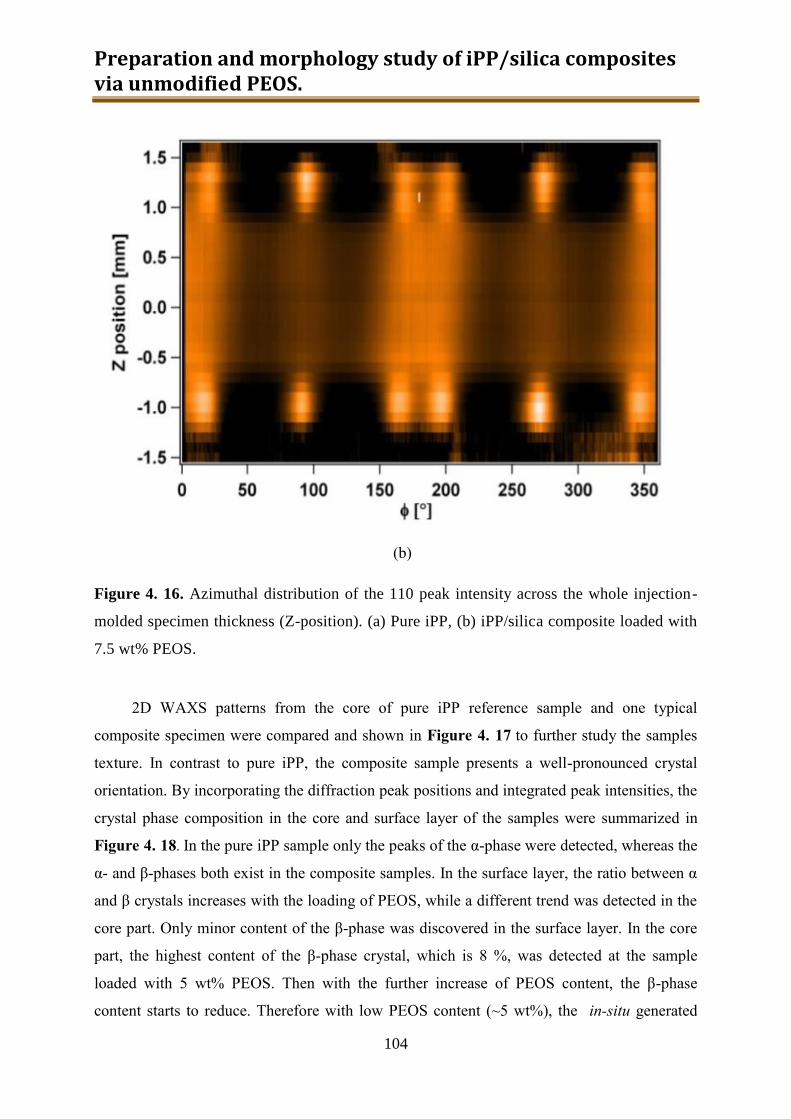
Preparation and morphology study of iPP/silica composites via unmodified PEOS.
104
(b)
Figure 4. 16. Azimuthal distribution of the 110 peak intensity across the whole injection-
molded specimen thickness (Z-position). (a) Pure iPP, (b) iPP/silica composite loaded with
7.5 wt% PEOS.
2D WAXS patterns from the core of pure iPP reference sample and one typical
composite specimen were compared and shown in Figure 4. 17 to further study the samples
texture. In contrast to pure iPP, the composite sample presents a well-pronounced crystal
orientation. By incorporating the diffraction peak positions and integrated peak intensities, the
crystal phase composition in the core and surface layer of the samples were summarized in
Figure 4. 18. In the pure iPP sample only the peaks of the α-phase were detected, whereas the
α- and β-phases both exist in the composite samples. In the surface layer, the ratio between α
and β crystals increases with the loading of PEOS, while a different trend was detected in the
core part. Only minor content of the β-phase was discovered in the surface layer. In the core
part, the highest content of the β-phase crystal, which is 8 %, was detected at the sample
loaded with 5 wt% PEOS. Then with the further increase of PEOS content, the β-phase
content starts to reduce. Therefore with low PEOS content (~5 wt%), the in-situ generated
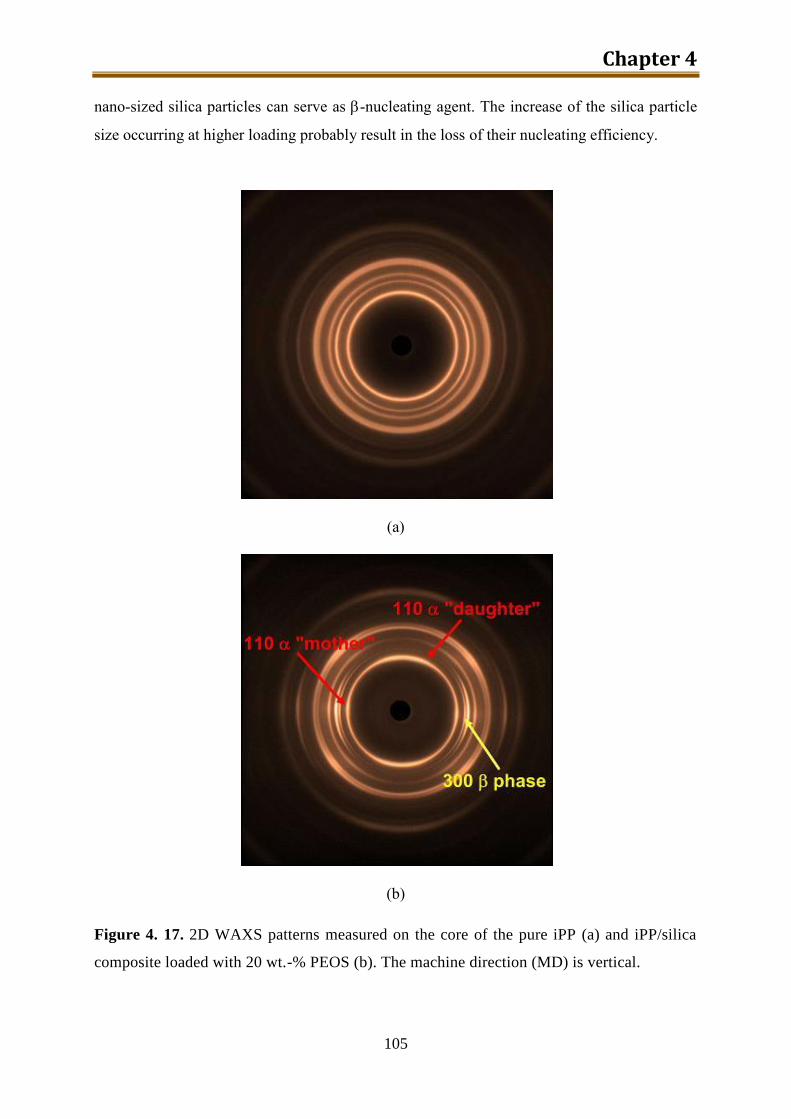
Chapter 4
105
nano-sized silica particles can serve as -nucleating agent. The increase of the silica particle
size occurring at higher loading probably result in the loss of their nucleating efficiency.
(a)
(b)
Figure 4. 17. 2D WAXS patterns measured on the core of the pure iPP (a) and iPP/silica
composite loaded with 20 wt.-% PEOS (b). The machine direction (MD) is vertical.
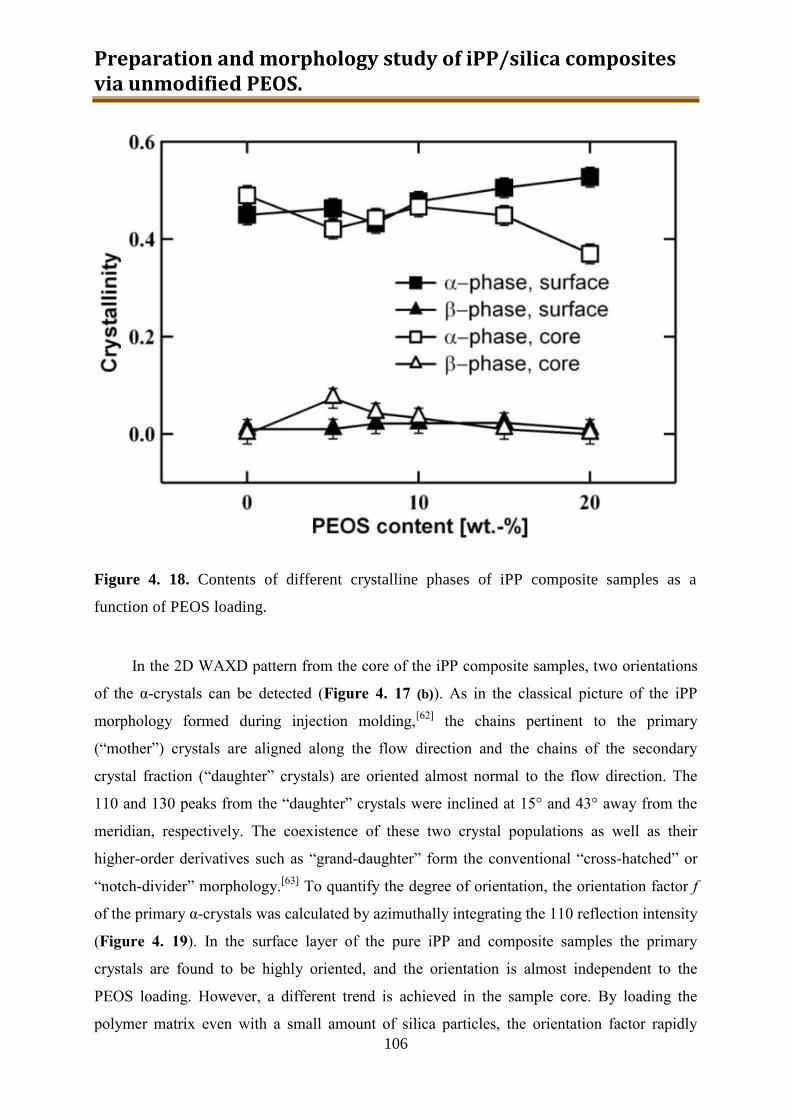
Preparation and morphology study of iPP/silica composites via unmodified PEOS.
106
Figure 4. 18. Contents of different crystalline phases of iPP composite samples as a
function of PEOS loading.
In the 2D WAXD pattern from the core of the iPP composite samples, two orientations
of the α-crystals can be detected (Figure 4. 17 (b)). As in the classical picture of the iPP
morphology formed during injection molding,[62]
the chains pertinent to the primary
(“mother”) crystals are aligned along the flow direction and the chains of the secondary
crystal fraction (“daughter” crystals) are oriented almost normal to the flow direction. The
110 and 130 peaks from the “daughter” crystals were inclined at 15° and 43° away from the
meridian, respectively. The coexistence of these two crystal populations as well as their
higher-order derivatives such as “grand-daughter” form the conventional “cross-hatched” or
“notch-divider” morphology.[63]
To quantify the degree of orientation, the orientation factor f
of the primary α-crystals was calculated by azimuthally integrating the 110 reflection intensity
(Figure 4. 19). In the surface layer of the pure iPP and composite samples the primary
crystals are found to be highly oriented, and the orientation is almost independent to the
PEOS loading. However, a different trend is achieved in the sample core. By loading the
polymer matrix even with a small amount of silica particles, the orientation factor rapidly
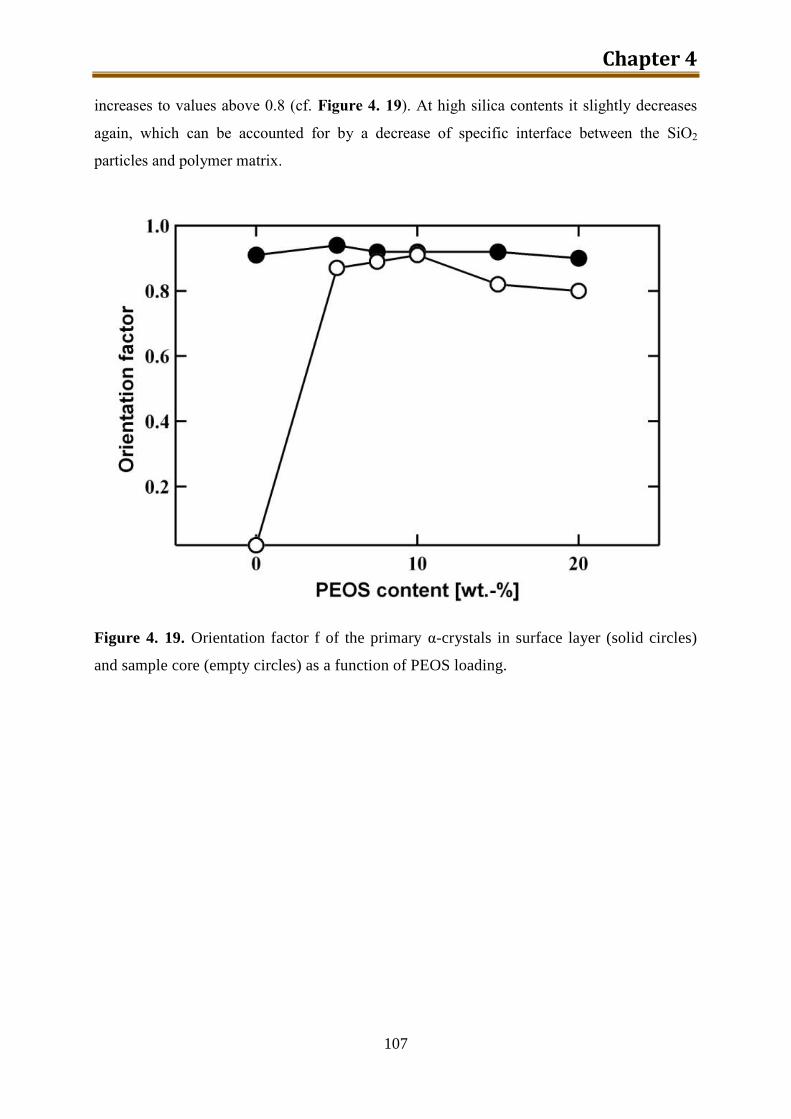
Chapter 4
107
increases to values above 0.8 (cf. Figure 4. 19). At high silica contents it slightly decreases
again, which can be accounted for by a decrease of specific interface between the SiO2
particles and polymer matrix.
Figure 4. 19. Orientation factor f of the primary α-crystals in surface layer (solid circles)
and sample core (empty circles) as a function of PEOS loading.
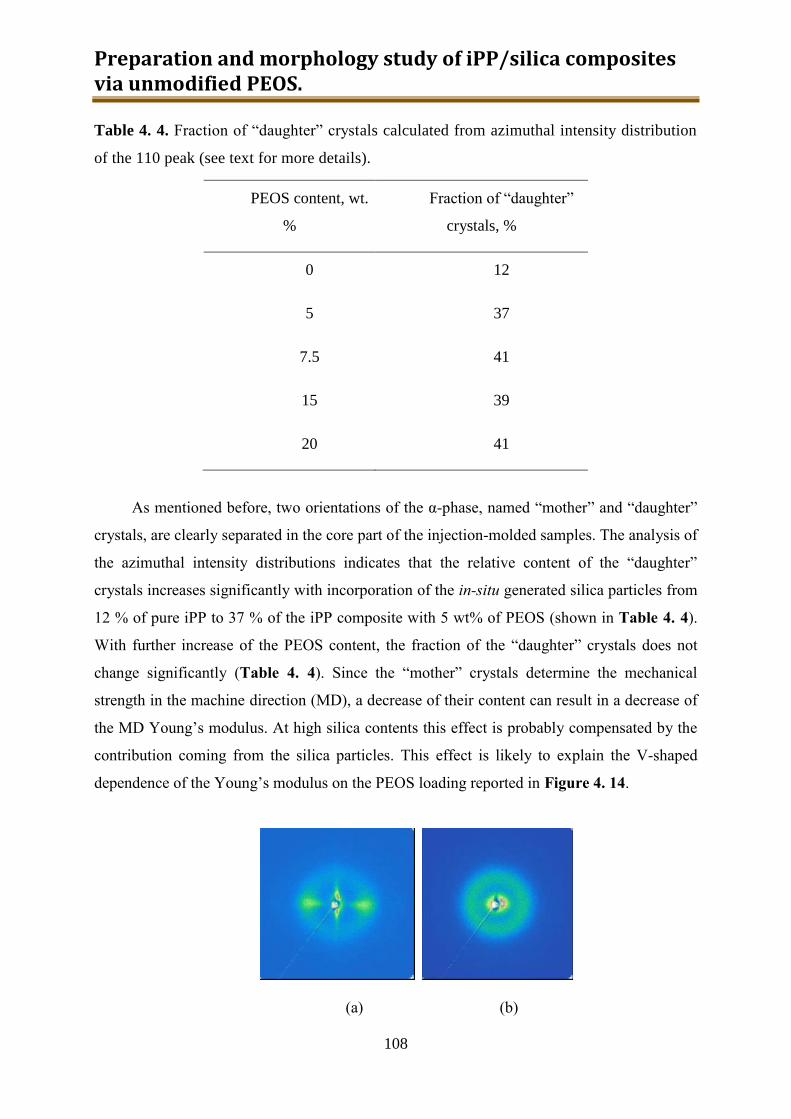
Preparation and morphology study of iPP/silica composites via unmodified PEOS.
108
Table 4. 4. Fraction of “daughter” crystals calculated from azimuthal intensity distribution
of the 110 peak (see text for more details).
PEOS content, wt.
%
Fraction of “daughter”
crystals, %
0 12
5 37
7.5 41
15 39
20 41
As mentioned before, two orientations of the α-phase, named “mother” and “daughter”
crystals, are clearly separated in the core part of the injection-molded samples. The analysis of
the azimuthal intensity distributions indicates that the relative content of the “daughter”
crystals increases significantly with incorporation of the in-situ generated silica particles from
12 % of pure iPP to 37 % of the iPP composite with 5 wt% of PEOS (shown in Table 4. 4).
With further increase of the PEOS content, the fraction of the “daughter” crystals does not
change significantly (Table 4. 4). Since the “mother” crystals determine the mechanical
strength in the machine direction (MD), a decrease of their content can result in a decrease of
the MD Young’s modulus. At high silica contents this effect is probably compensated by the
contribution coming from the silica particles. This effect is likely to explain the V-shaped
dependence of the Young’s modulus on the PEOS loading reported in Figure 4. 14.
(a) (b)

Chapter 4
109
(c) (d)
Figure 4. 20. 2D SAXS patterns corresponding to the skin (a,c) and core (b,d) of the pure
iPP sample (a, b) and iPP composite loaded with 20 wt.-% PEOS(c,d), respectively. The
machine direction is horizontal.
2D SAXS measurements have been conducted to analyze the crystalline lamellae
arrangement in the injection-molded samples. The SAXS patterns recorded on both surface
and core zones of the samples are shown in Figure 4. 20. Similar to the WAXS results
presented previously, the “mother” lamellae in the surface layer stay always oriented, being
independent from the silica content. It is noteworthy that the vertical streak in small-angle
region on the SAXS pattern of pure iPP (Figure 4. 20 (a)) is typical of the extended chain
crystals, or the so-called “shishes”. For the composites the streak is covered by strong
scattering from the silica particles. Therefore, the role of these particles on the formation of
the “shish” scaffold still has to be clarified.
In the sample core, well-defined orientation of the crystalline lamellae was observed
only in the iPP/silica composites. Despite a significant fraction of the “daughter” crystals in
the composite samples, no interference maxima in the vertical direction of the 2D SAXS
patterns, i.e. the one perpendicular to MD, were detected. This indicates the absence of a
regular stacking of the “daughter” lamellae. Figure 4. 21 sketches the lamellae ordering in the
core of the pure iPP sample and iPP/silica composites.
(a)
mothercrystals
daughtercrystals
MD
mothercrystals
daughtercrystals
MD

Preparation and morphology study of iPP/silica composites via unmodified PEOS.
110
(b)
Figure 4. 21. Schematic representation of the lamellar arrangement in the core of pure iPP
sample (a) and iPP/silica composites (b). The sketch shows an improvement of the
“mother”-lamellae orientation and increase of the “daughter”-crystal fraction with addition
of the silica particles to the iPP matrix.
The thickness of amorphous (La) and crystalline (Lc) domains as well as the long period
(LB) were calculated from the 1D SAXS curves via the interface distribution functions
(Figure 4. 5). The relationship between these parameters and the PEOS loading is shown in
Figure 4. 22. The silica content shows no significant influence on the thickness of the
smallest region, i.e. the interlamellar amorphous layer (La), which is about 2.6 nm. By
contrast, the largest distance, i.e. the crystal thickness (Lc), significantly increases with adding
of silica particles: it grows from 7.0 nm for pure iPP to 8.2 nm for the composite with 5 wt%
PEOS. With further increase of the filler content, the crystal thickness remains almost
constant. The assignment of the two SAXS distances was chosen to be compatible with the
bulk crystallinity values determined from WAXS (cf. Figure 4. 18).
mothercrystals
daughtercrystals
MD
mothercrystals
daughtercrystals
MD
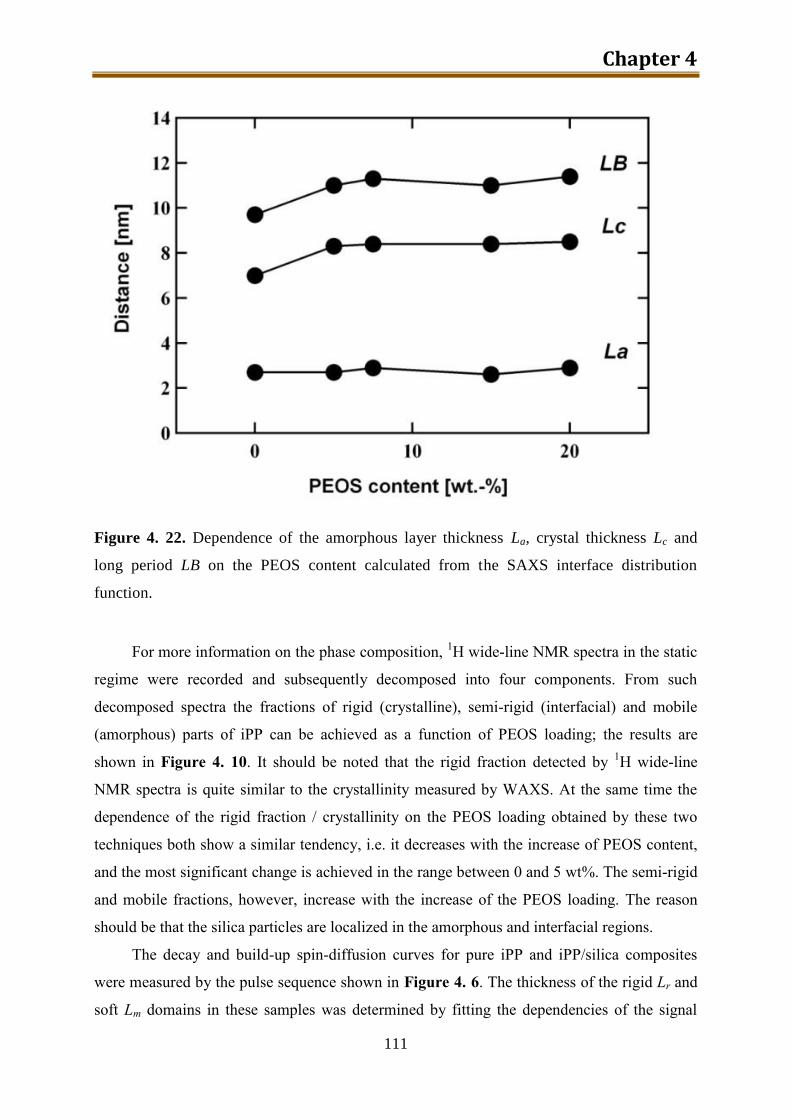
Chapter 4
111
Figure 4. 22. Dependence of the amorphous layer thickness La, crystal thickness Lc and
long period LB on the PEOS content calculated from the SAXS interface distribution
function.
For more information on the phase composition, 1H wide-line NMR spectra in the static
regime were recorded and subsequently decomposed into four components. From such
decomposed spectra the fractions of rigid (crystalline), semi-rigid (interfacial) and mobile
(amorphous) parts of iPP can be achieved as a function of PEOS loading; the results are
shown in Figure 4. 10. It should be noted that the rigid fraction detected by 1H wide-line
NMR spectra is quite similar to the crystallinity measured by WAXS. At the same time the
dependence of the rigid fraction / crystallinity on the PEOS loading obtained by these two
techniques both show a similar tendency, i.e. it decreases with the increase of PEOS content,
and the most significant change is achieved in the range between 0 and 5 wt%. The semi-rigid
and mobile fractions, however, increase with the increase of the PEOS loading. The reason
should be that the silica particles are localized in the amorphous and interfacial regions.
The decay and build-up spin-diffusion curves for pure iPP and iPP/silica composites
were measured by the pulse sequence shown in Figure 4. 6. The thickness of the rigid Lr and
soft Lm domains in these samples was determined by fitting the dependencies of the signal
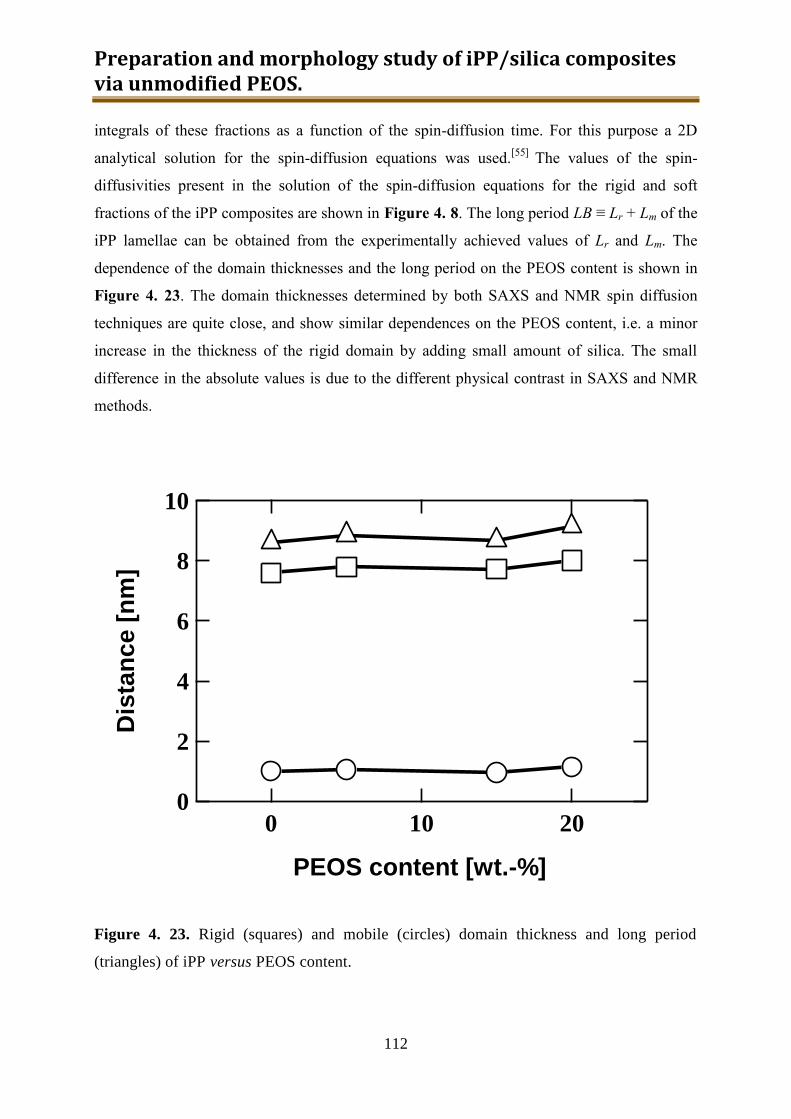
Preparation and morphology study of iPP/silica composites via unmodified PEOS.
112
integrals of these fractions as a function of the spin-diffusion time. For this purpose a 2D
analytical solution for the spin-diffusion equations was used.[55]
The values of the spin-
diffusivities present in the solution of the spin-diffusion equations for the rigid and soft
fractions of the iPP composites are shown in Figure 4. 8. The long period LB ≡ Lr + Lm of the
iPP lamellae can be obtained from the experimentally achieved values of Lr and Lm. The
dependence of the domain thicknesses and the long period on the PEOS content is shown in
Figure 4. 23. The domain thicknesses determined by both SAXS and NMR spin diffusion
techniques are quite close, and show similar dependences on the PEOS content, i.e. a minor
increase in the thickness of the rigid domain by adding small amount of silica. The small
difference in the absolute values is due to the different physical contrast in SAXS and NMR
methods.
Figure 4. 23. Rigid (squares) and mobile (circles) domain thickness and long period
(triangles) of iPP versus PEOS content.
10
8
6
4
2
0
Dis
tan
ce
[n
m]
20100
PEOS content [wt.-%]
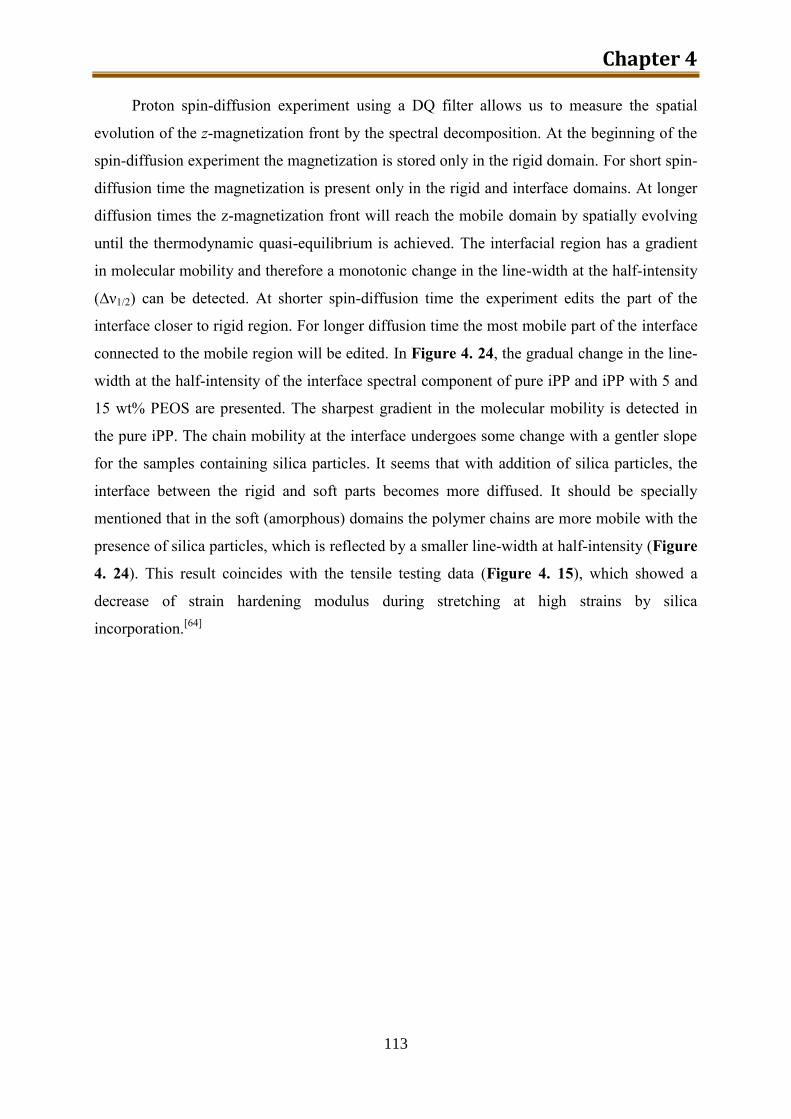
Chapter 4
113
Proton spin-diffusion experiment using a DQ filter allows us to measure the spatial
evolution of the z-magnetization front by the spectral decomposition. At the beginning of the
spin-diffusion experiment the magnetization is stored only in the rigid domain. For short spin-
diffusion time the magnetization is present only in the rigid and interface domains. At longer
diffusion times the z-magnetization front will reach the mobile domain by spatially evolving
until the thermodynamic quasi-equilibrium is achieved. The interfacial region has a gradient
in molecular mobility and therefore a monotonic change in the line-width at the half-intensity
(∆ν1/2) can be detected. At shorter spin-diffusion time the experiment edits the part of the
interface closer to rigid region. For longer diffusion time the most mobile part of the interface
connected to the mobile region will be edited. In Figure 4. 24, the gradual change in the line-
width at the half-intensity of the interface spectral component of pure iPP and iPP with 5 and
15 wt% PEOS are presented. The sharpest gradient in the molecular mobility is detected in
the pure iPP. The chain mobility at the interface undergoes some change with a gentler slope
for the samples containing silica particles. It seems that with addition of silica particles, the
interface between the rigid and soft parts becomes more diffused. It should be specially
mentioned that in the soft (amorphous) domains the polymer chains are more mobile with the
presence of silica particles, which is reflected by a smaller line-width at half-intensity (Figure
4. 24). This result coincides with the tensile testing data (Figure 4. 15), which showed a
decrease of strain hardening modulus during stretching at high strains by silica
incorporation.[64]
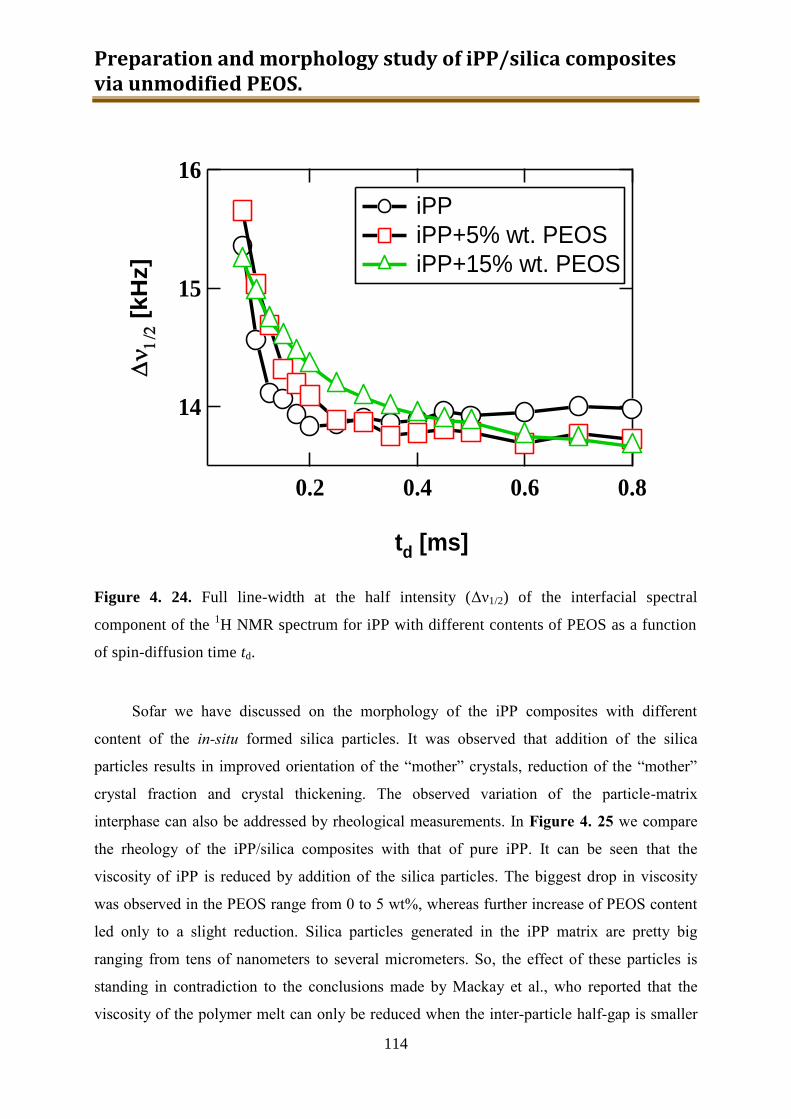
Preparation and morphology study of iPP/silica composites via unmodified PEOS.
114
Figure 4. 24. Full line-width at the half intensity (Δν1/2) of the interfacial spectral
component of the 1H NMR spectrum for iPP with different contents of PEOS as a function
of spin-diffusion time td.
Sofar we have discussed on the morphology of the iPP composites with different
content of the in-situ formed silica particles. It was observed that addition of the silica
particles results in improved orientation of the “mother” crystals, reduction of the “mother”
crystal fraction and crystal thickening. The observed variation of the particle-matrix
interphase can also be addressed by rheological measurements. In Figure 4. 25 we compare
the rheology of the iPP/silica composites with that of pure iPP. It can be seen that the
viscosity of iPP is reduced by addition of the silica particles. The biggest drop in viscosity
was observed in the PEOS range from 0 to 5 wt%, whereas further increase of PEOS content
led only to a slight reduction. Silica particles generated in the iPP matrix are pretty big
ranging from tens of nanometers to several micrometers. So, the effect of these particles is
standing in contradiction to the conclusions made by Mackay et al., who reported that the
viscosity of the polymer melt can only be reduced when the inter-particle half-gap is smaller
16
15
14
[k
Hz]
0.80.60.40.2
td [ms]
iPP
iPP+5% wt. PEOS
iPP+15% wt. PEOS
Chapter 4
115
than the radius of gyration of the polymer coil.[38]
The incompatibility of the in-situ formed
silica particles with the iPP matrix and the homogeneous volume distribution might be the
reason for such an effect.
As previously shown by us, the in-situ generated silica particles behave as a weak
nucleator by increasing the crystallization temperature of iPP for about 5 °C.[64]
It is
commonly known that adding of nucleating agent to the iPP matrix can also change the
structure of injection-molded specimens, e.g. it can improve the orientation degree of crystals
due to incomplete relaxation of the melt orientation (recoverable shear strain)[65-67]
and
increase the lamellar thickness.[68]
This means that the nucleation by the silica particles can
contribute to these two phenomena observed in the core zone of the iPP/silica composite
samples, although the nucleating effect is not significant. The increase of the “daughter”
crystal fraction with the adding of silica particles can be probably merely attributed to the
reduction of the melt viscosity due to the increased rate of the polymer coil relaxation. Thus it
was reported that the increase of the cylinder temperature led to a higher “daughter” crystal
fraction.[69]
The elevation of the cylinder temperature can decrease the melt viscosity, the
same effect can be found from the silica particles in our case. In addition, we have found that
the β-crystals are formed mainly in the core zone of the composite samples; this is in contrast
to previous results obtained on injection-molded samples of iPP filled with nucleating agents,
where the formation of β-crystals was observed only in the surface layer,[65, 69]
since their
formation was promoted by shear. This can possibly be the result of the reduced melt
viscosity in the composite samples.
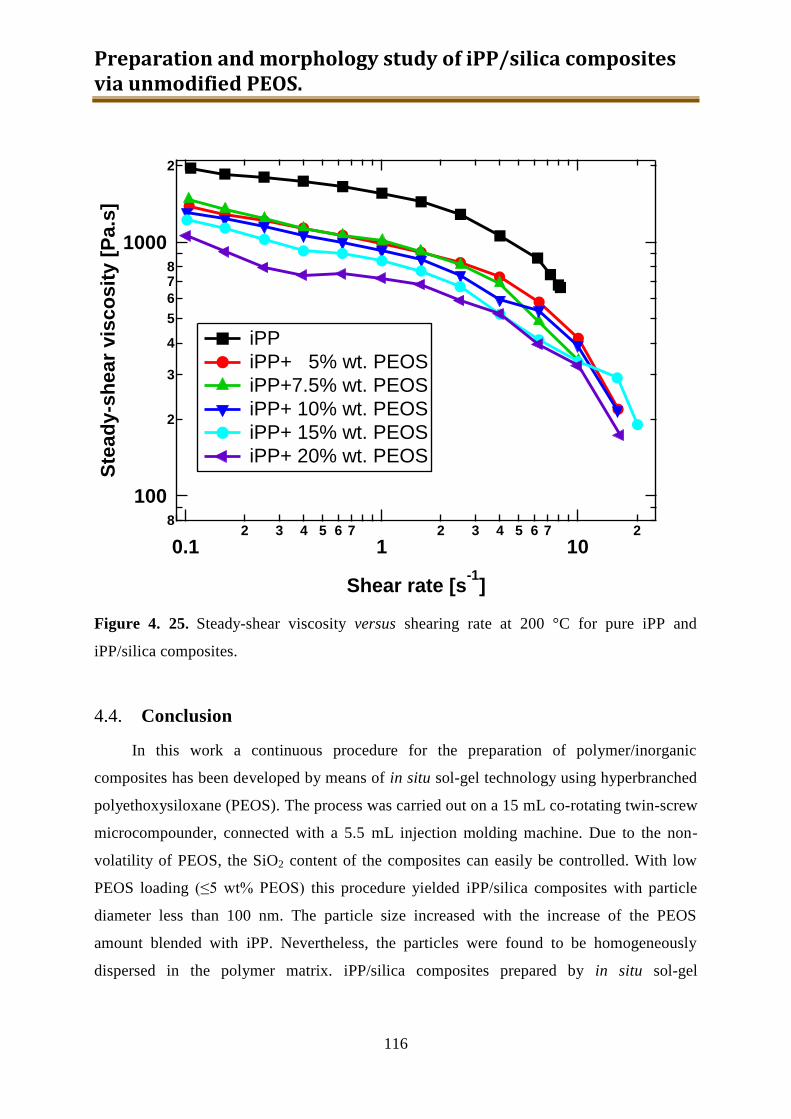
Preparation and morphology study of iPP/silica composites via unmodified PEOS.
116
Figure 4. 25. Steady-shear viscosity versus shearing rate at 200 °C for pure iPP and
iPP/silica composites.
4.4. Conclusion
In this work a continuous procedure for the preparation of polymer/inorganic
composites has been developed by means of in situ sol-gel technology using hyperbranched
polyethoxysiloxane (PEOS). The process was carried out on a 15 mL co-rotating twin-screw
microcompounder, connected with a 5.5 mL injection molding machine. Due to the non-
volatility of PEOS, the SiO2 content of the composites can easily be controlled. With low
PEOS loading (≤5 wt% PEOS) this procedure yielded iPP/silica composites with particle
diameter less than 100 nm. The particle size increased with the increase of the PEOS
amount blended with iPP. Nevertheless, the particles were found to be homogeneously
dispersed in the polymer matrix. iPP/silica composites prepared by in situ sol-gel
8
100
2
3
4
5
6
78
1000
2
Ste
ad
y-s
he
ar
vis
co
sit
y [
Pa
.s]
0.12 3 4 5 6 7
12 3 4 5 6 7
102
Shear rate [s-1
]
iPP
iPP+ 5% wt. PEOS
iPP+7.5% wt. PEOS
iPP+ 10% wt. PEOS
iPP+ 15% wt. PEOS
iPP+ 20% wt. PEOS
Chapter 4
117
technology showed improved thermal properties, but almost not affected mechanical
properties comparing with pure iPP.
A combination of wide- and small-angle X-ray scattering and solid-state NMR
spectroscopy was used to analyze the semicrystalline morphology of injection-molded iPP /
silica composites. The results about the phase composition and lamellar micro-structure
obtained from both X-ray and NMR techniques are quite similar. By means of WAXS it
was demonstrated that the “mother”-crystal fraction was largely decreased by incorporation
of the in-situ formed silica particles. This fact together with the solid filler effect can be the
reason for the observed V-shaped dependence of Young’s modulus of the composites on the
PEOS loading. Both WAXS and SAXS revealed a significant orientation of the iPP crystals
in the core of the injection-molded parts in the machine direction, meanwhile, the core of
the pure iPP sample did not reveal any orientation. The β-crystals were detected in the core
zone of the iPP/silica composite samples, and their maximal amount was observed with the
PEOS content of 5 wt%. In contrast to previous results obtained on injection-molded
samples of iPP filled with nucleating agents, where the formation of β-crystals was
observed only in the surface layer, in this work it has been found that the β-crystals are
formed mainly in the core part of the composite samples. All these phenomena are most
probably because of the nucleating effect as well as a decrease of the polymer melt viscosity
by the silica particles, which was established by the rheological measurements. Proton spin-
diffusion experiment using a double quantum filter was proved to be a suitable method to
measure chain mobility gradient in the interface region, and it indicated as well the increase
of the polymer chain mobility in the amorphous region in the presence of silica particles.
The latter result coincided with the tensile testing data, which showed a decrease of strain
hardening modulus during stretching at high strains by the silica inclusion.
The work in this chapter has been published in J Sol-Gel Sci Technol. 2008, 48, 51-60.
(Copyright: Springer and the original publisher Journal of sol-gel science and technology,
volume 48, 2008, page 51-60, is given to the publication in which the material was
originally published, by adding; with kind permission from Springer Science and Business
Media.) and Macromolecules. 2010, 43, 6067-6074. (Copyright: Reprinted (adapted) with
permission from (Macromolecules. 2010, 43, 6067-6074.). Copyright (2010) American
Chemical Society.)
References:

Preparation and morphology study of iPP/silica composites via unmodified PEOS.
118
[1]. Beecroft, L.L. and Ober, C.K., Chemistry of Materials, 1997. 9(6): p. 1302-1317.
[2]. Innocenzi, P. and Brusatin, G., Chemistry of Materials, 2001. 13(10): p. 3126-
3139.
[3]. Interrante, L.V., Chemistry of Materials, 1995. 7(10): p. 1751-1752.
[4]. Komarneni, S., Journal of Materials Chemistry, 1992. 2(12): p. 1219-1230.
[5]. Gleiter, H., Advanced Materials, 1992. 4(7-8): p. 474-481.
[6]. Novak, B.M., Advanced Materials, 1993. 5(6): p. 422-433.
[7]. Breuer, O. and Sundararaj, U., Polymer Composites, 2004. 25(6): p. 630-645.
[8]. Manevitch, O.L. and Rutledge, G.C., Journal of Physical Chemistry B, 2004.
108(4): p. 1428-1435.
[9]. Sturcova, A., Davies, G.R., and Eichhorn, S.J., Biomacromolecules, 2005. 6(2): p.
1055-1061.
[10]. Treacy, M.M.J., Ebbesen, T.W., and Gibson, J.M., Nature, 1996. 381(6584): p.
678-680.
[11]. Van Lier, G., et al., Chemical Physics Letters, 2000. 326(1-2): p. 181-185.
[12]. Babonneau, F., Bois, L., and Livage, J., Journal of Non-Crystalline Solids, 1992.
147: p. 280-284.
[13]. Mack, J.J., et al., Advanced Materials, 2005. 17(1): p. 77-+.
[14]. Samir, M., Alloin, F., and Dufresne, A., Biomacromolecules, 2005. 6(2): p. 612-
626.
[15]. Ray, S.S. and Okamoto, M., Progress in Polymer Science, 2003. 28(11): p. 1539-
1641.
[16]. Gilman, J.W., et al., Chemistry of Materials, 2000. 12(7): p. 1866-1873.
[17]. Davidson, M.G., et al., Polyhedron, 2007. 26: p. 975-980.
[18]. Cao, Z., et al., Soft Matter, 2007. 3(7): p. 910-915.
[19]. Pluta, M., et al., Journal of Polymer Science Part B-Polymer Physics, 2006.
44(2): p. 299-311.
[20]. Yudin, V.E., et al., Polymer, 2005. 46(24): p. 10866-10872.
[21]. Zhang, H., et al., Acta Materialia, 2006. 54(7): p. 1833-1842.
Chapter 4
119
[22]. Muh, E., et al., Advanced Functional Materials, 2001. 11(6): p. 425-429.
[23]. Jain, S., et al., Polymer, 2005. 46(17): p. 6666-6681.
[24]. Ruan, W.H., et al., Journal of Materials Science, 2004. 39(10): p. 3475-3478.
[25]. Garcia, M., et al., Reviews on Advanced Materials Science, 2004. 6(2): p. 169-
175.
[26]. KIM, Y.K., et al. Nanocomposite Fibers. in Materials Research Society
Symposium Proceedings. 2002.
[27]. Rankin, S.E., Macosko, C.W., and McCormick, A.V., Aiche Journal, 1998. 44(5):
p. 1141-1156.
[28]. Sugahara, Y., Inoue, T., and Kuroda, K., Journal of Materials Chemistry, 1997.
7(1): p. 53-59.
[29]. Alam, T.M., Assink, R.A., and Loy, D.A., Chemistry of Materials, 1996. 8(9): p.
2366-2374.
[30]. Aelion, R., Loebel, A., and Eirich, F., Recueil Des Travaux Chimiques Des Pays-
Bas-Journal of the Royal Netherlands Chemical Society, 1950. 69(1): p. 61-75.
[31]. Dubitsky, Y., et al., Materials Chemistry and Physics, 2000. 64(1): p. 45-53.
[32]. Rankin, S.E. and McCormick, A.V., Magnetic Resonance in Chemistry, 1999.
37: p. S27-S37.
[33]. Altmann, S. and Pfeiffer, J., Monatshefte Fur Chemie, 2003. 134(8): p. 1081-
1092.
[34]. Mizutani, Y. and Nago, S., Journal of Applied Polymer Science, 1999. 72(11): p.
1489-1494.
[35]. Phe, B.H., et al., Journal of Sol-Gel Science and Technology, 2004. 31(1-3): p.
47-50.
[36]. Zhu, X.M., et al., Macromolecules, 2006. 39(5): p. 1701-1708.
[37]. Mackay, M.E., et al., Nature Materials, 2003. 2(11): p. 762-766.
[38]. Tuteja, A., et al., Macromolecules, 2005. 38(19): p. 8000-8011.
[39]. Tuteja, A., Duxbury, P.M., and Mackay, M.E., Macromolecules, 2007. 40(26): p.
9427-9434.
[40]. Tuteja, A., et al., Nano Letters, 2007. 7(5): p. 1276-1281.
Preparation and morphology study of iPP/silica composites via unmodified PEOS.
120
[41]. Karian, H.G., Handbook of Polypropylene and Polypropylene Composites, Second
Edition, Revised and Expanded, ed. Dekker, M. 2003, New York.
[42]. Hwang, W.R., et al., Macromolecules, 2006. 39(24): p. 8389-8398.
[43]. Hedesiu, C., et al., Macromolecules, 2007. 40(11): p. 3977-3989.
[44]. Schmidt-Rohr, K. and Spiess, H.W., Multidimensional Solid-State NMR and
Polymers. 1994, London: Academic Press.
[45]. Hedesiu, C., et al., Macromolecular Materials and Engineering, 2008. 293(10): p.
847-857.
[46]. Hedesiu, C., et al., Macromolecular Chemistry and Physics, 2008. 209(7): p.
734-745.
[47]. Bovay, F.A. and Mirau, P.A., NMR of Polymers. 1996, San Diego: Academic
Press.
[48]. Ando, I., Solid State NMR of Polymers, Studies in Physical and Theoretical
Chemistry, ed. Asakura, T. 1998, Amsterdam: Elsevier.
[49]. Hatada, K.K., T., NMR Spectroscopy of Polymers. 2004, Heidelberg: Springer-
Verlag: Berin.
[50]. Tanaka, H., Kohrogi, F., and Suzuki, K., European Polymer Journal, 1989.
25(5): p. 449-453.
[51]. Dadayli, D., et al., Polymer, 1994. 35(19): p. 4083-4087.
[52]. Schreurs, S., et al., Journal of Physical Chemistry B, 1999. 103(9): p. 1393-1401.
[53]. Tanaka, H. and Inoue, Y., Polymer International, 1993. 31(1): p. 9-13.
[54]. Li, J.X., Ness, J.N., and Cheung, W.L., Journal of Applied Polymer Science,
1996. 59(11): p. 1733-1740.
[55]. Demco, D.E., Johansson, A., and Tegenfeldt, J., Solid State Nuclear Magnetic
Resonance, 1995. 4(1): p. 13-38.
[56]. Buda, A., et al., Journal of Physical Chemistry B, 2003. 107(22): p. 5357-5370.
[57]. Buda, A., et al., Chemphyschem, 2004. 5(6): p. 876-883.
[58]. Kristiansen, M., et al., Macromolecules, 2003. 36(14): p. 5150-5156.
[59]. Jain, S., et al., Polymer, 2005. 46(20): p. 8805-8818.
[60]. Wunderlich, B., Thermal analysis. 1990, Academic Press: New York. p. 418.

Chapter 4
121
[61]. Schrauwen, B.A.G., et al., Macromolecules, 2004. 37(16): p. 6069-6078.
[62]. Garcia, M., et al., Polymers for Advanced Technologies, 2004. 15(4): p. 164-172.
[63]. Padden, F.J. and Keith, H.D., Journal of Applied Physics, 1966. 37(11): p. 4013-
&.
[64]. Dou, Q., et al., Journal of Sol-Gel Science and Technology, 2008. 48(1-2): p. 51-
60.
[65]. Zhu, P.W. and Edward, G., Macromolecular Materials and Engineering, 2003.
288(4): p. 301-311.
[66]. Fujiyama, M. and Wakino, T., Journal of Applied Polymer Science, 1991.
42(10): p. 2739-2747.
[67]. Fujiyama, M. and Wakino, T., Journal of Applied Polymer Science, 1991.
42(10): p. 2749-2760.
[68]. Price, F.P., In Nucleation, ed. Zettlemoyer, A.C. 1969, New York: Marcel
Dekker.
[69]. Fujiyama, M. and Wakino, T., Journal of Applied Polymer Science, 1991. 43(1):
p. 57-81.

Preparation and morphology study of iPP/silica composites via unmodified PEOS.
122
Chapter 5
123
5. Preparation and characterization of iPP
/ modified silica composites via modified
PEOS
According to TEM micrographs shown in chapter 04 (Figure 4. 10), the iPP / Silica
sample prepared with a small amount of PEOS (5 wt%) contained silica particles of 30-40
nm in size. However, due to the low compatibility of PEOS with PP, the particle size
increased when more PEOS was added. With the PEOS content of 10 wt%, particles of 300
– 400 nm in size were observed. At relatively high loading of PEOS (15 – 20 wt.-%), silica
particles of several micrometers were formed.
With given iPP matrix, despite the influence of the compounding condition (e.g.
temperature, screw speed and circle time) to the morphology of the silica particles in the
final composite, the miscibility of the precursor in the molten iPP should be the main key
factor we can play with in our lab. As shown in chapter 3, a series of modified PEOS were
synthesized to adjust the compatibility of PEOS in iPP matrix.
5.1. Preparation of iPP / iBSilica via iBPEOS
As mentioned in chapter 3, iso-butyl group was the first one we used to improve the
compatibility of PEOS and molten iPP because of the similarity to the end-groups in PP. A
series of iso-Butyl modified PEOS (iBPEOS) which should have a better compatibility with
the molten iPP matrix were synthesized and applied to the similar hybrids.
5.1.1. Experimental
Materials. Iso-butyl modified hyperbranched polyethoxysiloxane (iBPEOS) were
prepared according to the procedure reported previously in chapter 3. Isotactic polypropylene
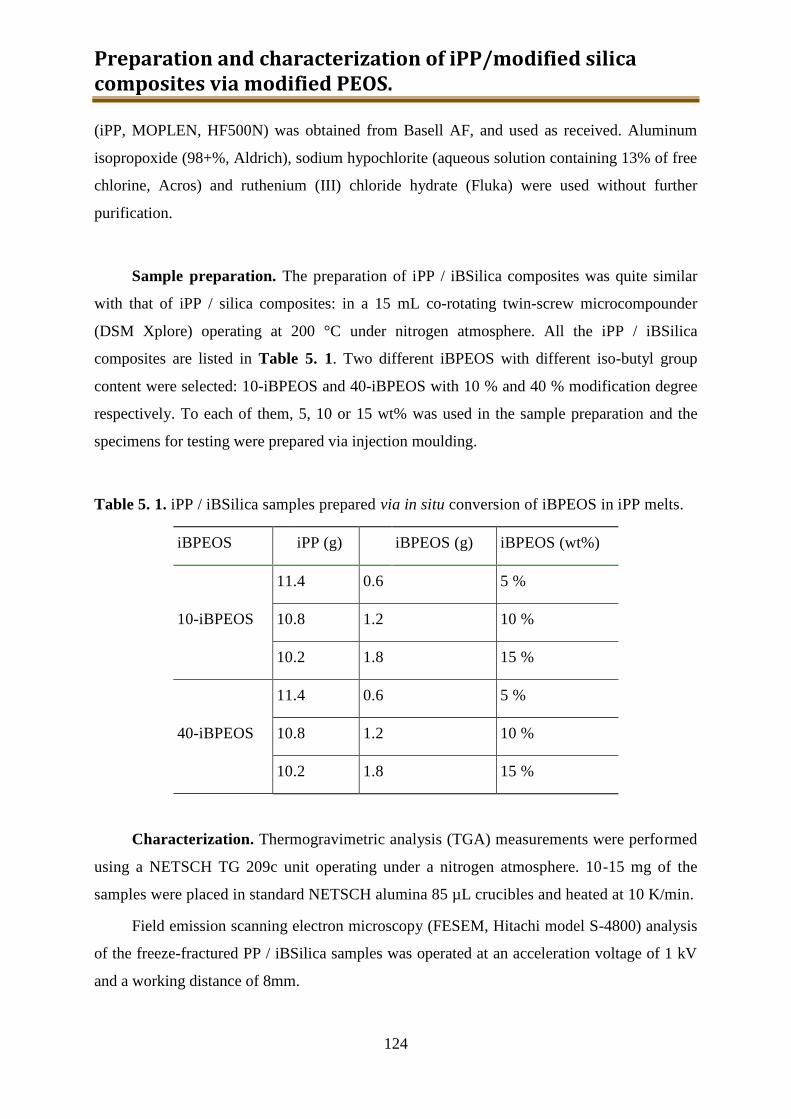
Preparation and characterization of iPP/modified silica composites via modified PEOS.
124
(iPP, MOPLEN, HF500N) was obtained from Basell AF, and used as received. Aluminum
isopropoxide (98+%, Aldrich), sodium hypochlorite (aqueous solution containing 13% of free
chlorine, Acros) and ruthenium (III) chloride hydrate (Fluka) were used without further
purification.
Sample preparation. The preparation of iPP / iBSilica composites was quite similar
with that of iPP / silica composites: in a 15 mL co-rotating twin-screw microcompounder
(DSM Xplore) operating at 200 °C under nitrogen atmosphere. All the iPP / iBSilica
composites are listed in Table 5. 1. Two different iBPEOS with different iso-butyl group
content were selected: 10-iBPEOS and 40-iBPEOS with 10 % and 40 % modification degree
respectively. To each of them, 5, 10 or 15 wt% was used in the sample preparation and the
specimens for testing were prepared via injection moulding.
Table 5. 1. iPP / iBSilica samples prepared via in situ conversion of iBPEOS in iPP melts.
iBPEOS iPP (g) iBPEOS (g) iBPEOS (wt%)
10-iBPEOS
11.4 0.6 5 %
10.8 1.2 10 %
10.2 1.8 15 %
40-iBPEOS
11.4 0.6 5 %
10.8 1.2 10 %
10.2 1.8 15 %
Characterization. Thermogravimetric analysis (TGA) measurements were performed
using a NETSCH TG 209c unit operating under a nitrogen atmosphere. 10-15 mg of the
samples were placed in standard NETSCH alumina 85 µL crucibles and heated at 10 K/min.
Field emission scanning electron microscopy (FESEM, Hitachi model S-4800) analysis
of the freeze-fractured PP / iBSilica samples was operated at an acceleration voltage of 1 kV
and a working distance of 8mm.
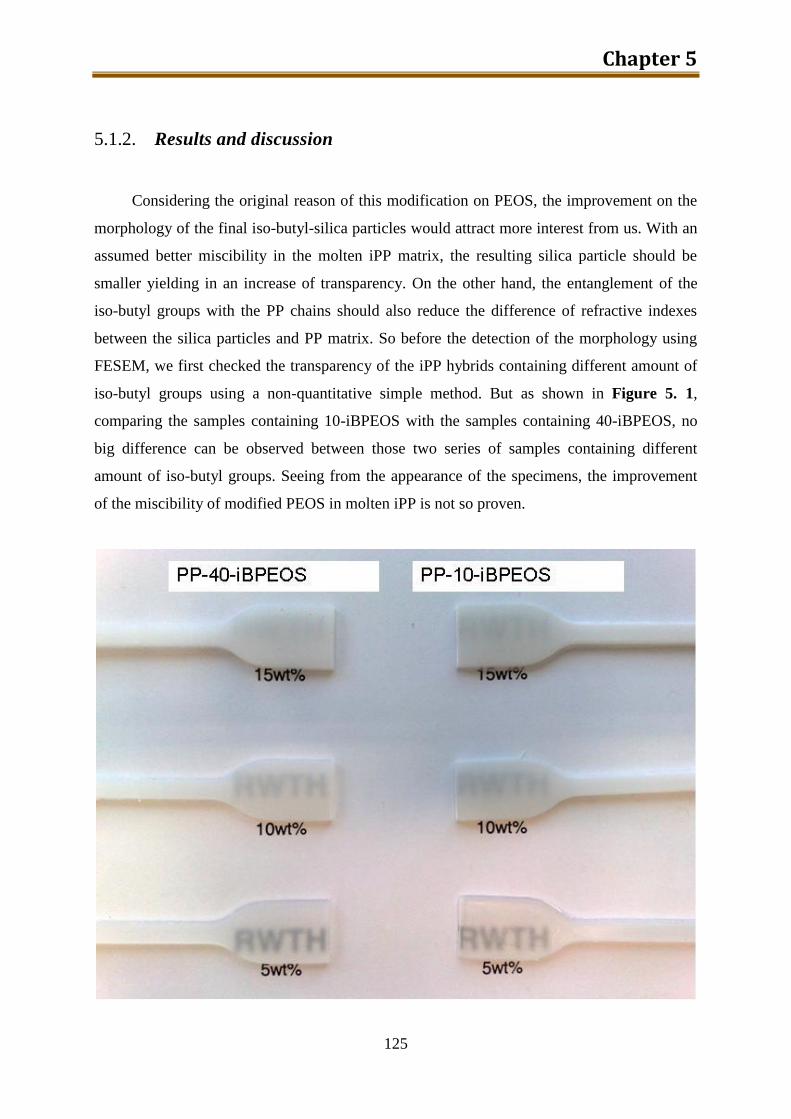
Chapter 5
125
5.1.2. Results and discussion
Considering the original reason of this modification on PEOS, the improvement on the
morphology of the final iso-butyl-silica particles would attract more interest from us. With an
assumed better miscibility in the molten iPP matrix, the resulting silica particle should be
smaller yielding in an increase of transparency. On the other hand, the entanglement of the
iso-butyl groups with the PP chains should also reduce the difference of refractive indexes
between the silica particles and PP matrix. So before the detection of the morphology using
FESEM, we first checked the transparency of the iPP hybrids containing different amount of
iso-butyl groups using a non-quantitative simple method. But as shown in Figure 5. 1,
comparing the samples containing 10-iBPEOS with the samples containing 40-iBPEOS, no
big difference can be observed between those two series of samples containing different
amount of iso-butyl groups. Seeing from the appearance of the specimens, the improvement
of the miscibility of modified PEOS in molten iPP is not so proven.
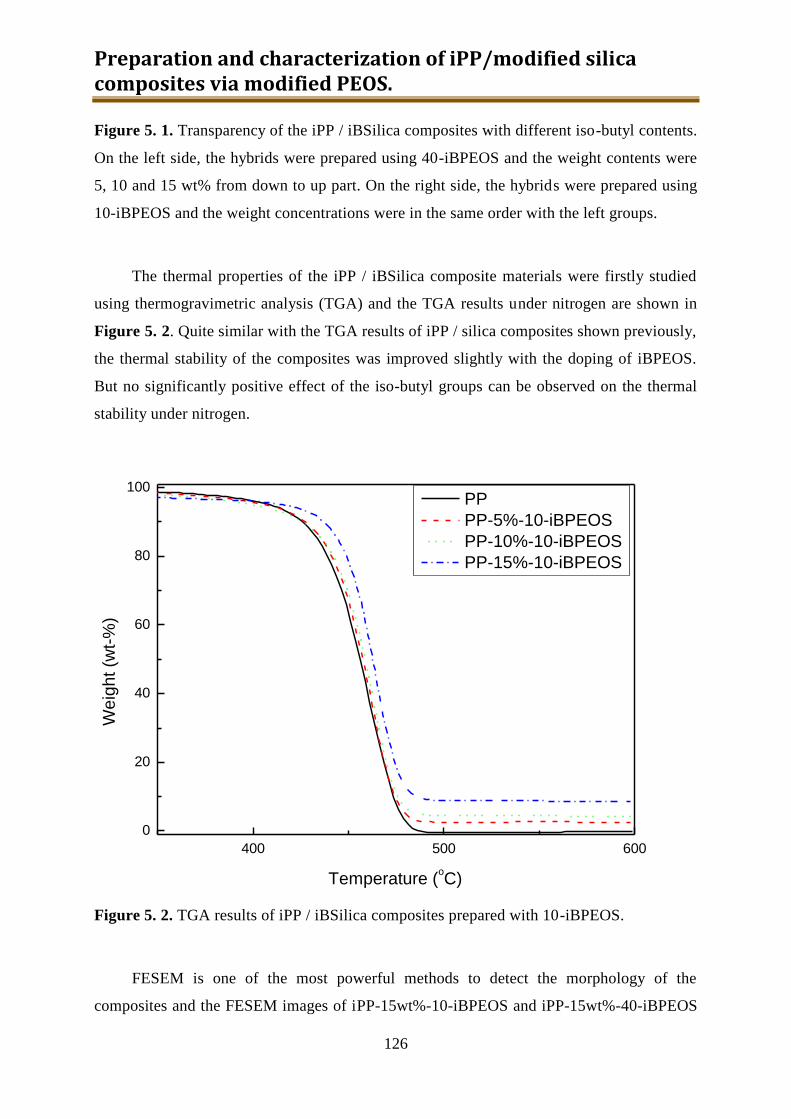
Preparation and characterization of iPP/modified silica composites via modified PEOS.
126
Figure 5. 1. Transparency of the iPP / iBSilica composites with different iso-butyl contents.
On the left side, the hybrids were prepared using 40-iBPEOS and the weight contents were
5, 10 and 15 wt% from down to up part. On the right side, the hybrids were prepared using
10-iBPEOS and the weight concentrations were in the same order with the left groups.
The thermal properties of the iPP / iBSilica composite materials were firstly studied
using thermogravimetric analysis (TGA) and the TGA results under nitrogen are shown in
Figure 5. 2. Quite similar with the TGA results of iPP / silica composites shown previously,
the thermal stability of the composites was improved slightly with the doping of iBPEOS.
But no significantly positive effect of the iso-butyl groups can be observed on the thermal
stability under nitrogen.
400 500 600
0
20
40
60
80
100
Temperature (oC)
We
igh
t (w
t-%
)
PP
PP-5%-10-iBPEOS
PP-10%-10-iBPEOS
PP-15%-10-iBPEOS
Figure 5. 2. TGA results of iPP / iBSilica composites prepared with 10-iBPEOS.
FESEM is one of the most powerful methods to detect the morphology of the
composites and the FESEM images of iPP-15wt%-10-iBPEOS and iPP-15wt%-40-iBPEOS

Chapter 5
127
are shown in Figure 5. 3. Obviously smaller particles (<2 μm) in comparison to composites
based on unmodified PEOS can be observed from the sample prepared with 40-iBPEOS
comparing with Figure 5. 3 (a). But still many particles larger than 5 μm still exist in the
matrix. So the conclusion will be the improvement of the miscibility of iBPEOS in molten
iPP is not good enough.
(a)

Preparation and characterization of iPP/modified silica composites via modified PEOS.
128
(b)
Figure 5. 3. FESEM images of (a). iPP-15wt%-10-iBPEOS and (b). iPP-15wt%-40-
iBPEOS.
5.1.3. Preliminary conclusion
Although the efficiency of the compounder might be another key issue in the
preparation, we can still see the improvement in the final particle dimensions in the iPP /
iBSilica composites comparing with that from previous chapter. With higher degree of iso-
butyl modification, the content of the smaller particles increased significantly. At least the
concept of modification on the miscibility of PEOS in molten iPP using alkyl groups was
proved applicable. And the not-encouraging-enough results from this part might be
explained by the not-good-enough compatibility of iso-butyl groups with the PP chains.
5.2. Preparation of iPP / OSilica via OPEOS
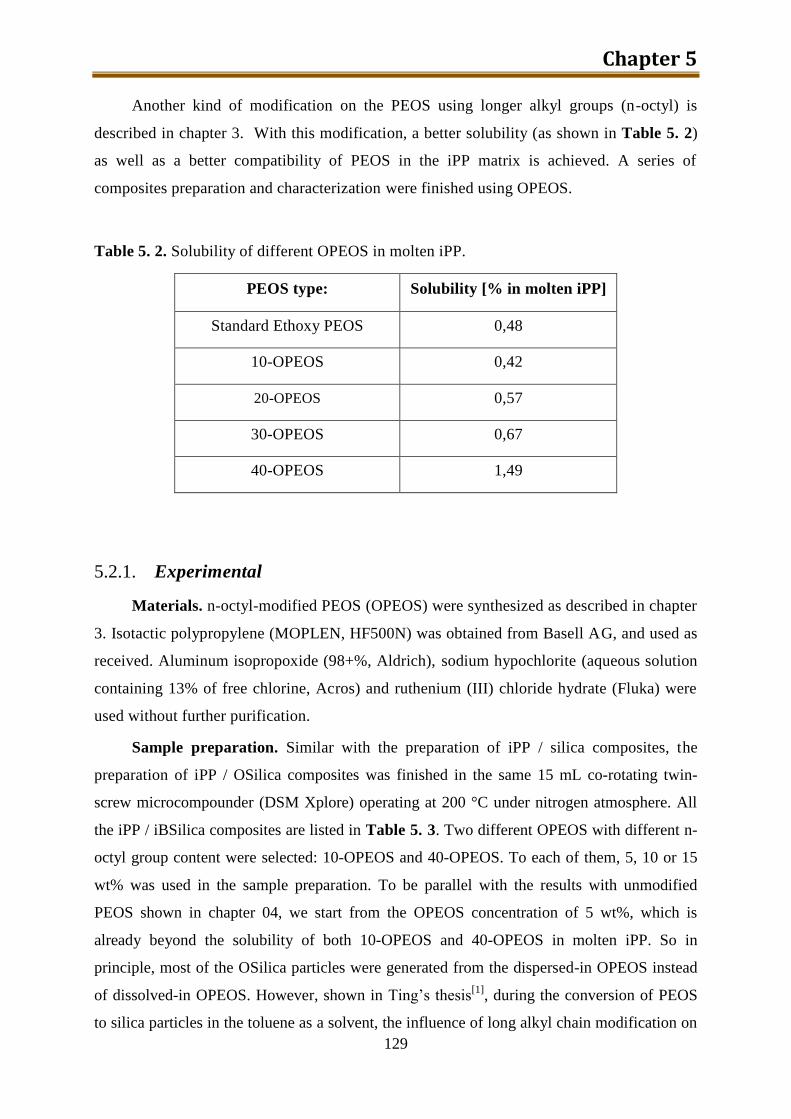
Chapter 5
129
Another kind of modification on the PEOS using longer alkyl groups (n-octyl) is
described in chapter 3. With this modification, a better solubility (as shown in Table 5. 2)
as well as a better compatibility of PEOS in the iPP matrix is achieved. A series of
composites preparation and characterization were finished using OPEOS.
Table 5. 2. Solubility of different OPEOS in molten iPP.
PEOS type: Solubility [% in molten iPP]
Standard Ethoxy PEOS 0,48
10-OPEOS 0,42
20-OPEOS 0,57
30-OPEOS 0,67
40-OPEOS 1,49
5.2.1. Experimental
Materials. n-octyl-modified PEOS (OPEOS) were synthesized as described in chapter
3. Isotactic polypropylene (MOPLEN, HF500N) was obtained from Basell AG, and used as
received. Aluminum isopropoxide (98+%, Aldrich), sodium hypochlorite (aqueous solution
containing 13% of free chlorine, Acros) and ruthenium (III) chloride hydrate (Fluka) were
used without further purification.
Sample preparation. Similar with the preparation of iPP / silica composites, the
preparation of iPP / OSilica composites was finished in the same 15 mL co-rotating twin-
screw microcompounder (DSM Xplore) operating at 200 °C under nitrogen atmosphere. All
the iPP / iBSilica composites are listed in Table 5. 3. Two different OPEOS with different n-
octyl group content were selected: 10-OPEOS and 40-OPEOS. To each of them, 5, 10 or 15
wt% was used in the sample preparation. To be parallel with the results with unmodified
PEOS shown in chapter 04, we start from the OPEOS concentration of 5 wt%, which is
already beyond the solubility of both 10-OPEOS and 40-OPEOS in molten iPP. So in
principle, most of the OSilica particles were generated from the dispersed-in OPEOS instead
of dissolved-in OPEOS. However, shown in Ting’s thesis[1]
, during the conversion of PEOS
to silica particles in the toluene as a solvent, the influence of long alkyl chain modification on
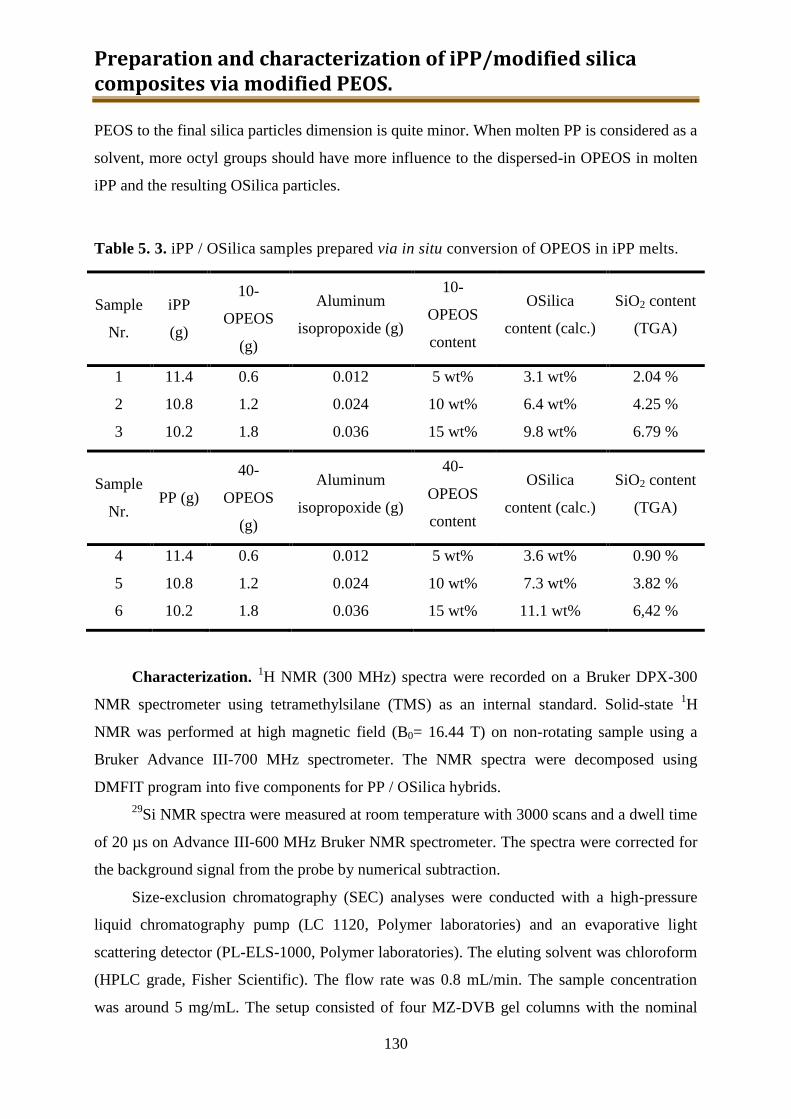
Preparation and characterization of iPP/modified silica composites via modified PEOS.
130
PEOS to the final silica particles dimension is quite minor. When molten PP is considered as a
solvent, more octyl groups should have more influence to the dispersed-in OPEOS in molten
iPP and the resulting OSilica particles.
Table 5. 3. iPP / OSilica samples prepared via in situ conversion of OPEOS in iPP melts.
Sample
Nr.
iPP
(g)
10-
OPEOS
(g)
Aluminum
isopropoxide (g)
10-
OPEOS
content
OSilica
content (calc.)
SiO2 content
(TGA)
1 11.4 0.6 0.012 5 wt% 3.1 wt% 2.04 %
2 10.8 1.2 0.024 10 wt% 6.4 wt% 4.25 %
3 10.2 1.8 0.036 15 wt% 9.8 wt% 6.79 %
Sample
Nr. PP (g)
40-
OPEOS
(g)
Aluminum
isopropoxide (g)
40-
OPEOS
content
OSilica
content (calc.)
SiO2 content
(TGA)
4 11.4 0.6 0.012 5 wt% 3.6 wt% 0.90 %
5 10.8 1.2 0.024 10 wt% 7.3 wt% 3.82 %
6 10.2 1.8 0.036 15 wt% 11.1 wt% 6,42 %
Characterization. 1H NMR (300 MHz) spectra were recorded on a Bruker DPX-300
NMR spectrometer using tetramethylsilane (TMS) as an internal standard. Solid-state 1H
NMR was performed at high magnetic field (B0= 16.44 T) on non-rotating sample using a
Bruker Advance III-700 MHz spectrometer. The NMR spectra were decomposed using
DMFIT program into five components for PP / OSilica hybrids.
29Si NMR spectra were measured at room temperature with 3000 scans and a dwell time
of 20 µs on Advance III-600 MHz Bruker NMR spectrometer. The spectra were corrected for
the background signal from the probe by numerical subtraction.
Size-exclusion chromatography (SEC) analyses were conducted with a high-pressure
liquid chromatography pump (LC 1120, Polymer laboratories) and an evaporative light
scattering detector (PL-ELS-1000, Polymer laboratories). The eluting solvent was chloroform
(HPLC grade, Fisher Scientific). The flow rate was 0.8 mL/min. The sample concentration
was around 5 mg/mL. The setup consisted of four MZ-DVB gel columns with the nominal
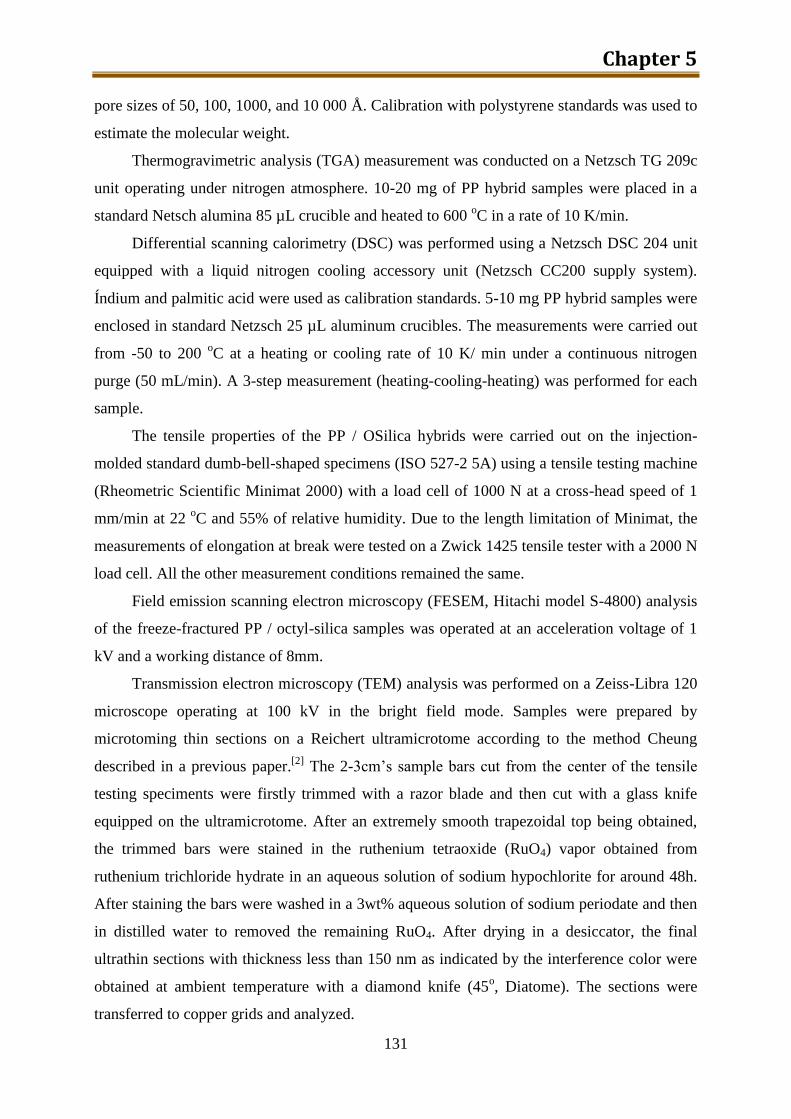
Chapter 5
131
pore sizes of 50, 100, 1000, and 10 000 Å. Calibration with polystyrene standards was used to
estimate the molecular weight.
Thermogravimetric analysis (TGA) measurement was conducted on a Netzsch TG 209c
unit operating under nitrogen atmosphere. 10-20 mg of PP hybrid samples were placed in a
standard Netsch alumina 85 µL crucible and heated to 600 oC in a rate of 10 K/min.
Differential scanning calorimetry (DSC) was performed using a Netzsch DSC 204 unit
equipped with a liquid nitrogen cooling accessory unit (Netzsch CC200 supply system).
Índium and palmitic acid were used as calibration standards. 5-10 mg PP hybrid samples were
enclosed in standard Netzsch 25 µL aluminum crucibles. The measurements were carried out
from -50 to 200 oC at a heating or cooling rate of 10 K/ min under a continuous nitrogen
purge (50 mL/min). A 3-step measurement (heating-cooling-heating) was performed for each
sample.
The tensile properties of the PP / OSilica hybrids were carried out on the injection-
molded standard dumb-bell-shaped specimens (ISO 527-2 5A) using a tensile testing machine
(Rheometric Scientific Minimat 2000) with a load cell of 1000 N at a cross-head speed of 1
mm/min at 22 oC and 55% of relative humidity. Due to the length limitation of Minimat, the
measurements of elongation at break were tested on a Zwick 1425 tensile tester with a 2000 N
load cell. All the other measurement conditions remained the same.
Field emission scanning electron microscopy (FESEM, Hitachi model S-4800) analysis
of the freeze-fractured PP / octyl-silica samples was operated at an acceleration voltage of 1
kV and a working distance of 8mm.
Transmission electron microscopy (TEM) analysis was performed on a Zeiss-Libra 120
microscope operating at 100 kV in the bright field mode. Samples were prepared by
microtoming thin sections on a Reichert ultramicrotome according to the method Cheung
described in a previous paper.[2]
The 2-3cm’s sample bars cut from the center of the tensile
testing speciments were firstly trimmed with a razor blade and then cut with a glass knife
equipped on the ultramicrotome. After an extremely smooth trapezoidal top being obtained,
the trimmed bars were stained in the ruthenium tetraoxide (RuO4) vapor obtained from
ruthenium trichloride hydrate in an aqueous solution of sodium hypochlorite for around 48h.
After staining the bars were washed in a 3wt% aqueous solution of sodium periodate and then
in distilled water to removed the remaining RuO4. After drying in a desiccator, the final
ultrathin sections with thickness less than 150 nm as indicated by the interference color were
obtained at ambient temperature with a diamond knife (45o, Diatome). The sections were
transferred to copper grids and analyzed.
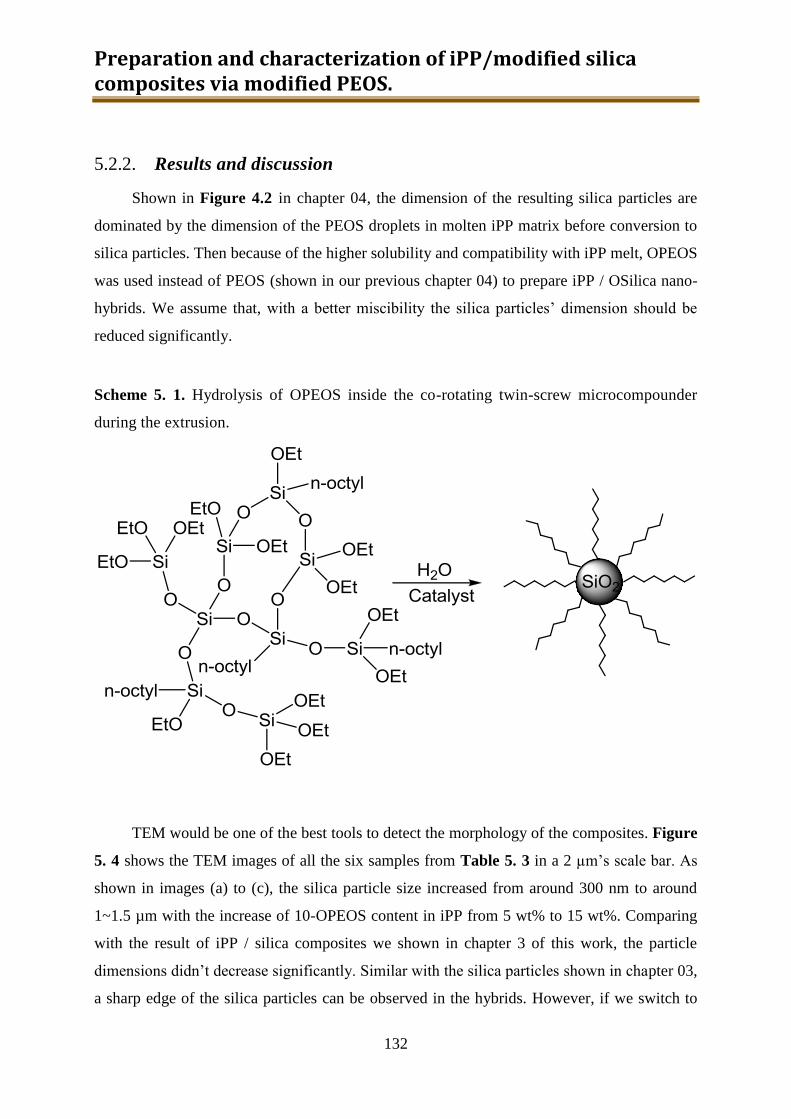
Preparation and characterization of iPP/modified silica composites via modified PEOS.
132
5.2.2. Results and discussion
Shown in Figure 4.2 in chapter 04, the dimension of the resulting silica particles are
dominated by the dimension of the PEOS droplets in molten iPP matrix before conversion to
silica particles. Then because of the higher solubility and compatibility with iPP melt, OPEOS
was used instead of PEOS (shown in our previous chapter 04) to prepare iPP / OSilica nano-
hybrids. We assume that, with a better miscibility the silica particles’ dimension should be
reduced significantly.
Scheme 5. 1. Hydrolysis of OPEOS inside the co-rotating twin-screw microcompounder
during the extrusion.
TEM would be one of the best tools to detect the morphology of the composites. Figure
5. 4 shows the TEM images of all the six samples from Table 5. 3 in a 2 µm’s scale bar. As
shown in images (a) to (c), the silica particle size increased from around 300 nm to around
1~1.5 µm with the increase of 10-OPEOS content in iPP from 5 wt% to 15 wt%. Comparing
with the result of iPP / silica composites we shown in chapter 3 of this work, the particle
dimensions didn’t decrease significantly. Similar with the silica particles shown in chapter 03,
a sharp edge of the silica particles can be observed in the hybrids. However, if we switch to
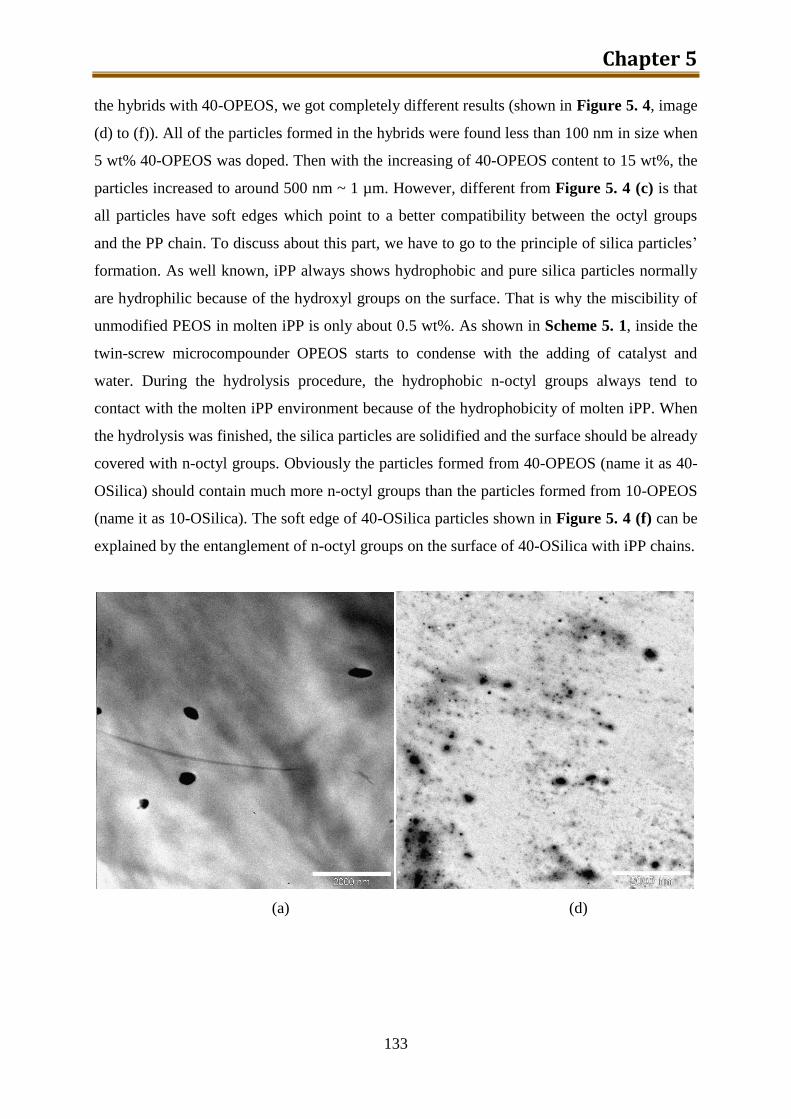
Chapter 5
133
the hybrids with 40-OPEOS, we got completely different results (shown in Figure 5. 4, image
(d) to (f)). All of the particles formed in the hybrids were found less than 100 nm in size when
5 wt% 40-OPEOS was doped. Then with the increasing of 40-OPEOS content to 15 wt%, the
particles increased to around 500 nm ~ 1 µm. However, different from Figure 5. 4 (c) is that
all particles have soft edges which point to a better compatibility between the octyl groups
and the PP chain. To discuss about this part, we have to go to the principle of silica particles’
formation. As well known, iPP always shows hydrophobic and pure silica particles normally
are hydrophilic because of the hydroxyl groups on the surface. That is why the miscibility of
unmodified PEOS in molten iPP is only about 0.5 wt%. As shown in Scheme 5. 1, inside the
twin-screw microcompounder OPEOS starts to condense with the adding of catalyst and
water. During the hydrolysis procedure, the hydrophobic n-octyl groups always tend to
contact with the molten iPP environment because of the hydrophobicity of molten iPP. When
the hydrolysis was finished, the silica particles are solidified and the surface should be already
covered with n-octyl groups. Obviously the particles formed from 40-OPEOS (name it as 40-
OSilica) should contain much more n-octyl groups than the particles formed from 10-OPEOS
(name it as 10-OSilica). The soft edge of 40-OSilica particles shown in Figure 5. 4 (f) can be
explained by the entanglement of n-octyl groups on the surface of 40-OSilica with iPP chains.
(a) (d)
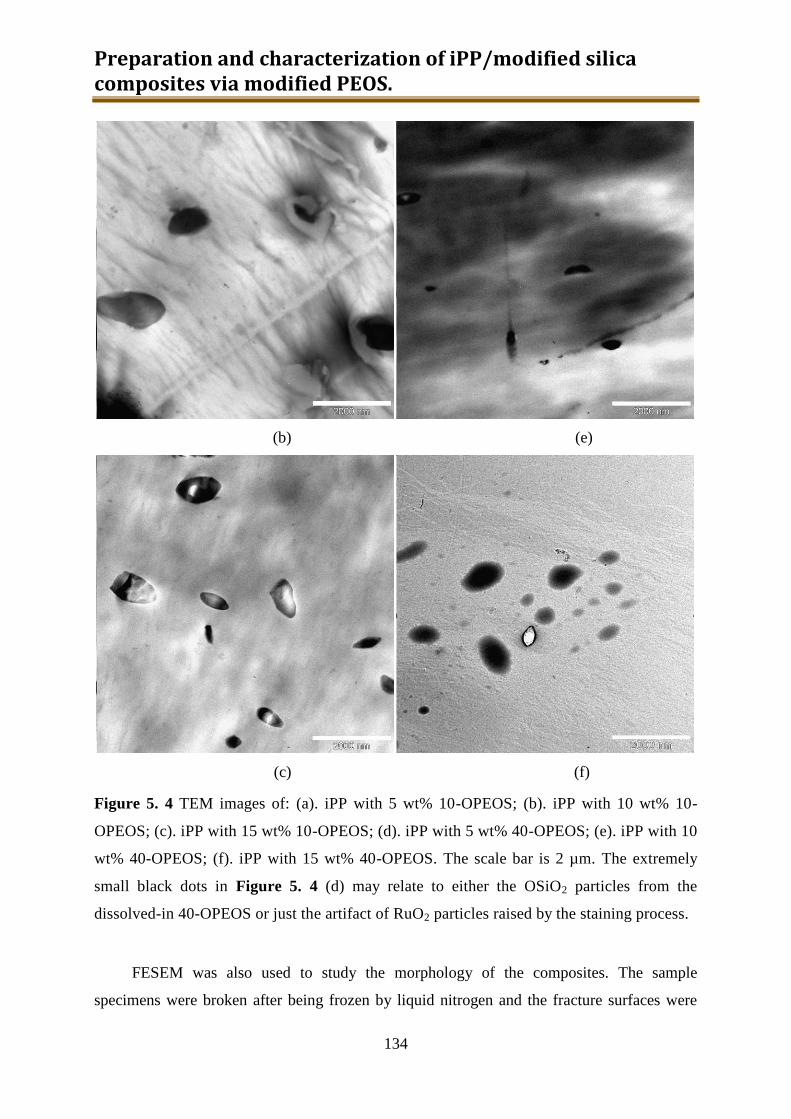
Preparation and characterization of iPP/modified silica composites via modified PEOS.
134
(b) (e)
(c) (f)
Figure 5. 4 TEM images of: (a). iPP with 5 wt% 10-OPEOS; (b). iPP with 10 wt% 10-
OPEOS; (c). iPP with 15 wt% 10-OPEOS; (d). iPP with 5 wt% 40-OPEOS; (e). iPP with 10
wt% 40-OPEOS; (f). iPP with 15 wt% 40-OPEOS. The scale bar is 2 µm. The extremely
small black dots in Figure 5. 4 (d) may relate to either the OSiO2 particles from the
dissolved-in 40-OPEOS or just the artifact of RuO2 particles raised by the staining process.
FESEM was also used to study the morphology of the composites. The sample
specimens were broken after being frozen by liquid nitrogen and the fracture surfaces were
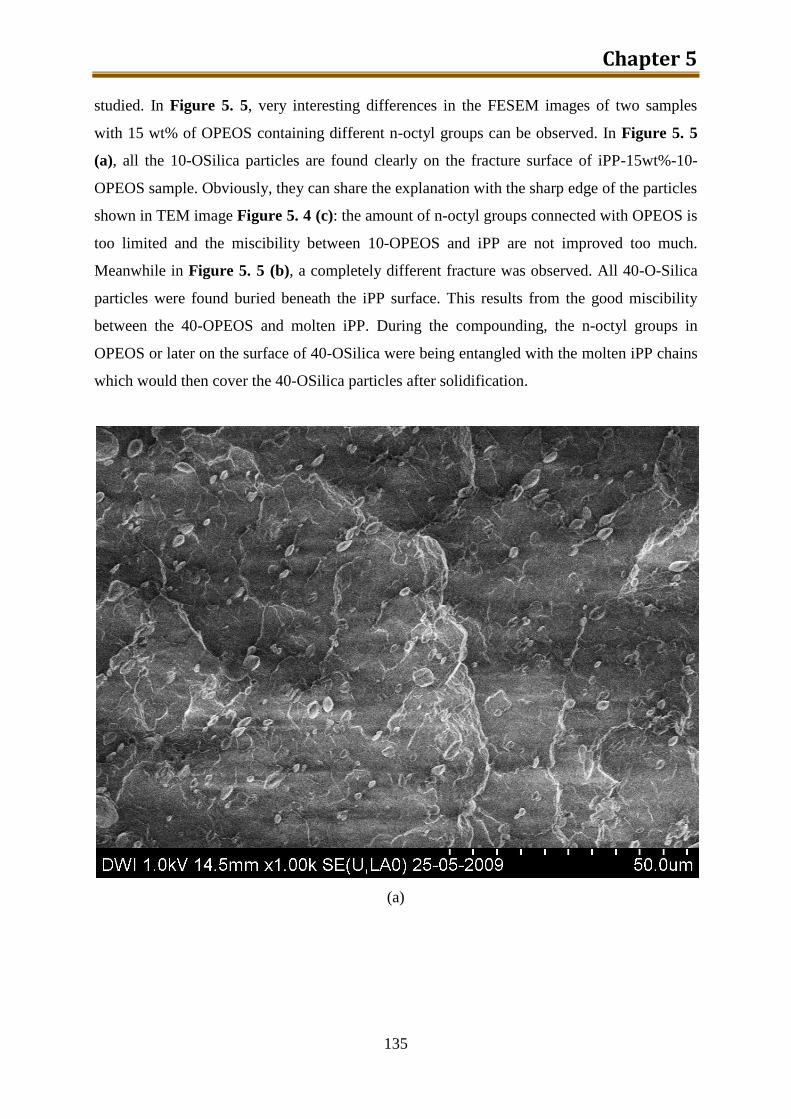
Chapter 5
135
studied. In Figure 5. 5, very interesting differences in the FESEM images of two samples
with 15 wt% of OPEOS containing different n-octyl groups can be observed. In Figure 5. 5
(a), all the 10-OSilica particles are found clearly on the fracture surface of iPP-15wt%-10-
OPEOS sample. Obviously, they can share the explanation with the sharp edge of the particles
shown in TEM image Figure 5. 4 (c): the amount of n-octyl groups connected with OPEOS is
too limited and the miscibility between 10-OPEOS and iPP are not improved too much.
Meanwhile in Figure 5. 5 (b), a completely different fracture was observed. All 40-O-Silica
particles were found buried beneath the iPP surface. This results from the good miscibility
between the 40-OPEOS and molten iPP. During the compounding, the n-octyl groups in
OPEOS or later on the surface of 40-OSilica were being entangled with the molten iPP chains
which would then cover the 40-OSilica particles after solidification.
(a)
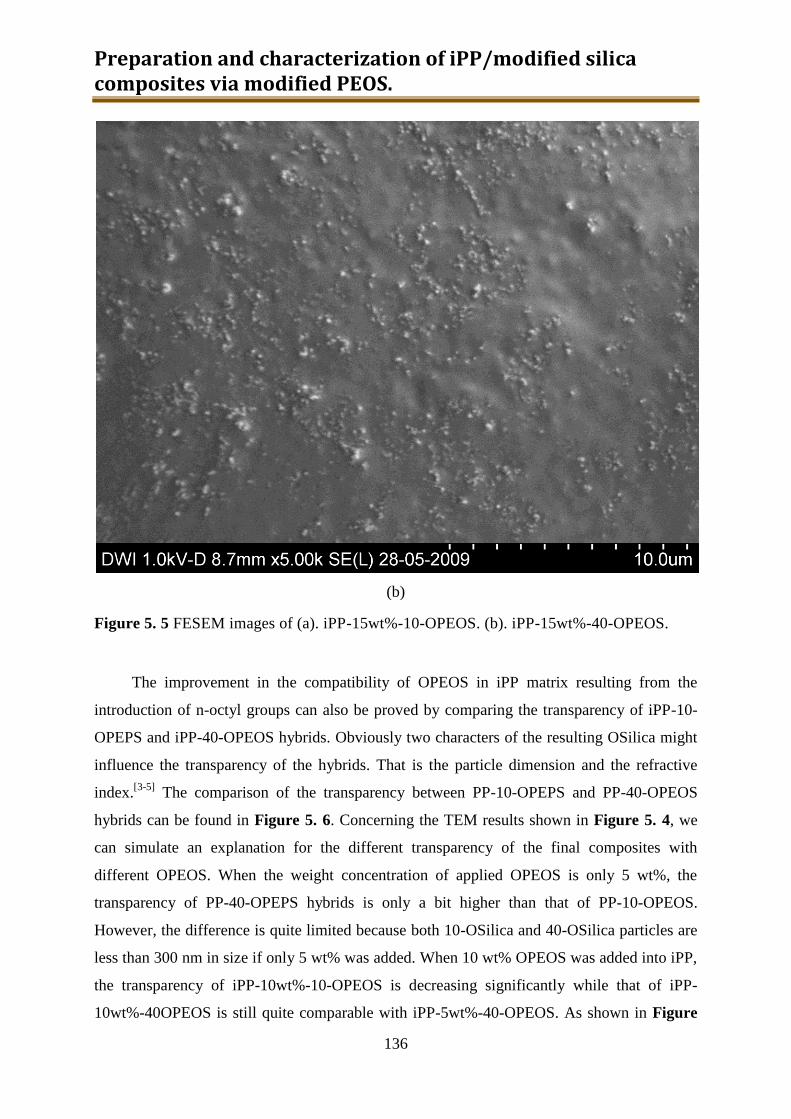
Preparation and characterization of iPP/modified silica composites via modified PEOS.
136
(b)
Figure 5. 5 FESEM images of (a). iPP-15wt%-10-OPEOS. (b). iPP-15wt%-40-OPEOS.
The improvement in the compatibility of OPEOS in iPP matrix resulting from the
introduction of n-octyl groups can also be proved by comparing the transparency of iPP-10-
OPEPS and iPP-40-OPEOS hybrids. Obviously two characters of the resulting OSilica might
influence the transparency of the hybrids. That is the particle dimension and the refractive
index.[3-5]
The comparison of the transparency between PP-10-OPEPS and PP-40-OPEOS
hybrids can be found in Figure 5. 6. Concerning the TEM results shown in Figure 5. 4, we
can simulate an explanation for the different transparency of the final composites with
different OPEOS. When the weight concentration of applied OPEOS is only 5 wt%, the
transparency of PP-40-OPEPS hybrids is only a bit higher than that of PP-10-OPEOS.
However, the difference is quite limited because both 10-OSilica and 40-OSilica particles are
less than 300 nm in size if only 5 wt% was added. When 10 wt% OPEOS was added into iPP,
the transparency of iPP-10wt%-10-OPEOS is decreasing significantly while that of iPP-
10wt%-40OPEOS is still quite comparable with iPP-5wt%-40-OPEOS. As shown in Figure
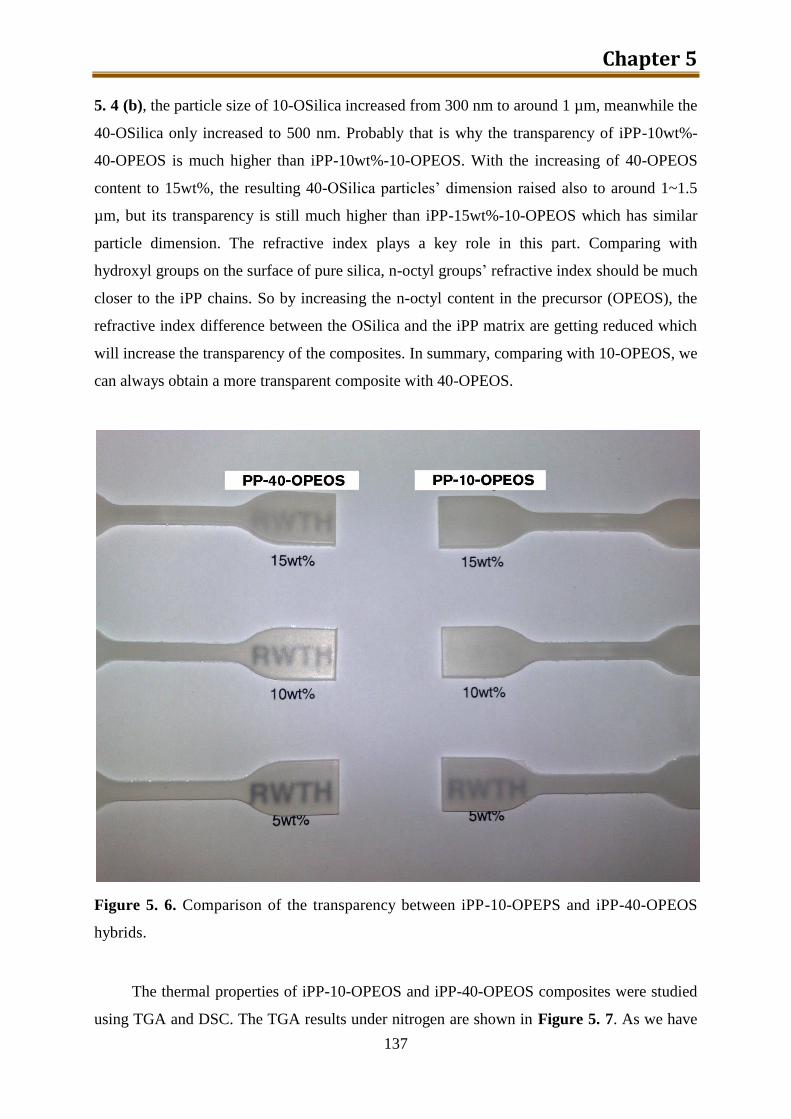
Chapter 5
137
5. 4 (b), the particle size of 10-OSilica increased from 300 nm to around 1 µm, meanwhile the
40-OSilica only increased to 500 nm. Probably that is why the transparency of iPP-10wt%-
40-OPEOS is much higher than iPP-10wt%-10-OPEOS. With the increasing of 40-OPEOS
content to 15wt%, the resulting 40-OSilica particles’ dimension raised also to around 1~1.5
µm, but its transparency is still much higher than iPP-15wt%-10-OPEOS which has similar
particle dimension. The refractive index plays a key role in this part. Comparing with
hydroxyl groups on the surface of pure silica, n-octyl groups’ refractive index should be much
closer to the iPP chains. So by increasing the n-octyl content in the precursor (OPEOS), the
refractive index difference between the OSilica and the iPP matrix are getting reduced which
will increase the transparency of the composites. In summary, comparing with 10-OPEOS, we
can always obtain a more transparent composite with 40-OPEOS.
Figure 5. 6. Comparison of the transparency between iPP-10-OPEPS and iPP-40-OPEOS
hybrids.
The thermal properties of iPP-10-OPEOS and iPP-40-OPEOS composites were studied
using TGA and DSC. The TGA results under nitrogen are shown in Figure 5. 7. As we have
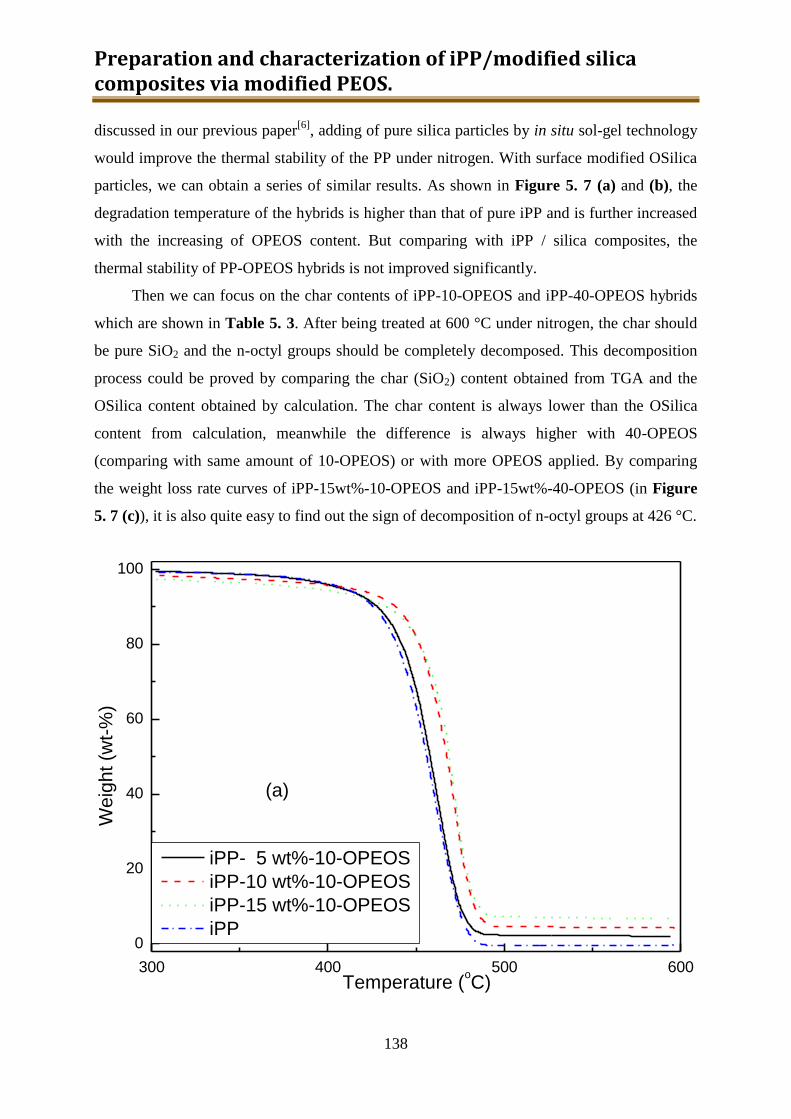
Preparation and characterization of iPP/modified silica composites via modified PEOS.
138
discussed in our previous paper[6]
, adding of pure silica particles by in situ sol-gel technology
would improve the thermal stability of the PP under nitrogen. With surface modified OSilica
particles, we can obtain a series of similar results. As shown in Figure 5. 7 (a) and (b), the
degradation temperature of the hybrids is higher than that of pure iPP and is further increased
with the increasing of OPEOS content. But comparing with iPP / silica composites, the
thermal stability of PP-OPEOS hybrids is not improved significantly.
Then we can focus on the char contents of iPP-10-OPEOS and iPP-40-OPEOS hybrids
which are shown in Table 5. 3. After being treated at 600 °C under nitrogen, the char should
be pure SiO2 and the n-octyl groups should be completely decomposed. This decomposition
process could be proved by comparing the char (SiO2) content obtained from TGA and the
OSilica content obtained by calculation. The char content is always lower than the OSilica
content from calculation, meanwhile the difference is always higher with 40-OPEOS
(comparing with same amount of 10-OPEOS) or with more OPEOS applied. By comparing
the weight loss rate curves of iPP-15wt%-10-OPEOS and iPP-15wt%-40-OPEOS (in Figure
5. 7 (c)), it is also quite easy to find out the sign of decomposition of n-octyl groups at 426 °C.
300 400 500 600
0
20
40
60
80
100
We
igh
t (w
t-%
)
Temperature (oC)
iPP- 5 wt%-10-OPEOS
iPP-10 wt%-10-OPEOS
iPP-15 wt%-10-OPEOS
iPP
(a)
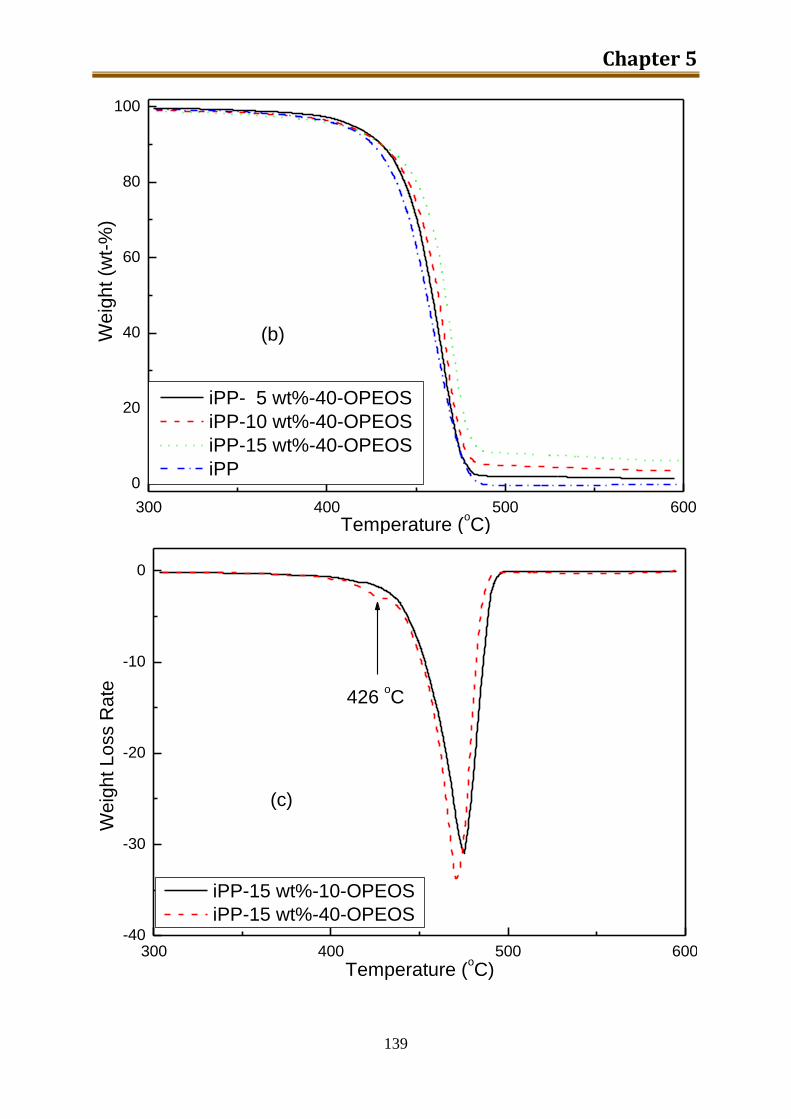
Chapter 5
139
300 400 500 600
0
20
40
60
80
100W
eig
ht (w
t-%
)
Temperature (oC)
iPP- 5 wt%-40-OPEOS
iPP-10 wt%-40-OPEOS
iPP-15 wt%-40-OPEOS
iPP
(b)
300 400 500 600-40
-30
-20
-10
0
426 oC
We
igh
t L
oss R
ate
Temperature (oC)
iPP-15 wt%-10-OPEOS
iPP-15 wt%-40-OPEOS
(c)
Preparation and characterization of iPP/modified silica composites via modified PEOS.
140
Figure 5. 7. (a), TGA curves of iPP-10-OPEOS hybrids; (b), TGA curves of iPP-40-OPEOS
hybrids; (c), comparison of the weight loss rate of iPP with 15 wt% 10-OPEOS and 40-
OPEOS.
The DSC data about pure iPP and iPP-OPEOS hybrids are summarized in Table 5.3. At
the first heating runs, the melting temperature was found decreasing with the adding of
OPEOS, and the only exception is PP-5wt%-10-OPEOS. Comparing with the result of DSC
test about PP / Silica hybrids in our previous paper [6]
, we can easily find out that the reason
for this exception is the small amount of n-octyl groups. Though the silica particles have good
nucleation effect[7]
in the iPP matrix, both Tm1 and Tm2 were identical when 2.5~10 wt% pure
silica particle was added. With 5wt % 10-OPEOS introduced, the Tm1 of the iPP hybrid is
almost the same with Tm1 of pure iPP and even the Tm2 is not as low as all the other samples
in two series. The Tm1 of the iPP hybrids with 40-OPEOS or not less than 10 wt% 10-OPEOS
are almost coincident and all of them are about 3 °C lower than the Tm1 of pure iPP. The
melting temperatures of this series of samples during the second melting (Tm2) are showing a
similar tendency comparing with Tm1. The Tm2 of iPP-5wt%-10-OPEOS is 1.8 °C lower than
that of pure iPP while all the rest samples have a similar bigger gap (4 °C) comparing with
pure iPP. Then we can easily estimate the effect of n-octyl groups on the melting temperature.
The crystalline fraction (Xc) of iPP in the composite was determined in the following
formula by the melting enthalpy (ΔH) which are calculated from the DSC curves:
%100X c
o
f
f
H
F
H
ΔHf is the melting enthalpy of the iPP hybrids and o
fH which is 207.1 J/g is the
melting enthalpy for 100% crystalline PP.[8]
The factor F is the weight content of iPP in the
hybrids samples and it can be calculated as:
%1 OSilicaF
where OSilica% is the OSilica weight content in the iPP hybrids.
The crystalline fractions (both Xc1 and Xc2) of all the prepared samples and pure PP are
shown in Table 5. 4. Comparing with pure silica particles, OSilica particle appears to be a
better nucleation agent. For the injection-molded specimens, even only 5 wt% 10-OPEOS was
added, the crystalline fraction (Xc1) of the iPP hybrids would increase from 44 % to 47.37 %.
Then with the increasing of the 10-OPEOS content from 5 wt% to 15 wt%, Xc1 would
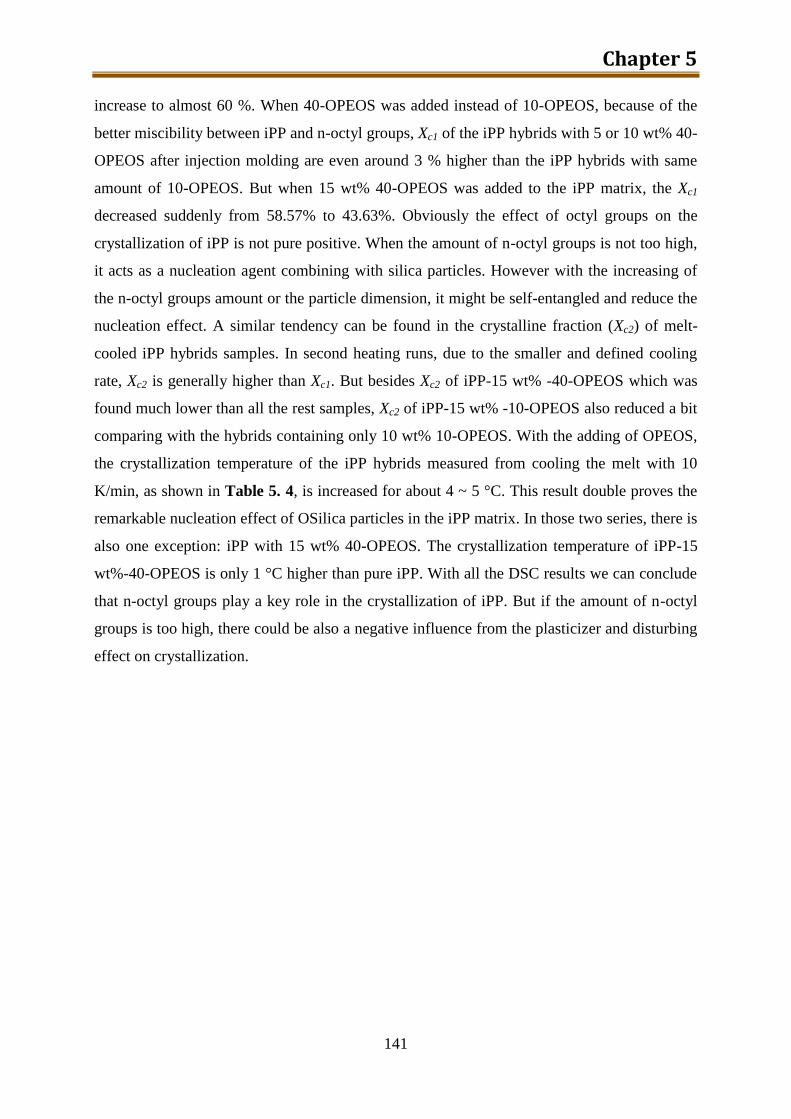
Chapter 5
141
increase to almost 60 %. When 40-OPEOS was added instead of 10-OPEOS, because of the
better miscibility between iPP and n-octyl groups, Xc1 of the iPP hybrids with 5 or 10 wt% 40-
OPEOS after injection molding are even around 3 % higher than the iPP hybrids with same
amount of 10-OPEOS. But when 15 wt% 40-OPEOS was added to the iPP matrix, the Xc1
decreased suddenly from 58.57% to 43.63%. Obviously the effect of octyl groups on the
crystallization of iPP is not pure positive. When the amount of n-octyl groups is not too high,
it acts as a nucleation agent combining with silica particles. However with the increasing of
the n-octyl groups amount or the particle dimension, it might be self-entangled and reduce the
nucleation effect. A similar tendency can be found in the crystalline fraction (Xc2) of melt-
cooled iPP hybrids samples. In second heating runs, due to the smaller and defined cooling
rate, Xc2 is generally higher than Xc1. But besides Xc2 of iPP-15 wt% -40-OPEOS which was
found much lower than all the rest samples, Xc2 of iPP-15 wt% -10-OPEOS also reduced a bit
comparing with the hybrids containing only 10 wt% 10-OPEOS. With the adding of OPEOS,
the crystallization temperature of the iPP hybrids measured from cooling the melt with 10
K/min, as shown in Table 5. 4, is increased for about 4 ~ 5 °C. This result double proves the
remarkable nucleation effect of OSilica particles in the iPP matrix. In those two series, there is
also one exception: iPP with 15 wt% 40-OPEOS. The crystallization temperature of iPP-15
wt%-40-OPEOS is only 1 °C higher than pure iPP. With all the DSC results we can conclude
that n-octyl groups play a key role in the crystallization of iPP. But if the amount of n-octyl
groups is too high, there could be also a negative influence from the plasticizer and disturbing
effect on crystallization.
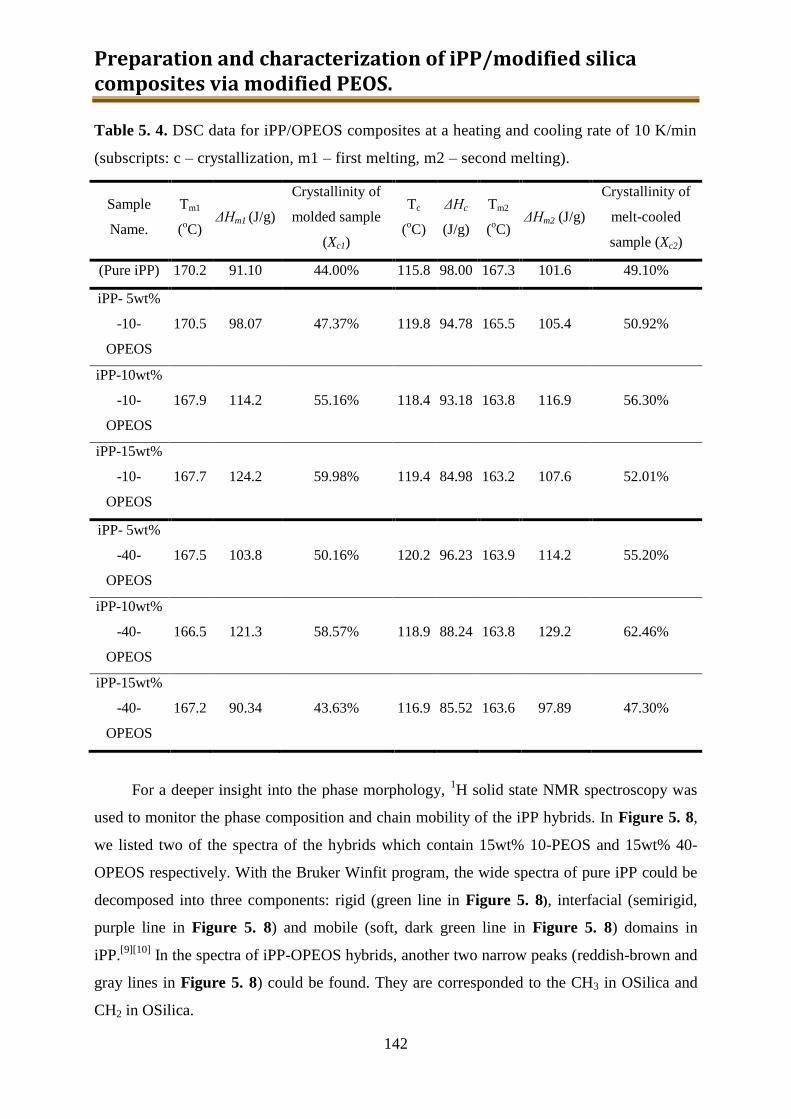
Preparation and characterization of iPP/modified silica composites via modified PEOS.
142
Table 5. 4. DSC data for iPP/OPEOS composites at a heating and cooling rate of 10 K/min
(subscripts: c – crystallization, m1 – first melting, m2 – second melting).
Sample
Name.
Tm1
(oC)
ΔHm1 (J/g)
Crystallinity of
molded sample
(Xc1)
Tc
(oC)
ΔHc
(J/g)
Tm2
(oC)
ΔHm2 (J/g)
Crystallinity of
melt-cooled
sample (Xc2)
(Pure iPP) 170.2 91.10 44.00% 115.8 98.00 167.3 101.6 49.10%
iPP- 5wt%
-10-
OPEOS
170.5 98.07 47.37% 119.8 94.78 165.5 105.4 50.92%
iPP-10wt%
-10-
OPEOS
167.9 114.2 55.16% 118.4 93.18 163.8 116.9 56.30%
iPP-15wt%
-10-
OPEOS
167.7 124.2 59.98% 119.4 84.98 163.2 107.6 52.01%
iPP- 5wt%
-40-
OPEOS
167.5 103.8 50.16% 120.2 96.23 163.9 114.2 55.20%
iPP-10wt%
-40-
OPEOS
166.5 121.3 58.57% 118.9 88.24 163.8 129.2 62.46%
iPP-15wt%
-40-
OPEOS
167.2 90.34 43.63% 116.9 85.52 163.6 97.89 47.30%
For a deeper insight into the phase morphology, 1H solid state NMR spectroscopy was
used to monitor the phase composition and chain mobility of the iPP hybrids. In Figure 5. 8,
we listed two of the spectra of the hybrids which contain 15wt% 10-PEOS and 15wt% 40-
OPEOS respectively. With the Bruker Winfit program, the wide spectra of pure iPP could be
decomposed into three components: rigid (green line in Figure 5. 8), interfacial (semirigid,
purple line in Figure 5. 8) and mobile (soft, dark green line in Figure 5. 8) domains in
iPP.[9][10]
In the spectra of iPP-OPEOS hybrids, another two narrow peaks (reddish-brown and
gray lines in Figure 5. 8) could be found. They are corresponded to the CH3 in OSilica and
CH2 in OSilica.
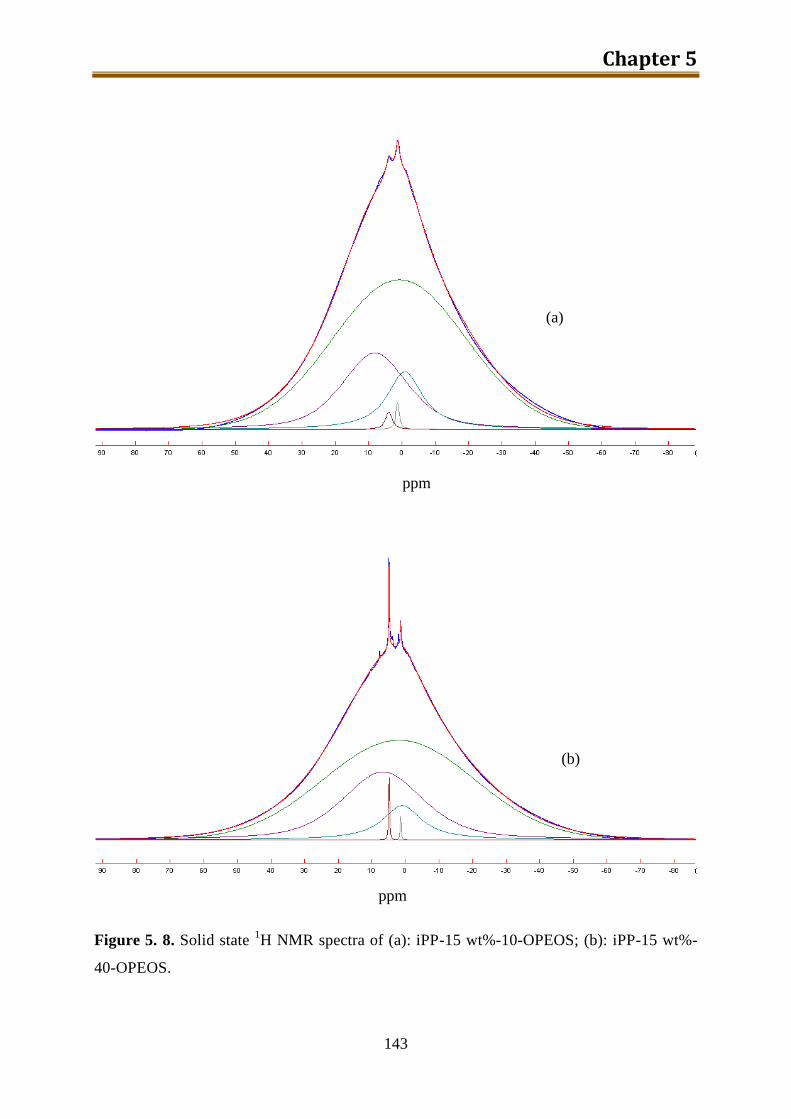
Chapter 5
143
Figure 5. 8. Solid state 1H NMR spectra of (a): iPP-15 wt%-10-OPEOS; (b): iPP-15 wt%-
40-OPEOS.
ppm
ppm
(a)
(b)
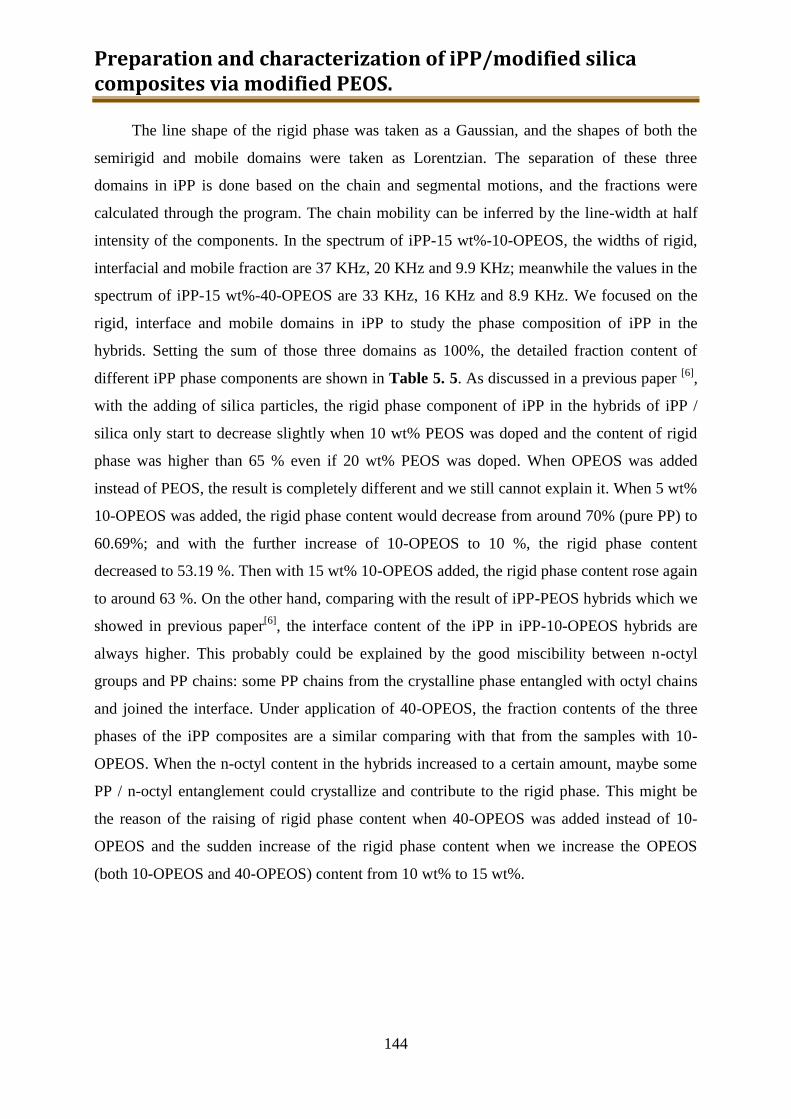
Preparation and characterization of iPP/modified silica composites via modified PEOS.
144
The line shape of the rigid phase was taken as a Gaussian, and the shapes of both the
semirigid and mobile domains were taken as Lorentzian. The separation of these three
domains in iPP is done based on the chain and segmental motions, and the fractions were
calculated through the program. The chain mobility can be inferred by the line-width at half
intensity of the components. In the spectrum of iPP-15 wt%-10-OPEOS, the widths of rigid,
interfacial and mobile fraction are 37 KHz, 20 KHz and 9.9 KHz; meanwhile the values in the
spectrum of iPP-15 wt%-40-OPEOS are 33 KHz, 16 KHz and 8.9 KHz. We focused on the
rigid, interface and mobile domains in iPP to study the phase composition of iPP in the
hybrids. Setting the sum of those three domains as 100%, the detailed fraction content of
different iPP phase components are shown in Table 5. 5. As discussed in a previous paper [6]
,
with the adding of silica particles, the rigid phase component of iPP in the hybrids of iPP /
silica only start to decrease slightly when 10 wt% PEOS was doped and the content of rigid
phase was higher than 65 % even if 20 wt% PEOS was doped. When OPEOS was added
instead of PEOS, the result is completely different and we still cannot explain it. When 5 wt%
10-OPEOS was added, the rigid phase content would decrease from around 70% (pure PP) to
60.69%; and with the further increase of 10-OPEOS to 10 %, the rigid phase content
decreased to 53.19 %. Then with 15 wt% 10-OPEOS added, the rigid phase content rose again
to around 63 %. On the other hand, comparing with the result of iPP-PEOS hybrids which we
showed in previous paper[6]
, the interface content of the iPP in iPP-10-OPEOS hybrids are
always higher. This probably could be explained by the good miscibility between n-octyl
groups and PP chains: some PP chains from the crystalline phase entangled with octyl chains
and joined the interface. Under application of 40-OPEOS, the fraction contents of the three
phases of the iPP composites are a similar comparing with that from the samples with 10-
OPEOS. When the n-octyl content in the hybrids increased to a certain amount, maybe some
PP / n-octyl entanglement could crystallize and contribute to the rigid phase. This might be
the reason of the raising of rigid phase content when 40-OPEOS was added instead of 10-
OPEOS and the sudden increase of the rigid phase content when we increase the OPEOS
(both 10-OPEOS and 40-OPEOS) content from 10 wt% to 15 wt%.
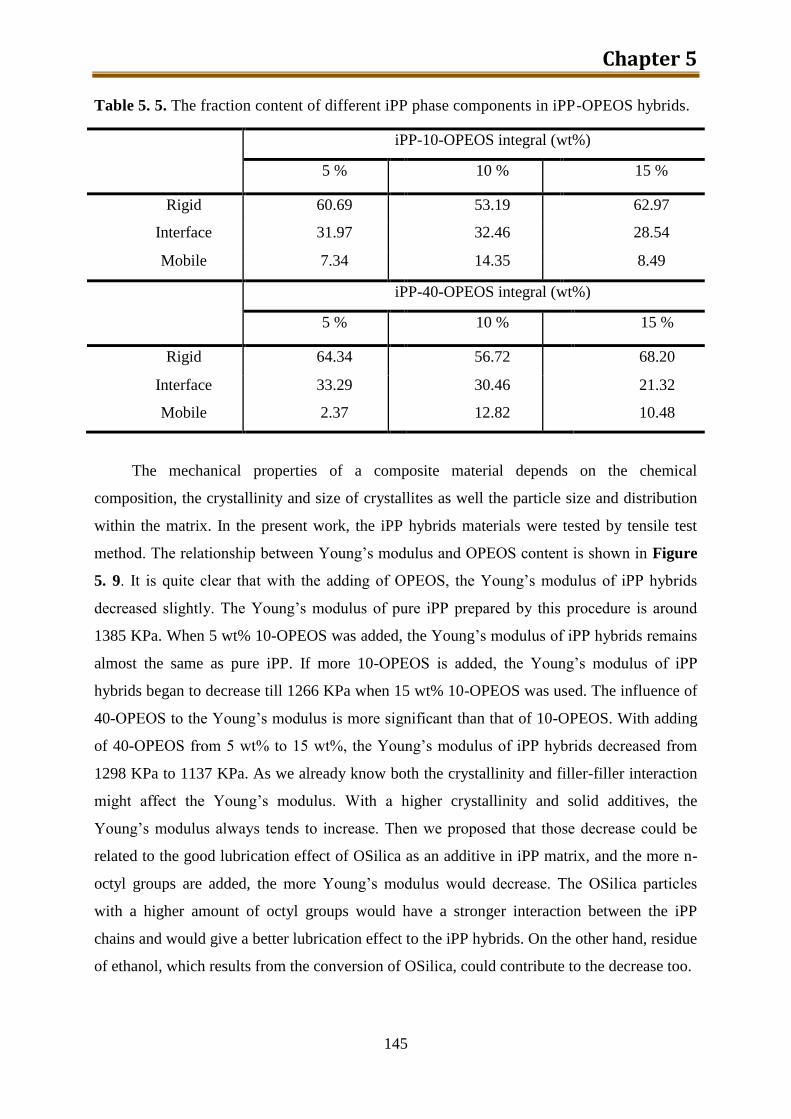
Chapter 5
145
Table 5. 5. The fraction content of different iPP phase components in iPP-OPEOS hybrids.
iPP-10-OPEOS integral (wt%)
5 % 10 % 15 %
Rigid 60.69 53.19 62.97
Interface 31.97 32.46 28.54
Mobile 7.34 14.35 8.49
iPP-40-OPEOS integral (wt%)
5 % 10 % 15 %
Rigid 64.34 56.72 68.20
Interface 33.29 30.46 21.32
Mobile 2.37 12.82 10.48
The mechanical properties of a composite material depends on the chemical
composition, the crystallinity and size of crystallites as well the particle size and distribution
within the matrix. In the present work, the iPP hybrids materials were tested by tensile test
method. The relationship between Young’s modulus and OPEOS content is shown in Figure
5. 9. It is quite clear that with the adding of OPEOS, the Young’s modulus of iPP hybrids
decreased slightly. The Young’s modulus of pure iPP prepared by this procedure is around
1385 KPa. When 5 wt% 10-OPEOS was added, the Young’s modulus of iPP hybrids remains
almost the same as pure iPP. If more 10-OPEOS is added, the Young’s modulus of iPP
hybrids began to decrease till 1266 KPa when 15 wt% 10-OPEOS was used. The influence of
40-OPEOS to the Young’s modulus is more significant than that of 10-OPEOS. With adding
of 40-OPEOS from 5 wt% to 15 wt%, the Young’s modulus of iPP hybrids decreased from
1298 KPa to 1137 KPa. As we already know both the crystallinity and filler-filler interaction
might affect the Young’s modulus. With a higher crystallinity and solid additives, the
Young’s modulus always tends to increase. Then we proposed that those decrease could be
related to the good lubrication effect of OSilica as an additive in iPP matrix, and the more n-
octyl groups are added, the more Young’s modulus would decrease. The OSilica particles
with a higher amount of octyl groups would have a stronger interaction between the iPP
chains and would give a better lubrication effect to the iPP hybrids. On the other hand, residue
of ethanol, which results from the conversion of OSilica, could contribute to the decrease too.
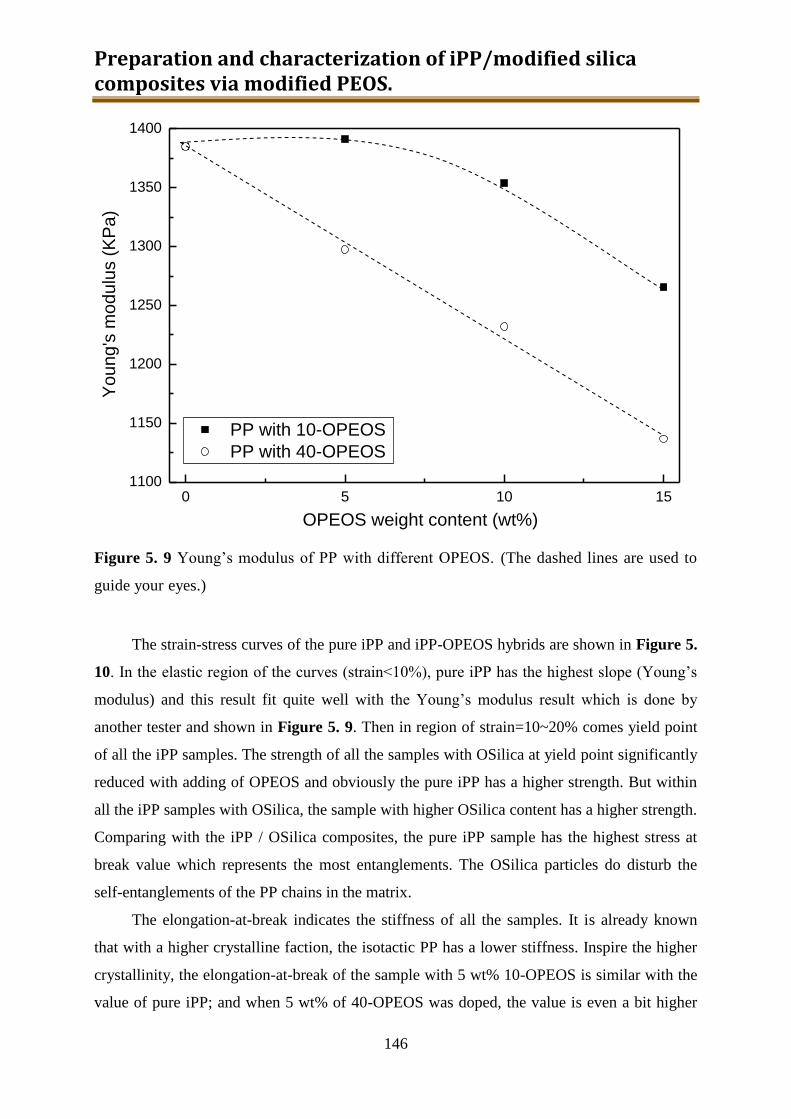
Preparation and characterization of iPP/modified silica composites via modified PEOS.
146
0 5 10 151100
1150
1200
1250
1300
1350
1400
Yo
un
g's
mo
du
lus (
KP
a)
PP with 10-OPEOS
PP with 40-OPEOS
OPEOS weight content (wt%)
Figure 5. 9 Young’s modulus of PP with different OPEOS. (The dashed lines are used to
guide your eyes.)
The strain-stress curves of the pure iPP and iPP-OPEOS hybrids are shown in Figure 5.
10. In the elastic region of the curves (strain<10%), pure iPP has the highest slope (Young’s
modulus) and this result fit quite well with the Young’s modulus result which is done by
another tester and shown in Figure 5. 9. Then in region of strain=10~20% comes yield point
of all the iPP samples. The strength of all the samples with OSilica at yield point significantly
reduced with adding of OPEOS and obviously the pure iPP has a higher strength. But within
all the iPP samples with OSilica, the sample with higher OSilica content has a higher strength.
Comparing with the iPP / OSilica composites, the pure iPP sample has the highest stress at
break value which represents the most entanglements. The OSilica particles do disturb the
self-entanglements of the PP chains in the matrix.
The elongation-at-break indicates the stiffness of all the samples. It is already known
that with a higher crystalline faction, the isotactic PP has a lower stiffness. Inspire the higher
crystallinity, the elongation-at-break of the sample with 5 wt% 10-OPEOS is similar with the
value of pure iPP; and when 5 wt% of 40-OPEOS was doped, the value is even a bit higher
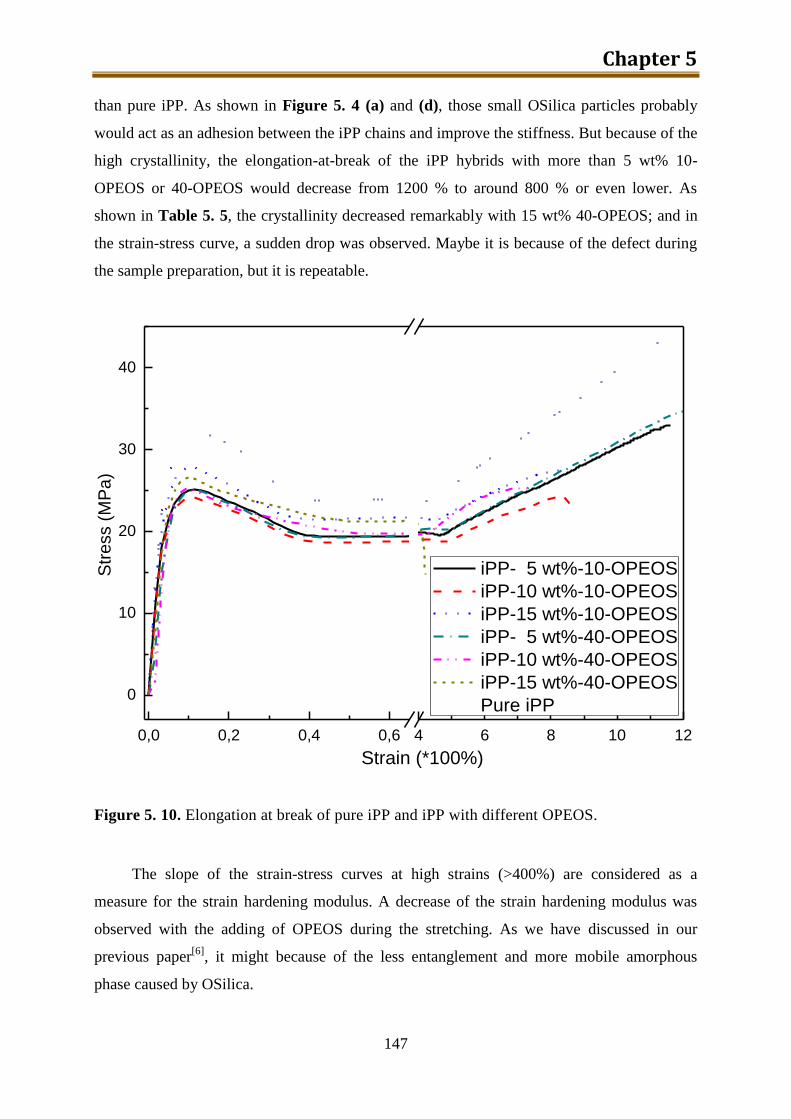
Chapter 5
147
than pure iPP. As shown in Figure 5. 4 (a) and (d), those small OSilica particles probably
would act as an adhesion between the iPP chains and improve the stiffness. But because of the
high crystallinity, the elongation-at-break of the iPP hybrids with more than 5 wt% 10-
OPEOS or 40-OPEOS would decrease from 1200 % to around 800 % or even lower. As
shown in Table 5. 5, the crystallinity decreased remarkably with 15 wt% 40-OPEOS; and in
the strain-stress curve, a sudden drop was observed. Maybe it is because of the defect during
the sample preparation, but it is repeatable.
0,0 0,2 0,4 0,6 4 6 8 10 12
0
10
20
30
40
Str
ess (
MP
a)
Strain (*100%)
iPP- 5 wt%-10-OPEOS
iPP-10 wt%-10-OPEOS
iPP-15 wt%-10-OPEOS
iPP- 5 wt%-40-OPEOS
iPP-10 wt%-40-OPEOS
iPP-15 wt%-40-OPEOS
Pure iPP
Figure 5. 10. Elongation at break of pure iPP and iPP with different OPEOS.
The slope of the strain-stress curves at high strains (>400%) are considered as a
measure for the strain hardening modulus. A decrease of the strain hardening modulus was
observed with the adding of OPEOS during the stretching. As we have discussed in our
previous paper[6]
, it might because of the less entanglement and more mobile amorphous
phase caused by OSilica.
Preparation and characterization of iPP/modified silica composites via modified PEOS.
148
5.2.3. Preliminary conclusion
In this part, a series of iPP composites containing from nano-scale to micro-scale
silica particles were prepared. The dimension of the resulting silica particles decreased and
the transparency of the final composites were improved by the modification of PEOS with
n-octyl groups.
5.3. Preparation of iPP / NH2-Silica via NH2-PEOS
So far all the modification and application of PEOS targeted only the nano-scale
composites. During the project “Improve the flame retardance of flexible PU foams” (see
chapter 07), we applied amino modified PEOS to the PU foam and the thermal stability of
the PU foams under air was significantly improved. One more small trial of the application
of amino modified PEOS on iPP composites was carried on to discover the influence of
amino groups modified silica particles to the thermal stability of iPP composites. To
maximum the influence of the amino groups, one of the amino groups modified silica
precursors containing most amino groups was chosen: PAPTES (x=1).
5.3.1. Experimental
Materials. PAPTES (x=1) was synthesized as described in chapter 3. Both PAPTES
before and after putting though the TFE were used in the sample preparation. Isotactic
polypropylene (MOPLEN, HF501N) was obtained from Basell AG, and was used as
received.
Sample preparation. Similar to the preparation of iPP / silica composites, the
preparation of iPP / NH2-Silica composites was finished in the same 15 mL co-rotating twin-
screw microcompounder (DSM Xplore) operating at 200 °C under nitrogen atmosphere. All
the iPP / NH2-Silica composites are listed in Table 5. 6. Both PAPTES (x=1) and the
PAPTES (x=1, after TFE) were applied to the composites preparation.
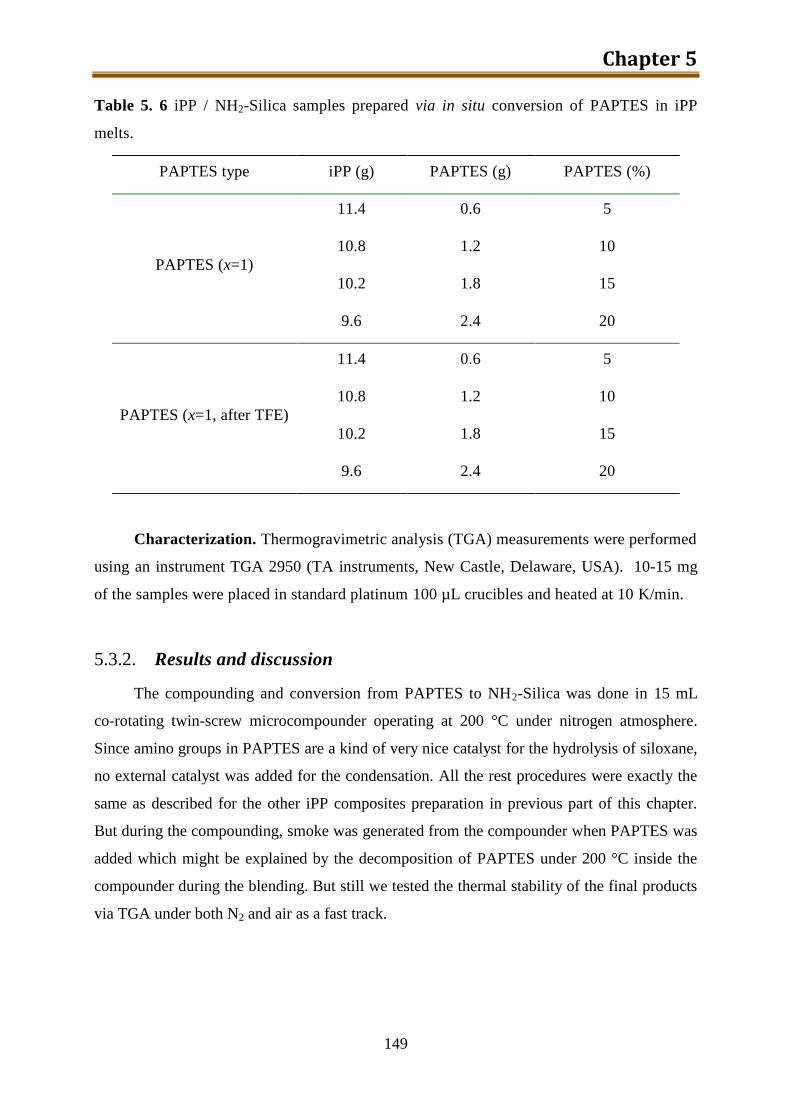
Chapter 5
149
Table 5. 6 iPP / NH2-Silica samples prepared via in situ conversion of PAPTES in iPP
melts.
PAPTES type iPP (g) PAPTES (g) PAPTES (%)
PAPTES (x=1)
11.4 0.6 5
10.8 1.2 10
10.2 1.8 15
9.6 2.4 20
PAPTES (x=1, after TFE)
11.4 0.6 5
10.8 1.2 10
10.2 1.8 15
9.6 2.4 20
Characterization. Thermogravimetric analysis (TGA) measurements were performed
using an instrument TGA 2950 (TA instruments, New Castle, Delaware, USA). 10-15 mg
of the samples were placed in standard platinum 100 µL crucibles and heated at 10 K/min.
5.3.2. Results and discussion
The compounding and conversion from PAPTES to NH2-Silica was done in 15 mL
co-rotating twin-screw microcompounder operating at 200 °C under nitrogen atmosphere.
Since amino groups in PAPTES are a kind of very nice catalyst for the hydrolysis of siloxane,
no external catalyst was added for the condensation. All the rest procedures were exactly the
same as described for the other iPP composites preparation in previous part of this chapter.
But during the compounding, smoke was generated from the compounder when PAPTES was
added which might be explained by the decomposition of PAPTES under 200 °C inside the
compounder during the blending. But still we tested the thermal stability of the final products
via TGA under both N2 and air as a fast track.
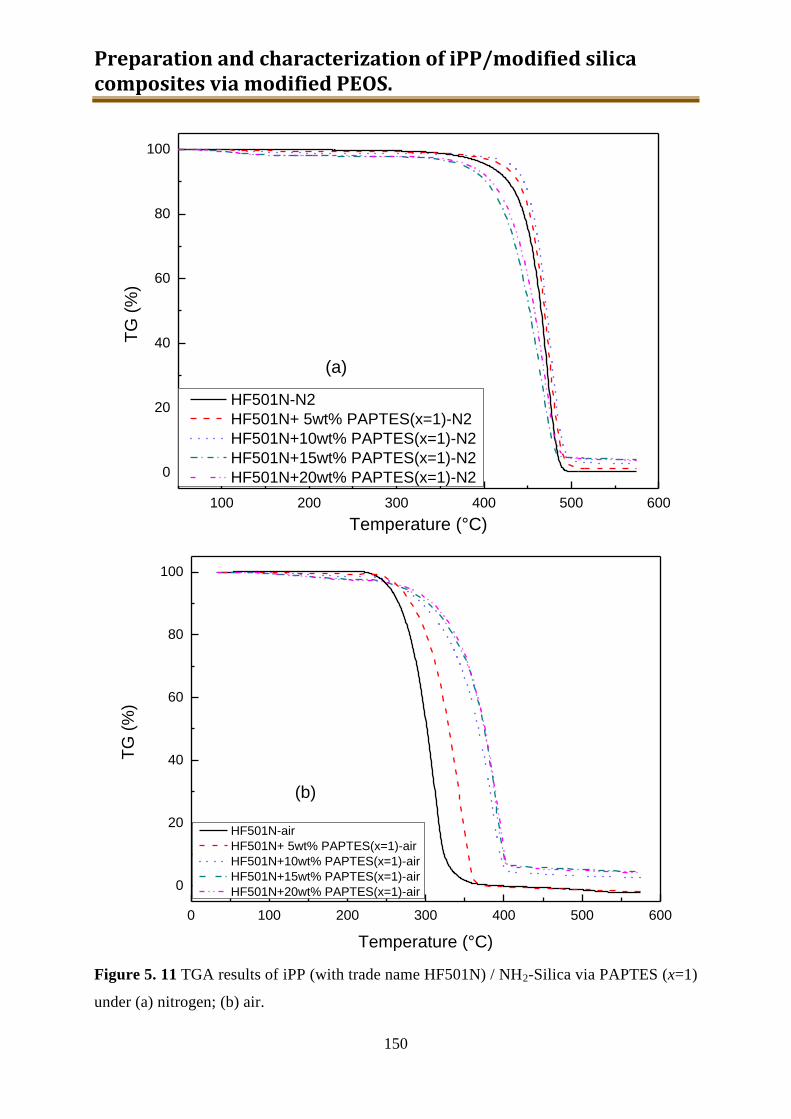
Preparation and characterization of iPP/modified silica composites via modified PEOS.
150
100 200 300 400 500 600
0
20
40
60
80
100
TG
(%
)
Temperature (°C)
HF501N-N2
HF501N+ 5wt% PAPTES(x=1)-N2
HF501N+10wt% PAPTES(x=1)-N2
HF501N+15wt% PAPTES(x=1)-N2
HF501N+20wt% PAPTES(x=1)-N2
(a)
0 100 200 300 400 500 600
0
20
40
60
80
100
TG
(%
)
Temperature (°C)
HF501N-air
HF501N+ 5wt% PAPTES(x=1)-air
HF501N+10wt% PAPTES(x=1)-air
HF501N+15wt% PAPTES(x=1)-air
HF501N+20wt% PAPTES(x=1)-air
(b)
Figure 5. 11 TGA results of iPP (with trade name HF501N) / NH2-Silica via PAPTES (x=1)
under (a) nitrogen; (b) air.
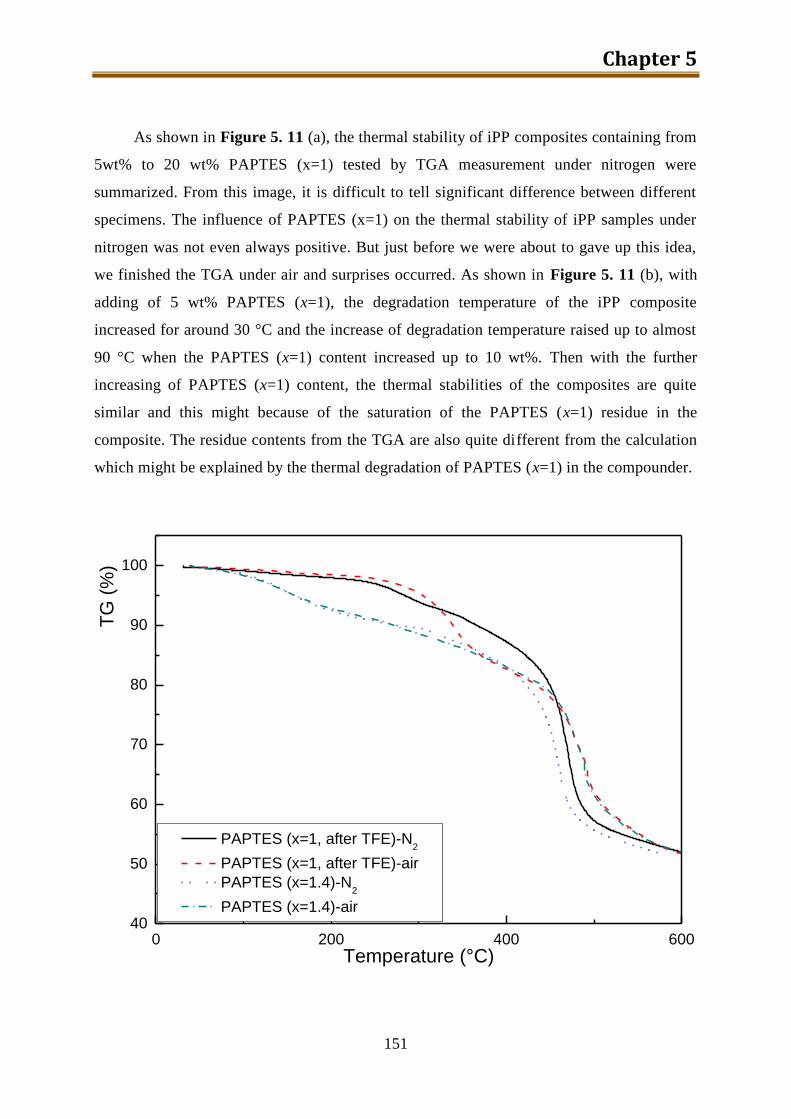
Chapter 5
151
As shown in Figure 5. 11 (a), the thermal stability of iPP composites containing from
5wt% to 20 wt% PAPTES (x=1) tested by TGA measurement under nitrogen were
summarized. From this image, it is difficult to tell significant difference between different
specimens. The influence of PAPTES (x=1) on the thermal stability of iPP samples under
nitrogen was not even always positive. But just before we were about to gave up this idea,
we finished the TGA under air and surprises occurred. As shown in Figure 5. 11 (b), with
adding of 5 wt% PAPTES (x=1), the degradation temperature of the iPP composite
increased for around 30 °C and the increase of degradation temperature raised up to almost
90 °C when the PAPTES (x=1) content increased up to 10 wt%. Then with the further
increasing of PAPTES (x=1) content, the thermal stabilities of the composites are quite
similar and this might because of the saturation of the PAPTES (x=1) residue in the
composite. The residue contents from the TGA are also quite different from the calculation
which might be explained by the thermal degradation of PAPTES (x=1) in the compounder.
0 200 400 60040
50
60
70
80
90
100
PAPTES (x=1, after TFE)-N2
PAPTES (x=1, after TFE)-air
PAPTES (x=1.4)-N2
PAPTES (x=1.4)-air
TG
(%
)
Temperature (°C)
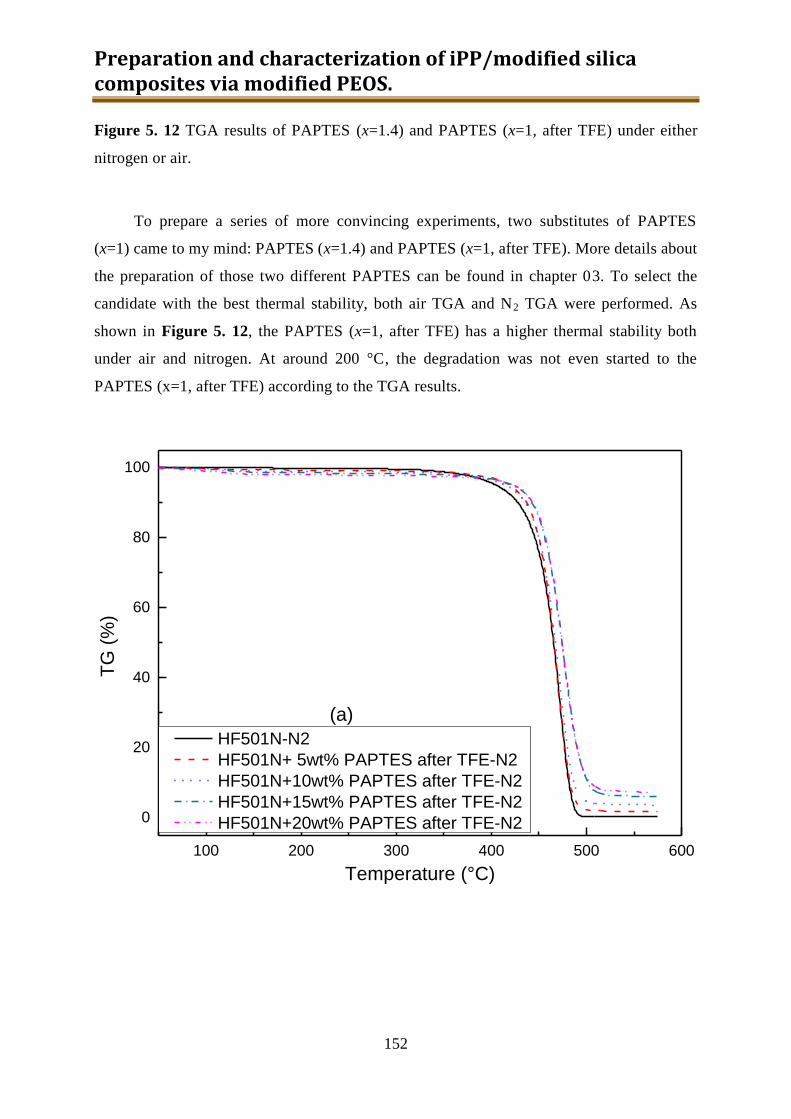
Preparation and characterization of iPP/modified silica composites via modified PEOS.
152
Figure 5. 12 TGA results of PAPTES (x=1.4) and PAPTES (x=1, after TFE) under either
nitrogen or air.
To prepare a series of more convincing experiments, two substitutes of PAPTES
(x=1) came to my mind: PAPTES (x=1.4) and PAPTES (x=1, after TFE). More details about
the preparation of those two different PAPTES can be found in chapter 03. To select the
candidate with the best thermal stability, both air TGA and N2 TGA were performed. As
shown in Figure 5. 12, the PAPTES (x=1, after TFE) has a higher thermal stability both
under air and nitrogen. At around 200 °C, the degradation was not even started to the
PAPTES (x=1, after TFE) according to the TGA results.
100 200 300 400 500 600
0
20
40
60
80
100
TG
(%
)
Temperature (°C)
HF501N-N2
HF501N+ 5wt% PAPTES after TFE-N2
HF501N+10wt% PAPTES after TFE-N2
HF501N+15wt% PAPTES after TFE-N2
HF501N+20wt% PAPTES after TFE-N2
(a)
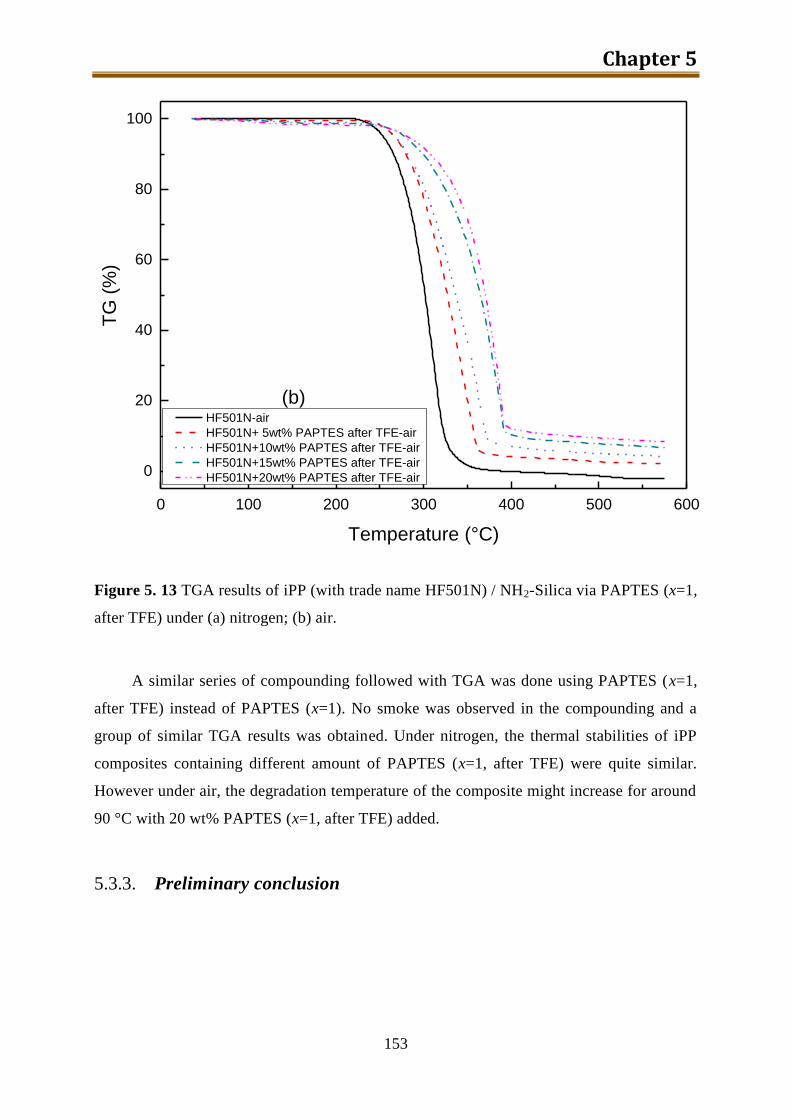
Chapter 5
153
0 100 200 300 400 500 600
0
20
40
60
80
100T
G (
%)
Temperature (°C)
HF501N-air
HF501N+ 5wt% PAPTES after TFE-air
HF501N+10wt% PAPTES after TFE-air
HF501N+15wt% PAPTES after TFE-air
HF501N+20wt% PAPTES after TFE-air
(b)
Figure 5. 13 TGA results of iPP (with trade name HF501N) / NH2-Silica via PAPTES (x=1,
after TFE) under (a) nitrogen; (b) air.
A similar series of compounding followed with TGA was done using PAPTES (x=1,
after TFE) instead of PAPTES (x=1). No smoke was observed in the compounding and a
group of similar TGA results was obtained. Under nitrogen, the thermal stabilities of iPP
composites containing different amount of PAPTES (x=1, after TFE) were quite similar.
However under air, the degradation temperature of the composite might increase for around
90 °C with 20 wt% PAPTES (x=1, after TFE) added.
5.3.3. Preliminary conclusion

Preparation and characterization of iPP/modified silica composites via modified PEOS.
154
In this part, a series of iPP composites containing amino groups modified silica
particles were prepared. With the modification of amino groups, the thermal stability of the
composite under air was improved significantly. The further application of PAPTES in the
flame-retardance improvement of polyolefin will be continued in the future.
5.4. Conclusion
In this chapter, three various PEOS modifications were applied to the iPP matrix and
three different series of iPP / modified silica composites with different PEOS contents were
prepared.
iPP / iBSilica composites was used to minimize the resulting particle size within the iPP
composites. Obviously it was not a successful trial since we could not avoid the formation of
silica particle in micrometer scale. But alkyl group modification was proved to be applicable
in increasing the compatibility between PEOS and iPP matrix.
n-Octyl modified PEOS (OPEOS) were used instead of iso-butyl modified PEOS to
prepare iPP / silica nano composites. Shown in Table 5. 2, the solubility of OPEOS in molten
iPP increased with the increase of octyl content. However, since the OPEOS content in all the
samples are higher than the individual solubility, most of the silica particles were converted
from the dispersed-in OPEOS in the iPP matrix. Proved by the TEM / FESEM results, the
compatibility between PEOS and molten iPP matrix was significantly improved with the
modification of n-octyl groups on PEOS. Benefited from the better compatibility, the
resulting composites have a much better transparency.
Amino groups modified PEOS was the last PEOS we selected in the application in iPP
composites. As we expected, the amino groups brought significant positive effect to the
thermal stability of the iPP composites under air.
References:
Chapter 5
155
[1]. Liu, T., Synthesis of Ultrasmall Hydrophobic SiO2-Nanoparticles, in ITMC. 2007,
RWTH: Aachen.
[2]. Li, J.X., Ness, J.N., and Cheung, W.L., Journal of Applied Polymer Science,
1996. 59(11): p. 1733-1740.
[3]. Morino, S., et al., The journal of physical chemistry, 1995. 99(25): p. 10280.
[4]. Morino, S. and Horie, K., ACS Symposium Series, 1997. 672: p. 260.
[5]. Demir, M.M., et al., Macromolecules, 2007. 40(4): p. 1089-1100.
[6]. Dou, Q., et al., Journal of Sol-Gel Science and Technology, 2008. 48(1-2): p. 51-
60.
[7]. Qian, J.S., He, P.S., and Nie, K.M., Journal of Applied Polymer Science, 2004.
91(2): p. 1013-1019.
[8]. Zhu, P.W. and Edward, G., Macromolecular Materials and Engineering, 2003.
288(4): p. 301-311.
[9]. Kimata, S., et al., Science, 2007. 316(5827): p. 1014-1017.
[10]. Hsiao, B.S., et al., Physical Review Letters, 2005. 94(11).

Preparation and characterization of iPP/modified silica composites via modified PEOS.
156
Chapter 6
157
6. The application of PEOS as an assistant
in the layer-exfoliation of layered
silicate in iPP matrix
As mentioned in the previous chapters, nanocomposites are a new class of
composites[1]
which are greatly attracting our interests all over the world. The conventional
fillers include talc, calcium carbonate, fibers, etc. The fillers also fall into three different
categories by the virtue of their primary particle dimensions[2]
: spherical particles, fibres
and layers. At least one dimension of the filled particles should be in the nanometer range.
So far, in my previous chapters, we only focused in the spherical silica particles generated
from PEOS or modified PEOS as a precursor.
Amongst all of the potential nano-fillers, those based on clay and layered silicates
have been quite widely investigated.[1, 3-7]
The original clay materials are easily available
and the chemical structure is very well studied for a long time.[8, 9]
The nanocomposites
exhibit markedly improved mechanical, thermal, optical and physical-chemical properties
when compared with the pure polymer or conventional (microscale) composites as firstly
demonstrated by Kojima and co-workers for nylon-clay nanocomposites.[10]
The
improvements include moduli, strength, heat-resistance, gas barrier and flammability. To
finalize as a kind of nano-scale filler, the dispersion of the nano-clay is the most important
topic in the application of layered silicate. On the other hand, a better dispersion will lead to
a better homogeneity of the polymer matrix.
In the literature, four major processes were reported considering preparing polymer-
layered silicate nanocomposites: exfoliation-adsorption,[11]
in situ intercalative
polymerization,[12-15]
melt intercalation[13]
and template synthesis.[16]
Exfoliation-adsorption: the layered silicate is exfoliated using a solvent in which the
polymer matrix is soluble too. Due to the weak forces that stack the layers together and the

The application of PEOS as an assistant in the layer-exfoliation of layered silicate in iPP matrix.
158
possibly ionic exchange, which may occur between the layers and solvent, they can be
easily dispersed in an adequate solvent. The polymer then adsorbs onto the delaminated
layers and sandwich polymer composites will be formed after the evaporation of solvent.
But, with this method, only quite limited solvents can be used to certain polymer and it is
for sure not easy to up-scale in the industry.
In situ intercalative polymerization: the layered silicate is swollen within the liquid
monomer and either the heat or the radiation from the polymerization occurs in between the
layers will exfoliate the sheets. In this method, the selection of a suitable initiator might be a
challenge since the layered silicate is good poison to the catalyst in many different
polymerizations.
Template synthesis: layered silicate could be formed in situ in an aqueous solution
containing the polymer and the silicate building blocks. This technique is very widely used
for the synthesis of double-layer hydroxide-based nanocomposites, however, it is far less
developed for layered silicate.
Melt intercalation: the layered silicate is mixed with the polymer matrix in the molten
state. If the layer surfaces are sufficiently compatible with the certain polymer, the polymer
can crawl into the interlayer space and form either an intercalated or exfoliated
nanocomposites. This technique is one of the most commonly used methods since no
solvent is required. But, it is always difficult to find out a suitable polymer~layered-silicate
couple.
iPP has been tested for the preparation of naocomposites.[17-19]
However, no direct
intercalation of iPP in simply unmodified layered silicates has been observed so far since
the iPP is too much apolar to correctly interact with the layers. Modification on iPP matrix,
layered silicate or both are required to finish the intercalation, e.g. Kato et al. described the
melt intercalation of iPP chains modified with either maleic anhydride or hydroxyl groups
in the octadecylammonium-exchanged montmorillonite.[20]
After the invention of PEOS, we realized that PEOS can also be applied in the
exfoliation of layered silicate. As shown in Figure 6. 1, the process can be described as a
mixture of exfoliation-adsorption and melt intercalation inside the compounder. As a
thermally stable liquid, PEOS can be added together with iPP matrix and layered silicate.
Then under the stirring, PEOS may intercalate into the layers and form a kind of liquid film
on the layer’s surface. Thereafter water vapor is introduced to convert PEOS to silica
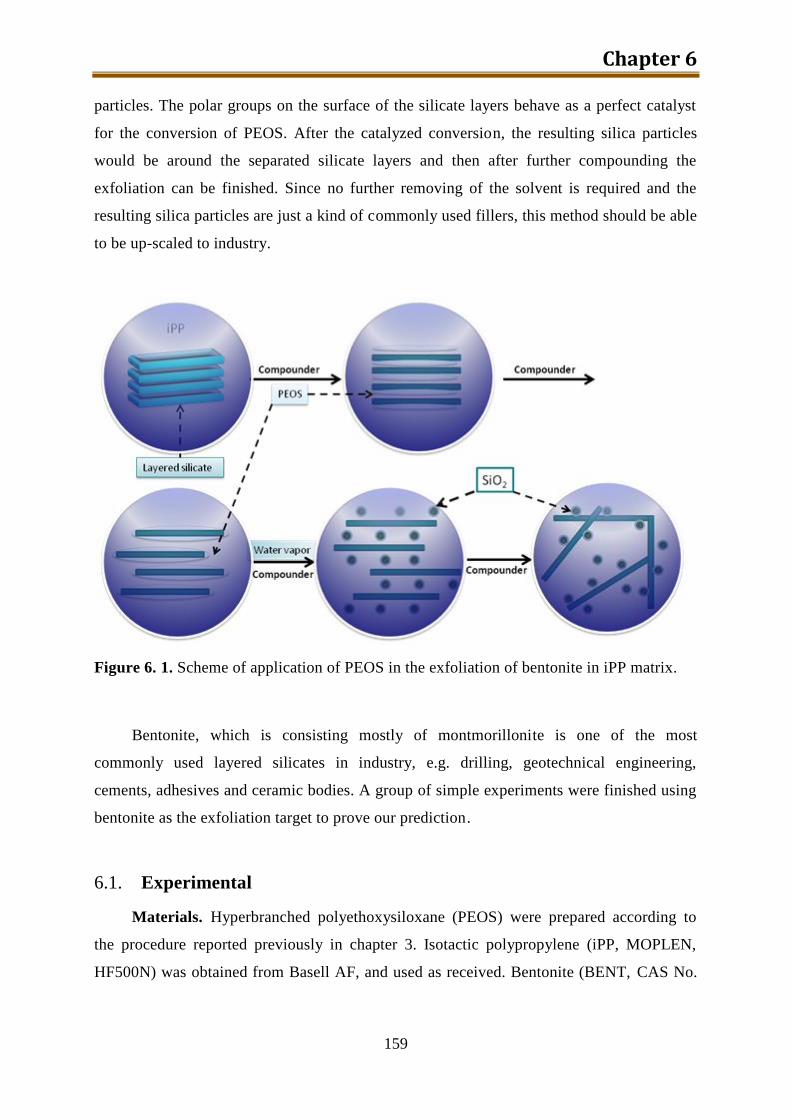
Chapter 6
159
particles. The polar groups on the surface of the silicate layers behave as a perfect catalyst
for the conversion of PEOS. After the catalyzed conversion, the resulting silica particles
would be around the separated silicate layers and then after further compounding the
exfoliation can be finished. Since no further removing of the solvent is required and the
resulting silica particles are just a kind of commonly used fillers, this method should be able
to be up-scaled to industry.
Figure 6. 1. Scheme of application of PEOS in the exfoliation of bentonite in iPP matrix.
Bentonite, which is consisting mostly of montmorillonite is one of the most
commonly used layered silicates in industry, e.g. drilling, geotechnical engineering,
cements, adhesives and ceramic bodies. A group of simple experiments were finished using
bentonite as the exfoliation target to prove our prediction.
6.1. Experimental
Materials. Hyperbranched polyethoxysiloxane (PEOS) were prepared according to
the procedure reported previously in chapter 3. Isotactic polypropylene (iPP, MOPLEN,
HF500N) was obtained from Basell AF, and used as received. Bentonite (BENT, CAS No.
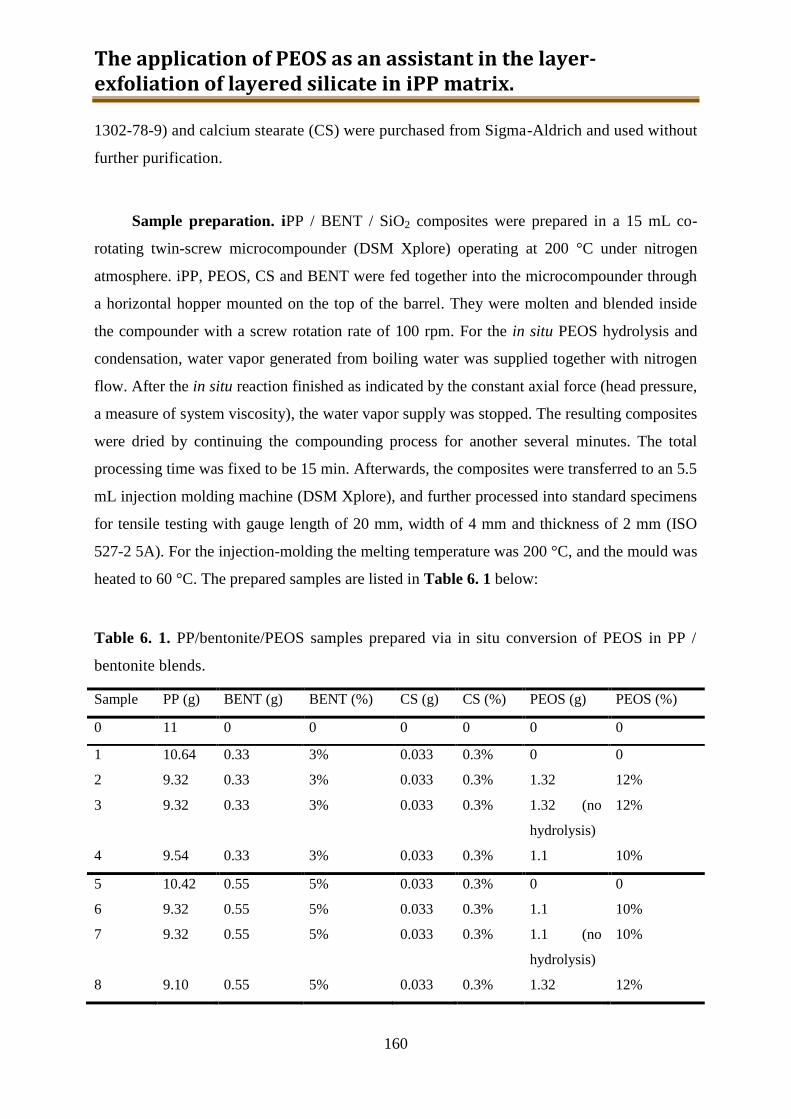
The application of PEOS as an assistant in the layer-exfoliation of layered silicate in iPP matrix.
160
1302-78-9) and calcium stearate (CS) were purchased from Sigma-Aldrich and used without
further purification.
Sample preparation. iPP / BENT / SiO2 composites were prepared in a 15 mL co-
rotating twin-screw microcompounder (DSM Xplore) operating at 200 °C under nitrogen
atmosphere. iPP, PEOS, CS and BENT were fed together into the microcompounder through
a horizontal hopper mounted on the top of the barrel. They were molten and blended inside
the compounder with a screw rotation rate of 100 rpm. For the in situ PEOS hydrolysis and
condensation, water vapor generated from boiling water was supplied together with nitrogen
flow. After the in situ reaction finished as indicated by the constant axial force (head pressure,
a measure of system viscosity), the water vapor supply was stopped. The resulting composites
were dried by continuing the compounding process for another several minutes. The total
processing time was fixed to be 15 min. Afterwards, the composites were transferred to an 5.5
mL injection molding machine (DSM Xplore), and further processed into standard specimens
for tensile testing with gauge length of 20 mm, width of 4 mm and thickness of 2 mm (ISO
527-2 5A). For the injection-molding the melting temperature was 200 °C, and the mould was
heated to 60 °C. The prepared samples are listed in Table 6. 1 below:
Table 6. 1. PP/bentonite/PEOS samples prepared via in situ conversion of PEOS in PP /
bentonite blends.
Sample PP (g) BENT (g) BENT (%) CS (g) CS (%) PEOS (g) PEOS (%)
0 11 0 0 0 0 0 0
1 10.64 0.33 3% 0.033 0.3% 0 0
2 9.32 0.33 3% 0.033 0.3% 1.32 12%
3 9.32 0.33 3% 0.033 0.3% 1.32 (no
hydrolysis)
12%
4 9.54 0.33 3% 0.033 0.3% 1.1 10%
5 10.42 0.55 5% 0.033 0.3% 0 0
6 9.32 0.55 5% 0.033 0.3% 1.1 10%
7 9.32 0.55 5% 0.033 0.3% 1.1 (no
hydrolysis)
10%
8 9.10 0.55 5% 0.033 0.3% 1.32 12%
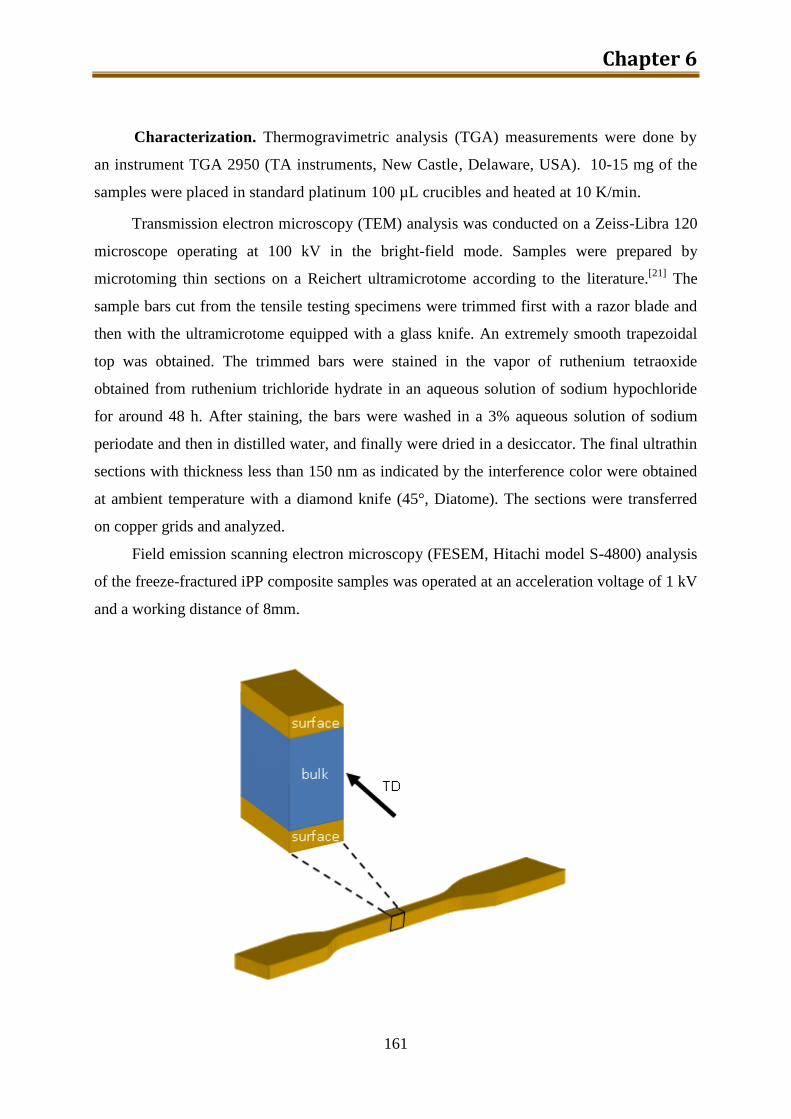
Chapter 6
161
Characterization. Thermogravimetric analysis (TGA) measurements were done by
an instrument TGA 2950 (TA instruments, New Castle, Delaware, USA). 10-15 mg of the
samples were placed in standard platinum 100 µL crucibles and heated at 10 K/min.
Transmission electron microscopy (TEM) analysis was conducted on a Zeiss-Libra 120
microscope operating at 100 kV in the bright-field mode. Samples were prepared by
microtoming thin sections on a Reichert ultramicrotome according to the literature.[21]
The
sample bars cut from the tensile testing specimens were trimmed first with a razor blade and
then with the ultramicrotome equipped with a glass knife. An extremely smooth trapezoidal
top was obtained. The trimmed bars were stained in the vapor of ruthenium tetraoxide
obtained from ruthenium trichloride hydrate in an aqueous solution of sodium hypochloride
for around 48 h. After staining, the bars were washed in a 3% aqueous solution of sodium
periodate and then in distilled water, and finally were dried in a desiccator. The final ultrathin
sections with thickness less than 150 nm as indicated by the interference color were obtained
at ambient temperature with a diamond knife (45°, Diatome). The sections were transferred
on copper grids and analyzed.
Field emission scanning electron microscopy (FESEM, Hitachi model S-4800) analysis
of the freeze-fractured iPP composite samples was operated at an acceleration voltage of 1 kV
and a working distance of 8mm.
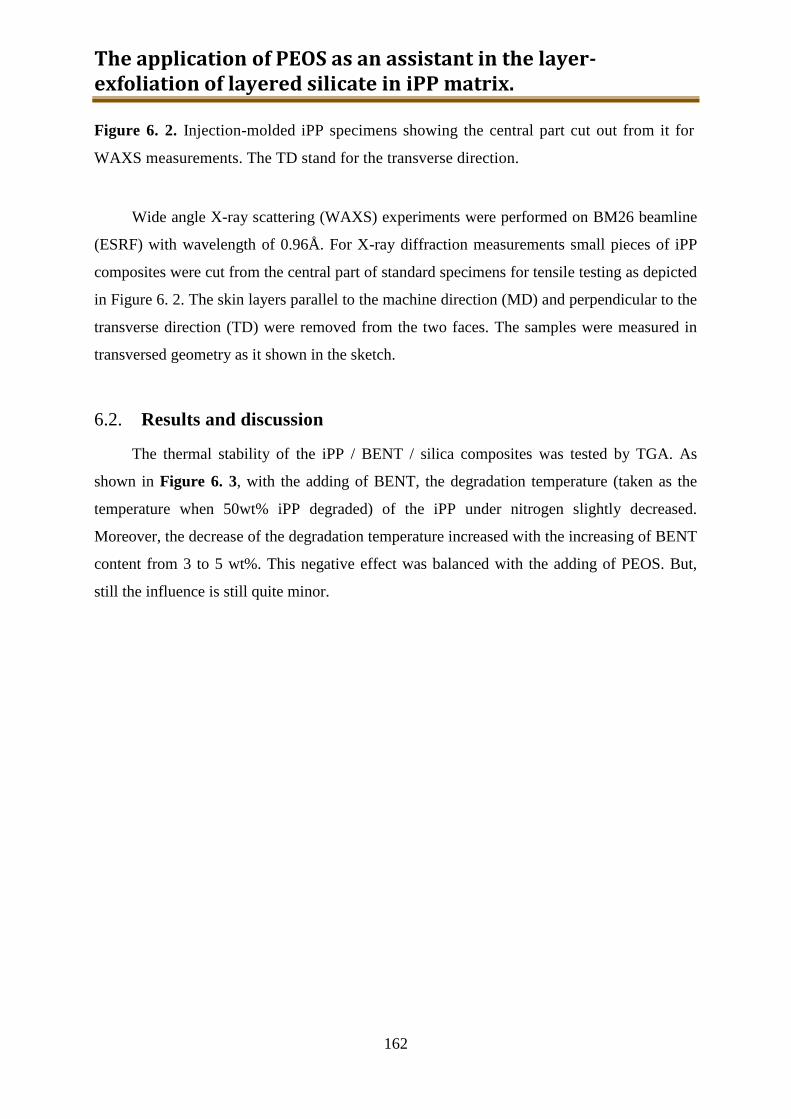
The application of PEOS as an assistant in the layer-exfoliation of layered silicate in iPP matrix.
162
Figure 6. 2. Injection-molded iPP specimens showing the central part cut out from it for
WAXS measurements. The TD stand for the transverse direction.
Wide angle X-ray scattering (WAXS) experiments were performed on BM26 beamline
(ESRF) with wavelength of 0.96Å. For X-ray diffraction measurements small pieces of iPP
composites were cut from the central part of standard specimens for tensile testing as depicted
in Figure 6. 2. The skin layers parallel to the machine direction (MD) and perpendicular to the
transverse direction (TD) were removed from the two faces. The samples were measured in
transversed geometry as it shown in the sketch.
6.2. Results and discussion
The thermal stability of the iPP / BENT / silica composites was tested by TGA. As
shown in Figure 6. 3, with the adding of BENT, the degradation temperature (taken as the
temperature when 50wt% iPP degraded) of the iPP under nitrogen slightly decreased.
Moreover, the decrease of the degradation temperature increased with the increasing of BENT
content from 3 to 5 wt%. This negative effect was balanced with the adding of PEOS. But,
still the influence is still quite minor.
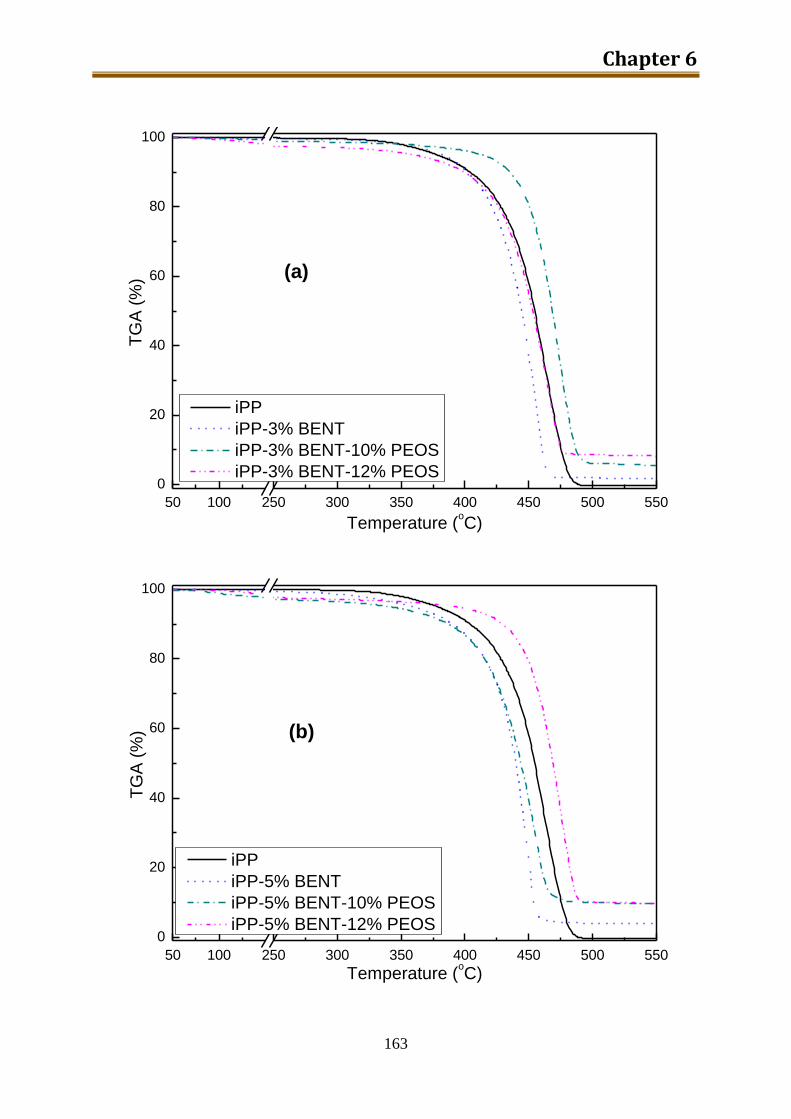
Chapter 6
163
50 100 250 300 350 400 450 500 550
0
20
40
60
80
100
TG
A (
%)
Temperature (oC)
iPP
iPP-3% BENT
iPP-3% BENT-10% PEOS
iPP-3% BENT-12% PEOS
(a)
50 100 250 300 350 400 450 500 550
0
20
40
60
80
100
iPP
iPP-5% BENT
iPP-5% BENT-10% PEOS
iPP-5% BENT-12% PEOS
TG
A (
%)
Temperature (oC)
(b)
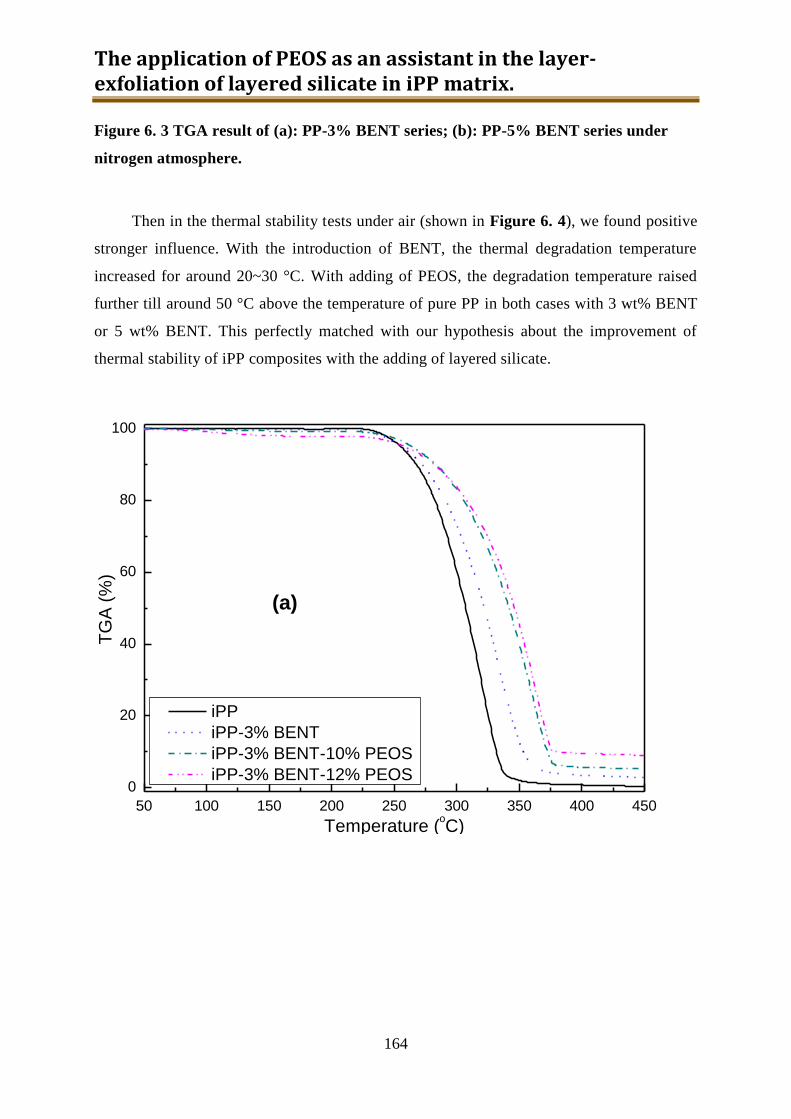
The application of PEOS as an assistant in the layer-exfoliation of layered silicate in iPP matrix.
164
Figure 6. 3 TGA result of (a): PP-3% BENT series; (b): PP-5% BENT series under
nitrogen atmosphere.
Then in the thermal stability tests under air (shown in Figure 6. 4), we found positive
stronger influence. With the introduction of BENT, the thermal degradation temperature
increased for around 20~30 °C. With adding of PEOS, the degradation temperature raised
further till around 50 °C above the temperature of pure PP in both cases with 3 wt% BENT
or 5 wt% BENT. This perfectly matched with our hypothesis about the improvement of
thermal stability of iPP composites with the adding of layered silicate.
50 100 150 200 250 300 350 400 450
0
20
40
60
80
100
TG
A (
%)
Temperature (oC)
iPP
iPP-3% BENT
iPP-3% BENT-10% PEOS
iPP-3% BENT-12% PEOS
(a)
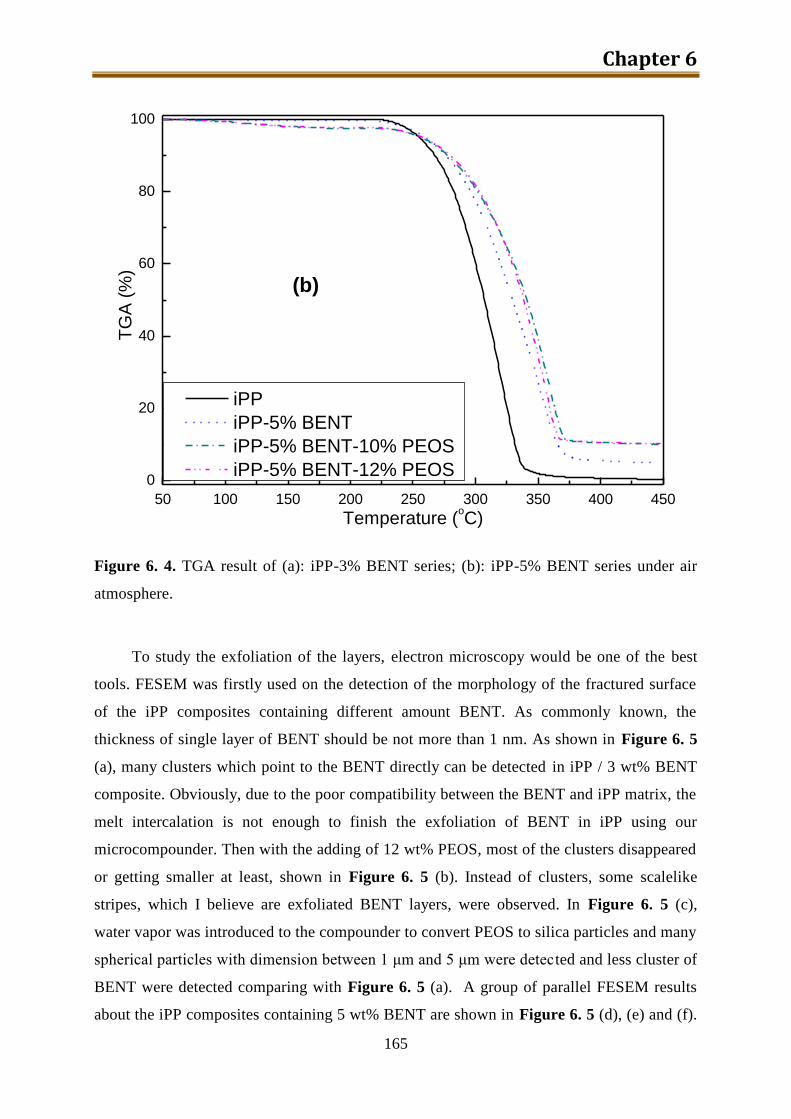
Chapter 6
165
50 100 150 200 250 300 350 400 450
0
20
40
60
80
100
iPP
iPP-5% BENT
iPP-5% BENT-10% PEOS
iPP-5% BENT-12% PEOS
TG
A (
%)
Temperature (oC)
(b)
Figure 6. 4. TGA result of (a): iPP-3% BENT series; (b): iPP-5% BENT series under air
atmosphere.
To study the exfoliation of the layers, electron microscopy would be one of the best
tools. FESEM was firstly used on the detection of the morphology of the fractured surface
of the iPP composites containing different amount BENT. As commonly known, the
thickness of single layer of BENT should be not more than 1 nm. As shown in Figure 6. 5
(a), many clusters which point to the BENT directly can be detected in iPP / 3 wt% BENT
composite. Obviously, due to the poor compatibility between the BENT and iPP matrix, the
melt intercalation is not enough to finish the exfoliation of BENT in iPP using our
microcompounder. Then with the adding of 12 wt% PEOS, most of the clusters disappeared
or getting smaller at least, shown in Figure 6. 5 (b). Instead of clusters, some scalelike
stripes, which I believe are exfoliated BENT layers, were observed. In Figure 6. 5 (c),
water vapor was introduced to the compounder to convert PEOS to silica particles and many
spherical particles with dimension between 1 μm and 5 μm were detected and less cluster of
BENT were detected comparing with Figure 6. 5 (a). A group of parallel FESEM results
about the iPP composites containing 5 wt% BENT are shown in Figure 6. 5 (d), (e) and (f).
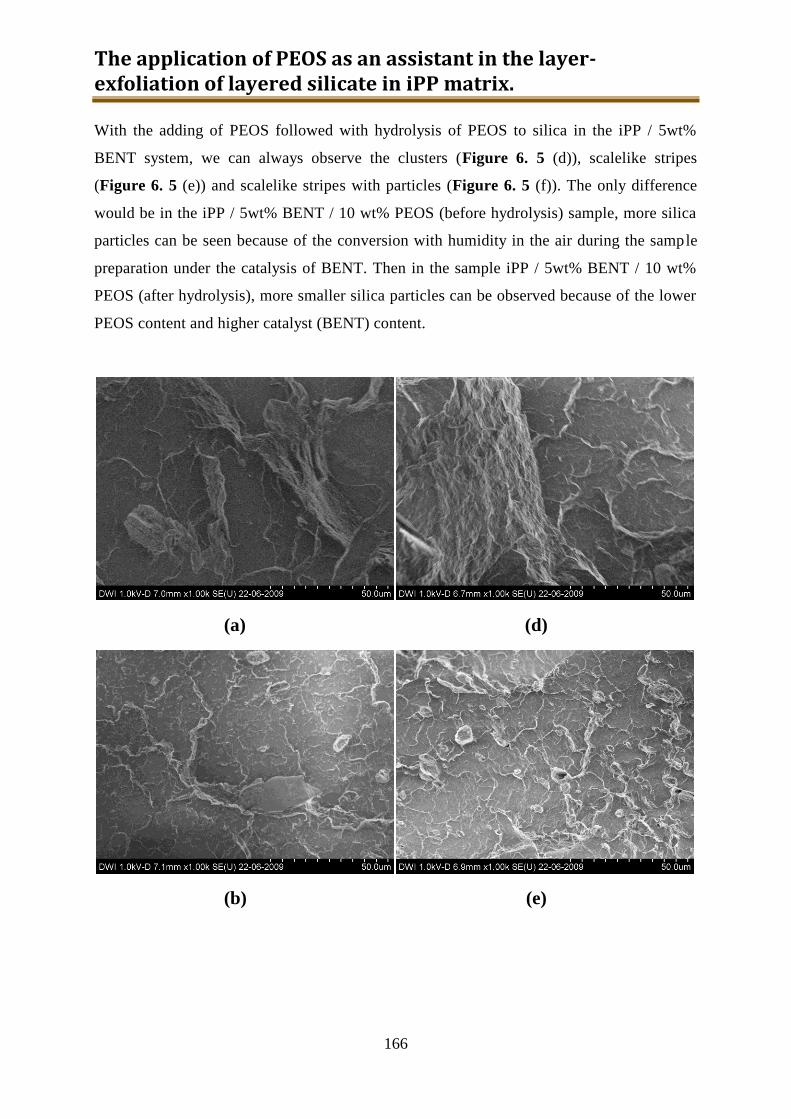
The application of PEOS as an assistant in the layer-exfoliation of layered silicate in iPP matrix.
166
With the adding of PEOS followed with hydrolysis of PEOS to silica in the iPP / 5wt%
BENT system, we can always observe the clusters (Figure 6. 5 (d)), scalelike stripes
(Figure 6. 5 (e)) and scalelike stripes with particles (Figure 6. 5 (f)). The only difference
would be in the iPP / 5wt% BENT / 10 wt% PEOS (before hydrolysis) sample, more silica
particles can be seen because of the conversion with humidity in the air during the sample
preparation under the catalysis of BENT. Then in the sample iPP / 5wt% BENT / 10 wt%
PEOS (after hydrolysis), more smaller silica particles can be observed because of the lower
PEOS content and higher catalyst (BENT) content.
(a) (d)
(b) (e)
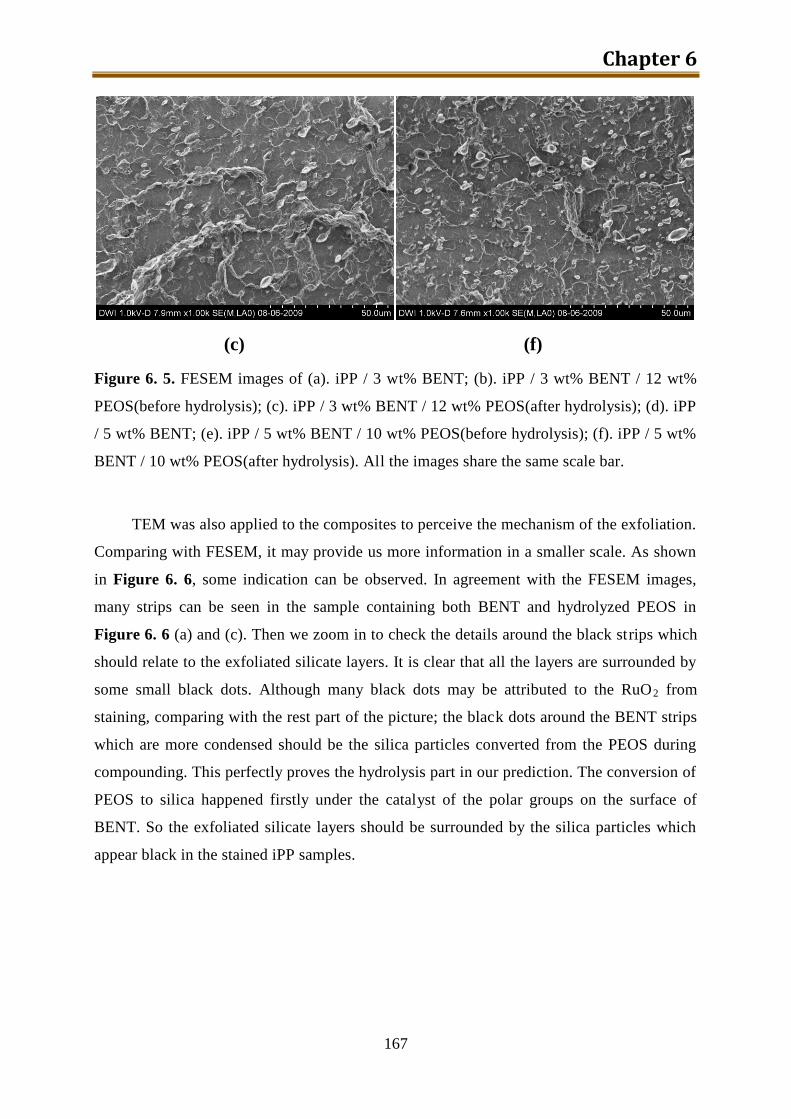
Chapter 6
167
(c) (f)
Figure 6. 5. FESEM images of (a). iPP / 3 wt% BENT; (b). iPP / 3 wt% BENT / 12 wt%
PEOS(before hydrolysis); (c). iPP / 3 wt% BENT / 12 wt% PEOS(after hydrolysis); (d). iPP
/ 5 wt% BENT; (e). iPP / 5 wt% BENT / 10 wt% PEOS(before hydrolysis); (f). iPP / 5 wt%
BENT / 10 wt% PEOS(after hydrolysis). All the images share the same scale bar.
TEM was also applied to the composites to perceive the mechanism of the exfoliation.
Comparing with FESEM, it may provide us more information in a smaller scale. As shown
in Figure 6. 6, some indication can be observed. In agreement with the FESEM images,
many strips can be seen in the sample containing both BENT and hydrolyzed PEOS in
Figure 6. 6 (a) and (c). Then we zoom in to check the details around the black strips which
should relate to the exfoliated silicate layers. It is clear that all the layers are surrounded by
some small black dots. Although many black dots may be attributed to the RuO2 from
staining, comparing with the rest part of the picture; the black dots around the BENT strips
which are more condensed should be the silica particles converted from the PEOS during
compounding. This perfectly proves the hydrolysis part in our prediction. The conversion of
PEOS to silica happened firstly under the catalyst of the polar groups on the surface of
BENT. So the exfoliated silicate layers should be surrounded by the silica particles which
appear black in the stained iPP samples.

The application of PEOS as an assistant in the layer-exfoliation of layered silicate in iPP matrix.
168
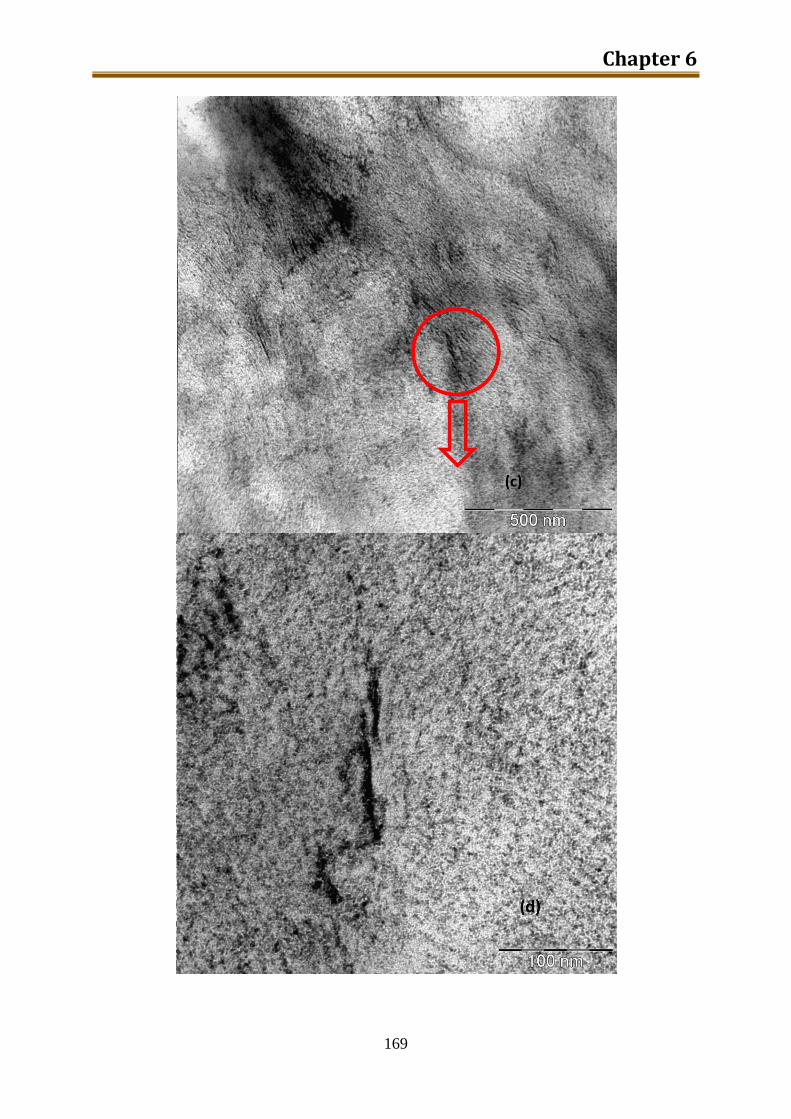
Chapter 6
169
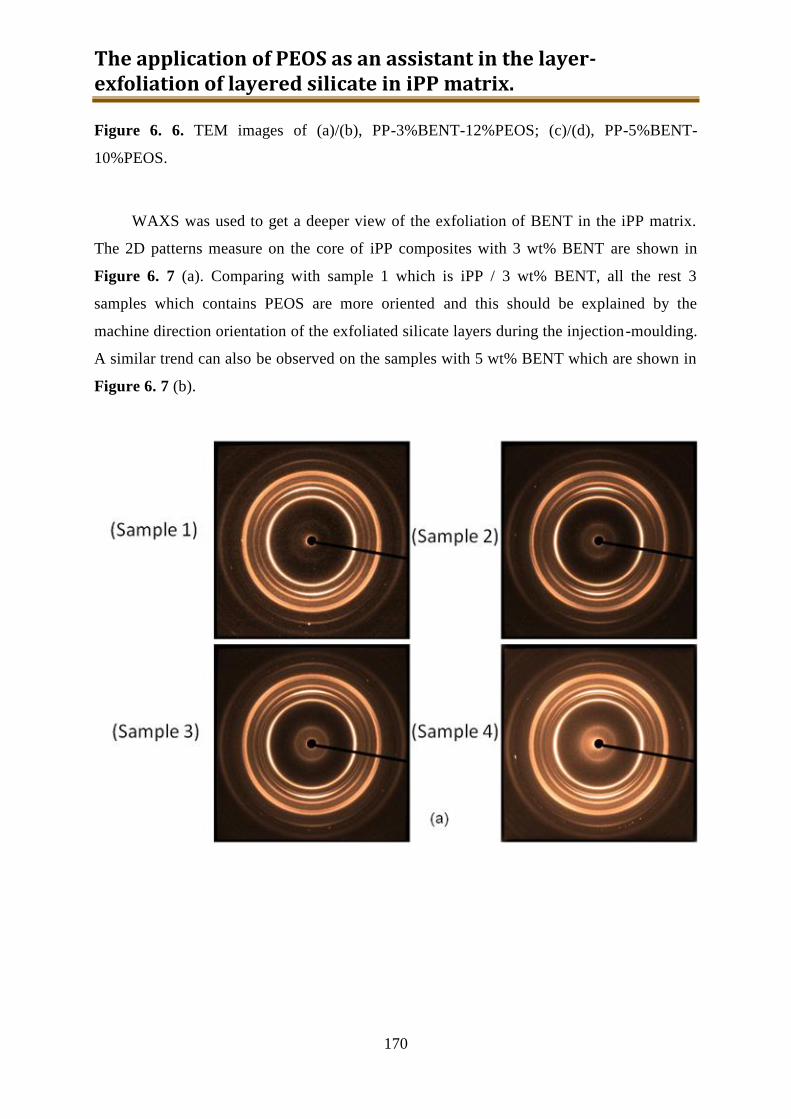
The application of PEOS as an assistant in the layer-exfoliation of layered silicate in iPP matrix.
170
Figure 6. 6. TEM images of (a)/(b), PP-3%BENT-12%PEOS; (c)/(d), PP-5%BENT-
10%PEOS.
WAXS was used to get a deeper view of the exfoliation of BENT in the iPP matrix.
The 2D patterns measure on the core of iPP composites with 3 wt% BENT are shown in
Figure 6. 7 (a). Comparing with sample 1 which is iPP / 3 wt% BENT, all the rest 3
samples which contains PEOS are more oriented and this should be explained by the
machine direction orientation of the exfoliated silicate layers during the injection-moulding.
A similar trend can also be observed on the samples with 5 wt% BENT which are shown in
Figure 6. 7 (b).
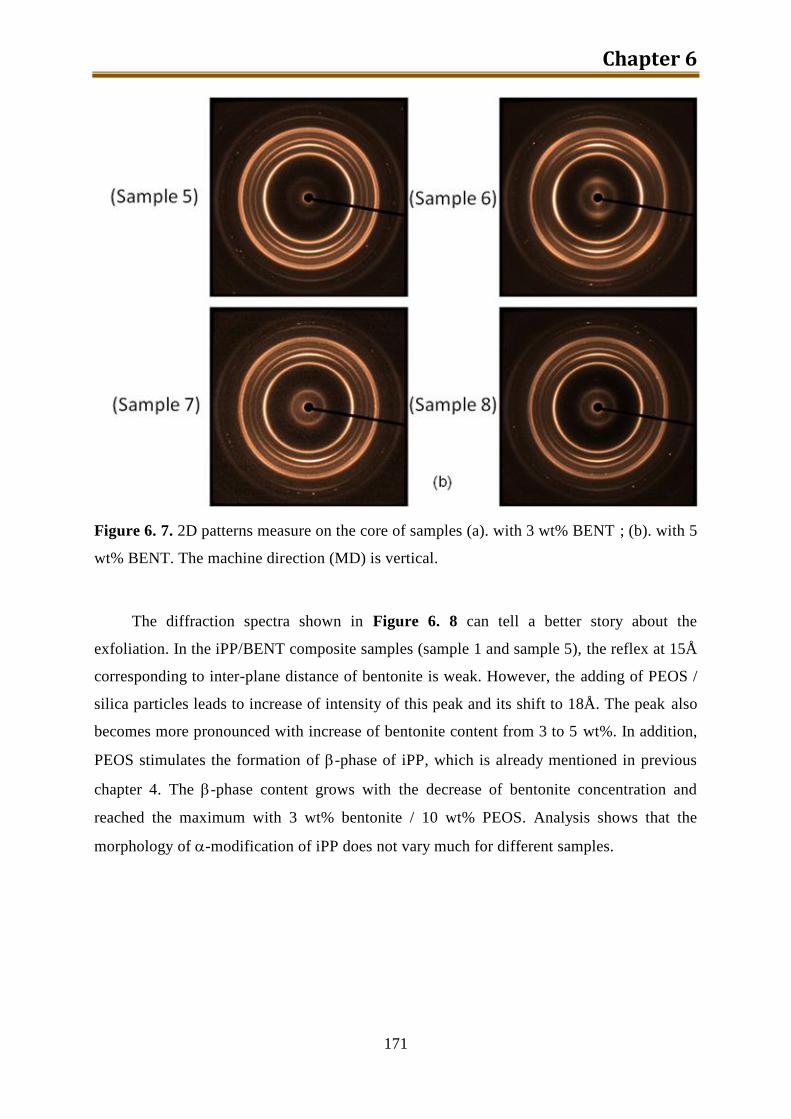
Chapter 6
171
Figure 6. 7. 2D patterns measure on the core of samples (a). with 3 wt% BENT ; (b). with 5
wt% BENT. The machine direction (MD) is vertical.
The diffraction spectra shown in Figure 6. 8 can tell a better story about the
exfoliation. In the iPP/BENT composite samples (sample 1 and sample 5), the reflex at 15Å
corresponding to inter-plane distance of bentonite is weak. However, the adding of PEOS /
silica particles leads to increase of intensity of this peak and its shift to 18Å. The peak also
becomes more pronounced with increase of bentonite content from 3 to 5 wt%. In addition,
PEOS stimulates the formation of -phase of iPP, which is already mentioned in previous
chapter 4. The -phase content grows with the decrease of bentonite concentration and
reached the maximum with 3 wt% bentonite / 10 wt% PEOS. Analysis shows that the
morphology of -modification of iPP does not vary much for different samples.
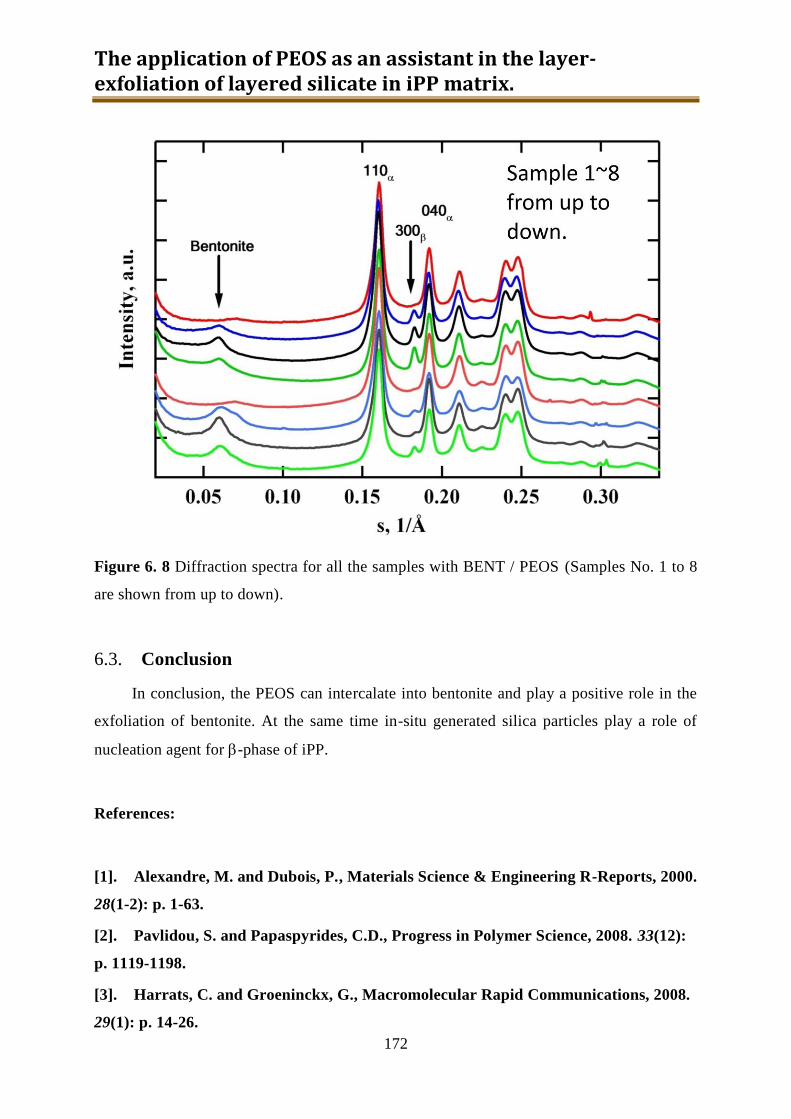
The application of PEOS as an assistant in the layer-exfoliation of layered silicate in iPP matrix.
172
Figure 6. 8 Diffraction spectra for all the samples with BENT / PEOS (Samples No. 1 to 8
are shown from up to down).
6.3. Conclusion
In conclusion, the PEOS can intercalate into bentonite and play a positive role in the
exfoliation of bentonite. At the same time in-situ generated silica particles play a role of
nucleation agent for -phase of iPP.
References:
[1]. Alexandre, M. and Dubois, P., Materials Science & Engineering R-Reports, 2000.
28(1-2): p. 1-63.
[2]. Pavlidou, S. and Papaspyrides, C.D., Progress in Polymer Science, 2008. 33(12):
p. 1119-1198.
[3]. Harrats, C. and Groeninckx, G., Macromolecular Rapid Communications, 2008.
29(1): p. 14-26.
Chapter 6
173
[4]. Takahashi, N. and Kuroda, K., Journal of Materials Chemistry, 2011. 21(38): p.
14336-14353.
[5]. Ray, S.S. and Okamoto, M., Progress in Polymer Science, 2003. 28(11): p. 1539-
1641.
[6]. Giannelis, E.P., Advanced Materials, 1996. 8(1): p. 29-35.
[7]. Giannelis, E.P., Applied Organometallic Chemistry, 1998. 12(10-11): p. 675-680.
[8]. Ogawa, M. and Kuroda, K., Bulletin of the Chemical Society of Japan, 1997.
70(11): p. 2593-2618.
[9]. Theng, B.K.G., The Chemistry of Clay-Organic Reactions. 1974, Wiley: New
York.
[10]. Usuki, A., et al., Journal of Applied Polymer Science, 1995. 55(1): p. 119-123.
[11]. Krikorian, V. and Pochan, D.J., Chemistry of Materials, 2003. 15(22): p. 4317-
4324.
[12]. Alexandre, M., et al., Polymer, 2002. 43(8): p. 2123-2132.
[13]. Lepoittevin, B., et al., Polymer, 2003. 44(7): p. 2033-2040.
[14]. Jeong, H.M., Choi, M.Y., and Ahn, Y.T., Macromolecular Research, 2006.
14(3): p. 312-317.
[15]. Namazi, H., Mosadegh, M., and Dadkhah, A., Carbohydrate Polymers, 2009.
75(4): p. 665-669.
[16]. Vartuli, J.C., et al., Chemistry of Materials, 1994. 6(11): p. 2070-2077.
[17]. Assouline, E., et al., Journal of Polymer Science Part B-Polymer Physics, 2003.
41(5): p. 520-527.
[18]. Zanetti, M., et al., Macromolecular Rapid Communications, 2001. 22(3): p. 176-
180.
[19]. Rong, M.Z., et al., Polymer, 2001. 42(1): p. 167-183.
[20]. Kato, M., Usuki, A., and Okada, A., Journal of Applied Polymer Science, 1997.
66(9): p. 1781-1785.
[21]. Li, J.X., Ness, J.N., and Cheung, W.L., Journal of Applied Polymer Science,
1996. 59(11): p. 1733-1740.

The application of PEOS as an assistant in the layer-exfoliation of layered silicate in iPP matrix.
174
Chapter 7
175
7. Application of PEOS in the flexible
polyurethane foams
Polyurethane foam (PU foam) is the most widely used foam plastic and has a
significantly positive impact on our daily lives. Depending on the formulation and the
process, the final polyurethane foams can be separated to rigid PU foam and flexible PU
foam.
The rigid PU foam industry can be characterised in several, equally valid, ways.
However, for the sake of this treatment, it is probably simplest to divide by application and
subsequently by product/process: appliance foams, construction foams, and transportation
foams. As appliance foams, rigid PU foams are mainly used in the refrigerators, air-
conditioners and water heaters because of its excellent insulation. Besides providing highly
efficient thermal insulation, they can also contribute substantially to the structural integrity
of the unit. The strong adhesive characteristics of PU systems coupled with the added value
of a composite sandwich structure allows the use of very thin metal and/or plastic skins in
the construction of cabinets. Although energy efficiency standards and other requirements
vary from market to market, it has been found that rigid PU foams can meet most, if not all,
of these when appropriately formulated using a choice of the technical options. Another
application area, as construction foams, is characterised by their requirement for high
thermal efficiency, structural integrity and light weight. In this area, rigid PU foams are
always used as lining boards, roof boards, pipe section, cold store panels, food processing
enclosures and even doors. As transportation foams, rigid PU foams are always used in the
sandwich panels for trucks, reefer boxes and flotation.
The use of flexible PU foams has developed in the past 50 years on the basis of their
ability to meet the requirements of the cushioning, packaging and safety products market. It
has been achieved through three predominant product types: slabstock foam, moulded foam
and integral skin materials. Slabstock foams have tended to be lower density products and
have found their main uses in cushioning and packaging applications. This type of foams
Application of PEOS in the flexible polyurethane foams.
176
mainly includes bedding, furniture cushioning, and seats in public transport, sportswear and
packaging. Moulded foams tend to have the interim range of densities for applications
where some load-bearing requirement exists. Furniture seating, seats in cars, sound barriers
and flotation can be guided in this type. Integral skin foams are also moulded foams, and
they are manufactured either by injection into closed, vented moulds or into open moulds.
Those foams are characterised by a high density outer skin and a low density, softer core.
This type of foams is mainly used in the steering wheels, automobile bumpers, shoe soles
and flotation.
Fire performance of foams has been a growing issue over the last 10-20 years. The
recent increase in published patents and papers on flame retardant properties (FR)[1-7]
at
least partially reflects a growing need for "pristine" FR technology which is most likely
inspired by the expectation that halogen and maybe even phosphorous containing
"traditional" FR agents will experience increased scrutiny by regulatory bodies, both in the
EU and elsewhere. Also, the rising interest in "true" organic-inorganic hybrids[8-12]
can be
viewed as a signal that new, improved, intrinsic flame retardant materials for e.g.
polyurethane (PU) applications are on the horizon right now. Recognizing this and many
other opportunities for hybrid materials, hyper branched Polyethoxysiloxane (PEOS) has
been investigated for their ability to enhance flame-retardancy of polyurethane foams in the
context of a 3-year PhD program sponsored by and in cooperation with Dow PU R&D in
Europe. This project delivered a fully Dow-owned patent disclosure.[13]
Based on the learning from previous internal work from Sylwia in DWI, several stages
have been changed slightly in order to emphasize the incorporation of functionalized PEOS
via covalent linkages in isocyanates and polyols. The ultimate goal of the research remains
unchanged namely to explore, if, and to what ex-tend co-continuous hybrid PU-Si
morphologies can be constructed from PEOS, water glass and amphiphilic polyols by
exploiting the propensity of the latter to form a kind of co-continuous structure, particularly
in aqueous environments. Depending on the type of mesostructure formed and the presence
or absence of phase connectivity, a wide range of PU-Si based products with enhanced FR
properties can be envisioned (as shown in Figure 7. 1). The listing includes counterparts for
current rigid, flexible and CPP foams, as well as low-cost PU-Si alternatives for mineral
wool which has so far been untouchable by PU foams, solely due to their flammability
performance.
Chapter 7
177
Shown in the previous work at DWI by Sylwia, foam formation has been studied mostly
in rigid PU and polyisocyanurate (PIR) and occasionally in slabstock formulations using
different functional or surface active PEOS types: unmodified hydrophobic PEOS, reactive,
hydrophilic PEOS-NH2 and PEOS-OH, with reactant TEOS and TEOS-NH2, and with
ethylsilicate TES 40 (synthesized by partially condensation with water, commercial available
from Wacker) and TEOS-NH2. It was found that both -NH2 and -OH functionalized PEOS are
capable of replacing Trichloropropylphosphonate (TCPP) in rigid PU, PIR and flexible foam
FR testing using, respectively, DIN 4102 B2 and CAL 117-A1 "Vertical Burning" tests.
Active levels of both compounds were ~ 1/10 of current TCPP usage. Preliminary
experiments using PMDI prepolymers in rigid PU also showed PEOS incorporated in
isocyanate to be FR active at the same level. However, the biggest disadvantage of such
systems is the low hydrolytically stability of the Amino-PEOS modified by reaction of PEOS
with amino alcohols.
In consideration the thermal degradation profiles of PEOS derivatives in conjunction
with those of current FR agents, it is hypothesized that the observed FR activity hinges on
inherent thermal instabilities such as that PEOS derivatives degrade in roughly the same
temperature regime as TCPP by splitting off EtOH, MEA and, at higher temperatures, H2O
and NH3. During this process, a polysilicate coating is forming and act as a fire-retardant
intumescing layer. This FR mechanism explains why only TCPP can be replaced whilst
neither low boiling FR agents (i.e. Triethyl phospate, TEP and Diethyl-ethylphosphonate,
DEEP) nor high-T char formers (i.e stable organo-silicates and brominated polyols) cannot
yet be replaced. The manifestation of significant FR performance at levels ~ 1/10 of normal
TCPP usage is attributed to a spatial distribution of PEOS-NH2 and PEOS-OH on the
molecular level. This hypothesis is supported by both their impact on foam compressive
strength and on the absence in SEM/EDX of any Si-containing particulate material at or just
below burned surfaces after flame testing.
To confirm the mechanism of the FR performance of PEOS-NH2 in PU foams, as well
as to improve the stability of PEOS-NH2, this project was extended. Instead of amino-
alcohol, APTES was introduced into the PEOS molecule to form a hydrolytically stable
amino modified PEOS. Since the previous work mostly focused on the rigid PU foams, we
will switch to flexible PU foams. The preparations of NH2-PEOS with different amino
contents are described in chapter3.
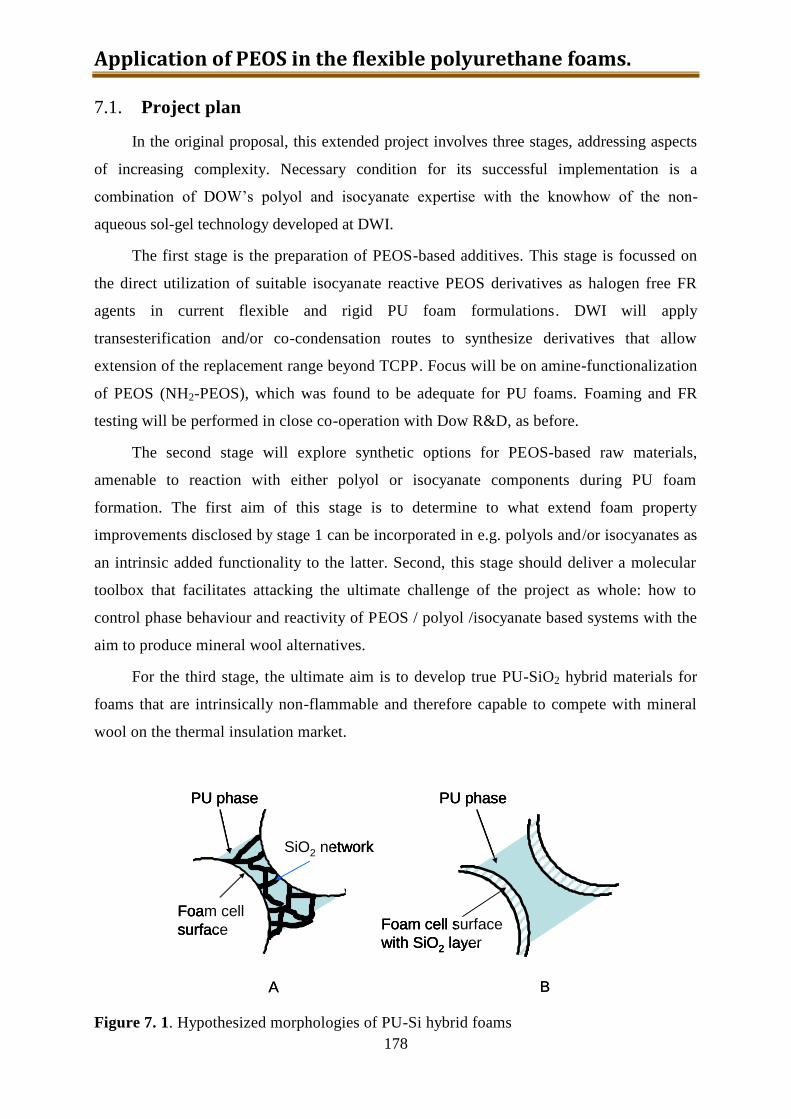
Application of PEOS in the flexible polyurethane foams.
178
7.1. Project plan
In the original proposal, this extended project involves three stages, addressing aspects
of increasing complexity. Necessary condition for its successful implementation is a
combination of DOW’s polyol and isocyanate expertise with the knowhow of the non-
aqueous sol-gel technology developed at DWI.
The first stage is the preparation of PEOS-based additives. This stage is focussed on
the direct utilization of suitable isocyanate reactive PEOS derivatives as halogen free FR
agents in current flexible and rigid PU foam formulations. DWI will apply
transesterification and/or co-condensation routes to synthesize derivatives that allow
extension of the replacement range beyond TCPP. Focus will be on amine-functionalization
of PEOS (NH2-PEOS), which was found to be adequate for PU foams. Foaming and FR
testing will be performed in close co-operation with Dow R&D, as before.
The second stage will explore synthetic options for PEOS-based raw materials,
amenable to reaction with either polyol or isocyanate components during PU foam
formation. The first aim of this stage is to determine to what extend foam property
improvements disclosed by stage 1 can be incorporated in e.g. polyols and/or isocyanates as
an intrinsic added functionality to the latter. Second, this stage should deliver a molecular
toolbox that facilitates attacking the ultimate challenge of the project as whole: how to
control phase behaviour and reactivity of PEOS / polyol /isocyanate based systems with the
aim to produce mineral wool alternatives.
For the third stage, the ultimate aim is to develop true PU-SiO2 hybrid materials for
foams that are intrinsically non-flammable and therefore capable to compete with mineral
wool on the thermal insulation market.
Figure 7. 1. Hypothesized morphologies of PU-Si hybrid foams
PU phase
SiO2 network
Foam cell surface
with SiO2 layer
PU phase
Foam cell
surface
A B
PU phase
SiO2 network
Foam cell surface
with SiO2 layer
PU phase
Foam cell
surface
PU phase
SiO2 network
Foam cell surface
with SiO2 layer
PU phase
Foam cell
surface
A B
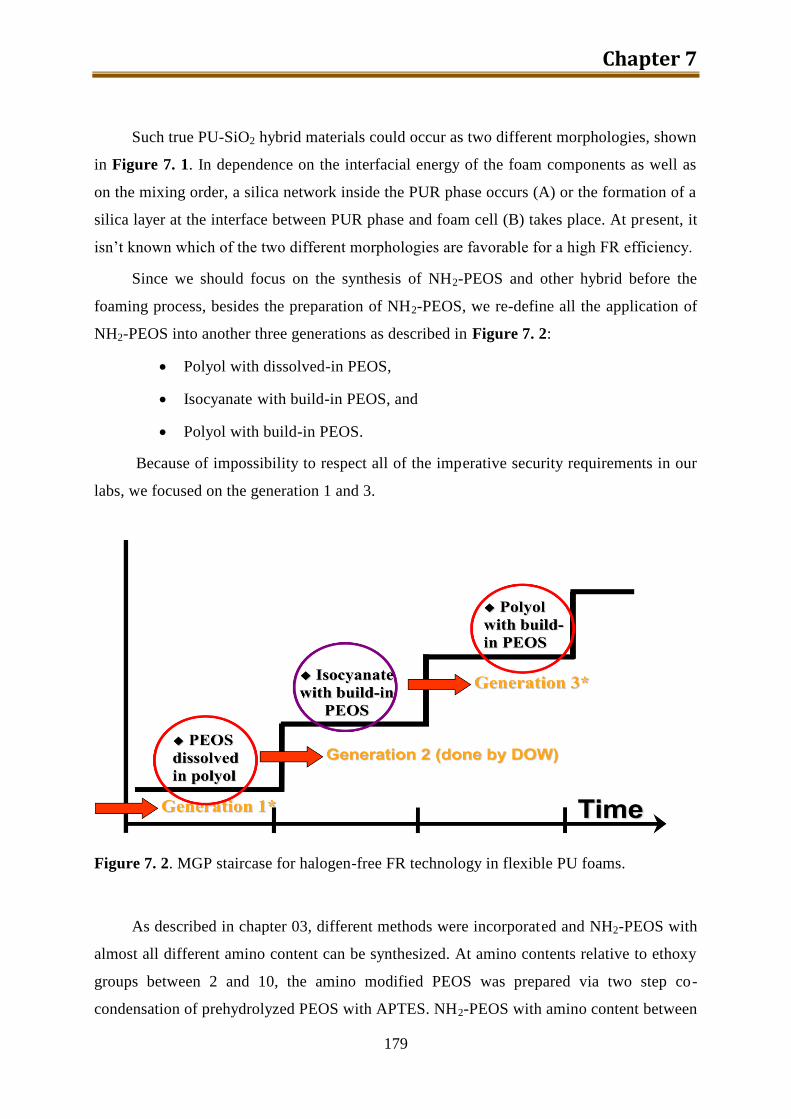
Chapter 7
179
Such true PU-SiO2 hybrid materials could occur as two different morphologies, shown
in Figure 7. 1. In dependence on the interfacial energy of the foam components as well as
on the mixing order, a silica network inside the PUR phase occurs (A) or the formation of a
silica layer at the interface between PUR phase and foam cell (B) takes place. At present, it
isn’t known which of the two different morphologies are favorable for a high FR efficiency.
Since we should focus on the synthesis of NH2-PEOS and other hybrid before the
foaming process, besides the preparation of NH2-PEOS, we re-define all the application of
NH2-PEOS into another three generations as described in Figure 7. 2:
Polyol with dissolved-in PEOS,
Isocyanate with build-in PEOS, and
Polyol with build-in PEOS.
Because of impossibility to respect all of the imperative security requirements in our
labs, we focused on the generation 1 and 3.
Figure 7. 2. MGP staircase for halogen-free FR technology in flexible PU foams.
As described in chapter 03, different methods were incorporated and NH2-PEOS with
almost all different amino content can be synthesized. At amino contents relative to ethoxy
groups between 2 and 10, the amino modified PEOS was prepared via two step co-
condensation of prehydrolyzed PEOS with APTES. NH2-PEOS with amino content between
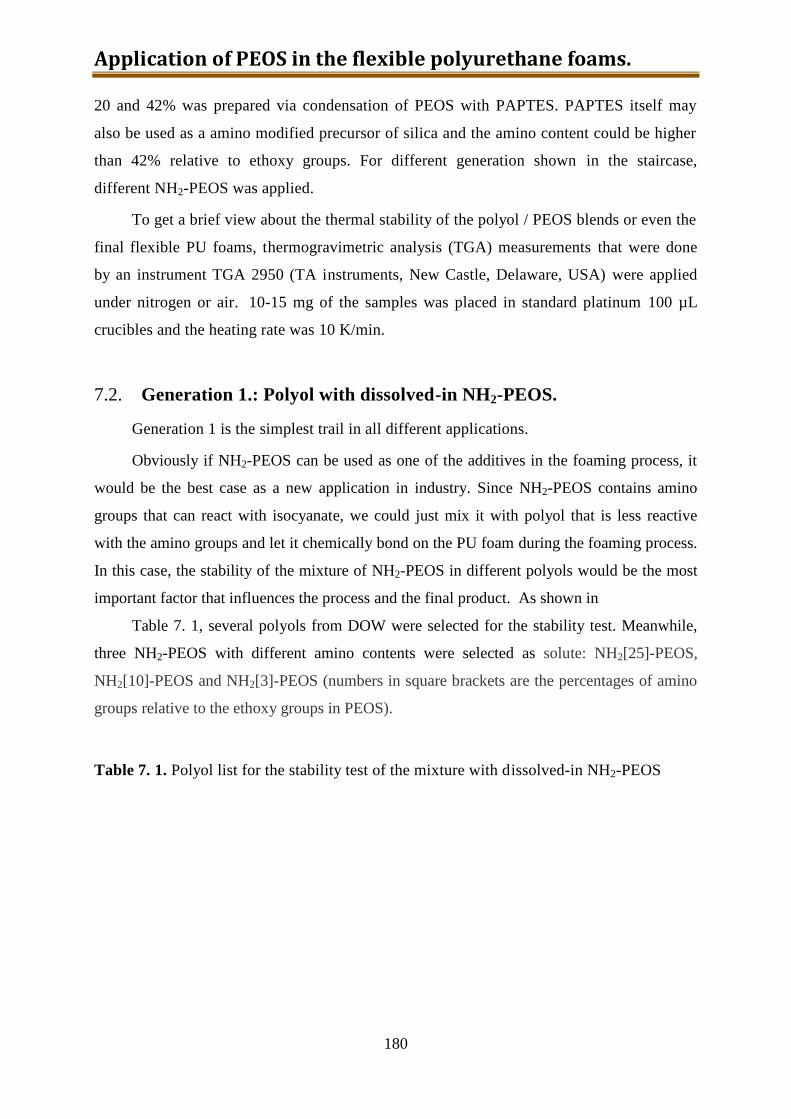
Application of PEOS in the flexible polyurethane foams.
180
20 and 42% was prepared via condensation of PEOS with PAPTES. PAPTES itself may
also be used as a amino modified precursor of silica and the amino content could be higher
than 42% relative to ethoxy groups. For different generation shown in the staircase,
different NH2-PEOS was applied.
To get a brief view about the thermal stability of the polyol / PEOS blends or even the
final flexible PU foams, thermogravimetric analysis (TGA) measurements that were done
by an instrument TGA 2950 (TA instruments, New Castle, Delaware, USA) were applied
under nitrogen or air. 10-15 mg of the samples was placed in standard platinum 100 µL
crucibles and the heating rate was 10 K/min.
7.2. Generation 1.: Polyol with dissolved-in NH2-PEOS.
Generation 1 is the simplest trail in all different applications.
Obviously if NH2-PEOS can be used as one of the additives in the foaming process, it
would be the best case as a new application in industry. Since NH2-PEOS contains amino
groups that can react with isocyanate, we could just mix it with polyol that is less reactive
with the amino groups and let it chemically bond on the PU foam during the foaming process.
In this case, the stability of the mixture of NH2-PEOS in different polyols would be the most
important factor that influences the process and the final product. As shown in
Table 7. 1, several polyols from DOW were selected for the stability test. Meanwhile,
three NH2-PEOS with different amino contents were selected as solute: NH2[25]-PEOS,
NH2[10]-PEOS and NH2[3]-PEOS (numbers in square brackets are the percentages of amino
groups relative to the ethoxy groups in PEOS).
Table 7. 1. Polyol list for the stability test of the mixture with dissolved-in NH2-PEOS
Chapter 7
181
Polyol name: Base Initiator: Oxide structure: HEW (g):
IP 4735 Glycerine PO +EO cap 1580
IP 3040 Glycerine PO + PO/EO Hetero 993
VORANOL CP 1055 Glycerine PO 360
VORANOL 3008 Glycerine PO 993
VORANOL 3322 Glycerine PO + PO/EO Hetero 1181
VORANOL 1010 Propylene glycol PO 508
IP 400 Glycerine EO 133
VORANOL 400 Propylene glycol PO 216
VORANOL CP 6001 Glycerine PO +EO cap 2040
VORANOL CP 1421 Glycerine PO + PO/EO Hetero 1675
VORANOL CP 4702 Glycerine PO +EO cap 1580
7.2.1. Stability test of polyol with dissolved-in NH2[25]-PEOS or silica
precursor with 25 % amino groups prepared from precondensed
TEOS.
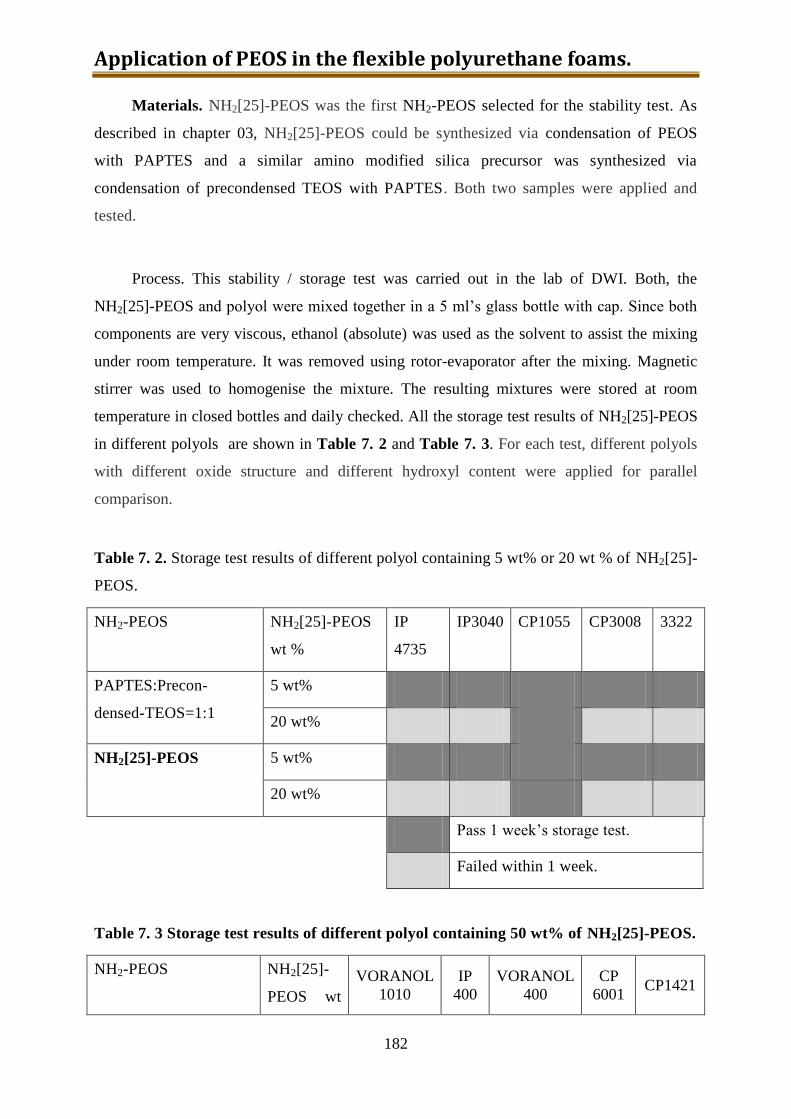
Application of PEOS in the flexible polyurethane foams.
182
Materials. NH2[25]-PEOS was the first NH2-PEOS selected for the stability test. As
described in chapter 03, NH2[25]-PEOS could be synthesized via condensation of PEOS
with PAPTES and a similar amino modified silica precursor was synthesized via
condensation of precondensed TEOS with PAPTES. Both two samples were applied and
tested.
Process. This stability / storage test was carried out in the lab of DWI. Both, the
NH2[25]-PEOS and polyol were mixed together in a 5 ml’s glass bottle with cap. Since both
components are very viscous, ethanol (absolute) was used as the solvent to assist the mixing
under room temperature. It was removed using rotor-evaporator after the mixing. Magnetic
stirrer was used to homogenise the mixture. The resulting mixtures were stored at room
temperature in closed bottles and daily checked. All the storage test results of NH2[25]-PEOS
in different polyols are shown in Table 7. 2 and Table 7. 3. For each test, different polyols
with different oxide structure and different hydroxyl content were applied for parallel
comparison.
Table 7. 2. Storage test results of different polyol containing 5 wt% or 20 wt % of NH2[25]-
PEOS.
NH2-PEOS NH2[25]-PEOS
wt %
IP
4735
IP3040 CP1055 CP3008 3322
PAPTES:Precon-
densed-TEOS=1:1
5 wt%
20 wt%
NH2[25]-PEOS 5 wt%
20 wt%
Pass 1 week’s storage test.
Failed within 1 week.
Table 7. 3 Storage test results of different polyol containing 50 wt% of NH2[25]-PEOS.
NH2-PEOS NH2[25]-
PEOS wt
VORANOL
1010
IP
400
VORANOL
400
CP
6001 CP1421
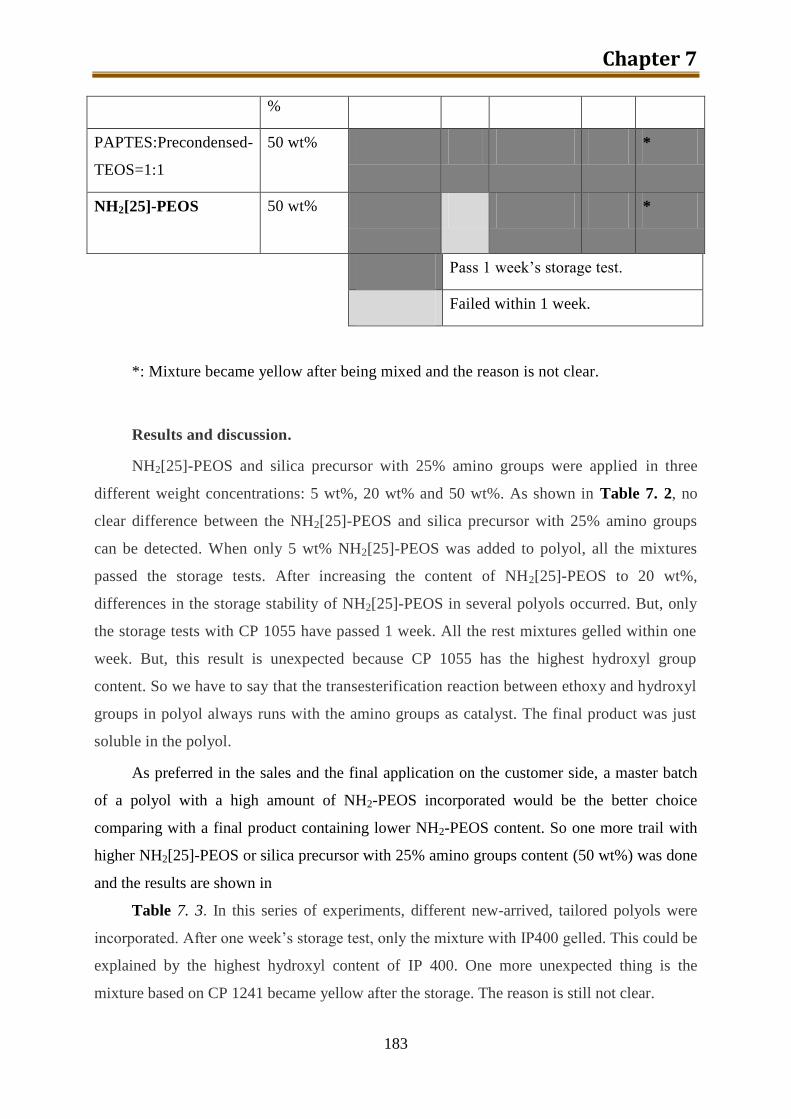
Chapter 7
183
%
PAPTES:Precondensed-
TEOS=1:1
50 wt% *
NH2[25]-PEOS 50 wt% *
Pass 1 week’s storage test.
Failed within 1 week.
*: Mixture became yellow after being mixed and the reason is not clear.
Results and discussion.
NH2[25]-PEOS and silica precursor with 25% amino groups were applied in three
different weight concentrations: 5 wt%, 20 wt% and 50 wt%. As shown in Table 7. 2, no
clear difference between the NH2[25]-PEOS and silica precursor with 25% amino groups
can be detected. When only 5 wt% NH2[25]-PEOS was added to polyol, all the mixtures
passed the storage tests. After increasing the content of NH2[25]-PEOS to 20 wt%,
differences in the storage stability of NH2[25]-PEOS in several polyols occurred. But, only
the storage tests with CP 1055 have passed 1 week. All the rest mixtures gelled within one
week. But, this result is unexpected because CP 1055 has the highest hydroxyl group
content. So we have to say that the transesterification reaction between ethoxy and hydroxyl
groups in polyol always runs with the amino groups as catalyst. The final product was just
soluble in the polyol.
As preferred in the sales and the final application on the customer side, a master batch
of a polyol with a high amount of NH2-PEOS incorporated would be the better choice
comparing with a final product containing lower NH2-PEOS content. So one more trail with
higher NH2[25]-PEOS or silica precursor with 25% amino groups content (50 wt%) was done
and the results are shown in
Table 7. 3. In this series of experiments, different new-arrived, tailored polyols were
incorporated. After one week’s storage test, only the mixture with IP400 gelled. This could be
explained by the highest hydroxyl content of IP 400. One more unexpected thing is the
mixture based on CP 1241 became yellow after the storage. The reason is still not clear.
Application of PEOS in the flexible polyurethane foams.
184
After all those storage test, one foaming trail was done in DOW R&D using NH2[20]-
PEOS / NH2[25]-PEOS or silica precursor with similar amino groups content prepared via
the two different methods described in Chapter 3. The results are quite negative. Only the
NH2[20]-PEOS shortly passed CAL 117 (B2). All the other samples failed.
Conclusion. However since the mixture in this generation is never well studied due to
the complexity during the mixing, we have to move on to the other generations. We can
conclude from this generation:
(1) Transesterification between ethoxy groups and hydroxyl groups under the catalysis
of amino groups cannot be prevented;
(2) The difference between the NH2-PEOS prepared via method 3 or method 4 (see in
chapter 03) is quite minor.
Since negative results were obtained with NH2[25]-PEOS in the foam preparation, we
started to apply NH2-PEOS with lower amino content into the similar storage tests. NH2[3]-
PEOS, NH2[5]-PEOS and NH2[10]-PEOS were selected to replace NH2[25]-PEOS.
7.2.2. Stability test of polyol with dissolved-in NH2[3]-PEOS or NH2[10]-
PEOS
Materials. NH2[3]-PEOS, NH2[5]-PEOS and NH2[10]-PEOS, which were prepared via
two step co-condensation of prehydrolyzed PEOS with APTES, were applied instead of
NH2[25]-PEOS. More details about the preparation can be found in chapter 03. With a lower
amino content the stability of the mixture should be better comparing with the previous
results. Two polyols for the synthesis of flexible PU foams were used in this series of storage
test.
Process. This stability / storage test was the same as the previous one shown in this
chapter. The NH2-PEOS and polyol were mixed in 5 ml’s glass bottles with cap. Magnetic
stirrer was used to homogenise the mixture for several minutes. The resulting mixtures were
stored under room temperature in the closed bottles and the appearances of the two mixtures
were daily checked. All the storage test results of mixtures of NH2[3]-PEOS, NH2[5]-PEOS
and NH2[10]-PEOS with different polyols are shown in Table 7. 4.
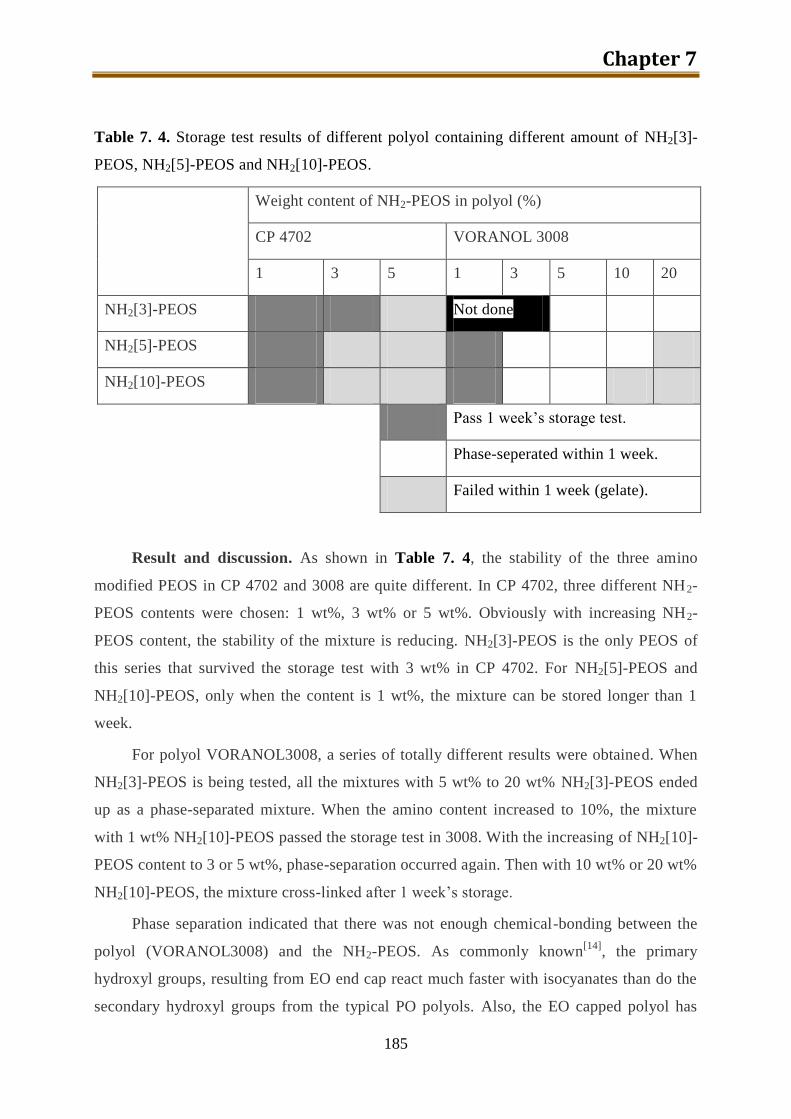
Chapter 7
185
Table 7. 4. Storage test results of different polyol containing different amount of NH2[3]-
PEOS, NH2[5]-PEOS and NH2[10]-PEOS.
Weight content of NH2-PEOS in polyol (%)
CP 4702 VORANOL 3008
1 3 5 1 3 5 10 20
NH2[3]-PEOS Not done
NH2[5]-PEOS
NH2[10]-PEOS
Pass 1 week’s storage test.
Phase-seperated within 1 week.
Failed within 1 week (gelate).
Result and discussion. As shown in Table 7. 4, the stability of the three amino
modified PEOS in CP 4702 and 3008 are quite different. In CP 4702, three different NH2-
PEOS contents were chosen: 1 wt%, 3 wt% or 5 wt%. Obviously with increasing NH2-
PEOS content, the stability of the mixture is reducing. NH2[3]-PEOS is the only PEOS of
this series that survived the storage test with 3 wt% in CP 4702. For NH2[5]-PEOS and
NH2[10]-PEOS, only when the content is 1 wt%, the mixture can be stored longer than 1
week.
For polyol VORANOL3008, a series of totally different results were obtained. When
NH2[3]-PEOS is being tested, all the mixtures with 5 wt% to 20 wt% NH2[3]-PEOS ended
up as a phase-separated mixture. When the amino content increased to 10%, the mixture
with 1 wt% NH2[10]-PEOS passed the storage test in 3008. With the increasing of NH2[10]-
PEOS content to 3 or 5 wt%, phase-separation occurred again. Then with 10 wt% or 20 wt%
NH2[10]-PEOS, the mixture cross-linked after 1 week’s storage.
Phase separation indicated that there was not enough chemical-bonding between the
polyol (VORANOL3008) and the NH2-PEOS. As commonly known[14]
, the primary
hydroxyl groups, resulting from EO end cap react much faster with isocyanates than do the
secondary hydroxyl groups from the typical PO polyols. Also, the EO capped polyol has
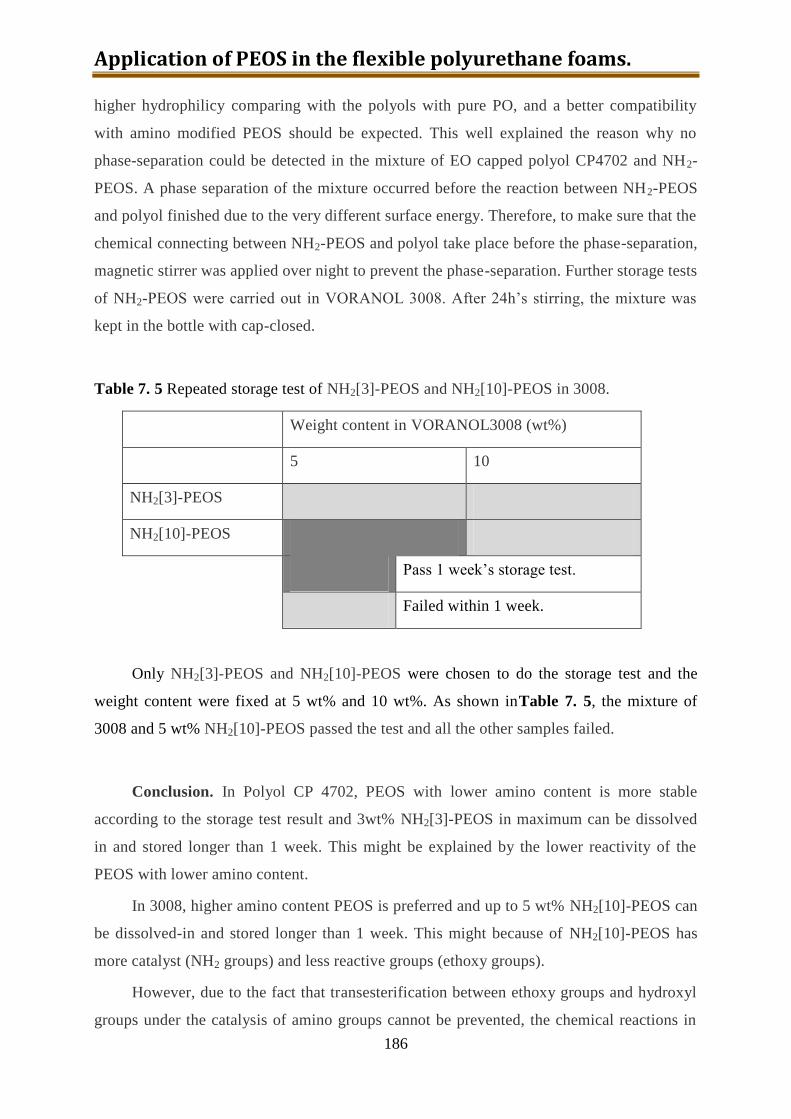
Application of PEOS in the flexible polyurethane foams.
186
higher hydrophilicy comparing with the polyols with pure PO, and a better compatibility
with amino modified PEOS should be expected. This well explained the reason why no
phase-separation could be detected in the mixture of EO capped polyol CP4702 and NH2-
PEOS. A phase separation of the mixture occurred before the reaction between NH2-PEOS
and polyol finished due to the very different surface energy. Therefore, to make sure that the
chemical connecting between NH2-PEOS and polyol take place before the phase-separation,
magnetic stirrer was applied over night to prevent the phase-separation. Further storage tests
of NH2-PEOS were carried out in VORANOL 3008. After 24h’s stirring, the mixture was
kept in the bottle with cap-closed.
Table 7. 5 Repeated storage test of NH2[3]-PEOS and NH2[10]-PEOS in 3008.
Weight content in VORANOL3008 (wt%)
5 10
NH2[3]-PEOS
NH2[10]-PEOS
Pass 1 week’s storage test.
Failed within 1 week.
Only NH2[3]-PEOS and NH2[10]-PEOS were chosen to do the storage test and the
weight content were fixed at 5 wt% and 10 wt%. As shown inTable 7. 5, the mixture of
3008 and 5 wt% NH2[10]-PEOS passed the test and all the other samples failed.
Conclusion. In Polyol CP 4702, PEOS with lower amino content is more stable
according to the storage test result and 3wt% NH2[3]-PEOS in maximum can be dissolved
in and stored longer than 1 week. This might be explained by the lower reactivity of the
PEOS with lower amino content.
In 3008, higher amino content PEOS is preferred and up to 5 wt% NH2[10]-PEOS can
be dissolved-in and stored longer than 1 week. This might because of NH2[10]-PEOS has
more catalyst (NH2 groups) and less reactive groups (ethoxy groups).
However, due to the fact that transesterification between ethoxy groups and hydroxyl
groups under the catalysis of amino groups cannot be prevented, the chemical reactions in
Chapter 7
187
the mixture during dissolving are quite complex and it is quite difficult to detect the detailed
structure of the mixture. So another method to synthesize a mixture with known NH2-PEOS
content / structure was deserved. It would be described as generation 3.
7.3. Generation 2. Isocyanate with dissolved-in NH2-PEOS.
Generation 2 is quite similar with generation 1. NH2-PEOS and different types of
isocyanate were mixed together to prepare a prepolymer for the foam preparation. Since this
part of work was done by DOW R&D, only some brief data from the project meeting would
be collected here with a short conclusion.
Materials. PEOS with 0 to 40 % amino groups prepared via transesterification with
ethanol amino as described in chapter 03 were tested in this series of work and two different
isocyanates were used as matrix: MDI (precut-50) and PMDI (M229).
Process. This series of work aimed on determining correct amino content in PEOS to
give good dispersion / solution with MDI and PMDI. PEOS or NH2-PEOS was dissolved in
MDI or PMDI in concentrations between 1 wt% and 10 wt%. Magnetic stirrer was used to
homogenise the mixture and the whole process was finished in the glove box under the
protection of dry nitrogen. The final product was observed visually.
Result and discussion. To get a reaction of NCO groups with Si-OEt, the ethoxy
groups have to be hydrolyzed to Si-OH before. However, due to the high hydrolytically
stability of PEOS without any catalyst, the reactivity of unmodified PEOS with MDI or
PMDL should be very poor. As shown in Figure 7. 3, unmodified PEOS has also very poor
solubility in both MDI and PMDI. By varying the content of PEOS from 1 wt% to 10 wt%,
the solutions are turbid and for most of them yellow / hazy dispersions were observed.
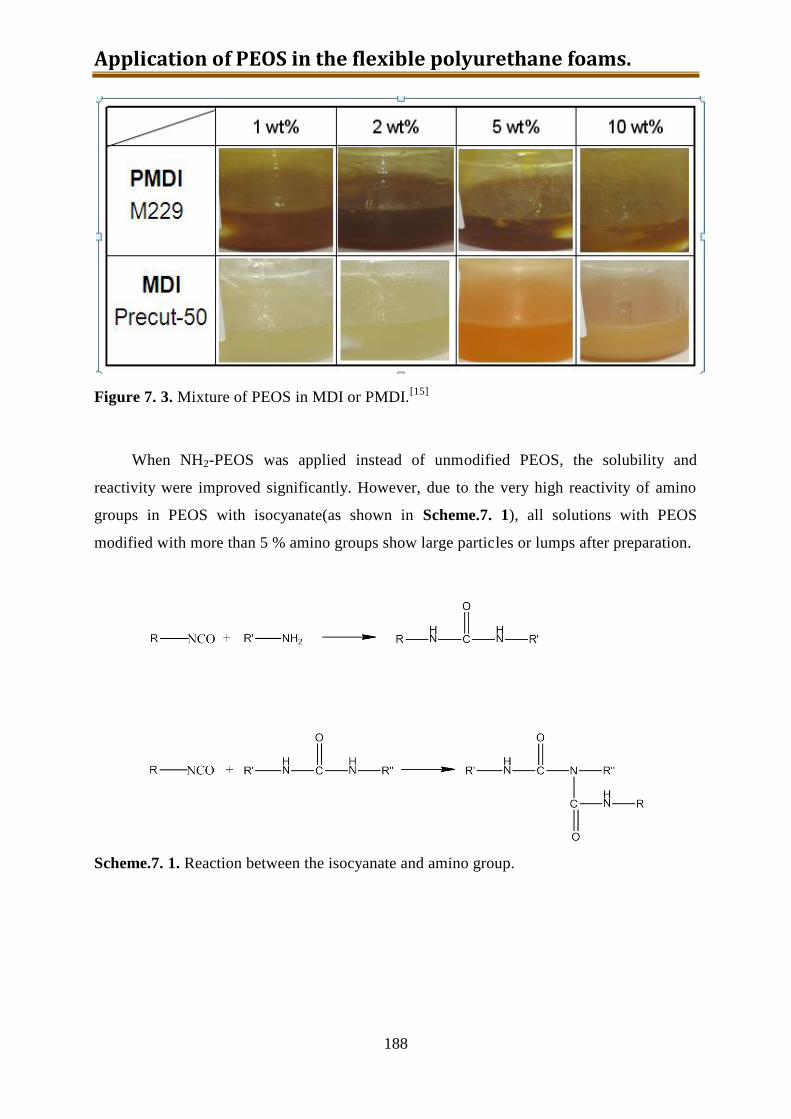
Application of PEOS in the flexible polyurethane foams.
188
Figure 7. 3. Mixture of PEOS in MDI or PMDI.[15]
When NH2-PEOS was applied instead of unmodified PEOS, the solubility and
reactivity were improved significantly. However, due to the very high reactivity of amino
groups in PEOS with isocyanate(as shown in Scheme.7. 1), all solutions with PEOS
modified with more than 5 % amino groups show large particles or lumps after preparation.
Scheme.7. 1. Reaction between the isocyanate and amino group.
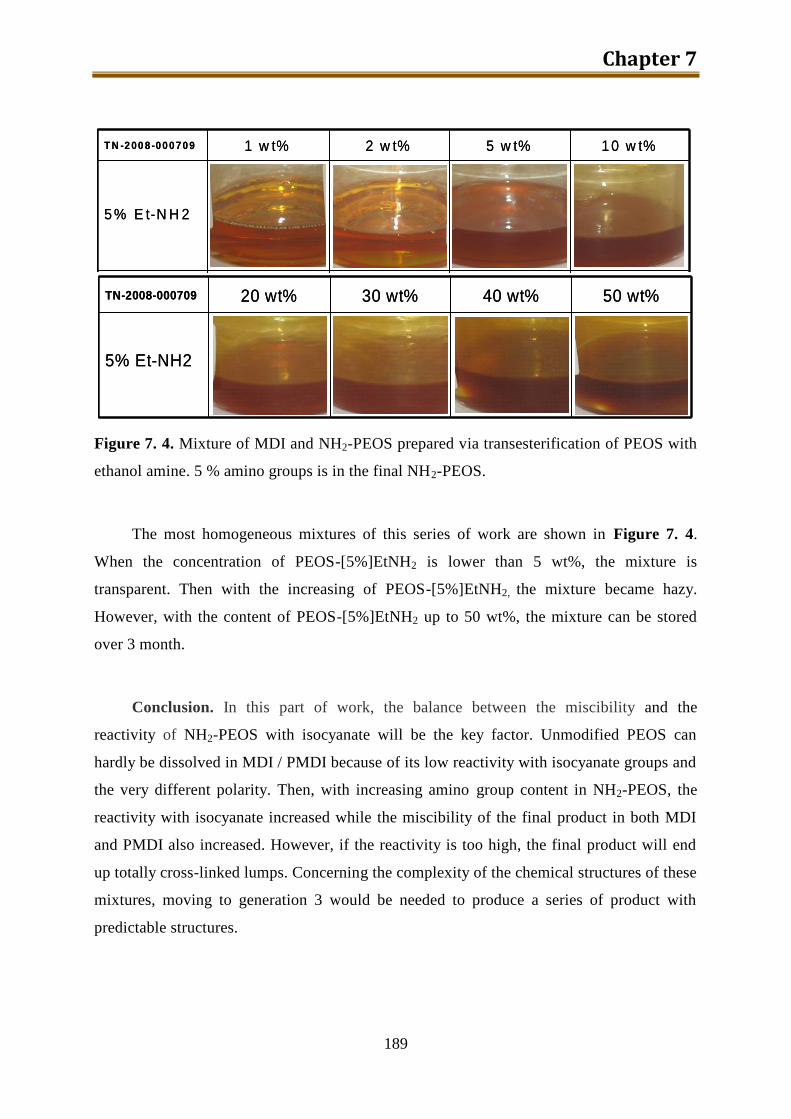
Chapter 7
189
Figure 7. 4. Mixture of MDI and NH2-PEOS prepared via transesterification of PEOS with
ethanol amine. 5 % amino groups is in the final NH2-PEOS.
The most homogeneous mixtures of this series of work are shown in Figure 7. 4.
When the concentration of PEOS-[5%]EtNH2 is lower than 5 wt%, the mixture is
transparent. Then with the increasing of PEOS-[5%]EtNH2, the mixture became hazy.
However, with the content of PEOS-[5%]EtNH2 up to 50 wt%, the mixture can be stored
over 3 month.
Conclusion. In this part of work, the balance between the miscibility and the
reactivity of NH2-PEOS with isocyanate will be the key factor. Unmodified PEOS can
hardly be dissolved in MDI / PMDI because of its low reactivity with isocyanate groups and
the very different polarity. Then, with increasing amino group content in NH2-PEOS, the
reactivity with isocyanate increased while the miscibility of the final product in both MDI
and PMDI also increased. However, if the reactivity is too high, the final product will end
up totally cross-linked lumps. Concerning the complexity of the chemical structures of these
mixtures, moving to generation 3 would be needed to produce a series of product with
predictable structures.
2 0 % E t-N H 2
1 0 % E t-N H 2
5 % E t-N H 2
1 0 w t%5 w t%2 w t%1 w t%T N -2 00 8 -0 0 0 7 0 9
2 0 % E t-N H 2
1 0 % E t-N H 2
5 % E t-N H 2
1 0 w t%5 w t%2 w t%1 w t%T N -2 00 8 -0 0 0 7 0 9
5% Et-NH2
50 wt%40 wt%30 wt%20 wt%TN-2008-000709
5% Et-NH2
50 wt%40 wt%30 wt%20 wt%TN-2008-000709
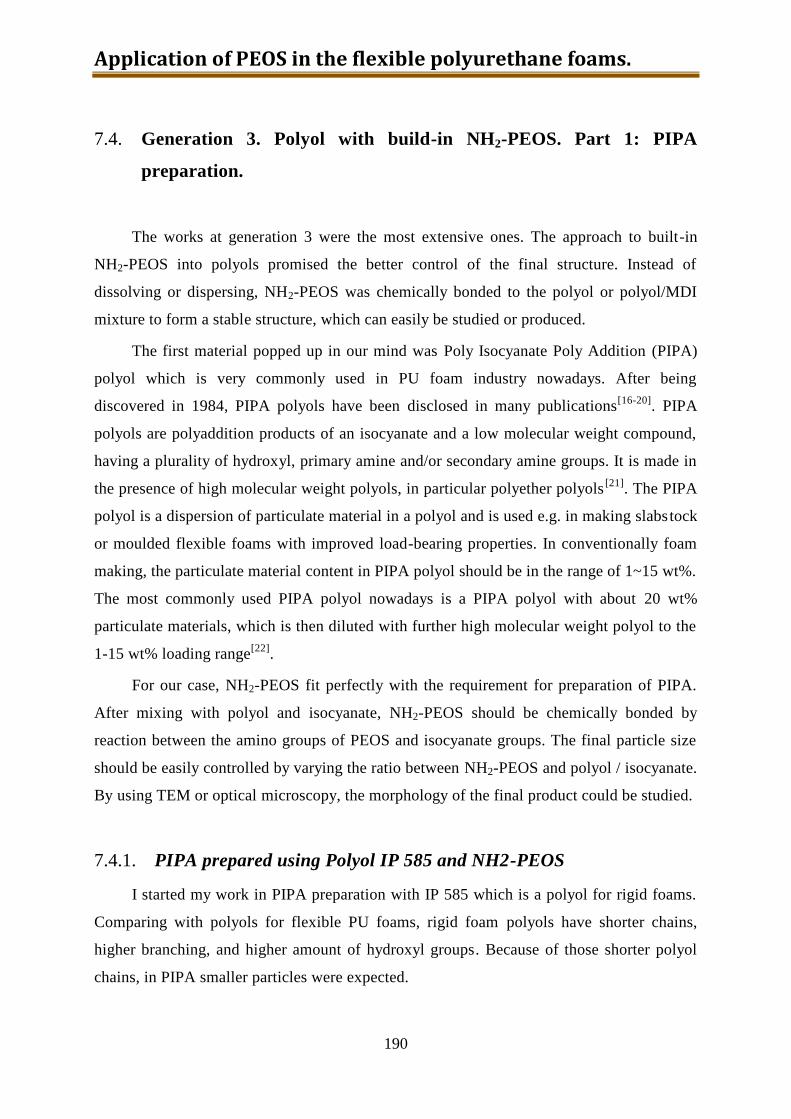
Application of PEOS in the flexible polyurethane foams.
190
7.4. Generation 3. Polyol with build-in NH2-PEOS. Part 1: PIPA
preparation.
The works at generation 3 were the most extensive ones. The approach to built-in
NH2-PEOS into polyols promised the better control of the final structure. Instead of
dissolving or dispersing, NH2-PEOS was chemically bonded to the polyol or polyol/MDI
mixture to form a stable structure, which can easily be studied or produced.
The first material popped up in our mind was Poly Isocyanate Poly Addition (PIPA)
polyol which is very commonly used in PU foam industry nowadays. After being
discovered in 1984, PIPA polyols have been disclosed in many publications[16-20]
. PIPA
polyols are polyaddition products of an isocyanate and a low molecular weight compound,
having a plurality of hydroxyl, primary amine and/or secondary amine groups. It is made in
the presence of high molecular weight polyols, in particular polyether polyols[21]
. The PIPA
polyol is a dispersion of particulate material in a polyol and is used e.g. in making slabstock
or moulded flexible foams with improved load-bearing properties. In conventionally foam
making, the particulate material content in PIPA polyol should be in the range of 1~15 wt%.
The most commonly used PIPA polyol nowadays is a PIPA polyol with about 20 wt%
particulate materials, which is then diluted with further high molecular weight polyol to the
1-15 wt% loading range[22]
.
For our case, NH2-PEOS fit perfectly with the requirement for preparation of PIPA.
After mixing with polyol and isocyanate, NH2-PEOS should be chemically bonded by
reaction between the amino groups of PEOS and isocyanate groups. The final particle size
should be easily controlled by varying the ratio between NH2-PEOS and polyol / isocyanate.
By using TEM or optical microscopy, the morphology of the final product could be studied.
7.4.1. PIPA prepared using Polyol IP 585 and NH2-PEOS
I started my work in PIPA preparation with IP 585 which is a polyol for rigid foams.
Comparing with polyols for flexible PU foams, rigid foam polyols have shorter chains,
higher branching, and higher amount of hydroxyl groups. Because of those shorter polyol
chains, in PIPA smaller particles were expected.
Chapter 7
191
Materials. PEOS with 3, 5 and 8 % of amino groups prepared via two step
condensation of pre-hydrolyzed PEOS with APTES as described in chapter 03 were used in
this series of work while isocyanate TDI (T80) and polyol (IP 585) were select to form the
matrix of PIPA. Dibutyltin dilaurate (DBTDL, DABCO T-12 from Air Products), which
promotes the gelling reaction for the production of both rigid and flexible PU foams, was
used as the catalyst without any further purification.
Process. PIPA was prepared via simply mixing of PEOS, IP 585 and T80 in a certain
order. First of all, NH2-PEOS and IP 585 were mixed by gently stirring and shaking under
dry N2 atmosphere because the NH2-PEOS is quite sensitive to humidity. Then after 3 drops
of catalyst DBTDL was added, the mixture was stirred by mechanical stirrer under 4000
rpm for 30 sec. After that isocyanate T80 was added to the mixture under further stirring
and then the mixture was stirred for another 30 sec. The final mixtures were stored in the
capped bottles for 24h to finish the reaction. All of the so prepared PIPA samples are listed
in Table 7. 6. For each NH2-PEOS the weight content varied from 8 wt% to 12 wt%. The
PIPA mixture was diluted in pure ethanol using ultra turrax (Heidolph DIAX 900) and then
the morphology of the final PIPA were detected by microscope (Carl Zeiss Axioplan 2
imaging polarizing microscope, and the micrographs recorded with a Carl Zeiss AxioCam
MRc digital camera).
Table 7. 6. PIPA prepared using IP 585 and T80.
Sample No. NH2-PEOS (g) T80 (g) IP585 (g)
NH2[3]-PEOS 1 12 0.5 88
2 10 0.5 90
3 8 0.5 92
NH2[5]-PEOS 4 12 0.5 88
5 10 0.5 90
6 8 0.5 92
NH2[8]-PEOS 7 12 0.5 88
8 10 0.5 90
9 8 0.5 92
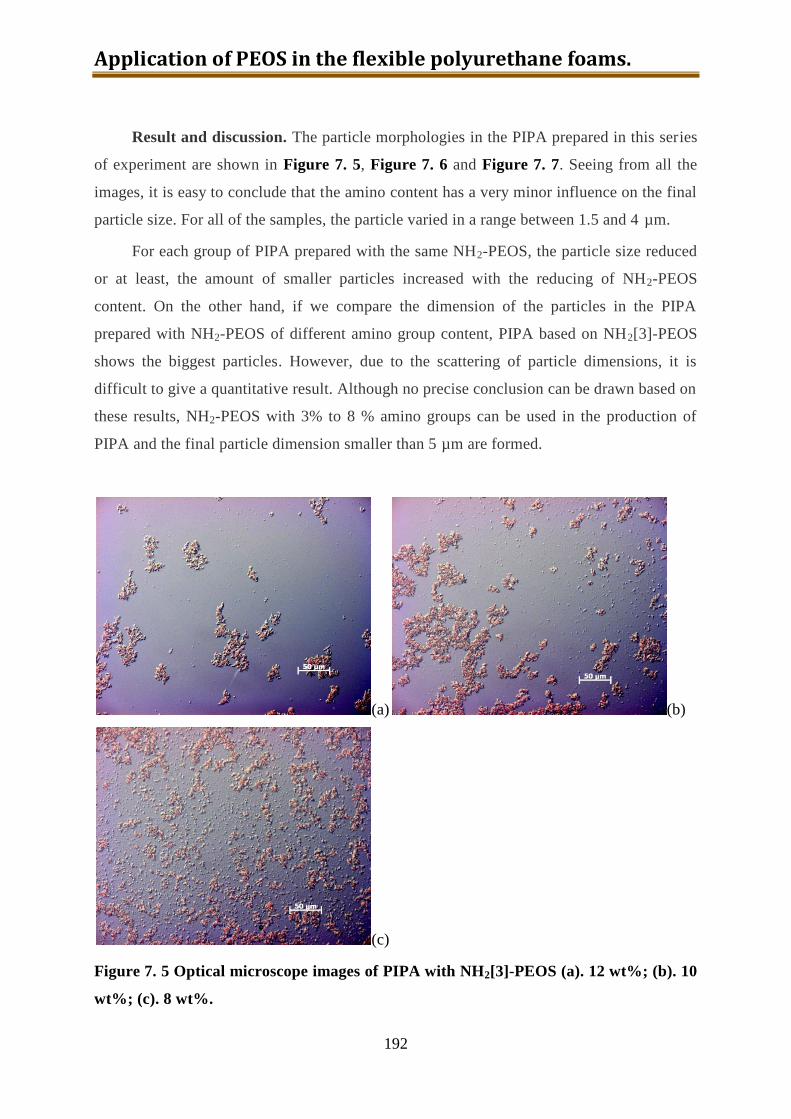
Application of PEOS in the flexible polyurethane foams.
192
Result and discussion. The particle morphologies in the PIPA prepared in this series
of experiment are shown in Figure 7. 5, Figure 7. 6 and Figure 7. 7. Seeing from all the
images, it is easy to conclude that the amino content has a very minor influence on the final
particle size. For all of the samples, the particle varied in a range between 1.5 and 4 µm.
For each group of PIPA prepared with the same NH2-PEOS, the particle size reduced
or at least, the amount of smaller particles increased with the reducing of NH2-PEOS
content. On the other hand, if we compare the dimension of the particles in the PIPA
prepared with NH2-PEOS of different amino group content, PIPA based on NH2[3]-PEOS
shows the biggest particles. However, due to the scattering of particle dimensions, it is
difficult to give a quantitative result. Although no precise conclusion can be drawn based on
these results, NH2-PEOS with 3% to 8 % amino groups can be used in the production of
PIPA and the final particle dimension smaller than 5 µm are formed.
(a) (b)
(c)
Figure 7. 5 Optical microscope images of PIPA with NH2[3]-PEOS (a). 12 wt%; (b). 10
wt%; (c). 8 wt%.
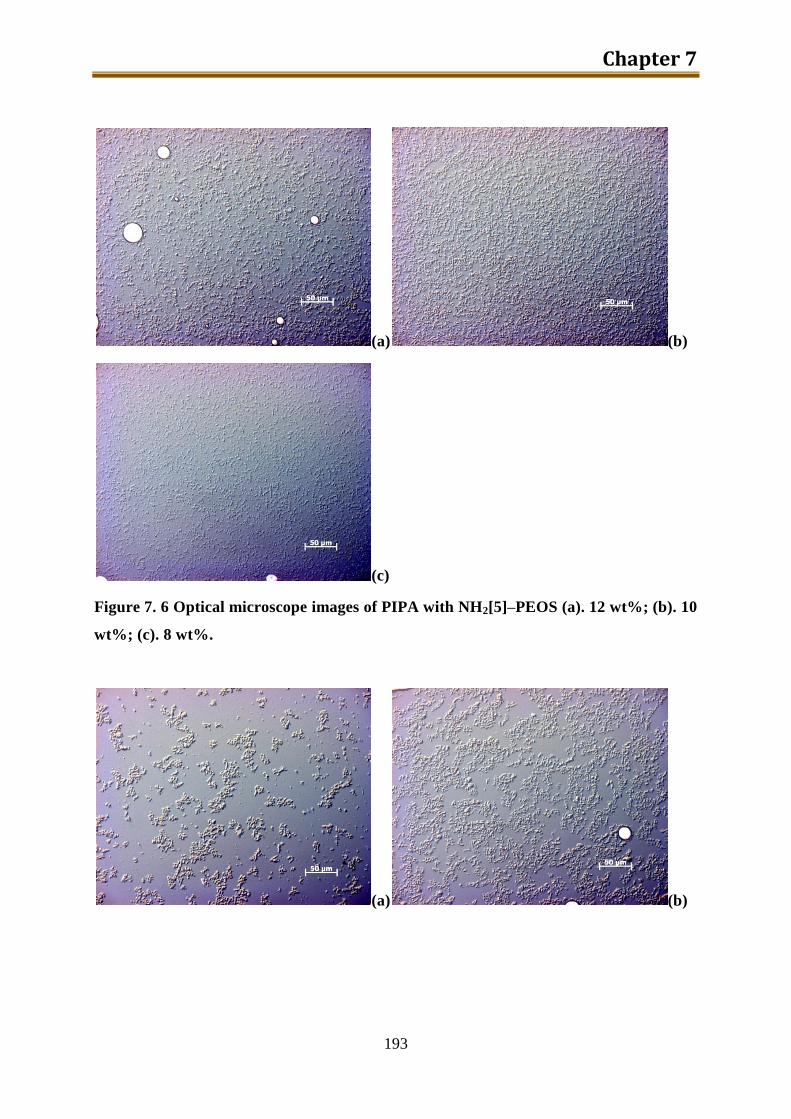
Chapter 7
193
(a) (b)
(c)
Figure 7. 6 Optical microscope images of PIPA with NH2[5]–PEOS (a). 12 wt%; (b). 10
wt%; (c). 8 wt%.
(a) (b)
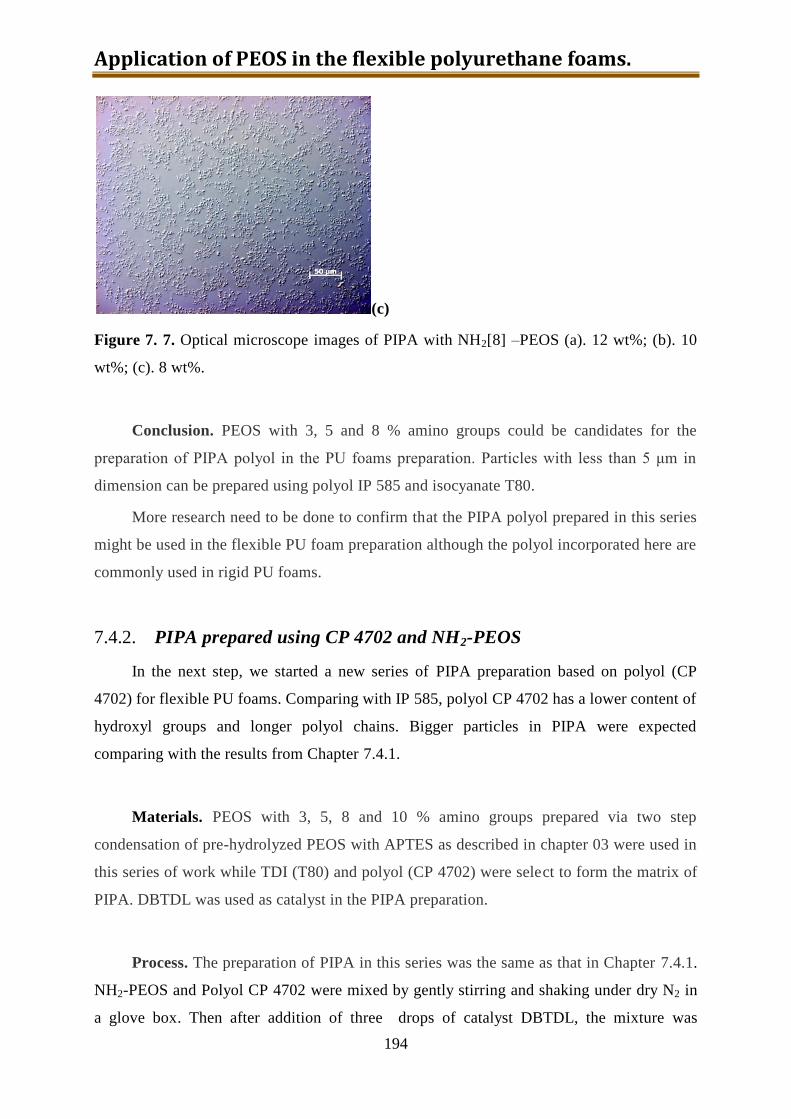
Application of PEOS in the flexible polyurethane foams.
194
(c)
Figure 7. 7. Optical microscope images of PIPA with NH2[8] –PEOS (a). 12 wt%; (b). 10
wt%; (c). 8 wt%.
Conclusion. PEOS with 3, 5 and 8 % amino groups could be candidates for the
preparation of PIPA polyol in the PU foams preparation. Particles with less than 5 μm in
dimension can be prepared using polyol IP 585 and isocyanate T80.
More research need to be done to confirm that the PIPA polyol prepared in this series
might be used in the flexible PU foam preparation although the polyol incorporated here are
commonly used in rigid PU foams.
7.4.2. PIPA prepared using CP 4702 and NH2-PEOS
In the next step, we started a new series of PIPA preparation based on polyol (CP
4702) for flexible PU foams. Comparing with IP 585, polyol CP 4702 has a lower content of
hydroxyl groups and longer polyol chains. Bigger particles in PIPA were expected
comparing with the results from Chapter 7.4.1.
Materials. PEOS with 3, 5, 8 and 10 % amino groups prepared via two step
condensation of pre-hydrolyzed PEOS with APTES as described in chapter 03 were used in
this series of work while TDI (T80) and polyol (CP 4702) were select to form the matrix of
PIPA. DBTDL was used as catalyst in the PIPA preparation.
Process. The preparation of PIPA in this series was the same as that in Chapter 7.4.1.
NH2-PEOS and Polyol CP 4702 were mixed by gently stirring and shaking under dry N2 in
a glove box. Then after addition of three drops of catalyst DBTDL, the mixture was

Chapter 7
195
mechanically stirred under 4000 rpm for 30 sec. Then, after isocyanate T80 was added
under stirring, the mixture was stirred for another 30 seconds. The final mixtures were
stored in the capped bottles for 24h to finish the reaction. All the PIPA samples prepared on
the base of NH2-PEOS,flexible polyol CP 4702 and isocyanate T80 are listed in Table 7. 7.
The morphology of the final PIPA were detected by optical microscope after being diluted
in pure ethanol and homogenised using ultrasonic.
Table 7. 7 PIPA prepared using CP 4702 and T80.
Index= NH2 Content in PEOS (relative to EtO)
NCO/NH2 3% 5% 8% 10%
Weight content
of NH2-PEOS
in PIPA (%)
4 1.94 1.2 0.98
6 1.29 0.81 0.65
8 1.61 0.97 0.60 0.49
10 1.29 0.78 0.48 0.39
12 1.07 0.65 0.40 0.33
14 0.92 0.55
16 0.81
: Not done
: Cross-linked
: Liquid-like
Result and discussion. When the flexible polyol CP 4702 was incorporated instead of
the rigid polyol IP 585, different series of PIPA polyol were obtained. Different NH2-PEOS
is applied to check the ability of different PEOS to be incorporated in the PIPA before
getting cross-linked. From each of the NH2-PEOS, different weight contents between 4 wt%
and 16 wt% were selected and different morphologies of the final PIPA were obtained. The
index NCO/NH2 was calculated based on the average structures shown in Chapter 03.
When NH2[3]-PEOS was applied in the PIPA preparation, the weight content varied
from 8 wt% to 16 wt% and all the PIPA mixtures were liquid-like. The morphology of the
PIPA polyol with different amounts of NH2[3]-PEOS are shown in Figure 7. 8. With the
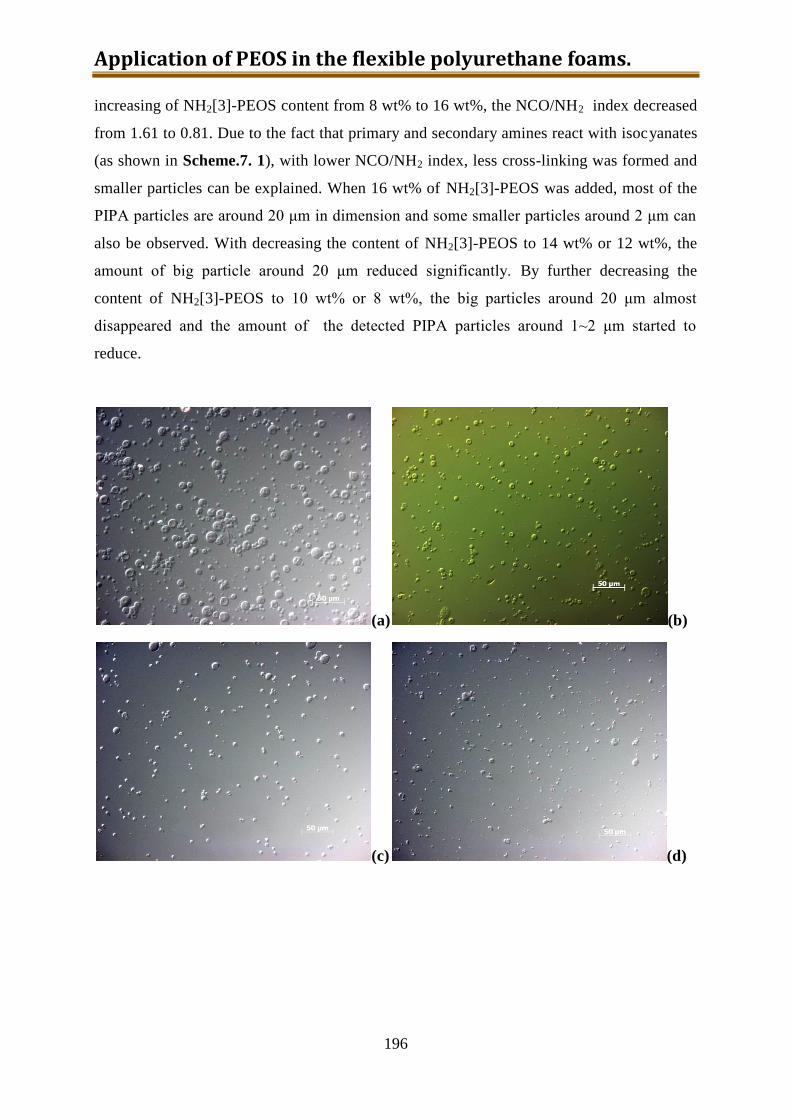
Application of PEOS in the flexible polyurethane foams.
196
increasing of NH2[3]-PEOS content from 8 wt% to 16 wt%, the NCO/NH2 index decreased
from 1.61 to 0.81. Due to the fact that primary and secondary amines react with isocyanates
(as shown in Scheme.7. 1), with lower NCO/NH2 index, less cross-linking was formed and
smaller particles can be explained. When 16 wt% of NH2[3]-PEOS was added, most of the
PIPA particles are around 20 μm in dimension and some smaller particles around 2 μm can
also be observed. With decreasing the content of NH2[3]-PEOS to 14 wt% or 12 wt%, the
amount of big particle around 20 μm reduced significantly. By further decreasing the
content of NH2[3]-PEOS to 10 wt% or 8 wt%, the big particles around 20 μm almost
disappeared and the amount of the detected PIPA particles around 1~2 μm started to
reduce.
(a) (b)
(c) (d)
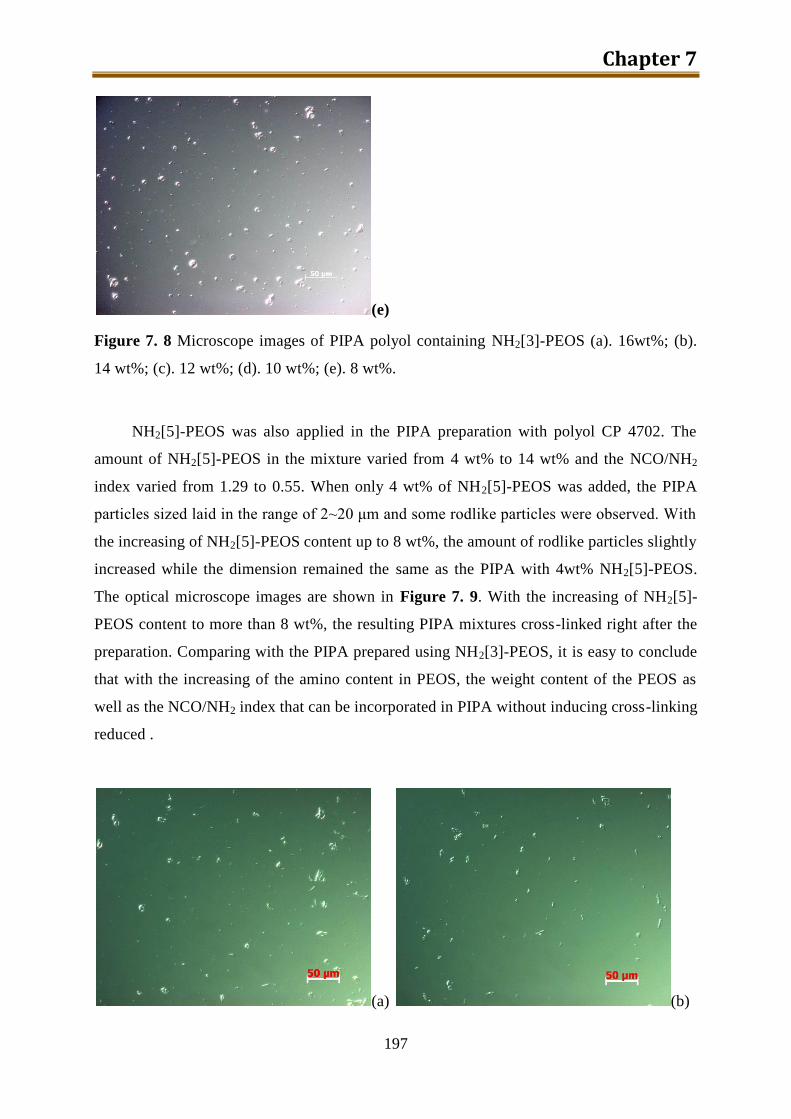
Chapter 7
197
(e)
Figure 7. 8 Microscope images of PIPA polyol containing NH2[3]-PEOS (a). 16wt%; (b).
14 wt%; (c). 12 wt%; (d). 10 wt%; (e). 8 wt%.
NH2[5]-PEOS was also applied in the PIPA preparation with polyol CP 4702. The
amount of NH2[5]-PEOS in the mixture varied from 4 wt% to 14 wt% and the NCO/NH2
index varied from 1.29 to 0.55. When only 4 wt% of NH2[5]-PEOS was added, the PIPA
particles sized laid in the range of 2~20 μm and some rodlike particles were observed. With
the increasing of NH2[5]-PEOS content up to 8 wt%, the amount of rodlike particles slightly
increased while the dimension remained the same as the PIPA with 4wt% NH2[5]-PEOS.
The optical microscope images are shown in Figure 7. 9. With the increasing of NH2[5]-
PEOS content to more than 8 wt%, the resulting PIPA mixtures cross-linked right after the
preparation. Comparing with the PIPA prepared using NH2[3]-PEOS, it is easy to conclude
that with the increasing of the amino content in PEOS, the weight content of the PEOS as
well as the NCO/NH2 index that can be incorporated in PIPA without inducing cross-linking
reduced .
(a) (b)
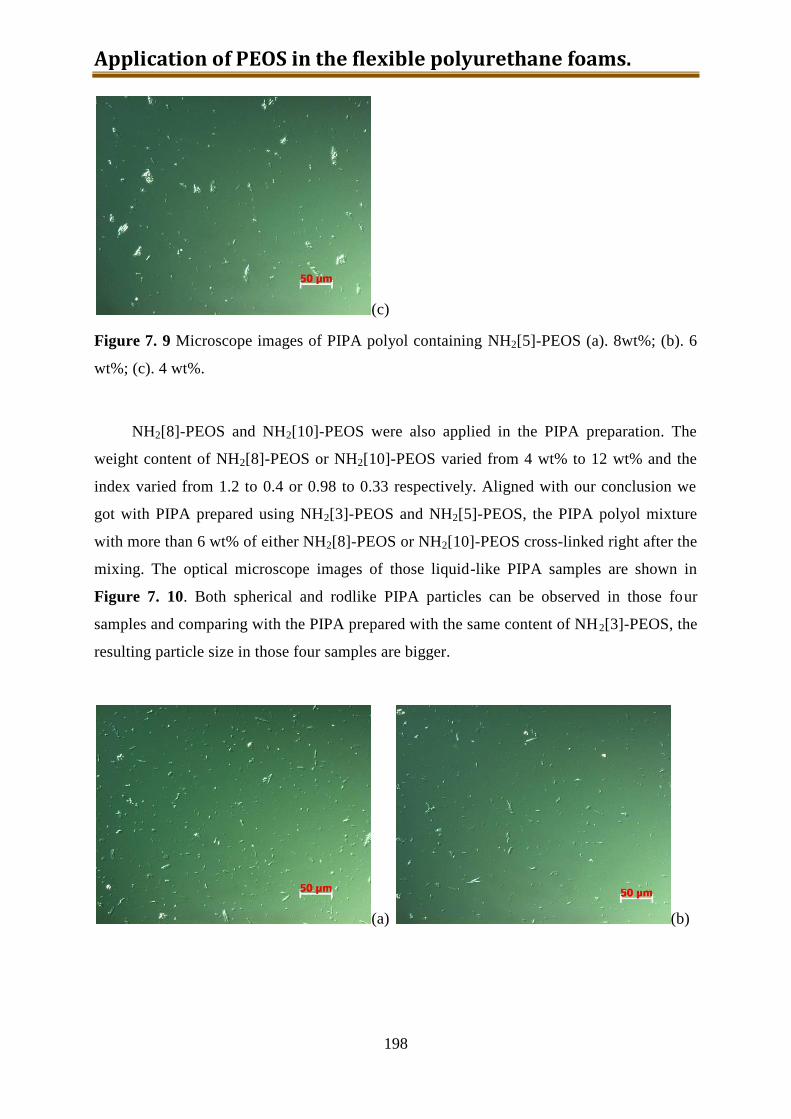
Application of PEOS in the flexible polyurethane foams.
198
(c)
Figure 7. 9 Microscope images of PIPA polyol containing NH2[5]-PEOS (a). 8wt%; (b). 6
wt%; (c). 4 wt%.
NH2[8]-PEOS and NH2[10]-PEOS were also applied in the PIPA preparation. The
weight content of NH2[8]-PEOS or NH2[10]-PEOS varied from 4 wt% to 12 wt% and the
index varied from 1.2 to 0.4 or 0.98 to 0.33 respectively. Aligned with our conclusion we
got with PIPA prepared using NH2[3]-PEOS and NH2[5]-PEOS, the PIPA polyol mixture
with more than 6 wt% of either NH2[8]-PEOS or NH2[10]-PEOS cross-linked right after the
mixing. The optical microscope images of those liquid-like PIPA samples are shown in
Figure 7. 10. Both spherical and rodlike PIPA particles can be observed in those four
samples and comparing with the PIPA prepared with the same content of NH2[3]-PEOS, the
resulting particle size in those four samples are bigger.
(a) (b)
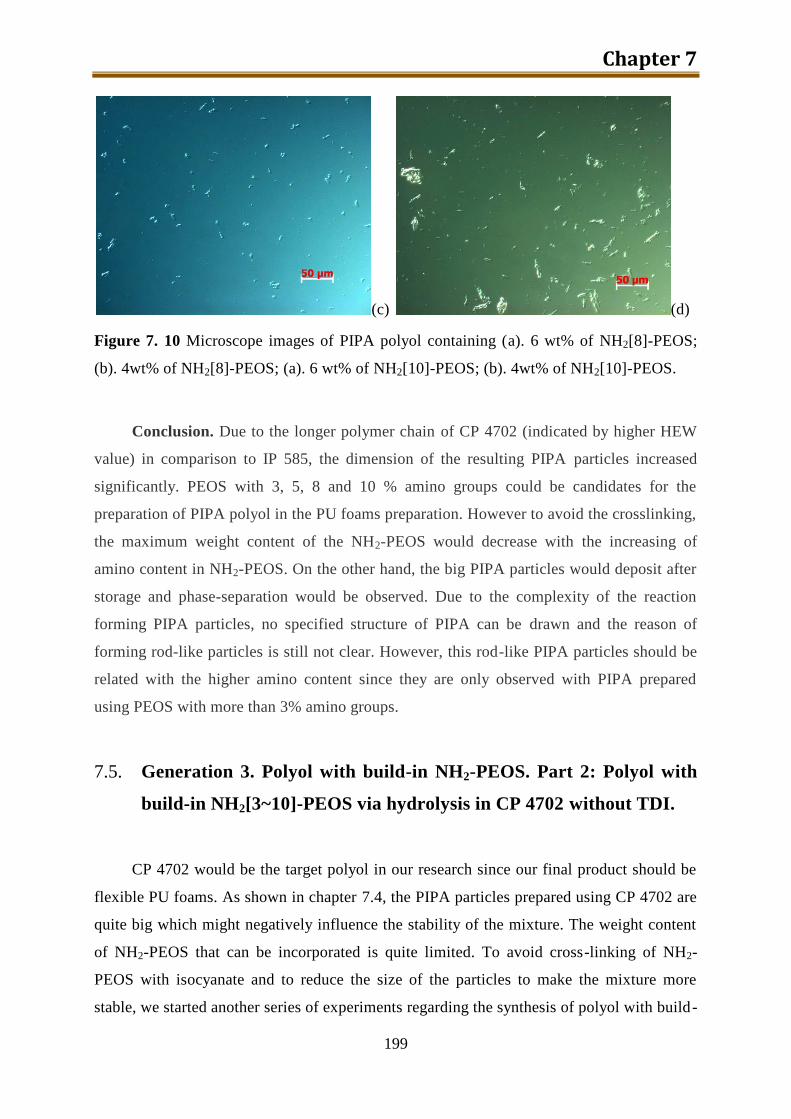
Chapter 7
199
(c) (d)
Figure 7. 10 Microscope images of PIPA polyol containing (a). 6 wt% of NH2[8]-PEOS;
(b). 4wt% of NH2[8]-PEOS; (a). 6 wt% of NH2[10]-PEOS; (b). 4wt% of NH2[10]-PEOS.
Conclusion. Due to the longer polymer chain of CP 4702 (indicated by higher HEW
value) in comparison to IP 585, the dimension of the resulting PIPA particles increased
significantly. PEOS with 3, 5, 8 and 10 % amino groups could be candidates for the
preparation of PIPA polyol in the PU foams preparation. However to avoid the crosslinking,
the maximum weight content of the NH2-PEOS would decrease with the increasing of
amino content in NH2-PEOS. On the other hand, the big PIPA particles would deposit after
storage and phase-separation would be observed. Due to the complexity of the reaction
forming PIPA particles, no specified structure of PIPA can be drawn and the reason of
forming rod-like particles is still not clear. However, this rod-like PIPA particles should be
related with the higher amino content since they are only observed with PIPA prepared
using PEOS with more than 3% amino groups.
7.5. Generation 3. Polyol with build-in NH2-PEOS. Part 2: Polyol with
build-in NH2[3~10]-PEOS via hydrolysis in CP 4702 without TDI.
CP 4702 would be the target polyol in our research since our final product should be
flexible PU foams. As shown in chapter 7.4, the PIPA particles prepared using CP 4702 are
quite big which might negatively influence the stability of the mixture. The weight content
of NH2-PEOS that can be incorporated is quite limited. To avoid cross-linking of NH2-
PEOS with isocyanate and to reduce the size of the particles to make the mixture more
stable, we started another series of experiments regarding the synthesis of polyol with build-
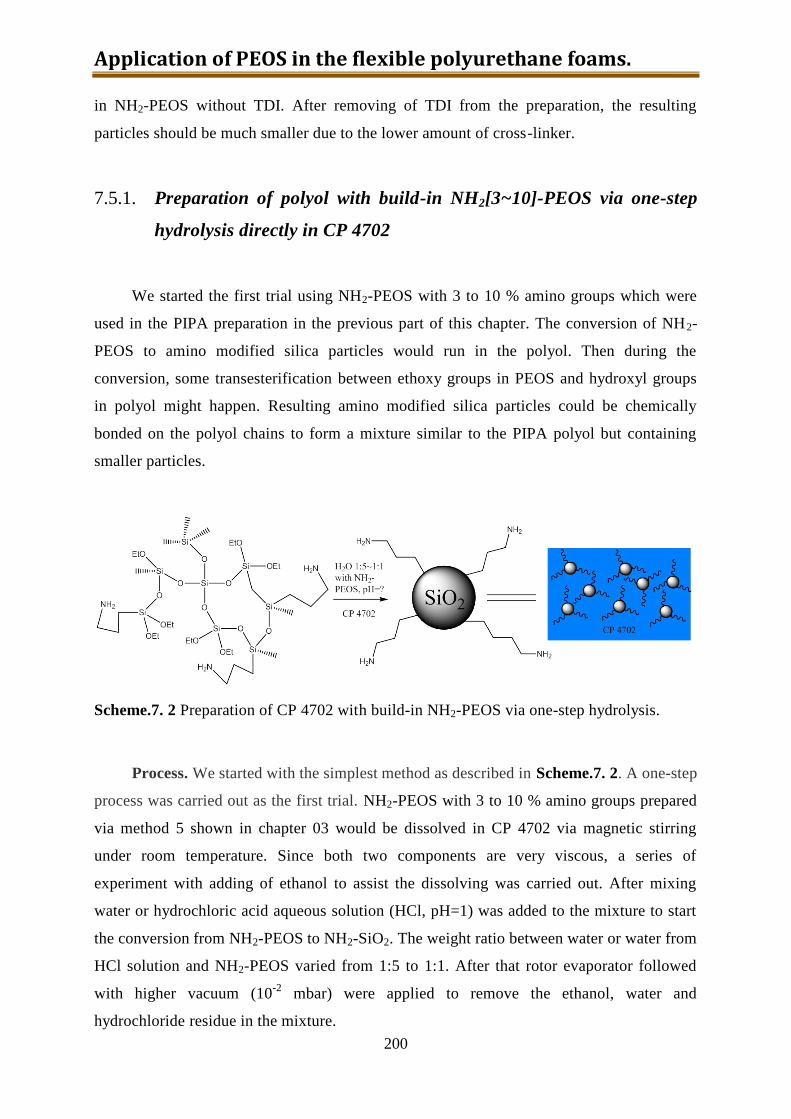
Application of PEOS in the flexible polyurethane foams.
200
in NH2-PEOS without TDI. After removing of TDI from the preparation, the resulting
particles should be much smaller due to the lower amount of cross-linker.
7.5.1. Preparation of polyol with build-in NH2[3~10]-PEOS via one-step
hydrolysis directly in CP 4702
We started the first trial using NH2-PEOS with 3 to 10 % amino groups which were
used in the PIPA preparation in the previous part of this chapter. The conversion of NH2-
PEOS to amino modified silica particles would run in the polyol. Then during the
conversion, some transesterification between ethoxy groups in PEOS and hydroxyl groups
in polyol might happen. Resulting amino modified silica particles could be chemically
bonded on the polyol chains to form a mixture similar to the PIPA polyol but containing
smaller particles.
Scheme.7. 2 Preparation of CP 4702 with build-in NH2-PEOS via one-step hydrolysis.
Process. We started with the simplest method as described in Scheme.7. 2. A one-step
process was carried out as the first trial. NH2-PEOS with 3 to 10 % amino groups prepared
via method 5 shown in chapter 03 would be dissolved in CP 4702 via magnetic stirring
under room temperature. Since both two components are very viscous, a series of
experiment with adding of ethanol to assist the dissolving was carried out. After mixing
water or hydrochloric acid aqueous solution (HCl, pH=1) was added to the mixture to start
the conversion from NH2-PEOS to NH2-SiO2. The weight ratio between water or water from
HCl solution and NH2-PEOS varied from 1:5 to 1:1. After that rotor evaporator followed
with higher vacuum (10-2
mbar) were applied to remove the ethanol, water and
hydrochloride residue in the mixture.
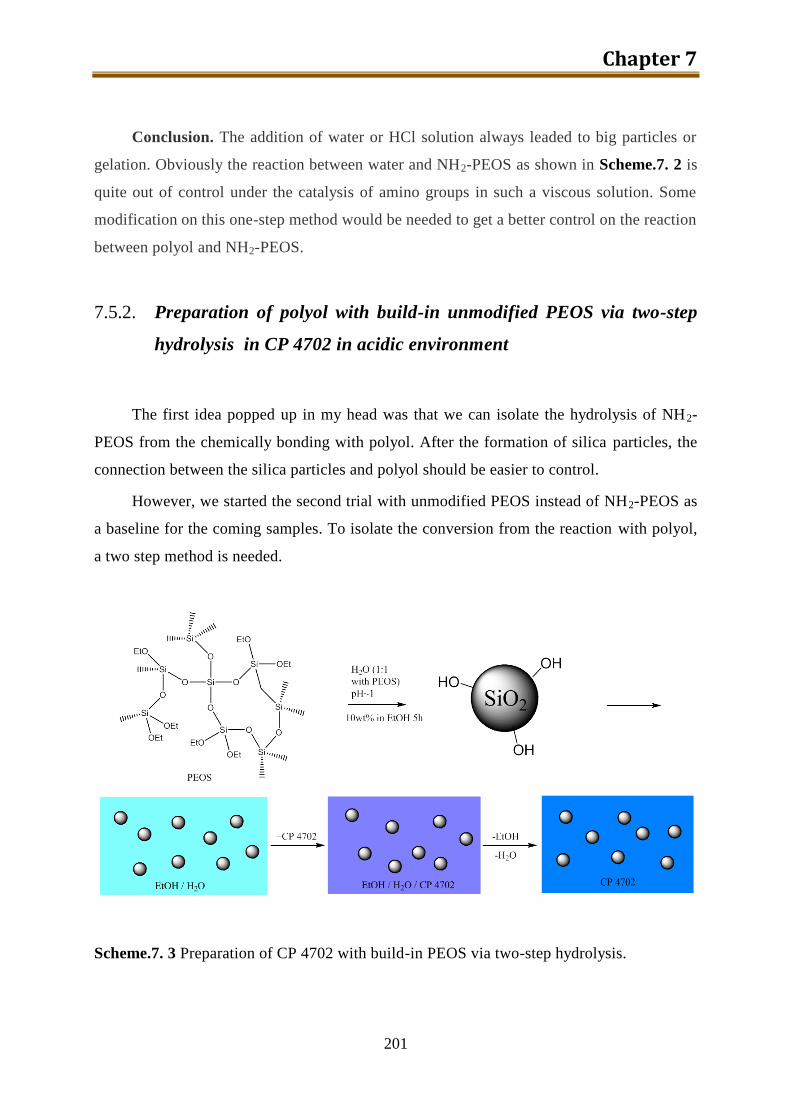
Chapter 7
201
Conclusion. The addition of water or HCl solution always leaded to big particles or
gelation. Obviously the reaction between water and NH2-PEOS as shown in Scheme.7. 2 is
quite out of control under the catalysis of amino groups in such a viscous solution. Some
modification on this one-step method would be needed to get a better control on the reaction
between polyol and NH2-PEOS.
7.5.2. Preparation of polyol with build-in unmodified PEOS via two-step
hydrolysis in CP 4702 in acidic environment
The first idea popped up in my head was that we can isolate the hydrolysis of NH2-
PEOS from the chemically bonding with polyol. After the formation of silica particles, the
connection between the silica particles and polyol should be easier to control.
However, we started the second trial with unmodified PEOS instead of NH2-PEOS as
a baseline for the coming samples. To isolate the conversion from the reaction with polyol,
a two step method is needed.
Scheme.7. 3 Preparation of CP 4702 with build-in PEOS via two-step hydrolysis.
Application of PEOS in the flexible polyurethane foams.
202
Process. The first step in this method is the hydrolysis which was carried on in
ethanol as solvent. After unmodified PEOS was dissolved in ethanol with a weight
concentration of 10 wt%, hydrochloric acid aqueous solution with pH=1 was added into the
mixture and the weight ratio between water in HCl solution and the PEOS was kept as 1:1
to confirm the accomplishing of hydrolysis. The hydrolysis was done under magnetic
stirring for 5 hours under room temperature. Then CP 4702 was added into the mixture. The
weight content of PEOS in CP 4702 varied from 2 wt% to 10 wt%. After homogenization of
the mixture using magnetic stirrer, ethanol, water and HCl were removed using rotor
evaporator followed with higher vacuum (10-2
mbar) and a series of viscous transparent
liquid were obtained.
The morphology of the resulting particles were detected by transmission electron
microscopy (TEM) analysis that was conducted on a Zeiss-Libra 120 microscope operating
at 100 kV in the bright-field mode.
Hydrodynamic diameters of the resulting particles were measured with the Zetasizer
Nano Series (Malvern Instruments) with NIBS (non-invasive back-scatter) technology at a
scattering angle of 173°.
Result and discussion. The dimension of the final particles should be detected using
TEM. Since the viscosity of the final blends is quite high, we diluted them with pure ethanol
and then coated it on the small copper grids which would be analyzed. However, during the
observation via TEM, all the particles are aggregated and covered by a liquid layer and no
individual particle can be observed. Considering the good miscibility between si lica
particles surrounded by polyol chains and the polyol matrix, it is quite understandable. No
TEM images of this series of samples were recorded.
Zetasizer was also applied to detect the dimension of the resulting particles in the
mixture and no valid results were observed due to the existence of big aggregation.
The influence of the resulting particles to the thermal stability of the polyol matrix
attracted our interests greatly. TGA under both nitrogen and air were applied to detect the
thermal stability of the mixture.Polyol CP 4702 was used as a reference. The TGA results of
CP 4702 with different amount of PEOS doped under nitrogen with 10k/min heating rate are
shown in Figure 7. 11. Quite in line with our results about the iPP / PEOS composites
shown in chapter 04, the thermal stability of the CP 4702 is only slightly influenced by
adding of PEOS. With the adding of 2 wt% PEOS in the CP 4702 by 2 step hydrolysis, the
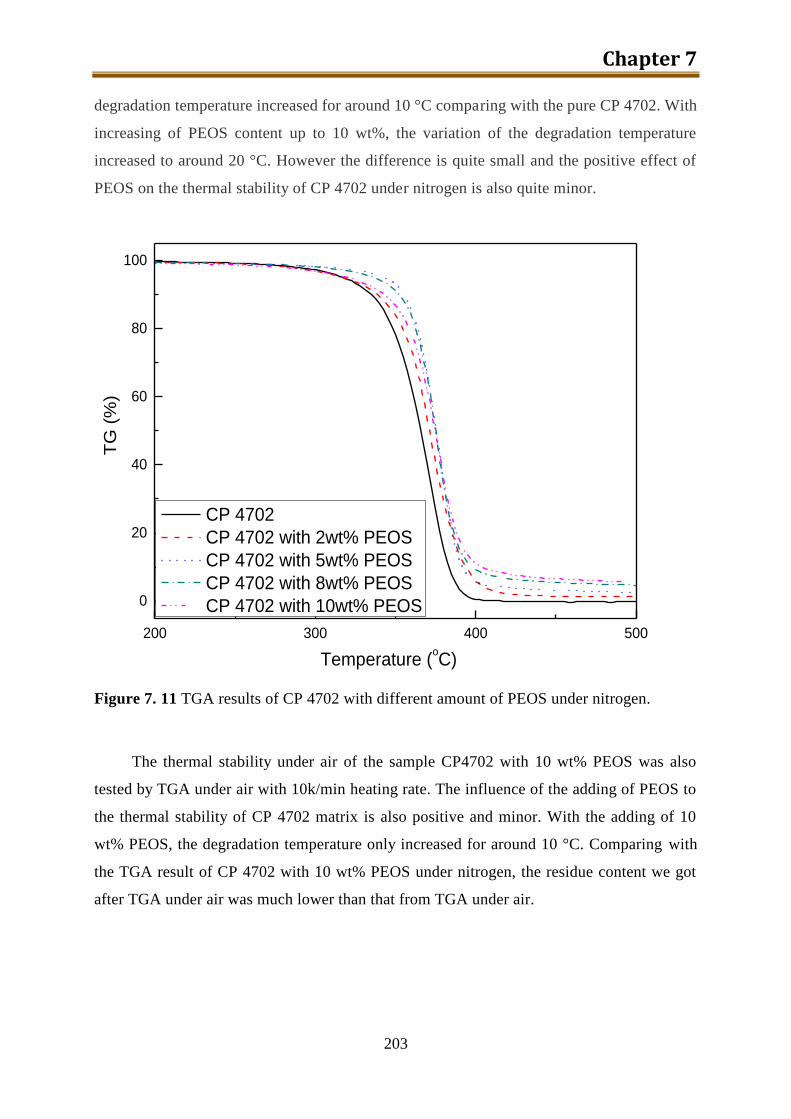
Chapter 7
203
degradation temperature increased for around 10 °C comparing with the pure CP 4702. With
increasing of PEOS content up to 10 wt%, the variation of the degradation temperature
increased to around 20 °C. However the difference is quite small and the positive effect of
PEOS on the thermal stability of CP 4702 under nitrogen is also quite minor.
200 300 400 500
0
20
40
60
80
100
TG
(%
)
Temperature (oC)
CP 4702
CP 4702 with 2wt% PEOS
CP 4702 with 5wt% PEOS
CP 4702 with 8wt% PEOS
CP 4702 with 10wt% PEOS
Figure 7. 11 TGA results of CP 4702 with different amount of PEOS under nitrogen.
The thermal stability under air of the sample CP4702 with 10 wt% PEOS was also
tested by TGA under air with 10k/min heating rate. The influence of the adding of PEOS to
the thermal stability of CP 4702 matrix is also positive and minor. With the adding of 10
wt% PEOS, the degradation temperature only increased for around 10 °C. Comparing with
the TGA result of CP 4702 with 10 wt% PEOS under nitrogen, the residue content we got
after TGA under air was much lower than that from TGA under air.
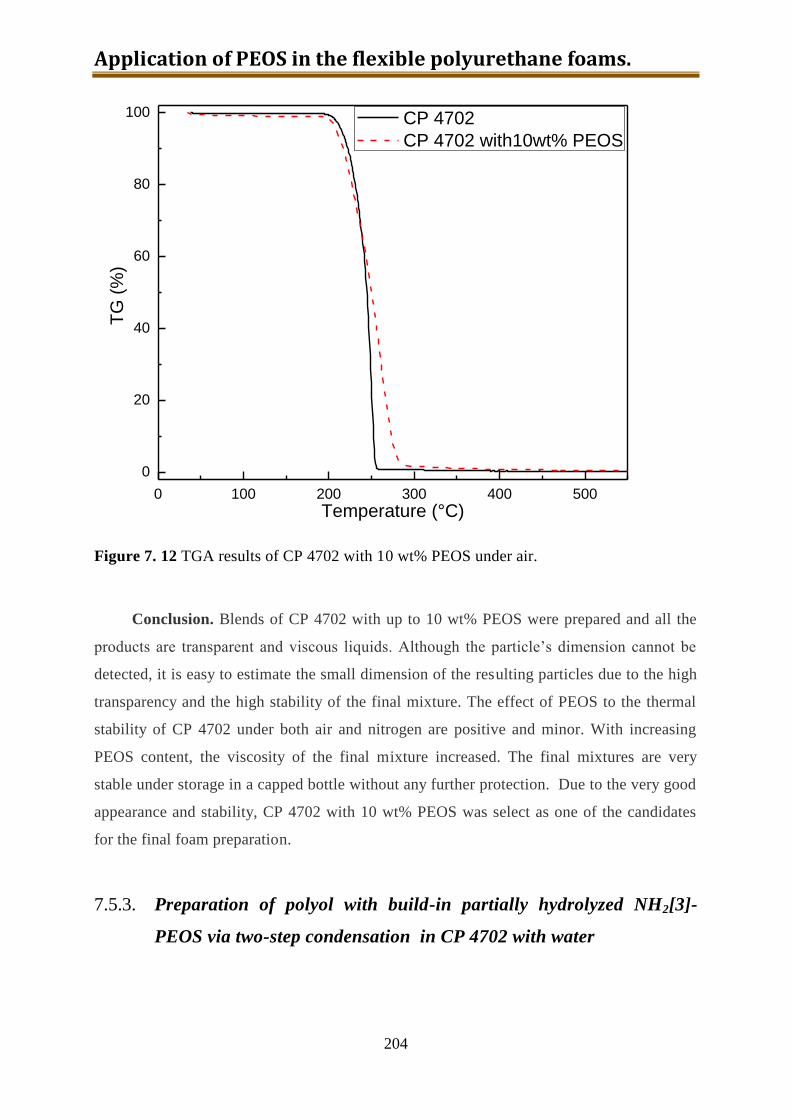
Application of PEOS in the flexible polyurethane foams.
204
0 100 200 300 400 500
0
20
40
60
80
100
TG
(%
)
Temperature (°C)
CP 4702
CP 4702 with10wt% PEOS
Figure 7. 12 TGA results of CP 4702 with 10 wt% PEOS under air.
Conclusion. Blends of CP 4702 with up to 10 wt% PEOS were prepared and all the
products are transparent and viscous liquids. Although the particle’s dimension cannot be
detected, it is easy to estimate the small dimension of the resulting particles due to the high
transparency and the high stability of the final mixture. The effect of PEOS to the thermal
stability of CP 4702 under both air and nitrogen are positive and minor. With increasing
PEOS content, the viscosity of the final mixture increased. The final mixtures are very
stable under storage in a capped bottle without any further protection. Due to the very good
appearance and stability, CP 4702 with 10 wt% PEOS was select as one of the candidates
for the final foam preparation.
7.5.3. Preparation of polyol with build-in partially hydrolyzed NH2[3]-
PEOS via two-step condensation in CP 4702 with water
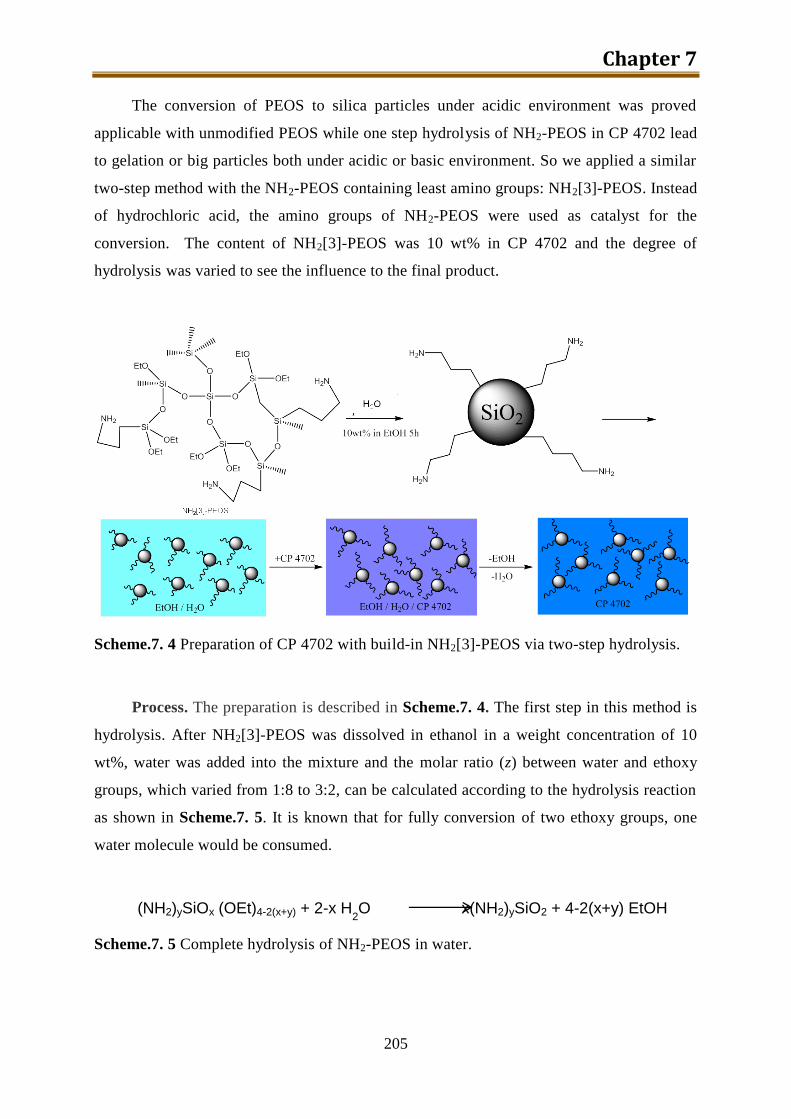
Chapter 7
205
The conversion of PEOS to silica particles under acidic environment was proved
applicable with unmodified PEOS while one step hydrolysis of NH2-PEOS in CP 4702 lead
to gelation or big particles both under acidic or basic environment. So we applied a similar
two-step method with the NH2-PEOS containing least amino groups: NH2[3]-PEOS. Instead
of hydrochloric acid, the amino groups of NH2-PEOS were used as catalyst for the
conversion. The content of NH2[3]-PEOS was 10 wt% in CP 4702 and the degree of
hydrolysis was varied to see the influence to the final product.
Scheme.7. 4 Preparation of CP 4702 with build-in NH2[3]-PEOS via two-step hydrolysis.
Process. The preparation is described in Scheme.7. 4. The first step in this method is
hydrolysis. After NH2[3]-PEOS was dissolved in ethanol in a weight concentration of 10
wt%, water was added into the mixture and the molar ratio (z) between water and ethoxy
groups, which varied from 1:8 to 3:2, can be calculated according to the hydrolysis reaction
as shown in Scheme.7. 5. It is known that for fully conversion of two ethoxy groups, one
water molecule would be consumed.
(NH2)ySiOx (OEt)4-2(x+y) + 2-x H2O x(NH2)ySiO2 + 4-2(x+y) EtOH
Scheme.7. 5 Complete hydrolysis of NH2-PEOS in water.
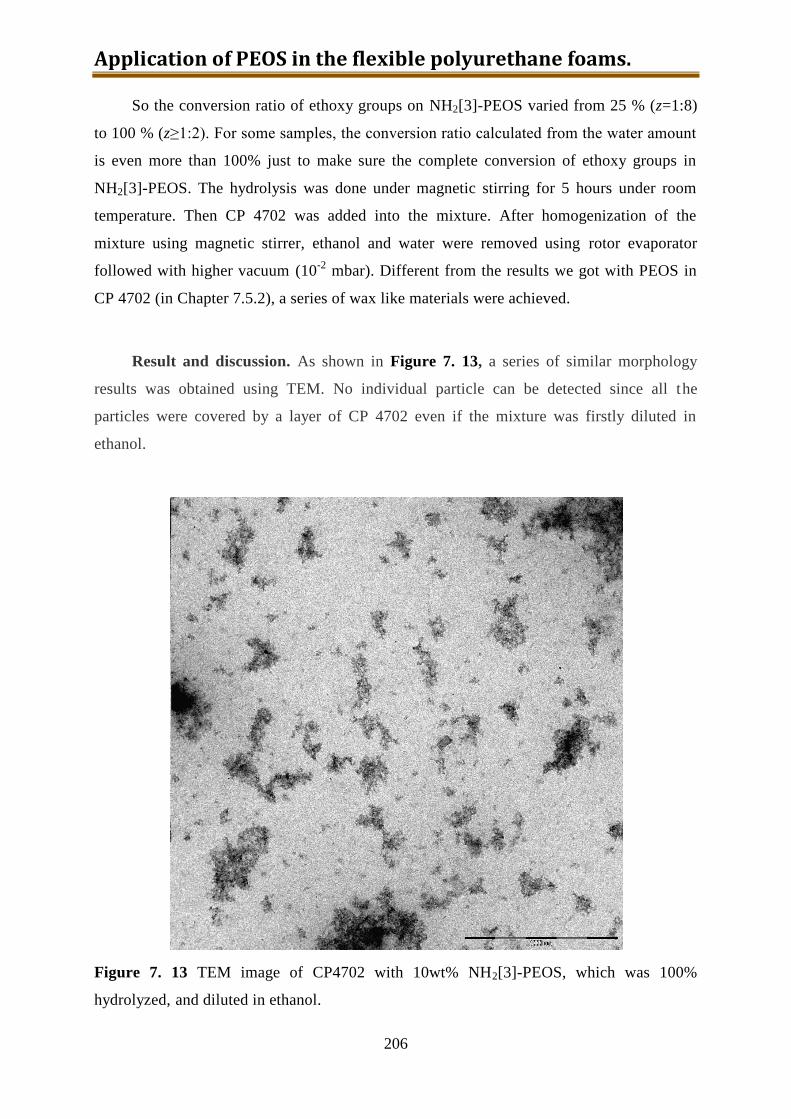
Application of PEOS in the flexible polyurethane foams.
206
So the conversion ratio of ethoxy groups on NH2[3]-PEOS varied from 25 % (z=1:8)
to 100 % (z≥1:2). For some samples, the conversion ratio calculated from the water amount
is even more than 100% just to make sure the complete conversion of ethoxy groups in
NH2[3]-PEOS. The hydrolysis was done under magnetic stirring for 5 hours under room
temperature. Then CP 4702 was added into the mixture. After homogenization of the
mixture using magnetic stirrer, ethanol and water were removed using rotor evaporator
followed with higher vacuum (10-2
mbar). Different from the results we got with PEOS in
CP 4702 (in Chapter 7.5.2), a series of wax like materials were achieved.
Result and discussion. As shown in Figure 7. 13, a series of similar morphology
results was obtained using TEM. No individual particle can be detected since all the
particles were covered by a layer of CP 4702 even if the mixture was firstly diluted in
ethanol.
Figure 7. 13 TEM image of CP4702 with 10wt% NH2[3]-PEOS, which was 100%
hydrolyzed, and diluted in ethanol.
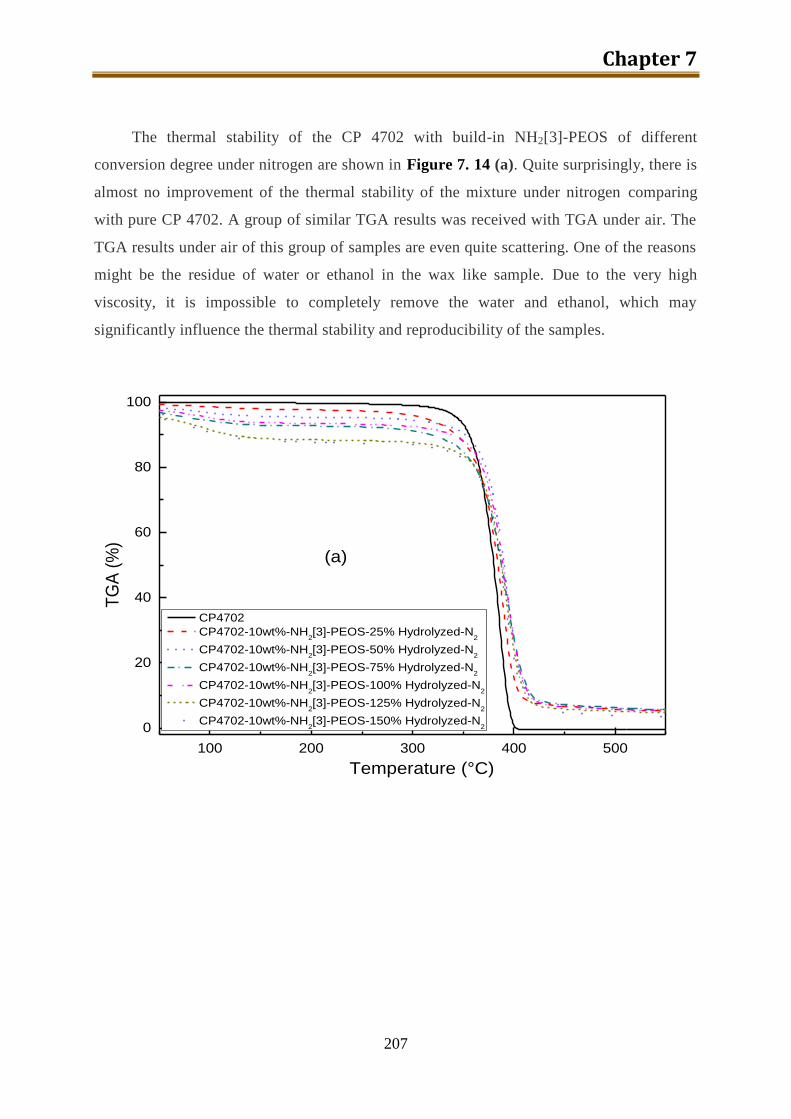
Chapter 7
207
The thermal stability of the CP 4702 with build-in NH2[3]-PEOS of different
conversion degree under nitrogen are shown in Figure 7. 14 (a). Quite surprisingly, there is
almost no improvement of the thermal stability of the mixture under nitrogen comparing
with pure CP 4702. A group of similar TGA results was received with TGA under air. The
TGA results under air of this group of samples are even quite scattering. One of the reasons
might be the residue of water or ethanol in the wax like sample. Due to the very high
viscosity, it is impossible to completely remove the water and ethanol, which may
significantly influence the thermal stability and reproducibility of the samples.
100 200 300 400 500
0
20
40
60
80
100
Temperature (°C)
TG
A (
%)
CP4702
CP4702-10wt%-NH2[3]-PEOS-25% Hydrolyzed-N
2
CP4702-10wt%-NH2[3]-PEOS-50% Hydrolyzed-N
2
CP4702-10wt%-NH2[3]-PEOS-75% Hydrolyzed-N
2
CP4702-10wt%-NH2[3]-PEOS-100% Hydrolyzed-N
2
CP4702-10wt%-NH2[3]-PEOS-125% Hydrolyzed-N
2
CP4702-10wt%-NH2[3]-PEOS-150% Hydrolyzed-N
2
(a)
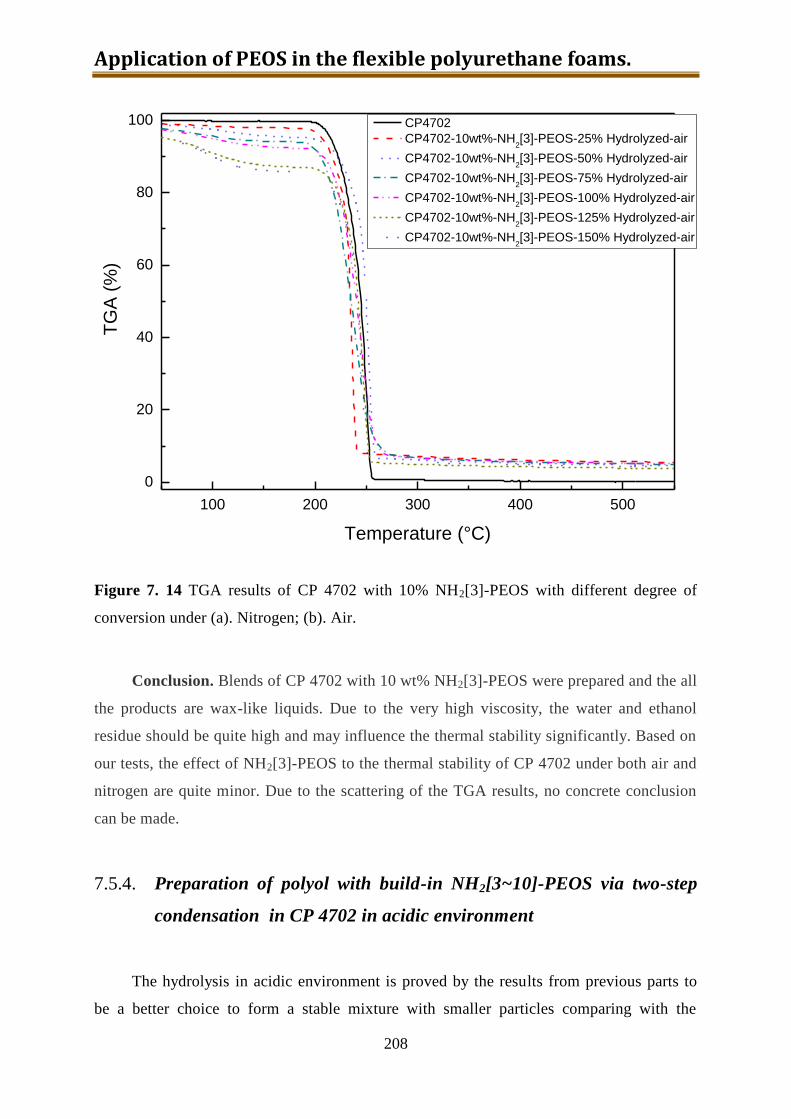
Application of PEOS in the flexible polyurethane foams.
208
100 200 300 400 500
0
20
40
60
80
100
TG
A (
%)
Temperature (°C)
CP4702
CP4702-10wt%-NH2[3]-PEOS-25% Hydrolyzed-air
CP4702-10wt%-NH2[3]-PEOS-50% Hydrolyzed-air
CP4702-10wt%-NH2[3]-PEOS-75% Hydrolyzed-air
CP4702-10wt%-NH2[3]-PEOS-100% Hydrolyzed-air
CP4702-10wt%-NH2[3]-PEOS-125% Hydrolyzed-air
CP4702-10wt%-NH2[3]-PEOS-150% Hydrolyzed-air
Figure 7. 14 TGA results of CP 4702 with 10% NH2[3]-PEOS with different degree of
conversion under (a). Nitrogen; (b). Air.
Conclusion. Blends of CP 4702 with 10 wt% NH2[3]-PEOS were prepared and the all
the products are wax-like liquids. Due to the very high viscosity, the water and ethanol
residue should be quite high and may influence the thermal stability significantly. Based on
our tests, the effect of NH2[3]-PEOS to the thermal stability of CP 4702 under both air and
nitrogen are quite minor. Due to the scattering of the TGA results, no concrete conclusion
can be made.
7.5.4. Preparation of polyol with build-in NH2[3~10]-PEOS via two-step
condensation in CP 4702 in acidic environment
The hydrolysis in acidic environment is proved by the results from previous parts to
be a better choice to form a stable mixture with smaller particles comparing with the
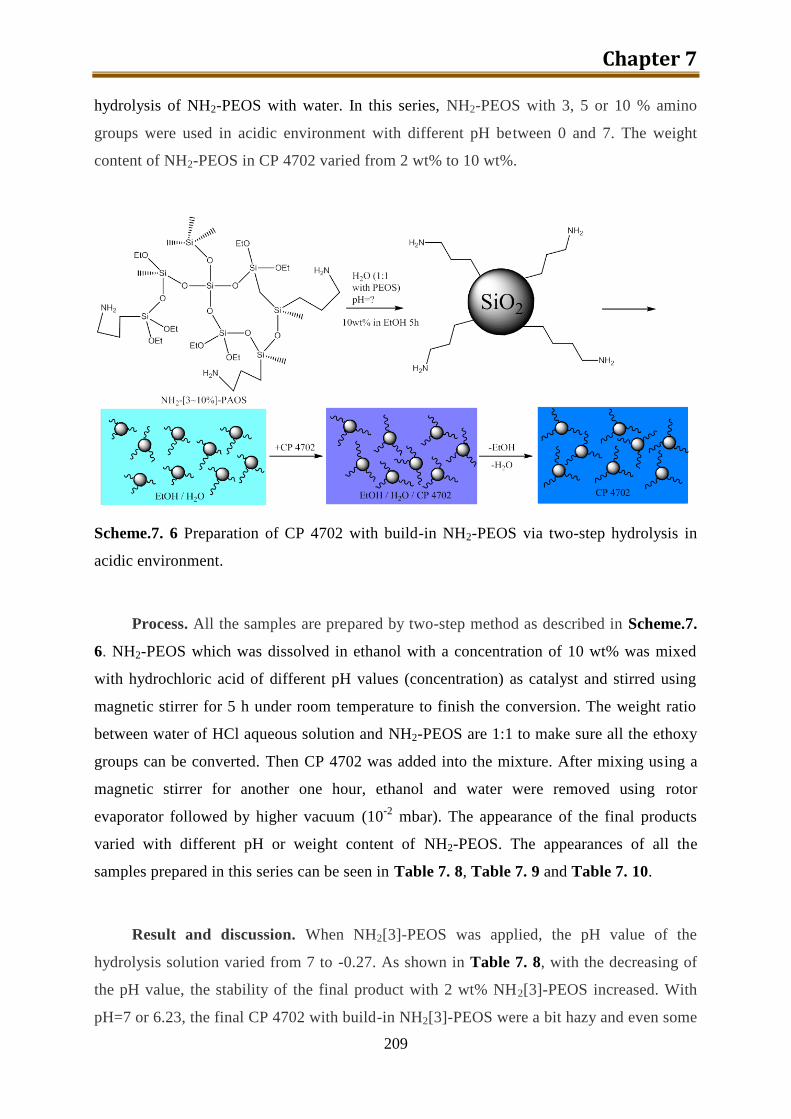
Chapter 7
209
hydrolysis of NH2-PEOS with water. In this series, NH2-PEOS with 3, 5 or 10 % amino
groups were used in acidic environment with different pH between 0 and 7. The weight
content of NH2-PEOS in CP 4702 varied from 2 wt% to 10 wt%.
Scheme.7. 6 Preparation of CP 4702 with build-in NH2-PEOS via two-step hydrolysis in
acidic environment.
Process. All the samples are prepared by two-step method as described in Scheme.7.
6. NH2-PEOS which was dissolved in ethanol with a concentration of 10 wt% was mixed
with hydrochloric acid of different pH values (concentration) as catalyst and stirred using
magnetic stirrer for 5 h under room temperature to finish the conversion. The weight ratio
between water of HCl aqueous solution and NH2-PEOS are 1:1 to make sure all the ethoxy
groups can be converted. Then CP 4702 was added into the mixture. After mixing using a
magnetic stirrer for another one hour, ethanol and water were removed using rotor
evaporator followed by higher vacuum (10-2
mbar). The appearance of the final products
varied with different pH or weight content of NH2-PEOS. The appearances of all the
samples prepared in this series can be seen in Table 7. 8, Table 7. 9 and Table 7. 10.
Result and discussion. When NH2[3]-PEOS was applied, the pH value of the
hydrolysis solution varied from 7 to -0.27. As shown in Table 7. 8, with the decreasing of
the pH value, the stability of the final product with 2 wt% NH2[3]-PEOS increased. With
pH=7 or 6.23, the final CP 4702 with build-in NH2[3]-PEOS were a bit hazy and even some
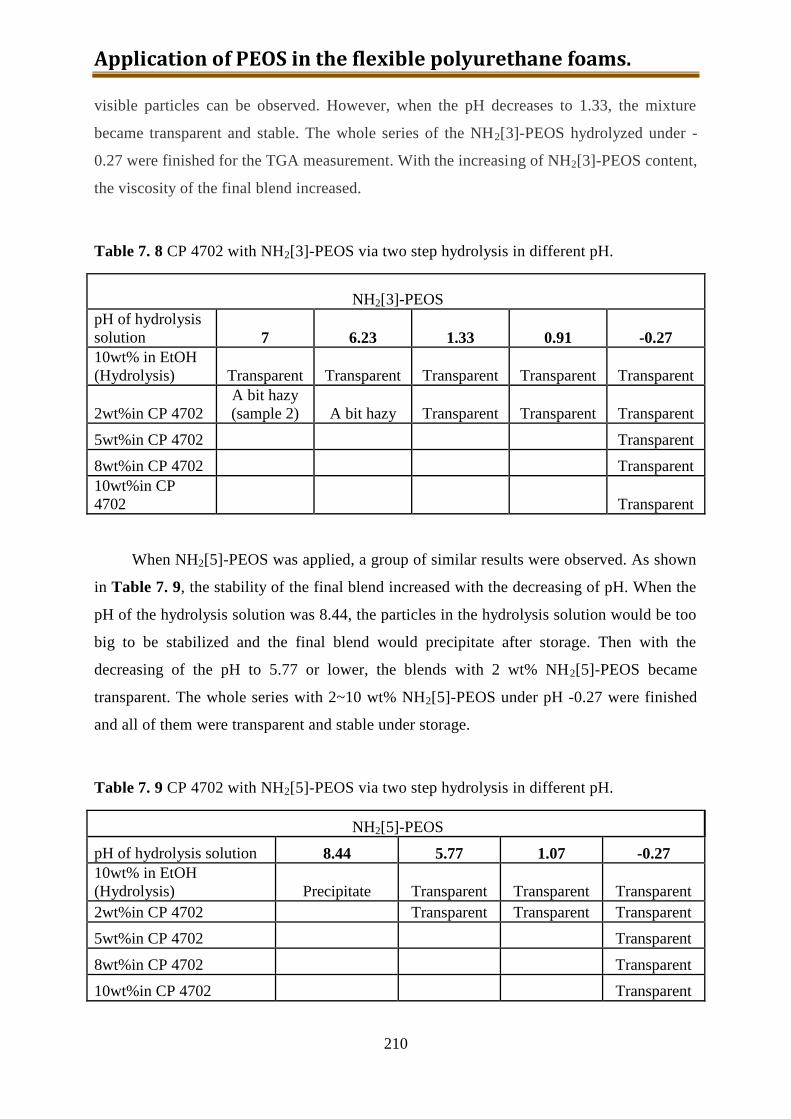
Application of PEOS in the flexible polyurethane foams.
210
visible particles can be observed. However, when the pH decreases to 1.33, the mixture
became transparent and stable. The whole series of the NH2[3]-PEOS hydrolyzed under -
0.27 were finished for the TGA measurement. With the increasing of NH2[3]-PEOS content,
the viscosity of the final blend increased.
Table 7. 8 CP 4702 with NH2[3]-PEOS via two step hydrolysis in different pH.
NH2[3]-PEOS
pH of hydrolysis
solution 7 6.23 1.33 0.91 -0.27
10wt% in EtOH
(Hydrolysis) Transparent Transparent Transparent Transparent Transparent
2wt%in CP 4702
A bit hazy
(sample 2) A bit hazy Transparent Transparent Transparent
5wt%in CP 4702 Transparent
8wt%in CP 4702 Transparent
10wt%in CP
4702 Transparent
When NH2[5]-PEOS was applied, a group of similar results were observed. As shown
in Table 7. 9, the stability of the final blend increased with the decreasing of pH. When the
pH of the hydrolysis solution was 8.44, the particles in the hydrolysis solution would be too
big to be stabilized and the final blend would precipitate after storage. Then with the
decreasing of the pH to 5.77 or lower, the blends with 2 wt% NH2[5]-PEOS became
transparent. The whole series with 2~10 wt% NH2[5]-PEOS under pH -0.27 were finished
and all of them were transparent and stable under storage.
Table 7. 9 CP 4702 with NH2[5]-PEOS via two step hydrolysis in different pH.
NH2[5]-PEOS
pH of hydrolysis solution 8.44 5.77 1.07 -0.27
10wt% in EtOH
(Hydrolysis) Precipitate Transparent Transparent Transparent
2wt%in CP 4702 Transparent Transparent Transparent
5wt%in CP 4702 Transparent
8wt%in CP 4702 Transparent
10wt%in CP 4702 Transparent
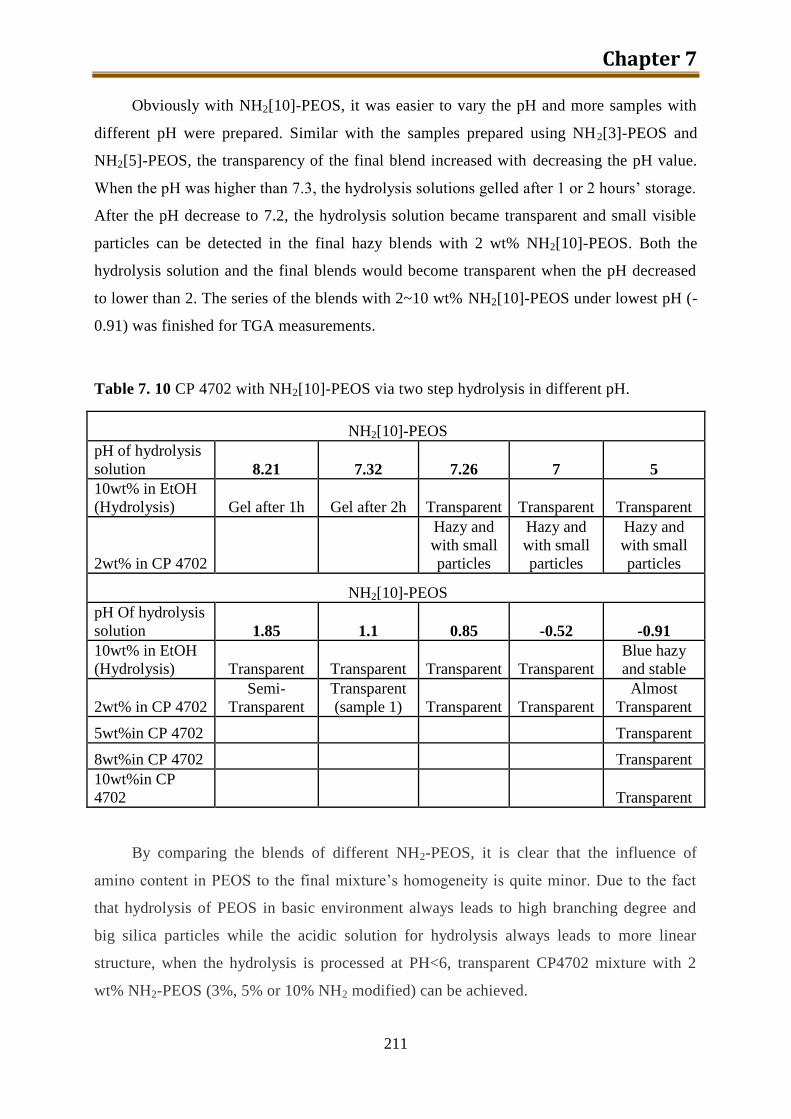
Chapter 7
211
Obviously with NH2[10]-PEOS, it was easier to vary the pH and more samples with
different pH were prepared. Similar with the samples prepared using NH2[3]-PEOS and
NH2[5]-PEOS, the transparency of the final blend increased with decreasing the pH value.
When the pH was higher than 7.3, the hydrolysis solutions gelled after 1 or 2 hours’ storage.
After the pH decrease to 7.2, the hydrolysis solution became transparent and small visible
particles can be detected in the final hazy blends with 2 wt% NH2[10]-PEOS. Both the
hydrolysis solution and the final blends would become transparent when the pH decreased
to lower than 2. The series of the blends with 2~10 wt% NH2[10]-PEOS under lowest pH (-
0.91) was finished for TGA measurements.
Table 7. 10 CP 4702 with NH2[10]-PEOS via two step hydrolysis in different pH.
NH2[10]-PEOS
pH of hydrolysis
solution 8.21 7.32 7.26 7 5
10wt% in EtOH
(Hydrolysis) Gel after 1h Gel after 2h Transparent Transparent Transparent
2wt% in CP 4702
Hazy and
with small
particles
Hazy and
with small
particles
Hazy and
with small
particles
NH2[10]-PEOS
pH Of hydrolysis
solution 1.85 1.1 0.85 -0.52 -0.91
10wt% in EtOH
(Hydrolysis) Transparent Transparent Transparent Transparent
Blue hazy
and stable
2wt% in CP 4702
Semi-
Transparent
Transparent
(sample 1) Transparent Transparent
Almost
Transparent
5wt%in CP 4702 Transparent
8wt%in CP 4702 Transparent
10wt%in CP
4702 Transparent
By comparing the blends of different NH2-PEOS, it is clear that the influence of
amino content in PEOS to the final mixture’s homogeneity is quite minor. Due to the fact
that hydrolysis of PEOS in basic environment always leads to high branching degree and
big silica particles while the acidic solution for hydrolysis always leads to more linear
structure, when the hydrolysis is processed at PH<6, transparent CP4702 mixture with 2
wt% NH2-PEOS (3%, 5% or 10% NH2 modified) can be achieved.
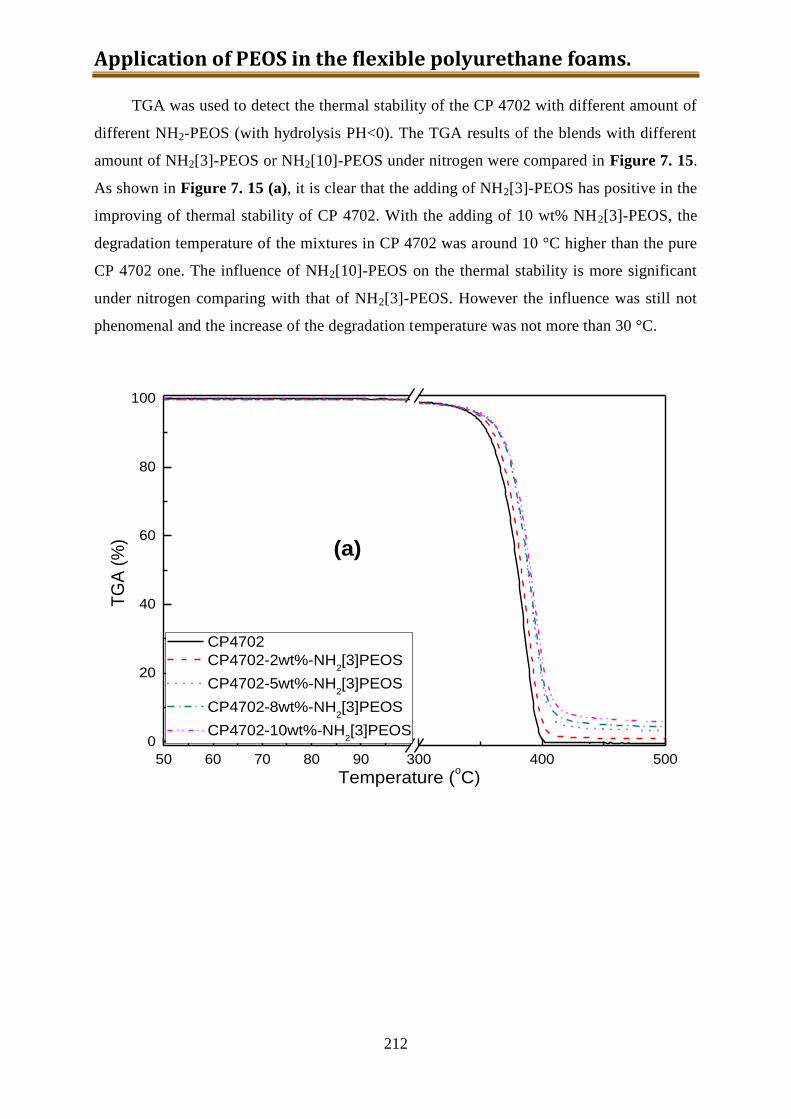
Application of PEOS in the flexible polyurethane foams.
212
TGA was used to detect the thermal stability of the CP 4702 with different amount of
different NH2-PEOS (with hydrolysis PH<0). The TGA results of the blends with different
amount of NH2[3]-PEOS or NH2[10]-PEOS under nitrogen were compared in Figure 7. 15.
As shown in Figure 7. 15 (a), it is clear that the adding of NH2[3]-PEOS has positive in the
improving of thermal stability of CP 4702. With the adding of 10 wt% NH2[3]-PEOS, the
degradation temperature of the mixtures in CP 4702 was around 10 °C higher than the pure
CP 4702 one. The influence of NH2[10]-PEOS on the thermal stability is more significant
under nitrogen comparing with that of NH2[3]-PEOS. However the influence was still not
phenomenal and the increase of the degradation temperature was not more than 30 °C.
50 60 70 80 90 300 400 500
0
20
40
60
80
100
TG
A (
%)
Temperature (oC)
CP4702
CP4702-2wt%-NH2[3]PEOS
CP4702-5wt%-NH2[3]PEOS
CP4702-8wt%-NH2[3]PEOS
CP4702-10wt%-NH2[3]PEOS
(a)
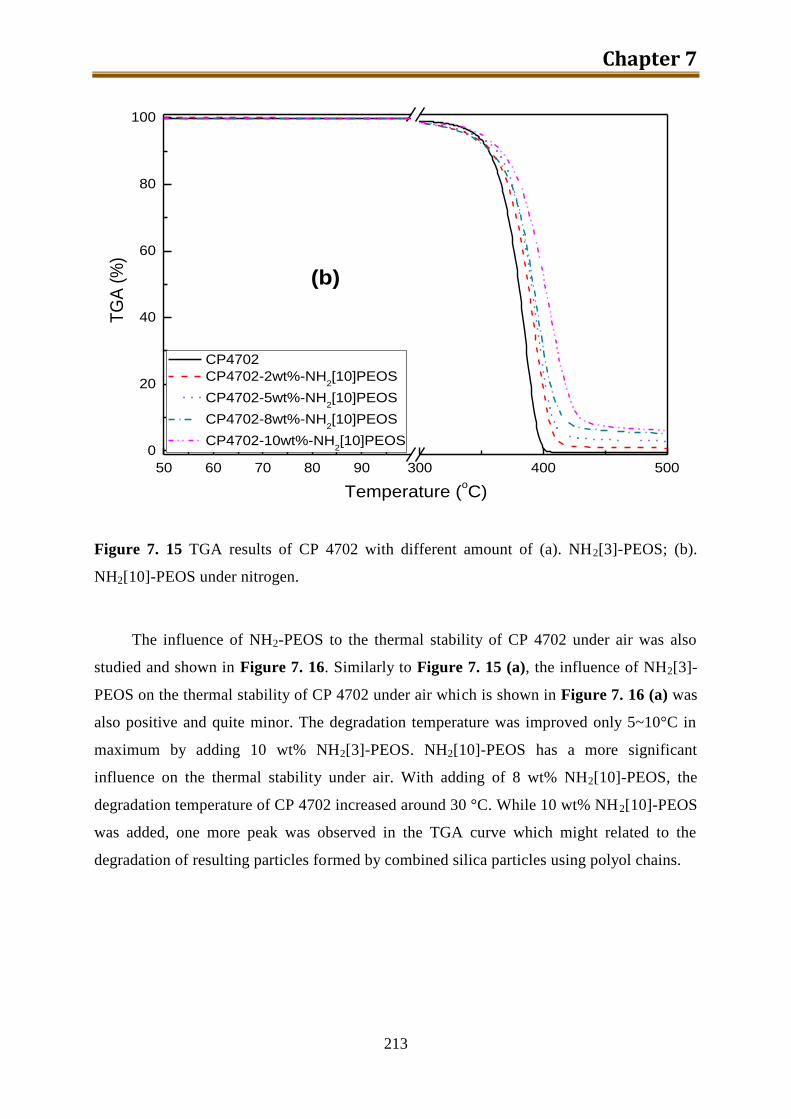
Chapter 7
213
50 60 70 80 90 300 400 500
0
20
40
60
80
100T
GA
(%
)
Temperature (oC)
CP4702
CP4702-2wt%-NH2[10]PEOS
CP4702-5wt%-NH2[10]PEOS
CP4702-8wt%-NH2[10]PEOS
CP4702-10wt%-NH2[10]PEOS
(b)
Figure 7. 15 TGA results of CP 4702 with different amount of (a). NH2[3]-PEOS; (b).
NH2[10]-PEOS under nitrogen.
The influence of NH2-PEOS to the thermal stability of CP 4702 under air was also
studied and shown in Figure 7. 16. Similarly to Figure 7. 15 (a), the influence of NH2[3]-
PEOS on the thermal stability of CP 4702 under air which is shown in Figure 7. 16 (a) was
also positive and quite minor. The degradation temperature was improved only 5~10°C in
maximum by adding 10 wt% NH2[3]-PEOS. NH2[10]-PEOS has a more significant
influence on the thermal stability under air. With adding of 8 wt% NH2[10]-PEOS, the
degradation temperature of CP 4702 increased around 30 °C. While 10 wt% NH2[10]-PEOS
was added, one more peak was observed in the TGA curve which might related to the
degradation of resulting particles formed by combined silica particles using polyol chains.
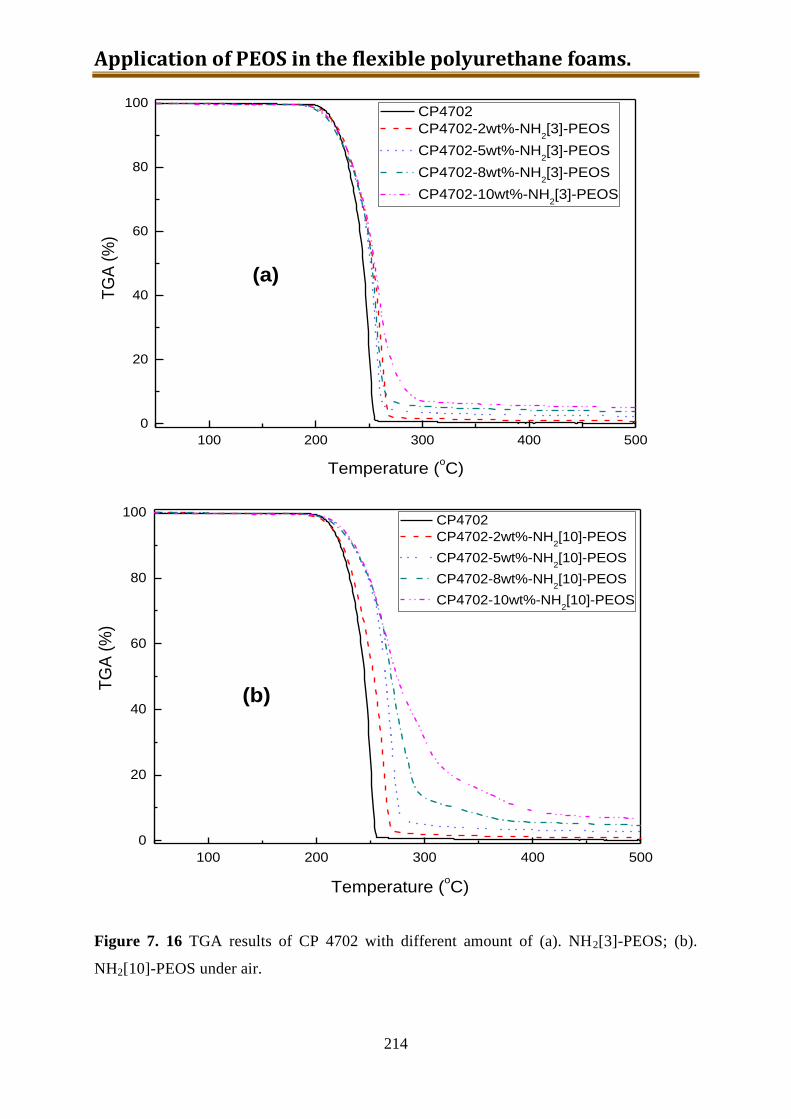
Application of PEOS in the flexible polyurethane foams.
214
100 200 300 400 500
0
20
40
60
80
100
TG
A (
%)
Temperature (oC)
CP4702
CP4702-2wt%-NH2[3]-PEOS
CP4702-5wt%-NH2[3]-PEOS
CP4702-8wt%-NH2[3]-PEOS
CP4702-10wt%-NH2[3]-PEOS
(a)
100 200 300 400 500
0
20
40
60
80
100
Temperature (oC)
TG
A (
%)
CP4702
CP4702-2wt%-NH2[10]-PEOS
CP4702-5wt%-NH2[10]-PEOS
CP4702-8wt%-NH2[10]-PEOS
CP4702-10wt%-NH2[10]-PEOS
(b)
Figure 7. 16 TGA results of CP 4702 with different amount of (a). NH2[3]-PEOS; (b).
NH2[10]-PEOS under air.
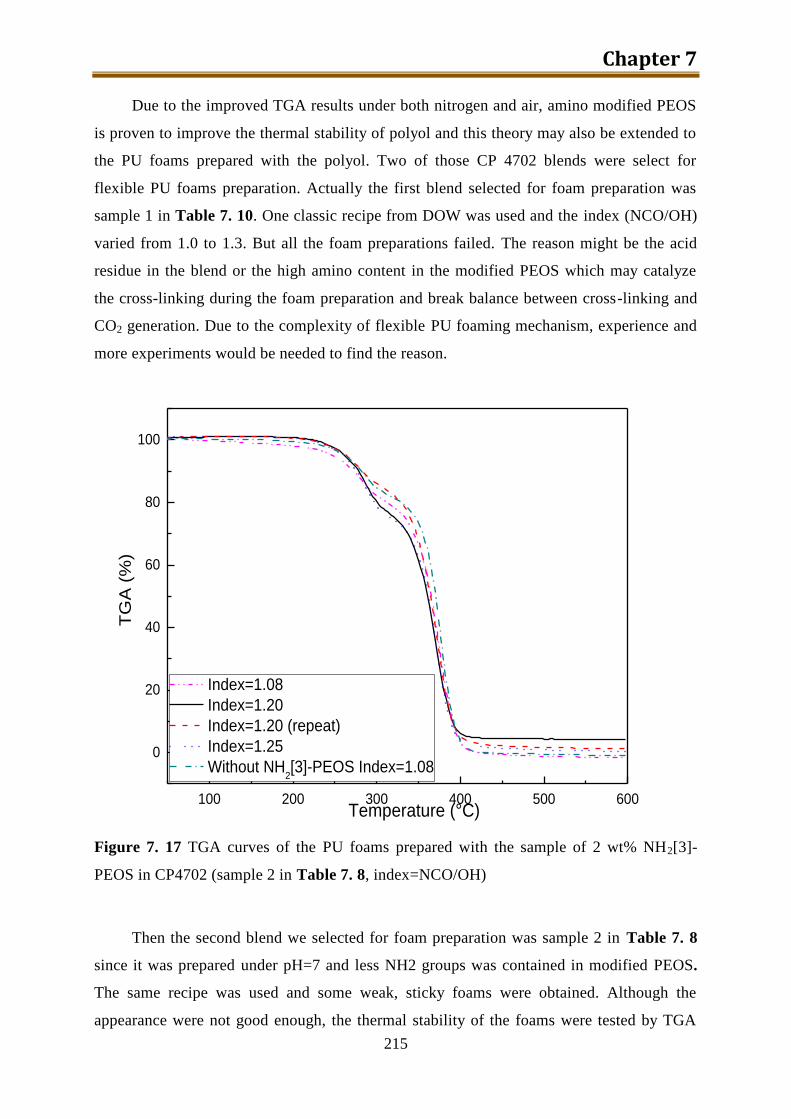
Chapter 7
215
Due to the improved TGA results under both nitrogen and air, amino modified PEOS
is proven to improve the thermal stability of polyol and this theory may also be extended to
the PU foams prepared with the polyol. Two of those CP 4702 blends were select for
flexible PU foams preparation. Actually the first blend selected for foam preparation was
sample 1 in Table 7. 10. One classic recipe from DOW was used and the index (NCO/OH)
varied from 1.0 to 1.3. But all the foam preparations failed. The reason might be the acid
residue in the blend or the high amino content in the modified PEOS which may catalyze
the cross-linking during the foam preparation and break balance between cross-linking and
CO2 generation. Due to the complexity of flexible PU foaming mechanism, experience and
more experiments would be needed to find the reason.
100 200 300 400 500 600
0
20
40
60
80
100
Index=1.08
Index=1.20
Index=1.20 (repeat)
Index=1.25
Without NH2[3]-PEOS Index=1.08
TG
A (
%)
Temperature (°C)
Figure 7. 17 TGA curves of the PU foams prepared with the sample of 2 wt% NH2[3]-
PEOS in CP4702 (sample 2 in Table 7. 8, index=NCO/OH)
Then the second blend we selected for foam preparation was sample 2 in Table 7. 8
since it was prepared under pH=7 and less NH2 groups was contained in modified PEOS.
The same recipe was used and some weak, sticky foams were obtained. Although the
appearance were not good enough, the thermal stability of the foams were tested by TGA
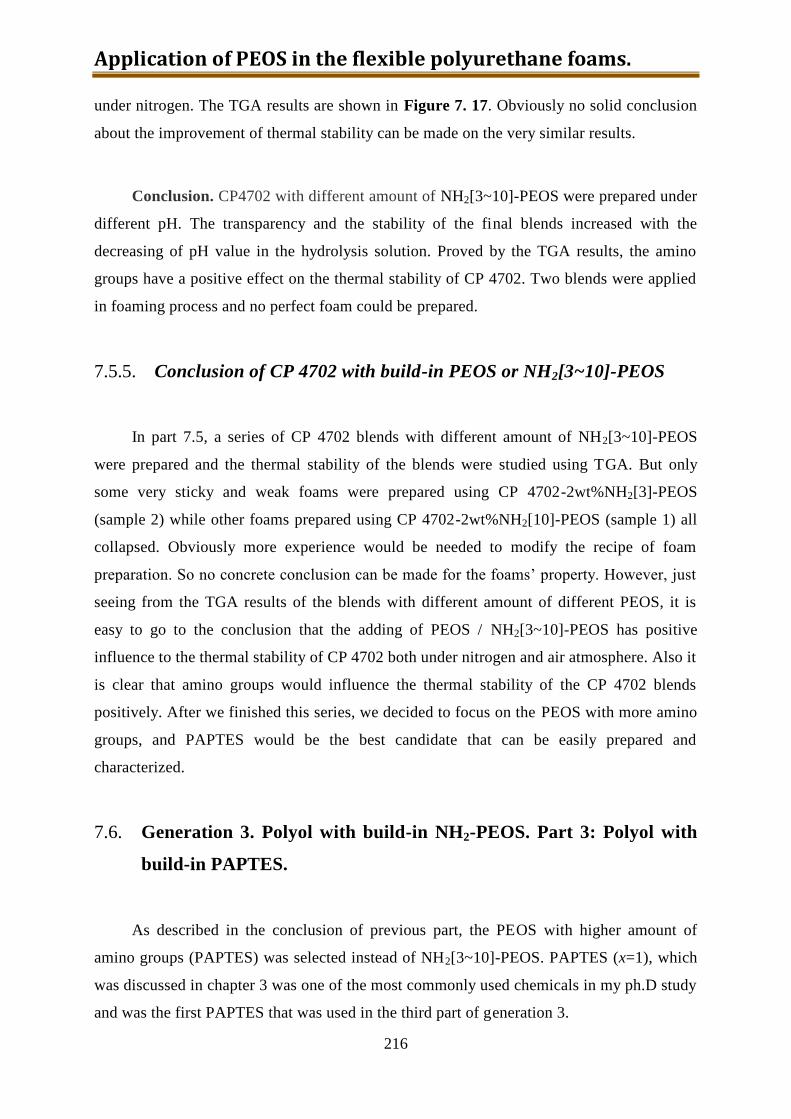
Application of PEOS in the flexible polyurethane foams.
216
under nitrogen. The TGA results are shown in Figure 7. 17. Obviously no solid conclusion
about the improvement of thermal stability can be made on the very similar results.
Conclusion. CP4702 with different amount of NH2[3~10]-PEOS were prepared under
different pH. The transparency and the stability of the final blends increased with the
decreasing of pH value in the hydrolysis solution. Proved by the TGA results, the amino
groups have a positive effect on the thermal stability of CP 4702. Two blends were applied
in foaming process and no perfect foam could be prepared.
7.5.5. Conclusion of CP 4702 with build-in PEOS or NH2[3~10]-PEOS
In part 7.5, a series of CP 4702 blends with different amount of NH2[3~10]-PEOS
were prepared and the thermal stability of the blends were studied using TGA. But only
some very sticky and weak foams were prepared using CP 4702-2wt%NH2[3]-PEOS
(sample 2) while other foams prepared using CP 4702-2wt%NH2[10]-PEOS (sample 1) all
collapsed. Obviously more experience would be needed to modify the recipe of foam
preparation. So no concrete conclusion can be made for the foams’ property. However, just
seeing from the TGA results of the blends with different amount of different PEOS, it is
easy to go to the conclusion that the adding of PEOS / NH2[3~10]-PEOS has positive
influence to the thermal stability of CP 4702 both under nitrogen and air atmosphere. Also it
is clear that amino groups would influence the thermal stability of the CP 4702 blends
positively. After we finished this series, we decided to focus on the PEOS with more amino
groups, and PAPTES would be the best candidate that can be easily prepared and
characterized.
7.6. Generation 3. Polyol with build-in NH2-PEOS. Part 3: Polyol with
build-in PAPTES.
As described in the conclusion of previous part, the PEOS with higher amount of
amino groups (PAPTES) was selected instead of NH2[3~10]-PEOS. PAPTES (x=1), which
was discussed in chapter 3 was one of the most commonly used chemicals in my ph.D study
and was the first PAPTES that was used in the third part of generation 3.
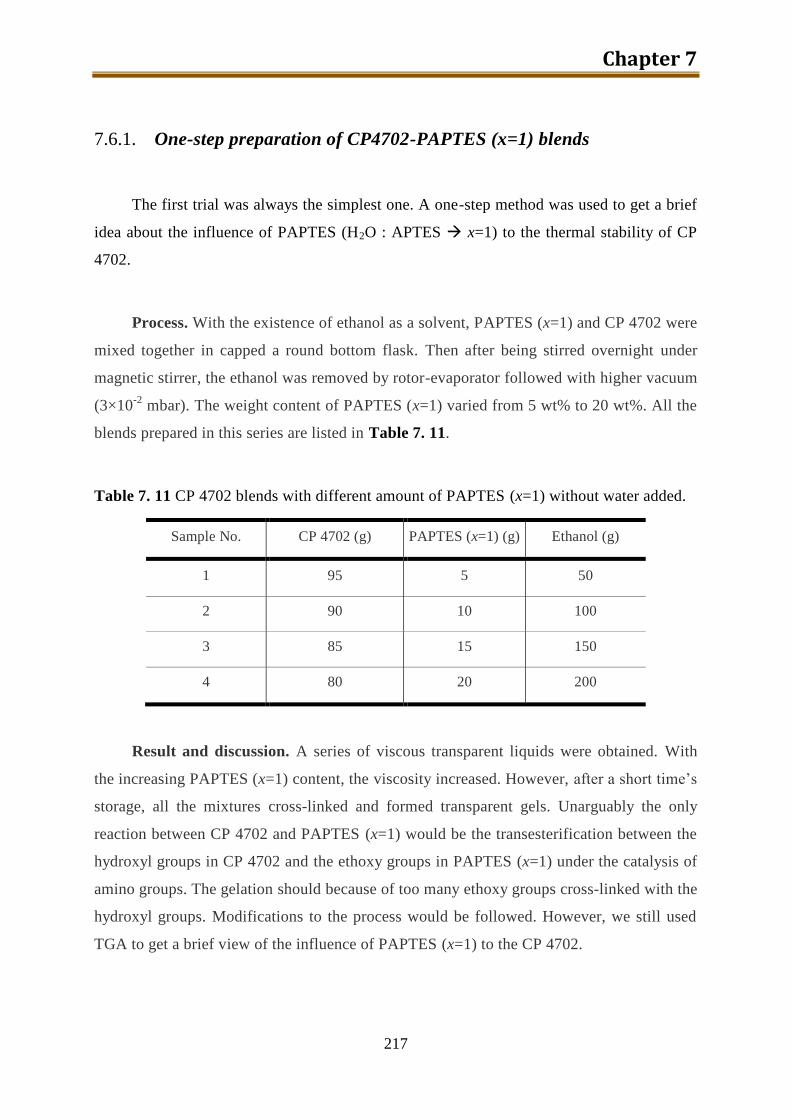
Chapter 7
217
7.6.1. One-step preparation of CP4702-PAPTES (x=1) blends
The first trial was always the simplest one. A one-step method was used to get a brief
idea about the influence of PAPTES (H2O : APTES x=1) to the thermal stability of CP
4702.
Process. With the existence of ethanol as a solvent, PAPTES (x=1) and CP 4702 were
mixed together in capped a round bottom flask. Then after being stirred overnight under
magnetic stirrer, the ethanol was removed by rotor-evaporator followed with higher vacuum
(3×10⁻²
mbar). The weight content of PAPTES (x=1) varied from 5 wt% to 20 wt%. All the
blends prepared in this series are listed in Table 7. 11.
Table 7. 11 CP 4702 blends with different amount of PAPTES (x=1) without water added.
Sample No. CP 4702 (g) PAPTES (x=1) (g) Ethanol (g)
1 95 5 50
2 90 10 100
3 85 15 150
4 80 20 200
Result and discussion. A series of viscous transparent liquids were obtained. With
the increasing PAPTES (x=1) content, the viscosity increased. However, after a short time’s
storage, all the mixtures cross-linked and formed transparent gels. Unarguably the only
reaction between CP 4702 and PAPTES (x=1) would be the transesterification between the
hydroxyl groups in CP 4702 and the ethoxy groups in PAPTES (x=1) under the catalysis of
amino groups. The gelation should because of too many ethoxy groups cross-linked with the
hydroxyl groups. Modifications to the process would be followed. However, we still used
TGA to get a brief view of the influence of PAPTES (x=1) to the CP 4702.
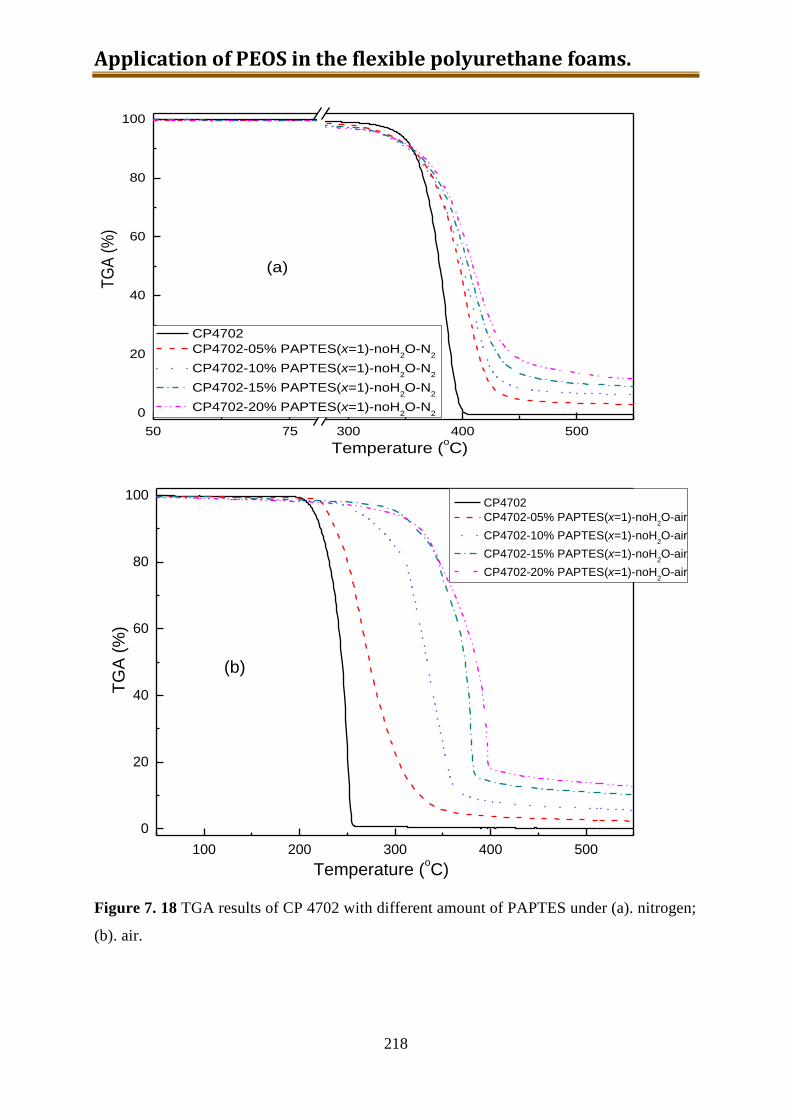
Application of PEOS in the flexible polyurethane foams.
218
50 75 300 400 500
0
20
40
60
80
100
Temperature (oC)
TG
A (
%)
CP4702
CP4702-05% PAPTES(x=1)-noH2O-N
2
CP4702-10% PAPTES(x=1)-noH2O-N
2
CP4702-15% PAPTES(x=1)-noH2O-N
2
CP4702-20% PAPTES(x=1)-noH2O-N
22
(a)
100 200 300 400 500
0
20
40
60
80
100
Temperature (oC)
TG
A (
%)
CP4702
CP4702-05% PAPTES(x=1)-noH2O-air
CP4702-10% PAPTES(x=1)-noH2O-air
CP4702-15% PAPTES(x=1)-noH2O-air
CP4702-20% PAPTES(x=1)-noH2O-air
(b)
Figure 7. 18 TGA results of CP 4702 with different amount of PAPTES under (a). nitrogen;
(b). air.

Chapter 7
219
The TGA results of CP 4702 with different amount of PAPTES (x=1) are shown in
Figure 7. 18. Quite similar with the results we got with NH2[3~10]-PEOS, PAPTES (x=1)
has positive influence on the thermal stability of CP 4702 under nitrogen. With the
increasing of PAPTES (x=1) content, the degradation temperature increased. With the
amount of PAPTES up to 20 wt%, the increase of the degradation temperature (at 50wt%
weight loss) could be around 30 °C. However, the TGA results under air atmosphere that is
shown in Figure 7. 18 (b) is quite impressive. Whenever 5 wt% PAPTES (x=1) was added,
the degradation temperature at 50 wt% weight loss increased around 30 °C and in maximum
150 °C higher degradation temperature was achieved with CP 4702 with 20 wt% PAPTES
(x=1). Comparing with the results we achieved with NH2[3~10]-PEOS, the huge difference
should be raised by the higher amino content.
Conclusion. CP 4702 with 5~20 wt% PAPTES (x=1) were prepared. Both the
viscosity and the thermal stability of those transparent blends increased with the increasing
of the PAPTES (x=1) content. However, the storability of those blends is not good and they
would cross-link after short time storage. Since the reaction between hydroxyl groups and
ethoxy groups should be the reason of cross-linking, modification on the process would be
done to reduce the amount of ethoxy groups in PAPTES and to reduce the cross-linking at
the same time.
7.6.2. One-step preparation of CP4702-PAPTES (x=1) blends with adding
of water (1:1 with PAPTES in wt) to remove the ethoxy groups
As we have discussed in the last part, we need to reduce the amount of ethoxy groups
in PAPTES (x=1) to reduce the cross-linking and increase the storability of the final blends
with CP 4702. Obviously, the best candidate to remove ethoxy groups is water, which can
react with ethoxy groups nicely under the catalysis of amino groups and be removed easily.
Process. PolyAPTES (x=1), ethanol and CP 4702 were mixed together in a capped
round bottom flask. After the whole mixture was homogenized and transparent, water in the
same amount by weight as PAPTES (x=1) was added and the mixture was stirred overnight
in the fume hood. Then ethanol and the water residues were removed by rotor-evaporator
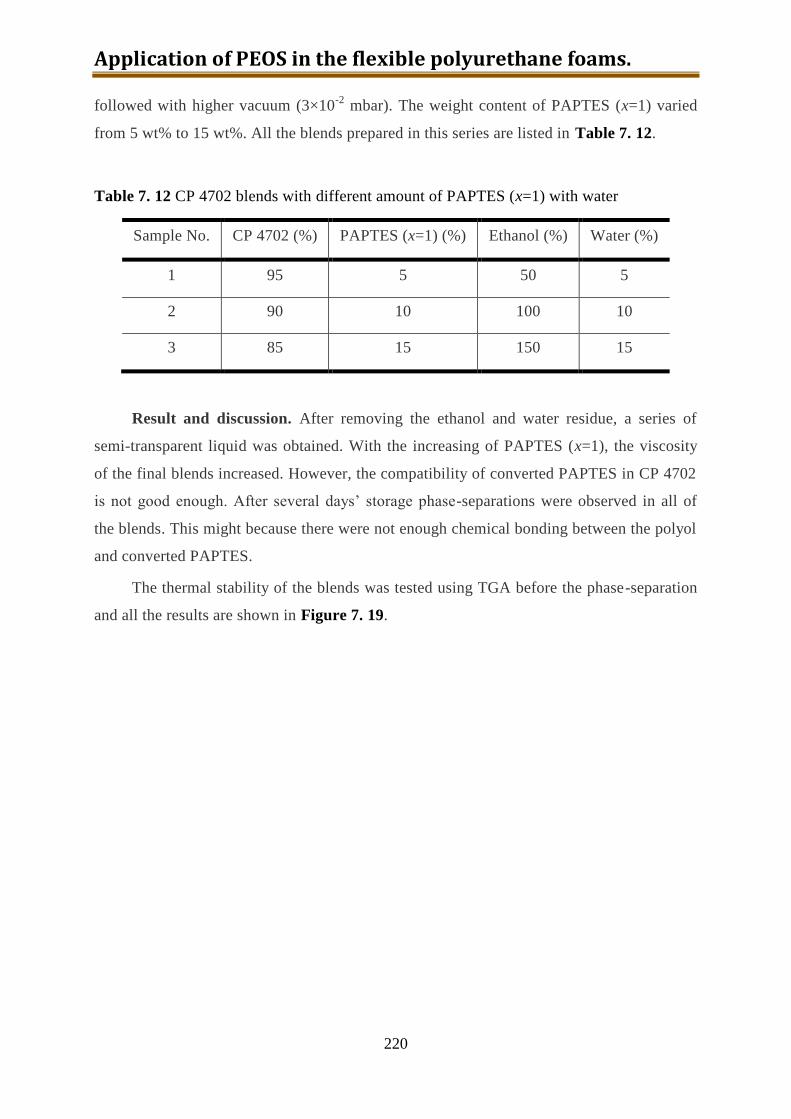
Application of PEOS in the flexible polyurethane foams.
220
followed with higher vacuum (3×10⁻²
mbar). The weight content of PAPTES (x=1) varied
from 5 wt% to 15 wt%. All the blends prepared in this series are listed in Table 7. 12.
Table 7. 12 CP 4702 blends with different amount of PAPTES (x=1) with water
Sample No. CP 4702 (%) PAPTES (x=1) (%) Ethanol (%) Water (%)
1 95 5 50 5
2 90 10 100 10
3 85 15 150 15
Result and discussion. After removing the ethanol and water residue, a series of
semi-transparent liquid was obtained. With the increasing of PAPTES (x=1), the viscosity
of the final blends increased. However, the compatibility of converted PAPTES in CP 4702
is not good enough. After several days’ storage phase-separations were observed in all of
the blends. This might because there were not enough chemical bonding between the polyol
and converted PAPTES.
The thermal stability of the blends was tested using TGA before the phase-separation
and all the results are shown in Figure 7. 19.
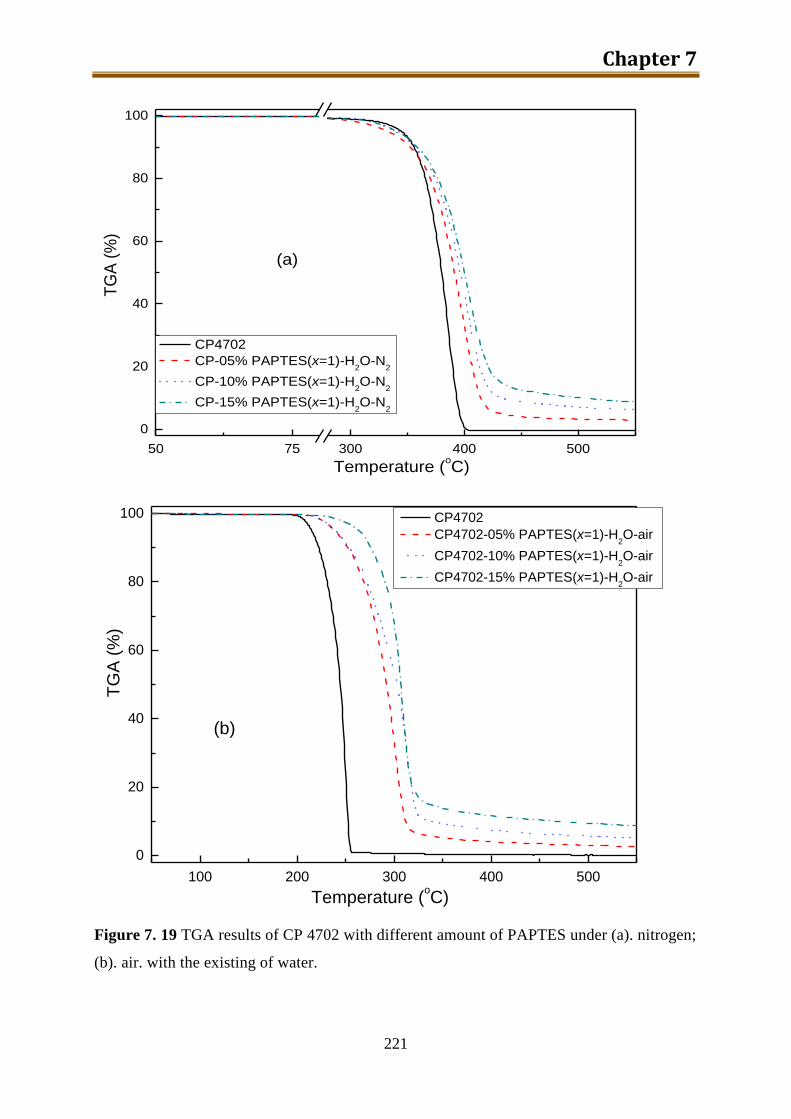
Chapter 7
221
50 75 300 400 500
0
20
40
60
80
100
Temperature (oC)
TG
A (
%)
CP4702
CP-05% PAPTES(x=1)-H2O-N
2
CP-10% PAPTES(x=1)-H2O-N
2
CP-15% PAPTES(x=1)-H2O-N
22
(a)
100 200 300 400 500
0
20
40
60
80
100
Temperature (oC)
TG
A (
%)
CP4702
CP4702-05% PAPTES(x=1)-H2O-air
CP4702-10% PAPTES(x=1)-H2O-air
CP4702-15% PAPTES(x=1)-H2O-airir
(b)
Figure 7. 19 TGA results of CP 4702 with different amount of PAPTES under (a). nitrogen;
(b). air. with the existing of water.
Application of PEOS in the flexible polyurethane foams.
222
The thermal stability of the blends under nitrogen is shown in Figure 7. 19 (a). It has
a similar trend comparing with previous results. The converted PAPTES can slightly
improve the thermal stability of CP 4702 under nitrogen. However, in Figure 7. 19 (b) we
found a different trend. With the adding of first 5 wt% PAPTES (x=1) and conversion by
water, the degradation temperature increases for more than 50 °C which is quite in line with
previous results. However, when 10 or 15 wt% PAPTES (x=1) was added, the degradation
temperature didn’t show too much variation comparing with the CP 4702 with 5 wt%
PAPTES (x=1). In conclusion, the connection between the converted PAPTES and polyol
are one of the most important factor that influence the thermal stability of the final blends.
Conclusion. CP 4702 with 5~15 wt% PAPTES (x=1) that was hydrolyzed using water
were prepared. Both the viscosity and the thermal stability of those transparent blends
increased with the increasing of the PAPTES (x=1) content. However, the storability of
those blends is not good and they would phase-separate after short time storage. The very
limited chemical connection between the hydrolyzed PAPTES (x=1) with pure water and
CP 4702 should be the only reason for that. The TGA results proved that the chemical
connection between them would also influence the thermal stability of the CP 4702
significantly.
7.6.3. Preparation of CP4702-PAPTES (x=1) blends with a better
connection
Shown in the previous two parts, either too much connection (cross-link) or too
limited connection (phase-separation) between the PAPTES (x=1) and CP 4702 are not
preferred in the preparation of a stable blend. So we have done a series of work by varying
the process to prepare a stable CP 4702 blend containing at least 20 wt% PAPTES (x=1).
Process. PolyAPTES (x=1) was still used in this part of work and other process
conditions were varied to get a blend with “better” connection between the PAPTES (x=1)
and CP 4702. The weight content of PAPTES (x=1) varied from 20 to 30 and the ratio
between ethoxy groups after being removed by adding water and hydroxyl groups from CP

Chapter 7
223
4702 in the final blends varied from 1:0,37 to 1:4 by varying the water content. All the
samples were listed in Table 7. 13.
Table 7. 13 Blends prepared using CP 4702 with PAPTES (x=1) in different conditions
Sample No. CP 4702 (g) PAPTES (x=1) (g) Ethanol (g) H2O Temperature (°C) EtO:OH
1 95 5 - No 80 1:1.77
2 80 20 - No 80 1:0.37
3 80 20 - Yes 80 1:2
4 80 20 200 Yes 80 1:2
5 80 20 200 Yes 80 1:4
6 75 25 250 Yes 80 1:2
7 70 30 300 Yes 80 1:2
Result and discussion. We started the first trial with just a small modification based
on the one-step method we described in Chapter 7.6.1. Polyol CP 4702 for flexible PU
foams and 5 wt% PAPTES (x=1) were mixed in a round bottom flask without any solvent at
80 °C. After removing the ethanol residue generated by the transesterification of hydroxyl
groups and ethoxy groups, a transparent and very viscous liquid was obtained. This blend
can be stored for a long time without cross-linking. After calculation, the ratio between
ethoxy groups and hydroxyl groups is 1:1.77. However, a higher weight content of PAPTES
(x=1) would be preferred.
In the second trial, we increased the weight content of PAPTES (x=1) up to 20 wt%
and all the other conditions stayed unchanged. After removing the formed ethanol, a
transparent viscous liquid was obtained. However, this liquid gelled after several days’
storage. It is quite easy to get the ratio of ethoxy to hydroxyl groups, which equals to 1:037
by calculation and obviously this would be one of the most important factor which influence
the storability of the blends.
Based on the recipe of the second trial, we introduced a certain amount of water in the
mixture under stirring to remove the ethoxy groups and keep the ratio between ethoxy and
hydroxyl groups equals to 1:2. After removing the water / ethanol residue, a wax like liquid
was obtained. The appearance was not good enough for application as a additive in the PU
foam preparation However, the resulting liquid was very stable under storage and very
homogeneous. Concerning the independence of ethanol, this product might be preferred in
the industry production. We decided to put this blend in our foaming list.
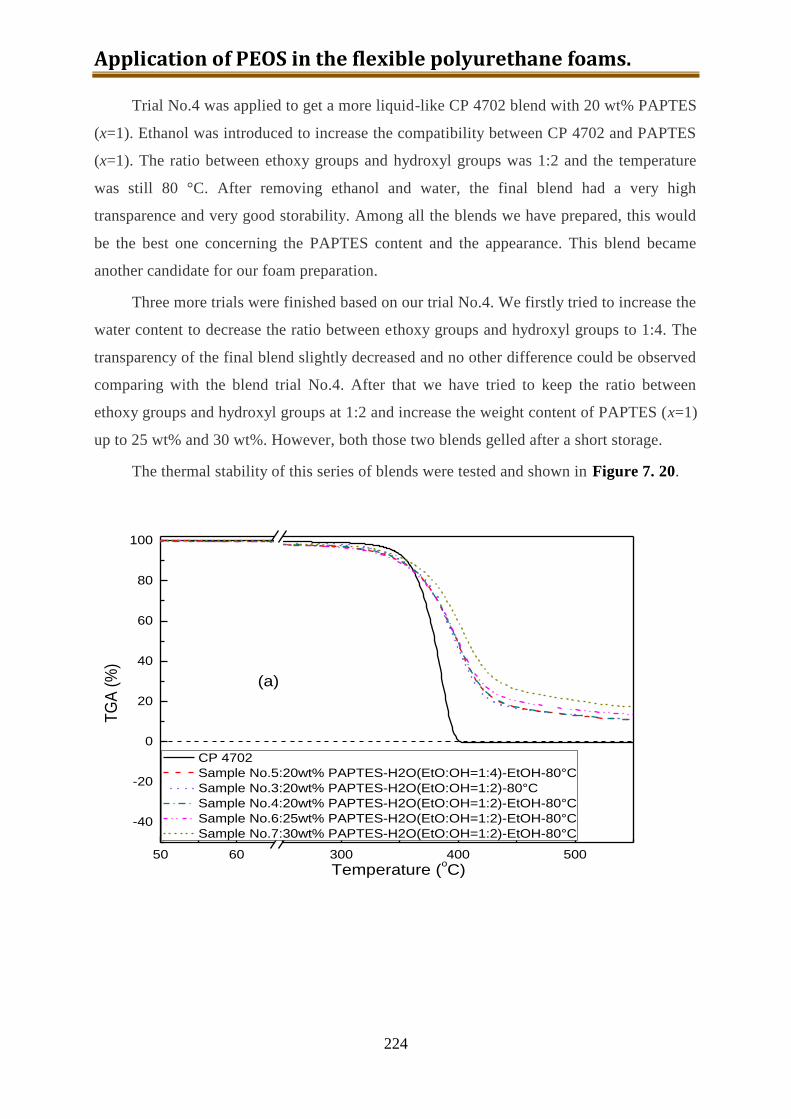
Application of PEOS in the flexible polyurethane foams.
224
Trial No.4 was applied to get a more liquid-like CP 4702 blend with 20 wt% PAPTES
(x=1). Ethanol was introduced to increase the compatibility between CP 4702 and PAPTES
(x=1). The ratio between ethoxy groups and hydroxyl groups was 1:2 and the temperature
was still 80 °C. After removing ethanol and water, the final blend had a very high
transparence and very good storability. Among all the blends we have prepared, this would
be the best one concerning the PAPTES content and the appearance. This blend became
another candidate for our foam preparation.
Three more trials were finished based on our trial No.4. We firstly tried to increase the
water content to decrease the ratio between ethoxy groups and hydroxyl groups to 1:4. The
transparency of the final blend slightly decreased and no other difference could be observed
comparing with the blend trial No.4. After that we have tried to keep the ratio between
ethoxy groups and hydroxyl groups at 1:2 and increase the weight content of PAPTES (x=1)
up to 25 wt% and 30 wt%. However, both those two blends gelled after a short storage.
The thermal stability of this series of blends were tested and shown in Figure 7. 20.
50 60 300 400 500
-40
-20
0
20
40
60
80
100
Temperature (oC)
TG
A (
%)
CP 4702
Sample No.5:20wt% PAPTES-H2O(EtO:OH=1:4)-EtOH-80°C
Sample No.3:20wt% PAPTES-H2O(EtO:OH=1:2)-80°C
Sample No.4:20wt% PAPTES-H2O(EtO:OH=1:2)-EtOH-80°C
Sample No.6:25wt% PAPTES-H2O(EtO:OH=1:2)-EtOH-80°C
Sample No.7:30wt% PAPTES-H2O(EtO:OH=1:2)-EtOH-80°C
(a)

Chapter 7
225
100 200 300 400 500
-40
-20
0
20
40
60
80
100
Temperature (oC)
TG
A (
%)
CP4702
Sample No.2:20wt% PAPTES-80°C
Sample No.3:20wt% PAPTES-H2O(EtO:OH=1:2)-80°C
Sample No.4:20wt% PAPTES-H2O(EtO:OH=1:2)-EtOH-80°C
Sample No.6:25wt% PAPTES-H2O(EtO:OH=1:2)-EtOH-80°C
Sample No.7:30wtAPTES-H2O(EtO:OH=1:2)-EtOH-80°C
(b)
Figure 7. 20 TGA results of the blends prepared using CP 4702 with PAPTES (x=1) in
different conditions under (a). nitrogen; (b). air.
Seeing the TGA results under nitrogen, the influence of PAPTES (x=1) to the thermal
stability under nitrogen is always minor and positive. On the other hand, there is almost no
influence of the different process condition to the degradation curve of the final blends.
Then the TGA results under air double confirmed this theory. The TGA curve of sample
No.2, No.3 and No.4 are so close and the degradation temperature increased significantly
comparing with pure CP 4702. When the PAPTES (x=1) increased to 25 wt% or 30 wt%,
another jump of the degradation temperature was observed.
Conclusion. CP 4702 with >20 wt% PAPTES (x=1) that was hydrolyzed using water
under different conditions were prepared. By varying the ratio between ethoxy and hydroxyl
groups, transparent and stable blends with 20 wt% PAPTES (x=1) can be prepared. With the
introduction of ethanol as solvent, the final blend would be more liquid-like, although none
solvent process would be more preferred in industry. In all the ratios between ethoxy and
hydroxyl groups, ~1:2 would be the best choice when the weight content of PAPTES (x=1)
was not higher than 20 wt%. Some of the blends would be applied in the foam preparation.
Application of PEOS in the flexible polyurethane foams.
226
7.6.4. Preparation of CP4702-PAPTES (x=1.4) blends
In the previous part we always needed to introduce water to remove the ethoxy groups
from PAPTES (x=1). To simplify the procedure, we have prepared another PAPTES (x=1.4)
which contains less ethoxy groups for the CP 4702 blends preparation.
Process. PAPTES (x=1.4) and CP 4702 were mixed in a round bottom flask with
ethanol as solvent. After magnetic stirrering over night, ethanol was removed using rotor-
evaporator followed with higher vacuum (3×10⁻²
mbar). Since the ethoxy groups contained in
the PAPTES (x=1.4) are already quite limited, water was not added. The weight content of
PAPTES (x=1.4) varied from 5 to 20 wt%. The final blends are a series of viscous transparent
liquid. All the samples prepared in this series are listed in Table 7. 14.
.
Table 7. 14 CP 4702 blends with different amount of PAPTES (x=1.4)
Sample No. CP 4702 (%) PAPTES (x=1.4) (%) Ethanol (%)
1 95 5 50
2 90 10 100
3 85 15 150
4 80 20 200
Result and discussion. With the catalysis of amino groups, there should be still some
connection between the PAPTES (H2O : APTES x=1.4) with CP 4702. With different
PAPTES (x=1.4) content, the storability of the final blends are different. When 5 or 10 wt%
PAPTES (x=1.4) was added, the final liquid can be stored over 2 weeks while the samples
with 15 or 20 wt% PAPTES (x=1.4) would gelled in two weeks.
The thermal stability of the blends was tested by TGA before the gelation and the
results are shown in Figure 7. 21. In line with our previous results, the PAPTES (x=1)
would slightly increase the thermal stability of CP 4702 under nitrogen, meanwhile the
influence on the thermal stability under air are much more significant. With the increasing
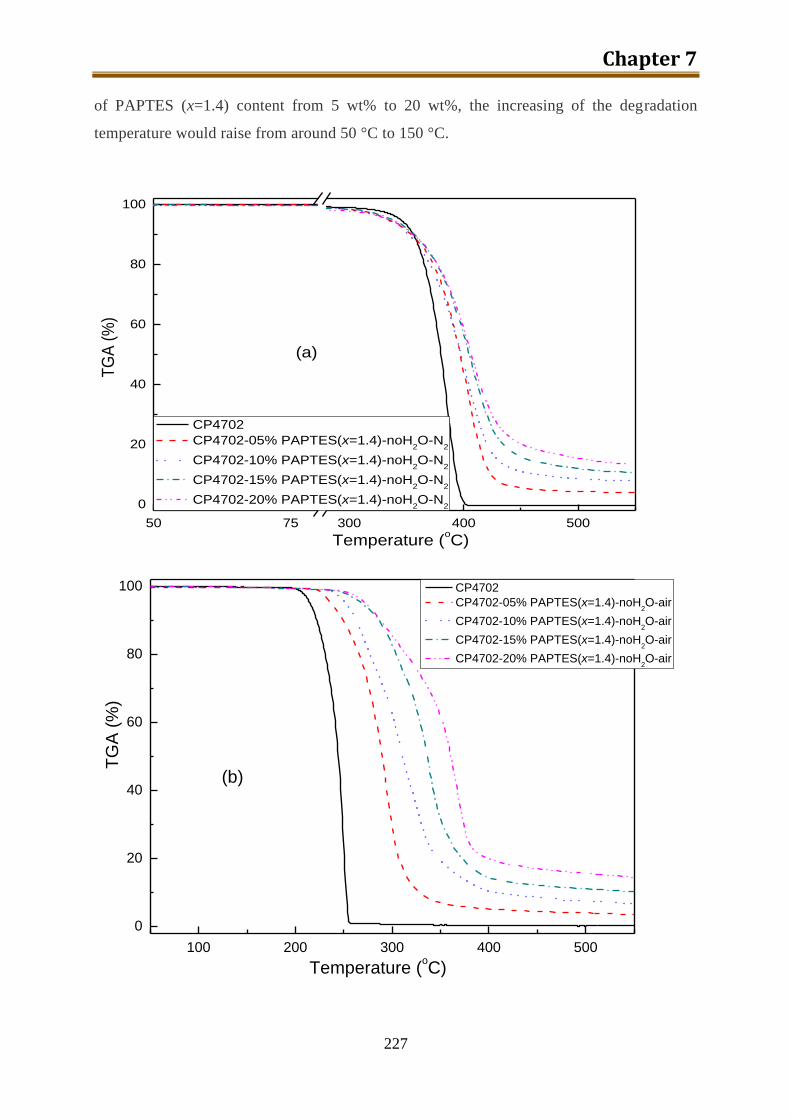
Chapter 7
227
of PAPTES (x=1.4) content from 5 wt% to 20 wt%, the increasing of the degradation
temperature would raise from around 50 °C to 150 °C.
50 75 300 400 500
0
20
40
60
80
100
Temperature (oC)
TG
A (
%)
CP4702
CP4702-05% PAPTES(x=1.4)-noH2O-N
2
CP4702-10% PAPTES(x=1.4)-noH2O-N
2
CP4702-15% PAPTES(x=1.4)-noH2O-N
2
CP4702-20% PAPTES(x=1.4)-noH2O-N
2
(a)
100 200 300 400 500
0
20
40
60
80
100
Temperature (oC)
TG
A (
%)
CP4702
CP4702-05% PAPTES(x=1.4)-noH2O-air
CP4702-10% PAPTES(x=1.4)-noH2O-air
CP4702-15% PAPTES(x=1.4)-noH2O-air
CP4702-20% PAPTES(x=1.4)-noH2O-air
(b)
Application of PEOS in the flexible polyurethane foams.
228
Figure 7. 21 TGA results of the blends prepared using CP 4702 with PAPTES (x=1.4)
under (a). nitrogen; (b). air.
Conclusion. Polyols CP 4702 which is used for flexible PU foams with 5 ~ 20 wt%
PAPTES (x=1.4) were prepared in this section. All the samples were transparent and the
viscosity increased with the increasing of PAPTES (x=1.4) content. However, only the
blends with 5 or 10 wt% PAPTES (x=1.4) can be stored over two weeks and the blends with
higher amount of PAPTES (x=1.4) would gelled after storage.
7.6.5. Preparation of CP4702-SiON blends
We noticed that the final product of the 100% hydrolyzed APTES could be re-
dissolved in ethanol. Then we came up with an idea that this 100% hydrolyzed APTES
might be also applied in the CP 4702 blends to form a product completely non-connected to
CP 4702.
Process. We name the 100% hydrolysed APTES as SiON since this product is kind of
amino groups modified SiO2. The preparation of SiON can be described as the formulation
below:
(EtO)3Si(CH2)3NH2 + 1.5 H2O → SiO1.5(C3H6NH2) + 3 EtOH
APTES, ethanol and water were mixed in a round bottom flask equipped with a cap
and then stirred at room temperature over night. The molar ratio between water and APTES
is higher than 1.5 and the weight content of APTES in ethanol was 10 wt%. After removing
ethanol by rotor evaporation, a transparent glass-like rigid film (or foam like material) was
obtained. With adding of ethanol, the SiON can be re-dissolved under magnetic stirring. In
the next step, SiON would be applied in the CP 4702 after being dissolved in ethanol with a
concentration of 32.39 wt%.
Hydrolysis of APTES was also carried out in acidic environment (with PH≈1) to make
the SiON linier. However, the addition of HCl acid always leaded to big particle formation,
which does not re-dissolve in ethanol. Therefore, we only focus on the SiON converted with
only water.
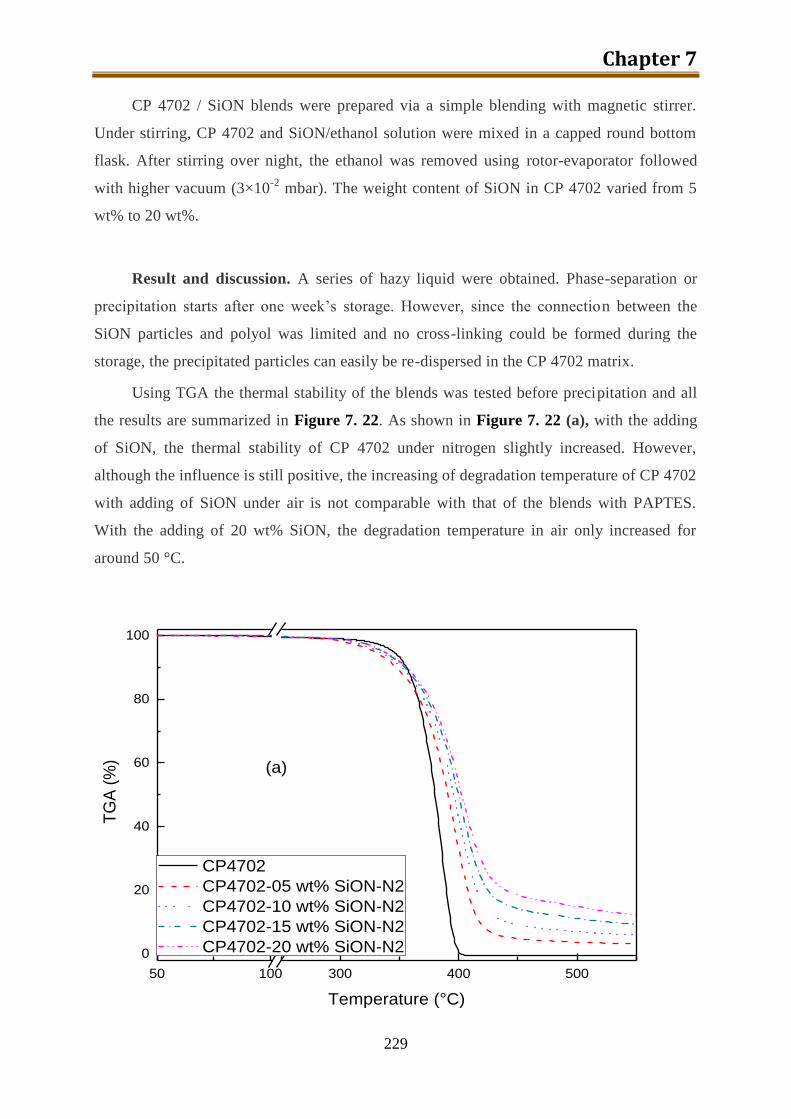
Chapter 7
229
CP 4702 / SiON blends were prepared via a simple blending with magnetic stirrer.
Under stirring, CP 4702 and SiON/ethanol solution were mixed in a capped round bottom
flask. After stirring over night, the ethanol was removed using rotor-evaporator followed
with higher vacuum (3×10⁻²
mbar). The weight content of SiON in CP 4702 varied from 5
wt% to 20 wt%.
Result and discussion. A series of hazy liquid were obtained. Phase-separation or
precipitation starts after one week’s storage. However, since the connection between the
SiON particles and polyol was limited and no cross-linking could be formed during the
storage, the precipitated particles can easily be re-dispersed in the CP 4702 matrix.
Using TGA the thermal stability of the blends was tested before precipitation and all
the results are summarized in Figure 7. 22. As shown in Figure 7. 22 (a), with the adding
of SiON, the thermal stability of CP 4702 under nitrogen slightly increased. However,
although the influence is still positive, the increasing of degradation temperature of CP 4702
with adding of SiON under air is not comparable with that of the blends with PAPTES.
With the adding of 20 wt% SiON, the degradation temperature in air only increased for
around 50 °C.
50 100 300 400 500
0
20
40
60
80
100
TG
A (
%)
Temperature (°C)
CP4702
CP4702-05 wt% SiON-N2
CP4702-10 wt% SiON-N2
CP4702-15 wt% SiON-N2
CP4702-20 wt% SiON-N2
(a)
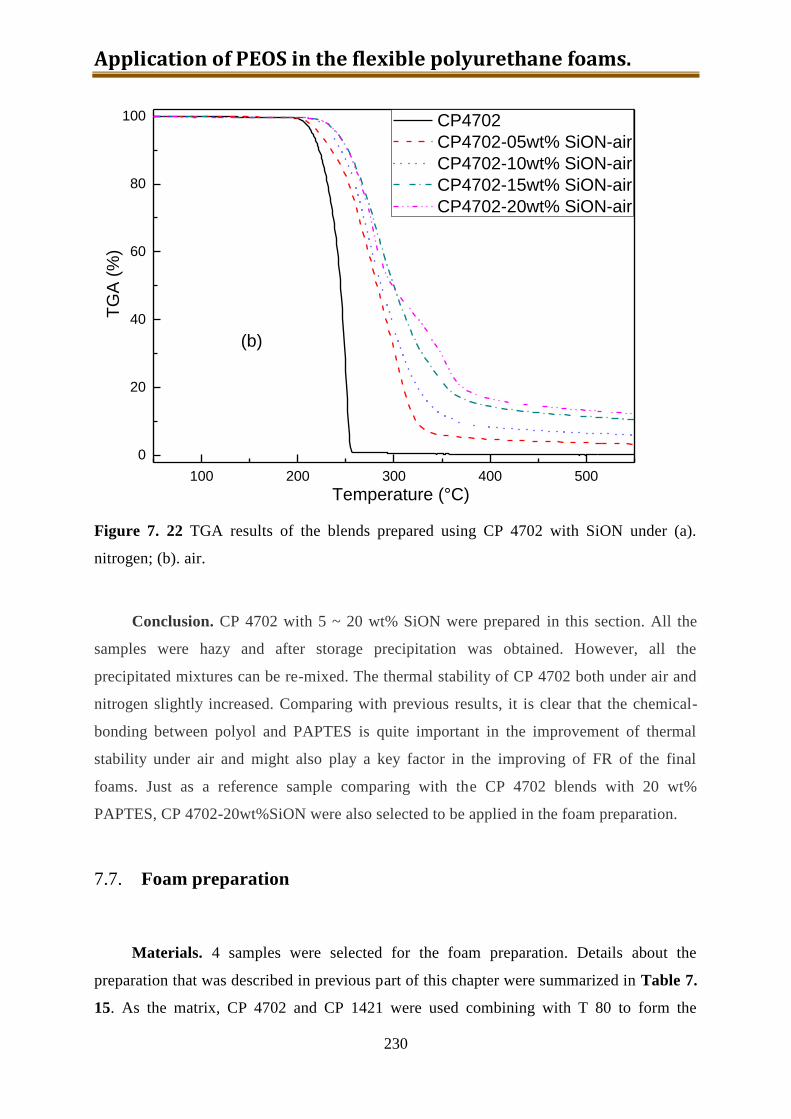
Application of PEOS in the flexible polyurethane foams.
230
100 200 300 400 500
0
20
40
60
80
100
TG
A (
%)
Temperature (°C)
CP4702
CP4702-05wt% SiON-air
CP4702-10wt% SiON-air
CP4702-15wt% SiON-air
CP4702-20wt% SiON-air
(b)
Figure 7. 22 TGA results of the blends prepared using CP 4702 with SiON under (a).
nitrogen; (b). air.
Conclusion. CP 4702 with 5 ~ 20 wt% SiON were prepared in this section. All the
samples were hazy and after storage precipitation was obtained. However, all the
precipitated mixtures can be re-mixed. The thermal stability of CP 4702 both under air and
nitrogen slightly increased. Comparing with previous results, it is clear that the chemical-
bonding between polyol and PAPTES is quite important in the improvement of thermal
stability under air and might also play a key factor in the improving of FR of the final
foams. Just as a reference sample comparing with the CP 4702 blends with 20 wt%
PAPTES, CP 4702-20wt%SiON were also selected to be applied in the foam preparation.
7.7. Foam preparation
Materials. 4 samples were selected for the foam preparation. Details about the
preparation that was described in previous part of this chapter were summarized in Table 7.
15. As the matrix, CP 4702 and CP 1421 were used combining with T 80 to form the
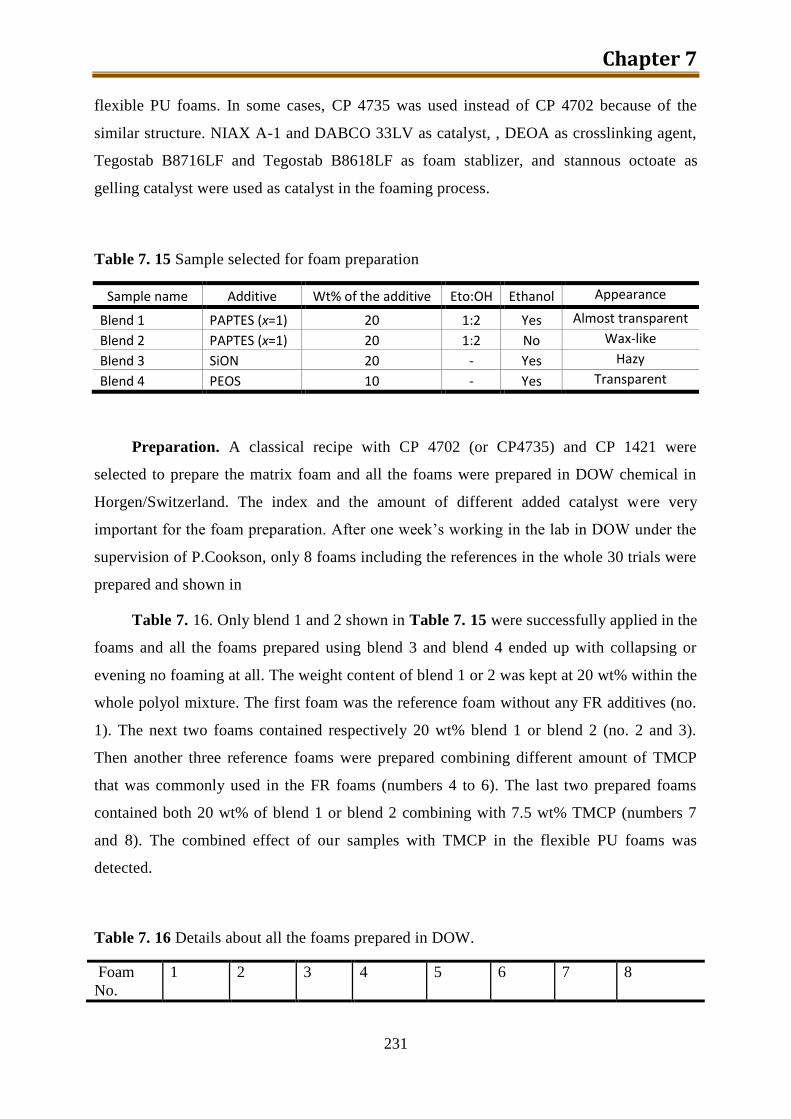
Chapter 7
231
flexible PU foams. In some cases, CP 4735 was used instead of CP 4702 because of the
similar structure. NIAX A-1 and DABCO 33LV as catalyst, , DEOA as crosslinking agent,
Tegostab B8716LF and Tegostab B8618LF as foam stablizer, and stannous octoate as
gelling catalyst were used as catalyst in the foaming process.
Table 7. 15 Sample selected for foam preparation
Sample name Additive Wt% of the additive Eto:OH Ethanol Appearance
Blend 1 PAPTES (x=1) 20 1:2 Yes Almost transparent
Blend 2 PAPTES (x=1) 20 1:2 No Wax-like
Blend 3 SiON 20 - Yes Hazy
Blend 4 PEOS 10 - Yes Transparent
Preparation. A classical recipe with CP 4702 (or CP4735) and CP 1421 were
selected to prepare the matrix foam and all the foams were prepared in DOW chemical in
Horgen/Switzerland. The index and the amount of different added catalyst were very
important for the foam preparation. After one week’s working in the lab in DOW under the
supervision of P.Cookson, only 8 foams including the references in the whole 30 trials were
prepared and shown in
Table 7. 16. Only blend 1 and 2 shown in Table 7. 15 were successfully applied in the
foams and all the foams prepared using blend 3 and blend 4 ended up with collapsing or
evening no foaming at all. The weight content of blend 1 or 2 was kept at 20 wt% within the
whole polyol mixture. The first foam was the reference foam without any FR additives (no.
1). The next two foams contained respectively 20 wt% blend 1 or blend 2 (no. 2 and 3).
Then another three reference foams were prepared combining different amount of TMCP
that was commonly used in the FR foams (numbers 4 to 6). The last two prepared foams
contained both 20 wt% of blend 1 or blend 2 combining with 7.5 wt% TMCP (numbers 7
and 8). The combined effect of our samples with TMCP in the flexible PU foams was
detected.
Table 7. 16 Details about all the foams prepared in DOW.
Foam
No.
1 2 3 4 5 6 7 8
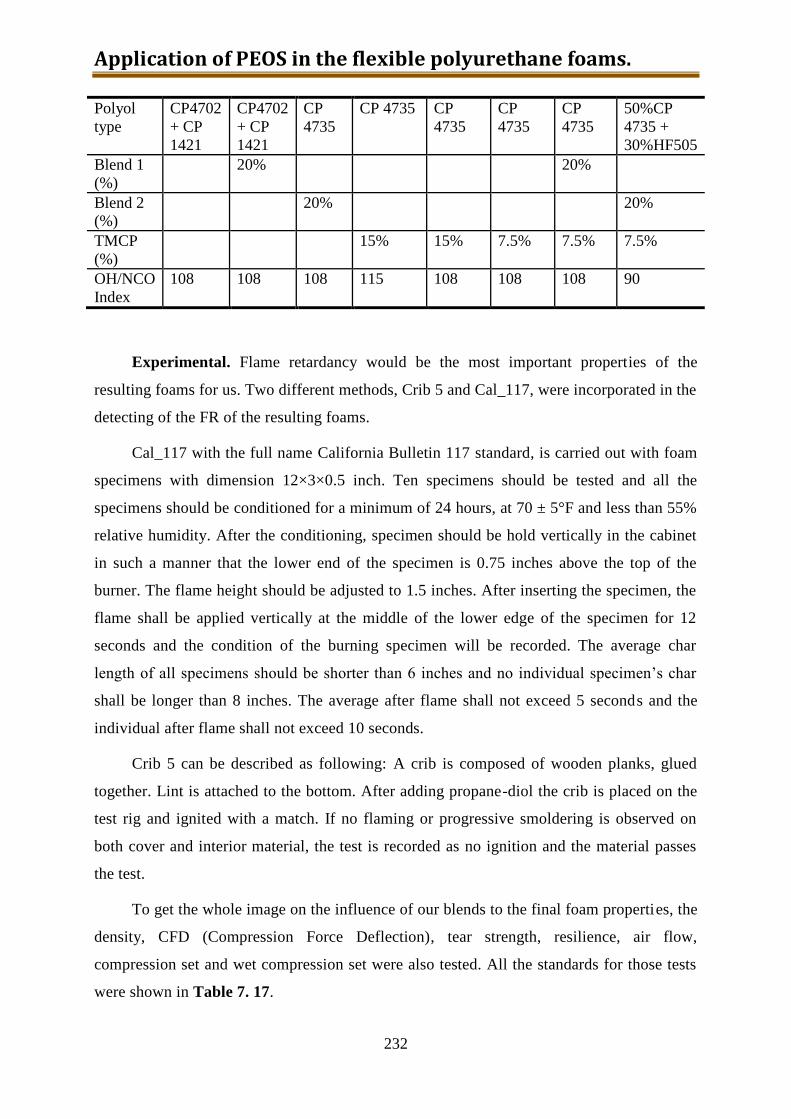
Application of PEOS in the flexible polyurethane foams.
232
Polyol
type
CP4702
+ CP
1421
CP4702
+ CP
1421
CP
4735
CP 4735 CP
4735
CP
4735
CP
4735
50%CP
4735 +
30%HF505
Blend 1
(%)
20% 20%
Blend 2
(%)
20% 20%
TMCP
(%)
15% 15% 7.5% 7.5% 7.5%
OH/NCO
Index
108 108 108 115 108 108 108 90
Experimental. Flame retardancy would be the most important properties of the
resulting foams for us. Two different methods, Crib 5 and Cal_117, were incorporated in the
detecting of the FR of the resulting foams.
Cal_117 with the full name California Bulletin 117 standard, is carried out with foam
specimens with dimension 12×3×0.5 inch. Ten specimens should be tested and all the
specimens should be conditioned for a minimum of 24 hours, at 70 ± 5°F and less than 55%
relative humidity. After the conditioning, specimen should be hold vertically in the cabinet
in such a manner that the lower end of the specimen is 0.75 inches above the top of the
burner. The flame height should be adjusted to 1.5 inches. After inserting the specimen, the
flame shall be applied vertically at the middle of the lower edge of the specimen for 12
seconds and the condition of the burning specimen will be recorded. The average char
length of all specimens should be shorter than 6 inches and no individual specimen’s char
shall be longer than 8 inches. The average after flame shall not exceed 5 seconds and the
individual after flame shall not exceed 10 seconds.
Crib 5 can be described as following: A crib is composed of wooden planks, glued
together. Lint is attached to the bottom. After adding propane-diol the crib is placed on the
test rig and ignited with a match. If no flaming or progressive smoldering is observed on
both cover and interior material, the test is recorded as no ignition and the material passes
the test.
To get the whole image on the influence of our blends to the final foam properties, the
density, CFD (Compression Force Deflection), tear strength, resilience, air flow,
compression set and wet compression set were also tested. All the standards for those tests
were shown in Table 7. 17.
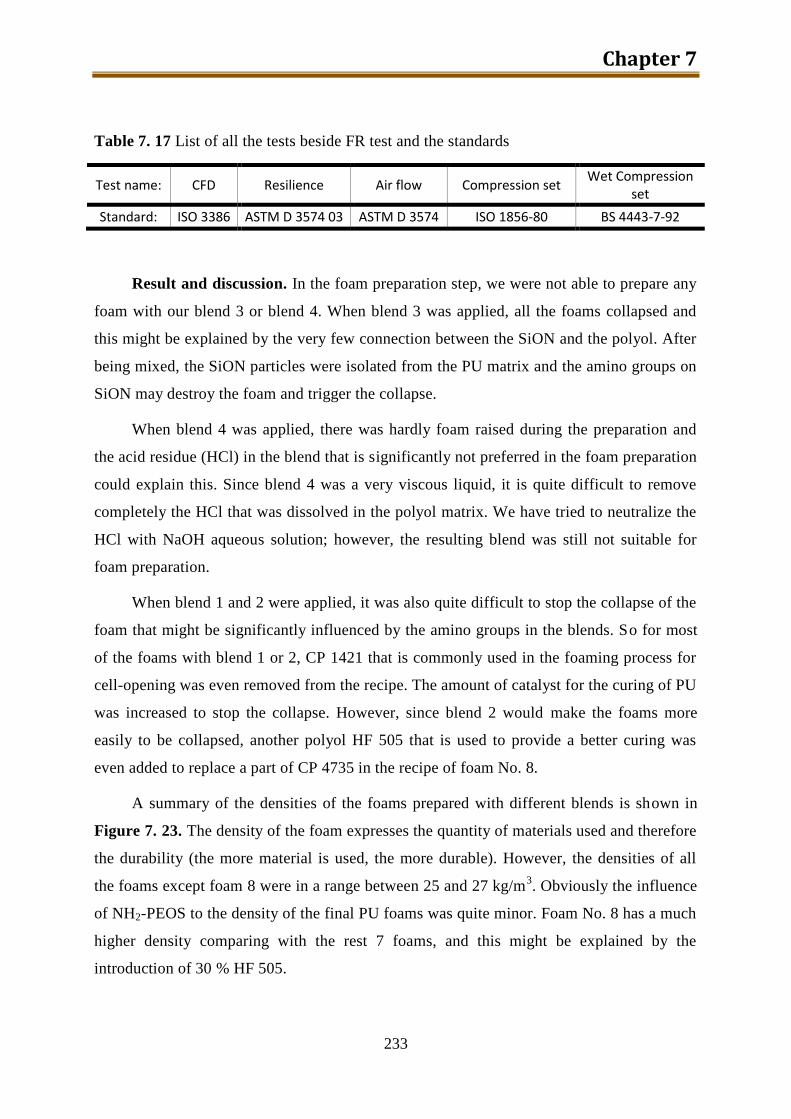
Chapter 7
233
Table 7. 17 List of all the tests beside FR test and the standards
Test name: CFD Resilience Air flow Compression set Wet Compression
set
Standard: ISO 3386 ASTM D 3574 03 ASTM D 3574 ISO 1856-80 BS 4443-7-92
Result and discussion. In the foam preparation step, we were not able to prepare any
foam with our blend 3 or blend 4. When blend 3 was applied, all the foams collapsed and
this might be explained by the very few connection between the SiON and the polyol. After
being mixed, the SiON particles were isolated from the PU matrix and the amino groups on
SiON may destroy the foam and trigger the collapse.
When blend 4 was applied, there was hardly foam raised during the preparation and
the acid residue (HCl) in the blend that is significantly not preferred in the foam preparation
could explain this. Since blend 4 was a very viscous liquid, it is quite difficult to remove
completely the HCl that was dissolved in the polyol matrix. We have tried to neutralize the
HCl with NaOH aqueous solution; however, the resulting blend was still not suitable for
foam preparation.
When blend 1 and 2 were applied, it was also quite difficult to stop the collapse of the
foam that might be significantly influenced by the amino groups in the blends. So for most
of the foams with blend 1 or 2, CP 1421 that is commonly used in the foaming process for
cell-opening was even removed from the recipe. The amount of catalyst for the curing of PU
was increased to stop the collapse. However, since blend 2 would make the foams more
easily to be collapsed, another polyol HF 505 that is used to provide a better curing was
even added to replace a part of CP 4735 in the recipe of foam No. 8.
A summary of the densities of the foams prepared with different blends is shown in
Figure 7. 23. The density of the foam expresses the quantity of materials used and therefore
the durability (the more material is used, the more durable). However, the densities of all
the foams except foam 8 were in a range between 25 and 27 kg/m3. Obviously the influence
of NH2-PEOS to the density of the final PU foams was quite minor. Foam No. 8 has a much
higher density comparing with the rest 7 foams, and this might be explained by the
introduction of 30 % HF 505.
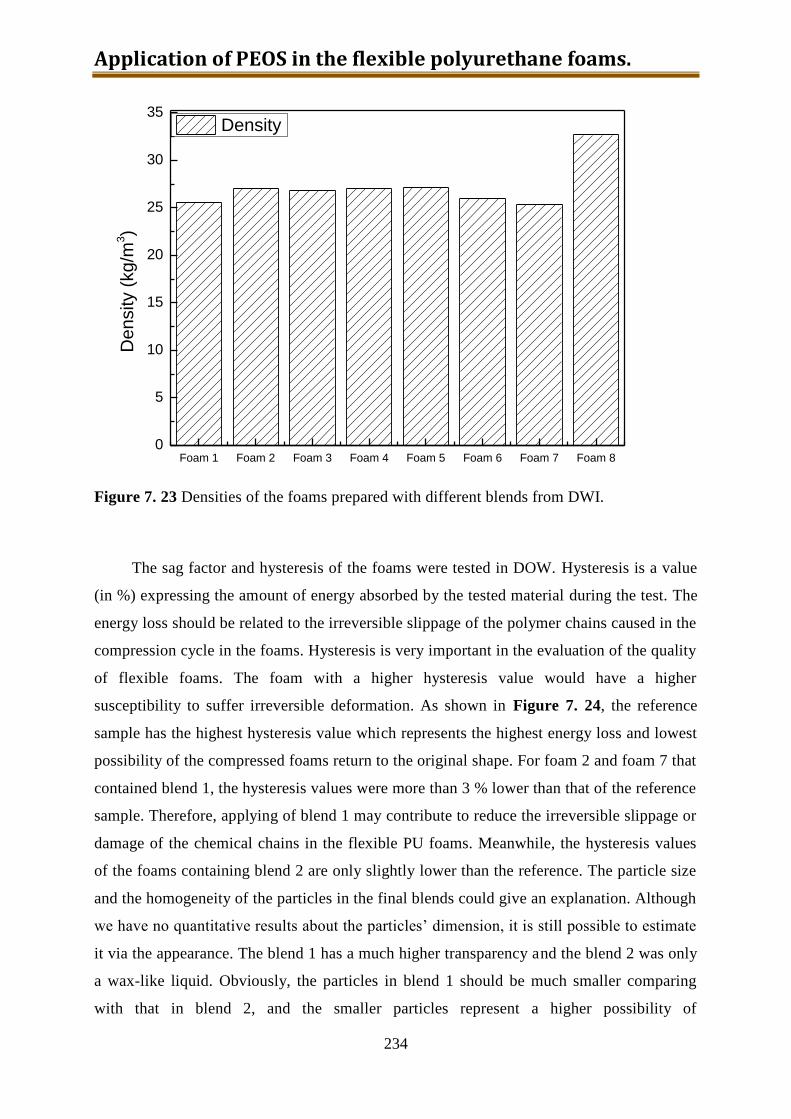
Application of PEOS in the flexible polyurethane foams.
234
Foam 1 Foam 2 Foam 3 Foam 4 Foam 5 Foam 6 Foam 7 Foam 80
5
10
15
20
25
30
35
De
nsity (
kg/m
3)
Density
Figure 7. 23 Densities of the foams prepared with different blends from DWI.
The sag factor and hysteresis of the foams were tested in DOW. Hysteresis is a value
(in %) expressing the amount of energy absorbed by the tested material during the test. The
energy loss should be related to the irreversible slippage of the polymer chains caused in the
compression cycle in the foams. Hysteresis is very important in the evaluation of the quality
of flexible foams. The foam with a higher hysteresis value would have a higher
susceptibility to suffer irreversible deformation. As shown in Figure 7. 24, the reference
sample has the highest hysteresis value which represents the highest energy loss and lowest
possibility of the compressed foams return to the original shape. For foam 2 and foam 7 that
contained blend 1, the hysteresis values were more than 3 % lower than that of the reference
sample. Therefore, applying of blend 1 may contribute to reduce the irreversible slippage or
damage of the chemical chains in the flexible PU foams. Meanwhile, the hysteresis values
of the foams containing blend 2 are only slightly lower than the reference. The particle size
and the homogeneity of the particles in the final blends could give an explanation. Although
we have no quantitative results about the particles’ dimension, it is still possible to estimate
it via the appearance. The blend 1 has a much higher transparency and the blend 2 was only
a wax-like liquid. Obviously, the particles in blend 1 should be much smaller comparing
with that in blend 2, and the smaller particles represent a higher possibility of
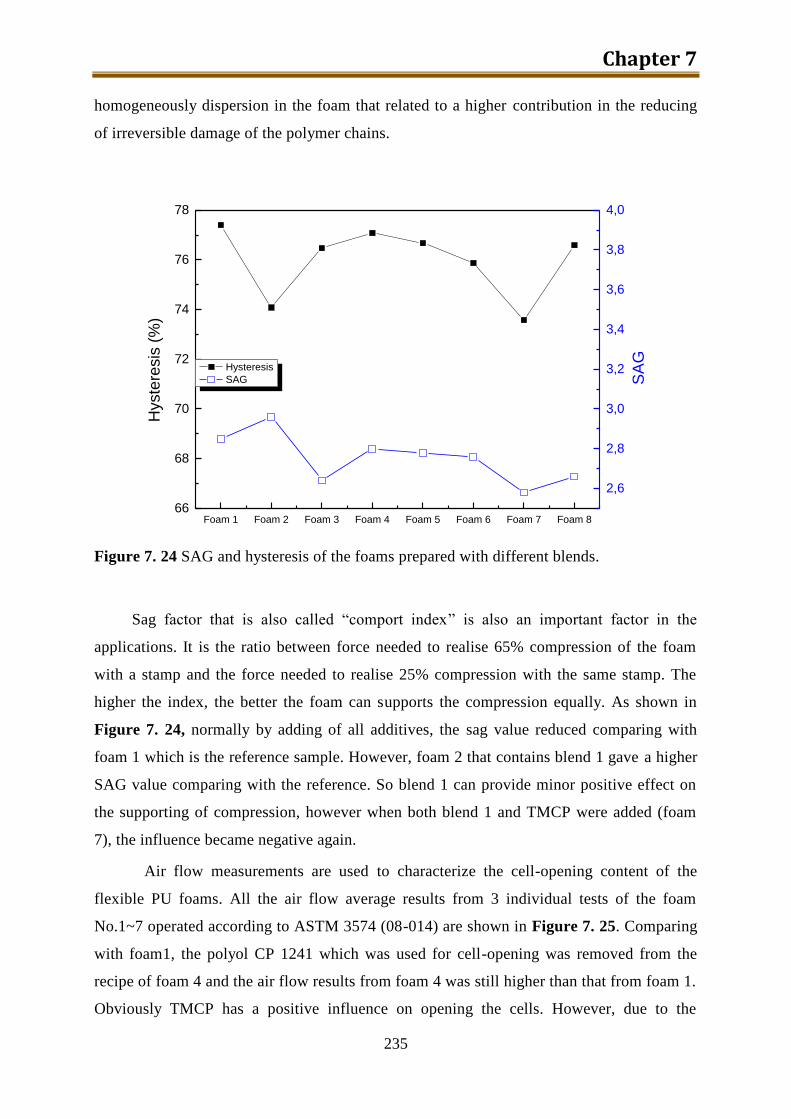
Chapter 7
235
homogeneously dispersion in the foam that related to a higher contribution in the reducing
of irreversible damage of the polymer chains.
Foam 1 Foam 2 Foam 3 Foam 4 Foam 5 Foam 6 Foam 7 Foam 866
68
70
72
74
76
78
Hysteresis
SAG
Hyste
resis
(%
)
2,6
2,8
3,0
3,2
3,4
3,6
3,8
4,0
SA
G
Figure 7. 24 SAG and hysteresis of the foams prepared with different blends.
Sag factor that is also called “comport index” is also an important factor in the
applications. It is the ratio between force needed to realise 65% compression of the foam
with a stamp and the force needed to realise 25% compression with the same stamp. The
higher the index, the better the foam can supports the compression equally. As shown in
Figure 7. 24, normally by adding of all additives, the sag value reduced comparing with
foam 1 which is the reference sample. However, foam 2 that contains blend 1 gave a higher
SAG value comparing with the reference. So blend 1 can provide minor positive effect on
the supporting of compression, however when both blend 1 and TMCP were added (foam
7), the influence became negative again.
Air flow measurements are used to characterize the cell-opening content of the
flexible PU foams. All the air flow average results from 3 individual tests of the foam
No.1~7 operated according to ASTM 3574 (08-014) are shown in Figure 7. 25. Comparing
with foam1, the polyol CP 1241 which was used for cell-opening was removed from the
recipe of foam 4 and the air flow results from foam 4 was still higher than that from foam 1.
Obviously TMCP has a positive influence on opening the cells. However, due to the
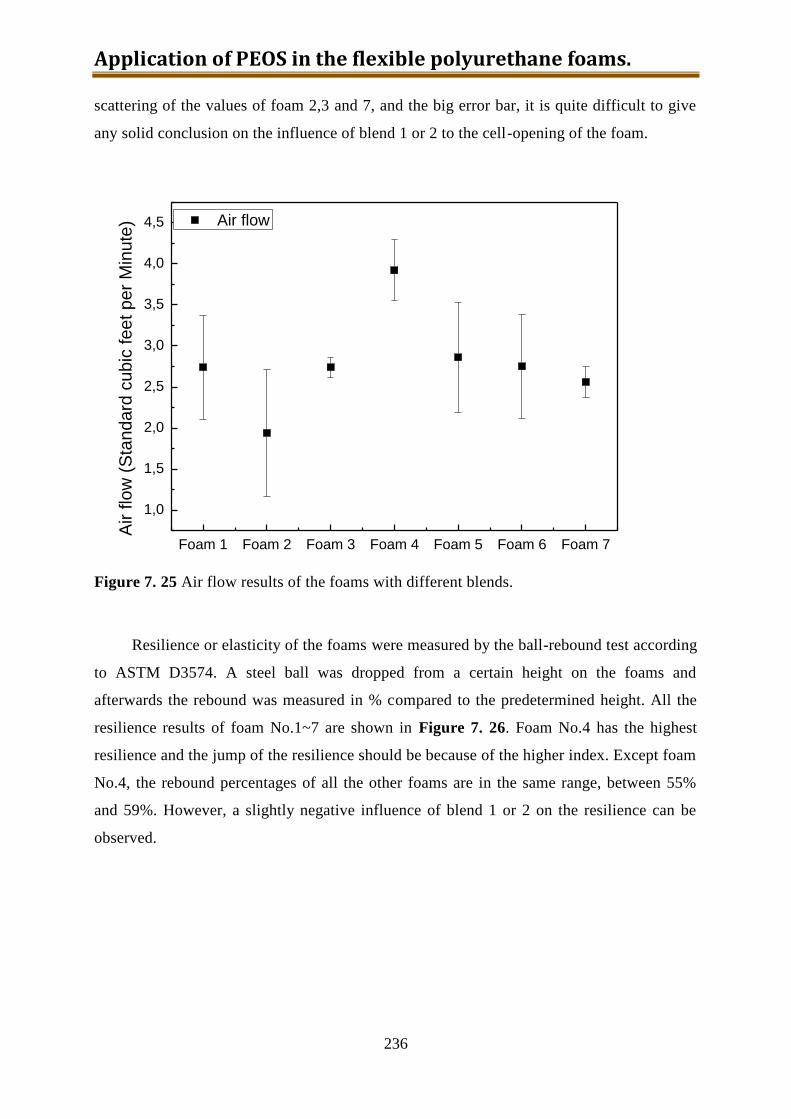
Application of PEOS in the flexible polyurethane foams.
236
scattering of the values of foam 2,3 and 7, and the big error bar, it is quite difficult to give
any solid conclusion on the influence of blend 1 or 2 to the cell-opening of the foam.
Foam 1 Foam 2 Foam 3 Foam 4 Foam 5 Foam 6 Foam 7
1,0
1,5
2,0
2,5
3,0
3,5
4,0
4,5
Air flow
Air flo
w (
Sta
ndard
cubic
feet per
Min
ute
)
Figure 7. 25 Air flow results of the foams with different blends.
Resilience or elasticity of the foams were measured by the ball-rebound test according
to ASTM D3574. A steel ball was dropped from a certain height on the foams and
afterwards the rebound was measured in % compared to the predetermined height. All the
resilience results of foam No.1~7 are shown in Figure 7. 26. Foam No.4 has the highest
resilience and the jump of the resilience should be because of the higher index. Except foam
No.4, the rebound percentages of all the other foams are in the same range, between 55%
and 59%. However, a slightly negative influence of blend 1 or 2 on the resilience can be
observed.
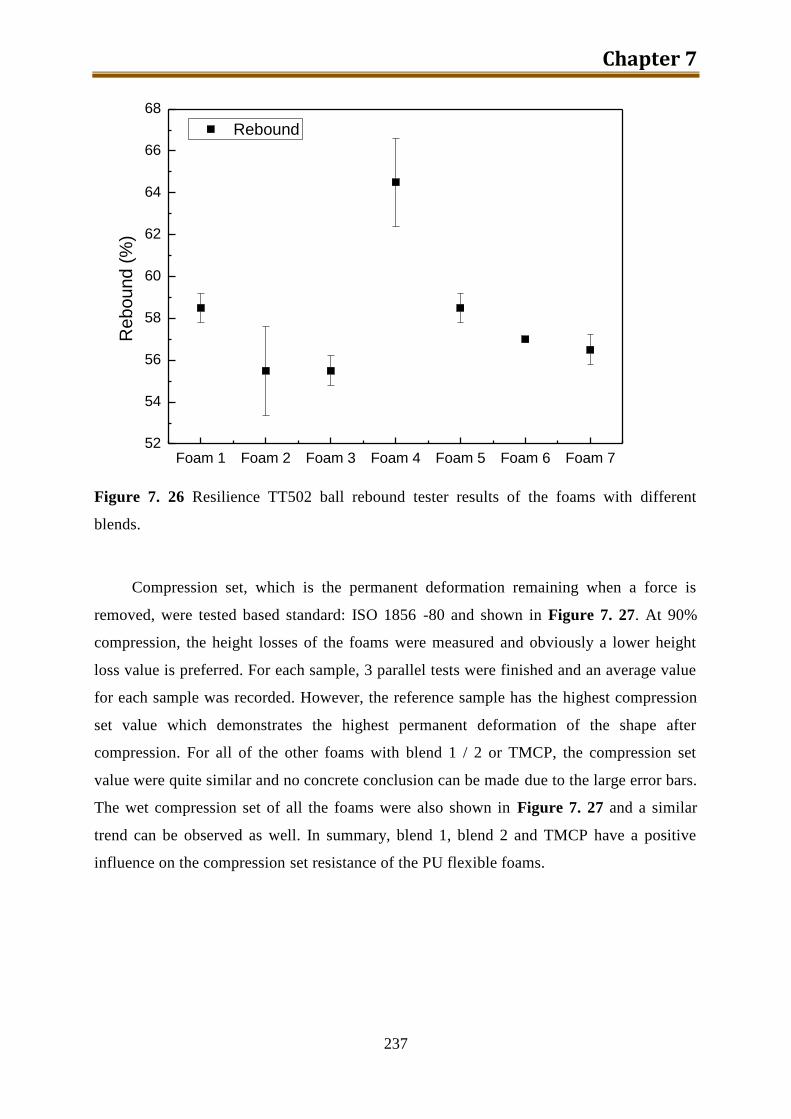
Chapter 7
237
Foam 1 Foam 2 Foam 3 Foam 4 Foam 5 Foam 6 Foam 752
54
56
58
60
62
64
66
68
ReboundR
eb
ou
nd
(%
)
Figure 7. 26 Resilience TT502 ball rebound tester results of the foams with different
blends.
Compression set, which is the permanent deformation remaining when a force is
removed, were tested based standard: ISO 1856 -80 and shown in Figure 7. 27. At 90%
compression, the height losses of the foams were measured and obviously a lower height
loss value is preferred. For each sample, 3 parallel tests were finished and an average value
for each sample was recorded. However, the reference sample has the highest compression
set value which demonstrates the highest permanent deformation of the shape after
compression. For all of the other foams with blend 1 / 2 or TMCP, the compression set
value were quite similar and no concrete conclusion can be made due to the large error bars.
The wet compression set of all the foams were also shown in Figure 7. 27 and a similar
trend can be observed as well. In summary, blend 1, blend 2 and TMCP have a positive
influence on the compression set resistance of the PU flexible foams.
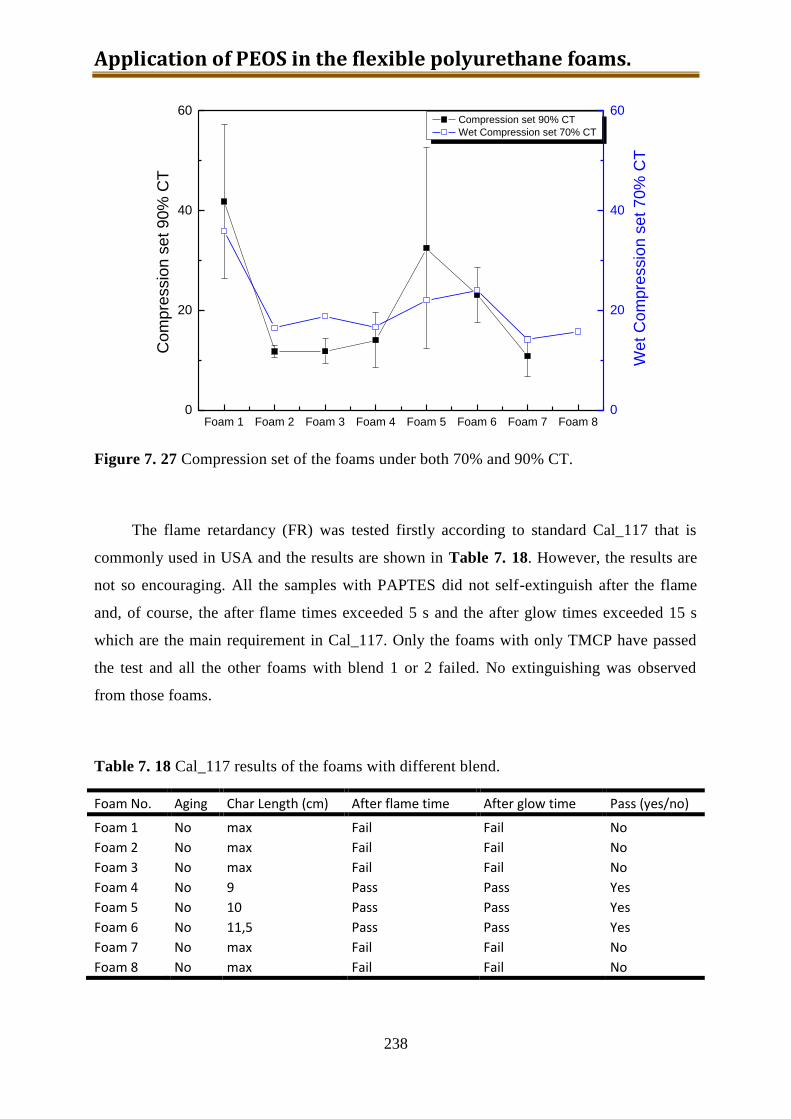
Application of PEOS in the flexible polyurethane foams.
238
Foam 1 Foam 2 Foam 3 Foam 4 Foam 5 Foam 6 Foam 7 Foam 80
20
40
60
Compression set 90% CT
Wet Compression set 70% CT
Co
mpre
ssio
n s
et 9
0%
CT
0
20
40
60
We
t C
om
pre
ssio
n s
et 7
0%
CT
Figure 7. 27 Compression set of the foams under both 70% and 90% CT.
The flame retardancy (FR) was tested firstly according to standard Cal_117 that is
commonly used in USA and the results are shown in Table 7. 18. However, the results are
not so encouraging. All the samples with PAPTES did not self-extinguish after the flame
and, of course, the after flame times exceeded 5 s and the after glow times exceeded 15 s
which are the main requirement in Cal_117. Only the foams with only TMCP have passed
the test and all the other foams with blend 1 or 2 failed. No extinguishing was observed
from those foams.
Table 7. 18 Cal_117 results of the foams with different blend.
Foam No. Aging Char Length (cm) After flame time After glow time Pass (yes/no)
Foam 1 No max Fail Fail No Foam 2 No max Fail Fail No Foam 3 No max Fail Fail No
Foam 4 No 9 Pass Pass Yes Foam 5 No 10 Pass Pass Yes Foam 6 No 11,5 Pass Pass Yes Foam 7 No max Fail Fail No Foam 8 No max Fail Fail No
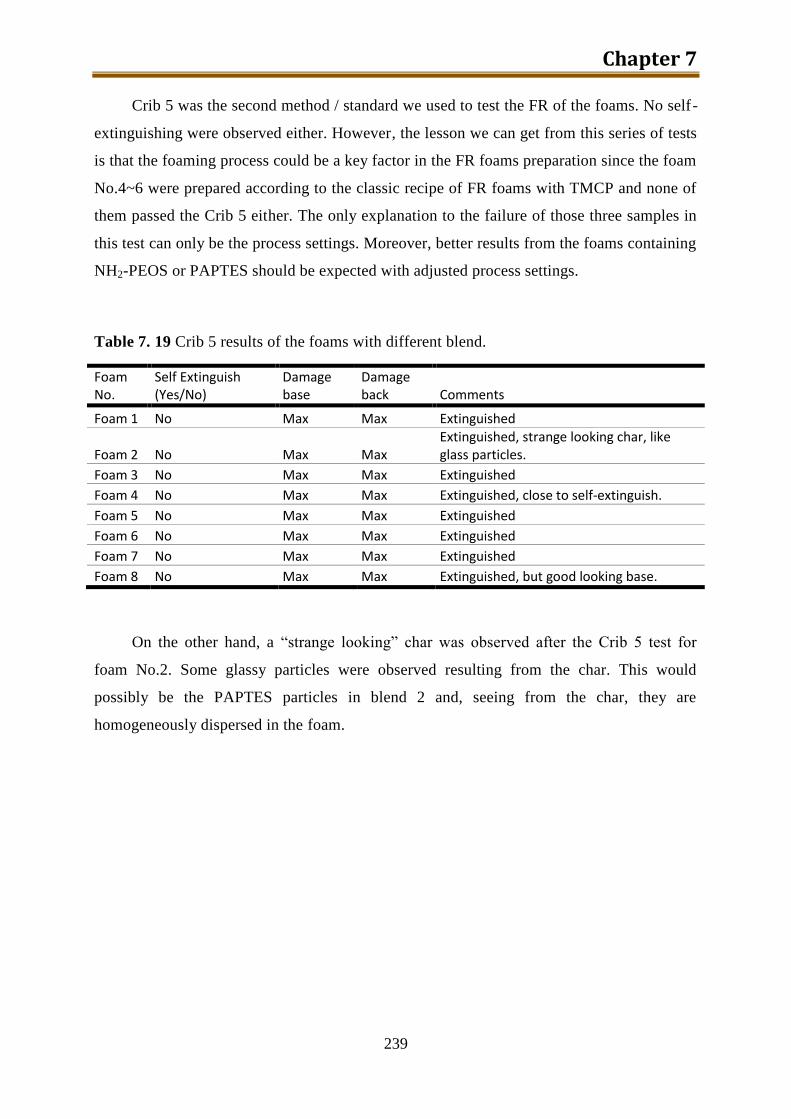
Chapter 7
239
Crib 5 was the second method / standard we used to test the FR of the foams. No self-
extinguishing were observed either. However, the lesson we can get from this series of tests
is that the foaming process could be a key factor in the FR foams preparation since the foam
No.4~6 were prepared according to the classic recipe of FR foams with TMCP and none of
them passed the Crib 5 either. The only explanation to the failure of those three samples in
this test can only be the process settings. Moreover, better results from the foams containing
NH2-PEOS or PAPTES should be expected with adjusted process settings.
Table 7. 19 Crib 5 results of the foams with different blend.
Foam No.
Self Extinguish (Yes/No)
Damage base
Damage back Comments
Foam 1 No Max Max Extinguished
Foam 2 No Max Max Extinguished, strange looking char, like glass particles.
Foam 3 No Max Max Extinguished
Foam 4 No Max Max Extinguished, close to self-extinguish.
Foam 5 No Max Max Extinguished
Foam 6 No Max Max Extinguished
Foam 7 No Max Max Extinguished
Foam 8 No Max Max Extinguished, but good looking base.
On the other hand, a “strange looking” char was observed after the Crib 5 test for
foam No.2. Some glassy particles were observed resulting from the char. This would
possibly be the PAPTES particles in blend 2 and, seeing from the char, they are
homogeneously dispersed in the foam.
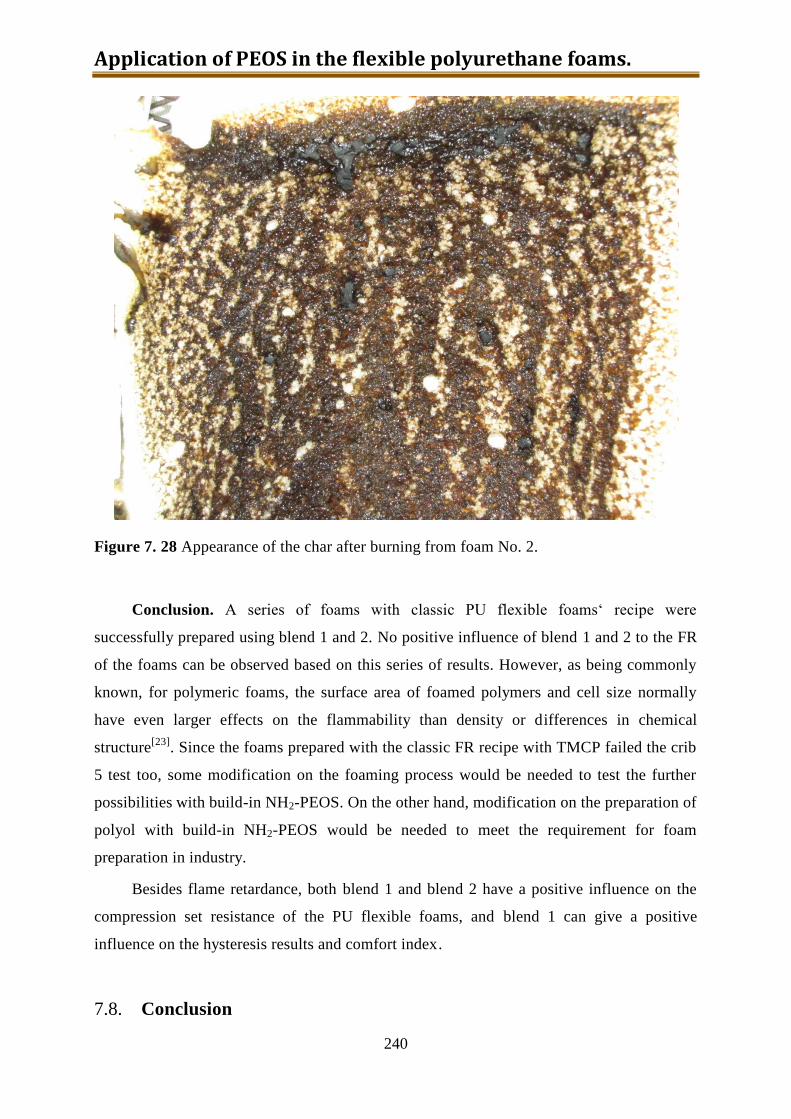
Application of PEOS in the flexible polyurethane foams.
240
Figure 7. 28 Appearance of the char after burning from foam No. 2.
Conclusion. A series of foams with classic PU flexible foams‘ recipe were
successfully prepared using blend 1 and 2. No positive influence of blend 1 and 2 to the FR
of the foams can be observed based on this series of results. However, as being commonly
known, for polymeric foams, the surface area of foamed polymers and cell size normally
have even larger effects on the flammability than density or differences in chemical
structure[23]
. Since the foams prepared with the classic FR recipe with TMCP failed the crib
5 test too, some modification on the foaming process would be needed to test the further
possibilities with build-in NH2-PEOS. On the other hand, modification on the preparation of
polyol with build-in NH2-PEOS would be needed to meet the requirement for foam
preparation in industry.
Besides flame retardance, both blend 1 and blend 2 have a positive influence on the
compression set resistance of the PU flexible foams, and blend 1 can give a positive
influence on the hysteresis results and comfort index.
7.8. Conclusion
Chapter 7
241
NH2-PEOS with all different amino group contents were prepared and most of them
were applied in those three different generations.
For generation 1 that is polyol with dissolved-in NH2-PEOS, PEOS with different
amino content was preferred when different polyol was applied. With the polyol for flexible
PU foams 3008 as a matrix, NH2[10]-PEOS is recommended and up to 5 wt% can be
dissolved in and stored over 2 weeks. When Polyol CP 4702 was applied, lower amino
content in PEOS is preferred and up to 3 wt% NH2[3]-PEOS can be added.
For generation 2, up to 50 wt% of PEOS with 5 % amino groups prepared via
transesterification with ethanol amino could be added in MDI and stored for several months.
For generation 3, PIPA was prepared with NH2[3~10]-PEOS. The particles in PIPA
were quite large and we decided to switch to polyol with build-in PEOS without TDI.
PEOS, NH2[3~10]-PEOS, PAPTES (x=1 or 1.4) and SiON were applied in this generation.
We end up with the conclusion that PEOS with more amino groups would have a stronger
influence on the thermal stability of the polyol blend under air. Four blends with PAPTES
(x=1), PEOS or SiON were selected for foaming. However no positive results were obtained
from the FR test. More trials with different foaming process or different polyol with build-
in PEOS should be carried out.
References:
[1]. Lu, S.-Y. and Hamerton, I., Progress in polymer Science, 2002. 27(8): p. 1661-
1712.
[2]. Lomakin, S.M. and Zaikov, G.E., Modern polymer flame retardancy. 2003, Zeist:
VSP.
[3]. Nishihara, H., Asahi Kasei Kabushiki Kaisha, Osaka (JP) US 6,454,961 B1, 2002.
[4]. Takeshi Kawachi, et al., EP0789068 B1, 1999.
[5]. Harada, M., et al., Journal of Applied Polymer Science, 2007. 106(1): p. 338-344.
[6]. Functional fillers for plastics, ed. Xanthos, M. 2005, Weinheim: Wiley-VCH.
[7]. Fire Retardancy of Polymeric Materials, ed. Grand, A.F. and Wilkie, C.A. 2000,
New York: Marcel Dekker.
Application of PEOS in the flexible polyurethane foams.
242
[8]. Neumann, D., et al., Journal of the American Chemical Society, 2002. 124(47): p.
13998-13999.
[9]. Schubert, U., Chemistry of Materials, 2001. 13(10): p. 3487-3494.
[10]. Ochi, M. and Matsumura, T., Journal of Polymer Science Part B: Polymer
Physics, 2005. 43(13): p. 1631-1639.
[11]. Chan, C.-K. and Chu, I.M., Polymer, 2001. 42(16): p. 6823-6831.
[12]. Chiang, C.-L., et al., Journal of Polymer Science Part A: Polymer Chemistry,
2003. 41(7): p. 905-913.
[13]. Gruenbauer, H.J.M., et al., WO 2009078725, 2009.
[14]. Kaushiva, B.D., US 20050096488, 2005.
[15]. Gruenbauer, H., Internal knowledge from DOW. .
[16]. Carroll, W.G. and Farley, P., Imperial Chemical Industries PLC, UK US
4452923, 1984.
[17]. Carroll, W.G.F., Peter; Marklow, Raymond Joseph, Imperial Chemical
Industries PLC, UK US 4438252, 1984.
[18]. Carroll, W.G., Imperial Chemical Industries PLC, UK US 4554306, 1985.
[19]. Sparrow, D.J.F., Peter; Carroll, William Graham, Imperial Chemical
Industries PLC, UK GB 2102822, 1983.
[20]. Van Veen, K.J.B., G. Ronald, Woodbridge Foam Corp., Can. WO 94/12553,
1994.
[21]. Verhelst, G.A.B., Alphonse Elisabeth Joseph, Huntsman ICI Chemicals, LLC,
USA US 6881783, 2005.
[22]. Verhelst, G.A.B., Alphonse Elisabeth Joseph, Huntsman ICI Chemicals, LLC,
USA WO 00/73364 A1, 2000.
[23]. Williams, M.K., et al., Recent Adv. Flame Retard. Polym. Mater., 2001. 12: p.
137-150.
Chapter 8
243
8. Preparation and application of poly
(isopropoxyl titanium) as a TiO2
precursor with high storage stability
Titanium dioxide is a basic material in our daily life. Because of its brightness and very
high refractive index, it is one of the most widely used white pigments from ancient times.
And, because it is inexpensive, harmless, and chemically stable, it is employed as a pigment
to provide whiteness and opacity in foods, cosmetic and even medicines. In 1969, Fujishima
succeeded to photo electrochemically decompose water for the first time[1]
. Those finding
have encouraged photo electrochemists and then it has become an active area of research in
chemistry[2, 3]
. At the same time, as the main character of the photo electrochemical solar
energy conversion, titanium dioxide (TiO2) began to fascinate people. Then in 1972,
Fujishima and Honda succeeded in the photo electrochemical decomposition of water under
irradiation with light and without any applied electric power[4]
. In this series of experiments,
n-type TiO2 was used as the anode and Pt as the cathode. When the TiO2 electrode was
illuminated under short circuit conditions, H2 was evolved at the Pt electrode, while O2 was
evolved at the TiO2 electrode. This discovery attracted world-wide attention and since this
discovery, more and more potential applications of TiO2 in the area of photocatalysis[5-13]
,
photoinduced hydrophilicity[14, 15]
and self-cleaning surfaces[8, 16]
have been raised.
Photocatalytic properties of TiO2 are due to its semiconducting behaviour[5]
. The
anatase modification of TiO2 has a bandgap of 3.2 eV, which leads to the formation of
electron (e-)-hole (p
+) pairs, when exposed to light wavelengths less than 387 nm (as shown in
Scheme.8. 1). The electrons (e-) and holes (p
+) formed by the absorption of UV light
participate in oxidation reactions and attack organic materials. These oxidation reactions are
initiated by hydroxyl radicals (OH•) and superoxide radical anions (O2•), which are formed
with the presence of water and air[13]
. Studies have shown that this reaction can lead to the
Preparation and application of poly(isopropoxyl titanium) as a TiO2 precursor with high storage stability.
244
breakdown of many common organic compounds[17]
, e.g. degradation of salicylic acid[18, 19]
,
malic acid[20]
, acetaldehyde[21]
, phenol[22]
, 1-4 dichlorobenzene[19]
,
acetylene/trichloroethene[23]
, 1-butene[24]
, evolution of hydrogen from carbohydrates[25]
and
the conversion of NO to NO2[26]
.
Scheme.8. 1 Photocatalytic reaction of TiO2 with water and oxygen forming radicals.
22
-
2
-
2
O Oe
HOH OHp
pe UVTiO
Another interesting property is the switching of wetting properties. The water static
contact angle of TiO2 surface reduces to zero degree with UV irradiation and reverts when it
stores back in the dark[15]
. This is called “photoinduced hydrophilicity”[15, 27, 28]
. In the
phenomenon of photoinduced hydrophilicity, the generated electrons (e-) tend to reduce Ti
(VI) cations to Ti (III) state, and the holes (p+) oxidized the O2-
anions and eject them from
the surface. Absorption of water molecules at these vacant sites has been found to be the
reason for the increased hydrophilicity. The conversion of the TiO2 surface to a hydrophilic
one is essential in providing a “self-cleaning” surface because water will run down a
hydrophilic surface and remove the dirt[29-31]
.
Because of the high refractive index and good insulating properties, TiO2 is very often
applied as thin films or coatings[32, 33]
. Nowadays, the most widely used methods to prepare
TiO2 films are chemical vapour deposition (CVD)[34]
, oxidation of titanium[35]
, electron beam
evaporation[36]
, ion sputtering[37]
, and sol-gel methods[38, 39]
. Nevertheless, the interest in sol-
gel technology has been increased recently because of low process cost, low temperature of
heat treatment, high evenness of the films and wide possibilities to vary film properties by
changing the composition of the precursor solution, etc. But all of the preparation methods for
TiO2 have disadvantages too: the procedure is too complex and the pre-product of TiO2 cannot
be stored because of the high reactivity in air atmosphere. So a precursor for TiO2 film-
preparation with higher storage and processing stability is urgently needed.
In one of our previous chapter and paper, we described a water-free sol-gel method to
prepare polyethoxysiloxane (PEOS)[40]
. With this method, the stability of this special silica
precursor has been greatly increased comparing with the monomer tetraethoxysiloxane or the
precondensed products made by hydrolysis with water. Based on previous study from Dr.
Chapter 8
245
Jaumann[41]
, in this chapter we are going to describe a method similar to PEOS synthesis to
prepare a polyalkoxytitanate (PAOT) as a precursor of TiO2 which can be stored in common
solvents (e.g. chloroform, toluene) without special drying for weeks and can be applied in
standard dip-coating or spin-casting processes.
8.1. Experimental.
Materials. Tetraisopropyl orthotitanate (Ti(O-iPr)4, 97%, from ABCR) and acetic
anhydride (Ac2O, 99.5%, from Fluka) were used without further purification. Chloroform
(≥99%, synthesis) was purchased from VWR and used as received. Silicon wafers
(Type/Dopant: N/Phosphors; orientation: (100); thickness: 650± 25µm; front surface:
polished; back surface: etched.) were purchased from Si-Mat and used after cleaning and
activation.
PAOT synthesis. Tetraisopropyl orthotitanate was filled in a two-necked round
bottom flask equipped with a syringe as a dropping funnel and a reflux condenser connected
with a distillation bridge and an inlet of dry N2. After adding acetic anhydride dropwise into
the flask through syringe within 60 minutes under magnetic stirring, the temperature was
increased to 130 oC and had been hold at this temperature for 24h. With the distilling out of
isopropyl acetate, this reaction moved forward. Then after 24 hours’ distilling, the
condensation was finished and the rest of the side-product (isopropyl acetate) was removed
by the following vacuum. After that, high vacuum (10-2
mbar) was introduced to finish the
reaction.
TiO2 film preparation. Silicon wafers in a size of ~1 cm2 and with a 2 nm thick native
silicon oxide layer were used as substrates for film formation. Before using, they were
cleaned by sonication in isopropanol for 5 minutes, and activated by UV/O2 for 12 minutes.
Then the films were prepared by spin-casting onto freshly prepared silicon wafers with spin-
caster (Convac 1001S, Germany).
Characterization of PAOT. Proton high-resolution NMR spectra were measured using
an ADVANCE 600 Bruker NMR spectrometer operating at the proton frequency of 600.068
Preparation and application of poly(isopropoxyl titanium) as a TiO2 precursor with high storage stability.
246
MHz with CDCl3 as a solvent. The time domain data was 64 k, the spectral width was 10 kHz,
and the recycle delay was 4 s. The spectra were recorded at room temperature.
High-resolution MAS 47,49
Ti NMR spectra were measured on a Bruker 600 WB
spectrometer operating at 33.8366 MHz frequency in the range of titanium isotopes Larmor
frequencies. 47,49
Ti NMR is unique in that their resonant frequency difference is only 267 ppm
so both nuclei are generally observed in the same spectrum. The NMR spectra were collected
at room temperature for a special 4 mm MAS Bruker probe with the rotor frequency of 2.5
kHz. The dead time of the spectrometer is 50 s. The length of a /2 pulse was about 8 s
(500 W), the dwell time was 1 s, the recycle delay was 5 s for all measurements, and the
time domain was 9854. The number of scans was 31790. The 47,49
Ti NMR spectra were
referenced to the 49
Ti resonance of TiCl4 (neat). 49
Ti is the nucleus of choice because it is
more sensitive and yields narrower lines than 47
Ti. Both isotopes show moderately sharp lines
in symmetric molecular environments. The samples are very sensitive to moist air and
therefore, they were packed into the 4 mm rotor under N2 using a gloves box.
For determination of TiO2 content of the samples PAOT was fully hydrolysed using a mixture
of ethanol and water (volume ratio 1:1). The solvent was removed by naturally evaporation at
room temperature overnight. Than calcinations in a Muffel oven at 900 °C were done until a
constant mass of the residue was obtained.
For testing the hydrolytic stability of PAOT the sample was dissolved in chloroform
with tested water content (31.4 ppm) and in a weight concentration of 10 g/L. The solutions
were stored in a glass cell (OS glass, for Zetasizer) and sealed with PTFE cap in the
laboratory. Zetasizer Nano Series, Malvern Instruments (at a scattering angle of 173°). was
used to monitor the growth of the TiO2 particles.
Characterization of TiO2 film. The topography of the TiO2 film was investigated by
using tapping mode atomic force microscopy (AFM, NanoScope IIIa, Digital Instruments
Veeco Instruments, Santa Barbara, CA) in ambient condition. Commercially available
standard silicon cantilevers (PPPNCH from Nanosensors) with a spring constant of ~42 N/m
and an oscillation frequency of ~330 kHz were used. All of the picture analyses were
processed by using the Digital Instruments software, NanoScope, version 5.12r5.
X-ray Photoelectron Spectroscopy (XPS) measurement was carried out with an Ultra
Axis™ spectrometer (manufacturer: Kratos Analytical Ltd., Manchester, England) to detect
the surface chemical composition of the TiO2 film.
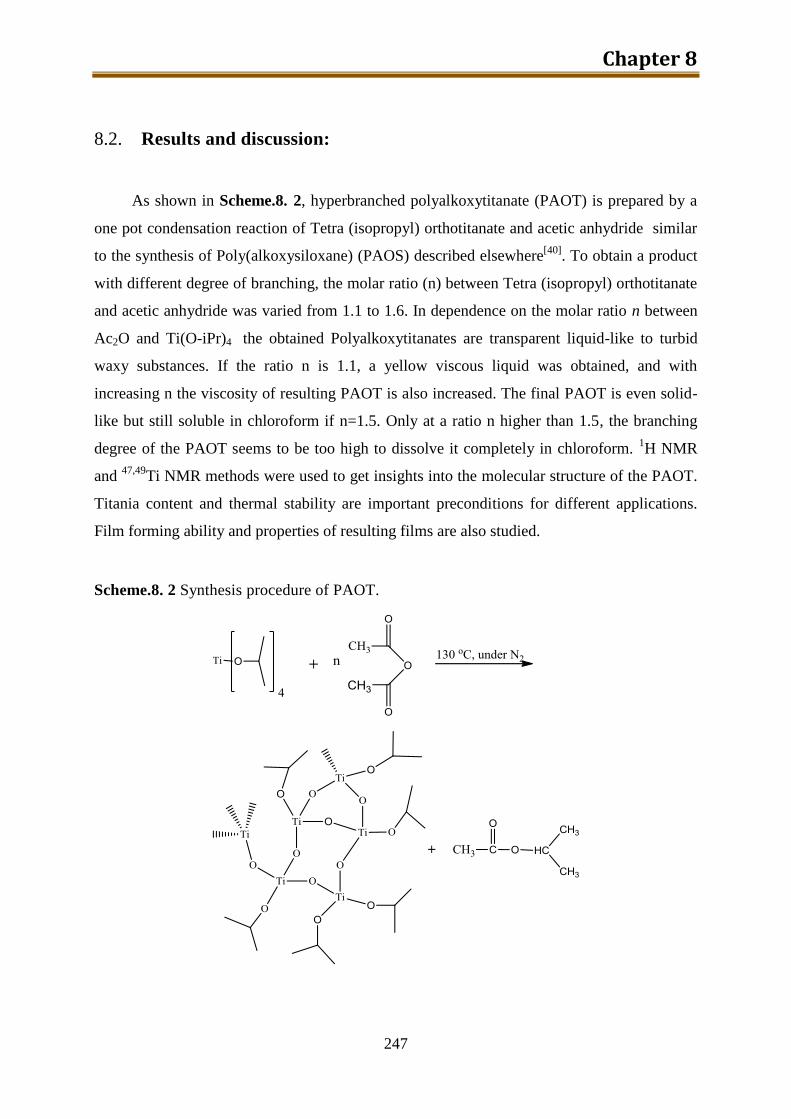
Chapter 8
247
8.2. Results and discussion:
As shown in Scheme.8. 2, hyperbranched polyalkoxytitanate (PAOT) is prepared by a
one pot condensation reaction of Tetra (isopropyl) orthotitanate and acetic anhydride similar
to the synthesis of Poly(alkoxysiloxane) (PAOS) described elsewhere[40]
. To obtain a product
with different degree of branching, the molar ratio (n) between Tetra (isopropyl) orthotitanate
and acetic anhydride was varied from 1.1 to 1.6. In dependence on the molar ratio n between
Ac2O and Ti(O-iPr)4 the obtained Polyalkoxytitanates are transparent liquid-like to turbid
waxy substances. If the ratio n is 1.1, a yellow viscous liquid was obtained, and with
increasing n the viscosity of resulting PAOT is also increased. The final PAOT is even solid-
like but still soluble in chloroform if n=1.5. Only at a ratio n higher than 1.5, the branching
degree of the PAOT seems to be too high to dissolve it completely in chloroform. 1H NMR
and 47,49
Ti NMR methods were used to get insights into the molecular structure of the PAOT.
Titania content and thermal stability are important preconditions for different applications.
Film forming ability and properties of resulting films are also studied.
Scheme.8. 2 Synthesis procedure of PAOT.
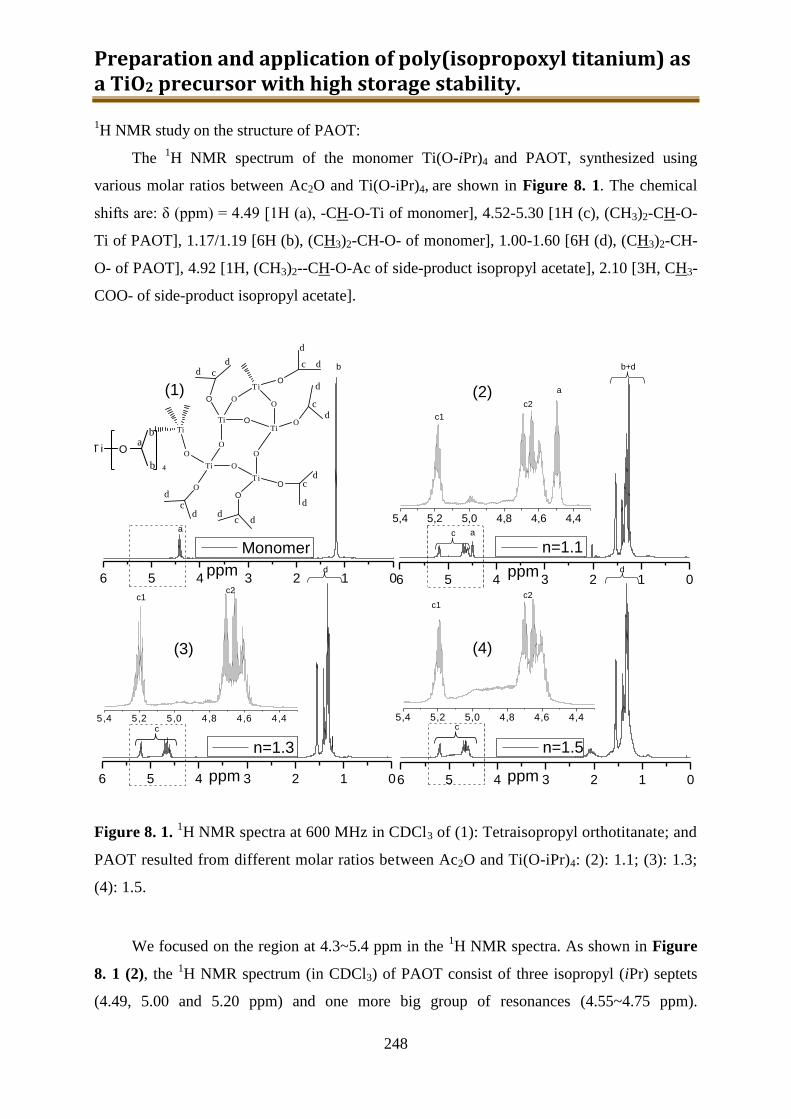
Preparation and application of poly(isopropoxyl titanium) as a TiO2 precursor with high storage stability.
248
1H NMR study on the structure of PAOT:
The 1H NMR spectrum of the monomer Ti(O-iPr)4 and PAOT, synthesized using
various molar ratios between Ac2O and Ti(O-iPr)4, are shown in Figure 8. 1. The chemical
shifts are: δ (ppm) = 4.49 [1H (a), -CH-O-Ti of monomer], 4.52-5.30 [1H (c), (CH3)2-CH-O-
Ti of PAOT], 1.17/1.19 [6H (b), (CH3)2-CH-O- of monomer], 1.00-1.60 [6H (d), (CH3)2-CH-
O- of PAOT], 4.92 [1H, (CH3)2--CH-O-Ac of side-product isopropyl acetate], 2.10 [3H, CH3-
COO- of side-product isopropyl acetate].
6 5 4 3 2 1 06 5 4 3 2 1 0
6 5 4 3 2 1 06 5 4 3 2 1 0
5,4 5,2 5,0 4,8 4,6 4,4
ppm
cc
ppm
n=1.3
c
d
c1
c2
(3)
5,4 5,2 5,0 4,8 4,6 4,4
dppm
T i O
4
ab
b
ppm
n=1.5
c2
(4)
5,4 5,2 5,0 4,8 4,6 4,4
n=1.1
c1
a
c1
c2(2)
a
Ti
O
O
O
O
Ti
Ti
Ti
O
O
O
O
O
TiO
O
TiO
O
cdd c
d
d
d
cd
dc
d
dcdd
cd
Monomer
a
b b+d
(1)
Figure 8. 1. 1H NMR spectra at 600 MHz in CDCl3 of (1): Tetraisopropyl orthotitanate; and
PAOT resulted from different molar ratios between Ac2O and Ti(O-iPr)4: (2): 1.1; (3): 1.3;
(4): 1.5.
We focused on the region at 4.3~5.4 ppm in the 1H NMR spectra. As shown in Figure
8. 1 (2), the 1H NMR spectrum (in CDCl3) of PAOT consist of three isopropyl (iPr) septets
(4.49, 5.00 and 5.20 ppm) and one more big group of resonances (4.55~4.75 ppm).
Chapter 8
249
Comparing the spectra in Figure 8. 1 (2) with that of the monomer (Figure 8. 1 (1)) and of
side-product isopropyl acetate[42]
, it is easy to assign the resonance at 4.49 and 5.00 ppm to
the single proton (CH) in iPr groups of the unreacted monomer Ti(O-iPr)4 and side-product
isopropyl acetate. Because of the high viscosity of the final product PAOT, the side-product
isopropyl acetate can not be removed completely even at 10-2
mbar. But, after being dissolved
by a solvent, e.g. toluene or chloroform, and spin-casted, this side-product is evaporating and
won’t affect the final titanium dioxide (TiO2) films.
By increasing the ratio n between Ac2O and Ti(O-iPr)4 from 1.1 to 1.3, the signal of the
i-Propyl groups of the monomer (4.49 ppm) disappears. This proves that almost all of the
monomer is chemically bonded on PAOT. But the proton signal of CH in i-Propyl groups of
PAOT still split into two groups at 4.55~4.75 (c1) and 5.20 (c2) ppm. By the way, the ratios
of the intensities of these two groups are almost constant (c2/c1=2.86~2.97). In Davison’s
paper[43]
, a result from NOESY and COSY measurements was published which assigned a
couple of similar resonances at around 4.63 and 5.14 ppm to the single proton in two different
i-Propyl groups in a chiral structure of Ti3(R)2(OiPr)8. In our case we can expect that these
two groups of signal can also be assigned to single protons of i-Propyl groups in different
chiral environment.
47,49Ti NMR Measurements of PAOT:
High-resolution 47,49
Ti MAS NMR spectra of the monomer tetra(isopropyl) orthotitanate
and PAOT with different molar ratios between Ac2O and Ti(O-iPr)4 are shown in Figure 8. 2.
The spectrum of the sample with a ratio n of 1.1 shows two narrow 47,49
Ti resonances (the top
spectrum in Figure 8. 2). The absolute sensitivity of 49
Ti nuclei is about 1.36 higher
compared with the 47
Ti nuclei which is in a good agreement with the integral intensities of the
resonances of Figure 8. 2. The quadrupolar moment of 47
Ti and 49
Ti is 30.2x10-39
m2 and
24.7x10-39
m2, respectively. Therefore, the line width due to relaxation induced by molecular
motions is larger for the 47
Ti resonance (Figure 8. 2). The NMR spectrum is similar to that of
TiCl4 showing that for this polytitanate sample there are symmetric and identical
environments around titanium isotopes. With the increasing size of the polycondensate the
resonances become broader due to faster relaxation to observe with a high-resolution NMR
spectrometer as shown in the bottom spectrum of Figure 8. 2.
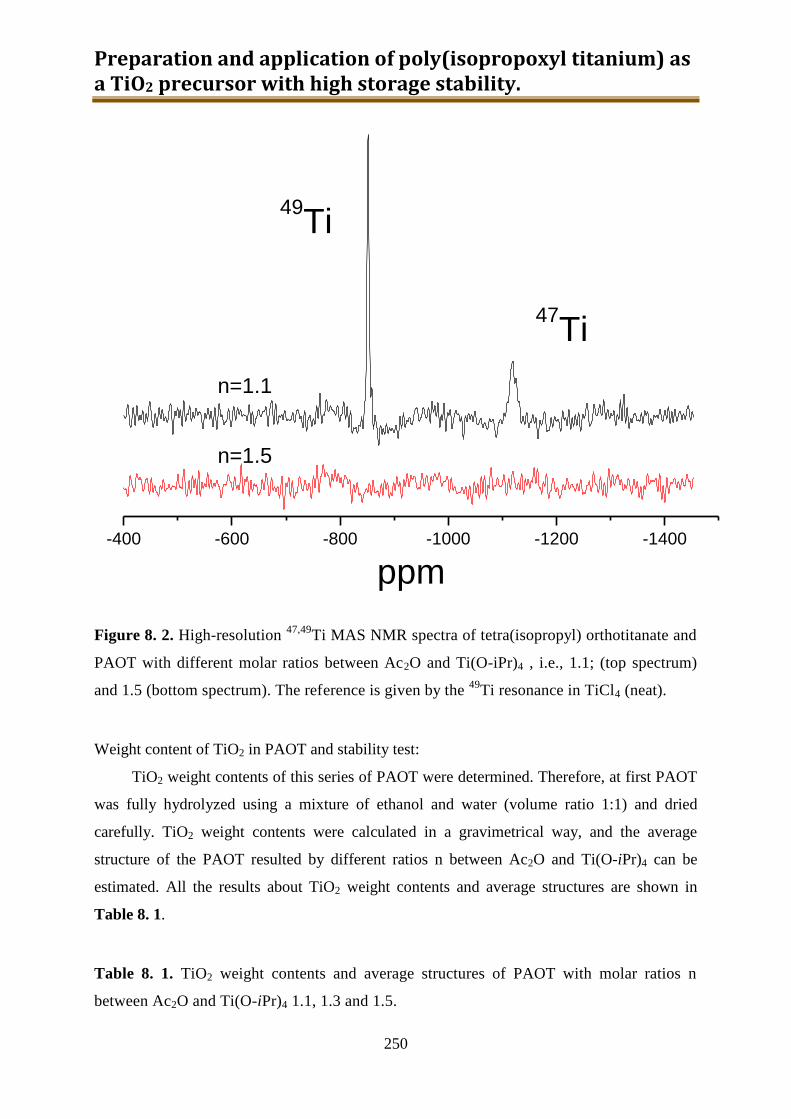
Preparation and application of poly(isopropoxyl titanium) as a TiO2 precursor with high storage stability.
250
-400 -600 -800 -1000 -1200 -1400
47Ti
49Ti
ppm
n=1.1
n=1.5
Figure 8. 2. High-resolution 47,49
Ti MAS NMR spectra of tetra(isopropyl) orthotitanate and
PAOT with different molar ratios between Ac2O and Ti(O-iPr)4 , i.e., 1.1; (top spectrum)
and 1.5 (bottom spectrum). The reference is given by the 49
Ti resonance in TiCl4 (neat).
Weight content of TiO2 in PAOT and stability test:
TiO2 weight contents of this series of PAOT were determined. Therefore, at first PAOT
was fully hydrolyzed using a mixture of ethanol and water (volume ratio 1:1) and dried
carefully. TiO2 weight contents were calculated in a gravimetrical way, and the average
structure of the PAOT resulted by different ratios n between Ac2O and Ti(O-iPr)4 can be
estimated. All the results about TiO2 weight contents and average structures are shown in
Table 8. 1.
Table 8. 1. TiO2 weight contents and average structures of PAOT with molar ratios n
between Ac2O and Ti(O-iPr)4 1.1, 1.3 and 1.5.
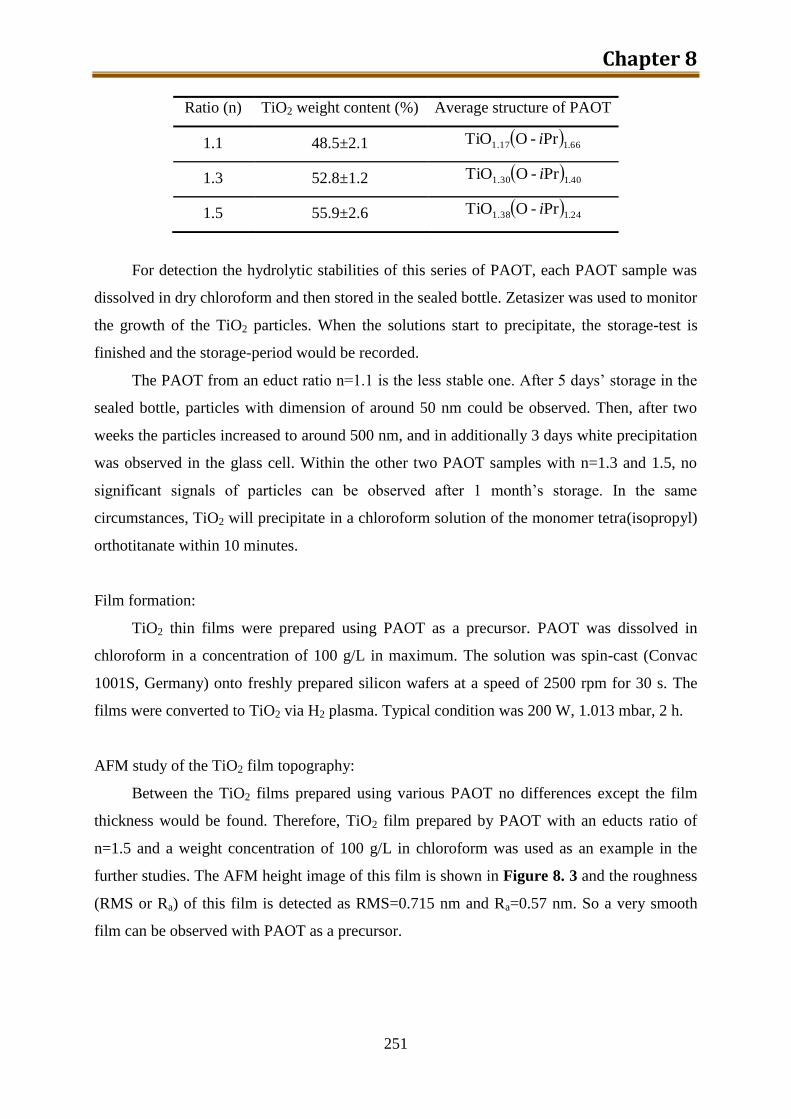
Chapter 8
251
Ratio (n) TiO2 weight content (%) Average structure of PAOT
1.1 48.5±2.1 66.11.17 Pr-OTiO i
1.3 52.8±1.2 40.11.30 Pr-OTiO i
1.5 55.9±2.6 24.11.38 Pr-OTiO i
For detection the hydrolytic stabilities of this series of PAOT, each PAOT sample was
dissolved in dry chloroform and then stored in the sealed bottle. Zetasizer was used to monitor
the growth of the TiO2 particles. When the solutions start to precipitate, the storage-test is
finished and the storage-period would be recorded.
The PAOT from an educt ratio n=1.1 is the less stable one. After 5 days’ storage in the
sealed bottle, particles with dimension of around 50 nm could be observed. Then, after two
weeks the particles increased to around 500 nm, and in additionally 3 days white precipitation
was observed in the glass cell. Within the other two PAOT samples with n=1.3 and 1.5, no
significant signals of particles can be observed after 1 month’s storage. In the same
circumstances, TiO2 will precipitate in a chloroform solution of the monomer tetra(isopropyl)
orthotitanate within 10 minutes.
Film formation:
TiO2 thin films were prepared using PAOT as a precursor. PAOT was dissolved in
chloroform in a concentration of 100 g/L in maximum. The solution was spin-cast (Convac
1001S, Germany) onto freshly prepared silicon wafers at a speed of 2500 rpm for 30 s. The
films were converted to TiO2 via H2 plasma. Typical condition was 200 W, 1.013 mbar, 2 h.
AFM study of the TiO2 film topography:
Between the TiO2 films prepared using various PAOT no differences except the film
thickness would be found. Therefore, TiO2 film prepared by PAOT with an educts ratio of
n=1.5 and a weight concentration of 100 g/L in chloroform was used as an example in the
further studies. The AFM height image of this film is shown in Figure 8. 3 and the roughness
(RMS or Ra) of this film is detected as RMS=0.715 nm and Ra=0.57 nm. So a very smooth
film can be observed with PAOT as a precursor.
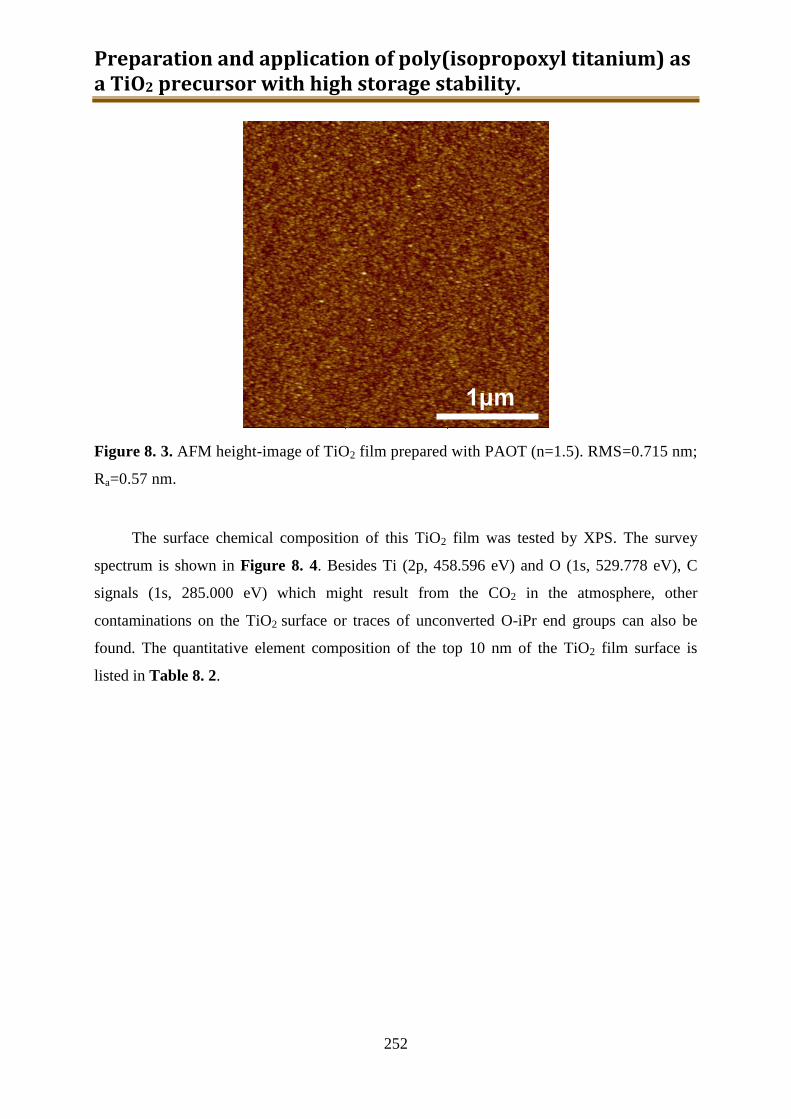
Preparation and application of poly(isopropoxyl titanium) as a TiO2 precursor with high storage stability.
252
Figure 8. 3. AFM height-image of TiO2 film prepared with PAOT (n=1.5). RMS=0.715 nm;
Ra=0.57 nm.
The surface chemical composition of this TiO2 film was tested by XPS. The survey
spectrum is shown in Figure 8. 4. Besides Ti (2p, 458.596 eV) and O (1s, 529.778 eV), C
signals (1s, 285.000 eV) which might result from the CO2 in the atmosphere, other
contaminations on the TiO2 surface or traces of unconverted O-iPr end groups can also be
found. The quantitative element composition of the top 10 nm of the TiO2 film surface is
listed in Table 8. 2.
1μm
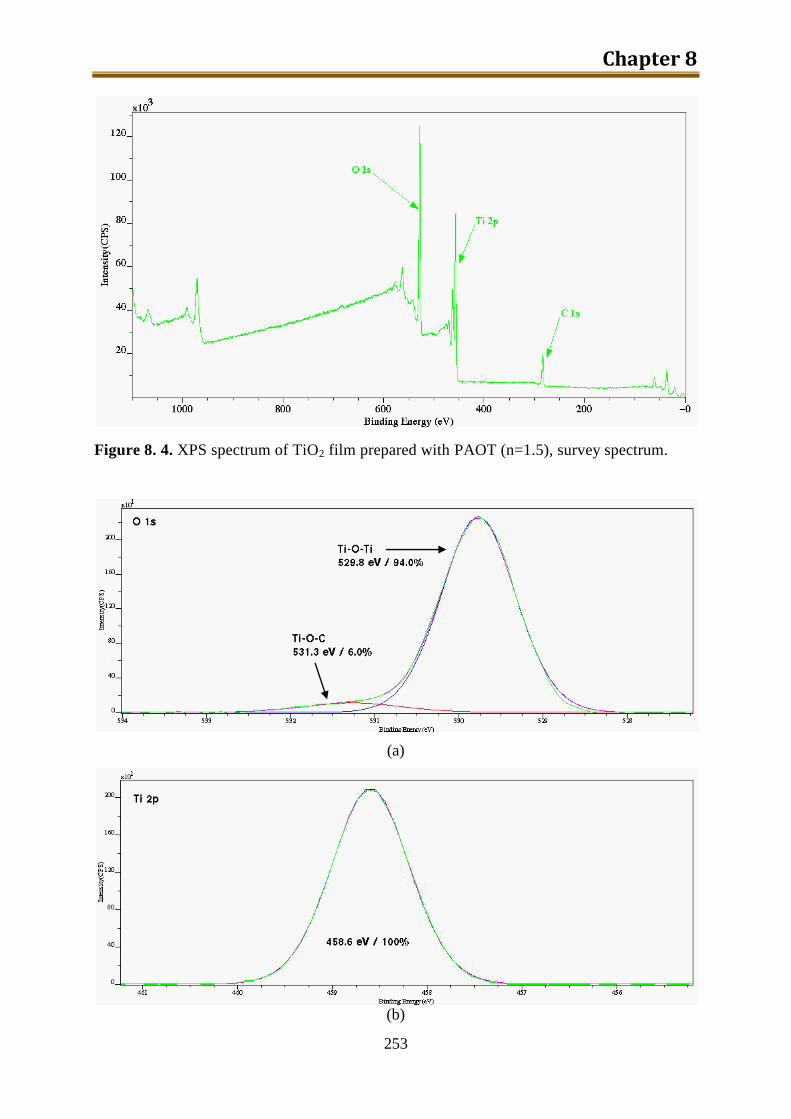
Chapter 8
253
Figure 8. 4. XPS spectrum of TiO2 film prepared with PAOT (n=1.5), survey spectrum.
(a)
(b)
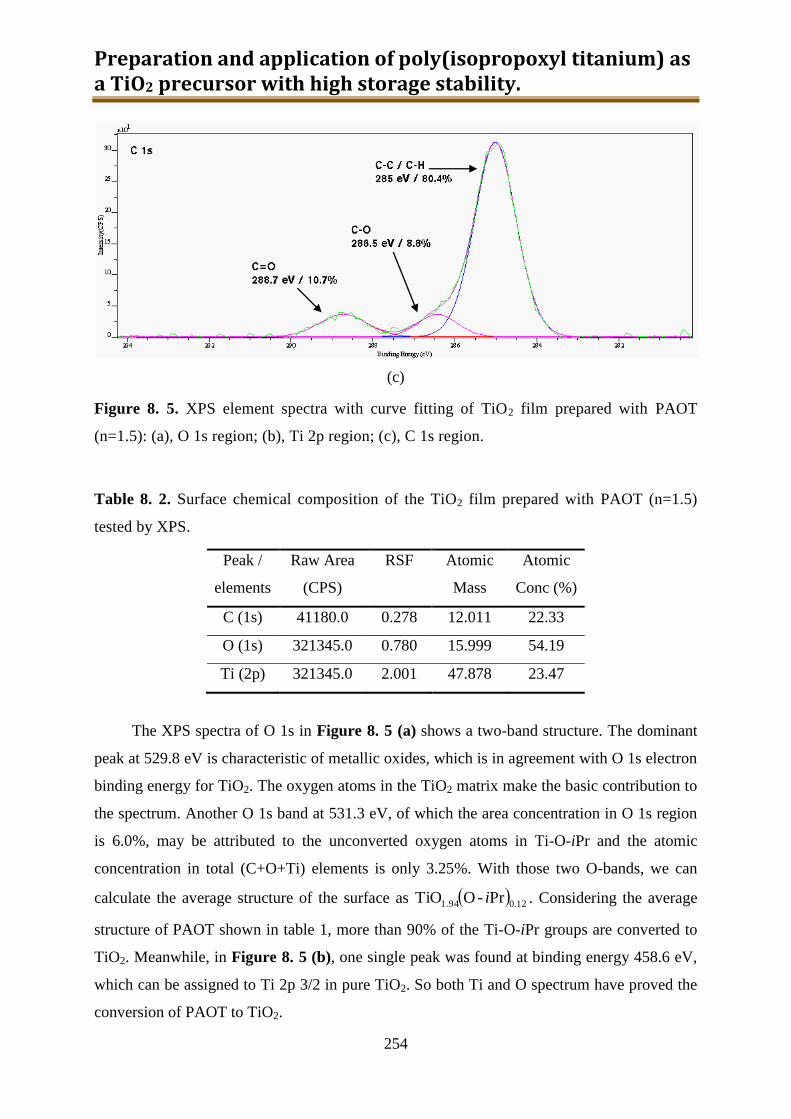
Preparation and application of poly(isopropoxyl titanium) as a TiO2 precursor with high storage stability.
254
(c)
Figure 8. 5. XPS element spectra with curve fitting of TiO2 film prepared with PAOT
(n=1.5): (a), O 1s region; (b), Ti 2p region; (c), C 1s region.
Table 8. 2. Surface chemical composition of the TiO2 film prepared with PAOT (n=1.5)
tested by XPS.
Peak /
elements
Raw Area
(CPS)
RSF Atomic
Mass
Atomic
Conc (%)
C (1s) 41180.0 0.278 12.011 22.33
O (1s) 321345.0 0.780 15.999 54.19
Ti (2p) 321345.0 2.001 47.878 23.47
The XPS spectra of O 1s in Figure 8. 5 (a) shows a two-band structure. The dominant
peak at 529.8 eV is characteristic of metallic oxides, which is in agreement with O 1s electron
binding energy for TiO2. The oxygen atoms in the TiO2 matrix make the basic contribution to
the spectrum. Another O 1s band at 531.3 eV, of which the area concentration in O 1s region
is 6.0%, may be attributed to the unconverted oxygen atoms in Ti-O-iPr and the atomic
concentration in total (C+O+Ti) elements is only 3.25%. With those two O-bands, we can
calculate the average structure of the surface as 12.01.94 Pr-OTiO i . Considering the average
structure of PAOT shown in table 1, more than 90% of the Ti-O-iPr groups are converted to
TiO2. Meanwhile, in Figure 8. 5 (b), one single peak was found at binding energy 458.6 eV,
which can be assigned to Ti 2p 3/2 in pure TiO2. So both Ti and O spectrum have proved the
conversion of PAOT to TiO2.
Chapter 8
255
In Figure 8. 5 (c), a three-band carbon signal was observed. The main peak at binding
energy of 285.0 eV is related with C-C or C-H bonds and was used as a reference to adjust the
binding energy. Because the samples were exposed to air before XPS measurements, another
small peak at 288.7 eV could be found in the spectrum and should be mainly related to C=O
bonds which were contained mainly in the organic contamination or the carbon dioxide on the
TiO2 surface . At 286.4 eV, a small peak related to C-O bonds could probably help us to
figure out the percentage of unconverted O-iPr groups. The atomic concentration of the C 1s
band at 286.4 eV in total (C+O+Ti) elements is 1.96%. Comparing with O 1s band at 531.3
eV, this peak could be related with the CH connected with O in the unconverted O-iPr groups.
In addition, the signal of CH3 in O-iPr groups could be covered already in the C 1s main peak
at 285.0 eV.
8.3. Conclusion
A new polymeric precursor of TiO2 which is named “Polyalkoxy titanate (PAOT)” was
prepared by one-step condensation of Ti(O-iPr)4. The precursor has a much higher stability
comparing with the monomer Ti(O-iPr)4 and can easily be stored in a solvent such as
chloroform without use of any additional protections. The hydrolytic stability depends on the
ration of Ti(O-iPr)4 and acetic anhydride in the synthesis. From this precursor, a smooth TiO2
film can be prepared by spin-cast followed with H2 plasma-curing. After curing, more than
90% of Ti-OiPr could convert to TiO2 film. So, TiO2 film can be prepared by PAOT as a
precursor using common lab-solvents by known casting methods, e.g. spin-casting or dip-
coating.
References:
[1]. Fujishima, A., Honda, K., and Kikuchi, K., Kogyo Kagaku Zasshi, 1969. 72: p.
108-113.
[2]. Kitamura, T., et al., Chemistry of Materials, 2004. 16(9): p. 1806-1812.
[3]. Wang, Z.S., et al., Journal of Physical Chemistry B, 2000. 104(41): p. 9676-9682.
[4]. Fujishima, A. and Honda, K., Nature, 1972. 238(5358): p. 37-+.
[5]. Frank, S.N. and Bard, A.J., Journal of the American Chemical Society, 1977.
99(1): p. 303-304.
[6]. Schwitzgebel, J., et al., Journal of Physical Chemistry, 1995. 99(15): p. 5633-5638.
Preparation and application of poly(isopropoxyl titanium) as a TiO2 precursor with high storage stability.
256
[7]. Anpo, M., et al., Journal of Physical Chemistry, 1985. 89(23): p. 5017-5021.
[8]. Heller, A., Accounts of Chemical Research, 1995. 28(12): p. 503-508.
[9]. Yoko, T., et al., Thin Solid Films, 1996. 283(1-2): p. 188-195.
[10]. O'Shea, K.E., Pernas, E., and Saiers, J., Langmuir, 1999. 15(6): p. 2071-2076.
[11]. Sawunyama, P., Fujishima, A., and Hashimoto, K., Langmuir, 1999. 15(10): p.
3551-3556.
[12]. Thompson, D.W., et al., Langmuir, 1999. 15(3): p. 650-653.
[13]. Harris, C.S., The Glass Researcher, 2003. 12: p. 32.
[14]. Wang, R., et al., Nature, 1997. 388(6641): p. 431-432.
[15]. Watanabe, T., et al., Thin Solid Films, 1999. 351(1-2): p. 260-263.
[16]. Sopyan, I., et al., Chemistry Letters, 1994(4): p. 723-726.
[17]. Paz, Y., et al., Journal of Materials Research, 1995. 10(11): p. 2842-2848.
[18]. Tunesi, S. and Anderson, M., Journal of Physical Chemistry, 1991. 95(8): p. 3399-
3405.
[19]. Papp, J., et al., Chemistry of Materials, 1993. 5(3): p. 284-288.
[20]. Langlet, M., et al., Journal of Sol-Gel Science and Technology, 2002. 25(3): p.
223-234.
[21]. Negishi, N., et al., Chemistry Letters, 1995(9): p. 841-842.
[22]. Chhabra, V., et al., Langmuir, 1995. 11(9): p. 3307-3311.
[23]. Weinberger, B.R. and Garber, R.B., Applied Physics Letters, 1995. 66(18): p.
2409-2411.
[24]. Cao, L.X., et al., Journal of Physical Chemistry B, 1999. 103(15): p. 2912-2917.
[25]. Kawai, T. and Sakata, T., Nature, 1980. 286(5772): p. 474-476.
[26]. Negishi, N., Takeuchi, K., and Ibusuki, T., Applied Surface Science, 1997. 121: p.
417-420.
[27]. Carp, O., Huisman, C.L., and Reller, A., Progress in Solid State Chemistry, 2004.
32(1-2): p. 33-177.
[28]. Sakai, N., et al., Journal of Physical Chemistry B, 2001. 105(15): p. 3023-3026.
[29]. Blossey, R., Nature Materials, 2003. 2(5): p. 301-306.
[30]. Seemann, R., Monch, W., and Herminghaus, S., Europhysics Letters, 2001. 55(5):
p. 698-704.
[31]. Huppert, H.E., Nature, 1982. 300(5891): p. 427-429.
Chapter 8
257
[32]. Fuyuki, T. and Matsunami, H., Japanese Journal of Applied Physics Part 1-
Regular Papers Short Notes & Review Papers, 1986. 25(9): p. 1288-1291.
[33]. Bertrand, P.A. and Fleischauer, P.D., Thin Solid Films, 1983. 103(1-2): p. 167-
175.
[34]. Babonneau, F., Bois, L., and Livage, J., Journal of Non-Crystalline Solids, 1992.
147: p. 280-284.
[35]. Morris, H.B., Texas Instruments Incorporated US4200474 A, 1978.
[36]. Lottiaux, M., et al., Thin Solid Films, 1989. 170(1): p. 107-126.
[37]. Suhail, M.H., Rao, G.M., and Mohan, S., Journal of Applied Physics, 1992. 71(3):
p. 1421-1427.
[38]. Schroder, H., Physics of Thin Films, ed. Hass, G. and Thun, R.E. Vol. 5. 1969,
New York: Academic. 87.
[39]. Yoldas, B.E. and Okeeffe, T.W., Applied Optics, 1979. 18(18): p. 3133-3138.
[40]. Zhu, X.M., et al., Macromolecules, 2006. 39(5): p. 1701-1708.
[41]. Jaumann, M., Hyperbranched Polyalkoxysiloxanes: Synthesis, Characterization
and Applications, in DWI. 2008, RWTH: Aachen. p. 173.
[42]. Alexandre, M. and Dubois, P., Materials Science & Engineering R-Reports, 2000.
28(1-2): p. 1-63.
[43]. Davidson, M.G., et al., Polyhedron, 2007. 26: p. 975-980.
Acknowledgements.
258
Acknowledgements
The present Ph.D thesis is the result of the work that has been performed in the
laboratories of DWI at the RWTH Aachen between September of 2007 and October of 2011
under the supervision of Prof. Dr. Martin Möller.
It is my great pleasure to express the depth of my gratitude to those people who made
this thesis possible.
First of all, I would like to express my appreciation and thanks to my supervisor, Prof.
Dr. Martin Möller, for this interesting topic, wise discussion, scientific support and granting
me a large freedom in my research. It is my honour to have this opportunity working in DWI
under your supervision.
I would also like to thank Dr. Karin Peter, who was my project leader through my Ph.D
study, for her valuable discussions, scientific support and all her other help both in the
laboratory and in my daily life. Thanks again for guiding me in the right direction all the time.
We should be firmly linked via “PAOS” in the future.
I appreciate Dr. Xiaomin Zhu, for his great help throughout my Ph.D study. As the first
person I knew in Aachen and first friend I made in Aachen, he has given me priceless help
both on my research and my life. Furthermore, I would like to thank Prof. Dr. Dan Demco for
all his guidance on all my NMR measurements and Prof. Dr. Crisan Popescu for his support on all
the thermal analysis in my research. Thanks to Dr. Henri Gruenbauer (Nimaro Ageno Consult)
and Dr. Paul Cookson (DOW, Horgen) for their professional advice on PU foams, and thanks to
Daniel Hoehener (DOW, Horgen) for his efforts on PU foam preparation. Thanks to Meike
Robisch (IKV, RWTH) for all her kindly help in the lab in IKV.
To all my other colleagues in DWI and ITMC, thank you very much for the
unforgettable four years. I can only address some special thanks. To my Russian friend
Nikolay Belov, as my lab mate for more than half of my Ph.D study, many thanks for his
support in the lab and interesting discussions. Thanks to Dr. Hailin Wang and Ting Liu for
your kindly help on operating TEM. Thanks to Dr. Kim Ho Phan and Mr. Stephan Rütten for
their help on my FESEM. To Yaodong Wu, Heng Zhang, Dr. Lei Li, Qingxin Zhao,
Yongliang Zhao, René Spiertz, Dr. Antje Jung, Dr. Yingchun He, Ziyun Zhang, Jing Jin,
Yanqing Li, Manisha Gupta, Dr. Ibrahim Hassounah, Dr. Heidron Keul, Smriti Sigh, Tsolmon

Acknowledgements.
259
Narangerel, Dr. Dragos Popescu, Dr. Jingbo Wang, thank you all for all the help and
discussion. I would like to address special thanks to our DWI purchase manager Sike
Scharfenberger (Ortmann) for her kindly help on ordering chemicals and glassware, and also
for daily German practise.
I appreciate all my Chinese friends in Aachen, Dr. Yan Li, Qing Sun, Ang Li, Liyong
Yu, Yifei Long, Haoting Yu, Xiaobin Xu, Min Chen, Nianchen Xu, thanks for staying with
me and my family in Aachen.
Special thanks to Dr. Sandeep Tyagi (Borealis, Linz) and Dr. Dusan Jeremic (Borealis,
Linz) for your kindly support.
The most important thanks should be addressed to my dearest family: my parents, my
parents in law, my wife Dr. Cheng Cheng and my daughter Tangdou. Thank you all for loving
me and supporting me for no reason. I want to address my best love to my wife, for all her
love and patience on me, and of course, for bringing me such a lovely daughter. And to
Niuniu, you are my biggest achievement in Aachen!
At last, I would like to acknowledge financial support from DOW chemical for my
four years’ research.