Micromechanics and macromechanics of carbon nanotube-enhanced elastomers

Poly(hydroxyalkanoate) Elastomers and Their GrapheneNanocomposites∥
John S. F. Barrett,†,‡ Ahmed A. Abdala,*,§,⊥ and Friedrich Srienc*,†,‡
†Department of Chemical Engineering and Materials Science, University of Minnesota, Minneapolis, Minnesota 55455, United States‡Biotechnology Institute, University of Minnesota, St. Paul, Minnesota 55108, United States§Department of Chemical Engineering, the Petroleum Institute, Abu Dhabi, United Arab Emirates⊥Department of Chemical Engineering and Petroleum Refining, Faculty of Petroleum and Mining Engineering, Suez University, Suez,Egypt
*S Supporting Information
ABSTRACT: Medium-chain-length poly(hydroxyalkanoate)s(PHAmcl) are biodegradable and renewable biopolymers withelastomeric qualities. Here we report on the preparation andcharacterization of composite materials using thermallyreduced graphene (TRG) nanoparticles as filler with threePHAmcl polymers. The matrices vary with respect to chainpacking length, capacity for noncovalent bonding with theTRG surface, and the presence of covalent cross-linking.Results show that the addition of up to 2.5 vol % TRG toPHAmcl increases the melting temperature by 1−3 °C, themodulus by 200−590%, and the electrical conductivity by >7 orders of magnitude. Additionally, we use rheology and microscopyto characterize the composites. We discuss our results in light of polymer entanglement theory and the effects of polymerstructure, filler loading volume, and the role of graphene-polymer interfacial forces. We extend our discussion by comparing themodulus enhancements of PHAmcl composites to those reported in other studies in which layered carbon nanofillers arecombined with structurally related biopolyesters including: polylactide, polylactide-co-polyglycolide, polycaprolactone, and twoother PHA copolymers.
■ INTRODUCTION
Poly(3-(R)-hydroxyalkanoates) (PHA) are a class of polymericmaterials produced naturally by a variety of environmentalmicroorganisms as a means of carbon and energy storageduring times of nutrient excess.1 Polymer synthesis occurs viathe action of a synthase enzyme and results in the accumulationof small insoluble inclusions within the cell. Purification of PHAfrom residual cell biomass produces a plastic material withphysical and mechanical properties similar to those ofpetroleum-derived polymers. The desirability of PHA is dueto its characteristics of rapid biodegradation,1 biocompatibilityfor use in medical applications,2 and synthesis from a variety ofrenewable feedstocks including sugars,3 plant oils,4 industrialand municipal waste streams,5 and carbon dioxide.6 Poly-hydroxybutyrate (PHB, C4), the most common form of PHA,has a Young’s modulus of 3.5−4 GPa, < 5% elongation at break,and a melting temperature of 175−180 °C.7 Medium-chain-length poly(hydroxyalkanoate)s (PHAmcl, C6−C14), which aremore elastomeric, have a Young’s modulus of 0.003−0.07 GPa,up to 500% elongation at break, and a melting temperature of45−60 °C.8,9 Despite the useful characteristics of these basicforms of PHA, their continued proliferation into newapplications requires the development of a more diverserange of physical and mechanical properties.
One commonly employed technique for enhancing thephysical and mechanical properties of polymers is via theformation of composite materials by dispersion of fillers intothe polymer matrix. Moreover, a growing trend has been in theuse of nanosized filler materials, i.e., nanocomposites. Becauseof their small size, nanofillers provide a large surface area formolecular contact with the polymer chains at a minimalloading. A few PHB composites have already been studied withnanofillers including: wood flour,10 clay,11 layered silicate,12 andcarbon nanotubes.13,14 The addition of these nanofillersresulted in changes in the thermal, mechanical, andcrystallization properties of PHB.Among nanofiller materials, carbon allotropes, which include
exfoliated graphite,15 carbon nanotubes,16 and graphene,17 havereceived additional attention because of their exceptionalstrength, low weight, and capacity for electrical conductivity.Graphene, the nanofiller used in this study, is an atomic-thicksheet of sp2-hybridized carbon atoms. With measured Young’smodulus and ultimate strength of 1 TPa and 130 GPa,respectively, graphene is the stiffest and strongest material ever
Received: January 4, 2014Revised: May 11, 2014Published: June 10, 2014
Article
pubs.acs.org/Macromolecules
© 2014 American Chemical Society 3926 dx.doi.org/10.1021/ma500022x | Macromolecules 2014, 47, 3926−3941
measured.18 The theoretical surface area of graphene19 isestimated to be 2630 m2/g. The addition of graphene to variouspolymers has been shown to enhance their resistance tothermal degradation, improve mechanical properties, increaseelectrical conductivity, and lower gas permeability.20 Moreover,theoretical and experimental results indicate that the modulusenhancement with graphene addition is more pronounced withlow-modulus, elastomeric polymers than with high-modulus,glassy polymers.20 Therefore, the addition of graphene has asignificant potential for creating a range of useful functionalitiesin a class of polymers that is highly valued for its eco-friendlyand biocompatible qualities.Understanding the way by which a nanofiller affects the
viscoelastic properties of dense polymer systems is based on thetheory of polymer entanglements. These entanglements canform between neighboring polymer chains21−23 as well asbetween the polymer and the nanofiller.24−28 Adding nanofillerto a polymer matrix alters its viscoelastic behavior due to theformation of additional entanglements between the particlesand the polymer chains, thereby enhancing the stiffness of thepolymer matrix. While attractive intermolecular forces betweenthe matrix and filler do contribute to the viscoelastic behaviorof nanocomposites, size, shape and aspect ratio of thenanofillers also have significant influence on reinforcingeffects,26,29,30 and the existence of molecular attraction betweenthe matrix and filler is not required for reinforcement tooccur.28,31 The prevalent theory of this phenomenon is thatnoninteracting nanoparticles block and confine the primitivepaths of reptating chains, creating entanglements purely basedon physical interactions.26−28
When interfacial forces between graphene sheets and thepolymer matrix are significantly attractive, additional entangle-ments can originate at the interface.25 Transmission of stressbetween the matrix and the graphene surface can occur via π−πstacking, cation-π, or van der Waals interactions with availablesp2 networks.32 Graphite oxide (GO), an alternate form ofgraphene, contains additional moieties such as epoxide,carbonyl, and hydroxyl groups on the surface that permit theformation of hydrogen bonds. GO can be reduced chemicallyor thermally to produce reduced graphene with much loweroxygen content than GO. In this study, we use thermallyreduced graphene (TRG) which is synthesized by rapid heatingof GO that leads to simultaneous reduction and exfoliation ofthe GO layers. The C:O ratio of TRG is 10:1 compared to 2:1for GO33 While hydrogen bonding can occur between TRGand the polymer matrix, it can also occur between multiplesheets of TRG, thereby leading to particle aggregation and poordispersion. Modification of reduced graphene by incorporatingother chemical moieties on its surface can also be used topromote interfacial attraction with a specific matrix.20
Herein, we report on the preparation of composite materialsby incorporating TRG into three, unique PHAmcl copolymers:nominally, they are PHO (polhydroxyoctanoate, C8), PHD(polhydroxydecanoate, C10), and PHOe (polyhydroxyocte-noate, C8). The copolymers vary in their composition of C6,C8, and C10 monomers. While all polymers contain a majorityof C8 monomers, PHD contains a significant fraction of C10monomers and is predicted to have a greater packing lengthbased on its cross-section, which is wider than that of PHO.Thus, PHD should be less likely to participate in polymerentanglements. Moreover, the longer aliphatic appendages ofPHD can shield noncovalent bonding with the polyesterbackbone. PHOe is very similar to PHO with the exception that
PHOe contains a small fraction of C8 monomers with anunsaturated carbon at the terminal position. Thus, PHOe iscapable of forming a network structure via covalent cross-linking. We discuss the effectiveness of graphene reinforcementin each matrix in the theoretical context of polymerentanglements and the ability of each polymer to engage innoncovalent interactions with the oxygenated TRG surface.Finally, we compare our results to other studies in the literaturethat combine layered carbon nanofillers with similar biode-gradable polyesters. Figure 8 depicts the chemical structures ofthe different PHAmcl matrices along with related polyoxoesters.
■ MATERIALS AND METHODSPHA Synthesis. Synthesis of the various PHAmcl copolymers was
performed by a method similar to that used by Lageveen et al.34
Briefly, the polymers were produced by fed-batch biosynthesis usingthe wild-type organism Pseudomonas oleovorans in minimal media withspecific alkanes as the sole carbon source. Octane, decane, and octenewere used to synthesize polyhydroxyoctanoate (PHO) polyhydrox-ydecanoate (PHD) and polyhydroxyoctenoate (PHOe) respectively.More specifically, the PHOe copolymer was synthesized via repeatedcycles between octane and 1-octene. Previous studies on the synthesisof PHA copolymers suggested that repeated cycling between differentcarbon sources produces a mixture of the two corresponding polymertypes with some fraction of the polymer chains expected to be di- andtriblock-copolymers.35,36 Additional details of the biosynthesis areavailable in the Supporting Information.
Following polymer biosynthesis cells were harvested via centrifu-gation at 10 000 rpm for 20 min. The resulting cell pellet was flashfrozen in liquid nitrogen and lyophilized overnight to remove residualmoisture. Polymer material was extracted from the dried cells into 1-Lof boiling chloroform for 16 h using a Soxhlet apparatus. The extractwas concentrated by evaporation to 100 mL before precipitation inexcess methanol, 8:1 (v/v). The purified polymer was dried in air toremove excess solvent.
PHA Characterization. Purified PHAs were analyzed via gaschromatography fitted with a flame ionization detector (GC-17A,Shimadzu) using a DB-WAX column (ID 0.32 mm, 0.5 μm filmthickness) (Agilent Technologies). Prior to analysis, polyhydroxyalka-noic acids were converted to 3-hydroxyalkanoic propyl esters by themethod of propanolysis.37 Quantitative determination of differentPHAs was made by comparison to standards synthesized from purified3-hydroxyalkanoic acids (Sigma).
Polymer molecular weights were determined by gel permeationchromatography (PL GPC 220 high temperature chromatograph,Polymer Laboratories) using 3, PL-gel 10 μm mixed B columns inseries. TCB (1,2,4-triclorobenzene) was used as the mobile phase, andthe column was operated at 160 °C. Calibration of the instrument wasperformed using polystyrene standards, and molecular weights arereported in polystyrene equivalents.
Graphene Synthesis. Thermally reduced graphene (TRG) wasproduced following the thermal exfoliation method.33,38 In thismethod, graphite was first oxidized using Staudenmaier method39 asfollows: 5 g of graphite was placed in an ice-chilled flask containing amixture of 90 mL of H2SO4 and 45 mL of HNO3. Potassium chlorate,55 g, was slowly added to the cold reaction mixture. After 96 h, thereaction was quenched by combining the mixture with 4 L of water.The resulting graphite oxide (GO) was washed once in 5% HClfollowed by additional water washes to remove the residual acid beforedrying overnight in a vacuum oven. TRG was produced by exfoliatingthe GO via rapid heating in a tube furnace (Barnstead Thermolyne) at1000 °C under a flow of nitrogen for 30 s.
Graphene Characterization. Graphene was characterized by X-ray diffraction and transmission electron microscopy. Details of thesecharacterization methods are provided in the Supporting Information.
PHA−Graphene Nanocomposite Preparation. First, 1 g ofpolymer was mixed with 20 mL of chloroform in a sealed tube andagitated using a vortex mixer. Periodic incubation of the mixture in an
Macromolecules Article
dx.doi.org/10.1021/ma500022x | Macromolecules 2014, 47, 3926−39413927

80° water bath was used to promote dissolution. Second, graphene wasdispersed in chloroform at a concentration of 0.5 mg/mL. To promotethe dispersion of single graphene sheets, the mixture was sonicated for6 min using a probe type sonicator (Misonix 3000) at a power densityof 1.5−3 W/mL. The sonicator program consisted of 28 cycles of 15 ssonication followed by a 45 s rest period to dissipate heat. Thegraphene dispersion was then added to the polymer solution andstirred for 1 h. The nanocomposite solution was solvent-cast bytransferring it into a Petri dish placed over a 55 °C hot plate with lightstirring for ∼1 h. Films were dried overnight to remove excesschloroform.PHA−Graphene Nanocomposite Characterization. The non-
oxidative thermal stability of the pure and composite samples wasassessed using a simultaneous thermal analyzer (STG) (Netzsch STA449 F1 Jupiter), which performs both thermal gravimetric analysis(TGA) and differential scanning calorimetery (DSC). The polymernanocomposite sample (∼10 mg) was placed in a ceramic crucible andheated from 25−600 °C at a heating rate of 20 °C/min under nitrogenflow.The glass transition temperature (Tg), melting temperature (Tm),
and heat of melting (ΔHm) of the pure and composite samples weremeasured using differential scanning calorimetry (Netzsch 204 F1Phoenix). The polymer nanocomposite sample (6−10 mg) was placedin crimped but unsealed aluminum pans and heated from −60 to +250°C at a heating rate of 5°/min under nitrogen flow. All samples wereaged for 72 h prior to testing.Specimens for mechanical, rheological, and surface resistance
measurements were prepared using a hot-press (Tetrahedron, MTP-10) at 100 °C and 1.0 MPa for 5 min to form a thin film (0.4−0.5mm). Samples were aged at room temperature for >72 h prior totesting. Surface resistance measurements were obtained using an 11-point probe (Prostat Corp., PRF-914B probe with PRS-801 meter).For each sample, four readings were collected, two from each side ofthe film.The rheological properties of the pure and composite samples were
determined via dynamic oscillatory measurement (TA Instruments,AR2000ex) using an 8 mm parallel plate geometry. Strain andfrequency sweeps were performed on 8 × 0.5 mm circular disks at 70°C.The mechanical properties of the pure and composite samples were
measured using a dynamic mechanical analyzer (DMA) (TAInstruments, RSAIII). 50 × 5 x 0.5 mm specimens were tested at astrain rate of 5 mm/min.The fracture surface of the pure and composite samples were
examined using SEM (Philips FEI Quanta 200 SEM) operated at ahigh-vacuum mode.Dispersion of graphene within the polymer matrix was analyzed
with transmission electron microscopy (TEM) (JEOL, 1200 EXII).Thin sections of composite samples, 70−100 nm, for TEMcharacterization were prepared without resin embedding using anultramicrotome (Leica EM UC6) at −80 °C. Samples were mountedon 200-mesh copper grids with carbon type-B coating (Ted Pella)
■ RESULTS AND DISCUSSIONProperties of Purified PHA. Poly(hydroxyalkanoate)
(PHA) polymers were produced in vivo using the micro-organism Pseudomonas. oleovorans with different hydrocarbonsas substrates. The composition of different polymer samples
can be controlled via the type of carbon substrate fed to thebatch during biosynthesis, e.g., the metabolism of octaneproduces the monomer 3-(R)-hydroxyoctanoyl-CoA, anddecane produces 3-(R)-hydroxydecanoyl-CoA. However, dueto the cyclical nature of the β-oxidation pathway, whichdegrades these molecules, the metabolism of a single substrateproduces a random copolymer consisting of related monomersdiffering by −2n carbons, where n is number of β-oxidationcycles.7 A detailed description and schematic of this process areincluded in the Supporting Information.Nominally, PHO (polyhydroxyoctanoate), PHOe (polyhy-
droxyoctenoate), and PHD (polyhydroxydecanoate) designatecopolymer materials that contain full-length monomers as wellas shorter monomers created by β−oxidation. PHO and PHDwere synthesized from octane and decane, respectively. PHOewas synthesized from cyclical additions of octane and octeneand so contains both saturated and unsaturated monomersalong the polymer chain.40 Given the cyclical nature in whichoctane and octene feeds were administered, we expect that thepurified polymer may contain some block copolymermolecules35,36 composed of distinct domains enriched inpolyhydroxyoctene. The presence of double bonds along thepolymer backbone of PHOe permits the formation of chemicalcross-links between chains. In a previous report, researchersproduced similar poly(hydroxyalkanoate) polymers synthesizedfrom octane and octene and subjected them to varyingintensities of electron-beam radiation to promote cross-linking.40 While PHOe used in this study was never subjectedto concentrated radiation, its exposure to environmental,ultraviolet radiation over a 1-year period likely contributed tothe formation of a small degree of cross-linking. Furthermore, itis possible that additional cross-linking occurred under theelevated temperature (100 °C) used for melt-pressingcomposite specemins. Table 1 provides the composition andmolecular weight for the pure polymers. As a caveat to themolecular weight data, we remind the reader that all values arereported as polystyrene equivalents, which does not account forthe fact that given equivalent molecular weights, polymers witha larger cross-section and thus a larger hydrodynamic volumeelute faster during size-exclusion chromatography. BetweenPHO and PHOe, we expect little difference in the hydro-dynamic volume based on their similar monomer composition.PHD, we anticipate, may have a larger hydrodynamic volumedue to its longer aliphatic appendages. Thus, the comparisonbetween PHD and PHO according to polystyrene equivalentsmay actually underestimate the difference in molecular weight.Furthermore, Nerkar et al. have reported that for GPCmeasurements in THF, the uncorrected polystyrene equivalentsprovide a good estimate (within 10%) of absolute MW valuesfor PHAmcl, irrespective of side-chain length.41
Properties of Thermally Reduced Graphene. X-raydiffraction was used to confirm the oxidation of graphite to GO
Table 1. Chemical Composition and Molecular Weight of Purified Poly(hydroxyalkanoate)s
molecular weighta compositionb (% wt)
Mw (103 g/mol) Mw/Mn 3HB 3HH 3HH6:1 3HO 3HO8:1 3HD
PHO 71 3.1 0.4 7.0 − 91.4 − 1.2PHOe 54 2.3 − 4.2 <0.1 89.5 6.1 <0.1PHD 57 2.6 0.4 6.4 − 61.5 − 31.7
aWeight-average molecular weight (Mw); number-average molecular weight (Mn).b3HB (3-(R)-hydroxybutyrate), 3HH (3-(R)-hydroxyhexanoate),
3HH6:1 (3-(R)-hydroxyhexenoate), 3HO (3-(R)-hydroxyoctanoate), 3HO8:1 (3-(R)-hydroxyoctenoate), and 3HD (3-(R)-hydroxydecanoate).
Macromolecules Article
dx.doi.org/10.1021/ma500022x | Macromolecules 2014, 47, 3926−39413928
and the exfoliation of GO to nonstacked graphene sheets.Details are presented in the Supporting Information.Transmission electron microscopy (TEM) was used to
observe the morphology of graphene sheets precipitated from aDMF suspension, Figure 1. The TEM image indicates thatgraphene is composed of thin and large wrinkled sheets.Translucent graphene sheets are clearly visible with edgesappearing as dark fields.
Properties of PHA−Graphene Nanocomposites. Ther-mal Stability. The nonoxidative thermal degradation of purePHAmcl polymers and their graphene nanocomposites wasmeasured between 50 and 350 °C. Measurements were madeunder nitrogen flow using simultaneous thermal gravimetricanalysis (TGA) and differential scanning calorimetry (DSC).Figure 2 shows the effect of graphene loading on differentthermal properties. T50% is the temperature at which 50% of thecomposite mass remains (Figure 2a). E50% is the totalendothermic heat-load incurred during heating from 270 °Cto T50%, and Cp is the specific heat capacity of the compositemeasured at 270 °C (Figure 2c). For easy comparison with Cpvalues ((J/g)/°C) E50% values (J/g) have been scaled by thecorresponding increase in temperature between 270 °C andT50% and are presented in units of (J/g)/°C (Figure 2c). Fullthermograms are provided in the Supporting Information. Ingeneral, the addition of graphene increases the T50% values ofcomposites samples: at 2.5% loading T50% increases by 4−6 °C.One exception to this trend is the PHD−0.5% composite,which shows a decrease in T50% by −4.6 °C. While increases inT50% indicate that the addition of graphene can improve thethermal stability of composites, E50% values provide analternative perspective. For PHD−1.0% and PHO−2.5% E50%values increase by 23% and 60% respectively. This indicatesimproved thermal stability, because more heat is required fordegradation to proceed. On the other hand, for PHOe−2.5%and PHD−2.5% E50% values decrease by 16% and 30%respectively.Some insight into this result can be gained by considering the
specific heat capacity of the samples at 270 °C, just prior to theonset of thermal degradation. The Cp values show an obviouscorrelation with E50% values. For PHO the addition of graphenecauses a linear increase in the heat capacity of the compositesamples. This could be due to an increase in the entanglementdensity of the composites thereby raising their capacity to storepotential energy. Another storage mechanism for potentialenergy is the formation of hydrogen bonds between the estergroups of polymer chains and hydroxyl and carboxyl moieties
on the TRG surface. As for why Cp of pure PHO is lower thanthat of pure PHOe and PHD, it is has been shown that Cp isinversely proportional to polymer molecular weight,42 and theMw of PHO is ∼25% greater than that of PHOe and PHD. ForPHOe, the addition of graphene causes a small decrease in theheat capacity of the composites. We hypothesize that theintercalation of graphene particles within the gel network ofPHOe may increase the internal strain of the matrix, therebyconsuming some of its capacity to store potential energy. Whilethe PHD−1% composite shows a large increase in heatcapacity, the opposite is true for the PHD−2.5% composite.This suggests that under some conditions entanglements withgraphene may form less easily for PHD than for PHO, andinstead graphene may produce a solvating effect, which reducesthe entanglement density of PHD.The strong correlation between heat capacity and the total
endothermic heat-flow indicates that changes to the entangle-ment density of the composite are a significant factor incontrolling the thermal stability of the composites. However,the presence of graphene can provide protection againstthermal decomposition by other mechanisms as well. Giventhat graphene composites show a significant reduction in gaspermeability,20 it is likely that their presence retards
Figure 1. TEM image showing the morphology of TRG sheets.
Figure 2. Thermal decomposition data for PHA−graphenecomposites. (a) Temperature at which 50% of the composite masshas been lost (T50%). (b) Residual char (Char) at 345 °C minus wt %of corresponding graphene loading. (c) Specific heat capacity at 270°C (Cp) and total endotherm (E50%) when 50% of the composite masshas been lost. E50% values (J/g) are scaled by the correspondingtemperature increase between 270 °C and T50% to give units equivalentto specific heat capacity ((J/g)/°C).
Macromolecules Article
dx.doi.org/10.1021/ma500022x | Macromolecules 2014, 47, 3926−39413929

degradation by slowing the migration of volatile decompositiongases to the sample surface. Furthermore, it has been shownthat the formation of a surface char layer on carbonnanocomposites can act as an additional barrier to gas evolutionand may act as a protective heat shield, delaying the rise ofsample temperature.43 Ultimately, an increase in the heatcapacity of the composite requires an increase in the averagekinetic energy of the material, i.e., temperature, to disrupt thephysical entanglements that prevent bond breakage necessaryto initiate decomposition reactions. Additionally, temperaturemust increase for gas particles to overcome the graphenebarriers that hinder their migration to the surface. For PHOand PHD, the effect of graphene on T50% appear to saturate by1% loading, and T50% values for all three matrices converge towithin 0.7 °C by 2.5% loading. This suggests that beyond 1%loading, the kinetics of the decomposition process are governedprimarily by the barrier properties of graphene despite thevaried entanglement structure of the composites.For PHD−0.5%, which is the only composite with a reduced
T50%, we note that it is also the only composite with anincreased E50% while having a lowered Cp. Thus, thedegradation reaction that initiates early in the decompositionof PHD−0.5% is distinctly more endothermic, suggesting thatan alternate decomposition process may be at play.Furthermore, we note that among all three polymer matricesthe 0.5% composites show higher mass loss rates, d(mass)/dt(mass %/min) than the pure polymer matrices. Data areprovided in the Supporting Information. Thus, it is a possibilitythat the oxygen-containing species on the TRG surface maycause an increase in the decomposition rate, especially if thefiller loading is too sparse to hinder escaping gases. For PHOe−0.5%, which experiences an even greater drop in heat capacitybut a slight increase in T50%, it is possible that the restriction ofpolymer motion due to the gel network may provide additionalhindrance to gas diffusion, thereby raising the decompositiontemperature.Values for char formation are presented in Figure 2b. Given
that single layer graphene has been shown to be stable up to2600 K,44 it is expected to be present as part of the residualchar of the degraded composites. Thus, we have adjusted thefinal char values by subtracting the mass of graphene added toeach composite. Note: 0.5, 1.0, and 2.5 vol % graphene ≈ 1.0,2.5, and 5 wt %. For pure PHO and PHD no residual char isobserved; however, for pure PHOe ∼13% char was observed.This difference is attributed to the presence of double bonds inthe PHOe structure, which can act as a source of free radicalsfor the initiation of cyclization reactions that lead to theformation of char instead of more volatile compounds.45
For PHOe, the addition of graphene results in an unusualreduction in char formation. One possibility may be thatoxygen-containing radicals liberated from TRG compete for thealkene groups of PHOe thereby reducing the rate of cyclizationreactions. For PHO and PHD, it is interesting that somecomposites produce char while others do not. Since charformation does not occur between polymer segments alone, itis most likely that additional carbon atoms are retained bybonding to the TRG surface. Presumably, such reactions areaided by the epoxide, alcohol, and carboxyl moieties on theTRG surface. At low graphene loadings polymer chains are theprimary reactant at the graphene surface, but at higher loadings,especially in the case of poorly dispersed filler and weakpolymer−filler attraction, oxygen-containing species on adja-
cent TRG sheets may compete with polymer chains forreaction, thereby reducing char formation.
Thermal Transitions. The physical transitions of pure andcomposite samples were measured using DSC. Values for theglass transition temperature (Tg), melting temperature (Tm),specific enthalpy of melting (ΔHm), specific entropy of melting(ΔSm), and relative crystallinity (xc/xp) are shown in Table 2.Among pure polymer samples, Tm of PHO is higher than thatof both PHOe and PHD, which is consistent with previouslyreported results.8,40 We attribute this to the reduction in thecrystal-forming ability of the PHOe and PHD polymers causedby disruption of the regularity of the PHO chain by 3HO8:1 (3-(R)-hydroxyoctenoate) and 3HD (3-(R)-hydroxydecanoate)monomers, similar to the finding of Noda et al.46 Nonetheless,the higher Tm of PHO could also be attributed to its highermolecular weight.22 The effect of graphene on the thermaltransitions is demonstrated by a small increase in the Tm ofPHO and PHD by ∼0.5−3 °C depending on graphene loading.These results are consistent with a similar increase in Tm with
graphene loading reported for other polyoxoester-graphenecomposites.47,48 The increases in Tm for PHO and PHD implyimproved perfection in the crystalline lattice; however, this iscontradictory to the decreases in ΔHm which indicate areduction in crystallinity. Reconciliation of this inconsistencyrequires consideration of the entropic effects of nanoparticleaddition. Recall from thermodyanics, Tm = ΔHm/ΔSm. Thus,for Tm to increase the addition of graphene must cause an evengreater decrease in the entropy of the phase transition. Wespeculate that this is due to an ordering effect of the grapheneparticles whereby they hinder the rotation and translation ofpolymer chains within confined spaces. As a necessity, thereduction in entropy must be greater in the melt phase than insolid phase.For the case of PHOe, the decreases in ΔHm is smaller (11%,
max) compared to PHO and PHD (>42%, max). Part of thereason for this is that PHOe contains fewer crystals that canundergo melting, due to molecular cross-links, which obstructcrystal formation. Contrary to PHO and PHD composites,PHOe composites showed a decrease in Tm by as much as 7.5°C at only 0.5 vol % graphene loading. Thus, for PHOe thedecrease in ΔSm must be smaller than the decrease in ΔHm Toexplain this alternate effect we hypothesize that grapheneparticles may be able to intercalate within the gel network ofPHOe, thereby creating an isotropic strain within the polymermatrix and raising the enthalpy of the solid state. In the meltphase, however, the added enthalpy of particle intercalationwould be less due to random motions in the gel network causedby thermal fluctuations. Essentially, the intercalated particles fallout when polymer movements becomes too large. In addition,ΔSm would be smaller in the presence of the gel network, whichserves to maintain order among the polymer chains during thetransition from solid to liquid.The Tg for pure PHD is significantly lower than that of PHO
and PHOe, in agreement with an earlier report.8 At 0.5%graphene loading the PHO polymer displays a significantincrease in Tg by 3.8 °C while PHD and PHOe show aninsignificant decrease by less than 1 °C. As the second order Tgtransition is known to be a kinetically controlled effect, thisresult suggests that the presence of graphene nanoparticles slowthe motion of PHO chains by blocking reptation paths andcreating entanglements. Further additions of graphene to PHOproduce a minimal recovery of the Tg toward its pure polymervalue. For the PHD polymer, the addition of graphene causes a
Macromolecules Article
dx.doi.org/10.1021/ma500022x | Macromolecules 2014, 47, 3926−39413930
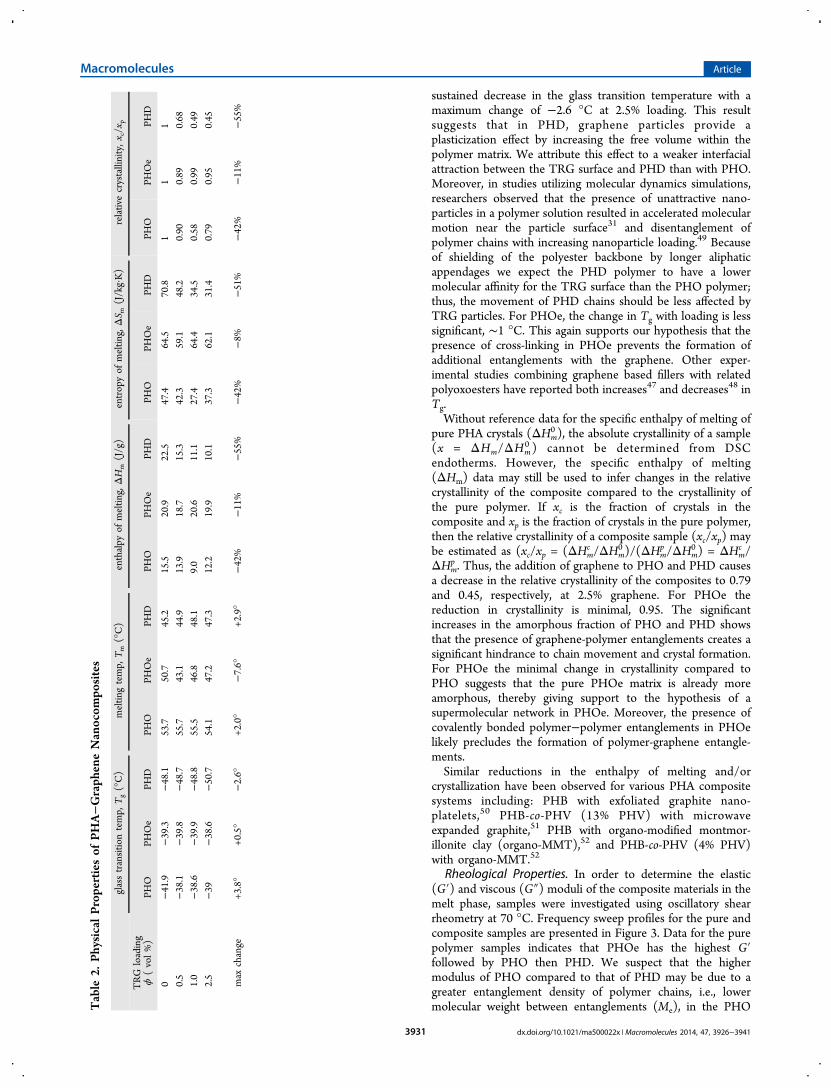
sustained decrease in the glass transition temperature with amaximum change of −2.6 °C at 2.5% loading. This resultsuggests that in PHD, graphene particles provide aplasticization effect by increasing the free volume within thepolymer matrix. We attribute this effect to a weaker interfacialattraction between the TRG surface and PHD than with PHO.Moreover, in studies utilizing molecular dynamics simulations,researchers observed that the presence of unattractive nano-particles in a polymer solution resulted in accelerated molecularmotion near the particle surface31 and disentanglement ofpolymer chains with increasing nanoparticle loading.49 Becauseof shielding of the polyester backbone by longer aliphaticappendages we expect the PHD polymer to have a lowermolecular affinity for the TRG surface than the PHO polymer;thus, the movement of PHD chains should be less affected byTRG particles. For PHOe, the change in Tg with loading is lesssignificant, ∼1 °C. This again supports our hypothesis that thepresence of cross-linking in PHOe prevents the formation ofadditional entanglements with the graphene. Other exper-imental studies combining graphene based fillers with relatedpolyoxoesters have reported both increases47 and decreases48 inTg.Without reference data for the specific enthalpy of melting of
pure PHA crystals (ΔHm0 ), the absolute crystallinity of a sample
(x = ΔHm/ΔHm0 ) cannot be determined from DSC
endotherms. However, the specific enthalpy of melting(ΔHm) data may still be used to infer changes in the relativecrystallinity of the composite compared to the crystallinity ofthe pure polymer. If xc is the fraction of crystals in thecomposite and xp is the fraction of crystals in the pure polymer,then the relative crystallinity of a composite sample (xc/xp) maybe estimated as (xc/xp = (ΔHm
c /ΔHm0 )/(ΔHm
p /ΔHm0 ) = ΔHm
c /ΔHm
p . Thus, the addition of graphene to PHO and PHD causesa decrease in the relative crystallinity of the composites to 0.79and 0.45, respectively, at 2.5% graphene. For PHOe thereduction in crystallinity is minimal, 0.95. The significantincreases in the amorphous fraction of PHO and PHD showsthat the presence of graphene-polymer entanglements creates asignificant hindrance to chain movement and crystal formation.For PHOe the minimal change in crystallinity compared toPHO suggests that the pure PHOe matrix is already moreamorphous, thereby giving support to the hypothesis of asupermolecular network in PHOe. Moreover, the presence ofcovalently bonded polymer−polymer entanglements in PHOelikely precludes the formation of polymer-graphene entangle-ments.Similar reductions in the enthalpy of melting and/or
crystallization have been observed for various PHA compositesystems including: PHB with exfoliated graphite nano-platelets,50 PHB-co-PHV (13% PHV) with microwaveexpanded graphite,51 PHB with organo-modified montmor-illonite clay (organo-MMT),52 and PHB-co-PHV (4% PHV)with organo-MMT.52
Rheological Properties. In order to determine the elastic(G′) and viscous (G″) moduli of the composite materials in themelt phase, samples were investigated using oscillatory shearrheometry at 70 °C. Frequency sweep profiles for the pure andcomposite samples are presented in Figure 3. Data for the purepolymer samples indicates that PHOe has the highest G′followed by PHO then PHD. We suspect that the highermodulus of PHO compared to that of PHD may be due to agreater entanglement density of polymer chains, i.e., lowermolecular weight between entanglements (Me), in the PHOT
able
2.PhysicalPropertiesof
PHA−Graph
eneNanocom
posites
glasstransitio
ntemp,
Tg(°C)
meltin
gtemp,
Tm(°C)
enthalpy
ofmeltin
g,ΔH
m(J/g)
entropyof
meltin
g,ΔS m
(J/kg·K)
relativecrystallinity,x
c/x p
TRG
loading
ϕ(vol%)
PHO
PHOe
PHD
PHO
PHOe
PHD
PHO
PHOe
PHD
PHO
PHOe
PHD
PHO
PHOe
PHD
0−41.9
−39.3
−48.1
53.7
50.7
45.2
15.5
20.9
22.5
47.4
64.5
70.8
11
10.5
−38.1
−39.8
−48.7
55.7
43.1
44.9
13.9
18.7
15.3
42.3
59.1
48.2
0.90
0.89
0.68
1.0
−38.6
−39.9
−48.8
55.5
46.8
48.1
9.0
20.6
11.1
27.4
64.4
34.5
0.58
0.99
0.49
2.5
−39
−38.6
−50.7
54.1
47.2
47.3
12.2
19.9
10.1
37.3
62.1
31.4
0.79
0.95
0.45
max
change
+3.8°
+0.5°
−2.6°
+2.0°
−7.6°
+2.9°
−42%
−11%
−55%
−42%
−8%
−51%
−42%
−11%
−55%
Macromolecules Article
dx.doi.org/10.1021/ma500022x | Macromolecules 2014, 47, 3926−39413931
matrix. Me is known to vary with the cube of the chain packinglength (p), and p has a quadratic dependence on the cross-sectional diameter of the polymer chain.22 Because 3HDmonomers in PHD increase the cross-sectional area of thepolymer chain, the packing length of the PHD chain is expectedto be greater. As a result, Me for PHD is expected to be greater,and its propensity to form entanglements is expected to bereduced.22 Thus, PHO chains with their smaller cross-sectionare expected to form more entanglements, leading to a greatermodulus than less entangled PHD chains.For PHOe, the presence of double bonds stemming from its
aliphatic appendages permits the formation of chemical cross-links between adjacent chains, thereby leading to a greaterelastic modulus than the PHO and PHD polymers. In aprevious report, researchers produced similar poly-(hydroxyalkanoate) polymers synthesized from octane andoctene and subjected them to varying intensities of electron-beam radiation to promote cross-linking.40 Samples presumedto have a higher degree of cross-linking showed increasedmodulus values. Thus, in the melt phase, where crystallinitydoes not contribute to the modulus, the network connectivityprovided by cross-linking in the PHOe polymer is responsiblefor the higher G′ for PHOe and the onset of a rubbery plateauat low frequencies, compared to PHO and PHD which havelower values of modulus and display behavior characteristic ofthe terminal regime.According to a report by Kazatchkov et al.53 values observed
for the crossover frequency, (ωc), where the storage modulus(G′) is equal to the viscous modulus (G″), show an inversepower-law dependence upon Mw, specifically ωc = (Mw)
−3.7 forLLDPE. In our case, ωc was found to be ∼70 rad/s for PHOand ∼40 rad/s for PHOe. Data for G″ not shown. Bothmatrices had a similar value for the crossover modulus of ∼1.5Pa. This difference in ωc values suggests that the Mw of PHOeis greater than that of PHO. But GPC results show that the Mwof PHO is 71K Da while that of PHOe is 54K Da. We interpretthis as another indication of cross-linking in the PHOe matrix,thereby increasing the apparent Mw of linked polymer chains.In Figure 3a, data for the PHO−graphene composites is
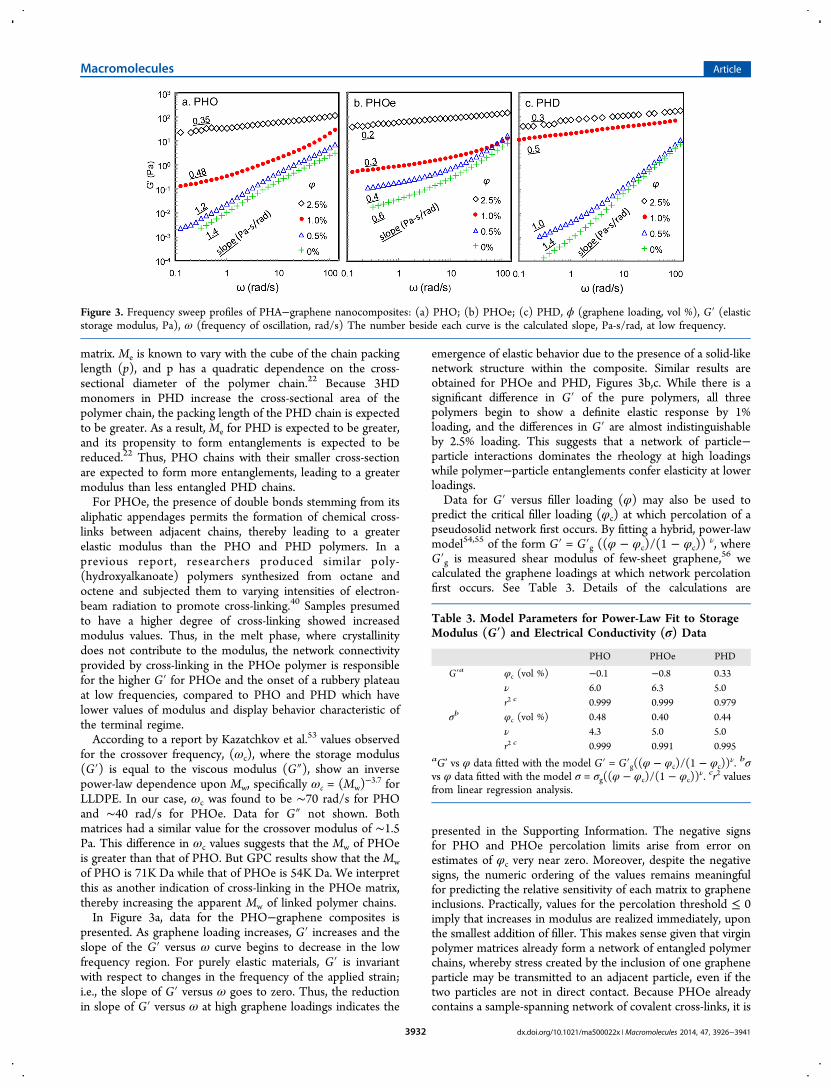
presented. As graphene loading increases, G′ increases and theslope of the G′ versus ω curve begins to decrease in the lowfrequency region. For purely elastic materials, G′ is invariantwith respect to changes in the frequency of the applied strain;i.e., the slope of G′ versus ω goes to zero. Thus, the reductionin slope of G′ versus ω at high graphene loadings indicates the
emergence of elastic behavior due to the presence of a solid-likenetwork structure within the composite. Similar results areobtained for PHOe and PHD, Figures 3b,c. While there is asignificant difference in G′ of the pure polymers, all threepolymers begin to show a definite elastic response by 1%loading, and the differences in G′ are almost indistinguishableby 2.5% loading. This suggests that a network of particle−particle interactions dominates the rheology at high loadingswhile polymer−particle entanglements confer elasticity at lowerloadings.Data for G′ versus filler loading (φ) may also be used to
predict the critical filler loading (φc) at which percolation of apseudosolid network first occurs. By fitting a hybrid, power-lawmodel54,55 of the form G′ = G′g ((φ − φc)/(1 − φc))
ν, whereG′g is measured shear modulus of few-sheet graphene,56 wecalculated the graphene loadings at which network percolationfirst occurs. See Table 3. Details of the calculations are
presented in the Supporting Information. The negative signsfor PHO and PHOe percolation limits arise from error onestimates of φc very near zero. Moreover, despite the negativesigns, the numeric ordering of the values remains meaningfulfor predicting the relative sensitivity of each matrix to grapheneinclusions. Practically, values for the percolation threshold ≤ 0imply that increases in modulus are realized immediately, uponthe smallest addition of filler. This makes sense given that virginpolymer matrices already form a network of entangled polymerchains, whereby stress created by the inclusion of one grapheneparticle may be transmitted to an adjacent particle, even if thetwo particles are not in direct contact. Because PHOe alreadycontains a sample-spanning network of covalent cross-links, it is
Figure 3. Frequency sweep profiles of PHA−graphene nanocomposites: (a) PHO; (b) PHOe; (c) PHD, ϕ (graphene loading, vol %), G′ (elasticstorage modulus, Pa), ω (frequency of oscillation, rad/s) The number beside each curve is the calculated slope, Pa-s/rad, at low frequency.
Table 3. Model Parameters for Power-Law Fit to StorageModulus (G′) and Electrical Conductivity (σ) Data
PHO PHOe PHD
G′a φc (vol %) −0.1 −0.8 0.33ν 6.0 6.3 5.0r2 c 0.999 0.999 0.979
σb φc (vol %) 0.48 0.40 0.44ν 4.3 5.0 5.0r2 c 0.999 0.991 0.995
aG’ vs φ data fitted with the model G′ = G′g((φ − φc)/(1 − φc))ν. bσ
vs φ data fitted with the model σ = σg((φ − φc)/(1 − φc))ν. cr2 values
from linear regression analysis.
Macromolecules Article
dx.doi.org/10.1021/ma500022x | Macromolecules 2014, 47, 3926−39413932
the most sensitive to graphene inclusions and has a φc lowerthan PHO. Alternatively, PHD, which is less likely toparticipate in molecular entanglements due to its greaterpacking length and reduced chain length, has a φc higher thanPHO.Mechanical Properties. One of the most important benefits
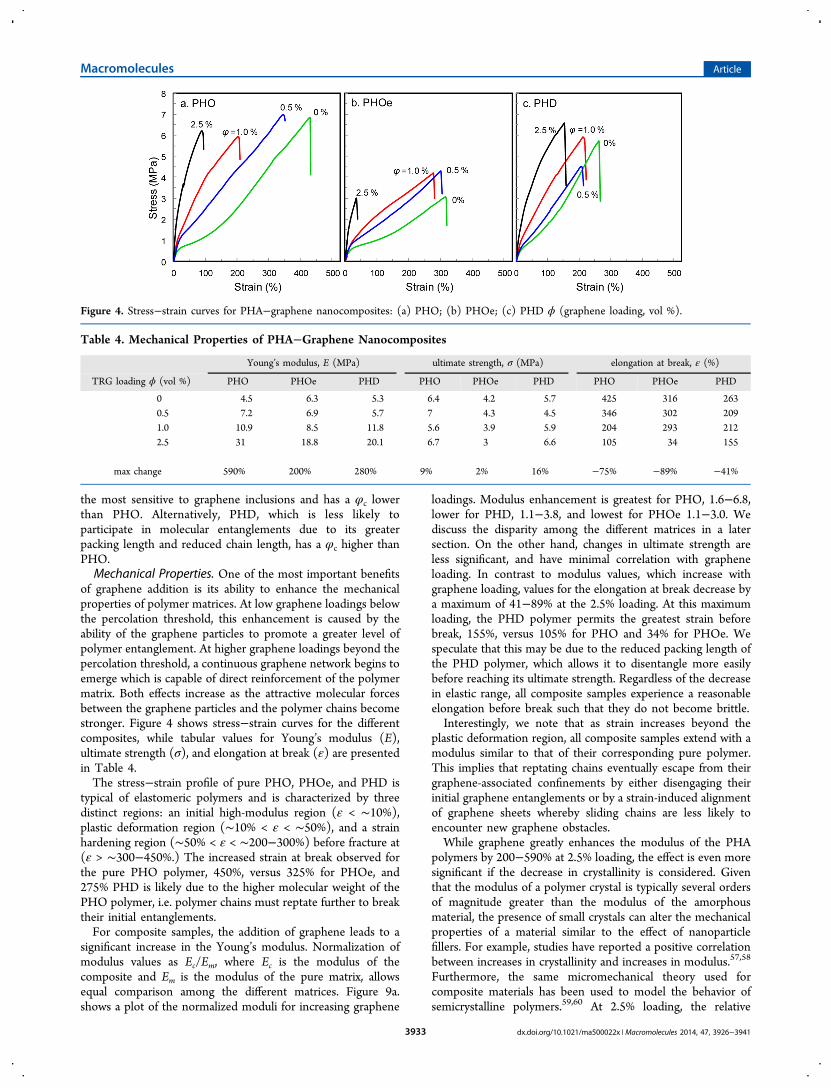
of graphene addition is its ability to enhance the mechanicalproperties of polymer matrices. At low graphene loadings belowthe percolation threshold, this enhancement is caused by theability of the graphene particles to promote a greater level ofpolymer entanglement. At higher graphene loadings beyond thepercolation threshold, a continuous graphene network begins toemerge which is capable of direct reinforcement of the polymermatrix. Both effects increase as the attractive molecular forcesbetween the graphene particles and the polymer chains becomestronger. Figure 4 shows stress−strain curves for the differentcomposites, while tabular values for Young’s modulus (E),ultimate strength (σ), and elongation at break (ε) are presentedin Table 4.The stress−strain profile of pure PHO, PHOe, and PHD is
typical of elastomeric polymers and is characterized by threedistinct regions: an initial high-modulus region (ε < ∼10%),plastic deformation region (∼10% < ε < ∼50%), and a strainhardening region (∼50% < ε < ∼200−300%) before fracture at(ε > ∼300−450%.) The increased strain at break observed forthe pure PHO polymer, 450%, versus 325% for PHOe, and275% PHD is likely due to the higher molecular weight of thePHO polymer, i.e. polymer chains must reptate further to breaktheir initial entanglements.For composite samples, the addition of graphene leads to a
significant increase in the Young’s modulus. Normalization ofmodulus values as Ec/Em, where Ec is the modulus of thecomposite and Em is the modulus of the pure matrix, allowsequal comparison among the different matrices. Figure 9a.shows a plot of the normalized moduli for increasing graphene
loadings. Modulus enhancement is greatest for PHO, 1.6−6.8,lower for PHD, 1.1−3.8, and lowest for PHOe 1.1−3.0. Wediscuss the disparity among the different matrices in a latersection. On the other hand, changes in ultimate strength areless significant, and have minimal correlation with grapheneloading. In contrast to modulus values, which increase withgraphene loading, values for the elongation at break decrease bya maximum of 41−89% at the 2.5% loading. At this maximumloading, the PHD polymer permits the greatest strain beforebreak, 155%, versus 105% for PHO and 34% for PHOe. Wespeculate that this may be due to the reduced packing length ofthe PHD polymer, which allows it to disentangle more easilybefore reaching its ultimate strength. Regardless of the decreasein elastic range, all composite samples experience a reasonableelongation before break such that they do not become brittle.Interestingly, we note that as strain increases beyond the
plastic deformation region, all composite samples extend with amodulus similar to that of their corresponding pure polymer.This implies that reptating chains eventually escape from theirgraphene-associated confinements by either disengaging theirinitial graphene entanglements or by a strain-induced alignmentof graphene sheets whereby sliding chains are less likely toencounter new graphene obstacles.While graphene greatly enhances the modulus of the PHA
polymers by 200−590% at 2.5% loading, the effect is even moresignificant if the decrease in crystallinity is considered. Giventhat the modulus of a polymer crystal is typically several ordersof magnitude greater than the modulus of the amorphousmaterial, the presence of small crystals can alter the mechanicalproperties of a material similar to the effect of nanoparticlefillers. For example, studies have reported a positive correlationbetween increases in crystallinity and increases in modulus.57,58
Furthermore, the same micromechanical theory used forcomposite materials has been used to model the behavior ofsemicrystalline polymers.59,60 At 2.5% loading, the relative
Figure 4. Stress−strain curves for PHA−graphene nanocomposites: (a) PHO; (b) PHOe; (c) PHD ϕ (graphene loading, vol %).
Table 4. Mechanical Properties of PHA−Graphene Nanocomposites
Young’s modulus, E (MPa) ultimate strength, σ (MPa) elongation at break, ε (%)
TRG loading ϕ (vol %) PHO PHOe PHD PHO PHOe PHD PHO PHOe PHD
0 4.5 6.3 5.3 6.4 4.2 5.7 425 316 2630.5 7.2 6.9 5.7 7 4.3 4.5 346 302 2091.0 10.9 8.5 11.8 5.6 3.9 5.9 204 293 2122.5 31 18.8 20.1 6.7 3 6.6 105 34 155
max change 590% 200% 280% 9% 2% 16% −75% −89% −41%
Macromolecules Article
dx.doi.org/10.1021/ma500022x | Macromolecules 2014, 47, 3926−39413933

crystallinity of PHO, PHOe, and PHD composites compared tothe pure polymers is reduced to 0.79, 0.95, and 0.45,respectively; thus, by this effect we would expect thecomposites to have a lower modulus than the pure polymers.To account for the effects of reduced crystallinity, we can
make an alternate estimate of the modulus enhancement factoras (Ec/Em)/(xc/xp). A derivation of the approximation is givenin the Supporting Information. Figure 9a contains a plot of thenormalized moduli versus graphene loading, with and withoutthe correction for crystallinity. While there is a significantdifference between PHO and PHD for the uncorrectedmodulus enhancement, the results are almost identical whencrystallinity is considered. This alternative estimate suggeststhat the dispersion and molecular interactions of PHO andPHD with TRG are more similar than originally thought. ForPHOe, the effect of crystallinity on modulus enhancement isnegligible.Electrical Conductivity. Another important advantage of
polymer-graphene composites is their potential for electricalconductivity. This conduction is possible via the overlap of sp2
orbitals above the plane of the graphene monolayer. Figure 5
shows the bulk resistivity (ρ) of PHA−graphene composites forvarious graphene loadings. Just before a graphene loading of0.5%, the formation of a few, continuous, graphene pathwaysbegins to produce a small drop in the resistivity of thecomposite. By ϕ = 2.5%, the bulk resistivity in all three PHAmatrices is decreased by >7 orders of magnitude.To make a more accurate estimate of the electrical
conductivity percolation threshold (φc), we employee apower-law model55 of the form σ = σg ((ϕ − ϕc)/(1 −ϕc))
ν, where σg is the conductivity of few-layer graphene, and νis the “universal constant” for which classical models specify atheoretical value of 2 for geometric percolation. Fitting thismodel to σ versus φ, we calculated the graphene loading atwhich percolation of an electrically conducting network firstoccurs. See Table 3. The ϕc values for electrical conductivity aredistinctly greater than those predicted for rheologicalpercolation and are much more similar among the differentpolymer matrices. Details of the calculations are presented inthe Supporting Information. In rheological and mechanicaltesting of nanocomposites, improvements in modulus mayactually arise before formation of a continuous filler phase dueto the aid of polymer entanglements that link distant particles.61
For this reason, measurements of electrical conductivity arebetter indicators of geometric network percolation. However,the ϕc values predicted from conductivity data may still bebelow the threshold for true geometric percolation, as thecorresponding estimates of ν are all greater than the classicalvalue of 2. Such high ν values have been attributed to quantumtunneling effects, which can permit conductivity betweenproximal, but nontouching particles.55 By analogy, the similarlyhigh values of ν obtained from the rheology percolation modelssupport the hypothesis that polymer entanglements betweenparticles confer network structure well before geometricpercolation. Moreover, the wide range of ϕc values forrheological percolation, −0.8 to +0.33 vol %, indicatessignificant variation in the molecular interactions of the TRGparticles with the different PHA matrices.
Evaluation of Composite Structure. Nanocompositestructure may be described with respect to properties of thenanoparticles, e.g., size, aspect ratio, and dispersion, as well asproperties of the polymer entanglements within the matrix, e.g.,size and density of entanglements. Direct methods of evaluationinclude spectroscopy and microscopy while indirect methodsuse rheological, mechanical, or electrical conductivity measure-ments to infer structure.
Estimation of Af and Particle Dispersion from ElectricalConductivity. According to percolation theory for electricallyconducting networks, fillers with elongated or expandedgeometry such as fibers or sheets possess a lower φc, becausethey can more readily form a continuous network in a polymermatrix.62,63 Moreover, percolation arises most quickly when theparticles are distributed in completely random orientations.Thus, φc for a composite system conveys information about theaspect ratio of the particles as well as their orientation.For a nanoparticle, the aspect ratio (Af) is defined as the
average diameter of the particle (d) divided by its thickness (t).Crumpling or breaking of graphene particles during exfoliationcauses a direct reduction in Af while particle aggregation, poordispersion, and strain induced particle alignment duringsecondary processing can indirectly cause a reduction in theeffective Af.Assuming a completely random orientation of the nano-
particles, several mathematical models have been proposed torelate φc to Af. A semiempirical estimation by Ren et al.62
predicts the percolation loading as ϕc = (3 ϕcs/2Af), where ϕc
s isthe percolation volume fraction of spherical particles (ϕc
s = 0.3).A more rigorous model by Celzard et al.63 predicts percolationloading to be bounded between ϕc = 1 − exp((−3.6/πAf)) andϕc = 1 − exp((−5.6/πAf)) for an infinitesimally thin spheroidand a perfect sphere, respectively. On the other hand, a modelused by Lu and Mai64 predicts ϕc = (2.154/Af). Using thevalues for φc obtained from conductivity data, values of Afcalculated from the different models are provided in Table 5.The average aspect ratios of all three models is Af
PHO = 288,Af
PHOe = 345 AfPHD = 314. The similarity in these values
indicates that at low graphene loadings there is little differencein the geometry or dispersion of graphene in the three differentmatrices.
Transmission Electron Microscopy. TEM images are usedto visually assess nanofiller dispersion within the matrix. Figure6 shows TEM images of the composite samples at a loading of0.5%. The best dispersion of graphene is seen in the PHOsample as indicated by the existence of transparent, likely singlelayer, graphene sheets. The poorest dispersion is seen in thePHOe sample where the appearance of darkly contrasted and
Figure 5. Bulk resistivity (ρ) of PHA−graphene nanocomposites. φ(graphene loading, % vol).
Macromolecules Article
dx.doi.org/10.1021/ma500022x | Macromolecules 2014, 47, 3926−39413934
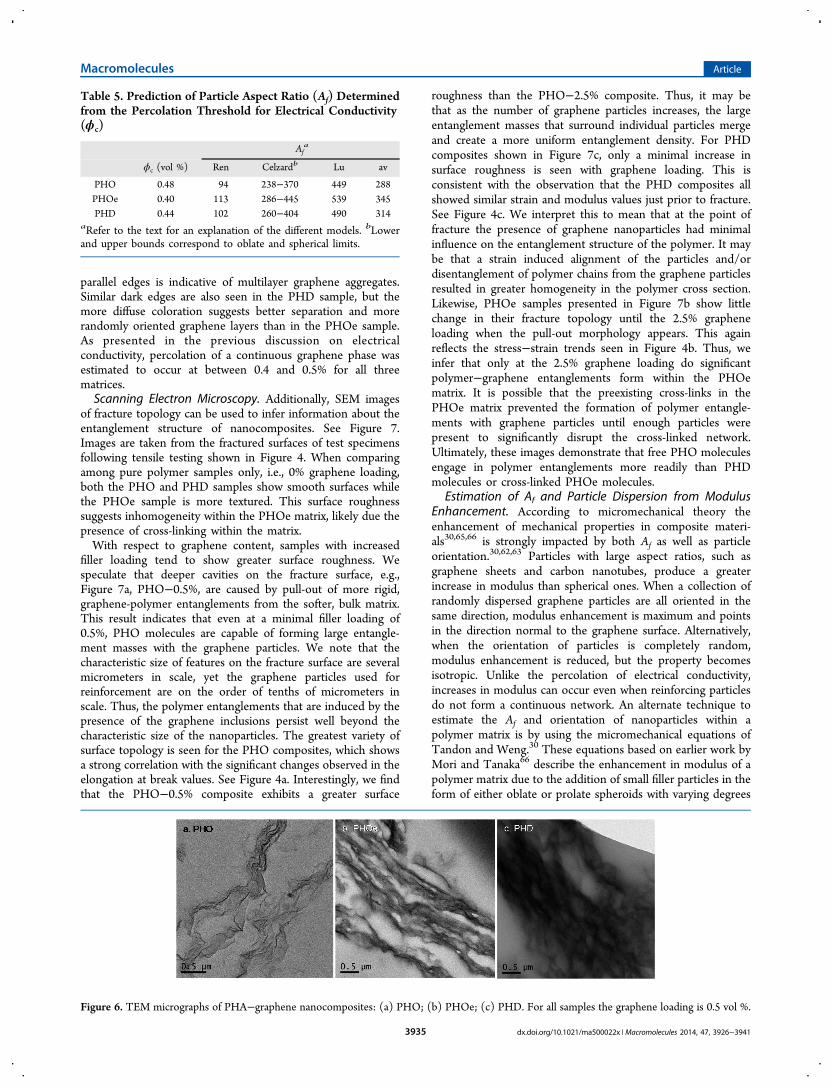
parallel edges is indicative of multilayer graphene aggregates.Similar dark edges are also seen in the PHD sample, but themore diffuse coloration suggests better separation and morerandomly oriented graphene layers than in the PHOe sample.As presented in the previous discussion on electricalconductivity, percolation of a continuous graphene phase wasestimated to occur at between 0.4 and 0.5% for all threematrices.Scanning Electron Microscopy. Additionally, SEM images
of fracture topology can be used to infer information about theentanglement structure of nanocomposites. See Figure 7.Images are taken from the fractured surfaces of test specimensfollowing tensile testing shown in Figure 4. When comparingamong pure polymer samples only, i.e., 0% graphene loading,both the PHO and PHD samples show smooth surfaces whilethe PHOe sample is more textured. This surface roughnesssuggests inhomogeneity within the PHOe matrix, likely due thepresence of cross-linking within the matrix.With respect to graphene content, samples with increased
filler loading tend to show greater surface roughness. Wespeculate that deeper cavities on the fracture surface, e.g.,Figure 7a, PHO−0.5%, are caused by pull-out of more rigid,graphene-polymer entanglements from the softer, bulk matrix.This result indicates that even at a minimal filler loading of0.5%, PHO molecules are capable of forming large entangle-ment masses with the graphene particles. We note that thecharacteristic size of features on the fracture surface are severalmicrometers in scale, yet the graphene particles used forreinforcement are on the order of tenths of micrometers inscale. Thus, the polymer entanglements that are induced by thepresence of the graphene inclusions persist well beyond thecharacteristic size of the nanoparticles. The greatest variety ofsurface topology is seen for the PHO composites, which showsa strong correlation with the significant changes observed in theelongation at break values. See Figure 4a. Interestingly, we findthat the PHO−0.5% composite exhibits a greater surface
roughness than the PHO−2.5% composite. Thus, it may bethat as the number of graphene particles increases, the largeentanglement masses that surround individual particles mergeand create a more uniform entanglement density. For PHDcomposites shown in Figure 7c, only a minimal increase insurface roughness is seen with graphene loading. This isconsistent with the observation that the PHD composites allshowed similar strain and modulus values just prior to fracture.See Figure 4c. We interpret this to mean that at the point offracture the presence of graphene nanoparticles had minimalinfluence on the entanglement structure of the polymer. It maybe that a strain induced alignment of the particles and/ordisentanglement of polymer chains from the graphene particlesresulted in greater homogeneity in the polymer cross section.Likewise, PHOe samples presented in Figure 7b show littlechange in their fracture topology until the 2.5% grapheneloading when the pull-out morphology appears. This againreflects the stress−strain trends seen in Figure 4b. Thus, weinfer that only at the 2.5% graphene loading do significantpolymer−graphene entanglements form within the PHOematrix. It is possible that the preexisting cross-links in thePHOe matrix prevented the formation of polymer entangle-ments with graphene particles until enough particles werepresent to significantly disrupt the cross-linked network.Ultimately, these images demonstrate that free PHO moleculesengage in polymer entanglements more readily than PHDmolecules or cross-linked PHOe molecules.
Estimation of Af and Particle Dispersion from ModulusEnhancement. According to micromechanical theory theenhancement of mechanical properties in composite materi-als30,65,66 is strongly impacted by both Af as well as particleorientation.30,62,63 Particles with large aspect ratios, such asgraphene sheets and carbon nanotubes, produce a greaterincrease in modulus than spherical ones. When a collection ofrandomly dispersed graphene particles are all oriented in thesame direction, modulus enhancement is maximum and pointsin the direction normal to the graphene surface. Alternatively,when the orientation of particles is completely random,modulus enhancement is reduced, but the property becomesisotropic. Unlike the percolation of electrical conductivity,increases in modulus can occur even when reinforcing particlesdo not form a continuous network. An alternate technique toestimate the Af and orientation of nanoparticles within apolymer matrix is by using the micromechanical equations ofTandon and Weng.30 These equations based on earlier work byMori and Tanaka66 describe the enhancement in modulus of apolymer matrix due to the addition of small filler particles in theform of either oblate or prolate spheroids with varying degrees
Table 5. Prediction of Particle Aspect Ratio (Af) Determinedfrom the Percolation Threshold for Electrical Conductivity(ϕc)
Afa
ϕc (vol %) Ren Celzardb Lu av
PHO 0.48 94 238−370 449 288PHOe 0.40 113 286−445 539 345PHD 0.44 102 260−404 490 314
aRefer to the text for an explanation of the different models. bLowerand upper bounds correspond to oblate and spherical limits.
Figure 6. TEM micrographs of PHA−graphene nanocomposites: (a) PHO; (b) PHOe; (c) PHD. For all samples the graphene loading is 0.5 vol %.
Macromolecules Article
dx.doi.org/10.1021/ma500022x | Macromolecules 2014, 47, 3926−39413935

of Af. The equations are used in conjunction with experimentaldata for Ec/Em versus φ, where Ec is the composite modulus, Emis the pure polymer modulus, and φ is the volume fraction offiller within the composite. Values for the filler modulus (Ef),and Poisson ratio of the matrix and the filler (νm, νf) are alsorequired for the calculations. Details of the equations arepresented in the Supporting Information. Figure 9a is a plot ofEc/Em versus φ for the composites in this study. Calculationswith the Tandon and Weng equations predict Af
PHO = 309,Af
PHOe = 97, and AfPHD = 151. The value of Af
PHO predicted bythis method is similar to the ones predicted by percolationtheory, while the values for Af
PHOe and AfPHD are significantly
smaller. However, when the modulus enhancement values arecorrected for crystallinity by (Ec/Em)/(xc/xp), the resulting Afvalues are, Af
PHO = 435, AfPHOe = 106, and Af
PHD = 425. Thissuggests that the behavior of the PHO and PHD matrices areactually, very similar. For PHOe, the lower value of Af predictedby modulus enhancement, Af = 97, compared to percolationtheory, Af = 345, , suggests that the presence of covalent cross-links somehow prevents stress transmission to the grapheneparticle.While the explanation of crystallinity seems to account of the
difference in modulus between PHO and PHD, we note thatthe pull-out morphology seen in SEM images of PHO andPHOe fracture surfaces is not seen in PHD. Also, PHO andPHOe experience a 75% and 89% reduction in ε at 2.5%graphene loading, while for PHD the reduction in ε is only41%. This suggests that under high stresses, PHD relinquishesits graphene entanglements more easily, possibly due a reducedinterfacial attraction.Effect of Particle−Polymer Interfacial Forces on Modulus
Enhancement. Another important point when consideringfiller effects is the nature of the interfacial forces between thepolymer and particle. In simulations it has been shown thatattractive forces at the particle surface can result in a greaterentanglement density surrounding the particle surface,25
thereby leading to increases in modulus. In choosing tocompare the composites according to Af values, we note thatthe Tandon and Weng equations, which assume perfectlamination between matrix and filler and a no-slip conditionat the interface, do not account for variations in interfacialattraction and the phenomenon of entanglements. Alter-natively, Lu et al. have developed a similar set of micro-mechanical equations that do account for the effects ofentanglements caused by interfacial forces.67 In their results,increasing the volume or modulus of the entanglement“interphase” surrounding each nanoparticle resulted in a linearincrease in composite modulus similar to the linear trend seenwith particle size. Thus, we assert that Af values calculated fromthe basic Tandon and Weng equations are also an indicator ofstrong interfacial forces as well as particle geometry and thequality of dispersion.Given the presence of epoxide, hydroxyl, and carbonyl
groups on the TRG surface and ester linkages along thepoly(hydroxyalkanoate) chain, the possibility does exist for theformation of polarity-based van der Waals attractions as well ashydrogen bonding. However, in PHAmcl polymers the presenceof long aliphatic extension from the polyester backbone wouldlikely reduce the intensity of such interactions due to steric-hindrance of oxygen atoms along the polymer backbone.According to this hypothesis, we would expect that the PHOpolymer with its shorter aliphatic appendages would be moreavailable for bonding interactions with TRG particles than thePHD polymer. Thus, PHO would exhibit a greater increase inthe normalized modulus than PHD. In a related study of TRGcomposites, Kim et al.68 demonstrated that functionalization ofpolyethylene with different polar moieties capable of hydrogenbonding resulted in greater enhancements of the Young’smodulus compared to TRG composites of unmodifiedpolyethylene. Furthermore, samples prepared by solventblending had greater modulus enhancement than those
Figure 7. SEM micrograph of PHA−graphene nanocomposites. Panels: (a) PHO; (b) PHOe; (c) PHD.
Macromolecules Article
dx.doi.org/10.1021/ma500022x | Macromolecules 2014, 47, 3926−39413936

prepared by melt blending, presumably due to better dispersionof the filler.Modulus Enhancement in Other Biodegradable,
Polyester Nanocomposites. To further explore the relation-ships among polymer structure, particle size, and surfacechemistry, we compared our results to other studies combininglayered carbon fillers with biodegradable polyesters. All thestudies we considered used some form of graphite-derived filler;however, variations in synthesis technique and exfoliationprocedure resulted in different particle sizes, aspect ratio, andoxygen content of the nanoparticles. The systems consideredinclude: poly(3-(R)-hydroxybutyrate)-co-poly(3-(R)-hydroxy-hexanoate) (PHBH, 13% 3HH) with expanded graphite(EG),48 poly(3-(R)-hydroxybutyrate)-co-poly(3-(R)-hydroxy-valerate) (PHBV, 13% 3HV) with microwave expandedgraphite (MEG),51 polylactide (PLA) with graphene nano-platelets (GNP),47 graphite oxide (GO),47 or thermally reducedgraphene (TRG),69 poly(ε-caprolactone) with TRG70 or GO,71
and polyglycolide-co-polylactide (PGLA, 50% lactide) withGO.72,73 Figure 8 shows the chemical structure of each
polymer, and Table 6 provides the details for each nano-composite study. For a review of preparation and exfoliationtechniques for graphene and graphite oxide see Kim et al.20 andDreyer et al.32 Figure 9b provides a plot of Ec/Em versus φ forthe other nanocomposites in the literature, which was used tocalculate Af for each. In calculating the slopes of the Ec/Emversus φ lines, we used only the first three loading fractionsfrom each data set, including 0%, where dispersion is expectedto be the best and the slope is a maximum. All the consideredpolymers have a similar polyoxoester backbone; however, theydiffer in the linear density of ester bonds and the size ofaliphatic appendages stemming from the backbone. Young’smoduli of the polymers range on the order of 1 to 1000 MPaand include both glassy and semicrystalline polymers. Theequations of Tandon and Wang predict that for a given loadingvolume of filler, low modulus polymers will experience aproportionally greater enhancement in modulus than will highmodulus polymers.20 Thus, the calculation of Af from theTandon and Weng equations allows normalization of Ec/Em
Figure 8. Structures of various biodegradable polyoxoesters. Monomers <1% (wt) of polymer composition are not depicted in the structures.
Table 6. Properties of Biodegradable Polyoxoester-Layered Carbon Nanocomposites
aspect ratiov Af (d/t)
polymer−filler matrix modulus Em (MPa) particle diamu d (nm) measd calcd oxygen content C:Ow dispr methodx sonic time (h)
PHO−TRGa 4.5 500b 700−1500c 309 10:1d TCM 0.12PHOe−TRGa 6.3 500b 700−1500c 97 10:1d TCM 0.12PHD−TRGa 5.3 500b 700−1500c 151 10:1d TCM 0.12PHBH−EGe 292 13000f 240−570g 325 58:1h TCM 0.16PHBV−MEGi 85.7 5000j 2500j 11 94:1j TCM 0.16PLA−GNPk 1800 5000k 600−900k 1110 22:1l TCM 2PLA−TRGm 3000 500n 700−1500c 81 10:1d melt 0PLA−GOk 1800 500k 300−800o 1405 2:1d DMK/TCM 5PCL−TRGp 107 500n 700−1500c 846 10:1d TCM 2PCL−GOq 340 600r 400−900o 53 2:1d DMF 24PLGA−GOs 110 200s 150−300o 191 2:1d DMF/DCM 24PLGA−GOt 203 500t 300−800o 155 2:1d DMF 1
aPolymers in this study. bReference 33. cReferences 33 and 75. dReference 76. eReference 48. fReference 77. gReferences 78−80. hReference 74.mReference 69. iReference 51. jReference 81. kReference 47. lReferences 76, 82, and 83. nReference 33. oReferences 76 and 83 pReference 70.qReference 71. rReference 84. sReference 73. tReference 72. uParticle diameter was usually given as a range: here we present an estimated medianvalue. vAspect ratio (measd) was estimated by dividing the range of particle diameters by the estimated median value for particle thickness that wasfound in the specified references. Aspect ratio (calcd) was determined from Ec/Em versus φ data using the equations of Tandon and Weng. wC:O(the ratio of carbon to oxygen atoms in the filler material). xSolvents: TCM (chloroform), DCM (dichloromethane) DMK (acetone), DMF (N,N-dimethylformamide).
Macromolecules Article
dx.doi.org/10.1021/ma500022x | Macromolecules 2014, 47, 3926−39413937

versus ϕ data so that an equal comparison of reinforcementeffects can be made.We judge the quality of reinforcement for each system by
comparing the value of Af predicted from the Tandon andWeng equations to the Af determined from particle measure-ments. In some cases measured Af were taken from spectros-copy or microscopy data from the actual composite, and inothers Af values were determined from measurements of purenanofiller.Generally, the data show that the use of particles with a larger
aspect ratio contributes to greater enhancements in the relativemodulus. Polymers with small aliphatic appendages or none,e.g., PLA−GO, PLA−GNP, PHBH−EG, PCL−TRG, andPGLA−GO, tend to give values of Af near or above themeasured Af, while PHO, PHOe, and PHD, all with longeraliphatic appendages, give values of Af well below the Af valuemeasured from pure nanofiller (Table 6). This is consistentwith our hypothesis that steric hindrance from long aliphaticappendages may disrupt hydrogen bonding and other non-covalent interactions with oxygen molecules on the TRGsurface. However, it is possible that use of a longer sonicationperiod for the TRG used in our study could have resulted inincreased value of Af due to better exfoliation of multilayerparticles.84 We also note that the highest value of Af, 1405,occurs when PLA is paired with GO. Again this suggests thatthe additional interfacial attraction due to the presence of extraoxygen moieties on the surface of GO may give rise to strongreinforcement effects.However, the data set does contain exceptions to these
observations. The most conspicuous is the low modulus ofPLA−TRG composites given that PLA−GO and PLA−GNPboth show a much greater modulus enhancement. For PLA−TRG we attribute the low value of Af to the melt blendingtechnique used for graphene dispersion.68 As a result of thisprocess, the TRG received no sonication prior to mixing whichlikely resulted in poor exfoliation of graphene particles and areduced aspect ratio. Furthermore, the viscosity of melt phasePLA is likely much higher than solvated PLA thus requiringgreater mixing times for melt compounding.
The modulus enhancement for PHBV is also unexpectedlylow given the much greater modulus enhancement for PHBH,which is structurally similar. Here we note that the oxygencontent of the microwave expanded graphite used for PHBV(C:O = 94:1) is the lowest among all filler materials. Wespeculate that reduced intermolecular attraction between thepolymer and filler may have led to poor dispersion and minimalreinforcement effects.Next, we draw attention to the result of the PCL−GO
composites. Given the absence of any aliphatic appendagesalong the PCL backbone and the use of GO for filler, we expectthe presence of strong interfacial adhesion in the composite,thus the minimal increase in modulus is an unexpected result.While the solvent used for this study, dimethylformamide(DMF), is a good solvent for graphite oxide,85 it is a poorsolvent for PCL, especially as Mw increases beyond 65 000:86
for the PCL−GO composite, the Mw was 300 000. Thus, poorphysical dispersion of the GO in PCL may have contributed tothe low modulus enhancement.For PGLA-GO, we obtained data from two, very similar
studies; however, we do observe a small disparity in the degreeof reinforcement. In the first study73 which produced thehighest calculated value of Af, 191, we note that the researchersused a 24 h sonication period to disperse the GO, and theydissolved the polymer in dichloromethane which is known tobe a strong solvent for PGLA. In the second study72 whichproduced a lower calculated value Af, 155, the authors sonicatedthe GO for only 1 h and dissolved the PGLA indimethylformamide, a less effective solvent, thus requiringthem to heat the polymer to 60 °C.For several of the polymer systems including: PLA−GO,
PLA−GNP, PLA−TRG, and PHBH, the modulus eitherremains constant or even decrease with increasing grapheneloading beyond ∼0.3 vol %. This suggests a poor dispersion ofgraphene possibly induced by aggregation at higher grapheneloadings.
■ CONCLUSIONS
The purpose of this study was to explore how variations in themolecular structure of elastomeric PHAmcl polymers affect their
Figure 9. Relative modulus increase and effectiveness of dispersion of layered carbon nanofillers in biopolymer nanocomposites. (a)Nanocomposites in this report: PHO−TRG (⧫), PHOe−TRG (■), PHD−TRG (▲), xPHO−TRG (◊), xPHOe−TRG (□), and xPHD−TRG(△). “x” before the abbreviation denotes data corrected for reduced crystallinity. (b) Nanocomposites in the literature: PLA−GO (●) PLA−GNP(−), PHBH−EG (∗), PLA−TRG (×), PHBV−MEG (○), PGLA−GOα (+), PGLA−GOβ (◊), PCL−TRG (△), and PCL−GO (□). Ec and Em arethe modulus for the composite and unfilled matrix, respectively. The number next to each polymer name is the filler’s average aspect ratio (Af)calculated using the Tandon and Weng model.
Macromolecules Article
dx.doi.org/10.1021/ma500022x | Macromolecules 2014, 47, 3926−39413938

performance in TRG nanocomposites. Depending on matrixtype, the Young’s modulus increased by 180−590%, and theelongation at break decreased by 41−89% at the 2.5% loading.However, it is likely that the magnitude of the modulusenhancements would have been higher if it were not for adecrease in matrix crystallinity by 15−55%.Percolation of an electrically conducting, graphene, network
was observed to occur between a volume loading of 0.4−0.5%,and an increase in electrical conductivity by >107 orders wasobserved at 2.5% loading. Conversely, rheology data indicatedthat percolation of a pseudosolid network based on graphene-polymer entanglements occurred at a distinctly lower grapheneloading close to 0 vol %.The addition of graphene to PHAmcl also showed an effect on
the thermal stability of the composites: for T50% changes variedbetween an increase of 5.8 °C and a decrease of −4.5 °C. Forthe endothermic heat requirement at T50%, values variedbetween an increase of 60% and a decrease of −30%. Moreover,E50% values showed a strong correlation with variation in theheat capacity of composites, likely due to changes in theentanglement structure of polymer chains.Comparison of modulus improvements among the three
different matrices was done by calculating values for Af fromnormalized modulus data. Initially, the results indicated thatreinforcement in PHO, Af
PHO = 309, was more effective than inPHD, Af
PHD = 151, but when the effects of crystallinity changewere considered, PHO and PHD showed similar improvementsin modulus, Af
PHO = 435 and AfPHD = 425, respectively. Still,
differences in the elongation at break and SEM fracturetopology suggest that PHD may disentangle from the grapheneparticles more easily than PHO. We speculate this may be dueto the longer packing length of PHD, i.e. its larger diameter, ora reduction in the interfacial attraction between PHD and TRGdue to steric shielding of oxygen atoms along the polyesterbackbone.In the covalently cross-linked PHOe matrix, Af
PHOe = 97,modulus improvements were significantly lower than in theuncross-linked PHO, Af
PHO = 309, even when samplecrystallinity was considered. Presumably, the network structureof PHOe precludes the formation of strong entanglements withthe graphene particles. This hypothesis is supported by SEMimages of fractured surfaces following extension testing. Therough surface topology of the PHO−0.5% graphene compositesuggests the formation of dense polymer−graphene entangle-ments. Only at 2.5% graphene loading does PHOe show asimilarly rough, pull-out morphology. An interesting experi-ment would be to measure the reinforcement effects whenmatrix cross-linking is performed after graphene dispersion.Our survey of other composite systems in the literature
highlights the numerous factors, which can control theeffectiveness of nanoparticle reinforcement. These include:polymer chemistry, particle aspect ratio, chemical modificationson the nanofiller surface, dispersion method (i.e., solvent versusmelt), solvent choice for both graphene and polymer, andduration of sonication treatment for exfoliation. Comparison ofour results against other, in-class, biopolyesters gives supportfor our hypothesis that strong interfacial interactions canincrease the degree of modulus enhancement in PHAs. Longeraliphatic appendages present in PHAmcl polymers may precludethe formation of hydrogen bonds and other noncovalentinteractions with the TRG nanoparticles compared to less bulkypolymers such as PHB-co-PHH, PLA, PCL, and PGLA thatshowed greater improvements in relative modulus. The use of
GO with its higher fraction of epoxide, hydroxyl, and carbonylmoieties may be a way to further improve interfacial attractionwith PHAmcl, similar to the way in which GO proved veryeffective with PLA47 and PGLA72 systems. Additionally PHAmclcould itself be functionalized to promote hydrogen bonding,e.g., with the use of terminally substituted ω-hydroxy fattyacids87 as monomer feedstocks.Furthermore, good dispersion technique is essential when
preparing polymer graphene composites. The saturation ofmodulus enhancement with graphene loading seen in somecomposites is likely an indication of poor dispersion. Whilesonication can be a useful tool for exfoliation, which increasesthe aspect ratio of particles, it can also break graphene particlesand lessen their aspect ratio when the duration of the treatmentis extended.84 Comparison among different studies in the fieldwould benefit from a quantitative approach to this technique bydetailed reporting of the graphene concentration in thedispersant, duration of sonication times, and power density(power/volume) used for exfoliation. Furthermore, care shouldbe taken to choose a solvent, which is effective at solubilizingboth the nanoparticle and the polymer. In cases of highviscosity in either polymer melts or solutions, estimation ofmixing time can help ensure proper dispersion, i.e., goodmicromixing at the length scale of the nanoparticles. Theestimate of mixing time depends on filler density, solutionviscosity, volumetric power density, and geometry of the mixingequipment.We envision several practical applications for PHA−graphene
composite technology. First, the significant improvements inpolymer stiffness afforded by graphene reinforcement greatlyexpand the useful mechanical range of PHA elastomers.Second, the added property of electrical conductivity couldallow the proliferation of PHA based materials into previouslyunrecognized applications. These may include for instance,biodegradable options for packaging of charge sensitiveelectronic circuit boards and charge dissipating floor coveringsfor use in static-sensitive manufacturing processes. Becausepoly(hydroxyalkanoate)s are also biocompatible the possibilitymay exist for the use of these materials in implantable devicesor as tissue scaffolds with electrical conductivity. However, whatremains the most significant impediment to greater prolifer-ation of PHAmcl polymers is their low melting point, 45−55 °C,compared to PHB with a melting point of 175 °C. For PHOand PHD graphene addition resulted in a small increase in Tmby up to 3 °C but caused a reduction in Tm by as much as −8°C for PHOe. Fortunately with the use of blends, copolymers,cross-linking, and more recently PHA block copolymers, it islikely that a PHAmcl material can be created with a meltingtemperature sufficiently high to meet the requirements ofcurrent engineering plastics.
■ ASSOCIATED CONTENT
*S Supporting Information(1) Method and schematic of poly(hydroxyalkanoate) biosyn-thesis, (2) method and results of graphene characterization, (3)TGA and DSC thermograms for PHA−graphene decom-position studies, (4) method and results for estimating thepercolation threshold from rheology data, (5) method andresults for estimating the percolation threshold from electricalconductivity data, (6) equations and parameter values forcomputing Af using the micromechanical theory of Tandon andWeng, and (7) derivation of a corrected modulus enhancement
Macromolecules Article
dx.doi.org/10.1021/ma500022x | Macromolecules 2014, 47, 3926−39413939

factor to account for changes in crystallinity. This material isavailable free of charge via the Internet at http://pubs.acs.org.
■ AUTHOR INFORMATIONCorresponding Authors*(A.A.A.) E-mail: [email protected]. Telephone: 971-2-607-5584. Fax: 971-2-6075200.*(F.S.) E-mail: [email protected]. Telephone: 612-624-9776.Fax: 612-625-5780.Author ContributionsThe manuscript was written through the contributions of allauthors. All authors have given approval to the final version ofthe manuscript.NotesThe authors declare no competing financial interest.∥Part of this material was originally presented at the 244th ACSNational Meeting in Philadelphia, PA (August 19−23, 2012).
■ ACKNOWLEDGMENTSThe authors would like to acknowledge the following peopleand organizations for their contribution to the manuscript: Mr.Daniel P. Rouse of the University of Minnesota for synthesisand purification of the poly(hydroxyalkanoate)s polymers, Mr.Hussain Arwani (a Petroleum Institute visiting student from theUniversity of Waterloo) for assistance in preparation andcharacterization of nanocomposites (while at the PetroleumInstitute), Dr. Thomas Krick and the Center for MassSpectrometry and Proteomics, Dr. Fang Zhou of theCharacterization Facility, and Dr. David Giles of the PolymerCharacterization Lab. This work was financially supported bythe Abu Dhabi Minnesota Institute for Research Excellence(ADMIRE).
■ REFERENCES(1) Reis, M. A. M.; Serafim, L. S.; Lemos, P. C.; Ramos, A. M.;Aguiar, F. R.; Loosdrecht, M. C. M. Bioprocess Biosystems Eng. 2003, 25(6), 377−385.(2) Chen, G.-Q.; Wu, Q. Biomaterials 2005, 26 (33), 6565−6578.(3) Wang, F.; Lee, S. Y. Appl. Environ. Microbiol. 1997, 63 (12),4765−4769.(4) Lee, W.-H.; Loo, C.-Y.; Nomura, C. T.; Sudesh, K. Bioresour.Technol. 2008, 99 (15), 6844−6851.(5) Castilho, L. R.; Mitchell, D. A.; Freire, D. M. G. Bioresour.Technol. 2009, 100 (23), 5996−6009.(6) Ishizaki, A.; Tanaka, K.; Taga, N. Appl. Microbiol. Biotechnol.2001, 57 (1−2), 6−12.(7) Barrett, J. S. F.; Srienc, F. In Green chemistry for the production ofbiodegradable, biorenewable, and biocompatible polymers; John Wiley &Sons, Inc.: New York, 2011; pp 329−359.(8) Gross, R. A.; DeMello, C.; Lenz, R. W.; Brandl, H.; Fuller, R. C.Macromolecules 1989, 22 (3), 1106−1115.(9) Liu, W.; Chen, G. Q. Appl. Microbiol. Biotechnol. 2007, 76 (5),1153−9.(10) Fernandes, E. G.; Pietrini, M.; Chiellini, E. Biomacromolecules2004, 5 (4), 1200−1205.(11) Botana, A.; Mollo, M.; Eisenberg, P.; Torres Sanchez, R. M.Appl. Clay Sci. 2010, 47 (3−4), 263−270.(12) Maiti, P.; Batt, C. A.; Giannelis, E. P. Biomacromolecules 2007, 8(11), 3393−3400.(13) Xu, C.; Qiu, Z. Polym. Adv. Technol. 2011, 22 (5), 538−544.(14) Yun, S. I.; Lo, V.; Noorman, J.; Davis, J.; Russell, R. A.; Holden,P. J.; Gadd, G. E. Polym. Bull. 2010, 64 (1), 99−106.(15) Li, B.; Zhong, W.-H. J. Mater. Sci. 2011, 46 (17), 5595−5614.(16) Byrne, M. T.; Gun’ko, Y. K. Adv. Mater. 2010, 22 (15), 1672−1688.
(17) Verdejo, R.; Bernal, M. M.; Romasanta, L. J.; Lopez-Manchado,M. A. J. Mater. Chem. 2011, 21 (10), 3301−3310.(18) Lee, C.; Wei, X.; Kysar, J. W.; Hone, J. Science 2008, 321 (5887),385−388.(19) Bunch, J. S.; Verbridge, S. S.; Alden, J. S.; van der Zande, M.;Parpia, J. M.; Craighead, H. G.; McEuen, P. L. Nano Lett. 2008, 8 (8),2458−2462.(20) Kim, H.; Abdala, A. A.; Macosko, C. W. Macromolecules 2010,43 (16), 6515−6530.(21) Everaers, R.; Sukumaran, S. K.; Grest, G. S.; Svaneborg, C.;Sivasubramanian, A.; Kremer, K. Science 2004, 303 (5659), 823−6.(22) Hiemenz, P. C.; Lodge, T. P. Polymer Chemistry, 2nd ed.; CRCPress: Boca Raton, FL, 2007.(23) de Gennes, P. G. J. Chem. Phys. 1971, 55 (2), 572−579.(24) Sarvestani, A. S. Eur. Polym. J. 2008, 44 (2), 263−269.(25) Kabanemi, K. K.; Hetu, J.-F. J. Non-Newtonian Fluid Mech. 2010,165 (15−16), 866−878.(26) Toepperwein, G. N.; Karayiannis, N. C.; Riggleman, R. A.;Kroger, M.; de Pablo, J. J. Macromolecules 2011, 44 (4), 1034−1045.(27) Schneider, G. J.; Nusser, K.; Willner, L.; Falus, P.; Richter, D.Macromolecules 2011, 44 (15), 5857−5860.(28) Riggleman, R. A.; Toepperwein, G.; Papakonstantopoulos, G. J.;Barrat, J.-L.; de Pablo, J. J. J. Chem. Phys. 2009, 130 (24), 244903−6.(29) Knauert, S. T.; Douglas, J. F.; Starr, F. W. J. Polym. Sci., Part B:Polym. Phys. 2007, 45 (14), 1882−1897.(30) Tandon, G. P.; Weng, G. J. Polym. Compos. 1984, 5 (4), 327−333.(31) Masnada, E.; Merabia, S.; Couty, M.; Barrat, J.-L. Soft Matter2013, 9 (44), 10532−10544.(32) Dreyer, D. R.; Park, S.; Bielawski, C. W.; Ruoff, R. S. Chem. Soc.Rev. 2010, 39 (1), 228−240.(33) McAllister, M. J.; Li, J.-L.; Adamson, D. H.; Schniepp, H. C.;Abdala, A. A.; Liu, J.; Herrera-Alonso, M.; Milius, D. L.; Car, R.;Prud’homme, R. K.; Aksay, I. A. Chem. Mater. 2007, 19 (18), 4396−4404.(34) Lageveen, R. G.; Huisman, G. W.; Preusting, H.; Ketelaar, P.;Eggink, G.; Witholt, B. Appl. Environ. Microbiol. 1988, 54 (12), 2924−2932.(35) Mantzaris, N. V.; Kelley, A. S.; Daoutidis, P.; Srienc, F. Chem.Eng. Sci. 2002, 57 (21), 4643−4663.(36) Pederson, E. N.; McChalicher, C. W. J.; Srienc, F.Biomacromolecules 2006, 7 (6), 1904−1911.(37) Riis, V.; Mai, W. J. Chromatogr. 1988, 445 (1), 285−289.(38) Prud’homme, R. K.; Aksay, I. A.; Adamson, D.; Abdala, A.Thermally exfoliated graphite oxide and polymer nanocomposites.US7658901B2, 2010.(39) Staudenmaier, L. Ber. Dtsch. Chem. Ges. 1898, 31, 1481−1487.(40) de Koning, G. J. M.; van Bilsen, H. M. M.; Lemstra, P. J.;Hazenberg, W.; Witholt, B.; Preusting, H.; van der Galien, J. G.;Schirmer, A.; Jendrossek, D. Polymer 1994, 35 (10), 2090−2097.(41) Nerkar, M.; Ramsay, J.; Ramsay, B.; Kontopoulou, M.;Hutchinson, R. J. Polym. Environ. 2013, 21 (1), 24−29.(42) Kokta, B. V.; Valade, J. L.; Hornof, V.; Law, K. N. Thermochim.Acta 1976, 14 (1−2), 71−86.(43) Kashiwagi, T.; Du, F.; Douglas, J. F.; Winey, K. I.; Harris, R. H.;Shields, J. R. Nat. Mater. 2005, 4 (12), 928−933.(44) Kim, K.; Regan, W.; Geng, B.; Aleman, B.; Kessler, B. M.; Wang,F.; Crommie, M. F.; Zettl, A. physica status solidi (RRL) − RapidResearch Letters 2010, 4 (11), 302−304.(45) Wilkie, C. A.; Morgan, A. B. Fire retardancy of polymericmaterials. CRC Press: Boca Raton, FL, 2010.(46) Noda, I.; Green, P. R.; Satkowski, M. M.; Schechtman, L. A.Biomacromolecules 2005, 6 (2), 580−586.(47) Pinto, A. M.; Cabral, J.; Tanaka, D. A. P.; Mendes, A. M.;Magalhaes, F. D. Polym. Int. 2013, 62 (1), 33−40.(48) Lin, G.; Noda, I.; Mark, J. E. In Graphite, Graphene, and theirPolymer Nanocomposites; Mukhopadhyay, P., Gupta, R. K., Eds. CRCPress: Boca Raton, FL, 2013; pp 423−446.
Macromolecules Article
dx.doi.org/10.1021/ma500022x | Macromolecules 2014, 47, 3926−39413940
(49) Li, Y.; Kroger, M.; Liu, W. K. Phys. Rev. Lett. 2012, 109 (11),118001.(50) Miloaga, D. G.; Hosein, H.-A. A.; Misra, M.; Drzal, L. T. J. Appl.Polym. Sci. 2007, 106 (4), 2548−2558.(51) Sridhar, V.; Lee, I.; Chun, H. H.; Park, H. eXPRESS Polym. Lett.2013, 7 (4), 320−328.(52) Bordes, P.; Pollet, E.; Bourbigot, S.; Averous, L. Macromol.Chem. Phys. 2008, 209 (14), 1473−1484.(53) Kazatchkov, I. B.; Hatzikiriakos, S. G.; Bohnet, N.; Goyal, S. K.Polym. Eng. Sci. 1999, 39 (4), 804−815.(54) Vermant, J.; Ceccia, S.; Dolgovskij, M.; Maffettone, P.; Macosko,C. J. Rheol. (1978−present) 2007, 51 (3), 429−450.(55) McLachlan, D. S.; Sauti, G. J. Nanomater. 2007, 2007, 30389.(56) Liu, X.; Metcalf, T. H.; Robinson, J. T.; Houston, B. H.; Scarpa,F. Nano Lett. 2012, 12 (2), 1013−1017.(57) Harris, A. M.; Lee, E. C. J. Appl. Polym. Sci. 2008, 107 (4),2246−2255.(58) Crist, B.; Fisher, C. J.; Howard, P. R. Macromolecules 1989, 22(4), 1709−1718.(59) Sedighiamiri, A.; Van Erp, T. B.; Peters, G. W. M.; Govaert, L.E.; van Dommelen, J. A. W. J. Polym. Sci., Part B: Polym. Phys. 2010, 48(20), 2173−2184.(60) Halpin, J.; Kardos, J. J. Appl. Phys. 1972, 43 (5), 2235−2241.(61) Du, F.; Scogna, R. C.; Zhou, W.; Brand, S.; Fischer, J. E.; Winey,K. I. Macromolecules 2004, 37 (24), 9048−9055.(62) Ren, J.; Silva, A. S.; Krishnamoorti, R. Macromolecules 2000, 33(10), 3739−3746.(63) Celzard, A.; McRae, E.; Deleuze, C.; Dufort, M.; Furdin, G.;Mareche, J. F. Phys. Rev. B: Condens. Matter Mater. Phys. 1996, 53 (10),6209−6214.(64) Lu, C.; Mai, Y.-W. Phys. Rev. Lett. 2005, 95 (8), 088303.(65) Halpin, J. C.; Kardos, J. L. Polym. Eng. Sci. 1976, 16 (5), 344−352.(66) Mori, T.; Tanaka, K. Acta Metall. 1973, 21 (5), 571−574.(67) Lu, P.; Leong, Y. W.; Pallathadka, P. K.; He, C. B. Int. J. Eng. Sci.2013, 73 (0), 33−55.(68) Kim, H.; Kobayashi, S.; AbdurRahim, M. A.; Zhang, M. J.;Khusainova, A.; Hillmyer, M. A.; Abdala, A. A.; Macosko, C. W.Polymer 2011, 52 (8), 1837−1846.(69) Kim, I.-H.; Jeong, Y. G. J. Polym. Sci., Part B: Polym. Phys. 2010,48 (8), 850−858.(70) Zhang, J.; Qiu, Z. Ind. Eng. Chem. Res. 2011, 50 (24), 13885−13891.(71) Kai, W.; Hirota, Y.; Hua, L.; Inoue, Y. J. Appl. Polym. Sci. 2008,107 (3), 1395−1400.(72) Park, J. J.; Yu, E. J.; Lee, W.-K.; Ha, C.-S. Polym. Adv. Technol.2013, 25 (1), 48−54.(73) Yoon, O.; Sohn, I.; Kim, D.; Lee, N.-E. Macromol. Res. 2012, 20(8), 789−794.(74) Li, J.; Kim, J.-K.; Lung Sham, M. Scripta Mater. 2005, 53 (2),235−240.(75) Burnett, T. L.; Yakimova, R.; Kazakova, O. J. Appl. Phys. 2012,112 (5), 054308−7.(76) Schniepp, H. C.; Li, J.-L.; McAllister, M. J.; Sai, H.; Herrera-Alonso, M.; Adamson, D. H.; Prud’homme, R. K.; Car, R.; Saville, D.A.; Aksay, I. A. J. Phys. Chem. B 2006, 110 (17), 8535−8539.(77) Celzard, A.; Mareche, J. F.; Furdin, G. Carbon 2002, 40 (14),2713−2718.(78) Chen, G.; Weng, W.; Wu, D.; Wu, C.; Lu, J.; Wang, P.; Chen, X.Carbon 2004, 42 (4), 753−759.(79) Celzard, A.; Mareche, J. F.; Furdin, G.; Puricelli, S. J. Phys. D:Appl. Phys. 2000, 33 (23), 3094.(80) Zhang, X.; Lin, G.; Abou-Hussein, R.; Allen, W. M.; Noda, I.;Mark, J. E. J. Macromol. Sci., Part A: Pure Appl.Chem. 2008, 45 (6),431−439.(81) Sridhar, V.; Jeon, J.-H.; Oh, I.-K. Carbon 2010, 48 (10), 2953−2957.(82) Szatkowski, C.XG Sciences, Inc.: Lansing, MI. Personalcommunication, 2013.
(83) Stankovich, S.; Dikin, D. A.; Piner, R. D.; Kohlhaas, K. A.;Kleinhammes, A.; Jia, Y.; Wu, Y.; Nguyen, S. T.; Ruoff, R. S. Carbon2007, 45 (7), 1558−1565.(84) Botas, C.; Perez-Mas, A. M.; Alvarez, P.; Santamaría, R.; Granda,M.; Blanco, C.; Menendez, R. Carbon 2013, 63, 576−578.(85) Paredes, J. I.; Villar-Rodil, S.; Martínez-Alonso, A.; Tascon, J. M.D. Langmuir 2008, 24 (19), 10560−10564.(86) Bordes, C.; Freville, V.; Ruffin, E.; Marote, P.; Gauvrit, J. Y.;Briancon, S.; Lanteri, P. Int. J. Pharm. 2010, 383 (1−2), 236−243.(87) Lu, W.; Ness, J. E.; Xie, W.; Zhang, X.; Minshull, J.; Gross, R. A.J. Am. Chem. Soc. 2010, 132 (43), 15451−15455.
Macromolecules Article
dx.doi.org/10.1021/ma500022x | Macromolecules 2014, 47, 3926−39413941
Copyright © 2022 FDOKUMEN