Liquid crystal engineering of carbon nanofibers and nanotubes
Upload
independentCategory
view
1download
0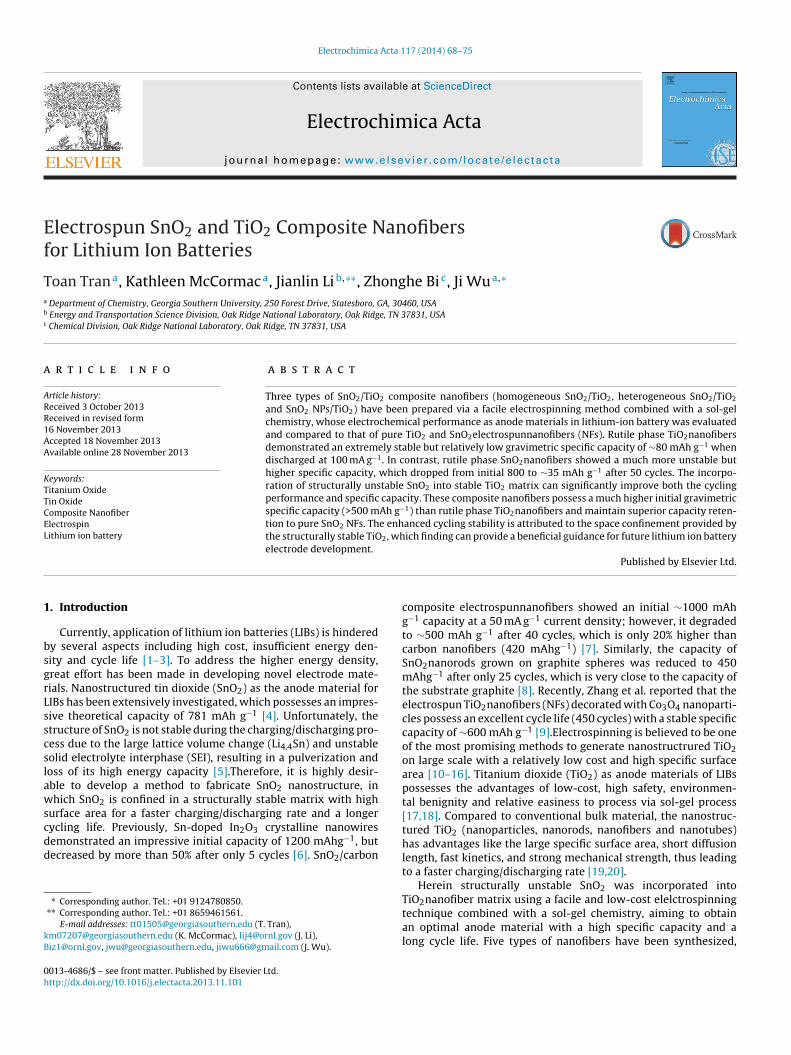
Ef
Ta
b
c
a
ARR1AA
KTTCEL
1
bsgrLsscslawscdd
kB
0h
Electrochimica Acta 117 (2014) 68– 75
Contents lists available at ScienceDirect
Electrochimica Acta
jou rn al hom ep age: www.elsev ier .com/ locate /e lec tac ta
lectrospun SnO2 and TiO2 Composite Nanofibersor Lithium Ion Batteries
oan Trana, Kathleen McCormaca, Jianlin Lib,∗∗, Zhonghe Bic, Ji Wua,∗
Department of Chemistry, Georgia Southern University, 250 Forest Drive, Statesboro, GA, 30460, USAEnergy and Transportation Science Division, Oak Ridge National Laboratory, Oak Ridge, TN 37831, USAChemical Division, Oak Ridge National Laboratory, Oak Ridge, TN 37831, USA
r t i c l e i n f o
rticle history:eceived 3 October 2013eceived in revised form6 November 2013ccepted 18 November 2013vailable online 28 November 2013
eywords:
a b s t r a c t
Three types of SnO2/TiO2 composite nanofibers (homogeneous SnO2/TiO2, heterogeneous SnO2/TiO2
and SnO2 NPs/TiO2) have been prepared via a facile electrospinning method combined with a sol-gelchemistry, whose electrochemical performance as anode materials in lithium-ion battery was evaluatedand compared to that of pure TiO2 and SnO2electrospunnanofibers (NFs). Rutile phase TiO2nanofibersdemonstrated an extremely stable but relatively low gravimetric specific capacity of ∼80 mAh g−1 whendischarged at 100 mA g−1. In contrast, rutile phase SnO2nanofibers showed a much more unstable buthigher specific capacity, which dropped from initial 800 to ∼35 mAh g−1 after 50 cycles. The incorpo-
itanium Oxidein Oxideomposite Nanofiberlectrospinithium ion battery
ration of structurally unstable SnO2 into stable TiO2 matrix can significantly improve both the cyclingperformance and specific capacity. These composite nanofibers possess a much higher initial gravimetricspecific capacity (>500 mAh g−1) than rutile phase TiO2nanofibers and maintain superior capacity reten-tion to pure SnO2 NFs. The enhanced cycling stability is attributed to the space confinement provided bythe structurally stable TiO2, which finding can provide a beneficial guidance for future lithium ion battery
electrode development.. Introduction
Currently, application of lithium ion batteries (LIBs) is hinderedy several aspects including high cost, insufficient energy den-ity and cycle life [1–3]. To address the higher energy density,reat effort has been made in developing novel electrode mate-ials. Nanostructured tin dioxide (SnO2) as the anode material forIBs has been extensively investigated, which possesses an impres-ive theoretical capacity of 781 mAh g−1 [4]. Unfortunately, thetructure of SnO2 is not stable during the charging/discharging pro-ess due to the large lattice volume change (Li4.4Sn) and unstableolid electrolyte interphase (SEI), resulting in a pulverization andoss of its high energy capacity [5].Therefore, it is highly desir-ble to develop a method to fabricate SnO2 nanostructure, inhich SnO2 is confined in a structurally stable matrix with high
urface area for a faster charging/discharging rate and a longer
ycling life. Previously, Sn-doped In2O3 crystalline nanowiresemonstrated an impressive initial capacity of 1200 mAhg−1, butecreased by more than 50% after only 5 cycles [6]. SnO2/carbon∗ Corresponding author. Tel.: +01 9124780850.∗∗ Corresponding author. Tel.: +01 8659461561.
E-mail addresses: [email protected] (T. Tran),[email protected] (K. McCormac), [email protected] (J. Li),[email protected], [email protected], [email protected] (J. Wu).
013-4686/$ – see front matter. Published by Elsevier Ltd.ttp://dx.doi.org/10.1016/j.electacta.2013.11.101
Published by Elsevier Ltd.
composite electrospunnanofibers showed an initial ∼1000 mAhg−1 capacity at a 50 mA g−1 current density; however, it degradedto ∼500 mAh g−1 after 40 cycles, which is only 20% higher thancarbon nanofibers (420 mAhg−1) [7]. Similarly, the capacity ofSnO2nanorods grown on graphite spheres was reduced to 450mAhg−1 after only 25 cycles, which is very close to the capacity ofthe substrate graphite [8]. Recently, Zhang et al. reported that theelectrospun TiO2nanofibers (NFs) decorated with Co3O4 nanoparti-cles possess an excellent cycle life (450 cycles) with a stable specificcapacity of ∼600 mAh g−1 [9].Electrospinning is believed to be oneof the most promising methods to generate nanostructrured TiO2on large scale with a relatively low cost and high specific surfacearea [10–16]. Titanium dioxide (TiO2) as anode materials of LIBspossesses the advantages of low-cost, high safety, environmen-tal benignity and relative easiness to process via sol-gel process[17,18]. Compared to conventional bulk material, the nanostruc-tured TiO2 (nanoparticles, nanorods, nanofibers and nanotubes)has advantages like the large specific surface area, short diffusionlength, fast kinetics, and strong mechanical strength, thus leadingto a faster charging/discharging rate [19,20].
Herein structurally unstable SnO2 was incorporated into
TiO2nanofiber matrix using a facile and low-cost elelctrospinningtechnique combined with a sol-gel chemistry, aiming to obtainan optimal anode material with a high specific capacity and along cycle life. Five types of nanofibers have been synthesized,
T. Tran et al. / Electrochimica Acta 117 (2014) 68– 75 69
1: Ti(i-C3H7O) 4 in HOAc & EtO Hmixes with PVP in EtOH.
Elec trospinning
25 KV 12 cm
Annealing at 540 oC
To remo ve PV P
1: TiO2 nan ofibe rs
2: Sn (t-C4H9O)4 in HOAc & EtO Hmixes with PVP in EtO H.
poly
3: Sn(t-C4H9O)4 & Ti(i-C3H7O)4 inHOAc & EtO H mixes with PV P in EtOH.
4: Ti(i-C3H7O)4 & SnO2 NPs in HOAc & EtO H mi xes with PV P in EtOH.
5: Ti(i-C3H7O)4 & ground Sn O2nano fibe rs di ssol ved in HOA c & EtOH mixes with PV P in EtOH.
5: Hetergeneou sSnO2/TiO2 nanofibe rs
2: SnO2 nanofibe rs
3: Homogeneous SnO2/TiO2 nanofibe rs
4: SnO2 NPs/ TiO2nan ofibe rs
an ele
itpc(detHaaap
2
2
ctpSN(detoa1r(adCfpAffgF
fs
HOAc: ace�c acid ; EtOH: ethan ol; PVP:
Fig. 1. The schematic of the nanofiber fabrication using
ncluding pure SnO2nanofibers, pure TiO2nanofibers, and threeypes of SnO2/TiO2 composite nanofibers [14–16]. The surface mor-hology, composition, crystallinity and structure of these NFs wereharacterized using field emission scanning electron microscopeFESEM), energy dispersive spectroscopy (EDS) analysis, X-rayiffraction (XRD) and micro-Raman. In general, two strategies weremployed to incorporate SnO2 into TiO2 NFs matrix to generatehree different types of composite NFs: 1) Homogeneous and 2)eterogeneous. The polyvinylpyrrolidone (PVP) polymer functionss a fiber template that can be easily removed by a post-syntheticnnealing in air [10,14]. Their electrochemical performance asnode materials in lithium ion batteries was evaluated and com-ared to those of pure SnO2 and TiO2nanofibers.
. Experimental
.1. Nanofiber Fabrication
Five types of electrospun nanofibers (NFs) have been fabri-ated, including pure TiO2 and pure SnO2nanofibers, as well ashree types of SnO2/TiO2 composite nanofibers. Pure TiO2 andure SnO2 NFs were used for control experiments. Three types ofnO2/TiO2 composite NFs are named as 1) Homogeneous SnO2/TiO2Fs; 2) Heterogeneous SnO2/TiO2 NFs; and 3) SnO2 nanoparticles
NPs)/TiO2 NFs. Fabrication of TiO2 NFs: First, 1 g polyvinylpyrroli-one (1.3 M MW, Sigma Aldrich) was dissolved in 10 ml absolutethanol and mixed well using a vortex mixer. Meanwhile, 1 gitanium (IV) isopropoxide (98%, Acros Organics) was mixed thor-ughly with 3 ml glacial acid (99.9%, Fisher Scientific) and 3 mlbsolute ethanol by magnetic stirring, followed by sonication for0 minutes. Then these two solutions were mixed together and fab-icated into nanofibers using a home-built electrospinning setupS1). The electrospinning working parameters were as follows:pplied voltage is direct current (DC) 25 kV (Spellman P/N230-30R);istance between the syringe needle (16 gauge, Air-Tite Productso.) containing the solution and the grounding collector (aluminumoil) is 12 cm; and pumping rate of syringe was 3 ml/hr. The syringeump was purchased from New Era Pump Systems Inc. (NE-1000).s-fabricated composite nanofibers were annealed at 540 ◦C in air
or 12 hrs to remove organic polymers using a Lindberg Blue tubeurnace, resulting in the formation of inorganic TiO2nanofibers. Theeneral fabrication scheme for all types of nanofibers is listed in
ig. 1.Fabrication of SnO2 NFs: the procedure is similar to that usedor TiO2nanofibers except that 2.7 g tin(IV) tert-butoxide (99.99%igma Aldrich) instead of 1 g titanium (IV) isopropoxide was used
vinylpyrrolid one; NPs: n anop ar�cles.
crospinning method combined with sol-gel chemistry.
as the sol-gel precursor.Fabrication of Homogeneous SnO2/TiO2 NFs:the procedure is similar to that used for TiO2 NFs except thata mixture of 1 g tin(IV) tert-butoxide and 1 g titanium (IV) iso-propoxide was used as the sol-gel precursor. The advantage ofthis method includes the great potential to be scaled up andeasy control over the SnO2 to TiO2 ratios. Fabrication of Heteroge-neous SnO2/TiO2nanofibers: 0.5 g pure electrospun SnO2nanofiberssynthesized using the above-mentioned procedure were groundusing a mortar and pestle for 30 minutes, and then mixed thor-oughly with 0.5 g titanium (IV) isopropoxide under sonication for20 minutes. The solution was then used for the electrospinning;the other steps are the same as those used for TiO2 NFs. Fabricationof SnO2 nanoparticles(NPs)/TiO2 NFs: 0.2 g or 0.4 g SnO2 nanoparti-cles (Sigma Aldrich, dia. <100 nm) were mixed with1 g titanium (IV)isopropoxide for electrospinning. Other steps are the same as thoseused for TiO2 NFs.
2.2. Characterization of electrospunnanofibers:
The prepared samples were characterized using a Field Emis-sion Electron Microscopy (JEOL JSM-7600F) attached with OXFORDEnergy Dispersive Spectroscopy (EDS) for elemental analysis atGeorgia Southern University. The samples were coated with a layerof thin gold film using Denton Desktop sputtering machine for SEMimaging. Micro-Raman analysis was conducted using a Thermo Sci-entific DXR SmartRaman Spectrometer. The power of the laser usedwas 1 mW of 532 nm wavelength. The total integration time was50 seconds, and the objective lens used was ×10. Structure of theNFs were characterized by X-ray diffraction (Scintag XGEN-4000)using a Cu K� radiation (�=1.542 A) from 10 to 80o with a step of0.03o/s. The acceleration voltage and current were 40 kV and 40 A,respectively.
2.3. Electrochemical Evaluation of NFs as LIB Anode Materials:
Each of the five NFs was mixed with Super P Li (Timcal) andKureha 9300 poly(vinylidene fluoride) (80/10/10 wt) in N-methyl-2-pyrrolidone (NMP) and coated onto a Cu foil using a doctorblade. The area loading is 9.4 mg/cm2. The electrodes were driedat 100 ◦C for 4 hours under vacuum before being assembled into2032 half cells with lithium foil as the counter electrode. Celgard2325 was used as the separator. The electrolyte was 1.2 M LiPF6 in
ethylene carbonate:diethyl carbonate (3/7 wt, Novolyte). The cellswere cycled with a potentiostats (VSP, Biologic) between 10 mVand 2.5 V at 25 ◦C. Cyclic voltammetry on the cells was recordedat a scan rate of 0.5 mV/s. The cells underwent rate tests first
7 imica
ft4t
3
3
dipatsaiticrmvmoTssscs2Sccaog(Asti(0woe
tsi1pfta[Now
1br
0 T. Tran et al. / Electroch
ollowed by 50 cycles at 100 mA g−1/-100 mA g−1. During rate tests,he cells were charged at 100 mA g−1 and discharged at 100 mA g−1,00 mA g−1, 800 mA g−1, 1200 mA g−1 and 1600 mA g−1, respec-ively. Five cycles were recorded for each C-rate.
. Results and discussion
.1. Fabrication and Characterization:
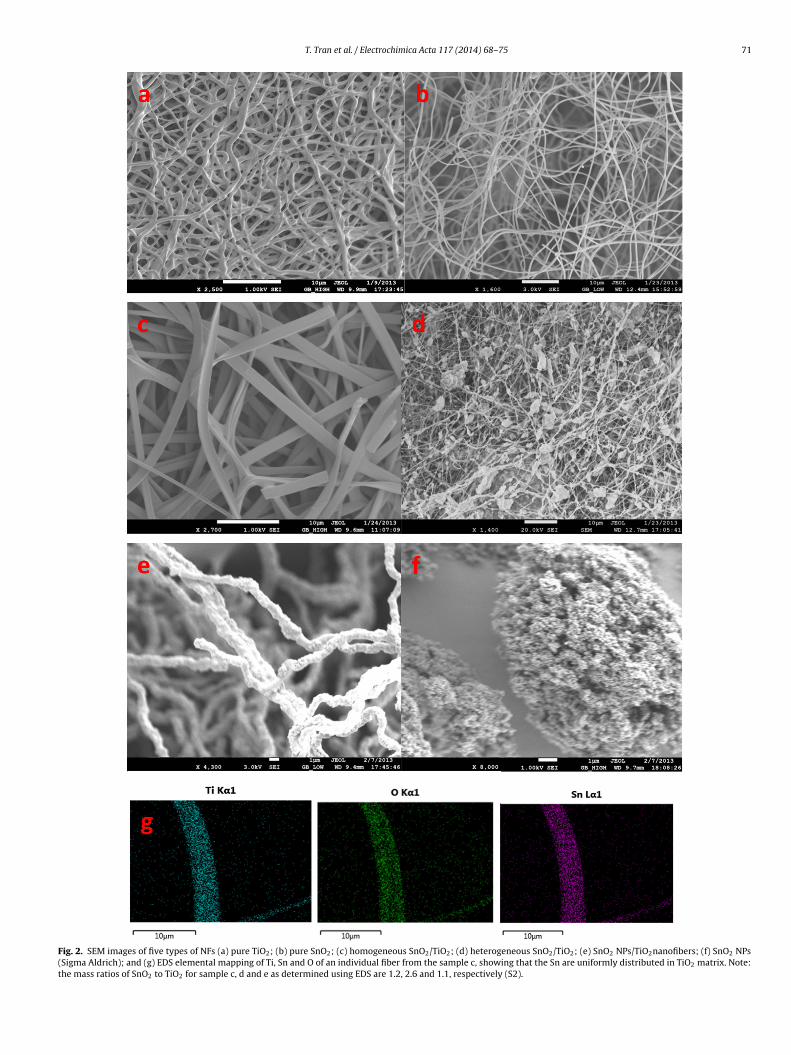
TiO2 and SnO2 NFs were fabricated for control experiments. Theiameters of TiO2 inorganic NFs range from 300 to 800 nm as shown
n Fig. 2. These nanofibers are interwoven into a network structure,ossessing a high surface to volume ratio, and thus would benefit
faster charging/discharging rate. Fig. 2b shows that the diame-ers of SnO2nanofibers are in the range of 400-800 nm, which arelightly thicker than those of TiO2 NFs. However, SnO2 fibers have
round shape, whereas those TiO2 NFs are relatively flat. SnO2 wasncorporated into structurally stable TiO2 matrix via three routeso obtain three types of SnO2/TiO2 composite NFs. The first ones called Homogeneous SnO2/TiO2 NFs (Fig. 2c). These NFs mainlyonsist of thin flat ribbons with widths from 1.5 to 2 �m. The massatio of SnO2 to TiO2 is 1.2:1 as determined from EDS measure-ents (S2). It should be pointed out that the mass ratio can be easily
aried by simply changing the mass ratio of SnO2:TiO2organo-etallic precursors. As seen from the EDS elemental mapping
f individual homogeneous SnO2/TiO2nanofiber (Fig. 2 g), Sn andi elements are uniformly distributed in the fiber matrix. Theecond type of NFs is called heterogeneous SnO2/TiO2 NFs. Pre-ynthesized pure SnO2electrospun NFs were first grounded intohort nanorods, which were then combined with TiO2 sol-gel pre-ursor for electrospinning. FESEM images show the agglomeratedhort SnO2nanorods (neurons) are connected by TiO2nanofibers of50-500 nm thick (Fig. 2d). EDS analysis indicates the mass ratio ofnO2 to TiO2 is as high as 2.6:1. Noteworthy, some SnO2nanorodsan precipitate from the solution during the electrospinning pro-ess due to agglomerations, and thereby this method is not good forn accurate composition control. To further improve the dispersionf SnO2 in TiO2 NFs matrix using this heterogeneous method, thoseround SnO2nanofibers were substituted by SnO2 nanoparticlesNPs, Sigma Aldrich) with diameters smaller than 100 nm (Fig. 2f).s shown in Fig. 2e, uniform SnO2 NPs/TiO2 NFs were obtained withlightly thicker diameters (800-1200 nm). The mass ratio of SnO2o TiO2 is 1.1:1, which is very close to Homogeneous NFs as shownn Fig. 2c. The concentration of SnO2 NPs is 0.2 g per 1 g titaniumIV) isopropoxide. When the amount of SnO2 NPs was increased to.4 g in 1 g titanium (IV) isopropoxide, the SnO2 to TiO2 mass ratioas increased to 1.5:1. This ratio is lower than the expected ratio
f 2:1, probably due to the precipitation of SnO2 NPs during thelectrospinning process.
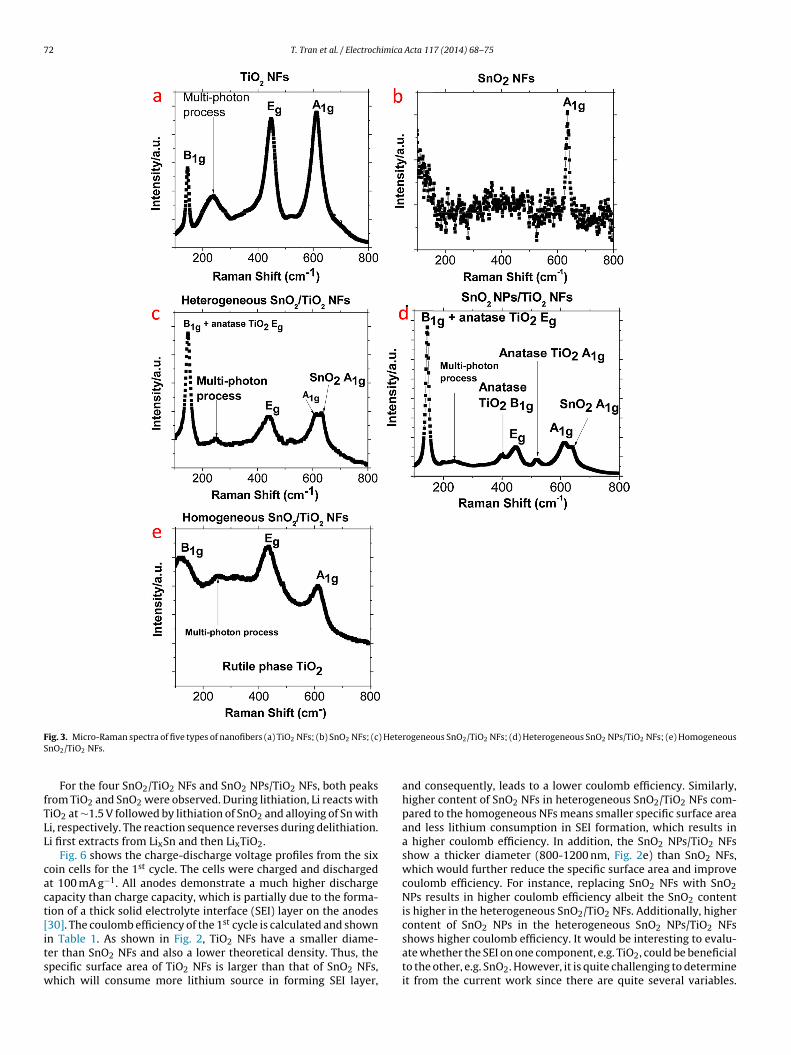
These NFs were further characterized using micro-Raman spec-roscopy to determine their phase composition (Fig. 3). The Ramanpectra of pure TiO2 NFs are characteristic of rutile phase, display-ng three distinct vibrational modes A1g, B1g and Eg at 612 cm−1,45 cm−1 and 447 cm−1, respectively (Fig. 3a) [21,22]. The broadeak ranging from 200-300 cm−1 is a combination band originatedrom multi-phonon process [23]. It can’t be exclusively concludedhat there is no trace amount of anatase phase because there is
weak peak at 520 cm−1 (A1g vibrational mode of anatase TiO2)24]. There was only A1g peak observed at 635 cm−1 in pure SnO2Fs (Fig. 3b), which is characteristic of rutile phase SnO2 [25]. Thether two vibrational modes of Eg and B2g of rutile SnO2 are tooeak to be distinguished.
For heterogeneous SnO2/TiO2 NFs (Fig. 3c), the peak at47 cm−1with a much enhanced intensity is attributed to the com-ination of A1g and Eg vibrational modes of rutile and anatase TiO2,espectively. The shoulder peak at 632 cm−1is assigned to the A1g
Acta 117 (2014) 68– 75
vibrational mode of rutile SnO2 [16,25]. Other peaks are from rutilephase TiO2. As shown in the Raman spectra of SnO2 NPs/TiO2 NFs(Fig. 3d), Eg, B1g, and A1g vibrations of anatase TiO2 are shownat 144 cm−1, 399 cm−1 and 520 cm−1, respectively [24]. Shoulderpeak located at 637 cm−1 is from A1g mode of rutile SnO2 [25].Other peaks are from rutile phase TiO2. Clearly, the incorporationof heterogeneous SnO2 is tending to form more anatase phase ascompared to pure TiO2 NFs. In contrast, the incorporation of SnO2into TiO2 matrix via a homogeneous strategy will lead to a pre-ferred formation of rutile phase TiO2 as shown in Fig. 3e. Peaks at141 cm−1, 436 cm−1, and 602 cm−1 are originated from the B1g, Eg,and A1g vibrational modes of rutile phase TiO2, respectively. Thisphenomenon is not too surprising since the addition of SnO2 hasbeen reported to facilitate the formation of rutile TiO2 and inhibitthe formation of anatase TiO2 via a sol-gel synthetic method [26]. Inaddition, the presence of SnO2 can inhibit the growth of TiO2 link-age, resulting in smaller TiO2 nanoparticles. This also explains whythe Raman peaks are shifted to lower energies and have broaderasymmetric line shapes [27].
Powder XRD was also employed to characterize the structure,phase and crystallinity of these NFs, which is complementary to theabove Raman analysis. Powder XRD patterns of TiO2 NFs (Fig. 4a)indicate that most TiO2 NFs are in rutile phase (JCPDS No.: 04-0551),while there are trace amount of anatase phase as seen from theweak (101) and (112) patterns of anatase TiO2 at 25.39◦ and 39.52◦,respectively (JCPDS No.: 21-1272).
The XRD data is consistent with the above-discussed Ramananalysis. Three strong patterns at 43.57◦, 50.65◦ and 74.44◦ areascribed to the (111), (200) and (220) (JCPDS No.: 04-0836) diffrac-tions from the copper foil that was used as current collector in theanodes. XRD patterns of SnO2 NFs as shown in Fig. 4b are character-istic of rutile SnO2 (JCPDS No.: 41-1445), which is also consistentwith the above Raman data. As aforementioned, the incorpora-tion of SnO2 into TiO2 matrix via a homogeneous strategy willlead to a preferred formation of rutile phase TiO2, which is fur-ther confirmed by XRD analysis (Fig. 4c) because no patterns fromanatase or brookite TiO2 can be found. Noteworthy, the presenceof SnO2 does inhibit the growth of TiO2 linkage, resulting in theformation of smaller TiO2 nanoparticles as confirmed by the broad-ened XRD peaks from TiO2 in the homogeneous NFs. This findingis again in agreement with the above Raman analysis. For hetero-geneous SnO2/TiO2 NFs (Fig. 4d), all patterns are from rutile phaseTiO2 and SnO2 (JCPDS No.: 04-0551 and 41-1445), and no patternsfrom anatase TiO2 can be identified. Similarly, all the patterns areascribed to rutile SnO2 and TiO2 in SnO2 NPs/TiO2 NFs (Fig. 4e-4f). Unlike results from Raman analysis, no anatase phase can beidentified through these XRD patterns, which might be due to therelatively lower XRD diffraction intensity for anatase TiO2 com-pared to the rutile one. In addition, the strongest diffraction patternfrom anatase TiO2 is located around 25◦, which is very close tothe strongest diffraction pattern from rutile TiO2 (∼27◦) and mightoverlap with each other.
3.2. Electrochemical performance of NFs as LIB anodes:
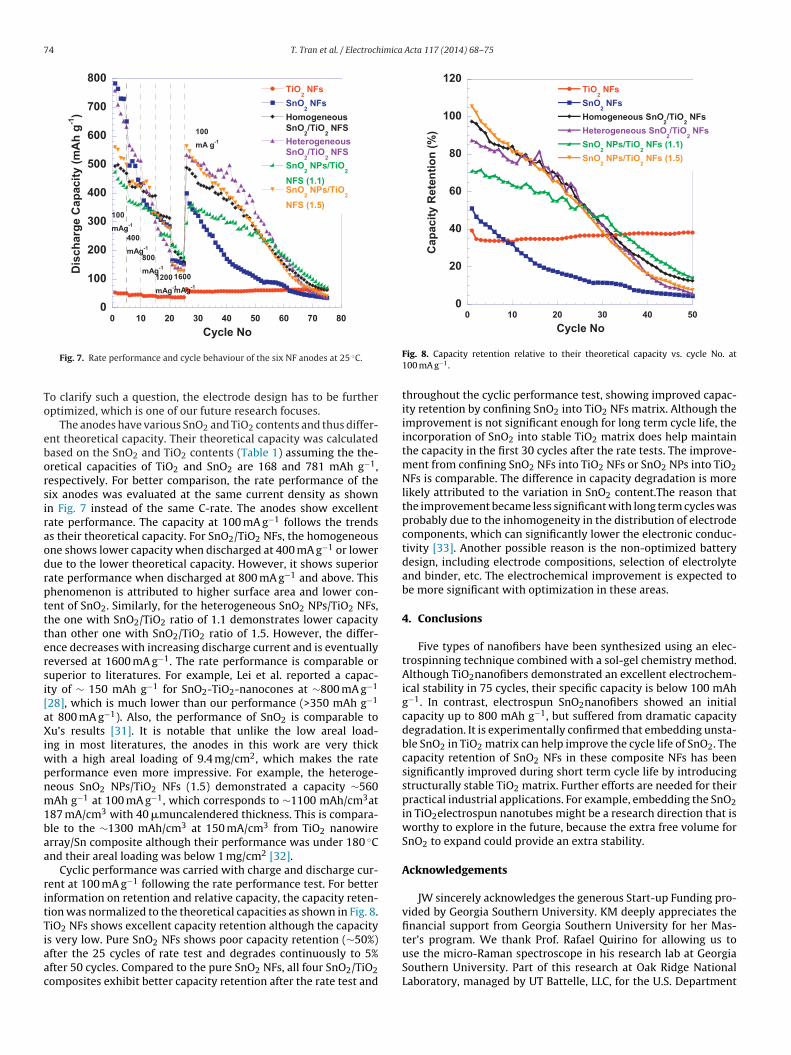
Based on cyclic voltammograms as shown in Fig. 5, there is areduction peak at ∼1.57 V for TiO2 NFs, which is a typical voltage forlithium intercalation into TiO2 to form LixTiO2. One reduction peakfor SnO2 NFs is at ∼0.58 V representing a reaction between SnO2and Li metal to form Sn and Li2O (Eq. 1) [28]. The other reductionpeak between 0.01 and 0.5 V is attributed to the alloying betweenSn and Li (Eq. 2) [29].
SnO2 + 4Li+ + 4e−↔ Sn + 2Li2O (1)
Sn + xLi+ + xe−↔ LixSn(0 ≤ x ≤ 4.4) (2)
T. Tran et al. / Electrochimica Acta 117 (2014) 68– 75 71
Fig. 2. SEM images of five types of NFs (a) pure TiO2; (b) pure SnO2; (c) homogeneous SnO2/TiO2; (d) heterogeneous SnO2/TiO2; (e) SnO2 NPs/TiO2nanofibers; (f) SnO2 NPs(Sigma Aldrich); and (g) EDS elemental mapping of Ti, Sn and O of an individual fiber from the sample c, showing that the Sn are uniformly distributed in TiO2 matrix. Note:the mass ratios of SnO2 to TiO2 for sample c, d and e as determined using EDS are 1.2, 2.6 and 1.1, respectively (S2).
72 T. Tran et al. / Electrochimica Acta 117 (2014) 68– 75
F ) HeteS
fTLL
cact[itsw
ig. 3. Micro-Raman spectra of five types of nanofibers (a) TiO2 NFs; (b) SnO2 NFs; (cnO2/TiO2 NFs.
For the four SnO2/TiO2 NFs and SnO2 NPs/TiO2 NFs, both peaksrom TiO2 and SnO2 were observed. During lithiation, Li reacts withiO2 at ∼1.5 V followed by lithiation of SnO2 and alloying of Sn withi, respectively. The reaction sequence reverses during delithiation.i first extracts from LixSn and then LixTiO2.
Fig. 6 shows the charge-discharge voltage profiles from the sixoin cells for the 1st cycle. The cells were charged and dischargedt 100 mA g−1. All anodes demonstrate a much higher dischargeapacity than charge capacity, which is partially due to the forma-ion of a thick solid electrolyte interface (SEI) layer on the anodes30]. The coulomb efficiency of the 1st cycle is calculated and shown
n Table 1. As shown in Fig. 2, TiO2 NFs have a smaller diame-er than SnO2 NFs and also a lower theoretical density. Thus, thepecific surface area of TiO2 NFs is larger than that of SnO2 NFs,hich will consume more lithium source in forming SEI layer,rogeneous SnO2/TiO2 NFs; (d) Heterogeneous SnO2 NPs/TiO2 NFs; (e) Homogeneous
and consequently, leads to a lower coulomb efficiency. Similarly,higher content of SnO2 NFs in heterogeneous SnO2/TiO2 NFs com-pared to the homogeneous NFs means smaller specific surface areaand less lithium consumption in SEI formation, which results ina higher coulomb efficiency. In addition, the SnO2 NPs/TiO2 NFsshow a thicker diameter (800-1200 nm, Fig. 2e) than SnO2 NFs,which would further reduce the specific surface area and improvecoulomb efficiency. For instance, replacing SnO2 NFs with SnO2NPs results in higher coulomb efficiency albeit the SnO2 contentis higher in the heterogeneous SnO2/TiO2 NFs. Additionally, highercontent of SnO2 NPs in the heterogeneous SnO2 NPs/TiO2 NFs
shows higher coulomb efficiency. It would be interesting to evalu-ate whether the SEI on one component, e.g. TiO2, could be beneficialto the other, e.g. SnO2. However, it is quite challenging to determineit from the current work since there are quite several variables.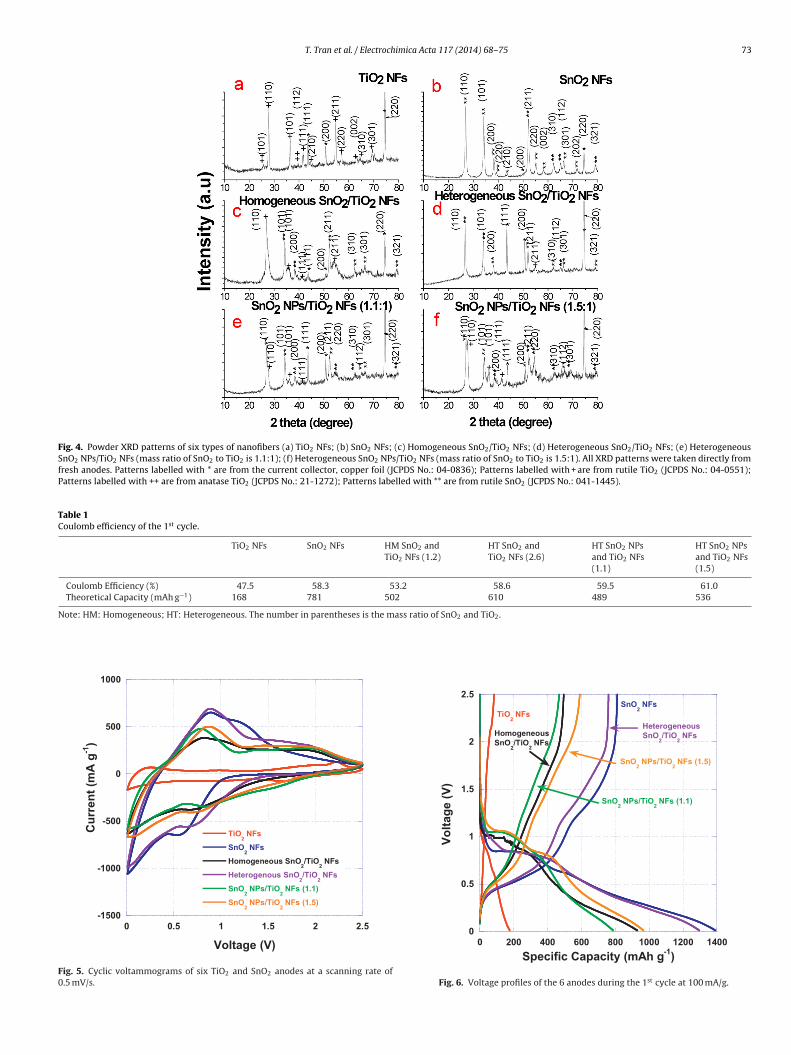
T. Tran et al. / Electrochimica Acta 117 (2014) 68– 75 73
Fig. 4. Powder XRD patterns of six types of nanofibers (a) TiO2 NFs; (b) SnO2 NFs; (c) Homogeneous SnO2/TiO2 NFs; (d) Heterogeneous SnO2/TiO2 NFs; (e) HeterogeneousSnO2 NPs/TiO2 NFs (mass ratio of SnO2 to TiO2 is 1.1:1); (f) Heterogeneous SnO2 NPs/TiO2 NFs (mass ratio of SnO2 to TiO2 is 1.5:1). All XRD patterns were taken directly fromfresh anodes. Patterns labelled with * are from the current collector, copper foil (JCPDS No.: 04-0836); Patterns labelled with + are from rutile TiO2 (JCPDS No.: 04-0551);Patterns labelled with ++ are from anatase TiO2 (JCPDS No.: 21-1272); Patterns labelled with ** are from rutile SnO2 (JCPDS No.: 041-1445).
Table 1Coulomb efficiency of the 1st cycle.
TiO2 NFs SnO2 NFs HM SnO2 andTiO2 NFs (1.2)
HT SnO2 andTiO2 NFs (2.6)
HT SnO2 NPsand TiO2 NFs(1.1)
HT SnO2 NPsand TiO2 NFs(1.5)
Coulomb Efficiency (%) 47.5 58.3 53.2 58.6 59.5 61.0Theoretical Capacity (mAh g−1) 168 781 502 610 489 536
N
F0
ote: HM: Homogeneous; HT: Heterogeneous. The number in parentheses is the mass ra
-1500
-1000
-500
0
500
1000
0 0.5 1 1.5 2 2.5
TiO2 NFs
SnO2 NFs
Homog eneous Sn O2/TiO
2 NFs
Heterogenous Sn O2/TiO
2 NFs
SnO2 NPs/TiO
2 NFs (1.1)
SnO2 NPs/TiO
2 NFs (1.5)
Cur
rent
(mA
g-1
)
Voltage (V)
ig. 5. Cyclic voltammograms of six TiO2 and SnO2 anodes at a scanning rate of.5 mV/s.
tio of SnO2 and TiO2.
0
0.5
1
1.5
2
2.5
0 200 400 600 80 0 1000 1200 1400Specific Ca pacit y (mAh g-1)
Volta
ge (V
)
TiO2 NFs
HomogeneousSnO
2/TiO
2 NFs
SnO2 NFs
Heter ogeneousSnO
2/TiO
2 NFs
SnO2 NPs/TiO
2 NFs (1.5)
SnO2 NPs/TiO
2 NFs (1.1)
Fig. 6. Voltage profiles of the 6 anodes during the 1st cycle at 100 mA/g.
74 T. Tran et al. / Electrochimica Acta 117 (2014) 68– 75
0
100
200
300
400
500
600
700
800
0 10 20 30 40 50 60 70 80
TiO2 NFs
SnO2 NFs
Homogeneou sSnO
2/TiO
2 NFS
HeterogeneousSnO
2/TiO
2 NFS
SnO2 NPs/TiO
2
NFS (1.1)SnO
2 NPs/TiO
2
NFS (1.5)
Dis
char
ge C
apac
ity (m
Ah
g-1)
Cycle No
100
mAg-1
400
mAg-1
800
mAg-1
1200
mAg-1
1600
mAg-1
100
mA g-1
To
eborsiraodrptttersi[aXiwpnm1baa
ritTiaac
0
20
40
60
80
100
120
0 10 20 30 40 50
TiO2 NFs
SnO2 NFs
Homogeneou s SnO2/TiO
2 NFs
Heterog eneous Sn O2/TiO
2 NF s
SnO2 NPs/TiO
2 NFs (1.1)
SnO2 NPs/TiO
2 NFs (1.5)
Cap
acity
Ret
entio
n (%
)
Cycle No
ter’s program. We thank Prof. Rafael Quirino for allowing us to
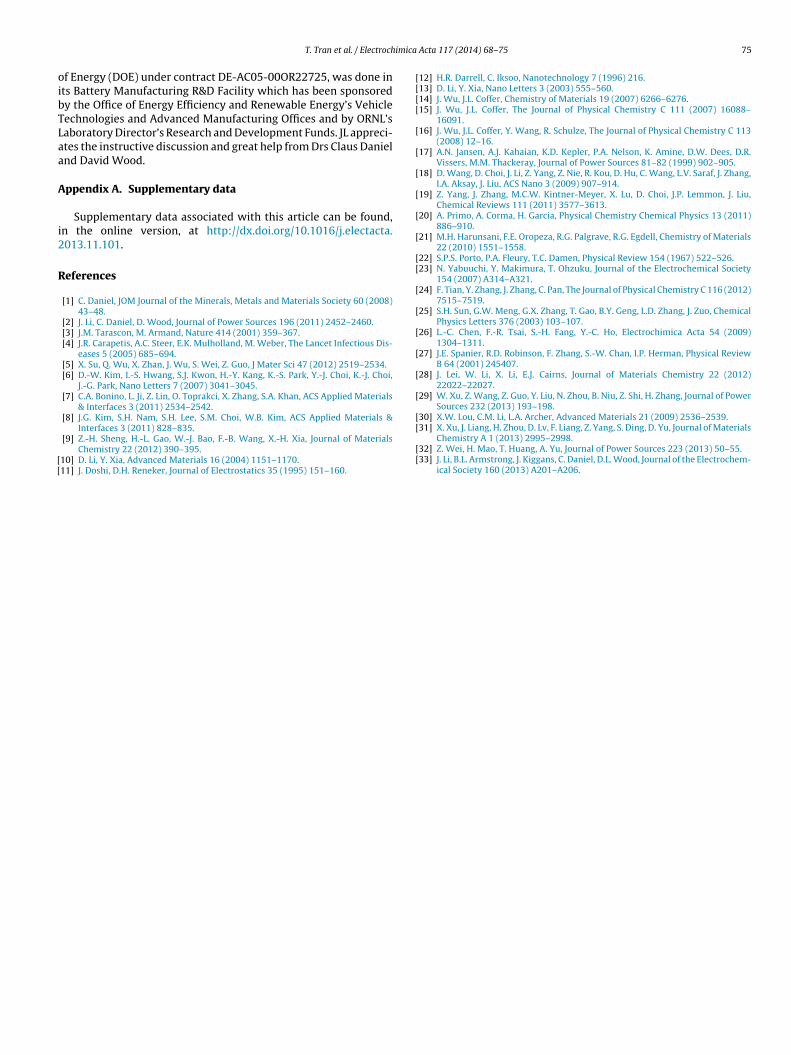
Fig. 7. Rate performance and cycle behaviour of the six NF anodes at 25 ◦C.
o clarify such a question, the electrode design has to be furtherptimized, which is one of our future research focuses.
The anodes have various SnO2 and TiO2 contents and thus differ-nt theoretical capacity. Their theoretical capacity was calculatedased on the SnO2 and TiO2 contents (Table 1) assuming the the-retical capacities of TiO2 and SnO2 are 168 and 781 mAh g−1,espectively. For better comparison, the rate performance of theix anodes was evaluated at the same current density as shownn Fig. 7 instead of the same C-rate. The anodes show excellentate performance. The capacity at 100 mA g−1 follows the trendss their theoretical capacity. For SnO2/TiO2 NFs, the homogeneousne shows lower capacity when discharged at 400 mA g−1 or lowerue to the lower theoretical capacity. However, it shows superiorate performance when discharged at 800 mA g−1 and above. Thishenomenon is attributed to higher surface area and lower con-ent of SnO2. Similarly, for the heterogeneous SnO2 NPs/TiO2 NFs,he one with SnO2/TiO2 ratio of 1.1 demonstrates lower capacityhan other one with SnO2/TiO2 ratio of 1.5. However, the differ-nce decreases with increasing discharge current and is eventuallyeversed at 1600 mA g−1. The rate performance is comparable oruperior to literatures. For example, Lei et al. reported a capac-ty of ∼ 150 mAh g−1 for SnO2-TiO2-nanocones at ∼800 mA g−1
28], which is much lower than our performance (>350 mAh g−1
t 800 mA g−1). Also, the performance of SnO2 is comparable tou’s results [31]. It is notable that unlike the low areal load-
ng in most literatures, the anodes in this work are very thickith a high areal loading of 9.4 mg/cm2, which makes the rateerformance even more impressive. For example, the heteroge-eous SnO2 NPs/TiO2 NFs (1.5) demonstrated a capacity ∼560Ah g−1 at 100 mA g−1, which corresponds to ∼1100 mAh/cm3at
87 mA/cm3 with 40 �muncalendered thickness. This is compara-le to the ∼1300 mAh/cm3 at 150 mA/cm3 from TiO2 nanowirerray/Sn composite although their performance was under 180 ◦Cnd their areal loading was below 1 mg/cm2 [32].
Cyclic performance was carried with charge and discharge cur-ent at 100 mA g−1 following the rate performance test. For betternformation on retention and relative capacity, the capacity reten-ion was normalized to the theoretical capacities as shown in Fig. 8.iO2 NFs shows excellent capacity retention although the capacitys very low. Pure SnO NFs shows poor capacity retention (∼50%)
2fter the 25 cycles of rate test and degrades continuously to 5%fter 50 cycles. Compared to the pure SnO2 NFs, all four SnO2/TiO2omposites exhibit better capacity retention after the rate test andFig. 8. Capacity retention relative to their theoretical capacity vs. cycle No. at100 mA g−1.
throughout the cyclic performance test, showing improved capac-ity retention by confining SnO2 into TiO2 NFs matrix. Although theimprovement is not significant enough for long term cycle life, theincorporation of SnO2 into stable TiO2 matrix does help maintainthe capacity in the first 30 cycles after the rate tests. The improve-ment from confining SnO2 NFs into TiO2 NFs or SnO2 NPs into TiO2NFs is comparable. The difference in capacity degradation is morelikely attributed to the variation in SnO2 content.The reason thatthe improvement became less significant with long term cycles wasprobably due to the inhomogeneity in the distribution of electrodecomponents, which can significantly lower the electronic conduc-tivity [33]. Another possible reason is the non-optimized batterydesign, including electrode compositions, selection of electrolyteand binder, etc. The electrochemical improvement is expected tobe more significant with optimization in these areas.
4. Conclusions
Five types of nanofibers have been synthesized using an elec-trospinning technique combined with a sol-gel chemistry method.Although TiO2nanofibers demonstrated an excellent electrochem-ical stability in 75 cycles, their specific capacity is below 100 mAhg−1. In contrast, electrospun SnO2nanofibers showed an initialcapacity up to 800 mAh g−1, but suffered from dramatic capacitydegradation. It is experimentally confirmed that embedding unsta-ble SnO2 in TiO2 matrix can help improve the cycle life of SnO2. Thecapacity retention of SnO2 NFs in these composite NFs has beensignificantly improved during short term cycle life by introducingstructurally stable TiO2 matrix. Further efforts are needed for theirpractical industrial applications. For example, embedding the SnO2in TiO2electrospun nanotubes might be a research direction that isworthy to explore in the future, because the extra free volume forSnO2 to expand could provide an extra stability.
Acknowledgements
JW sincerely acknowledges the generous Start-up Funding pro-vided by Georgia Southern University. KM deeply appreciates thefinancial support from Georgia Southern University for her Mas-
use the micro-Raman spectroscope in his research lab at GeorgiaSouthern University. Part of this research at Oak Ridge NationalLaboratory, managed by UT Battelle, LLC, for the U.S. Department
imica
oibTLaa
A
i2
R
[[
[[[[
[
[
[
[
[
[
[[
[
[
[
[
[
[
[
T. Tran et al. / Electroch
f Energy (DOE) under contract DE-AC05-00OR22725, was done ints Battery Manufacturing R&D Facility which has been sponsoredy the Office of Energy Efficiency and Renewable Energy’s Vehicleechnologies and Advanced Manufacturing Offices and by ORNL’saboratory Director’s Research and Development Funds. JL appreci-tes the instructive discussion and great help from Drs Claus Danielnd David Wood.
ppendix A. Supplementary data
Supplementary data associated with this article can be found,n the online version, at http://dx.doi.org/10.1016/j.electacta.013.11.101.
eferences
[1] C. Daniel, JOM Journal of the Minerals, Metals and Materials Society 60 (2008)43–48.
[2] J. Li, C. Daniel, D. Wood, Journal of Power Sources 196 (2011) 2452–2460.[3] J.M. Tarascon, M. Armand, Nature 414 (2001) 359–367.[4] J.R. Carapetis, A.C. Steer, E.K. Mulholland, M. Weber, The Lancet Infectious Dis-
eases 5 (2005) 685–694.[5] X. Su, Q. Wu, X. Zhan, J. Wu, S. Wei, Z. Guo, J Mater Sci 47 (2012) 2519–2534.[6] D.-W. Kim, I.-S. Hwang, S.J. Kwon, H.-Y. Kang, K.-S. Park, Y.-J. Choi, K.-J. Choi,
J.-G. Park, Nano Letters 7 (2007) 3041–3045.[7] C.A. Bonino, L. Ji, Z. Lin, O. Toprakci, X. Zhang, S.A. Khan, ACS Applied Materials
& Interfaces 3 (2011) 2534–2542.[8] J.G. Kim, S.H. Nam, S.H. Lee, S.M. Choi, W.B. Kim, ACS Applied Materials &
Interfaces 3 (2011) 828–835.[9] Z.-H. Sheng, H.-L. Gao, W.-J. Bao, F.-B. Wang, X.-H. Xia, Journal of Materials
Chemistry 22 (2012) 390–395.10] D. Li, Y. Xia, Advanced Materials 16 (2004) 1151–1170.11] J. Doshi, D.H. Reneker, Journal of Electrostatics 35 (1995) 151–160.
[
[[
Acta 117 (2014) 68– 75 75
12] H.R. Darrell, C. Iksoo, Nanotechnology 7 (1996) 216.13] D. Li, Y. Xia, Nano Letters 3 (2003) 555–560.14] J. Wu, J.L. Coffer, Chemistry of Materials 19 (2007) 6266–6276.15] J. Wu, J.L. Coffer, The Journal of Physical Chemistry C 111 (2007) 16088–
16091.16] J. Wu, J.L. Coffer, Y. Wang, R. Schulze, The Journal of Physical Chemistry C 113
(2008) 12–16.17] A.N. Jansen, A.J. Kahaian, K.D. Kepler, P.A. Nelson, K. Amine, D.W. Dees, D.R.
Vissers, M.M. Thackeray, Journal of Power Sources 81–82 (1999) 902–905.18] D. Wang, D. Choi, J. Li, Z. Yang, Z. Nie, R. Kou, D. Hu, C. Wang, L.V. Saraf, J. Zhang,
I.A. Aksay, J. Liu, ACS Nano 3 (2009) 907–914.19] Z. Yang, J. Zhang, M.C.W. Kintner-Meyer, X. Lu, D. Choi, J.P. Lemmon, J. Liu,
Chemical Reviews 111 (2011) 3577–3613.20] A. Primo, A. Corma, H. Garcia, Physical Chemistry Chemical Physics 13 (2011)
886–910.21] M.H. Harunsani, F.E. Oropeza, R.G. Palgrave, R.G. Egdell, Chemistry of Materials
22 (2010) 1551–1558.22] S.P.S. Porto, P.A. Fleury, T.C. Damen, Physical Review 154 (1967) 522–526.23] N. Yabuuchi, Y. Makimura, T. Ohzuku, Journal of the Electrochemical Society
154 (2007) A314–A321.24] F. Tian, Y. Zhang, J. Zhang, C. Pan, The Journal of Physical Chemistry C 116 (2012)
7515–7519.25] S.H. Sun, G.W. Meng, G.X. Zhang, T. Gao, B.Y. Geng, L.D. Zhang, J. Zuo, Chemical
Physics Letters 376 (2003) 103–107.26] L.-C. Chen, F.-R. Tsai, S.-H. Fang, Y.-C. Ho, Electrochimica Acta 54 (2009)
1304–1311.27] J.E. Spanier, R.D. Robinson, F. Zhang, S.-W. Chan, I.P. Herman, Physical Review
B 64 (2001) 245407.28] J. Lei, W. Li, X. Li, E.J. Cairns, Journal of Materials Chemistry 22 (2012)
22022–22027.29] W. Xu, Z. Wang, Z. Guo, Y. Liu, N. Zhou, B. Niu, Z. Shi, H. Zhang, Journal of Power
Sources 232 (2013) 193–198.30] X.W. Lou, C.M. Li, L.A. Archer, Advanced Materials 21 (2009) 2536–2539.
31] X. Xu, J. Liang, H. Zhou, D. Lv, F. Liang, Z. Yang, S. Ding, D. Yu, Journal of MaterialsChemistry A 1 (2013) 2995–2998.32] Z. Wei, H. Mao, T. Huang, A. Yu, Journal of Power Sources 223 (2013) 50–55.33] J. Li, B.L. Armstrong, J. Kiggans, C. Daniel, D.L. Wood, Journal of the Electrochem-
ical Society 160 (2013) A201–A206.
Copyright © 2022 FDOKUMEN