Structural characterization of a mechanically milled carbon nanotube/aluminum mixture

ORIGINAL PAPER
Electrochemical performance of mechanically treated SnO2
powders for OER in acid solution
S. Palmas Æ A. M. Polcaro Æ F. Ferrara Æ
J. Rodriguez Ruiz Æ F. Delogu Æ
C. Bonatto-Minella Æ G. Mulas
Received: 14 September 2007 / Revised: 17 January 2008 / Accepted: 21 January 2008 / Published online: 5 February 2008
� Springer Science+Business Media B.V. 2008
Abstract Commercial tin dioxide powders have been
subjected to mechanical treatment in order to modify their
microstructure. Processed powders were then used to
assembly thin film electrodes which worked as anodes in a
three electrode cell to drive the oxygen evolution reaction
from acid solution. Cyclic voltammetry and polarization
experiments were carried out together with electrochemical
impedance spectroscopy to highlight the effects of milling
on the catalytic performance. The findings suggest that the
mechanical processing is capable of generating a consid-
erable amount of lattice defects. The grain boundary
extension as well as the content of structural disorder
increase with the processing time. The increase in both the
reactive site density and extent of structural disorder
results in an enhanced chemical reactivity of the assembled
electrodes.
Keywords Ball milling � BDD/SnO2 electrodes �
Electrochemical impedance spectroscopy � Nanoparticles �Oxygen evolution reaction
1 Introduction
The mechanical processing of powders in ball mills is a
simple technique to carry out thermodynamically
unfavoured reactions and destabilize equilibrium com-
pounds [1, 2]. Metastable phases such as amorphous alloys
and nanostructured systems can be easily produced as a
consequence of the far-from-equilibrium processing con-
ditions [2]. These determine the excitation of unusual states
of reactivity via the application of mechanical forces and
the consequent transfer of mechanical energy [2–5].
The transfer of energy to powders takes place at impact
events in which a relatively small fraction of the total
powder charge is trapped between colliding surfaces [6].
Repeatedly involved in collisions, powder particles
undergo cold-welding, fracturing and plastic deformation
processes [6, 7]. Whereas the former induce a variation of
number and morphology of powder particles [7], local
deformation processes result in a decrease in the average
crystallite size and accumulation of lattice disorder [6]. The
gradual modification of microstructure, with formation of
grain boundaries and successive refinement of coherent
crystalline domains down to the nanometer range can, in
turn, promote phase transitions and chemical transforma-
tions as well as significant changes of physical properties
[2–7].
At microscopic level, the apparent simplicity of
mechanical treatment is replaced by a remarkable com-
plexity originating from intertwined atomistic processes
still awaiting a satisfactory description and rationalization
[8–15]. For example, the intimate nature of the local
excited states appearing in solid phases as a result of
applied mechanical forces is still debated [8–15]. A com-
prehensive conceptual approach to transformation kinetics
is still lacking even though any progress in such a direction
could open the door, not only to a deeper understanding of
atomistic processes but also to practical applications [2–7].
The present work focuses on the electrochemical
performance of electrodes obtained by assembling SnO2
S. Palmas (&) � A. M. Polcaro � F. Ferrara � J. Rodriguez Ruiz� F. DeloguDipartimento di Ingegneria Chimica e Materiali, Universita degli
Studi di Cagliari, Piazza d’Armi, 09123 Cagliari, Italy
e-mail: [email protected]
C. Bonatto-Minella � G. Mulas
Dipartimento di Chimica, Universita degli Studi di Sassari,
Via Vienna 2, 07100 Sassari, Italy
123
J Appl Electrochem (2008) 38:907–913
DOI 10.1007/s10800-008-9494-6
powders, mechanically processed for different times, on
boron doped diamond (BDD) supports. BDD has been
chosen in the light of its chemical inertness, very low
background current and large potential difference between
hydrogen and oxygen evolution and an extreme resistance
to chemical and electrochemical attack [16]. Its outstand-
ing properties also make it an attractive substrate for
electrochemical characterisation of supported electrocata-
lytic particles, avoiding the problems encountered with
other common substrates. The choice of SnO2 is motivated
by its wide use in both fundamental and applicative studies
[17]. For example, RuO2–SnO2, IrO2–SnO2, RuO2–TiO2–
SnO2, IrO2–TiO2–SnO2 and RuO2–Sb2O5–SnO2 systems
are often adopted to improve the electrode performance for
O2 evolution in acid media. In these cases the use of SnO2
represents the search for a compromise between electro-
catalytic activity, long-term electrode stability and cost. It
is a relatively cheap oxide capable of stabilizing the elec-
trode and partly producing catalytic effects.
The SnO2-based electrodes prepared in the present work
have been used to obtain information on the electrochem-
ical properties of mechanically-processed powders and, in
turn, on the modification of their chemical reactivity as a
consequence of the accumulation of lattice defects.
2 Experimental section
2.1 Preparation of powders
High purity SnO2 commercial powders (Aldrich, 99.99%,
325 mesh) were used. The mechanical treatment was car-
ried out with a commercial Spex/Mixer Mill mod. 8000.
Powder amounts of 8 g were introduced into a stainless
steel vial with two stainless steel balls. The vial was then
fixed on the mechanical arm and the mill operated at about
14.6 Hz. The treatment was interrupted after selected time
intervals to empty the vial and refill it with a further 8 g of
untreated powder. The powders extracted from the vials
were then compacted to prepare disk-shaped samples for
X-ray diffraction (XRD).
2.2 Powder characterization
XRD analyses were performed on a Rigaku D/Max dif-
fractometer equipped with a Cu radiation tube and a
graphite monochromator in the diffracted beam. The XRD
patterns of the SnO2 powders were accurately analyzed
by applying the well known Rietveld method [18]. This
allowed a numerical reconstruction of the observed
experimental XRD patterns via a best-fitting procedure
involving the parameters characteristic of the set of
mathematical functions employed to reproduce the peak
profiles [18]. It was thus possible to estimate the average
size L of coherent diffraction domains and the concentra-
tion of structural defects, quantified by the so-called
microstrain content e [18, 19].
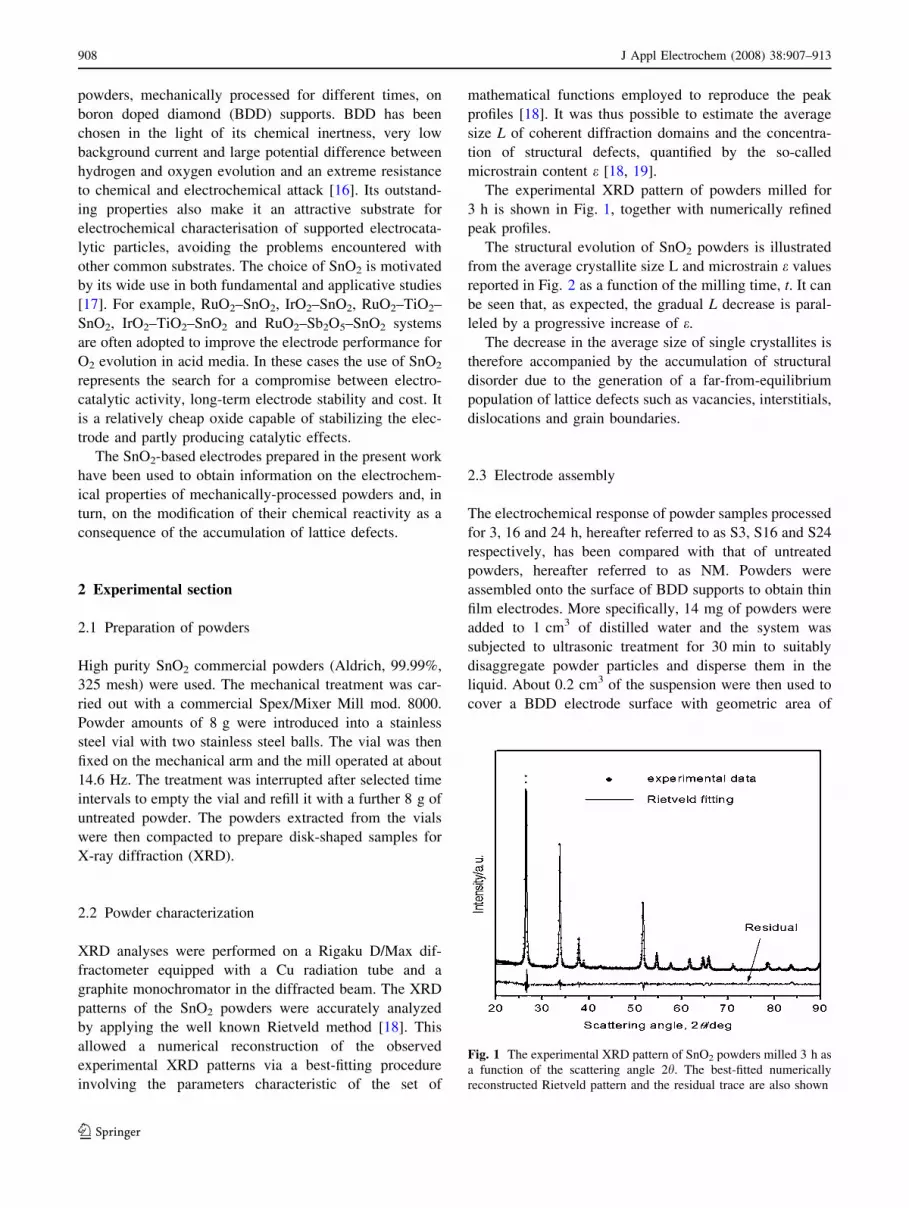
The experimental XRD pattern of powders milled for
3 h is shown in Fig. 1, together with numerically refined
peak profiles.
The structural evolution of SnO2 powders is illustrated
from the average crystallite size L and microstrain e values
reported in Fig. 2 as a function of the milling time, t. It can
be seen that, as expected, the gradual L decrease is paral-
leled by a progressive increase of e.
The decrease in the average size of single crystallites is
therefore accompanied by the accumulation of structural
disorder due to the generation of a far-from-equilibrium
population of lattice defects such as vacancies, interstitials,
dislocations and grain boundaries.
2.3 Electrode assembly
The electrochemical response of powder samples processed
for 3, 16 and 24 h, hereafter referred to as S3, S16 and S24
respectively, has been compared with that of untreated
powders, hereafter referred to as NM. Powders were
assembled onto the surface of BDD supports to obtain thin
film electrodes. More specifically, 14 mg of powders were
added to 1 cm3 of distilled water and the system was
subjected to ultrasonic treatment for 30 min to suitably
disaggregate powder particles and disperse them in the
liquid. About 0.2 cm3 of the suspension were then used to
cover a BDD electrode surface with geometric area of
Fig. 1 The experimental XRD pattern of SnO2 powders milled 3 h as
a function of the scattering angle 2h. The best-fitted numerically
reconstructed Rietveld pattern and the residual trace are also shown
908 J Appl Electrochem (2008) 38:907–913
123

1 cm2. Finally, the suspension was dried for 30 min at
80 �C in an oven. Approximately 2 mg of SnO2 were thus
deposited per square centimetre. The obtained oxide films
were stable up to potentials of the order of 2.3–2.5 V,
above which O2 bubbling resulted in film rupture and
detachment.
2.4 Electrochemical cell
Experimental runs were performed in a conventional three-
electrode cell in which the BDD/SnO2 electrode worked as
anode and a large platinum sheet as counter electrode. The
reference was a saturated calomel electrode (SCE) con-
nected to the cell by a Luggin capillary to minimize
uncompensated ohmic drops. All the potential values
hereafter quoted are referred to SCE.
2.5 Electrochemical measurements
A potentiostat (Model 7050 AMEL) and a frequency
response analyser (FRA, Model 7200 AMEL) were used to
perform voltammetric, polarization and spectroscopic
analyses. Runs were carried out in aqueous solutions of
H2SO4 at a concentration of 0.5 M. The potential interval
explored during the course of voltammetric measurements
ranged between the open circuit voltage (OCV), typically
between 0.1 and 0.2 V, and 2.5 V. Negative potential
values have been also occasionally imposed to investigate
the possible occurrence of SnO2 phase transformations.
Quasi steady-state polarisation runs were also carried
out in the same potential range, the potential scan rate
being 1 mV s-1.
Electrochemical impedance spectroscopy measurements
were performed by superimposing a sinusoidal signal with
excitation amplitude of 10 mV at different bias potentials
in the range from 0 to 2 V. Impedance spectra were
recorded in the frequency range 0.1 to 1 9 105 Hz by
collecting 16 points per decade. Zassist and ZsimpWin
softwares were used, respectively, to drive the experiments
and fit the resulting curves to suitable equivalent circuits.
3 Results and discussion
3.1 Electrochemical characterization of the samples
A typical example of the curves obtained from cyclic
voltammetry on NM powders in aqueous solution 0.5 M
H2SO4 is reported in Fig. 3. Aimed at pointing out the
phase transitions possibly undergone by SnO2 powders, a
voltammetric cycle was performed with E0 = OCV,
E1 = -1 V and E2 = 2.5 V.
In accordance with literature [20], at a potential value of
about -0.6 V the reduction of Sn (IV) to Sn (0) is
observed. Oxidation to Sn (II) and Sn (IV) is then observed
at about -0.4 V and 1.1 V, respectively. The O2 evolution
process is finally detected at higher anodic potentials.
As often pointed out [21–23], the mechanism of O2
evolution at oxide electrodes is complicated and its full
characterization and rationalization still challenge electro-
chemists. The reaction is typically a multi-stage one, the
rate determining step depending on the strength of the
intermediate product adsorption. In turn, this is governed
Fig. 2 The average crystallite size L and microstrain e as a function
of the milling time t
-5
-3
-1
1
3
5
7
-1 0 1 2 3
E / V vs SCE
mc
Am / j
2-
OCV
Fig. 3 Typical curves for cyclic voltammetry at NM powder
electrodes performed with E0 = OCV, E1 = -1 V and E2 = 2.5 V.
Scan rate 100 mV s-1
J Appl Electrochem (2008) 38:907–913 909
123

by the oxide layer composition [21]. A detailed study has
been carried out on PbO2 [22] which is referred as an ‘‘non-
active’’ oxide, as is the case of SnO2. The reactivity of
these species is mainly ascribed to the formation of a
hydrated oxide layer containing sites able to bind hydrox-
ide radicals HO� during the course of O2 evolution. Despite
the process being a remarkably complex one, the following
simplified mechanism has been proposed for the reaction
taking place in acid medium [22, 23]:
SnO2 þ H2O ! SnO2ðHO�Þ þ Hþ þ e� ð1Þ
SnO2ðHO�Þ ! SnO2 þ Hþ þ Oþ e� ð2Þ
2O ! O2 ð3Þ
SnO2(HO�) stands for the active site binding the HO�
species. According to such a mechanism, the peak detected
in the voltammetric curve (Fig. 3) before the current rise
related to O2 evolution can be ascribed to the intermediate
stages of this latter process. The current density j measured
at the potential E of 2 V for the different powder samples
as a function of the milling time t is given in Fig. 4. The
average specific surface area of crystallites Sp has also been
reported for sake of comparison. Sp was evaluated
according to the general expression:
Sp ¼f
qLð4Þ
where q is the SnO2 density and f a shape factor. Under the
simplifying assumption that powder particles have spheri-
cal shape, f was set equal to 6.
It can be seen that both quantities change linearly with t,
thus suggesting a possible direct correlation. Although the
direct correlation between the total surface area of crys-
tallites Sp and the current density j only suggests an
increase in the total number of active surface sites, with no
evidence of significantly different reactivity, this latter
possibility cannot be excluded a priori. Actually, it is
expected that the chemical reactivity of surface sites per-
taining to powders subjected to mechanical treatment is
higher than that of surface sites in untreated powders.
Further investigations were then carried out to specifically
address this point.
Polarization experiments were performed in the potential
range between 1.5 and 2.5 V, the quasi steady-state current-
potential data being recorded at a rate of 1 mV s-1. As
widely discussed [24], the Tafel plot provides only limited
information on the reaction mechanism when electrode
reactions take place at very high potential as in the case of
O2 and O3 evolution, so that b values very different from
the theoretical ones have often been obtained [25]. Never-
theless, in the present case a comparison between the
behaviour of the different powder samples can still give
useful information on their electrochemical catalytic
activity. The Tafel parameters, a and b, together with the
exchange current density j0 are quoted in Table 1.
The j0 value increases with milling time t, thus indicating
a larger electrochemical catalytic activity for powders
treated for longer times. It is, however, worth noting that j0is measured relative to the electrode geometrical surface
area, which is only an apparent surface area. The differ-
ences in a values for powder samples processed for different
milling times could be then due to the comminution process
accompanying the mechanical treatment. In order to obtain
a more representative quantity, data have been therefore
normalised to the specific surface area of crystallites Spobtained from XRD measurements. The resulting a* and j�0values for the different samples, also reported in Table 1,
are still characterized by significant differences, particularly
between the S24 sample and the remaining ones. This
suggests that the mechanical processing not only deter-
mines an increase in the total surface area, and then of the
number of active sites, but also modifies their nature.
3.2 Electrochemical impedance spectroscopy
The results obtained from electrochemical impedance
spectroscopy on the NM samples at different potentials are
shown in Fig. 5 as a Nyquist plot.
0
10
20
30
40
50
60
70
0 10 20 30
milling time / h
Sp
m / 2
g 1-
0
1
2
3
4
5
jm
cA
m /
2-
Fig. 4 Specific surface area of crystallites Sp (d) and electric current
density j (�) measured at E = 2 V as a function of the milling time t
Table 1 Values of Tafel parameters obtained at different samples
b (mV dec-1) a (V) a* (V) jo (mA cm-2) j�0 (mA cm-2)
NM 196 1.423 1.089 5.61 9 10-8 2.80 9 10-10
S3 212 1.35 1.070 4.29 9 10-7 8.97 9 10-10
S16 228 1.314 1.064 1.76 9 10-6 2.20 9 10-9
S24 251 0.831 0.602 4.83 9 10-4 3.97 9 10-7
The asterisked values are derived from current density values nor-
malised with respect to Sp
910 J Appl Electrochem (2008) 38:907–913
123

As shown in the inset, a capacitive loop independent of
potential is always observed in the high frequency region.
Two other loops are detected in the lower frequency region,
the resolution of which depends on the potential applied.
Highest impedance values are observed at less positive
potential and their values decrease progressively as the
potential increases. Correspondingly, the capacitive loops
become better defined and the polarization resistances Rp
for the OER, calculated by the low-frequency cut off of the
curves on the real axis, decrease exponentially with applied
potential according to a Buttler Volmer trend [26].
The polarization resistance Rp values can be adopted to
support the experimental findings relative to the polariza-
tion curves. The polarization resistance can be expressed as:
Rp ¼og
oj¼
b
j0exp
�2:3
bg
� �
ð5Þ
It follows that:
g ¼ b log1
Rp
� �
� b logj0
b
� �
ð6Þ
Accordingly, a plot of g vs. log R�1p
� �
gives the Tafel
slope. The trend of g vs. log R�1p
� �
(curve a) obtained for NM
sample is given inFig. 6 togetherwith theTafel plot (curve b).
A b value of 195 mV dec-1 was calculated by fitting
experimental data from impedance spectroscopy with Eq.
6, which well agrees with the corresponding value obtained
from the polarization curve (Table 1).
An example of the Nyquist diagrams obtained for the
different electrodes at a potential of 2 V is shown in Fig. 7.
With the aim of carrying out a quantitative analysis of
the experimental results obtained, the electrochemical
response of the electrodes has been modelled according to
the equivalent electrical circuit approach. To this end, in
accordance with the aforementioned mechanism for O2
evolution illustrated by Eqs. 1–3, the faradaic current iF has
been considered dependent on both the applied potential
and an additional variable, h, representing a measure of the
reaction intermediate SnO2(HO�) surface coverage. Fol-
lowing previous work [27], the faradaic admittance, YF, of
an electrode reaction with one state variable besides elec-
trode potential can be written as:
YF ¼1
Rct
þB
Aþ j-ð7Þ
where
1
Rct
¼oiF
oE
� �
ss
ð8Þ
B ¼oiF
oh
� �
ss
o _h
oE
!
ss
ð9Þ
A ¼ �o _h
oh
!
ss
ð10Þ
-3200
-2200
-1200
-200
0 2000 4000 6000 8000 10000
Z' / ohm
mh
o / ''Z
1.7 V
1.8 V
1.9 V
2 V
2.1 V
2.2 V
-8
-5
-2
2 4 6 8Z' / ohm
mh
o / ''Z
1.7 V
2.5 V
Fig. 5 Electrochemical impedance spectroscopy curves obtained at
NM samples at the different potential values. The inset reports a
close-up view of the high frequency region
1
1.2
1.4
1.6
1.8
-2.5 -2 -1.5 -1 -0.5 0 0.5 1
(a) log Rp-1
/ ohm−1cm-2
(b) log j / mA cm-2
ηE
CS
sv
V /
(a)
(b)
Fig. 6 Tafel plots for NM sample: (a) g vs. log R�1p
� �
from
impedance data, (b) g vs. log j from quasi steady-state data
-800
-600
-400
-200
00
Z' / ohm
mh
o / ''Z
NMS3S16S24
-60
-40
-20
00 100 200 300
Z' / ohm
mh
o / ''Z S16
S24
1000 2000 3000
Fig. 7 Nyquist plots obtained at a potential of 2 V for the different
samples. The inset shows a close-up view of the low impedance
region
J Appl Electrochem (2008) 38:907–913 911
123

Here Rct is the transfer resistance of the electrode reaction
and the subscript ss stands for steady state. As mentioned
above, h is the reaction intermediate SnO2(HO�) surface
coverage, whereas _h is its change rate dh=dt.
On the other hand, it is well established that a general
equivalent circuit for the faradaic electrode process
involving one state variable can be represented by the
schematic quoted in Fig. 8.
The total impedance Z of the electrode process can be
expressed by
Z ¼ Rs þ1
YF þ j-Cdl
ð11Þ
where Cdl is the double-layer capacitance, Rs the
uncompensated solution resistance and YF the faradaic
admittance. The faradaic impedance ZF can be written as:
ZF ¼1
YF¼ Rct þ
Ra
1þ j-RaCa
ð12Þ
Ra and Ca represent, respectively, the equivalent
resistance and capacitance associated with the
intermediate adsorption.
The relationship between the electrical elements in the
equivalent circuit and the electrochemical parameters in
the faradaic admittance can be pointed out by comparing
Eqs. 7 and 12. Accordingly:
B ¼�1
R2ctCa
ð13Þ
A ¼1
Ca
1
Ra
þ1
Rct
� �
ð14Þ
It follows that two capacitive loops must be expected in
impedance diagrams connected with the faradaic process.
An additional element was added to the equivalent
electrical circuit to take into account the capacitive
response of the oxide film. This modifies the equivalent
circuit shown in Fig. 8 into that schematically depicted in
Fig. 9.
Constant phase elements (CPEs) were used instead of
capacitors (C) to fit experimental data. According to liter-
ature [28–30], using CPEs is a good approach for studying
solid electrodes with different degrees of surface roughness
and non-uniform structure or distribution of reactive sur-
face sites. The CPE impedance can be expressed as
ZCPE ¼1
Q j-ð Þnð15Þ
Q representing the capacity parameter expressed in S cm-
2 sn and n accounting for the deviation from the ideal
behaviour, n being 1 for a perfect capacitor.
Figure 10 depicts an example of the fit between exper-
imental data and fitting curves based on the complex non-
linear least squares (CNLS) method for the sample NM.
The equivalent circuit parameter values obtained for the
different samples at a potential E value of 2 V are quoted
in Table 2.
It can be seen that the film resistance increases with the
milling time t: the mechanical treatment leads to a com-
minution of powder particles, with a corresponding
increase of the specific free surface, and an increase in their
lattice defect content. The decrease in average crystallite
size corresponds to an increase in grain boundary extension
area. As a consequence, the intensity of scattering events
involving charge carriers at grain boundaries also increa-
ses. A decrease of the overall charge carrier mobility is
therefore observed and, in turn, an electrical resistivity
increase [31]. The formation of highly defective grain
boundaries is further highlighted [28–30] by the decreasing
CPE exponent of the electrical element connected with the
reaction intermediate SnO2(HO�) absorption: high values
of n are measured for samples milled up to 3 h which
becomes 0.46 for sample S24.
Additional evidence of the capability of mechanical
processing of enhancing the chemical reactivity of powders
Fig. 8 Equivalent electric circuit for oxide electrodes during O2
evolution reaction
Fig. 9 Modified equivalent electric circuit for oxide electrodes
during O2 evolution reaction
912 J Appl Electrochem (2008) 38:907–913
123

via the disordering of crystalline lattice is provided by the
progressively decreasing Rct and Ra values.
4 Conclusions
The present work represents a preliminary investigation of
the electrochemical properties of tin dioxide powders
subjected to mechanical processing, used as electrodes for
oxygen evolution reaction in acid medium. Cyclic vol-
tammetry, electrical polarization and electrochemical
impedance spectroscopy experiments have been carried out
to gain information on the mechanistic scenario underlying
the chemical reaction and, indirectly, on the modifications
connected with powder particle deformation. This latter
determined a significant decrease in the average crystallite
size and the accumulation of structural disorder. According
to the equivalent circuit approach, such processes result in
an increase in the thin film resistance. The larger grain
boundary extension related to the crystallite size decrease
determined a corresponding decrease in the charge carrier
mobility. At the same time, evidence has been collected
suggesting that the enhanced catalytic activity of processed
powders can be related, not only to the grain boundary
extension increase, but also to the generation of surface
active sites with different reactivity. Further work is needed
to support the aforementioned preliminary conclusions.
Acknowledgements Prof. G. Cocco, Department of Chemistry,
University of Sassari, Italy, is gratefully acknowledged for useful
suggestions. Financial support was given by the Universities of
Cagliari and Sassari.
References
1. Siegel RW, Hu E, Roco MC (eds) (1999) Nanostructure science
and technology. WTEC, Loyola College, Maryland
2. Suryanarayana C (2001) Prog Mater Sci 46:1
3. Butyagin PYu (1989) Sov Sci Rev B Chem 14:1
4. Gutman EM (1998) Mechanochemistry of materials. Cambridge
International Science Publishing, Cambridge
5. Urakaev FKh, Boldyrev VV (2000) Powder Technol 107:93
6. Delogu F, Deidda C, Mulas G, Schiffini L, Cocco G (2004) J
Mater Sci 39:1
7. Courtney TH (1995) Mater Trans JIM 36:110
8. Bellon P, Averback RS (1995) Phys Rev Lett 74:1819
9. Hoagland RG, Baskes MI (1998) Scr Mater 39:417
10. Fu XY, Falk ML, Rigney DA (2001) Wear 250:420
11. Lund AC, Schuh CA (2003) Appl Phys Lett 82:2017
12. Butyagin PYu, Streletskii AN (2005) Phys Solid State 47:856
13. Levitas VI (2004) Phys Rev B 70:184118
14. Odunuga S, Li Y, Krasnochtchekov P, Bellon P, Averback RS
(2005) Phys Rev Lett 95:045901
15. Delogu F, Mulas G, Enzo S, Schiffini L, Cocco G (2007) Chem
Sust Develop 15:157
16. Pleskov YV (1999) Russ Chem Rev 68:381
17. Batzill M, Diebold U (2005) Prog Surf Sci 79:47
18. Lutterotti L, Ceccato R, Dal Maschio R, Pagani E (1998) Mater
Sci Forum 278:87
19. Klug HP, Alexander LE (1974) X-Ray diffraction procedures.
Wiley-Interscience, New York
20. Patil PS, Chigare PS, Sadale SB, Mujawar SH, Shinde PS (2007)
Sol Energy Mater Sol Cells 91:859
21. Martelli GN, Ornelas R, Faita G (1994) Electrochim Acta 39:1551
22. Amadelli R, Maldotti A, Molinari A, Danilov FI, Velichenko AB
(2002) J Electroanal Chem 534:1
23. Al faro MAQ, Ferro S, Martinez-Huitle CA, Vong YM (2006) J
Braz Chem Soc 17:227
24. Li FB, Hillman R, Lubetkin SD (1992) Electrochim Acta 37:2723
25. Fernandes KC, Da Silva LM, Boodts JFC, De Faria LA (2006)
Electrochim Acta 51:2809
26. Meilin L, Zhonglin W (1998) Solid State Ionics 107:105
27. Cao CN (1990) Electrochim Acta 35:831
28. Rammelt U, Reinhard G (1990) Electrochim Acta 35:1045
29. Gudic S, Radosevic J, Kliskic M (1996) J Appl Electrochem
26:1027
30. Spataru N, Lehelloco JG, Durand R (1996) J Appl Electrochem
26:397
31. Bilgin V, Kose S, Atay F, Akyuz I (2004) Mater Lett 58:3686
0
200
400
600
800
1000
0 500 1000 1500
Z' / ohm
mh
o / ''Z -
(a)
1
10
100
1000
10000
0.1 1 10 100 1000 10000
Frequency / Hz
mh
o / |Z|
0
20
40
60
80
100
ge
d /
elg
nA
|Z|
Angle(b)
Fig. 10 Example of the fit
between calculated and
experimental Nyquist (a) and
Bode (b) modulus and phase
angle plots at E = 2 V
Table 2 Values of the parameters of the equivalent electrical circuit
reported in Fig. 9, derived for the different samples from runs per-
formed at E = 2 V vs. SCE
NM S3 S16 S24
Rs (ohm) 0.2 0.03 0.01 0.01
Cf (lF) 0.4 0.7 0.2 0.1
Rf (ohm) 4.0 4.4 8.3 9.7
Qdl (lS sn) 60 54 27 34
n 0.96 0.94 0.97 1
Rct (ohm) 800.5 782.2 45.7 26.3
Qa (mS sn) 0.3 0.5 0.4 2.1
n 0.90 0.96 0.64 0.46
Ra (ohm) 1002.1 725.4 164.1 50.9
J Appl Electrochem (2008) 38:907–913 913
123
Copyright © 2022 FDOKUMEN