
Lattice Strain Mapping of Platinum Nanoparticles on Carbon and SnO2 Supports
Upload
independentCategory
view
0download
0
This article appeared in a journal published by Elsevier. The attachedcopy is furnished to the author for internal non-commercial researchand education use, including for instruction at the authors institution
and sharing with colleagues.
Other uses, including reproduction and distribution, or selling orlicensing copies, or posting to personal, institutional or third party
websites are prohibited.
In most cases authors are permitted to post their version of thearticle (e.g. in Word or Tex form) to their personal website orinstitutional repository. Authors requiring further information
regarding Elsevier’s archiving and manuscript policies areencouraged to visit:
http://www.elsevier.com/authorsrights
Author's personal copy
Nanocrystalline SnO2 thin films: Structural, morphological, electrical transportand optical studies
R.D. Sakhare a, G.D. Khuspe a, S.T. Navale a, R.N. Mulik a, M.A. Chougule a, R.C. Pawar b, C.S. Lee b,Shashwati Sen c, V.B. Patil a,⇑a Functional Materials Research Laboratory, School of Physical Sciences, Solapur University, Solapur 413255, MS, Indiab Department of Materials Engineering, Hanyang University, Ansan 426-791, South Koreac Crystal Technology Section, Technical Physics Division, BARC, Mumbai, India
a r t i c l e i n f o
Article history:Received 18 September 2012Received in revised form 9 February 2013Accepted 11 February 2013Available online 26 February 2013
Keywords:Sol–gelCrystal structureMicrostructureOptical propertiesElectrical properties
a b s t r a c t
Sol–gel spin coating method has been successfully employed for preparation of nanocrystalline tin oxide(SnO2) thin films. The effect of processing temperature on the structure, morphology, electrical conduc-tivity, thermoelectric power and band gap was studied using X-ray diffraction, field emission scanningelectron microscopy, transmission electron microscopy, selected area electron diffraction pattern, atomicforce microscopy, two probe technique and UV–visible spectroscopy. X-ray diffraction (XRD) analysisshowed that SnO2 films are crystallized in the tetragonal phase and present a random orientation. Fieldemission scanning electron microscopy (FESEM) analysis revealed that surface morphology of the tinoxide film consists nanocrystalline grains with uniform coverage of the substrate surface. Transmissionelectron microscopy (TEM) of SnO2 film showed nanocrystals having diameter ranging from 5 to10 nm. Selected area electron diffraction (SAED) pattern confirms tetragonal phase evolution of SnO2.Atomic force microscopy (AFM) analysis showed surface morphology of SnO2 film is smooth. The dc elec-trical conductivity showed the semiconducting nature with room temperature electrical conductivityincreased from 10�7 to 10�5 (X cm)�1 as processing temperature increased from 400 to 700 �C. Thermopower measurement confirms n-type conduction. The band gap energy of SnO2 film decreased from 3.88to 3.60 eV as processing temperature increased from 400 to 700 �C.
� 2013 Elsevier B.V. All rights reserved.
1. Introduction
Metal oxides can adopt a large variety of structural geometrieswith an electronic structure that may exhibit metallic, semicon-ductor, or insulator characteristics, endowing them with diversechemical and physical properties. Therefore, metal oxides are themost important functional materials used for chemical and biolog-ical sensing and transduction. Moreover, their unique and tunablephysical properties have made themselves excellent candidates forelectronic and optoelectronic applications. Nanostructured metaloxides have been actively studied due to both scientific interestsand potential applications [1–3].
The physical properties of nanomaterials greatly depend ontheir surface characteristics and microstructure. These in turn arehighly sensitive to the phase and quality of the synthesizednanomaterials. Hence, the importance of single phase materialcannot be undermined as it is crucial for the accurate measure-ment of physical properties (such as electrical and magneticproperties).
Nanocrystalline SnO2 is an n-type semiconductor with a largeband gap. Because of its unique electrical, optical, and electro-chemical properties and also it is chemical stability, SnO2 is usedin gas sensors [4], photo catalysis [5], dye-sensitized solar cells[6], etc. The properties of the film are strongly depending uponthe method of preparation. To improve chemical and physicalproperties of SnO2 thin films, researchers are trying to modifythe synthesis procedure. Undoped and doped SnO2 thin films havebeen obtained by different techniques. It is being synthesized bysol–gel [7,8], controlled precipitation [9,10], thermal evaporation[11,12], solid state reaction [13], microwave [14,15], electrochem-ical [4], sonochemical [16] and hydrothermal methods [17]. Amongthese, our novel method is a facile, simple chemical synthesismethod, and it is distinguished for such merits as low cost, surfac-tant free and the layer-by-layer growth feature. This method iswidely used to deposit various metal oxides films (ZnO, CuO,NiO, TiO2, Co3O4, etc.) [18–22].
Specially sol–gel thin film deposition techniques offer impor-tant advantages over other techniques due to excellent composi-tional control, high homogeneity at the molecular level, lowercrystallization temperature and feasibility of producing thin filmson complex shapes when dip-coating is used. Also, SnO2 films de-
0925-8388/$ - see front matter � 2013 Elsevier B.V. All rights reserved.http://dx.doi.org/10.1016/j.jallcom.2013.02.069
⇑ Corresponding author. Tel.: +91 2172744771.E-mail address: [email protected] (V.B. Patil).
Journal of Alloys and Compounds 563 (2013) 300–306
Contents lists available at SciVerse ScienceDirect
Journal of Alloys and Compounds
journal homepage: www.elsevier .com/locate / ja lcom

Author's personal copy
rived from alkoxides using sol–gel process require considerablyless equipment, resulting in generally lower processing costs. Amajor advantage of sol–gel processes over other methods is theability to control the microstructure of the deposited film, i.e. thepore size, pore volume and surface area [18].
However, despite of considerable efforts in the field includingthe adsorption of complex agent from precursors and the reductionof rinsing time, the slow growth rate for almost all kind of films hasstill been major disadvantage, which limits it is applications insemiconductor industry. This method is in demand to both im-prove the growth rate and maintain the high quality of the films.Freshly deposited films may contain defects such as oxide vacan-cies and also hydroxide phase, since the inclusion of hydroxidephase is unavoidable due to an aqueous alkaline medium for depo-sition [23]. Annealing of films reduces the defects and removes thehydroxide phase along with recrystallization process. To obtain tinoxide without trace of hydroxide and oxide vacancies, the tin oxidepowders were annealed at 400–700 �C in air atmosphere for 1 h.
However, most of the reported methods are associated withsome limitations such as use of (i) metal complex compounds asstarting materials, which are difficult to synthesize and expensive(ii) delicate reagents those are difficult to handle (iii) and/or strongacids, bases, (iv) sometimes use of organic solvents. Moreover, for-mation of mixed or undesired crystalline phases often occurs dur-ing processing [15,4,16,17].
Therefore, development of a simple synthetic methodology forpreparation of pure and homogeneous SnO2 nanoparticles is a ma-jor challenge till now. In order to overcome the limitations of theexisting methods, we have developed technically simple but costeffective chemical synthetic routes. Herein, we report synthesismethodology for preparation of single phase SnO2 nanoparticles.In this methods precursor powders were synthesized by reactingaqueous solutions of tin chloride with methanol. Pure SnO2 nano-powders were obtained by calcining the precursor powders at dif-ferent temperatures ranging from 400 to 700 �C in air.
SnO2 thin films were characterized by using X-ray diffraction,FESEM, TEM, SAED, AFM, two probe technique and UV–visiblespectroscopy. Variation of its DC electrical conductivity with re-spect to process temperature has also been measured as this mate-rial has the potential application as humidity sensor.
2. Experimental details
Nanosized SnO2 thin films have been synthesized by a sol–gel spin coating tech-nique using Stannic chloride pentahydrate (SnCl4, 5H2O) as a source of tin oxide. Ina typical experiment; 2.3263 g of Stannic chloride pentahydrate was added to 40 mlof methanol and stirred vigorously at 60 �C for 1 h, leading to the formation of gel.This gel is further heated for 10 min to obtain faint yellow color powder. The as pre-pared powder was processed at various temperatures ranging from 400 to 700 �Cwith a fixed annealing time of 1 h in an ambient air to obtain nanocrystallineSnO2 powder with different crystallite sizes. For thin film formation, obtained nano-crystalline SnO2 powder was dissolved in organic solvent m-cresol and solution wascontinuously stirred for 11 h at room temperature and filtered. The filtered homo-geneous solution of SnO2 processed at different temperatures (400–700 �C) wasdeposited on to a glass substrate by a single wafer spin processor (APEX Instru-ments, Kolkata, Model SCU 2007). After setting the substrate on the substrateholder of the spin coater, the coating solution (approximately 0.2 ml) was droppedand spin-casted at 3000 rpm for 40 s in an air and dried on a hot plate at 100 �C for10 min. Fig. 1 shows the flow diagram for the sol–gel synthesis and deposition ofSnO2 films by spin-coating technique. X-ray powder diffraction (XRD) pattern ofthe prepared films were measured for the phase identification and estimation ofthe average crystallite size. XRD measurements were made by a Philips PW-3710model system with Cu Ka radiation (k = 1.5406 Å). The 2h range was from 20 to80 �C. The (101) diffraction peak has been considered for crystallite size estimation.In order to determine the particle size and morphology of SnO2, the sintered pow-ders were dispersed in methanol and sonicated ultrasonically by using OSCAR ultrasonic bath apparatus, to separate out individual particles. The size and morphologyof the thin films were then observed on FESEM Model: MIRA3 TESCAN, USA, oper-ating at 20 kV. The cross section of SnO2 films processed at 400 and 700 �C were ob-served on SEM model JEOL-JSM-6360, Japan, operated at 20 kV. Transmissionelectron microscopy (TEM) was obtained in order to investigate the microstructure
of tin oxide thin films using Hitachi Model H-800 TEM. The AFM images were re-corded in non-contact mode with a Nanoscope III (digital instruments). The dc elec-trical conductivity and thermoelectric power measurements of SnO2 thin films wereperformed using custom fabricated two probe technique in 300–500 K temperaturerange. The optical absorption spectra of the SnO2 thin films were measured using adouble-beam spectrophotometer Shimadzu UV-140 over 200–1100 nm wavelengthrange. The thickness of the film was measured by using weight difference methodand AMBIOS XP-1 surface profiler.
3. Results and discussion
3.1. SnO2 film formation mechanism and thickness measurement
The mechanism of SnO2 film formation by the sol–gel spin coat-ing method can be enlightened as follows:
SnCl4;5H2Oþ 2CH3OH !alkoxide formationCH3O—Sn—OCH3 þ 4HCl
þ 4H2O ðaÞ
CH3O—Sn—OCH3 þ 2H2O !hydrolysis
reesterificationHO—Sn—OHþ 2CH3OH ðbÞ
HO—Sn—OH
þHO—Sn—OH !Water condensation
hydrolysisHO—Sn—O—Sn—OHþH2O ðcÞ
Since to improve crystallinity and remove hydroxide phase,powders were annealed between 400 and 700 �C for 1 h. PureSnO2 is formed after air annealing by following mechanism,
nHO—Sn—O—Sn—OH !Air annealing400—700
�CnSnO2 þ nH2O ðdÞ
Thin films of processed SnO2 nanopowders are formed using or-ganic solvent m-cresol as discussed in Section 2. The thickness ofSnO2 films on the glass substrate was calculated using gravimetricweight difference method using formula:
t ¼ m=Aq ð1Þ
where t is film thickness of the film; m is actual mass depositedonto substrate; A is area of the film and q is the density of nanocrys-talline tin oxide (6.95 g/cm3). The SnO2 thin film thickness is also
Gel formation
After 10 min. cooling at RT
Stannic chloride pentahydrate +methanol
Stirring at 60 °C for 1 h
Faint yellow powder
Powder sintered at 400 – 700 °C for 1 h
Nanocrystalline SnO2 powder
SnO2 powder + m - cresol
Deposition of SnO2 on glass substrate by spin coating method
Heat treatment at 100 °C for 10 min in air
SnO2 films
Fig. 1. Flow diagram for SnO2 films prepared from the sol–gel spin-coatingtechnique.
R.D. Sakhare et al. / Journal of Alloys and Compounds 563 (2013) 300–306 301

Author's personal copy
confirmed by using AMBIOS XP-1 Surface profiler (Table 1) and issame as evaluated by gravimetric method.
3.2. Structural studies
Structural analysis of the SnO2 films processed at 400–700 �Cwas carried out by using X-ray diffractometer with CuKa radiationsource of wavelength (k = 1.54056 Å) and the diffraction patternsof films were recorded by varying diffraction angle (2h) in therange of 20–80�. Fig. 2 shows XRD pattern for the SnO2 films pro-
cessed at 400–700 �C. The observed ‘d’ values are in good agree-ment with standard ‘d’ values and the diffraction peaks areindexed to the tetragonal phase of SnO2. The lattice parametersare calculated for tetragonal phase of SnO2 using formula:
1=d2 ¼ h2 þ k2=a2 þ l2
=c2 ð2Þ
and its variation with processing temperature given Table 1. Theobserved values are in close agreement with the reported JCPDSNo. 72-1147 card. It shows well-defined peaks having orientationsin the (110), (101), (200), (211), (220), (002), (310), (112) and(301) planes. The absence of impurity peaks suggests the high pur-ity of the tin oxide. Compared with those of the bulk counterpart,the peaks are relatively broadened, which further indicates thatthe deposited material has a very small crystallite size [19]. Thecrystallite size (D) is calculated using equation as follows [20]
D ¼ 0:94k=b cos h ð3Þ
where D is the average crystallite size, assuming particles to bespherical K = 0.94, k is the wavelength of X-ray radiation, b is thefull width at half maximum of the diffracted peak measured in radi-ans and h is the angle of diffraction. The calculation of crystallitesize from XRD is a quantitative approach which is widely acceptedand used in scientific community [21–24]. The average crystallitesize is increased with increasing processing temperature (Table 1).
3.3. Compositional analysis
Fig. 3 shows EDAX spectra of nanocrystalline SnO2 thin film pro-cessed at 700 �C. The EDAX analysis revealed the presence of tin
Table 1Effect of processing temperature on thin film properties of SnO2.
Sr. no. Processingtemperature (�C)
Crystalline size(nm) (from XRD)
Lattice parameters (Å) Thickness (lm) Energy gap, Eg (eV) Activation energy (eV) Barrier potential (eV)
a and b c H.T. L.T.
1 400 14 4.728 3.320 0.61 3.88 0.42 0.23 0.862 500 25 4.732 3.323 0.76 3.76 0.52 0.31 0.753 600 50 4.735 3.326 0.85 3.62 0.94 0.35 0.704 700 67 4.737 3.328 0.92 3.60 0.95 0.39 0.67
20 30 40 50 60 70
(301
)(1
12)
(310
)
(002
)
(220
)
(200
)
(211
)
(101
)(110
)
(d)
(c)
(b)
(a)
Inte
nsity
(a.u
)
2θ (degree)
(a) 400 oC (b) 500 oC (c) 600 oC (d) 700 oC
Fig. 2. X ray diffraction patterns of SnO2 film at different processing temperatures.
Fig. 3. EDAX spectra of SnO2 thin film processed at 700 �C.
302 R.D. Sakhare et al. / Journal of Alloys and Compounds 563 (2013) 300–306

Author's personal copy
Fig. 4. FESEM of SnO2 thin films processed at: (a) 400 �C, (b) 500 �C, (c) 600 �C, and (d) 700 �C.
Fig. 5. Cross sectional SEM images of SnO2 thin films processed at: (a) 400 �C and (b) 700 �C.
a b
110
101200211220002
Fig. 6. TEM (a) and SAED (b) image of SnO2 thin film processed at 700 �C.
R.D. Sakhare et al. / Journal of Alloys and Compounds 563 (2013) 300–306 303

Author's personal copy
and oxygen and other elements from the glass substrates. The plat-inum traces arise from the platinum coatings applied to enhancethe FESEM imaging.
3.4. Field emission scanning electron microscopy (FESEM) analysis
The two-dimensional high magnification surface morphologiesof SnO2 thin films processed at 400–700 �C were carried out usingFESEM images are shown in Fig. 4a–d. From the micrographs, it isseen that the film consists of nanocrystalline grains with uniformcoverage of the substrate surface with randomly oriented mor-phology. Fig. 5 shows the cross sectional image of SnO2 films pro-cessed at 400 and 700 �C.
3.5. Transmission electron microscopy (TEM) analysis
Fig. 6a shows transmission electron microscopy (TEM) image ofSnO2 processed at 700 �C. The TEM image shows that the SnO2
nanoparticles were uniformly distributed over substrate surface.The micrographs show that the average diameter of SnO2 nanopar-ticles was in the 5–10 nm range. Fig. 6b shows the selected areaelectron diffraction (SAED) pattern together with the correspond-ing plane of SnO2. The different arrangement of dominant dif-fracted rings indicates a phase evolution of SnO2 crystalline grains.
3.6. Atomic force microscopy (AFM) analysis
The surface topography of the SnO2 film processed at 700 �Cwas investigated by atomic force microscopy in non-contact mode.In this mode, the probe cantilever is oscillated at or near its reso-nant frequency. Fig. 7a and b shows the 2D and 3D AFM images(1 lm � 1 lm) of the SnO2 nanoparticle films. From AFM imageit is seen that the SnO2 surface is smooth and the surface morphol-ogies of the SnO2 nanoparticles confirms spherical morphology asevidenced by FESEM micrographs. The surface roughness of thefilm over a 1 lm � 1 lm area was measured by AFM. The surfaceroughness mean square (RMS) of the film is 39 nm, which demon-strates that the surface morphology of SnO2 film processed at700 �C is smooth.
3.7. Electrical transport studies
3.7.1. Electrical conductivity measurementThe two-probe technique of dark dc electrical conductivity
measurement was used to study the variation of electrical conduc-tivity of film with processing temperature. The variation of logrwith reciprocal temperature (1000/T) is depicted in Fig. 8. Afterannealing, room temperature electrical conductivity was increasedfrom 10�7 to 10�5 (X cm)�1, due to increase in the crystallite sizeand reduced scattering at the grain boundary. Similar type of in-crease in electrical conductivity has been observed by Pawaret al. for sol gel derived TiO2 [24]. From Fig. 8 it is observed thatthe conductivity of film is increases with increase in annealingtemperature, further it is observed that conductivity obeys Arrhe-nius behavior indicating semiconducting transport behavior. Theactivation energies were calculated using
r ¼ r0 expðEar=kTÞ ð4Þ
where r is the conductivity at temperature T, r0 is a constant, k isthe Boltzmann constant, T is the absolute temperature and Ear isthe activation energy. The activation energy represents the locationof trap levels below the conduction band. The temperature depen-dence of electrical conductivity (Fig. 8) showed two distinct con-duction regions corresponding to two different conductionmechanisms; one, a grain boundary scattering limited and seconda variable range hopping. The activation energies of an electricalconduction have been computed for the regions and it is observedthat the activation energies are increased from 0.423 eV to0.945 eV, as the processing temperature increased from 400 to700 �C.
Fig. 7. 2D (a) and 3D (b) AFM image of SnO2 thin film processed at 700 �C.
2.0 2.2 2.4 2.6 2.8 3.0 3.2-8
-7
-6
-5
-4
-3(d)
(c)
(b)
(a)
Log
σ (o
hm c
m)-1
1000/TO(K)-1
(a) (400 OC)(b) (500 OC)(c) (600 OC)(d) (700 OC)
Fig. 8. Arrhenius plot of log conductivity versus 1000/T of SnO2 thin film processedat different temperatures.
304 R.D. Sakhare et al. / Journal of Alloys and Compounds 563 (2013) 300–306
Author's personal copy
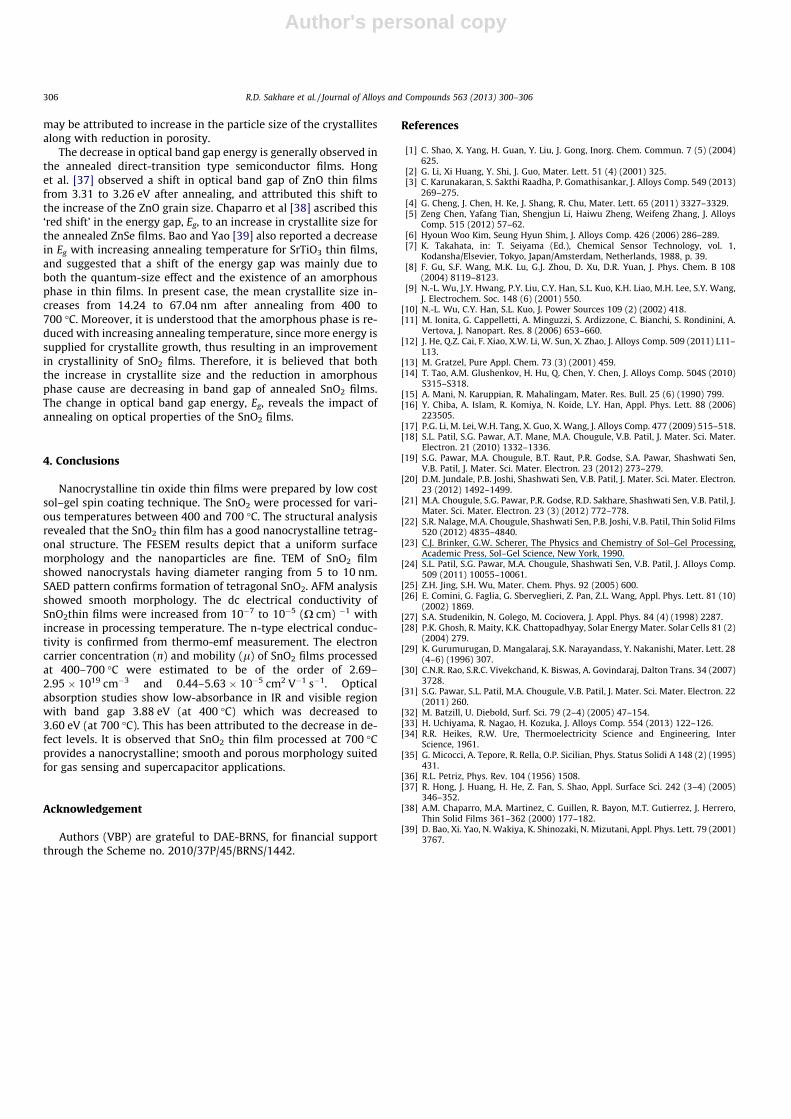
3.7.2. Thermoelectric power measurementThe thermo-emf of SnO2 films processed between 400 and
700 �C was measured as a function of temperature in the temper-ature range 300–500 K. The polarity of the thermally generatedvoltage at the hot end was negative, indicating that the SnO2 filmsare of n-type [25–27]. The variation of the thermo-emf (DV) withtemperature is shown in Fig. 9. The thermo-emf increases withincreasing temperature. The thermo-electric power (TEP) was usedto evaluate the carrier mobility (l) and carrier concentration (n)using the relation,
TEP ¼ �k=e½Aþ lnf2ð2pm�ckTÞ3=2=nh3g ð5Þ
where A is a thermoelectric factor (2 for tin oxide), n is electron den-sity, h is Plank’s constant, m�c is the effective mass of the electron.
After substitution of various constants Eq. (4) simplifies to [29].
log n ¼ 3=2 log T � 0:005TEPþ 15:719 ð6Þ
The electron density (n) was calculated using the above equa-tion and was in the order of 1019 cm�3 for films annealed at 400–700 �C. The mobility (l) of the charge carriers is determined fromthe relation,
l ¼ r=ne ð7Þ
where n is electron density and r is conductivity. It is observedthat electron density (n) and mobility (l) increases with tempera-ture. The electron carrier concentration (n) and mobility (l) wereestimated to be of the order of 2.69–2.95 � 1019 cm�3 and 0.44–
5.63 � 10�5 cm2 V�1 s�1 respectively for SnO2 processed between400 and 700 �C. The temperature variation of carrier mobility sug-gests that there is a considerable amount of scattering mechanismdue to the intergrain barrier potential [29–33]. This carrier scatter-ing is temperature dependent, and therefore it is related to the car-rier mobility (l) and intergranular potential (Ub) [24,34–36].
l ¼ l0 expð�Ub=kTÞ ð8Þ
where all the terms have their usual meanings. Intergranular poten-tial (scattering potential) is therefore calculated from the loglT1/2
versus 1000/T variation as suggested by Micocci et al. [34]. Fig. 10shows determination of intercrystalline barrier height for SnO2
films processed at 400–700 �C. It is typical value is between 0.86and 0.67 eV for SnO2 film processed at 400–700 �C.
3.8. Optical studies
The SnO2 thin films on glass substrate were used to study theoptical absorption. The optical absorption of SnO2 thin films inthe wavelength range of 200–1100 nm has been investigated.
Fig. 11 shows plots of (ahm)2 as a function of photon energy (hm)for SnO2thin films as a function of process temperature 400–700 �C. Since the plot is almost linear, the direct nature of the opti-cal transition in SnO2 is confirmed. Extrapolation of these curves tophoton energy axis reveals the band gap. The optical absorptiondata were analyzed using the following classical relation for nearedge optical absorption in semiconductor.
a ¼ a0ðhm� EgÞn=hm ð9Þ
where ‘a0’ is a constant, ‘Eg’ is the semiconductor band gap and ‘n’ isa number equal to 1/2 for direct gap and 2 for indirect gapcompound.
The band gap of SnO2 film was found to be decreased from 3.88to 3.60 eV for films processed at 400–700 �C. The decrease in Eg
with annealing temperature could be due to increase in crystallinesize and reduction of defect sites. This is in good agreement withthe experimental results of XRD analysis. According to XRD results,the mean grain size has increased with increased annealing tem-perature. As the grain size has increased, the grain boundary den-sity of a film decreased, subsequently, the scattering of carriers atgrain boundaries has decreased [24,28–32]. A continuous increaseof optical constants (a and Eg) and also the shift in absorption edgeto a higher wavelength with increasing annealing temperature
2.0 2.2 2.4 2.6 2.8 3.0 3.20.4
0.8
1.2
1.6
(d)
(c)
(b)
(a)
Ther
mo-
emf (
mV)
1000/T (OK)-1)
(a) 400 OC(b) 500 OC(C) 600 OC(d) 700 OC
Fig. 9. Variation of thermo-emf with temperature of SnO2 thin film processed atdifferent temperatures (400–700 �C).
2.0 2.2 2.4 2.6 2.8 3.0 3.2-6
-5
-4
-3
-3.2
-3.0
-2.8
-2.6
-2.4
-2.2
log (μT) 1/2
(b)
(c)
(d)
(a)
log
(μT)
1/2
1000/T (OK)-1
(a) 400oC(b) 500 oC(c) 600 oC(d) 700 oC
Fig. 10. Determination of intercrystalline barrier height for SnO2 films processed at400–700 �C.
2.0 2.5 3.0 3.5 4.0 4.50.0
1x10⁸
2x10⁸
3x10⁸
4x10⁸
(d)
(c)
(b)
(a)
(a) SnO2(400oC)(b) SnO2(500oC)(c) SnO2(600oC)(d) SnO2(700oC)
(αhν
)2 (cm
-2eV
2 )
Band gap (eV)
Fig. 11. Plot of (ahm)2 versus (hm) of SnO2 thin film processed between 400 and700 �C.
R.D. Sakhare et al. / Journal of Alloys and Compounds 563 (2013) 300–306 305
Author's personal copy
may be attributed to increase in the particle size of the crystallitesalong with reduction in porosity.
The decrease in optical band gap energy is generally observed inthe annealed direct-transition type semiconductor films. Honget al. [37] observed a shift in optical band gap of ZnO thin filmsfrom 3.31 to 3.26 eV after annealing, and attributed this shift tothe increase of the ZnO grain size. Chaparro et al [38] ascribed this‘red shift’ in the energy gap, Eg, to an increase in crystallite size forthe annealed ZnSe films. Bao and Yao [39] also reported a decreasein Eg with increasing annealing temperature for SrTiO3 thin films,and suggested that a shift of the energy gap was mainly due toboth the quantum-size effect and the existence of an amorphousphase in thin films. In present case, the mean crystallite size in-creases from 14.24 to 67.04 nm after annealing from 400 to700 �C. Moreover, it is understood that the amorphous phase is re-duced with increasing annealing temperature, since more energy issupplied for crystallite growth, thus resulting in an improvementin crystallinity of SnO2 films. Therefore, it is believed that boththe increase in crystallite size and the reduction in amorphousphase cause are decreasing in band gap of annealed SnO2 films.The change in optical band gap energy, Eg, reveals the impact ofannealing on optical properties of the SnO2 films.
4. Conclusions
Nanocrystalline tin oxide thin films were prepared by low costsol–gel spin coating technique. The SnO2 were processed for vari-ous temperatures between 400 and 700 �C. The structural analysisrevealed that the SnO2 thin film has a good nanocrystalline tetrag-onal structure. The FESEM results depict that a uniform surfacemorphology and the nanoparticles are fine. TEM of SnO2 filmshowed nanocrystals having diameter ranging from 5 to 10 nm.SAED pattern confirms formation of tetragonal SnO2. AFM analysisshowed smooth morphology. The dc electrical conductivity ofSnO2thin films were increased from 10�7 to 10�5 (X cm) �1 withincrease in processing temperature. The n-type electrical conduc-tivity is confirmed from thermo-emf measurement. The electroncarrier concentration (n) and mobility (l) of SnO2 films processedat 400–700 �C were estimated to be of the order of 2.69–2.95 � 1019 cm�3 and 0.44–5.63 � 10�5 cm2 V�1 s�1. Opticalabsorption studies show low-absorbance in IR and visible regionwith band gap 3.88 eV (at 400 �C) which was decreased to3.60 eV (at 700 �C). This has been attributed to the decrease in de-fect levels. It is observed that SnO2 thin film processed at 700 �Cprovides a nanocrystalline; smooth and porous morphology suitedfor gas sensing and supercapacitor applications.
Acknowledgement
Authors (VBP) are grateful to DAE-BRNS, for financial supportthrough the Scheme no. 2010/37P/45/BRNS/1442.
References
[1] C. Shao, X. Yang, H. Guan, Y. Liu, J. Gong, Inorg. Chem. Commun. 7 (5) (2004)625.
[2] G. Li, Xi Huang, Y. Shi, J. Guo, Mater. Lett. 51 (4) (2001) 325.[3] C. Karunakaran, S. Sakthi Raadha, P. Gomathisankar, J. Alloys Comp. 549 (2013)
269–275.[4] G. Cheng, J. Chen, H. Ke, J. Shang, R. Chu, Mater. Lett. 65 (2011) 3327–3329.[5] Zeng Chen, Yafang Tian, Shengjun Li, Haiwu Zheng, Weifeng Zhang, J. Alloys
Comp. 515 (2012) 57–62.[6] Hyoun Woo Kim, Seung Hyun Shim, J. Alloys Comp. 426 (2006) 286–289.[7] K. Takahata, in: T. Seiyama (Ed.), Chemical Sensor Technology, vol. 1,
Kodansha/Elsevier, Tokyo, Japan/Amsterdam, Netherlands, 1988, p. 39.[8] F. Gu, S.F. Wang, M.K. Lu, G.J. Zhou, D. Xu, D.R. Yuan, J. Phys. Chem. B 108
(2004) 8119–8123.[9] N.-L. Wu, J.Y. Hwang, P.Y. Liu, C.Y. Han, S.L. Kuo, K.H. Liao, M.H. Lee, S.Y. Wang,
J. Electrochem. Soc. 148 (6) (2001) 550.[10] N.-L. Wu, C.Y. Han, S.L. Kuo, J. Power Sources 109 (2) (2002) 418.[11] M. Ionita, G. Cappelletti, A. Minguzzi, S. Ardizzone, C. Bianchi, S. Rondinini, A.
Vertova, J. Nanopart. Res. 8 (2006) 653–660.[12] J. He, Q.Z. Cai, F. Xiao, X.W. Li, W. Sun, X. Zhao, J. Alloys Comp. 509 (2011) L11–
L13.[13] M. Gratzel, Pure Appl. Chem. 73 (3) (2001) 459.[14] T. Tao, A.M. Glushenkov, H. Hu, Q. Chen, Y. Chen, J. Alloys Comp. 504S (2010)
S315–S318.[15] A. Mani, N. Karuppian, R. Mahalingam, Mater. Res. Bull. 25 (6) (1990) 799.[16] Y. Chiba, A. Islam, R. Komiya, N. Koide, L.Y. Han, Appl. Phys. Lett. 88 (2006)
223505.[17] P.G. Li, M. Lei, W.H. Tang, X. Guo, X. Wang, J. Alloys Comp. 477 (2009) 515–518.[18] S.L. Patil, S.G. Pawar, A.T. Mane, M.A. Chougule, V.B. Patil, J. Mater. Sci. Mater.
Electron. 21 (2010) 1332–1336.[19] S.G. Pawar, M.A. Chougule, B.T. Raut, P.R. Godse, S.A. Pawar, Shashwati Sen,
V.B. Patil, J. Mater. Sci. Mater. Electron. 23 (2012) 273–279.[20] D.M. Jundale, P.B. Joshi, Shashwati Sen, V.B. Patil, J. Mater. Sci. Mater. Electron.
23 (2012) 1492–1499.[21] M.A. Chougule, S.G. Pawar, P.R. Godse, R.D. Sakhare, Shashwati Sen, V.B. Patil, J.
Mater. Sci. Mater. Electron. 23 (3) (2012) 772–778.[22] S.R. Nalage, M.A. Chougule, Shashwati Sen, P.B. Joshi, V.B. Patil, Thin Solid Films
520 (2012) 4835–4840.[23] C.J. Brinker, G.W. Scherer, The Physics and Chemistry of Sol–Gel Processing,
Academic Press, Sol–Gel Science, New York, 1990.[24] S.L. Patil, S.G. Pawar, M.A. Chougule, Shashwati Sen, V.B. Patil, J. Alloys Comp.
509 (2011) 10055–10061.[25] Z.H. Jing, S.H. Wu, Mater. Chem. Phys. 92 (2005) 600.[26] E. Comini, G. Faglia, G. Sberveglieri, Z. Pan, Z.L. Wang, Appl. Phys. Lett. 81 (10)
(2002) 1869.[27] S.A. Studenikin, N. Golego, M. Cociovera, J. Appl. Phys. 84 (4) (1998) 2287.[28] P.K. Ghosh, R. Maity, K.K. Chattopadhyay, Solar Energy Mater. Solar Cells 81 (2)
(2004) 279.[29] K. Gurumurugan, D. Mangalaraj, S.K. Narayandass, Y. Nakanishi, Mater. Lett. 28
(4–6) (1996) 307.[30] C.N.R. Rao, S.R.C. Vivekchand, K. Biswas, A. Govindaraj, Dalton Trans. 34 (2007)
3728.[31] S.G. Pawar, S.L. Patil, M.A. Chougule, V.B. Patil, J. Mater. Sci. Mater. Electron. 22
(2011) 260.[32] M. Batzill, U. Diebold, Surf. Sci. 79 (2–4) (2005) 47–154.[33] H. Uchiyama, R. Nagao, H. Kozuka, J. Alloys Comp. 554 (2013) 122–126.[34] R.R. Heikes, R.W. Ure, Thermoelectricity Science and Engineering, Inter
Science, 1961.[35] G. Micocci, A. Tepore, R. Rella, O.P. Sicilian, Phys. Status Solidi A 148 (2) (1995)
431.[36] R.L. Petriz, Phys. Rev. 104 (1956) 1508.[37] R. Hong, J. Huang, H. He, Z. Fan, S. Shao, Appl. Surface Sci. 242 (3–4) (2005)
346–352.[38] A.M. Chaparro, M.A. Martinez, C. Guillen, R. Bayon, M.T. Gutierrez, J. Herrero,
Thin Solid Films 361–362 (2000) 177–182.[39] D. Bao, Xi. Yao, N. Wakiya, K. Shinozaki, N. Mizutani, Appl. Phys. Lett. 79 (2001)
3767.
306 R.D. Sakhare et al. / Journal of Alloys and Compounds 563 (2013) 300–306
Copyright © 2022 FDOKUMEN