Electrically tuned magnetic order and magnetoresistance in a ...

Available online at www.ilcpa.pl
International Letters of Chemistry, Physics and Astronomy
10(1) (2013) 90-101 ISSN 2299-3843
Development of Electrically Conductive Nanocrystalline Thin Film for Optoelectronic
Applications
Sujan Kumar Das1,*, Jahid M. M. Islam3, Monirul Hasan2, Humayun Kabir2, Md. Abdul Gafur4, Enamul Hoque2, Mubarak A. Khan3
1Department of Physics, University of Chittagong, Chittagong - 4331, Bangladesh
2Department of Physics, Jahangirnagar University, Savar, Dhaka - 1342, Bangladesh
3Institute of Radiation and Polymer Technology, Bangladesh Atomic Energy Commission,
Dhaka - 1000, Bangladesh
4Pilot Plant and Process Development Centre, Bangladesh Council of Scientific and Industrial
Research, Dhaka, Bangladesh
*E-mail address: [email protected]
ABSTRACT
Sodium alginate (TiO2) sand composites were prepared by solution casting. Purified sand was
added in the composite films to increase electrical conductivity. Electrical properties such as
conductivity, capacitance, dielectric constant, and loss tangent of the composites were investigated.
The current voltage characteristics for all the composites showed ohmic behavior. All the electrical
properties have been found to improve with the incorporation of sand (SiO2) but 6 % sand containing
composite exhibits the best electrical properties. The mechanical properties tensile strength (TS),
elongation at break (Eb) and Young modulus for 6 % sand containing composite film are found to be
4.445 MPa, 9.76 %, and 72.8 MPa respectively. The experimental results reveal that the blended films
exhibit higher stability and improved mechanical properties of both tensile strength and elongation at
break in dry state. Water absorption properties of the composites are found to decrease with the
increase of sand content. Lowest water uptake properties and highest stability were demonstrated by 6
% sand containing sample. Electrically conductive composite films have useful applications for solar
cells and optoelectronics. Thus, this study is very much expected to aid in the design and selection of
proper composite for the potential application of solar cell and optoelectronics
Keywords: Conductive thin film, Composite, TiO2, Solar cell, Optoelectronics, Sodium alginate.
1. INTRODUCTION
Sodium alginate (chemical formula is NaC6H7O6) is an electro-active bio-polymer
extracted from the cell walls of brown algae. Biopolymers are a special class of polymers
either produced or synthesized from within living organisms [1]. Biopolymers are a renewable

International Letters of Chemistry, Physics and Astronomy 10(1) (2013) 90-101
91
resource and have a wide range of uses in nature, functioning as energy storage, transport,
signaling, and structural components. Sodium alginate has a versatile use in textile and
printing industry as well as food industry. It is soluble in both hot and cold water and has the
ability to form films.
Sch. 1: Chemical structure of mannuronic acid–rich type of sodium alginate
TiO2, an inexpensive, non-toxic and biocompatible material, is one of the most
interesting nanostructured photocatalysts [2-6] as it exhibits excellent optical, electrical, and
thermal properties. The interest in TiO2 as a strategic material for environmental
photocatalysis and photoelectrochemical solar energy conversion has continuously increased.
They are mainly related to photocatalysis, photovoltaic devices, dye-sensitized solar
cells, sensors, paintings and potential tool in cancer treatment [7-12]. However, it is well
known that there are two typical drawbacks in practical application. Firstly, only the
ultraviolet part of the solar irradiation (amounting to ~4 % of the incoming solar energy on
the earth’s surface) could be absorbed by TiO2 due to its high intrinsic band gap (3.2 eV for
anatase and 3.0 for rutile). Secondly, a low rate of electron transfer to oxygen and a high rate
of recombination between excited electron-hole pairs result in a low quantum yield rate and
also a limited photo-oxydation rate. In order to resolve the above listed problems, continuous
efforts have been made to improve the properties of TiO2 thin film, for example, noble metal
loading, metal ion doping, anion doping, dye sensitization, composite semiconductors, metal
ion-implantation, etc. [13-17].
Silicon dioxide is one of the most commonly encountered substances in both daily life
and in electronics manufacturing and is available in our nature. In this work the preparation of
Na-alginate (TiO2) sand thin films (of 0.1 to 10 % sand content by weight) using solution
casting method at room temperature is described in details. The electrical and mechanical
properties of the films have been investigated using different instruments and methods.
2. EXPERIMENTAL
2. 1. Materials
Sodium alginate (NaC6H7O6) and titanium dioxide (TiO2) were purchased from MERK,
Germany. Sand (SiO2) was collected from Sylhet, Bangladesh.
2. 2. Methods
2. 2. 1. Sand purification

International Letters of Chemistry, Physics and Astronomy 10(1) (2013) 90-101
92
Collected sand contained various impurities was washed with 0.1 % sulfuric acid
(H2SO4) for about 10 times. Then it was dried at room temperature for 24 hour. Again the
sand was washed with 10 % sulfuric acid and then dried. After drying it was again washed
with distill water and finally dried at room temperature for 48 hour. Dried sand was then made
into powder form firstly by grinding with mortar and then by ball milling with Universal Ball
Mill (Model: UB-32, Yamato Scientific Co. Ltd., Japan). Finally sand (SiO2) powder was
filtered by filtering machine.
2. 2. 2. Preparation of formulations
Sodium alginate was dissolved in distill water along with varying percentage of sand
and titanium dioxide to prepare various formulations. Mixtures were stirred continuously to
aid formation of homogeneous mixture and heated for about one and half an hour at 115 °C.
Then these formulations were sonicated by microwave sonicator for an hour. Table-1
showed six types of such formulations (F1 – F6).
Table 1. Composition of different formulations (%, w/w).
Components Formulations
F1 F2 F3 F4 F5 F6
NaC6H7O6 92 91.9 91.5 91 86 82
TiO2 8 8 8 8 8 8
Sand 0 0.1 0.5 1 6 10
2. 2. 3. Preparation of thin films
The formulated solutions were cast on silicon paper (release paper) mounted on level
glass plate. The solutions were kept at room temperature for about 72 hour. After formation of
the films, they were peeled off and cut into a dimension of 100 x 50 mm2. Average thickness
of the films was 0.1 to 0.3 mm.
Distill
water
Stirred for
30 minutes
Stirred & heated
for 1.5 hours at
115 °C
Composite film
drying at room
temperature
Solution
casting
Sonicated for
an hour
Cooled for 30
minutes
TiO2 & sand
powder
Sodium alginate
powder
Flow Sheet 1. Preparation process of Na-alginate (TiO2) sand thin film.

International Letters of Chemistry, Physics and Astronomy 10(1) (2013) 90-101
93
2. 3. Properties measurement
The samples were cut with an anti-cutter into small pieces of length 70 mm and width
30 mm. These samples were stored in a laminated poly-ethylene bag at room temperature and
65 % relative humidity until testing. All tests were carried out under similar condition.
2. 3. 1. Electrical Properties
Samples were cut into square shape with edge of 1 cm and the two surfaces of each
sample were coated with silver paste as contact material for electrical measurements. Silver
paste was added on both sides of the samples together with two thin copper wires of 100-
micron diameter which were well polished by silicon paper to improve contacting for
conduction. The samples were dried at 37 °C to eliminate any absorbed moisture. Then we
add scostape over both sides the samples to make ready for taking electrical properties.
The resistivity (ρ) of the samples was measured using the Agilent Precision Impedance
Analyzer (Agilent, 4291a) and the conductivity (ζ) was calculated from the following relation
ζ = 1/ρ …………… (1)
The dielectric loss and capacitance of the samples were measured at room temperature
by Agilent 4263B LCR meter with frequency ranges from 100 Hz to 100 kHz. Dielectric
constant of the samples were calculated from the measured capacitance using the following
relation
εr = C/Co ………….. (2)
where C and Co are the capacitance of the capacitor with samples and with air respectively. Co
was calculated from the knowledge of the dimension of the samples using the following
relation
Co = 8.854×10⁻¹²
×A/d ……………. (3)
where A is the area of the capacitive cell in meter2 and d is the thickness of the sample (or gap
between the electrodes) in meter. A Keithley617 programmable electrometer, Keithley197A
auto ranging micro voltmeter and a dc power supply were set in current-voltage mode for
recording the current through the sample at different voltage at constant temperature and
irradiation. In this case the voltage was varied from 0 to 32 V and the current was recorded
every 2 volts intervals.
Fig. 1. Experimental circuit diagram for I-V measurement.

International Letters of Chemistry, Physics and Astronomy 10(1) (2013) 90-101
94
2. 3. 2. Mechanical Properties
Mechanical properties: Tensile Strength (TS), Elongation at break (Eb %) and Young
Modulus (E) of the films were measured with Universal Testing Machine (HOUNSFIELD,
model H50KS).The test specimens were 70 mm in length and 10 mm in width. Parameters of
the UTM for tensile properties measurements are given below:
Load range = 10 N, extension range = 200 mm, gauge length = 25 mm, speed = 500,
approach Speed = 500, pre-load = 0
The test specimen was prepared according to ASTM Method [18] for measuring tensile
strength.
Tensile Strength (TS) [19] =
i.e., TS (MPa) =
.................... (4)
Elongation at break was calculated according to ASTM D-638 [20].
Elongation at break, Eb (%) =
100 % ……… (5)
The slope of the initial straight line portion of the stress-strain curve is the elastic
modulus of a material. In a tensile test this modulus is Young’s modulus and is calculated by
E =
, ……………………. (6)
where dζ = Stress at yield ζy and dε = Strain at yield εx.
2. 3. 3. Water Uptake and Stability
Water uptake and aging of the samples are taken for studying the stability of the
samples with time [21]. The water intake specimens were prepared according to ASTM [22].
The test specimens were about 30 mm length, width about 15 mm and thickness about
0.180 mm. The water uptake of the specimens was periodically monitored up to 80 seconds to
find the profile of water uptake. Water absorption was measured using the following equation
100 % ............ (7)
where:
Wg = percentage of weight gained by the sample due to water absorption,
Wa = weight of the sample after water treatment,
W0 = weight of the dry sample before water treatment.
International Letters of Chemistry, Physics and Astronomy 10(1) (2013) 90-101
95
3. RESULTS AND DISCUSSION
Most of the data presented in this paper are average values of at least five samples and
the results obtained are within the accuracy of ±1 %.
3. 1. Electrical Properties Analysis
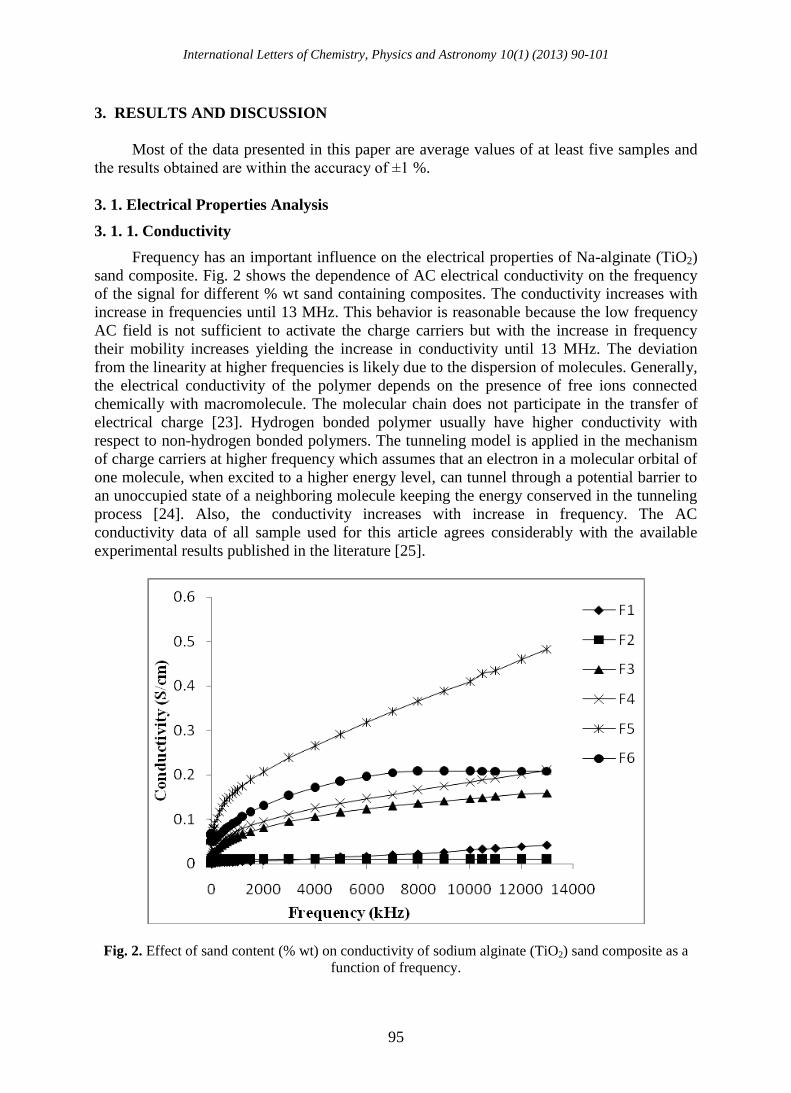
3. 1. 1. Conductivity
Frequency has an important influence on the electrical properties of Na-alginate (TiO2)
sand composite. Fig. 2 shows the dependence of AC electrical conductivity on the frequency
of the signal for different % wt sand containing composites. The conductivity increases with
increase in frequencies until 13 MHz. This behavior is reasonable because the low frequency
AC field is not sufficient to activate the charge carriers but with the increase in frequency
their mobility increases yielding the increase in conductivity until 13 MHz. The deviation
from the linearity at higher frequencies is likely due to the dispersion of molecules. Generally,
the electrical conductivity of the polymer depends on the presence of free ions connected
chemically with macromolecule. The molecular chain does not participate in the transfer of
electrical charge [23]. Hydrogen bonded polymer usually have higher conductivity with
respect to non-hydrogen bonded polymers. The tunneling model is applied in the mechanism
of charge carriers at higher frequency which assumes that an electron in a molecular orbital of
one molecule, when excited to a higher energy level, can tunnel through a potential barrier to
an unoccupied state of a neighboring molecule keeping the energy conserved in the tunneling
process [24]. Also, the conductivity increases with increase in frequency. The AC
conductivity data of all sample used for this article agrees considerably with the available
experimental results published in the literature [25].
Fig. 2. Effect of sand content (% wt) on conductivity of sodium alginate (TiO2) sand composite as a
function of frequency.

International Letters of Chemistry, Physics and Astronomy 10(1) (2013) 90-101
96
However, 6 % sand containing composite films showed very significant improved level
of conductivity in comparison with the other compositions.
3. 1. 2. I-V Characteristics
The current-voltage (I-V) characteristics of Na-alginate (TiO2) sand composites showed
ohmic behavior. The current conduction increased rapidly for the sample containing higher
percentage of sand as shown in Fig. 3. The maximum current conduction was observed for the
sample containing 6% sand and it showed a linear trend of increase in current conduction with
the applied voltage above 10 V. So I-V characteristics of 6 % sand containing composite film
was well fitted to ohms law.
Fig. 3. I-V characteristics for different % wt of sand containing composite.
3. 1. 3. Dielectric Constant
The study of dielectric constant of a material gives an outline about the nature of atoms,
ions and their bonding in the material. The dielectric constant (εr) depends on frequency of the
applied field. The dielectric constant (εr) showed a decreasing trend with increasing frequency
of applied voltage as shown in the Fig. 4. The value of dielectric constant decrease as the
frequency increases and it becomes independent at higher frequency region. The high value of
dielectric constant in the low frequency region may be due to the contributions of electronic,
ionic, dipolar, and space charge polarizations. The electronic exchange of the number of ions
in the composite gives local displacement of electron in the direction of applied field, which
in turn give rise to polarization. Generally, the polarizability (α) increases with increasing the

International Letters of Chemistry, Physics and Astronomy 10(1) (2013) 90-101
97
dipolar moment, orientation and reorientation motion is due to the decrease of εr at higher
frequency. From the experiment it is seen that 1 % sand containing composite has the high
value of dielectric constant and 0.1 % composite has the lowest value.
Fig. 4. Effect of sand (% wt) on the dielectric constant as a function of frequency (Hz).
3. 1. 4. Loss Tangent
Fig. 5. Effect of frequency on dielectric loss tangent for different % wt of sand containing Na-
alginate/TiO2/Sand composite.

International Letters of Chemistry, Physics and Astronomy 10(1) (2013) 90-101
98
Fig. 5 shows the variation of the dielectric loss (ε´) with frequency of applied field at
room temperature. The behavior of variation is similar to that of dielectric constant with
frequency. The dielectric loss is a measure of the energy absorbed by dielectric. Usually the
dielectric has a resistance R and reactance 1/ωC. Which are related to the phase angle tanδ =
1/ωCR, where C is the capacitance. So the low dielectric loss at high frequency region reveals
the superior optical quality of the composite with lesser defects.
From this figure it is found that, dielectric loss decreases with increasing frequency due
to the increase in the polarizability (α) by increasing the dipolar moment, orientation and
reorientation motion and it lead to the decrease in dielectric loss at higher frequency. The
similar behavior was seen in dielectric constant (εr). From figure it is also found that 1 %
Sand containing composite has the lowest loss factor and the 0.1 % composite has maximum
loss factor. Dielectric loss decreases drastically with increase in frequency until 10 kHz and
above 10 kHz dielectric loss is almost constant.
3. 2. Mechanical Properties Studies
The tensile strength of the films was increased with the increase in %wt sand content
shown in Fig. 6(a). The tensile strength of 0 % composite film was found to be 0.541 MPa
and the highest tensile strength was 4.445 MPa for 6 % composite film among all the
composite films used for this thesis. The tensile strength of the blend films began to decrease
with the increase in % wt of sand above 6 %.
Above 0.5 % composite film elongation at break was being increased till 6 % sand
containing film and then decreases with the increase in sand content. The film containing 6 %
sand showed a very significant value of elongation at break.
(a) (b) (c)
Fig. 6. Effect of sand on the (a) Tensile strength, (b) Elongation at break and (c) Elastic Modulus
in Na-alginate (TiO2) sand composite film.
The Young modulus of 38.17 MPa was observed for the 0 % sand containing composite
film. It was also seen that with the incorporation of sand the Young modulus started to
Ten
sile
Str
eng
th (
MP
a)
Composition (% wt of
Sand)
Elo
ng
ati
on
at
bre
ak
(%
)
Composition ( % wt of
Sand)
Ela
stic
Mo
du
lus
(MP
a)
Composition (%wt of
Sand)

International Letters of Chemistry, Physics and Astronomy 10(1) (2013) 90-101
99
increase shown in Fig. 6(c). The 6 % composite showed the highest elastic modulus of 72.8
MPa. Further incorporation of sand in the composite the elastic modulus started to decrease.
3. 3. Water Uptake and Stability
In Fig. 7(a) water uptake (% wt) is plotted against soaking time. The highest water
absorption of pure sodium alginate / TiO2 film was found to be 81.7293 % at 80 sec. From the
experiment it was found that the water absorption of the composites decreased gradually with
the increase of the percentage of sand in composites and lowest water absorption was found
for 6% sand containing composite film. This is most likely achieved by the reduction
hydroxyl groups and introducing between sand and matrix because sand particle penetrates
into the sodium alginate matrix and obstructs to create hydrogen bonding between Na-alginate
and water molecules. But further incorporation of sand the water uptake tends to decrease.
(a) (b)
Fig. 7. Effect of sand on (a) water uptake and (b) stability of Na-alginate/TiO2/Sand thin films.
The stability of the composite films was increased with increasing sand content. Furthermore, Fig.
7(b) also depicts that 6 % sand containing Na-alginate/TiO2 film has higher stability in water. The
lower water uptake and higher stability is most likely due to the sufficient intermolecular hydrogen
bonding between the hydrocarbon groups of Na-alginate and SiO2.
4. CONCLUSION
Sodium alginate (TiO2) sand composite films of six different compositions have been
fabricated using standard solution casting method. In this article, the effects of sand-addition
on the electrical and mechanical properties of the composite films have studied thoroughly.
Since organic polymer and water is poor conductor of electricity. The incorporation of sand
could enhance the conductivity of the composite as semiconducting silicon atom is in sand.
From the I-V characteristics it is clearly evident that the contact behavior is ohmic. Electrical
properties of the composites were found to be improved due to better conjugation among
sodium alginate, TiO2 and sand. The mechanical properties have been drastically improved
International Letters of Chemistry, Physics and Astronomy 10(1) (2013) 90-101
100
due to sand content in the films. Due to the incorporation of sand the tensile strength and
Young modulus of the composite has found to be increased. Also the elongation at break was
decreased. The water resistance properties of the composites were improved with the
incorporation of sand.
Throughout the investigation, it has been found that addition of sand remarkably
improves the electrical and mechanical properties along with increased crosslinking. Even
though, this work has some outstanding results which are very important in the field of
electroactive natural polymer, it might have great potential application in the field of organic
electronics especially in the field of organic semiconductor and organic photovoltaic solar
cells. It might have an application in biosensors.
ACKNOWLEDGEMENT
This work was carried out in Institute of Radiation and Polymer Technology (IRPT) of
Bangladesh Atomic Energy Research and Establishment (AERE), Department of Physics of
Jahangirnagar University and Pilot Plant and Process Development Centre (PP & PDC) of
Bangladesh Council of Scientific and Industrial Research (BCSIR), Dhaka, Bangladesh.
REFERENCES
[1] Lay G., Rehm J., Stepto R. F., Thoma M., Sachetto J., Lentz D. J., Silbiger J., U.S. Patent
No. 5,095,054 (1992).
[2] Hamal D. B., Klabunde K. J., J. Colloid Interface Sci. 311 (2007) 514-522,
http://dx.doi.org/10.1016/j.jcis.2007.03.001
[3] B. Tryba, A.W. Morawski, M. Inagaki, Appl. Catal. B: Environ. 46 (2003) 203-208,
http://dx.doi.org/10.1016/S0926-3373(03)00214-5
[4] P. Chrysicopoulou, D. Davazoglou, Chr. Trapalis, G. Kordas, Thin Solid Films 323
(1998) 188-193,
http://dx.doi.org/10.1016/S0040-6090(97)01018-3
[5] Lee J. W., Kong S., Kim W. S., and Kim J., Mater. Chem. Phys. 106 (2007) 39-44,
http://dx.doi.org/10.1016/j.matchemphys.2007.05.019
[6] Wang W., Tao J., Wang T., Wang L., Rare Met. 26 (2007) 136-141,
http://dx.doi.org/10.1016/S1001-0521(07)60173-9
[7] Doh J. G., Hong J. S., Vittal R., et al., Chem. Mater. 16 (2004) 493-497.
doi:10.1021/cm030542q
[8] Zhang D., Yoshida Y., Oekermann T., et al., Adv. Funct. Mater. 16 (2006) 1228-1234,
doi:10.1002/adfm.200500700
[9] Rothschild, A., Edelman, F., Komem, Y., et al., Sensor Actuat., Ser. B, 67 (2000)
282-289,
http://dx.doi.org/10.1016/S0925-4005(00)00523-2
[10] Shankar K., Tep K. C., Mor G. K., et al., J. Phys., Ser. D: Appl. Phys. 39 (2006)
2361-2366,
doi:10.1088/0022-3727/39/11/008
International Letters of Chemistry, Physics and Astronomy 10(1) (2013) 90-101
101
[11] Diebold U., Appl. Phys., Ser. A 76 (2003) 681-687,
doi:10.1007/s00339-002-2004-5
[12] Choi S. Y., Mamak M., Speakman S., et al., Small 1 (2005) 226-232.
doi:10.1002/smll.200400038
[13] Chu S. Z., Inoue S., Wada K., Li D., et al., Langmuir 21 (2005) 8035-8041,
doi:10.1021/la050902j
[14] Kim K. D., Han D. N., Lee J. B., et al., Scrip. Mater. 54 (2006) 143-146,
http://dx.doi.org/10.1016/j.scriptamat.2005.09.054
[15] Wang H., Lewis J. P., J. Phys., Ser. C 17 (2006) L 209-213,
doi:10.1088/0953-8984/17/21/L01
[16] Pan J. H., Lee W. I., Chem. Mater. 18 (2006) 847-853,
doi:10.1021/cm0522782
[17] Bavykin D. V., Friedrich J. M., Walsh F. C., Adv. Mater. 18 (2006) 2807-2824,
doi:10.1002/adma.200502696
[18] Standard Methods for the Sampling and Testing of Gelatins, Gelatin Manufacturers
Institute of America, Inc., 501 fifth Ave., Room 1015, New York, NY.
[19] Ali A., Studies on the Degradation of Jute fibre, An M.Sc. Thesis, Rajshahi University,
Rajshahi, Bangladesh, 66 (1987) 29-31.
[20] Leach D. C., Mechanical & Fire Properties of APC-2 Presented at SAMPLE at
Albuqueeque, 1987, 9-11.
[21] Bipasha Bose, Effect of water absorption on the mechanical properties of jute fiber
reinforced polymer composites, 2005.
[22] ASTM Designation: D570-81, Standard Test Method for water absorption of plastic,
1988, 141-143.
[23] Farnades F. N., Riz A. I., Garder M., Aranda P., Ruiz-Hitzky E., Journal of Nanoscience
and Nanotechnology, in press 2008.
[24] Caio M. Paranhos, G. Bluma Soares, et al, Macromol. Mater. Eng. 292 (2007) 620-626.
[25] Zanetti M., Lomakin S., Camino G., Macromal. Mater. Eng. 279 (2000) 1-9,
doi:10.1002/1439-2054(20000601)279:1<1::AID-MAME1>3.0.CO;2-Q
( Received 23 May 2013; accepted 27 May 2013 )
Copyright © 2022 FDOKUMEN